Parents and Their Cochlear Implanted Child: Questionnaire Development to Assess Parental Views and...
12
International Journal of Pediatric Otorhinolaryngology (2004) 68, 149—160 Parents and their cochlear implanted child: questionnaire development to assess parental views and experiences Ciaran O’Neill a, * , Mark E. Lutman b , Sue M. Archbold c , Sue Gregory d , Thomas P. Nikolopoulos c a School of Policy Studies, University of Ulster, Jordanstown, Newtownabbey BT37 0QB, UK b Hearing and Balance Centre, Institute of Sound and Vibration Research, University of Southampton, Southampton, UK c Nottingham Pediatric Cochlear Implant Programme, Queen’s Medical Centre, Nottingham, UK d School of Education, Birmingham University, Birmingham, UK Received 28 June 2003 ; received in revised form 19 September 2003; accepted 20 September 2003 KEYWORDS Cochlear implants; Children; Deaf; Parents; Perception; Outcomes; Quality of life Summary Objectives: To test the reliability of a validated closed-format question- naire assessing parental views following cochlear implantation of their child. Design: Parents were surveyed using a closed-format questionnaire developed in earlier work. The same parents were surveyed 1 month later and responses compared. Test—retest reliability was thereby assessed. Setting: Tertiary referral Pediatric Cochlear Implant Centre in the UK. Subjects and Methods: The parents of 20 children who had been born deaf or were deafened by age 3 years and who had been implanted for at least 2 years were drawn at random from patient lists. Parents were surveyed us- ing a closed-format questionnaire whose validity had been previously assessed and re-surveyed 1 month later. Responses over time were compared. Results: For the majority of items in the questionnaire, the replication of the item would lead to the same response on at least 95% of occasions. The text of the closed-format question- naire is reproduced in full. Conclusion: This validated closed-format questionnaire appears to be unique in respect of cochlear implantation, being based explicitly on issues thought important by the parents. The high test—retest reliability indicates that it is capable of eliciting parental views in a meaningful manner. This information that is not currently available by other means can then be used as part of an over- all assessment of outcomes, to inform efforts aimed at quality improvement as well as demonstrating accountability to purchasers and policymakers. Moreover, a wider use of this instrument can result in valid comparisons of outcomes among different cochlear implant centres. © 2003 Elsevier Ireland Ltd. All rights reserved. ∗ Corresponding author. Tel.: +44-2890-366205. E-mail address: [email protected] (C. O’Neill). 1. Introduction Cochlear implants are surgically implanted elec- tronic devices that give a sensation of hearing to those unable to benefit from conventional hear- ing aids. Various studies have demonstrated the 0165-5876/$ — see front matter © 2003 Elsevier Ireland Ltd. All rights reserved. doi:10.1016/j.ijporl.2003.09.015
-
Upload
independent -
Category
Documents
-
view
0 -
download
0
Transcript of Parents and Their Cochlear Implanted Child: Questionnaire Development to Assess Parental Views and...
International Journal of Pediatric Otorhinolaryngology (2004) 68, 149—160
Parents and their cochlear implanted child:questionnaire development to assess parentalviews and experiences
Ciaran O’Neill a,*, Mark E. Lutmanb, Sue M. Archboldc, Sue Gregoryd,Thomas P. Nikolopoulosc
a School of Policy Studies, University of Ulster, Jordanstown, Newtownabbey BT37 0QB, UKb Hearing and Balance Centre, Institute of Sound and Vibration Research, University of Southampton,Southampton, UKc Nottingham Pediatric Cochlear Implant Programme, Queen’s Medical Centre, Nottingham, UKd School of Education, Birmingham University, Birmingham, UK
Received 28 June 2003 ; received in revised form 19 September 2003; accepted 20 September 2003
KEYWORDSCochlear implants;Children;Deaf;Parents;Perception;Outcomes;Quality of life
Summary Objectives: To test the reliability of a validated closed-format question-naire assessing parental views following cochlear implantation of their child. Design:Parents were surveyed using a closed-format questionnaire developed in earlier work.The same parents were surveyed 1 month later and responses compared. Test—retestreliability was thereby assessed. Setting: Tertiary referral Pediatric Cochlear ImplantCentre in the UK. Subjects and Methods: The parents of 20 children who had beenborn deaf or were deafened by age 3 years and who had been implanted for atleast 2 years were drawn at random from patient lists. Parents were surveyed us-ing a closed-format questionnaire whose validity had been previously assessed andre-surveyed 1 month later. Responses over time were compared. Results: For themajority of items in the questionnaire, the replication of the item would lead to thesame response on at least 95% of occasions. The text of the closed-format question-naire is reproduced in full. Conclusion: This validated closed-format questionnaireappears to be unique in respect of cochlear implantation, being based explicitly onissues thought important by the parents. The high test—retest reliability indicatesthat it is capable of eliciting parental views in a meaningful manner. This informationthat is not currently available by other means can then be used as part of an over-all assessment of outcomes, to inform efforts aimed at quality improvement as wellas demonstrating accountability to purchasers and policymakers. Moreover, a wideruse of this instrument can result in valid comparisons of outcomes among differentcochlear implant centres.© 2003 Elsevier Ireland Ltd. All rights reserved.
∗Corresponding author. Tel.: +44-2890-366205.E-mail address: [email protected] (C. O’Neill).
1. Introduction
Cochlear implants are surgically implanted elec-tronic devices that give a sensation of hearing tothose unable to benefit from conventional hear-ing aids. Various studies have demonstrated the
0165-5876/$ — see front matter © 2003 Elsevier Ireland Ltd. All rights reserved.doi:10.1016/j.ijporl.2003.09.015

150 C. O’Neill et al.
efficacy of the procedure in children [1—6]. Themajority of such studies tend to be from a profes-sional perspective and have concentrated on as-pects of speech perception and production. Therehave been fewer studies of outcomes from thebroader perspectives of quality of life or of theeffects on the child and family from the point ofview of parents. While parents may be seen asbiased sources [7], their views have the poten-tial to add valuably to the assessments obtainedby implant professionals as formal objective mea-sures may not reflect the child’s functioning ineveryday situations. Vidas et al. [8] found thatfollowing cochlear implantation clinical tests ofspeech and hearing may not reflect the child’sperformance at home or school and assessmentsby parents and clinicians may differ widely. In-deed the position of the parent in the householdmakes them uniquely placed to assess the impactof implantation in the context within which thechild grows up. This broader view of outcomes cancomplement the assessments measured by the pro-fessionals at the implant Centre, school or home.It may also be useful where more formal measuresare inappropriate [9], especially in children im-planted very young. While others have examinedparental views in respect of implantation [9—16],these studies have tended to be limited in scope,examining a small range of specific issues such asdevice use, or parental stress rather than broaderissues of quality of life. Currently, only one vali-dated questionnaire exists to assess parental views[17].
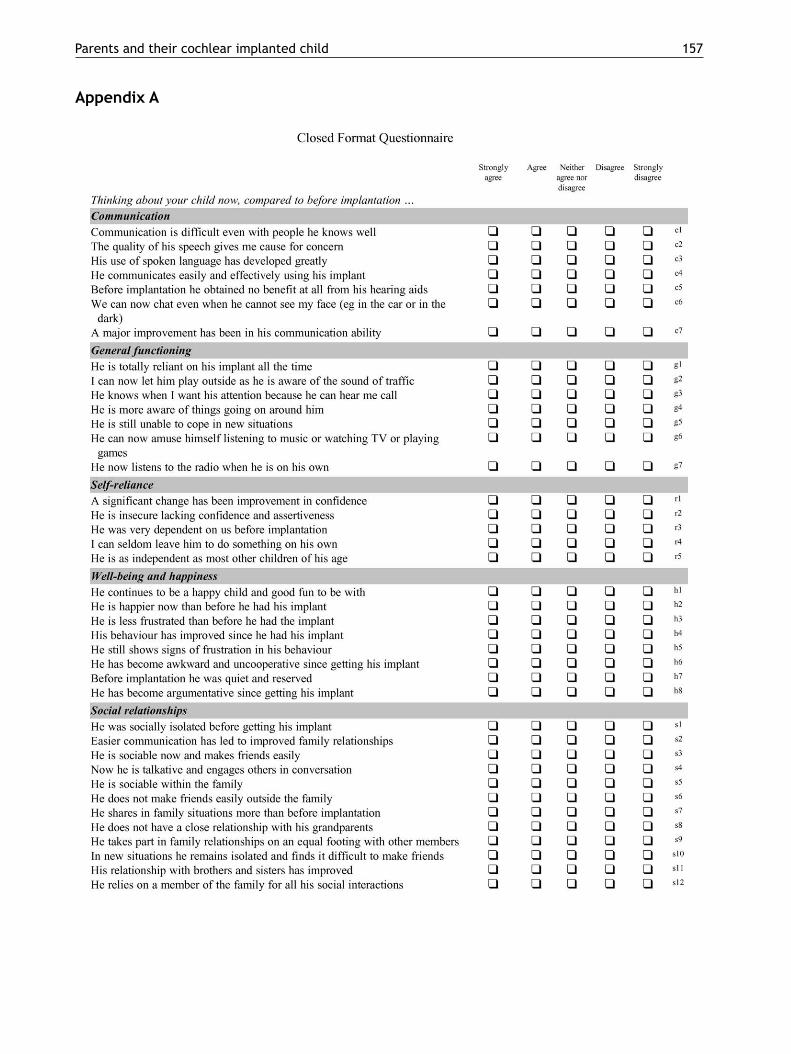
Archbold et al. [17] discuss the developmentand validation of the questionnaire. A full discus-sion of this is beyond the scope of this paper. Inbrief, however, this involved an open-ended ques-tionnaire survey of parents whose child had beenimplanted for at least 2 years. The survey wasdistributed to the parents of the first 30 consecu-tive children implanted in a specialist programme(the Nottingham Pediatric Cochlear Implant Pro-gramme) to fulfil the criteria of being born deaf,or deafened under the age of three and who hadbeen implanted for a minimum of 2 years. (Fur-ther discussion of the sample and the survey arediscussed elsewhere [17].) The open-ended ques-tionnaire was used to explore issues important toparents associated with implantation. A contentanalysis of open-format responses was used toidentify emergent themes. A closed-format ques-tionnaire was developed from these themes thatwas subsequently subjected to independent ver-ification and validation. In this paper, we reporton the test—retest reliability of the closed-formatquestionnaire.
2. Materials and methods
Twenty parents were drawn at random from amongthose implanted by the Nottingham Programme. Se-lection criteria, as with the development of theclosed-format questionnaire, were that the chil-dren were born deaf (or were deafened by age 3years) and had been implanted for a minimum 2years. (A minimum of 2 years was considered appro-priate to allow parents to properly assess the impactof implantation.) An additional criterion that theparents had not taken part in the development ofthe closed-format questionnaire was also applied.Sample size was arrived at in a pragmatic fashion–—the need to generate sufficient numbers to un-dertake meaningful analysis while leaving sufficientnumbers to allow for further analysis should re-finements and subsequent surveys be required. Ex-cluding the 30 who had participated in the originalopen-ended survey from the available group left 150possible respondents. The 20 selected representsjust over 13% of the population.
Parents were asked to complete and return thequestionnaire. The questionnairewas distributed bymail. Reminders were issued to any parent who hadnot returned the questionnaire within 2 weeks ofits date of issue and within 4 weeks of initial issue100% of the questionnaires had been returned.
A repeat survey of the same parents who hadcompleted the original closed-ended questionnairewas conducted 1 month after the initial survey. Thesame procedures were followed for the distributionand collection of questionnaires as before. Whereresponses were not forthcoming within 2 weeks ofdistribution, reminders were again sent to parents.Within 1 month of distribution, 17 responses to therepeat questionnaire had been received. It was de-cided to proceed with the test—retest analysis onthe basis of these seventeen responses rather thanissue fresh reminders. Given that second round re-minders were not issued (none being necessary) inthe initial survey, to do so with respect to the retestwas not thought appropriate.
The closed-format questionnaire consisted of aseries of statements with which the respondentcould ‘strongly agree’, ‘agree’, ‘neither agree nordisagree’, ‘disagree’, or ‘strongly disagree’. Re-sponses were coded in ascending order–—1: stronglyagree, 2: agree, 3: neither agree nor disagree, 4:disagree and 5: strongly disagree. A failure to re-spond was treated as a missing value. Data wereentered for analysis in the statistical softwarepackage SPSS version 8.0. Each respondent’s an-swer in the initial survey was compared with thatsubsequently obtained 1 month later. A Spearmancorrelation coefficient was used to determine the

Parents and their cochlear implanted child 151
association between individual’s responses to thequestions over time (a significant correlation indi-cating that the variation between responses withinindividuals was lower than variation between in-dividuals and that in this respect a high degree ofreliability was attained). Using the values assignedto responses (1: strongly agree etc.) it was possibleto calculate the standard deviation of the differ-ence in scores, giving an estimate of the dispersionin scores within individuals for each of the itemsin the questionnaire. For parametric data a changeof two standard deviations between replicationsindicates a significant difference in response atthe 5% level of confidence. Given the scoring sys-tem adopted, a change in response is evident asa change in score of at least one unit. A standarddeviation of 0.5 or less would suggest that thereplication of the item would lead to the sameresponse in 95% of cases. Those items for which astandard deviation of 0.5 or above occurred wereidentified to explore repeatability across items.
3. Results
Results for each of the items are shown in Tables 1—10 divided according to Appendix A. Column 1 ofeach table shows the item number within the sec-tion to which results relate. In column 2, the Spear-man correlation coefficient is shown, together withwhether or not this is significant. In column 3, thestandard deviation (S.D.) of the difference in re-sponses on replication is shown, those for whichthis is 0.5 or above being shown highlighted. Finally,in the remaining columns the distribution of thechange in responses is shown. (These differencesare defined by the score associated with the originalresponse minus the score associated with the subse-quent response. Given the scoring system adopted it
Table 1 Results of repeatability study: communication
Question Correlationcoefficient
Standarddeviation
Distribution of the change in responses
−4 −3 −2 −1 0 1 2 3 4 N
1 0.78*** 0.66 0 1 1 2 12 1 0 0 0 172 0.89*** 0.35 0 0 0 2 12 3 0 0 0 173 0.54** 0.35 0 0 0 3 13 1 0 0 0 174 0.74*** 0.40 0 0 0 1 14 1 1 0 0 175 0.54** 0.30 0 0 0 1 14 2 0 0 0 176 0.71*** 0.42 0 0 0 2 12 2 1 0 0 177 0.48** 0.49 0 0 0 2 13 2 0 0 0 17
Emboldened figures for standard deviation indicate those 0.5.** P < 0.05.*** P < 0.01.
follows that differences can range between −4 and+4.) A failure to respond to a question was treatedas a missing value and where this occurred the ob-servation was omitted from the analysis. Such omis-sions generally related to a particular item beinginapplicable in a given instance; for example, whena question related to interaction with siblings (thechild being an only child) or to school experiences(the child not yet having begun school). As a result,on occasion the sample size varies as shown in the fi-nal column of the tables. Note that a relatively highS.D. can be associated with a relatively high corre-lation coefficient (e.g. Table 1, item 1). This occurswhere there is a wide range of responses across in-dividuals and modest repeatability within individu-als. Conversely, there can be a relatively low S.D.associated with a low correlation coefficient (e.g.Table 7, item 13). This occurs where there is littlerange in responses across individuals and high re-peatability.
With respect to communication, as can be seenfrom Table 1, statistically significant correlationswere obtained between initial and subsequent re-sponses for each of the items in this domain. In onlyone instance was a standard deviation in excess of0.5 recorded, this relating to item 1. The distri-bution of the change in responses with respect tothis item indicates that the relatively high disper-sion relates to two responses that differedmarkedlyfrom those originally recorded, one value of −2and one of −3 being recorded. Clearly, with re-spect to this domain of functioning the question-naire demonstrated significant test—retest reliabil-ity.
In relation to general functioning, as shown inTable 2, significant correlations and low standarddeviations were recorded for all questions. Forself-reliance, while significant correlations wererecorded, in two instances standard deviations in

152 C. O’Neill et al.
Table 2 Results of repeatability study: general functioning
Question Correlationcoefficient
Standarddeviation
Distribution of the change in responses
−4 −3 −2 −1 0 1 2 3 4 N
1 0.82*** 0.30 0 0 0 1 14 2 0 0 0 172 0.83*** 0.28 0 0 0 1 12 1 0 0 0 143 0.78*** 0.23 0 0 0 2 15 0 0 0 0 174 0.65*** 0.30 0 0 0 2 14 1 0 0 0 175 0.73*** 0.43 0 0 0 3 11 3 0 0 0 176 0.80*** 0.31 0 0 0 4 13 0 0 0 0 177 0.87*** 0.48 0 0 0 3 9 4 0 0 0 16
*** P < 0.01.
Table 3 Results of repeatability study: self-reliance
Question Correlationcoefficient
Standarddeviation
Distribution of the change in responses
−4 −3 −2 −1 0 1 2 3 4 N
1 0.89*** 0.30 0 0 0 2 14 1 0 0 0 172 0.64** 0.76 1 0 0 1 13 2 0 0 0 173 0.80** 0.28 0 0 0 3 13 0 0 0 0 164 0.57** 0.77 0 0 0 2 12 2 0 0 1 175 0.88** 0.44 0 0 1 1 13 1 0 0 0 16
Emboldened figures for standard deviation indicate those 0.5.** P < 0.05.*** P < 0.01.
excess of 0.5 are recorded. Similarly, in relation towell-being, while most questions return significantcorrelations in six instances standard deviationsexceed 0.5. Moreover, in one instance (item 5) anon-significant correlation is recorded.
Similar reasoning applies to the results forother questions in the Tables. In the interests ofbrevity these are not discussed in detail. Suffice
Table 4 Results of repeatability study: well-being
Question Correlationcoefficient
Standarddeviation
Distribution of the change in responses
−4 −3 −2 −1 0 1 2 3 4 N
1 0.51** 0.35 0 0 0 2 13 2 0 0 0 172 0.51** 0.62 0 0 0 3 10 2 2 0 0 173 0.50** 0.53 0 0 0 3 11 2 1 0 0 174 0.69*** 0.59 0 0 1 2 12 1 1 0 0 175 0.42* 0.73 0 0 1 2 11 2 1 0 0 176 0.51** 0.49 0 0 0 1 11 4 1 0 0 177 0.75*** 0.61 0 0 1 3 11 1 1 0 0 178 0.69*** 0.59 0 0 0 2 11 1 2 0 0 16
Emboldened figures for standard deviation indicate those 0.5.* P < 0.1.** P < 0.05.*** P < 0.01.
it to say that in terms of overall reliability, ascan be seen from the tables, the survey instru-ment performed better in relation to certain itemsthan others. Items within ‘general functioning’,‘communication’, ‘supporting the child’, ‘effectsof implantation self reliance’ and ‘decision toimplant’ were more repeatable than those within‘process of implantation’ and ‘social relationships’,

Parents and their cochlear implanted child 153
Table 5 Results of repeatability study: social relationships
Question Correlationcoefficient
Standarddeviation
Distribution of the change in responses
−4 −3 −2 −1 0 1 2 3 4 N
1 0.59** 0.92 0 0 0 2 12 0 0 1 1 162 0.42* 0.45 0 0 0 1 13 2 1 0 0 173 0.70*** 0.42 0 0 0 4 11 2 0 0 0 174 0.67*** 0.40 0 0 0 3 12 2 0 0 0 175 0.78*** 0.23 0 0 0 0 15 2 0 0 0 176 0.59** 0.83 1 0 0 1 13 1 1 0 0 177 0.47* 0.58 0 0 1 5 7 2 0 0 0 158 0.85*** 0.31 0 0 0 1 13 2 0 0 0 169 0.75*** 0.47 0 0 0 2 13 1 1 0 0 1710 0.75*** 0.70 0 1 0 0 12 3 1 0 0 1711 0.45 0.66 0 0 1 2 9 1 1 0 0 1412 0.50** 0.88 1 0 1 1 10 3 0 0 0 1613 0.72*** 0.73 0 0 1 3 11 1 0 1 0 17
Emboldened figures for standard deviation indicate those 0.5.* P < 0.1.** P < 0.05.*** P < 0.01.
though it is not immediately obvious why this shouldbe the case. This said it is nonetheless clear thatthe majority of items showed significant correla-tions and low within-subject standard deviations.
Bearing in mind that a sample of just 17 obser-vations was available for analysis (and on occasionsomewhat less than this), the repeatability of thequestionnaire appears to be satisfactory. For themajority of items (73 out of 107), the estimatedS.D. suggests that replication of the item will leadto the same response on at least 95% of occasions.
Table 6 Results of repeatability study: education
Question Correlationcoefficient
Standarddeviation
Distribution of the change in responses
−4 −3 −2 −1 0 1 2 3 4 N
1 0.84*** 0.57 0 0 0 3 9 2 1 0 0 152 0.43* 0.95 0 0 1 2 9 2 1 0 1 163 0.80*** 0.40 0 0 0 2 11 3 0 0 0 164 0.52** 0.68 0 0 1 3 8 2 1 0 0 155 0.78*** 0.63 0 0 1 1 10 3 1 0 0 166 0.65** 0.48 0 0 0 3 12 1 0 0 0 167 0.57** 0.46 0 0 0 2 12 1 0 0 0 158 0.58** 0.33 0 0 0 2 11 1 0 0 0 149 0.70*** 0.60 0 0 0 5 8 2 1 0 0 1610 0.43 0.37 0 0 0 3 11 1 0 0 0 1511 0.77*** 0.47 0 0 0 2 9 5 0 0 0 16
Emboldened figures for standard deviation indicate those 0.5.* P < 0.1.** P < 0.05.*** P < 0.01.
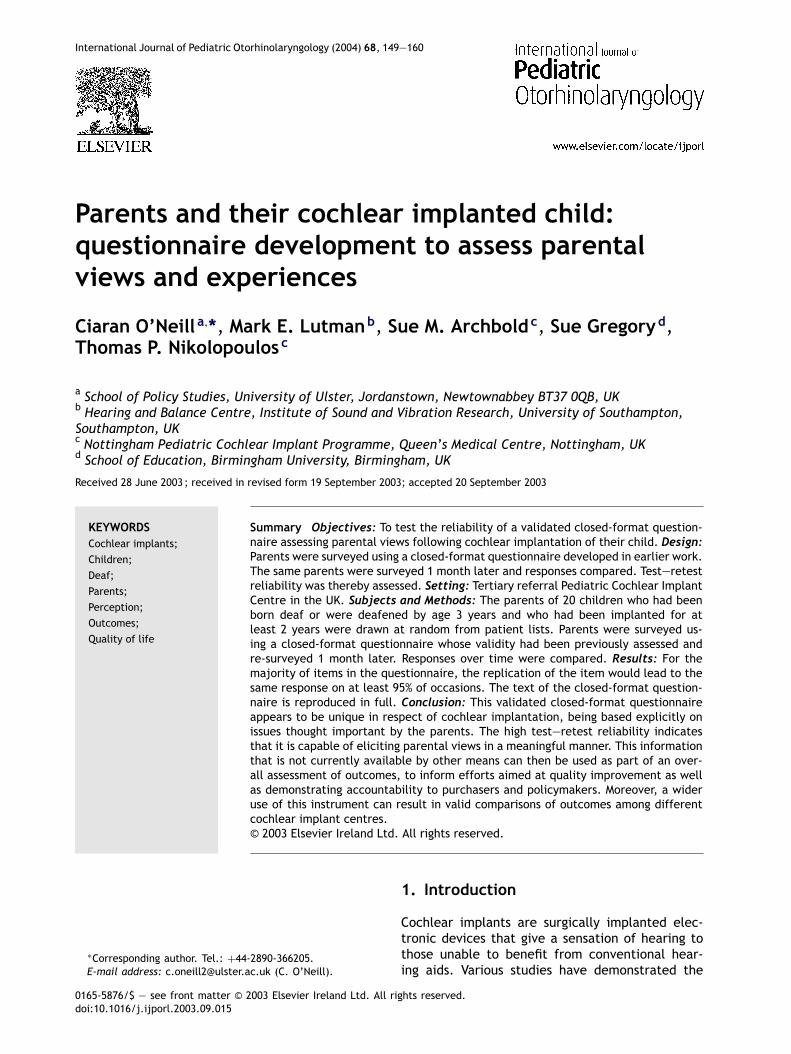
The main exceptions are in the sections labelled‘well-being’ and ‘social relationships’, where morethan half of the items can be expected to show achange on at least 5% of replications. Only one itemhas a S.D. greater than 1.0 (item 1 on the decisionto implant: S.D. = 1.10), indicating that a differ-ence of two response intervals might be expectedon slightly over 5% of replications. This item statedthat making the decision to proceed with implan-tation was the most difficult part, and it is under-standable that this might elicit different responses

154 C. O’Neill et al.
Table 7 Results of repeatability study: process of implantation
Question Correlationcoefficient
Standarddeviation
Distribution of the change in responses
−4 −3 −2 −1 0 1 2 3 4 N
1 0.59** 0.93 1 0 0 2 8 4 1 0 0 162 0.81*** 0.44 0 0 0 0 11 3 1 0 0 153 0.59** 0.45 0 0 0 0 9 5 1 0 0 154 0.71*** 0.40 0 0 0 0 14 2 1 0 0 175 0.82*** 0.53 0 0 1 1 11 4 0 0 0 176 0.79*** 0.47 0 0 1 0 13 3 0 0 0 177 0.55** 0.73 0 1 0 2 11 2 1 0 0 178 0.71*** 0.26 0 0 0 1 14 1 0 0 0 169 0.47* 0.30 0 0 0 1 14 2 0 0 0 1710 0.67*** 0.25 0 0 0 1 15 1 0 0 0 1711 0.33 0.47 0 0 0 1 12 3 1 0 0 1712 0.47* 0.30 0 0 0 2 14 1 0 0 0 1713 0.25 0.40 0 0 0 3 12 2 0 0 0 1714 0.59** 0.53 0 0 1 4 10 2 0 0 0 1715 0.55** 0.30 0 0 0 2 14 1 0 0 0 1716 0.79*** 0.35 0 0 0 3 13 1 0 0 0 1717 0.65*** 0.30 0 0 0 2 14 1 0 0 0 1718 0.68*** 0.35 0 0 0 2 13 2 0 0 0 1719 0.67*** 0.31 0 0 0 4 13 0 0 0 0 1720 0.13 0.40 0 0 0 3 12 2 0 0 0 1721 0.85*** 0.54 0 0 0 5 7 4 0 0 0 1622 0.92*** 0.24 0 0 0 2 14 0 0 0 0 1623 0.86*** 0.17 0 0 0 1 16 0 0 0 0 17
Emboldened figures for standard deviation indicate those 0.5.* P < 0.1.** P < 0.05.*** P < 0.01.
on different occasions, as parents reflect on eventsthat occurred several years in the past. Overall,it can be concluded that the repeatability of mostitems in the questionnaire is high, and that the over-all repeatability of the questionnaire is satisfactory.
Table 8 Results of repeatability study: effects of implantation
Question Correlationcoefficient
Standarddeviation
Distribution of the change in responses
−4 −3 −2 −1 0 1 2 3 4 N
1 0.76*** 0.57 0 0 0 2 12 1 2 0 0 172 0.75*** 0.47 0 0 1 1 13 2 0 0 0 173 0.43* 0.37 0 0 0 1 12 4 0 0 0 174 0.65*** 0.88 0 1 1 1 11 2 0 1 0 175 0.93*** 0.25 0 0 0 0 13 2 0 0 0 156 0.83*** 0.50 0 0 0 3 12 1 1 0 0 177 0.94*** 0.24 0 0 0 2 14 0 0 0 0 168 0.66*** 0.49 0 0 0 5 9 3 0 0 0 179 0.98*** 0.31 0 0 0 2 13 1 0 0 0 16
Emboldened figures for standard deviation indicate those 0.5.* P < 0.1.*** P < 0.01.
4. Discussion
The literature investigating the benefits and prob-lems associated with cochlear implantation asseen by parents is very limited. Cunningham [11]
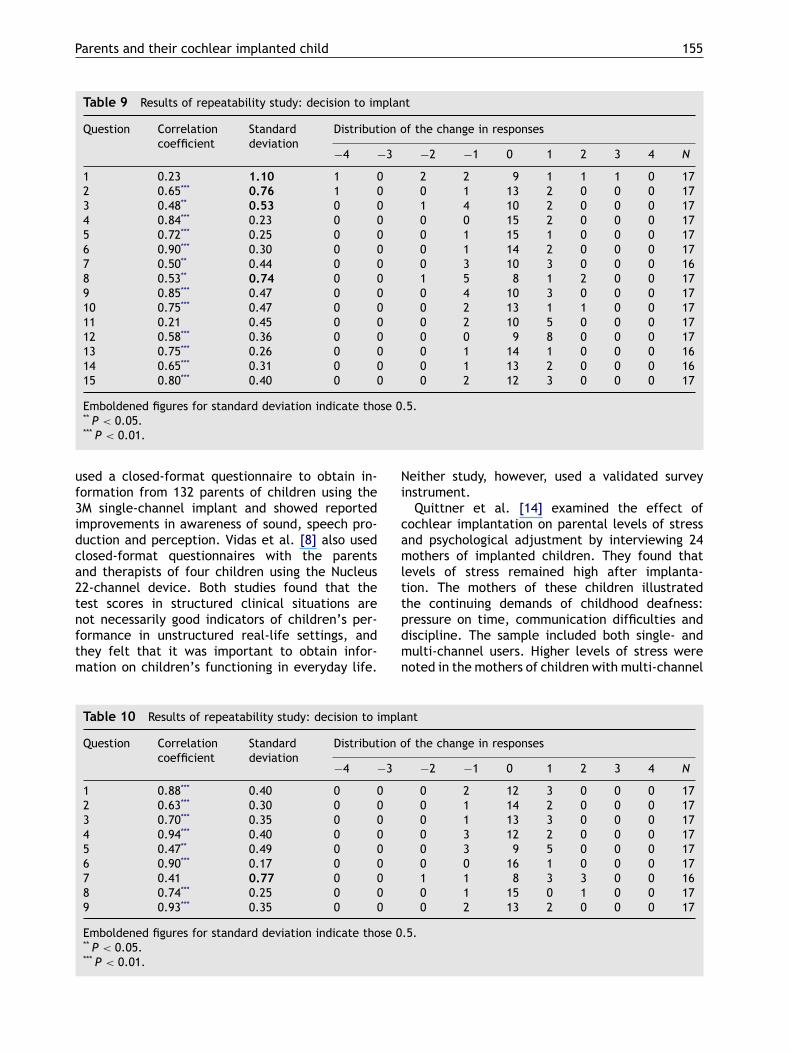
Parents and their cochlear implanted child 155
Table 9 Results of repeatability study: decision to implant
Question Correlationcoefficient
Standarddeviation
Distribution of the change in responses
−4 −3 −2 −1 0 1 2 3 4 N
1 0.23 1.10 1 0 2 2 9 1 1 1 0 172 0.65*** 0.76 1 0 0 1 13 2 0 0 0 173 0.48** 0.53 0 0 1 4 10 2 0 0 0 174 0.84*** 0.23 0 0 0 0 15 2 0 0 0 175 0.72*** 0.25 0 0 0 1 15 1 0 0 0 176 0.90*** 0.30 0 0 0 1 14 2 0 0 0 177 0.50** 0.44 0 0 0 3 10 3 0 0 0 168 0.53** 0.74 0 0 1 5 8 1 2 0 0 179 0.85*** 0.47 0 0 0 4 10 3 0 0 0 1710 0.75*** 0.47 0 0 0 2 13 1 1 0 0 1711 0.21 0.45 0 0 0 2 10 5 0 0 0 1712 0.58*** 0.36 0 0 0 0 9 8 0 0 0 1713 0.75*** 0.26 0 0 0 1 14 1 0 0 0 1614 0.65*** 0.31 0 0 0 1 13 2 0 0 0 1615 0.80*** 0.40 0 0 0 2 12 3 0 0 0 17
Emboldened figures for standard deviation indicate those 0.5.** P < 0.05.*** P < 0.01.
used a closed-format questionnaire to obtain in-formation from 132 parents of children using the3M single-channel implant and showed reportedimprovements in awareness of sound, speech pro-duction and perception. Vidas et al. [8] also usedclosed-format questionnaires with the parentsand therapists of four children using the Nucleus22-channel device. Both studies found that thetest scores in structured clinical situations arenot necessarily good indicators of children’s per-formance in unstructured real-life settings, andthey felt that it was important to obtain infor-mation on children’s functioning in everyday life.
Table 10 Results of repeatability study: decision to implant
Question Correlationcoefficient
Standarddeviation
Distribution of the change in responses
−4 −3 −2 −1 0 1 2 3 4 N
1 0.88*** 0.40 0 0 0 2 12 3 0 0 0 172 0.63*** 0.30 0 0 0 1 14 2 0 0 0 173 0.70*** 0.35 0 0 0 1 13 3 0 0 0 174 0.94*** 0.40 0 0 0 3 12 2 0 0 0 175 0.47** 0.49 0 0 0 3 9 5 0 0 0 176 0.90*** 0.17 0 0 0 0 16 1 0 0 0 177 0.41 0.77 0 0 1 1 8 3 3 0 0 168 0.74*** 0.25 0 0 0 1 15 0 1 0 0 179 0.93*** 0.35 0 0 0 2 13 2 0 0 0 17
Emboldened figures for standard deviation indicate those 0.5.** P < 0.05.*** P < 0.01.
Neither study, however, used a validated surveyinstrument.
Quittner et al. [14] examined the effect ofcochlear implantation on parental levels of stressand psychological adjustment by interviewing 24mothers of implanted children. They found thatlevels of stress remained high after implanta-tion. The mothers of these children illustratedthe continuing demands of childhood deafness:pressure on time, communication difficulties anddiscipline. The sample included both single- andmulti-channel users. Higher levels of stress werenoted in the mothers of children with multi-channel
156 C. O’Neill et al.
implants compared with those with single-channelimplants. Possible reasons given for this were theshorter length of time after implantation in themulti-channel group, the more complex tuningrequired by the multi-channel devices, and thepossibly greater, as yet unmet, expectations in thecase of multi-channel recipients. Horsch et al. [15]used the Parenting Stress Index to compare lev-els of stress in parents of children with cochlearimplants with those of children with hearing aidsand those of hearing children. They found that thestress levels in parents of children with cochlearimplants were less than those of hearing aidedchildren and similar to those of hearing children.Neither of these studies, however, examined thebroader range of benefits/effects associated withimplantation beyond stress.
Kelsay and Tyler [10] used an open-format ques-tionnaire with parents of 50 prelingually deaf chil-dren, asking them to list the expected benefits andproblems prior to implantation, and the resultantbenefits and problems annually following implanta-tion. Parents were felt to be realistic about the po-tential advantages and disadvantages prior to im-plantation; the disadvantages most commonly men-tioned were concerned with size and maintenanceof equipment. Kelsay and Tyler [10] commentedthat subjective questionnaires could prove usefulin providing information on children’s progress fol-lowing implantation, and that the information thusgained would be useful to share with other parents.This work was not developed, however, to producea validated closed-ended questionnaire for subse-quent use with large numbers of parents.
While these studies shed light on the aspects ofoutcomes and give credence to the elicitation ofparental views in general, perhaps most strikinglythey serve to emphasize the need for an accept-able, valid and reliable instrument that capturesthe spectrum of parental perceptions of implan-tation. The importance attached patient/parentperceptions in health care and the emphasis placedin many health care systems on involving pa-tients/parents in evaluation of the health careinterventions [17] further underscores this need.Credible information, however, presupposes the
existence of valid and reliable instruments for itscapture. The high repeatability of closed-endedquestionnaire we have developed and validatedshould allow the routine collection of such infor-mation in an economical fashion. This informationcan then be used as part of an overall assessmentof outcomes, to inform efforts aimed at quality im-provement as well as demonstrating accountabilityto purchasers and policymakers.
5. Conclusion
The validated closed-format questionnaire wehave produced appears to be unique in respectof cochlear implantation, being based explicitlyon issues thought important by the parents. Thehigh test—retest reliability of the questionnaireindicates that it is capable of eliciting parentalviews in a meaningful manner. This suggests theself-administered postal questionnaire, applied 2years post implantation should be able to provideevaluative material on outcomes from pediatricimplantation in an efficient manner that is notcurrently available by other means.
Other potential applications of the questionnaireinclude the investigation of the overall effective-ness of implantation in differing groups and to con-trast results between individuals in order to re-veal dimensions of variation. This could be doneby examining responses to individual questions orfrom indices or scores constructed to summarize re-sponses on groups of questions. (Further work wouldhowever be needed to develop such scores.) Thesedifferences could then be explored to investigatewhether differences observed can be explained interms of differences in the characteristics of chil-dren, parents, or the family context, or an inter-action amongst all of these. Further work explor-ing the uses and insights that can be gained fromsuch data is underway. By providing a valid and re-liable method of assessing parental experiences ofimplantation and its effects, this questionnaire isa valuable addition to the tools currently availablefor assessing and evaluating the consequences ofimplantation.
Parents and their cochlear implanted child 157
Appendix A

158 C. O’Neill et al.

Parents and their cochlear implanted child 159

160 C. O’Neill et al.
References
[1] G.M. O’Donoghue, T.P. Nikolopoulos, S.M. Archbold, M.Tait, Congenitally deaf children following cochlear implan-tation, Acta Otolaryngol. (Belg.) 52 (1998) 111—114.
[2] S.B. Waltzman, N.L. Cohen, R.H. Gomolin, J.E. Green,W.H. Shapiro, R.A. Hoffman, J.T. Roland Jr., Open-setspeech perception in congenitally deaf children usingcochlear implants, Am. J. Otol. 18 (1997) 342—349.
[3] C.M. Allen, T.P. Nikolopoulos, G.M. O’Donoghue, Speechintelligibility in children following cochlear implantation,Am. J. Otol. 19 (6) (1998) 742—746.
[4] G.M. O’Donoghue, T.P. Nikolopoulos, S.M. Archbold, M.Tait, Speech perception in children after cochlear implan-tation, Am. J. Otol. 19 (1998) 762—767.
[5] S.M. Archbold, M.E. Lutman, T.P. Nikolopoulos, Categoriesof auditory performance: inter-user reliability, Br. J. Au-diol. 32 (1998) 7—12.
[6] T.P. Nikolopoulos, S.M. Archbold, G.M. O’Donoghue, Thedevelopment of auditory perception in children followingcochlear implantation, Intern. J. Pediatr. Otorhinolaryngol.49 (Suppl.1) (1999) 189—191.
[7] J.F. Knutson, C. Rhonda, R.C. Boyd, J.B. Reid, T. Mayne,R. Fetrow, Observational assessments of the interactionof implant recipients with family and peers, Otolaryngol.Head Neck Surg. 117 (1997) 196—207.
[8] S. Vidas, R. Hassan, L.S. Parnes, Real-life performanceconsiderations of four paediatric multichannel cochlearimplant recipients, J. Otolaryngol. 21 (1992) 387—393.
[9] M.J. Osberger, L. Geier, S. Zimmerman-Phillips, M.J.Barker, Use of a parent-report scale to assess benefit inchildren given the Clarion cochlear implant, Am. J. Otol.18 (1997) 79—80.
[10] D.M.R. Kelsay, R.S. Tyler, Advantages and disadvantages ex-pected and realised by paediatric cochlear implant recip-ients as reported by their parents, Am. J. Otol. 17 (1996)866—873.
[11] J.K. Cunningham, Parents’ evaluation of the effects of3M/Housed cochlear implants in children, Ear Hear 11(1990) 375—381.
[12] A.M. Robbins, J.J. Renshaw, S.W. Berry, Evaluating mean-ingful auditory integration in profoundly hearing-impairedchildren, Am. J. Otol. 12 (Suppl.) (1991) 144—150.
[13] N. Tiber, A psychological evaluation of cochlear implantsin children, Ear & Hear 6 (Suppl.) (1985) 48s—51s.
[14] A.L. Quittner, J.T. Steck, R.L. Rouiller, Cochlear implantsin children: a study of parental stress and adjustment, Am.J. Otol. 12 (Suppl.) (1991) 95—104.
[15] U. Horsch, C. Weber, B. Bertram, P. Detrois, Stress experi-enced by parents of children with cochlear implants com-pared with parents of deaf children and hearing children,Am. J. Otol. 18 (Suppl. 6) (1997) s161—s163.
[16] S.M. Archbold, G.M. O’Donoghue, T.P. Nikolopoulos,Cochlear implants: an analysis of use over a three yearperiod, Am. J. Otol. 19 (1998) 328—331.
[17] S.M. Archbold, M.E. Lutman, S. Gregory, C. O’Neill, T.P.Nikolopoulos, Parents and their deaf child: their percep-tions three years after cochlear implantation, DeafnessEduc. Int. 4 (1) (2002) 12—40.


![Błąd wychowawczy a stosowana dyrektywność rodzicielska [The parental mistake and applied parental control]](https://static.fdokumen.com/doc/165x107/6331b765f008040551041fa0/blad-wychowawczy-a-stosowana-dyrektywnosc-rodzicielska-the-parental-mistake.jpg)