![Bles.ppt [Read-Only]](https://static.fdokumen.com/doc/165x107/633bffc7197a6737f10ceddf/blesppt-read-only.jpg)
Maryland's Child-Only Caseload: A COMPARISON OF PARENTAL AND NON-PARENTAL CASES
37
Maryland’s Child-Only Caseload: A COMPARISON OF PARENTAL AND NON-PARENTAL CASES ANDREA HETLING, PHD PROJECT DIRECTOR CORRENE SAUNDERS, BA PROJECT ANALYST CATHERINE E. BORN, PHD PRINCIPAL INVESTIGATOR APRIL 2005
Transcript of Maryland's Child-Only Caseload: A COMPARISON OF PARENTAL AND NON-PARENTAL CASES

Maryland’s Child-Only Caseload: A COMPARISON OF PARENTAL AND NON-PARENTAL CASES
ANDREA HETLING, PHD PROJECT DIRECTOR
CORRENE SAUNDERS, BA
PROJECT ANALYST
CATHERINE E. BORN, PHD PRINCIPAL INVESTIGATOR
APRIL 2005
This report was prepared by the Family Welfare Research and Training Group, School of Social Work, University of Maryland, 525 West Redwood Street, Baltimore, Maryland 21201 with support from its long time research partner, the Maryland Department of Human Resources. For additional information about the report or the study, please contact Dr. Catherine Born at the School of Social Work (410.706.5134, [email protected]). For more information about welfare reform in Maryland, please contact Mr. Richard Larson at the Department of Human Resources (410.767.7150, [email protected] or [email protected]).

Table of Contents
List of Tables and Figures Executive Summary Introduction .............................................................................................................1 Background .............................................................................................................3 Methods ..................................................................................................................7 Findings...................................................................................................................11
Type of Child-only Case ...............................................................................11 Adult Demographics .....................................................................................12 Case Demographics .....................................................................................15 Child Welfare Involvement............................................................................16
Cash Assistance Participation History ..........................................................18 Employment History .....................................................................................21
Conclusions.............................................................................................................25 References..............................................................................................................27 Appendix .................................................................................................................29

List of Tables and Figures Table 1. Adult Demographics .......................................................................14 Table 2. Case Demographics.......................................................................16 Table 3. Cash Assistance Participation History............................................20 Table 4. Employment History .......................................................................23 Table A-1. Child Welfare History (Child Level) .............................................29 Table A-2. Child Welfare History (Case Level).............................................29 Figure 1. Distribution of Child-Only Case Types ..........................................11 Figure 2. Child Welfare Involvement ............................................................18
Executive Summary Traditional mother-child cash assistance cases have exited welfare in record numbers since the outset of welfare reform in the mid-1990s. There has been extensive research into the population of so-called “welfare leavers” and, to a somewhat lesser degree, into the characteristics and circumstances of female-headed households who have not been able to transition from welfare to work. Until very recently, however, little empirical attention has been directed at attempting to understand better another important and increasingly more sizable group of current assistance recipients: child-only cases, those in which no adult is included on the grant. Little is actually known about the child-only population although it is widely suspected that they are not a homogeneous group and may have service needs and self-sufficiency prospects quite different from those of more traditional cases. At present, child-only cases represent a full third of Maryland’s entire cash assistance caseload and, in 17 of the state’s 24 sub-divisions, account for 40% or more of all cases. For the above reasons and because child-only cases, for the most part, are exempt from time limits and work requirements, it behooves us to learn more about the characteristics and circumstances of this population. Thus, this report describes Maryland’s child-only caseload, and compares sub-groups within this population on demographics, child welfare involvement, welfare utilization history, and earnings and employment patterns. Comparisons between child-only and non-child-only cases are also included where possible. Specific questions addressed in the research are:
1. What proportion of the Maryland child-only caseload consists of families in which no parent is present in the home? Among parental child-only cases, how many are child-only because of the parent’s immigration status, previous sanctions, or Supplemental Security Income (SSI) receipt?
2. What are the demographic characteristics of child-only cases and case
heads? 3. What is the history of child welfare involvement among youngsters in child-only cases? Does this vary depending on whether it is a non- parental or parental child-only case? 4. What are the historic and current cash assistance participation patterns
among child-only cases?
5. What are the historic and current employment and earnings patterns of adults heading child-only cases in Maryland?
i

To address these questions, we identified the universe of child-only cases (n=9,208) among the active Temporary Cash Assistance (TCA) caseload in Maryland in October 2003 and gathered person- and case-level data from a variety of administrative data systems. Key findings of the research include the following:
1. The child-only caseload is heterogeneous, and there are a number of programmatically important as well as statistically significant differences among the various population sub-groups.
2. Despite caseload diversity, two groups predominate: non-parental cases
(75.2%) where the parent is not resident in the home and parental cases (21.9%) where the resident parent receives SSI benefits, presumably because of long-term disability.
Our research identified five distinct sub-groups within the child-only population: non-parental cases (75.2%), parental SSI cases (21.9%), immigrant parent cases (2.2%), sanctioned parent cases (0.6%) and “other” parental cases (0.2%). Among the five groups, payees differed significantly on gender, race, marital status and age. Adults in non-parental cases were more likely to have been married and were significantly older, on average. The adults in non-parental cases also had significantly higher employment rates and earnings than did adults in any of the four parental sub-groups. In terms of the youngsters in these households, children in non-parental cases and in parental SSI cases were generally older, on average, while parental immigrant and parental sanctioning cases tended to have more children in their assistance units.
3. As a group, child-only cases that received cash assistance in the study month (October 2003) differ in many important ways from all other TCA cases that received benefits in that same month. Differences in historical and current welfare utilization patterns are particularly notable
Compared to adults from non-child-only cases active in October 2003, adults associated with child-only cases as a group are older and more likely to have been married. They are also likely to have older, but fewer, children in their assistance units and to have higher rates of employment and higher earnings than the adults heading non-child-only cases in the same month. Child-only cases, as a whole, have longer welfare histories and, on average, have been on welfare without interruption for longer periods of time. However, it is really non-parental and parental SSI cases which have lengthy welfare episodes; the other child-only sub-groups closely resemble “regular” TCA cases on these variables. The average length of the current, continuous welfare spell, to illustrate, was 13.6 months for “regular” TCA cases, but 36.2 months for non-parental child-only cases and 41.5 months for parental SSI child-only cases. Similarly, the typical or average non-parental child-only case had received TCA in 36.7 of the preceding 60 months or about 61% of the time and the typical parental SSI child-only case had received benefits in 42.9 of 60 months, about 71% of the time. Within the remainder of the active caseload, in contrast, the typical family had received TCA for 22.4 of 60 months, or about 37% of the time.
ii

4. A sizable plurality, if not the majority, of children in child-only TCA cases appear to straddle the murky boundary between public welfare and child welfare. Prior involvement with Child Protective Services (CPS) was quite common and rates were highest, by far, among children in non-parental child-only cases.
More than two-fifths (44.6%) of all youngsters in child-only TCA cases active in October 2003 had a prior substantiated or indicated incident of child abuse or neglect, one in five (19.8%) have a history of kinship care, and about 12% have received intensive family services or been in foster care. Child welfare involvement, specifically CPS involvement, is particularly high among children residing in non-parental cases. Fully one of every two (49.9%) children in these households had been the subject of a substantiated or indicated CPS investigation, compared to just under one child in three (30.9%) among all parental child-only cases in that same month. Similar, though not as dramatic, patterns were observed for Intensive Family Services (13.1% vs. 9.2%), Kinship Care (25.9% vs. 4.2%) and Foster Care (14.8% vs. 7.5%). Links between cash assistance and child welfare are not new. Moreover, states have made extensive use of familial placements for children removed from their parental homes because of abuse or neglect. Thus, it is not surprising that children in non-parental, child-only TCA homes have higher rates of previous involvement with the child welfare system. Indeed, we suspect that in a sizable number of non-parental, child-only TCA cases, the CPS investigation may have precipitated placement with the relative who is now receiving cash assistance on behalf of the child or children. However, because non-parental child-only cases represent fully 75% of the total child-only caseload and one of every two children in these families has a history with CPS, the magnitude of the child welfare-TANF overlap may be larger than has been commonly thought.
5. All else equal, it might be programmatically and fiscally prudent to assume that a significant majority of children in child-only cases will remain on cash assistance until they are emancipated.
6. It might also be wise to consider whether public welfare case
management and services should be supplemented by family and child welfare case management/services and long-range and contingency planning, particularly for children residing in non-parental child-only TCA homes where the average age of the caregiver is 52 years.
Study findings, particularly those concerning prior child welfare involvement and welfare utilization patterns, imply that many non-parental and parental SSI child-only cases could well persist in their current status for the foreseeable future, perhaps until the youngest resident child is emancipated. In terms of long-range planning for the individual children involved, the findings also suggest that, particularly for children in the care of non-parental caretakers – whose average age is 52 years - it may be wise to consider how or if public welfare case management services should be supplemented with child and family welfare case management and/or services and contingency planning. That is, the possible need for cross-program planning and case management for child-only cases, particularly those headed by a non-parent, should probably be
iii

carefully considered. This recommendation may be given further weight by our finding from an earlier study that the single most powerful predictor of future child welfare involvement is past child welfare involvement. In sum, this study has attempted to provide policy-makers, program managers and front-line TCA case management staff with descriptive information about child-only cases, a generally invisible, but increasingly larger cohort within cash assistance caseloads in all Maryland subdivisions. Understandably, most of the attention in recent months has focused on attempting to divine and plan for the more stringent work requirements that most observers believe will result from the eventual reauthorization of TANF at the national level. That is important work. At the same time, study findings suggest similar creative energy should probably be focused on further research into and cross-program planning/case management, service strategies and long-range planning for child-only cases. The practical reasons to focus specific attention on the child-only population are that child-only cases are generally exempt from work requirements and time limits and represent 35% of our state’s overall TCA caseload – and more than 40% in 17 of the state’s subdivisions. The most important reason, however, is that – by definition – all TCA recipients in these cases are children.
iv
Introduction The composition of the cash assistance caseload has changed in important, policy-relevant ways. One change is that as traditional female-headed cases have left welfare in huge numbers, child-only cases, those in which no adult is on the grant, now represent a much larger proportion of all families receiving cash assistance. In 1996, to illustrate, child-only cases represented 21.3% of Maryland’s caseload, or about one case in five. By mid 2004, the percentage had increased by more than half, to 35.5%, or more than one case in three. Intra-state variation is great, however. In June 2004, child-only cases ranged from roughly 30% (Baltimore City and Dorchester County) to 60% (Kent, Talbot and Worcester counties) of localities’ total caseloads. Notably, in 17 of the state’s 24 subdivisions, child-only cases accounted for 40% or more of all active cases (Maryland Department of Human Resources, 2004).1 Little is known about child-only cases except that they are not a homogenous population and may have service needs and self-sufficiency prospects quite different from those of more traditional cases. In light of the growing prominence of child-only cases, the purpose of this report is to describe Maryland’s child-only caseload, and to compare subgroups within this population on measures of demographics, child welfare involvement, welfare utilization history, and employment patterns. We examine child-only cases among the universe of Temporary Cash Assistance (TCA) cases active in Maryland in October 2003. Where possible, comparisons are also made to traditional (i.e., non child-only) cases in that same month. This comparison may aid policymakers and program managers in understanding more about these families’ characteristics and circumstances and in assessing policy or programmatic changes which might be necessary to insure their particular needs are adequately and appropriately addressed in today’s work-oriented cash assistance system. To be most informative, we examine parental and non-parental child-only cases separately, as well as report findings for the child-only caseload as a whole. In particular, this report provides beginning descriptive answers to the following important questions about the child-only portion of Maryland’s TANF caseload.
1. What proportion of the child-only caseload consists of families in which no parent lives in the home? Among parental cases, how many are child-only because of the parent’s immigration status, previous sanctions, or SSI receipt?
2. What are the demographic characteristics of child-only cases and payees?
3. What is the history of child welfare involvement among children in child-only cases? Does this vary between non-parental and parental cases?
4. What are the historic and current patterns of welfare use?
5. What are the historic and current patterns of employment for adults in child-only cases?
1 The seven jurisdictions where child-only cases were less than 40% of all cash assistance cases were: Charles, Dorchester, Garret, Hartford, St. Mary’s, and Somerset Counties, and Baltimore City.
1

2
Background Even the most ardent supporters of the 1996 welfare reforms were at least somewhat surprised by the rapid, dramatic, and unprecedented declines in cash assistance caseloads which occurred in virtually every state during the first few years of the new program. Maryland’s experience has been typical. The state’s welfare rolls decreased by more than 40,000 cases, or nearly 25%, during the first 12 months of reform alone and continued to drop thereafter, up to and through calendar year 2004 (Born, Caudill & Cordero, 1998; Maryland Department of Human Resources, 2005). These decreases have been well documented and well researched through a multitude of so-called “leavers’ studies” which have provided valuable information about the characteristics of exiting families and what happens to them, particularly in terms of employment and earnings, after their welfare cases close. Policy, program and research attention has also been fairly extensive in trying to identify the nature and extent of barriers to employment that may have prevented other families from being part of the mass exodus from welfare.
The reformed welfare system is very work- and performance- oriented and thus the emphasis since 1996 on employment, earnings and employment barriers is both understandable and appropriate. However, mainly as a result of these new foci, many states and localities now are in the situation where work-first strategies, sanctions and time limit policies may be ineffective for large proportions of their current cash assistance cases, many of whom, appropriately, have been exempted from these type of program requirements. Cases involving disability, domestic violence, and very young children are among this proportionately larger non-traditional welfare population. The single largest cohort, however, consists of child-only cases or cases without an adult recipient. It is not that states have experienced a large or consistent influx of child-only cases since 1996, but rather that child-only cases have been much less likely to leave welfare than the more traditional mother-child assistance units. As a result, the proportion of child-only cases in relation to the total, national cash assistance caseload rose from 21.5% in 1996 to 34.5% in 2000 (Assistant Secretary for Planning and Evaluation [ASPE], 2002). In Maryland, child-only cases comprised 36.0% of the active Temporary Cash Assistance (TCA) caseload in October 2001, compared to 21.3% in 1996 (Born, Hetling-Wernyj, Lacey, and Tracy, 2003). Although the vernacular used to describe them and the technical specifications used to define them differ from state to state, child-only cases, most generally, can be classified into two types: non-parental cases and parental cases. Parental child-only cases are ones in which the parent, while resident in the home, is ineligible for cash assistance due to receipt of other benefits (usually Supplemental Security Income, SSI), illegal immigrant status, or sanctions (Edelhoch, Liu, and Martin, 2004; Hercik, Palla, and Kakuska, 2003; ASPE, 2002; Wood and Strong, 2002). Non-parental cases are generally those in which no parent is present and the children reside with a relative or other adult with legal guardianship or custody (Charlesworth, Hercik & Kakuska, n.d.). Cases in which children are being cared for by a relative other than a parent also are commonly referred to as kinship care cases, and often involve a grandparent as the primary caregiver (Colosi, Dunifon, and Lee, 2003).
3

The emerging empirical data describing the child-only welfare population is generally consistent across states in painting a profile that differs rather considerably from the profile of a more traditional recipient family. In non-parental child-only cases, to illustrate, the adult caregivers are older than payees in traditional welfare cases, and most often are the grandparent(s) or great-grand-parent(s) of the youngsters in their care. A South Carolina study found that 62% of non-parental caregivers were over the age of 50. The same study also found that non-parental caregivers had longer welfare histories and were more likely to be married than were adults heading traditional TANF cases (Edelhoch, Liu, and Martin, 2004). A New Jersey study found that children in non-parental child-only cases tended to live with their caregiver for most of their lives, had more behavior and school problems than children in other TANF families, and that many of them had been involved with the child-welfare system (Wood and Strong, 2002). The reasons that children have come to reside in these non-parental TANF families/cases are diverse; some have been removed from their parents due to abuse and neglect, substance abuse, domestic violence, or mental health issues (Knitzer, 2000). Parental incarceration and parental desertion are also not uncommon antecedents in these cases. Parental child-only cases, in contrast, appear to consist largely of families in which the parent(s) either receive SSI benefits due to disability or are prohibited from receiving TANF due to immigration status or previous sanctions. Available information indicates that TANF cases headed by a disabled, non-recipient parent have little work history and receive more than half of their monthly income from SSI (Wood and Strong, 2002). Immigrant-parent child-only cases represent approximately one quarter of the nation’s parental child-only caseload, but the size of this cohort may be growing (ASPE, 2002). These families tend to have very low incomes, little work history, and larger households, which often include extended family or friends (Hercik, Palla, and Kurkuska, 2003). The number and circumstances of cases where the resident parent does not receive TANF because of a program sanction vary widely from state to state due to differences in sanctioning policies. Some states, to illustrate, impose partial sanctions for noncompliance with work or child support requirements, which result in child-only cases. In other states, full family sanctions are used instead, but in many of these states children in these families may continue to receive benefits through a protective payee (Farrell, Fishman, Laud, & Allen, 2000). Overall, national data indicates that a significant proportion, perhaps as many as half, of parental child-only cases had once been regular TANF cases.
The apparent diversity within the child-only TANF population and the increased proportion of overall welfare caseloads which these cases now represent are sufficient reason that policy-makers and program managers need to know more about such families’ characteristics and circumstances. Other practical considerations also make this an important topic. For example, in many states, including Maryland, child-only cases, appropriately, are not subject to time limits or work requirements. All else equal, this suggests that, compared to traditional recipient families, child-only cases may be likely to remain on assistance for longer periods of time and, over a period of years, consume more TANF funds. In addition, the children in these families also appear to be more likely to have prior involvement with the public child welfare system and/or be at
4
heightened risk of such involvement in the future.2 While there has always been some degree of overlap between the cash welfare and child welfare programs and populations, child-only cases probably represent the most visible point of intersection and, perhaps, risk. Particularly in the case of non-parental child-only cases, it has been opined that these families and youngsters occupy a poorly defined territory between the TANF and child welfare systems. The bottom-line is that the rising proportion of child-only cases in any given state or locality is probably a mixed blessing. This situation is good news because it implies that welfare-to-work strategies may have been effective for traditional cash assistance families. However, the larger size, great diversity, heightened visibility and potential child welfare risk of child-only cases also make it clear that attention to this population by researchers and program managers is warranted. Undoubtedly, the diversity of family structures within the child-only population makes the task of assessing risks and designing appropriate interventions complicated and challenging. A prerequisite to effective program planning, of course, is to possess reliable, empirical data describing the population of interest, in this case, child-only families. The purpose of today’s report is to provide that type of basic descriptive data about child-only TANF families in the State of Maryland.
2 An earlier Maryland study found that, by far, the single best predictor of future child welfare involvement among cash assistance recipient children was a prior history of child welfare involvement (Ovwigho, Leavitt, & Born, 2003).
5

6
Methods Sample Data presented in this report are based on the universe of child-only cases among the active TCA caseload in Maryland in October 2003 (n=9,208). For purposes of this analysis, cases were considered child-only cases when, according to the financial issuance detail table of the state’s automated information management system, the number of adults on the TANF grant was zero. Each case was then assigned to one of two groups, based on household relationships between case heads and child recipients, and on financial responsibility codes that indicate why a member is excluded from the cash grant. Cases where there were no parent-child relationships between the case head and any child recipients were classified as non-parental child-only cases; cases where there was at least one parent-child relationship were categorized as parental. To maximize the information yield from the study, parental cases were then divided into four sub-groups. Cases where parental non-receipt of TANF was because Supplemental Security Income (SSI) benefits were being received (indicated by either a financial responsibility code or disability code) were classified as SSI cases. Cases in which parents were excluded due to illegal alien status (indicated by their financial responsibility code) were assigned to the immigrant category, and cases with a financial code indicating disqualification due to sanction were classified as sanctioned parent cases. This process resulted in 370 cases where additional investigation was needed in order to definitively determine the correct category assignment. Thus, a search and review of the case narratives was done in each instance; as a result, all but 15 cases could be assigned to a category.3 The 15 unassigned cases were not dropped from the analysis, but are included as a separate analytic group: “other” parental child-only cases. Data Sources Findings described in this report are based on data gathered from several administrative data systems maintained by the State of Maryland. Individual and case-level demographic characteristics and program utilization data were obtained from two systems: AIMS/AMF (Automated Information Management System/Automated Master File) and CARES (Clients Automated Resources and Eligibility System). Employment and wage data were obtained from a third system, MABS (Maryland Automated Benefits System), which contains official data on all Maryland jobs covered by the state’s Unemployment Insurance system. Each of these systems is briefly described here.
3 Case narratives are free-form spaces in the automated system where caseworkers are required to document certain case actions and interactions with clients and where clarifying information about particular family circumstances and challenges is also often recorded.
7

AIMS/AMF. From 1987 through 1993, AIMS/AMF was the statewide data system for programs under the purview of the Maryland Department of Human Resources (DHR). A new system, CARES, began to be used in late 1993 and, with conversion of the last jurisdiction (Baltimore City) in 1998, became the official replacement for AIMS/AMF. Since 1998 no new data have been added to AIMS/AMF, but the archival system is still accessible for program management and research purposes. The archived system contains a participation history for each person who applied for cash assistance (AFDC or TCA), Food Stamps, Medical Assistance, or Social Services. The system contains basic demographic data such as name, date of birth, gender and ethnicity, but also includes the type of program, application and disposition (denial or closure) dates for each service episode, and a code which indicates the relationship of the individual to the head of the assistance unit. AIMS also displays, for each service case, a summary listing of all individuals included in that case. Limited financial data on the last 12 months of benefits received are also available for the cash assistance and Food Stamp programs.
CARES. CARES became the statewide, automated data system for DHR programs as of March 1998. Similar to its predecessor, AIMS/AMF, CARES provides individual and case level program participation data for cash assistance, Food Stamps, Medical Assistance and Social Services. It also provides more detailed information on new program requirements (e.g. time limit counter), exemptions from requirements, and barriers to self-sufficiency (e.g. disabilities, domestic violence).
MABS.
The Maryland Automated Benefits System (MABS) contains employment and wage data on all jobs within Maryland that are covered by the Unemployment Insurance program. Roughly 93% of all in-state jobs are covered. However, notable exclusions are federal government employees, civilian and military, independent contractors, commission-only salespersons, most religious organization employees, some student interns, self-employed persons with no paid staff, and farm workers. “Off the books” or “under the table” employment is not included, nor are jobs located outside of Maryland. The lack of data on jobs in other states and federal jobs is particularly important. According to the 1990 census, the rate of out-of-state employment among Maryland residents (17.4%) is nearly six times greater than that of the nation as a whole (3.5%).4 In certain Maryland counties, including two with large populations and large welfare caseloads (Montgomery and Prince George’s counties) in fact, one-third or more of employed residents worked outside of Maryland: Prince George’s County (44%); Cecil County (38%); Montgomery County (32%). Federal employment is also significant, but unmeasured in this study. There are more than 125,000 federal jobs within the state 4 Data were obtained from the U.S. Census Bureau website (http://venus.census.gov/cdrom/lookup; place of work information: summary tape file 3A).
8
and the large majority of Maryland residents live within easy commuting distance of Washington, D.C. Our lack of access to other states’ data and to federal employment data for purposes of this analysis is a limitation and has a depressing effect on all employment-related findings. Analyses Data from the above sources were used to profile demographic characteristics, welfare use, and employment experiences of adults heading child-only TANF cases in Maryland in October 2003. We used chi-square and ANOVA testing to evaluate differences among the child-only subgroups. Where applicable, comparisons are made to the general October 2003 active caseload using data from a sample that was randomly drawn, has a 99% confidence level with a "5% margin of error (n=1,269), and included two subgroups, Baltimore City and the rest of the state (Hetling, Born, and Saunders, forthcoming).
9

10

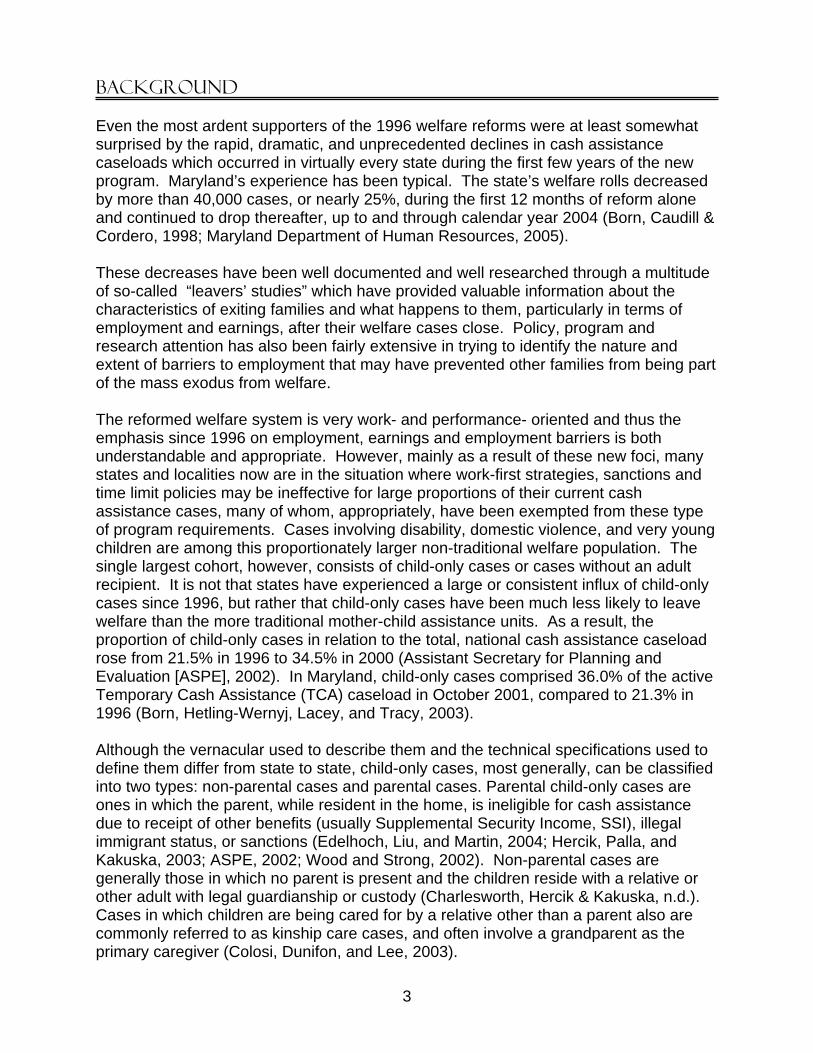
Findings In October 2003, our study month, roughly one of every three active TANF cases statewide was a child-only case, although this percentage ranged from about three in 10 cases in some jurisdictions to as many as three in five cases in others. We begin by providing additional information about the breakdown of these cases by type; this is followed by demographic, welfare use and employment information for the child-only population as a whole and, separately, for each sub-group. Type of Child-Only Case The large majority (75.2%) of all TCA child-only cases in Maryland in October 2003 were non-parental cases. The next most common situation was a parental case in which the parent was receiving SSI benefits (21.9%). Together, these two situations accounted for almost all (97.1%) child-only cases in the state. Roughly two percent of cases (2.2%) were parental cases where the adult’s immigration status precluded his or her TANF participation. Less than one percent of all child-only cases were due to parental sanctioning (0.6%) or some other reason (0.2%). These findings are depicted in Figure 1.
Although not shown in Figure 1, we also looked separately at the parental group of child-only cases; almost nine of 10 (88.3%) were situations in which the parent was receiving SSI disability payments. The remainder represented parents who were illegal immigrants (8.7%), parents who had been partially sanctioned (2.3%), or parents who were otherwise ineligible for cash benefits (0.7%).
Figure 1. Distribution of Child-only Case Types
Other Parental 0.2% (15)
Immigrant Parents 2.2% (198)Sanctioned Parents 0.6% (53)
Non-Parental Cases 75.2% (6,929)
SSI recipients 21.9% (2,013)
11

Adult Demographics The profile of a typical adult heading a child-only TANF case in Maryland is that of a never married (48.3%), African-American (77.3%), female (93%), in her late forties (mean age 48.5 years) who had her first child in her mid-twenties (mean age 25.4 years). However, there are statistically significant differences among the various sub-groups of child-only cases on all demographic measures. At the general level (non-parental vs. parental), we find that adults in non-parental cases are older (average age 52 years vs. 37 years). The adults in non-parental child-only cases are also less likely to have never married and they are less likely to be members of an ethnic group other than Caucasian or African-American.5 In terms of the five sub-groups, Table 1, following this discussion, shows that adults in non-parental cases resemble parents receiving SSI in at least some respects. In both of these sub-groups, while females predominate, there are more than twice as many male adults (7.0% and 7.7%, respectively) as there are in the other three parental groups. In the three other parental sub-groups (i.e., immigrants, sanctions, other), the percentages of male adults were 2.5%, 1.9% and 0%, respectively. In both the non-parental group (19.5%) and SSI parental cohort (24.1%) also, the adult is significantly more likely to be Caucasian. In contrast, less than two percent (1.6%) of adults in the parental immigrant group were Caucasian and none of the adults in the other two parental sub-groups (sanctions, other) were members of this ethnic group. Regarding marital status, the adults in non-parental, child-only cases are noticeably and significantly different from all four types of parental cases. One in five (20.9%) adults in non-parental child-only cases are currently married and two-fifths have never married (40.5%). In contrast, about seven out of ten SSI recipient and immigrant parents have never married (71.9% and 67.7% respectively), as well as over four-fifths of parents in the sanctioned (88.7%) and ‘other’ parental (86.7%) sub-groups. Consistent with the literature, Table 1 also shows that the adults in non-parental cases are significantly older, with an average age of 52 years. In contrast, average age among the parental sub-groups was: SSI cases (28 years), immigrant parents (32 years); sanctioned parents (34 years); and the ‘other’ group (25 years). In terms of estimated age at first birth, it was not possible to construct this variable for non-parental cases because, by definition, they did not have any natural-born or legally adopted children in the assistance unit. Estimates were developed for the four parental sub-groups, however. In SSI recipient cases and immigrant parent cases, the average age at first birth was approximately 25 years. Sanctioned parents were younger, averaging only 23 years of age at the time of first birth. Parents in the ‘other’ group were about 19 years old when they had their first child. SSI and immigrant parent cases were also less likely to have had a child before turning 18 (13.7% SSI cases, 7.8% immigrant cases). In contrast, approximately one in four parents in sanctioned and
5 Due to the large proportion of cases that were, by definition, missing certain of the data needed to compute estimated age at first birth (i.e., date of birth of payee’s oldest child in the assistance unit), statistical tests were not performed on this variable. Indeed, we do not even report age at first birth for non-parental cases.
12

‘other’ parental child-only cases had a child before their 18th birthday (23.1% of sanctioned, and 26.7% of ‘other’ parents). In comparing the overall profile of an adult in a Maryland child-only TANF case to the profile of adults in traditional (i.e., non-child-only) cases in that same month, we do find notable differences. Adults in child-only cases overall are more likely to have been married, and are, on average, much older than the adults in traditional (i.e., not child-only) cases. Of all child-only case heads in the sample, 48.3% had never married, compared with 81.3% of non-child-only case heads. Most notable in terms of long-range planning for the children involved, but also for the state’s cash assistance and child welfare programs, we find that child-only case heads, on average, are almost twenty years older (48.5 years) than are adults in traditional welfare cases (30.8 years).
13

Table 1. Adult Demographics
Non-Parental Parental - SSI Parental - Immigration
Parental - Sanction
Parental - Other Total
Gender*
Female 93.0% (6442) 92.3% (1857) 97.5% (193) 98.1% (52) 100.0% (15) 93.0% (8559) Male 7.0% (487) 7.7% (156) 2.5% (5) 1.9% (1) .0% (0) 7.0% (649)
Marital Status***
Divorced 7.7% (535) 6.9% (139) 1.0% (2) 1.9% (1) 6.7% (1) 7.4% (678)
Married 20.9% (1446) 6.2% (124) 11.1% (22) 3.8% (2) .0% (0) 17.3% (1594)
Never Married 40.5% (2806) 71.9% (1447) 67.7% (134) 88.7% (47) 86.7% (13) 48.3% (4447)
Separated 10.8% (748) 13.2% (265) 15.7% (31) 1.9% (1) 6.7% (1) 11.4% (1046)
Unknown 13.2% (913) 1.0% (21) 2.5% (5) 3.8% (2) .0% (0) 10.2% (941)
Widowed 6.9% (481) .8% (17) 2.0% (4) .0% (0) .0% (0) 5.5% (502)
Race***
Caucasian 19.5% (1292) 24.1% (477) 1.6% (3) .0% (0) .0% (0) 20.0% (1772)
African American 79.4% (5277) 73.1% (1445) 35.7% (66) 98.0% (50) 100.0% (15) 77.3% (6853)
Hispanic .6% (41) 1.2% (23) 58.9% (109) .0% (0) .0% (0) 2.0% (173)
Asian .3% (18) 1.2% (24) 3.8% (7) .0% (0) .0% (0) .6% (49)
Other .2% (14) .4% (7) .0% (0) 2.0% (1) .0% (0) .2% (22)
Age of Payee***
Less than 20 .1% (4) 1.1% (22) 2.0% (4) 3.8% (2) 26.7% (4) .4% (36)
20-25 1.6% (113) 7.3% (146) 15.2% (30) 7.5% (4) 40.0% (6) 3.2% (299)
26-30 3.0% (211) 11.4% (229) 26.8% (53) 17.0% (9) 13.3% (2) 5.5% (504)
31-35 5.0% (346) 15.6% (314) 21.2% (42) 24.5% (13) 13.3% (2) 7.8% (717)
36 and older 90.3% (6255) 64.7% (1302) 34.8% (69) 47.2% (25) 6.7% (1) 83.1% (7652)
Mean*** 52.1 38.3 32.4 34.0 24.7 48.5
Median 52.8 38.6 31.2 34.5 22.5 48.5
Standard Deviation 12.3 9.2 7.7 6.9 6.5 13.2
Minimum 18.8 18.0 18.4 18.7 18.3 18.0
Maximum 92.8 74.7 54.3 46.1 41.0 92.8Estimated Age at First Birth a
Mean 25.1 25.2 23.1 19.5 25.4
Median 23.9 24.0 21.7 19.6 24.1
Standard Deviation 6.7 5.8 6.1 2.7 7.1
Minimum 13.5 15.5 15.1 14.3 10.1
Maximum 48.9 43.5 38.6 26.0 48.9
% before 18 13.7% (252) 7.8% (15) 23.1% (12) 26.7% (4) 13.5% (357)
% before 21
33.8% (621) 24.9% (48) 46.2% (24) 80.0% (12) 33.0% (874)
Sample Size 6929 2013 198 53 15 9208 *p<.05, **p<.01, ***p<.001 a Due to the large proportion of missing data, statistical tests were not performed on this variable.
14
Case Demographics Three case-level demographic variables were also examined: average age of the youngest child in the assistance unit; number of children on the case; and the percent of cases with at least one child under the age of three years. Table 2, following this discussion, presents these results for the total child-only caseload in October 2003 and, separately, for each of the population sub-groups. For the child-only caseload as a whole, we find that the typical case contains only one child (59.4%), whose average age is 9.3 years and, further, that a relatively small percentage of child-only cases (14.1%) include a child under the age of three years. Differences among the various child-only sub-groups on these dimensions are large and statistically significant, however. First, we again find similarities between non-parental cases and parental SSI cases: in both sub-groups, the average age of the youngest child is roughly nine years, significantly higher than in any of the other sub-groups. The youngest child in the sanctioned parent group, on average, is 6.0 years old while, among immigrant parent and other parental cases, the youngest children, on average, are of pre-school age (3.9 years for immigrants, 3.6 years for the other group). The percentage of cases with at least one child under three years of age also varies significantly by sub-group. Non-parental cases are least likely to have a child this young on the case (11.5%) and relatively few parental SSI cases contain a toddler either (18.3%). In contrast, more than half of all parental immigrant cases (56.1%) and other parental cases (53.3%) do include at least one child younger than age three. Parental sanction cases fall between the two extremes; about one of every four (26.4%) of these cases include one or more children under the age of three years. Finally, parental immigrant cases and parental sanction cases both average about two children in the assistance unit, while non-parental cases and parental SSI cases average fewer than two children per case. When compared to traditional cash assistance cases active in October 2003, child-only cases, on average, have older and slightly fewer children. The average age of the youngest child in child-only cases was 9.3 years, while the average in all other cases was 5.1 years. Non-child-only cases had an average of 1.9 children in the assistance unit, and child-only cases averaged 1.6.
15
Table 2. Case Demographics
Non-Parental Parental - SSI Parental - Immigration
Parental – Sanction
Parental - Other Total
Age of Youngest Child in the Assistance Unit
Mean *** 9.5 9.0 3.9 6.0 3.5 9.3 Median 10.0 9.5 2.5 4.5 3.0 9.8
Standard Deviation 4.7 5.2 3.7 4.1 3.6 4.9
Minimum 0.0 0.0 0.1 0.8 0.7 0.0
Maximum 18.0 18.0 17.7 16.1 14.7 18.0
% of cases with children under 3 *** 11.5% (795) 18.3% (366) 56.1% (111) 26.4% (14) 53.3% (8) 14.1% (1294)
Number of Children in the Assistance Unit ***
1 62.8% (4348) 50.6% (1019) 40.9% (81) 32.1% (17) 60.0% (9) 59.4% (5474)
2 25.1% (1739) 29.6% (596) 32.3% (64) 41.5% (22) 13.3% (2) 26.3% (2423)
3 8.4% (584) 11.5% (231) 15.7% (31) 15.1% (8) 6.7% (1) 9.3% (855)
4 or more 3.7% (258) 8.3% (167) 11.1% (22) 11.3% (6) 20.0% (3) 5.0% (456)
Mean *** 1.6 1.8 2.0 2.2 1.9 1.6
Median 1.0 1.0 2.0 2.0 1.0 1.0
Standard Deviation 0.9 1.1 1.2 1.3 1.4 1.0
Minimum 1.0 1.0 1.0 1.0 1.0 1.0
Maximum 10.0 9.0 8.0 7.0 5.0 10.0
Sample Size 6929 2013 198 53 15 9208 *p<.05, **p<.01, ***p<.001 Child Welfare Involvement Today’s child-only TANF cases, for a variety of reasons, may represent the most visible, if not well understood and, perhaps, not well-served, population which straddles the boundaries between child welfare and cash assistance. Certainly, links between the child and cash welfare systems are not new. It has long been true that a significant percentage of families in the child welfare system receive cash assistance. Federal foster care funding (i.e., Title IV-E), since its inception, has been tied to welfare eligibility and, in recent years, TANF dollars have provided roughly one-quarter of all federal spending on child welfare (Geen, 2003). However, the emergence of child-only cases as a major TANF sub-population – nearly two-fifths of all TANF cases nationwide – implies that child well-being and child welfare issues, broadly-defined, may now or soon need to be addressed as front-and-center case management matters by TANF staff and programs. Indeed, recent studies do suggest that children who receive cash assistance in non-parental homes are more likely to have a history with Child Protective Services than are other child recipients. To a certain extent this is a common-sense finding because states have made widespread use of familial placements for children removed from their parental homes because of abuse or neglect. This practice reality is reflected in our
16

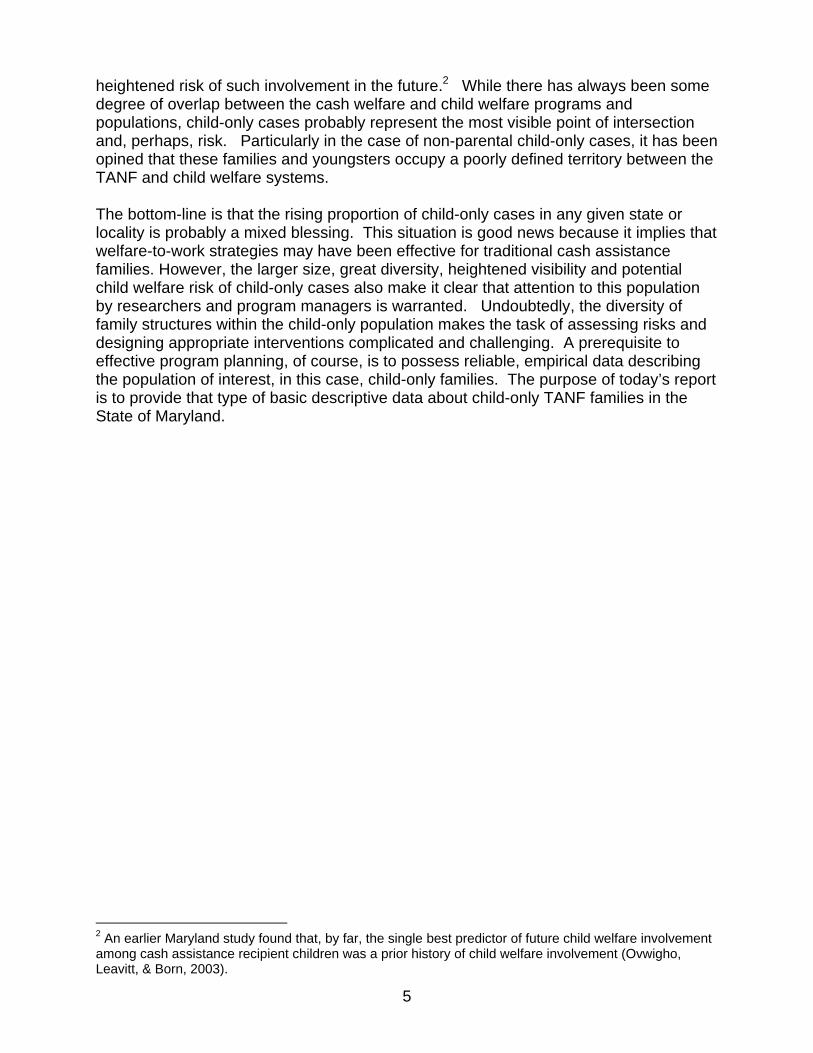
study findings. As illustrated in Figure 2, following, half of all children in non-parental, child-only cash assistance cases in Maryland in October 2003 had a substantiated or indicated incident of child abuse or child neglect in their past (49.9%), compared to less than one-third of all youngsters in parental child-only cases in that same month (30.9%).6 Indeed, it would seem reasonable to suspect that, in a sizable number of these cases, the children’s involvement with protective services may have precipitated their placement with the relative who is now receiving cash assistance on their behalf. Similar, though not nearly as dramatic, patterns were observed for the other child welfare services examined in this study; children in non-parental cases were more likely to have prior involvement with Intensive Family Services, Kinship Care Services and foster care than were children in parental child-only cases. In terms of Intensive Family Services, a counseling program aimed at preserving families facing a crisis of abuse or neglect, we found that 13.1% of children in non-parental cases had been involved with this service, compared to 9.2% of youngsters in parental cases. Kinship Care Services were, as expected, far more common among non-parental cases (25.9% versus 4.2%). Parental child-only cases that utilize Kinship Care may be families that include relatives such as cousins, nieces or nephews in addition to their own children. Finally, involvement with the formal foster care system was understandably low in both groups, as children eligible for funding through foster care do not receive TCA. Still, children in non-parental, child-only TCA cases were twice as likely to have been involved with the foster care system at some point than were children in parental child-only TCA cases (14.8% versus 7.5%). Children in child-only (parental or non-parental) TCA cases were also more likely to have prior child welfare involvement than children in TCA cases that had closed. Among children in cases that exited welfare between April 2002 and March 2003, 23.4% had been involved in a substantiated or indicated incident of abuse or neglect. The figure was almost twice as high (44.6%) among children in child-only cases that were active in October 2003. Findings were similar for the other child welfare services studied. Among children in exiting cases, 5.6% had received Intensive Family Services, compared to 12.0% of children in child-only cases and less than a tenth of leavers received Kinship Care (7.2%), compared to almost 20 percent of child-only recipients (19.8%). In terms of formal foster care services, 5.6% of youngsters in exiting cases had been involved in foster care compared to 12.7% of children in child-only cases (Ovwigho, Born, Ruck, and Tracy, 2003).
6 Detailed data tables based on child-level and case-level analyses regarding child welfare involvement are presented in the appendix.
17

Figure 2. Child Welfare Involvement
49.9%
13.1% 14.8%
25.9%
7.5%4.2%
9.2%
30.9%
0
10
20
30
40
50
60
70
80
90
100
Child Abuse andNeglect
Intensive FamilyServices
Kinship Care Foster Care
Parental Child-Only Non-Parental Child-Only
Cash Assistance Participation History For the most part, child-only cases are exempt from time limits, and, as a result may accrue long histories of cash assistance benefit receipt. The child-only population now represents a much larger and still increasing share of the total TCA caseload and federal and state TANF dollars are under mounting pressure. Therefore, it is important for long-range planning purposes to gain a better understanding of the welfare use patterns of this group of recipients. Table 3, following this discussion, shows that for our child-only study population as a whole, about one in five cases (20.3%) had received benefits in 12 or fewer months of the preceding 60 months. More than twice as many (45.3%), however, had received benefits in 49 to 60 of those months or, in other words, for 80% or more of the time. On average, a child-only case received benefits in 37.5 of the past 60 months, or not quite two-thirds of the time. Table 3 shows that cumulative welfare use also differs significantly among the various types of child-only cases. Non-parental cases and parental SSI cases have the most cumulative welfare use during the preceding five years: 44.1% and 54.1% of the cases in these two groups received benefits in at least 49 of the preceding 60 months. The comparable percentages among parental immigration cases (9.1%), parental sanction cases (18.9%) and other parental cases (6.7%) were much lower.
18

A similar pattern is observed when we look only at the last 12 months. Non-parental cases and parental SSI cases are more likely to have received benefits for most, if not all, of the year; 72.0% and 77.2% of non-parental and parental SSI cases, respectively, received benefits in at least 10 of the past 12 months.
The bottom third of Table 3 shows there are also statistically significant differences among the five groups on the average length of the current TCA spell. For the study population as a whole, average spell length as of October 2003 was 36.7 months or just about three years. About one-third (34.5%) of cases had been open for one year or less, but nearly an equal percentage (29.2%) had been open for more than 60 months or five years. Parental SSI cases (41.5 months) and non-parental cases (36.2 months) had the longest average current spell length, both types of child-only cases having been open without interruption, on average, for at least three years. Average current spell length for the other three groups was markedly lower: parental immigration cases (12.6 months), parental sanction cases (17.5 months), and other parental cases (13.3 months). Roughly one of every three non-parental cases (29.4%) and parental SSI cases (32.1%) had received cash assistance continuously for more than five years.
Although not shown in the table, child-only cases as a group are also noticeably different in terms of welfare history and current welfare use than non-child-only cases in the active TCA caseload in the same month (October 2003). Within the past year, child-only cases received cash assistance, on average, in two-and-one-half more months (9.8 months versus 7.3 months). Across the preceding five years, the cumulative difference was approximately 15 months (37.5 months versus 22.4 months). Most striking is the contrast in average length of the current welfare spell. As noted previously, the average or typical child-only case had been open continuously for about three years (36.7 months); the average or typical non-child-only case had been open for just about one year (13.6 months). Again, however, non-parental and parental SSI child-only cases have lengthy welfare episodes, while the other child-only groups more closely resemble “regular” TCA cases on this variable. That is, the average current spell length for non-child-only or “regular” cases (13.6 months), parental immigrant child-only cases (12.6 months), sanctioned child-only cases (17.5 months), and other parental child-only cases (13.3 months), were all less than 18 months, or one and one-half years. In contrast, the average length of the current, continuous welfare spell for non-parental child-only cases (36.2 months) and parental SSI cases (41.5 months) was at least three years.
19

Table 3. Cash Assistance Participation History
Non-Parental Parental - SSI Parental - Immigration
Parental - Sanction
Parental - Other Total
Number of Months of Receipt in the past 60***
12 months or less 21.9% (1519) 10.7% (216) 58.6% (116) 13.2% (7) 46.7% (7) 20.3% (1865)
13-24 months 13.5% (933) 10.3% (208) 19.7% (39) 18.9% (10) 33.3% (5) 13.0% (1195)
25-36 months 10.9% (752) 11.3% (228) 9.6% (19) 17.0% (9) 6.7% (1) 11.0% (1009)
37-48 months 9.7% (671) 13.5% (271) 3.0% (6) 32.1% (17) 6.7% (1) 10.5% (966)
49-60 months 44.1% (3054) 54.1% (1090) 9.1% (18) 18.9% (10) 6.7% (1) 45.3% (4173)
Mean 36.7 42.9 15.6 33.4 17.1 37.5
Median 41.0 52.0 10.0 38.0 13.0 43.0
Standard Deviation 21.9 18.8 16.5 16.2 16.6 21.6
Minimum 0.0 0.0 0.0 0.0 0.0 0.0
Maximum 60.0 60.0 60.0 59.0 60.0 60.0Number of Months of Receipt in the past 12***
0 months 2.8% (195) 1.9% (39) 8.1% (16) 1.9% (1) 13.3% (2) 2.7% (253)
1-3 months 7.9% (549) 5.5% (111) 20.7% (41) 5.7% (3) 13.3% (2) 7.7% (706)
4-6 months 6.6% (460) 4.9% (99) 9.6% (19) 7.5% (4) 20.0% (3) 6.4% (585)
7-9 months 10.6% (736) 10.4% (209) 21.2% (42) 18.9% (10) 26.7% (4) 10.9% (1001)
10-12 months 72.0% (4989) 77.2% (1555) 40.4% (80) 66.0% (35) 26.7% (4) 72.4% (6663)
Mean 9.8 10.3 7.1 9.6 6.3 9.8
Median 12.0 12.0 8.0 10.0 7.0 12.0
Standard Deviation 3.5 3.1 4.2 3.1 4.1 3.5
Minimum 0.0 0.0 0.0 0.0 0.0 0.0
Maximum 12.0 12.0 12.0 12.0 12.0 12.0Number of months of receipt in current spell***
12 months or less 34.7% (2404) 29.6% (596) 71.2% (141) 52.8% (28) 73.3% (11) 34.5% (3180)
13-24 months 14.3% (993) 12.8% (257) 15.2% (30) 26.4% (14) 6.7% (1) 14.1% (1295)
25-36 months 8.9% (615) 10.9% (219) 7.1% (14) 7.5% (4) .0% (0) 9.3% (852)
37-48 months 6.8% (472) 8.7% (175) 2.5% (5) 5.7% (3) 13.3% (2) 7.1% (657)
49-60 months 5.9% (408) 5.9% (119) 1.5% (3) 3.8% (2) .0% (0) 5.8% (532)
More than 60 months 29.4% (2037) 32.1% (647) 2.5% (5) 3.8% (2) 6.7% (1) 29.2% (2692)
Mean 36.2 41.5 12.6 17.5 13.3 36.7
Median 25.0 32.0 8.0 11.0 5.0 26.0
Standard Deviation 32.7 36.6 17.3 17.0 19.3 33.6
Minimum 1.0 1.0 1.0 1.0 1.0 1.0
Maximum 122.0 122.0 106.0 78.0 67.0 122.0
Sample Size 6929 2013 198 53 15 9208 *p<.05, **p<.01, ***p<.001
20
Employment History Child-only cash assistance cases, for the most part, are also exempt from work requirements, which are a prominent feature of today’s welfare system and an important focus of welfare reform reauthorization debates. The continued work exemption status of child-only cases is not being fervently contested, to our knowledge. Nonetheless, examination of current and historical employment and earnings patterns among adults in child-only households is important in gaining a better understanding of this portion of the TCA caseload. In addition, because child-only households typically receive less money from TANF than non-child-only households of the same size, low rates of employment or low earnings from employment could be of particular concern. Table 4 presents employment and earnings data from the Maryland Automated Benefits System for our critical study quarter (October to December 2003), as well as historical employment and earnings data for each type of child-only case. Work effort by adults who head child-only TCA cases is relatively substantial, as indicated in Table 4. In the eight quarters (October 2001 to September 2003) immediately preceding our study month, approximately half (47.4%) of all child-only case heads were employed in a Maryland job covered by the Unemployment Insurance program. On average, these adults worked at least some of the time during six of those eight quarters. However, these overall findings are most heavily influenced by the largest child-only cohort, non-parental cases, and do mask large and significant differences among the five groups. That is, more than half (55.2%) of all adults in non-parental cases worked at some point during the previous two years and worked in an average of six of the eight quarters (average 6.5 quarters). Adults in other parental cases also had a very high rate of employment (86.7%), but, on average, worked in only three of the eight quarters (3.3 quarters), or less than half of the time. About half of the sanctioned parents were also employed (49.1%) at some point during the past two years, but again the average number of quarters worked was low (2.7 quarters) and considerably lower than the average among the adults in non-parental cases (6.5 quarters). The percentages of both SSI recipient parents and immigrant parents who worked (22.9% and 22.2%, respectively) were lower than those of the other three groups, although they worked for an average of about three quarters (2.8 for both groups), as did sanctioned and other parental case heads. In the most recent four quarters, or July 2002 to September 2003, the pattern was similar. Parents in “other” child-only cases had the highest employment rate (73.3%), but worked in only two of the four quarters, on average. Adults in non-parental child-only cases, in contrast, had the second highest employment rate (50.2%), but much more consistent employment; they worked, on average, in 3.5 out of 4.0 quarters. SSI recipient parents and immigrant parents had the most in common, with employment rates of less than one in five (13.6% and 16.2%), and an average of 2.0 quarters in which they worked at least some of the time. Sanctioned parents had a somewhat higher employment rate (32.1%), but the lowest average number of quarters worked (1.5).
21

Average total and quarterly earnings for the most recent four quarters also reveal statistically significant differences among the child-only subgroups. Overall, among adults in child-only cases, average quarterly earnings were $5,002.84 and average total earnings for the year were $18,512.54. These figures, however, are very misleading because, as Table 4 shows, only the adults in non-parental cases – the largest group by far – had quarterly or total average earnings anywhere close to these levels. Non-parental adults, to illustrate, earned the highest average total wages ($20,009.55), and average quarterly wages ($5,365.53). Average annual and quarterly wages were considerably lower for all four types of parental child-only cases. Among the parental cases, adults in “other” child-only cases had the highest average total earnings ($5,153.14) in the four quarters, and slightly higher average quarterly earnings ($1,616.60) compared to the other three parental subgroups. SSI recipients, immigrant parents, and sanctioned parents earned an average of about three thousand dollars total in the year ($2,787.84, $3,232.75, and $2,872.31, respectively), and about half that quarterly ($1,168.88, $1,419.97, $1,476.05, respectively). Notably, the median earnings in the past four quarters were lowest for sanctioned parents, showing that half of those who received a child-only grant in October 2003 due to a sanction earned $585.04 or less in the previous year. In the critical or study quarter, October through December 2003, about one-third (33.5%) of all child-only case heads worked at some point in a job covered by the Maryland Unemployment Insurance program. Again, however, adults in non-parental cases had the highest employment rate by a wide margin, with more than two-fifths working (42.1%). SSI recipients, understandably, had the lowest employment rate at 6.7%. The remaining groups were varied, but in each one, less than a third were employed in the critical quarter. Adults in non-parental cases also had the highest average earnings in that quarter (mean=$6,018.61), averaging over three thousand dollars more than immigrant parents, who had the highest earnings among parental case heads (mean=$2,525.40). SSI recipients and sanctioned parents had the lowest average earnings in the critical quarter, averaging $1,226.60 and $1,386.01 respectively. Adults in “other” parental child-only cases earned an average of $1,895.37. Median earnings were lowest among SSI recipients and sanctioned parents, over half of whom earned less than $900 for the quarter. We also compared the October-December 2003 earnings of adults in child-only cases with the earnings of adults heading non-child-only cases that were also active (i.e., received a TCA benefit) in the month of October 2003. As a group, the child-only adults had higher quarterly earnings ($5,762.43), on average, than did the adults in more traditional cases ($3,415.10). However, a closer look reveals that the difference applies only to non-parental child-only cases. In fact, each of the parental child-only groups had lower average quarterly earnings than did the non-child-only or traditional TCA group. Indeed, in SSI recipient parent child-only cases and sanctioned parent child-only cases, average quarterly earnings ($1,226.60 and $1,386.01, respectively) were less than half the average quarterly earnings among adults in traditional or non-child-only TCA cases in that same month ($3,415.10). Adults in non-parental child-only cases, in contrast, had average quarterly earnings of $6,018.61.
22

Table 4. Employment History
Non-Parental Parental – SSI
Parental – Immigration
Parental – Sanction
Parental – Other Total
Past 8 Quarters %Employed*** 55.2% (3822) 22.9% (461) 22.2% (44) 49.1% (26) 86.7% (13) 47.4% (4366)Mean Quarters Worked*** 6.5 2.8 2.8 2.7 3.3 6.0
Median Quarters Worked 8.0 2.0 2.0 3.0 2.0 7.0
Standard Deviation 2.2 1.9 2.2 1.5 2.5 2.5Past 4 Quarters %Employed*** 50.2% (3477) 13.6% (273) 16.2% (32) 32.1% (17) 73.3% (11) 41.4% (3810)Mean Quarters Worked*** 3.5 2.0 2.0 1.5 2.1 3.3
Median Quarters Worked 4.0 2.0 1.5 1.0 2.5 2.5
Standard Deviation 0.9 1.1 1.1 0.9 1.0 1.0Total earnings Mean*** $20,009.55 $2,787.84 $3,232.75 $2,872.31 $5,153.14 $18,512.54Median $18,042.50 $1,002.26 $2,271.44 $585.04 $853.85 $16,537.32Standard Deviation $14,221.71 $4,097.94 $3,276.36 $5,082.04 $10,101.25 $14,477.00Minimum $23.05 $15.34 $12.27 $23.05 $72.62 $12.27Maximum $78,269.41 $36,944.31 $11,799.65 $20,493.56 $34,662.25 $78,269.41Avg. quarterly earnings Mean*** $5,365.53 $1,168.88 $1,419.97 $1,476.05 $1,616.60 $5,002.84Median $4,833.08 $743.00 $1,160.21 $585.04 $426.93 $4,454.58Standard Deviation $3,487.27 $1,487.79 $1,129.04 $1,586.44 $2,491.54 $3,558.65Minimum $23.05 $15.34 $12.27 $23.05 $72.62 $12.27Maximum $19,567.35 $9,236.08 $3,933.22 $5,123.39 $8,665.56 $19,567.35
Critical Quarter %Employed*** 42.1% (2914) 6.7% (135) 11.6% (23) 17.0% (9) 26.7% (4) 33.5% (3085)Total earnings Mean*** $6,018.61 $1,226.60 $2,525.40 $1,386.01 $1,895.37 $5,762.43Median $5,563.09 $852.85 $2,124.62 $803.75 $1,197.60 $5,347.63Standard Deviation $3,753.10 $1,224.93 $2,218.35 $1,926.91 $2,504.27 $3,813.03Minimum $8.02 $31.07 $123.27 $70.15 $250.54 $8.02Maximum $21,528.81 $6,146.37 $8,345.14 $6,292.68 $5,604.18 $21,528.81
Sample Size 6929 2013 198 53 15 9208 *p<.05, **p<.01, ***p<.001
23

24

Conclusions One important if unanticipated consequence of welfare reform has been a change in the composition of the cash assistance caseload. Of particular note is the increasing share of total caseloads that are accounted for by child-only cases, those in which the parent may or may not be present in the home, but in which cash assistance is being received only for the child or children. This study was undertaken to provide Maryland policy-makers and program managers with a better understanding of the characteristics and circumstances of this portion of their current caseloads. Our most general conclusions are that the child-only population is not homogeneous, there are programmatically important as well as statistically significant differences among the various sub-groups of child-only cases, and that a “one size fits all” service approach to these cases is probably not optimal. Another is that in at least a plurality of situations, child-only cases do appear to straddle the murky boundary between cash assistance and child welfare. Half (49.9%) of all youngsters in the non-parental child-only cases in our sample, to illustrate, had a prior substantiated or indicated incident of child abuse or neglect, the same was true for less than one-third (30.9%) of youngsters in parental child-only cases in that same month. Study findings, particularly those concerning prior child welfare involvement and welfare utilization patterns, imply that many non-parental and parental SSI child-only cases could well persist in their current status for the foreseeable future, perhaps until the youngest child is emancipated. In terms of long-range planning for the individual children involved, the findings also suggest that, particularly for children in the care of non-parental caretakers – whose average age is 52 years - it may be wise to consider how or if public welfare case management services should be supplemented with child and family welfare case management/services and contingency planning. That is, the need for cross-program planning and case management for child-only cases, especially those headed by a non-parent, should be carefully considered. This recommendation may be given further weight by our finding from an earlier study that the single most powerful predictor of future child welfare involvement is past child welfare involvement. In sum, this study attempts to provide policy-makers, program managers and front-line TCA case management staff with descriptive information about child-only cases, a generally invisible, but increasingly larger cohort within cash assistance caseloads in all Maryland subdivisions. Understandably, most attention in recent months has focused on efforts to divine and plan for the more stringent work requirements that most observers believe will result from the eventual reauthorization of TANF at the national level. That is important work. Study findings suggest similar creative energy should probably be focused on further research into and cross-program planning/case management, service strategies and long-range planning for child-only cases. The practical reasons to focus specific attention on the child-only population are that child-only cases are generally exempt from work requirements and time limits and represent 35% of our state’s overall TCA caseload – and more than 40% in 17 of the state’s subdivisions. The most important reason, however, is that – by definition – all TCA recipients in these cases are children.
25

26

References Assistant Secretary for Planning and Evaluation. (2002). Indicators of welfare
dependence: annual report to Congress, 2002. Washington, DC: U.S. Department of Health and Human Services.
Born, C.E., Caudill, P., and Cordero, M. (1998). Life On Welfare: Who Gets Assistance
18 Months Into Reform? Baltimore: University of Maryland School of Social Work.
Born, C. E., Hetling-Wernyj, A., Lacey, D., & Tracy, K. (2003). Life on welfare: A
snapshot of the active TCA caseload in October 2001. Baltimore, MD: University of Maryland School of Social Work.
Charlesworth, L., Hercik, J. & Kakuska, C. (n.d.). TANF Child-Only Cases Trends and
Issues. Retrieved on March 28, 2005 from http://peerta.acf.hhs.gov/pdf/child_only.pdf
Colosi, L., Dunifon, R., & Lee, W. (2003). Research brief: relatives as caregivers. Ithaca,
NY: Cornell Cooperative Extension. Edelhoch, M., Liu, Q., & Martin, L. (2004). Unsung heroes: Relative caretakers in child-
only cases. Policy & Practice (2002) 26-30. Farrell, M., Fishman, M., Laud, S., & Allen, V. (2000). Understanding the AFDC/TANF
Child-Only Caseload: Policies, Composition, and Characteristics in Three States. Washington, DC: U.S. Department of Health and Human Services.
Geen. R. (2003). Improving Child Welfare Agency Performance through Fiscal Reforms:
An Assessment of Recent Proposals. Working paper 338. Chicago: Joint Center for Poverty Research.
Hetling, A., Born, C.E., & Saunders, C. (forthcoming). Life on welfare: A snapshot of the
active TCA caseload in October 2003. Baltimore, MD: University of Maryland, School of Social Work.
Hercik, J., Palla, S., & Kakuska, C. (2003). Developing Strategies to Address the Child-
Only Caseload: Trenton, New Jersey. Fairfax, VA: Caliber Associates. Knitzer, J. (2000). Promoting resilience: Helping young children and parents affected by
substance abuse, domestic violence, and depression in the context of welfare reform. Children and Welfare Reform [Issue Brief 8]. New York, NY: National Center for Children in Poverty.
Maryland Department of Human Resources (2004, June). Core Caseload Case
Summary by Region/LDSS. Baltimore: Author.
27

Maryland Department of Human Resources (2005). Monthly statistical report January 2005. Baltimore: Author.
Ovwigho, P., Leavitt, K., & Born, C. (2003). Life after welfare: Child abuse & neglect
reports among early and later leavers. Baltimore, MD: University of Maryland, School of Social Work.
Ovwhigo, P., Born, C. E., Ruck, D., & Tracy, K. (2003). Life after welfare: Eighth report.
Baltimore, MD: University of Maryland, School of Social Work. Wood, R. & Strong, D. (2002). The Status of Families on Child-Only TANF Cases.
Princeton, NJ: Mathematica Policy Research, Inc.
28

Appendix Table A-1. Child Welfare History - Child Level
Non-Parental Parental - SSIParental -
Immigration Parental - Sanction
Parental - Other Total
Child Abuse and Neglect*** 49.9% (5431) 33.4% (1230) 7.2% (29) 38.7% (46) 20.7% (6) 44.6% (6742)
Intensive Family Services*** 13.1% (1429) 9.9% (364) 2.2% (9) 12.6% (15) .0% (0) 12.0% (1817)
Kinship Care*** 25.9% (2817) 4.6% (170) .0% (0) 6.7% (8) 3.4% (1) 19.8% (2996)
Foster Care*** 14.8% (1611) 8.0% (295) 3.2% (13) 5.9% (7) 6.9% (2) 12.7% (1928)
Sample Size 10,888 3,686 403 119 29 15,125 *p<.05, **p<.01, ***p<.001 Table A-2. Child Welfare History – Case Level
Non-Parental Parental - SSI Parental -
Immigration Parental - Sanction
Parental - Other Total
Child Abuse or Neglect*** 52.1% (3613) 34.3% (690) 7.6% (15) 47.2% (25) 20.0% (3) 47.2% (4346)
Intensive Family Services*** 13.5% (933) 10.7% (216) 2.0% (4) 13.2% (7) .0% (0) 12.6% (1160)
Kinship Care*** 27.1% (1877) 5.2% (104) .0% (0) 11.3% (6) 6.7% (1) 21.6% (1988)
Foster Care*** 17.3% (1200) 9.5% (192) 3.5% (7) 9.4% (5) 13.3% (2) 15.3% (1406)
Total 6,929 2,013 198 53 15 9,208 *p<.05, **p<.01, ***p<.001
29

![Błąd wychowawczy a stosowana dyrektywność rodzicielska [The parental mistake and applied parental control]](https://static.fdokumen.com/doc/165x107/6331b765f008040551041fa0/blad-wychowawczy-a-stosowana-dyrektywnosc-rodzicielska-the-parental-mistake.jpg)