Paraconductivity study in Er Ba2Cu3-x Mx O7-δ (M = Zn, Fe) superconductors
7
Chin. Phys. B Vol. 22, No. 11 (2013) 117401 Paraconductivity study in ErBa 2 Cu 3-x x O 7-δ ( = Zn, Fe) superconductors A. Sedky a)b) † and S. B. Mohamed a) a) Physics Department, Faculty of Science, King Faisal University, Al-Hassa 31982, Saudi Arabia b) Physics Department, Faculty of Science, Assiut University, Assiut, Egypt (Received 13 June 2013; revised manuscript received 2 August 2013) We report here the paraconductivity of ErBa 2 Cu 3-x M x O 7-δ (M = Zn and Fe) superconductors. The logarithmic plots of excess conductivity Δσ and reduced temperature C reveal two different exponents corresponding to crossover temperature as a result of shifting the order parameter from 2 to 3. The first exponent in the normal field region is close to 1, in which the order parameter dimensionality (OPD) is 2. The second exponent in the critical field region is close to 0.5, in which the OPD is 3. The coherence length, interlayer coupling, interlayer separation and carrier concentration decrease with increasing doping content, and their values for Fe samples are different from those of Zn samples. While anisotropy is increased with increasing doping content, it is generally higher for a Zn sample than that for an Fe sample. We also estimate several physical parameters such as upper critical magnetic fields in the a–b plane and along the c axis (B ab and B c ), and critical current density J at 0 K. Although B ab and B c are generally increased with doping content increasing, the value of B ab is found to be twice more than that of B c . A similar behavior is obtained for J (0 K) and its value is higher in the Fe sample than that in the Zn sample. These results are discussed in terms of oxygen deficiency, localization of carriers, and flux pinning, which are produced by doping. Keywords: ceramics, chemical synthesis, X-ray diffraction, electrical properties, transport properties PACS: 74.25.Bt, 74.62.Dh, 74.62.En, 74.72.gh DOI: 10.1088/1674-1056/22/11/117401 1. Introduction High temperature superconductors exhibit anisotropy and small coherence length together with elevated values of crit- ical temperature T c . These parameters have great effects on the thermal fluctuations of superconducting order parame- ter dimensionality (OPD), which have been observed in the measurements of conductivity versus temperature as excess conductivity. [1] By reducing the temperature from room tem- perature toward the critical temperature T c , the fluctuation of Cooper pairs begins to occur spontaneously at a temperature T f (T f = 2T c ). [2] As the temperature approaches T c , the number of Cooper pairs increases while the normal electron density de- creases. Therefore, the resistivity decreases and the thermal fluctuations induce an excess conductivity Δσ . The fluctuation induced conductivity (FIC) analyses re- vealed that the contribution of excess conductivity is due to Gaussian and critical fluctuations in the mean and critical field regions, respectively. [3] Gaussian fluctuation is probably dom- inant in the temperature region above the mean field tempera- ture T mf c when the fluctuation in the order parameter is small and the interactions between Cooper pairs can be neglected. While the critical fluctuation occurs in the critical field re- gion close to T c when the fluctuations in the order parameter are large and the interactions between Cooper pairs is con- sidered The variation of Gaussian FIC with the reduced tem- perature helps to find the dimensional exponents, coherence lengths and crossover temperatures. [4] The dimensional expo- nents in high-T c materials are found to be zero-dimensional (0D), one-dimensional (1D), two-dimensional (2D), and three- dimensional (3D). It is seen that the dimensional crossover takes place between any two regions with different dimen- sions. The crossover from two dimensions to three dimensions is mainly obtained above T c at a crossover temperature which is different for different samples. However, the crossover tem- perature is not unique; rather the dimensional crossover takes place over a temperature region. [5] However, the possibility of oxygen deficiency in Y:123 superconductors, either in CuO 2 planes or in CuO chains, has interesting phenomena due its influences on the critical temperatures of these materials. It has been reported that the oxygen deficiency influences the FIC in most of high T c superconductors. [6–9] The fluctuation analyses based on Y:123 samples have revealed that there is a crossover from three di- mensions to quasi two dimensions by removing the oxygen from CuO chains. A 3D behavior is expected close to T c when the c-axis coherence length becomes greater than the interlayer spacing. [6,7] While the crossover from three dimensions to two dimensions has been obtained by the created vacancies of oxy- gen induced by irradiation in the Cu–O 2 planes of Bi: 2212 system. [8,9] In the above background, we report here the order parameter dimensionality response to the oxygen deficiency created by both Zn and Fe doped Er: 123 superconductors. † Corresponding author. E-mail: [email protected]; [email protected] © 2013 Chinese Physical Society and IOP Publishing Ltd http://iopscience.iop.org/cpb http://cpb.iphy.ac.cn 117401-1
Transcript of Paraconductivity study in Er Ba2Cu3-x Mx O7-δ (M = Zn, Fe) superconductors
Chin. Phys. B Vol. 22, No. 11 (2013) 117401
Paraconductivity study in ErBa2Cu3−x𝑀xO7−δ (𝑀 = Zn, Fe)superconductors
A. Sedkya)b)† and S. B. Mohameda)
a)Physics Department, Faculty of Science, King Faisal University, Al-Hassa 31982, Saudi Arabiab)Physics Department, Faculty of Science, Assiut University, Assiut, Egypt
(Received 13 June 2013; revised manuscript received 2 August 2013)
We report here the paraconductivity of ErBa2Cu3−xMxO7−δ (M = Zn and Fe) superconductors. The logarithmicplots of excess conductivity ∆σ and reduced temperature C reveal two different exponents corresponding to crossovertemperature as a result of shifting the order parameter from 2 to 3. The first exponent in the normal field region is close to1, in which the order parameter dimensionality (OPD) is 2. The second exponent in the critical field region is close to 0.5,in which the OPD is 3. The coherence length, interlayer coupling, interlayer separation and carrier concentration decreasewith increasing doping content, and their values for Fe samples are different from those of Zn samples. While anisotropy isincreased with increasing doping content, it is generally higher for a Zn sample than that for an Fe sample. We also estimateseveral physical parameters such as upper critical magnetic fields in the a–b plane and along the c axis (Bab and Bc), andcritical current density J at 0 K. Although Bab and Bc are generally increased with doping content increasing, the value ofBab is found to be twice more than that of Bc. A similar behavior is obtained for J (0 K) and its value is higher in the Fesample than that in the Zn sample. These results are discussed in terms of oxygen deficiency, localization of carriers, andflux pinning, which are produced by doping.
Keywords: ceramics, chemical synthesis, X-ray diffraction, electrical properties, transport properties
PACS: 74.25.Bt, 74.62.Dh, 74.62.En, 74.72.gh DOI: 10.1088/1674-1056/22/11/117401
1. Introduction
High temperature superconductors exhibit anisotropy andsmall coherence length together with elevated values of crit-ical temperature Tc. These parameters have great effects onthe thermal fluctuations of superconducting order parame-ter dimensionality (OPD), which have been observed in themeasurements of conductivity versus temperature as excessconductivity.[1] By reducing the temperature from room tem-perature toward the critical temperature Tc, the fluctuation ofCooper pairs begins to occur spontaneously at a temperature Tf
(Tf = 2Tc).[2] As the temperature approaches Tc, the number ofCooper pairs increases while the normal electron density de-creases. Therefore, the resistivity decreases and the thermalfluctuations induce an excess conductivity ∆σ .
The fluctuation induced conductivity (FIC) analyses re-vealed that the contribution of excess conductivity is due toGaussian and critical fluctuations in the mean and critical fieldregions, respectively.[3] Gaussian fluctuation is probably dom-inant in the temperature region above the mean field tempera-ture T mf
c when the fluctuation in the order parameter is smalland the interactions between Cooper pairs can be neglected.While the critical fluctuation occurs in the critical field re-gion close to Tc when the fluctuations in the order parameterare large and the interactions between Cooper pairs is con-sidered The variation of Gaussian FIC with the reduced tem-perature helps to find the dimensional exponents, coherence
lengths and crossover temperatures.[4] The dimensional expo-nents in high-Tc materials are found to be zero-dimensional(0D), one-dimensional (1D), two-dimensional (2D), and three-dimensional (3D). It is seen that the dimensional crossovertakes place between any two regions with different dimen-sions. The crossover from two dimensions to three dimensionsis mainly obtained above Tc at a crossover temperature whichis different for different samples. However, the crossover tem-perature is not unique; rather the dimensional crossover takesplace over a temperature region.[5]
However, the possibility of oxygen deficiency in Y:123superconductors, either in CuO2 planes or in CuO chains,has interesting phenomena due its influences on the criticaltemperatures of these materials. It has been reported thatthe oxygen deficiency influences the FIC in most of high Tc
superconductors.[6–9] The fluctuation analyses based on Y:123samples have revealed that there is a crossover from three di-mensions to quasi two dimensions by removing the oxygenfrom CuO chains. A 3D behavior is expected close to Tc whenthe c-axis coherence length becomes greater than the interlayerspacing.[6,7] While the crossover from three dimensions to twodimensions has been obtained by the created vacancies of oxy-gen induced by irradiation in the Cu–O2 planes of Bi: 2212system.[8,9] In the above background, we report here the orderparameter dimensionality response to the oxygen deficiencycreated by both Zn and Fe doped Er: 123 superconductors.
†Corresponding author. E-mail: [email protected]; [email protected]© 2013 Chinese Physical Society and IOP Publishing Ltd http://iopscience.iop.org/cpb http://cpb.iphy.ac.cn
117401-1
Chin. Phys. B Vol. 22, No. 11 (2013) 117401
2. Experimental details
A series of the samples, ErBa2Cu3−xMx O7−δ (M = Znand Fe) with various x (0.00 ≤ x ≤ 0.18) is synthesized byusing the well-known solid state reaction method. The ingre-dients Y2O3 , BaCO3, CuO, ZnO, and Fe2O3 of 4 N purityare thoroughly mixed in required proportions and calcined at900 ◦C in air for 16 h, and then the furnace is slowly cooleddown to room temperature. This exercise is repeated threetimes with intermediate grinding at each stage. The resultingpowders are ground, palletized into pellets and sintered in at940 ◦C for 24 h. Finally, the furnace is cooled down to roomtemperature with an intervening annealing for 24 h at 600 ◦C.After that, the samples are characterized for phase purity andoxygen deficiency by X-ray diffraction (XRD) and idometrictitration, respectively. The electrical resistivity of the sampleis obtained using the standard four-probe technique in a closedcycle refrigerator (cryomech compressor package with cryo-stat Model 810-1812212, USA) within the range of 10–300 K.Nanovoltameter Keithley 2182, current source Keithley 6220,and temperature controller 9700 (0.001 K resolution) are usedduring these measurements.
3. Results and discussion
The excess conductivity ∆σ due to thermal fluctuationis defined as the deviation of the measured conductivity ofσm (T ) from the normal conductivity σn (T ), and expressedas follows:
∆σ =( 1
ρm− 1
ρn
)= σm−σn, (1)
where ρm and ρn are the measured and normal resistivity, re-spectively. Normally, ρn is obtained from the measured resis-tivity ρm at T ≥ 2Tc by applying the least square method to theAnderson and Zou relation, ρn(T ) = A+BT .[10] In order toestimate the paraconductivity, Aslamazov and Larkin (AL)[11]
deduced the following relation for the fluctuation- induced ex-cess conductivity ∆σ as
∆σ = AC−λ . (2)
Here, A = e2/(32hξc(0)) and λ = 0.5 for 3D conductivity ,and A = e2/(16hd) and λ = 1.0 for 2D conductivity, e is theelectronic charge, d is the interlayer spacing between two suc-cessive CuO2 planes, h is the reduced Plank constant, ξc (0) isthe c-axis 3D coherence length at zero temperature, and C isthe reduced temperature given by[10–12]
C=T −T mf
c
T mfc
, (3)
where T mfc is the mean field temperature, above which the in-
teractions between Cooper pairs can be neglected. The plot of
0
0.02
0.04
0.06
0.08
0.10
20 30 40
2θ/(O)
50 60
0 0.05 0.10 0.15 0.20
Doping content
OD
, O
xygen d
eficie
ncy
OD (Zn)OD (Fe)Oxy. def. (Zn)Oxy.def. (Fe)
20
Inte
nsi
tyIn
tensi
ty
30 40 50
ErBa2Cu↩xFexO7
ErBa2Cu↩xZnxO7
60
(a1)
(a2)
(b)
x/.
x/.
x/.
x/.
x/.
x/.
x/.
x/.
Fig. 1. (color online) (a) X-ray diffraction patterns forErBa2Cu3−xMxO7−δ samples, and (b) curves of orthorhom-bic distortion and oxygen deficiency versus doping content forErBa2Cu3−xMxO7−δ samples.
dρ/dT versus T is made for obtaining the value of T mfc from
the peak. However, for the polycrystalline sample, the modi-fied equations for 2D and 3D fluctuations are expressed as[13]
∆σ3D =e2
32hξp(0)ε− 1
2 , (4a)
∆σ2D =14
{e2
16hdε−1[
1+(
1+8ξ 4
c (0)d2ξ 2
ab(0)ε−1) 1
2]}
, (4b)
where ξab (0) is the coherence length at 0 K across the ab planeand ξp (0) is the effective characteristic coherence length at0 K.
On the other hand, the cross over behavior from two di-mensions to three dimensions occurs at a temperature T0 givenby[12]
T0 = T mfc exp
(2ξc(0)d
)2, (5)
117401-2

Chin. Phys. B Vol. 22, No. 11 (2013) 117401
where ξc (0) is given by[14,15]
ξc(0) =(dk1/2
2
), (6)
with k being the interlayer coupling and expressed by[16]
k = ln( T0
2T mfc
). (7)
Figure 1(a) shows the XRD patterns of pure and doped sam-ples. It is clear that the Zn samples are clearly orthorhom-bic, which is evident from crystallographic splittings of (020),(200) and (123), (213). The Fe samples with x = 0.03 and 0.05are orthorhombic, while the samples with x = 0.09 and 0.18are tetragonal. Figure 1(b) shows the orthorhombic distortion(OD) and oxygen deficiency versus doping content. Similarvalues are listed in Table 1. The values of OD vary from 0.018for pure sample to 0.017 for Zn samples, and to 0.00 for Fesamples. The values of oxygen deficiency vary from 0.074 forpure sample up to 0.090 for the Zn samples and to 0.059 forthe Fe samples.
Resistivity/mWScm-1
ErBa2Cu↩xZnxO7-δ
ErBa2Cu↩xFexO7-δ
Temperature/K
x/.
x/.
x/.
x/.
x/.
x/.x/.x/.x/.x/.
00
0.5
1.0
1.5
2.0
2.5
3.0(a)
(b)
Resistivity/mWScm-1
0
1.0
2.0
3.0
4.0
50 100 150 200 250 300
Temperature/K
50 100 150 200 250 300
Fig. 2. Curves of resistivity versus temperature for (a)ErBa2Cu3−xZnxO7−δ samples, and (b) ErBa2Cu3−xFexO7−δ sam-ples.
The curves of resistivity versus temperature for pure anddoped samples are given in Figs. 2(a) and 2(b). It is foundthat the normal resistivity is linear as temperature decreasesfrom room temperature down to a certain temperature TB. Inthis region, ρn(T ) follows the above formula, ρn(T ) = A+BTas discussed above. TB = 2T mf
c , and is defined as the tem-perature below which the Cooper-pair formation starts.[17] As
the temperature further decreases beyond the normal state re-gion, the decreasing rate of resistivity becomes entirely differ-ent as compared with that in this region. This is mainly dueto increasing Cooper pair formation with decreasing tempera-ture. Therefore, the FIC in this region follows the A–L modelto yield the dimensional exponent appropriate to fluctuation-induced conductivity in these samples.
The normal resistivity ρn(T ) is calculated in terms of Aand B parameters which are obtained from the linear fittingof the measured resistivity. The values of mean field tem-perature T mf
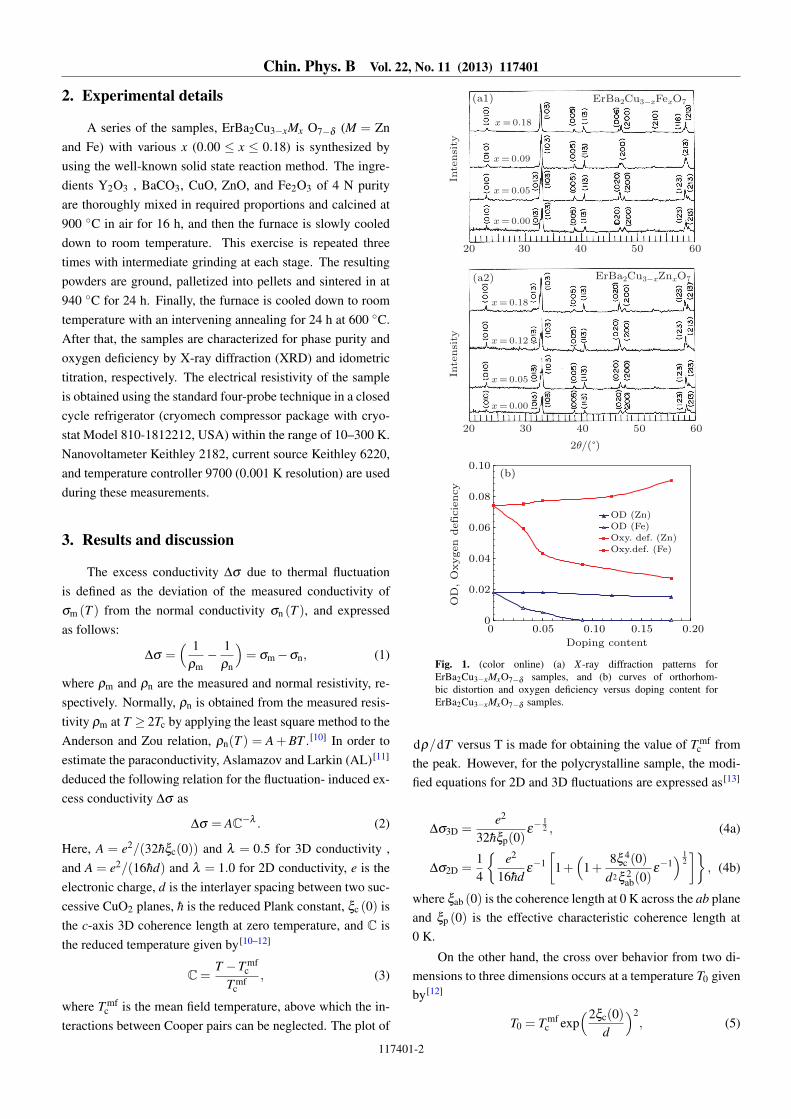
c for all samples are estimated from the plot ofpeak of dρ/dT against temperature as shown in Figs. 3(a) and3(b). After that we calculate the excess conductivity ∆σ andreduced temperature C as discussed above. We plot the curvesof ln ∆σ against lnC for all samples, see Figs. 4(a) and 4(b).It is evident from the fitting that there is distinct change in theslope of each plot. The corresponding temperature where theslope change occurs is designated to the crossover tempera-ture To. Figure 5(a) shows the variations of Tc , To, and T mf
c
against doping content. Similar values are listed in Table 1. Itis clear that both Tc and T mf
c decrease with increasing dopingcontent, and their values are generally higher for Fe samplesthan those for Zn samples. However, To decreases for Zn sam-ple and for Fe, To increases up to 0.0.09, then decreases withdoping content further increasing up to 0.18.
ErBa2Cu↩xZnxO7-δ
ErBa2Cu↩xFexO7-δ
x/.x/.x/.x/.x/.
x/.x/.x/.x/.
Temperature/K40 60 80 100 1200
0.10
0.20
0.30
(dρ/dT↽/mWSK
-1
Temperature/K
60 80 100 1200
0.10
0.20
0.30
0.40
(dρ/dT↽/mWSK
-1
(a)
(b)
Fig. 3. Curves of dρ/dT versus temperature for (a)ErBa2Cu3−xZnxO7−δ samples and (b) ErBa2Cu3−xFexO7−δ
samples.
117401-3
Chin. Phys. B Vol. 22, No. 11 (2013) 117401
ErBa2Cu↩xZnxO7-δx/.
x/.
x/.
x/.
x/.
x/.
x/.
x/.
x/.
x/.
-4 -2 0-2
0
2ln∆σ
ln∆σ
(a)
ErBa2Cu↩xFexO7-δ(b)
-4 -2 0-2
0
2
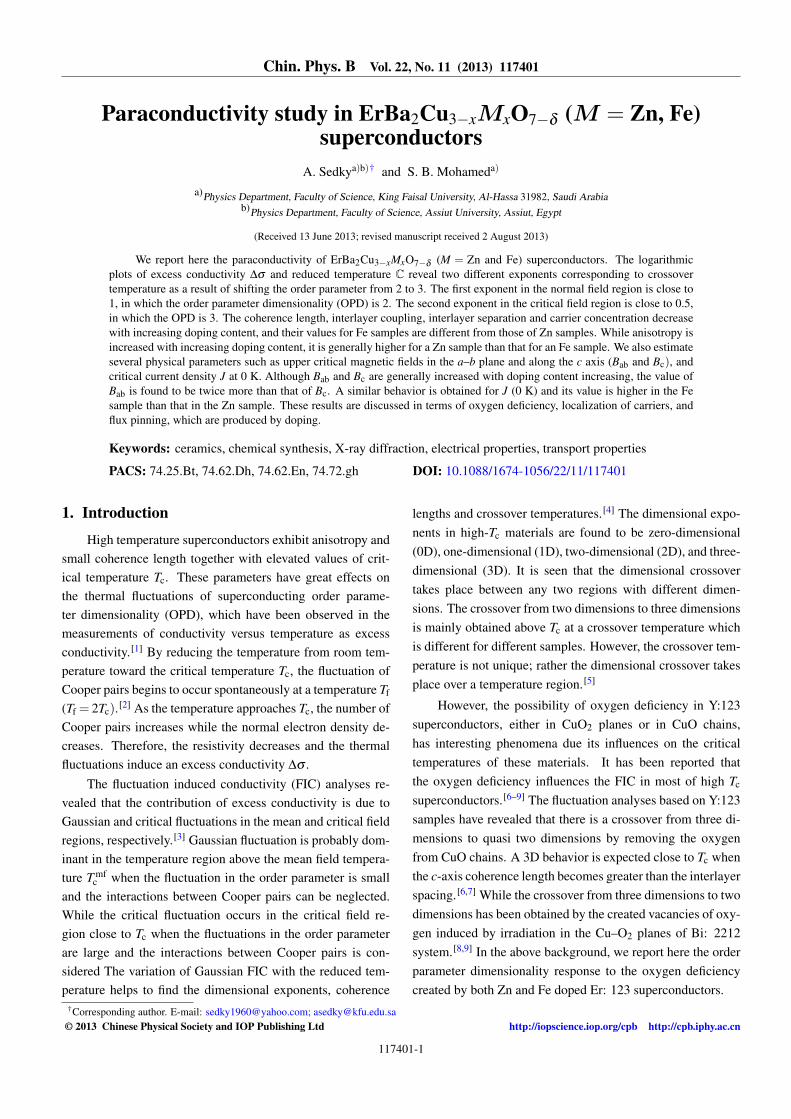
Fig. 4. Curves of ln∆σ against lnC for (a)ErBa2Cu3−xZnxO7−δ
samples and (b) ErBa2Cu3−xFexO7−δ samples.
45
55
65
75
85
95
105
115
125
0 0.05 0.10 0.15 0.20
(a)
(b)
Doping content
Tem
pera
ture
/K
Tc (Zn)Tc (Fe)Tc (Zn)mf
mfTc (Fe)To (Zn)To (Fe)
0.1
1.0
10.0
0 0.05 0.10 0.15 0.20
Doping content
Ord
er
para
mete
r
3D (Zn)3D (Fe)2D (Zn)2D (Fe)
Isot. (Zn)Isot. (Fe)
Fig. 5. (color online) Curves of (a) Tc, T mfc and To and (b)
hole carrier and interlayer coupling versus doping content forErBa2Cu3−xMxO7−δ samples.
However, two different exponents corresponding to thecrossover temperature are obtained from each plot with an ac-curacy of ±1 K. The first exponent occurs at (0.00 ≥ lnC ≥−1.2) for Zn samples, and at (−0.60 ≥ lnC ≥ −1.5) for Fesamples, and its values are higher than 1, in which the OPD is
2.[18] The second exponent occurs at (−1.2 ≥ lnC ≥ −4) forZn samples, and at (−1.5 ≥ lnC ≥ −4) for Fe samples, andits values are close to 0.5, in which the OPD is 3. Figure 5(b)shows the variations of OPD versus doping content for all sam-ples. Similar values are listed in Table 1. These results revealthat the OPD is shifted from 2 to 3 as temperature decreasestowards Tc. However, more than one region has been reportedin each of pure and doped Y:123 samples.[19,20] Normally, thecritical field region is controlled by the critical fluctuation re-sulting from the small mean free path of the charge carriersand also due to short coherence length produced as the carrierconcentration is changed.[20–23] Anyhow, the dimensional na-ture in RE:123 system is supposed to be 3D conduction. But insome recent studies based on Y:123 superconductors, the pres-ence of 2D fluctuation conduction is certified. Furthermore,an intermediate crossover region between two dimensions andthree dimensions is reported, which is consistent with the re-sults in the present work.[24–26]
On the other hand, Presland et al.[27] have found that thephase diagrams for pure and doped high Tc systems, and theyare described by the following parabolic formula:
T mc
T xc
= 1−82.6(p−0.16)2, (8)
where T xc and T m
c are the critical and maximum critical tem-perature, respectively and p is the hole carrier concentrationper Cu ion and calculated using the above parabolic relation-ship. Figure 6(a) shows the variations of k and p against dop-ing content. Similar values are listed in Tables 1 and 2. It isfound that the values of k and p decrease with doping contentincreasing up to 0.12 then increase with doping content furtherincreasing up to 0.18, and their values are slightly higher for Fesamples than those of Zn samples. Anyhow, a universal dome-shaped curve of Tc versus carrier concentration has been ob-served in Y:123 system.[28] It is has been also reported that Tc
increases with increasing carrier concentration until it passesthrough a maximum, after which it decreases and becomeszero above an optimum value of concentration.[28] Actually,the Y:123 system is essentially 3D with two CuO2 planes andone CuO chain which manifests in the higher values of k andlower degree of anisotropy γ .[29] However, the decrease in kwith doping content increasing suggests that the system maybecome more highly anisotropic, and consequently the chargecarriers are either increased or localized. However, anisotropyvalues will be presented in the next paragraph.
For polycrystalline samples, ξp(0) is given by[13]
1ξp(0)
=14
[ 1ξc(0)
+( 1
ξ 2c (0)
+8
ξ 2ab(0)
) 12]. (9)
Also, T0 is related to the crossover temperature as follows:
T0 = Tc
{1+
ξ 2p (0)d2
[1+
ξ 2p (0)
16ξ 2ab(0)
]}. (10)
117401-4
Chin. Phys. B Vol. 22, No. 11 (2013) 117401
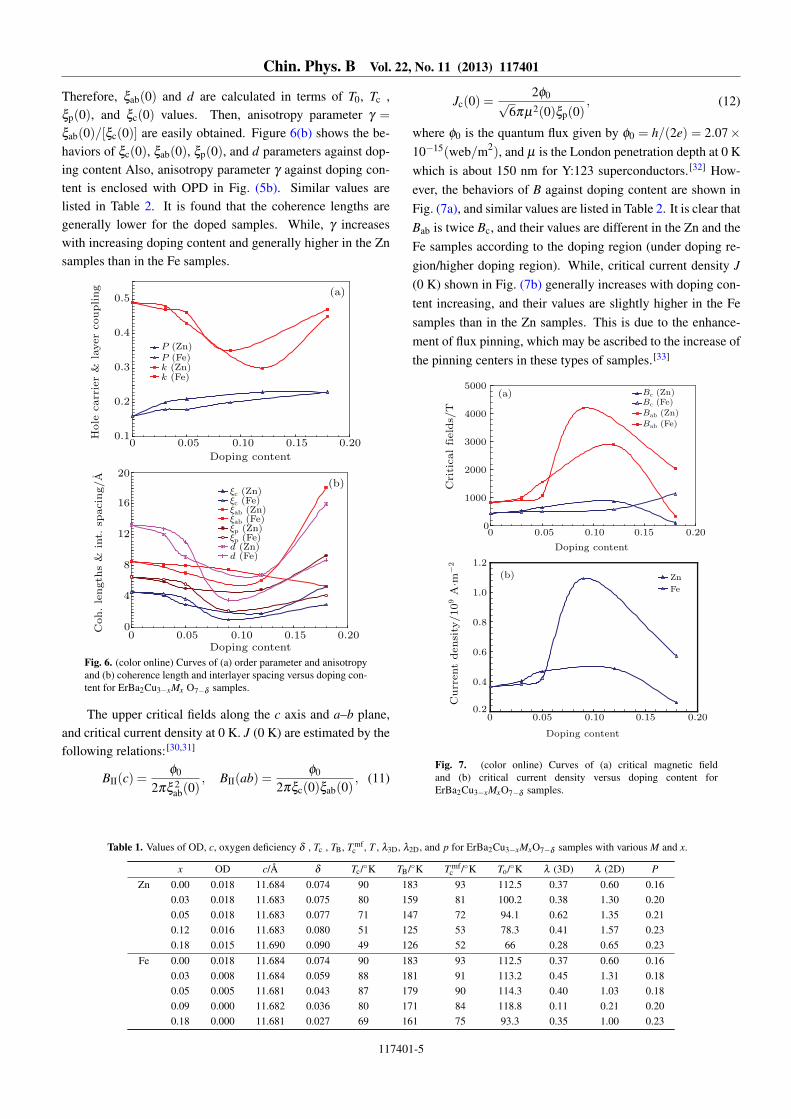
Therefore, ξab(0) and d are calculated in terms of T0, Tc ,ξp(0), and ξc(0) values. Then, anisotropy parameter γ =
ξab(0)/[ξc(0)] are easily obtained. Figure 6(b) shows the be-haviors of ξc(0), ξab(0), ξp(0), and d parameters against dop-ing content Also, anisotropy parameter γ against doping con-tent is enclosed with OPD in Fig. (5b). Similar values arelisted in Table 2. It is found that the coherence lengths aregenerally lower for the doped samples. While, γ increaseswith increasing doping content and generally higher in the Znsamples than in the Fe samples.
(a)
(b)
0.1
0.2
0.3
0.4
0.5
0 0.05 0.10 0.15 0.20
Doping content
Hole
carr
ier
& layer
coupling
P (Zn)P (Fe)k (Zn)k (Fe)
0
4
8
12
16
20
0 0.05 0.10 0.15 0.20Doping content
Coh. le
ngth
s &
int. s
pacin
g/A
ξc (Zn)ξc (Fe)ξab (Zn)ξab (Fe)ξp (Zn)ξp (Fe)d (Zn)d (Fe)
Fig. 6. (color online) Curves of (a) order parameter and anisotropyand (b) coherence length and interlayer spacing versus doping con-tent for ErBa2Cu3−xMx O7−δ samples.
The upper critical fields along the c axis and a–b plane,and critical current density at 0 K. J (0 K) are estimated by thefollowing relations:[30,31]
BII(c) =φ0
2πξ 2ab(0)
, BII(ab) =φ0
2πξc(0)ξab(0), (11)
Jc(0) =2φ0√
6πµ2(0)ξp(0), (12)
where φ0 is the quantum flux given by φ0 = h/(2e) = 2.07×10⁻¹⁵(web/m2), and µ is the London penetration depth at 0 Kwhich is about 150 nm for Y:123 superconductors.[32] How-ever, the behaviors of B against doping content are shown inFig. (7a), and similar values are listed in Table 2. It is clear thatBab is twice Bc, and their values are different in the Zn and theFe samples according to the doping region (under doping re-gion/higher doping region). While, critical current density J(0 K) shown in Fig. (7b) generally increases with doping con-tent increasing, and their values are slightly higher in the Fesamples than in the Zn samples. This is due to the enhance-ment of flux pinning, which may be ascribed to the increase ofthe pinning centers in these types of samples.[33]
(a)
(b)
0.2
0.4
0.6
0.8
1.0
1.2
0 0.05 0.10 0.15 0.20
Doping content
Curr
ent
densi
ty/10
9 ASm
-2
Zn
Fe
0
1000
2000
3000
4000
5000
0 0.05 0.10 0.15 0.20
Doping content
Critical field
s/T
Bc (Zn)Bc (Fe)
Bab (Zn)
Bab (Fe)
Fig. 7. (color online) Curves of (a) critical magnetic fieldand (b) critical current density versus doping content forErBa2Cu3−xMxO7−δ samples.
Table 1. Values of OD, c, oxygen deficiency δ , Tc , TB, T mfc , T , λ3D, λ2D, and p for ErBa2Cu3−xMxO7−δ samples with various M and x.
x OD c/A δ Tc/◦K TB/◦K T mfc /◦K To/◦K λ (3D) λ (2D) P
Zn 0.00 0.018 11.684 0.074 90 183 93 112.5 0.37 0.60 0.160.03 0.018 11.683 0.075 80 159 81 100.2 0.38 1.30 0.200.05 0.018 11.683 0.077 71 147 72 94.1 0.62 1.35 0.210.12 0.016 11.683 0.080 51 125 53 78.3 0.41 1.57 0.230.18 0.015 11.690 0.090 49 126 52 66 0.28 0.65 0.23
Fe 0.00 0.018 11.684 0.074 90 183 93 112.5 0.37 0.60 0.160.03 0.008 11.684 0.059 88 181 91 113.2 0.45 1.31 0.180.05 0.005 11.681 0.043 87 179 90 114.3 0.40 1.03 0.180.09 0.000 11.682 0.036 80 171 84 118.8 0.11 0.21 0.200.18 0.000 11.681 0.027 69 161 75 93.3 0.35 1.00 0.23
117401-5

Chin. Phys. B Vol. 22, No. 11 (2013) 117401
Table 2. Values of k, ξc(0) , ξab(0) , γ , d, ξp(0), BIIC, BIIab, and J(0) for ErBa2Cu3−xMxO7−δ samples with various values of M and x.
x k ξc(0)/A ξab(0)/A γ d/A ξp(0)/A BIIC/T BIIab/T J/A·m−2
Zn 0.00 0.49 4.64 8.57 1.85 13.28 6.56 448.8 828.9 3.65×10⁸
0.03 0.48 4.16 7.85 1.89 12.02 5.94 534.9 1009.4 4.03×10⁸
0.05 0.43 2.99 7.07 2.36 9.14 5.31 659.4 1559.3 4.68×10⁸
0.12 0.30 1.86 6.13 3.29 6.80 4.91 877.2 2890.9 4.87×10⁸
0.18 0.45 5.36 18.15 3.38 15.99 9.31 100.1 338.8 2.57×10⁸
Fe 0.00 0.49 4.64 8.57 1.85 13.28 6.56 448.8 828.9 3.65×10⁸
0.03 0.47 4.38 8.22 1.88 12.80 6.24 487.8 915.5 3.83×10⁸
0.05 0.46 3.75 8.04 2.14 11.07 5.65 510.0 1093.3 4.23×10⁸
0.09 0.35 1.05 7.48 7.12 3.55 2.19 589.1 4196.8 10.9×10⁸
0.18 0.47 2.99 5.39 1.80 8.71 4.18 1134.6 2045.3 5.72×10⁸
However, the effects of partial substitution for Cu siteswith 3d elements on the properties of Y:123 systems havebeen extensively investigated. Great attention is focused onthe Fe doping owing to the co-existence of magnetic orderingby Fe sublattice and superconductivity.[33–35] It is found thatFe atom attracts additional oxygen atoms and consequently itscoordination number is increased. A slight change of super-conducting transition temperature Tc is observed for the lowervalues of Fe content (≤ 0.05). But the further increase of Fecontent leads to the abrupt decrease of Tc, and the structurechange from orthorhombic to tetragonal phase occurs, whichis in agreement with the present data. Furthermore, the pin-ning force density is increased by 0.09 Fe addition followedby a decrease with the further increase of Fe up to 0.18, whichis consistnt with the behaviors of critical fields and critical cur-rents.
A great reduction in the OPD of the Fe samples near thecritical field region is observed, which suggests an anomalouscrossover as result of much slower supression of superconduc-tivity in the Fe samples than in the Zn samples. An indication,i.e., an OPD of 2 near Tc suggests a deterioration in the CuO2
coupling in this region. An OPD of 3 in the mean field regionand crossover behavior suggest a partial suppresion of fluc-tuation by Fe. Therefore, the chain site occupancy does notsuppress the fluctuation sufficiently fast, owing to the triva-lence of Fe. The decrease of oxygen deficiency by Fe causea decrease in c axis coherence length, thereby resulting in areduction of mean free path. Therefore, the coupling betweenCuO2 planes is not affected drastically, which is in agreementwith the value of k. Therefore, the change of OPD with Fe isdue to the changing of the superconducting volume fraction,which is in agreement with the reported data.[36,37]
The Zn samples look more 3D near the mean field re-gion in the higher and lower temperature limits. In the criticalfield region, we observed a dominant parameter with an OPDof 2. In Y:123 system, ∆σ increases by increasing oxygendeficiency δ , which should decouple the CuO2 planes and in-crease in the c-axis coherence length. Since δ is invariant byZn (≈ 0.07), we do not expect decoupling of the CuO chains oran increase in the value of ξc or c-axis length, which causes an
increase in ∆σ .[38] Hence, the behavior of Zn sample is simi-lar to that of the pure sample and the planes remain coupled sostrongly. The specific behavior of resistivity of the Zn dopedsample for x = 0.18 causes the sharp reversal of dimensional-ity with its exponent approximating to 0.27. The overall OPDbehavior, however, is similar to that of low concentration Zndoped sample.
Because of matching ionic radii and divalent oxidationstates, substitution of Zn for Cu in Er123 is unlikely to haveany significant effect on the carrier density. Cu and Zn havesimilar valence states, and the charge balance within the CuO2
plane is not affected. But Zn disorders and disturbs the hy-bridization and alignment between Cu-3d and O-2p, therebycausing carrier localization in CuO2 planar networks. TheYBCO films and magnetically aligned powders show a strongλ (0) increase with the increase of Zn doping content. In Lon-don criteria, ns(0) ∝ λ−2(0), the λ (0) increase corresponds toa large decrease in carrier density ns.[38–41] Thus, Zn causes adecrease in ns. The invariant OPD suggests its independenceof ns variation with Zn concentration. The OD is independentof Zn concentration, which indicates an intact oxygen order-ing or the linear chain structure. Since Zn does not change thelattice parameters we expect a change neither in the overlapbetween the Cu-3d and O-2p orbital’s nor in the separation be-tween the CuO2 planes. The nature of the OPD with 3 and itsinvariance with Zn concentration indicate that the two planesin the unit cell are so coupled that their contributions appear tobe due to a single plane.
4. Conclusions
A comparative study between effects of Zn and Fe dopingon paraconductivity of Er:123 superconductor is reported. Theresults show the independence of carrier concentration varia-tion in the CuO2 planes, and suggest the strong couplings be-tween them for pure and doped samples. For low Fe content,the OPD is invariant and for higher Fe content the OPD showsmarked dimensionality variation and increased oxygen con-tent dependence. However, the OPD promotes a dimensional-ity reversal at 0.18. While OPD remains almost invariant with
117401-6

Chin. Phys. B Vol. 22, No. 11 (2013) 117401
respect to Zn doping content, and seems to cause the suppres-sion of 2D fluctuations. The critical field increases with dop-ing content increasing, and then decreases with doping contentfurther increasing up to 0.18, and the values of critical fieldsare different between Zn and Fe samples. While J (0 K) gener-ally increases with doping content increasing, and the value isslightly higher in the Fe samples than in the Zn samples. Thisis attributed to the enhancement of flux pinning, which may beascribed to the increase of the pinning centers produced by Fein these samples.
References[1] Fisher D S, Fisher M PA and Huse D A 1991 Phys. Rev. B 43 130[2] Aswal D K, Singh A, Sen S, Kaur M, Viswandham C S, Goswami G L
and Gupta S K 2002 J. Phys. Chem. Solids 63 1797[3] Maki K and Thompson R S 1988 Phys. Rev. B 39 2767[4] Vidal F, Veira J A, Maja J, Ponte J J, Alvarado F G, Mordan E, Amador
J and Cascales C 1988 Physica C 156 807[5] Baraduc C, Pagnon V, Buzdin A, Henry J and Ayache C 1992 Phys.
Lett. A 166 267[6] Malik S K and Shah S S 1992 High Temperature Superconductivity
(NewYork: Nova Science)[7] Loram W, Wheatley J M, Mirza K A and Liu R S 1992 Phil. Mag. B 65
1405[8] Ghosh A K, Bandyopadhyay S K, Barat P, Pintu S and Basu A N 1995
Physica C 255 319[9] Weaver B D, Jackson E M, Summers G P and Jackson E A 1992 Phys.
Rev. B 46 1134[10] Anderson W and Zou Z 1988 Phys. Rev. Lett 60 132[11] Aslamazov L G and Larkin A I 1968 Phys. Lett. A 26 238[12] Lawrence W E, Doniach S and Proc S 1970 12th International Confer-
ence of Low Tempature Physics 1971 Keigaku, Tokyo, p. 361[13] Gosh A K, Bandyopadhyay S K and Basu A N 1999 J. Appl. Phys. 86
3247[14] Ghosh A K, Bandyopadhyay S K, Barat P, PintuS and Basu A N 1996
Physica C 264 255[15] Ramallo M V, Torron C and Vidal F 1994 Physica C 230 97[16] Baraduc C and Bazdin A 1992 Phys. Lett. A 171 408
[17] Ghosh A K, Bandyopadhyay S K, Barat P, PintuS and Basu A N 1995Physica C 255 319
[18] Reggiani L, Vaglio R and Varlamov A A 1991 Phys. Rev. B 44 9541[19] Vidal F, Veira J A, Maza J, Garcia-Alvarado F, Moran E and Alario M
A 1988 J. Phys. C 21 L9[20] Sedky A 2007 J. Low Temp. Phys. 148 53[21] Veira J A, Maza J and Vida F J 1988 Phys. Lett. A 131 310[22] Ghosh A K Bandyopadhyay S K and Basu A N 1997 Mod. Phys. Lett.
B 11 1013[23] Ghosh A K and Basu A N 2000 Supercond. Sci. Tech. 13 343[24] Bhatia S N and Dhard C P 1994 Phys. Rev. B 49 12206[25] Rojas Sarmiento M P, Uribe Laverde M A, Vera Lopez E, Landinez
Tellez D A and Roa Rojas J 2007 Physica B 398 360[26] Vovk R V, Obolenskii M A, Bondarenko A V, Goulatis I L and Chro-
neos A 2007 Acta Phys. Pol. 111 129[27] Presland M R, Tallon J L, Buckley R G, Liu R S and Floer N E 1991
Physica C 176 95[28] Matsuda A, Kinoshita K, Ishii T, Shibata H, Watanabe T and Yamada
T 1988 Phys. Rev. B 38 2910[29] Mandal P, Poddar A and Das A N 1994 J. Phys: Condens Matter 6
5689[30] Ghorbani S R and Homaei M 2011 Mod. Phys. Lett. B 25 1915[31] Nawazish A K, Najmul H, Sana N, Babar S, Sajid K and Azhar A R
2010 J. Appl. Phys. 107 083910[32] Petrovie Y, Fasano R, Lortz M, Dcrous M, Potel M and Cheriel R 2007
Physica C 460 702[33] Gupta A , Lal R, Sedky A, Narlikar A V and Awana V P S 2001 Phys.
Rev. B 61 11752[34] Wordenweber R , Heinemann K , Sastry G V S and Freyhardt H C 1989
Physica C 162 1601[35] Asaturian R A, Sarkissian A G, Ignatian E L and Begoian K G 1995
Solid State Commun. 95 389[36] Lobb C J 1987 Phys. Rev. B 36 3930[37] Loram J W, Copper J R and Mirza K A 1991 Supercond. Sci. Tech. 4
S391[38] Cooper J R, Obretelli S D, Freeman P A and Zheng D N 1991 Super-
cond. Sci. Tech. 4 S277[39] Rusiecki S, Bucher B, Kaldis E, Jilek E and Karpinski J 1990 J. Less-
Common Metals 164 31[40] Ulm E R, Kim J T, Lemberger T R, Foltyn S R and Wu X 1995 Phys.
Rev. B 51 9193[41] Porch A, Cooper J R, Zheng D N and Waldram J R 1993 Physica C
214 350
117401-7