Papageorgiou SN, Tsiranidou E, Antonoglou G, Deschner J, Jäger A. Choice of effect measure for...
15
ORIGINAL ARTICLE Choice of effect measure for meta-analyses of dichotomous outcomes influenced the identified heterogeneity and direction of small-study effects Spyridon N. Papageorgiou a,b,c, * , Elli Tsiranidou d , Georgios N. Antonoglou e , James Deschner c,f , Andreas J€ ager a,c a Department of Orthodontics, School of Dentistry, University of Bonn, Welschnonnenstr. 17, Bonn 53111, Germany b Department of Oral Technology, School of Dentistry, University of Bonn, Welschnonnenstr. 17, Bonn 53111, Germany c Clinical Research Unit 208, University of Bonn, Welschnonnenstr. 17, Bonn 53111, Germany d Medical Research Methodology, Medical School, Aristotle University of Thessaloniki, University Campus, PO 17034, Thessaloniki 54210, Greece e Department of Periodontology and Geriatric Dentistry, Institute of Dentistry, University of Oulu, Medical Campus, Aapistie 3A, PO 5281, Oulu 90014, Finland f Experimental Dento-Maxillo-Facial Medicine, University of Bonn, Welschnonnenstr. 17, Bonn 53111, Germany Accepted 6 January 2015; Published online xxxx Abstract Objectives: The aim of this study was to compare the use of odds ratio (OR), risk ratio (RR), and risk difference (RD) in meta-analyses of dichotomous outcomes and assess their influence on their results. Study Design and Setting: Initially, we included meta-analyses from a meta-epidemiologic database and reanalyzed them with OR, RR, and RD as summary metric. The primary outcomes were the effects of metric choice on the (1) statistical significance, (2) heterogeneity, and (3) Egger’s test for publication bias. Additionally, meta-analyses that originally used OR were reanalyzed using RR to assess the differences in their results. Results: In the 235 meta-analyses (147 reviews) that were included, the conclusions in terms of significance rarely changed. On the other hand, use of OR displayed the lowest I 2 values (median 42%), followed by RR (þ5.1%) and RD (þ15.0%). The Egger’s test was most often significant with RR (32%), followed by RD (29%) and OR (24%). Substitution of RR for OR led to a change of the observed effects in 3%, change of between-study heterogeneity in 6% to 24%, and change in Egger’s test results in 7% of the cases, respectively. Conclusion: The choice of metric for meta-analyses of dichotomous outcomes might influence the identified between-study heteroge- neity and the results of Egger’s test. Ó 2015 Elsevier Inc. All rights reserved. Keywords: Dentistry; Meta-analysis; Systematic reviews; Effect measure; Odds ratio; Risk ratio; Risk difference 1. Introduction 1.1. Background Systematic reviews and meta-analyses of controlled clin- ical evidence are fundamental in evidence-based decision making. One of the first steps of quantitative synthesis of data is selecting an effect measure with which to express the observed effects of each trial and pool them together. For bi- nary outcomes, the three most widely used metrics are the odds ratio (OR), the risk ratio (RR), and the risk difference (RD), with or without the number needed to treat (NNT). The selection of the most appropriate effect measure has been long debated, but no general guidelines have yet been developed. Consistency [1], interpretation ease [2,3], and favorable mathematical properties [4,5] play an important role in this choice. OR has the best mathematically proper- ties and a desirable symmetry. However, with event rates greater than 10e15%, the OR does not approximate well the RR [6]. Furthermore, it is not as intuitive compared with the other two metrics and is often misinterpreted as an RR both by readers and researchers [2,6,7]. RRs provide useful and easily understood effect estimates but lack sym- metry and differ according to the calculation of harms/ben- efits [8]. Contrary to the other two relative metrics, RD expresses the absolute difference and can be easily translated clinically with the NNT [9]. However, the indi- vidualized NNT is based on a constant RR, which is an Conflict of interest: None. * Corresponding author. Tel.: þ49-(0)228-287-22449; fax: þ49-(0) 228-287-22588. E-mail address: [email protected] (S.N. Papageorgiou). http://dx.doi.org/10.1016/j.jclinepi.2015.01.004 0895-4356/Ó 2015 Elsevier Inc. All rights reserved. Journal of Clinical Epidemiology - (2015) -
Transcript of Papageorgiou SN, Tsiranidou E, Antonoglou G, Deschner J, Jäger A. Choice of effect measure for...
Journal of Clinical Epidemiology - (2015) -
ORIGINAL ARTICLE
Choice of effect measure for meta-analyses of dichotomous outcomesinfluenced the identified heterogeneity and direction
of small-study effects
Spyridon N. Papageorgioua,b,c,*, Elli Tsiranidoud, Georgios N. Antonogloue,James Deschnerc,f, Andreas J€agera,c
aDepartment of Orthodontics, School of Dentistry, University of Bonn, Welschnonnenstr. 17, Bonn 53111, GermanybDepartment of Oral Technology, School of Dentistry, University of Bonn, Welschnonnenstr. 17, Bonn 53111, Germany
cClinical Research Unit 208, University of Bonn, Welschnonnenstr. 17, Bonn 53111, GermanydMedical Research Methodology, Medical School, Aristotle University of Thessaloniki, University Campus, PO 17034, Thessaloniki 54210, Greece
eDepartment of Periodontology and Geriatric Dentistry, Institute of Dentistry, University of Oulu, Medical Campus, Aapistie 3A, PO 5281,
Oulu 90014, FinlandfExperimental Dento-Maxillo-Facial Medicine, University of Bonn, Welschnonnenstr. 17, Bonn 53111, Germany
Accepted 6 January 2015; Published online xxxx
Abstract
Objectives: The aim of this study was to compare the use of odds ratio (OR), risk ratio (RR), and risk difference (RD) in meta-analysesof dichotomous outcomes and assess their influence on their results.
Study Design and Setting: Initially, we includedmeta-analyses from ameta-epidemiologic database and reanalyzed themwithOR,RR, andRDas summarymetric. The primary outcomeswere the effects ofmetric choice on the (1) statistical significance, (2) heterogeneity, and (3) Egger’stest for publication bias. Additionally, meta-analyses that originally used OR were reanalyzed using RR to assess the differences in their results.
Results: In the 235 meta-analyses (147 reviews) that were included, the conclusions in terms of significance rarely changed. On theother hand, use of OR displayed the lowest I2 values (median 42%), followed by RR (þ5.1%) and RD (þ15.0%). The Egger’s test wasmost often significant with RR (32%), followed by RD (29%) and OR (24%). Substitution of RR for OR led to a change of the observedeffects in 3%, change of between-study heterogeneity in 6% to 24%, and change in Egger’s test results in 7% of the cases, respectively.
Conclusion: The choice of metric for meta-analyses of dichotomous outcomes might influence the identified between-study heteroge-neity and the results of Egger’s test. � 2015 Elsevier Inc. All rights reserved.
Keywords: Dentistry; Meta-analysis; Systematic reviews; Effect measure; Odds ratio; Risk ratio; Risk difference
1. Introduction
1.1. Background
Systematic reviews and meta-analyses of controlled clin-ical evidence are fundamental in evidence-based decisionmaking. One of the first steps of quantitative synthesis of datais selecting an effect measure with which to express theobserved effects of each trial and pool them together. For bi-nary outcomes, the three most widely used metrics are theodds ratio (OR), the risk ratio (RR), and the risk difference(RD), with or without the number needed to treat (NNT).
Conflict of interest: None.
* Corresponding author. Tel.: þ49-(0)228-287-22449; fax: þ49-(0)
228-287-22588.
E-mail address: [email protected] (S.N. Papageorgiou).
http://dx.doi.org/10.1016/j.jclinepi.2015.01.004
0895-4356/� 2015 Elsevier Inc. All rights reserved.
The selection of the most appropriate effect measure hasbeen long debated, but no general guidelines have yet beendeveloped. Consistency [1], interpretation ease [2,3], andfavorable mathematical properties [4,5] play an importantrole in this choice. OR has the best mathematically proper-ties and a desirable symmetry. However, with event ratesgreater than 10e15%, the OR does not approximate wellthe RR [6]. Furthermore, it is not as intuitive comparedwith the other two metrics and is often misinterpreted asan RR both by readers and researchers [2,6,7]. RRs provideuseful and easily understood effect estimates but lack sym-metry and differ according to the calculation of harms/ben-efits [8]. Contrary to the other two relative metrics, RDexpresses the absolute difference and can be easilytranslated clinically with the NNT [9]. However, the indi-vidualized NNT is based on a constant RR, which is an
of Clinical Epidemiology - (2015) -
What is new?
Key findings� Choice of effect measure for meta-analyses of
dichotomous outcomes does not seem to influencethe statistical significance of the results.
� Between-study heterogeneity and the results ofEgger’s test might be influenced by the choice ofeffect measure.
� Changing the effect measure from odds ratio torisk ratio in meta-analyses of dichotomous out-comes might alter their results.
What this adds to what was known?� The influence of effect measure in the results of
meta-analyses of dichotomous outcomes mightnot be negligible.
What is the implication and what should changenow?� Caution is needed in the choice of effect measure
for meta-analyses of dichotomous outcomes, asthis might have an impact on their results.
assumption [10] and might lead to the underestimation ofbenefits among low-risk patients [11].
A number of concerns have been pointed out against theuse of ORs [3,12], cautioning in particular that ORs shouldonly be used in caseecontrol studies and regression ana-lyses [3]. However, selection of an ideal meta-analysismetric should be supported by empirical evidence [13,14]and not be solely based on theoretical grounds.
1.2. Aim
The aim of this study was to compare OR, RR, and RDas summary effect estimates in meta-analyses of dichoto-mous outcomes with regard to the meta-analyses results.Secondarily, OR is widely used in meta-analyses, butcaution has been advocated regarding its use. Therefore,we planned to substitute RR for OR in meta-analyses thatoriginally used the latter metric to assess how this metricchange affects the results on the basis of significance andidentified heterogeneity.
2 S.N. Papageorgiou et al. / Journal
2. Methods
2.1. Protocol
This study’s protocol was constructed a priori, based onthe guidelines of the PRISMA statement [15], the CochraneHandbook for Systematic Reviews of Interventions [16],
and previous studies [17], and it was circulated andaccepted by all authors.
2.2. Inclusion criteria
Eligible for this study were meta-analyses in any field ofdentistry or oral medicine with binary outcomes. A mini-mum of five included studies per meta-analysis was arbi-trarily adopted, as meta-analysis methods, includingestimations of pooled effects, identified heterogeneity, andreporting bias, have been shown to perform poorly withfew studies [16,18e20]. Additionally, the original meta-analysis should report raw data for the included studies.Excluded were all other study types and meta-analyses thatdid not meet the eligibility criteria. From systematic reviewarticles with more than one meta-analysis, the meta-analysis with the most studies was included, or if theyhad the same number, the one with the higher heterogeneityestimate.
2.3. Search and selection procedures
The search and selection procedures have beendescribed previously [21]. In short, we searched seven gen-eral, open-access, regional, or gray literature databases upto December 2012 without language, publication year, orpublication status restrictions. After study selection, datawere extracted into predefined and piloted worksheets.
2.4. Analysis
As a first step, each meta-analysis was reanalyzed threetimes with OR, RR, and RD as metrics in RevMan version5.2 (Copenhagen: The Nordic Cochrane Center, The Co-chrane Collaboration).
There are many methods to calculate and pool effectmeasures in RevMan. For the fixed-effect model, the inversevariance method is a straightforward method that can beused generally in most situations by weighing studies ac-cording to their precision. The ManteleHaenszel method[22,23] is a good method for reviews with few events orsmall studies (default method in RevMan). For ORs, thereis also the Peto method [24], which is a good method forstudies with few events, small effects (OR close to 1), andsimilar numbers in the experimental and control group.For the random-effects model, there are two options (Man-teleHaenszel and inverse variance). As this study aimed tocompare only the choice of metric, pooling was carried outwith the ManteleHaenszel method for both fixed-effect andrandom-effects models for consistency reasons.
The DerSimonian and Laird heterogeneity estimator waschosen, although it might be inferior to other estimators[19], as it is used most often and is included in RevMan.The extent of between-study heterogeneity was assessedwith the Q heterogeneity statistic (hereon plainly Q)and the associated chi-square test [25,26]. RevMan usesa hybrid method for ManteleHaenszel random-effects
3S.N. Papageorgiou et al. / Journal of Clinical Epidemiology - (2015) -
meta-analysis, which affects both the overall esti-mated and the identified heterogeneity. The weights areassigned according to the inverse variance method. How-ever, as the ManteleHaenszel method disregards theamount of identified heterogeneity, the estimation of Q isdone by comparing each study’s result with a ManteleHaenszel fixed-effect meta-analysis result. The test for Qis not given much attention nowadays due to its low power[27], but we still report it, as it is still included in the stan-dard output of RevMan. The impact of true between-studyheterogeneity was assessed by calculating the I2 statistic[28,29]. I2 values were naively interpreted as low (0% to25%), moderate (26% to 50%), high (51% to 75%), andextreme (76% to 100%). The magnitude and direction of ef-fects and the strength of evidence for heterogeneity were nottaken into consideration. Heterogeneity was also assessedwith the H2 statistic, as a summary of its impact [28]. Fun-nel plot asymmetry as a measure of small-study effects wasassessed with Egger’s linear regression test [30], when 10 ormore studies were included in the meta-analysis [31].
ORs are used in the vast majority of meta-analyses inoral medicine [19], because of their mathematical proper-ties. However, it has been suggested that the use of RRsmight be preferable to ORs for meta-analysis, because ofits simpler interpretation. Therefore, as a second step, weaimed to assess whether substitution of OR with RR wouldalso influence the meta-analyses’ results, apart from theirinterpretation. For all meta-analyses that originally usedOR as a metric, RR was used with the same model as inthe original, and the differences in significance, between-study heterogeneity, and Egger’s test were assessed.
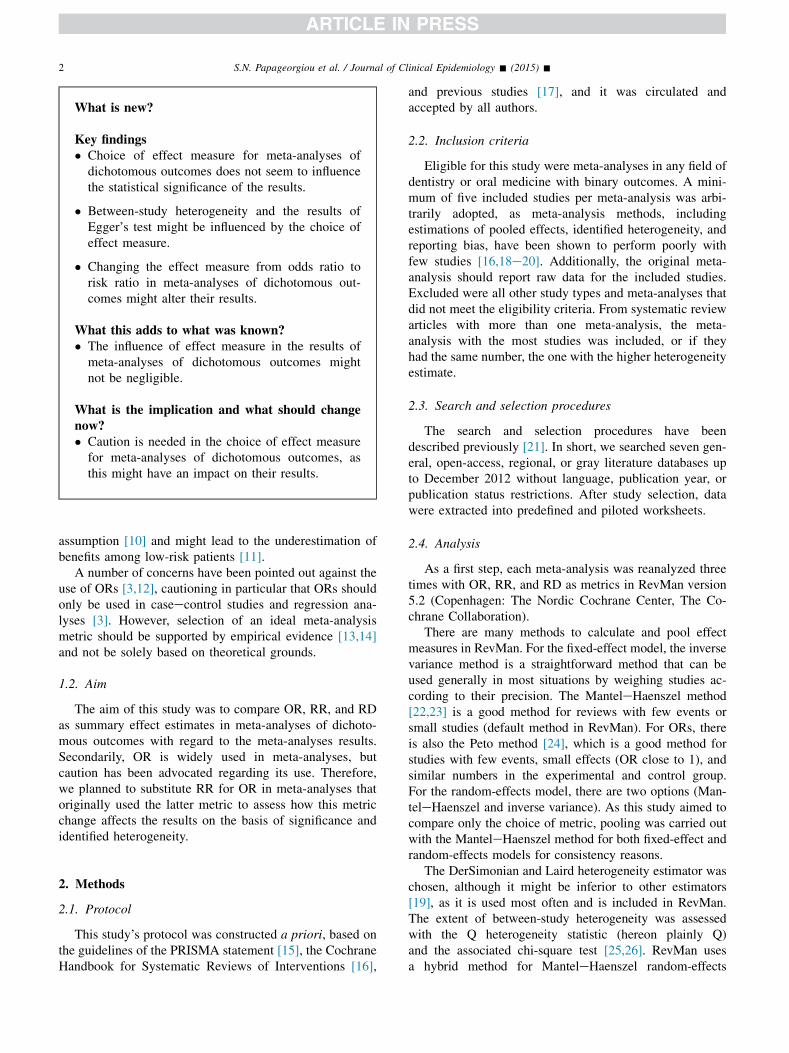
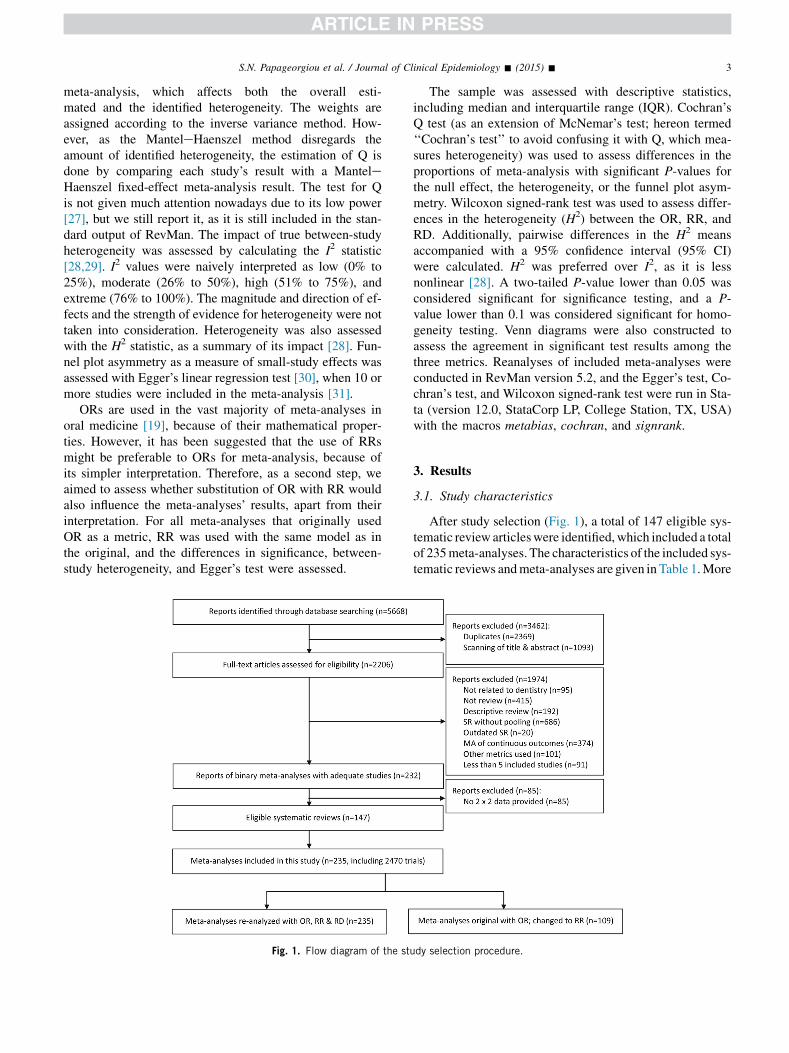
Fig. 1. Flow diagram of the stu
The sample was assessed with descriptive statistics,including median and interquartile range (IQR). Cochran’sQ test (as an extension of McNemar’s test; hereon termed‘‘Cochran’s test’’ to avoid confusing it with Q, which mea-sures heterogeneity) was used to assess differences in theproportions of meta-analysis with significant P-values forthe null effect, the heterogeneity, or the funnel plot asym-metry. Wilcoxon signed-rank test was used to assess differ-ences in the heterogeneity (H2) between the OR, RR, andRD. Additionally, pairwise differences in the H2 meansaccompanied with a 95% confidence interval (95% CI)were calculated. H2 was preferred over I2, as it is lessnonlinear [28]. A two-tailed P-value lower than 0.05 wasconsidered significant for significance testing, and a P-value lower than 0.1 was considered significant for homo-geneity testing. Venn diagrams were also constructed toassess the agreement in significant test results among thethree metrics. Reanalyses of included meta-analyses wereconducted in RevMan version 5.2, and the Egger’s test, Co-chran’s test, and Wilcoxon signed-rank test were run in Sta-ta (version 12.0, StataCorp LP, College Station, TX, USA)with the macros metabias, cochran, and signrank.
3. Results
3.1. Study characteristics
After study selection (Fig. 1), a total of 147 eligible sys-tematic review articleswere identified,which included a totalof 235meta-analyses. The characteristics of the included sys-tematic reviews andmeta-analyses are given in Table 1.More
dy selection procedure.

Table 1. Characteristics of included reviews and meta-analyses
Characteristics n (%)
Number of reviews 147 (100)Indexed (hierarchical)
PubMed 129 (88)EMBASE 7 (5)Not indexed 11 (8)
SubjectOral and maxillofacial surgery/medicine 85 (58)General dentistry 61 (42)Periodontics 36 (25)Orthodontics and dentofacialorthopedics
18 (12)
Pedodontics 18 (12)Endodontics 11 (8)Prosthodontics 6 (4)
Number of meta-analyses 235 (100)Model used in synthesis
Fixed-effect 107 (46)Random-effects 128 (55)
Metric used in synthesisOdds ratio 109 (46)Risk ratio 108 (46)Risk difference 2 (1)Hazard ratio 16 (7)
Number of included studiesMedian 8Interquartile range 5Range 5 to 52
Language of included studiesEnglish 167 (71)Non-English 8 (3)Both English and non-English 60 (26)
Design of included studiesRandomized 142 (60)Nonrandomized 71 (30)Both randomized and nonrandomized 22 (9)
4 S.N. Papageorgiou et al. / Journal of Clinical Epidemiology - (2015) -
than half of the included meta-analyses (55%) used arandom-effects model for the pooling of studies, whereasthe OR and the RR were used equally often (both on 46%of the meta-analyses). The median number of studiesincluded in the meta-analysis was eight and 60% of themeta-analyses included only randomized trials.
3.2. Comparison of significance testing among OR, RR,and RD
The statistical significance of the meta-analyses’ resultswas not significantly influenced by the use of OR, RR, orRD (Table 2 and Appendix A at www.jclinepi.com). As ex-pected, many more statistical significant results (at the 5%
Table 2. Distribution of significant effects from the 235 included meta-ana
Effect’s significance
Fixed-effect model
OR, n (%) RR, n (%) RD, n (%) P
P � 0.05 76 (32) 76 (32) 76 (32) 1P ! 0.05 159 (68) 159 (68) 159 (68)
Abbreviations: OR, odds ratio; RR, risk ratio; RD, risk difference.a From Cochran’s test.
level) were found with the use of a fixed-effect modelcompared with the use of a random-effects model. Aslightly greater variation was observed with use of arandom-effects model compared with the use of a fixed-effect model but was still only minor.
3.3. Comparison of heterogeneity estimates among OR,RR, and RD
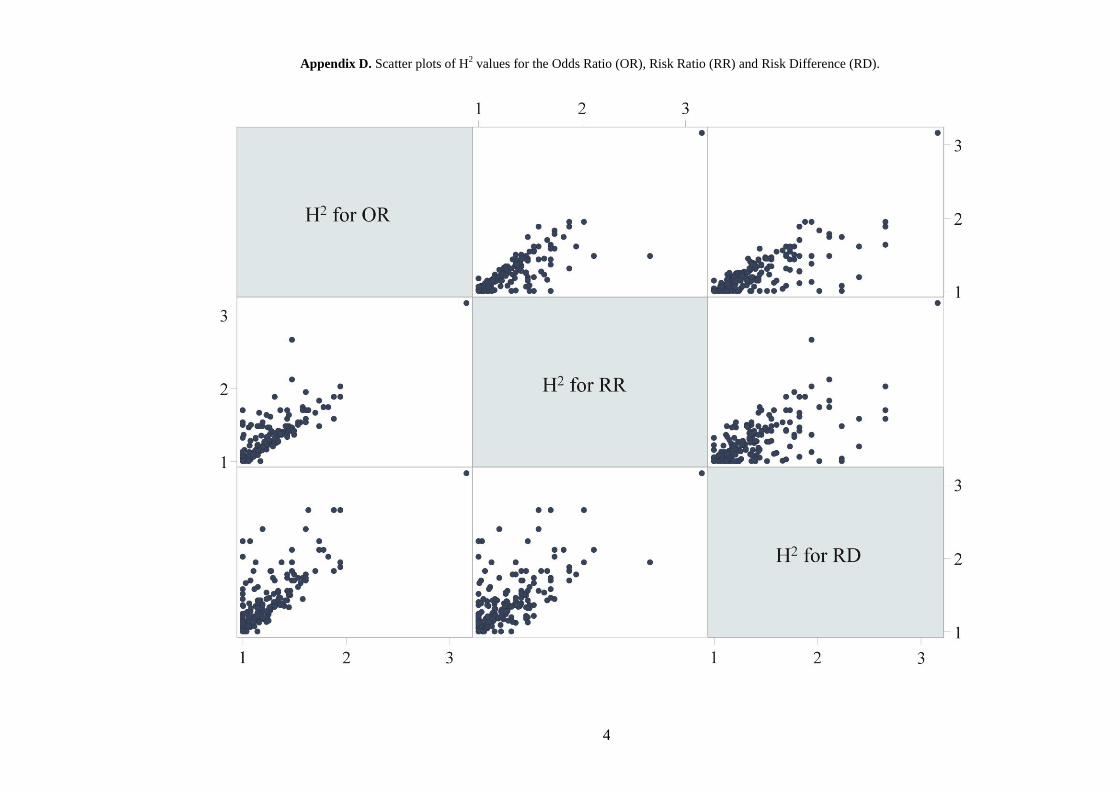
Heterogeneity estimateswere considerably affected by thechoice of metric (Table 3 and Appendix B at www.jclinepi.com). Statistically significant heterogeneity (P ! 0.1) wasless often identified with the use of OR compared with RRor RD. The same was observed from the medians, IQRs,and 95%CIs of I2 andH2 for the threemetrics. Finally, consis-tently less meta-analyses were categorized as having ‘‘high’’or ‘‘extreme’’ I2 values with the use of OR compared with RRor RD. Direct comparison of theH2 values between the threemetrics indicated that use of the RD resulted in significantlyhigher heterogeneity compared with both OR and RR, by2.55 and 1.85, respectively (Table 4 and Appendices C andD at www.jclinepi.com). Use of OR was associated with aslight underestimation of heterogeneity by 0.70 (95% CI:0.26, 1.14) compared with RR.
3.4. Comparison of Egger test’s results among OR, RRand RD
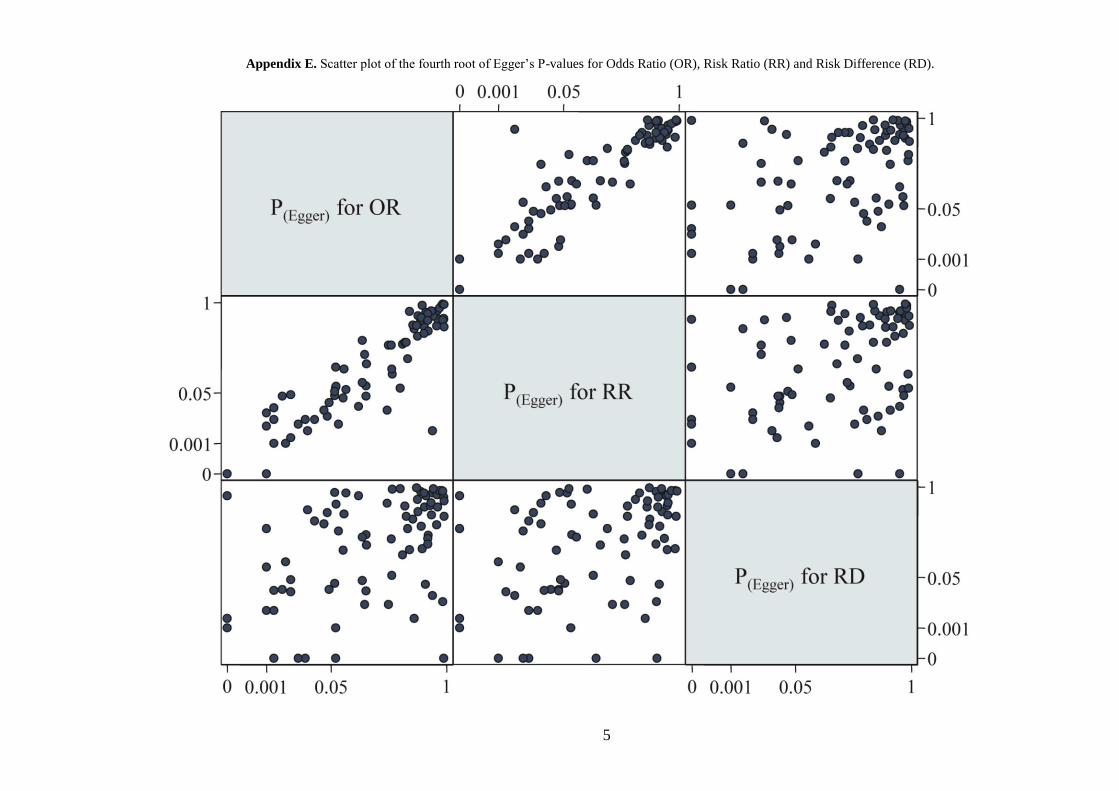
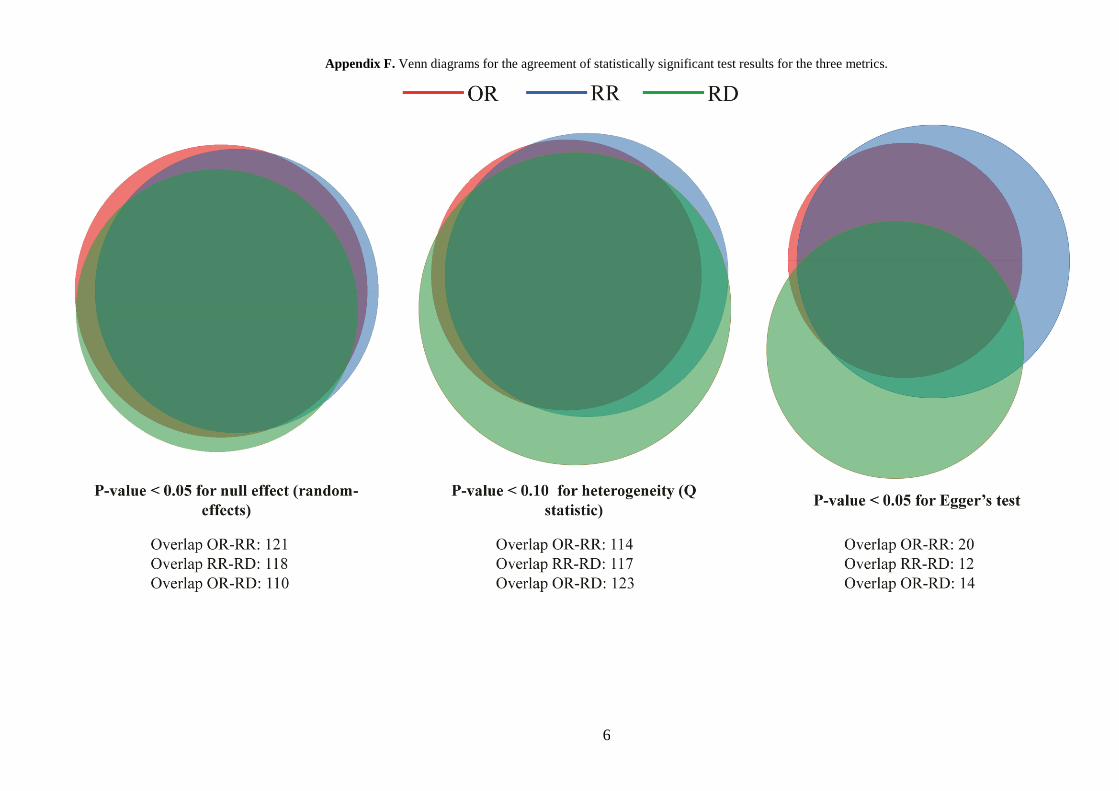
A total of 84meta-analyses included10ormore studies andwere assessed with Egger’s test (Table 5 and Appendix Eat www.jclinepi.com). Significant P-values (!0.05) forthe test were slightly affected by choice of metric, with RRbeing more frequently significant (32%), followed by RD(29%) andOR (24%).Venn diagrams for the agreement of sta-tistically significant test results among the three metrics aregiven in Appendix F.
3.5. Impact of substitution of OR with RR
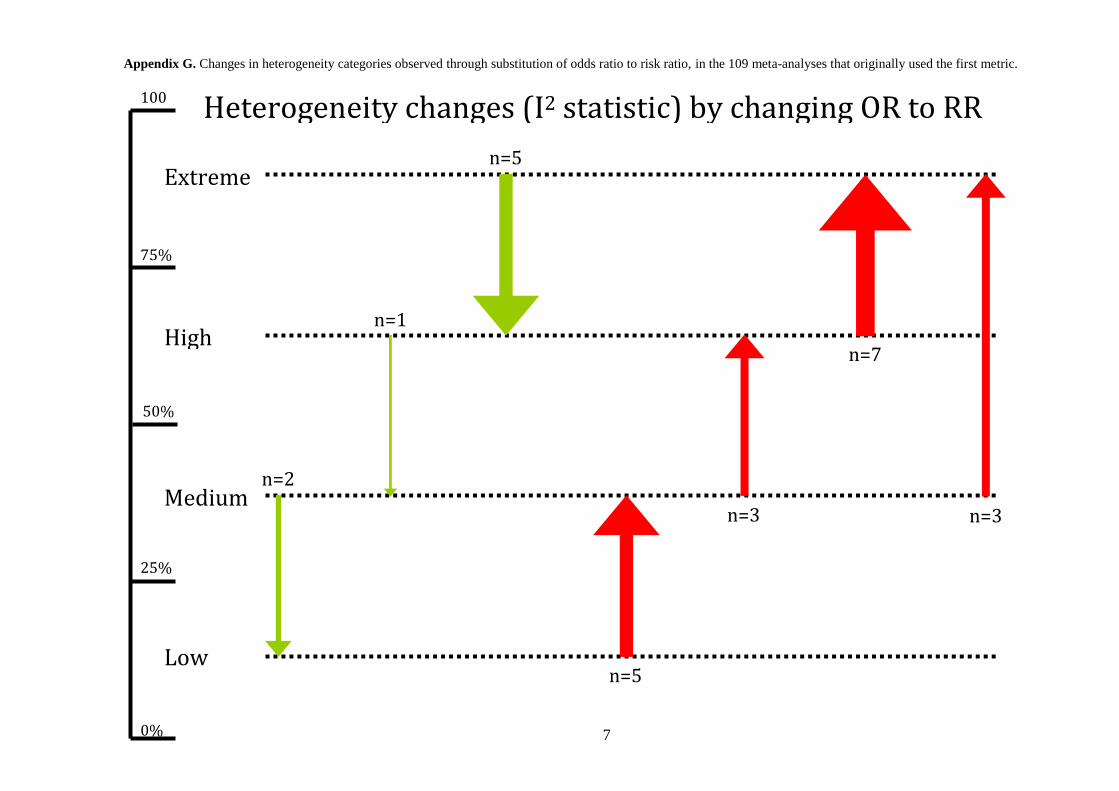
The substitution of OR with RR in the 109 meta-ana-lyses that originally used OR as a metric is shown inTable 6. The significance of the observed effect changedin 3% of the cases. The significance of heterogeneity testschanged in 6% of the cases, whereas the heterogeneity cate-gorization changed in 24% of the cases. In 17% of thecases, the substitution resulted in greater I2 with RR, andin 7% of the cases, the substitution resulted in lower I2 withRR. The substitution of OR with RR resulted in greatervariation (38e40% of the cases), with only 22% of the
lysis according to the model and the effect measure used
Random-effects model
-valuea OR, n (%) RR, n (%) RD, n (%) P-valuea
.000 102 (43) 110 (47) 111 (47) 0.110133 (57) 125 (53) 124 (53)
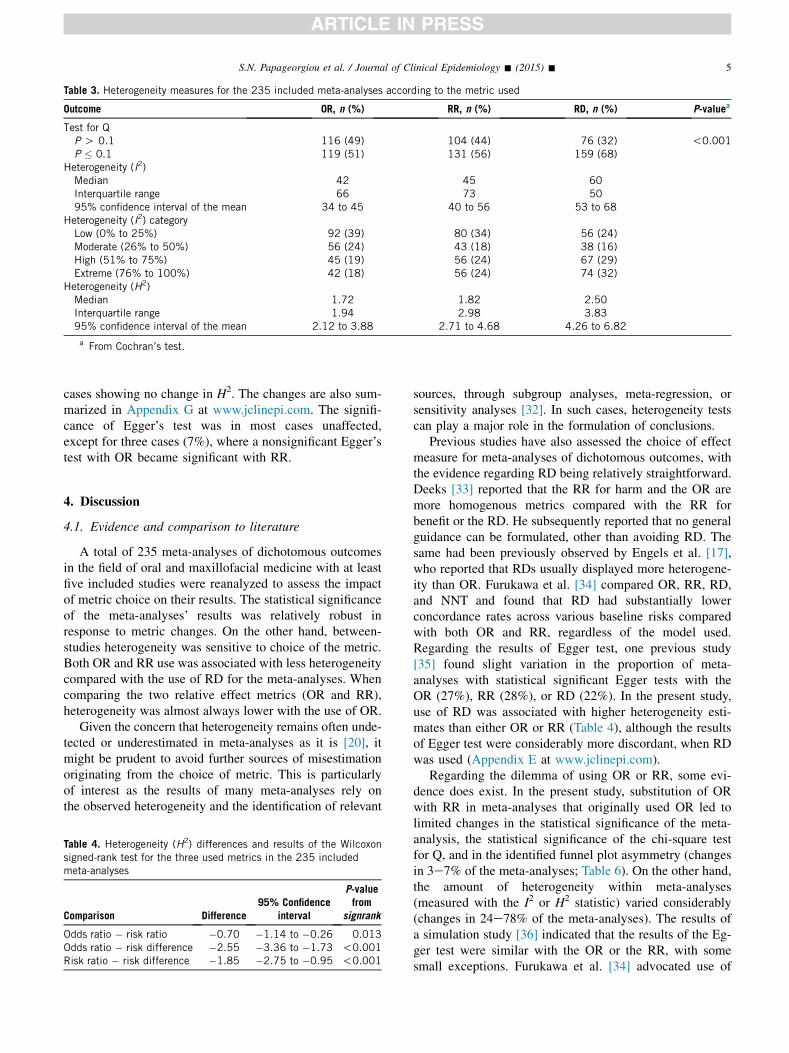
Table 3. Heterogeneity measures for the 235 included meta-analyses according to the metric used
Outcome OR, n (%) RR, n (%) RD, n (%) P-valuea
Test for QP O 0.1 116 (49) 104 (44) 76 (32) !0.001P � 0.1 119 (51) 131 (56) 159 (68)
Heterogeneity (I2)Median 42 45 60Interquartile range 66 73 5095% confidence interval of the mean 34 to 45 40 to 56 53 to 68
Heterogeneity (I2) categoryLow (0% to 25%) 92 (39) 80 (34) 56 (24)Moderate (26% to 50%) 56 (24) 43 (18) 38 (16)High (51% to 75%) 45 (19) 56 (24) 67 (29)Extreme (76% to 100%) 42 (18) 56 (24) 74 (32)
Heterogeneity (H2)Median 1.72 1.82 2.50Interquartile range 1.94 2.98 3.8395% confidence interval of the mean 2.12 to 3.88 2.71 to 4.68 4.26 to 6.82
a From Cochran’s test.
5S.N. Papageorgiou et al. / Journal of Clinical Epidemiology - (2015) -
cases showing no change in H2. The changes are also sum-marized in Appendix G at www.jclinepi.com. The signifi-cance of Egger’s test was in most cases unaffected,except for three cases (7%), where a nonsignificant Egger’stest with OR became significant with RR.
4. Discussion
4.1. Evidence and comparison to literature
A total of 235 meta-analyses of dichotomous outcomesin the field of oral and maxillofacial medicine with at leastfive included studies were reanalyzed to assess the impactof metric choice on their results. The statistical significanceof the meta-analyses’ results was relatively robust inresponse to metric changes. On the other hand, between-studies heterogeneity was sensitive to choice of the metric.Both OR and RR use was associated with less heterogeneitycompared with the use of RD for the meta-analyses. Whencomparing the two relative effect metrics (OR and RR),heterogeneity was almost always lower with the use of OR.
Given the concern that heterogeneity remains often unde-tected or underestimated in meta-analyses as it is [20], itmight be prudent to avoid further sources of misestimationoriginating from the choice of metric. This is particularlyof interest as the results of many meta-analyses rely onthe observed heterogeneity and the identification of relevant
Table 4. Heterogeneity (H2) differences and results of the Wilcoxonsigned-rank test for the three used metrics in the 235 includedmeta-analyses
Comparison Difference95% Confidence
interval
P-valuefrom
signrank
Odds ratio � risk ratio �0.70 �1.14 to �0.26 0.013Odds ratio � risk difference �2.55 �3.36 to �1.73 !0.001Risk ratio � risk difference �1.85 �2.75 to �0.95 !0.001
sources, through subgroup analyses, meta-regression, orsensitivity analyses [32]. In such cases, heterogeneity testscan play a major role in the formulation of conclusions.
Previous studies have also assessed the choice of effectmeasure for meta-analyses of dichotomous outcomes, withthe evidence regarding RD being relatively straightforward.Deeks [33] reported that the RR for harm and the OR aremore homogenous metrics compared with the RR forbenefit or the RD. He subsequently reported that no generalguidance can be formulated, other than avoiding RD. Thesame had been previously observed by Engels et al. [17],who reported that RDs usually displayed more heterogene-ity than OR. Furukawa et al. [34] compared OR, RR, RD,and NNT and found that RD had substantially lowerconcordance rates across various baseline risks comparedwith both OR and RR, regardless of the model used.Regarding the results of Egger test, one previous study[35] found slight variation in the proportion of meta-analyses with statistical significant Egger tests with theOR (27%), RR (28%), or RD (22%). In the present study,use of RD was associated with higher heterogeneity esti-mates than either OR or RR (Table 4), although the resultsof Egger test were considerably more discordant, when RDwas used (Appendix E at www.jclinepi.com).
Regarding the dilemma of using OR or RR, some evi-dence does exist. In the present study, substitution of ORwith RR in meta-analyses that originally used OR led tolimited changes in the statistical significance of the meta-analysis, the statistical significance of the chi-square testfor Q, and in the identified funnel plot asymmetry (changesin 3e7% of the meta-analyses; Table 6). On the other hand,the amount of heterogeneity within meta-analyses(measured with the I2 or H2 statistic) varied considerably(changes in 24e78% of the meta-analyses). The results ofa simulation study [36] indicated that the results of the Eg-ger test were similar with the OR or the RR, with somesmall exceptions. Furukawa et al. [34] advocated use of
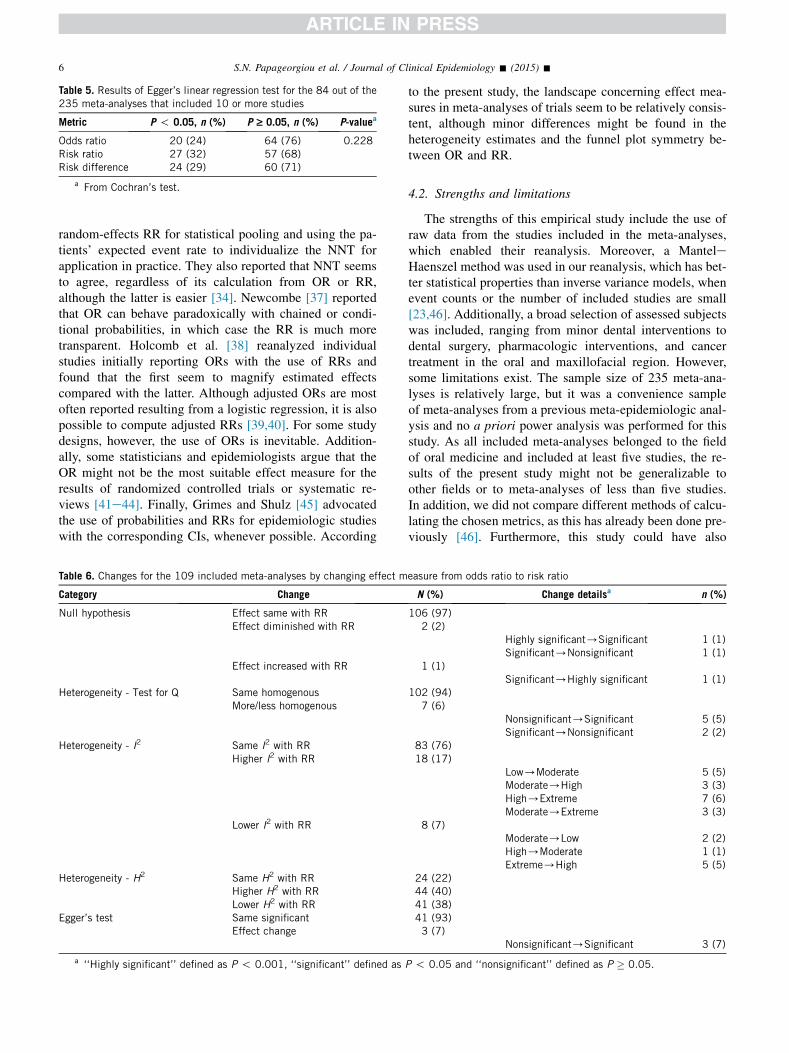
Table 5. Results of Egger’s linear regression test for the 84 out of the235 meta-analyses that included 10 or more studies
Metric P ! 0.05, n (%) P ‡ 0.05, n (%) P-valuea
Odds ratio 20 (24) 64 (76) 0.228Risk ratio 27 (32) 57 (68)Risk difference 24 (29) 60 (71)
a From Cochran’s test.
6 S.N. Papageorgiou et al. / Journal of Clinical Epidemiology - (2015) -
random-effects RR for statistical pooling and using the pa-tients’ expected event rate to individualize the NNT forapplication in practice. They also reported that NNT seemsto agree, regardless of its calculation from OR or RR,although the latter is easier [34]. Newcombe [37] reportedthat OR can behave paradoxically with chained or condi-tional probabilities, in which case the RR is much moretransparent. Holcomb et al. [38] reanalyzed individualstudies initially reporting ORs with the use of RRs andfound that the first seem to magnify estimated effectscompared with the latter. Although adjusted ORs are mostoften reported resulting from a logistic regression, it is alsopossible to compute adjusted RRs [39,40]. For some studydesigns, however, the use of ORs is inevitable. Addition-ally, some statisticians and epidemiologists argue that theOR might not be the most suitable effect measure for theresults of randomized controlled trials or systematic re-views [41e44]. Finally, Grimes and Shulz [45] advocatedthe use of probabilities and RRs for epidemiologic studieswith the corresponding CIs, whenever possible. According
Table 6. Changes for the 109 included meta-analyses by changing effect m
Category Change
Null hypothesis Effect same with RREffect diminished with RR
Effect increased with RR
Heterogeneity - Test for Q Same homogenousMore/less homogenous
Heterogeneity - I2 Same I2 with RRHigher I2 with RR
Lower I2 with RR
Heterogeneity - H2 Same H2 with RRHigher H2 with RRLower H2 with RR
Egger’s test Same significantEffect change
a ‘‘Highly significant’’ defined as P ! 0.001, ‘‘significant’’ defined as
to the present study, the landscape concerning effect mea-sures in meta-analyses of trials seem to be relatively consis-tent, although minor differences might be found in theheterogeneity estimates and the funnel plot symmetry be-tween OR and RR.
4.2. Strengths and limitations
The strengths of this empirical study include the use ofraw data from the studies included in the meta-analyses,which enabled their reanalysis. Moreover, a ManteleHaenszel method was used in our reanalysis, which has bet-ter statistical properties than inverse variance models, whenevent counts or the number of included studies are small[23,46]. Additionally, a broad selection of assessed subjectswas included, ranging from minor dental interventions todental surgery, pharmacologic interventions, and cancertreatment in the oral and maxillofacial region. However,some limitations exist. The sample size of 235 meta-ana-lyses is relatively large, but it was a convenience sampleof meta-analyses from a previous meta-epidemiologic anal-ysis and no a priori power analysis was performed for thisstudy. As all included meta-analyses belonged to the fieldof oral medicine and included at least five studies, the re-sults of the present study might not be generalizable toother fields or to meta-analyses of less than five studies.In addition, we did not compare different methods of calcu-lating the chosen metrics, as this has already been done pre-viously [46]. Furthermore, this study could have also
easure from odds ratio to risk ratio
N (%) Change detailsa n (%)
106 (97)2 (2)
Highly significant/Significant 1 (1)Significant/Nonsignificant 1 (1)
1 (1)Significant/Highly significant 1 (1)
102 (94)7 (6)
Nonsignificant/Significant 5 (5)Significant/Nonsignificant 2 (2)
83 (76)18 (17)
Low/Moderate 5 (5)Moderate/High 3 (3)High/Extreme 7 (6)Moderate/Extreme 3 (3)
8 (7)Moderate/Low 2 (2)High/Moderate 1 (1)Extreme/High 5 (5)
24 (22)44 (40)41 (38)41 (93)3 (7)
Nonsignificant/Significant 3 (7)
P ! 0.05 and ‘‘nonsignificant’’ defined as P � 0.05.
7S.N. Papageorgiou et al. / Journal of Clinical Epidemiology - (2015) -
included assessment of the effect magnitude for eachmetric, differentiate RR for harms/benefits, or assess thecontrol group risks among pooled studies. Finally, thereexist other approaches to identify and/or adjust for small-study effects [47e53], which have been shown to outper-form Egger’s test [47,48,51]. However, they are either notapplicable for all metrics (as the modified Harbord test[47]) or are not adequately assessed to form robust recom-mendations [31].
4.3. Conclusions and implications for future research
According to the results of this empirical study, the statis-tical significance of the meta-analyses’ results was relativelyrobust to the choice of metric independent of the model used.Identified heterogeneity with Q varied slightly with OR dis-playing the lowest heterogeneity, followed by RR and RD.Similarly, the heterogeneity (assessed with the H2 statistic)varied moderately, with OR displaying the lowest heteroge-neity, followed by RR (net increase 0.70) and RD (net in-crease 2.55). The statistical significance of the Egger testvaried slightly among OR, RR, and RD. Finally, substitutionof OR with RR in meta-analyses that initially used the firstchanged the statistical significance of the results in 6% ofthe cases, the identified heterogeneity in 7e40% of the cases,and the results of Egger’s test in 7% of the cases.
To conclude, it seems that the metric choice can slightlyinfluence the heterogeneity and small-study effects withinthe meta-analysis. As the reception of RR is more intuitivethan OR, it might be a good idea to prefer the use of RRinstead of OR as a metric, to avoid both the risk of mises-timation of heterogeneity and small-study effects andpossible misinterpretations of the meta-analysis results.
Acknowledgments
The authors thank I. Konstantinidis (Icahn School ofMedicine at Mount Sinai, New York, NY) for useful com-ments on the article.
Supplementary data
Supplementary data related to this article can be found athttp://dx.doi.org/10.1016/j.jclinepi.2015.01.004.
References
[1] Breslow NE, Day NE, editors. Statistical methods in cancer
research, volume I. The analysis of caseecontrol studies. Lyon:
International Agency for Research on Cancer; 1980.
[2] Sackett DL, Deeks JJ, Altman D. Down with odds ratios!. Evid
Based Med 1996;1:164e7.
[3] Deeks J. When can odds ratios mislead? Odds ratios should be used
only in case-control studies and logistic regression analyses. BMJ
1998;317:1155e6.
[4] Olkin I. Odds ratios revisited. Evid Based Med 1998;3:71.
[5] Senn S. Odds ratios revisited. Evid Based Med 1998;3:71.
[6] Altman DG, Deeks JJ, Sackett DL. Odds ratios should be avoided
when events are common. BMJ 1998;317:1318.
[7] Hayes RJ. Odds ratios and relative risks. Lancet 1988;2:338.
[8] Cummings P. Studies should report estimates of treatment effects
with confidence intervals. Arch Pediatr Adolesc Med 2007;161:
518e9.
[9] Cook RJ, Sackett DL. The number needed to treat: a clinically use-
ful measure of treatment effect. BMJ 1995;310:452e4.
[10] Sackett DL, Richardson WS, Rosenberg WM, Haynes RB. Evi-
dence-based medicine: how to practice and teach EBM. New York:
Churchill Livingstone; 1997.
[11] Mulrow CD, Cornell JA, Herrera CR, Kadri A, Farnett L, Aguilar C.
Hypertension in the elderly. Implications and generalizability of
randomized trials. JAMA 1994;272:1932e8.[12] Davies HT, Crombie IK, Tavakoli M. When can odds ratios
mislead? BMJ 1998;316:989e91.
[13] Walter SD. Choice of effect measure for epidemiological data.
J Clin Epidemiol 2000;53:931e9.[14] Walter SD. Odds ratios revisited. Evid Based Med 1998;3:71.
[15] Liberati A, Altman DG, Tetzlaff J, Mulrow C, Gøtzsche PC,
Ioannidis JP, et al. The PRISMA statement for reporting systematic
reviews and meta-analyses of studies that evaluate health care inter-
ventions: explanation and elaboration. J Clin Epidemiol 2009;62:
e1e34.
[16] Higgins JPT, Green S, editors. Cochrane handbook for systematic
reviews of interventions, version 5.1.0. Chichester, UK: John Wiley
& Sons; 2011.
[17] Engels EA, Schmid CH, Terrin N, Olkin I, Lau J. Heterogeneity and
statistical significance in meta-analysis: an empirical study of 125
meta-analyses. Stat Med 2000;19:1707e28.
[18] Brockwell SE, Gordon IR. A comparison of statistical methods for
meta-analysis. Stat Med 2001;20:825e40.
[19] Kontopantelis E, Reeves D. Performance of statistical methods
for meta-analysis when true study effects are non-normally
distributed: a simulation study. Stat Methods Med Res 2012;21:
409e26.
[20] Kontopantelis E, Springate DA, Reeves D. A re-analysis of the Co-
chrane Library data: the dangers of unobserved heterogeneity in
meta-analyses. PLoS One 2013;8:e69930.
[21] Papageorgiou SN, Antonoglou G, Tsiranidou E, Jepsen S, J€ager A.Bias and small-study effects influence treatment effect estimates: a
meta-epidemiological study in oral medicine. J Clin Epidemiol
2014;67:984e92.
[22] Mantel N, Haenszel W. Statistical aspects of the analysis of data
from retrospective studies of disease. J Natl Cancer Inst 1959;22:
719e48.
[23] Greenland S, Robins JM. Estimation of a common effect parameter
from sparse follow-up data. Biometrics 1985;41:55e68.[24] Yusuf S, Peto R, Lewis J, Collins R, Sleight P. Beta blockade during
and after myocardial infarction: an overview of the randomised tri-
als. Prog Cardiovasc Dis 1985;27:335e71.
[25] Cochran WG. The combination of estimates from different experi-
ments. Biometrics 1954;10:101e29.
[26] Whitehead A, Whitehead J. A general parametric approach to the
meta-analysis of randomised clinical trials. Stat Med 1991;10:
1665e77.
[27] Hardy RJ, Thompson SG. Detecting and describing heterogeneity in
meta-analysis. Stat Med 1998;17:841e56.
[28] Higgins JP, Thompson SG. Quantifying heterogeneity in a meta-
analysis. Stat Med 2002;21:1539e58.
[29] Higgins JP, Thompson SG, Deeks JJ, Altman DG. Measuring incon-
sistency in meta-analyses. BMJ 2003;327:557e60.[30] Egger M, Davey Smith G, Schneider M, Minder C. Bias in meta-
analysis detected by a simple, graphical test. BMJ 1997;315:
629e34.
[31] Sterne JA, Sutton AJ, Ioannidis JP, Terrin N, Jones DR, Lau J, et al.
Recommendations for examining and interpreting funnel plot asym-
metry in meta-analyses of randomised controlled trials. BMJ 2011;
343:d4002.
8 S.N. Papageorgiou et al. / Journal of Clinical Epidemiology - (2015) -
[32] White IR, Elbourne D. Assessing subgroup effects with binary data:
can the use of different effect measures lead to different conclu-
sions? BMC Med Res Methodol 2005;5:15.
[33] Deeks JJ. Issues in the selection of a summary statistic for meta-
analysis of clinical trials with binary outcomes. Stat Med 2002;
21:1575e600.
[34] Furukawa TA, Guyatt GH, Griffith LE. Can we individualize the
‘number needed to treat’? an empirical study of summary effect
measures in meta-analyses. Int J Epidemiol 2002;31:72e6.[35] Sterne JA, Egger M. Funnel plots for detecting bias in meta-analysis:
guidelines on choice of axis. J Clin Epidemiol 2001;54:1046e55.
[36] Schwarzer G, Antes G, Schumacher M. Inflation of type I error rate
in two statistical tests for the detection of publication bias in meta-
analyses with binary outcomes. Stat Med 2002;21:2465e77.
[37] Newcombe RG. A deficiency of the odds ratio as a measure of effect
size. Stat Med 2006;25:4235e40.[38] Holcomb WL Jr, Chaiworapongsa T, Luke DA, Burgdorf KD. An
odd measure of risk: use and misuse of the odds ratio. Obstet Gyne-
col 2001;98:685e8.
[39] McNutt LA, Wu C, Xue X, Hafner JP. Estimating the relative risk in
cohort studies and clinical trials of common outcomes. Am J Epide-
miol 2003;157:940e3.
[40] Greenland S. Model-based estimation of relative risks and other
epidemiologic measures in studies of common outcomes and in
case-control studies. Am J Epidemiol 2004;160:301e5.
[41] Finney DJ. Comment. J Chronic Dis 1979;32:78e9.
[42] Fleiss J. Statistical methods for rates and proportions. 2nd ed. New
York: Wiley; 1981.
[43] Feinstein AR. Indexes of contrast and quantitative significance for
comparisons of two groups. Stat Med 1999;18:2557e81.
[44] Sinclair JC, Bracken MB. Clinically useful measures of effects in
binary analyses of randomized trials. J Clin Epidemiol 1994;47:
881e9.
[45] Grimes DA, Schulz KF. Making sense of odds and odds ratios. Ob-
stet Gynecol 2008;111:423e6.[46] Sweeting MJ, Sutton AJ, Lambert PC. What to add to nothing? Use
and avoidance of continuity corrections in meta-analysis of sparse
data. Stat Med 2004;23:1351e75.
[47] Harbord RM, Egger M, Sterne JA. A modified test for small-study
effects in meta-analyses of controlled trials with binary endpoints.
Stat Med 2006;25:3443e57.
[48] Peters JL, Sutton AJ, Jones DR, Abrams KR, Rushton L. Compar-
ison of two methods to detect publication bias in meta-analysis. JA-
MA 2006;295:676e80.
[49] Copas JB, Shi JQ. A sensitivity analysis for publication bias in sys-
tematic reviews. Stat Methods Med Res 2001;10:251e65.[50] Moreno SG, Sutton AJ, Ades AE, Cooper NJ, Abrams KR. Adjust-
ing for publication biases across similar interventions performed
well when compared with gold standard data. J Clin Epidemiol
2011;64:1230e41.[51] R€ucker G, Schwarzer G, Carpenter JR, Binder H, Schumacher M.
Treatment-effect estimates adjusted for small-study effects via a
limit meta-analysis. Biostatistics 2011;12:122e42.[52] Moreno SG, Sutton AJ, Thompson JR, Ades AE, Abrams KR,
Cooper NJ. A generalized weighting regression-derived meta-anal-
ysis estimator robust to small-study effects and heterogeneity. Stat
Med 2012;31:1407e17.[53] Schwarzer G, Carpenter J, R€ucker G. Empirical evaluation suggests
Copas selection model preferable to trim-and-fill method for selec-
tion bias in meta-analysis. J Clin Epidemiol 2010;63:282e8.
1
Choice of effect measure for meta-analyses of dichotomous outcomes can influence the identified heterogeneity and direction of small-study effects –
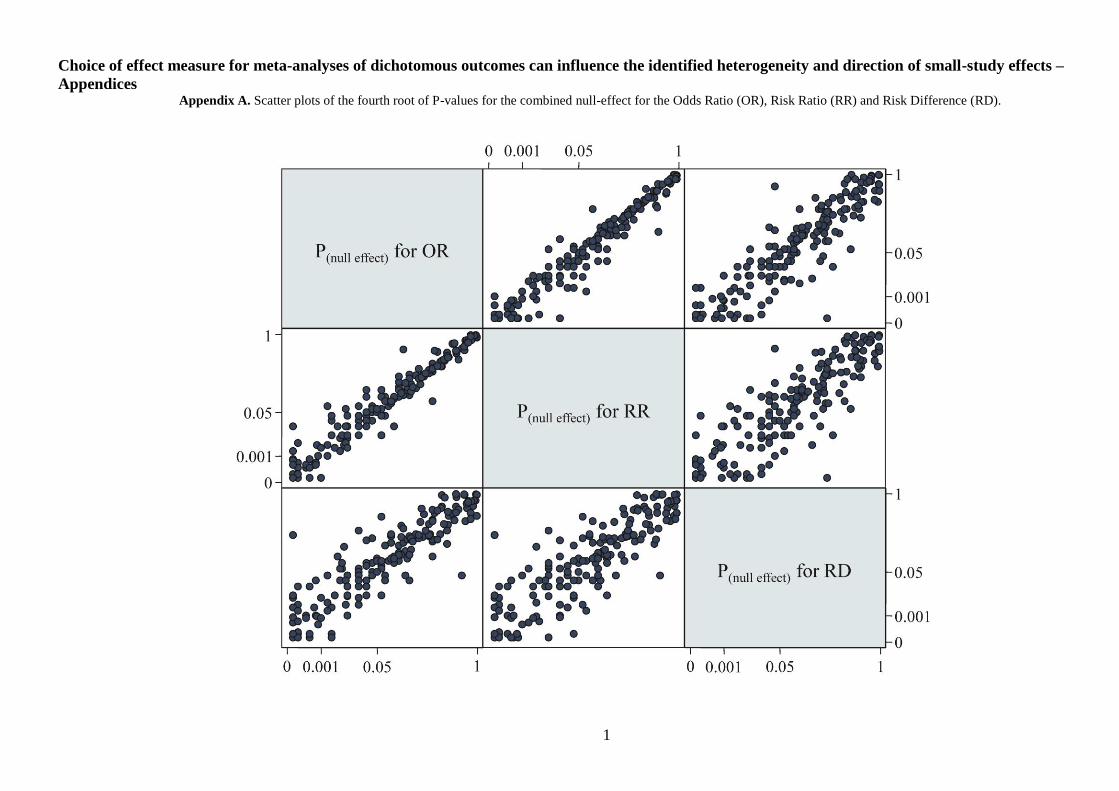
Appendices Appendix A. Scatter plots of the fourth root of P-values for the combined null-effect for the Odds Ratio (OR), Risk Ratio (RR) and Risk Difference (RD).
2
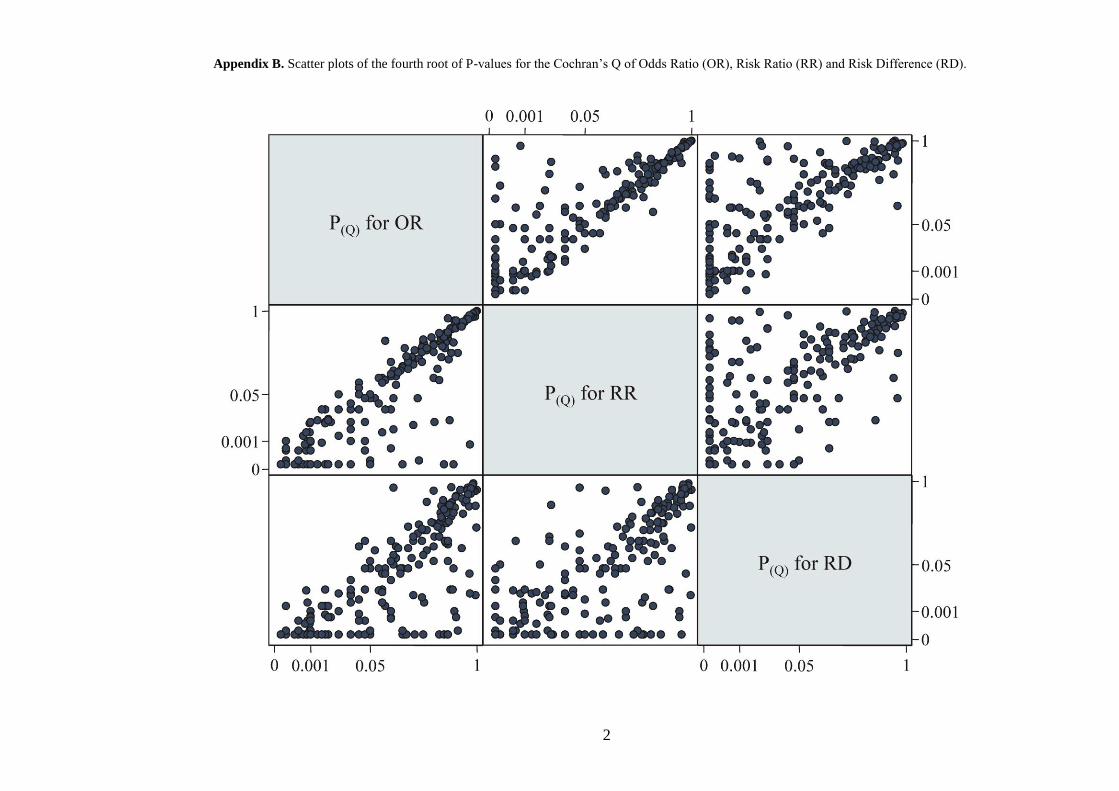
Appendix B. Scatter plots of the fourth root of P-values for the Cochran’s Q of Odds Ratio (OR), Risk Ratio (RR) and Risk Difference (RD).
3
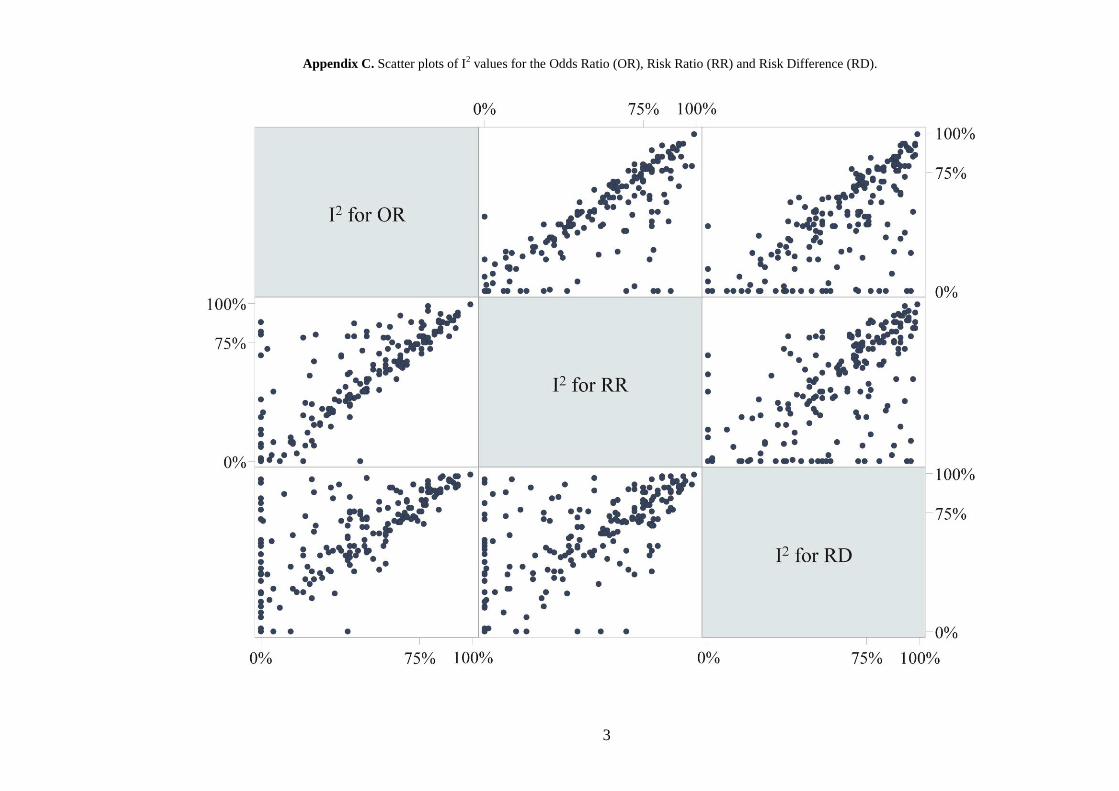
Appendix C. Scatter plots of I2 values for the Odds Ratio (OR), Risk Ratio (RR) and Risk Difference (RD).
4
Appendix D. Scatter plots of H2 values for the Odds Ratio (OR), Risk Ratio (RR) and Risk Difference (RD).
5
Appendix E. Scatter plot of the fourth root of Egger’s P-values for Odds Ratio (OR), Risk Ratio (RR) and Risk Difference (RD).
6
Appendix F. Venn diagrams for the agreement of statistically significant test results for the three metrics.
7
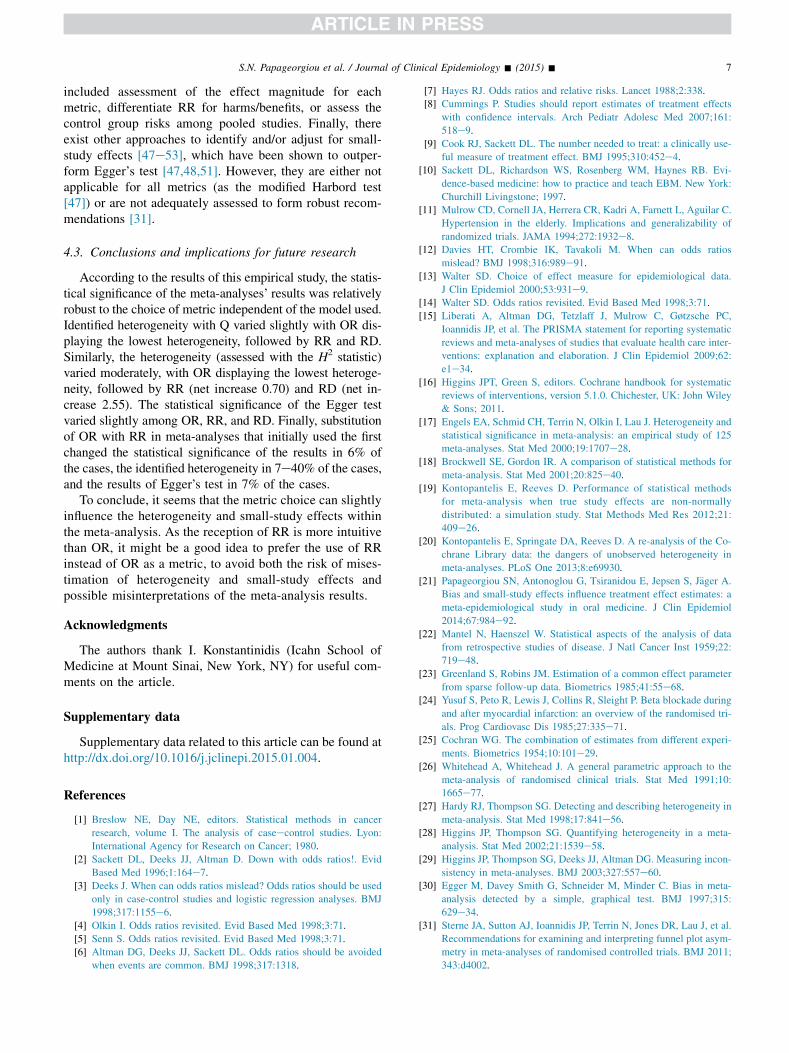
Appendix G. Changes in heterogeneity categories observed through substitution of odds ratio to risk ratio, in the 109 meta-analyses that originally used the first metric.
Extreme
High
Medium
Low
n=2
n=1
n=5
n=5
n=3 n=3
n=7
100%
75%
25%
0%
50%
Heterogeneity changes (I2 statistic) by changing OR to RR