An adaptive fuzzy regression model for the prediction of dichotomous response variables
6
An Adaptive Fuzzy Regression Model for the Prediction of Dichotomous Response Variables Rosma Mohd Dom University of Malaya [email protected] Sameem Abdul Kareem University of Malaya [email protected] Rosnah Zain Basir Abidin University of Malaya Cyberjaya University College of Medical Sciences [email protected] [email protected] Abstract This paper proposes an adaptive technique in the prediction of dichotomous response variable by combining fuzzy concept with statistical logistic regression. The model was tested on an oral cancer dataset in predicting oral cancer susceptibility. In this paper we will present the development, evaluation and validation of the proposed model based on the experiment carried out. Explanatory power of the adaptive model was calculated and compared with fuzzy neural network and statistical logistic regression models using calibration and discrimination techniques. Area under ROC values calculated indicates that the proposed model has compatible predictive ability to both fuzzy neural network and statistical logistic regression models. 1. Introduction 1.1 Predictive models and cancer screening Precise and accurate predictive models are very important in screening initiatives. The need for new approaches and philosophies in modeling cancer prediction and susceptibility are influenced by the recent advances in soft computing as well the questionable accuracy and inapplicability to individual prediction of previously sought after statistical analysis techniques. Thus establishing precise predictive models become increasingly more difficult for multivariable predictive models. Traditionally, such regression problems have been addressed by statistical logistic regression techniques for binary dependent variables. 1.2 Machine learning technique and interval prediction A machine learning technique is an algorithm that estimates an unknown dependency between a set of given input variables and its response variable. When such dependency is discovered, it can be used to predict or deduce the future output associated with a different set of input values. This is done by identifying the target function that best describes the behavior governing the input-output pattern. Learning in this context refers to the process of minimizing the difference between observed data and model output [7]. An interval prediction is usually comprised of the upper and lower limits between which a future unknown value is expected to lie with a prescribed probability. The prediction interval deals with the accuracy of the estimates with respect to the observed target values [7]. The use of prediction interval in machine learning is appropriate when dealing with multivariate functions where available data are very imprecise and limited and when explanatory variables are interacting in uncertain, vague manners [1]. In other words a fuzzy phenomenon is best modeled by a fuzzy functional relationship. The use of prediction interval in machine learning is referred to as fuzzy linear regression technique. 1.3 Motivation of study Existing Prediction Techniques include statistical techniques and artificial intelligent techniques like Artificial Neural Network (ANN), Support Vector Machine (SVM), Fuzzy Logic, k-nearest neighbors (k- NN), Fuzzy Neural Network (FNN) and Fuzzy Fifth International Conference on Computational Science and Applications 0-7695-2945-3/07 $25.00 © 2007 IEEE DOI 10.1109/ICCSA.2007.37 14 Fifth International Conference on Computational Science and Applications 0-7695-2945-3/07 $25.00 © 2007 IEEE DOI 10.1109/ICCSA.2007.37 14 Fifth International Conference on Computational Science and Applications 0-7695-2945-3/07 $25.00 © 2007 IEEE DOI 10.1109/ICCSA.2007.37 14
Transcript of An adaptive fuzzy regression model for the prediction of dichotomous response variables

An Adaptive Fuzzy Regression Model for the Prediction of Dichotomous Response Variables
Rosma Mohd Dom University of Malaya [email protected]
Sameem Abdul Kareem University of Malaya [email protected]
Rosnah Zain Basir Abidin University of Malaya Cyberjaya University College of Medical Sciences [email protected] [email protected]
Abstract
This paper proposes an adaptive technique in the prediction of dichotomous response variable by combining fuzzy concept with statistical logistic regression. The model was tested on an oral cancer dataset in predicting oral cancer susceptibility. In this paper we will present the development, evaluation and validation of the proposed model based on the experiment carried out. Explanatory power of the adaptive model was calculated and compared with fuzzy neural network and statistical logistic regression models using calibration and discrimination techniques. Area under ROC values calculated indicates that the proposed model has compatible predictive ability to both fuzzy neural network and statistical logistic regression models. 1. Introduction 1.1 Predictive models and cancer screening
Precise and accurate predictive models are very important in screening initiatives. The need for new approaches and philosophies in modeling cancer prediction and susceptibility are influenced by the recent advances in soft computing as well the questionable accuracy and inapplicability to individual prediction of previously sought after statistical analysis techniques. Thus establishing precise predictive models become increasingly more difficult for multivariable predictive models. Traditionally, such regression problems have been addressed by statistical logistic regression techniques for binary dependent variables.
1.2 Machine learning technique and interval prediction
A machine learning technique is an algorithm that
estimates an unknown dependency between a set of given input variables and its response variable. When such dependency is discovered, it can be used to predict or deduce the future output associated with a different set of input values. This is done by identifying the target function that best describes the behavior governing the input-output pattern. Learning in this context refers to the process of minimizing the difference between observed data and model output [7].
An interval prediction is usually comprised of the upper and lower limits between which a future unknown value is expected to lie with a prescribed probability. The prediction interval deals with the accuracy of the estimates with respect to the observed target values [7]. The use of prediction interval in machine learning is appropriate when dealing with multivariate functions where available data are very imprecise and limited and when explanatory variables are interacting in uncertain, vague manners [1]. In other words a fuzzy phenomenon is best modeled by a fuzzy functional relationship. The use of prediction interval in machine learning is referred to as fuzzy linear regression technique. 1.3 Motivation of study
Existing Prediction Techniques include statistical techniques and artificial intelligent techniques like Artificial Neural Network (ANN), Support Vector Machine (SVM), Fuzzy Logic, k-nearest neighbors (k-NN), Fuzzy Neural Network (FNN) and Fuzzy
Fifth International Conference on Computational Science and Applications
0-7695-2945-3/07 $25.00 © 2007 IEEEDOI 10.1109/ICCSA.2007.37
14
Fifth International Conference on Computational Science and Applications
0-7695-2945-3/07 $25.00 © 2007 IEEEDOI 10.1109/ICCSA.2007.37
14
Fifth International Conference on Computational Science and Applications
0-7695-2945-3/07 $25.00 © 2007 IEEEDOI 10.1109/ICCSA.2007.37
14
Regression [9, 10]. However there are limitations and drawbacks of the above listed prediction techniques.
Problems normally arise in statistical prediction when there is an inadequate number of observations and when distribution assumptions are not satisfied [1]. As for the artificial intelligent prediction techniques, common limitations involve low interpretation ability due to the “Black box” nature of the model (ANN and SVM), limited model ability to explicitly identify possible causal relationships between variables, over fitting problems (ANN and SVM), difficult to build (k-NN), lack in flexibility to incorporate new knowledge (SVM), risk of eroding old but valid information when new knowledge are introduced in the system (SVM) and unsuitable use for high-dimensional data (SVM) [6, 9, 10].
Thus the main question that sparked this study was
whether there exist new measures particularly among the artificial intelligent techniques that can be used in predicting binary outcome. The proposed model was supposed to provide answers to the following research questions:
• How do we improve the prediction accuracy using artificial intelligent techniques?
• What can be used to handle ambiguous relationship between the independent (explanatory) and dependent (response) variables?
• What can be introduced in the prediction of dichotomous outcome?
• How do we analyze the non-linear relationship between the independent and dependent variables in multivariate environment?
As a result, an adaptive model was developed by
combining the concept of fuzzy with statistical logistic regression. New algorithm to be used for intrinsically linear functions involving linear transformation processes was formulated. This adapted fuzzy logistic regression model can then be used to deduce prediction interval output for binary response variable.
This paper is organized as follows: section I gives the introduction of the proposed fuzzy regression model, section II describes the theory that underlies fuzzy linear regression and fuzzy logistic regression predictive models. The algorithm adapted is shown in section III. Section IV discusses the experiment conducted and model validation. Finally in section V, conclusions from the presented work are drawn.
2. Underlying theories for the adaptive fuzzy logistic regression model 2.1 Fuzzy linear regression theory
Regression analysis is an estimation method used in finding a crisp relationship between the dependent and independent variables and also used to estimate the variance of measurement error. Fuzzy regression analysis is an extension of the classical regression analysis in which some elements of the models are represented by fuzzy numbers [3]. Fuzzy regression methods have been successfully applied to modeling problems in financial forecasting and engineering [2, 8, 11]. There are two categories of fuzzy regression analysis; the first is a possibilistic regression analysis which is based on possibility concepts. Possibilistic regression analysis uses fuzzy linear system as a regression model whereby the total vagueness of the estimated values for the dependent variables is minimized. It was first proposed by Tanaka et al. [1, 3]. The second category of fuzzy regression analysis adopts the fuzzy least squares method (FLSM) for minimizing errors between the given outputs and the estimated outputs. The advantage of Tanaka’s possibilistic model is in its simplicity in programming and computation, while FLSM in its minimum degree of fuzziness between the observed and estimated values [3]. 2.2 Statistical logistic regression theory
Logistic regression is a mathematical modeling approach that is used to describe the relationship between several explanatory variables X’s to a dichotomous dependent variable Y [5]. Logistic regression can be used to predict the outcome from a set of variables that may be continuous, discrete, dichotomous, or a mix of any of these. That is, logistic regression makes no assumption about the distribution of the independent variables. They do not have to be normally distributed, linearly related or of equal variance within each group. The dichotomous dependent variable can take the value of 1 with a probability of success P, or the value of 0 with probability of failure 1-P. This type of variable is called Bernoulli (or binary) variable.
The relationship between the predictor and response variables is not a linear function in logistic
151515

regression, instead, logistic regression function is used which is the logit transformation of P [5].
)...(
...
2211
2211
2211
11
1
...)1
ln(
jj
jj
xbxbxba
xbxbxba
jj
eP
eP
P
xbxbxbaP
P
++++−
++++
+=
=−
++++=+
where P is the probability of a 1, e is the base of the natural logarithm (about 2.718) and a and b are the parameters of the model. 3. The adaptive fuzzy logistic regression
model The adaptive fuzzy logistic regression model is
based on Tanaka’s possibilistic regression analysis described above in which the response variable Y is written as Y=A0x0 + A1x1 + A2x2 +…..+ Ajxj +…+ Akxk where Y is the fuzzy output, x = [x1, x2, . . ., xk]T is the real-valued input vector of independent variables and each regression coefficient Aj, j=0, . . ., k, was assumed to be a symmetric triangular fuzzy number with center αj and half-width cj, Cj ≥0 [3,4].
Tanaka’s possibilistic fuzzy regression technique is however applicable to linear functions only [4]. Due to the fact that binary response variable defies the linearity functional relationship that must be satisfied, suitable transformation involving logit (logarithm of odds) transformation must be carried out to unfold the hidden linear relationship. Data must be pre-processed before being fed into a possibilistic fuzzy linear regression model which is then solved by using linear programming to produce a set of corresponding output in an interval form. The output represents the logarithm of the odds for the event to occur. Finally the output is transformed back into the probability of the event occurring by inversing the logarithm of the odds (logit) values. In the algorithm presented here it is assumed that the logarithm of the odds (logit) is linearly related to X’s, the independent variables after undergoing the logit transformation.
The algorithm for the adaptive model is summarized in the diagram below:
4. Experimental application, model
validation and results interpretation The adaptive fuzzy logistic regression model has
been tested on a sample set consisting of 84 oral cancer patients and 87 controls data provided by the Oral IRPA research team at the University of Malaya, Malaysia. This is to illustrate the feasibility of the adaptive fuzzy logistic regression algorithm in predicting oral cancer susceptibility. The data set x = [x1, x2, . . ., xn]T refers to the input variables consisting of demographic factors (age group, gender, ethnicity group), risk habits associated with oral cancer (cigarette smoking, alcohol drinking, tobacco chewing) and molecular markers (Gstm1 and Gstt1). The choice of input set is determined based on literature search and discussion with oral cancer experts from the University of Malaya. The response variable is binary
Step 1:Check function regression linearity
Step 2:Do Function Linear Transformation
Step 4:Solve Fuzzy Linear Regression Problem using Linear Programming Approach
Stage I: Set up Stage
Step 5Interpret results based on transformation process used.
Step 3: Data pre-processing Find logarithm of odds of parameters used as input variables
Stage II: Problem Solving Stage
161616
in nature describing the health status of either having oral cancer or healthy.
A total of 17 different sets of input variables were
experimented including: Set 1: Tobacco-Chewing habit Set 2: Cigarette Smoking habit Set 3: Alcohol-Drinking habit Set 4: Risk Habits (Smoking, Chewing & Drinking) Set 5: Gstm1 molecular marker Set 6: Gstt1 molecular marker Set 7: Molecular markers (Gstm1 & Gstt1) Set 8: Molecular markers & Risk habits Set 9: All markers (risk habits, molecular, age group, ethnic group & gender) Set 10: Age group Set 11: Ethnic group Set 12: Gender Set 13: Chewing, Age, Ethnicity & Drinking Set 14: Chewing, Age, Ethnicity & Smoking Set 15: Chewing, Age, Ethnicity & Gstm1 Set 16: Chewing, Age, Ethnicity & Gstt1 Set 17: Chewing, Age, Ethnicity & Gender For validation purposes, fuzzy neural network and
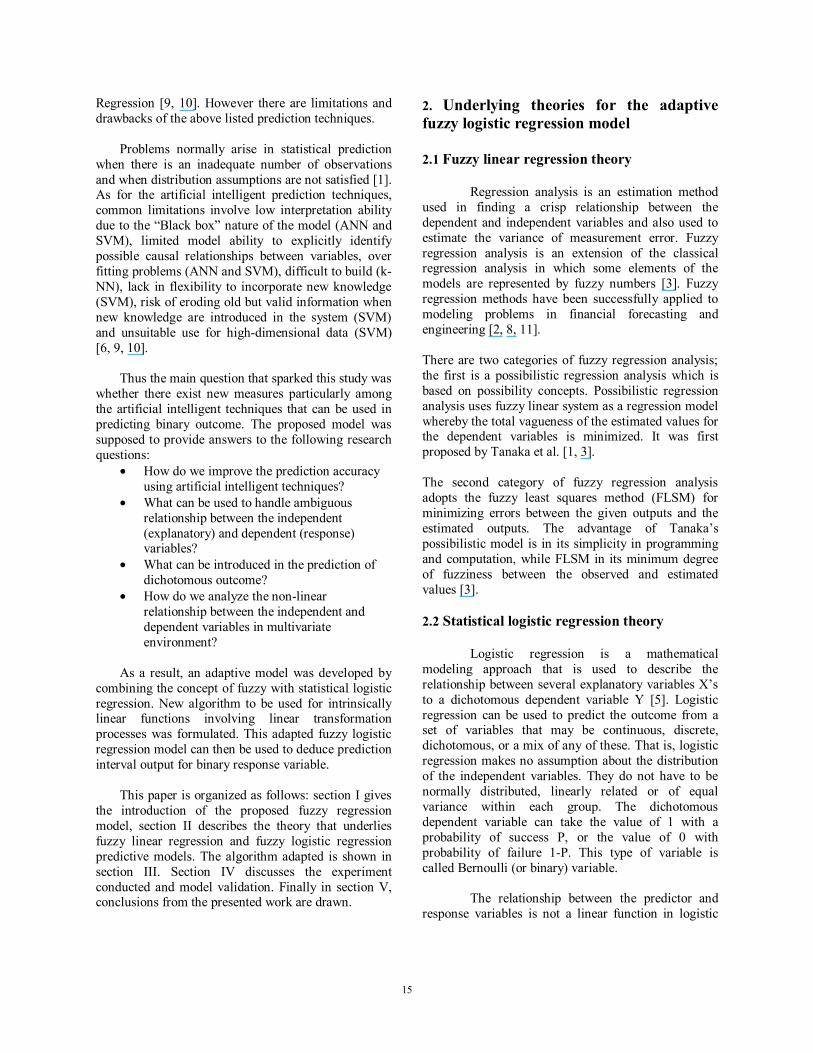
classical statistical logistic regression models were constructed and the same 17 input data sets were fed into them to predict oral cancer susceptibility. The fuzzy neural network (FNN) model was constructed by combining the learning capability of neural networks with the expressiveness of fuzzy if-then rules using linguistic variables to produce fuzzy neural network models ANFIS. The ANFIS system pioneered by Jang (1992) posses the main component of fuzzy inference system including fuzzification, implication and defuzzification.
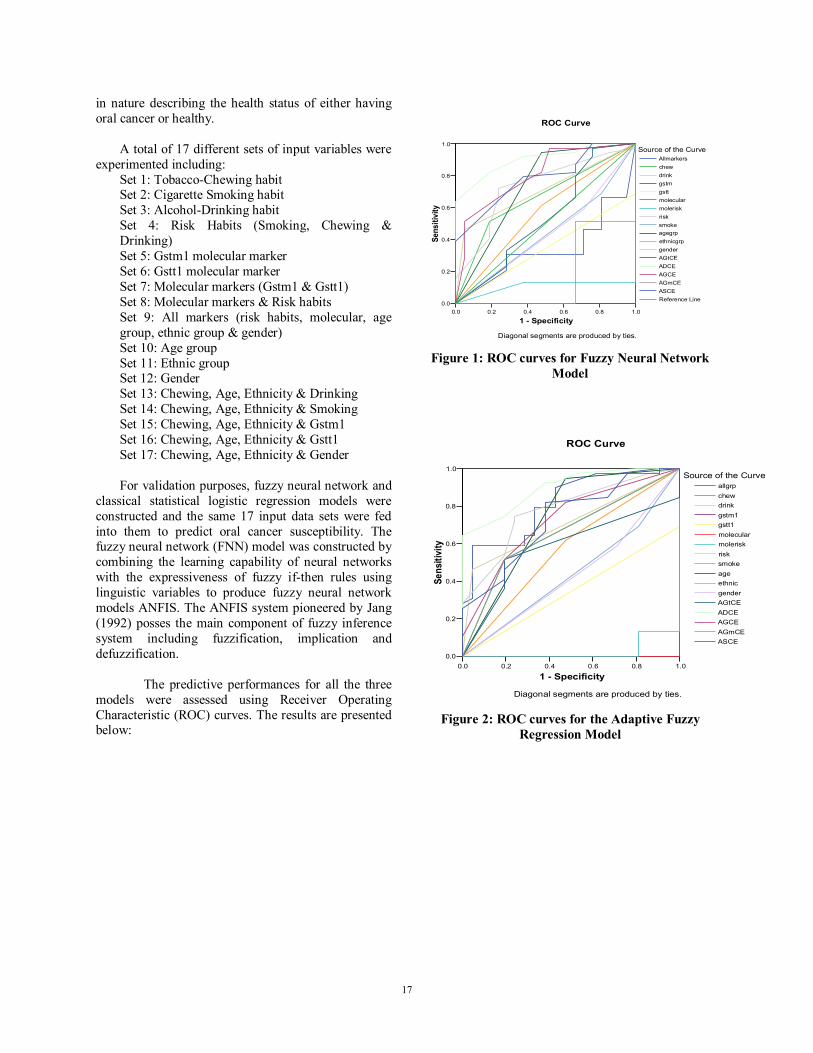
The predictive performances for all the three models were assessed using Receiver Operating Characteristic (ROC) curves. The results are presented below:
0.0 0.2 0.4 0.6 0.8 1.0
1 - Specificity
0.0
0.2
0.4
0.6
0.8
1.0
Sens
itivi
ty
Source of the CurveAllmarkerschewdrinkgstmgsttmolecularmoleriskrisksmokeagegrpethnicgrpgenderAGtCEADCEAGCEAGmCEASCEReference Line
Diagonal segments are produced by ties.
ROC Curve
Figure 1: ROC curves for Fuzzy Neural Network
Model
0.0 0.2 0.4 0.6 0.8 1.0
1 - Specificity
0.0
0.2
0.4
0.6
0.8
1.0
Sens
itivi
ty
Source of the Curveallgrpchewdrinkgstm1gstt1molecularmoleriskrisksmokeageethnicgenderAGtCEADCEAGCEAGmCEASCE
Diagonal segments are produced by ties.
ROC Curve
Figure 2: ROC curves for the Adaptive Fuzzy
Regression Model
171717

0.0 0.2 0.4 0.6 0.8 1.0
1 - Specificity
0.0
0.2
0.4
0.6
0.8
1.0
Sens
itivi
ty
Source of the CurveAgegrpGenderMolecularMoleRiskRiskSmokeChewDrinkGsttGstmAllfactorsEthnicAGtCEADCEAGCEASCEAGmCE
Diagonal segments are produced by ties.
ROC Curve
Figure 3: ROC curves for the Statistical Logistic Regression Model
Table 1: Area Under the Curve (AUC) for Fuzzy Neural Network, Adaptive Fuzzy Regression and
Statistical Logistic Regression Models
Test Result Variable(s)
AUC FNN
AUC Fuzzy
Regression
AUC Logistic
Regression Allmarkers .340 .815 .209chew .661 .661 .661drink .707 .707 .707gstm .000 .000 .000gstt .346 .346 .346molecular .000 .000 .000molerisk .104 .024 .070risk .734 .781 .772smoke .441 .441 .441agegrp .736 .736 .736ethnicgrp .570 .570 .570gender .438 .438 .438AGtCE .538 .584 .680ADCE .904 .897 .852AGCE .807 .726 .799AGmCE .171 .661 .379ASCE .783 .730 .783
Comparison of the tabulated AUC values for
the three ROC curves shown above suggests that the adaptive fuzzy regression model has compatible ability to fuzzy neural network model and classical statistical model in predicting oral cancer susceptibility based on significantly similar AUC values for all the models.
Similarly, the adaptive fuzzy logistic regression models exhibits similar variable selection ability as the other two models. This is reflected in the ranks of the AUC values for the different contributing factors. For this particular data set, the AUC values for drinking, chewing & smoking decreases (in that order) suggesting that among the three risk habit factors, drinking has the best predictive power followed by chewing and smoking in predicting oral cancer susceptibility (AUC values of 0.707, 0.661, 0.441) for all models.
AUC values of ROC curves for the three models indicate that GSTM1 and combination of GSTM1 with GSTT1 have the least predictive ability since they all show the lowest AUC values of zero. The three models also suggest that the variable set consisting of chewing habit, ethnic group, age group and drinking habit exhibits the highest predictive ability (AUC values of 0.904, 0.897 & 0.852) hence can be considered as the ‘optimal’ variable set for the prediction of oral cancer susceptibility. 5. Conclusion
The possibilistic fuzzy linear regression
introduced by Tanaka is being adapted in this study to produce the adaptive fuzzy logistic regression model. This adaptive model was experimented on an oral cancer data set to determine the association between a set of explanatory variables and its corresponding dichotomous response variable. The algorithm formulated can be generalized into prediction problem involving other types of intrinsic linear functions in the fuzzy environment with suitable linear transformation process. The comparatively good results obtained in this application suggest that the adaptive fuzzy logistic regression approach is reasonable, desirable and effective in producing a valid and transparent intelligent exploratory predictive model with dichotomous response variable. 10. References [1]. A. F. Shapiro, “Fuzzy Regression Models”, ARC, 2005.
181818

[2]. F.M. Tseng and L. Lin, “A Quadratic Interval Logit Model for Forecasting Bankruptcy”, Omega, Vol. 33, Issue 1, 2005, pp 85-91. [3]. H. Tanaka, S. Uejima, and K. Asai, “Linear Regression Analysis with Fuzzy Model”, IEEE Transactions on Systems, Man and Cybernetics, Vol. 12, No 6, 1982, pp 903 – 907. [4]. H.F Wang and R.C. Tsaur, “Insight of a Fuzzy Regression Model”, Fuzzy Set and Systems, 2000, pp. 355-369. [5]. J. Miles and M. Shevlin,. “Applying Regression and Correlation. A guide for Students and Researchers”. SAGE Publication Ltd., 2001. [6]. J.V. Tu, “Advantages and Disadvantages of Using Artificial Neural Networks Versus Logistic Regression for Predicting Medical Outcomes”, J Clin Epidemol, Vol 49, No 11, 1996, pp.1225-1231,. [7]. L. Durga. and P. Dimitri, “Machine Learning Approaches for Estimation of Prediction Interval for the Model Output”, Neural Networks Special Issue, 2006, pp. 1-11. [8]. M. Modarres, E. Nasrabadi, and M.M. Nasrabadi, “Fuzzy Linear Regression Models with Least Square Errors”, Applied Mathematics and Computation, Vol 163, 2005, pp 977-989. [9]. M. Nasiri et al., “Comparison of Statistical Regression, Fuzzy Regression and Artificial Neural Network Modeling Methodologies in Polyester Dyeing”, Proceedings of 2005 International Conference for modeling, control and automation. [10]. S. Dreiseitl and O. Machado, “Logistic Regression and Artificial Neural Network Classification Models: a Methodology Review”, Journal of Biomedical Informatics, 35, 2003, pp352-359. [11]. Y. Xue et al., “Fuzzy Regression Method for Prediction and Control the Bead Width in the Robotic Arc Welding Process, Journal of Material Processing Technology, Vol. 164-165 2005, pp. 1134 -1139
R.Mohd-Dom is a post-graduate student financially supported by the University of Technology MARA, Malaysia.
191919