Paleozoic plate dynamics
11
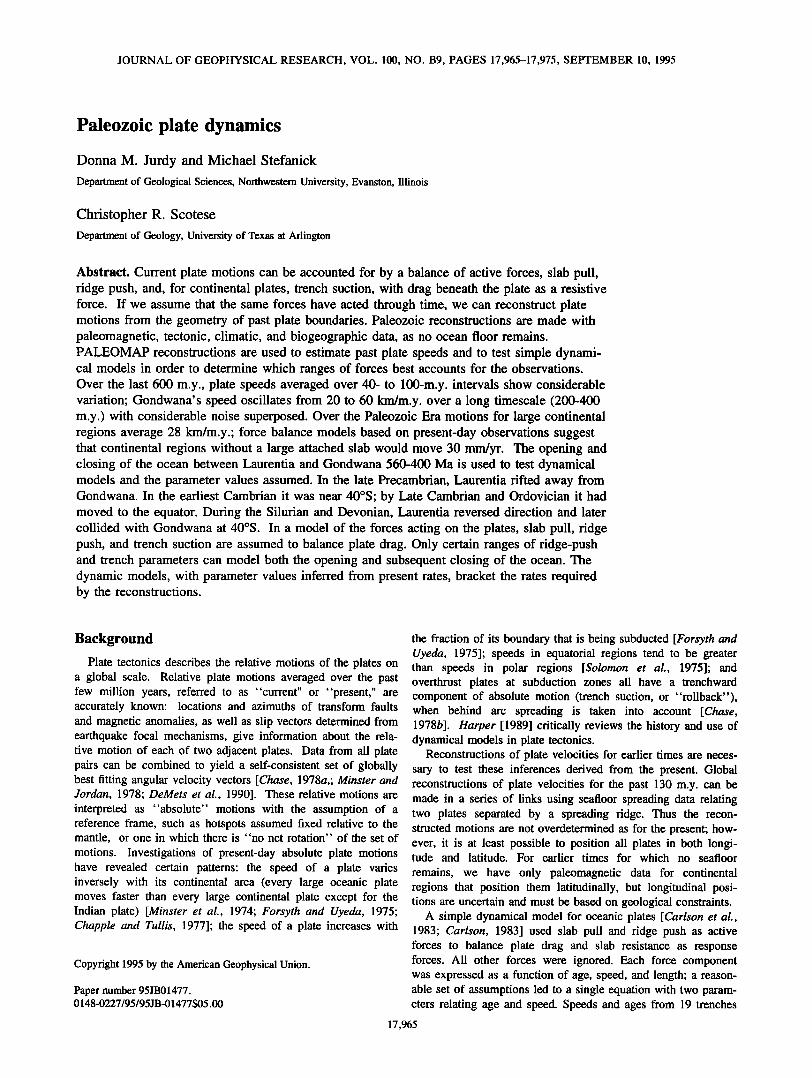
JOURNAL OF GEOPHYSICAL RESEARCH, VOL. 100, NO. B9, PAGES 17,965-17,975, SEPTEMBER 10, 1995 Paleozoic plate dynamics Donna M. Jurdy and Michael Stefanick Department of Geological Sciences, Northwestern University, Evanston, Illinois Christopher R. Scotese Department of Geology,University of Texasat Arlington Abstract. Current platemotions can be accounted for by a balance of active forces, slab pull, ridgepush, and,for continental plates, trench suction, with dragbeneath the plate as a resistive force. If we assume that the same forces haveacted through time, we canreconstruct plate motions from the geometry of pastplate boundaries. Paleozoic reconstructions are made with paleomagnetic, tectonic, climatic, and biogeographic data,as no ocean floor remains. PALEOMAP reconstructions are used to estimate pastplate speeds and to test simple dynami- cal modelsin order to determine which ranges of forcesbestaccounts for the observations. Over the last 600 m.y., plate speeds averaged over 40- to 100-m.y.intervals show considerable variation; Gondwana's speed oscillates from 20 to 60 km/m.y. over a long timescale (200-400 m.y.) with considerable noisesuperposed. Over the Paleozoic Era motions for large continental regions average 28 krn/m.y.;force balance models based on present-day observations suggest that continental regions withouta large attached slabwould move 30 mrn/yr. The opening and closing of the oceanbetween Laurentia and Gondwana 560-400 Ma is used to test dynamical models and the parameter values assumed. In the late Precambrian, Laurentia rifted away from Gondwana. In the earliest Cambrianit was near 40øS;by Late Cambrianand Ordovician it had moved to the equator. During the Silurian and Devonian,Laurentia reversed directionand later collidedwith Gondwana at 40øS. In a model of the forces actingon the plates,slabpull, ridge push,and trenchsuction are assumed to balance plate drag. Only certainranges of ridge-push and trench parameters can model both the opening and subsequent closing of the ocean. The dynamic models, with parameter values inferred from present rates, bracket the rates required by the reconstructions. Background Plate tectonics describes the relative motions of the plates on a global scale. Relative plate motions averaged over the past few million years, referredto as "current" or "present," are accurately known: locations and azimuths of transform faults and magnetic anomalies, as well as slip vectors determined from earthquake focal mechanisms, give informationabout the rela- tive motion of eachof two adjacent plates. Data from all plate pairscan be combined to yield a self-consistent set of globally best fitting angular velocity vectors [Chase, 1978a,;Minster and Jordan, 1978; DeMets et al., 1990]. These relative motions are interpreted as "absolute" motionswith the assumption of a referenceframe, such as hotspots assumed fixed relative to the mantle, or one in which there is "no net rotation" of the set of motions. Investigations of present-day absolute plate motions have revealed certain patterns:the speed of a plate varies inversely with its continental area (every large oceanicplate moves faster than every large continental plate except for the Indian plate) [Minster et al., 1974; Forsyth and Uyeda, 1975; Chappleand Tullis, 1977]; the speed of a plate increases with Copyright 1995 by theAmerican Geophysical Union. Papernumber 95JB01477. 0148-0227/95/95 JB-01477 $05.00 the fraction of its boundary that is being subducted [Forsyth and Uyeda, 1975]; speeds in equatorialregionstend to be greater than speeds in polar regions [Solomon et al., 1975]; and overthrust plates at subduction zones all have a trenchward componentof absolutemotion (trench suction, or "rollback"), when behind arc spreading is taken into account [Chase, 1978b]. Harper [1989] critically reviews the history anduseof dynamical models in platetectonics. Reconstructions of plate velocities for earlier times are neces- sary to test these inferences derived from the present. Global reconstructions of plate velocities for the past 130 m.y. can be madein a series of links usingseafloor spreading data relating two plates separated by a spreadingridge. Thus the recon- structed motions are not overdetermined as for the present; how- ever, it is at least possible to position all platesin both longi- tude and latitude. For earlier times for which no seafloor remains, we have only paleomagneticdata for continental regions that position them latitudinally,but longitudinal posi- tions are uncertain and mustbe based on geological constraints, A simpledynamical model for oceanic plates[Carlsonet al., 1983; Carlson, 1983] used slab pull and ridge push as active forces to balance plate drag and slab resistance as response forces.All other forces were ignored.Each force component was expressed as a functionof age, speed, and length;a reason- able setof assumptions led to a single equation with two param- etersrelating age and speed. Speeds and agesfrom 19 trenches 17,965
Transcript of Paleozoic plate dynamics
JOURNAL OF GEOPHYSICAL RESEARCH, VOL. 100, NO. B9, PAGES 17,965-17,975, SEPTEMBER 10, 1995
Paleozoic plate dynamics
Donna M. Jurdy and Michael Stefanick Department of Geological Sciences, Northwestern University, Evanston, Illinois
Christopher R. Scotese Department of Geology, University of Texas at Arlington
Abstract. Current plate motions can be accounted for by a balance of active forces, slab pull, ridge push, and, for continental plates, trench suction, with drag beneath the plate as a resistive force. If we assume that the same forces have acted through time, we can reconstruct plate motions from the geometry of past plate boundaries. Paleozoic reconstructions are made with paleomagnetic, tectonic, climatic, and biogeographic data, as no ocean floor remains. PALEOMAP reconstructions are used to estimate past plate speeds and to test simple dynami- cal models in order to determine which ranges of forces best accounts for the observations. Over the last 600 m.y., plate speeds averaged over 40- to 100-m.y. intervals show considerable variation; Gondwana's speed oscillates from 20 to 60 km/m.y. over a long timescale (200-400 m.y.) with considerable noise superposed. Over the Paleozoic Era motions for large continental regions average 28 krn/m.y.; force balance models based on present-day observations suggest that continental regions without a large attached slab would move 30 mrn/yr. The opening and closing of the ocean between Laurentia and Gondwana 560-400 Ma is used to test dynamical models and the parameter values assumed. In the late Precambrian, Laurentia rifted away from Gondwana. In the earliest Cambrian it was near 40øS; by Late Cambrian and Ordovician it had moved to the equator. During the Silurian and Devonian, Laurentia reversed direction and later collided with Gondwana at 40øS. In a model of the forces acting on the plates, slab pull, ridge push, and trench suction are assumed to balance plate drag. Only certain ranges of ridge-push and trench parameters can model both the opening and subsequent closing of the ocean. The dynamic models, with parameter values inferred from present rates, bracket the rates required by the reconstructions.
Background
Plate tectonics describes the relative motions of the plates on a global scale. Relative plate motions averaged over the past few million years, referred to as "current" or "present," are accurately known: locations and azimuths of transform faults and magnetic anomalies, as well as slip vectors determined from earthquake focal mechanisms, give information about the rela- tive motion of each of two adjacent plates. Data from all plate pairs can be combined to yield a self-consistent set of globally best fitting angular velocity vectors [Chase, 1978a,; Minster and Jordan, 1978; DeMets et al., 1990]. These relative motions are interpreted as "absolute" motions with the assumption of a reference frame, such as hotspots assumed fixed relative to the mantle, or one in which there is "no net rotation" of the set of
motions. Investigations of present-day absolute plate motions have revealed certain patterns: the speed of a plate varies inversely with its continental area (every large oceanic plate moves faster than every large continental plate except for the Indian plate) [Minster et al., 1974; Forsyth and Uyeda, 1975; Chapple and Tullis, 1977]; the speed of a plate increases with
Copyright 1995 by the American Geophysical Union.
Paper number 95JB01477. 0148-0227/95/95 JB-01477 $05.00
the fraction of its boundary that is being subducted [Forsyth and Uyeda, 1975]; speeds in equatorial regions tend to be greater than speeds in polar regions [Solomon et al., 1975]; and overthrust plates at subduction zones all have a trenchward component of absolute motion (trench suction, or "rollback"), when behind arc spreading is taken into account [Chase, 1978b]. Harper [1989] critically reviews the history and use of dynamical models in plate tectonics.
Reconstructions of plate velocities for earlier times are neces- sary to test these inferences derived from the present. Global reconstructions of plate velocities for the past 130 m.y. can be made in a series of links using seafloor spreading data relating two plates separated by a spreading ridge. Thus the recon- structed motions are not overdetermined as for the present; how- ever, it is at least possible to position all plates in both longi- tude and latitude. For earlier times for which no seafloor
remains, we have only paleomagnetic data for continental regions that position them latitudinally, but longitudinal posi- tions are uncertain and must be based on geological constraints,
A simple dynamical model for oceanic plates [Carlson et al., 1983; Carlson, 1983] used slab pull and ridge push as active forces to balance plate drag and slab resistance as response forces. All other forces were ignored. Each force component was expressed as a function of age, speed, and length; a reason- able set of assumptions led to a single equation with two param- eters relating age and speed. Speeds and ages from 19 trenches
17,965
17,966 JURDY ET AL.: PALEOZOIC PLATE DYNAMICS
were used to estimate the parameters, with the result that the ridge-push force is much smaller than the slab-pull force and may actually be zero within the errors. A generalization of this one-dimensional force model to two dimensions yielded a torque model which is fairly stable over the Cenozoic Era, with the misfit increasing systematically for earlier reconstructions [Jurdy and Stefanick, 1988]. For a two-dimensional model of a plate there are three conditions for dynamical equilibrium: the net forces and the net torque about any point must all be zero. Using these conditions, Stefanick and Jurdy [1992] estimated the magnitudes of forces as a function of age, with ridge push and slab pull as active forces and plate drag and slab resistance as passive, resistive forces. The balance refers to purely oceanic plates where slab pull dominates; for a continental plate with only a small attached slab, if any, slab pull is less than ridge push.
Another important question is whether the rate of subduction and plate motions have changed over geological time in response to the thermal regime. An estimate would require knowledge of the relation between mantle temperature and plate motions, as well as the history of that temperature. Abbott et al. [1994] conclude from a compilation of petrologic data that the mid-Archean was merely 10% hotter than at present; from this we would infer a change in rate of a few percent at best. How- ever, Davies [1992] argues that with the higher heat flow and faster convection in the Precambrian, subduction at a lower
average age would not have been negatively buoyant, and would be inhibited. In his view, plate tectonics with subduction has not always been in existence; it would gradually evolve as Earth cooled. In this paper, we attempt to use dynamical models derived for the present to account for the time scales of observed Wilson Cycles, the opening and closing of oceans.
Specifically, we model a full cycle: The separation and then convergence of Laurentia and Gondwana between 600 and 400 Ma, as an ocean opens and closes. We wish to see whether plate boundaries inferred from reconstructions along with force balance models derived for the present can account for the time evolution of reconstructions.
Reconstructions
Plate reconstructions back to 150 Ma are reliable because
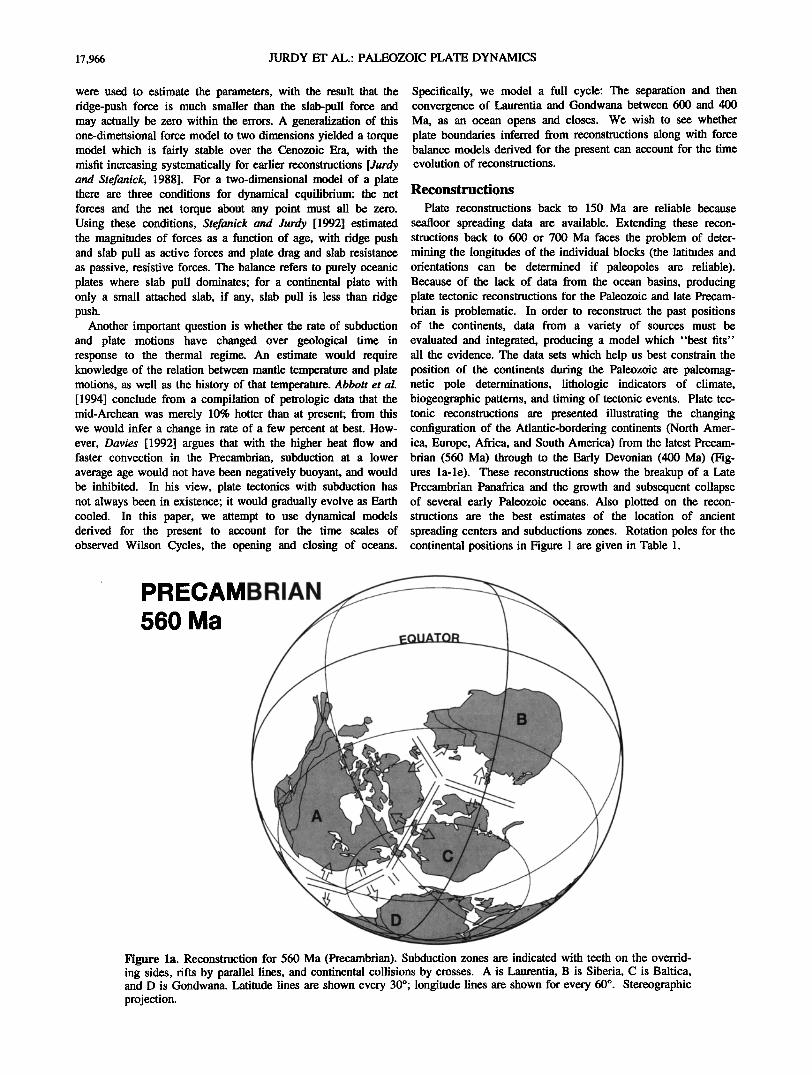
seafloor spreading data are available. Extending these recon- structions back to 600 or 700 Ma faces the problem of deter- mining the longitudes of the individual blocks (the latitudes and orientations can be determined if paleopoles are reliable). Because of the lack of data from the ocean basins, producing plate tectonic reconstructions for the Paleozoic and late Precam- brian is problematic. In order to reconstruct the past positions of the continents, data from a variety of sources must be evaluated and integrated, producing a model which "best fits" all the evidence. The data sets which help us best constrain the position of the continents during the Paleozoic are paleomag- netic pole determinations, lithologic indicators of climate, biogeographic patterns, and timing of tectonic events. Plate tec- tonic reconstructions are presented illustrating the changing configuration of the Atlantic-bordering continents (North Amer- ica, Europe, Africa, and South America) from the latest Precam- brian (560 Ma) through to the Early Devonian (400 Ma) (Fig- ures l a-le). These reconstructions show the breakup of a Late Precambrian Panafrica and the growth and subsequent collapse of several early Paleozoic oceans. Also plotted on the recon- structions are the best estimates of the location of ancient
spreading centers and subductions zones. Rotation poles for the continental positions in Figure 1 are given in Table 1.
PRECAMBRIAN 560 Ma
Figure la. Reconstruction for 560 Ma (Precambrian). Subduction zones are indicated with teeth on the overrid- ing sides, rifts by parallel lines, and continental collisions by crosses. A is Laurentia, B is Siberia, C is Baltica, and D is Gondwana. Latitude lines are shown every 30ø; longitude lines are shown for every 60 ø. Stereographic projection.
JURDY ET AL.' PALEOZOIC PLATE DYNAMICS 17,967
CAMBRIAN 520 Ma
E
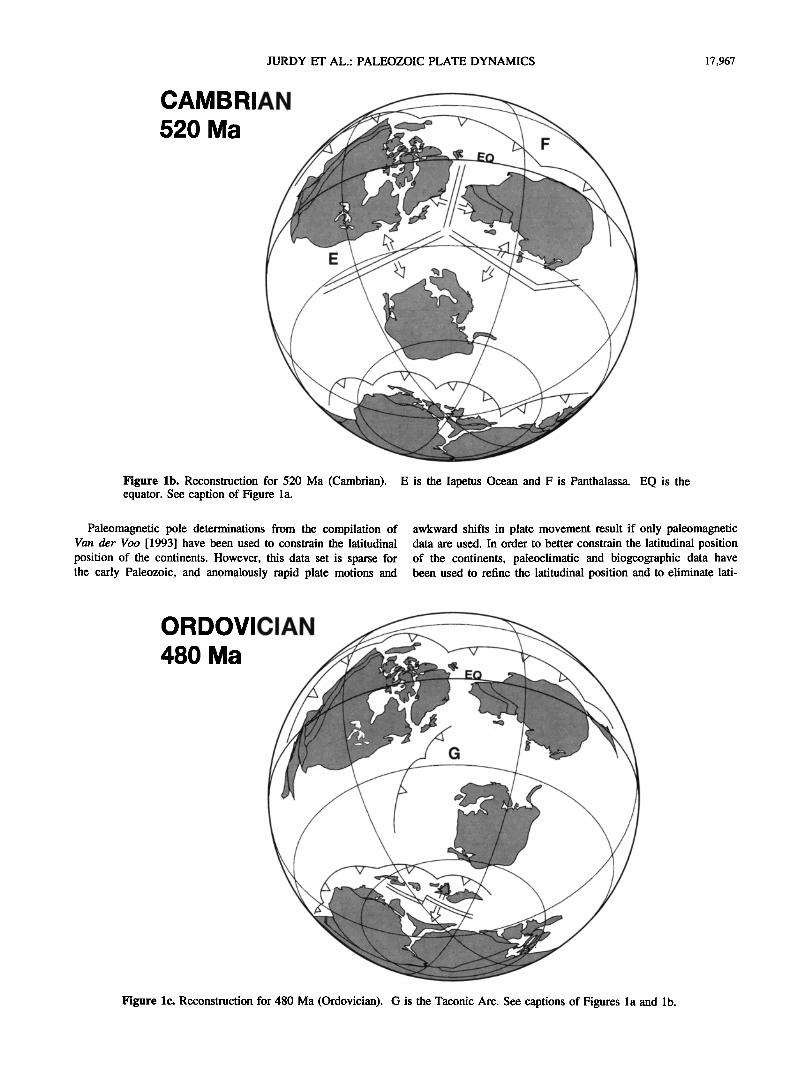
Figure lb. Reconstruction for 520 Ma (Cambrian). equator. See caption of Figure l a.
Paleomagnetic pole determinations from the compilation of Van der Voo [1993] have been used to constrain the latitudinal position of the continents. However, this data set is sparse for the early Paleozoic, and anomalously rapid plate motions and
E is the Iapetus Ocean and F is Panthalassa. EQ is the
awkward shifts in plate movement result if only paleomagnetic data are used. In order to better constrain the latitudinal position of the continents, paleoclimatic and biogeographic data have been used to refine the latitudinal position and to eliminate lati-
ORDOVlClAN
480 Ma
Figure lc. Reconstruction for 480 Ma (Ordovician). G is the Taconic Arc. See captions of Figures la and lb.
17,968 JURDY ET AL.: PALEOZOIC PLATE DYNAMICS
SILURIAN
440 Ma
H
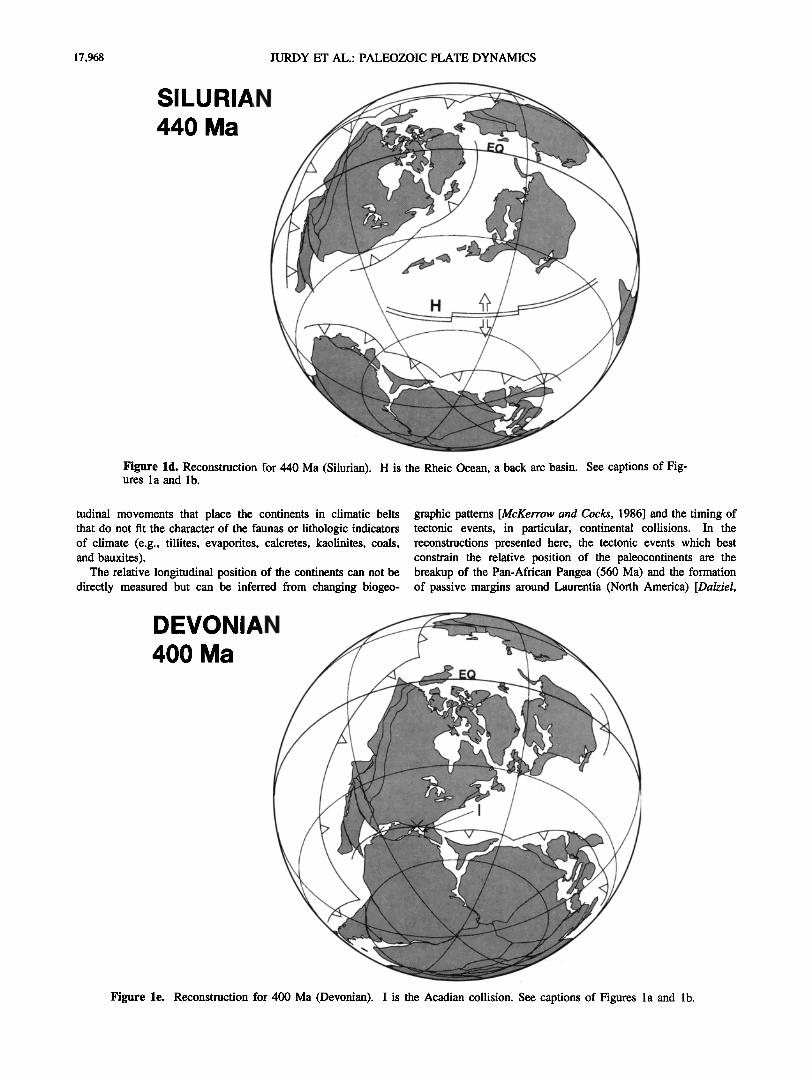
Figure ld. Reconstruction for 440 Ma (Silurian). H is the Rheic Ocean, a back arc basin See captions of Fig- ures 1 a and lb.
tudinal movements that place the continents in climatic belts that do not fit the character of the faunas or lithologic indicators of climate (e.g., tillites, evaporites, calcretes, kaolinites, coals, and bauxites).
The relative longitudinal position of the continents can not be directly measured but can be inferred from changing biogeo-
graphic patterns [McKerrow and Cocks, 1986] and the timing of tectonic events, in particular, continental collisions. In the reconstructions presented here, the tectonic events which best constrain the relative position of the paleocontinents are the breakup of the Pan-African Pangea (560 Ma) and the formation of passive margins around Laurentia (North America) [Dalziel,
DEVONIAN
400 Ma
Figure le. Reconstruction for 400 Ma (Devonian). I is the Acadian collision. See captions of Figures la and lb.
JURDY ET AL.: PALEOZOIC PLATE DYNAMICS 17,969
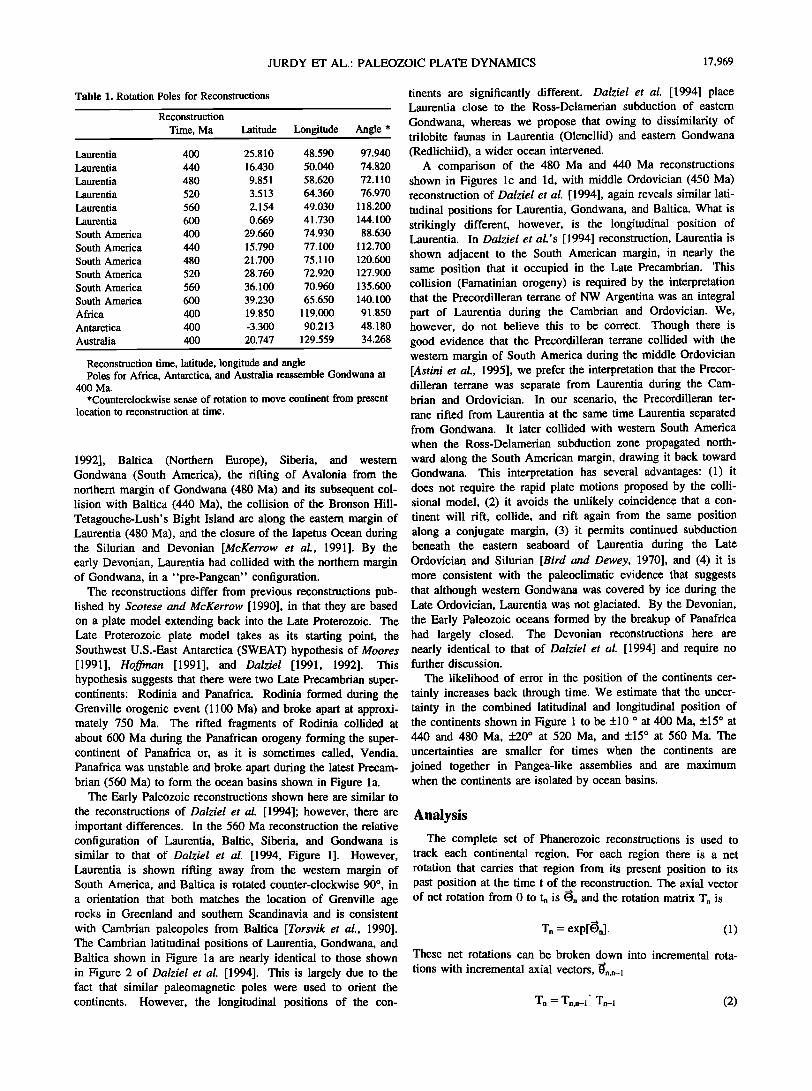
Table 1. Rotation Poles for Reconstructions
Reconstruction
Time, Ma Latitude Longitude Angle *
Laurentia 400 25.810 48.590 97.940 Laurentia 440 16.430 50.040 74.820 Laurentia 480 9.851 58.620 72.110 Laurentia 520 3.513 64.360 76.970 Laurentia 560 2.154 49.030 118.200 Laurentia 600 0.669 41.730 144.100 South America 400 29.660 74.930 88.630 South America 440 15.790 77.100 112.700 South America 480 21.700 75.110 120.600 South America 520 28.760 72.920 127.900 South America 560 36.100 70.960 135.600 South America 600 39.230 65.650 140.100 Africa 400 19.850 119.000 91.850 Antarctica 400 -3.300 90.213 48.180 Australia 400 20.747 129.559 34.268
Reconstruction time, latitude, longitude and angle Poles for Africa, Antarctica, and Australia reassemble Gondwana at
400 Ma.
*Counterclockwise sense of rotation to move continent from present location to reconstruction at time.
1992], Baltica (Northem Europe), Siberia, and western Gondwana (South America), the rifting of Avalonia from the northem margin ½,f Gondwana (480 Ma) and its subsequent col- lision with Baltica (440 Ma), the collision of the Bronson Hill- Tetagouche-Lush's Bight Island arc along the eastern margin of Laurentia (480 Ma), and the closure of the Iapetus Ocean during the Silurian and Devonian [McKerrow et al., 1991]. By the early Devonian, Laurentia had collided with the northern margin of Gondwana, in a "pre-Pangean" configuration.
The reconstructions differ from previous reconstructions pub- lished by Scotese and McKerrow [1990], in that they are based on a plate model extending back into the Late Proterozoic. The Late Proterozoic plate model takes as its starting point, the Southwest U.S.-East Antarctica (SWEAT) hypothesis of Moores [1991], Hoffman [1991], and Dalziel [1991, 1992]. This hypothesis suggests that there were two Late Precambrian super- continents: Rodinia and Panafrica. Rodinia formed during the Grenville orogenic event (1100 Ma) and broke apart at approxi- mately 750 Ma. The rifted fragments of Rodinia collided at about 600 Ma during the Panafrican orogeny forming the super- continent of Panafrica or, as it is sometimes called, Vendia. Panafrica was unstable and broke apart during the latest Precam- brian (560 Ma) to form the ocean basins shown in Figure l a.
The Early Paleozoic reconstructions shown here are similar to the reconstructions of Dalziel et al. [1994]; however, there are important differences. In the 560 Ma reconstruction the relative configuration of Laurentia, Baltic, Siberia, and Gondwana is similar to that of Dalziel et al. [1994, Figure 1]. However, Laurentia is shown rifting away from the western margin of South America, and Baltica is rotated counter-clockwise 90 ø, in a orientation that both matches the location of Grenville age rocks in Greenland and southern Scandinavia and is consistent
with Cambrian paleopoles from Baltica [Torsvik et al., 1990]. The Cambrian latitudinal positions of Laurentia, Gondwana, and Baltica shown in Figure l a are nearly identical to those shown in Figure 2 of Dalziel et al. [1994]. This is largely due to the fact that similar paleomagnetic poles were used to orient the continents. However, the longitudinal positions of the con-
tinents are significantly different. Dalziel et al. [1994] place Laurentia close to the Ross-Delamerian subduction of eastern
Gondwana, whereas we propose that owing to dissimilarity of trilobite faunas in Laurentia (Olenellid) and eastem Gondwana (Redlichiid), a wider ocean intervened.
A comparison of the 480 Ma and 440 Ma reconstructions shown in Figures l c and l d, with middle Ordovician (450 Ma) reconstruction of Dalziel et al. [1994], again reveals similar lati- tudinal positions for Laurentia, Gondwana, and Baltica. What is strikingly different, however, is the longitudinal position of Laurentia. In Dalziel et al.'s [1994] reconstruction, Laurentia is shown adjacent to the South American margin, in nearly the same position that it occupied in the Late Precambrian. This collision (Famatinian orogeny) is required by the interpretation that the Precordilleran terrane of NW Argentina was an integral part of Laurentia during the Cambrian and Ordovician. We, however, do not believe this to be correct. Though there is good evidence that the Precordilleran terrane collided with the western margin of South America during the middle Ordovician [Astini et al., 1995], we prefer the interpretation that the Precor- dilleran terrane was separate from Laurentia during the Cam- brian and Ordovician. In our scenario, the Precordilleran ter- rane rifted from Laurentia at the same time Laurentia separated from Gondwana. It later collided with western South America when the Ross-Delamerian subduction zone propagated north- ward along the South American margin, drawing it back toward Gondwana. This interpretation has several advantages: (1) it does not require the rapid plate motions proposed by the colli- sional model, (2) it avoids the unlikely coincidence that a con- tinent will rift, collide, and rift again from the same position along a conjugate margin, (3) it permits continued subduction beneath the eastern seaboard of Laurentia during the Late Ordovician and Silurian [Bird and Dewey, 1970], and (4) it is more consistent with the paleoclimatic evidence that suggests that although western Gondwana was covered by ice during the Late Ordovician, Laurentia was not glaciated. By the Devonian, the Early Paleozoic oceans formed by the breakup of Panafrica had largely closed. The Devonian reconstructions here are nearly identical to that of Dalziel et al. [1994] and require no further discussion.
The likelihood of error in the position of the continents cer- tainly increases back through time. We estimate that the uncer- tainty in the combined latitudinal and longitudinal position of the continents shown in Figure 1 to be +10 ø at 400 Ma, +15 ø at 440 and 480 Ma, +20 ø at 520 Ma, and +15 ø at 560 Ma. The uncertainties are smaller for times when the continents are
joined together in Pangea-like assemblies and are maximum when the continents are isolated by ocean basins.
Analysis
The complete set of Phanerozoic reconstructions is used to track each continental region. For each region there is a net rotation that carries that region from its present position to its past position at the time t of the reconstruction. The axial vector of net rotation from 0 to tn is •n and the rotation matrix Tn is
Tn = exp[•n]. (1)
These net rotations can be broken down into incremental rota-
tions with incremental axial vectors, i•n,n-I
Tn = Tn,n-•' Tn-• (2)
17,970 JURDY ET AL.' PALEOZOIC PLATE DYNAMICS
exp[•n] = exp(•n,n-1)' exp(•n-1).
Then we can sum these increments and define
•n = • •m,m-1- (3) m=l
The advantage to using these increments is that for two regions locked together or moving together during a time period the corresponding i• versus t curves will be exactly parallel, whereas • versus t only approximately so. (The exponential function for rotations is discussed further by Jurdy and $tefanick [1987].) Paleomagnetic poles provide direct information about the lati- tude and orientation of a region in the past, but the longitude information is lost. Reconstructions must supply the missing longitudinal information. A mistake in longitude would appear as a jump in the z component of • and would appear for several adjacent continents. These jumps can be and were used to detect and correct mistakes in the longitude assignment of previous sequences of reconstructions. The set of reconstructions presented here (Figure 1) seem satisfactory.
In our analysis there are 20 time slices for the last 200 m.y., with reconstructions every 10 m.y.; there are 18 more from 220 back to 560 Ma, with reconstructions every 20 m.y. and the ear- liest reconstruction is at 600 Ma. We would like to represent the speed of each plate through the Phanerozoic, but we do not have the entire plate defined, only the continental region. Plate speeds are computed by selecting a point near the center of the continent and using the rotation, T,, for the reconstruction to find the past positions of that point. The speeds will depend on the reconstructions and time interval chosen for averaging, so we used a range of intervals of 40 to 100 m.y. to get an idea of the variability. For example, speeds were determined from the reconstruction at 380 Ma by finding the angle to the correspond- ing positions for the reconstructions at 420, 440, 460, and 480 Ma, giving average speeds at the times 400, 410, 420, and 430
lOO
8o
6o
4o
2o
Africa
I I
0 i 0 200 400 600
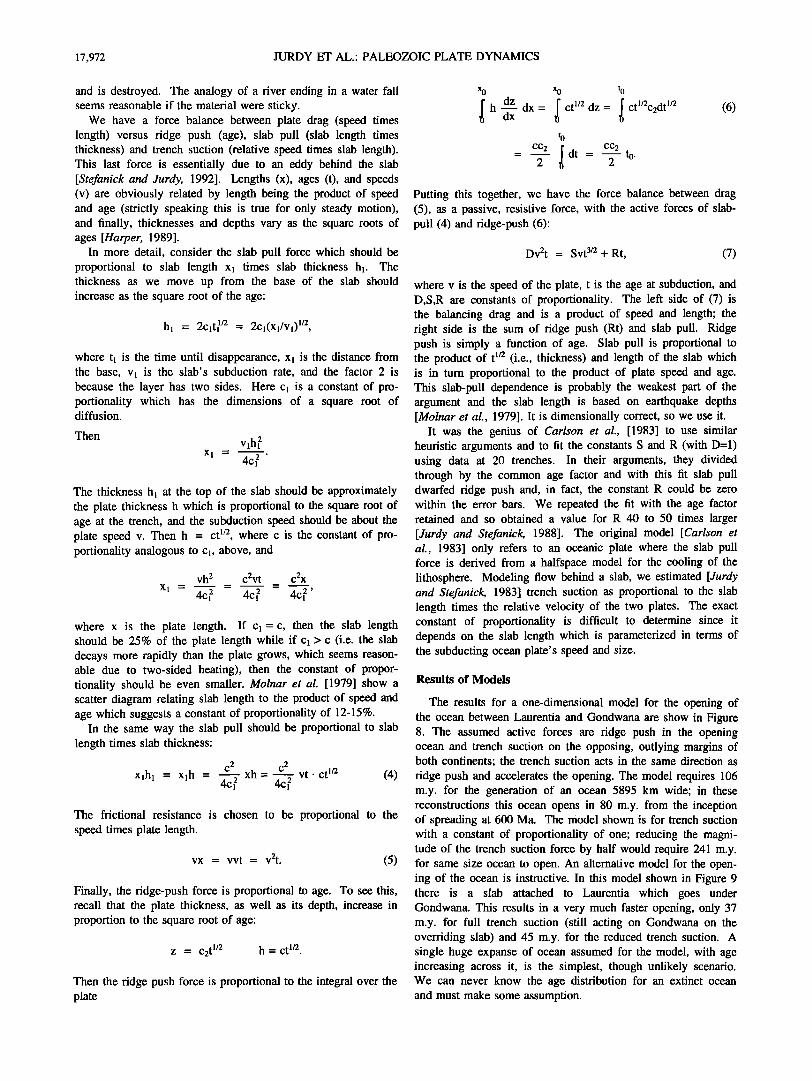
time (Ma) Figure 2. Motion of Africa with respect to coordinate system for reconstructions over Phanerozoic and latest Precambrian.
Crosses have widths proportional to the averaging interval (ranging from 40 to 100 m.y.) and height inversely proportional to the interval length.
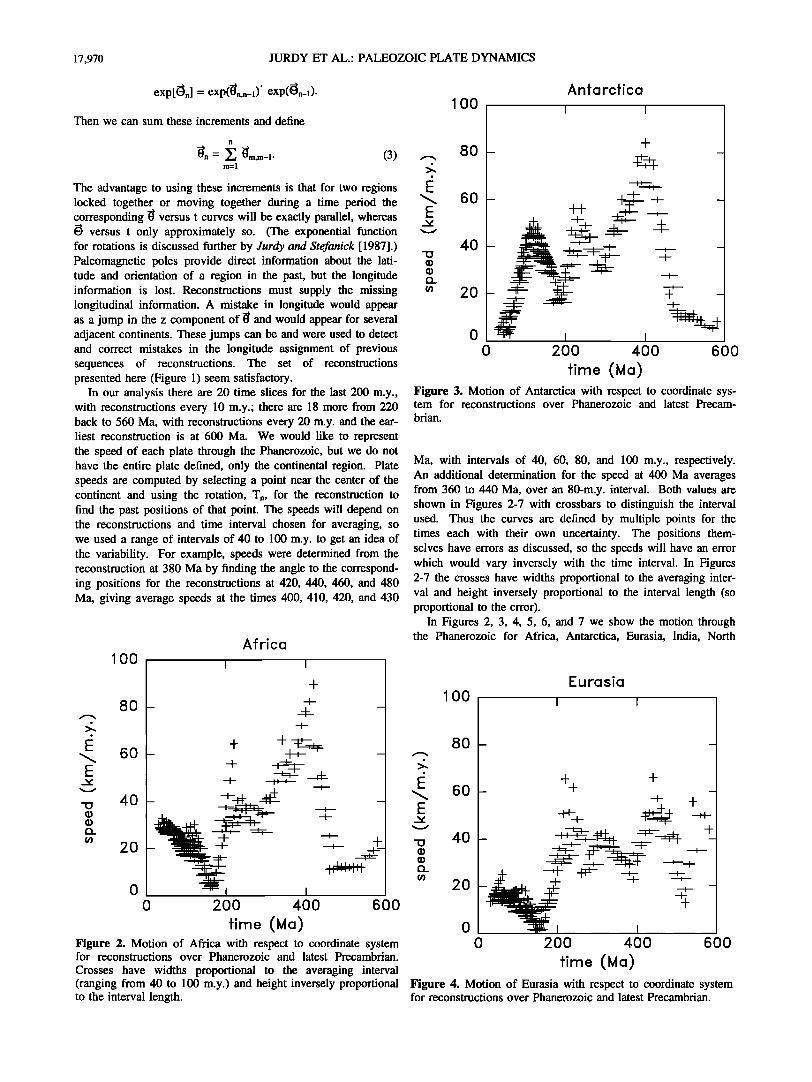
lOO Antarctica
80-
60 -H- ._•._-• . ,.+., ,+.+
2O
I
0 200 400 600
time (Ma) Figure 3. Motion of Antarctica with respect to coordinate sys- tem for reconstructions over Phanerozoic and latest Precam- brian.
Ma, with intervals of 40, 60, 80, and 100 m.y., respectively. An additional determination for the speed at 400 Ma averages from 360 to 440 Ma, over an 80-m.y. interval. Both values are shown in Figures 2-7 with crossbars to distinguish the interval used. Thus the curves are defined by multiple points for the times each with their own uncertainty. The positions them- selves have errors as discussed, so the speeds will have an error which would vary inversely with the time interval. In Figures 2-7 the crosses have widths proportional to the averaging inter- val and height inversely proportional to the interval length (so proportional to the error).
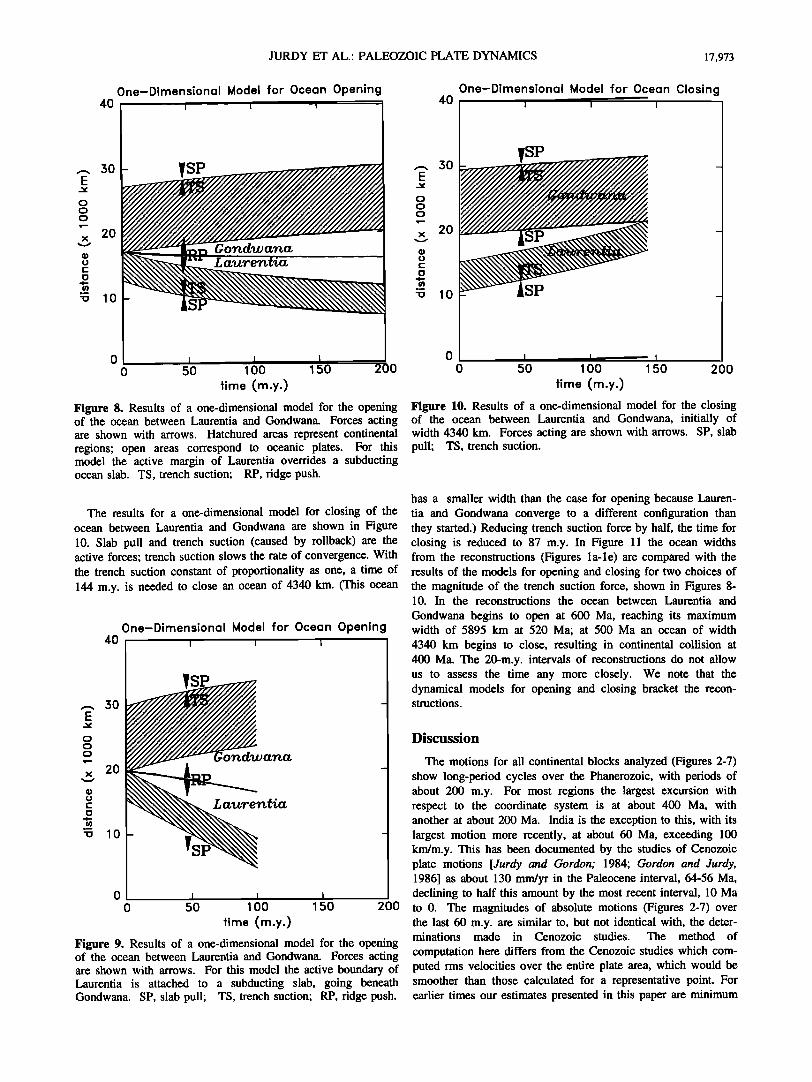
In Figures 2, 3, 4, 5, 6, and 7 we show the motion through the Phanerozoic for Africa, Antarctica, Eurasia, India, North
lOO Eurasia
I I
8O
6O
4O
2O
0 200 400
time (Mo)
+-I- +
600
Figure 4. Motion of Eurasia with respect to coordinate system for reconstructions over Phanerozoic and latest Precambrian.

JURDY ET AL.' PALEOZOIC PLATE DYNAMICS 17,971
lOO
8o
6o
4o
2o
++
India
I
I I
0 200 400 600
time (Ma) Figure 5. Motion of India with respect to coordinate system for reconstructions over Phanerozoic and latest Precambrian.
America, and Siberia, respectively; the motion of Africa is representative of the supercontinent of Gondwana which was intact for the first 400+ m.y. of the Paleozoic Era. Over the Phanerozoic plate, speeds show considerable variation, with Gondwana oscillating from 20 to 60 km/m.y. over a long times- cale, 200-400 m.y. There is considerable noise superposed on the longtime scale oscillations. Over the Paleozoic Era, motions for large continental regions average 28 km/m.y.; force balance models based on present-day observations suggest that continen- tal regions without a large attached slab would move 30 mm/yr [Stefanick and Jurdy, 1992]. India exhibits the most extreme
lOO North America . +
I I
8O
6O
4O
2O
0 200 400
Time (Ma) 600
Figure 6. Motion of North America with respect to coordinate system for reconstructions over Phanerozoic and latest Precam- brian.
lOO Siberia
I I
8O
6O
4O
0 200 400 600
time (Me) Figure 7. Motion of Siberia with respect to coordinate system for reconstructions over Phanerozoic and latest Precambrian.
speeds, in excess of 100 km/m.y.' these occur in the last 100 m.y. and are fully documented by magnetic anomalies, unlike speeds inferred at earlier times.
Opening and Closing of Laurentia/Gondwana Sea
In the early Paleozoic an ocean opened and then closed between Laurentia and the large continental block of Gondwana. (The reconstructions are shown starting at 560 Ma in 40 m.y. intervals in Figures l a-le.) At 600 Ma, Laurentia and Gondwana were initially together at about 60øS, each with a subduction zone on the outer perimeter of Gondwana that per- sisted through the entire 600-400 Ma interval of opening and subsequent closing. An ocean began to open at about 600 Ma, separating the two regions, and continued to about 520 Ma when its widest extent was nearly 6000 km. Laurentia traveled north to about 15øS and Gondwana's latitude remained about
the same. Spreading ceased, and a subduction began on the eastern side of South America, reuniting the regions. By 400 Ma the ocean closed, bringing Laurentia and Gondwana together at approximately the same latitude they started but in a slightly different configuration. Although no ocean floor remains to document the rates, we attempt to model the changing width of the ocean using force models that have been developed for the present and the location of inferred plate boundaries.
Force Balance Model
We model the breakup and reunion of Laurentia and Gondwana using ridge push, slab pull, and trench suction as active forces and a uniform drag as a resistive response. A sim- ple dynamical model for oceanic plates [Carlson et aL, 1983] used present-day data to determine the relative magnitudes of ridge-push and slab-pull and we have estimated the magnitude of trench suction. We regard these forces as a form of surface convection, and we consider these as sufficient to describe plate motion. Mantle convection is neither required or available as input. Lithosphere is created at a ridge then flows down hill, thickening as it goes, and then descends into the upper mantle
17,972 JURDY ET AL.' PALEOZOIC PLATE DYNAMICS
and is destroyed. The analogy of a river ending in a water fall seems reasonable if the material were sticky.
We have a force balance between plate drag (speed times length) versus ridge push (age), slab pull (slab length times thickness) and trench suction (relative speed times slab length). This last force is essentially due to an eddy behind the slab [Stefanick and Jurdy, 1992]. Lengths (x), ages (t), and speeds (v) are obviously related by length being the product of speed and age (strictly speaking this is true for only steady motion), and finally, thicknesses and depths vary as the square roots of ages [Harper, 1989].
In more detail, consider the slab pull force which should be proportional to slab length x• times slab thickness hi. The thickness as we move up from the base of the slab should increase as the square root of the age:
hi = 2Cltl 1/2 = 2Cl(Xl/V1) 1/2,
where t• is the time until disappearance, x 1 is the distance from the base, v• is the slab's subduction rate, and the factor 2 is because the layer has two sides. Here c• is a constant of pro- portionality which has the dimensions of a square root of diffusion.
Then
X 1 = Vlh• 4Cl 2 ß
The thickness hi at the top of the slab should be approximately the plate thickness h which is proportional to the square root of age at the trench, and the subduction speed should be about the plate speed v. Then h = ct 1/2, where c is the constant of pro- portionality analogous to c•, above, and
vh 2 c2vt c2x
x• = 4c12 = 4c• = 4Cl 2'
where x is the plate length. If c• = c, then the slab length should be 25% of the plate length while if c• > c (i.e. the slab decays more rapidly than the plate grows, which seems reason- able due to two-sided heating), then the constant of propor- tionality should be even smaller. Molnar et al. [1979] show a scatter diagram relating slab length to the product of speed and age which suggests a constant of proportionality of 12-15%.
In the same way the slab pull should be proportional to slab length times slab thickness:
c 2 c_•_ 2 xlhl = xlh = 4c12 xh = 4c• vt' ct 1/2 (4)
The frictional resistance is chosen to be proportional to the speed times plate length.
vx = vvt = v2t. (5)
Finally, the ridge-push force is proportional to age. To see this, recall that the plate thickness, as well as its depth, increase in proportion to the square root of age:
Z = c2t 1/2 h = ct 1/2.
Then the ridge push force is proportional to the integral over the plate
x 0 x 0 t o
Ih d•z dx= Ictl/2dz= Ict•/2c2dt v2 dx
t o
- I cc2 cc2 dt = to. - 2 -•-
(6)
Putting this together, we have the force balance between drag (5), as a passive, resistive force, with the active forces of slab- pull (4) and ridge-push (6)'
Dv2t = Svt 3/2 + Rt, (7)
where v is the speed of the plate, t is the age at subduction, and D,S,R are constants of proportionality. The left side of (7) is the balancing drag and is a product of speed and length; the right side is the sum of ridge push (Rt) and slab pull. Ridge push is simply a function of age. Slab pull is proportional to the product of t v2 (i.e., thickness) and length of the slab which is in turn proportional to the product of plate speed and age. This slab-pull dependence is probably the weakest part of the argument and the slab length is based on earthquake depths [Molnar et al., 1979]. It is dimensionally correct, so we use it.
It was the genius of Carlson et al., [1983] to use similar heuristic arguments and to fit the constants S and R (with D=I) using data at 20 trenches. In their arguments, they divided through by the common age factor and with this fit slab pull dwarfed ridge push and, in fact, the constant R could be zero within the error bars. We repeated the fit with the age factor retained and so obtained a value for R 40 to 50 times larger [Jurdy and Stefanick, 1988]. The original model [Carlson et al., 1983] only refers to an oceanic plate where the slab pull force is derived from a halfspace model for the cooling of the lithosphere. Modeling flow behind a slab, we estimated [Jurdy and Stefanick, 1983] trench suction as proportional to the slab length times the relative velocity of the two plates. The exact constant of proportionality is difficult to determine since it depends on the slab length which is parameterized in terms of the subducting ocean plate's speed and size.
Results of Models
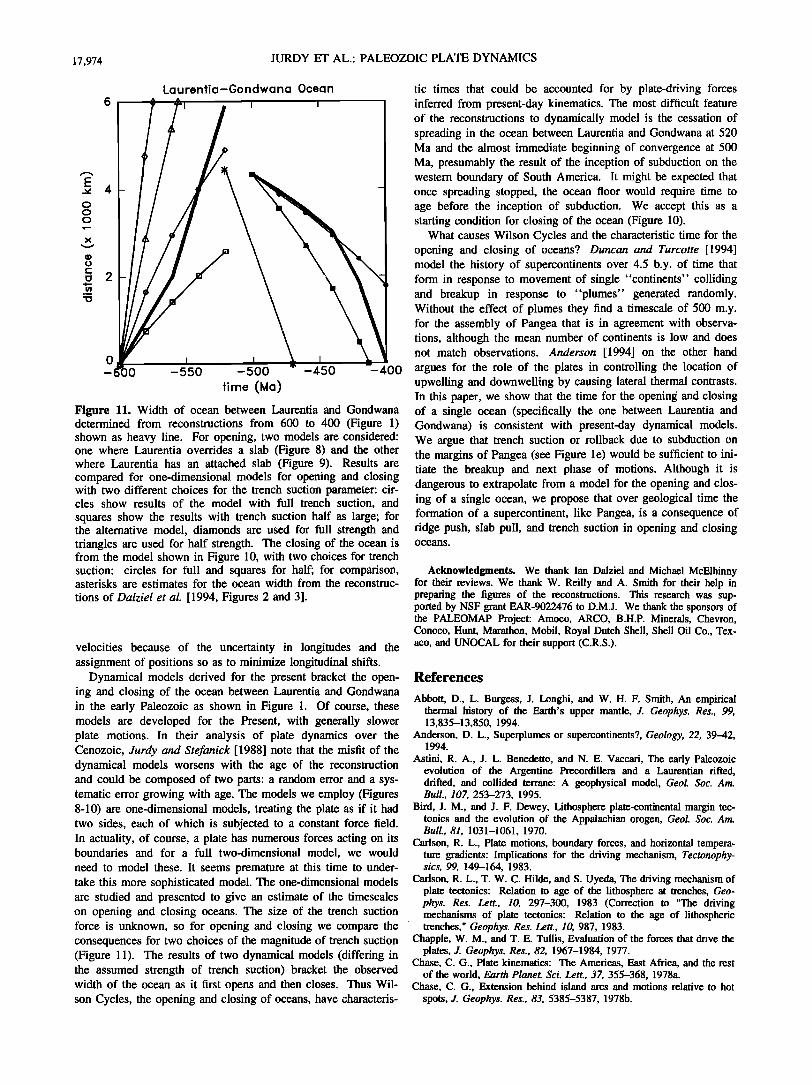
The results for a one-dimensional model for the opening of the ocean between Laurentia and Gondwana are show in Figure 8. The assumed active forces are ridge push in the opening ocean and trench suction on the opposing, outlying margins of both continents; the trench suction acts in the same direction as
ridge push and accelerates the opening. The model requires 106 m.y. for the generation of an ocean 5895 km wide; in these reconstructions this ocean opens in 80 m.y. from the inception of spreading at 600 Ma. The model shown is for trench suction with a constant of proportionality of one; reducing the magni- tude of the trench suction force by half would require 241 m.y. for same size ocean to open. An alternative model for the open- ing of the ocean is instructive. In this model shown in Figure 9 there is a slab attached to Laurentia which goes under Gondwana. This results in a very much faster opening, only 37 m.y. for full trench suction (still acting on Gondwana on the overriding slab) and 45 m.y. for the reduced trench suction. A single huge expanse of ocean assumed for the model, with age increasing across it, is the simplest, though unlikely scenario. We can never know the age distribution for an extinct ocean and must make some assumption.
JURDY ET AL.: PALEOZOIC PLATE DYNAMICS 17,973
40
,• 30
•,x 20
:8 10
One-Dimensional Model for Ocean Opening I I I ....
-
i I i 0 5o lOO 150
time (m.y.) 200
Figure 8. Results of a one-dimensional model for the opening of the ocean between Laurentia and Gondwana. Forces acting are shown with arrows. Hatchured areas represent continental regions; open areas correspond to oceanic plates. For this model the active margin of Laurentia overrides a subducting ocean slab. TS, trench suction; RP, ridge push.
One-Dimensional Model for Ocean Closing
•, 30 - o o
•,x 20 -
:8 10 -
0 50 100 150 200
time (m.y.)
Figure 10. Results of a one-dimensional model for the closing of the ocean between Laurentia and Gondwana, initially of width 4340 km. Forces acting are shown with arrows. SP, slab pull; TS, trench suction.
The results for a one-dimensional model for closing of the ocean between Laurentia and Gondwana are shown in Figure 10. Slab pull and trench suction (caused by rollback) are the active forces; trench suction slows the rate of convergence. With the trench suction constant of proportionality as one, a time of 144 m.y. is needed to close an ocean of 4340 km. (This ocean
One-Dimensional Model for Ocean Opening 40 • • •
•, 30
,•x 20
:8 10
I I I 0 50 100 150 200
,imo (m.v.)
Figure 9. Results of a one-dimensional model for the opening of the ocean between Laurentia and Gondwana. Forces acting are shown with arrows. For this model the active boundary of Laurentia is attached to a subducting slab, going beneath Gondwana. SP, slab pull; TS, trench suction; RP, ridge push.
has a smaller width than the case for opening because Lauren- tia and Gondwana converge to a different configuration than they started.) Reducing trench suction force by half, the time for closing is reduced to 87 m.y. In Figure 11 the ocean widths from the reconstructions (Figures l a-le) are compared with the results of the models for opening and closing for two choices of the magnitude of the trench suction force, shown in Figures 8- 10. In the reconstructions the ocean between Laurentia and
Gondwana begins to open at 600 Ma, reaching its maximum width of 5895 km at 520 Ma; at 500 Ma an ocean of width
4340 km begins to close, resulting in continental collision at 400 Ma. The 20-m.y. intervals of reconstructions do not allow us to assess the time any more closely. We note that the dynamical models for opening and closing bracket the recon- structions.
Discussion
The motions for all continental blocks analyzed (Figures 2-7) show long-period cycles over the Phanerozoic, with periods of about 200 m.y. For most regions the largest excursion with respect to the coordinate system is at about 400 Ma, with another at about 200 Ma. India is the exception to this, with its largest motion more recently, at about 60 Ma, exceeding !00 km/m.y. This has been documented by the studies of Cenozoic plate motions [Jurdy and Gordon; 1984; Gordon and Jurdy, 1986] as about 130 mm/yr in the Paleocene interval, 64-56 Ma, declining to half this amount by the most recent interval, 10 Ma to 0. The magnitudes of absolute motions (Figures 2-7) over the last 60 m.y. are similar to, but not identical with, the deter- minations made in Cenozoic studies. The method of
computation here differs from the Cenozoic studies which com- puted rms velocities over the entire plate area, which would be smoother than those calculated for a representative point. For earlier times our estimates presented in this paper are minimum
17,974 JURDY ET AL.: PALEOZOIC PLATE DYNAMICS
Laurenfia-Gondwana Ocean J• ^ ^1 I I
• 4
g 2
0 _ Foo 550 500 450 o
time (Ma)
Figure 11. Width of ocean between Laurentia and Oondwana determined from reconstructions from 600 to 400 (Figure 1) shown as heavy line. For opening, two models are considered: one where Laurentia overrides a slab (Figure 8) and the other where Laurentia has an attached slab (Figure 9). Results are compared for one-dimensional models for opening and closing with two different choices for the trench suction parameter: cir- cles show results of the model with full trench suction, and
squares show the results with trench suction half as large; for the alternative model, diamonds are used for full strength and triangles are used for half strength. The closing of the ocean is from the model shown in Figure 10, with two choices for trench suction: circles for full and squares for half; for comparison, asterisks are estimates for the ocean width from the reconstruc-
tions of Dalziel et al. [ 1994, Figures 2 and 3].
velocities because of the uncertainty in longitudes and the assignment of positions so as to minimize longitudinal shifts.
Dynamical models derived for the present bracket the open- ing and closing of the ocean between Laurentia and Gondwana in the early Paleozoic as shown in Figure 1. Of course, these models are developed for the Present, with generally slower plate motions. In their analysis of plate dynamics over the Cenozoic, Jurdy and Stefanick [1988] note that the misfit of the dynamical models worsens with the age of the reconstruction and could be composed of two parts: a random error and a sys- tematic error growing with age. The models we employ (Figures 8-10) are one-dimensional models, treating the plate as if it had two sides, each of which is subjected to a constant force field. In actuality, of course, a plate has numerous forces acting on its boundaries and for a full two-dimensional model, we would
need to model these. It seems premature at this time to under- take this more sophisticated model. The one-dimensional models are studied and presented to give an estimate of the timescales on opening and closing oceans. The size of the trench suction force is unknown, so for opening and closing we compare the consequences for two choices of the magnitude of trench suction (Figure 11). The results of two dynamical models (differing in the assumed strength of trench suction) bracket the observed width of the ocean as it first opens and then closes. Thus Wil- son Cycles, the opening and closing of oceans, have characteris-
tic times that could be accounted for by plate-driving forces inferred from present-day kinematics. The most difficult feature of the reconstructions to dynamically model is the cessation of spreading in the ocean between Laurentia and Gondwana at 520 Ma and the almost immediate beginning of convergence at 500 Ma, presumably the result of the inception of subduction on the western boundary of South America. It might be expected that once spreading stopped, the ocean floor would require time to age before the inception of subduction. We accept this as a starting condition for closing of the ocean (Figure 10).
What causes Wilson Cycles and the characteristic time for the opening and closing of oceans? Duncan and Turcotte [1994] model the history of supercontinents over 4.5 b.y. of time that form in response to movement of single "continents" colliding and breakup in response to "plumes" generated randomly. Without the effect of plumes they find a timescale of 500 m.y. for the assembly of Pangea that is in agreement with observa- tions, although the mean number of continents is low and does not match observations. Anderson [1994] on the other hand argues for the role of the plates in controlling the location of upwelling and downwelling by causing lateral thermal contrasts. In this paper, we show that the time for the opening and closing of a single ocean (specifically the one between Laurentia and Gondwana) is consistent with present-day dynamical models. We argue that trench suction or rollback due to subduction on the margins of Pangea (see Figure l e) would be sufficient to ini- tiate the breakup and next phase of motions. Although it is dangerous to extrapolate from a model for the opening and clos- ing of a single ocean, we propose that over geological time the formation of a supercontinent, like Pangea, is a consequence of ridge push, slab pull, and trench suction in opening and closing oceans.
Acknowledgments. We thank Ian Dalziel and Michael McElhinny for their reviews. We thank W. Reilly and A. Smith for their help in preparing the figures of the reconstructions. This research was sup- ported by NSF grant EAR-9022476 to D.M.J. We thank the sponsors of the PALEOMAP Project: Amoco, ARCO, B.H.P. Minerals, Chevron, Conoco, Hunt, Marathon, Mobil, Royal Dutch Shell, Shell Oil Co., Tex- aco, and UNOCAL for their support (C.R.S.).
References
Abbott, D., L. Burgess, J. Longhi, and W. H. F. Smith, An empirical thermal history of the Earth's upper mantle, J. Geephys. Res., 99, 13,835-13,850, 1994.
Anderson, D. L., Superplumes or supercontinents?, Geology, 22, 39-42, 1994.
Astini, R. A., J. L. Benedetto, and N. E. Vaccari, The early Paleozoic evolution of the Argentine Precordillera and a Laurentian rifted, drifted, and collided terrane: A geophysical model, Geol. Soc. Am. Bull., 107, 253-273, 1995.
Bird, J. M., and J. F. Dewey, Lithosphere plate-continental margin tec- tonics and the evolution of the Appalachian orogen, Geol. Soc. Am. Bull., 81, 1031-1061, 1970.
Carlson, R. L., Plate motions, boundary forces, and horizontal tempera- ture gradients: Implications for the driving mechanism, Tectonophy- sics, 99, 149-164, 1983.
Carlson, R. L., T. W. C. Hilde, and S. Uyeda, The driving mechanism of plate tectonics: Relation to age of the lithosphere at trenches, Geo- phys. Res. Lett., 10, 297-300, 1983 (Correction to "The driving mechanisms of plate tectonics: Relation to the age of lithospheric trenches," Geophys. Res. Lett., 10, 987, 1983.
Chapple, W. M., and T. E. Tullis, Evaluation of the forces that drive the plates, J. Geophys. Res., 82, 1967-1984, 1977.
Chase, C. G., Plate kinematics: The Americas, East Africa, and the rest of the world, Earth Planet. Sci. Lett., 37, 355-368, 1978a.
Chase, C. G., Extension behind island arcs and motions relative to hot spots, J. Geophys. Res., 83, 5385-5387, 1978b.
JURDY ET AL.: PALEOZOIC PLATE DYNAMICS 17,975
Dalziel, I. W. D., Pacific margins of Laurentia and East Antarctica- Australia as a conjugate rift pair: Evidence and implications for and Eocambrian supercontinent, Geology, 19, 598-601, 1991.
Dalziel, I. W. D., On the organization of American plates in the neopro- terozoic and the breakout of Laurentia, GSA Today, 2, 273-241, 1992.
Dalziel, I. W. D., L. H. Dalla Salda, and L. M. Gahagan, Paleozoic Laurentia-Gondwana Interaction and the Origin of the Appalachian- Andean Mountain System, Geol. Soc. Am. Bull., 106, 243-252, 1994.
Davies, G. F., On the emergence of plate tectonics, Geology, 20, 963-966, 1992.
DeMets, C., R. G. Gordon, D. F. Argus, and S. Stein, Current plate motions, Geophys. J. lnt., 101, 425-478, 1990.
Duncan, C. C., and D. L. Turcotte, On the breakup and coalescence of continents, Geology, 22, 103-106, 1994.
Forsyth, D. W., and S. Uyeda, On the relative importance of the driving forces of plate motion, Geophys. J. R. Astron. Soc., 43, 163-200, 1975.
Gordon, R. G., and D. M. Jurdy, Cenozoic global plate motions, J. Geo- phys. Res., 91, 12,389-12,406, 1986.
Harper, J. F., Forces driving plate tectonics: The use of simple dynami- cal models, Rev. in Aquat. Sci., 1, 319-336, 1989.
Hoffman, P. F., Did the breakout of Laurentia turn Gondwanaland inside out?, Science, 252, 1409-1412, 1991.
Jurdy, D. M., and R. G. Gordon, Global plate motions relative to the hot spots 64 to 56 Ma, J. Geophys. Res., 89, 9927-9936, 1984.
Jurdy, D. M., and M. Stefanick Flow models for back-arc spreading, Tectonophysics, 99, 191-206, 1983.
Jurdy, D. M., and M. Stefanick, Errors in plate rotations as described by covariance matrices and their combination in reconstructions, J. Geo- phys. Res., 92, 6,310-6,318, 1987.
Jurdy, D. M., and M. Stefanick, Plate driving forces over the Cenozoic era, J. Geophys. Res., 93, 11,833-11,844, 1988.
McKerrow, W. S., and L. R. M. Cocks, Oceans, island arcs, and olistos- tromes: The use of fossils in distinguishing sutures, terranes, and environments around the Iapetus Ocean, J. Geol. Soc. London., 143, 185-191, 1986.
McKerrow, W. S., J. F. Dewey, and C. R. Scotese, The Ordovician and Silurian development of the Iapetus Ocean, Spec. Pap. Palaeontol., 44, pp. 165-178, Palaeontol. Soc., London, 1991.
Minster, J. B., and T. H. Jordan, Present-day plate motions, J. Geophys. Res., 83, 5331-5354, 1978.
Minster, J. B., T. H. Jordan, P. Molnar, and E. Haines, Numerical modeling of instantaneous plate tectonics, Geophys. J. R. Astron. Soc., 36, 541-576, 1974.
Molnar, P., D. Freedman, and J. S. F. Shih, Lengths of intermediate and deep seismic zones and temperatures in downgoing slabs of litho- sphere, Geophys. J. R. Astron. Soc., 56, 41-54, 1979.
Moores, E. M., Southwest U.S.-East Antarctica (SWEAT) connection: A hypothesis, Geology, 19, 425-428, 1991.
Scotese, C. R., and W. S. McKerrow, Revised world maps and introduc- tion, edited by W. S. McKerrow and C. R. Scotese, in Palaeozoic Palaeogeography and Biogeography, Geol. Soc. London Mern., 12, 1-21, 1990.
Solomon, S.C., N.H. Sleep, and R. M. Richardson, On the forces driv- ing plate tectonics: Inferences from absolute plate velocities and intra- plate stress, Geophys. J. R. Astron. Soc., 42, 769-801, 1975.
Stefanick, M., and D. M. Jurdy, Stress observations and driving force models for the South American plate, J. Geophys. Res., 97, 11,905-11,913, 1992.
Torsvik, T. H., O. Olesen, P. D. Ryan, and A. Trench, On the paleo- geography of Baltica during the Paleozoic: New paleomagnetic data from the Scandinavian Caledonides, Geophys. lnt., 103, 261-279, 1990.
Van der Voo, R., Paleomagnetism of the Atlantic, Tethyes, and lapetus Oceans, 411 pp., Cambridge University Press, New York, 1993.
D. M. Jurdy and M. Stefanick, Department of Geological Sciences, Northwestern University, Evanston, IL 60208-2150 (e-mail: donna@ earth.nwu.edu)
C. R. Scotese, Department of Geology, University of Texas at Arling- ton, Arlington, TX 76019-0049.
(Received November 3, 1994; revised April 5, 1995; accepted May 9, 1995,)