Oxford Police Department Year-End Review 2017
34
THIS REPORT WAS PREPARED BY END2END PUBLIC SAFETY, THE CAD/RMS PROVIDER FOR THE CITY OF OXFORD POLICE DEPARTMENT 1 Oxford Police Department Year-End Review 2017 City of Oxford
-
Upload
khangminh22 -
Category
Documents
-
view
0 -
download
0
Transcript of Oxford Police Department Year-End Review 2017

THIS REPORT WAS PREPARED BY END2END PUBLIC SAFETY, THE CAD/RMS PROVIDER FOR THE CITY OF OXFORD POLICE DEPARTMENT
1
Oxford Police Department Year-End Review
2017
City of Oxford

THIS REPORT WAS PREPARED BY END2END PUBLIC SAFETY, THE CAD/RMS PROVIDER FOR THE CITY OF OXFORD POLICE DEPARTMENT
2
MAYOR Robyn Tannehill
BOARD OF ALDERMAN Rick Addy – Ward I Mark Huelse – Ward II Janice Antonow – Ward III Ulysses “Coach” Howell – Ward IV Preston E. Taylor – Ward V Jason Bailey – Ward VI John Morgan – Alderman At-Large

THIS REPORT WAS PREPARED BY END2END PUBLIC SAFETY, THE CAD/RMS PROVIDER FOR THE CITY OF OXFORD POLICE DEPARTMENT
3
Table of Contents Calls by Type of Origination ..................................................................................................................... 4
Call Volume per Year ................................................................................................................................ 7
Recent Call Volume Increases from Incoming 911 Transfers ................................................................... 8
Days with Highest Call Volume ................................................................................................................. 9
After-Midnight Call Volume ................................................................................................................... 10
After-Midnight Call Volume: Officer-Initiated Calls .............................................................................. 11
Noise/Party Complaints by Year ............................................................................................................ 12
Case Reports Issued ............................................................................................................................... 13
FBI UCR Part 1 Crimes ................................................................................ Error! Bookmark not defined.
Larceny-Theft statistics out of UCR Part 1 Crime Reporting .................................................................. 16
Larceny-Theft Offense Occurrences by Month ...................................................................................... 17
Burglary Crimes by Day of the Week ...................................................................................................... 19
Investigated Incidents – Year 2016 ........................................................................................................ 20
Alcohol Violations .................................................................................................................................. 21
Drug Violations ....................................................................................................................................... 22
Drug Arrest Demographics ..................................................................................................................... 23
Arrest Charges Involving Students ......................................................................................................... 25
Traffic Accidents ..................................................................................................................................... 26
Top 5 Business Parking Lots for Traffic Accidents ...................................... Error! Bookmark not defined.
Top 5 Streets for Traffic Accidents ............................................................. Error! Bookmark not defined.
Traffic Citations Issued ........................................................................................................................... 27
Top 5 Traffic Violations .......................................................................................................................... 30

THIS REPORT WAS PREPARED BY END2END PUBLIC SAFETY, THE CAD/RMS PROVIDER FOR THE CITY OF OXFORD POLICE DEPARTMENT
4
Calls by Type of Origination
During the Year 2017, the department received 51,151 total calls. The department categorized each call based on the nature in which the call originated (commonly referred to as Received Via):
• E911 Dispatch • Phone • Radio • Walk In
E911 Dispatch refers to calls received through an incoming call-transfer from Lafayette County 911. Phone refers to calls received through the non-emergency phone numbers for OPD. Radio refers to calls received from Officers as they observe events in the field. Walk In refers to calls received from citizens coming into the OPD facilities to speak with Officers regarding a yet-to-be-reported event. During the Year 2017, the breakdown of calls per how each was received, is as follows:
E911 Dispatch 2847 Phone 15768 Radio 31609 Walk In 927 During the Year 2017, the department managed 31,609 calls which were Officer Initiated (meaning the call was received via Radio from an Officer in the field), or 61.80% of the total number of calls received by the department for the Year 2017. The following data represents call volume by origination type from Year 2013 through Year 2017:
Received Via Year 2013 Year 2014 Year 2015 Year 2016 Year 2017 Grand Total E911 Disp 727 1239 2503 2954 2847 10270 Phone 17907 18262 15842 16866 15768 84645 Radio 12572 20293 28809 36774 31609 130057 Walk In 386 565 1089 1114 927 4081 Grand Total 31592 40359 48243 57708 51151 229053

THIS REPORT WAS PREPARED BY END2END PUBLIC SAFETY, THE CAD/RMS PROVIDER FOR THE CITY OF OXFORD POLICE DEPARTMENT
5
The following chart depicts year-to-year comparisons for each type of call origination as received from Year 2013 through Year 2017:
386
12572
17907
727
565
20293
18262
1239
1089
28809
15842
2503
1114
36774
16866
2954
927
31609
15768
2847
0 5000 10000 15000 20000 25000 30000 35000 40000
Walk In
Radio
Phone
E911 Disp
Number of Calls
Rece
ived
Via
Received Via Comparison across Year 2013 to Year 2017
Year 2017 Year 2016 Year 2015 Year 2014 Year 2013

THIS REPORT WAS PREPARED BY END2END PUBLIC SAFETY, THE CAD/RMS PROVIDER FOR THE CITY OF OXFORD POLICE DEPARTMENT
6
Calls that are received via Radio are known as Officer-Initiated calls. All other methods by which a call is received are known as Citizen-Initiated calls. The following chart provides a year-to-year comparison of Officer-Initiated vs. Citizen-Initiated call volume for Year 2013 through Year 2017:
12566
20286
28795
36749
31609
1902620073 19448
2095919542
0
5000
10000
15000
20000
25000
30000
35000
40000
Year 2013 Year 2014 Year 2015 Year 2016 Year 2017
Officer-Initiated vs. Citizen-Initiated for Year 2013 to Year 2017
Officer-Initiated Citizen-Initiated

THIS REPORT WAS PREPARED BY END2END PUBLIC SAFETY, THE CAD/RMS PROVIDER FOR THE CITY OF OXFORD POLICE DEPARTMENT
7
Call Volume per Year
In the Year 2014, the department experienced a 27.75% increase in total call volume from the previous year. In the Year 2016, the department experienced a 19.62% increase in total call volume from the previous year. The following chart displays the rising total call volume from 2013 through 2016, with a decrease of 11.36% in total call volume from 2016 through 2017:
31592
40359
48243
57708
51151
0
10000
20000
30000
40000
50000
60000
70000
2013 2014 2015 2016 2017
Num
ber o
f Cal
ls
Year
Total Calls per Year

THIS REPORT WAS PREPARED BY END2END PUBLIC SAFETY, THE CAD/RMS PROVIDER FOR THE CITY OF OXFORD POLICE DEPARTMENT
8
Recent Call Volume Increases from Incoming 911 Transfers
Lafayette County Sheriff Office is home to the county’s Public Safety Answering Point (PSAP), meaning any call to 911 within Lafayette County is automatically routed to Lafayette County 911 Dispatchers at the Lafayette County Sheriff Office. When calls are received at Lafayette County 911 from citizens that are currently within Oxford city limits, those calls are transferred from Lafayette County 911 to the Oxford Police Department. Calls received as transfers from Lafayette County 911 have increased four of the last five years.
0
500
1000
1500
2000
2500
3000
3500
Year 2013 Year 2014 Year 2015 Year 2016 Year 2017
Calls Originating from 911 - Year 2013 through Year 2017

THIS REPORT WAS PREPARED BY END2END PUBLIC SAFETY, THE CAD/RMS PROVIDER FOR THE CITY OF OXFORD POLICE DEPARTMENT
9
Days with Highest Call Volume
The following chart illustrated a breakdown of call volume by day of the week during Year 2017. As shown by the chart below, the department receives the largest amount of calls during Wednesday through Saturday of each week during the year.
Sunday10%
Monday13%
Tuesday13%
Wednesday16%
Thursday15%
Friday17%
Saturday16%
Percentage of Total Calls - 2017 - by Weekday
Sunday
Monday
Tuesday
Wednesday
Thursday
Friday
Saturday

THIS REPORT WAS PREPARED BY END2END PUBLIC SAFETY, THE CAD/RMS PROVIDER FOR THE CITY OF OXFORD POLICE DEPARTMENT
10
After-Midnight Call Volume
The time between 12:00 AM and 3:00 AM are sometimes the busiest for the department. The following chart provides a breakdown of call volume after midnight on week-ending nights/mornings (i.e. Thursday night, Friday night, and Saturday night).
2301
1633
866
555
O F F I C E R - I N I T I A T ED
AFTER-MIDNIGHT CALL VOLUME FOR YEAR 2017
Midnight
1AM
2AM
3AM

THIS REPORT WAS PREPARED BY END2END PUBLIC SAFETY, THE CAD/RMS PROVIDER FOR THE CITY OF OXFORD POLICE DEPARTMENT
11
After-Midnight Call Volume: Officer-Initiated Calls
The following chart illustrates the breakdown of after-midnight calls that were Officer-Initiated during the Year 2017.
2301
1633
866
555
0
500
1000
1500
2000
2500
Officer-Initiated
After-Midnight Call Volume for Year 2017
Midnight
1AM
2AM
3AM

THIS REPORT WAS PREPARED BY END2END PUBLIC SAFETY, THE CAD/RMS PROVIDER FOR THE CITY OF OXFORD POLICE DEPARTMENT
12
Noise/Party Complaints by Year
The department receives several hundred calls per year regarding noise complaints. The department received fewer noise complaints in 2013 than 2012; however, the number of occurrences began to increase again, year-to-year, from 2013 through 2016. Year 2017 saw a decline from Year 2016.
354397
630
1701
636
0
200
400
600
800
1000
1200
1400
1600
1800
Year 2013 Year 2014 Year 2015 Year 2016 Year 2017
Num
ber o
f Cal
ls
Year of Occurrence
Noise/Party Complaints by Year

THIS REPORT WAS PREPARED BY END2END PUBLIC SAFETY, THE CAD/RMS PROVIDER FOR THE CITY OF OXFORD POLICE DEPARTMENT
13
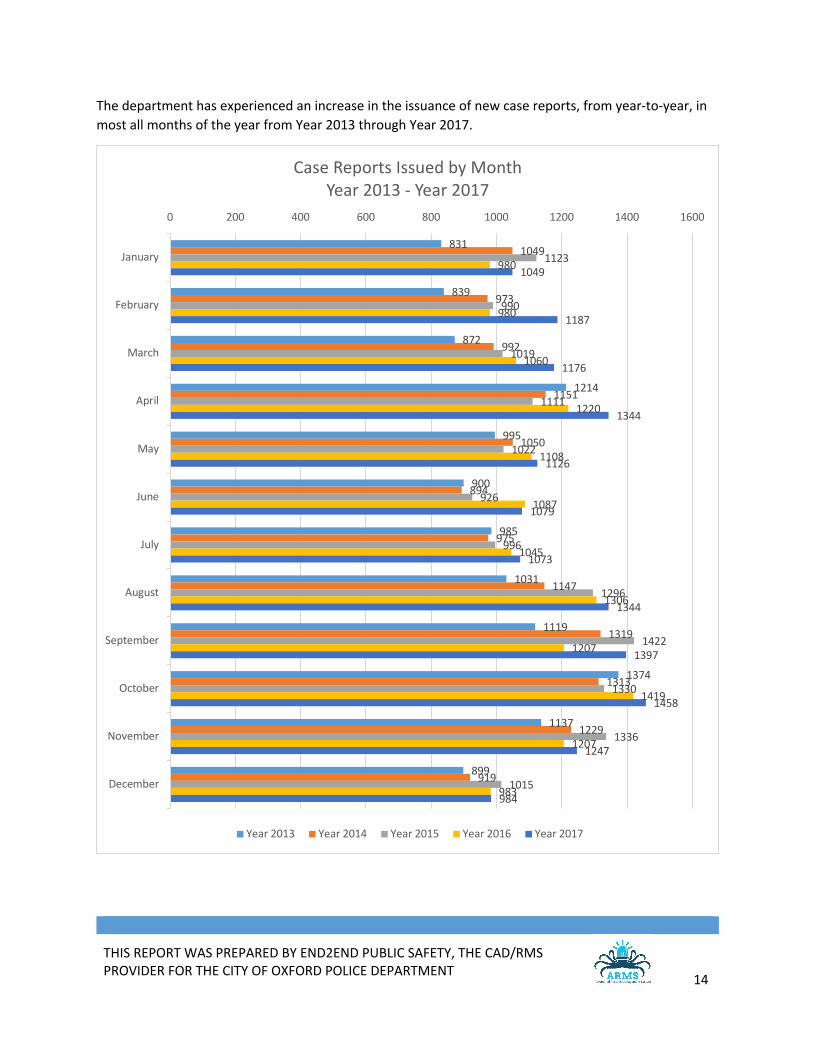
Case Reports Issued
Certain types of calls to the department result in the issuance of a case report. The department issues more than 10,000 new case reports each year. The department’s case report issuance in September 2014 was a 17.87% increase from September 2013. The department’s case report issuance in September 2015 was a 7.81% increase from September 2014. Comparing September 2017 to September 2013 shows a 24.84% increase in case reports issued. Comparing Year 2017 to Year 2013 shows an 18.60% increase in case reports issued.
Month Name Year 2013
Year 2014
Year 2015
Year 2016
Year 2017
Grand Total
January 831 1049 1123 980 1049 5032 February 839 973 990 980 1187 4969 March 872 992 1019 1060 1176 5119 April 1214 1151 1111 1220 1344 6040 May 995 1050 1022 1108 1126 5301 June 900 894 926 1087 1079 4886 July 985 975 996 1045 1073 5074 August 1031 1147 1296 1306 1344 6124 September 1119 1319 1422 1207 1397 6464 October 1374 1313 1330 1419 1458 6894 November 1137 1229 1336 1207 1247 6156 December 899 919 1015 983 984 4800 Grand Total 12196 13011 13586 13602 14464 66859
THIS REPORT WAS PREPARED BY END2END PUBLIC SAFETY, THE CAD/RMS PROVIDER FOR THE CITY OF OXFORD POLICE DEPARTMENT
14
The department has experienced an increase in the issuance of new case reports, from year-to-year, in most all months of the year from Year 2013 through Year 2017.
831
839
872
1214
995
900
985
1031
1119
1374
1137
899
1049
973
992
1151
1050
894
975
1147
1319
1313
1229
919
1123
990
1019
1111
1022
926
996
1296
1422
1330
1336
1015
980
980
1060
1220
1108
1087
1045
1306
1207
1419
1207
983
1049
1187
1176
1344
1126
1079
1073
1344
1397
1458
1247
984
0 200 400 600 800 1000 1200 1400 1600
January
February
March
April
May
June
July
August
September
October
November
December
Case Reports Issued by MonthYear 2013 - Year 2017
Year 2013 Year 2014 Year 2015 Year 2016 Year 2017

THIS REPORT WAS PREPARED BY END2END PUBLIC SAFETY, THE CAD/RMS PROVIDER FOR THE CITY OF OXFORD POLICE DEPARTMENT
15
Significant Offenses occurring Year 2013 through Year 2017
The following chart and table depicts the occurrence of significant incidents Year 2013 – Year 2017. The chart reflects crime categories typically of interest within the FBI’s Uniform Crime Reporting program.
Homicide Rape Robbery Assault Burglary Auto Theft Larceny Theft2013 1 12 14 231 98 16 7312014 1 21 19 239 89 10 5662015 2 18 11 226 83 14 7262016 2 15 19 268 106 12 5622017 1 12 12 276 86 13 604
1 12 14
231
98
16
731
121 19
239
89
10
566
218 11
226
83
14
726
2 15 19
268
106
12
562
1 12 12
276
86
13
604
0
100
200
300
400
500
600
700
800
Significant Offense OccurrencesYear 2013 - Year 2017
2013 2014 2015 2016 2017

THIS REPORT WAS PREPARED BY END2END PUBLIC SAFETY, THE CAD/RMS PROVIDER FOR THE CITY OF OXFORD POLICE DEPARTMENT
16
Larceny-Theft statistics
The following chart illustrates occurrences of Larceny-Theft offenses from 2013 through 2017, based on the day of the week of which the offense occurred:
403
475
525
464445
464
406
0
100
200
300
400
500
600
LARCENY THEFT
Larceny-Theft Offenses by Day of the WeekYear 2013 - Year 2017
Sunday
Monday
Tuesday
Wednesday
Thursday
Friday
Saturday

THIS REPORT WAS PREPARED BY END2END PUBLIC SAFETY, THE CAD/RMS PROVIDER FOR THE CITY OF OXFORD POLICE DEPARTMENT
17
Larceny-Theft Offense Occurrences by Month
The following chart depicts a summary count of Larceny-Theft offenses grouped by month of occurrence, showing the aggregate percentage for the month, from the Year 2013 through Year 2017.
January7%
February7%
March7%
April8%
May9%
June8%July
8%
August9%
September9%
October10%
November10%
December8%
Larceny Theft by MonthlyPercentage of Total Occurrences
Year 2013 - Year 2017
January
February
March
April
May
June
July
August
September
October
November
December

THIS REPORT WAS PREPARED BY END2END PUBLIC SAFETY, THE CAD/RMS PROVIDER FOR THE CITY OF OXFORD POLICE DEPARTMENT
18
The following chart shows a breakdown of the Hour of Day during which Larceny-Thefts are occurring. This chart helps the department to determine the need for citizens to make sure their home, apartment, vehicle, garage, etc. are locked to help prevent becoming the victim of theft while they are away at work, at school, etc., as those times of day experience the highest volume of larceny-theft offenses.
79 77
2431
159
31
71
136
187
236 240
206
273263
279
236
180 180
112106
7165
75
0
50
100
150
200
250
300
0 1 2 3 4 5 6 7 8 9 10 11 12 13 14 15 16 17 18 19 20 21 22 23
Num
ber o
f Offe
nces
Hour of the Day (24hr format)
Larceny Theft Offenses by Hour of DayYear 2013 - Year 2017
Total

THIS REPORT WAS PREPARED BY END2END PUBLIC SAFETY, THE CAD/RMS PROVIDER FOR THE CITY OF OXFORD POLICE DEPARTMENT
19
Burglary Crimes by Day of the Week
The department analyzes crime data regarding Burglaries to assist in efforts to determine patterns that might prove beneficial to solving burglary crimes. The following chart illustrates the days of the week and the percentage by which each produces the occurrence of a Burglary offense.
Day of Week Occurrences of Burglary: 2013 through 2017 Sunday 78 Monday 68 Tuesday 62 Wednesday 66 Thursday 52 Friday 75 Saturday 61
Sunday17%
Monday15%
Tuesday14%
Wednesday14%
Thursday11%
Friday16%
Saturday13%
Burglary Offenses by Day of the WeekYear 2013 - Year 2017
Sunday
Monday
Tuesday
Wednesday
Thursday
Friday
Saturday

THIS REPORT WAS PREPARED BY END2END PUBLIC SAFETY, THE CAD/RMS PROVIDER FOR THE CITY OF OXFORD POLICE DEPARTMENT
20
Investigated Incidents – Year 2016
The department’s Investigations division collects data about the types of incidents being investigated and if an incident is ‘cleared by arrest’, meaning an offender has been apprehended for the crime.
3 14
106
284
559
15 193 11
53 60
193
5 16
0
100
200
300
400
500
600
AggravatedAssault
AggravatedDomesticViolence
Burglary Financial Crimes Larcenies Sexual Assault Robberies
Investigationed Incidents - Year 2016
Number of Incidents Number of Arrests

THIS REPORT WAS PREPARED BY END2END PUBLIC SAFETY, THE CAD/RMS PROVIDER FOR THE CITY OF OXFORD POLICE DEPARTMENT
21
Alcohol Violations
The following chart provides summary counts of alcohol related arrest charges from the Year 2013 through the Year 2017. The arrest offenses are based on the charge(s) filed against the defendants.
168
40
20
21
394
47
17
511
323
30
29
56
730
76
20
648
6
533
13
32
367
669
65
13
1047
8
220
36
10
63
807
50
24
971
223
4
2
31
751
50
6
860
0 200 400 600 800 1000 1200
AGGRAVATED DUI
ALCOHOL POSSESSION BY MINOR
BEER,WINE PURCHASE OR POSSESSION UNDER AGEOF 21
COMSUMPTION ALCOHOL ON STREETS
CONSUMPTION OF ALCOHOL IN PUB. BUILD. PARKSETC
DUI 1ST OFFENSE
DUI 2ND OFFENSE
DUI 3RD OFFENSE
PUBLIC DRUNK
Alcohol Arrest Offenses by Year2013 - 2017
2017
2016
2015
2014
2013

THIS REPORT WAS PREPARED BY END2END PUBLIC SAFETY, THE CAD/RMS PROVIDER FOR THE CITY OF OXFORD POLICE DEPARTMENT
22
Drug Violations
The department categorizes all drug related arrest charges under Narcotics. The numbers shown below reflect the counts of drug related offenses charged against defendants arrested by OPD. These numbers do not include arrest charges brought forth by the Metro Narcotics Unit.
406
735
11071228
1106
0
200
400
600
800
1000
1200
1400
NARCOTICS
Narcotics Violations - All Violation Types2013 - 2017
2013
2014
2015
2016
2017
Sunday13%
Monday9%
Tuesday14%
Wednesday13%
Thursday14%
Friday17%
Saturday20%
Arrests for Narcotic Violations by Day of the Week2013 - 2017
Sunday
Monday
Tuesday
Wednesday
Thursday
Friday
Saturday

THIS REPORT WAS PREPARED BY END2END PUBLIC SAFETY, THE CAD/RMS PROVIDER FOR THE CITY OF OXFORD POLICE DEPARTMENT
23
Drug Arrest Demographics
The department has experienced significantly more drug-related arrests against Male defendants than against Female defendants. The following chart displays a comparison of Males arrests for one, or multiple, drug related offenses. The chart gives one count for one person arrested for a drug related offense. The chart does not count the person arrested based on the number of charges against that person. For example, if a male is arrested for 3 drug offenses, the chart counts him once.
53
231
97
298
79
423
105
485
121
479
0
100
200
300
400
500
600
FEMALE MALE FEMALE MALE FEMALE MALE FEMALE MALE FEMALE MALE
2013 2014 2015 2016 2017
Narcotic Arrests by Gender2013 - 2017
Total

THIS REPORT WAS PREPARED BY END2END PUBLIC SAFETY, THE CAD/RMS PROVIDER FOR THE CITY OF OXFORD POLICE DEPARTMENT
24
Much of drug related arrest charges were brought forth against defendants that were either White Male or Black Male; the number of charges against Asian, American Indian, or Pacific Islanders were very small. The following chart displays the number of drug related arrest charges, grouped by Gender and Race, where the defendant was either White or Black.
16
37
7
94
1
129
2
26
69
4
124
1
169
1
14
1
63
5
161
4
253
32
73
4
192
8
281
1
32
88
5
186
3
285
0 50 100 150 200 250 300
AMERICAN INDIAN
ASIAN
BLACK
UNKNOWN
WHITE
ASIAN
BLACK
UNKNOWN
WHITE
FEM
ALE
MAL
E
Narcotic Arrests by Gender and Race2013 - 2017
2017
2016
2015
2014
2013

THIS REPORT WAS PREPARED BY END2END PUBLIC SAFETY, THE CAD/RMS PROVIDER FOR THE CITY OF OXFORD POLICE DEPARTMENT
25
Arrest Charges Involving Students
The following chart displays Arrest Charge based on the type of person arrested, which is referred to as Name Type. The chart shows the breakdown of arrests involving UM Students, Residents of the City of Oxford, Residents of Lafayette County, and all others.
926
1300
832
1037
85
1501
2299
1121
1909
117
2037
2416
1398
2679
142
22922414
1579
1767
121
2047
2457
1325
1852
69
0
500
1000
1500
2000
2500
3000
Non-Resident Resident of City Resident of County UM Student UNKNOWN
Arrest Charges by Residency Type2013 - 2017
2013
2014
2015
2016
2017

THIS REPORT WAS PREPARED BY END2END PUBLIC SAFETY, THE CAD/RMS PROVIDER FOR THE CITY OF OXFORD POLICE DEPARTMENT
26
Traffic Accidents
The department has experienced increases of Traffic Accident reporting each year 2013 through 2017. Traffic Accident calls increased:
• 15.51% from 2013 to 2014 • 9.26% from 2014 to 2015 • 6.32% from 2015 to 2016 • -1.47% from 2016 to 2017
Year Traffic Accidents Percent Change Year 2013 1618 Year 2014 1869 15.51% Year 2015 2042 9.26% Year 2016 2171 6.32% Year 2017 2139 -1.47%
1618
1869
20422171 2139
0
500
1000
1500
2000
2500
Year 2013 Year 2014 Year 2015 Year 2016 Year 2017
Traffic Accidents

THIS REPORT WAS PREPARED BY END2END PUBLIC SAFETY, THE CAD/RMS PROVIDER FOR THE CITY OF OXFORD POLICE DEPARTMENT
27
Traffic Citations Issued
The department experienced significant increase in moving and criminal citations issued in 2014, 2016, and 2017.
For the Year 2017, the department issued 10,139 Verbal Traffic Warnings as the result of vehicle stops. The graph above reflects 12,949 written citations, which do not include the 10,139 verbal warnings.
6478
100419735
11478
12949
0
2000
4000
6000
8000
10000
12000
14000
Year 2013 Year 2014 Year 2015 Year 2016 Year 2017
Citations Issued by Year

THIS REPORT WAS PREPARED BY END2END PUBLIC SAFETY, THE CAD/RMS PROVIDER FOR THE CITY OF OXFORD POLICE DEPARTMENT
28
During the Year 2017, the citations issued by the department reflect the following breakdown by race of defendant, as shown in the table and pie chart below.
RACE OF DEFENDANT COUNT AMERICAN INDIAN 10 ASIAN 290 BLACK 4361 PACIFIC ISLANDER 1 UNKNOWN 340 WHITE 7847
**NOTE: Race and Sex are not collected from traffic stops resulting in a Verbal Warning.
AMERICAN INDIAN0% ASIAN
2%
BLACK34%
PACIFIC ISLANDER0%
UNKNOWN3%
WHITE61%
Citations by RaceYear 2017
AMERICAN INDIAN
ASIAN
BLACK
PACIFIC ISLANDER
UNKNOWN
WHITE

THIS REPORT WAS PREPARED BY END2END PUBLIC SAFETY, THE CAD/RMS PROVIDER FOR THE CITY OF OXFORD POLICE DEPARTMENT
29
During the Year 2017, the citations issued by the department reflect the following breakdown by sex of defendant, as shown in the pie chart below.
**NOTE: Race and Sex are not collected from traffic stops resulting in a Verbal Warning.
FEMALE35%
MALE65%
Percentage of Citations by GenderYear 2017
FEMALE
MALE
THIS REPORT WAS PREPARED BY END2END PUBLIC SAFETY, THE CAD/RMS PROVIDER FOR THE CITY OF OXFORD POLICE DEPARTMENT
30
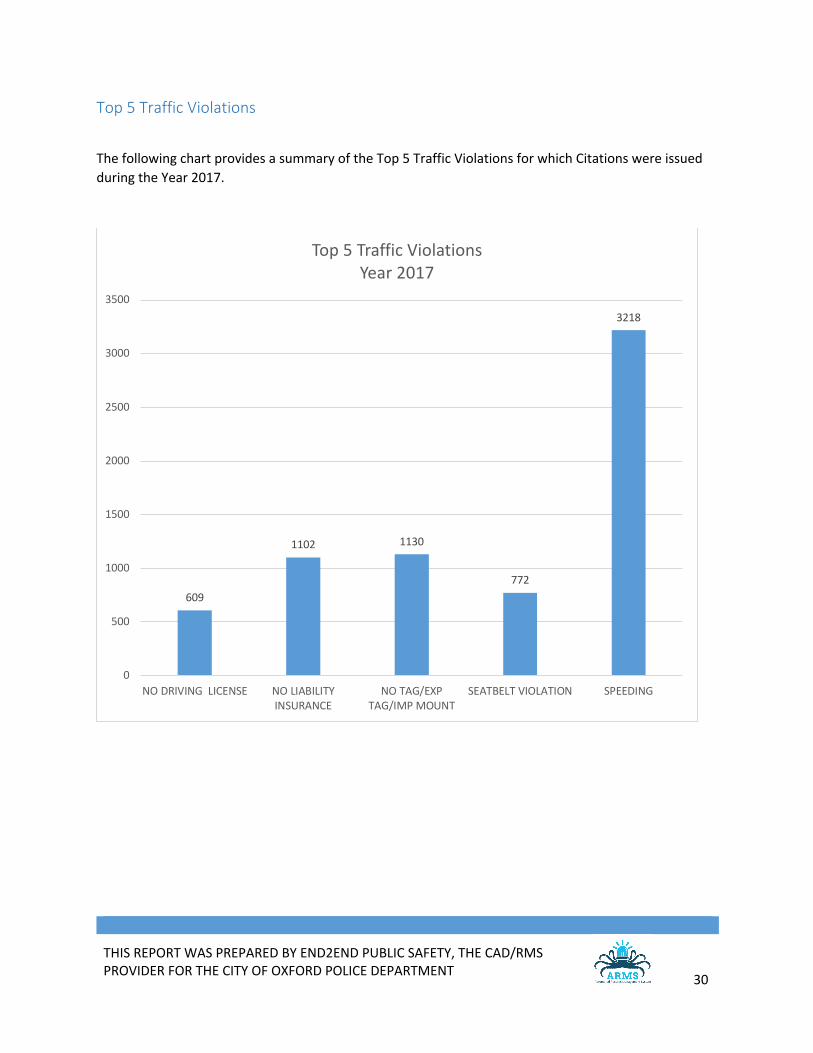
Top 5 Traffic Violations
The following chart provides a summary of the Top 5 Traffic Violations for which Citations were issued during the Year 2017.
609
1102 1130
772
3218
0
500
1000
1500
2000
2500
3000
3500
NO DRIVING LICENSE NO LIABILITYINSURANCE
NO TAG/EXPTAG/IMP MOUNT
SEATBELT VIOLATION SPEEDING
Top 5 Traffic ViolationsYear 2017

THIS REPORT WAS PREPARED BY END2END PUBLIC SAFETY, THE CAD/RMS PROVIDER FOR THE CITY OF OXFORD POLICE DEPARTMENT
31
Community Outreach Events
During the Year 2017, the agency performed the following:
Active Shooter / Safety Assessments at –
• M-Trade • Oxford Urology and Associates • Buford Chapel (Water Valley) • Oxford Church of Christ • Oxford United Methodist Church • Christ Presbyterian Church • 2nd Baptist Church • Citizens Police Academy (3x) • Pine Lake Church • First Federal Credit Union • Coldwell Banker • Regents School of Oxford • Oxford University School
Health Heroes –
8x per year, Law Fit members perform an exercise class at Della Davidson Elementary School
Citizens Police Academy –
9-week course, 3x per year; approximately 70 people attended
Haunted House –
1835 people attended
K9 Demos –
Approximately 30 demos occurred

THIS REPORT WAS PREPARED BY END2END PUBLIC SAFETY, THE CAD/RMS PROVIDER FOR THE CITY OF OXFORD POLICE DEPARTMENT
32
On-Location Giveaway Table –
There were 35 giveaway events which occurred
Compassion Outreach (Zach Anderson) –
• Bowling with special needs children from OHS • Replaced TV at Peggy’s Alterations • Visited two nursing home facilities and participated in singing with residents • Cleaned up an elderly gentleman’s yard
Coffee with a Cop –
There were 4 occurrences of this event
OPD Facility Tours –
There were 17 occurrences of this event
Child Safety Seat Checks and Installations –
These events are numerous throughout the year
Interacting with Police course held at –
• Philadelphia Missionary Church • Sororities at Ole Miss • Foreign Exchange Students at Ole Miss
Distracted / DUI training classes –
• Oxford High School • Lafayette High School • Grenada High School

THIS REPORT WAS PREPARED BY END2END PUBLIC SAFETY, THE CAD/RMS PROVIDER FOR THE CITY OF OXFORD POLICE DEPARTMENT
33
Mounted Unit –
There were 40 occurrences of outreach events by Oxford Mounted Police Unit
Unlock Car Door Assists at Bramlett, Oxford Elementary, and Della Davidson schools –
There were 4 occurrences of this event
Women’s Self-Defense –
There were 12 occurrences of this event
Camp C.O.P.S. –
There were 2 sessions and 65 children which attended this event
OPD Fun Day –
Attended by numerous children and family members
Bingo events occurred at –
• Heritage Park Apartments • Oxford Health and Rehab • C.B. Webb Apartments • Hermitage Gardens • Veterans Home
Reading and Show-n-Tell –
There were occurrences of this event at local schools
Snow Cones –
This event occurred the last day of school at Oxford Housing Authority

THIS REPORT WAS PREPARED BY END2END PUBLIC SAFETY, THE CAD/RMS PROVIDER FOR THE CITY OF OXFORD POLICE DEPARTMENT
34
Other events which occurred during Year 2017 include –
• Explorer Program (Rasberry) • Youth Long Gun Safety Training Course (Valerie)