Rockford Police Department
122
-
Upload
khangminh22 -
Category
Documents
-
view
1 -
download
0
Transcript of Rockford Police Department


PRESENTED BY:
Chief Daniel G. O’Shea
Rockford Police Department

Reduce Violent Crime
Improve Community Engagement
Improve Traffic Safety
Improve Employee Development
Enhance Organizational Development/Capabilities
Rockford Police Department
Key Strategic Initiatives
2017

Rockford Police DepartmentNIBRS Group A Offense Count 2015-2017
Offense Count Column Labels
Row Labels January February March April May June July August September October November December Grand Total
2015 1476 1040 1364 1505 1740 1643 1712 1785 1581 1621 1518 1433 18418
2016 1370 1184 1537 1482 1707 1662 1795 1610 1524 1560 1361 1375 18167
2017 1583 1296 1139 1452 1397 1450 1731 1563 1465 1497 1245 1368 17186
District 1 667 522 453 602 543 587 694 649 578 621 525 516 6957
District 2 474 455 375 483 511 537 599 530 535 494 417 448 5858
District 3 442 317 310 365 340 322 435 384 352 380 301 403 4351
Unknown 2 1 2 3 4 3 2 2 1 20
Grand Total 4429 3520 4040 4439 4844 4755 5238 4958 4570 4678 4124 4176 53771
0
200
400
600
800
1000
1200
1400
1600
1800
2000
January February March April May June July August September October November December
Offense Count
2015
2016
2017

Rockford Police DepartmentGroup A Comparison
Violent Crimes / Property Crimes

Rockford Police DepartmentAggravated Battery / Shots Fired 2014-2017

Rockford Police DepartmentAggravated Assault 2015 - 2017

Rockford Police DepartmentRobbery 2015 - 2017
Offense Count Column Labels
Row Labels January February March April May June July August September October November December Grand Total
2015 30 14 34 27 45 50 65 37 59 55 49 44 509
2016 63 28 39 39 46 53 52 38 47 40 49 49 543
2017 48 34 32 31 21 38 34 43 32 36 26 46 421
District 1 22 16 14 16 10 13 18 16 9 12 11 21 178
District 2 17 11 11 10 9 19 10 16 18 17 9 18 165
District 3 9 7 7 5 2 6 6 11 5 7 6 7 78
Grand Total 141 76 105 97 112 141 151 118 138 131 124 139 1473
0
10
20
30
40
50
60
70
January February March April May June July August September October November December
Offense Count
2015
2016
2017

Rockford Police DepartmentAuto Thefts 2015 - 2017
Offense Count Column Labels
Row Labels January February March April May June July August September October November December Grand Total
2015 43 26 33 26 50 35 35 48 38 76 49 50 509
2016 38 33 48 37 34 47 41 38 35 25 37 75 488
2017 44 37 27 24 37 27 33 49 33 45 40 54 450
District 1 15 14 14 13 10 8 9 27 22 25 18 28 203
District 2 12 10 4 4 17 13 12 13 6 10 21 17 139
District 3 17 13 9 7 10 6 12 9 5 10 1 9 108
Grand Total 125 96 108 87 121 109 109 135 106 146 126 179 1447
0
10
20
30
40
50
60
70
80
January February March April May June July August September October November December
Offense Count
2015
2016
2017

Rockford Police DepartmentTraffic Accidents 2014 - 2017

Rockford Police DepartmentAccomplishments
5% Violent Crime Reduction
8% Property Crime Reduction
Decentralized to Three District Stations
ROCK Officer Program
SIGNIFICANTLY increased community engagement
Reached full authorized strength – first time in a decade over 300

PRESENTED BY:
Chief Derek Bergsten
Rockford Fire Department

Rockford Fire Department
Key Strategic Initiatives
2018
• Maintain and improve health and safety throughout the organization
• Enhance career related training and development throughout all department
levels
• Continually improve and enhance delivery of service to the citizens
• Recruit and retain a diverse and effective workforce
• Foster community outreach and agency partnerships

Rockford Fire DepartmentScorecard
Area of
Focus Metric/Program Definition Standard/Goal
Current
Performance
Call Answer Time
911 calls answered in 10 seconds or
less 90% 82.46%
Total Response Time
911 call received to first unit on
scene in 8:12 or less 90% 90.76%
Utstein Rating Cardiac Survival Rate 27.1% 28.6%
EMS Customer Service Overall customer experience rating 95% 93.48%
Reduction of hospital admissions 50% 40%
Reduction of hospital readmissions 75% 50%
Fire Dollar Save Ratio
Percentage of property value saved
from structure fires 90% 82.86%
Arson Clearance Rate
Percentage of arson incidents cleared
by arrest 15% 10.96%
Inspections
General inspection performed within
the last four years 95% 94.20%
Smoke Alarm/Battery
Program
Average number of homes visited
monthly with Smoke Alarms installed
or batteries replaced 30 18
Mobile Integrated
Healthcare Program
EMS
Fire
/Fir
e P
reve
nti
on
Re
spo
nse
Tim
es

Rockford Fire DepartmentIncidents
Year Total Incidents % Change
2000 16,853
2001 17,549 4.13%
2002 17,662 0.64%
2003 18,498 4.73%
2004 18,596 0.53%
2005 19,447 4.58%
2006 20,941 7.68%
2007 22,867 9.20%
2008 23,635 3.36%
2009 23,662 0.11%
2010 22,842 -3.47%
2011 23,737 3.92%
2012 24,557 3.45%
2013 24,749 0.78%
2014 26,010 5.10%
2015 27,446 5.52%
2016 27,189 -0.94%
2017 28,378 4.37%
3.16%Average Increase

Rockford Fire DepartmentIncidents
752
22,390
574
3,054
1,544
64
28,378
False Alarm & False Call
Other Incident Type
Total
2017 Incidents by Type
Fire
EMS & Search and Rescue
Hazardous Condition
Service/Good Intent Call

Rockford Fire DepartmentIncidents

Rockford Fire DepartmentVacant Building Fires
2013 2014 2015 2016 2017
4 6 3 1 9
26 26 14 29 24
30 32 17 30 33
Commercial
Residential
Total
Structure Type

Rockford Fire DepartmentVacant Building Fires
Hot Spot Map
• 142 total vacant building fires
2013-2017

Rockford Fire DepartmentRed X Properties
• 99 total properties with Red X
Signage

Rockford Fire DepartmentOpen Burning Incidents
Since May of 2013, 397 Notice to Appear tickets have been written by fire investigators

Rockford Fire DepartmentAmbulance Transports
Hospital 2013 2014 2015 2016 2017
Rockford Memorial 5,284 5,651 5,527 5,327 5,958
OSF St. Anthony 3,199 3,337 3,651 3,767 4,087
Swedish American 8,589 9,107 9,766 9,678 9,408
Total 17,072 18,095 18,944 18,772 19,453

Rockford Fire DepartmentEMS Customer Service Surveys
2017 Executive Summary
• 648 patients returned a questionnaire between 1/1/2017 and 12/31/2017
• Overall mean score was 93.48, .87 points higher from the overall database score of
92.61. (143 departments/companies in database)
• Ranked 9th for comparably sized departments in the system (45 comparable
departments)
• 79.37% of responses were marked Very Good, the highest rating. 99.02% of all
responses were positive.

Rockford Fire DepartmentEMS Customer Service Surveys

Rockford Fire DepartmentEMS Customer Service Surveys

Rockford Fire DepartmentLift Assist Incidents

Rockford Fire DepartmentLift Assist Incidents

Rockford Fire DepartmentResponse Times
911 Notified of Emergency
Address and Type of Call Verified and Alarm is Sent
to Appropriate StationUnits go Enroute to
the Incident
First Unit Arrives on Scene with ALS
Capability
Alarm Handling
1:30
Turnout Time
1:30Travel Time
5:12
90th Percentile Total
Response Time
CPSE 90th Percentile
Standard
2017 Performance
8:12 8:05
Total Response Time
8:12

Rockford Fire Department2017 Achievements
• Relocated Station 7 to former Shop Facility (2323 Sawyer Rd) for better
coverage and response
• Appointed new Mobile Integrated Healthcare (MIH) Paramedic as part of the
partnership with Humana
• Implemented new patient care reporting software that allows capture of data
in the field
• Mission Lifeline Gold Plus Award from American Heart Association
• Hired 31 new Firefighters and 2 new Telecommunicators
• Installed smoke detectors and replaced batteries in 216 homes in partnership
with Red Cross
• Obtained Grant from ATF to fund the program for accelerant detecting canine

Rockford Fire Department2018 Areas of Improvement
• 911 Consolidation
• Next Generation 911
• New 911 CAD system award and implementation
• Vacant/Hazardous Structure Identification and Notification
• Fire/Police Mobile Command Vehicle
• Commission on Accreditation of Ambulance Services (CAAS) renewal
• Emergency Management training for City Staff
• Expanding partnerships with Rockford School District #205

PRESENTED BY:
Mark Stockman
Director
Public Works

Public Works DepartmentKey Strategic Initiatives
2017
• Balanced infrastructure system inclusive of road, rail, parking, pedestrian and
alternative modes of transportation
• Improved infrastructure & redevelopment to attract businesses to the City of
Rockford
• Street maintenance program which provides commuters with clean, safe and well-
maintained streets
• Operate and maintain the public water system in a manner that protects public health
and enhances the community
• Maintain a stormwater management program that protects the public and the
environment while enhancing the community

Mitch Leatherby – Street & Transportation Superintendent

Street & TransportationDashboard

Street & Transportation
2486
2803
2029
3299
2884
3186 3116
27542637
3385
0
500
1000
1500
2000
2500
3000
3500
4000
2008 2009 2010 2011 2012 2013 2014 2015 2016 2017
Total Annual Requests - Pothole Patching
Total Annual Requests - Pothole Patching

Street & Transportation

Street & Transportation
321
704 638
819
11941114
1201
1018889
471
65 28 44 6137
237 265
574
406322
0
200
400
600
800
1000
1200
1400
2008 2009 2010 2011 2012 2013 2014 2015 2016 2017
Annual Tree Removals – Internal vs Contracted
Contracted Removals
City Removals
2 per. Mov. Avg. (Contracted Removals)
2 per. Mov. Avg. (City Removals)

Street & Transportation
12261030
929 862
25302394
0
500
1000
1500
2000
2500
3000
2012 2013 2014 2015 2016 2017
Traffic Sign - Service Requests Completed
Traffic Sign Service Requests Completed Linear (Traffic Sign Service Requests Completed)

Street & Transportation
27
15
2729
35
27
0
5
10
15
20
25
30
35
40
2012 2013 2014 2015 2016 2017
City Owned Streetlights Damaged
# Streetlights Damaged Linear (# Streetlights Damaged)

Street & Transportation
53
6065 64
55
42
0
10
20
30
40
50
60
70
2012 2013 2014 2015 2016 2017
Traffic Signal -Knockdowns
# Signals Damaged Linear (# Signals Damaged)

Street & Transportation2017 Accomplishments & Areas for Future Improvement
Accomplishments Areas for Improvement
• 5,905 Street requests for service
completed (97%)
• Removed 322 trees internally. Savings
to the city of $160,000(2017) +
$225,000(2016) = $400,000 over a 2-
year span.
• Forestry Dept. pruned 3,075 trees (2nd
best year in a row)
• Signage Dept. Replaced 2420 street
signs
• Nearly 100% monthly completion of
Traffic Signal/Sign Service requests
• Central Garage completed 4665 repair
work orders
• Initiate an electronic asset
management work order /
inventory system for the property
department
• Continued Long line pavement and
crosswalk striping
• Coordination with PD to
purchase/replace existing vehicles
in the fleet
• Continue incremental
improvements to City Yards
facility

Public Works – Graffiti2017 YTD Dashboard
2015 51 2017
63 75 88 122 73 28 2016 57
2017 39
2016 2017
LY Jan Feb Mar Apr May Jun Jul Aug Sept Oct Nov Dec TY Jan Feb Mar Apr May Jun Jul Aug Sep Oct Nov Dec
8 38 28 32 62 66 63 75 88 122 73 28 89 55 28 25 44 58 51 50 19 13 24 9
35 35 40 40 100 110 110 110 80 80 45 35 35 35 40 40 100 110 110 110 80 80 45 35
Averages
Plan
Actual
52
RockStat Trend GraphDate
Operation
Name Kwame CalvinJAN 18'
Properties
Goal / Target
52
1st 6 months 2nd 6 monthsGraffiti CallsElement/Measure
2016 Last 6 months actuals
0
20
40
60
80
100
120
140
Jan Feb Mar Apr May Jun Jul Aug Sept Oct Nov Dec TY Jan Feb Mar Apr May Jun Jul Aug Sep Oct Nov Dec
Actual Plan Average

Public Works – GraffitiStatistics
• We have a 38% reduction in graffiti this
year compared to last year. We have (465)
cases this year compared to (683) cases
last year.
• We have a 79% decrease in graffiti over
the last 4 months of this year (65)
compared to last year (311).
• Gang graffiti makes up 43% of all graffiti
identified. Slap tags is the lowest with just
1% out of all graffiti identified.
Before
After

Achievements
• Graffiti response and abatement time
was (1.1) day average since April 1st
• Graffiti declined 38% last year.
• October graffiti (13) was our lowest
month. Also, lowest October to date.
• Finishing strong- last 4 months total
cases (65) compared to (311) total
cases last year.
Areas of improvements
• Ward #5 continues to lead all wards
in graffiti each year.
Public Works – Graffiti

Kyle Saunders - Water Superintendent

PUBLIC WORKS / WATER DIVISIONWater Production/Consumption Financial Performance – Budget to Actual
100.88%
95.72%
90.0 % 95.0 % 100.0 %
Budgeted Revenues
Budgeted Expenses
Budget
Scorecard Highlights – FY 2017
4.4% Increase in Revenue
4.3% Below Expense Budget
0.5% Increase in Water Production
3.5% Increase in Water Loss*
150% Increase in Distribution PMs
$6.75MM Investment in Water CIP
1.0 BG
3.0 BG
5.0 BG
7.0 BG
9.0 BG
2013 2014 2015 2016 2017
Water Sales Water Production
2017
Monthly
Target
2017
YTD
Average
2016
YTD
Average
Indicator
Emergency Repair Time (hours) 2 0.9 1.2 -0.3
% of Total Repairs That Are Planned 70% 82% 76% 6%
Backlog of Non-Emerg Repairs (Weekly Avg) 25 27 49 -22
# of Winter Backlog Jobs 130
Water Main Flushed (mi) 40 37 44 -7
Total Work Orders 2465 2505 2535 -30
Days Priority S /O Outstanding 30 7 7 0
Backlog of Priority S /O 50 9 17 -8
Maintenance Work Orders 200 199 210 -11
Service Pressure Excursions 45 24 36 -12
% Preventative Maintenance 60% 58% 66% -8%
# of Water Quality Complaints 3 2 1 1
% Design Demand 100% 123% 136% -13%
Total Amt Past 30 Days Due as % of Revenue 5% 2.4% 3.0% -0.6%
Operating Revenue, % of Plan 95% 100% 101% -1%
Number of New Water Connections 5 10 8 2
Date Based Metric
Monthly Performance
Wat
er O
per
atio
ns
Dis
trib
uti
on
Fie
ld
Serv
ices
Pro
du
cti
on
Fin
an
cia
l

PUBLIC WORKS / WATER DIVISIONAchievements
• 208 Miles of Acoustic Leak
Detection in SE Rockford
• Backwash Tank Residuals
Removal
• Large Meter Testing Program
• Master Meter Validations
• 4.0+ Miles of Water Main
Replaced/Installed City-Wide
• 5 Well Rehabilitations
• Fireflow Testing & Hydrant PMs
• 2500 40W ERTs Replaced
• Chamber of Commerce Confluence
Award – P3 Partnership
• Lead and Drinking Water Program
Areas of Improvement
• Stanley St Radium Treatment Plant
Construction
• Valve Assessment Pilot Program
• River Crossing(s) Pipe Assessment
• LIMS Implementation
• Cost-of-Service Analysis
• Brand Identity/Awareness
• Water Leadership Program
• More Robust CIP Program
• Water System Modeling
• Lead and Drinking Water Program

PUBLIC WORKS / WATER DIVISION2018 Goals & Objectives
• Provide safe, plentiful, and desirable drinking water to the community
• Reduce water loss through leak detection, master meter validation and
large meter testing
• Continue predictive/preventative maintenance management efforts
• Increase efficiency of ERT replacement program; next generation
metering
• Proactively replace antiquated, high-risk water infrastructure city-wide
• Advance the development of the Rockford Water Academy and Water
Leadership programs to aid in staff development

PRESENTED BY:
Todd Cagnoni
Community and Economic
Development

Community & Economic Development Department
Key Strategic Initiatives
2017
• Code Enforcement Improvement
• Neighborhood and Housing Improvement
• Commercial Corridors
• Global Trade Park - Land Use & Marketing Plan
• Central Planning Area

CEDD - Construction & Development ServicesConstruction Valuation 2017
2013 2014 2015 2016 2017 % ChangeResidential $ 16,478,272 $ 52,796,024 $ 22,098,220 $ 26,486,997 $ 30,205,802 14.04%
Commercial $ 52,807,574 $ 86,746,135 $ 107,000,438 $216,061,659 $ 300,740,980 39.19%
Total $ 69,285,846 $139,542,159 $ 129,098,658 $242,548,656 $ 330,946,782 36.45%
$-
$50,000,000
$100,000,000
$150,000,000
$200,000,000
$250,000,000
$300,000,000
$350,000,000
2013 2014 2015 2016 2017
Residential
Commercial
Total

CEDD - Construction & Development ServicesPermit Fees 2017
2013 2014 2015 2016 2017%
CHANGE
Building $1,115,762 $2,131,184 $ 1,456,553 $ 2,223,112 $ 1,444,900 -35.01%
Planning $ 141,181 $ 145,296 $ 177,378 $ 190,635 $ 179,673 -5.75%
Total $1,256,943 $2,276,480 $ 1,633,931 $ 2,413,747 $ 1,624,573 -32.69%
$-
$1,000,000
$2,000,000
$3,000,000
2013 2014 2015 2016 2017
Building Planning

CEDD - Construction & Development ServicesTotal Permits 2017
2013 2014 2015 2016 2017 % CHANGE
5,990 9,664 6,463 6,463 6,744 4%
TOTAL PERMITS -
2,000
4,000
6,000
8,000
10,000
5,990
9,664
6,463 6,463 6,744
2013 2014 2015 2016 2017

CEDD - Construction & Development ServicesBuilding Scorecard – 2017
2016
YTD
2016
AVG
2017
YTD% Change
vs. 2016 Goal 95%
2017
AVG
New 1&2 Fam 24 2 32 33% 3 Days --
1+2 Acc. Det. 59 5 58 -2% 2 Days 91%
1/2 Add/Alt 448 40 397 -11% 2 Days 92%
Comm/MF Plans 149 13 228 53% 14 Days 98%
Plum/Mech Plans 88 8 151 72% 14 Days 94%
Elec Plans 138 12 175 27% 14 Days 95%
Counter Permits 26 2 46 77% 1 Day 98%
Demolition Permits 181 16 213 18% 2 Days 82%
Plumbing Permits 1315 116 1257 -4% - 95%
Stand Alone Plum 875 78 977 12% 1 Day
Mechanical Permits 1237 111 1207 -2% - 95%
Stand Alone Mech 829 76 906 9% 1 Day
Electrical Permits 870 73 813 -7% - 96%
Stand Alone Elec 328 27 369 13% 1 Day
# Roofing Permits 1126 94 1691 50% 1 Day 99%
# Siding Permits 170 14 150 -12% 1 Day 99%
Struct Insp Reported 3536 295 2333 -34% -
Struct Inspections 2967 247 1947 -34% 1 Day 97%
Plum Insp Reported 2031 169 2578 27% -
Plumbing Inspections 1837 153 2040 11% 1 Day 100%
# Mech Insp Reported 1538 128 2021 31% -
# Mechanical Insp 745 62 1515 103% 1 Day 99%
Elec Insp Reported 1886 157 1778 -6% -
# Electrical Inspections 1477 123 1462 -1% 1 Day 99%
# FOIA Requests 512 43 545 6% On Time
Current TrendsPerformance
Measurement

CEDD – Neighborhood DevelopmentScorecard
Funding
Neighborhood Development
Program
2017 Annual
Target 2017 Actual % of Target
CDBG Ramps 3 0 0%
HOMEHomeowner Rehab 24 23 96%
HOME / NSP /
IHDA Homebuyer Assistance 10 11 110%
HOMECHDO Homebuyer /Rental /
Operating 5 0 0%
HOMESub-recipient: Jeremiah
Development 2 2 100%
Madigan Grant Roof Repair /Replacement 20 12 60%
64 48 75%
CDBG
Discovery Center - After School
Program 220 199 90%
220 199 90%
CDBG, IHDA,
Sanitation, RCI,
Emergency Demolitions 108 111 103%
IHDA BRP
Blight Reduction Program –
Acquisition 19 23 121%
CDBG Code Enforcement 5,000 5,915 118%
5,127 6,049 118%
Ho
us
ing
Ac
tiv
itie
s
TOTAL HOUSING
Pu
blic
Se
rvic
e
TOTAL PUBLIC SERVICE
Pro
pe
rty
Im
pro
ve
me
nts
TOTAL PROPERTY IMPROVEMENTS

CEDD – Neighborhood Development

CEDD – Neighborhood DevelopmentAchievements – Single Family Housing Rehabilitation
“My failing
house is
now my
castle!”

CEDD - Economic Development Scorecard
Goal Actual Goal Actual Goal Actual Goal Actual Goal Actual
20 5 1 5 5 5 3 5 3 20 12
12 3 3 3 1 3 2 3 3 12 9
800 200 37 200 171 200 1 200 136 800 345
Private
Investment125,000,000$
Public
Investment
Commercial New and Retained
Projects
Industrial New and Retained
Projects
New and Retained Jobs
Year to Date
2,600,000$ 77,052,827$ 85,556,142$ 2,264,649$ 167,473,618$
2017 Annual
Target
First Quarter Second Quarter Third Quarter Fourth QuarterEconomic Development Data
Quarterly Performance
244,912$ 10,198,573$
1.56% 4.50% 5.17% 10.81% 6.09%Percentage, Public Investment
Total
Investment40,500$ 3,469,837$ 4,423,587$

• Enterprise Zone Property Tax Abatement MOU – Chem Processing
• Napleton Auto Group Incentive Agreement
• Indoor City Market Development Agreement
• Gorman/Amerock Hotel Development Agreement Amendment
• 326 West Jefferson Development Agreement
• OSF Campus Development Agreement
• Ozinga Lease Agreement
• CDBG Projects
• Warner Winnebago LLC (Façade Improvement)
• Midtown Faust Corporation (Façade Improvement)
• Crust & Crumbles (Rehab and Development Assistance)
• Salon 4 Purpose (Rehab and Development Assistance)
• Cliffbreakers (Section 108 Loan)
CEDD - Economic Development 2017 Development Agreements

CEDD - Economic & Neighborhood Brownfield Grants
• Awarded $2,216,435 from EDA for Infrastructure Colman Village Phase 1
• Awarded $700,000 for revolving loan fund in FY18
• Awarded $170,000 US EPA clean up grant for FY18
Neighborhood Grants
• Awarded $125,000 for residential demolition IHDA – APP #2
• Applied for $250,000 for residential demolition 12/1/2017 IHDA – APP #3
• Applied for $850,000 for land bank in conjunction with R1 Regional Planning

CEDD – Construction & Development Services2017 Neighborhood Standards Code Enforcement Trends
Positive Trend
Negative Trend
2017 2016 % ChangeTotal Complaints
(Service Requests) 4764 4118 15.7% 2017 2016 % ChangeUnfounded
Complaints 1635 1469 11.3%
% Rate of Voluntary
Compliance 68.6% 48.7% 40.7%*Avg No. Days to
Initial Inspection 1.4 2.8 -50.2%
Avg Days to Vol.
Compliance 13.8 21.4 -35.6%Total
Cases Started 9764 8095 20.6%
% Rate of Induced
Compliance 2.9% 7.9% -63.1%ProActive
Cases Started 5849 4969 17.7%
Avg Days to Induced
Compliance 26.4 44.4 -40.5%CD ORD Cases (Rental,
Zoning, Etc) 445 360 23.6%
% Rate of Forced
Compliance 28.7% 44.0% -34.9%Zoning/Non-Cont.
Cases Started 2164 1362 58.9%
Avg Days to Forced
Compliance 23.8 23.3 2.1%Nuisance Cases
Started 7179 6373 12.6%
Year Total
Year Total

CEDD – Construction & Development Services2017 Electronic Waste Program
*July 5, 2017
Collection Bins
Moved to KNIB Monthly invoices have been reduced an average
of ~ $7,582 per month since relocation.
Estimated Annual Saving: $90,983
MONTH LBS E-WASTE LOCATION
JAN - JUL 1,041,888 2 KELLEY-WILLIAMSON STATIONS
JUL - DEC 422,455 KEEP NORTHERN ILLINOIS BEAUTIFUL
2017 TOTAL 1,464,343
2016 TOTAL 1,900,108

Community and Economic DevelopmentAchievements
• Collaboration with Prairie State Legal for Fair Housing Video: 23,000 views on
Facebook and 500 views on YouTube. Seen by 100 people in local training events.
• Successful marketing efforts – In 2017, all of the available and budgeted HOME
funds were committed to projects. There are currently 31 applicants on a waiting
list and 54 additional names on an “Interested Party” list for our housing programs.
Housing needs far exceed our available HOME funds.
• Amount of leveraged funds on HOME projects increased 42% from 2016 to 2017,
primarily due to the increase in homebuyer assistance projects.
• 31% increase in obligated HOME funds from 2016 to 2017, with a 55% increase in
the number of assisted HOME projects.
• Rockford Community Partner supported projects; 2nd Annual “Rockford Day” on
8/15, Great Neighborhoods Initiative (Transform Rockford), Ethnic Festival
(Midtown), “Our City Our Story” (RACVB), installation of public tables in Lot 5
(Forest City Beautiful).

Community & Economic DevelopmentGoals and Strategies for 2018
• CODE ENFORCEMENT – Advance recommendations of
Community Progress report including alignment with
Neighborhood Stabilization position in Legal Department to revise
code enforcement procedures to promote and leverage investment.
• ECONOMIC DEVELOPMENT – Facilitate a Quick Start Building
Project in conjunction with RAEDC, educate industry with EZ,
RERZ, and TIF processes and procedure, prioritize Business
Liaison responsibilities, implement “Doing Business in Rockford
Task Force” recommendations and prioritize activity to expand
business startups, MBE / WBE through Business First.
• NEIGHBORHOODS – Continue to demolish abandoned properties,
create a pipeline of eligible Community Housing Development
Organizations, advance regional housing policies, improve systems
used to track relevant data for reports and timely use of funds and
identify, evaluate, and apply for additional grants to compliment
and leverage our limited dollars

PRESENTED BY:
Jennifer Jaeger
Director
Community Services

Community Services Key Strategic Initiatives
2017
• Training and Employment
• Education
• Healthy Homes/Energy Efficiency
• Emergency Assistance
• Housing/Homeless

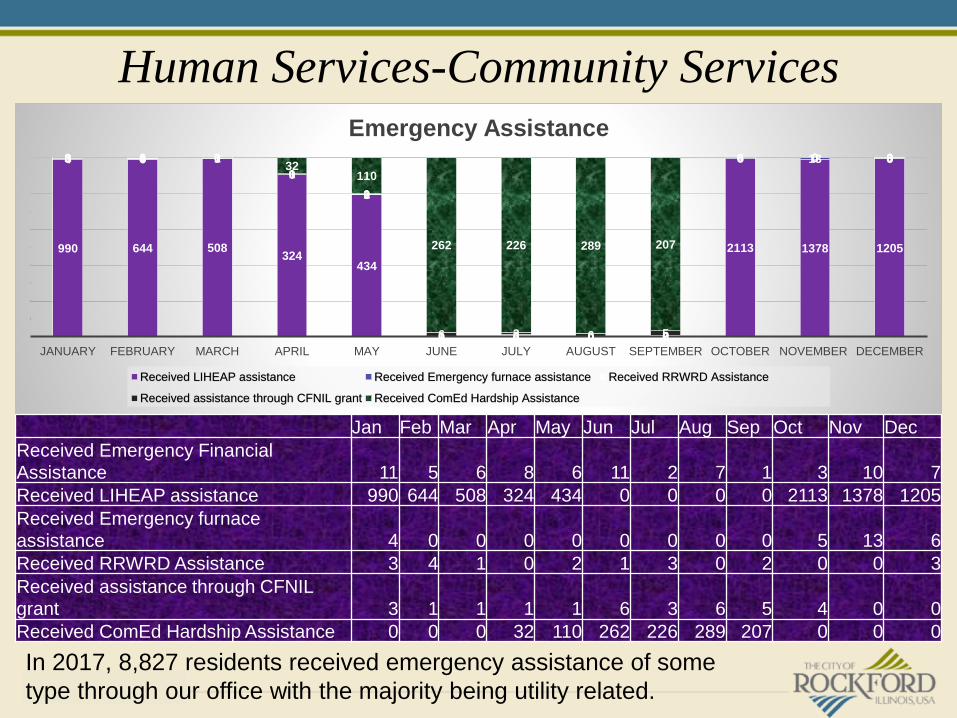
Human Services-Community Services
2
6
3
6
2 2
3
0
7
3 3
5
3 3
0 0
2
3
4 4
2
0 0 0
2 2
3
2
JUN-17 JUL-17 AUG-17 SEP-17 OCT-17 NOV-17 DEC-17
Employment and Training
Completed soft job skills training Completed job training Obtained Unsubsidized employment Obtained Living wage job
Jun-17 Jul-17 Aug-17 Sep-17 Oct-17 Nov-17 Dec-17YTD
Completed soft job skills training 2 6 3 6 2 2 3 24
Completed job training 0 7 3 3 5 3 3 24
Obtained Unsubsidized employment 0 0 2 3 4 4 2 10
Obtained Living wage job 0 0 0 2 2 3 2 9
We used employment and training funds for two projects in 2017, a sub grant to
Zion West for training and subsidized employment for 10 individuals, who went on to
obtain non-subsidized employment and a partnership with Rock Valley College to
pay tuition for low-income individuals to obtain certificates in either CNC or
cold forming. Overall, the project had a 79% employment rate.

Human Services-Community Services
Community Action provides post secondary scholarships of at least $1,000 to at
least 5 students annually with 80% staying in college and/or graduating. Our
scholarship application is currently open, call 844-710-6919.
1
4
5 5
1
0
0 0
2
0
0 0
1
0
0 0
2014 2015 2016 2017
Educational Status of Scholarship Recipients 2014-2017
Still in school Graduated unable to contact Did not graduate
2014 2015 2016 2017
Still in school 1 4 5 5
Graduated 1 0 0 0
unable to contact 2 0 0 0
Did not graduate 1 0 0 0

Human Services-Community Services
1 12
34
01
6
10
19
5
8 8 8
0
5
2
7
11
18
5
78 8
0
5
2
7
10
MARCH APRIL MAY JUNE JULY AUGUST SEPTEMBER OCTOBER NOVEMBER DECEMBER
Healthy Homes- Emergency Home Repair and Weatherization
CSBG Home Repairs completed Completed Weatherization Homes Weatherization homes that met target
Jan Feb Mar Apr May Jun Jul Aug Sep Oct Nov Dec
CSBG Home Repairs completed 1 0 1 1 2 3 4 0 1 6 1 0
Completed Weatherization
Homes 1 3 19 5 8 8 8 0 5 2 7 11
Weatherization homes that met
target 1 3 18 5 7 8 8 0 5 2 7 10
97 homes in our service area received either life/safety repairs or weatherization
services, with the average investment per home being $11,000 in labor and material.
Human Services-Community Services
In 2017, 8,827 residents received emergency assistance of some
type through our office with the majority being utility related.
990 644 508324
434
0 0 0 0
2113 1378 1205
4 0 0
0
0
0 0 0 0
5 13 63 4 1
0
2
1 3 0 2
0 0 33 1 1
1
1
6 3 6 5
4 0 00 0 032
110
262 226 289 207
0 0 0
JANUARY FEBRUARY MARCH APRIL MAY JUNE JULY AUGUST SEPTEMBER OCTOBER NOVEMBER DECEMBER
Emergency Assistance
Received LIHEAP assistance Received Emergency furnace assistance Received RRWRD Assistance
Received assistance through CFNIL grant Received ComEd Hardship Assistance
Jan Feb Mar Apr May Jun Jul Aug Sep Oct Nov Dec
Received Emergency Financial
Assistance 11 5 6 8 6 11 2 7 1 3 10 7
Received LIHEAP assistance 990 644 508 324 434 0 0 0 0 2113 1378 1205
Received Emergency furnace
assistance 4 0 0 0 0 0 0 0 0 5 13 6
Received RRWRD Assistance 3 4 1 0 2 1 3 0 2 0 0 3
Received assistance through CFNIL
grant 3 1 1 1 1 6 3 6 5 4 0 0
Received ComEd Hardship Assistance 0 0 0 32 110 262 226 289 207 0 0 0

Human Services-Community Services
In addition to our work with the homeless we work to prevent homelessness
and stabilize families. In 2017, we assisted 230 households to keep their housing.
Over 80% of those we help remain stably housed.
9
17
12
17
34
15
18
12
23
12
24
14
19
34
15
18
13
23
APRIL MAY JUNE JULY AUGUST SEPTEMBER OCTOBER NOVEMBER DECEMBER
Housing Assistance and Stability- Homeless Prevention
Still stably housed Assisted with rent/deposit/mortage for housing stability
Jan Feb Mar Apr May Jun Jul Aug Sep Oct Nov Dec
Still stably housed 13 12 19 9 17 12 17 34 15 18 12 23
Assisted with rent/deposit/mortage for
housing stability 19 15 24 12 24 14 19 34 15 18 13 23

Human Services-Community Services
We have now sustained functional zero for veteran homelessness for 24 months,
all new veterans entering homelessness are housed within 30 days. Our recent
Point in Time count of the homeless has verified that our census of this
Population is accurate.
6
7
5 5
6
5 5
8
7 7 7
4 4
3 3 3 3
5
6 6 6 6 6 6
Sustaining Veteran Functional Zero
Sustaining Threshold

Human Services-Community Services
We reached functional zero for the chronically homeless (a year plus
literally homeless and a diagnosed disability)in January, 2017. Our recent Point in
Time count of the homeless has verified that our census of this
Population is accurate.
30
3940
3233
34
30
21
26 26
14
7
3 3 3 32 2 2 2
32 2 2
Chronic Homeless Chart

Human Services-Community Services
131
44 5780
113
379
264
182 175 178
510
308
239 255291
261
2013 2014 2015 2016 2017 2018
Homeless Counts Boone and Winnebago 2013-2018
Families with children Individuals Total Homeless Shelters/Streets
Our CoC area, Boone and Winnebago Counties, has seen a decrease in the
number of persons who are homeless over the past five years. Our focus in
2015 was veterans and 2016 was chronic (both groups are primarily individuals)
which is shown by the larger decrease in individuals above. Our focus in 2018 is
unaccompanied youth who can be either parenting or single.

Human Services-Community ServicesAchievements
In October, we received notice from the United States Interagency
Council on Homelessness (USICH) and the Department of Housing and
Urban Development (HUD) that they have verified that we achieved functional zero
for chronic homelessness. We are one of only three communities in the nation to
receive this certification and the only community to receive this certification for
both veteran and chronic homelessness.
Since July, we have recertified 958 Percentage of Income Payment program
participants and enrolled 320 new participants. This program helps consumers
budget their utility bills and makes a small co-pay. If participants stay on budget
for 12 months any arrearages are forgiven. We are using this program to help an
older couple (one of them is on life support) to address a $59,499.19 ComEd bill.
Their bill grew to this size due to the high electric needs of the life support
equipment plus late fees and deposits ($39,011) combined with their very low income.
In 2017, we were notified that our agency had met all of the standards needed to meet
Certification for the National Organizational Standards for Community Action Agencies.
Agencies must meet a set of 58 rigorous standards to ensure they are
in compliance with the federal regulations governing CSBG.

Human Services-Community ServicesAreas of Improvement
We face a need to increase resources to continue to reduce homelessness. To
date we have achieved progress primarily through the better utilization of grant funds.
We will need to quickly develop additional; resources to continue to be successful.
We are seeking a new funding stream to support this effort, the HUD Youth
Homelessness Demonstration Program, only ten are awarded each cycle.
This is cycle two.
We will be operating a new weatherization program in 2018 that is designed by the
utility companies. Adapting to this new process will require changes in our approach
to energy efficiency.

PRESENTED BY:
George Davis
Executive Director
Head Start

Head Start/Early Head Start/Early Head Start – Child Care
2016 – 2017 Demographics
837 Children received services
• 88 children had a diagnosed disability
• 37 children in foster care
• 30 children experienced homelessness during the program
year
Of 770 families served
• 609 are single parent families
• 257 single parent families are unemployed
• 161 two parent families
• 37 two parent families, both parents are unemployed
• 239 families have less then a high school education
• 228 enrolled families have a primary language other than
English

Early Head Start Screening Outcomes
Ages Birth – 3Percentage of children who met developmental milestones
7% 9% 12% 7% 9% 7% 9% 5% 7% 5% 3% 7% 5% 9% 7%
14% 12%14%
7% 3% 7%12%
7%9% 10%
7%10% 9% 5% 10%
79% 79% 74%86% 88% 86%
79%88% 84% 85% 90%
83% 86% 86% 83%
Communication Gross Motor Fine Motor Problem Solving Personal Social
Period 1 Period 2 Period 3 Period 1 Period 2 Period 3 Period 1 Period 2 Period 3 Period 1 Period 2 Period 3 Period 1 Period 2 Period 3
Percentages based on 58 children who completed program year out of the total enrollment of 117.

Early Head Start Screening Outcomes
Ages Birth – 3
• 16 children identified as failing one or more learning areas during the
year.
• 3 entered Early Head Start already receiving Early Intervention (EI)
services.
• Remaining 13 were referred to Early Intervention services.
• 8 of the 13 (61%) were found eligible to receive additional services
through Early Intervention.

Early Head Start Screening Outcomes
Ages Birth – 3Percentage of children who met developmental milestones
0%
10%
20%
30%
40%
50%
60%
70%
80%
90%
100%
Social Emotional Physical Language Cognitive Literacy Math
Fall Winter Spring

Head Start Child Outcomes
Ages 3-5 YearsPercentage of children who meet or exceed developmental objectives
0%
10%
20%
30%
40%
50%
60%
70%
80%
90%
100%
Social-Emotional
Physical-Gross Motor
Physical-FineMotor
Language Cognitive Literacy Mathematics
Fall Winter Spring

CLASS - The Classroom Assessment Scoring System (CLASS) is an observation
Instrument developed to assess quality in 3 specific domains in early childhood classrooms.
Emotional Support
• Positive Climate
• Negative Climate
• Teacher Sensitivity
• Regard for Student
Perspectives
Classroom Organization
• Behavior Management
• Productivity
• Instructional Learning
Formats
Instructional Support
• Concept Development
• Quality of Feedback
• Language Modeling
• Literacy Focus
School Readiness
Initiative: Increase CLASS scores to increase effectiveness of teacher/child interactions.
0.0
1.0
2.0
3.0
4.0
5.0
6.0
Emotional Support ClassroomOrganization
Instructional Support
Re-Compation Levels for 2016
City of Rockford Head Start
The standard of excellence for all
domains is 6.

Early Head Start:• 87% of children up-to-date on age-appropriate preventive and primary health
care, according to the state EPSDT schedule for well child care• 88% of children determined by a health care professional to be up-to-date on all
immunizations appropriate for their age
Early Head Start –Child Care Partnership:• 71% of children up-to-date on age-appropriate preventive and primary health
care, according to the state EPSDT schedule for well child care• 84% of children determined by a health care professional to be up-to-date on all
immunizations appropriate for their age
Head Start:• 97% of children up-to-date on age-appropriate preventive and primary health
care, according to the state EPSDT schedule for well child care • 98% of children determined by a health care professional to be up-to-date on all
immunizations appropriate for their age• 98% of children with continuous, accessible dental care provided by a dentist• 94% of children completed an oral health exam during the operating period
Health Outcomes

Social Services
Family Support Specialists and Home Visitor Teachers support families’ goals and
needs. Families make decisions, including the resources they choose to utilize and
options they choose to exercise. In some cases, support is provided to families in
crisis.
Head
Start
Early
Head
Start
Head
Start
Early
Head
Start
Emergency/crisis intervention (addressing
immediate need for food, clothing or
shelter):
48 14Adult Education such as GED programs
and college selection19 2
Mental health services 2 14 Domestic Violence Services 3 3
English as a Second Language (ESL)
training5 2 Health education 33 102
Child Abuse and Neglect services 0 0Assistance to families of incarcerated
individuals0 0
Housing Assistance such as subsidies,
utilities, repairs21 8 Parenting education 76 102

Head Start
Achievements
• Chamber of Commerce
Confluence Award for great
Partnerships/Collaborations
with the Music Academy in
Rockford.
• Full Enrollment in Early
Head Start.
• New Partnership with
YMCA Children’s Learning
Center to serve 15 children.
Areas for Improvement
Areas for Improvement
• Maintain full enrollment in all program
options/site locations.
• Participate in Single Point of Entry with
Rockford Public Schools Early
Childhood and other local early
childhood agencies.
• Explore additional options for In-Kind
in the community.
• Develop new polices and procedures
to address the revised Head Start
Performance Standards.
• Complete proposal for new 5 year
Head Start/Early Head Start grant
PRESENTED BY:
Gus Saros
Customer Service Supervisor
Finance:
Customer Service Center

FINANCE – CUSTOMER SERVICE CENTERScorecard
Monthly Performance2017
TargetJan Feb Mar Apr May Jun Jul Aug Sep Oct Nov Dec YTD 2017 YTD 2016
Total number of calls 6,750 6,334 5,572 6,086 5,716 6,239 6,230 6,373 6775 5933 6351 5397 5523 72,529 74,911
Average Time to Answer in sec. 30 38 17 15 13 14 12 13 12 14 19 16 17 17 24
% Calls Abandoned 8% 4.7 1.5 1.7 1.3 1.5 1 1.5 1 1.9 2 1.9 1.6 2 3
Targets based on AWWA Benchmarking Water Utility Customer Relations Best Practices
Customer Service CenterScorecard

Finance-Customer Service CenterCall Volume
0
1000
2000
3000
4000
5000
6000
7000
8000
Ja
n
Fe
b
Ma
r
Apr
Ma
y
Ju
n
Ju
l
Aug
Sep
Oct
Nov
Dec
Nu
mb
er
of
Call
s
Call Volume 2017 Call Volume 2016

Finance-Customer Service CenterWrap Up Code
0
5000
10000
15000
20000
25000

Finance-Customer Service Center
-
2,000
4,000
6,000
8,000
10,000
12,000
JANUARY FEBRUARY MARCH APRIL MAY JUNE JULY AUGUST SEPTEMBER OCTOBER NOVEMBER DECEMBER
2017 CITY HALL PAYMENTS
In Person Mail

Finance-Customer Service Center
0
5000
10000
15000
20000
25000
30000
35000
40000
45000
JAN FEB MAR APR MAY JUN JUL AUG SEP OCT NOV DEC
PAPER & E-BILLS COMPARISON
PAPER BILLS E-BILLS

Finance-Customer Service Center
-
5,000
10,000
15,000
20,000
25,000
January February March April May June July August September October November December
THIRD PARTY WATER PAYMENTS
Lockbox (REMITCO) E Banking (Metavante, Checkfree, ORCC)
On Line (LevelOne ACH, CC) Phone (IVR )

Customer Service Center
Accomplishments
• Helped a total of 1,054 customers at the
side window
• Took a total of 6,555 COMED payments
• Trained new employees in different
processes to improve our departmental
operations and to provide excellent
customer service
• Improved communication across City
departments to help our billing process
more effective
• Contributed to the implementation of the
Tree Loan Program in collaboration with
Forestry
Areas of Improvement
• Continue to communicate with other
departments to find solutions on
pending issues affecting our billing
and setting up processes in place to
increase efficiency.
• Work on a timeline to implement
Citizen’s Self Service and revise
forms/documents in preparation for
upcoming changes
• Improve our internal operations and
find ways to simplify work while
achieving optimal results

PRESENTED BY:
Shurice Hunter
Director of Human Resources
Human Resources

HUMAN RESOURCES DEPARTMENT
Key Strategic Initiatives - 2017
1. Maintain a fair and equitable work environment
2. Continue to grow wellness program to better meet the needs of our employees and their families
3. Maintain the fiscal integrity of the health fund and risk management program
4. Develop and train our workforce to meet the needs of the city organization
5. Offer the best in customer service to our employees and our managers

Human ResourcesAreas of Achievement
• Proactively managed benefit plan to result in flat rate increases for:
• BCBS - Medical Third Party Administration
• Express Scripts, Inc. Prescription Drug Benefit – New contract for 2017 with
greater discounts and improved rebates
• MetLife Employer and Voluntary Life Insurance
• Worked with City Departments to maintain staffing:
• 84 permanent positions and 28 temporary positions filled and on-boarded
• 30 positions reclassified.
• Maintained support for employees and departments with HR staffing at 60% for a
portion of the year.
• Welcomed 2 new employees to the Human Resources Department:
• Shurice Hunter – HR Director
• Jen Klemm – HR Specialist

Human ResourcesAreas of Achievement - Continued
Biometrics and Flu Shots• 604 Blood Draws and 428 HHRAs completed and 390 Flu Shots provided in 2017
Held 16 Wellness Events with over 900 total attendees
Drug & Alcohol Screening• Police 38% (Goal is minimum of 25%), Fire 27% (Not to exceed 27%)
• CDL 87 tests were conducted (on quarterly basis)

Human ResourcesBudget Performance Measurements
2015 2016 2017
Applications 1,829 3,094 3,734
Vacancies Filled 62 80 84
Workers' Comp Claims 201 191 214
Workers' Comp Lost Days 951 336 602
Training Sessions 30 53 59
Health Insurance Participants 3,222 3,186 3,197
Flex Spending Participants 327 327 311

Wellness Center 2017
• Achieved a 3:1 cumulative ROI in overall health claims projections.
o Actual claims paid are $7.7M below projection over the past three years.
• Exceeded employee engagement rates by 18 point at 78.3%.
• Engaged 64% and 47% of High & Chronic employees and dependents
respectively (509 unique patients) in their health at COR Wellness.
• Increased baseline screening rates from 81% Year 2 to 84% in Year 3.
• 794 unique patients improved at least one risk factor (130 more than Year 2).
• Patient satisfaction in Year End Survey 90%.
• Continued occupational health services for multiple departments resulting in
cost savings for the organization by eliminating the need for use of other
occupational health centers.

COR Wellness Opens
Cumulative $7.73M below projection, est. ROI = 3.0:1

40%
78%
33% 33%40%
21%
10%
18% 20%
20%
10%
4%
38%
19% 9%
71%
93%89%
72%69%
0%
10%
20%
30%
40%
50%
60%
70%
80%
90%
100%
AFSCME n=167 AFSCME-B&C n=69 Fire Union n=286 Police Union n=263 Non-Represented n=239
Coaching Acute/Medical only Lab-Only Utilization
Employee Engagement by Bargaining Unit

Health Plan by the Numbers
Plan Costs 2015 2016 2017 Change
Medical Only 12,526,996.70$ 13,414,705.81$ 12,999,506.00$ (415,199.81)$
Total Plan Expenses 18,062,532.88$ 19,016,933.29$ 18,013,685.73$ (1,003,247.56)$
Cost per Employee 2015 2016 2017 Change
No. of Employees/Retirees 1185 1221 1238
Medical Only 10,571.31$ 10,986.66$ 10,500.41$ (486.25)$
Total Plan Expenses 15,242.64$ 15,574.88$ 14,550.63$ (1,024.25)$
Cost per Plan Participant 2015 2016 2017 Change
3222 3186 3197
Medical Only 3,919.59$ 4,210.52$ 4,066.16$ (144.36)$
Total Plan Expense 5,651.61$ 5,968.91$ 5,634.56$ (334.35)$

Workers’ Comp by the Numbers
• Total claim frequency increased 8% with 197 claims in 2016 and 214 in 2017.
• Fire Department claims frequency decreased 10% from 60 in 2016 to 55 in
2017.
• Police Department had 91claims in 2016 and 98 in 2017.
• Public Works Department claims frequency was 24 in 2016 and 17 in 2017.
• In 2017, 87% of all claims reported within 3 days from the accident
• Lost Time Claims frequency rate decreased 11% from 2016 to 2017
• Medical Only Claims frequency rate decreased by 3% from 2016 to 2017

Workers’ Comp by the Numbers
The leading departments in Frequency and Severity for 2017:
• Police Sworn: 98 claims with $1,240,907 incurred
• Fire Sworn: 55 claims with $244,286 incurred
• Public Works Water: 14 claims with $22,897 incurred
• Human Service – Clerical/Administrative: 14 claims with
$16,271 incurred

2018 Human Resources Objectives
Enhance the employee performance evaluation tool for non-
represented employees.
Enhance new employee on-boarding orientation process to
include organizational and City principles and departmental
orientation.
Establish a strategic growth build out plan for CORWellness
Center.
Continue to partner with the Wellness Group to proactively
plan 2018 wellness agenda.

PRESENTED BY:
Glenn Trommels
Information Technology Director
Information Technology

• Implement FTF Initiatives
• Implement New CAD and RMS systems
• Support NG911 initiative
• Support Electronic Plan Review Project
• Implement Vendor Self-Serve, TCM, Utility Billing
• Support Upgrade to WinGIS Infrastructure
Information Technology
Key Strategic Initiatives
2018

• Major Hansen Upgrade
• Major Munis Upgrade
• Data Center Core Switch Upgrade
• Finalize New FOIA System
• Continued Enhancement of Security Posture
• Fiber to Last Three City Buildings (Career Goal!)
Information Technology
Key Strategic Initiatives
2018

Information TechnologyDashboard
Jan Feb Mar Apr May Jun Jul Aug Sep Oct Nov Dec YTD
WO Open 769 710 863 801 853 796 730 806 716 685 670 673 9072
WO Closed 672 704 810 763 883 757 743 767 775 952 670 665 9161
WO % 87.39% 99.15% 93.86% 95.26% 103.52% 95.10% 101.78% 95.16% 108.24% 138.98% 100.00% 98.81% 100.98%
Server
Availability99.99% 100.00% 99.99% 99.86% 100.00% 99.97% 100.00% 99.98% 100.00% 100.00% 100.00% 100.00% 99.98%
Servers
Within SLA79.20% 98.40% 80.00% 88.00% 93.44% 94.21% 95.87% 76.92% 97.44% 91.38% 92.24% 97.22% 90.36%
Network
Availability99.99% 99.99% 99.95% 100.00% 99.98% 99.98% 99.96% 99.97% 99.99% 100.00% 100.00% 99.99% 99.98%
Network
Within SLA88.16% 69.74% 92.11% 94.52% 83.56% 89.04% 87.67% 90.41% 90.41% 95.83% 98.61% 96.00% 89.67%

Information TechnologyServer / Network Availability
99.80%
99.85%
99.90%
99.95%
100.00%
1 2 3 4 5 6 7 8 9 10 11 12
Availability
Servers Network

Information TechnologyAchievements
• PD Districts: planning / fiber / network / VoIP / wireless / cameras / moves
• Station #7 / Shop: planning / fiber / network / VoIP / wireless / cameras / moves
• Enterprise Storage Upgrade
• Fiber connection to St. Anthony
• Fiber connection to State and Main Deck
• 911 firewall upgrades
• Repaired 911 Positron server
• Memory upgrades on servers
• Moved more vendors to SecureLink remote access
• Implemented monitoring system for battery backup (more than 50 devices)
• Upgrade on RSA two factor authentication system
• Implemented enterprise job scheduling system
• Upgraded 911 UDT server and assumed administrative duties
• Asset management for storm water detention basins
• Assisted PW to build GIS water distribution network
• Collaborated with WinGIS to create custom fire map application
• Finalized Opportunity Space project for CD and Fire departments

Information TechnologyAchievements
• Created interactive field editing web map for hydrant inspection contractors
• Automated the mapping of traffic accidents
• Supported PW with the implementation of the City’s first CCTV system
• Implemented City’s first video conferencing system at police districts
• Upgraded anti-virus infrastructure System
• Retired (almost all) Windows 2003 Servers (two remain!)
• Automated InTime data download for Munis payroll
• Substantially completed retool of FOIA system
• Automate creation of child permits in building module in Hansen
• Implemented fire service workflow in Hansen
• Rewrote planning workflow in Hansen for greater efficiency
• Updated service request report for Aldermen
• Implemented “responsive” website for online service requests
• Created Blight Reduction Program demolition workflow in Hansen
• Supported the launch of the City’s new website
• Acting Director for WinGIS for 2017
• Closed out over 9,100 service requests

Information TechnologyAreas of Improvement
• Finalize New FOIA System
• Continued Enhancement of Security Posture
• Continued Effort Towards Disaster Recovery

PRESENTED BY:
Nicholas Meyer
Legal Director
Legal Department

Legal DepartmentAchievements
City Council -
• 301 Committee Reports
• 279 Resolutions
• 231 Ordinances
Highlights include:
• Amerock Hotel and Convention Center
- Passage of ordinances for the creation of the new Amerock
Hotel TIF and amendment to the Westside #2 TIF
• Indoor Market Agreements approved
• Barmore/Kingdom Authority case finalized
• 25 Development Agreements and Intergovernmental Agreements were
approved
• Adoption of a Building and Sanitation Code Hearing Fine Reduction Policy

Legal DepartmentAchievements
Claims -
• Processed 152 claims. An increase of 10% from 2016
Collections/Ordinance Prosecution -
• 86% collection rate for damage to City-owned property/contract
enforcement (small claims cases): $2,300
• Total of $80,576 in fines paid to the City through prosecution of general
ordinance violations
- A total of 817 ordinance cases were prosecuted
Demolitions -
• Assisted in the fast-track demolition of 116 properties

Legal DepartmentAchievements
Diversity Procurement -
• Airport Drive Landscaping and Signage – awarded with federal funds from EDA
Grant - trained and worked with Minority Prime Contractor
• Cliffbreakers renovation completed in accordance under HUD 108 loan
• Demolition and Façade projects
• Continued networking and outreach efforts (participation in events, expos and
meetings including):
- Northwestern Illinois Building Trades
- Doing Business in Rockford Task Force & Forum
- RAMM (Rockford Association for Minority Management)
- SWIFTT (South West Ideas for Today and Tomorrow)
- Illinois Tollway Technical Assistance
- Prairie Stat College Construction Business Development Center
- William Charles Sponsored DBE/MBE/WBE Event
- SBDC (Illinois Small Business Development Center)
- ADME (Advancing the Development of Minority Entrepreneurship)
• Management Trainings
- One formal training
- Numerous informal trainings throughout the year regarding compliance with Davis Bacon,
Prevailing wage and LCPTracker

Legal DepartmentAchievements
FOIA -
• Processed 2901 requests, which represents a 10% decrease from 2016
• Amicably resolved all cases on appeal to AG’s office and won all court
actions
Impounds -
• Impounded 2,182 vehicles (1,259 released to owner/923 auctioned)
• Total amount collected: $685,034.30
- $477,205 from released vehicles
- $20,850 of Fees/Fines
- $186,979.30 from auctioned vehicles

Legal DepartmentAchievements
Land Acquisition -
• 17 properties for CD
• 5 properties for Public Works (Gregory Heights Drainage project)
• 24 properties for BRP
• 20 permanent easements for Miracle Mile Lighting project
• 14 properties for the West State Street expansion project
City-Owned Properties Sold:
• 6 properties for a total of $1,185,604
Liquor and Tobacco Licenses -
• Issued 18 Liquor and 14 Tobacco Licenses
• The 18 Liquor Licenses consisted of:
- 12 Consumption Licenses
- 5 Packaged Liquor Sales Licenses
- 1 Consumption and Packaged Liquor Sales License
• Currently there are a total of 514 licenses which include 358 Liquor Licenses and
156 Tobacco Licenses
• There are currently 9 Liquor Licenses that were approved but have not yet met
conditions for issuance of license

Legal DepartmentAchievements
Litigation -
• Won 10 cases (77%):
Warren v. Armendariz (Excessive Force)
Parham v. City of Rockford (Sidewalk Fall)
Fleming v. City of Rockford (Excessive Force)
Schwab v. City of Rockford (Negligence Maintenance of Roadway)
Brandies v. City of Rockford (Negligence Maintenance of Roadway)
Chavez v. City of Rockford (Malicious Prosecution)
Mangrum v. City of Rockford (Negligent Pursuit)
Acuity v. City of Rockford (Negligent Traffic Light Maintenance)
Terra Creek v. City of Rockford (Zoning and special use permit)
City of Rockford v. Chicago Title Land Trust Company et al. (Eminent Domain)
• Settled 3 cases (23%):
Rockford Renaissance v. City of Rockford (Breach of Contract- $2,108,204.61)
Damon v. City of Rockford (Motor Vehicle Accident - $205,000.00)
Ponkuski v. City of Rockford (Negligent Elevator Maintenance - $10,000.00)