Acylphosphatase overexpression triggers SH-SY5Y differentiation towards neuronal phenotype
Overexpression of caveolin-1 and -2 in cell lines and in human samples
of inflammatory breast cancer
Gert G. Van den Eynden1, Steven J. Van Laere1, Ilse Van der Auwera1, Sofia D. Merajver2,Eric A. Van Marck1, Peter van Dam1, Peter B. Vermeulen1, Luc Y. Dirix1, and Kenneth L. vanGolen1Translational Cancer Research Group Antwerp (Lab Pathology, University of Antwerp/University Hospital Antwerp,Edegem; Oncology Center, General Hospital St-Augustinus, Wilrijk), Belgium; 2Department of Internal Medicine,Division of Hematology and Oncology, The University of Michigan Comprehensive Cancer Center, Ann Arbor,Michigan, USA
Key words: caveolin-1, caveolin-2, inflammatory breast cancer, methylation, RhoC GTPase
Summary
Purpose. Inflammatory breast cancer (IBC) is the most aggressive form of locally advanced breast cancer (LABC).The IBC phenotype is characterized by an infiltrative growth pattern, increased (lymph)angiogenesis and thepropensity to invade dermal lymphatics. In pancreatic cancer, interactions between caveolin-1 and RhoC GTPase, akey molecule in causing the IBC phenotype, regulate tumour cell motility and invasion. In this study we sought toinvestigate the role of caveolin-1 and -2 in IBC cell lines and in human IBC samples.
Experimental design. Differential methylation techniques identified the methylation status of the caveolin-1and -2 promoters in human mammary epithelial cells (HMECs) and the SUM149 cell line. In cell line experi-ments, caveolin-1 and -2 mRNA and protein expression were compared in HMECs, MCF10A, the SUM102 non-IBC cell lines and 2 IBC cell lines (SUM149 and SUM190). Furthermore, caveolin-1 and -2 mRNA and proteinexpression were compared in human IBC and non-IBC samples using cDNA microarray, real-time qRT-PCR andimmunohistochemistry. Results were correlated with RhoC protein expression data.
Results. In the SUM149 cell line, the caveolin-1 and -2 promoter sites were hypomethylated. A significantlyincreased expression of caveolin-1 and -2, both at the mRNA and protein level was found in IBC cell lines and inhuman samples of IBC: caveolin-1 and -2 mRNA were respectively 1.7 (p = 0.02) and 2.2 (p = 0.03) fold moreexpressed in IBC compared to non IBC and at the protein level, 41.4% of IBC specimens expressed either caveolin-1 or-2, compared to 15.6% of non-IBC specimens (p = 0.03). Furthermore a correlation was found between RhoCprotein expression and caveolin-1 (p = 0.1) or caveolin-2 (p = 0.09) or either caveolin-1 or -2 protein expression(p = 0.04).
Conclusions. Although considered a tumour suppressor in breast cancer, we demonstrated overexpression ofcaveolin-1 and -2 in IBC cell lines and in human samples of IBC,most likely due to hypomethylation of their respectivepromoters. These results confirm the distinctmolecular signature of IBC.Our data further suggest interaction betweenRhoC GTPase and the caveolins in IBC.
Introduction
Inflammatory breast cancer (IBC) is a distinct andaggressive subtype of locally advanced breast cancer(LABC). At time of diagnosis virtually all patients havelymph node involvement and 1/3 of the patients havedistant metastases, resulting in a very poor prognosis.Even when receiving combined modality treatmentincluding neo-adjuvant chemotherapy, less than 50% ofIBC patients have an overall survival of more than5 years [1]. The aggressive IBC phenotype is marked by adiffusely infiltrative rather than nodule-forming growthpattern, by increased angiogenesis and lymphangiogenesis
[2, 3] and by the propensity of IBC to invade the der-mal lymphatics and metastasize early in the develop-ment of the disease. It is the extraordinary invasivenessof the disease that suggests an important role for fac-tors involved in cell motility and migration in thepathophysiology of IBC. Better understanding of themolecular mechanisms involved in the IBC phenotypecan therefore lead to better understanding of the biologyof breast cancer and metastasis ‘an sich’.
Caveolin-1 is the major protein component ofcaveolae: specialized lipid rafts that are recognized inelectron micrographs as 50–100 nm invaginations of theplasma membrane [4]. Although similar in distribution
Breast Cancer Research and Treatment (2006) 95: 219–228 � Springer 2005DOI 10.1007/s10549-005-9002-1

and tissue expression to caveolin-1, caveolin-2 is lessextensively studied. Many receptors and signal trans-duction molecules are concentrated within caveolae;therefore caveolae are proposed to be able to integrateand regulate cellular signalling pathways includingGTPases (i.e. Ras and RhoA). Caveolin-1 has beenshown to directly interact with small GTP bindingproteins such as RhoA, a homologue of RhoC (95%identical) and with the epidermal growth factor receptor(EGFR) [5–6]. Abnormal EGFR expression and acti-vation, as is often found in IBC, can lead to caveolin-1phosphorylation and subsequent cell motility [7–9].
Although other Rho-family members are detected inhuman cancers, RhoC expression is associated withparticularly aggressive human cancers [10–25]. RhoC hasalso been intimately linked to the unique IBC phenotype.RhoC is overexpressed and active in the majority of IBCand is involved in the motile, invasive, angiogenic andmetastatic phenotype through mitogen activated proteinkinase (MAPK) signaling. Overexpression of RhoC inHMECs recapitulated the IBC phenotype with regards toinvasion, motility and angiogenesis [26–28]. Furthermore,in tumours smaller than 1 cm, RhoC expression is a goodmarker to identify breast cancer patients with increasedrisk of developing metastases [29].
Therefore, the aim of this study was to investigate therole of caveolin-1 and -2 in IBC. We studied the meth-ylation status of the caveolin-1 and -2 promoters in IBCcell lines. Subsequently, the expression of caveolin-1 and-2 was compared, at the mRNA and protein level, inIBC and non-IBC cell lines and in human samples ofIBC and non-IBC patients. Results were confrontedwith cDNA microarray experiments comparing IBC andnon-IBC patient samples [30] and were correlated toRhoC protein expression levels [31].
Materials and methods
Cell line experiments
Culture conditionsThe SUM190, SUM149 and SUM102 cell lines weremaintained under defined culture conditions as previouslydescribed [32–35]. E6/E7 immortalized human mammaryepithelial cells (HMECs: [36]) were grown in 5% FBS (LifeTechnologies, Gaithersburg, MD)-supplemented Ham’sF12 medium (Life Technologies) containing insulin,hydrocortisone, epidermal growth factor and choleratoxin (Sigma Chemical Co., St. Louis, MO). MCF10Acells were maintained in serum free mammary epithelialgrowthmedium (Clonetics, Rockland,ME) supplementedwith cholera toxin. All cell lines were kept at 37 �C in a90% air/10% CO2 atmosphere.
Differential methylation analysisGenomic DNA (gDNA) was isolated from theSUM149, HMECs and normal lymphocytes (isolatedfrom the patient whose tumour the SUM149 cell line
was isolated from) using Trizol (Invitrogen, Carlsbad,CA). Two lg aliquots of gDNA were digested with20 units of each RsaI, RsaI + MspI (a methylationinsensitive restriction enzyme), or RsaI + HpaI (amethylation sensitive restriction enzyme) for 16 h at37 �C. Restriction enzymes were heat inactivated for20 min at 65 �C. The digested gDNAs were amplified byarbitrarily primed PCR (AP-PCR) according to theoriginal published protocol [37] using a single-primer(AACCCTCACCCTAACCCCGG) or two primers(AACCCTCACCCTAACCGCGC+AACCCTCACAACCCGCG). PCR reactions were performed in a finalvolume of 25 ll with the following components: 10 mMTris–HCl pH 8.3, 1.5 mM MgCl2, 50 mM KCl, 200 lMdNTPs, 2 lCi c32P-dATP (MP Biomedicals, Irvine, CA) ,25 pmol primer and 0.53 U Taq polymerase (Roche) at94 �C for 30 s, 40 �C for 60 s and 72 �C for 90 s for 5cycles followed by 94 �C for 15 s, 55 �C for 15 s and72 �C for 60 s for 30 cycles. PCR products were sepa-rated on an 8 M urea 6% polyacrylamide gel, dried tofilter paper and exposed to Kodak X-Omat film for 72 hat RT. Differentially methylated products were excised,eluted in TE buffer, reamplified by PCR, cloned into thepGEM-T Easy vector system (Promega, Madison, WI)and sequenced by the University of Michigan DNAsequencing core. Sequences were submitted to BLASTN(http://www.ncbi.nlm.nih.gov/BLAST/).
Semiquantitative RT-PCRTotal RNA was harvested from actively growing cells at60% confluence using Trizol Reagent (Invitrogen) andcDNAwasmade using theAMV-reverse transcriptase kit(Promega). Caveolin-1 and -2 transcripts were PCRamplified using 1:100 dilutions of caveolin specific prim-ers; caveolin-1 forward 5¢-CGTAGACTCGGAGGGACATC-3¢, reverse 5¢-GATGCGGACATTGCTGAATA-3¢,caveolin-2 forward 5¢-ATGACGCCTACAGCCACCACAG-3¢, reverse 5¢-GCAAACAGGATACCCGCAATG-3¢.GAPDH was amplified as a loading control. PCR prod-ucts were separated on a 1.2% TAE agarose gel andvisualized by ethidiumbromide staining (SigmaChemicalCo.). The intensity of ethidium bromide stained PCRproducts was measured using ImageJ (NIH sharewareprogram) on a negative image. Caveolin message levelswere calculated relative to GAPDH levels.
Western blot analysisCells were grown in 100 mm dishes until reaching 70%confluence. Protein was harvested with 500 ll RIPAbuffer with the addition of 1 mM sodium orthovana-date, 0.3 mg/ml aprotinin, and 0.1 mg/ml phenylmeth-ylsulfonyl fluoride. Aliquots of 50 lg were mixed withLaemmli buffer, heat denatured, separated by 12.5%SDS-PAGE and transferred to nitrocellulose. Nonspe-cific binding was blocked by 1 h incubation with 5%powdered milk in Tris-buffered saline with 0.05% Tween20 (Sigma Chemical Co.). Immobilized proteins wereprobed using antibodies for caveolin-1 (clone 2297,Transduction Laboratories, BD Biosciences, San Diego,
220 GG Van den Eynden et al.
CA) and caveolin-2 (clone 65, Transduction Laborato-ries). Levels of actin were determined as loading controls(actin antibody (C2), Santa Cruz Biotechnology, SantaCruz, CA). Protein bands were visualized by ECL andexposed to hyperfilm (Amersham-Pharmacia Biotech,Piscataway, NJ). Densitometry was performed usingImageJ (NIH shareware program). Protein levels werecalculated relative to actin levels.
Statistical analysisStatistics were performed using Prism4 (Graphpad Soft-ware, San Diego, CA) graphing and statistics program.Mean relative caveolin-1 and -2 mRNA and proteinexpression were compared between cell lines, using One-Way ANOVA statistics and Bonferroni’s post hoc testing.
Human tissue sample experiments
Tissue samplesAll tumour specimens included in this study were ob-tained pre-treatment (before any neo-adjuvant chemo-and/or hormonal therapy) and after written informedconsent. All protocols were reviewed and approved bythe ethical committee of the General HospitalSint-Augustinus. For the cDNA microarray and quan-titative RT-PCR experiments, tumour specimens of 17consecutive IBC and 20 control non-stage matched pa-tients with breast cancer were collected and snap-frozenin liquid nitrogen. IBC cases were diagnosed by strictlyrespecting the criteria mentioned by the American JointCommittee on Cancer as T4d [38]. All IBC patientspresented with a recently developed diffuse enlargementof the breast with redness and edema of more than onethird of the skin of the breast. The presence of tumouremboli in dermal lymphatics was, as an isolated patho-logical finding, not sufficient for the diagnosis of IBC.The average age of the IBC patients was 59.9 years(range: 40.5–80.1 years). The non-IBC control popula-tion consisted of 6 T1, 4 T2, 7 T3 and 3 T4 breast tu-mours. The average age of the non-IBC patients was61.6 years (range: 42.1–77.8 years). All but one IBC andall non-IBC resection specimens included for the qRT-PCR and cDNA microarray analysis were also includedfor the IHC analysis. Both groups were enlarged with 12patients from whom no fresh frozen tissue was available.Clinico-pathological characteristics are listed in Table 1.Tumour size, lymph node status and estrogen receptorand progesterone receptor status were recorded by re-view of pathology files. Tumours were subtyped asductal, lobular or special type (medullary, mucinous,tubular,. . .) carcinoma and histologically graded as I-IIIaccording to the Nottingham modification of the Bloomand Richardson histological grading scheme.
cDNA microarrays and Real-Time quantitative ReverseTranscriptase-PCRTotal RNA was extracted with the RNeasy Mini RNAisolation kit (Qiagen, Valencia, CA). The AgilentBioanalyzer (Agilent Technologies, Palo Alto, CA) was
used to assess the quality of the RNA. The cDNAmicroarray experiments were performed as describedbefore [30]. Briefly, one microgram of total RNA of eachsample was reverse transcribed, amplified and labelledwith Cy5 using the Amino Allyl MessageAmp aRNAAmplification Kit (Ambion, Woodward, TX). ReferenceRNA (Universal Human Reference RNA, Stratagene, LaJolla, CA) was processed accordingly and was labelledwith Cy3. Sample and reference were competitivelyhybridized onto cDNA microarray slides obtained fromthe Sanger Center (Hixton, Cambridge, UK) as part ofthe Ludwig Institute for Cancer Research/Cancer Re-search United Kingdom (LICR/CRUK) MicroarrayConsortium. These slides were made by linking PCRproducts of cDNA clones on 3D-linked activated glassslides. Each array contained 10750 spots, representing9932 sequence-validated cDNA elements of 6000 knownand named human genes/ESTs. Slides were incubated16 h at 47 �C, washed and scanned using ScanArray(Perkin–Elmer Life and Analytical Sciences, Boston,MA) software. Data were normalized, analysed as de-scribed before [30].
For the RT-PCR experiments, one microgram oftotal RNA was reverse transcribed into cDNA withrandom primers with High-Capacity cDNA Archive kit
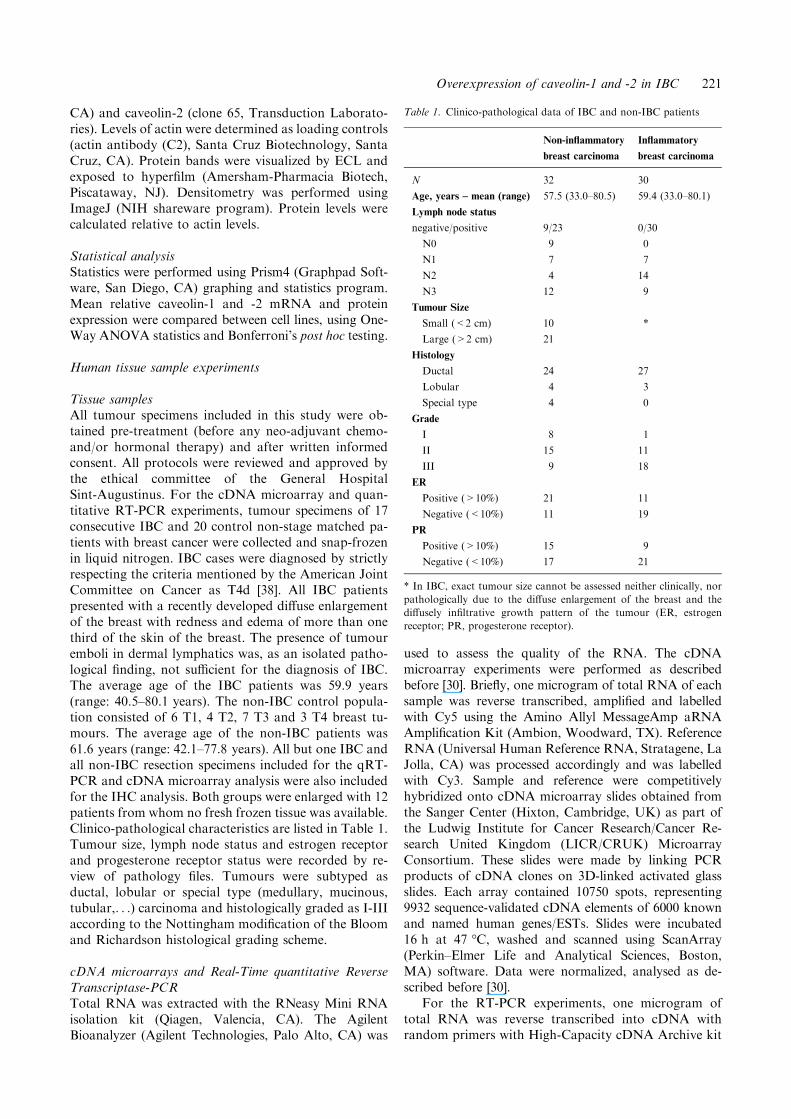
Table 1. Clinico-pathological data of IBC and non-IBC patients
Non-inflammatory
breast carcinoma
Inflammatory
breast carcinoma
N 32 30
Age, years – mean (range) 57.5 (33.0–80.5) 59.4 (33.0–80.1)
Lymph node status
negative/positive 9/23 0/30
N0 9 0
N1 7 7
N2 4 14
N3 12 9
Tumour Size
Small (<2 cm) 10 *
Large (>2 cm) 21
Histology
Ductal 24 27
Lobular 4 3
Special type 4 0
Grade
I 8 1
II 15 11
III 9 18
ER
Positive (>10%) 21 11
Negative (<10%) 11 19
PR
Positive (>10%) 15 9
Negative (<10%) 17 21
* In IBC, exact tumour size cannot be assessed neither clinically, nor
pathologically due to the diffuse enlargement of the breast and the
diffusely infiltrative growth pattern of the tumour (ER, estrogen
receptor; PR, progesterone receptor).
Overexpression of caveolin-1 and -2 in IBC 221

(Applied Biosystems, Foster City, CA). PCR primersand TaqMan probes targeting caveolin-1 and -2, 18SrRNA and b-actin were purchased as Assays-on-de-mand Products for Gene Expression (AppliedBiosystems). Real-time quantitative reverse transcrip-tase-PCR was performed with the ABI Prism 7700 Se-quence Detector (Applied Biosystems). 18S rRNA andb-actin were selected as internal controls for RNA inputand reverse transcription efficiency with the TaqManHuman Endogenous Control Plate (Applied Biosys-tems). All PCR reactions were done in duplicate forboth target genes and internal controls. Relative geneexpressions were presented with the 2)DDCt method [39].
ImmunohistochemistryA representative formalin fixed paraffin embedded tissueblock was selected, five-micrometer sections were cut,deparaffinised and rehydrated through graded alcohols.Antigen retrieval was performed by heating the slides incitrate buffer for 30 min using a warm water bath at98 �C. Endogenous peroxidase was quenched for 10 minwith peroxidase blocking reagent (DakoCytomation,Glostrup, Denmark). Primary antibodies , anti-caveo-lin-1 (1:100; clone 2297; BD Biosciences Pharmingen,San Diego, CA) and anti-caveolin-2 (1:100; clone 65;BD Biosciences Pharmingen, San Diego, CA) wereincubated for 60 min at room temperature. Antibodystaining was visualized using the ChemMate Envisiondetection system (DakoCytomation). Sections werecounterstained with hematoxylin and mounted for lightmicroscopy. Caveolin-1 and -2 status of the tumour cellswas evaluated by light microscopy as either positive (anytumour cell with immunohistochemical staining) ornegative. IHC interpretation was done by 2 independentobservers (GVdE and PV). Interobserver reproducibilitywas excellent (j-value caveolin-1 and -2 : 0.91). For afew discrepant cases slides were reviewed and a con-sensus was reached.
From 46 of 62 tumour specimens, 15 IBC and 31non-IBC, RhoC protein expression was determinedusing a tissue microarray (TMA) we previously vali-dated [31]. Briefly, a TMA containing 34 IBC and 41non-stage matched non-IBC tumours was constructed.After antigen retrieval, IHC staining for RhoC (anti-body kindly provided by Prof. Dr. C.G. Kleer, 1/750,1 h) was performed using the ChemMate Envisiondetection system (DakoCytomation). Interpretation ofRhoC expression was done as described before [29] andthe results were dichotomised: IHC score 0–1 = 0 andscore 2–3 = 1.
StatisticsStatistical analysis was done using SPSS 12.0 software(SPSS, Chicago, IL). Median caveolin-1 and caveolin-2mRNA expression in IBC and non-IBC tumour sampleswere compared using a Mann–Whitney U non-para-metric test. Caveolin-1, caveolin-2 and RhoC proteinexpression were compared using Chi-Square statistics(or Fisher’s Exact Test, if necessary). The correlation
between caveolin-1 and -2 expression at the mRNA andprotein level was analysed using a Spearman’s correla-tion coefficient and Chi-Square statistics, respectively.The correlation between RhoC and caveolin-1 and -2protein expression was analysed using v2 statistics.
Results
Cell line experiments
Using a differential methylation technique utilizingarbitrarily primed PCR [37], we previously identified 15distinct hyper- and hypomethylated transcripts in theSUM149 IBC cell line compared with HMECs [40].Genomic sequencing [41] was used to identify differen-tially methylated sequences. BLASTN analysis of iso-lated sequences revealed that two 249 bp and 248 bphypomethylated transcripts, matched BAC clone CTB-11K1 (AC006159), proximal to chromosomal markerD7S522, corresponding to the caveolin-1 and caveolin-2promoters, respectively.
Since hypomethylation of CpG islands in gene pro-moter regions typically lead to increased gene expres-sion, RT-PCR and Western blot analysis were used tomeasure caveolin-1 and -2 levels in the SUM149 andSUM190 IBC cell lines relative to HMECs, MCF10Asand the SUM102 non-IBC cell lines. Figure 1 shows theresults of a typical RT-PCR and Western blot experi-ment (Figure 1). Relative caveolin-1 and -2 mRNAlevels were measured three separate times and found todiffer significantly in the cell lines (One-way ANOVAp<0.001 and p<0.001, respectively). In the SUM149and SUM190 cell lines, mean relative caveolin-1 mRNAexpression was significantly higher then in HMEC’s(Bonferroni’s post hoc test p<0.001 and p = 0.001,respectively), MCF10A (Bonferroni’s post hoc testp<0.001 and p<0.001, respectively) and SUM102(Bonferroni’s post hoc test p<0.001 and p<0.001,respectively) cell lines. For caveolin-2, significantly in-creased mean relative mRNA expression in IBC celllines compared to HMECs and non-IBC cell lines wasalso found, although the difference between theSUM149 and MCF10A did not reach statistical signifi-cance (Bonferroni’s post hoc test p = 0.125).
Relative caveolin-1 and -2 protein expression werealso measured three separate times. Mean relative pro-tein expression significantly differed between the celllines (One Way ANOVA p = 0.004 and p = 0.002,respectively). Mean relative caveolin-1 protein expres-sion was significantly higher in SUM149 and SUM190IBC cell lines compared to HMECs (Bonferroni’s posthoc test p = 0.1 and p = 0.03, respectively) and theMCF10A (Bonferroni’s post hoc test p = 0.03 andp = 0.01, respectively) cell line. No statistical significantdifference was found between both IBC cell lines and theSUM102 non-IBC cell line (Bonferroni’s post hoc testp = 0.33 and 0.12, respectively). For mean relativecaveolin-2 expression, comparable results were found.
222 GG Van den Eynden et al.

Table 2 shows the mean relative caveolin-1 and -2mRNA and protein expression levels in all cell linesinvestigated (Table 2).
Human sample experiments
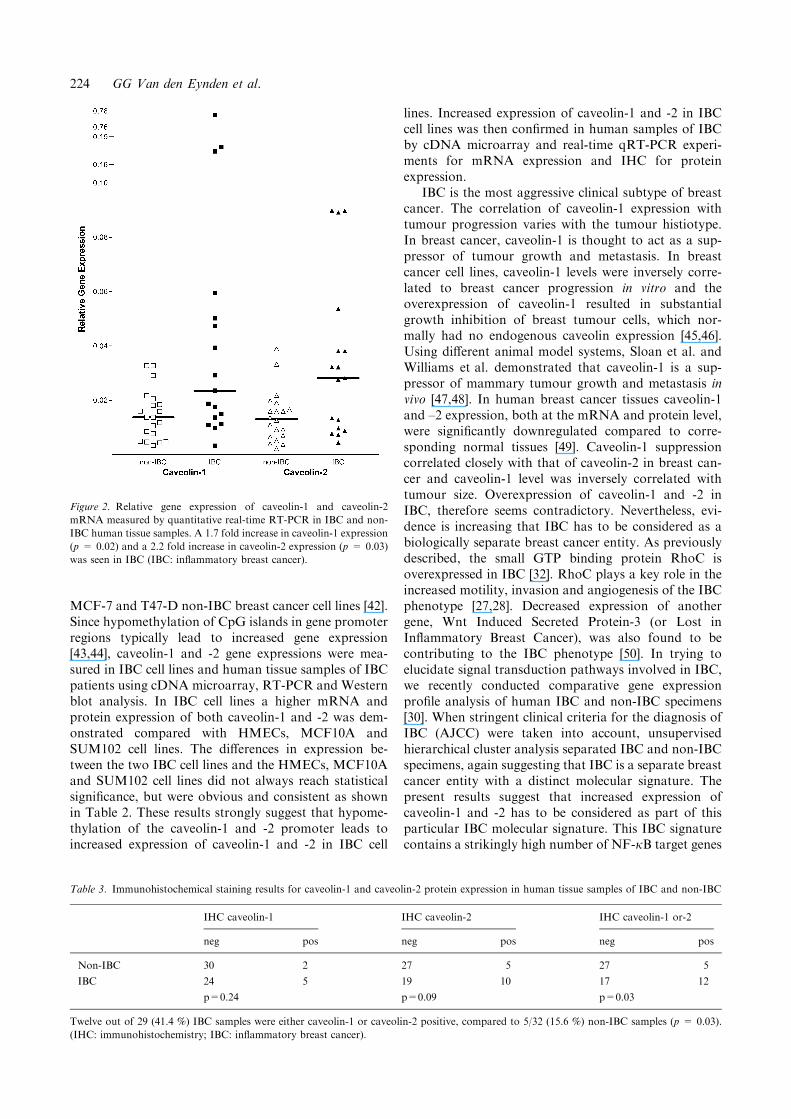
Relative gene expression, measured by cDNA micro-array analysis, for both caveolin-1 and -2 mRNA wasfound to be significantly higher in the human IBCsamples: 1.7 fold for caveolin-1 (p = 0.05) and 1.8 foldfor caveolin-2 (p = 0.04). This was confirmed by real-time quantitative RT-PCR analysis on the same sam-ples: median caveolin-1 expression was 1.7 fold higher(p = 0.02) and median caveolin-2 expression was 2.2fold higher (p = 0.03) in IBC compared to non-IBC(Figure 2). Furthermore, a correlation between relativegene expression for caveolin-1 and -2 in the same samplewas found (q = 0.55, p<0.001).
Table 3 shows the IHC results for caveolin-1 andcaveolin-2 protein expression in IBC and non-IBC.When the expression of both molecules was consideredseparately, no difference was found between IBC andnon-IBC for caveolin-1 (p = 0.24) expression. Forcaveolin-2 a statistical trend to overexpression in IBC(p = 0.09) was found. But 12 out of 29 (41.4%) IBCspecimens did express either caveolin-1 or -2 comparedto only 5 out of 32 (15.6%) non-IBC specimens
(p = 0.03) (Table 3). Again, caveolin-1 and -2 expres-sion were correlated (p = 0.008). Figure 3 representsthe same zone of an IBC specimen showing IHC stain-ing for caveolin-1 and caveolin-2 (Figure 3).
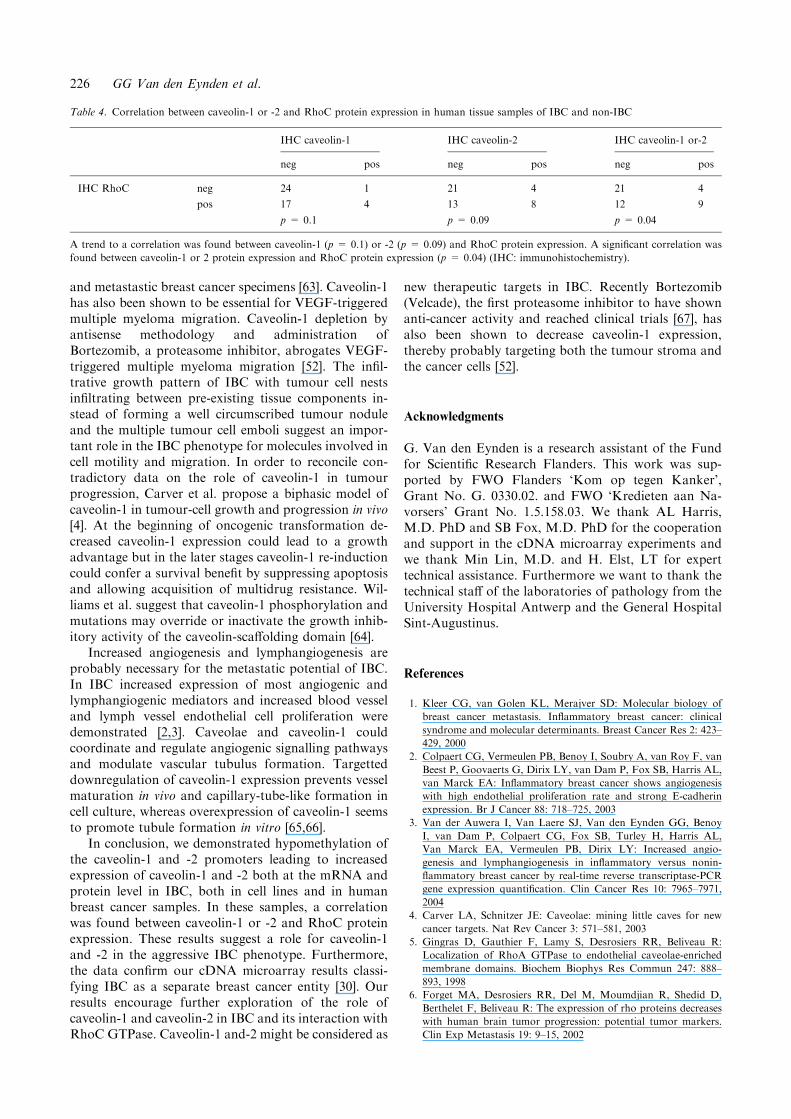
RhoC protein expression was significantly differentbetween IBC and non-IBC: 66.7 % of IBC and 35.5% ofnon-IBC tumour specimens expressed RhoC (p = 0.04).When IBC and non-IBC samples were taken together, atrend to a correlation between caveolin-1 (p = 0.1) orcaveolin-2 (p = 0.09) and RhoC protein expression wasfound. A significant correlation was found betweenRhoC expression and the combined caveolin-1 orcaveolin-2 protein expression (p = 0.04) (Table 4).
Discussion
We used a differential methylation technique utilizingarbitrarily primed PCR [37] to demonstrate hypome-thylation of the caveolin-1 and -2 promoter in theSUM149 IBC cell line. The sequences corresponding tothe caveolin-1 and -2 promoters are 4 of the 10 distincthypomethylated transcripts that we previously identified[40] in the SUM149 IBC cell line compared withHMECs. Engelman et al. demonstrated that hyperme-thylation of CpG islands in the caveolin-1 promoter wasresponsible for decreased caveolin-1 expression in the
Figure 1. RT-PCR and Western blot of caveolin-1 and -2 expression in HMECs and IBC and non-IBC cell lines. (a) Gel electrophoretic image of
RT-PCR amplified caveolin-1 and -2 mRNA in HMECs, MCF10A and SUM102 non-IBC and SUM149 and SUM190 IBC cell lines. GAPDH
was used as a loading control. Increased expression of caveolin-1 and-2 mRNA in SUM149 and SUM190 compared to HMECs, MCF10A and
SUM102 was observed. (b) Western blot image of caveolin-1 and -2 in the same cell lines. b-actin was used as a loading control. Protein levels of
caveolin-1 and-2 mirrored mRNA expression. (HMEC: human mammary epithelial cell; IBC: inflammatory breast cancer).
Table 2. Mean relative caveolin-1 and -2 mRNA and protein expression levels (±SD) in HMECs, MCF10, SUM102, SUM149 and SUM190 cell
lines
HMECs Non-IBC IBC
MCF10A SUM102 SUM149 SUM190
RT-PCR Caveolin-1 45.47 (±13.16) 67.17 (±7.35) 36.63 (±5.07) 144.70 (±19.45) 204.60 (±15.98)
Caveolin-2 32.93 (±8.69) 60.73 (±16.35) 17.57 (±5.30) 95.20 (±15.32) 134.40 (±18.98)
Western Blot Caveolin-1 67.80 (±19.52) 53.43 (±18.24) 83.63 (±32.23) 141.53 (±31.93) 155.97 (±36.75)
Caveolin-2 66.93 (±18.01) 49.00 (±7.50) 102.77 (±17.81) 122.33 (±14.63) 115.24 (±24.66)
Relative caveolin-1 and-2 mRNA and protein levels are higher in IBC compared to non-IBC cell lines. (HMEC: human mammary epithelial cell;
IBC: inflammatory breast cancer)
Overexpression of caveolin-1 and -2 in IBC 223
MCF-7 and T47-D non-IBC breast cancer cell lines [42].Since hypomethylation of CpG islands in gene promoterregions typically lead to increased gene expression[43,44], caveolin-1 and -2 gene expressions were mea-sured in IBC cell lines and human tissue samples of IBCpatients using cDNA microarray, RT-PCR and Westernblot analysis. In IBC cell lines a higher mRNA andprotein expression of both caveolin-1 and -2 was dem-onstrated compared with HMECs, MCF10A andSUM102 cell lines. The differences in expression be-tween the two IBC cell lines and the HMECs, MCF10Aand SUM102 cell lines did not always reach statisticalsignificance, but were obvious and consistent as shownin Table 2. These results strongly suggest that hypome-thylation of the caveolin-1 and -2 promoter leads toincreased expression of caveolin-1 and -2 in IBC cell
lines. Increased expression of caveolin-1 and -2 in IBCcell lines was then confirmed in human samples of IBCby cDNA microarray and real-time qRT-PCR experi-ments for mRNA expression and IHC for proteinexpression.
IBC is the most aggressive clinical subtype of breastcancer. The correlation of caveolin-1 expression withtumour progression varies with the tumour histiotype.In breast cancer, caveolin-1 is thought to act as a sup-pressor of tumour growth and metastasis. In breastcancer cell lines, caveolin-1 levels were inversely corre-lated to breast cancer progression in vitro and theoverexpression of caveolin-1 resulted in substantialgrowth inhibition of breast tumour cells, which nor-mally had no endogenous caveolin expression [45,46].Using different animal model systems, Sloan et al. andWilliams et al. demonstrated that caveolin-1 is a sup-pressor of mammary tumour growth and metastasis invivo [47,48]. In human breast cancer tissues caveolin-1and –2 expression, both at the mRNA and protein level,were significantly downregulated compared to corre-sponding normal tissues [49]. Caveolin-1 suppressioncorrelated closely with that of caveolin-2 in breast can-cer and caveolin-1 level was inversely correlated withtumour size. Overexpression of caveolin-1 and -2 inIBC, therefore seems contradictory. Nevertheless, evi-dence is increasing that IBC has to be considered as abiologically separate breast cancer entity. As previouslydescribed, the small GTP binding protein RhoC isoverexpressed in IBC [32]. RhoC plays a key role in theincreased motility, invasion and angiogenesis of the IBCphenotype [27,28]. Decreased expression of anothergene, Wnt Induced Secreted Protein-3 (or Lost inInflammatory Breast Cancer), was also found to becontributing to the IBC phenotype [50]. In trying toelucidate signal transduction pathways involved in IBC,we recently conducted comparative gene expressionprofile analysis of human IBC and non-IBC specimens[30]. When stringent clinical criteria for the diagnosis ofIBC (AJCC) were taken into account, unsupervisedhierarchical cluster analysis separated IBC and non-IBCspecimens, again suggesting that IBC is a separate breastcancer entity with a distinct molecular signature. Thepresent results suggest that increased expression ofcaveolin-1 and -2 has to be considered as part of thisparticular IBC molecular signature. This IBC signaturecontains a strikingly high number of NF-jB target genes
Figure 2. Relative gene expression of caveolin-1 and caveolin-2
mRNA measured by quantitative real-time RT-PCR in IBC and non-
IBC human tissue samples. A 1.7 fold increase in caveolin-1 expression
(p = 0.02) and a 2.2 fold increase in caveolin-2 expression (p = 0.03)
was seen in IBC (IBC: inflammatory breast cancer).
Table 3. Immunohistochemical staining results for caveolin-1 and caveolin-2 protein expression in human tissue samples of IBC and non-IBC
IHC caveolin-1 IHC caveolin-2 IHC caveolin-1 or-2
neg pos neg pos neg pos
Non-IBC 30 2 27 5 27 5
IBC 24 5 19 10 17 12
p=0.24 p=0.09 p=0.03
Twelve out of 29 (41.4 %) IBC samples were either caveolin-1 or caveolin-2 positive, compared to 5/32 (15.6 %) non-IBC samples (p = 0.03).
(IHC: immunohistochemistry; IBC: inflammatory breast cancer).
224 GG Van den Eynden et al.

that are overexpressed compared to non-IBC. In breastcancer [51], but also in multiple myeloma [52], NF-jBactivation is responsible for invasiveness due to in-creased cell migration and motility. In the breast cancermodel, this was due to induction of an epithelial-mes-enchymal transition by TGFbeta that depended criti-cally on NF-jB signalling, while in multiple myeloma,the NF-jB target gene caveolin-1 triggered tumour cellmigration. Overexpression of caveolin-1 might contrib-ute to the unique IBC phenotype, possibly by interac-tion or regulation of RhoC GTPase activity. As before,we demonstrated an increased protein expression ofRhoC in IBC compared to non-IBC [31]. Furthermore,a correlation between caveolin-1 or caveolin-2 andRhoC protein expression was found. In other cell types,caveolin-1 has been shown to directly interact and reg-
ulate molecules such as RhoA, a homologue of RhoC(95% identical) [5,6]. Furthermore, we demonstratedthat pancreatic cancer cells motility is controlledthrough interaction of RhoC and caveolin-1 [53]. In theprevious cDNA microarray experiments IBC specimenswere classified as belonging to the basal like subtypeaccording to Perou et al. [54]. Since caveolin-2 belongsto the gene set that defines the basal-like subtype,overexpression of caveolin-2 confirms this classificationof IBC to this subtype, indicative of a worse prognosis.
Although in breast cancer mainly considered to be atumour growth and metastasis suppressor, in prostate[55–60] , bladder [61] and esophageal [62] cancer,caveolin-1 may function as a tumour promoter. Fur-thermore, Yang et al. demonstrated an increasedexpression of caveolin-1 in prostate cancer and primary
Figure 3. Immunohistochemical staining of caveolin-1 (a) and caveolin-2 (b) in the same tumour region of an IBC resection specimen. Insets
show membranous staining of IBC tumour cells for caveolin-1 and -2 (IBC: inflammatory breast cancer).
Overexpression of caveolin-1 and -2 in IBC 225
and metastastic breast cancer specimens [63]. Caveolin-1has also been shown to be essential for VEGF-triggeredmultiple myeloma migration. Caveolin-1 depletion byantisense methodology and administration ofBortezomib, a proteasome inhibitor, abrogates VEGF-triggered multiple myeloma migration [52]. The infil-trative growth pattern of IBC with tumour cell nestsinfiltrating between pre-existing tissue components in-stead of forming a well circumscribed tumour noduleand the multiple tumour cell emboli suggest an impor-tant role in the IBC phenotype for molecules involved incell motility and migration. In order to reconcile con-tradictory data on the role of caveolin-1 in tumourprogression, Carver et al. propose a biphasic model ofcaveolin-1 in tumour-cell growth and progression in vivo[4]. At the beginning of oncogenic transformation de-creased caveolin-1 expression could lead to a growthadvantage but in the later stages caveolin-1 re-inductioncould confer a survival benefit by suppressing apoptosisand allowing acquisition of multidrug resistance. Wil-liams et al. suggest that caveolin-1 phosphorylation andmutations may override or inactivate the growth inhib-itory activity of the caveolin-scaffolding domain [64].
Increased angiogenesis and lymphangiogenesis areprobably necessary for the metastatic potential of IBC.In IBC increased expression of most angiogenic andlymphangiogenic mediators and increased blood vesseland lymph vessel endothelial cell proliferation weredemonstrated [2,3]. Caveolae and caveolin-1 couldcoordinate and regulate angiogenic signalling pathwaysand modulate vascular tubulus formation. Targetteddownregulation of caveolin-1 expression prevents vesselmaturation in vivo and capillary-tube-like formation incell culture, whereas overexpression of caveolin-1 seemsto promote tubule formation in vitro [65,66].
In conclusion, we demonstrated hypomethylation ofthe caveolin-1 and -2 promoters leading to increasedexpression of caveolin-1 and -2 both at the mRNA andprotein level in IBC, both in cell lines and in humanbreast cancer samples. In these samples, a correlationwas found between caveolin-1 or -2 and RhoC proteinexpression. These results suggest a role for caveolin-1and -2 in the aggressive IBC phenotype. Furthermore,the data confirm our cDNA microarray results classi-fying IBC as a separate breast cancer entity [30]. Ourresults encourage further exploration of the role ofcaveolin-1 and caveolin-2 in IBC and its interaction withRhoC GTPase. Caveolin-1 and-2 might be considered as
new therapeutic targets in IBC. Recently Bortezomib(Velcade), the first proteasome inhibitor to have shownanti-cancer activity and reached clinical trials [67], hasalso been shown to decrease caveolin-1 expression,thereby probably targeting both the tumour stroma andthe cancer cells [52].
Acknowledgments
G. Van den Eynden is a research assistant of the Fundfor Scientific Research Flanders. This work was sup-ported by FWO Flanders ‘Kom op tegen Kanker’,Grant No. G. 0330.02. and FWO ‘Kredieten aan Na-vorsers’ Grant No. 1.5.158.03. We thank AL Harris,M.D. PhD and SB Fox, M.D. PhD for the cooperationand support in the cDNA microarray experiments andwe thank Min Lin, M.D. and H. Elst, LT for experttechnical assistance. Furthermore we want to thank thetechnical staff of the laboratories of pathology from theUniversity Hospital Antwerp and the General HospitalSint-Augustinus.
References
1. Kleer CG, van Golen KL, Merajver SD: Molecular biology of
breast cancer metastasis. Inflammatory breast cancer: clinical
syndrome and molecular determinants. Breast Cancer Res 2: 423–
429, 2000
2. Colpaert CG, Vermeulen PB, Benoy I, Soubry A, van Roy F, van
Beest P, Goovaerts G, Dirix LY, van Dam P, Fox SB, Harris AL,
van Marck EA: Inflammatory breast cancer shows angiogenesis
with high endothelial proliferation rate and strong E-cadherin
expression. Br J Cancer 88: 718–725, 2003
3. Van der Auwera I, Van Laere SJ, Van den Eynden GG, Benoy
I, van Dam P, Colpaert CG, Fox SB, Turley H, Harris AL,
Van Marck EA, Vermeulen PB, Dirix LY: Increased angio-
genesis and lymphangiogenesis in inflammatory versus nonin-
flammatory breast cancer by real-time reverse transcriptase-PCR
gene expression quantification. Clin Cancer Res 10: 7965–7971,
2004
4. Carver LA, Schnitzer JE: Caveolae: mining little caves for new
cancer targets. Nat Rev Cancer 3: 571–581, 2003
5. Gingras D, Gauthier F, Lamy S, Desrosiers RR, Beliveau R:
Localization of RhoA GTPase to endothelial caveolae-enriched
membrane domains. Biochem Biophys Res Commun 247: 888–
893, 1998
6. Forget MA, Desrosiers RR, Del M, Moumdjian R, Shedid D,
Berthelet F, Beliveau R: The expression of rho proteins decreases
with human brain tumor progression: potential tumor markers.
Clin Exp Metastasis 19: 9–15, 2002
Table 4. Correlation between caveolin-1 or -2 and RhoC protein expression in human tissue samples of IBC and non-IBC
IHC caveolin-1 IHC caveolin-2 IHC caveolin-1 or-2
neg pos neg pos neg pos
IHC RhoC neg 24 1 21 4 21 4
pos 17 4 13 8 12 9
p = 0.1 p = 0.09 p = 0.04
A trend to a correlation was found between caveolin-1 (p = 0.1) or -2 (p = 0.09) and RhoC protein expression. A significant correlation was
found between caveolin-1 or 2 protein expression and RhoC protein expression (p = 0.04) (IHC: immunohistochemistry).
226 GG Van den Eynden et al.
7. Lu Z, Ghosh S, Wang Z, Hunter T: Downregulation of caveolin-1
function by EGF leads to the loss of E-cadherin, increased tran-
scriptional activity of beta-catenin, and enhanced tumor cell
invasion. Cancer Cell 4: 499–515, 2003
8. Abulrob A, Giuseppin S, Andrade MF, McDermid A, Moreno M,
Stanimirovic D: Interactions of EGFR and caveolin-1 in human
glioblastoma cells: evidence that tyrosine phosphorylation regu-
lates EGFR association with caveolae. Oncogene 23: 6967–6979,
2004
9. Park WY, Cho KA, Park JS, Kim DI, Park SC: Attenuation of
EGF signaling in senescent cells by caveolin. Ann N Y Acad Sci
928: 79–84, 2001
10. Ridley AJ: The GTP-binding protein Rho. Int J Biochem Cell Biol
29: 1225–1229, 1997
11. Takai Y, Sasaki T, Matozaki T: Small GTP-binding proteins.
Physiol Rev 81: 153–208, 2001
12. Fritz G, Just I, Kaina B: Rho GTPases are over-expressed in
human tumors. Int J Cancer 81: 682–687, 1999
13. Cheng JC, Frackelton AR Jr., Bearer EL, Kumar PS, Kannan B,
Santos-Moore A, Rifai A, Settleman J, Clark JW: Changes in
tyrosine-phosphorylated p190 and its association with p120 type I
and p100 type II rasGAPs during myelomonocytic differentiation
of human leukemic cells. Cell Growth Differ 6: 139–148, 1995
14. Moscow JA, He R, Gnarra JR, Knutsen T, Weng Y, Zhao WP,
Whang-Peng J, Linehan WM, Cowan KH: Examination of human
tumors for rhoA mutations. Oncogene 9: 189–194, 1994
15. del Peso L, Hernandez-Alcoceba R, Embade N, Carnero A, Esteve
P, Paje C, Lacal JC: Rho proteins induce metastatic properties in
vivo. Oncogene 15: 3047–3057, 1997
16. Imamura F, Mukai M, Ayaki M, Takemura K, Horai T, Shinkai
K, Nakamura H, Akedo H: Involvement of small GTPases Rho
and Rac in the invasion of rat ascites hepatoma cells. Clin Exp
Metastasis 17: 141–148, 1999
17. Clark EA, Golub TR, Lander ES, Hynes RO: Genomic analysis of
metastasis reveals an essential role for RhoC. Nature 406: 532–
535, 2000
18. Carr KM, Bittner M, Trent JM: Gene-expression profiling in
human cutaneous melanoma. Oncogene 22: 3076–3080, 2003
19. Marionnet C, Lalou C, Mollier K, Chazal M, Delestaing G,
Compan D, Verola O, Vilmer C, Cuminet J, Dubertret L, Basset-
Seguin N: Differential molecular profiling between skin carcino-
mas reveals four newly reported genes potentially implicated in
squamous cell carcinoma development. Oncogene 22: 3500–3505,
2003
20. Horiuchi A, Imai T, Wang C, Ohira S, Feng Y, Nikaido T,
Konishi I: Up-regulation of small GTPases, RhoA and RhoC, is
associated with tumor progression in ovarian carcinoma. Lab In-
vest 83: 861–870, 2003
21. Kamai T, Tsujii T, Arai K, Takagi K, Asami H, Ito Y, Oshima H:
Significant association of Rho/ROCK pathway with invasion and
metastasis of bladder cancer. Clin Cancer Res 9: 2632–2641, 2003
22. Shinto E, Tsuda H, Matsubara O, Mochizuki H: [Significance of
RhoC expression in terms of invasion and metastasis of colorectal
cancer]. Nippon Rinsho 7(61 Suppl), 215–219, 2003
23. Wang W, Yang LY, Yang ZL, Huang GW, Lu WQ: Expression
and significance of RhoC gene in hepatocellular carcinoma. World
J Gastroenterol 9: 1950–1953, 2003
24. Kondo T, Sentani K, Oue N, Yoshida K, Nakayama H, Yasui W:
Expression of RHOC is associated with metastasis of gastric car-
cinomas. Pathobiology 71: 19–25, 2004
25. Sahai E, Marshall CJ: Rho: GTPases and Cancer. Nat Rev Cancer
2: 133–142, 2002
26. van Golen KL, Bao LW, Pan Q, Miller FR, Wu ZF, Merajver SD:
Mitogen activated protein kinase pathway is involved in RhoC
GTPase induced motility, invasion and angiogenesis in inflam-
matory breast cancer. Clin Exp Metastasis 19: 301–11, 2002
27. van Golen KL, Wu ZF, Qiao XT, Bao LW, Merajver SD: RhoC
GTPase, a novel transforming oncogene for human mammary
epithelial cells that partially recapitulates the inflammatory breast
cancer phenotype. Cancer Res 60: 5832–5838, 2000
28. van Golen KL, Wu ZF, Qiao XT, Bao L, Merajver SD: RhoC
GTPase overexpression modulates induction of angiogenic factors
in breast cells. Neoplasia 2: 418–425, 2000
29. Kleer CG, van Golen KL, Zhang Y, Wu ZF, Rubin MA, Merajver
SD: Characterization of RhoC expression in benign and malignant
breast disease: a potential new marker for small breast carcinomas
with metastatic ability. Am J Pathol 160: 579–584, 2002
30. Van Laere S, Van der Auwera I, Van den Eynden GG, Fox SB,
Bianchi F, Harris AL, van Dam P, van Marck EA, Vermeulen PB,
Dirix LY: Distinct molecular signature of inflammatory breast
cancer bij cDNA microarray analysis. in Press: Breast Cancer
Research and Treatment, 2005
31. Van Den Eynden GG, Van Der Auwera I, Van Laere S, Colpaert
CG, Van Dam P, Merajver S, Kleer CG, Harris AL, Van Marck
EA, Dirix LY, Vermeulen PB: Validation of a tissue microarray to
study differential protein expression in inflammatory and non-
inflammatory breast cancer. Breast Cancer Res Treat 85: 13–22,
2004
32. van Golen KL, Davies S, Wu ZF, Wang Y, Bucana CD, Root H,
Chandrasekharappa S, Strawderman M, Ethier SP, Merajver SD:
A novel putative low-affinity insulin-like growth factor-binding
protein, LIBC (lost in inflammatory breast cancer), and RhoC
GTPase correlate with the inflammatory breast cancer phenotype.
Clin Cancer Res 5: 2511–9, 1999
33. Ethier SP: Human breast cancer cell lines as models of growth
regulation and disease progression. J Mammary Gland Biol
Neoplasia 1: 111–21, 1996
34. Ethier SP, Kokeny KE, Ridings JW, Dilts CA: erbB family
receptor expression and growth regulation in a newly isolated
human breast cancer cell line. Cancer Res 56: 899–907, 1996
35. Sartor CI, Dziubinski ML, Yu CL, Jove R, Ethier SP: Role of
epidermal growth factor receptor and STAT-3 activation in
autonomous proliferation of SUM-102PT human breast cancer
cells. Cancer Res 57: 978–87, 1997
36. Band V, Zajchowski D, Kulesa V, Sager R: Human papilloma
virus DNAs immortalize normal human mammary epithelial cells
and reduce their growth factor requirements. Proc Natl Acad Sci
USA 87: 463–7, 1990
37. Gonzalgo ML, Liang G, Spruck CH 3rd, Zingg JM, Rideout WM
3rd, Jones PA: Identification and characterization of differentially
methylated regions of genomic DNA by methylation-sensitive
arbitrarily primed PCR. Cancer Res 57: 594–9, 1997
38. American Joint Committee on Cancer AJCC Cancer Staging
Manual Sixth Edition. Springer Verlag, New York – Berlin –
Heidelberg, 221–240 2002
39. Livak KJ, Schmittgen TD: Analysis of relative gene expression
data using real-time quantitative PCR and the 2(-Delta Delta
C(T)) Method. Methods 25: 402–408, 2001
40. Davies S, van Golen KL, Hu H, Ethier SP, Merajver S: Identifi-
cation of Genes Differentially Methylated in Inflammatory Breast
Cancer. In: Proceedings of the AACR. AACR 89th Annual
Meeting, New Orleans, LA, 1998, pp 259
41. Pfeifer GP, Steigerwald SD, Mueller PR, Wold B, Riggs AD:
Genomic sequencing and methylation analysis by ligation medi-
ated PCR. Science 246: 810–813, 1989
42. Engelman JA, Zhang XL, Lisanti MP: Sequence and detailed
organization of the human caveolin-1 and -2 genes located near the
D7S522 locus (7q31.1). Methylation of a CpG island in the 5¢promoter region of the caveolin-1 gene in human breast cancer cell
lines. FEBS Lett 448: 221–230, 1999
43. Szyf M: DNA methylation and cancer therapy. Drug Resist Updat
6: 341–353, 2003
44. Szyf M, Pakneshan P, Rabbani SA: DNA methylation and breast
cancer. Biochem Pharmacol 68: 1187–1197, 2004
45. Lee SW, Reimer CL, Oh P, Campbell DB, Schnitzer JE: Tumor
cell growth inhibition by caveolin re-expression in human breast
cancer cells. Oncogene 16: 1391–1397, 1998
46. Fiucci G, Ravid D, Reich R, Liscovitch M: Caveolin-1 inhibits
anchorage-independent growth, anoikis and invasiveness in MCF-
7 human breast cancer cells. Oncogene 21: 2365–2375, 2002
Overexpression of caveolin-1 and -2 in IBC 227

47. Sloan EK, Stanley KL, Anderson RL: Caveolin-1 inhibits breast
cancer growth and metastasis. Oncogene 23: 7893–7897, 2004
48. Williams TM, Medina F, Badano I, Hazan RB, Hutchinson J,
Muller WJ, Chopra NG, Scherer PE, Pestell RG, Lisanti MP:
Caveolin-1 gene disruption promotes mammary tumorigenesis and
dramatically enhances lung metastasis in vivo. Role of Cav-1 in
cell invasiveness and matrix metalloproteinase (MMP-2/9) secre-
tion. J Biol Chem 279: 51630–51646, 2004
49. Sagara Y, Mimori K, Yoshinaga K, Tanaka F, Nishida K, Ohno
S, Inoue H, Mori M: Clinical significance of Caveolin-1, Caveolin-
2 and HER2/neu mRNA expression in human breast cancer. Br J
Cancer 91: 959–965, 2004
50. Kleer CG, Zhang Y, Pan Q, van Golen KL, Wu ZF, Livant D,
Merajver SD: WISP3 is a novel tumor suppressor gene of
inflammatory breast cancer. Oncogene 21: 3172–3180, 2002
51. Huber MA, Azoitei N, Baumann B, Grunert S, Sommer A,
Pehamberger H, Kraut N, Beug H, Wirth T: NF-jB is essential for
epithelial-mesenchymal transition and metastasis in a model of
breast cancer progression. J Clin Invest 114: 569–581, 2004
52. Podar K, Shringarpure R, Tai YT, Simoncini M, Sattler M,
Ishitsuka K, Richardson PG, Hideshima T, Chauhan D, Anderson
KC: Caveolin-1 is required for vascular endothelial growth factor-
triggered multiple myeloma cell migration and is targeted by
bortezomib. Cancer Res 64: 7500–7506, 2004
53. Lin M, Bao L, Boyanapalli M, Merajver S, van Golen KL: Pan-
creatic cancer cell motility is controlled through interaction of
RhoC GTPase and caveolin-1. In: Proceedings of the AACR.
AACR 95th Annual Meeting, Orlando, FL, 2004, S.143
54. Perou CM, Sorlie T, Eisen MB, van de Rijn M, Jeffrey SS, Rees
CA, Pollack JR, Ross DT, Johnsen H, Akslen LA, Fluge O,
Pergamenschikov A, Williams C, Zhu SX, Lonning PE, Borresen-
Dale AL, Brown PO, Botstein D: Molecular portraits of human
breast tumours. Nature 406: 747–752, 2000
55. Timme TL, Goltsov A, Tahir S, Li L, Wang J, Ren C, Johnston
RN, Thompson TC: Caveolin-1 is regulated by c-myc and sup-
presses c-myc-induced apoptosis. Oncogene 19: 3256–3265, 2000
56. Mouraviev V, Li L, Tahir SA, Yang G, Timme TM, Goltsov A,
Ren C, Satoh T, Wheeler TM, Ittmann MM, Miles BJ, Amato RJ,
Kadmon D, Thompson TC: The role of caveolin-1 in androgen
insensitive prostate cancer. J Urol 168: 1589–1596, 2002
57. Tahir SA, Yang G, Ebara S, Timme TL, Satoh T, Li L, Goltsov A,
Ittmann M, Morrisett JD, Thompson TC: Secreted caveolin-1
stimulates cell survival/clonal growth and contributes to metastasis
in androgen-insensitive prostate cancer. Cancer Res 61: 3882–
3885, 2001
58. Nasu Y, Timme TL, Yang G, Bangma CH, Li L, Ren C, Park SH,
DeLeon M, Wang J, Thompson TC: Suppression of caveolin
expression induces androgen sensitivity in metastatic androgen-
insensitive mouse prostate cancer cells. Nat Med 4: 1062–1064, 1998
59. Li L, Yang G, Ebara S, Satoh T, Nasu Y, Timme TL, Ren C,
Wang J, Tahir SA, Thompson TC: Caveolin-1 mediates testos-
terone-stimulated survival/clonal growth and promotes metastatic
activities in prostate cancer cells. Cancer Res 61: 4386–4392, 2001
60. Lavie Y, Fiucci G, Liscovitch M: Up-regulation of caveolae and
caveolar constituents in multidrug-resistant cancer cells. J Biol
Chem 273: 32380–32383, 1998
61. Rajjayabun PH, Garg S, Durkan GC, Charlton R, Robinson MC,
Mellon JK: Caveolin-1 expression is associated with high-grade
bladder cancer. Urology 58: 811–814, 2001
62. Kato K, Hida Y, Miyamoto M, Hashida H, Shinohara T, Itoh T,
Okushiba S, Kondo S, Katoh H: Overexpression of caveolin-1 in
esophageal squamous cell carcinoma correlates with lymph node
metastasis and pathologic stage. Cancer 94: 929–933, 2002
63. Yang G, Truong LD, Timme TL, Ren C, Wheeler TM, Park SH,
Nasu Y, Bangma CH, Kattan MW, Scardino PT, Thompson TC:
Elevated expression of caveolin is associated with prostate and
breast cancer. Clin Cancer Res 4: 1873–1880, 1998
64. Williams TM, Lisanti MP: Caveolin-1 in oncogenic transforma-
tion, cancer, and metastasis. Am J Physiol Cell Physiol 288:
C494–C506, 2005
65. Liu J, Razani B, Tang S, Terman BI, Ware JA, Lisanti MP:
Angiogenesis activators and inhibitors differentially regulate
caveolin-1 expression and caveolae formation in vascular endo-
thelial cells. Angiogenesis inhibitors block vascular endothelial
growth factor-induced down-regulation of caveolin-1. J Biol Chem
274: 15781–15785, 1999
66. Liu J, Wang XB, Park DS, Lisanti MP: Caveolin-1 expression
enhances endothelial capillary tubule formation. J Biol Chem 277:
10661–10668, 2002
67. Park DJ, Lenz HJ: The role of proteasome inhibitors in solid
tumors. Ann Med 36: 296–303, 2004
Address for offprints and correspondence: Peter B. Vermeulen,Department of Pathology, AZ St.-Augustinus, Oosterveldlaan 24,B-2610 Wilrijk, Belgium; Tel.:+32-3-443-4608; Fax:+32-3-443-3036;E-mail: [email protected]
228 GG Van den Eynden et al.
Copyright © 2022 FDOKUMEN