Outdoor Insulation in Polluted Conditions: Guidelines for Selection and Dimensioning Part 2: The DC...
89
518 2 Outdoor Insulation in Polluted Conditions: Guidelines for Selection and Dimensioning Part 2: The DC Case Working Group C4.303 December 2012
-
Upload
independent -
Category
Documents
-
view
0 -
download
0
Transcript of Outdoor Insulation in Polluted Conditions: Guidelines for Selection and Dimensioning Part 2: The DC...
518
2
Outdoor Insulation in Polluted Conditions: Guidelines for Selection and Dimensioning
Part 2: The DC Case
Working Group C4.303
December 2012
OUTDOOR INSULATION IN POLLUTED CONDITIONS: GUIDELINES FOR SELECTION AND DIMENSIONING P A R T 2 : T H E D C C A S E
WG C4.303
Members
Main Authors:
C.S. Engelbrecht, Convenor (NL), J.P. Reynders, Secretary (ZA),
I. Gutman (SE), K. Kondo (JP), C. Lumb (FR), A. Pigini (IT), V. Sklenicka (CZ), D. Wu (SE).
Contributions have been made by:
A.C. Britten (ZA), R. W. Garcia (BR), C. Kovacs (DE), N. Mahatho (ZA), R. Matsuoka (JP),
T. Nakachi (JP), S. Nishimura (JP), A.J. Phillips (US), W. Schwardt (DE), E. Solomonik (RU),
N.J. West (ZA), M. Yamarkin (RU), X. Liang (CN), R. Znaïdi (TN).
Copyright © 2012
“Ownership of a CIGRE publication, whether in paper form or on electronic support only infers right of use for personal purposes. Are prohibited, except if explicitly agreed by CIGRE, total or partial reproduction of the publication for use other than personal and transfer to a third party; hence circulation on any intranet or other company network is forbidden”.
Disclaimer notice
“CIGRE gives no warranty or assurance about the contents of this publication, nor does it accept any responsibility, as to the accuracy or exhaustiveness of the information. All implied warranties and conditions are excluded to the maximum extent permitted by law”.
ISBN : ISBN: 978- 2- 85873-211-1
OUTDOOR INSULATION IN POLLUTED CONDITIONS: GUIDELINES FOR SELECTION AND DIMENSIONING
Page 1
ISBN : (To be completed by CIGRE)
OUTDOOR INSULATION IN POLLUTED CONDITIONS: GUIDELINES FOR SELECTION AND DIMENSIONING
Page 2
OUTDOOR INSULATION IN POLLUTED CONDITIONS: GUIDELINES FOR SELECTION AND DIMENSIONING P A R T 2 : T H E D C C A S E
Table of Contents
MEMBERS ............................................................................................................................ 0
EXECUTIVE SUMMARY ........................................................................................................ 4
DEFINITIONS ....................................................................................................................... 5
ABBREVIATIONS ................................................................................................................. 6 Chapter 1: Introduction ........................................................................................................................... 7
Background ............................................................................................................................................. 7 Aim with this document ......................................................................................................................... 8
Chapter 2: Scope Methodology ........................................................................................................... 9 Differences between DC and AC ....................................................................................................... 9 Principles of dimensioning .................................................................................................................... 9 Insulator selection Flow Chart ........................................................................................................... 10
Chapter 3: Identify Candidate insulators .......................................................................................... 13 Introduction ........................................................................................................................................... 13 Choice of insulation material ............................................................................................................. 14 Choice of insulator profile ................................................................................................................. 17
Chapter 4: Assessment of Environmental and System Stresses ..................................................... 21 Introduction ........................................................................................................................................... 21 Influencing factors ............................................................................................................................... 22 How to determine the pollution severity ......................................................................................... 24
Chapter 5: Determination of the insulator characteristics and dimensions ................................. 28 Introduction ........................................................................................................................................... 28 Influencing factors ............................................................................................................................... 28 Characterisation of insulator performance .................................................................................... 35 Available artificial pollution test methods for HVDC ................................................................... 35
Chapter 6: A simplified method to determine the required USCD .............................................. 38 Introduction ........................................................................................................................................... 38 Determining the site DC Severity ..................................................................................................... 39 Determining the Required USCD ...................................................................................................... 40 Other considerations ........................................................................................................................... 42
OUTDOOR INSULATION IN POLLUTED CONDITIONS: GUIDELINES FOR SELECTION AND DIMENSIONING
Page 3
Chapter 7: Design Verification ............................................................................................................ 43 Chapter 8: Discussion and validation ................................................................................................. 44
Substations with Non-HTM insulators ............................................................................................... 44 Overhead lines with Non-HTM insulators ....................................................................................... 46 HTM insulators ...................................................................................................................................... 46
References ............................................................................................................................................... 48 Annex A: Derivation of correction factors ......................................................................................... 53
Ratio of DC to AC (or non-energised) pollution accumulation, Kp ............................................ 53 Correction for the amount of calcium ions present in the pollution layer, Kc ........................... 55 Correction for NSDD, Kn. .................................................................................................................... 56 Correction for the non-uniform pollution distribution (top to bottom ratio), KCUR. ................... 56 Correction for diameter on the pollution accumulation, Kd. ........................................................ 58 Correction for diameter on the flashover performance .............................................................. 59 Statistical co-ordination factor ......................................................................................................... 60 Performance of different insulator types ....................................................................................... 60 References ............................................................................................................................................ 63
Annex B: Influence of profile on the DC pollution flashover performance ................................. 65 General ................................................................................................................................................. 65 Influence of the creepage factor ..................................................................................................... 65 Creepage distance versus clearance (l/d) ..................................................................................... 68 Influence of distance between sheds ............................................................................................... 69 Spacing versus shed overhang ......................................................................................................... 70 References ............................................................................................................................................ 71
Annex C: Service experience ............................................................................................................... 73 Survey of applied USCD at existing HVDC schemes ................................................................... 73 Outages at converter stations ........................................................................................................... 76 Pollution Performance of insulation .................................................................................................. 78 References ............................................................................................................................................ 79
Annex D: Typical parameters to record when performing ESDD/NSDD measurements ......... 81 References ............................................................................................................................................ 83
Annex E: The Statistical Approach ...................................................................................................... 84 References ............................................................................................................................................ 87
OUTDOOR INSULATION IN POLLUTED CONDITIONS: GUIDELINES FOR SELECTION AND DIMENSIONING
Page 4
EXECUTIVE SUMMARY For a variety of important technical reasons, high‐voltage direct current (HVDC) is an increasingly desirable option for the transmission of bulk electrical energy. With 50 years of experience, utilities are entering the ultra‐high voltage (UHV) arena with HVDC schemes of 800kV and above. With the important need to contain costs and improve reliability, it was deemed appropriate for CIGRE to commission a working group (WG) with the task of reviewing and analysing the practice of the past 50 years and draw up guidelines which will enable designers to select the most appropriate insulation systems for HVDC lines and substations, taking into account system requirements, environmental conditions and modern insulator technology. In contrast to high‐voltage alternating current (HVAC) systems, where switching and lightning performance are the dominant factors influencing the overall length of insulation, under HVDC the ability to deal with environmental pollution on the insulator surfaces is the defining stress the insulation designer has to address. The static electrostatic field along the length of an insulator, in conjunction with the prevailing wind, lead to a steady build‐up of pollutants on the insulator surface which may, typically, range between 1‐ 4 times, but possibly as high as 10 times more severe than that on comparable HVAC insulation in the same environment. The situation is exacerbated by the fact that the leakage current in the pollution does not experience natural current‐zeros and as a result, the dry‐band arcing is very aggressive. An accurate assessment of site severity is, therefore, the starting point for any insulation design. The guideline explores a range of options for doing this, starting with data from insulators energised at HVDC through information from insulators energised at HVAC to a survey of likely pollution sources, coupled with wind and rain data. The further the assessment is from that on live candidate HVDC insulators the less confidence there will be in the outcome. The site severity is determined in terms of both the concentration of salts (ESDD) which contribute to electrical conduction and the concentration of non‐soluble material (NSDD) which contributes to water retention. Bearing in mind the difficulty of doing an accurate assessment of the site severity using energized HVDC insulators, the document surveys publications related to large number of HVDC sites around the world and presents a range of correction factors for adjusting site severity information from HVAC insulation or from the analysis of source, wind and rain conditions to determine the HVDC site severity. By using the two primary site severity parameters, ESDD and NSDD, the document addresses the selection of material, profile and creepage length. The final stage in the process is the validation of the chosen insulation and different options are considered. Where possible a live test in the actual environment is the most desirable, allowing sufficient time for the natural accumulation of pollution. It is rare for this to be feasible and a means of performing a representative laboratory test is thoroughly discussed. Although the confidence level may be low, the option of a pencil‐and‐paper validation using comparable insulation in a comparable environment, elsewhere in the world, can be undertaken. The need and application of maintenance and palliative measures should already be considered at the design stage so that cost‐effective steps can be taken to secure reliable service of the system.
OUTDOOR INSULATION IN POLLUTED CONDITIONS: GUIDELINES FOR SELECTION AND DIMENSIONING
Page 5
DEFINITIONS Composite insulator: An insulator made of at least two insulating parts, namely, a core and a housing equipped with metal fittings. Note that composite insulators, for example, can consist either of individual sheds mounted on the core, with or without an intermediate sheath, or alternatively, of a housing directly moulded or cast in one or several pieces on to the core. Composite Insulators are a subset of Polymeric insulators.
Contamination Uniformity Ratio (CUR), is the ESDD level on the bottom surface of the insulator divided by that of the top surface. It should be noted that many papers quote the Top to Bottom ratio (T/B) which is the inverse of the CUR.
Creepage Factor (CF), is a global check of the overall density of creepage distance and is equal to l/A where: l is the total creepage distance of the insulator and A is the arcing distance of the insulator. For disc insulators the CF is determined for a string comprising at least 5 insulator units.
DC system voltage, is the highest mean or average operating voltage to earth, excluding harmonics and commutation overshoots (IEC Standard 61245 pollution test of HVDC insulator).
Equivalent Salt Deposit Density (ESDD): The amount of sodium chloride (NaCl) that, when dissolved in demineralised water, gives the same volume conductivity as that of the natural deposit removed from a given surface of the insulator divided by the area of this surface; generally expressed in mg/cm².
Hybrid insulator: An insulator made of at least two insulating parts, namely a core equipped with metal fittings and a housing. In the case of a hybrid insulator the core can be made from either porcelain or glass and the housing is made of a polymeric material.
Hydrophobicity Transfer Materials (HTM): In this document polymer materials that exhibit hydrophobicity and have the capability to transfer hydrophobicity to the layer of pollution on their surfaces are referred to as Hydrophobicity Transfer Materials (HTM). It should be noted that hydrophobicity may be lost in certain conditions, either temporarily or in some cases permanently. IEC 62073 gives guidance on the measurement of wettability of insulator surfaces [76].
Non- Hydrophobicity Transfer Materials (non-HTM): Materials which do not exhibit hydrophobicity transfer are referred to as non- Hydrophobicity Transfer Materials (non-HTM).
Non Soluble Deposit Density (NSDD): The amount of the non-soluble residue removed from a given surface of the insulator divided by the area of this surface; generally expressed in mg/cm².
Polymeric insulator: An insulator whose insulating body consists of at least one organic based material. Coupling devices may be attached to the ends of the insulating body.
Salt Deposit Density (SDD): The amount of sodium chloride (NaCl) in an artificial deposit on a given surface of the insulator (metal parts and assembling materials are not included in this surface) divided by the area of this surface; generally expressed in mg/cm².
Site Equivalent Salinity (SES): The salinity of a salt fog test according to IEC 60507 that would give comparable peak values of leakage current on the same insulator as produced at the same voltage by natural pollution at a site, generally expressed in kg/m³.
Top to Bottom ratio (T/B), is the ESDD level on the top surface of the insulator divided by that of the bottom surface. It should be noted that many papers quote the Contamination Uniformity Ratio (CUR) which is the inverse of the T/B.
Unified Specific Creepage Distance (USCD) is the creepage distance of an insulator divided by the maximum operating voltage across the insulator (for AC systems usually Um/√3). It is generally expressed in mm/kV. Note that this definition differs from that of Specific Creepage Distance where the phase-to-phase value of the highest voltage for the equipment is used. For phase to earth insulation, this definition will result in a value that is √3 times that given by the definition of Specific Creepage Distance in IEC 60815 (1986).
OUTDOOR INSULATION IN POLLUTED CONDITIONS: GUIDELINES FOR SELECTION AND DIMENSIONING
Page 6
ABBREVIATIONS CF: Creepage Factor
CUR: Contamination Uniformity Ratio
EPDM: Ethylene‐Propylene‐Diene Monomer
ESDD: Equivalent Salt Deposit Density
HTM: Hydrophobicity Transfer Material
NSDD: Non Soluble Deposit Density
SDD: Salt Deposit Density
SES: Site Equivalent Salinity
SIR: Silicone Rubber
SPS: Site Pollution Severity
T/B: Top to Bottom Ratio
USCD: Unified Specific Creepage Distance
OUTDOOR INSULATION IN POLLUTED CONDITIONS: GUIDELINES FOR SELECTION AND DIMENSIONING
Page 7
Chapter 1: Introduction
Background
As society has become increasingly dependent on a continuous supply of electrical energy, more attention has, in recent years, been given to the reliability and cost of each component in the electricity supply system, including the insulation of power lines and substations. The integrity of outdoor insulation is crucial in maintaining the reliability and cost-effectiveness of a modern electricity supply utility. In service, the outdoor insulation should withstand all voltage and environmental stresses that it may be subjected to. The pollution performance of the insulation is, therefore, one component of the overall insulation coordination design and the final solution will be chosen taking due cognisance of all the aspects of insulator performance.
In June 2000, CIGRE published an important review of current knowledge [1] covering, in considerable depth, what is known of the performance of glass, porcelain and composite insulators. Based on the review, work continued within CIGRE to produce guideline documents with the aim of providing engineers with the tools necessary for selecting and dimensioning outdoor insulation with respect to the environmental conditions. In 2008 this culminated in the publication of the first guideline entitled, “Outdoor insulation in polluted conditions: Guidelines for selection and dimensioning: Part 1: General principles and the AC case.” [2]. During the compilation of this document, it was realised that external HVDC insulation is a specialised topic on its own, which needed to be addressed separately from the AC case. The design and selection of insulators for HVDC applications requires that several parameters that are not so significant in the AC case are seriously considered. The renewed interest in the utilisation of HVDC schemes, the introduction of ±800 kV and the foreseen development of 1100 kV, have resulted in a significant body of new research which has not been reported on in the review. In the process of developing the DC guidelines CIGRE Working Group C4.303 reassessed the state of the art in dimensioning procedures for HVDC and identified aspects which deserve further investigation [3].
One of the key issues that impacts the insulation design of HVDC lines and substations is the pollution performance of the external insulation. Since the beginning of overhead power transmission over a century ago it was noted that the performance of external insulation is adversely affected when the insulating surface is polluted with airborne deposits such as marine salt or industrial pollution. These deposits may form a conducting or partially conducting surface layer on the insulator when wet, resulting in discharges and, in the worst case, flashover of the insulators.
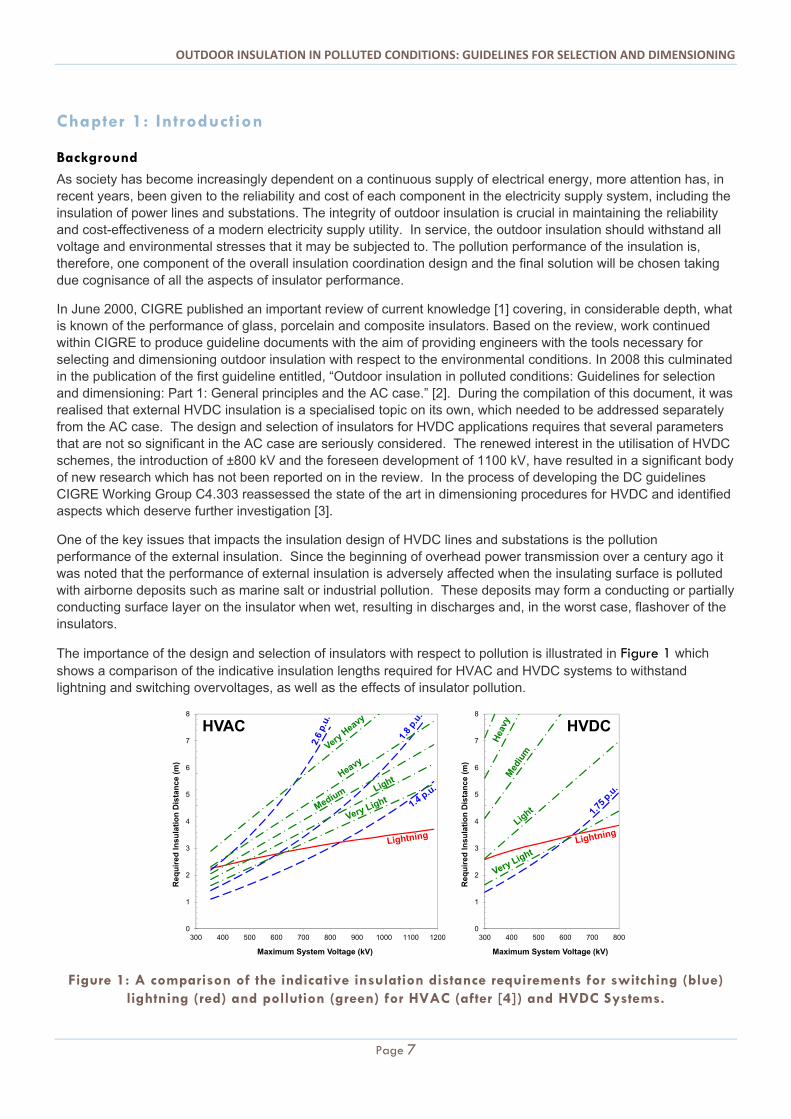
The importance of the design and selection of insulators with respect to pollution is illustrated in Figure 1 which shows a comparison of the indicative insulation lengths required for HVAC and HVDC systems to withstand lightning and switching overvoltages, as well as the effects of insulator pollution.
Figure 1: A comparison of the indicative insulation distance requirements for switching (blue) lightning (red) and pollution (green) for HVAC (after [4]) and HVDC Systems.
0
1
2
3
4
5
6
7
8
300 400 500 600 700 800 900 1000 1100 1200
Req
uir
ed In
sula
tio
n D
ista
nce
(m
)
Maximum System Voltage (kV)
0
1
2
3
4
5
6
7
8
300 400 500 600 700 800
Req
uir
ed In
sula
tio
n D
ista
nce
(m
)
Maximum System Voltage (kV)
HVAC HVDC

OUTDOOR INSULATION IN POLLUTED CONDITIONS: GUIDELINES FOR SELECTION AND DIMENSIONING
Page 8
It is apparent from Figure 1 that on HVAC systems the insulation lengths are in the most cases determined by either switching or lightning overvoltages. The pollution performance requirement can then be met by selecting insulators with a suitable creepage factor (i.e. creepage distance per unit arcing distance). In almost all cases, except perhaps for locations with the highest site pollution severity, this can be achieved with common insulator designs without a need for pushing the boundaries (i.e. remaining within established profile limits).
In contrast, the situation for DC systems is quite different. In the first place the creepage distance required for DC at a particular site severity is higher than for AC [1], and secondly the magnitude of slow front transients (i.e. switching overvoltages) is lower than those occurring in AC systems [5]. In areas with significant pollution levels this may require large insulation dimensions, which may influence, and in some cases dictate, the conceptual design of the whole project. Choices that may be impacted are:
The routing of the lines and siting of the converter station, to avoid polluted conditions. The use of cables instead of overhead lines to minimise the number of external insulation surfaces
exposed to pollution. Utilising indoor switchyards and converter stations to protect the external insulation surfaces from pollution
and/or wetting. The choice of particular insulator assemblies or conductor configurations for the transmission line or
special layouts of the converter stations to accommodate long insulation distances or special insulation solutions.
An inappropriate design under pollution conditions can therefore have a strong impact on the overall system cost as it may result in higher investment costs (i.e. the need for extremely long and costly substation insulators, taller towers to accommodate long insulator strings) or increase the operating costs (e.g. the need for costly palliative maintenance measures). It is, therefore, necessary for the DC case to limit, as far as possible, the shortcomings in the design by following an exhaustive design approach. This explains why a simplified approach, with its potential risk for grossly over or under design, is not advised for DC systems. This is in contrast to AC systems where a simplified approach can be used with confidence in all environments with the exception of areas with particularly severe pollution levels.
Aim of this document
The body of the guide describes the methodology and principles by which HVDC insulators for polluted conditions should be selected and dimensioned. Relevant technical background information – especially on some of the parameters unique to DC – is given in the appendices.
As with the AC document, this guideline is based on a flow chart, which assumes that certain basic data regarding the application of the insulators, the environment and available insulator characteristics can be obtained. Selection and dimensioning involve matching the application and the environment to the characteristics of available insulators in an optimal way. Where good, valid service experience is not available, or where new insulator types are being considered, field or laboratory testing is recommended and a sufficient lead-time must be allowed for the completion of this qualification phase.
The crux of the guideline is to be found in the procedures and technical justification given for the choice of insulator material and its dimensioning, for both line and converter station applications.

OUTDOOR INSULATION IN POLLUTED CONDITIONS: GUIDELINES FOR SELECTION AND DIMENSIONING
Page 9
Chapter 2: Scope Methodology Before going into the details of selecting and dimensioning insulators for DC applications, it is first necessary to highlight the differences between the pollution performance of insulators under AC and DC energisation.
Differences between DC and AC pollution performance
There are fundamental differences between the DC and AC pollution deposition and flashover processes that may impact the DC insulation design. In the first place, DC energised insulators tend to accumulate more pollution than do AC insulators, and secondly it is found that with the same amount of pollution on the insulator, a DC energised insulator has a lower flashover voltage than an AC energised one.
Pollution Catch:
Under AC conditions pollution is primarily deposited on the insulator surface by aerodynamic action. The particles are transported by wind to the insulator where deposited on the insulator depending to a large extent on the air-flow around the insulator. In wind-still areas the pollution is mainly precipitated on the insulator by gravity. In most cases it makes little difference whether or not the insulator is energised.
On DC energised insulators however, the effect of the static electric field may contribute significantly to the pollution deposit [14]. This is especially prominent for low wind speeds. In general this results in a higher level of pollution on DC insulators compared to AC insulators installed in the same area. In literature it is reported that the ratio DC to AC pollution deposit may vary from 1 to 10 – see Figure 25 in Annex A.
Flashover voltage:
A survey of literature [6][7][8][9][10] has shown that an insulator with the same level of pollution will have a lower flashover strength under DC than AC energisation. The ratio of DC (peak) to AC (r.m.s.) is variable and influenced by many factors but it typically falls in the range 100% to 60% for the same type of insulator. Experimental studies have clearly shown that there is a difference between DC and AC arc propagation across the insulator surface. Under AC voltage the dry band arc will extinguish and need re-ignite at each voltage zero. Furthermore, it is found that the arcs tend to propagate along the insulator surface under AC energisation while the DC arcs are more likely leave the surface and propagate in the air, as is illustrated in Figure 2. Most manufacturers offer, therefore, special DC optimised insulator profiles, which have a larger shed, or under-rib, spacing than is the practice for AC insulators.
Figure 2: Schematic representation of dry band arc propagation under DC and AC voltage.
Principles of dimensioning
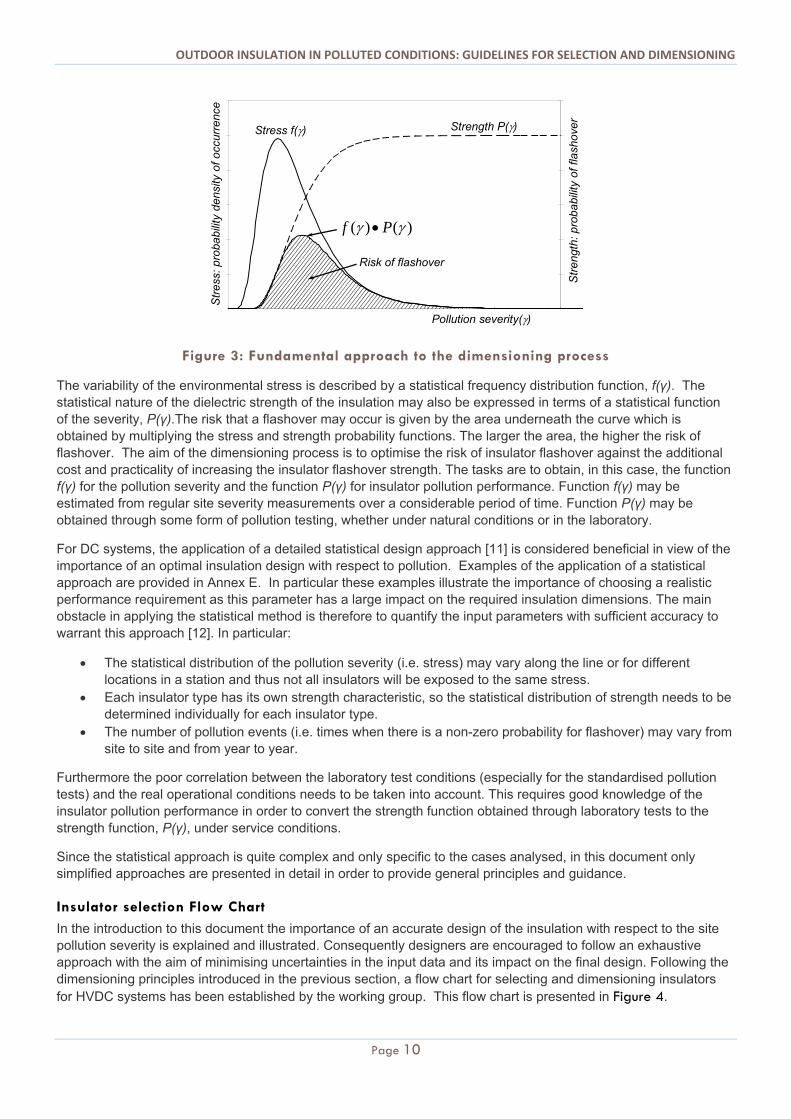
The essence of dimensioning insulators with respect to contaminated (or polluted) conditions is to select the insulator dimensions to obtain an acceptable level of flashover performance in the network. This means that the insulator should not flashover at the highest pollution severity that can reasonably be expected to occur during its service life. The basic principles applied in the insulation dimensioning process can be described with reference to Figure 3 [1].
AC arcDC arc
OUTDOOR INSULATION IN POLLUTED CONDITIONS: GUIDELINES FOR SELECTION AND DIMENSIONING
Page 10
Figure 3: Fundamental approach to the dimensioning process
The variability of the environmental stress is described by a statistical frequency distribution function, f(γ). The statistical nature of the dielectric strength of the insulation may also be expressed in terms of a statistical function of the severity, P(γ).The risk that a flashover may occur is given by the area underneath the curve which is obtained by multiplying the stress and strength probability functions. The larger the area, the higher the risk of flashover. The aim of the dimensioning process is to optimise the risk of insulator flashover against the additional cost and practicality of increasing the insulator flashover strength. The tasks are to obtain, in this case, the function f(γ) for the pollution severity and the function P(γ) for insulator pollution performance. Function f(γ) may be estimated from regular site severity measurements over a considerable period of time. Function P(γ) may be obtained through some form of pollution testing, whether under natural conditions or in the laboratory.
For DC systems, the application of a detailed statistical design approach [11] is considered beneficial in view of the importance of an optimal insulation design with respect to pollution. Examples of the application of a statistical approach are provided in Annex E. In particular these examples illustrate the importance of choosing a realistic performance requirement as this parameter has a large impact on the required insulation dimensions. The main obstacle in applying the statistical method is therefore to quantify the input parameters with sufficient accuracy to warrant this approach [12]. In particular:
The statistical distribution of the pollution severity (i.e. stress) may vary along the line or for different locations in a station and thus not all insulators will be exposed to the same stress.
Each insulator type has its own strength characteristic, so the statistical distribution of strength needs to be determined individually for each insulator type.
The number of pollution events (i.e. times when there is a non-zero probability for flashover) may vary from site to site and from year to year.
Furthermore the poor correlation between the laboratory test conditions (especially for the standardised pollution tests) and the real operational conditions needs to be taken into account. This requires good knowledge of the insulator pollution performance in order to convert the strength function obtained through laboratory tests to the strength function, P(γ), under service conditions.
Since the statistical approach is quite complex and only specific to the cases analysed, in this document only simplified approaches are presented in detail in order to provide general principles and guidance.
Insulator selection Flow Chart
In the introduction to this document the importance of an accurate design of the insulation with respect to the site pollution severity is explained and illustrated. Consequently designers are encouraged to follow an exhaustive approach with the aim of minimising uncertainties in the input data and its impact on the final design. Following the dimensioning principles introduced in the previous section, a flow chart for selecting and dimensioning insulators for HVDC systems has been established by the working group. This flow chart is presented in Figure 4.
Stress f() Strength P()
Risk of flashover
Pollution severity()
Str
ess:
pro
babi
lity
dens
ity o
f oc
curr
ence
Str
engt
h: p
roba
bilit
y of
fla
shov
er
)()( Pf
OUTDOOR INSULATION IN POLLUTED CONDITIONS: GUIDELINES FOR SELECTION AND DIMENSIONING
Page 11
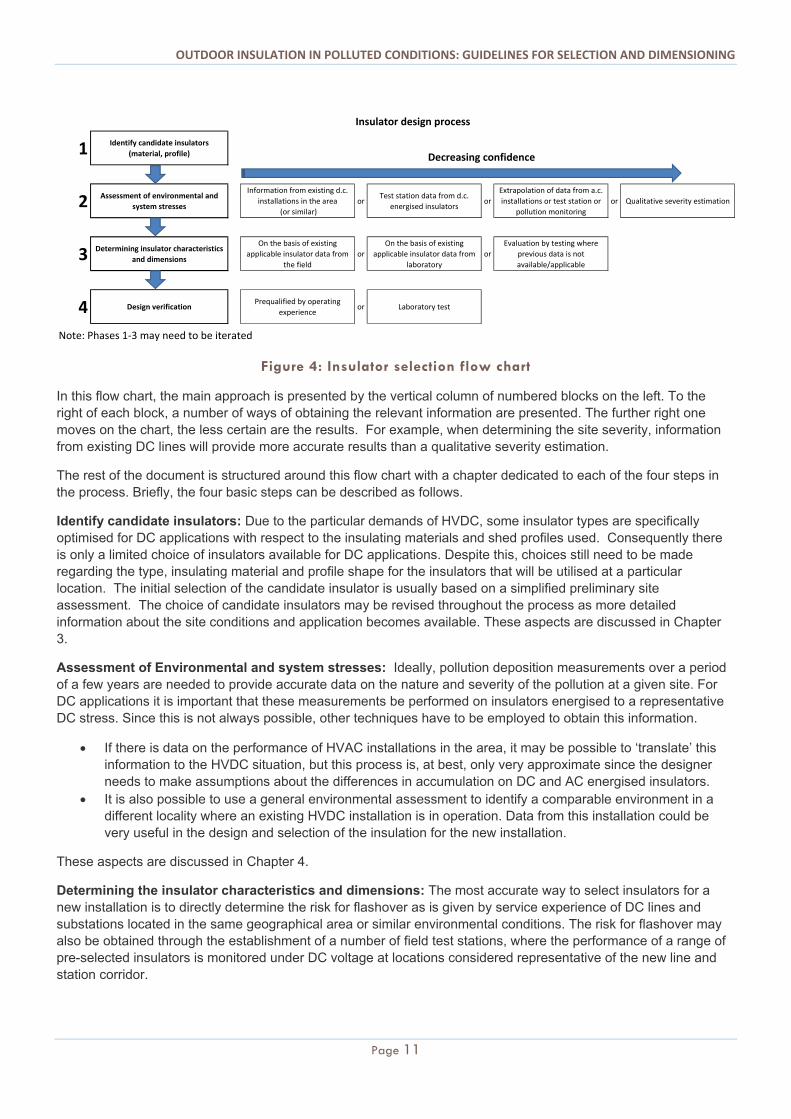
Figure 4: Insulator selection flow chart
In this flow chart, the main approach is presented by the vertical column of numbered blocks on the left. To the right of each block, a number of ways of obtaining the relevant information are presented. The further right one moves on the chart, the less certain are the results. For example, when determining the site severity, information from existing DC lines will provide more accurate results than a qualitative severity estimation.
The rest of the document is structured around this flow chart with a chapter dedicated to each of the four steps in the process. Briefly, the four basic steps can be described as follows.
Identify candidate insulators: Due to the particular demands of HVDC, some insulator types are specifically optimised for DC applications with respect to the insulating materials and shed profiles used. Consequently there is only a limited choice of insulators available for DC applications. Despite this, choices still need to be made regarding the type, insulating material and profile shape for the insulators that will be utilised at a particular location. The initial selection of the candidate insulator is usually based on a simplified preliminary site assessment. The choice of candidate insulators may be revised throughout the process as more detailed information about the site conditions and application becomes available. These aspects are discussed in Chapter 3.
Assessment of Environmental and system stresses: Ideally, pollution deposition measurements over a period of a few years are needed to provide accurate data on the nature and severity of the pollution at a given site. For DC applications it is important that these measurements be performed on insulators energised to a representative DC stress. Since this is not always possible, other techniques have to be employed to obtain this information.
If there is data on the performance of HVAC installations in the area, it may be possible to ‘translate’ this information to the HVDC situation, but this process is, at best, only very approximate since the designer needs to make assumptions about the differences in accumulation on DC and AC energised insulators.
It is also possible to use a general environmental assessment to identify a comparable environment in a different locality where an existing HVDC installation is in operation. Data from this installation could be very useful in the design and selection of the insulation for the new installation.
These aspects are discussed in Chapter 4.
Determining the insulator characteristics and dimensions: The most accurate way to select insulators for a new installation is to directly determine the risk for flashover as is given by service experience of DC lines and substations located in the same geographical area or similar environmental conditions. The risk for flashover may also be obtained through the establishment of a number of field test stations, where the performance of a range of pre-selected insulators is monitored under DC voltage at locations considered representative of the new line and station corridor.
1 Identify candidate insulators
(material, profile)
2 Assessment of environmental and
system stresses
Information from existing d.c.
installations in the area
(or similar)
orTest station data from d.c.
energised insulatorsor
Extrapolation of data from a.c.
installations or test station or
pollution monitoring
or Qualitative severity estimation
3 Determining insulator characteristics
and dimensions
On the basis of existing
applicable insulator data from
the field
or
On the basis of existing
applicable insulator data from
laboratory
or
Evaluation by testing where
previous data is not
available/applicable
4 Design verificationPrequalified by operating
experienceor Laboratory test
Note: Phases 1‐3 may need to be iterated
Insulator design process
Decreasing confidence
OUTDOOR INSULATION IN POLLUTED CONDITIONS: GUIDELINES FOR SELECTION AND DIMENSIONING
Page 12
Where there is previous experience with DC lines in the same area, excellent data on insulator performance will be available on which to base the preliminary design. If there is a lead time of a one year or longer, good data can be obtained from the installation of energised insulators in field stations located at representative sites along the length of the line and at the converter sites. The insulators at such field stations should be energised to representative stresses to take account of the influence of the electrostatic field on pollution accumulation, which can be very significant.
Instead of determining the risk for flashover directly, it is also possible to follow a simplified deterministic method for the design. In this simplified method the pollution stress, i.e. the maximum pollution level on the insulators, is determined from pollution measurements and through site condition studies. The insulator strength is estimated from published information or based on the performance data summarised in this guideline with several correction factors applied to correlate the test conditions with the site conditions. These data are then used to make a rough selection of the insulator type, material and dimensions.
Details of this part of the process can be found in Chapter 5.
As an illustration of the principles introduced in this document a simplified method is presented in Chapter 6. This method can be used to make a preliminary insulator design for HVDC insulators with respect to polluted conditions.
Design Verification: This is the last step in the process whereby the chosen insulation design is evaluated either by a comparison with past experience or by testing. Methods that can be used for the design verification are discussed in Chapter 7.
In the final chapter (Chapter 8) the principles and procedures introduced in these guidelines are verified against the available service experience.
Detailed background information utilised in the main part of the report is presented in the annexes.
OUTDOOR INSULATION IN POLLUTED CONDITIONS: GUIDELINES FOR SELECTION AND DIMENSIONING
Page 13
Chapter 3: Identify Candidate insulators
Introduction
In the initial stages of the project it is beneficial to identify a few possible insulation solutions as this may influence the choices made during the later stages of the selection and dimensioning process. This may be based on a simplified design procedure presented in Chapter 6. The term “insulating solution” is used here in its broadest sense to include:
1. The selection of insulator material and profile, 2. The choice of outdoor or indoor substation configurations, 3. The implementation of mitigation measures (e.g. washing, or coating) as part of the insulation design or, 4. Setting operational constraints such as operating temporarily at reduced voltages during critical pollution or
climatic events.
Different types of insulators are utilised in DC systems. Each type has its own specific aspects that require special consideration. An overview of the insulator categories in HVDC systems is provided in Table 1.
Line Insulation Substation Insulation
Vertical orientation
Disc type suspension sets Post Insulators
Long-rod suspension sets DC current transductor insulator, surge arresters and other station
equipment insulators
-- Transformer and reactor bushings
Horizontal orientation Disc type tension insulator sets Wall bushings
Long-rod tension insulator sets --
Table 1: Overview of typical insulation categories used in DC systems
In this section an overview is given of the specific insulator characteristics required for DC together with the various aspects that need to be considered when identifying candidate insulator types. For this purpose this chapter focuses primarily on the two basic choices that the designer must make:
What material is most appropriate for the application? In this case the choice is between ceramic or composite insulators. Under ceramic insulators is understood, glass and porcelain, and for composite insulators the choice, today, falls between Silicone Rubber and EPDM insulators.
What shed profile performs best in the particular environment? This is related to the shape of the insulators, that is, whether the sheds have a simple shape or are intricate with many or deep shed under-ribs.
It is important to be aware that the design of the insulator assembly and its installation orientation may have an effect on the pollution performance. Some typical examples can be mentioned:
Insulator assemblies comprising closely spaced multiple strings (i.e. with a separation distance smaller than the insulator shed spacing) may have a reduced flashover voltage.
Insulators installed in a horizontal position will generally accumulate less pollution over time than vertically mounted insulators as they are more effectively cleaned by rain than vertically installed insulators. Also in laboratory tests insulators in a horizontal position exhibit higher flashover voltages than vertically installed insulators. This is because of arc extension away from the insulator surface due to convection. These influences are to some extent also applicable to insulators installed in a V-string configuration.
Due to the particular demands of HVDC, some insulator types are specifically optimised for DC applications with respect to the insulating materials and shed profiles used. Consequently there is only a limited choice of insulators available for DC applications. This, in combination with the relatively greater importance of the insulator’s pollution performance, has forced many users to consider maintenance or mitigation measures, at the design stage, in order
OUTDOOR INSULATION IN POLLUTED CONDITIONS: GUIDELINES FOR SELECTION AND DIMENSIONING
Page 14
to obtain practical insulator designs. In severe environments it may be advantageous to build an indoor inverter station with a controlled environment.
Other aspects that need to be considered when identifying possible insulation solutions for HVDC systems are related to the way the system will be operated and maintenance and design constraints which may need particular attention. Typically this may include:
Wall bushings flashovers Specification of electric field grading along the insulator For converter stations there is the choice of an indoor or an outdoor solution Need or requirement for live-working/washing Interactions with animals Mechanical requirements Corrosion of the metal end-fittings
One particular concern for HVDC stations is the performance of wall bushings, especially under partial wetting conditions. Such conditions can occur if the converter hall shields a part of the bushing from wetting by rain during windy conditions [1]. The problem has been mitigated with the application of booster sheds, hydrophobic insulator coatings and replacement with polymer HTM housings [13][1].
Grading rings may be applied to prevent corona discharges from end fittings and hardware thus reducing the level of space charge that could distort the electric field along the insulator or result in more pollution accumulation along the insulator. Rings have, however, little grading effect on the E-field along the insulator under normal service conditions.
A general aspect of interest is the verification of the influence of active parts inside the insulators, as for bushings or current transformers, on the performance of the external insulation [14] and of the influence of the frequent surface pre-discharges due to pollution, on the performance of the inner active parts, e.g. for surge arresters [15].
In those cases, where the use of composite insulators is not feasible (e.g. applications where rigidity is important), the performance of an insulation solution may be modified by the use of maintenance or palliative measures. For example, in a situation of extreme pollution, the most economical, or technically acceptable solution may be to foresee regular washing or to pre-coat the insulation. Conversely, a higher investment cost solution may be acceptable because regular maintenance is logistically difficult or not economically viable. As a general rule, coatings (RTV Silicone, greases etc.) are used as a palliative measure and are not considered as a candidate solution for new insulation projects. However, if due to severe environmental conditions, their use may be unavoidable, it should be borne mind that coatings may require one or more replacements during the life of the insulation and, if grease is applied, it may require even more frequent replacement.
As with all engineering projects, the final choice is often dictated by economic factors. An acceptable balance needs to be found between initial investment, maintenance costs and replacement costs, taking the prospective life of the project into account. An example of the typical design considerations taken on an actual HVDC project can be found in [16].
Choice of insulation material
Two types of insulator material are commonly used in modern HVDC insulators:
1. Ceramic insulators made from glass1 or glazed porcelain. 2. Composite insulators, which consist of a fibreglass reinforced plastic (FRP) core or tube, which
provides the mechanical strength to the insulator and a polymeric housing to seal the rod from the environment and provide the required creepage distance and profile for the pollution performance.
3. Hybrid insulators which have a ceramic core or tube covered by a polymeric housing.
1 Strictly speaking glass is not a ceramic material, but in terms of its flashover performance glass and porcelain behave similarly so they a grouped together for simplicity sake.
OUTDOOR INSULATION IN POLLUTED CONDITIONS: GUIDELINES FOR SELECTION AND DIMENSIONING
Page 15
When considering the choice of material it is important to consider the following performance aspects:
Prospective life and life cycle costing: The life expectancy and possible additional costs and effort for condition assessment, replacement and maintenance needs to be factored into the selection process.
Pollution flashover performance: Aged insulators may show some reduction in flashover performance as a result of an increased surface roughness or a reduction in hydrophobic properties. These ageing aspects need to be factored in when selecting insulation (creepage) distances.
Corrosion of the end fittings: Corrosion of metallic end fittings is more prevalent on DC systems. This may result in a reduction of the mechanical strength of the insulator or negatively impact the flashover performance, if the insulating surface is coated with corrosion by-products.
It falls outside the scope of this document to provide a comprehensive comparison between polymer and ceramic insulators and readers are referred to other CIGRE documents dealing more directly with insulator technology for more information. However, as far as pollution performance is concerned, some general considerations applicable to each insulator type are discussed in the following sections.
CERAMIC INSULATING MATERIALS (I.E. PORCELAIN AND GLASS)
These “conventional” materials have been in use for many years and there is a significant amount of service experience and laboratory test results, from around the world, available with regard to their application in HVDC systems. The pollution flashover mechanism on this type of insulator is fairly well understood and, provided attention is given to the choice of the profile and the creepage length to suit the particular environment, a predictable performance can be anticipated.
In areas with high pollution severities, however, the required creepage distance necessary to achieve adequate performance may be so long that a practical insulator design cannot be realised. In such cases performance enhancement measures such as regular maintenance and/or the application of hydrophobic coatings may be needed to give a satisfactory performance. Alternatively the application of hydrophobic composite insulators can be considered.
There are a number of specific aspects that need to be considered when applying porcelain or glass insulators on DC systems:
Porcelain disc insulators:
Most recorded in-service failures of DC porcelain disc insulators have been caused by corrosion of the zinc-alloy sleeve in the insulator pin which causes it to swell. This in turn subjects the porcelain dielectric to hoop stresses, eventually resulting in cracks and a mechanical failure of the insulator. This phenomenon is, however, restricted to areas with a high pollution severity and continual high humidity. On modern DC porcelain insulators this problem has been solved by employing a pure zinc sacrificial sleeve and by the application of a thin polymer coating to the pin, in the area where it is in contact with the cement, to block circulating electrolytic current [17] [1].
Other possible failure mechanisms such as thermal runaway or ion migration in the disc have not generally been observed under normal service conditions [17].
Toughened glass disc insulators
Spontaneous bursting of glass discs on HVDC lines resulting in significant failure rates on pre-1988 installations. These failures were associated with ion movement in the glass material, especially around inclusions. The ion concentrations in the disc results in a distortion of the mechanical stresses in the glass and ultimately in a spontaneous shattering of the glass shell. These failures prompted the development of a special high purity glass for HVDC applications. The glass used in these insulators is characterised by minimal inhomogeneities and extra high resistivity glass [17].
In locations with severe pollution it was also found that glass insulators may be subjected to erosion from the arcing activity. In some cases these erosion tracks may be deep enough to precipitate the shattering of the glass disc. Laboratory tests have shown that glass insulators are more prone to such erosion than porcelain ones [18].
OUTDOOR INSULATION IN POLLUTED CONDITIONS: GUIDELINES FOR SELECTION AND DIMENSIONING
Page 16
Erosion of glass insulators is a sign that the insulator strings are under-dimensioned for the conditions present and it can be solved by re-insulating with appropriately dimensioned insulators.
DC glass insulators are also normally fitted with zinc sleeves on both the cap and pin to inhibit corrosion of the end fittings.
Porcelain long-rod insulators:
There are no special requirements for the porcelain used for porcelain long-rod insulators for DC applications since this type of insulator, which is considered puncture proof (Class A), has a much lower DC stress in the dielectric material than disc insulators.
In addition the leakage current density at the metallic end fittings is lower resulting in a decreased risk of corrosion.
Porcelain substation and equipment insulators:
There are no special requirements for the porcelain used for the fabrication of substation post or equipment insulators in DC installations. The main concern with equipment insulators relates to the reduction of the pollution flashover performance as a result of the large diameter. Consequently this type of insulator may require longer insulator lengths, which can be difficult to manufacture.
Semi-conducting glaze insulators
Semi-conducting glaze insulators are often applied in AC systems at sites with high pollution levels or where flashovers due to winter icing are likely [1]. In particularly severe conditions this type of insulator can, however, be overwhelmed resulting in thermal runaway. Additionally under so-called “cold switch-on” conditions the pollution withstand strength of these insulators is not significantly higher than regular insulator types. These problems can however be overcome if the insulator is dimensioned correctly for the circumstances [1].
Although laboratory tests have shown that semi-conducting glaze post insulators may have a better pollution flashover performance than their conventional counterparts [19], they may not be suitable for use on DC systems due to the risk for electrolytic glaze corrosion which may severely limit the insulator’s life expectancy [1].
POLYMERIC INSULATING MATERIALS
The use of composite insulators and in particular those with housings made of hydrophobicity transfer materials (HTM), are attractive for DC systems as they generally offer an improved flashover performance over that of ceramic insulators. Documented service experience [20] shows that polymeric insulating materials have been successfully implemented on HVDC line insulators since the 1980s and a significant record of good service experience has been built up for the designer to be confident about their performance. These results should, however, be seen against the very limited number of insulators contained in the sample (i.e. less than 1 000 units) and their relatively short service life (i.e. less than 10 years) at the time of the survey. This survey highlighted however some instances of severe erosion in high pollution areas and corrosion of the end fittings. In more recent reports excellent service experience of thousands of HVDC composite insulators after 25 years of service has been claimed [21][22][23].
In many instances composite insulators have been used successfully in HVDC applications. For example, HTV silicone rubber, which is commonly used for long-rod insulators, contains the filler material ATH (Alumina-trihidrate) for an improved tracking resistance. This filler material also improves the performance of the silicone rubber in HVDC applications as it reduces the housing’s tendency to accumulate and retain space charge on its surface [24]. For other silicone rubber formulations, e.g. RTV or liquid silicone rubber products, it may be necessary to consider the addition of anti-electrostatic agents to avoid the accumulation of space charge. Hydrophilic insulators, such as EPDM, on the other hand, have a lower surface resistance which is beneficial for the drainage of space charge from the surface and therefore special additives are generally not required. Unfortunately, they do not inhibit the development of the conducting layer, as is the case with hydrophobic materials and their flashover performance is therefore not as good, but they nevertheless demonstrate slightly improved performance compared to porcelain insulators in pollution tests.
OUTDOOR INSULATION IN POLLUTED CONDITIONS: GUIDELINES FOR SELECTION AND DIMENSIONING
Page 17
In contrast to ceramic insulators where under-dimensioned units usually result in an inadequate flashover performance, on composite insulators it may also precipitate in premature ageing. It is therefore important to consider the long-term ageing performance of composite insulators for HVDC applications.
Ageing in polluted environments:
Most DC systems with external insulation are located in areas with a moderate to low pollution severity [25], thereby avoiding excessive erosion stresses. In some applications of composite insulators the trend is to reduce the leakage distance utilised compared to that which would be specified for glass and porcelain [22]. This proved to be a workable solution provided that the required leakage distance is correctly determined for the ceramic insulators on the basis of flashover performance. However, the increase in stress on the polymeric material may negatively impact its ageing performance.
In comparisons of the tracking performance of composite insulators under AC and DC energisation, when subjected to single and multi-stress tests, it has been shown that under the same stress (i.e. DC voltage equal to the r.m.s. AC voltage) the erosion and deterioration incurred is more severe (both in extent and erosion depth) under DC energisation than under AC [26][27]. This finding has also been confirmed for inclined plane tests [28][21][23]. To reduce the erosion stress, DC insulators require therefore longer specific creepage distances than AC insulators.
Ageing in areas with little to no pollution:
On AC systems it is now well established that the primary ageing mechanism on composite insulators under clean conditions (i.e. little to no pollution) is corona in combination with wetting on the insulator surface [29][30]. This type of ageing is concentrated in the areas on the composite insulator exposed to a high E-field stress. It is believed that the ionised air combines with the water to form a weak acid that can either directly attack the material and interfaces [31] or cause it to lose its hydrophobicity [29]. One of the primary ways on AC systems to inhibit such ageing is the application of corona rings to limit the E-field to below the corona-threshold value [32].
To date this ageing mechanism has not been studied on HVDC systems except for one documented occurrence of water induced corona on HVDC insulators that resulted in a loss of hydrophobicity [33]. This aspect warrants further investigation to clarify the need, effectiveness and design of corona rings on HVDC composite insulators.
Choice of insulator profile
In the AC guide [2] general principles are given for selecting the insulator profile based on the type of environment. The same principles apply to HVDC but in this case the available insulator choices are limited as special DC optimised insulator profiles are required. HVDC insulators generally have larger shed, or under-rib, spacings than is customary for HVAC insulators. This is because under DC energisation the dry band arcs are more likely to leave the surface and propagate in the air, as compared to AC where the arcs tend to propagate along the insulator surface, as is shown in Figure 2.
Many aspects that influence insulator behaviour need to be considered when selecting the insulator profile for a particular site (see Chapter 5). Different types of insulator and even different mounting angles and orientations of the same insulator type may accumulate pollution at different rates in the same environment. In addition, variations in the nature of the pollutant may make some shapes of insulator more effective than others. Pollution accumulation and non-uniformity of deposition is normally greater under HVDC than under HVAC. When there is a selection of profiles available the choice should be made with the following aspects in mind:
Minimise accumulation of the pollution in service conditions, with reference to the specific environment. Optimise pollution flashover performance. Minimise the risk of ageing aspects.
Open profiles reduce the accumulation of wind-borne pollution and also facilitate natural washing. The use of under ribs on insulators serves to increase the creepage length for a given axial length, but they may trap more pollution rendering the additional creepage length ineffective with the passage of time. Specific profile considerations for each insulator type are given in the following paragraphs.
OUTDOOR INSULATION IN POLLUTED CONDITIONS: GUIDELINES FOR SELECTION AND DIMENSIONING
Page 18
Profile selection for equipment insulators is even more critical. Not only the pollution flashover performance is important but also flashover under rain needs to be considered. From service experience it is known that there is an increased risk for flashover during rainstorms after a relatively long period of pollution accumulation. This is especially critical on large diameter insulators that have a large rain collection area – see Annex C.
In Annex B a consolidation of available information is provided on the effect of profile parameters of the DC pollution flashover voltage. The presented data suggest strongly that there is an upper limit to the amount of effective creepage (in terms of pollution flashover) that can be packed into an insulator with a given axial length. Furthermore, the analyses also show that the effectiveness of the specific creepage distance is strongly dependent on the insulator profile parameters. In theory it means that the required USCD should be specified individually for each insulator type. As this is hardly practical, the concept of a generalised USCD is still applied for the preliminary design. It is however important during the final design phase to check the validity of this approach against the available performance information for the individual insulators.
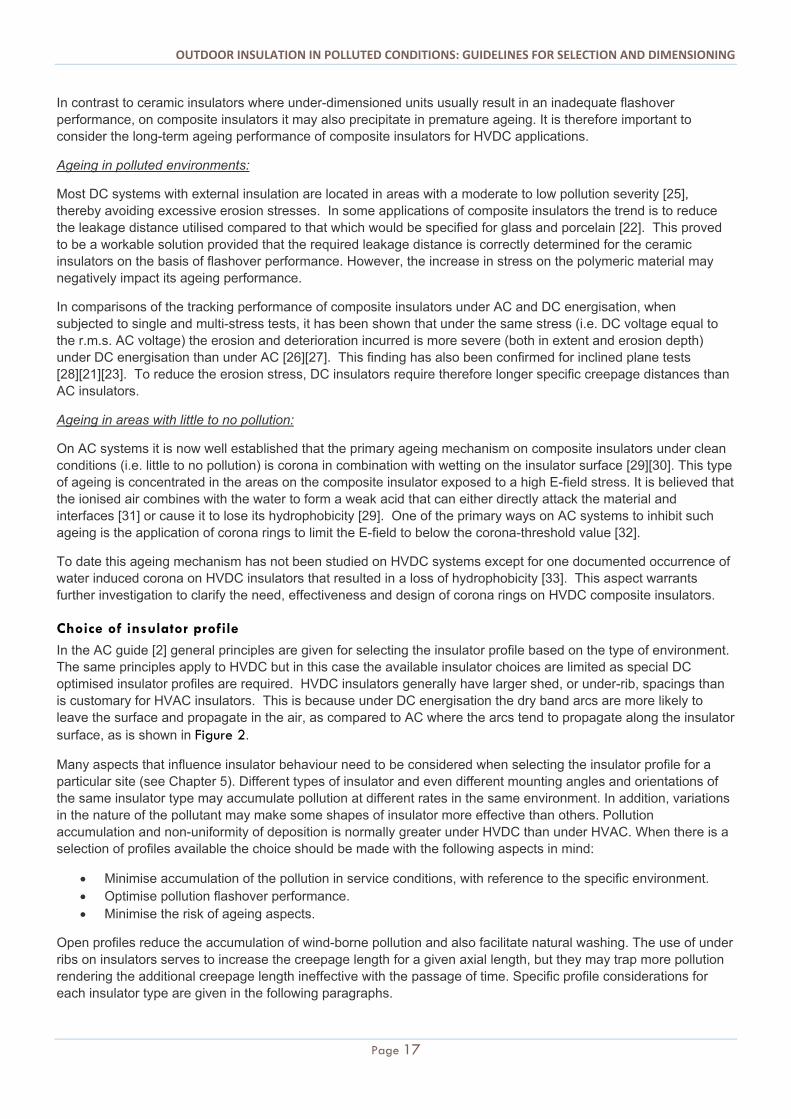
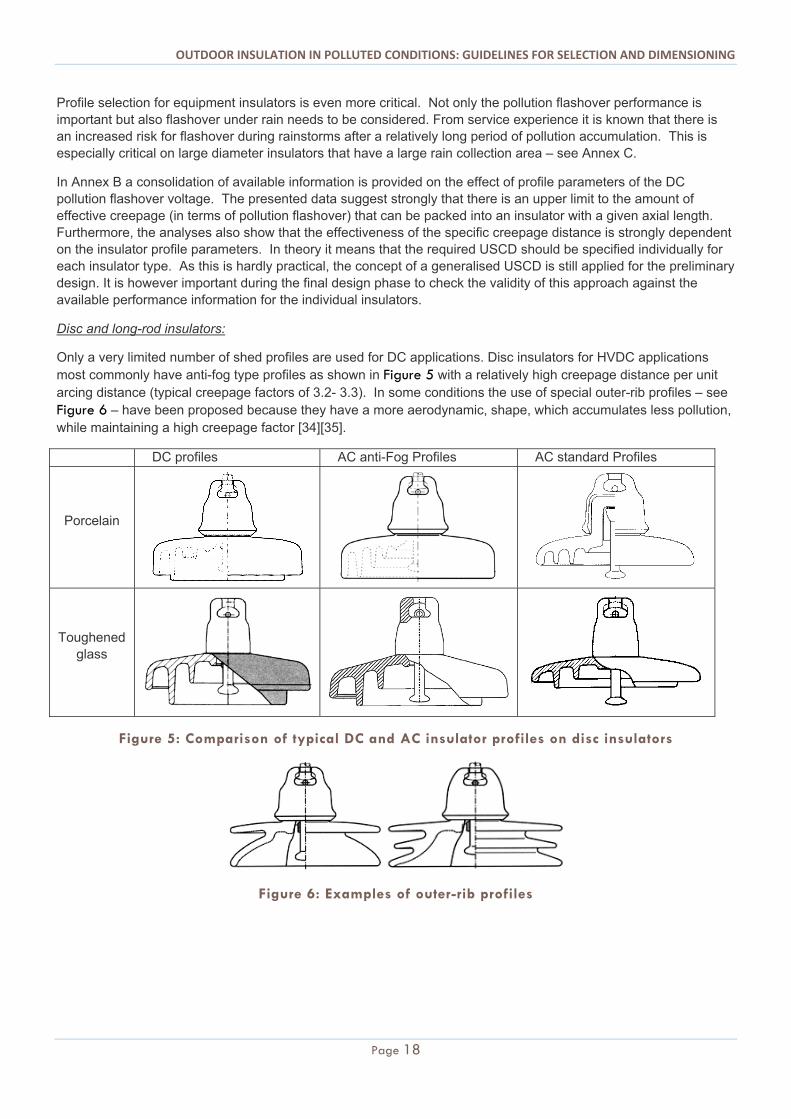
Disc and long-rod insulators:
Only a very limited number of shed profiles are used for DC applications. Disc insulators for HVDC applications most commonly have anti-fog type profiles as shown in Figure 5 with a relatively high creepage distance per unit arcing distance (typical creepage factors of 3.2- 3.3). In some conditions the use of special outer-rib profiles – see Figure 6 – have been proposed because they have a more aerodynamic, shape, which accumulates less pollution, while maintaining a high creepage factor [34][35].
DC profiles AC anti-Fog Profiles AC standard Profiles
Porcelain
Toughened glass
Figure 5: Comparison of typical DC and AC insulator profiles on disc insulators
Figure 6: Examples of outer-rib profiles
OUTDOOR INSULATION IN POLLUTED CONDITIONS: GUIDELINES FOR SELECTION AND DIMENSIONING
Page 19
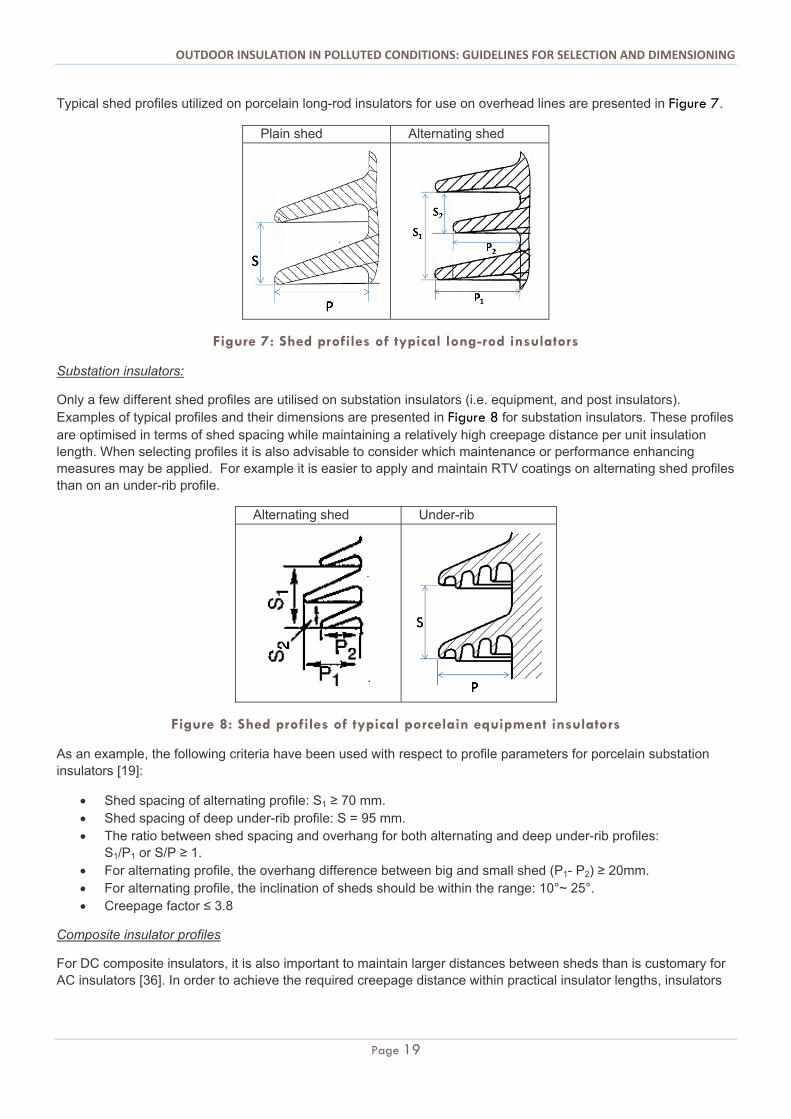
Typical shed profiles utilized on porcelain long-rod insulators for use on overhead lines are presented in Figure 7.
Plain shed Alternating shed
Figure 7: Shed profiles of typical long-rod insulators
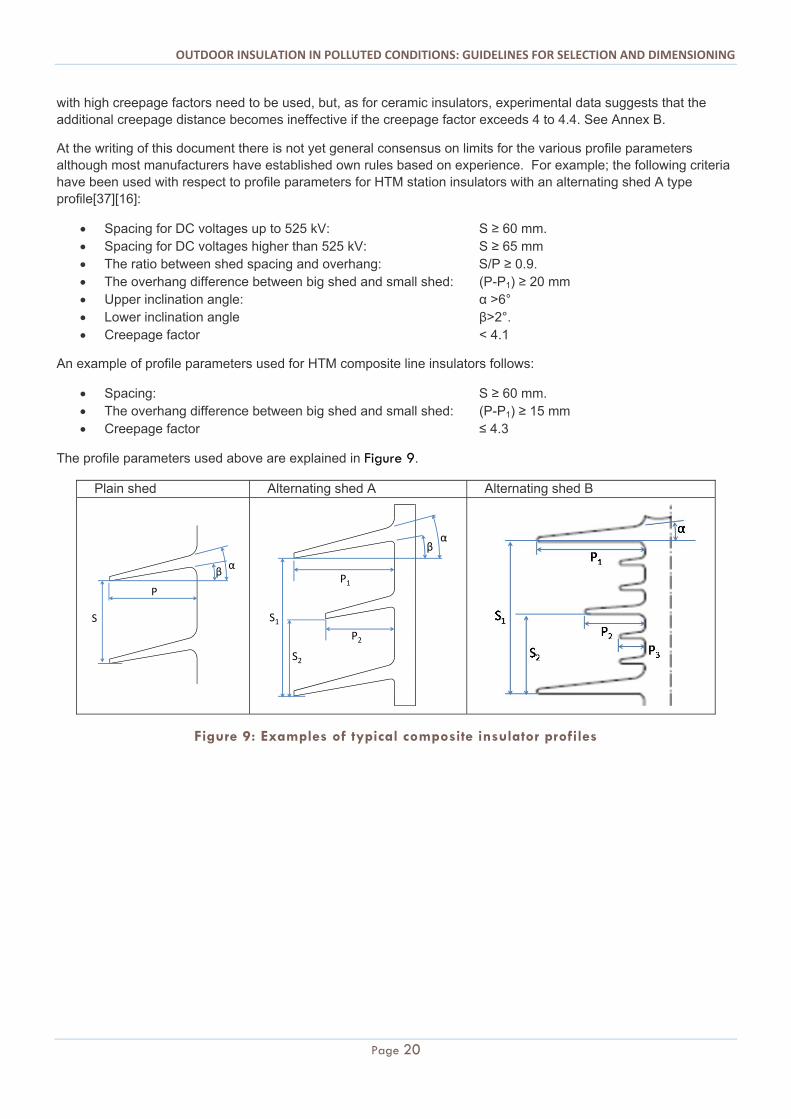
Substation insulators:
Only a few different shed profiles are utilised on substation insulators (i.e. equipment, and post insulators). Examples of typical profiles and their dimensions are presented in Figure 8 for substation insulators. These profiles are optimised in terms of shed spacing while maintaining a relatively high creepage distance per unit insulation length. When selecting profiles it is also advisable to consider which maintenance or performance enhancing measures may be applied. For example it is easier to apply and maintain RTV coatings on alternating shed profiles than on an under-rib profile.
Alternating shed Under-rib
Figure 8: Shed profiles of typical porcelain equipment insulators
As an example, the following criteria have been used with respect to profile parameters for porcelain substation insulators [19]:
Shed spacing of alternating profile: S1 ≥ 70 mm. Shed spacing of deep under-rib profile: S = 95 mm. The ratio between shed spacing and overhang for both alternating and deep under-rib profiles:
S1/P1 or S/P ≥ 1. For alternating profile, the overhang difference between big and small shed (P1- P2) ≥ 20mm. For alternating profile, the inclination of sheds should be within the range: 10°~ 25°. Creepage factor ≤ 3.8
Composite insulator profiles
For DC composite insulators, it is also important to maintain larger distances between sheds than is customary for AC insulators [36]. In order to achieve the required creepage distance within practical insulator lengths, insulators
OUTDOOR INSULATION IN POLLUTED CONDITIONS: GUIDELINES FOR SELECTION AND DIMENSIONING
Page 20
with high creepage factors need to be used, but, as for ceramic insulators, experimental data suggests that the additional creepage distance becomes ineffective if the creepage factor exceeds 4 to 4.4. See Annex B.
At the writing of this document there is not yet general consensus on limits for the various profile parameters although most manufacturers have established own rules based on experience. For example; the following criteria have been used with respect to profile parameters for HTM station insulators with an alternating shed A type profile[37][16]:
Spacing for DC voltages up to 525 kV: S ≥ 60 mm. Spacing for DC voltages higher than 525 kV: S ≥ 65 mm The ratio between shed spacing and overhang: S/P ≥ 0.9. The overhang difference between big shed and small shed: (P-P1) ≥ 20 mm Upper inclination angle: α >6° Lower inclination angle β>2°. Creepage factor < 4.1
An example of profile parameters used for HTM composite line insulators follows:
Spacing: S ≥ 60 mm. The overhang difference between big shed and small shed: (P-P1) ≥ 15 mm Creepage factor ≤ 4.3
The profile parameters used above are explained in Figure 9.
Plain shed Alternating shed A Alternating shed B
Figure 9: Examples of typical composite insulator profiles
βα
P
S
P1
P2
S1
S2
βα
OUTDOOR INSULATION IN POLLUTED CONDITIONS: GUIDELINES FOR SELECTION AND DIMENSIONING
Page 21
Chapter 4: Assessment of Environmental and System Stresses
Introduction
Determining the stresses which the insulator will be subjected to is part of the fundamental information critical to an optimised insulator selection. The insulator is basically subjected to two stresses:
1. Energisation: The magnitude of the operating voltage and the overvoltages applied to the insulator. 2. Environment: The severity of the pollution at the site where the insulator will be installed.
Whereas the energisation parameters are a matter of system design, the environmental conditions need to be quantified through site severity measurements. Particularly for DC systems it is essential to accurately determine the environmental parameters as the site severity may dictate the final insulation design. Pollution deposition under HVDC is a complex interaction between the electric field, the weather and the characteristics of the airborne pollutants. In this chapter the focus is, therefore, more on discussing the requirements for site assessment with respect to the parameters needed for the insulation design.
SYSTEM PARAMETERS
Typical system parameters that are important for the insulation system are:
The range of operating voltage applied to the insulators during normal and abnormal operation, The expected voltage levels on station insulation which are stressed at both AC and DC. The required lightning impulse withstand voltage (LIWV). The required switching impulse withstand voltage (SIWV).
There is a distinct difference in the operating regimen between DC and AC systems. On AC systems the operating voltage varies within a very narrow band (10%) and often pollution related outages result in a lock-out situation due to repeated flashovers on re-energisation. The installation can then only be re-energised when the insulators have dried out sufficiently after the pollution event is over. On classic DC systems the service voltage is a function of the amount of power transferred and it is therefore possible, during critical conditions, to regulate the system voltage, by reducing the transferred power, to a level that will not result in further flashovers for the duration of the pollution event.
The selection and dimensioning of the insulators with respect to environmental conditions is normally based on the DC system voltage.
ENVIRONMENTAL PARAMETERS
For the dimensioning process the following information about site conditions is needed:
The identification of the type (i.e. Type A or B as defined in IEC 60815-1 [38]) and composition of the pollution, i.e. type of salt or more specifically the portion of low solubility salt and the type of inert material present.
The amount of pollution present, typically as determined through Equivalent Salt Deposit Density (ESDD) measurements on DC energised insulators.
The amount of inert material in the pollution layer as determined through Non-Soluble Deposit Density (NSDD) measurements on DC energised insulators.
The non-uniformity of the pollution deposit on the insulator as expressed by: o Top to bottom ratio of the pollution layer o The axial non-uniformity of the pollution layer o The radial non-uniformity of the pollution including other directional variations such as the dominant
wind direction or distinct sources of pollution. An estimate of the number of pollution events per year where a pollution event is a time period with
significant discharge activity on the insulator.
OUTDOOR INSULATION IN POLLUTED CONDITIONS: GUIDELINES FOR SELECTION AND DIMENSIONING
Page 22
In addition it may also be useful to characterise the climate, specifically identifying if there is a prolonged dry season, assessing the geographical, topological and geological features to identify possible natural pollution sources and perform a survey of present and foreseeable future industrial pollution sources and land use.
Influencing factors
POLLUTION DEPOSITION
The deposition of pollution onto insulators is a complicated process as there are a number of forces that determine the flight path of airborne pollution particles. The following forces can be mentioned:
Aerodynamic forces due to air movement. Gravitation as a result of the mass of the particles. Forces due to the electrical field surrounding the insulators.
Wind is an important mode of transport for pollution particles. Measurements at a coastal test station, for example, have shown that the Equivalent Salt Deposit Density (ESDD) is proportional to the cube of the wind speed (i.e. v3) [1]. It was found that a light breeze (wind speed approximately 2-3 m/s) is sufficient to transport pollution particles from localised sources over distances of up to 5 km [39][40]. Wind can transport particles from larger sources, such as the sea or large industrial complexes over several tens of kilometres. On DC systems the pollution deposition by the airflow around insulators becomes overwhelmingly dominant during times when the wind speed exceeds 6 m/s (moderate breeze) [41].
In practice it is found that the electrostatic field effects are significant only on DC energised insulators. Research has shown that the:
The polarity of the DC energisation has very little influence on the amount of pollution deposited [42][41]. The electrostatic attraction seems to be stronger on small particles, such as the particulate content of car
or industry exhaust gasses, than on natural pollution sources such as the sea [43]. Pollution accumulation by electrostatic attraction is dominant during times when the wind speed is below
1.5-3 m/s (i.e. light breeze) [41][39]. On DC insulators (both polymer and conventional) it is found that insulators or insulator sections in the high
E-field regions tend to accumulate the most pollution [44]. This generally results in a non-uniform axial distribution of pollution along the insulator length where most pollution is deposited at the live end, somewhat less at the ground end and the least towards the middle of the insulator [45] [46].
The ratio of pollution non-uniformity on the insulators, as expressed by the top to bottom ratio, is higher on DC energised insulators than it is on AC energised ones. This is because DC insulators accumulate more pollution while the natural cleaning effect is the same as for AC.
When the electric field dominates, the distribution of pollution will be very non-uniform and it will be significantly higher than on AC energised insulators. Where wind dominates the deposition will be much closer to that under AC conditions.
Pollution precipitating onto the insulators (under the influence of gravity) is normally only a concern at sites located close to distinct sources of pollution such as:
Polluted industrial areas (with dust laden air). Mining (especially open cast mines). Agriculture (ploughing, irrigation etc.). Roads (road salt during winter, and soot from automobiles etc.).
These areas are normally of limited extent as the pollution severity from a localised source generally reduces by the inverse of the square of the distance from the source [47].
OUTDOOR INSULATION IN POLLUTED CONDITIONS: GUIDELINES FOR SELECTION AND DIMENSIONING
Page 23
NATURAL CLEANING
Insulators are also exposed to natural cleaning in which pollution is removed from the insulator surfaces by natural means. This is considered beneficial as it results in a reduction of the pollution severity. The two natural cleaning agents are:
1. Rain. High-intensity rain is very effective in washing pollutants from insulator surfaces. Exposed (i.e., top) surfaces that come in direct contact with the rain are most effectively cleaned. The more protected, or bottom surface on the insulator, may also undergo some cleaning, but it is not as efficient. Rain washing of inclined/horizontal insulators can, however, be very effective.
2. Wind. In desert areas, strong winds may carry large sand particles that have a “sand blasting” affect, removing pollutants from the windward side of the insulator [44]. Strong winds will also inhibit the deposition of pollution on smooth surfaces.
The combination of deposition and natural cleaning processes results in a non-uniform pollution deposit on the insulator surface where the exposed surfaces of the insulator generally collect less pollution than the more protected parts. On disc insulators this is normally quantified by measuring the amount of pollution accumulated on the top and bottom surface of the insulator separately and expressing it in terms of the Contamination Uniformity Ratio (CUR), which is the ESDD level on bottom surface of the insulator divided by that of the top surface. It should be noted that many papers quote the Top to Bottom Ratio (T/B) which is the inverse of the CUR.
Field experience shows that insulators subjected to a long term build-up of pollution normally exhibit a CUR greater than 1. This means that the bottom surface of the insulator normally collects more pollution than the top surface. In many locations it is found that the CUR increases over time as the pollution level of the top surface stays relatively constant (due to regular natural cleaning) while the pollution continues to accumulate on the bottom surface under the influence of the electrostatic attraction.
From ESDD measurements on disc type line insulators in China it was found that the there is a relationship between the minimum CUR that can be expected and the severity of the pollution on the disk [40][41]. The pollution distribution between the top and bottom surfaces tended to be more uniform on insulators with a relatively low pollution level. For the specific cases in China the following relationships have been used [41][40]:
AverageMinimum ESDDCUR 100, for coastal areas with regular instances of natural cleaning.
3.148 AverageMinimum ESDDCUR, for dry inland areas where natural cleaning is infrequent.
For substation insulators, ESDD measurements in China show that the differences between the pollution level on the insulator top and bottom surfaces are generally smaller than for disc insulator strings. In one case the average CUR value was as low as 0.64 [41]. Consequently station type insulators are usually designed on the basis of a uniform pollution distribution [48].
IMPORTANT INSULATOR PARAMETERS
The insulator characteristics play an important part in determining the amount of pollution accumulated. The following influences can be mentioned:
The insulator shed profile. The type of insulating material on the retention of pollution particles to the insulator surface.
It has long been known that the insulator shape also strongly influences the amount of pollution accumulation on insulators. Aerodynamically shaped insulators (e.g. insulators with open profiles) accumulate generally less pollution than insulators with more complex profiles. Also insulators with larger diameters collect less pollution per unit area than insulators with smaller diameters. The effect of diameter on the pollution accumulation is independent of the insulating material used for the insulator [49].
OUTDOOR INSULATION IN POLLUTED CONDITIONS: GUIDELINES FOR SELECTION AND DIMENSIONING
Page 24
For AC systems a variety of insulator shapes are available on the market. These range from open aerodynamic profiles (often used in desert areas) to anti-fog shapes with deep under-ribs (often utilised in highly polluted conditions). For DC systems, however, the choice of ceramic insulators was, until recently, limited to anti-fog type designs, which provide a high ratio of leakage to arcing distance. This has changed with the introduction of an outer-rib type profile, specifically designed to minimise the long-term pollution accumulation in areas with a distinct dry period.
Laboratory [34] and field tests [35] have shown that outer-rib type insulators exhibit lower pollution levels than anti-fog insulators under the same conditions. The laboratory field results suggest that the average ESDD measured on the outer-rib profile is in the order of 30-40% of that on anti-fog designs. This reduction in accumulation is explained by the better aerodynamic shape of the outer-rib type insulators which leads to less turbulence and the fact that a greater portion of the total insulator surface is exposed to natural cleaning [34]. Other field results indicate that these ratios may not be applicable to all types of environment [50] and it is possible that the long term accumulation on the outer-rib profiles can be more severe than on the standard anti-fog profile, in some instances.
Specific solutions have also been developed for composite insulators based on the principle of achieving a high creepage factor while maintaining sufficient shed spacing to prevent inter-shed breakdown.
At sites exposed to man-made sources of pollution (e.g. industry etc.) where a significant portion of the pollution precipitates from the air it is found that the pollution mostly collects on the upper (horizontal) insulator surfaces. In such areas vertically orientated insulators with large shed projections collect more pollution than those with smaller sheds. This is aggravated in low-rainfall areas where there is limited natural cleaning.
The housing material can influence the build-up of pollution on the insulator surface. Porcelain and toughened glass insulators have smooth surfaces that – in the new state – do not provide much grip for pollutants to firmly attach to it. This changes as the insulator weathers and the surface becomes rougher, resulting in higher levels of pollution on weathered insulators.
Comparative measurements under DC energisation have shown that the hydrophobic surface of silicone rubber insulators tends to collect about 20% more pollution than a standard disc insulator [49]. This effect has also been observed on insulators under AC energisation [1] and it is ascribed to the low molecular weight silicone oils which migrate into the pollution layer and bind it to the insulator surface [45]. This pollution is however not directly available for the pollution flashover process as it is prevented, to a certain extent, from going into solution by the same oils when the insulator is wetted. For this reason ESDD measurements are not regarded as an appropriate method to determine the pollution severity on composite insulators. This is because pollution encapsulated by low-molecular weight silicone oils is also included in the measurement. Surface conductivity measurements may be more applicable for these insulators [51][52].
How to determine the pollution severity
In this section, different methods to assess the site pollution severity for the application of DC insulators are discussed. There are several techniques available to quantify the severity of a site, but for DC installations ESDD/NSDD measurements are used most often. The ESDD/NSDD measurement technique has been standardised by the IEC [38]. To facilitate the interpretation of the pollution measurements it is also necessary to obtain general information about the climate and nature of the pollution at the site. Some important parameters are listed in Table 2.
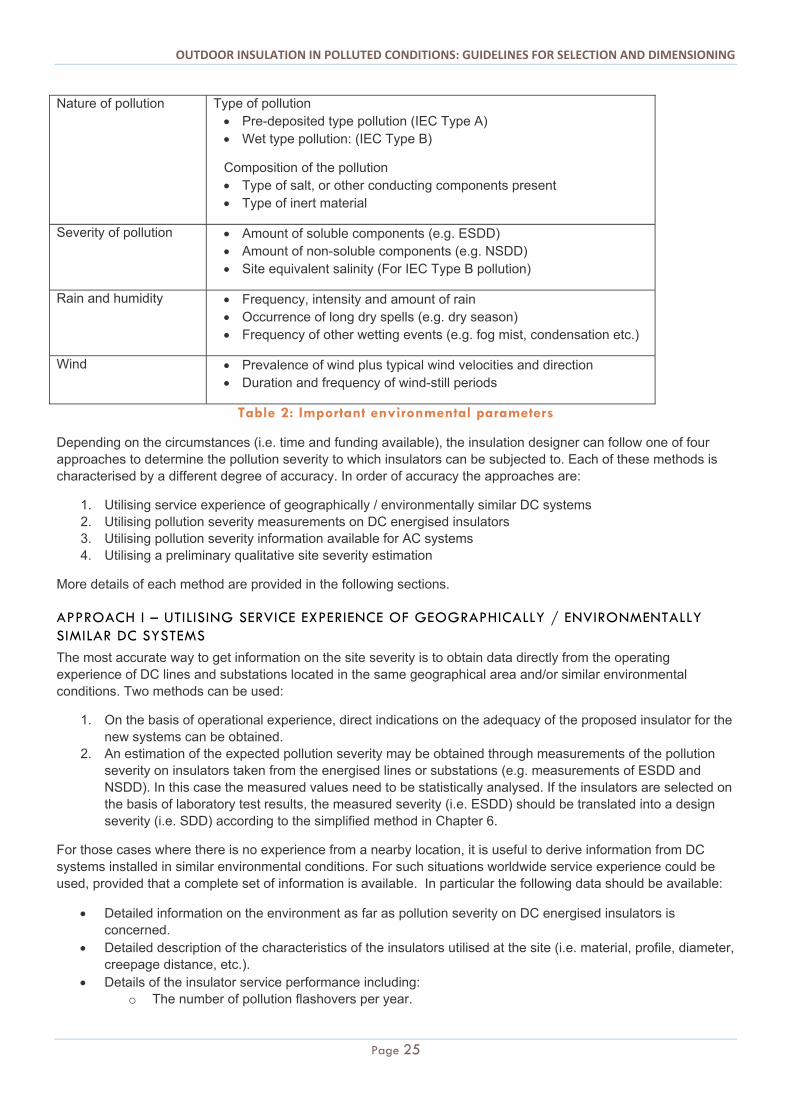
OUTDOOR INSULATION IN POLLUTED CONDITIONS: GUIDELINES FOR SELECTION AND DIMENSIONING
Page 25
Nature of pollution Type of pollution Pre-deposited type pollution (IEC Type A) Wet type pollution: (IEC Type B)
Composition of the pollution Type of salt, or other conducting components present Type of inert material
Severity of pollution Amount of soluble components (e.g. ESDD) Amount of non-soluble components (e.g. NSDD) Site equivalent salinity (For IEC Type B pollution)
Rain and humidity Frequency, intensity and amount of rain Occurrence of long dry spells (e.g. dry season) Frequency of other wetting events (e.g. fog mist, condensation etc.)
Wind Prevalence of wind plus typical wind velocities and direction Duration and frequency of wind-still periods
Table 2: Important environmental parameters
Depending on the circumstances (i.e. time and funding available), the insulation designer can follow one of four approaches to determine the pollution severity to which insulators can be subjected to. Each of these methods is characterised by a different degree of accuracy. In order of accuracy the approaches are:
1. Utilising service experience of geographically / environmentally similar DC systems 2. Utilising pollution severity measurements on DC energised insulators 3. Utilising pollution severity information available for AC systems 4. Utilising a preliminary qualitative site severity estimation
More details of each method are provided in the following sections.
APPROACH I – UTILISING SERVICE EXPERIENCE OF GEOGRAPHICALLY / ENVIRONMENTALLY SIMILAR DC SYSTEMS
The most accurate way to get information on the site severity is to obtain data directly from the operating experience of DC lines and substations located in the same geographical area and/or similar environmental conditions. Two methods can be used:
1. On the basis of operational experience, direct indications on the adequacy of the proposed insulator for the new systems can be obtained.
2. An estimation of the expected pollution severity may be obtained through measurements of the pollution severity on insulators taken from the energised lines or substations (e.g. measurements of ESDD and NSDD). In this case the measured values need to be statistically analysed. If the insulators are selected on the basis of laboratory test results, the measured severity (i.e. ESDD) should be translated into a design severity (i.e. SDD) according to the simplified method in Chapter 6.
For those cases where there is no experience from a nearby location, it is useful to derive information from DC systems installed in similar environmental conditions. For such situations worldwide service experience could be used, provided that a complete set of information is available. In particular the following data should be available:
Detailed information on the environment as far as pollution severity on DC energised insulators is concerned.
Detailed description of the characteristics of the insulators utilised at the site (i.e. material, profile, diameter, creepage distance, etc.).
Details of the insulator service performance including: o The number of pollution flashovers per year.
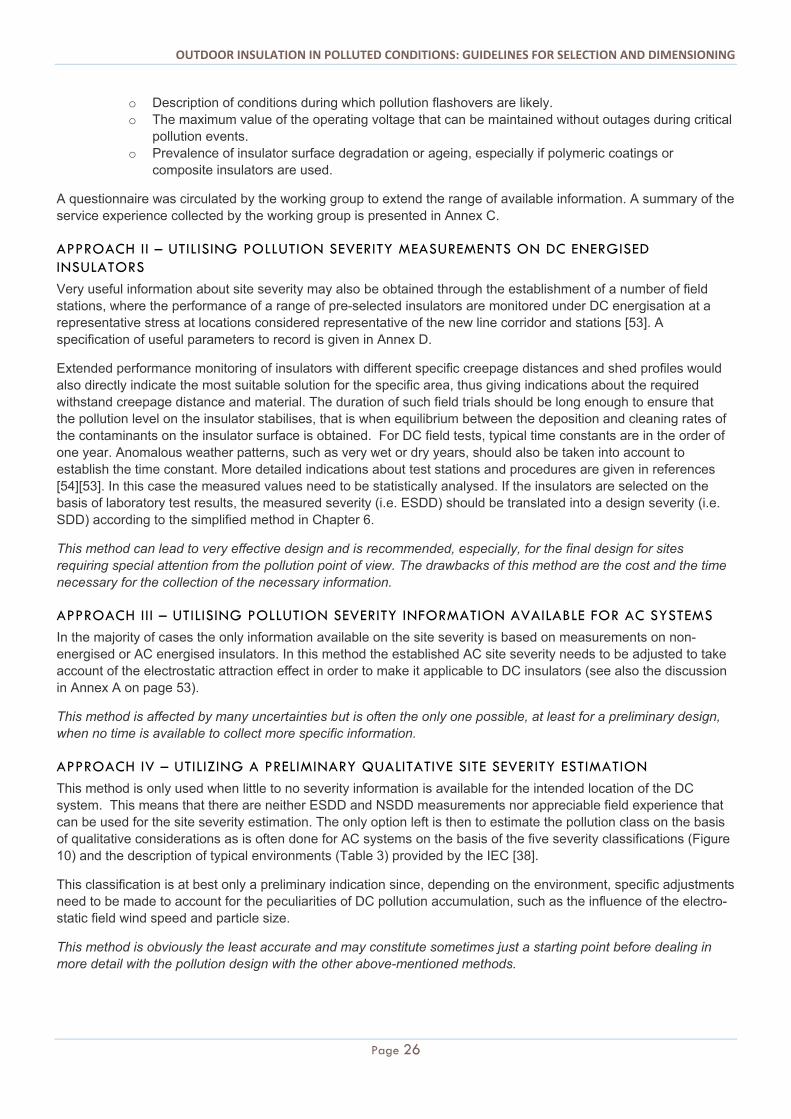
OUTDOOR INSULATION IN POLLUTED CONDITIONS: GUIDELINES FOR SELECTION AND DIMENSIONING
Page 26
o Description of conditions during which pollution flashovers are likely. o The maximum value of the operating voltage that can be maintained without outages during critical
pollution events. o Prevalence of insulator surface degradation or ageing, especially if polymeric coatings or
composite insulators are used.
A questionnaire was circulated by the working group to extend the range of available information. A summary of the service experience collected by the working group is presented in Annex C.
APPROACH II – UTILISING POLLUTION SEVERITY MEASUREMENTS ON DC ENERGISED INSULATORS
Very useful information about site severity may also be obtained through the establishment of a number of field stations, where the performance of a range of pre-selected insulators are monitored under DC energisation at a representative stress at locations considered representative of the new line corridor and stations [53]. A specification of useful parameters to record is given in Annex D.
Extended performance monitoring of insulators with different specific creepage distances and shed profiles would also directly indicate the most suitable solution for the specific area, thus giving indications about the required withstand creepage distance and material. The duration of such field trials should be long enough to ensure that the pollution level on the insulator stabilises, that is when equilibrium between the deposition and cleaning rates of the contaminants on the insulator surface is obtained. For DC field tests, typical time constants are in the order of one year. Anomalous weather patterns, such as very wet or dry years, should also be taken into account to establish the time constant. More detailed indications about test stations and procedures are given in references [54][53]. In this case the measured values need to be statistically analysed. If the insulators are selected on the basis of laboratory test results, the measured severity (i.e. ESDD) should be translated into a design severity (i.e. SDD) according to the simplified method in Chapter 6.
This method can lead to very effective design and is recommended, especially, for the final design for sites requiring special attention from the pollution point of view. The drawbacks of this method are the cost and the time necessary for the collection of the necessary information.
APPROACH III – UTILISING POLLUTION SEVERITY INFORMATION AVAILABLE FOR AC SYSTEMS
In the majority of cases the only information available on the site severity is based on measurements on non-energised or AC energised insulators. In this method the established AC site severity needs to be adjusted to take account of the electrostatic attraction effect in order to make it applicable to DC insulators (see also the discussion in Annex A on page 53).
This method is affected by many uncertainties but is often the only one possible, at least for a preliminary design, when no time is available to collect more specific information.
APPROACH IV – UTILIZING A PRELIMINARY QUALITATIVE SITE SEVERITY ESTIMATION
This method is only used when little to no severity information is available for the intended location of the DC system. This means that there are neither ESDD and NSDD measurements nor appreciable field experience that can be used for the site severity estimation. The only option left is then to estimate the pollution class on the basis of qualitative considerations as is often done for AC systems on the basis of the five severity classifications (Figure 10) and the description of typical environments (Table 3) provided by the IEC [38].
This classification is at best only a preliminary indication since, depending on the environment, specific adjustments need to be made to account for the peculiarities of DC pollution accumulation, such as the influence of the electro-static field wind speed and particle size.
This method is obviously the least accurate and may constitute sometimes just a starting point before dealing in more detail with the pollution design with the other above-mentioned methods.
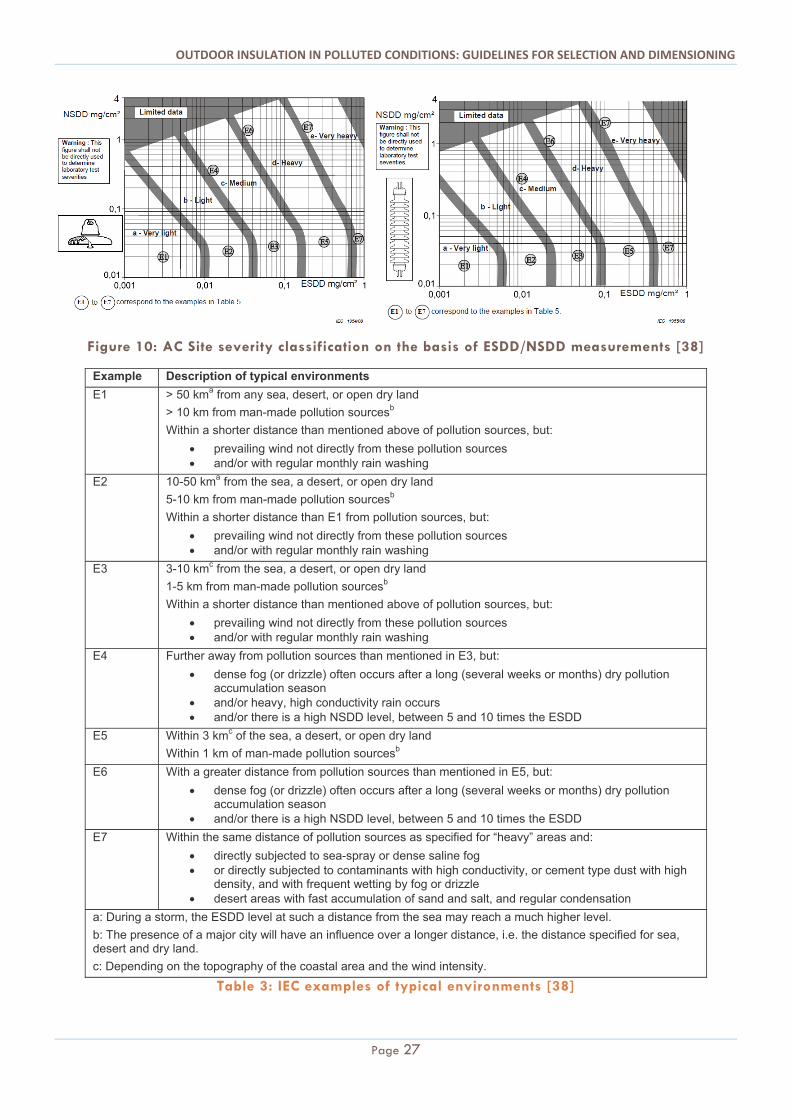
OUTDOOR INSULATION IN POLLUTED CONDITIONS: GUIDELINES FOR SELECTION AND DIMENSIONING
Page 27
Figure 10: AC Site severity classification on the basis of ESDD/NSDD measurements [38]
Example Description of typical environments
E1 > 50 kma from any sea, desert, or open dry land
> 10 km from man-made pollution sourcesb
Within a shorter distance than mentioned above of pollution sources, but:
prevailing wind not directly from these pollution sources and/or with regular monthly rain washing
E2 10-50 kma from the sea, a desert, or open dry land
5-10 km from man-made pollution sourcesb
Within a shorter distance than E1 from pollution sources, but:
prevailing wind not directly from these pollution sources and/or with regular monthly rain washing
E3 3-10 kmc from the sea, a desert, or open dry land
1-5 km from man-made pollution sourcesb
Within a shorter distance than mentioned above of pollution sources, but:
prevailing wind not directly from these pollution sources and/or with regular monthly rain washing
E4 Further away from pollution sources than mentioned in E3, but:
dense fog (or drizzle) often occurs after a long (several weeks or months) dry pollution accumulation season
and/or heavy, high conductivity rain occurs and/or there is a high NSDD level, between 5 and 10 times the ESDD
E5 Within 3 kmc of the sea, a desert, or open dry land
Within 1 km of man-made pollution sourcesb
E6 With a greater distance from pollution sources than mentioned in E5, but:
dense fog (or drizzle) often occurs after a long (several weeks or months) dry pollution accumulation season
and/or there is a high NSDD level, between 5 and 10 times the ESDD
E7 Within the same distance of pollution sources as specified for “heavy” areas and:
directly subjected to sea-spray or dense saline fog or directly subjected to contaminants with high conductivity, or cement type dust with high
density, and with frequent wetting by fog or drizzle desert areas with fast accumulation of sand and salt, and regular condensation
a: During a storm, the ESDD level at such a distance from the sea may reach a much higher level.
b: The presence of a major city will have an influence over a longer distance, i.e. the distance specified for sea, desert and dry land.
c: Depending on the topography of the coastal area and the wind intensity.
Table 3: IEC examples of typical environments [38]
OUTDOOR INSULATION IN POLLUTED CONDITIONS: GUIDELINES FOR SELECTION AND DIMENSIONING
Page 28
Chapter 5: Determination of the insulator characteristics and dimensions
Introduction
Selection of creepage distance: The required insulator dimensions (notably the leakage distance) for particular site conditions are determined from available service experience or field test results. If that is not available representative tests may be performed on the candidate insulator types to determine the statistical flashover properties. Under “representative test” is understood any laboratory test, which is designed to imitate the natural pollution conditions as closely as possible by replicating the:
1. Pollution severity (i.e. ESDD and NSDD) 2. Its composition (i.e. type of salt, and non-soluble components) 3. The uniformity of the deposit and 4. Wetting conditions.
The above information is then used to do a statistical risk evaluation of the insulation design, including any mitigation measures, to verify compliance with the required performance criterion. This should include an assessment of the impact of:
1. The number of insulators exposed to the same conditions, 2. The frequency of pollution events and 3. Additional safety factors to cater for any uncertainties in the input data.
Influencing factors
There are various parameters that influence the pollution flashover strength of insulators. These include:
Polarity of the applied voltage Linearity of flashover strength with the length of the insulator Pollution severity Wetting conditions Effect of non-soluble pollution Effect of type of salt Effect of diameter Effect of non-uniformity of pollution (top to bottom and axial differences) Effect of altitude The effect of the insulator surface characteristics e.g. HTM or non-HTM
THE EFFECT OF POLARITY ON THE POLLUTION FLASHOVER VOLTAGE
It is generally accepted that DC pollution tests with a negative polarity results in the lowest flashover values on line insulators. Laboratory test results indicate that this difference can be in the order of 10-20% [14][10] for disc insulator strings, but on long-rod, post or equipment insulators the polarity effect was found to be negligible [4]. For substation insulators the effect of polarity is not as distinct. A survey of outages in substations has shown (see Figure 11) that most flashovers on vertical insulators occurred on positive polarity. However, flashovers on wall bushings were mostly negative due to the specific flashover condition under non uniform rain [55].
Most of the pollution flashover results reported on in literature are for tests with negative polarity.
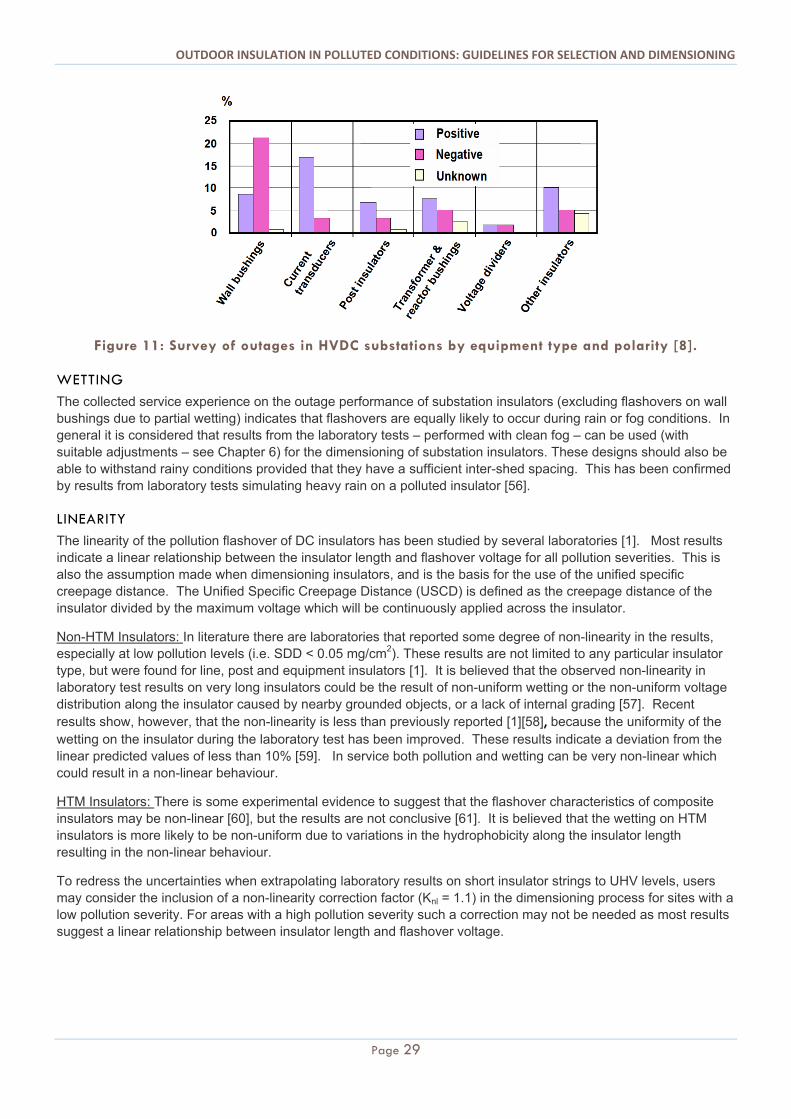
OUTDOOR INSULATION IN POLLUTED CONDITIONS: GUIDELINES FOR SELECTION AND DIMENSIONING
Page 29
Figure 11: Survey of outages in HVDC substations by equipment type and polarity [8].
WETTING
The collected service experience on the outage performance of substation insulators (excluding flashovers on wall bushings due to partial wetting) indicates that flashovers are equally likely to occur during rain or fog conditions. In general it is considered that results from the laboratory tests – performed with clean fog – can be used (with suitable adjustments – see Chapter 6) for the dimensioning of substation insulators. These designs should also be able to withstand rainy conditions provided that they have a sufficient inter-shed spacing. This has been confirmed by results from laboratory tests simulating heavy rain on a polluted insulator [56].
LINEARITY
The linearity of the pollution flashover of DC insulators has been studied by several laboratories [1]. Most results indicate a linear relationship between the insulator length and flashover voltage for all pollution severities. This is also the assumption made when dimensioning insulators, and is the basis for the use of the unified specific creepage distance. The Unified Specific Creepage Distance (USCD) is defined as the creepage distance of the insulator divided by the maximum voltage which will be continuously applied across the insulator.
Non-HTM Insulators: In literature there are laboratories that reported some degree of non-linearity in the results, especially at low pollution levels (i.e. SDD < 0.05 mg/cm2). These results are not limited to any particular insulator type, but were found for line, post and equipment insulators [1]. It is believed that the observed non-linearity in laboratory test results on very long insulators could be the result of non-uniform wetting or the non-uniform voltage distribution along the insulator caused by nearby grounded objects, or a lack of internal grading [57]. Recent results show, however, that the non-linearity is less than previously reported [1][58], because the uniformity of the wetting on the insulator during the laboratory test has been improved. These results indicate a deviation from the linear predicted values of less than 10% [59]. In service both pollution and wetting can be very non-linear which could result in a non-linear behaviour.
HTM Insulators: There is some experimental evidence to suggest that the flashover characteristics of composite insulators may be non-linear [60], but the results are not conclusive [61]. It is believed that the wetting on HTM insulators is more likely to be non-uniform due to variations in the hydrophobicity along the insulator length resulting in the non-linear behaviour.
To redress the uncertainties when extrapolating laboratory results on short insulator strings to UHV levels, users may consider the inclusion of a non-linearity correction factor (Knl = 1.1) in the dimensioning process for sites with a low pollution severity. For areas with a high pollution severity such a correction may not be needed as most results suggest a linear relationship between insulator length and flashover voltage.
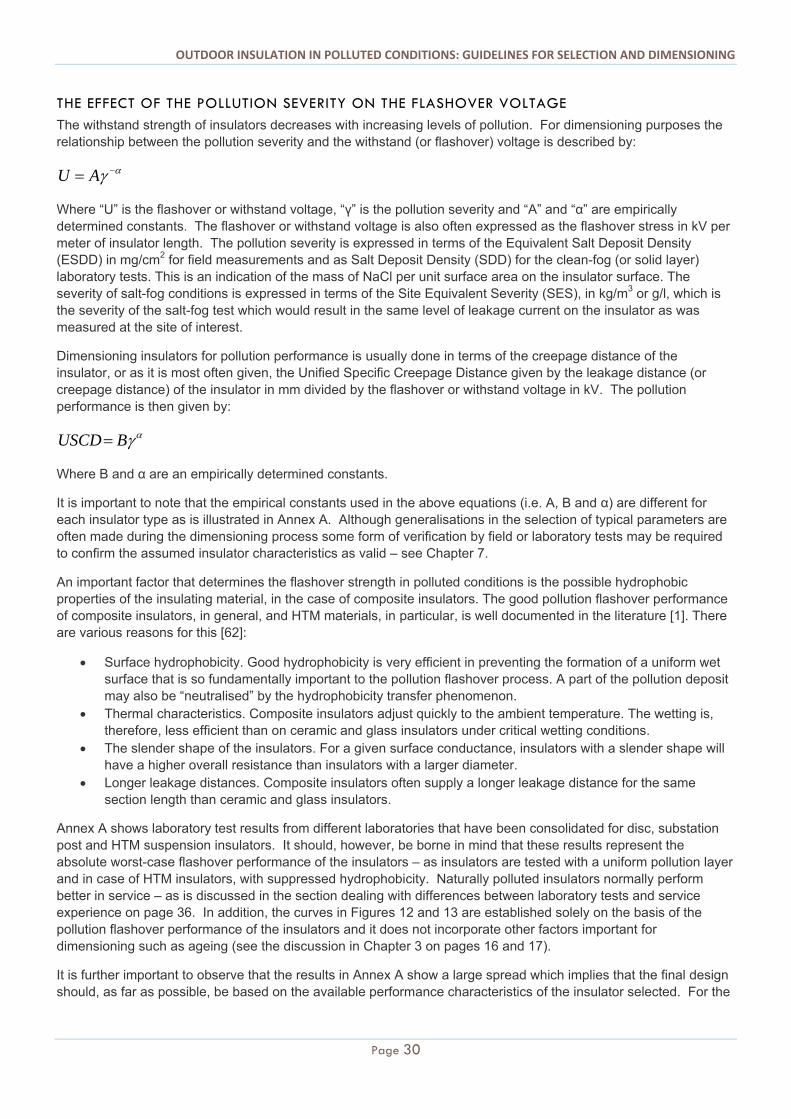
OUTDOOR INSULATION IN POLLUTED CONDITIONS: GUIDELINES FOR SELECTION AND DIMENSIONING
Page 30
THE EFFECT OF THE POLLUTION SEVERITY ON THE FLASHOVER VOLTAGE
The withstand strength of insulators decreases with increasing levels of pollution. For dimensioning purposes the relationship between the pollution severity and the withstand (or flashover) voltage is described by:
AU
Where “U” is the flashover or withstand voltage, “γ” is the pollution severity and “A” and “α” are empirically determined constants. The flashover or withstand voltage is also often expressed as the flashover stress in kV per meter of insulator length. The pollution severity is expressed in terms of the Equivalent Salt Deposit Density (ESDD) in mg/cm2 for field measurements and as Salt Deposit Density (SDD) for the clean-fog (or solid layer) laboratory tests. This is an indication of the mass of NaCl per unit surface area on the insulator surface. The severity of salt-fog conditions is expressed in terms of the Site Equivalent Severity (SES), in kg/m3 or g/l, which is the severity of the salt-fog test which would result in the same level of leakage current on the insulator as was measured at the site of interest.
Dimensioning insulators for pollution performance is usually done in terms of the creepage distance of the insulator, or as it is most often given, the Unified Specific Creepage Distance given by the leakage distance (or creepage distance) of the insulator in mm divided by the flashover or withstand voltage in kV. The pollution performance is then given by:
BUSCD
Where B and α are an empirically determined constants.
It is important to note that the empirical constants used in the above equations (i.e. A, B and α) are different for each insulator type as is illustrated in Annex A. Although generalisations in the selection of typical parameters are often made during the dimensioning process some form of verification by field or laboratory tests may be required to confirm the assumed insulator characteristics as valid – see Chapter 7.
An important factor that determines the flashover strength in polluted conditions is the possible hydrophobic properties of the insulating material, in the case of composite insulators. The good pollution flashover performance of composite insulators, in general, and HTM materials, in particular, is well documented in the literature [1]. There are various reasons for this [62]:
Surface hydrophobicity. Good hydrophobicity is very efficient in preventing the formation of a uniform wet surface that is so fundamentally important to the pollution flashover process. A part of the pollution deposit may also be “neutralised” by the hydrophobicity transfer phenomenon.
Thermal characteristics. Composite insulators adjust quickly to the ambient temperature. The wetting is, therefore, less efficient than on ceramic and glass insulators under critical wetting conditions.
The slender shape of the insulators. For a given surface conductance, insulators with a slender shape will have a higher overall resistance than insulators with a larger diameter.
Longer leakage distances. Composite insulators often supply a longer leakage distance for the same section length than ceramic and glass insulators.
Annex A shows laboratory test results from different laboratories that have been consolidated for disc, substation post and HTM suspension insulators. It should, however, be borne in mind that these results represent the absolute worst-case flashover performance of the insulators – as insulators are tested with a uniform pollution layer and in case of HTM insulators, with suppressed hydrophobicity. Naturally polluted insulators normally perform better in service – as is discussed in the section dealing with differences between laboratory tests and service experience on page 36. In addition, the curves in Figures 12 and 13 are established solely on the basis of the pollution flashover performance of the insulators and it does not incorporate other factors important for dimensioning such as ageing (see the discussion in Chapter 3 on pages 16 and 17).
It is further important to observe that the results in Annex A show a large spread which implies that the final design should, as far as possible, be based on the available performance characteristics of the insulator selected. For the
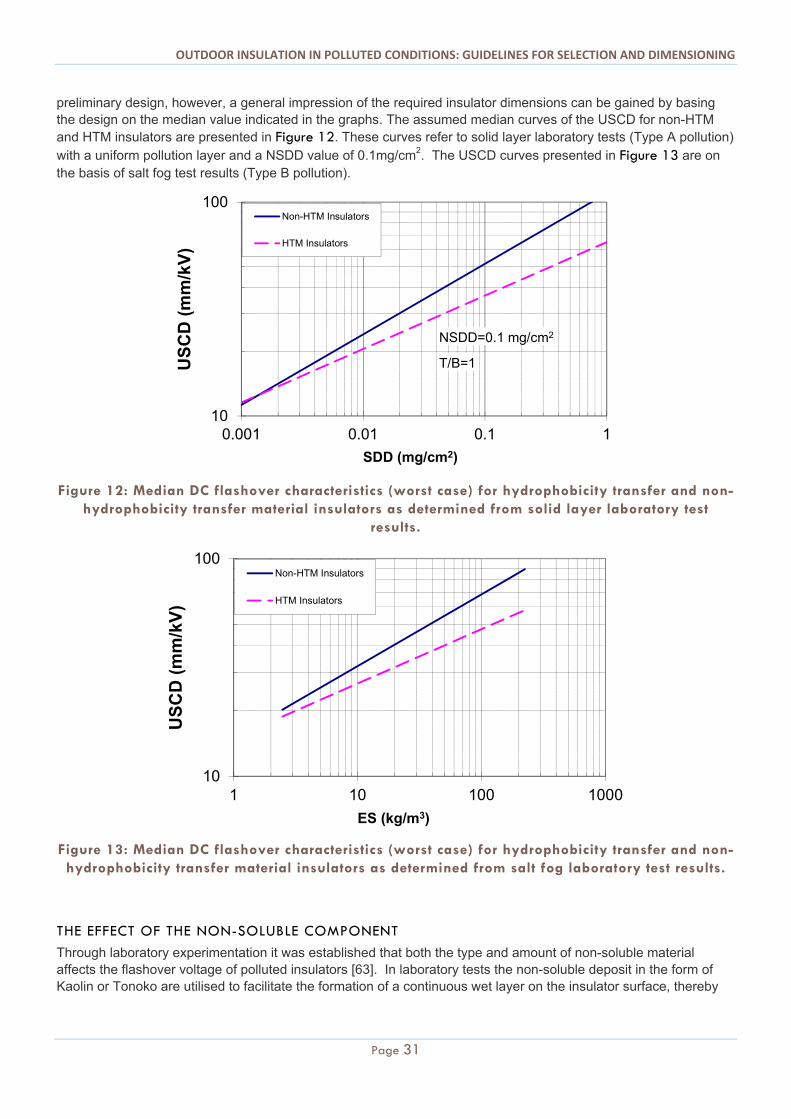
OUTDOOR INSULATION IN POLLUTED CONDITIONS: GUIDELINES FOR SELECTION AND DIMENSIONING
Page 31
preliminary design, however, a general impression of the required insulator dimensions can be gained by basing the design on the median value indicated in the graphs. The assumed median curves of the USCD for non-HTM and HTM insulators are presented in Figure 12. These curves refer to solid layer laboratory tests (Type A pollution) with a uniform pollution layer and a NSDD value of 0.1mg/cm2. The USCD curves presented in Figure 13 are on the basis of salt fog test results (Type B pollution).
Figure 12: Median DC flashover characteristics (worst case) for hydrophobicity transfer and non-hydrophobicity transfer material insulators as determined from solid layer laboratory test
results.
Figure 13: Median DC flashover characteristics (worst case) for hydrophobicity transfer and non-hydrophobicity transfer material insulators as determined from salt fog laboratory test results.
THE EFFECT OF THE NON-SOLUBLE COMPONENT
Through laboratory experimentation it was established that both the type and amount of non-soluble material affects the flashover voltage of polluted insulators [63]. In laboratory tests the non-soluble deposit in the form of Kaolin or Tonoko are utilised to facilitate the formation of a continuous wet layer on the insulator surface, thereby
10
100
0.001 0.01 0.1 1
US
CD
(m
m/k
V)
SDD (mg/cm2)
Non-HTM Insulators
HTM Insulators
NSDD=0.1 mg/cm2
T/B=1
10
100
1 10 100 1000
US
CD
(m
m/k
V)
ES (kg/m3)
Non-HTM Insulators
HTM Insulators
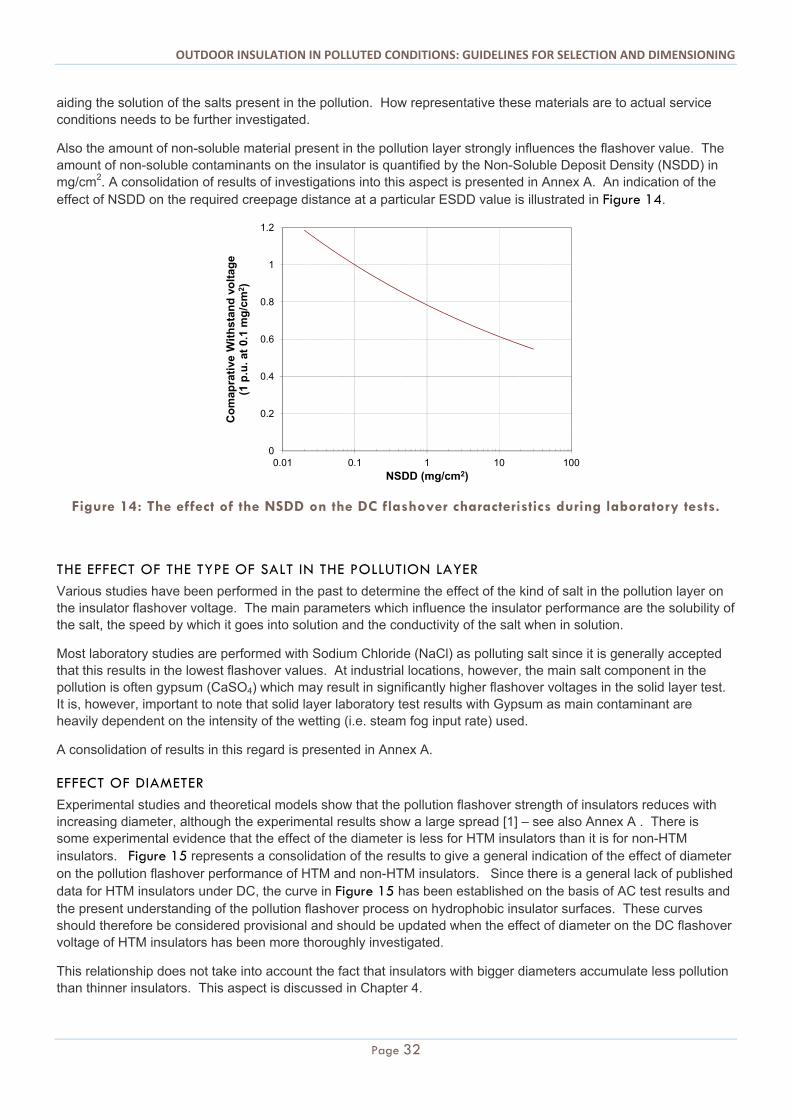
OUTDOOR INSULATION IN POLLUTED CONDITIONS: GUIDELINES FOR SELECTION AND DIMENSIONING
Page 32
aiding the solution of the salts present in the pollution. How representative these materials are to actual service conditions needs to be further investigated.
Also the amount of non-soluble material present in the pollution layer strongly influences the flashover value. The amount of non-soluble contaminants on the insulator is quantified by the Non-Soluble Deposit Density (NSDD) in mg/cm2. A consolidation of results of investigations into this aspect is presented in Annex A. An indication of the effect of NSDD on the required creepage distance at a particular ESDD value is illustrated in Figure 14.
Figure 14: The effect of the NSDD on the DC flashover characteristics during laboratory tests.
THE EFFECT OF THE TYPE OF SALT IN THE POLLUTION LAYER
Various studies have been performed in the past to determine the effect of the kind of salt in the pollution layer on the insulator flashover voltage. The main parameters which influence the insulator performance are the solubility of the salt, the speed by which it goes into solution and the conductivity of the salt when in solution.
Most laboratory studies are performed with Sodium Chloride (NaCl) as polluting salt since it is generally accepted that this results in the lowest flashover values. At industrial locations, however, the main salt component in the pollution is often gypsum (CaSO4) which may result in significantly higher flashover voltages in the solid layer test. It is, however, important to note that solid layer laboratory test results with Gypsum as main contaminant are heavily dependent on the intensity of the wetting (i.e. steam fog input rate) used.
A consolidation of results in this regard is presented in Annex A.
EFFECT OF DIAMETER
Experimental studies and theoretical models show that the pollution flashover strength of insulators reduces with increasing diameter, although the experimental results show a large spread [1] – see also Annex A . There is some experimental evidence that the effect of the diameter is less for HTM insulators than it is for non-HTM insulators. Figure 15 represents a consolidation of the results to give a general indication of the effect of diameter on the pollution flashover performance of HTM and non-HTM insulators. Since there is a general lack of published data for HTM insulators under DC, the curve in Figure 15 has been established on the basis of AC test results and the present understanding of the pollution flashover process on hydrophobic insulator surfaces. These curves should therefore be considered provisional and should be updated when the effect of diameter on the DC flashover voltage of HTM insulators has been more thoroughly investigated.
This relationship does not take into account the fact that insulators with bigger diameters accumulate less pollution than thinner insulators. This aspect is discussed in Chapter 4.
0
0.2
0.4
0.6
0.8
1
1.2
0.01 0.1 1 10 100
Co
map
rati
ve W
ith
stan
d v
olt
age
(1 p
.u. a
t 0.
1 m
g/c
m2 )
NSDD (mg/cm2)
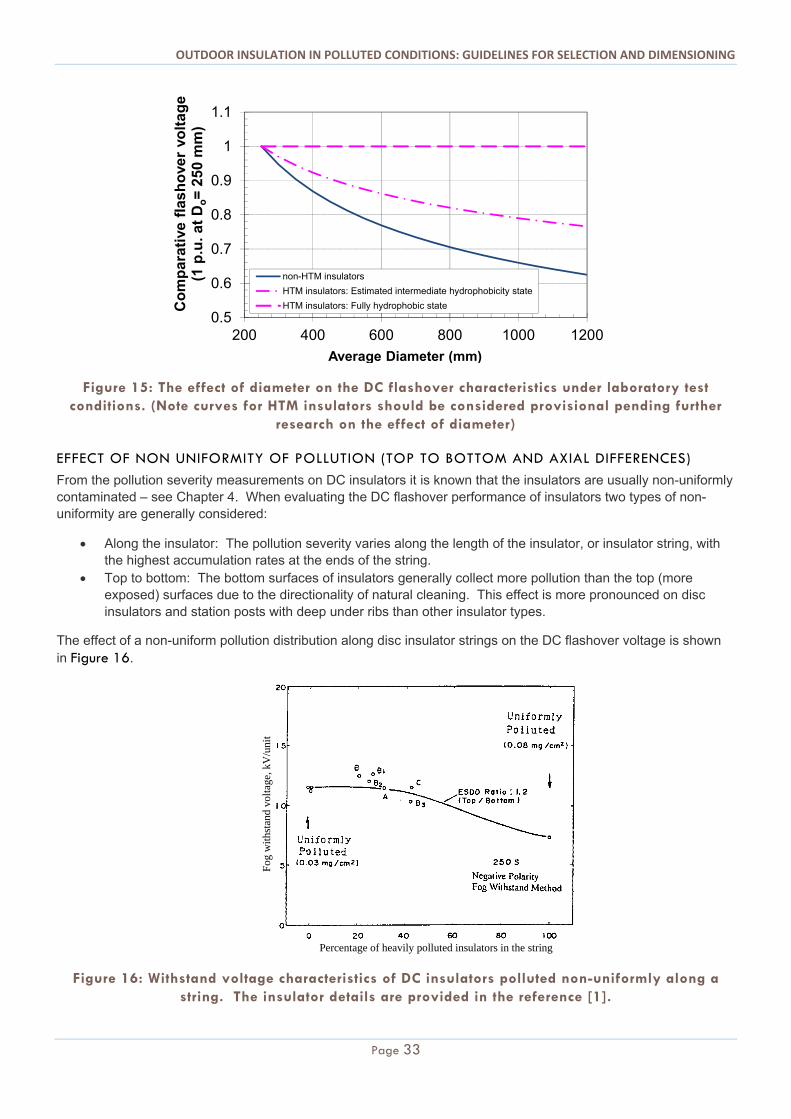
OUTDOOR INSULATION IN POLLUTED CONDITIONS: GUIDELINES FOR SELECTION AND DIMENSIONING
Page 33
Figure 15: The effect of diameter on the DC flashover characteristics under laboratory test conditions. (Note curves for HTM insulators should be considered provisional pending further
research on the effect of diameter)
EFFECT OF NON UNIFORMITY OF POLLUTION (TOP TO BOTTOM AND AXIAL DIFFERENCES)
From the pollution severity measurements on DC insulators it is known that the insulators are usually non-uniformly contaminated – see Chapter 4. When evaluating the DC flashover performance of insulators two types of non-uniformity are generally considered:
Along the insulator: The pollution severity varies along the length of the insulator, or insulator string, with the highest accumulation rates at the ends of the string.
Top to bottom: The bottom surfaces of insulators generally collect more pollution than the top (more exposed) surfaces due to the directionality of natural cleaning. This effect is more pronounced on disc insulators and station posts with deep under ribs than other insulator types.
The effect of a non-uniform pollution distribution along disc insulator strings on the DC flashover voltage is shown in Figure 16.
Figure 16: Withstand voltage characteristics of DC insulators polluted non-uniformly along a string. The insulator details are provided in the reference [1].
0.5
0.6
0.7
0.8
0.9
1
1.1
200 400 600 800 1000 1200
Co
mp
arat
ive
flas
ho
ver
volt
ag
e (1
p.u
. a
t D
o=
25
0 m
m)
Average Diameter (mm)
non-HTM insulators
HTM insulators: Estimated intermediate hydrophobicity state
HTM insulators: Fully hydrophobic state
Percentage of heavily polluted insulators in the string
Fog
with
stan
d vo
ltag
e, k
V/u
nit
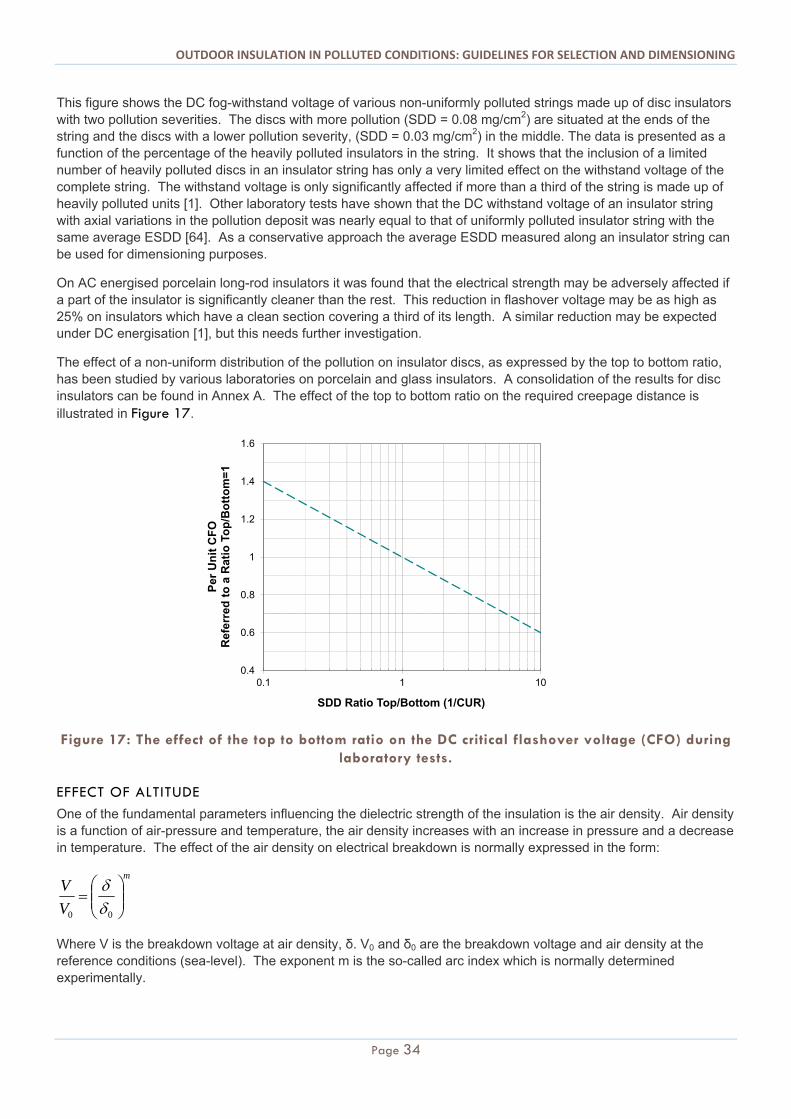
OUTDOOR INSULATION IN POLLUTED CONDITIONS: GUIDELINES FOR SELECTION AND DIMENSIONING
Page 34
This figure shows the DC fog-withstand voltage of various non-uniformly polluted strings made up of disc insulators with two pollution severities. The discs with more pollution (SDD = 0.08 mg/cm2) are situated at the ends of the string and the discs with a lower pollution severity, (SDD = 0.03 mg/cm2) in the middle. The data is presented as a function of the percentage of the heavily polluted insulators in the string. It shows that the inclusion of a limited number of heavily polluted discs in an insulator string has only a very limited effect on the withstand voltage of the complete string. The withstand voltage is only significantly affected if more than a third of the string is made up of heavily polluted units [1]. Other laboratory tests have shown that the DC withstand voltage of an insulator string with axial variations in the pollution deposit was nearly equal to that of uniformly polluted insulator string with the same average ESDD [64]. As a conservative approach the average ESDD measured along an insulator string can be used for dimensioning purposes.
On AC energised porcelain long-rod insulators it was found that the electrical strength may be adversely affected if a part of the insulator is significantly cleaner than the rest. This reduction in flashover voltage may be as high as 25% on insulators which have a clean section covering a third of its length. A similar reduction may be expected under DC energisation [1], but this needs further investigation.
The effect of a non-uniform distribution of the pollution on insulator discs, as expressed by the top to bottom ratio, has been studied by various laboratories on porcelain and glass insulators. A consolidation of the results for disc insulators can be found in Annex A. The effect of the top to bottom ratio on the required creepage distance is illustrated in Figure 17.
Figure 17: The effect of the top to bottom ratio on the DC critical flashover voltage (CFO) during laboratory tests.
EFFECT OF ALTITUDE
One of the fundamental parameters influencing the dielectric strength of the insulation is the air density. Air density is a function of air-pressure and temperature, the air density increases with an increase in pressure and a decrease in temperature. The effect of the air density on electrical breakdown is normally expressed in the form:
m
V
V
00
Where V is the breakdown voltage at air density, δ. V0 and δ0 are the breakdown voltage and air density at the reference conditions (sea-level). The exponent m is the so-called arc index which is normally determined experimentally.
0.4
0.6
0.8
1
1.2
1.4
1.6
0.1 1 10
Per
Un
it C
FO
R
efer
red
to
a R
atio
To
p/B
ott
om
=1
SDD Ratio Top/Bottom (1/CUR)
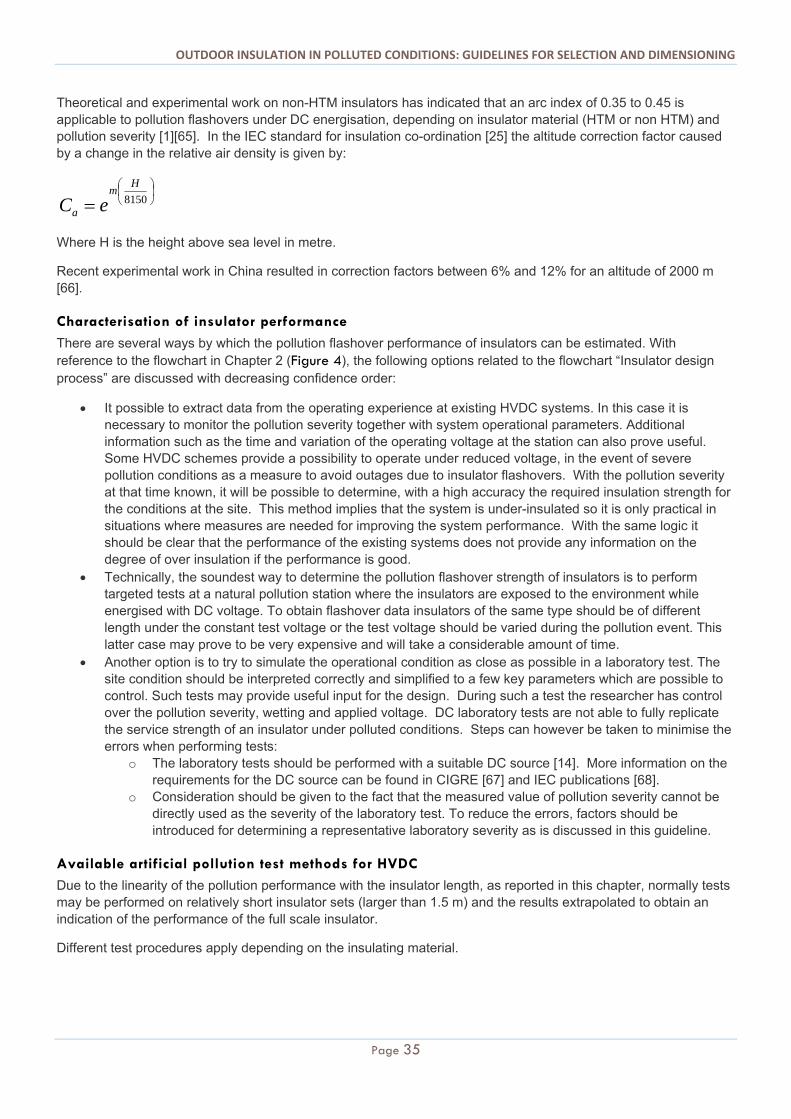
OUTDOOR INSULATION IN POLLUTED CONDITIONS: GUIDELINES FOR SELECTION AND DIMENSIONING
Page 35
Theoretical and experimental work on non-HTM insulators has indicated that an arc index of 0.35 to 0.45 is applicable to pollution flashovers under DC energisation, depending on insulator material (HTM or non HTM) and pollution severity [1][65]. In the IEC standard for insulation co-ordination [25] the altitude correction factor caused by a change in the relative air density is given by:
8150
Hm
a eC
Where H is the height above sea level in metre.
Recent experimental work in China resulted in correction factors between 6% and 12% for an altitude of 2000 m [66].
Characterisation of insulator performance
There are several ways by which the pollution flashover performance of insulators can be estimated. With reference to the flowchart in Chapter 2 (Figure 4), the following options related to the flowchart “Insulator design process” are discussed with decreasing confidence order:
It possible to extract data from the operating experience at existing HVDC systems. In this case it is necessary to monitor the pollution severity together with system operational parameters. Additional information such as the time and variation of the operating voltage at the station can also prove useful. Some HVDC schemes provide a possibility to operate under reduced voltage, in the event of severe pollution conditions as a measure to avoid outages due to insulator flashovers. With the pollution severity at that time known, it will be possible to determine, with a high accuracy the required insulation strength for the conditions at the site. This method implies that the system is under-insulated so it is only practical in situations where measures are needed for improving the system performance. With the same logic it should be clear that the performance of the existing systems does not provide any information on the degree of over insulation if the performance is good.
Technically, the soundest way to determine the pollution flashover strength of insulators is to perform targeted tests at a natural pollution station where the insulators are exposed to the environment while energised with DC voltage. To obtain flashover data insulators of the same type should be of different length under the constant test voltage or the test voltage should be varied during the pollution event. This latter case may prove to be very expensive and will take a considerable amount of time.
Another option is to try to simulate the operational condition as close as possible in a laboratory test. The site condition should be interpreted correctly and simplified to a few key parameters which are possible to control. Such tests may provide useful input for the design. During such a test the researcher has control over the pollution severity, wetting and applied voltage. DC laboratory tests are not able to fully replicate the service strength of an insulator under polluted conditions. Steps can however be taken to minimise the errors when performing tests:
o The laboratory tests should be performed with a suitable DC source [14]. More information on the requirements for the DC source can be found in CIGRE [67] and IEC publications [68].
o Consideration should be given to the fact that the measured value of pollution severity cannot be directly used as the severity of the laboratory test. To reduce the errors, factors should be introduced for determining a representative laboratory severity as is discussed in this guideline.
Available artificial pollution test methods for HVDC
Due to the linearity of the pollution performance with the insulator length, as reported in this chapter, normally tests may be performed on relatively short insulator sets (larger than 1.5 m) and the results extrapolated to obtain an indication of the performance of the full scale insulator.
Different test procedures apply depending on the insulating material.
OUTDOOR INSULATION IN POLLUTED CONDITIONS: GUIDELINES FOR SELECTION AND DIMENSIONING
Page 36
PORCELAIN AND GLASS (NON-HTM) INSULATORS
IEC Standard 61245 describes the DC pollution test for glass/porcelain insulators. The standard is formally applicable for voltages up to ±600 DC and at present IEC is considering a revision of this standard to include higher voltages (UHV). Two standard pollution methods, i.e. Salt Fog and Solid Layer are recommended in the present standard.
The Solid Layer method is more often used for HVDC as representative of Type A pollution and could be performed on full scale insulators in the UHV range.
The Salt Fog test, representative of type B can only be applied to insulators applicable up to ±600 kV. Results can be extrapolated on the basis of linearity to higher system voltages.
These standard test methods have also been applied with adjusted test parameters aiming to simulate as close as possible actual service conditions in terms of non-soluble deposits, type of salt and non-uniformity of the pollution layer [56][69].
A number of non-standard test methods available for pollution testing have been described in [1].
COMPOSITE (HTM) INSULATORS
At present there are no standardised laboratory tests available for the testing of composite insulators. However, several organisations have utilised modified test methods, based on the available standardised for Non-HTM insulators, to investigate the behaviour of HTM insulators under polluted conditions [61][70][37]. The applicability and relevance of such test methods are still under discussion as the outage performance on correctly selected HTM insulators has generally been good [71].
Within CIGRE working group C4.303, work is underway to define a common test method that can be used for the comparison of test results between different laboratories [72]. The publication of the findings is expected in 2013.
RELATIONSHIP BETWEEN LABORATORY TESTS AND NATURAL CONDITIONS
The recommendations given in this guideline rely heavily on the outcome of artificial pollution tests performed in laboratories around the world. With such laboratory testing it is relatively easy to investigate the impact that various parameters have on the pollution flashover strength of the insulators. In order to ensure that the conclusions drawn from the laboratory tests are valid, it is necessary to verify that these tests give a true reflection of the flashover strength in service. Such a comparison has been done in Japan where the results on non-HTM insulators from natural testing stations have been compared with the withstand characteristics obtained in the laboratory [1]. These results are presented in Figure 18.
The following observations can be made from the data presented in Figure 18:
The standard deviation of the pollution flashover strength of insulators under natural polluted conditions is higher than that of laboratory tests. The relatively small standard deviation obtained from the laboratory tests results indicates that these tests give repeatable results, which is an important pre-requisite for such testing.
It can also be seen, (see ∆ in Figure 18), that contrary to the AC case the withstand voltage obtained through DC laboratory tests is significantly lower than that obtained from natural pollution testing [1]. This means that insulator dimensioning based purely on laboratory results will tend to result in conservative designs. It is believed that this difference is due to the factors described in foregoing sections of this chapter, i.e. non-uniformity of the pollution on the insulators, NSDD and type of pollution.
It can therefore be concluded that one should be careful in applying laboratory test results directly, without any corrections for the design of insulation for DC installations. This may result in conservative and, possibly, costly designs. More optimised designs are possible when the laboratory test parameters and results are adjusted for the effects discussed in the foregoing sections of this chapter.
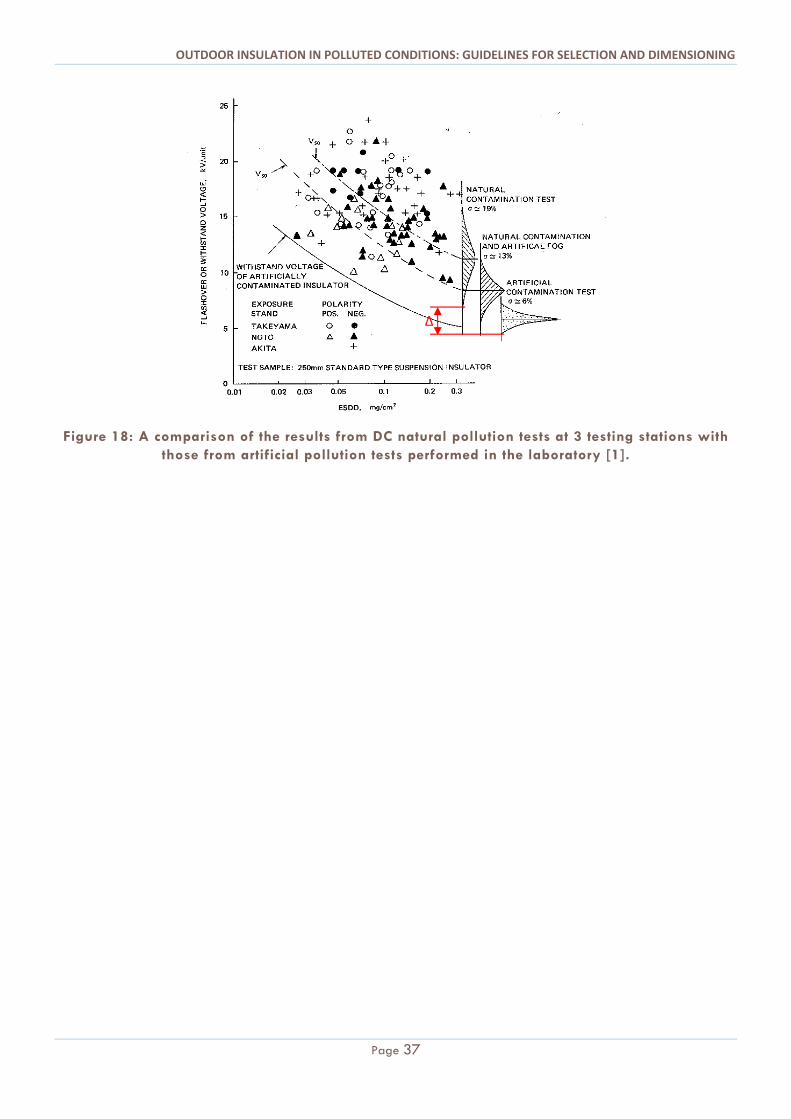
OUTDOOR INSULATION IN POLLUTED CONDITIONS: GUIDELINES FOR SELECTION AND DIMENSIONING
Page 37
Figure 18: A comparison of the results from DC natural pollution tests at 3 testing stations with those from artificial pollution tests performed in the laboratory [1].
Δ
OUTDOOR INSULATION IN POLLUTED CONDITIONS: GUIDELINES FOR SELECTION AND DIMENSIONING
Page 38
Chapter 6: A simplified method to determine the required USCD
Introduction
As an illustration of how the various principles introduced in this guideline document can be applied, a simplified approach has been established by the working group on the basis of a review of published information presented in Annex A. The simplified design method provides a useful orientation at the start of a project in that it identifies a range of preliminary solutions. It can also be an effective tool to analyse the outage performance, and the adequacy of the insulation solutions of existing systems. It is, however, important to note that the simplified method has serious limitations which may result in either over- or under-dimensioned insulation. Aspects that may affect the accuracy of the design are:
For DC the pollution performance is the dominating factor determining the size (i.e. axial length of the insulators). Thus any uncertainty in the estimation of the pollution severity may directly impact the required insulator length. This is fundamentally different to AC where insulator lengths are rarely impacted by the required pollution performance.
Higher pollution levels call for a greater increase in the leakage distance on DC insulators than for AC (see Figure 1). Any error in the severity estimate has therefore a larger impact on the DC insulation dimensions than for AC.
A further complication in the DC design process is the effect of the electrostatic attraction which can result in significantly higher levels of pollution accumulation on the DC energised insulators when compared with AC energised or non-energised insulators (see Figure 25). This ratio may range between 1 and 10 and therefore introduces a large uncertainty in the estimation of the pollution severity when general environmental or AC-specific site severity methods are used.
Other uncertainties in the input data which may affect the outcome of the design process are the non-uniformity of the pollution accumulation on the insulators (e.g. top to bottom ratio, radial differences and distribution along the insulator) as well as the type and composition of the pollution present.
Basic assumptions on which this simplified method is based:
Design is done on the median flashover characteristics of insulators as determined from laboratory tests. This may result either in an over- or underestimate of the required USCD depending on the relative efficiency of the insulator creepage distance (see Annex B on profile influence).
The assumed characteristic of HTM insulators is on the basis of a partially suppressed hydrophobic state.
The simplified method is divided into two parts. The first part deals with determining the pollution severity of the site which is the equivalent value of the ESDD at a reference value of the NSDD of 0.1 mg/cm2. The second step is to adjust this value individually for each type of insulator considered so that the required USCD can be determined. The two parts of the process are shown in Figure 19 and Figure 20, respectively.
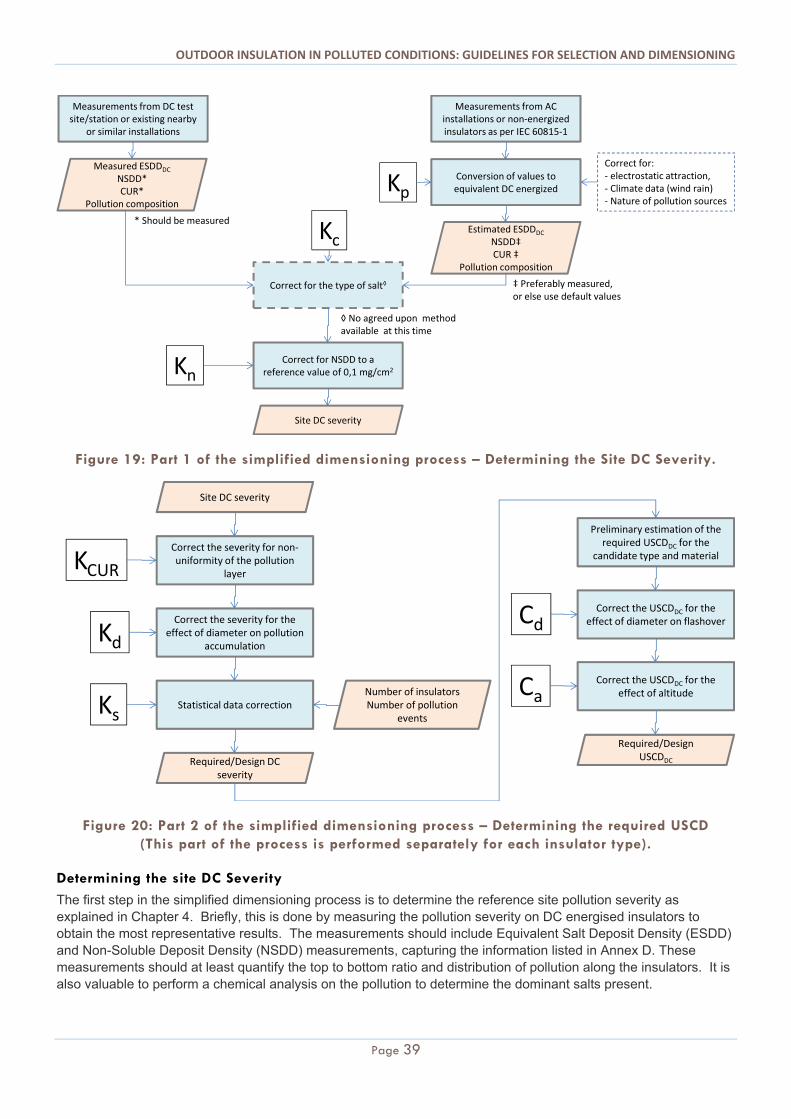
OUTDOOR INSULATION IN POLLUTED CONDITIONS: GUIDELINES FOR SELECTION AND DIMENSIONING
Page 39
Figure 19: Part 1 of the simplified dimensioning process – Determining the Site DC Severity.
Figure 20: Part 2 of the simplified dimensioning process – Determining the required USCD (This part of the process is performed separately for each insulator type).
Determining the site DC Severity
The first step in the simplified dimensioning process is to determine the reference site pollution severity as explained in Chapter 4. Briefly, this is done by measuring the pollution severity on DC energised insulators to obtain the most representative results. The measurements should include Equivalent Salt Deposit Density (ESDD) and Non-Soluble Deposit Density (NSDD) measurements, capturing the information listed in Annex D. These measurements should at least quantify the top to bottom ratio and distribution of pollution along the insulators. It is also valuable to perform a chemical analysis on the pollution to determine the dominant salts present.
Measurements from DC test site/station or existing nearby
or similar installations
Measurements from AC installations or non‐energized insulators as per IEC 60815‐1
Conversion of values to equivalent DC energized
Correct for: ‐ electrostatic attraction, ‐ Climate data (wind rain) ‐ Nature of pollution sources
Measured ESDDDC
NSDD*CUR*
Pollution composition
Estimated ESDDDC
NSDD‡CUR ‡
Pollution composition
* Should be measured
‡ Preferably measured, or else use default values
Correct for the type of salt◊
Kp
Kc
◊ No agreed upon method available at this time
Correct for NSDD to a reference value of 0,1 mg/cm2Kn
Site DC severity
Correct the severity for non‐uniformity of the pollution
layerKCUR
Site DC severity
Correct the severity for the effect of diameter on pollution
accumulationKd
Statistical data correctionKsNumber of insulatorsNumber of pollution
events
Required/Design DC severity
Preliminary estimation of the required USCDDC for the
candidate type and material
Correct the USCDDC for the effect of diameter on flashoverCd
Correct the USCDDC for the effect of altitudeCa
Required/Design USCDDC
OUTDOOR INSULATION IN POLLUTED CONDITIONS: GUIDELINES FOR SELECTION AND DIMENSIONING
Page 40
As an alternative, it is also possible, but with an increased uncertainty, to base the site severity assessment on measurements on AC energised or non-energised insulators. In such a case it is necessary to estimate the contribution of the electrostatic field on the accumulation on DC energised insulators. This is done with the DC/AC accumulation factor Kp (applicable to both ESDD and NSDD values). This factor is selected by considering the generation and transportation of pollutants to the DC insulators as explained in Annex A. General guidance on the selection of Kp is as follows:
Kp is typically 1.1, with a range of 1 to 1.2 in areas where maximum site severities conditions are reached in a short time following specific events. Typical cases are those where the wind speed is the dominant factor that determines the amount of pollution carried in the air or in areas where high wind speeds prevail (i.e. wind speed higher than 6 m/s). A typical example of such an area is a site close to the sea with Type B pollution.
Kp is typically 1.6, with a range of 1.3 to 1.9 in areas where the maximum site severity conditions are reached in times of the order of a month. These areas may be characterised by pollution either of type A or B (e.g. at some distance from the coast or from pollution sources associated with human activity) with moderate wind conditions (i.e. wind speeds of between 3 to 6 m/s).
Kp is typically 2.5 with a range of 2 to 3 in areas with a pollution process increasing slowly in time (e. g. showing an increasing trend in a 1-2 year period), e.g. areas with Type A pollution, characterised by human activity such as mining, industry, roads etc., and generally mild wind speeds (i.e. 1.5-3 m/s).
It should be noted that Kp can be higher than the values given above when the site location is characterised by extended dry periods and can be lower when there are frequent natural cleaning events such as rain.
Once the site severity measurements are available, the maximum value of the average ESDDs measured on the insulators is converted to an equivalent laboratory test severity. With this correction it is recognised that artificial testing differs from natural pollution in a number of important aspects, namely:
Type of Salt: Laboratory testing is mostly performed with marine salt (NaCl) whereas natural pollution layers may often contain less soluble salts such as gypsum (CaSO4). At present, however, there is no generally applicable method to quantify this effect other than performing specific flashover testing on insulators with natural pollution so assume Kc = 1.
Amount of non-soluble material present in the pollution layer: The standardised laboratory test usually subjects the insulator to a pollution layer with an NSDD=0.1 mg/cm2. In service the NSDD levels may typically vary from 0.01 – 10 mg/cm2. From Annex A the correction for NSDD for values greater than 0.02 mg/cm2 is:
106.0
1.0
NSDDKn
These corrections result in an estimate of the equivalent site severity at a NSDD=0.1 mg/cm2. For Non HTM insulators is α = 0.33 and for HTM insulators α = 0.25 (see Figure 12).
Determining the Required USCD
The second part of the process is to adjust this basic site severity characteristic for each of the candidate insulators considered. The following corrections are applied:
The non-uniformity of the pollution layer (applies to disc type insulators only): In Annex A the effect of the top to bottom ratio on the flashover voltage of the insulator is presented. The equivalent ESDD for a uniformly polluted insulator can be derived from field measurements and the Contamination Uniformity Ratio (CUR) as follows:
1
10 /14.01/159.01
59.1
CURLOGCUR
KCUR
For Non HTM insulators α = 0.33 and the non-uniformity of the pollution deposit along the string is taken into account by utilising the average value of the ESDD/NSDD measurements taken along the string. No information is at present available on a correction factor KCUR for disc type insulators with a HTM coating.
OUTDOOR INSULATION IN POLLUTED CONDITIONS: GUIDELINES FOR SELECTION AND DIMENSIONING
Page 41
Insulator diameter: Larger diameter insulators collect less pollution than small diameter insulators. The amount of pollution on insulators with a large diameter (i.e. an average diameter, D larger than 250 mm) can be estimated from measurements on disc insulators as follows:
32.0
250
DKd
Statistical considerations: This correction factor is chosen to obtain a sufficiently low risk for flashover. This takes account of the number of insulators simultaneously exposed to the same pollution event, the frequency of pollution events etc. into account. For many insulators exposed to the same contamination (e.g. line insulators e.g. N > 100): Ks=1.4. Only a few insulators exposed to the same conditions (e.g. station apparatus): Ks=1
The correction factors mentioned above are used as follows to determine the required design DC severity (SDDDC
severity):
MeasuredSdCURncPseverityDC ESDDKKKKKKSDD
The design DC severity corresponds to the pollution severity at which representative laboratory tests can be performed. At this stage it is also possible to make a first approximate estimate of the leakage distance (USCD) that will be required for the project. The following equations, derived from laboratory results, can be used:
For all non-HTM insulators: 33.0110 severityDCBasicDC SDDUSCD
For all HTM insulators: 25.065 severityDCBasicDC SDDUSCD
These equations are valid for line insulators and substation insulators with a relatively small diameter. Insulators with a large diameter have generally a lower flashover voltage than insulators with a smaller diameter, thus requiring longer leakage distances. The following correction factors can be used to correct for the effect of the insulator average diameter D [mm], for insulators with diameters larger than 250 mm:
For all non-HTM insulators: 30.0
250
DCd
For all HTM insulators: 17.0
250
DCd
For installations at high altitude an additional correction factor should be considered to adjust the leakage distance for the lower flashover voltage under low air density conditions. The following equation can be used for DC polluted insulators (non-HTM and HTM):
815035.0
H
a eC
The parameter H is still being considered by CIGRE and IEC. Two approaches are being considered at present [73]:
In accordance with IEC 60071-2 H is the height above sea level in metre. Standard industry practise has been to only consider altitudes exceeding 1000 m so that the term H
becomes the height above sea level minus 1000 m.
OUTDOOR INSULATION IN POLLUTED CONDITIONS: GUIDELINES FOR SELECTION AND DIMENSIONING
Page 42
Finally the required unified specific creepage distance is determined as:
BasicDCadDC USCDCCUSCD
In areas where the pollution and wetting occur simultaneously, the pollution severity is determined by monitoring the leakage current activity on the insulators and comparing peak values with those obtained from Salt-Fog tests. The severity of the site is expressed as the laboratory severity (in terms of the salinity of the salt water used [kg/m3]) which would result in the same level of leakage current which is observed at the site. This is referred to as the Site Equivalent Salinity (SES).
Since there is already a direct link between the site severity assessment and the laboratory test (i.e. Salt-Fog) the simplified design process becomes even simpler as there is no need to correct for the type of salts, NSDD and uniformity of the pollution deposit. At present it is proposed that corrections be made for:
Diameter effect: Where the same equation used for pre-deposited pollution applies. Statistical considerations: Again the same correction used for pre-deposited pollution applies.
The equivalent salinity (ES) is thus calculated as follows:
SESKKES SD
The basic required unified specific creepage distance can be estimated as follows:
For all non-HTM insulators: 33.015 ESUSCD BasicDC
For all HTM insulators: 25.015 ESUSCD BasicDC
As for pre-deposited pollution it is also necessary to adjust the basic required specific creepage distance for the effect of diameter and altitude. The same equations can be used thus:
BasicDCaDDC USCDCCUSCD
Other considerations
In the foregoing section an overview is given on how to determine the insulator dimensions based on the flashover performance of the insulators. This does not take account of any long-term ageing effects which may be present. These aspects are briefly discussed in Chapter 3 and at present there is not enough documented service experience available to give general guidance. There can be large variations in the composition of insulator housing materials on offer from the different manufacturers and these materials may have very different abilities to withstand the service stresses placed on them by the DC energisation. It is therefore advisable to collect as much relevant service experience as possible on the particular insulator make that is a candidate for installation on the HVDC system. In addition, it is also necessary to consider E-field grading along the insulator to avoid the ageing effects observed on AC insulators in clean areas. Indications are that similar ageing mechanisms may be at work on DC energised insulators.
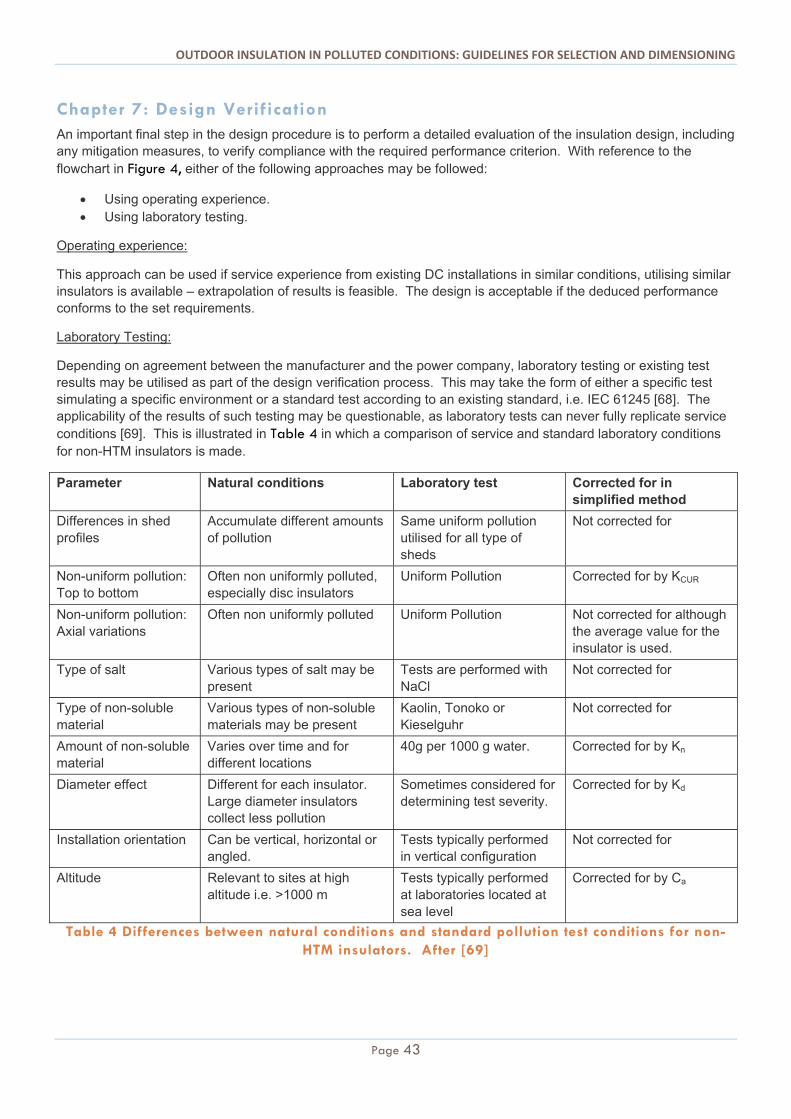
OUTDOOR INSULATION IN POLLUTED CONDITIONS: GUIDELINES FOR SELECTION AND DIMENSIONING
Page 43
Chapter 7: Design Verification An important final step in the design procedure is to perform a detailed evaluation of the insulation design, including any mitigation measures, to verify compliance with the required performance criterion. With reference to the flowchart in Figure 4, either of the following approaches may be followed:
Using operating experience. Using laboratory testing.
Operating experience:
This approach can be used if service experience from existing DC installations in similar conditions, utilising similar insulators is available – extrapolation of results is feasible. The design is acceptable if the deduced performance conforms to the set requirements.
Laboratory Testing:
Depending on agreement between the manufacturer and the power company, laboratory testing or existing test results may be utilised as part of the design verification process. This may take the form of either a specific test simulating a specific environment or a standard test according to an existing standard, i.e. IEC 61245 [68]. The applicability of the results of such testing may be questionable, as laboratory tests can never fully replicate service conditions [69]. This is illustrated in Table 4 in which a comparison of service and standard laboratory conditions for non-HTM insulators is made.
Parameter Natural conditions Laboratory test Corrected for in simplified method
Differences in shed profiles
Accumulate different amounts of pollution
Same uniform pollution utilised for all type of sheds
Not corrected for
Non-uniform pollution: Top to bottom
Often non uniformly polluted, especially disc insulators
Uniform Pollution Corrected for by KCUR
Non-uniform pollution: Axial variations
Often non uniformly polluted Uniform Pollution Not corrected for although the average value for the insulator is used.
Type of salt Various types of salt may be present
Tests are performed with NaCl
Not corrected for
Type of non-soluble material
Various types of non-soluble materials may be present
Kaolin, Tonoko or Kieselguhr
Not corrected for
Amount of non-soluble material
Varies over time and for different locations
40g per 1000 g water. Corrected for by Kn
Diameter effect Different for each insulator. Large diameter insulators collect less pollution
Sometimes considered for determining test severity.
Corrected for by Kd
Installation orientation Can be vertical, horizontal or angled.
Tests typically performed in vertical configuration
Not corrected for
Altitude Relevant to sites at high altitude i.e. >1000 m
Tests typically performed at laboratories located at sea level
Corrected for by Ca
Table 4 Differences between natural conditions and standard pollution test conditions for non-HTM insulators. After [69]
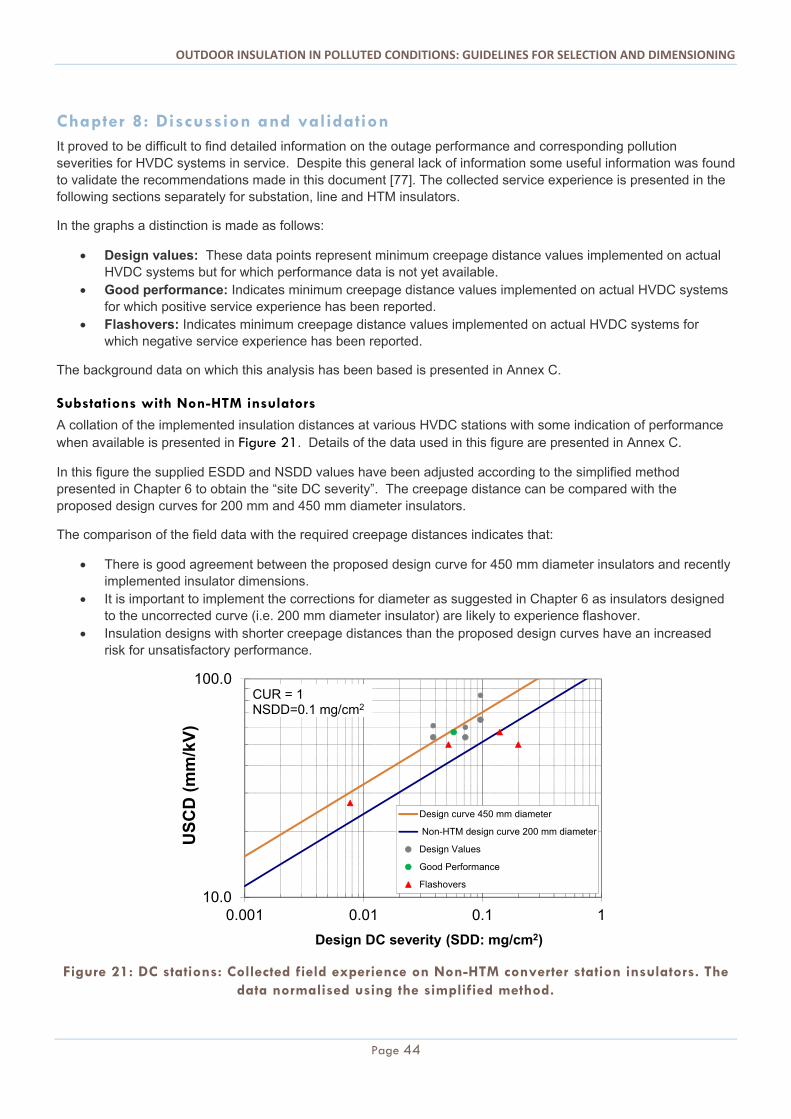
OUTDOOR INSULATION IN POLLUTED CONDITIONS: GUIDELINES FOR SELECTION AND DIMENSIONING
Page 44
Chapter 8: Discussion and validation It proved to be difficult to find detailed information on the outage performance and corresponding pollution severities for HVDC systems in service. Despite this general lack of information some useful information was found to validate the recommendations made in this document [77]. The collected service experience is presented in the following sections separately for substation, line and HTM insulators.
In the graphs a distinction is made as follows:
Design values: These data points represent minimum creepage distance values implemented on actual HVDC systems but for which performance data is not yet available.
Good performance: Indicates minimum creepage distance values implemented on actual HVDC systems for which positive service experience has been reported.
Flashovers: Indicates minimum creepage distance values implemented on actual HVDC systems for which negative service experience has been reported.
The background data on which this analysis has been based is presented in Annex C.
Substations with Non-HTM insulators
A collation of the implemented insulation distances at various HVDC stations with some indication of performance when available is presented in Figure 21. Details of the data used in this figure are presented in Annex C.
In this figure the supplied ESDD and NSDD values have been adjusted according to the simplified method presented in Chapter 6 to obtain the “site DC severity”. The creepage distance can be compared with the proposed design curves for 200 mm and 450 mm diameter insulators.
The comparison of the field data with the required creepage distances indicates that:
There is good agreement between the proposed design curve for 450 mm diameter insulators and recently implemented insulator dimensions.
It is important to implement the corrections for diameter as suggested in Chapter 6 as insulators designed to the uncorrected curve (i.e. 200 mm diameter insulator) are likely to experience flashover.
Insulation designs with shorter creepage distances than the proposed design curves have an increased risk for unsatisfactory performance.
Figure 21: DC stations: Collected field experience on Non-HTM converter station insulators. The data normalised using the simplified method.
10.0
100.0
0.001 0.01 0.1 1
US
CD
(m
m/k
V)
Design DC severity (SDD: mg/cm2)
Design curve 450 mm diameter
Non-HTM design curve 200 mm diameter
Design Values
Good Performance
Flashovers
CUR = 1NSDD=0.1 mg/cm2
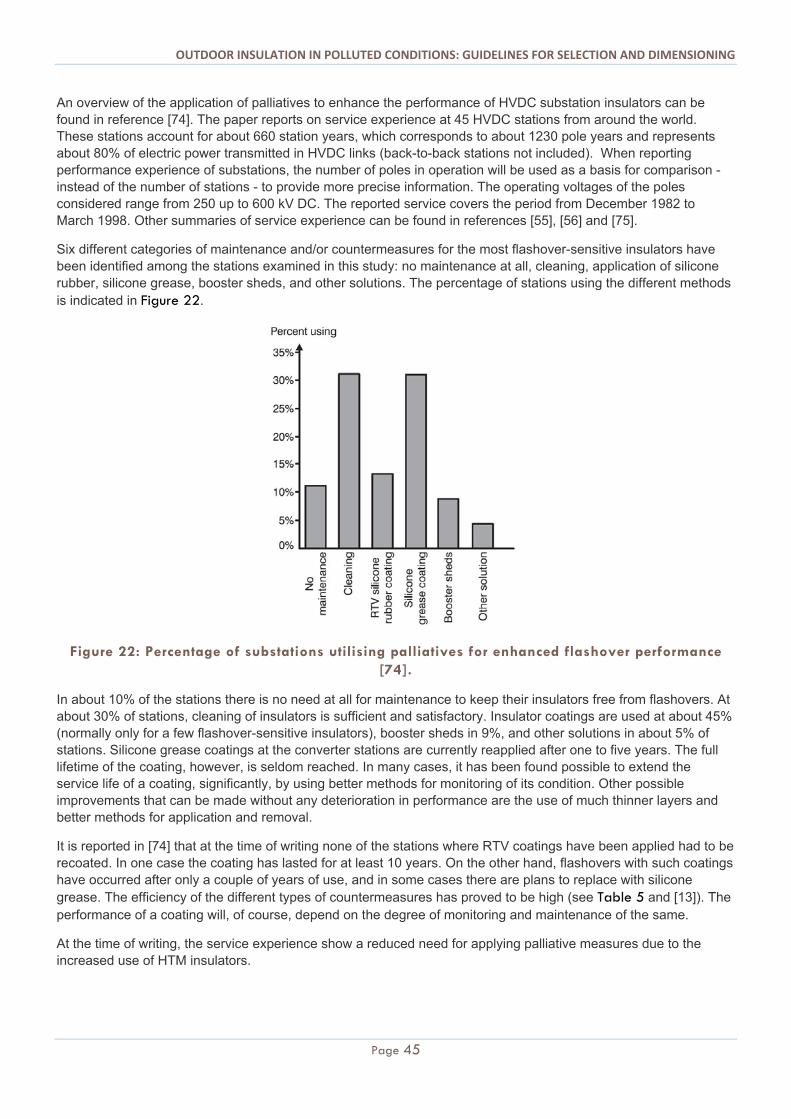
OUTDOOR INSULATION IN POLLUTED CONDITIONS: GUIDELINES FOR SELECTION AND DIMENSIONING
Page 45
An overview of the application of palliatives to enhance the performance of HVDC substation insulators can be found in reference [74]. The paper reports on service experience at 45 HVDC stations from around the world. These stations account for about 660 station years, which corresponds to about 1230 pole years and represents about 80% of electric power transmitted in HVDC links (back-to-back stations not included). When reporting performance experience of substations, the number of poles in operation will be used as a basis for comparison - instead of the number of stations - to provide more precise information. The operating voltages of the poles considered range from 250 up to 600 kV DC. The reported service covers the period from December 1982 to March 1998. Other summaries of service experience can be found in references [55], [56] and [75].
Six different categories of maintenance and/or countermeasures for the most flashover-sensitive insulators have been identified among the stations examined in this study: no maintenance at all, cleaning, application of silicone rubber, silicone grease, booster sheds, and other solutions. The percentage of stations using the different methods is indicated in Figure 22.
Figure 22: Percentage of substations utilising palliatives for enhanced flashover performance [74].
In about 10% of the stations there is no need at all for maintenance to keep their insulators free from flashovers. At about 30% of stations, cleaning of insulators is sufficient and satisfactory. Insulator coatings are used at about 45% (normally only for a few flashover-sensitive insulators), booster sheds in 9%, and other solutions in about 5% of stations. Silicone grease coatings at the converter stations are currently reapplied after one to five years. The full lifetime of the coating, however, is seldom reached. In many cases, it has been found possible to extend the service life of a coating, significantly, by using better methods for monitoring of its condition. Other possible improvements that can be made without any deterioration in performance are the use of much thinner layers and better methods for application and removal.
It is reported in [74] that at the time of writing none of the stations where RTV coatings have been applied had to be recoated. In one case the coating has lasted for at least 10 years. On the other hand, flashovers with such coatings have occurred after only a couple of years of use, and in some cases there are plans to replace with silicone grease. The efficiency of the different types of countermeasures has proved to be high (see Table 5 and [13]). The performance of a coating will, of course, depend on the degree of monitoring and maintenance of the same.
At the time of writing, the service experience show a reduced need for applying palliative measures due to the increased use of HTM insulators.

OUTDOOR INSULATION IN POLLUTED CONDITIONS: GUIDELINES FOR SELECTION AND DIMENSIONING
Page 46
Palliative No. of stations with palliative
No. of stations where flashovers occurred despite palliative
Booster Sheds 4 0
RTV coating 6 3
Silicone grease 14 1
Table 5: The efficiency of different countermeasures against flashover [74]
Overhead lines with Non-HTM insulators
A similar collation of service experience has been performed for DC overhead lines. The results are presented in Figure 23. Details of the data used in this figure are presented in Annex C.
Figure 23: DC overhead lines: Collected field experience on Non-HTM Insulators.
The comparison of the field data with the required creepage distances indicates that:
Designs with creepage distances lower than the design curve are likely to have unsatisfactory performance Designs with creepage distances in accordance with the proposed design curve result in good performance Recent designs are in accordance with the proposed design curve.
HTM insulators
The service experience with composite insulators at HVDC stations and test stations located in very severe environments indicates that good ageing and flashover performance can be expected provided proper attention is given to the selection of the material and to the profile and creepage length. This indicates that there is scope to apply composite insulators with reduced specific creepage distances in comparison with non-HTM insulators in the same environment. The application of composite insulators is especially attractive in HVDC systems due to the many advantages of polymer housings, and mainly because of its proven superior pollution flashover performance, which essential for the realisation of UHV solutions.
A body of documented service experience is also available with DC polymer line insulators. There are some installations where composite insulators have now been installed for more than two decades. In most cases good experience is reported. In particular, the data suggests that lower creepage distances than non-HTM insulators may be used – even after many years in service. A collation of service experience has been performed for HTM
10
100
0.001 0.01 0.1 1
US
CD
(m
m/k
V)
Design DC severity (SDD: mg/cm2)
Non-HTM
Design Values
Good Performance
Flashovers
CUR = 1NSDD=0.1 mg/cm2
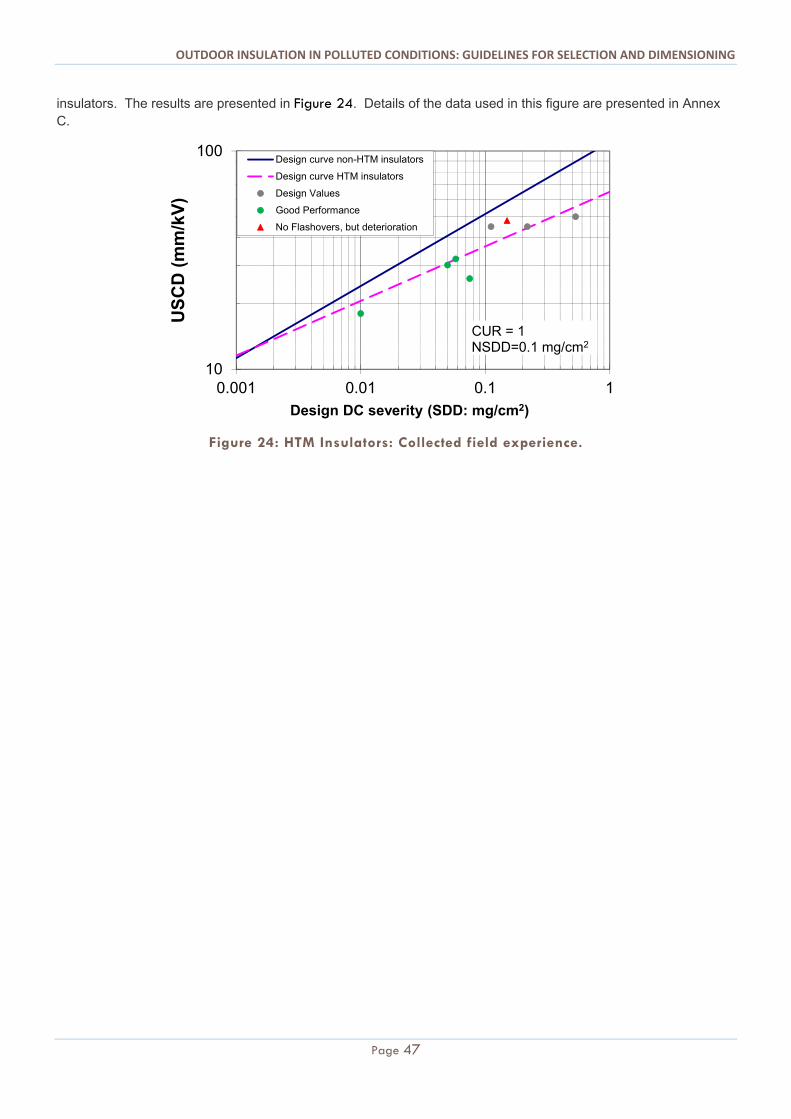
OUTDOOR INSULATION IN POLLUTED CONDITIONS: GUIDELINES FOR SELECTION AND DIMENSIONING
Page 47
insulators. The results are presented in Figure 24. Details of the data used in this figure are presented in Annex C.
Figure 24: HTM Insulators: Collected field experience.
10
100
0.001 0.01 0.1 1
US
CD
(m
m/k
V)
Design DC severity (SDD: mg/cm2)
Design curve non-HTM insulators
Design curve HTM insulators
Design Values
Good Performance
No Flashovers, but deterioration
CUR = 1NSDD=0.1 mg/cm2
OUTDOOR INSULATION IN POLLUTED CONDITIONS: GUIDELINES FOR SELECTION AND DIMENSIONING
Page 48
References [1] CIGRE TF 33.04.01, "Polluted Insulators: A review of current knowledge", Technical Brochure, No.
158, June 2000. [2] CIGRE WG C4.303 “Outdoor insulation in polluted conditions: Guidelines for selection and
dimensioning: Part 1: General principles and the AC case.” CIGRE Working Group C4-303. Brochure 361. 2008.
[3] Pigini A. Britten A.C. Engelbrecht C.; : Development of guidelines for the selection of insulators with respect to pollution for EHV- UHV DC: state of the art and research needs, CIGRE Paris Session 2008, paper C4-101.
[4] Hileman A. R., Insulation coordination for power systems, Power Engineering Series No.9, 1999, ISBN 0-8247-9957-7.
[5] Weimers, L.: Bulk power transmission at extra high voltages, a comparison between transmission lines for HVDC at voltages above 600 kV DC and 800 kV AC, CEPSI 2004, Shanghai, China, October 17 -22, 2004
[6] Cortina R., Marrone G., Pigini A., Thione L., Petrusch W., Verma M.P.-“Study of HVDC systems and application to design and testing” Cigré Paris Session 1984 Paper 33.12.
[7] Pigini A. and al. “Performance of insulators for EHVDC systems under polluted conditions” Cigré Paris Session 1988, Paper 33.22.
[8] Kawamura, T., Seta, T., Nagai K., Naito, K., “DC Pollution Performance of Insulators” Cigré Paris Session 1984 Paper 33.10.
[9] Baker, A.C. Zaffanella, L.E. Anzivino, L.D. Schneider, H.M. Moran, J.H. “A comparison of HVAC and HVDC contamination performance of station post insulators” IEEE Transactions on Power Delivery, Volume: 4, Issue: 2, Apr 1989, pp 1486 - 1491
[10] Kimoto, I.; Fujimura, T.; Naito, K.; “Performance of Insulators for Direct Current Transmission Line Under Polluted Condition” IEEE Transactions on Power Apparatus and Systems, Volume: PAS-92, Issue: 3, 1973, Page(s): 943 – 949.
[11] Engelbrecht, C.S.; Hartings, R.; Lundquist, J.; Statistical dimensioning of insulators with respect to polluted conditions Generation, IEE Proceedings Transmission and Distribution, Volume: 151 Issue 3, May 2004, On page(s): 321 - 326
[12] Long Y., Xiao Y., Su Z., Wu D., Astrom U.: “The Reliability Study of the Statistical Method on Insulator Dimensioning of (U)HVDC Lines with Regard to Pollution Conditions”, 6th Int. Conf. on Power T&D Technology, Nov. 10-12, 2007, Guangzhou, China
[13] McDermid, W.; Black, T Experience with Preventing External Flashovers in HVDC Converter Stations Conference Record of the 2008 IEEE International Symposium on Electrical Insulation, ISEI 2008, Vancouver, BC, 9-12 June 2008 pages(s): 81 - 84
[14] CIGRE Task Force 33.04.04 “Artificial pollution testing of HVDC insulators analysis of factors influencing performance”, ELECTRA, No 140, February 1992, pp 99-113.
[15] CIGRE Working Group A3.21 “Aspects for the Application of Composite Insulators to High Voltage (≥72kV) Apparatus” Technical Brochure, No. 455, April 2011.
[16] Wu D., Åström U., Flisberg G., Liu Z., Gao L., Ma W, Su Z., External Insulation Design of Converter Stations for Xiangjiaba-Shanghai ±800 kV UHVDC Project, 2010 International Conference on Power System Technology, 24-28 Oct. 2010, Hangzhou, China.
[17] CIGRE Task Force 33.04.02 “Failure of cap and pin insulators subjected to HVDC”, Electra No. 153, April 1994, pp. 23-31.
[18] Mason J.M., Gleizer M., Sens M.A., Tan A.L. “DC tracking and erosion on glass and porcelain” 5th International Symposium on High Voltage Engineering, Braunschweig, 24-28 August 1987, Paper 52.02.
OUTDOOR INSULATION IN POLLUTED CONDITIONS: GUIDELINES FOR SELECTION AND DIMENSIONING
Page 49
[19] Wu D., Åström U., Almgren B., Söderholm S., Investigation into alternative solutions for HVDC station post insulators, Paper presented at the POWERCON '98, International Conference on Power Systems Technology Beijing, China in August 18-21, 1998
[20] CIGRE Working Group 22.03 “Service experience of composite insulators used on HVDC lines”, Electra No. 161, August 1995, pp. 53-57.
[21] Seifert J.M., Stefanini D., Janssen H., “HTV Silicone composite insulators for HVDC applications – Long term experiences with material and design for 500 kV and above”, Proceedings of the 16th International Symposium on High Voltage Engineering, Cape Town, 2009, Paper C-12.
[22] Liang X., Wang S., Su Z., “Experience with composite HVDC and HVAC insulators in China: From design to operation”, Proceedings of the 2003 World Congress on Insulators, Arresters and Bushings, pp 15-22.
[23] Gutman I., Halsan K., Seifert J., Vosloo W.: “Pollution and ageing performance of DC line composite insulators: service experience vs. laboratory experience”, World Congress & Exhibition on Insulators, Arresters & Bushings, Seoul, Korea, 17-20 April 2011
[24] Kumara S., Serdyuk Y. V., Gubanski S. M. Surface Charge Decay on Polymeric Materials under Different Neutralization Modes in Air IEEE Transactions on Dielectrics and Electrical Insulation Vol. 18, No. 5; October 2011 1
[25] International Electrotechnical Commission: “Insulation co-ordination - Part 2: Application guide”, IEC 60071-2 ed3.0 1996-12-19
[26] Kondo K., Nakachi T., Fujii O., Hayakawa T., Suzuki Y. “Accelerated Ageing Characteristics of Polymer Insulators under DC Voltage Application”, 16th International Conference on Electrical Engineering, July 11-14, 2010 Busan Korea.
[27] Gutman I. Hartings R., “Single stress and multistress AC/DC tracking and erosion tests for composite insulators”, Proceedings of the Nordic Insulation Symposium (NORD IS), Copenhagen, June 14-16, 1999, pp 271-278.
[28] Moreno, V.M.; Gorur, R.S.; “AC and DC performance of polymeric housing materials for HV outdoor insulators”, IEEE Transactions on Dielectrics and Electrical Insulation, Volume: 6 , Issue: 3, 1999 , Page(s): 342 – 350.
[29] Phillips A. J., Childs D. J., Schneider H. M. “Ageing of Non-Ceramic Insulators due to Corona from Water Drops.” IEEE Transactions on Power Delivery. Vol. 14. pp. 1081-1086.
[30] Phillips, A. J., Childs D. J., Schneider H. M. “Water-Drop Corona Effects on Full-Scale 500 kV Non-Ceramic Insulators.” IEEE Transactions on Power Delivery. Vol. 14. pp. 258-263.
[31] Umeda I., Tanaka K., Kondo T., Kondo K., Suzuki Y., “Acid Aging of Silicone Rubber Housing for Polymer Insulators”, 2008 International Symposium on Electrical Insulating Materials (ISEIM) on 7th-11th Sept., 2008.
[32] IEEE Taskforce on Electric Fields and Composite Insulators, “Electric Fields on AC Composite Transmission Line Insulators”, IEEE Transactions On Power Delivery, Vol. 23, No. 2, April 2008.
[33] Ijumba, N.M., Britten A.C., Swartz J., “Effect of water droplet corona on silicone rubber insulators under HVDC potential”, 13th International Symposium on High Voltage Engineering, The Netherlands, 2003.
[34] Zhou J. G. Dong, G., Imakoma T., Kondo K., “Contamination performance of outer-rib type suspension insulators”, IEEE/PES T&D 2002: Asia Pacific, Yokohama, Paper No. PO18-10, 2002.
[35] Kondo, K. “Pollution accumulation performance of 3-outer-rib type insulators for DC application”, CIGRE Paris Session 2006, Discussion document B4- Subject 1, Questions 1.4 and 6.
[36] Xingliang Jiang; Jihe Yuan; Lichun Shu; Zhijin Zhang; Jianlin Hu; Feng Mao: Comparison of DC Pollution Flashover Performances of Various Types of Porcelain, Glass, and Composite Insulators IEEE Transactions on Power Delivery, Issue Date: April 2008 Volume: 23 Issue:2 On page(s): 1183 – 1190
[37] Ma W.M., Luo B., Su Z.Y., Dang Z.P., Guan Z.C., Liang X.D., Åström U., Wu D., Long E. Y., Sun H.G. Preliminary Recommendations on the Suitable Shed Profile for HVDC Station Insulators with Silicone
OUTDOOR INSULATION IN POLLUTED CONDITIONS: GUIDELINES FOR SELECTION AND DIMENSIONING
Page 50
Rubber Housing, International Conference on Power System Technology, 2006. PowerCon 2006. Chongqing, 22-26 Oct. 2006.
[38] International Electrotechnical Commission: Selection and dimensioning of high-voltage insulators intended for use in polluted conditions – Part 1: Definitions, information and general principles, IEC Technical Specification IEC/TS 60815-1, Edition 1.0, 2008-10-29.
[39] Wu D., Su Z., “The correction factor between DC and AC pollution levels: review and proposal”, Proceedings of the 10th ISH Vol. 3, August 25-29, 1997, Montreal, Canada, pp 253-256.
[40] Su Z. Y., Liang X.D., Yin Y., Zhou J., Li W.F., Li P., ”Outdoor insulation selection method of HVDC lines”, Proceedings of the 14th International Symposium on High Voltage Engineering, Tsinghua University, Beijing China, August 25-29 2005, Paper D-18.
[41] Su Z. Y, Fan J., Li Q., Liu Y., Zhou J., “Natural Contamination Performances on Insulators under DC Stress and the Pollution Deposit Density Ratio of DC to AC”, 15th International Symposium on High Voltage Engineering (ISH), Ljubljana, Slovenia, August 27-31, 2007, Paper T4-324.
[42] Pigini A., Bertolotto P. “Design of External Insulation for UHV DC in Contaminated Environment”, 15th International Symposium on High Voltage Engineering (ISH), Ljubljana, Slovenia, August 27-31, 2007, Paper T4-347.
[43] Su Z. Y., Liang X.D., Yin Y., Zhou J., Li W.F., Li P., ”Important correction factors in HVDC line insulation selection”, Proceedings of the 14th International Symposium on High Voltage Engineering, Tsinghua University, Beijing China, August 25-29 2005,
[44] Lampe, W.; Hoglund, T.K.E.; Nellis, C.L.; Renner, P.E.; Stearns, R.D.; “Long-term tests of HVDC insulators under natural pollution conditions at the Big Eddy Test Center”, IEEE Transactions on Power Delivery, Volume 4, Issue 1, Jan 1989 Page(s): 248 – 259
[45] Besztercey, G.; Karady, G.G.; Ruff, D.L.; Surface characterization of naturally contaminated HVDC insulators International Conference on Electric Power Engineering, 1999. PowerTech Budapest 99.
[46] EPRI, Contamination flashover of HVDC Insulators, EPRI, Palo Alto, CA: 1981, EL-2016. [47] NGK Insulators, LTD. “Technical Guide”, Cat. No. 91 R, First revision 1989. [48] Li W., Li P., Su Z., Fan J. “Contamination Flashover Performance of Insulator Strings and Post Insulators
Used for ±500kV HVDC System”, Proceedings of the XIVth International Symposium on High Voltage Engineering, Tsinghua University, Beijing, China, August 25-29, 2005 Paper D-25.
[49] Matsuoka, R., Naito, K., Irie, T., Kondo, K. “Evaluation methods of Polymer Insulators under Contaminated Conditions”, NGK Rev Overseas Edition. Vol. 27 2003, pp 13-18.
[50] Li Q.; Wang L.; Su Z.; Liu Y.; Morita, K.; Matsuoka, R.; Ito, S.; “Natural contamination test results of various insulators under DC voltage in an inland area in China” Proceedings of the 3rd International Conference on Properties and Applications of Dielectric Materials, 1991., 8-12 Jul 1991, Page(s): 350 - 353 vol.1.
[51] Kindersberger, J., Kuhl, M.: “Surface conductivity of polluted silicone rubber insulators”, 7th International Symposium on High Voltage Engineering, Dresden, August 26-30, 1991, paper 43.15.
[52] Engelbrecht C. S., Eklund A, Hartings R, Znaidi R, “Field and laboratory testing for the choice of optimum composite insulator design for a marine-desert environment.” CIGRE Paris session 2000, paper 33-202.
[53] Su Z.Y., Ma W., Wu D., Åström U., Karlsson G. ”Measurement of Site Pollution Severity Under DC Voltage by Means of a Portable Test Station”, Proceedings of the 14th International Symposium on High Voltage Engineering, Tsinghua University, Beijing China, August 25-29 2005.
[54] CIGRE WG B2 21 “Guide for the Establishment of Naturally Polluted Insulator Testing Stations” CIGRE brochure.
[55] Almgren B., Åström U., Wu D.: “Operating experiences of insulators in HVDC converter stations” Eleventh National Power Systems Conference (NPSC 2000), December 19-22, 2000, Bangalore, India.
OUTDOOR INSULATION IN POLLUTED CONDITIONS: GUIDELINES FOR SELECTION AND DIMENSIONING
Page 51
[56] Åström U., Almgren B., Wu D.: “Outdoor Insulation Design for the Three Gorges-Changzhou ±500 kV HVDC Project”, ICPS2001 Conference, Wuhan, China, Sep. 03 - 05, 2001.
[57] Matsuoka, R.; Ito, S.; Sakanishi, K.; Naito, K.; “Flashover on contaminated insulators with different diameters” IEEE Transactions on Electrical Insulation, Volume: 26 No. 6, Dec 1991, Page(s): 1140 – 1146.
[58] Su Z. Y., Zhou J., Gao H. F., ITO S, KONDO S.: Study on Pollution Performance and Insulation Selection of ±800 kV Long String Insulators, Proceedings of the CSEE, Vol.29 No.22 Aug. 5, 2009, pp. 94-99.
[59] Gutman, T. Kiiveri, L. Carlshem: “Statistical approach for the insulation dimensioning of the 500 kV HVDC line in Scandinavia”, 15th ISH-2007, Ljubljana, Slovenia, 27-31 August, 2007, T4-13
[60] Matsuoka R., Ito S., Tanaka K., Kondo K.; “Contamination withstand voltage characteristics of polymer insulators”, 10th International Symposium on High Voltage Engineering, ISH ’97, Montreal, Quebec Canada.
[61] Gutman I., Liang X.D., Luo B., Su Z.Y., Solomonik E., Vosloo W.L.: “Evaluation of OHL performance based on environmental stresses and pollution laboratory testing of composite insulators”, CIGRE-2008, C4-112).
[62] Phillips A. J., Engelbrecht C. S. “Insulation for Power Frequency Voltage”, Chapter 4 of the EPRI AC Transmission Line Reference Book—200 kV and Above, Third Edition. EPRI, Palo Alto, CA: 2005. 1011974.
[63] Matsuoka, R.; Kondo, K.; Naito, K.; Ishii, M.; “Influence of nonsoluble contaminants on the flashover voltages of artificially contaminated insulators”, IEEE Transactions on Power Delivery, Volume: 11 , Issue: 1, 1996 , Page(s): 420 – 430
[64] Fujimura, T.; Naito, K.; Suzuki, Y.; “DC Flashover Voltage Characteristics of Contaminated Insulators” , IEEE Transactions on Electrical Insulation Volume: EI-16 , Issue: 3, 1981 , Page(s): 189 - 198
[65] Xingliang J., Jihe Y., Zhijin Z., Qin H.: Study on AC Pollution Flashover Performance of Composite Insulators at High altitude Sites of 2800-4500 m, IEEE Transactions on Dielectrics and Electrical Insulation Vol. 16, No. 1; February 2009, pp. 123 – 132.
[66] Fuzeng Zhang; Jie Zhao; Liming Wang; Zhicheng Guan; “Experimental Investigation on Outdoor Insulation for DC Transmission Line at High Altitudes”, IEEE Transactions on Power Delivery, Volume: 25 , Issue: 1, 2010 , Page(s): 351 – 357.
[67] CIGRE Task Force 33.04.01 “HVDC source requirements in polluted insulator tests”, Electra No 136 June 1991, pp 97-111.
[68] International Electrotechnical Commission: Artificial pollution tests on high-voltage insulators to be used on d.c. systems, IEC/Technical Report 61245, 1993, IEC, 1st ed.
[69] Wu D., Åström U., Su Z., Ma W., “Critical issues on the dimensioning of external insulation for UHVDC converter stations”, 2006 International Conference of UHV Transmission Technology, Beijing, China, 2006.11.
[70] Luo B., Li L., Rao H. Li X. Study on Pollution Flashover Characteristics of ±800kV DC Composite Insulators, IEEE PES PowerAfrica 2007 Conference and Exposition Johannesburg, South Africa, 16-20 July 2007
[71] Fong F., “Operational experience on HVDC and HVAC insulators at Sylmar converter station” Conference Record of the 2002 IEEE International Symposium on Electrical Insulation, Boston, MA, USA, April 7-10, 2002
[72] Gutman I., Kondo K., Matsuoka R., Garcia R. W., CIGRE round robin pollution test for polymeric insulators: results in four high-voltage laboratories, XVII International Symposium on High Voltage Engineering, Hannover, Germany, August 22-26, 2011 Paper C-013
[73] Wu D., Li M., Kvarngren M., Uncertainties in the application of atmospheric and altitude corrections as recommended in IEC standards, Proceedings of the 16th International Symposium on High Voltage Engineering, Cape Town, South Africa, 24–28 August 200, Paper A-15.
OUTDOOR INSULATION IN POLLUTED CONDITIONS: GUIDELINES FOR SELECTION AND DIMENSIONING
Page 52
[74] Almgren B., Åström U., Wu D. “A survey of the flashover performance of HVDC converter station insulators”, POWERCON '98, International Conference on Power Systems Technology Beijing, China in August 18-21, 1998
[75] Wu D., Åström U., Su Z.Y., Ma W.M. “The Design and Operational Experience of an Indoor DC yard for ±500 kV HVDC Transmission 15th International symposium on high voltage engineering, ISH 2007, Ljubljana, August 27-31, 2007, Paper T9-276.
[76] International Electrotechnical Commission: Guidance on the measurement of wettability of insulator surfaces, IEC/TS 62073, 1st ed
[77] Pigini A., Garcia R.W. “Considerações sobre projeto de isoladores atcc para ambiente poluído” XXI SNPTEE 2011
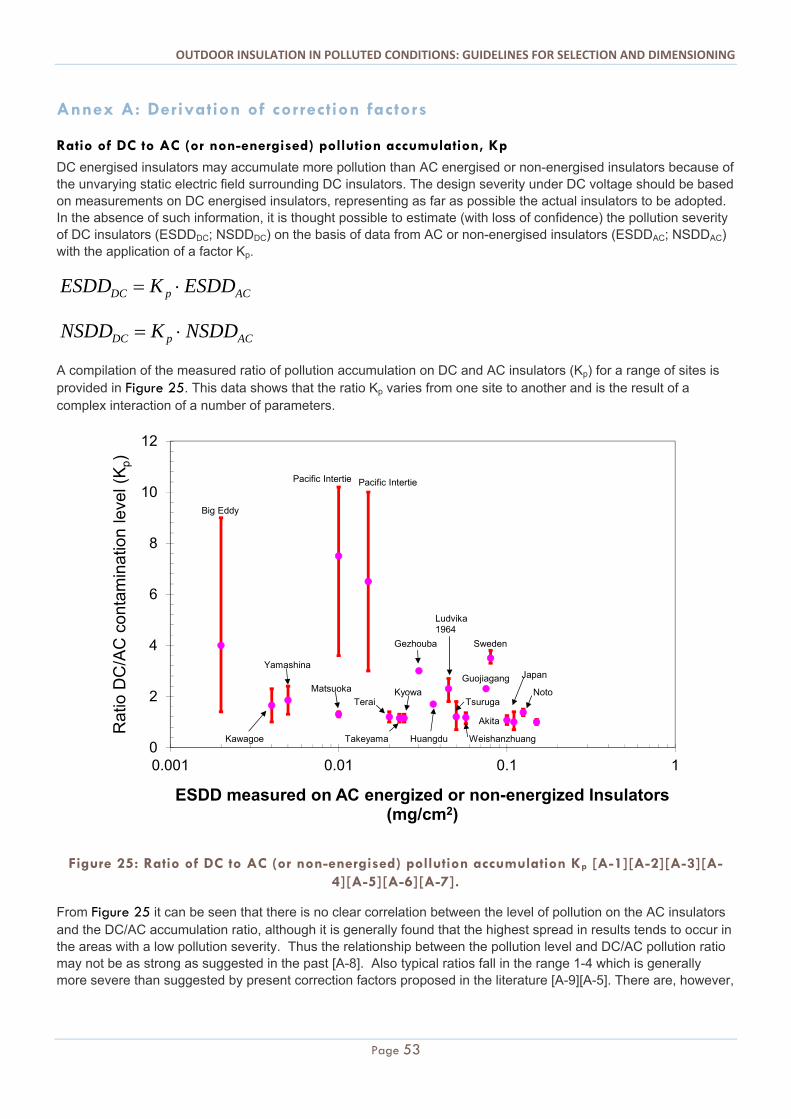
OUTDOOR INSULATION IN POLLUTED CONDITIONS: GUIDELINES FOR SELECTION AND DIMENSIONING
Page 53
Annex A: Derivation of correction factors
Ratio of DC to AC (or non-energised) pollution accumulation, Kp
DC energised insulators may accumulate more pollution than AC energised or non-energised insulators because of the unvarying static electric field surrounding DC insulators. The design severity under DC voltage should be based on measurements on DC energised insulators, representing as far as possible the actual insulators to be adopted. In the absence of such information, it is thought possible to estimate (with loss of confidence) the pollution severity of DC insulators (ESDDDC; NSDDDC) on the basis of data from AC or non-energised insulators (ESDDAC; NSDDAC) with the application of a factor Kp.
ACpDC ESDDKESDD
ACpDC NSDDKNSDD
A compilation of the measured ratio of pollution accumulation on DC and AC insulators (Kp) for a range of sites is provided in Figure 25. This data shows that the ratio Kp varies from one site to another and is the result of a complex interaction of a number of parameters.
Figure 25: Ratio of DC to AC (or non-energised) pollution accumulation Kp [A-1][A-2][A-3][A-4][A-5][A-6][A-7].
From Figure 25 it can be seen that there is no clear correlation between the level of pollution on the AC insulators and the DC/AC accumulation ratio, although it is generally found that the highest spread in results tends to occur in the areas with a low pollution severity. Thus the relationship between the pollution level and DC/AC pollution ratio may not be as strong as suggested in the past [A-8]. Also typical ratios fall in the range 1-4 which is generally more severe than suggested by present correction factors proposed in the literature [A-9][A-5]. There are, however,
0
2
4
6
8
10
12
0.001 0.01 0.1 1
Rat
io D
C/A
C c
onta
min
atio
n le
vel (
Kp)
ESDD measured on AC energized or non-energized Insulators (mg/cm2)
Big Eddy
Gezhouba
Ludvika1964
Huangdu
Guojiagang
Noto
Akita
Takeyama
Kyowa
Weishanzhuang
Terai
Matsuoka
Yamashina
Kawagoe
Pacific Intertie
Sweden
Japan
Pacific Intertie
Tsuruga
OUTDOOR INSULATION IN POLLUTED CONDITIONS: GUIDELINES FOR SELECTION AND DIMENSIONING
Page 54
a few general rules which can be used to identify locations where high DC to AC pollution ratios can be expected [A-10][A-9]:
Sites in proximity of manmade pollution sources such as roads, industrial plants, mining, and residential areas where coal or wood are used for heating and cooking.
Environments with extended dry periods (e.g. dry season, or extended droughts) that allow the long term accumulation of pollutants.
Areas with significant periods where the wind speed is below 3 m/s (light breeze). In China, for example such areas are identified based on the average wind speed over the dry winter period [A-11].
Other aspects that may influence the DC/AC pollution ratio are:
The effectiveness and frequency of natural cleaning on the insulators: Electrostatic attraction is a process that results in a slow, but steady, build-up of pollution, which means that insulators subjected to frequent natural cleaning would generally have lower DC/AC pollution ratios. In the same way insulators allowing effective natural cleaning, either because of their shed profile or because of their installation orientation may exhibit smaller DC/AC pollution ratios.
The electric field stress on the actual insulator units: Insulators subjected to high E-field stresses tend to collect more pollution than insulators with low E-field stresses. On this basis it is expected that UHV-DC insulators would accumulate more pollution than EHV-DC insulators.
A new proposal for the DC/AC pollution accumulation factor has been made in [A-12], based on the particle size (D50 in μm) of the pollution collected on the insulator surface and the average wind speed over the accumulation period [A-11]. This proposal has so far not been verified at other HVDC sites in different climatic conditions so its general applicability is not yet confirmed.
In summary: From the available information, it is clear that the prediction of DC pollution levels from measurements on AC (or non-energised) insulators is, at best, guesswork with the real risk of making large errors. This should thus be avoided as far as possible. In cases where relevant information is not available, a general estimation of the ratio Kp is possible by considering the following factors:
How the pollution is generated: At sites in proximity of the sea or in desert areas the amount of pollution in the air increases with the wind speed. Close to roads, housing or industrial areas the amount of pollution generated is more-or-less constant and independent of the wind speed. The DC to AC accumulation ratio is higher in areas where the amount of pollution in the air is independent on the wind speed.
How the pollution is transported: Electrostatic attraction only has an effect on the pollution accumulation if the wind speed is low (i.e. light breeze and lower, ≤ 3m/s ). During these conditions the pollution accumulation on energised DC insulators will be higher than on those energised by AC. Above these wind speeds the aerodynamic interaction between the insulator and airflow becomes dominant which results in small differences in the pollution accumulation between DC and AC energised insulators.
With these principles in mind the following guidance can be given with regards to the choice of Kp:
Kp= 1 for measurements made on DC energised insulators for sufficiently long time. Kp is typically 1.1, with a range of 1 to 1.2 in areas where maximum site severities conditions are reached
in a short time following specific events. Typical cases are those where the wind speed is the dominant factor that determines the amount of pollution carried in the air or in areas where high wind speeds prevail (i.e. wind speed higher than 6 m/s). A typical example of such an area is a site close to the sea with Type B pollution.
Kp is typically 1.6, with a range of 1.3 to 1.9 in areas where the maximum site severity conditions are reached in times of the order of a month. These areas may be characterised by pollution either of type A or B (e.g. at some distance from the coast or from pollution sources associated with human activity) with moderate wind conditions (i.e. wind speeds of between 3 to 6 m/s).
Kp is typically 2.5 with a range of 2 to 3 in areas with a pollution process increasing slowly in time (e. g. showing an increasing trend in a 1-2 year period), e.g. areas with Type A pollution, characterised by human activity such as mining, industry, roads etc., and generally mild wind speeds (i.e. 1.5-3 m/s).
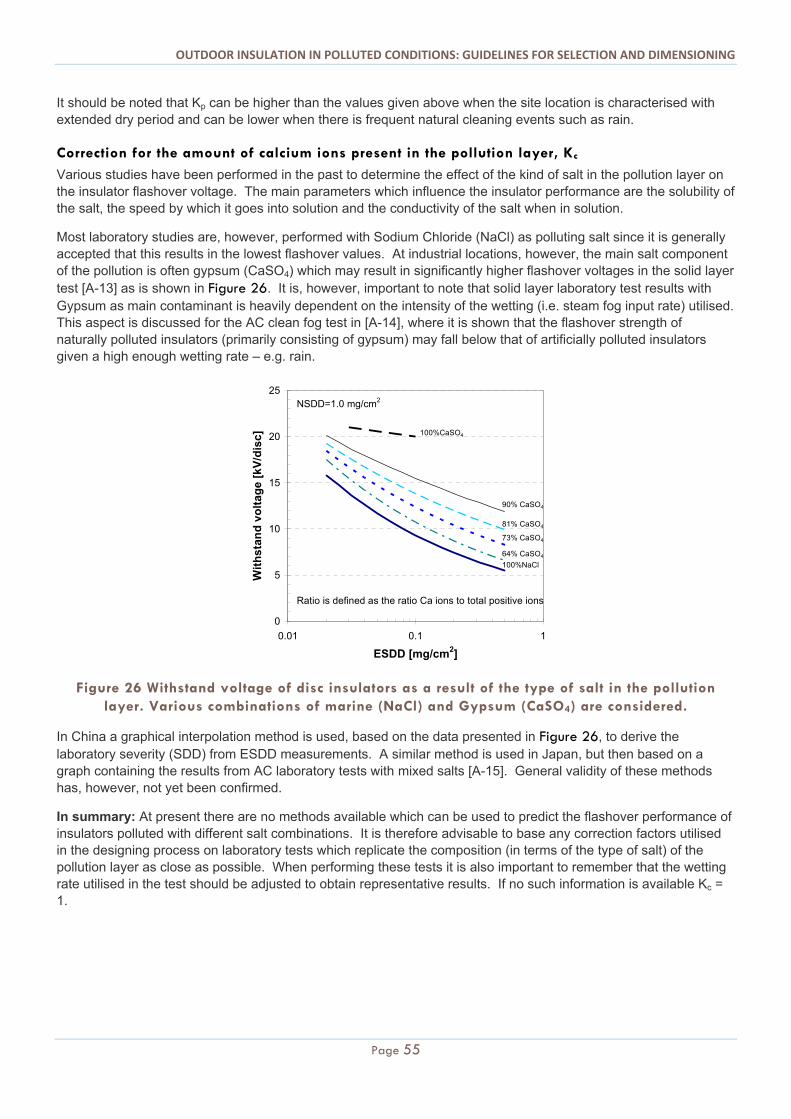
OUTDOOR INSULATION IN POLLUTED CONDITIONS: GUIDELINES FOR SELECTION AND DIMENSIONING
Page 55
It should be noted that Kp can be higher than the values given above when the site location is characterised with extended dry period and can be lower when there is frequent natural cleaning events such as rain.
Correction for the amount of calcium ions present in the pollution layer, Kc
Various studies have been performed in the past to determine the effect of the kind of salt in the pollution layer on the insulator flashover voltage. The main parameters which influence the insulator performance are the solubility of the salt, the speed by which it goes into solution and the conductivity of the salt when in solution.
Most laboratory studies are, however, performed with Sodium Chloride (NaCl) as polluting salt since it is generally accepted that this results in the lowest flashover values. At industrial locations, however, the main salt component of the pollution is often gypsum (CaSO4) which may result in significantly higher flashover voltages in the solid layer test [A-13] as is shown in Figure 26. It is, however, important to note that solid layer laboratory test results with Gypsum as main contaminant is heavily dependent on the intensity of the wetting (i.e. steam fog input rate) utilised. This aspect is discussed for the AC clean fog test in [A-14], where it is shown that the flashover strength of naturally polluted insulators (primarily consisting of gypsum) may fall below that of artificially polluted insulators given a high enough wetting rate – e.g. rain.
Figure 26 Withstand voltage of disc insulators as a result of the type of salt in the pollution layer. Various combinations of marine (NaCl) and Gypsum (CaSO4) are considered.
In China a graphical interpolation method is used, based on the data presented in Figure 26, to derive the laboratory severity (SDD) from ESDD measurements. A similar method is used in Japan, but then based on a graph containing the results from AC laboratory tests with mixed salts [A-15]. General validity of these methods has, however, not yet been confirmed.
In summary: At present there are no methods available which can be used to predict the flashover performance of insulators polluted with different salt combinations. It is therefore advisable to base any correction factors utilised in the designing process on laboratory tests which replicate the composition (in terms of the type of salt) of the pollution layer as close as possible. When performing these tests it is also important to remember that the wetting rate utilised in the test should be adjusted to obtain representative results. If no such information is available Kc = 1.
0
5
10
15
20
25
0.01 0.1 1
ESDD [mg/cm2]
Wit
hst
and
vo
ltag
e [k
V/d
isc]
NSDD=1.0 mg/cm2
100%NaCl
100%CaSO4
90% CaSO4
81% CaSO4
73% CaSO4
64% CaSO4
Ratio is defined as the ratio Ca ions to total positive ions
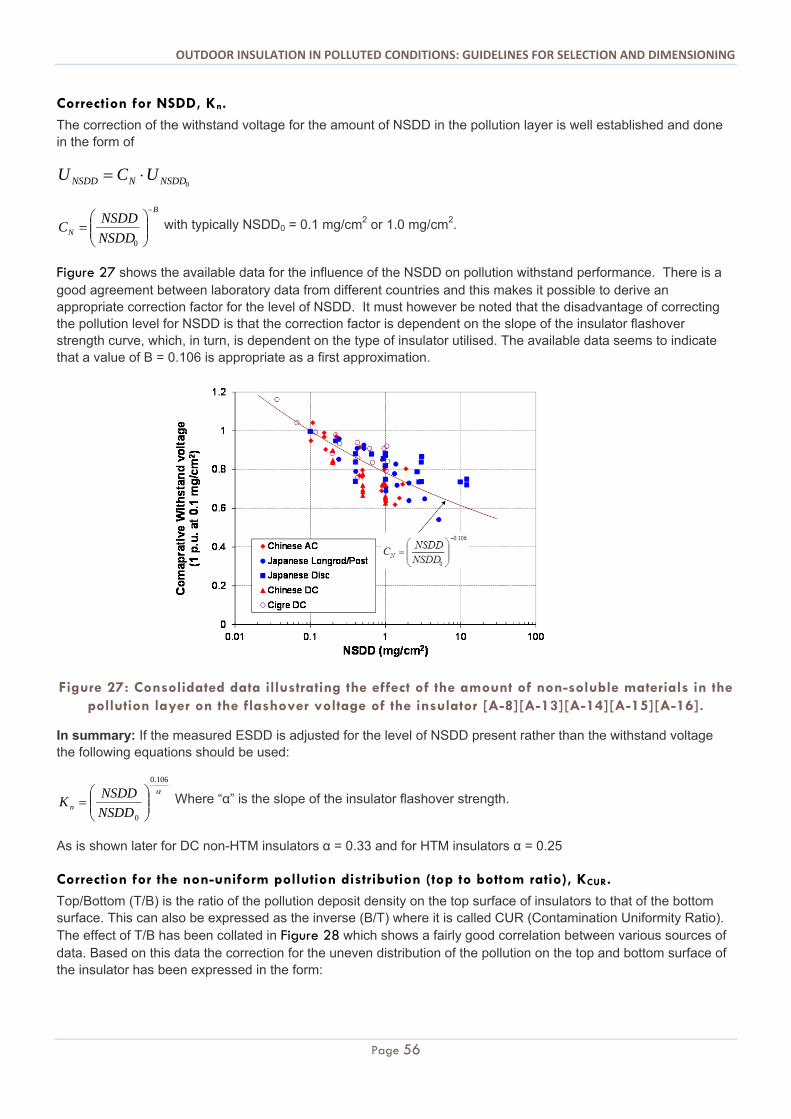
OUTDOOR INSULATION IN POLLUTED CONDITIONS: GUIDELINES FOR SELECTION AND DIMENSIONING
Page 56
Correction for NSDD, Kn.
The correction of the withstand voltage for the amount of NSDD in the pollution layer is well established and done in the form of
0NSDDNNSDD UCU
B
N NSDD
NSDDC
0
with typically NSDD0 = 0.1 mg/cm2 or 1.0 mg/cm2.
Figure 27 shows the available data for the influence of the NSDD on pollution withstand performance. There is a good agreement between laboratory data from different countries and this makes it possible to derive an appropriate correction factor for the level of NSDD. It must however be noted that the disadvantage of correcting the pollution level for NSDD is that the correction factor is dependent on the slope of the insulator flashover strength curve, which, in turn, is dependent on the type of insulator utilised. The available data seems to indicate that a value of B = 0.106 is appropriate as a first approximation.
Figure 27: Consolidated data illustrating the effect of the amount of non-soluble materials in the pollution layer on the flashover voltage of the insulator [A-8][A-13][A-14][A-15][A-16].
In summary: If the measured ESDD is adjusted for the level of NSDD present rather than the withstand voltage the following equations should be used:
106.0
0
NSDD
NSDDK n
Where “α” is the slope of the insulator flashover strength.
As is shown later for DC non-HTM insulators α = 0.33 and for HTM insulators α = 0.25
Correction for the non-uniform pollution distribution (top to bottom ratio), KCUR.
Top/Bottom (T/B) is the ratio of the pollution deposit density on the top surface of insulators to that of the bottom surface. This can also be expressed as the inverse (B/T) where it is called CUR (Contamination Uniformity Ratio). The effect of T/B has been collated in Figure 28 which shows a fairly good correlation between various sources of data. Based on this data the correction for the uneven distribution of the pollution on the top and bottom surface of the insulator has been expressed in the form:
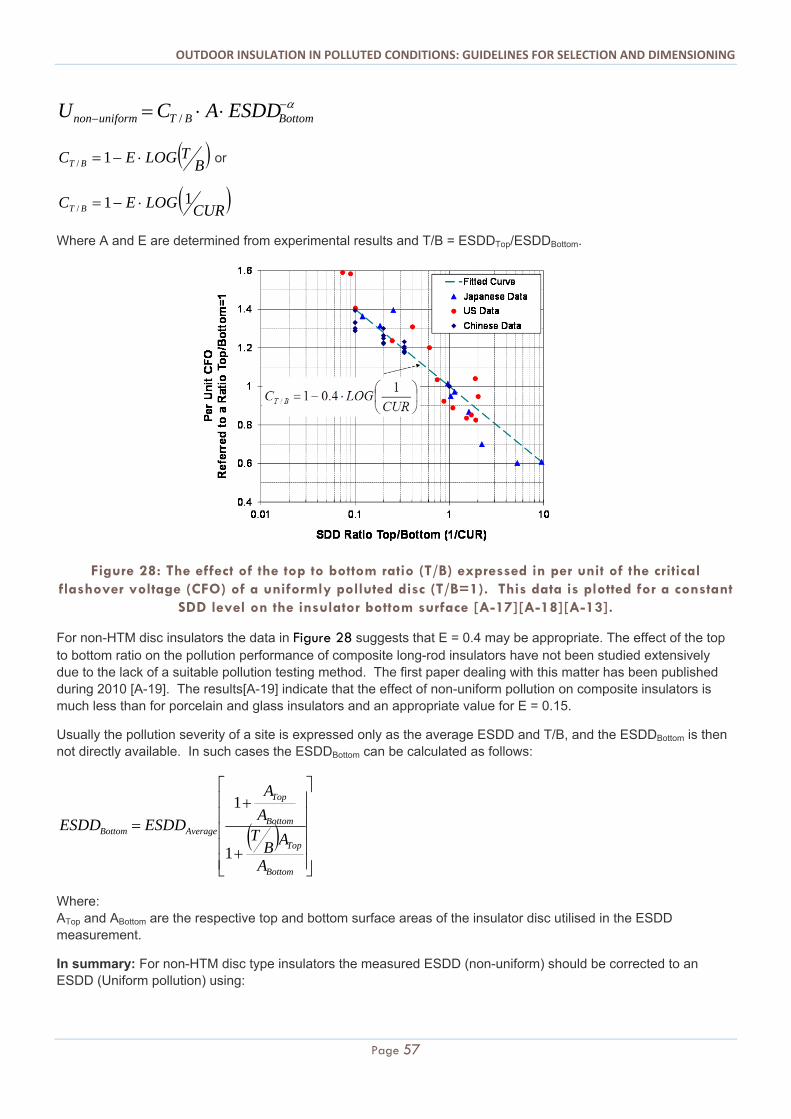
OUTDOOR INSULATION IN POLLUTED CONDITIONS: GUIDELINES FOR SELECTION AND DIMENSIONING
Page 57
BottomBTuniformnon ESDDACU /
BTLOGEC BT 1/ or
CURLOGEC BT11/
Where A and E are determined from experimental results and T/B = ESDDTop/ESDDBottom.
Figure 28: The effect of the top to bottom ratio (T/B) expressed in per unit of the critical flashover voltage (CFO) of a uniformly polluted disc (T/B=1). This data is plotted for a constant
SDD level on the insulator bottom surface [A-17][A-18][A-13].
For non-HTM disc insulators the data in Figure 28 suggests that E = 0.4 may be appropriate. The effect of the top to bottom ratio on the pollution performance of composite long-rod insulators have not been studied extensively due to the lack of a suitable pollution testing method. The first paper dealing with this matter has been published during 2010 [A-19]. The results[A-19] indicate that the effect of non-uniform pollution on composite insulators is much less than for porcelain and glass insulators and an appropriate value for E = 0.15.
Usually the pollution severity of a site is expressed only as the average ESDD and T/B, and the ESDDBottom is then not directly available. In such cases the ESDDBottom can be calculated as follows:
Bottom
Top
Bottom
Top
AverageBottom
A
ABTA
A
ESDDESDD
1
1
Where: ATop and ABottom are the respective top and bottom surface areas of the insulator disc utilised in the ESDD measurement.
In summary: For non-HTM disc type insulators the measured ESDD (non-uniform) should be corrected to an ESDD (Uniform pollution) using:
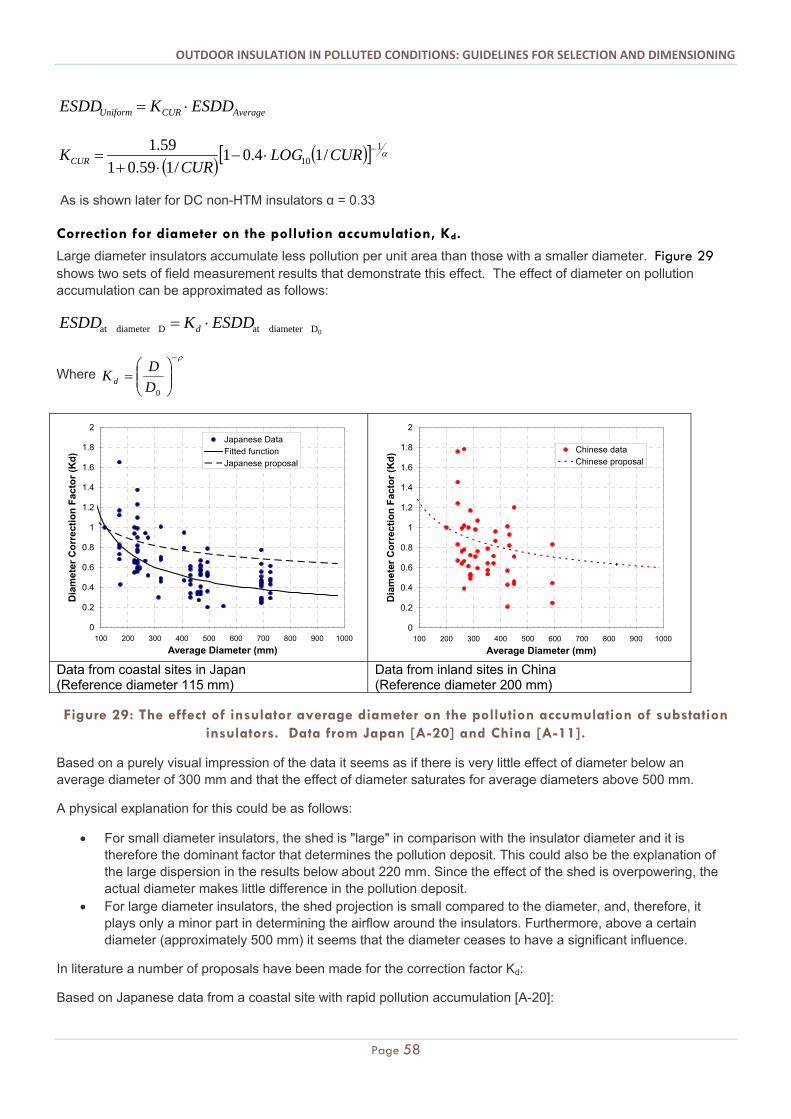
OUTDOOR INSULATION IN POLLUTED CONDITIONS: GUIDELINES FOR SELECTION AND DIMENSIONING
Page 58
AverageCURUniform ESDDKESDD
1
10 /14.01/159.01
59.1
CURLOGCUR
KCUR
As is shown later for DC non-HTM insulators α = 0.33
Correction for diameter on the pollution accumulation, Kd.
Large diameter insulators accumulate less pollution per unit area than those with a smaller diameter. Figure 29 shows two sets of field measurement results that demonstrate this effect. The effect of diameter on pollution accumulation can be approximated as follows:
0DdiameteratDdiameterat ESDDKESDD d
Where
0D
DK d
Data from coastal sites in Japan (Reference diameter 115 mm)
Data from inland sites in China (Reference diameter 200 mm)
Figure 29: The effect of insulator average diameter on the pollution accumulation of substation insulators. Data from Japan [A-20] and China [A-11].
Based on a purely visual impression of the data it seems as if there is very little effect of diameter below an average diameter of 300 mm and that the effect of diameter saturates for average diameters above 500 mm.
A physical explanation for this could be as follows:
For small diameter insulators, the shed is "large" in comparison with the insulator diameter and it is therefore the dominant factor that determines the pollution deposit. This could also be the explanation of the large dispersion in the results below about 220 mm. Since the effect of the shed is overpowering, the actual diameter makes little difference in the pollution deposit.
For large diameter insulators, the shed projection is small compared to the diameter, and, therefore, it plays only a minor part in determining the airflow around the insulators. Furthermore, above a certain diameter (approximately 500 mm) it seems that the diameter ceases to have a significant influence.
In literature a number of proposals have been made for the correction factor Kd:
Based on Japanese data from a coastal site with rapid pollution accumulation [A-20]:
0
0.2
0.4
0.6
0.8
1
1.2
1.4
1.6
1.8
2
100 200 300 400 500 600 700 800 900 1000
Average Diameter (mm)
Dia
met
er C
orr
ecti
on
Fac
tor
(Kd
)
Japanese DataFitted functionJapanese proposal
0
0.2
0.4
0.6
0.8
1
1.2
1.4
1.6
1.8
2
100 200 300 400 500 600 700 800 900 1000
Average Diameter (mm)
Dia
met
er C
orr
ecti
on
Fac
tor
(Kd
) Chinese dataChinese proposal
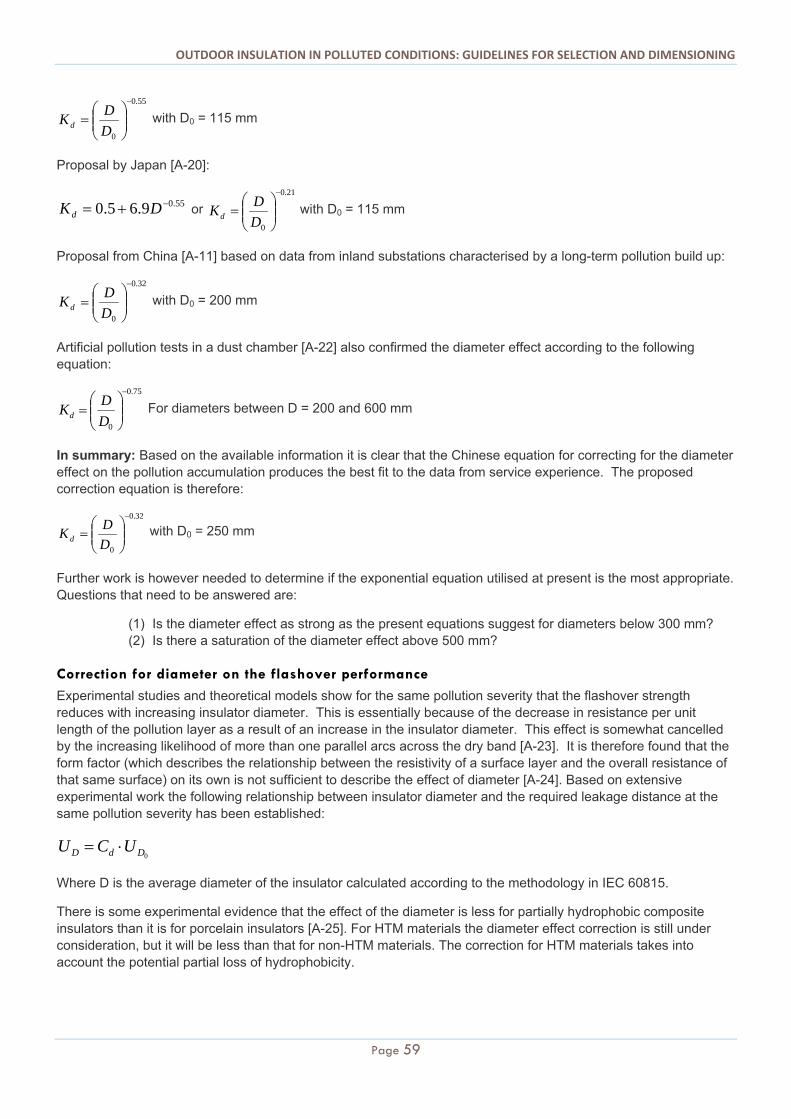
OUTDOOR INSULATION IN POLLUTED CONDITIONS: GUIDELINES FOR SELECTION AND DIMENSIONING
Page 59
55.0
0
D
DKd
with D0 = 115 mm
Proposal by Japan [A-20]:
55.09.65.0 DKd or 21.0
0
D
DKd
with D0 = 115 mm
Proposal from China [A-11] based on data from inland substations characterised by a long-term pollution build up:
32.0
0
D
DKd
with D0 = 200 mm
Artificial pollution tests in a dust chamber [A-22] also confirmed the diameter effect according to the following equation:
75.0
0
D
DKd
For diameters between D = 200 and 600 mm
In summary: Based on the available information it is clear that the Chinese equation for correcting for the diameter effect on the pollution accumulation produces the best fit to the data from service experience. The proposed correction equation is therefore:
32.0
0
D
DKd
with D0 = 250 mm
Further work is however needed to determine if the exponential equation utilised at present is the most appropriate. Questions that need to be answered are:
(1) Is the diameter effect as strong as the present equations suggest for diameters below 300 mm? (2) Is there a saturation of the diameter effect above 500 mm?
Correction for diameter on the flashover performance
Experimental studies and theoretical models show for the same pollution severity that the flashover strength reduces with increasing insulator diameter. This is essentially because of the decrease in resistance per unit length of the pollution layer as a result of an increase in the insulator diameter. This effect is somewhat cancelled by the increasing likelihood of more than one parallel arcs across the dry band [A-23]. It is therefore found that the form factor (which describes the relationship between the resistivity of a surface layer and the overall resistance of that same surface) on its own is not sufficient to describe the effect of diameter [A-24]. Based on extensive experimental work the following relationship between insulator diameter and the required leakage distance at the same pollution severity has been established:
0DdD UCU
Where D is the average diameter of the insulator calculated according to the methodology in IEC 60815.
There is some experimental evidence that the effect of the diameter is less for partially hydrophobic composite insulators than it is for porcelain insulators [A-25]. For HTM materials the diameter effect correction is still under consideration, but it will be less than that for non-HTM materials. The correction for HTM materials takes into account the potential partial loss of hydrophobicity.
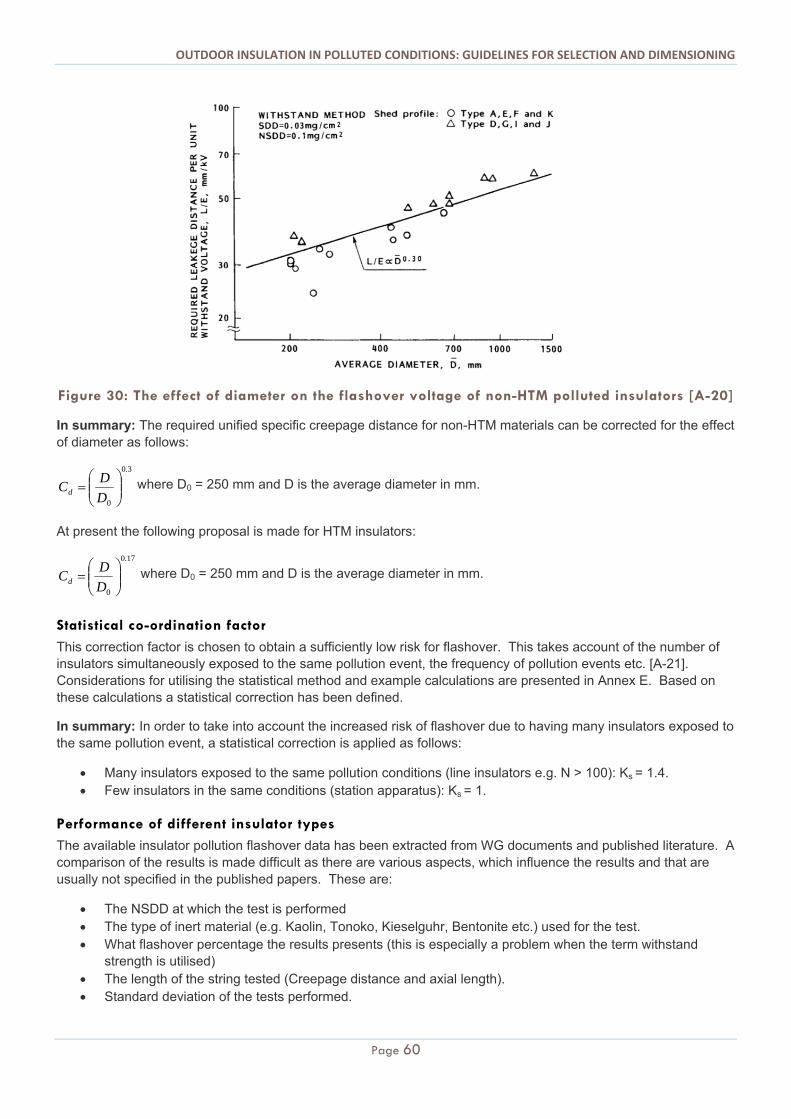
OUTDOOR INSULATION IN POLLUTED CONDITIONS: GUIDELINES FOR SELECTION AND DIMENSIONING
Page 60
Figure 30: The effect of diameter on the flashover voltage of non-HTM polluted insulators [A-20]
In summary: The required unified specific creepage distance for non-HTM materials can be corrected for the effect of diameter as follows:
3.0
0
D
DCd
where D0 = 250 mm and D is the average diameter in mm.
At present the following proposal is made for HTM insulators:
17.0
0
D
DCd
where D0 = 250 mm and D is the average diameter in mm.
Statistical co-ordination factor
This correction factor is chosen to obtain a sufficiently low risk for flashover. This takes account of the number of insulators simultaneously exposed to the same pollution event, the frequency of pollution events etc. [A-21]. Considerations for utilising the statistical method and example calculations are presented in Annex E. Based on these calculations a statistical correction has been defined.
In summary: In order to take into account the increased risk of flashover due to having many insulators exposed to the same pollution event, a statistical correction is applied as follows:
Many insulators exposed to the same pollution conditions (line insulators e.g. N > 100): Ks = 1.4. Few insulators in the same conditions (station apparatus): Ks = 1.
Performance of different insulator types
The available insulator pollution flashover data has been extracted from WG documents and published literature. A comparison of the results is made difficult as there are various aspects, which influence the results and that are usually not specified in the published papers. These are:
The NSDD at which the test is performed The type of inert material (e.g. Kaolin, Tonoko, Kieselguhr, Bentonite etc.) used for the test. What flashover percentage the results presents (this is especially a problem when the term withstand
strength is utilised) The length of the string tested (Creepage distance and axial length). Standard deviation of the tests performed.
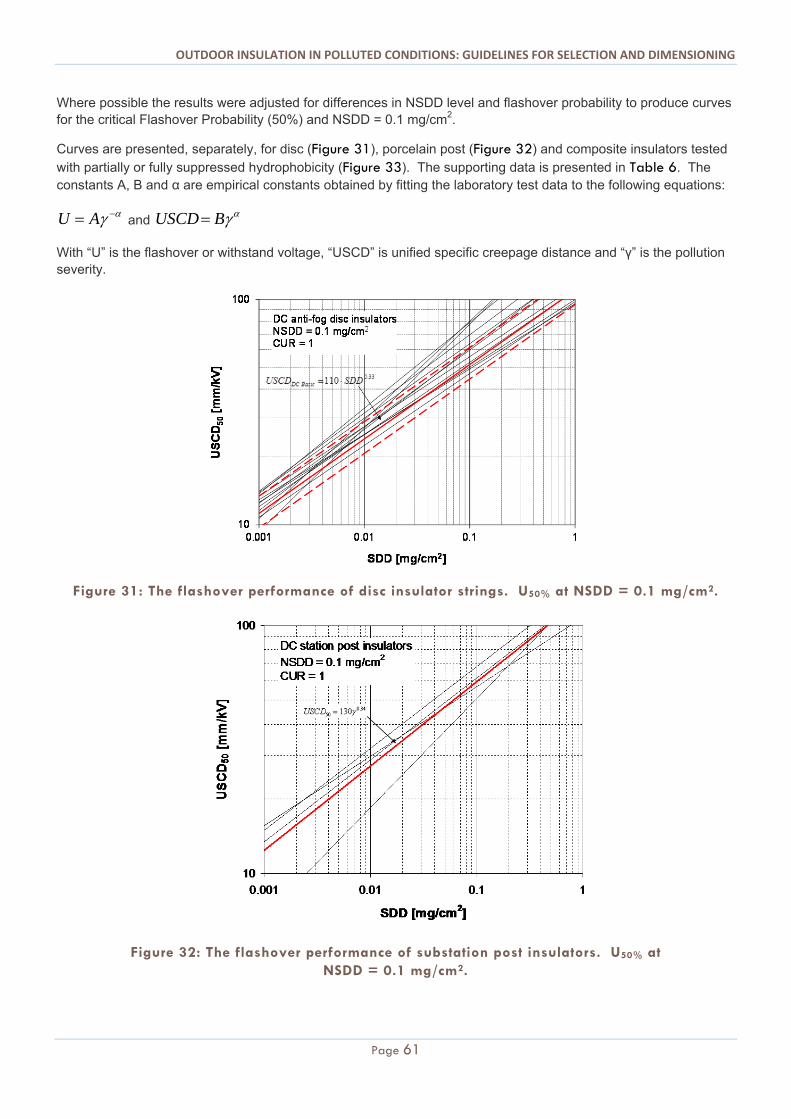
OUTDOOR INSULATION IN POLLUTED CONDITIONS: GUIDELINES FOR SELECTION AND DIMENSIONING
Page 61
Where possible the results were adjusted for differences in NSDD level and flashover probability to produce curves for the critical Flashover Probability (50%) and NSDD = 0.1 mg/cm2.
Curves are presented, separately, for disc (Figure 31), porcelain post (Figure 32) and composite insulators tested with partially or fully suppressed hydrophobicity (Figure 33). The supporting data is presented in Table 6. The constants A, B and α are empirical constants obtained by fitting the laboratory test data to the following equations:
AU and BUSCD
With “U” is the flashover or withstand voltage, “USCD” is unified specific creepage distance and “γ” is the pollution severity.
Figure 31: The flashover performance of disc insulator strings. U50% at NSDD = 0.1 mg/cm2.
Figure 32: The flashover performance of substation post insulators. U50% at NSDD = 0.1 mg/cm2.
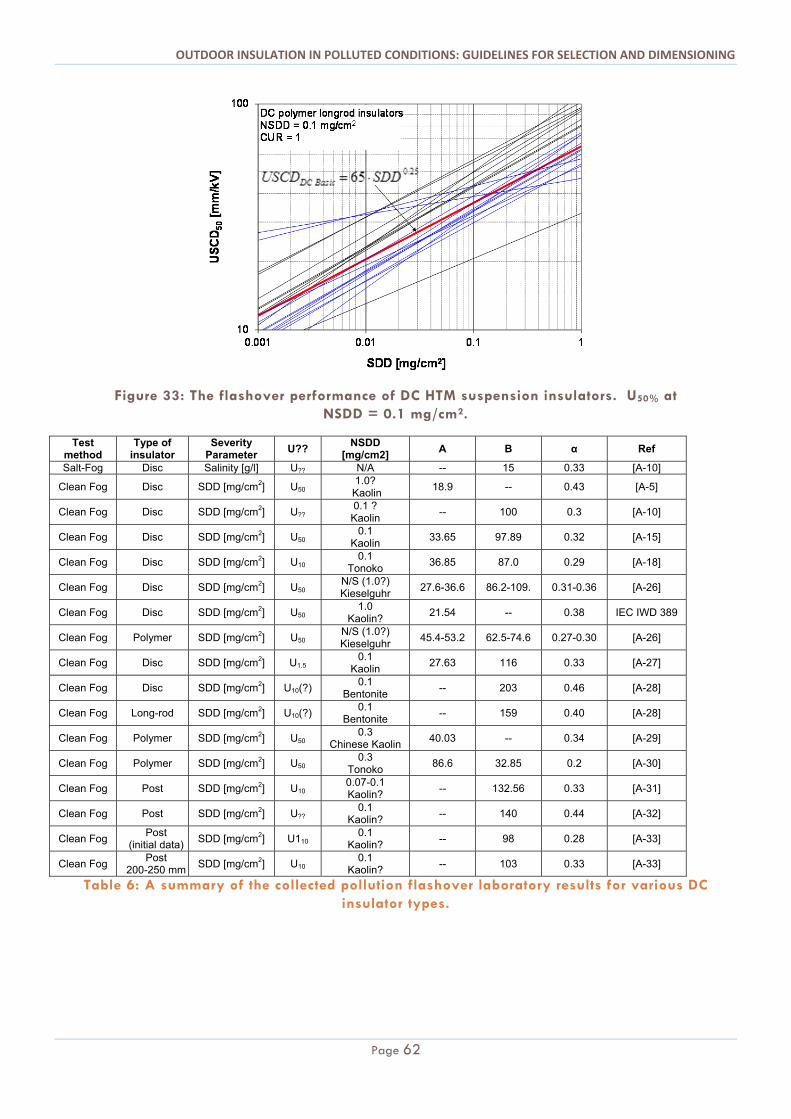
OUTDOOR INSULATION IN POLLUTED CONDITIONS: GUIDELINES FOR SELECTION AND DIMENSIONING
Page 62
Figure 33: The flashover performance of DC HTM suspension insulators. U50% at NSDD = 0.1 mg/cm2.
Test method
Type of insulator
Severity Parameter
U?? NSDD
[mg/cm2] A B α Ref
Salt-Fog Disc Salinity [g/l] U?? N/A -- 15 0.33 [A-10]
Clean Fog Disc SDD [mg/cm2] U50 1.0?
Kaolin 18.9 -- 0.43 [A-5]
Clean Fog Disc SDD [mg/cm2] U?? 0.1 ?
Kaolin -- 100 0.3 [A-10]
Clean Fog Disc SDD [mg/cm2] U50 0.1
Kaolin 33.65 97.89 0.32 [A-15]
Clean Fog Disc SDD [mg/cm2] U10 0.1
Tonoko 36.85 87.0 0.29 [A-18]
Clean Fog Disc SDD [mg/cm2] U50 N/S (1.0?) Kieselguhr
27.6-36.6 86.2-109. 0.31-0.36 [A-26]
Clean Fog Disc SDD [mg/cm2] U50 1.0
Kaolin? 21.54 -- 0.38 IEC IWD 389
Clean Fog Polymer SDD [mg/cm2] U50 N/S (1.0?) Kieselguhr
45.4-53.2 62.5-74.6 0.27-0.30 [A-26]
Clean Fog Disc SDD [mg/cm2] U1.5 0.1
Kaolin 27.63 116 0.33 [A-27]
Clean Fog Disc SDD [mg/cm2] U10(?) 0.1
Bentonite -- 203 0.46 [A-28]
Clean Fog Long-rod SDD [mg/cm2] U10(?) 0.1
Bentonite -- 159 0.40 [A-28]
Clean Fog Polymer SDD [mg/cm2] U50 0.3
Chinese Kaolin 40.03 -- 0.34 [A-29]
Clean Fog Polymer SDD [mg/cm2] U50 0.3
Tonoko 86.6 32.85 0.2 [A-30]
Clean Fog Post SDD [mg/cm2] U10 0.07-0.1 Kaolin?
-- 132.56 0.33 [A-31]
Clean Fog Post SDD [mg/cm2] U?? 0.1
Kaolin? -- 140 0.44 [A-32]
Clean Fog Post
(initial data) SDD [mg/cm2] U110
0.1 Kaolin?
-- 98 0.28 [A-33]
Clean Fog Post
200-250 mm SDD [mg/cm2] U10
0.1 Kaolin?
-- 103 0.33 [A-33]
Table 6: A summary of the collected pollution flashover laboratory results for various DC insulator types.
OUTDOOR INSULATION IN POLLUTED CONDITIONS: GUIDELINES FOR SELECTION AND DIMENSIONING
Page 63
In summary: Based on the data collected the following conclusions can be made:
The proposed equations for disc and post insulators represent the “median” of the experimental data. The slope for the disc and post insulator curves is about the same (α= 0.33) The slope for composite insulators (i.e. α= 0.22 – 0.25) is less than that of disc and post insulators. There is a wide spread in the laboratory test results especially for composite insulators (a factor 3 between
worst and best performer). This is attributed to the varying degrees of hydrophobic transfer/recovery during testing.
The advantage of HTM materials is dependent on pollution severity, i.e. it is not warranted to apply a simple percentage creepage distance reduction independent of the pollution severity.
References
[A-1] Lampe, W.; Hoglund, T.K.E.; Nellis, C.L.; Renner, P.E.; Stearns, R.D.; “Long-term tests of HVDC insulators under natural pollution conditions at the Big Eddy Test Center”, IEEE Transactions on Power Delivery, Volume 4, Issue 1, Jan 1989 Page(s): 248 - 259
[A-2] EPRI “HVDC Transmission line reference Book” EPRI, Palo Alto, CA: 1993, TR 102764. [A-3] Imakoma T.; “DC Pollution performance of insulators” Contribution to CIGRE Paris Session 2000,
Group 33 Preferential subject 2, Question 8.1 & 8.2. [A-4] Z.Y. Su, W. Ma, D. Wu, U. Åström, G. Karlsson ”Measurement of Site Pollution Severity Under DC
Voltage by Means of a Portable Test Station”, Proceedings of the 14th International Symposium on High Voltage Engineering, Tsinghua University, Beijing China, August 25-29 2005,
[A-5] Z.Y. Su, X.D. Liang, Y. Yin, J.Zhou, W.F.Li, P. Li, ”Outdoor insulation selection method of HVDC lines”, Proceedings of the 14th International Symposium on High Voltage Engineering, Tsinghua University, Beijing China, August 25-29 2005, Paper D-18.
[A-6] Pigini, A.; “Private communication” [A-7] Li Qisheng; Wang Lai; Su Zhiyi; Liu Yansheng; Morita, K.; Matsuoka, R.; Ito, S.; “Natural
contamination test results of various insulators under DC voltage in an inland area in China” Proceedings of the 3rd International Conference on Properties and Applications of Dielectric Materials, 1991., 8-12 Jul 1991, Page(s): 350 - 353 vol.1
[A-8] CIGRE Task Force 33.04.04 “Artificial pollution testing of HVDC insulators analysis of factors influencing performance”, ELECTRA, No 140, February 1992, pp 99-113.
[A-9] D. Wu, Z. Su, “The correction factor between DC and AC pollution levels: review and proposal”, Proceedings of the 10th ISH Vol. 3, August 25-29, 1997, Montreal, Canada, pp 253-256.
[A-10] A. Pigini A.C. Britten C. Engelbrecht; Development of guidelines for the selection of insulators with respect to pollution for EHV- UHV DC: state of the art and research needs, CIGRE Paris Session 2008, paper C4-101.
[A-11] Su Zhiyi, Fan Jianbin, Li Qingfeng, Liu Yansheng, Zhou Jun, “Natural Contamination Performances on Insulators under DC Stress and the Pollution Deposit Density Ratio of DC to AC”, 15th International Symposium on High Voltage Engineering (ISH), Ljubljana, Slovenia, August 27-31, 2007, Paper T4-324.
[A-12] Su Zhiyi, Fan Jianbin, Gu Chen: “The research of pollution level forecast method of HVDC converter stations”, CIGRE Wg C4.303-07 (25).
[A-13] Z.Y. Su, X.D. Liang, Y. Yin, J.Zhou, W.F.Li, P. Li, ”Important correction factors in HVDC line insulation selection”, Proceedings of the 14th International Symposium on High Voltage Engineering, Tsinghua University, Beijing China, August 25-29 2005,
[A-14] CIGRE Task Force 33.04.01 Polluted Insulators: A review of current knowledge, CIGRE Technical brochure 158, June 2000.
[A-15] Kondo, K., Ito, S., Kondo, S., Imakoma, T.: “Investigation results of suspension insulators removed from DC 500 kV Gezhouba-Shanghai Line in China”
OUTDOOR INSULATION IN POLLUTED CONDITIONS: GUIDELINES FOR SELECTION AND DIMENSIONING
Page 64
[A-16] Matsuoka, R.; Kondo, K.; Naito, K.; Ishii, M.; “Influence of nonsoluble contaminants on the flashover voltages of artificially contaminated insulators”, IEEE Transactions on Power Delivery, Volume: 11 , Issue: 1, 1996 , Page(s): 420 - 430
[A-17] EPRI: “HVDC Transmission Line Insulator Performance”, EPRI, Palo Alto, CA: 1986. EL-4618. [A-18] Naito, K.; Morita, K.; Hasegawa, Y.; Imakoma, T.; “Improvement of the DC voltage insulation
efficiency of suspension insulators under contaminated conditions”, IEEE Transactions on Electrical Insulation, Volume: 23 , Issue: 6, 1988 , Page(s): 1025 - 1032
[A-19] Xingliang Jiang; Jihe Yuan; Zhijin Zhang; Jianlin Hu; Caixin Sun; “Study on AC Artificial-Contaminated Flashover Performance of Various Types of Insulators” IEEE Transactions on Power Delivery, Volume: 22 , Issue: 4, 2007 , Page(s): 2567 – 2574
[A-20] Matsuoka, R.; Ito, S.; Sakanishi, K.; Naito, K.; “Flashover on contaminated insulators with different diameters” IEEE Transactions on Electrical Insulation, Volume: 26 No. 6, Dec 1991, Page(s): 1140 – 1146.
[A-21] Engelbrecht C.S., Gutman I, Hartings R., A Practical Implementation of Statistical Principles to Dimension AC Line Insulators With Respect to Contaminated Conditions IEEE Transactions on Power Delivery, Volume: 22 , Issue: 1 2007 , Page(s): 667 - 673
[A-22] Pigini A. and al. “Performance of insulators for EHVDC systems under polluted conditions” CIGRE Paris Session 1988, Paper 33.22.
[A-23] Looms J.S.T. “Insulators for high voltages”, Book, IET Power and Energy Series 7, 1988. [A-24] Farzaneh M., Chisholm W.A.; “Insulators for icing and polluted environments”, Book, IEEE press series
on Power Engineering, 2009. [A-25] Matsuoka R., Ito S., Tanaka K., Kondo K.; “Contamination withstand voltage characteristics of
polymer insulators”, 10th International Symposium on High Voltage Engineering, ISH ’97, Montreal, Quebec Canada.
[A-26] Xingliang J.; Jihe Y.; Lichun S.; Zhijin Z.; Hu J.; Feng M.; “Comparison of DC Pollution Flashover Performances of Various Types of Porcelain, Glass, and Composite Insulators”, IEEE Transactions on Power Delivery, Volume: 23 , Issue: 2, 2008 , Page(s): 1183 - 1190
[A-27] Kondo K., “Comments on USCD under DC voltage application for DC-fog type insulators. CIGRE C4.303, internal working group document.
[A-28] Seifert J. M.; Petrusch W.; Janssen H.; “A comparison of the pollution performance of long-rod and disc type HVDC insulators” IEEE Transactions on Dielectrics and Electrical Insulation, Volume: 14 , Issue: 1: 2007 , Page(s): 125 – 129.
[A-29] Luo B., Li L., Rao H., Li X., “Study on Pollution Flashover characteristics of ±800 kV DC Composite Insulators”, IEEE PES Power Africa 2007 Conference and Exposition, Johannesburg South Africa, 16-20 July 2007.
[A-30] Matsuoka R., Ito S., Tanaka K., Kondo K.; “Contamination withstand voltage characteristics of polymer insulators”, 10th International Symposium on High Voltage Engineering, ISH ’97, Montreal, Quebec Canada.
[A-31] Åström U., Almgren B., Wu D.: “Outdoor Insulation Design for the Three Gorges-Changzhou ±500 kV HVDC Project”, ICPS2001 Conference, Wuhan, China, Sep. 03 - 05, 2001.
[A-32] Pigini A., Bertolotto P. “Design of External Insulation for UHV DC in Contaminated Environment”, 15th International Symposium on High Voltage Engineering (ISH), Ljubljana, Slovenia, August 27-31, 2007, Paper T4-347.
[A-33] Naito, K.; Kunieda, S.; Hasegawa, Y.; Ito, S.; “DC contamination performance of station insulators”, IEEE Transactions on Electrical Insulation, Volume: 23, Issue: 6, 1988 , Page(s): 1015 – 1023.
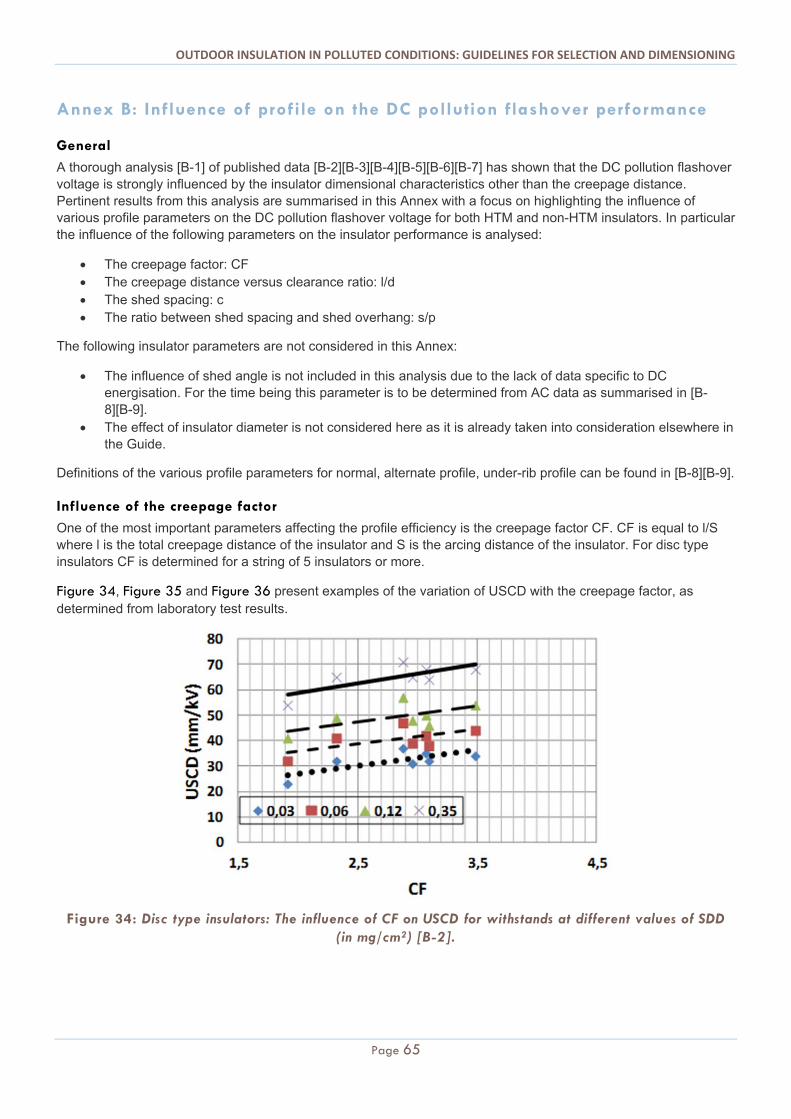
OUTDOOR INSULATION IN POLLUTED CONDITIONS: GUIDELINES FOR SELECTION AND DIMENSIONING
Page 65
Annex B: Influence of profile on the DC pollution flashover performance
General
A thorough analysis [B-1] of published data [B-2][B-3][B-4][B-5][B-6][B-7] has shown that the DC pollution flashover voltage is strongly influenced by the insulator dimensional characteristics other than the creepage distance. Pertinent results from this analysis are summarised in this Annex with a focus on highlighting the influence of various profile parameters on the DC pollution flashover voltage for both HTM and non-HTM insulators. In particular the influence of the following parameters on the insulator performance is analysed:
The creepage factor: CF The creepage distance versus clearance ratio: l/d The shed spacing: c The ratio between shed spacing and shed overhang: s/p
The following insulator parameters are not considered in this Annex:
The influence of shed angle is not included in this analysis due to the lack of data specific to DC energisation. For the time being this parameter is to be determined from AC data as summarised in [B-8][B-9].
The effect of insulator diameter is not considered here as it is already taken into consideration elsewhere in the Guide.
Definitions of the various profile parameters for normal, alternate profile, under-rib profile can be found in [B-8][B-9].
Influence of the creepage factor
One of the most important parameters affecting the profile efficiency is the creepage factor CF. CF is equal to l/S where l is the total creepage distance of the insulator and S is the arcing distance of the insulator. For disc type insulators CF is determined for a string of 5 insulators or more.
Figure 34, Figure 35 and Figure 36 present examples of the variation of USCD with the creepage factor, as determined from laboratory test results.
Figure 34: Disc type insulators: The influence of CF on USCD for withstands at different values of SDD (in mg/cm2) [B-2].
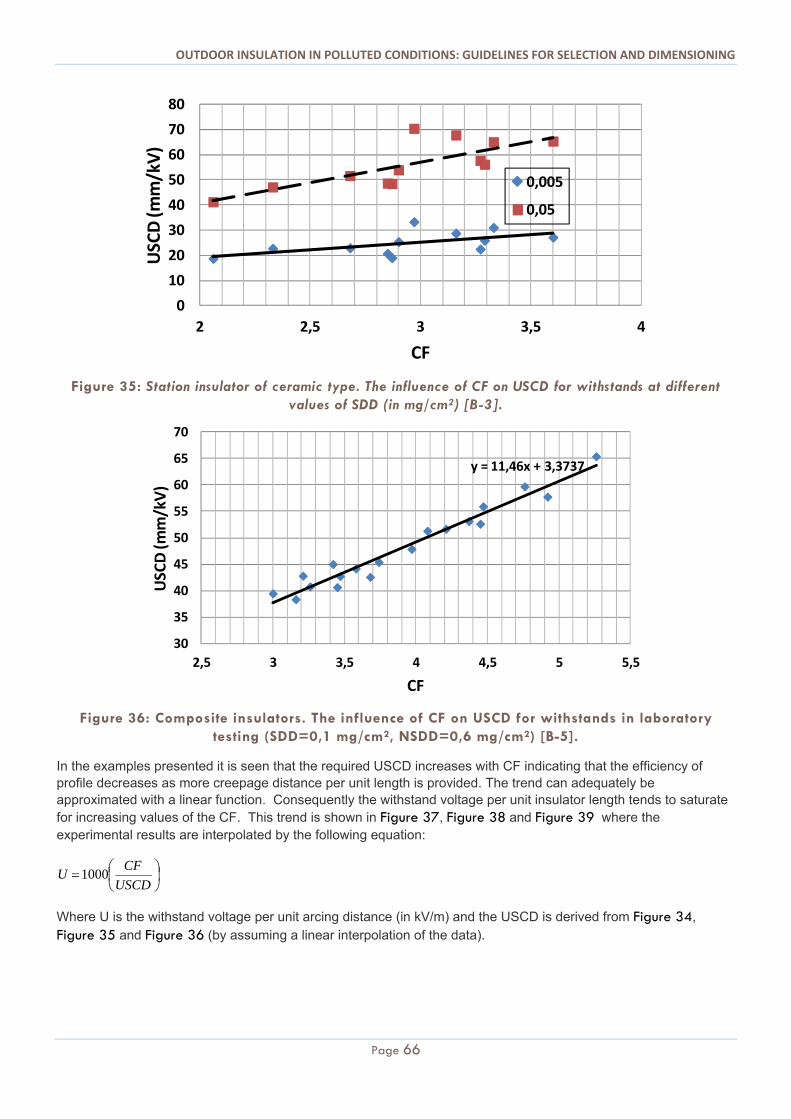
OUTDOOR INSULATION IN POLLUTED CONDITIONS: GUIDELINES FOR SELECTION AND DIMENSIONING
Page 66
Figure 35: Station insulator of ceramic type. The influence of CF on USCD for withstands at different values of SDD (in mg/cm2) [B-3].
Figure 36: Composite insulators. The influence of CF on USCD for withstands in laboratory testing (SDD=0,1 mg/cm2, NSDD=0,6 mg/cm2) [B-5].
In the examples presented it is seen that the required USCD increases with CF indicating that the efficiency of profile decreases as more creepage distance per unit length is provided. The trend can adequately be approximated with a linear function. Consequently the withstand voltage per unit insulator length tends to saturate for increasing values of the CF. This trend is shown in Figure 37, Figure 38 and Figure 39 where the experimental results are interpolated by the following equation:
USCD
CFU 1000
Where U is the withstand voltage per unit arcing distance (in kV/m) and the USCD is derived from Figure 34, Figure 35 and Figure 36 (by assuming a linear interpolation of the data).
0
10
20
30
40
50
60
70
80
2 2,5 3 3,5 4
USCD (m
m/kV)
CF
0,005
0,05
y = 11,46x + 3,3737
30
35
40
45
50
55
60
65
70
2,5 3 3,5 4 4,5 5 5,5
USCD (m
m/kV)
CF
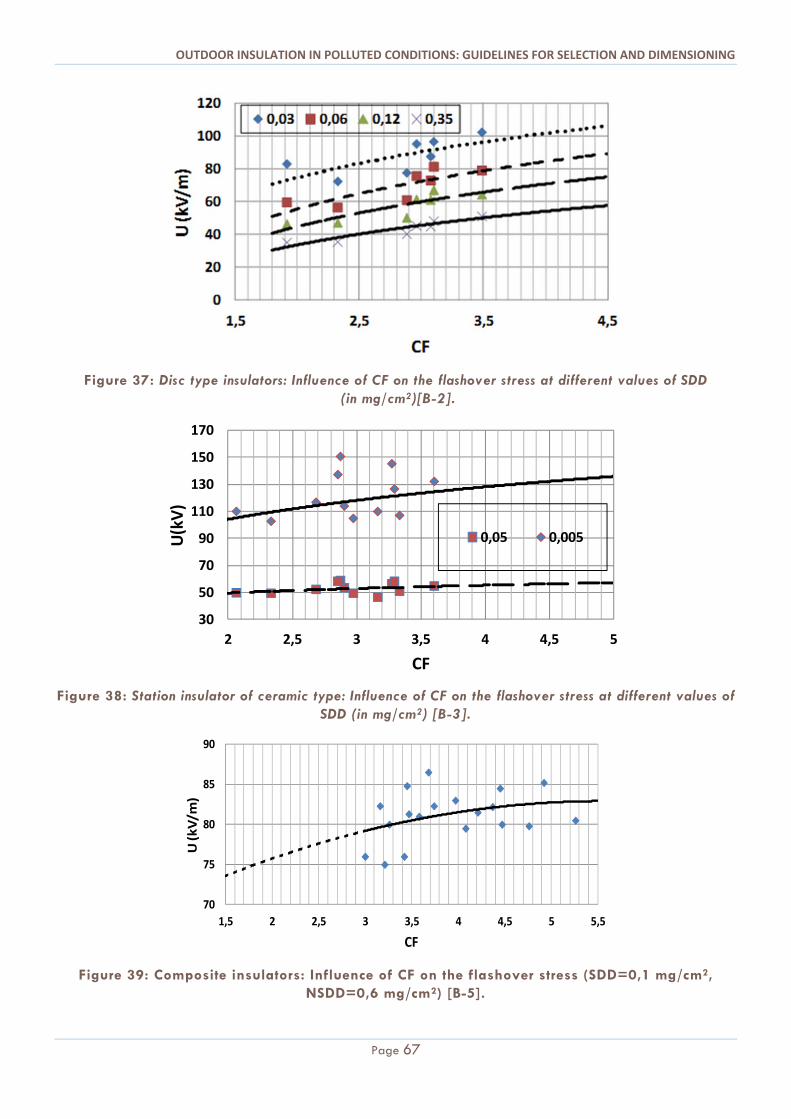
OUTDOOR INSULATION IN POLLUTED CONDITIONS: GUIDELINES FOR SELECTION AND DIMENSIONING
Page 67
Figure 37: Disc type insulators: Influence of CF on the flashover stress at different values of SDD (in mg/cm2)[B-2].
Figure 38: Station insulator of ceramic type: Influence of CF on the flashover stress at different values of SDD (in mg/cm2) [B-3].
Figure 39: Composite insulators: Influence of CF on the flashover stress (SDD=0,1 mg/cm2, NSDD=0,6 mg/cm2) [B-5].
30
50
70
90
110
130
150
170
2 2,5 3 3,5 4 4,5 5
U(kV)
CF
0,05 0,005
70
75
80
85
90
1,5 2 2,5 3 3,5 4 4,5 5 5,5
U (kV/m
)
CF
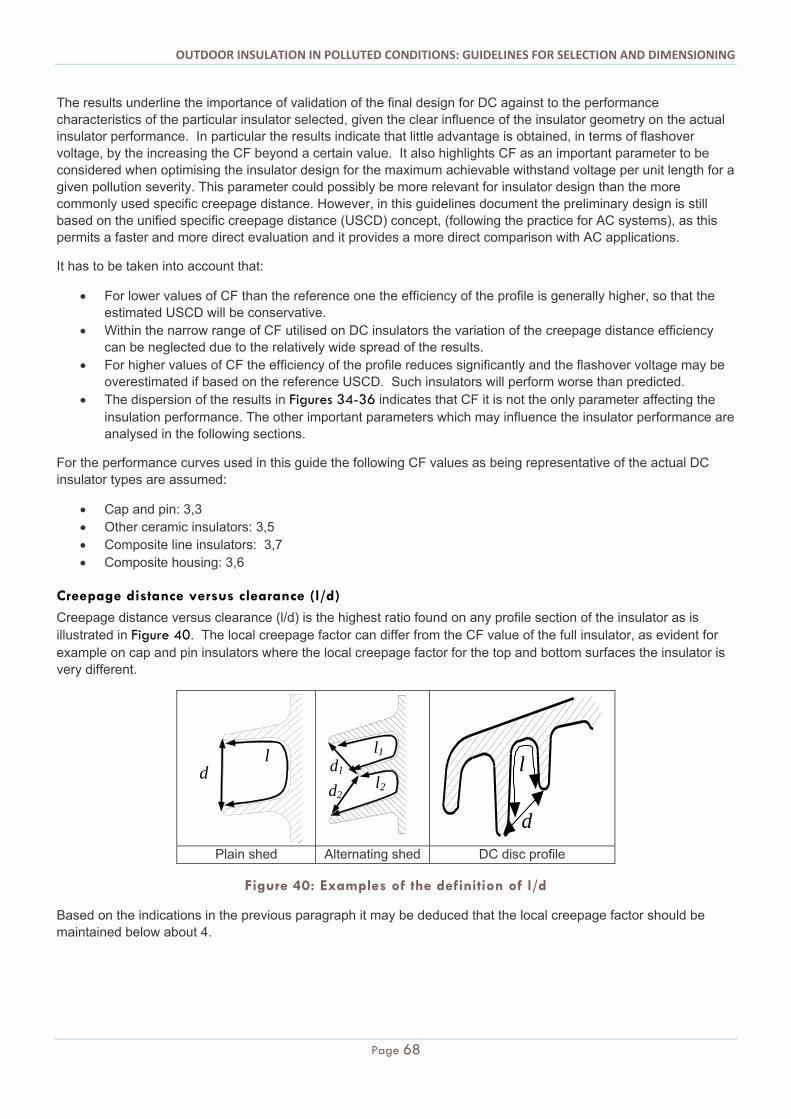
OUTDOOR INSULATION IN POLLUTED CONDITIONS: GUIDELINES FOR SELECTION AND DIMENSIONING
Page 68
The results underline the importance of validation of the final design for DC against to the performance characteristics of the particular insulator selected, given the clear influence of the insulator geometry on the actual insulator performance. In particular the results indicate that little advantage is obtained, in terms of flashover voltage, by the increasing the CF beyond a certain value. It also highlights CF as an important parameter to be considered when optimising the insulator design for the maximum achievable withstand voltage per unit length for a given pollution severity. This parameter could possibly be more relevant for insulator design than the more commonly used specific creepage distance. However, in this guidelines document the preliminary design is still based on the unified specific creepage distance (USCD) concept, (following the practice for AC systems), as this permits a faster and more direct evaluation and it provides a more direct comparison with AC applications.
It has to be taken into account that:
For lower values of CF than the reference one the efficiency of the profile is generally higher, so that the estimated USCD will be conservative.
Within the narrow range of CF utilised on DC insulators the variation of the creepage distance efficiency can be neglected due to the relatively wide spread of the results.
For higher values of CF the efficiency of the profile reduces significantly and the flashover voltage may be overestimated if based on the reference USCD. Such insulators will perform worse than predicted.
The dispersion of the results in Figures 34-36 indicates that CF it is not the only parameter affecting the insulation performance. The other important parameters which may influence the insulator performance are analysed in the following sections.
For the performance curves used in this guide the following CF values as being representative of the actual DC insulator types are assumed:
Cap and pin: 3,3 Other ceramic insulators: 3,5 Composite line insulators: 3,7 Composite housing: 3,6
Creepage distance versus clearance (l/d)
Creepage distance versus clearance (l/d) is the highest ratio found on any profile section of the insulator as is illustrated in Figure 40. The local creepage factor can differ from the CF value of the full insulator, as evident for example on cap and pin insulators where the local creepage factor for the top and bottom surfaces the insulator is very different.
d l
l1 d1
l2 d2
l
d
Plain shed Alternating shed DC disc profile
Figure 40: Examples of the definition of l/d
Based on the indications in the previous paragraph it may be deduced that the local creepage factor should be maintained below about 4.
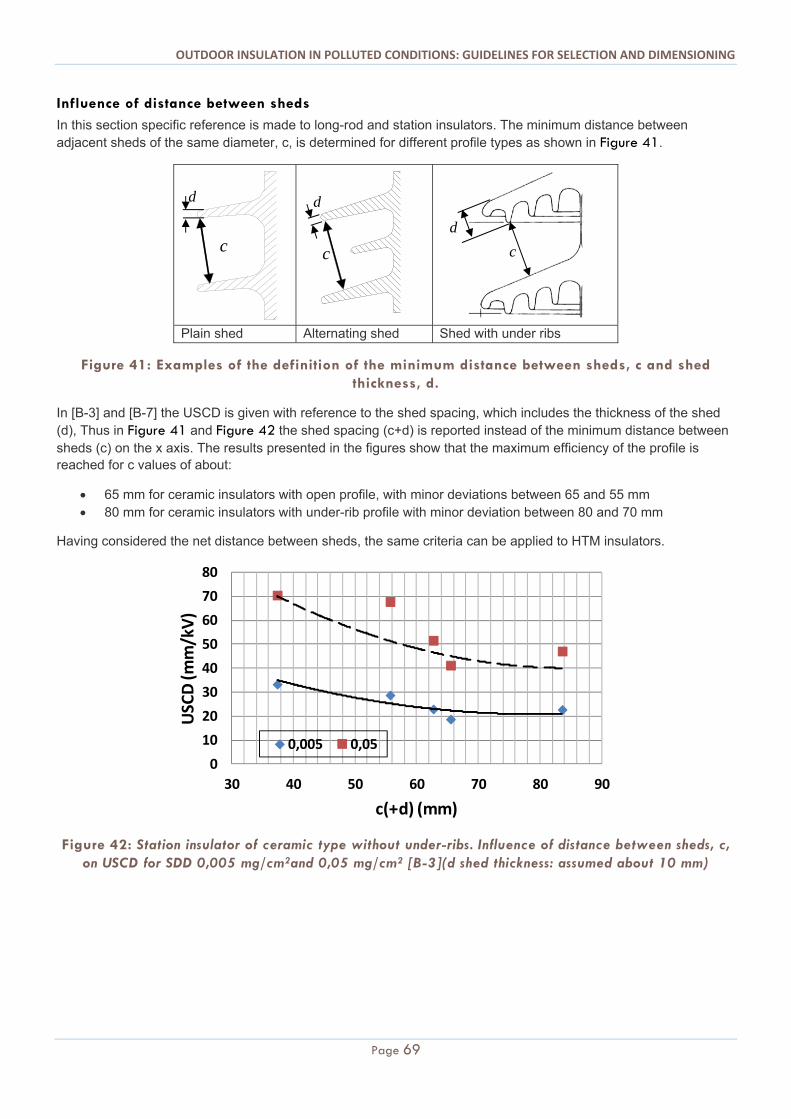
OUTDOOR INSULATION IN POLLUTED CONDITIONS: GUIDELINES FOR SELECTION AND DIMENSIONING
Page 69
Influence of distance between sheds
In this section specific reference is made to long-rod and station insulators. The minimum distance between adjacent sheds of the same diameter, c, is determined for different profile types as shown in Figure 41.
c
c
Plain shed Alternating shed Shed with under ribs
Figure 41: Examples of the definition of the minimum distance between sheds, c and shed thickness, d.
In [B-3] and [B-7] the USCD is given with reference to the shed spacing, which includes the thickness of the shed (d), Thus in Figure 41 and Figure 42 the shed spacing (c+d) is reported instead of the minimum distance between sheds (c) on the x axis. The results presented in the figures show that the maximum efficiency of the profile is reached for c values of about:
65 mm for ceramic insulators with open profile, with minor deviations between 65 and 55 mm 80 mm for ceramic insulators with under-rib profile with minor deviation between 80 and 70 mm
Having considered the net distance between sheds, the same criteria can be applied to HTM insulators.
Figure 42: Station insulator of ceramic type without under-ribs. Influence of distance between sheds, c, on USCD for SDD 0,005 mg/cm2and 0,05 mg/cm2 [B-3](d shed thickness: assumed about 10 mm)
0
10
20
30
40
50
60
70
80
30 40 50 60 70 80 90
USCD (m
m/kV)
c(+d) (mm)
0,005 0,05
c
d d
d
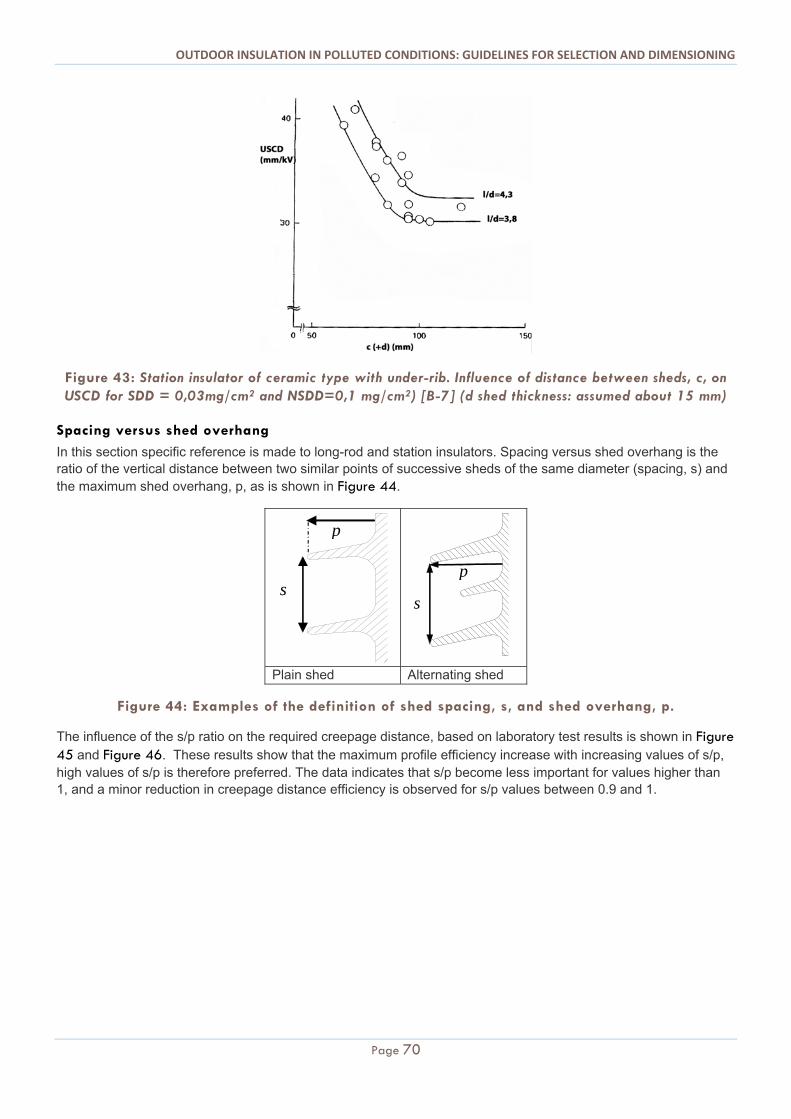
OUTDOOR INSULATION IN POLLUTED CONDITIONS: GUIDELINES FOR SELECTION AND DIMENSIONING
Page 70
Figure 43: Station insulator of ceramic type with under-rib. Influence of distance between sheds, c, on USCD for SDD = 0,03mg/cm2 and NSDD=0,1 mg/cm2) [B-7] (d shed thickness: assumed about 15 mm)
Spacing versus shed overhang
In this section specific reference is made to long-rod and station insulators. Spacing versus shed overhang is the ratio of the vertical distance between two similar points of successive sheds of the same diameter (spacing, s) and the maximum shed overhang, p, as is shown in Figure 44.
s
p
s
p
Plain shed Alternating shed
Figure 44: Examples of the definition of shed spacing, s, and shed overhang, p.
The influence of the s/p ratio on the required creepage distance, based on laboratory test results is shown in Figure 45 and Figure 46. These results show that the maximum profile efficiency increase with increasing values of s/p, high values of s/p is therefore preferred. The data indicates that s/p become less important for values higher than 1, and a minor reduction in creepage distance efficiency is observed for s/p values between 0.9 and 1.
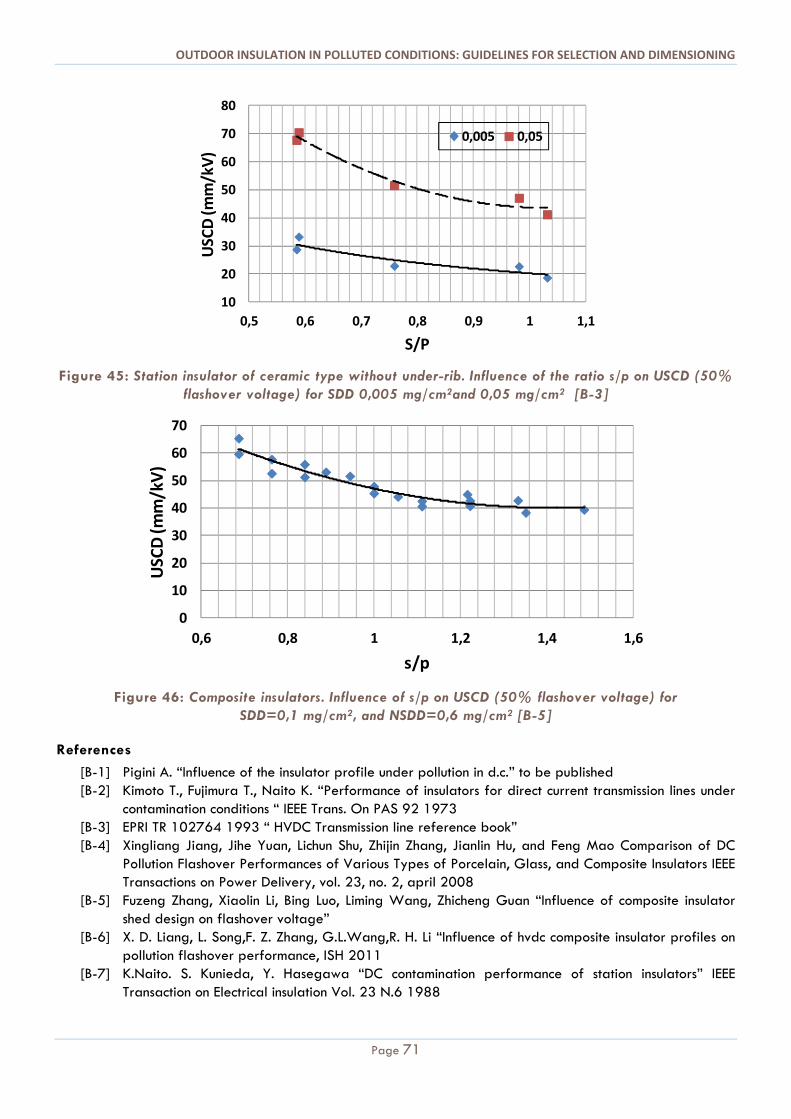
OUTDOOR INSULATION IN POLLUTED CONDITIONS: GUIDELINES FOR SELECTION AND DIMENSIONING
Page 71
Figure 45: Station insulator of ceramic type without under-rib. Influence of the ratio s/p on USCD (50% flashover voltage) for SDD 0,005 mg/cm2and 0,05 mg/cm2 [B-3]
Figure 46: Composite insulators. Influence of s/p on USCD (50% flashover voltage) for SDD=0,1 mg/cm2, and NSDD=0,6 mg/cm2 [B-5]
References
[B-1] Pigini A. “Influence of the insulator profile under pollution in d.c.” to be published [B-2] Kimoto T., Fujimura T., Naito K. “Performance of insulators for direct current transmission lines under
contamination conditions “ IEEE Trans. On PAS 92 1973 [B-3] EPRI TR 102764 1993 “ HVDC Transmission line reference book” [B-4] Xingliang Jiang, Jihe Yuan, Lichun Shu, Zhijin Zhang, Jianlin Hu, and Feng Mao Comparison of DC
Pollution Flashover Performances of Various Types of Porcelain, Glass, and Composite Insulators IEEE Transactions on Power Delivery, vol. 23, no. 2, april 2008
[B-5] Fuzeng Zhang, Xiaolin Li, Bing Luo, Liming Wang, Zhicheng Guan “Influence of composite insulator shed design on flashover voltage”
[B-6] X. D. Liang, L. Song,F. Z. Zhang, G.L.Wang,R. H. Li “Influence of hvdc composite insulator profiles on pollution flashover performance, ISH 2011
[B-7] K.Naito. S. Kunieda, Y. Hasegawa “DC contamination performance of station insulators” IEEE Transaction on Electrical insulation Vol. 23 N.6 1988
10
20
30
40
50
60
70
80
0,5 0,6 0,7 0,8 0,9 1 1,1
USCD (m
m/kV)
S/P
0,005 0,05
0
10
20
30
40
50
60
70
0,6 0,8 1 1,2 1,4 1,6
USCD (m
m/kV)
s/p
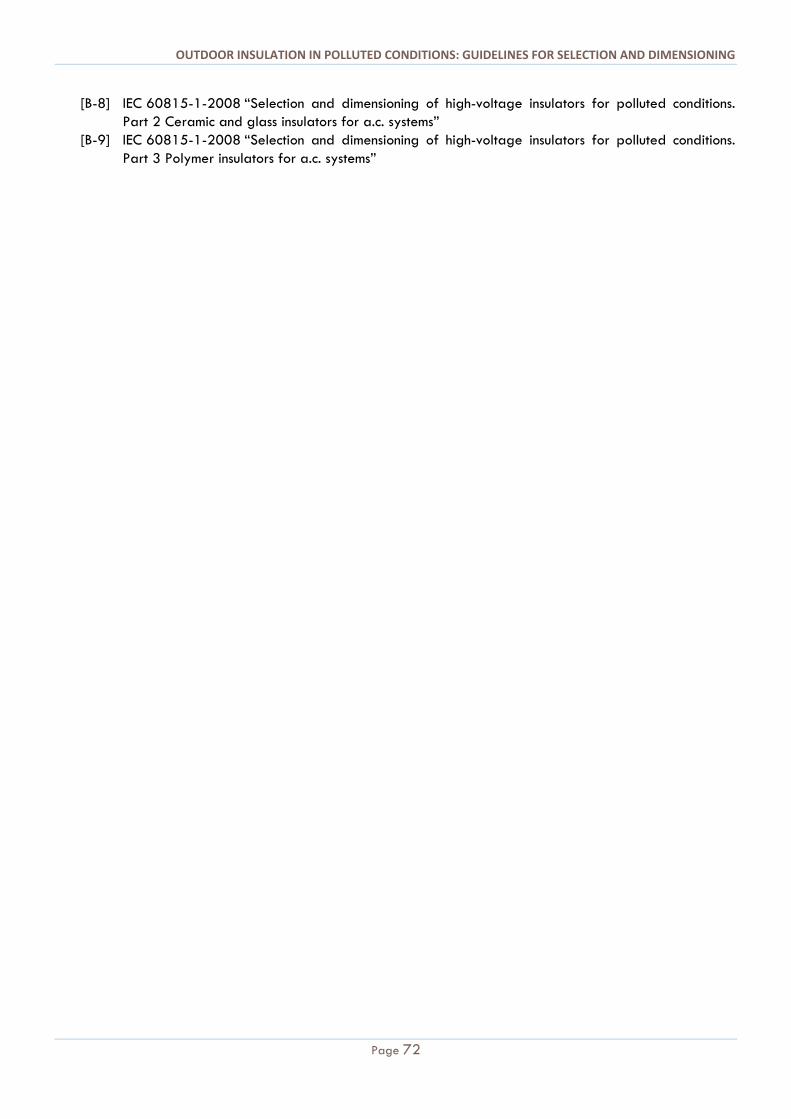
OUTDOOR INSULATION IN POLLUTED CONDITIONS: GUIDELINES FOR SELECTION AND DIMENSIONING
Page 72
[B-8] IEC 60815-1-2008 “Selection and dimensioning of high-voltage insulators for polluted conditions. Part 2 Ceramic and glass insulators for a.c. systems”
[B-9] IEC 60815-1-2008 “Selection and dimensioning of high-voltage insulators for polluted conditions. Part 3 Polymer insulators for a.c. systems”
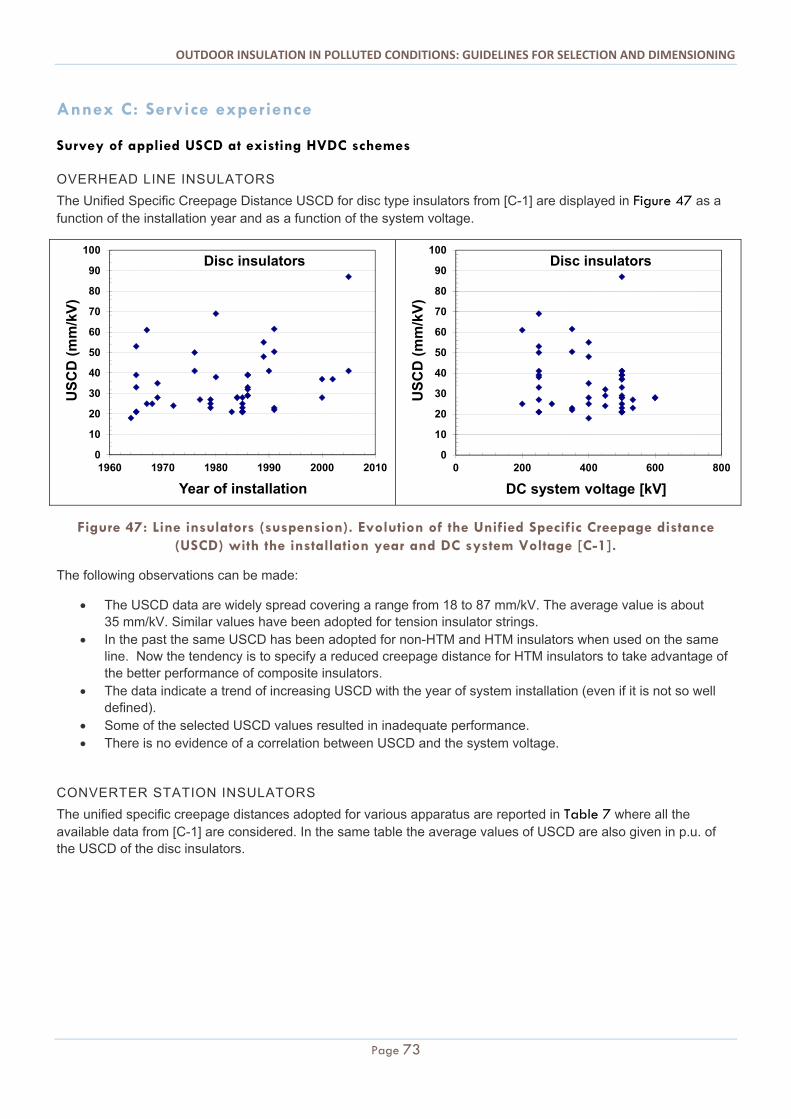
OUTDOOR INSULATION IN POLLUTED CONDITIONS: GUIDELINES FOR SELECTION AND DIMENSIONING
Page 73
Annex C: Service experience
Survey of applied USCD at existing HVDC schemes
OVERHEAD LINE INSULATORS
The Unified Specific Creepage Distance USCD for disc type insulators from [C-1] are displayed in Figure 47 as a function of the installation year and as a function of the system voltage.
Figure 47: Line insulators (suspension). Evolution of the Unified Specific Creepage distance (USCD) with the installation year and DC system Voltage [C-1].
The following observations can be made:
The USCD data are widely spread covering a range from 18 to 87 mm/kV. The average value is about 35 mm/kV. Similar values have been adopted for tension insulator strings.
In the past the same USCD has been adopted for non-HTM and HTM insulators when used on the same line. Now the tendency is to specify a reduced creepage distance for HTM insulators to take advantage of the better performance of composite insulators.
The data indicate a trend of increasing USCD with the year of system installation (even if it is not so well defined).
Some of the selected USCD values resulted in inadequate performance. There is no evidence of a correlation between USCD and the system voltage.
CONVERTER STATION INSULATORS
The unified specific creepage distances adopted for various apparatus are reported in Table 7 where all the available data from [C-1] are considered. In the same table the average values of USCD are also given in p.u. of the USCD of the disc insulators.
0
10
20
30
40
50
60
70
80
90
100
1960 1970 1980 1990 2000 2010
US
CD
(m
m/k
V)
Year of installation
Disc insulators
0
10
20
30
40
50
60
70
80
90
100
0 200 400 600 800
US
CD
(m
m/k
V)
DC system voltage [kV]
Disc insulators
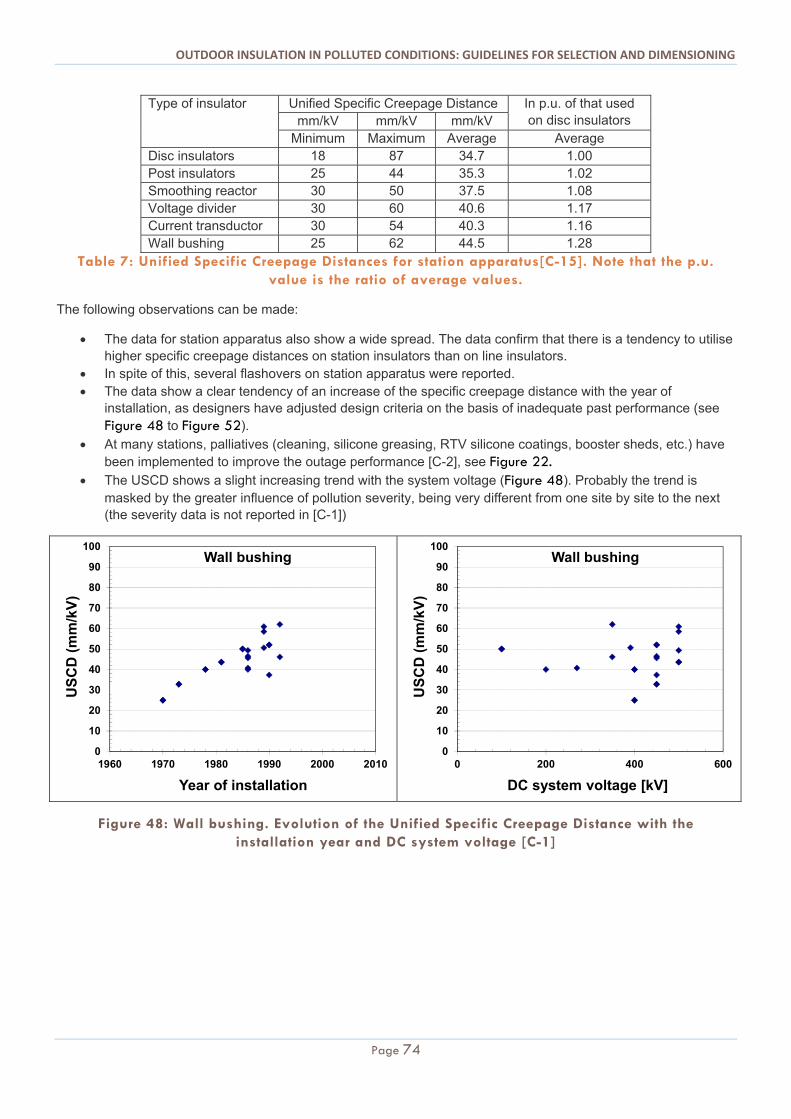
OUTDOOR INSULATION IN POLLUTED CONDITIONS: GUIDELINES FOR SELECTION AND DIMENSIONING
Page 74
Type of insulator Unified Specific Creepage Distance In p.u. of that used on disc insulators mm/kV mm/kV mm/kV
Minimum Maximum Average Average Disc insulators 18 87 34.7 1.00 Post insulators 25 44 35.3 1.02 Smoothing reactor 30 50 37.5 1.08 Voltage divider 30 60 40.6 1.17 Current transductor 30 54 40.3 1.16 Wall bushing 25 62 44.5 1.28
Table 7: Unified Specific Creepage Distances for station apparatus[C-15]. Note that the p.u. value is the ratio of average values.
The following observations can be made:
The data for station apparatus also show a wide spread. The data confirm that there is a tendency to utilise higher specific creepage distances on station insulators than on line insulators.
In spite of this, several flashovers on station apparatus were reported. The data show a clear tendency of an increase of the specific creepage distance with the year of
installation, as designers have adjusted design criteria on the basis of inadequate past performance (see Figure 48 to Figure 52).
At many stations, palliatives (cleaning, silicone greasing, RTV silicone coatings, booster sheds, etc.) have been implemented to improve the outage performance [C-2], see Figure 22.
The USCD shows a slight increasing trend with the system voltage (Figure 48). Probably the trend is masked by the greater influence of pollution severity, being very different from one site by site to the next (the severity data is not reported in [C-1])
Figure 48: Wall bushing. Evolution of the Unified Specific Creepage Distance with the installation year and DC system voltage [C-1]
0
10
20
30
40
50
60
70
80
90
100
1960 1970 1980 1990 2000 2010
US
CD
(m
m/k
V)
Year of installation
Wall bushing
0
10
20
30
40
50
60
70
80
90
100
0 200 400 600
US
CD
(m
m/k
V)
DC system voltage [kV]
Wall bushing
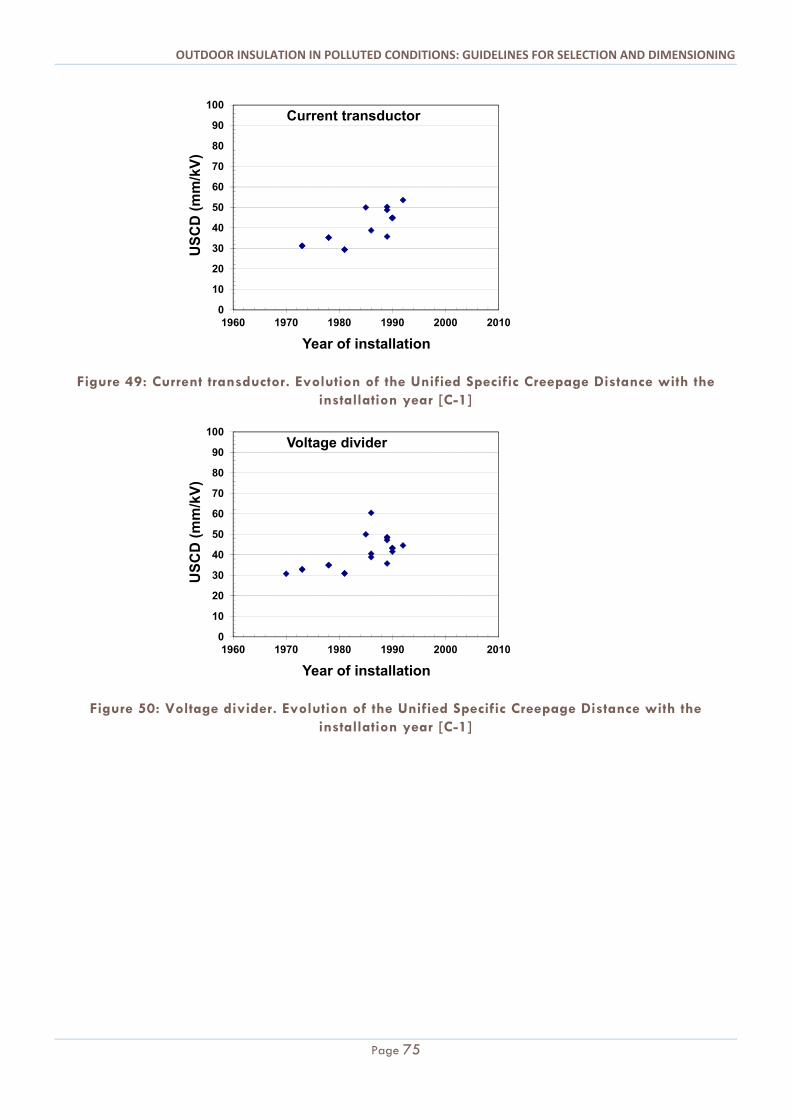
OUTDOOR INSULATION IN POLLUTED CONDITIONS: GUIDELINES FOR SELECTION AND DIMENSIONING
Page 75
Figure 49: Current transductor. Evolution of the Unified Specific Creepage Distance with the installation year [C-1]
Figure 50: Voltage divider. Evolution of the Unified Specific Creepage Distance with the installation year [C-1]
0
10
20
30
40
50
60
70
80
90
100
1960 1970 1980 1990 2000 2010
US
CD
(m
m/k
V)
Year of installation
Current transductor
0
10
20
30
40
50
60
70
80
90
100
1960 1970 1980 1990 2000 2010
US
CD
(m
m/k
V)
Year of installation
Voltage divider
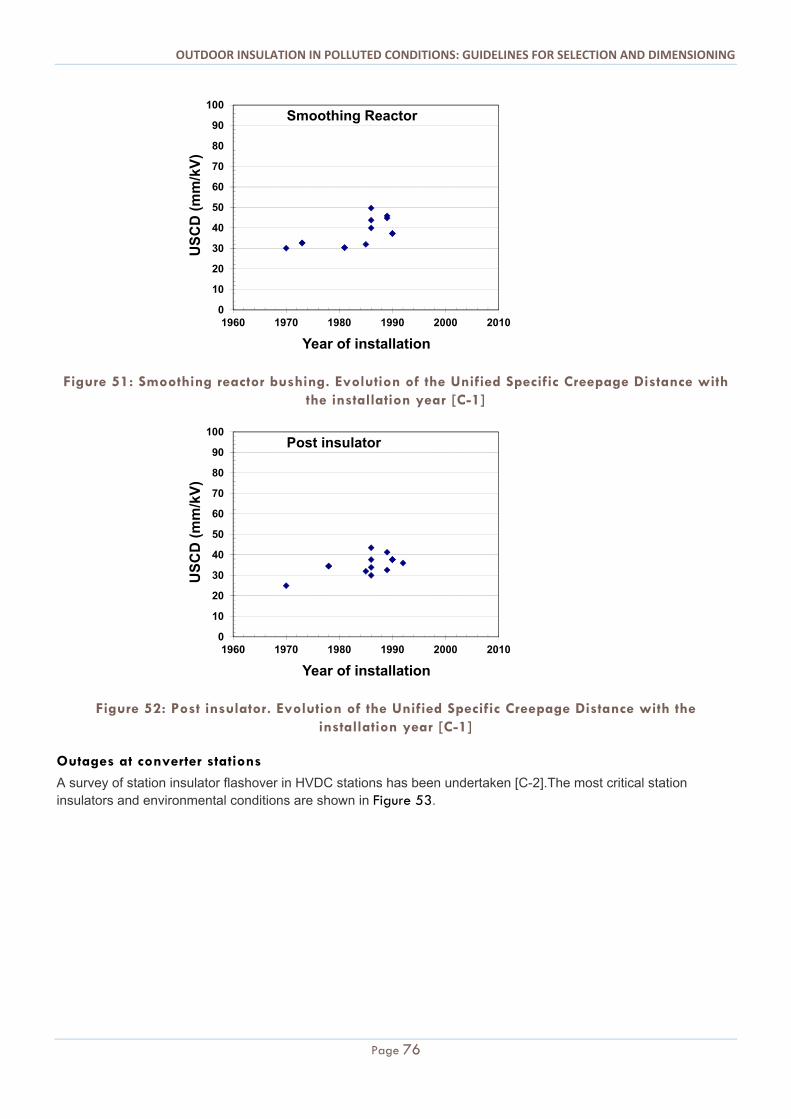
OUTDOOR INSULATION IN POLLUTED CONDITIONS: GUIDELINES FOR SELECTION AND DIMENSIONING
Page 76
Figure 51: Smoothing reactor bushing. Evolution of the Unified Specific Creepage Distance with the installation year [C-1]
Figure 52: Post insulator. Evolution of the Unified Specific Creepage Distance with the installation year [C-1]
Outages at converter stations
A survey of station insulator flashover in HVDC stations has been undertaken [C-2].The most critical station insulators and environmental conditions are shown in Figure 53.
0
10
20
30
40
50
60
70
80
90
100
1960 1970 1980 1990 2000 2010
US
CD
(m
m/k
V)
Year of installation
Smoothing Reactor
0
10
20
30
40
50
60
70
80
90
100
1960 1970 1980 1990 2000 2010
US
CD
(m
m/k
V)
Year of installation
Post insulator
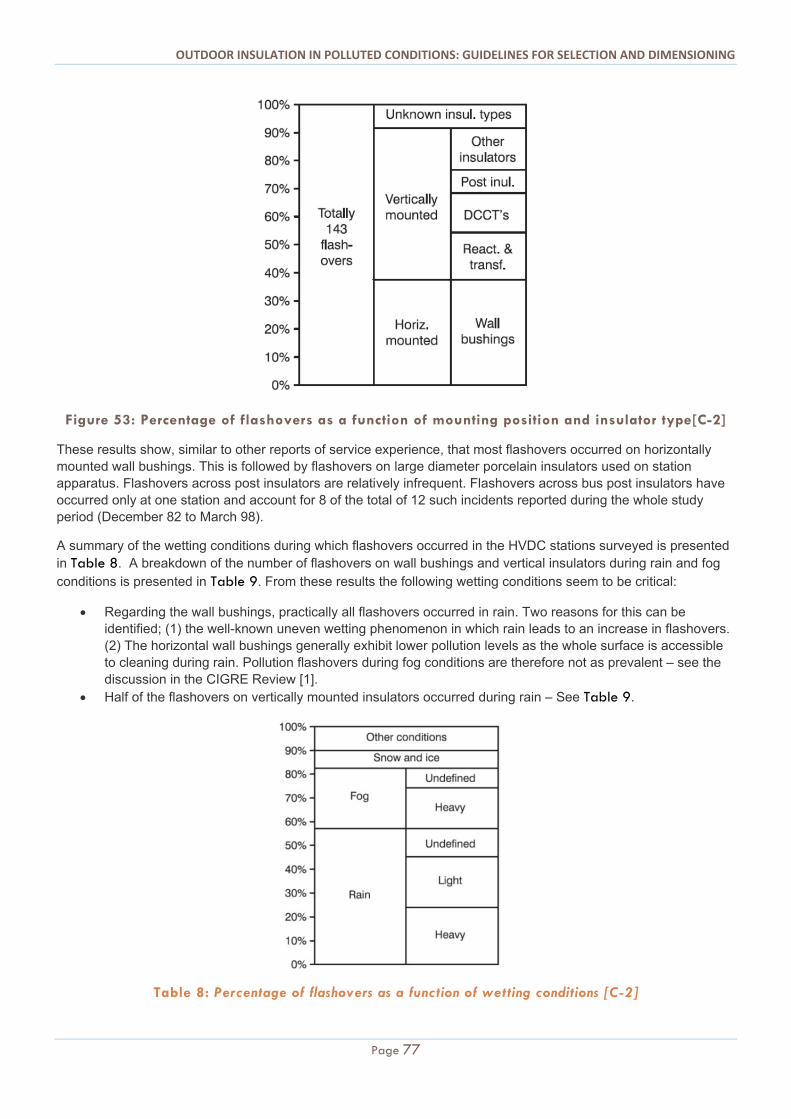
OUTDOOR INSULATION IN POLLUTED CONDITIONS: GUIDELINES FOR SELECTION AND DIMENSIONING
Page 77
Figure 53: Percentage of flashovers as a function of mounting position and insulator type[C-2]
These results show, similar to other reports of service experience, that most flashovers occurred on horizontally mounted wall bushings. This is followed by flashovers on large diameter porcelain insulators used on station apparatus. Flashovers across post insulators are relatively infrequent. Flashovers across bus post insulators have occurred only at one station and account for 8 of the total of 12 such incidents reported during the whole study period (December 82 to March 98).
A summary of the wetting conditions during which flashovers occurred in the HVDC stations surveyed is presented in Table 8. A breakdown of the number of flashovers on wall bushings and vertical insulators during rain and fog conditions is presented in Table 9. From these results the following wetting conditions seem to be critical:
Regarding the wall bushings, practically all flashovers occurred in rain. Two reasons for this can be identified; (1) the well-known uneven wetting phenomenon in which rain leads to an increase in flashovers. (2) The horizontal wall bushings generally exhibit lower pollution levels as the whole surface is accessible to cleaning during rain. Pollution flashovers during fog conditions are therefore not as prevalent – see the discussion in the CIGRE Review [1].
Half of the flashovers on vertically mounted insulators occurred during rain – See Table 9.
Table 8: Percentage of flashovers as a function of wetting conditions [C-2]
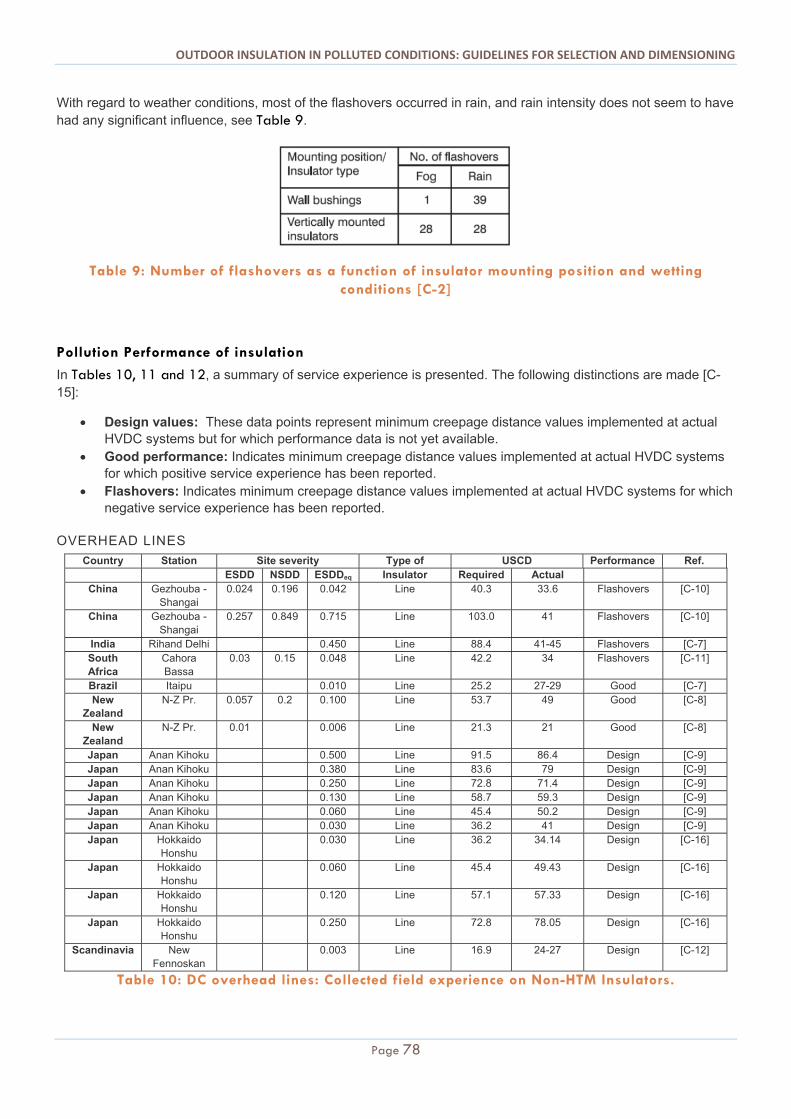
OUTDOOR INSULATION IN POLLUTED CONDITIONS: GUIDELINES FOR SELECTION AND DIMENSIONING
Page 78
With regard to weather conditions, most of the flashovers occurred in rain, and rain intensity does not seem to have had any significant influence, see Table 9.
Table 9: Number of flashovers as a function of insulator mounting position and wetting conditions [C-2]
Pollution Performance of insulation
In Tables 10, 11 and 12, a summary of service experience is presented. The following distinctions are made [C-15]:
Design values: These data points represent minimum creepage distance values implemented at actual HVDC systems but for which performance data is not yet available.
Good performance: Indicates minimum creepage distance values implemented at actual HVDC systems for which positive service experience has been reported.
Flashovers: Indicates minimum creepage distance values implemented at actual HVDC systems for which negative service experience has been reported.
OVERHEAD LINES
Country Station Site severity Type of USCD Performance Ref. ESDD NSDD ESDDeq Insulator Required Actual
China Gezhouba -Shangai
0.024 0.196 0.042 Line 40.3 33.6 Flashovers [C-10]
China Gezhouba -Shangai
0.257 0.849 0.715 Line 103.0 41 Flashovers [C-10]
India Rihand Delhi 0.450 Line 88.4 41-45 Flashovers [C-7] South Africa
Cahora Bassa
0.03 0.15 0.048 Line 42.2 34 Flashovers [C-11]
Brazil Itaipu 0.010 Line 25.2 27-29 Good [C-7] New
Zealand N-Z Pr. 0.057 0.2 0.100 Line 53.7 49 Good [C-8]
New Zealand
N-Z Pr. 0.01 0.006 Line 21.3 21 Good [C-8]
Japan Anan Kihoku 0.500 Line 91.5 86.4 Design [C-9] Japan Anan Kihoku 0.380 Line 83.6 79 Design [C-9] Japan Anan Kihoku 0.250 Line 72.8 71.4 Design [C-9] Japan Anan Kihoku 0.130 Line 58.7 59.3 Design [C-9] Japan Anan Kihoku 0.060 Line 45.4 50.2 Design [C-9] Japan Anan Kihoku 0.030 Line 36.2 41 Design [C-9] Japan Hokkaido
Honshu 0.030 Line 36.2 34.14 Design [C-16]
Japan Hokkaido Honshu
0.060 Line 45.4 49.43 Design [C-16]
Japan Hokkaido Honshu
0.120 Line 57.1 57.33 Design [C-16]
Japan Hokkaido Honshu
0.250 Line 72.8 78.05 Design [C-16]
Scandinavia New Fennoskan
0.003 Line 16.9 24-27 Design [C-12]
Table 10: DC overhead lines: Collected field experience on Non-HTM Insulators.

OUTDOOR INSULATION IN POLLUTED CONDITIONS: GUIDELINES FOR SELECTION AND DIMENSIONING
Page 79
CONVERTER STATIONS
Country Station Site severity Type of Required USCD Actual USCD
Performance Ref.
ESDD NSDD ESDDeq Insulator 200 mm diameter
450 mm diameter
China Longquam 0.04 0.2 0.05 Apparatus 42.8 50.1 54-61 Design [C-5] China Zengping 0.08 0.4 0.13 Apparatus 57.9 67.8 65-84 Design [C-5] China Xiangjiaba-
Shanghai 0.064 0.32 0.093 Support/Apparatus 52.5 61.5 54-60 Design
China Gezhouba 0.054 0.27 0.074 Support 48.8 57.1 57 Good [C-4] China Nanqiao 0.106 0.53 0.181 Support 65.4 76.6 57 Flashovers [C-4] India Dari 0.04 0.5 0.067 Support 47.1 55.2 50 Flashovers [C-4] Brazil Itaipu 0.008 0.2 0.01 Support 25.2 29.5 27 Flashover [C-7] New-
Zealand Haywards 0.2 Cable termination 67.6 86.2 50 Flashovers [C-8]
Table 11: DC stations: Collected field experience.
HTM INSULATORS
Country Station Site severity Type of USCD Performance Ref. ESDD NSDD ESDDeq Insulator Required Actual
China 800 kV 0.05 0.3 0.112 37.6 45 Design [C-13] China 800 kV 0.08 0.48 0.218 44.4 45 Design [C-13] China 800 kV 0.15 0.9 0.533 55.5 50 Design [C-13] USA Pacific
Intertie 0.026 0.3 0.058 31.9 32 Good [C-17]
South Africa
Cahora Bassa
0.03 0.15 0.05 30.7 30 Good [C-17]
New Zealand
Transpower 0.01 20.6 18 Good [C-14]
New Zealand
Transpower 0.15 0.15 40.5 48 Good (with
deterioration)
[C-14]
USA LADWP 0.04 0.2 0.075 34.0 26 Good [C-14]
Table 12: DC overhead lines: Collected field experience on HTM Insulators.
References
[C-1] “Insulation of HVDC converter stations. Committee report by WG 12 of the Substation Committee” IEEE Transactions on Power delivery, Vol. 14, N. 2, April 1999
[C-2] Almgren, B.; Åström, U.; Dong Wu; A survey of the flashover performance of HVDC converter station insulators Proceedings of the 1998 International Conference on Power System Technology, 1998. POWERCON '98, Beijing , China, 18-21 Aug 1998, page(s): 516 - 519 vol.1
[C-3] Bengt Almgren, Urban Åström, Dong Wu “A survey of the flashover performance of HVDC converter station insulators Powconference”
[C-4] Bengt Almgren, Urban Åström,Dong Wu “Operating experiences of insulators in HVDC converter stations”Presented at NPSC Conference, Bangalore,India, December 20-22, 2000
[C-5] Urban Åström, Bengt Almgren and Dong Wu “Outdoor Insulation Design for the Three Gorges-Changzhou ±500 kV HVDC Project”
[C-6] D. Wu*, U. Åström1, Z.Y. Su, and W.M. Ma “The Design and Operational Experience of an Indoor DC yard for ±500 kV HVDC Transmission ISH 2007
[C-7] EPRI Project 1013857 “Advanced HVDC Systems at ±800 kV and above” 2006 [C-8] Gleadow J, Heyman O and Burtnyk V, “External Insulation Requirements For the New Zealand DC
Project” CIGRE International Colloquium on Insulation, Wellington, New Zealand, September 29 – October 4 1993.
[C-9] Y. Yamamoto, K.Kawabata, Y. Maekawa”Design of the Anan- Kihoku DC Trunk line” CIGRE SC 22, 1997 Sendai meeting
OUTDOOR INSULATION IN POLLUTED CONDITIONS: GUIDELINES FOR SELECTION AND DIMENSIONING
Page 80
[C-10] K. Kondo, S. Ito, S. Kondo and T. Imakoma “Investigation Results of Suspension Insulators Removed from DC 500kV GEZHOUBA-SHANGHAI Line in China” NGK Review 2001
[C-11] FF Bologna, AC Britten, RE Kohlmeyer HF Vosloo “Investigation into the Cause of “Unknown” Line Faults On a ±533 kV DC Line in South Africa” CIGRE WG C40303 06 33 IWD
[C-12] Gutman, L. Carlshem and T. Kiiveri: Statistical approach for the insulation dimensioning of the 500 kV HVDC line in Scandinavia ISH 2007
[C-13] Zhiyi Su, Yu Yin, Jun Zhou, Haifeng Gao, Tao DengXidong Liang, Senior Member, IEEE, and Jiafu Wang “Reliability of Composite Insulators Used For UHV AC/DC Transmission Lines” International Conference on UHV Transmission Beijing 2009
[C-14] CIGRE WG 22.03 “Service performance of composite insulators used on HVDC lines” Electra 161-1995
[C-15] Pigini A., Garcia R.W. “Considerações sobre projeto de isoladores atcc para ambiente poluído” XXI SNPTEE 2011
[C-16] T. Kawamura, T. Seta, S.Minemura, K. Naito " Rationalized antipollution designs of DC transmission lines and stations" CIGRE General session 1986 paper 33-03.
[C-17] Seifert J. Private communication.
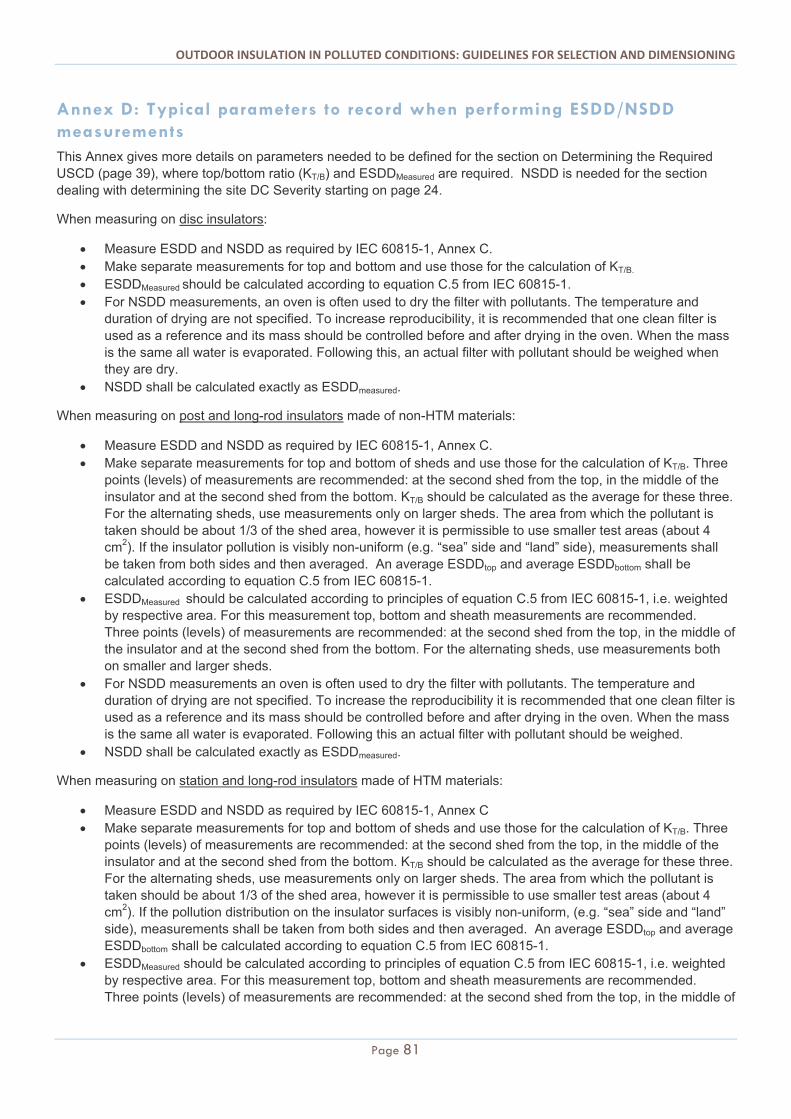
OUTDOOR INSULATION IN POLLUTED CONDITIONS: GUIDELINES FOR SELECTION AND DIMENSIONING
Page 81
Annex D: Typical parameters to record when performing ESDD/NSDD measurements This Annex gives more details on parameters needed to be defined for the section on Determining the Required USCD (page 39), where top/bottom ratio (KT/B) and ESDDMeasured are required. NSDD is needed for the section dealing with determining the site DC Severity starting on page 24.
When measuring on disc insulators:
Measure ESDD and NSDD as required by IEC 60815-1, Annex C. Make separate measurements for top and bottom and use those for the calculation of KT/B. ESDDMeasured should be calculated according to equation C.5 from IEC 60815-1. For NSDD measurements, an oven is often used to dry the filter with pollutants. The temperature and
duration of drying are not specified. To increase reproducibility, it is recommended that one clean filter is used as a reference and its mass should be controlled before and after drying in the oven. When the mass is the same all water is evaporated. Following this, an actual filter with pollutant should be weighed when they are dry.
NSDD shall be calculated exactly as ESDDmeasured.
When measuring on post and long-rod insulators made of non-HTM materials:
Measure ESDD and NSDD as required by IEC 60815-1, Annex C. Make separate measurements for top and bottom of sheds and use those for the calculation of KT/B. Three
points (levels) of measurements are recommended: at the second shed from the top, in the middle of the insulator and at the second shed from the bottom. KT/B should be calculated as the average for these three. For the alternating sheds, use measurements only on larger sheds. The area from which the pollutant is taken should be about 1/3 of the shed area, however it is permissible to use smaller test areas (about 4 cm2). If the insulator pollution is visibly non-uniform (e.g. “sea” side and “land” side), measurements shall be taken from both sides and then averaged. An average ESDDtop and average ESDDbottom shall be calculated according to equation C.5 from IEC 60815-1.
ESDDMeasured should be calculated according to principles of equation C.5 from IEC 60815-1, i.e. weighted by respective area. For this measurement top, bottom and sheath measurements are recommended. Three points (levels) of measurements are recommended: at the second shed from the top, in the middle of the insulator and at the second shed from the bottom. For the alternating sheds, use measurements both on smaller and larger sheds.
For NSDD measurements an oven is often used to dry the filter with pollutants. The temperature and duration of drying are not specified. To increase the reproducibility it is recommended that one clean filter is used as a reference and its mass should be controlled before and after drying in the oven. When the mass is the same all water is evaporated. Following this an actual filter with pollutant should be weighed.
NSDD shall be calculated exactly as ESDDmeasured.
When measuring on station and long-rod insulators made of HTM materials:
Measure ESDD and NSDD as required by IEC 60815-1, Annex C Make separate measurements for top and bottom of sheds and use those for the calculation of KT/B. Three
points (levels) of measurements are recommended: at the second shed from the top, in the middle of the insulator and at the second shed from the bottom. KT/B should be calculated as the average for these three. For the alternating sheds, use measurements only on larger sheds. The area from which the pollutant is taken should be about 1/3 of the shed area, however it is permissible to use smaller test areas (about 4 cm2). If the pollution distribution on the insulator surfaces is visibly non-uniform, (e.g. “sea” side and “land” side), measurements shall be taken from both sides and then averaged. An average ESDDtop and average ESDDbottom shall be calculated according to equation C.5 from IEC 60815-1.
ESDDMeasured should be calculated according to principles of equation C.5 from IEC 60815-1, i.e. weighted by respective area. For this measurement top, bottom and sheath measurements are recommended. Three points (levels) of measurements are recommended: at the second shed from the top, in the middle of
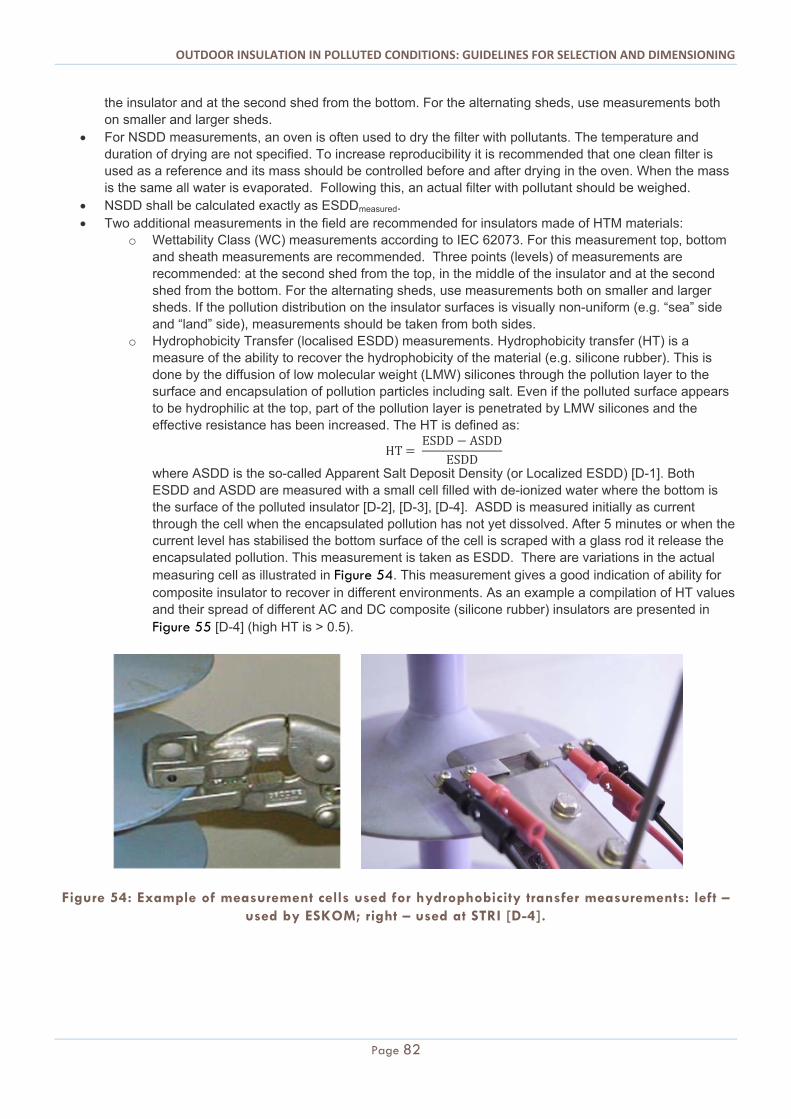
OUTDOOR INSULATION IN POLLUTED CONDITIONS: GUIDELINES FOR SELECTION AND DIMENSIONING
Page 82
the insulator and at the second shed from the bottom. For the alternating sheds, use measurements both on smaller and larger sheds.
For NSDD measurements, an oven is often used to dry the filter with pollutants. The temperature and duration of drying are not specified. To increase reproducibility it is recommended that one clean filter is used as a reference and its mass should be controlled before and after drying in the oven. When the mass is the same all water is evaporated. Following this, an actual filter with pollutant should be weighed.
NSDD shall be calculated exactly as ESDDmeasured. Two additional measurements in the field are recommended for insulators made of HTM materials:
o Wettability Class (WC) measurements according to IEC 62073. For this measurement top, bottom and sheath measurements are recommended. Three points (levels) of measurements are recommended: at the second shed from the top, in the middle of the insulator and at the second shed from the bottom. For the alternating sheds, use measurements both on smaller and larger sheds. If the pollution distribution on the insulator surfaces is visually non-uniform (e.g. “sea” side and “land” side), measurements should be taken from both sides.
o Hydrophobicity Transfer (localised ESDD) measurements. Hydrophobicity transfer (HT) is a measure of the ability to recover the hydrophobicity of the material (e.g. silicone rubber). This is done by the diffusion of low molecular weight (LMW) silicones through the pollution layer to the surface and encapsulation of pollution particles including salt. Even if the polluted surface appears to be hydrophilic at the top, part of the pollution layer is penetrated by LMW silicones and the effective resistance has been increased. The HT is defined as:
HT ESDD ASDD
ESDD
where ASDD is the so-called Apparent Salt Deposit Density (or Localized ESDD) [D-1]. Both ESDD and ASDD are measured with a small cell filled with de-ionized water where the bottom is the surface of the polluted insulator [D-2], [D-3], [D-4]. ASDD is measured initially as current through the cell when the encapsulated pollution has not yet dissolved. After 5 minutes or when the current level has stabilised the bottom surface of the cell is scraped with a glass rod it release the encapsulated pollution. This measurement is taken as ESDD. There are variations in the actual measuring cell as illustrated in Figure 54. This measurement gives a good indication of ability for composite insulator to recover in different environments. As an example a compilation of HT values and their spread of different AC and DC composite (silicone rubber) insulators are presented in Figure 55 [D-4] (high HT is > 0.5).
Figure 54: Example of measurement cells used for hydrophobicity transfer measurements: left – used by ESKOM; right – used at STRI [D-4].
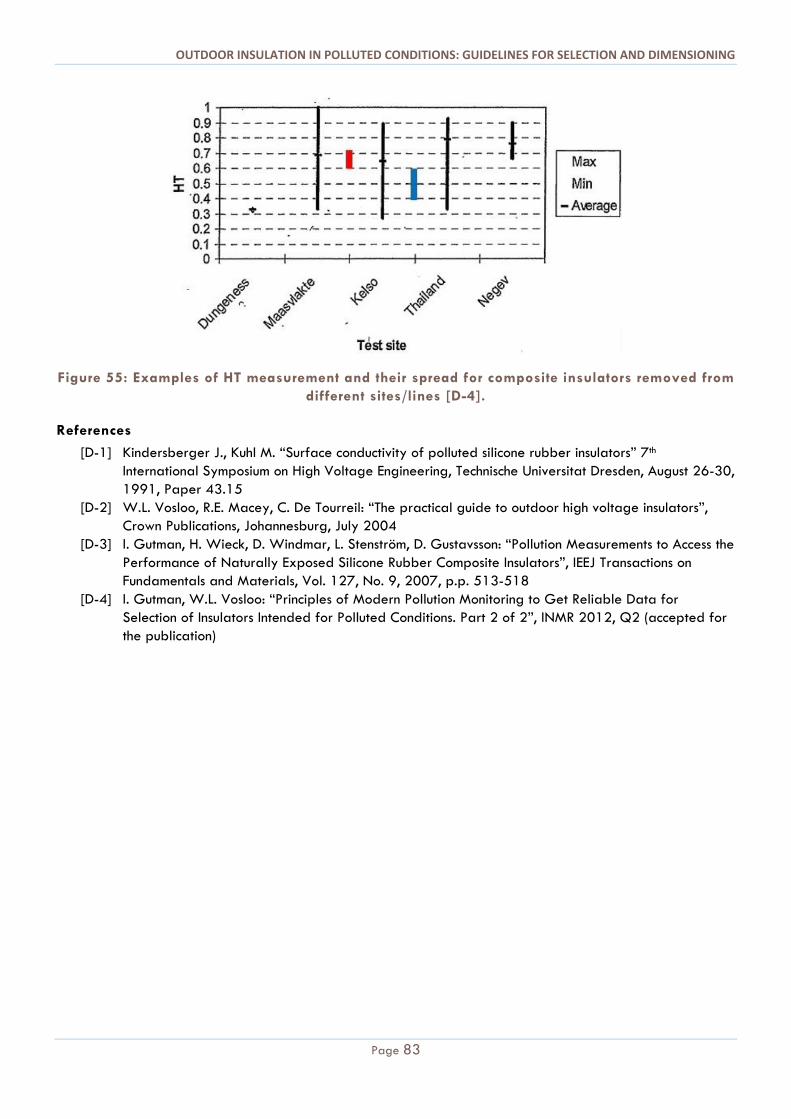
OUTDOOR INSULATION IN POLLUTED CONDITIONS: GUIDELINES FOR SELECTION AND DIMENSIONING
Page 83
Figure 55: Examples of HT measurement and their spread for composite insulators removed from different sites/lines [D-4].
References
[D-1] Kindersberger J., Kuhl M. “Surface conductivity of polluted silicone rubber insulators” 7th International Symposium on High Voltage Engineering, Technische Universitat Dresden, August 26-30, 1991, Paper 43.15
[D-2] W.L. Vosloo, R.E. Macey, C. De Tourreil: “The practical guide to outdoor high voltage insulators”, Crown Publications, Johannesburg, July 2004
[D-3] I. Gutman, H. Wieck, D. Windmar, L. Stenström, D. Gustavsson: “Pollution Measurements to Access the Performance of Naturally Exposed Silicone Rubber Composite Insulators”, IEEJ Transactions on Fundamentals and Materials, Vol. 127, No. 9, 2007, p.p. 513-518
[D-4] I. Gutman, W.L. Vosloo: “Principles of Modern Pollution Monitoring to Get Reliable Data for Selection of Insulators Intended for Polluted Conditions. Part 2 of 2”, INMR 2012, Q2 (accepted for the publication)
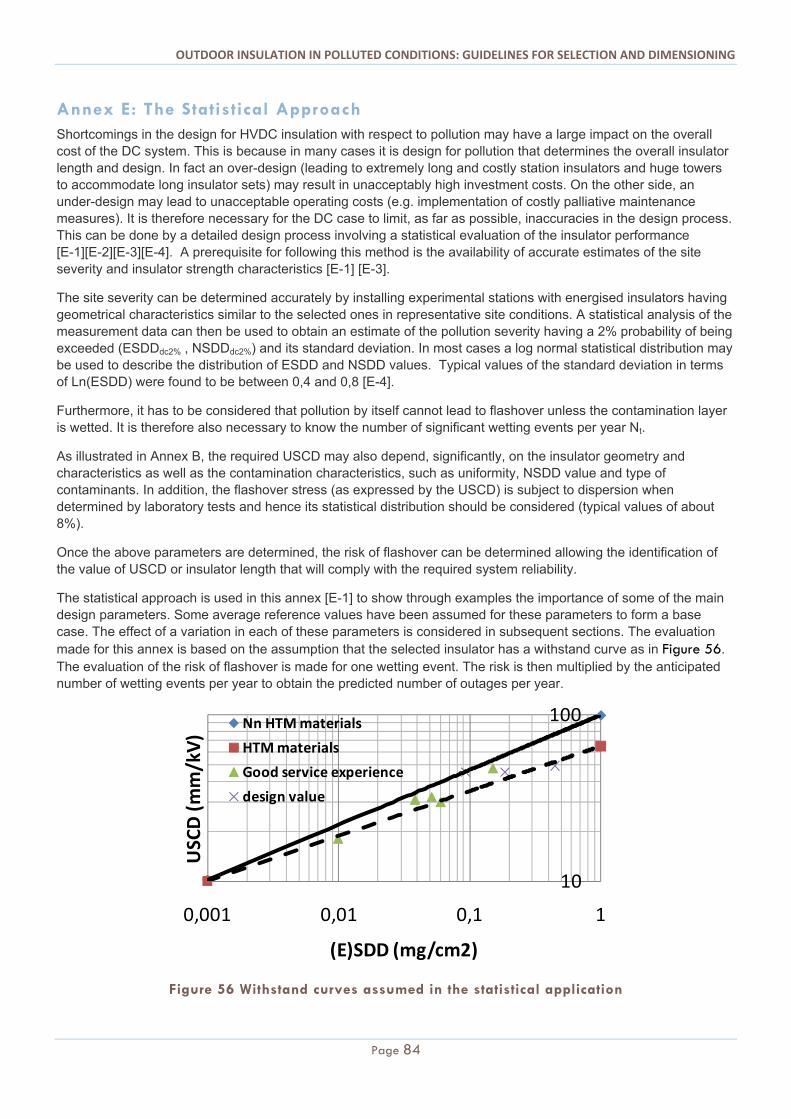
OUTDOOR INSULATION IN POLLUTED CONDITIONS: GUIDELINES FOR SELECTION AND DIMENSIONING
Page 84
Annex E: The Statistical Approach Shortcomings in the design for HVDC insulation with respect to pollution may have a large impact on the overall cost of the DC system. This is because in many cases it is design for pollution that determines the overall insulator length and design. In fact an over-design (leading to extremely long and costly station insulators and huge towers to accommodate long insulator sets) may result in unacceptably high investment costs. On the other side, an under-design may lead to unacceptable operating costs (e.g. implementation of costly palliative maintenance measures). It is therefore necessary for the DC case to limit, as far as possible, inaccuracies in the design process. This can be done by a detailed design process involving a statistical evaluation of the insulator performance [E-1][E-2][E-3][E-4]. A prerequisite for following this method is the availability of accurate estimates of the site severity and insulator strength characteristics [E-1] [E-3].
The site severity can be determined accurately by installing experimental stations with energised insulators having geometrical characteristics similar to the selected ones in representative site conditions. A statistical analysis of the measurement data can then be used to obtain an estimate of the pollution severity having a 2% probability of being exceeded (ESDDdc2% , NSDDdc2%) and its standard deviation. In most cases a log normal statistical distribution may be used to describe the distribution of ESDD and NSDD values. Typical values of the standard deviation in terms of Ln(ESDD) were found to be between 0,4 and 0,8 [E-4].
Furthermore, it has to be considered that pollution by itself cannot lead to flashover unless the contamination layer is wetted. It is therefore also necessary to know the number of significant wetting events per year Nt.
As illustrated in Annex B, the required USCD may also depend, significantly, on the insulator geometry and characteristics as well as the contamination characteristics, such as uniformity, NSDD value and type of contaminants. In addition, the flashover stress (as expressed by the USCD) is subject to dispersion when determined by laboratory tests and hence its statistical distribution should be considered (typical values of about 8%).
Once the above parameters are determined, the risk of flashover can be determined allowing the identification of the value of USCD or insulator length that will comply with the required system reliability.
The statistical approach is used in this annex [E-1] to show through examples the importance of some of the main design parameters. Some average reference values have been assumed for these parameters to form a base case. The effect of a variation in each of these parameters is considered in subsequent sections. The evaluation made for this annex is based on the assumption that the selected insulator has a withstand curve as in Figure 56. The evaluation of the risk of flashover is made for one wetting event. The risk is then multiplied by the anticipated number of wetting events per year to obtain the predicted number of outages per year.
Figure 56 Withstand curves assumed in the statistical application
10
100
0,001 0,01 0,1 1
USCD (mm/kV)
(E)SDD (mg/cm2)
Nn HTM materials
HTM materials
Good service experience
design value
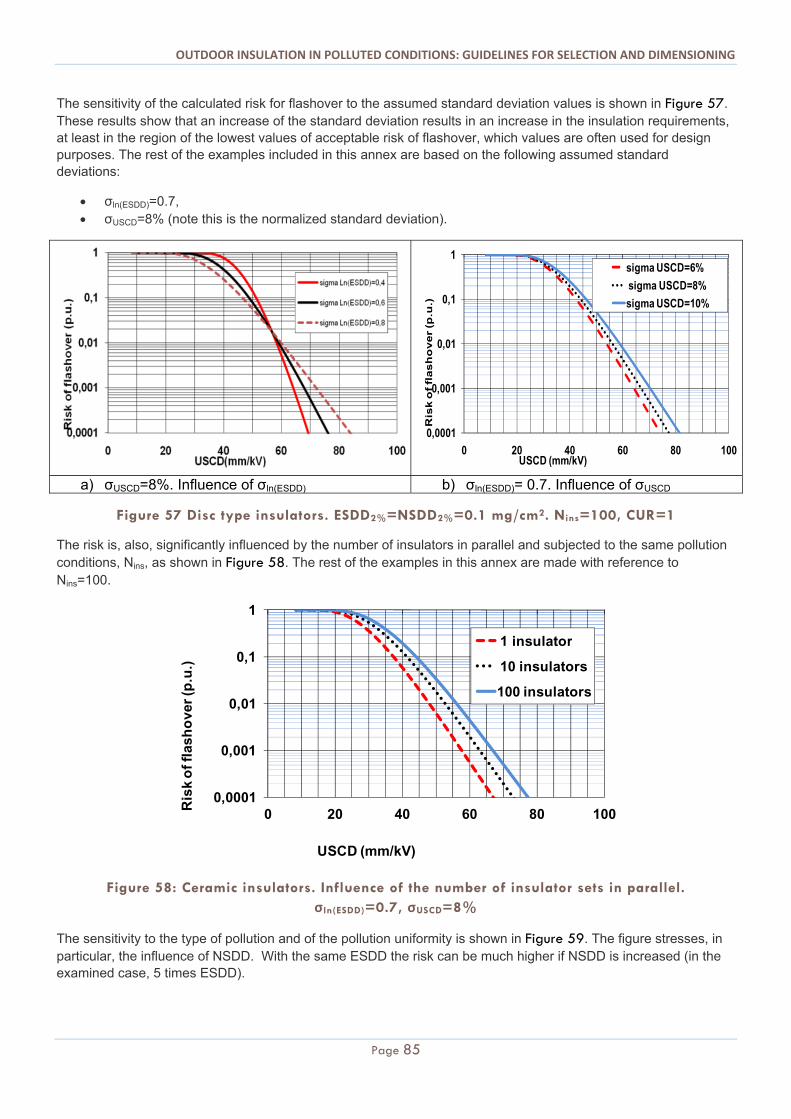
OUTDOOR INSULATION IN POLLUTED CONDITIONS: GUIDELINES FOR SELECTION AND DIMENSIONING
Page 85
The sensitivity of the calculated risk for flashover to the assumed standard deviation values is shown in Figure 57. These results show that an increase of the standard deviation results in an increase in the insulation requirements, at least in the region of the lowest values of acceptable risk of flashover, which values are often used for design purposes. The rest of the examples included in this annex are based on the following assumed standard deviations:
σln(ESDD)=0.7, σUSCD=8% (note this is the normalized standard deviation).
a) σUSCD=8%. Influence of σln(ESDD) b) σln(ESDD)= 0.7. Influence of σUSCD
Figure 57 Disc type insulators. ESDD2%=NSDD2%=0.1 mg/cm2. Nins=100, CUR=1
The risk is, also, significantly influenced by the number of insulators in parallel and subjected to the same pollution conditions, Nins, as shown in Figure 58. The rest of the examples in this annex are made with reference to Nins=100.
Figure 58: Ceramic insulators. Influence of the number of insulator sets in parallel. σln(ESDD)=0.7, σUSCD=8%
The sensitivity to the type of pollution and of the pollution uniformity is shown in Figure 59. The figure stresses, in particular, the influence of NSDD. With the same ESDD the risk can be much higher if NSDD is increased (in the examined case, 5 times ESDD).
0,0001
0,001
0,01
0,1
1
0 20 40 60 80 100
Ris
k o
f fl
ash
over
(p.u
.)
USCD (mm/kV)
sigma USCD=6%
sigma USCD=8%
sigma USCD=10%
0,0001
0,001
0,01
0,1
1
0 20 40 60 80 100
Ris
k o
f fla
sho
ver
(p.u
.)
USCD (mm/kV)
1 insulator
10 insulators
100 insulators
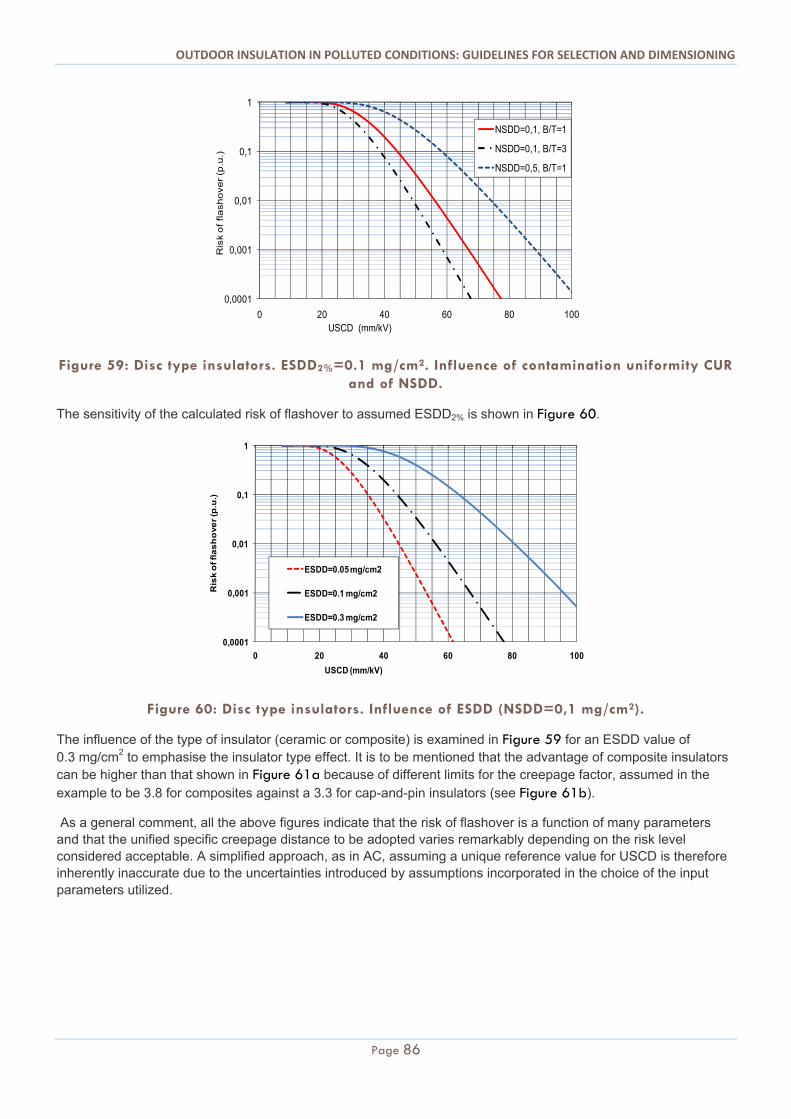
OUTDOOR INSULATION IN POLLUTED CONDITIONS: GUIDELINES FOR SELECTION AND DIMENSIONING
Page 86
Figure 59: Disc type insulators. ESDD2%=0.1 mg/cm2. Influence of contamination uniformity CUR and of NSDD.
The sensitivity of the calculated risk of flashover to assumed ESDD2% is shown in Figure 60.
Figure 60: Disc type insulators. Influence of ESDD (NSDD=0,1 mg/cm2).
The influence of the type of insulator (ceramic or composite) is examined in Figure 59 for an ESDD value of 0.3 mg/cm2 to emphasise the insulator type effect. It is to be mentioned that the advantage of composite insulators can be higher than that shown in Figure 61a because of different limits for the creepage factor, assumed in the example to be 3.8 for composites against a 3.3 for cap-and-pin insulators (see Figure 61b).
As a general comment, all the above figures indicate that the risk of flashover is a function of many parameters and that the unified specific creepage distance to be adopted varies remarkably depending on the risk level considered acceptable. A simplified approach, as in AC, assuming a unique reference value for USCD is therefore inherently inaccurate due to the uncertainties introduced by assumptions incorporated in the choice of the input parameters utilized.
0,0001
0,001
0,01
0,1
1
0 20 40 60 80 100
Ris
k o
f fla
sh
ove
r (p
.u.)
USCD (mm/kV)
NSDD=0,1, B/T=1
NSDD=0,1, B/T=3
NSDD=0,5, B/T=1
0,0001
0,001
0,01
0,1
1
0 20 40 60 80 100
Ris
k o
f fl
as
ho
ve
r (p
.u.)
USCD (mm/kV)
ESDD=0.05 mg/cm2
ESDD=0.1 mg/cm2
ESDD=0.3 mg/cm2
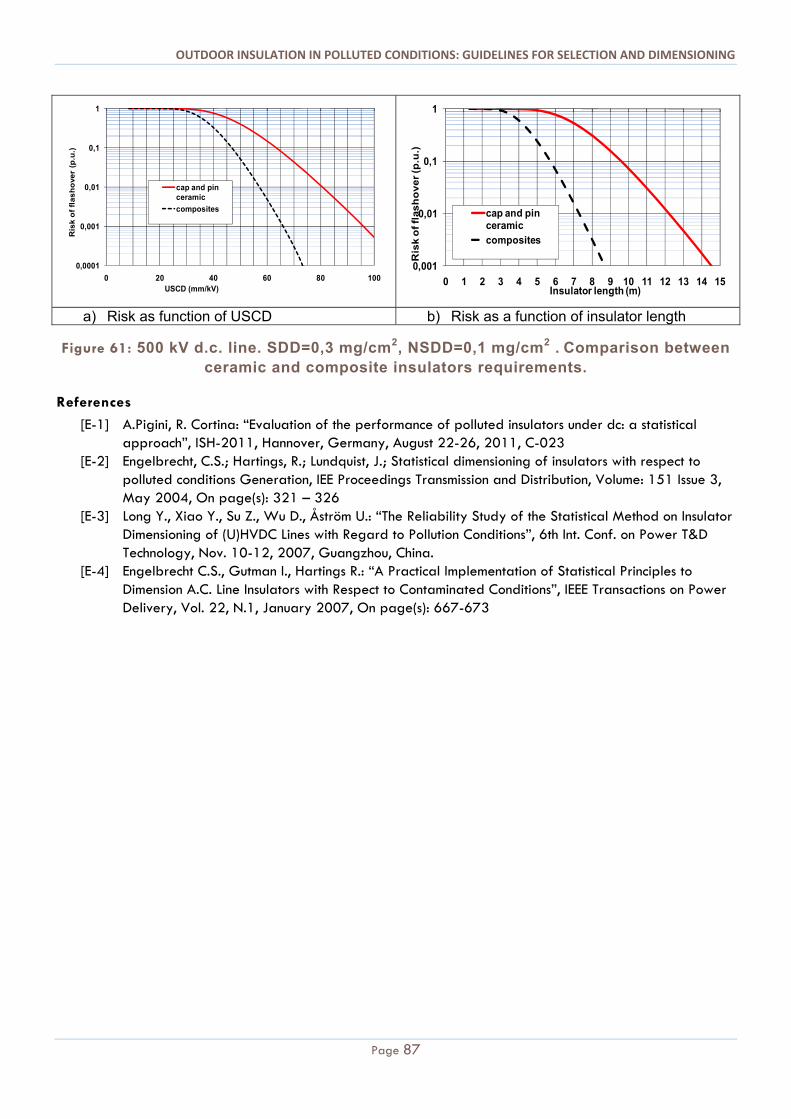
OUTDOOR INSULATION IN POLLUTED CONDITIONS: GUIDELINES FOR SELECTION AND DIMENSIONING
Page 87
a) Risk as function of USCD b) Risk as a function of insulator length
Figure 61: 500 kV d.c. line. SDD=0,3 mg/cm2, NSDD=0,1 mg/cm2 . Comparison between ceramic and composite insulators requirements.
References
[E-1] A.Pigini, R. Cortina: “Evaluation of the performance of polluted insulators under dc: a statistical approach”, ISH-2011, Hannover, Germany, August 22-26, 2011, C-023
[E-2] Engelbrecht, C.S.; Hartings, R.; Lundquist, J.; Statistical dimensioning of insulators with respect to polluted conditions Generation, IEE Proceedings Transmission and Distribution, Volume: 151 Issue 3, May 2004, On page(s): 321 – 326
[E-3] Long Y., Xiao Y., Su Z., Wu D., Åström U.: “The Reliability Study of the Statistical Method on Insulator Dimensioning of (U)HVDC Lines with Regard to Pollution Conditions”, 6th Int. Conf. on Power T&D Technology, Nov. 10-12, 2007, Guangzhou, China.
[E-4] Engelbrecht C.S., Gutman I., Hartings R.: “A Practical Implementation of Statistical Principles to Dimension A.C. Line Insulators with Respect to Contaminated Conditions”, IEEE Transactions on Power Delivery, Vol. 22, N.1, January 2007, On page(s): 667-673
0,0001
0,001
0,01
0,1
1
0 20 40 60 80 100
Ris
k o
f fl
as
ho
ve
r (p
.u.)
USCD (mm/kV)
cap and pin ceramic
composites
0,001
0,01
0,1
1
0 1 2 3 4 5 6 7 8 9 10 11 12 13 14 15
Ris
k o
f fl
as
ho
ver
(p.u
.)
Insulator length (m)
cap and pin ceramiccomposites