A Multifunctional Solution for Simultaneous Sound Insulation ...
20
Citation: Rodríguez, J.C.; Alba, J.; del Rey, R. A Multifunctional Solution for Simultaneous Sound Insulation and Acoustic Conditioning—An Example of Application in a Radio Studio. Buildings 2022, 12, 123. https:// doi.org/10.3390/buildings12020123 Academic Editor: Francesco Nocera Received: 27 December 2021 Accepted: 23 January 2022 Published: 26 January 2022 Publisher’s Note: MDPI stays neutral with regard to jurisdictional claims in published maps and institutional affil- iations. Copyright: © 2022 by the authors. Licensee MDPI, Basel, Switzerland. This article is an open access article distributed under the terms and conditions of the Creative Commons Attribution (CC BY) license (https:// creativecommons.org/licenses/by/ 4.0/). buildings Article A Multifunctional Solution for Simultaneous Sound Insulation and Acoustic Conditioning—An Example of Application in a Radio Studio Juan C. Rodríguez * , Jesús Alba and Romina del Rey Centro de Tecnologías Físicas, Universitat Politècnica de València, 46730 Valencia, Grao de Gandia, Spain; jesalba@fis.upv.es (J.A.); roderey@fis.upv.es (R.d.R.) * Correspondence: [email protected] Abstract: In building acoustics, two different problems usually arise. There is a need to comply with established sound insulation parameters, but there are also legislative conditions concerning reverberation time. It is therefore necessary to acoustically insulate and condition the enclosures. When designing the acoustic treatment of buildings, sound insulation is always considered before acoustic conditioning. There are multiple solutions for sound insulation; one of them consists of a base wall reinforced with a plasterboard lining. The sound insulation improvement provided by these solutions will depend on the type of base wall used. A common solution for acoustic conditioning is the use of perforated plate lining systems with a plenum filled with sound absorbing material. This work presents a solution for simultaneous sound insulation and conditioning improvement, reducing the installation costs. Materials that provide the acoustic conditioning features were analyzed to validate their use in the complete solution, performing airflow resistance tests. The complete solution was also evaluated on a laboratory scale by conducting tests in a reverberation chamber and in a transmission chamber for small samples. Finally, the effectiveness of the presented solution was assessed with in-situ tests in a radio studio. Keywords: sound insulation; acoustic conditioning; multilayer solutions; perforated plasterboard lining 1. Introduction When acoustically designing a space, essentially, two requirements must be met to guarantee acoustic comfort; these are good sound insulation and controlled reverberation time. These conditions will provide a quiet or low-noise space and good listening conditions whether for talking, listening to music or any other type of sound reproduction. Some examples of the increasing relevance of acoustic comfort in homes and offices can be found in the literature [1–5]. These requirements are usually met using two independent solutions, one for sound insulation and another for acoustic conditioning. This work presents the study of a solution that meets both requirements simultaneously with materials available in the market, which considerably reduces production and installation costs. In the near future, alternative solutions designed with metamaterials that also address both problems simultaneously are foreseeable, even with improved performance in the low frequency range; however, for the time being these solutions require a degree of custom design and fabrication that still make them quite expensive for widespread use in buildings. Some reviews that can serve as an introduction to the topic can be found in [6,7]. The proposed solution consists of a plasterboard lining system formed by a viscoelastic multilayer—composed of two layers of textile felt with the same density and thickness, thermally adhered to a high-density viscoelastic membrane—combined with perforated plasterboard. This solution requires a base wall. Combining the viscoelastic membrane with the textile should provide the solution with airborne sound insulation characteristics. The Buildings 2022, 12, 123. https://doi.org/10.3390/buildings12020123 https://www.mdpi.com/journal/buildings
-
Upload
khangminh22 -
Category
Documents
-
view
4 -
download
0
Transcript of A Multifunctional Solution for Simultaneous Sound Insulation ...

�����������������
Citation: Rodríguez, J.C.; Alba, J.; del
Rey, R. A Multifunctional Solution for
Simultaneous Sound Insulation and
Acoustic Conditioning—An Example
of Application in a Radio Studio.
Buildings 2022, 12, 123. https://
doi.org/10.3390/buildings12020123
Academic Editor: Francesco Nocera
Received: 27 December 2021
Accepted: 23 January 2022
Published: 26 January 2022
Publisher’s Note: MDPI stays neutral
with regard to jurisdictional claims in
published maps and institutional affil-
iations.
Copyright: © 2022 by the authors.
Licensee MDPI, Basel, Switzerland.
This article is an open access article
distributed under the terms and
conditions of the Creative Commons
Attribution (CC BY) license (https://
creativecommons.org/licenses/by/
4.0/).
buildings
Article
A Multifunctional Solution for Simultaneous Sound Insulationand Acoustic Conditioning—An Example of Application in aRadio StudioJuan C. Rodríguez * , Jesús Alba and Romina del Rey
Centro de Tecnologías Físicas, Universitat Politècnica de València, 46730 Valencia, Grao de Gandia, Spain;[email protected] (J.A.); [email protected] (R.d.R.)* Correspondence: [email protected]
Abstract: In building acoustics, two different problems usually arise. There is a need to complywith established sound insulation parameters, but there are also legislative conditions concerningreverberation time. It is therefore necessary to acoustically insulate and condition the enclosures.When designing the acoustic treatment of buildings, sound insulation is always considered beforeacoustic conditioning. There are multiple solutions for sound insulation; one of them consists of abase wall reinforced with a plasterboard lining. The sound insulation improvement provided by thesesolutions will depend on the type of base wall used. A common solution for acoustic conditioning isthe use of perforated plate lining systems with a plenum filled with sound absorbing material. Thiswork presents a solution for simultaneous sound insulation and conditioning improvement, reducingthe installation costs. Materials that provide the acoustic conditioning features were analyzed tovalidate their use in the complete solution, performing airflow resistance tests. The complete solutionwas also evaluated on a laboratory scale by conducting tests in a reverberation chamber and in atransmission chamber for small samples. Finally, the effectiveness of the presented solution wasassessed with in-situ tests in a radio studio.
Keywords: sound insulation; acoustic conditioning; multilayer solutions; perforated plasterboard lining
1. Introduction
When acoustically designing a space, essentially, two requirements must be met toguarantee acoustic comfort; these are good sound insulation and controlled reverberationtime. These conditions will provide a quiet or low-noise space and good listening conditionswhether for talking, listening to music or any other type of sound reproduction. Someexamples of the increasing relevance of acoustic comfort in homes and offices can be foundin the literature [1–5].
These requirements are usually met using two independent solutions, one for soundinsulation and another for acoustic conditioning. This work presents the study of a solutionthat meets both requirements simultaneously with materials available in the market, whichconsiderably reduces production and installation costs.
In the near future, alternative solutions designed with metamaterials that also addressboth problems simultaneously are foreseeable, even with improved performance in the lowfrequency range; however, for the time being these solutions require a degree of customdesign and fabrication that still make them quite expensive for widespread use in buildings.Some reviews that can serve as an introduction to the topic can be found in [6,7].
The proposed solution consists of a plasterboard lining system formed by a viscoelasticmultilayer—composed of two layers of textile felt with the same density and thickness,thermally adhered to a high-density viscoelastic membrane—combined with perforatedplasterboard. This solution requires a base wall. Combining the viscoelastic membrane withthe textile should provide the solution with airborne sound insulation characteristics. The
Buildings 2022, 12, 123. https://doi.org/10.3390/buildings12020123 https://www.mdpi.com/journal/buildings

Buildings 2022, 12, 123 2 of 20
closure with perforated plasterboards over the textile felt layer should efficiently controlthe reverberation time.
The use of viscoelastic membranes is a common practice in sound insulation ap-plications [8,9], and their positive performance in these cases has already been demon-strated. Combining this material with a porous layer can also provide excellent soundabsorbing behavior.
In buildings, this porous sound absorbing layer usually consists of fibers or foams. Inthis case, a textile felt created from waste from the textile industry was used as the poroussound absorbing layer. The textile industry generates an enormous quantity of residues,so recycling them is crucial. An example of using these residues for other applicationsembracing circularity is their use in acoustic conditioning solutions as sustainable soundabsorbers [10–12].
However, the use of sustainable materials in acoustic treatments is not only limitedto recycled textiles and their sound absorption applications. The growing importance ofusing environmentally friendly materials in buildings has given rise to a great deal ofresearch on different materials and their applications for sound insulation and acousticconditioning [13–19]. Besides the environmental benefits, using these materials usuallyreduces production costs since they come from natural or recycled materials.
The textile felt provides part of the sound absorption of the proposed solution andalso helps to improve the sound insulation but it cannot be left exposed, so another layerthat does not penalize the global sound absorption is needed. This may lead to consideringcombining the existing elements with a final layer of perforated plasterboard to obtain aready-to-install solution, as presented in Figure 1.
Buildings 2022, 12, x FOR PEER REVIEW 2 of 20
The proposed solution consists of a plasterboard lining system formed by a viscoe-lastic multilayer—composed of two layers of textile felt with the same density and thick-ness, thermally adhered to a high-density viscoelastic membrane—combined with perfo-rated plasterboard. This solution requires a base wall. Combining the viscoelastic mem-brane with the textile should provide the solution with airborne sound insulation charac-teristics. The closure with perforated plasterboards over the textile felt layer should effi-ciently control the reverberation time.
The use of viscoelastic membranes is a common practice in sound insulation applica-tions [8,9], and their positive performance in these cases has already been demonstrated. Combining this material with a porous layer can also provide excellent sound absorbing behavior.
In buildings, this porous sound absorbing layer usually consists of fibers or foams. In this case, a textile felt created from waste from the textile industry was used as the porous sound absorbing layer. The textile industry generates an enormous quantity of residues, so recycling them is crucial. An example of using these residues for other appli-cations embracing circularity is their use in acoustic conditioning solutions as sustainable sound absorbers [10–12].
However, the use of sustainable materials in acoustic treatments is not only limited to recycled textiles and their sound absorption applications. The growing importance of using environmentally friendly materials in buildings has given rise to a great deal of research on different materials and their applications for sound insulation and acoustic conditioning [13–19]. Besides the environmental benefits, using these materials usually reduces production costs since they come from natural or recycled materials.
The textile felt provides part of the sound absorption of the proposed solution and also helps to improve the sound insulation but it cannot be left exposed, so another layer that does not penalize the global sound absorption is needed. This may lead to considering combining the existing elements with a final layer of perforated plasterboard to obtain a ready-to-install solution, as presented in Figure 1.
Figure 1. Overview of the proposed solution.
The perforated plasterboard helps to slightly increase the low frequency sound ab-sorption and to tune the solution to achieve the most absorption in the range of mid fre-quencies of interest in each case. Some recent examples of using perforated plates to con-trol sound absorption can be found in [20,21].
The sound insulation improvement provided by the proposed lining system will de-pend on the base wall used. The final sound absorption will depend on the type of perfo-rated plasterboard and the plenum left between the plasterboard lining and the base wall. Therefore, by adjusting its different elements the proposed solution can be helpful in ap-plications where controlled sound absorption levels are needed while maintaining opti-mum sound insulation behavior.
This work assesses the behavior of different configurations for the proposed solution, combining the viscoelastic multilayer with varying types of perforated plasterboard.
Figure 1. Overview of the proposed solution.
The perforated plasterboard helps to slightly increase the low frequency sound absorp-tion and to tune the solution to achieve the most absorption in the range of mid frequenciesof interest in each case. Some recent examples of using perforated plates to control soundabsorption can be found in [20,21].
The sound insulation improvement provided by the proposed lining system willdepend on the base wall used. The final sound absorption will depend on the type ofperforated plasterboard and the plenum left between the plasterboard lining and the basewall. Therefore, by adjusting its different elements the proposed solution can be helpfulin applications where controlled sound absorption levels are needed while maintainingoptimum sound insulation behavior.
This work assesses the behavior of different configurations for the proposed solution,combining the viscoelastic multilayer with varying types of perforated plasterboard. Soundabsorption and sound transmission tests were carried out for each analyzed configuration.

Buildings 2022, 12, 123 3 of 20
Finally, the effectiveness of the presented solution was assessed with in-situ tests in acouple of enclosures destined to function as a radio studio, which required both types ofacoustic treatments. The proposed solution is validated with the obtained results in thein-situ installations.
2. Materials
This section describes the most relevant characteristics of each of the elements thatmake up the multi-functional solution. The proposed solution consists of a plasterboardlining system formed by a viscoelastic multilayer—composed of two layers of textile feltwith the same density and thickness, thermally adhered to a high-density viscoelasticmembrane forming a sandwich—combined with perforated plasterboard. First, the charac-teristics of the viscoelastic multilayer as a solution for sound insulation in conjunction withthe base wall are presented, including the airflow resistivity in the case of the textile felts.Subsequently, the characteristics of the perforated plates, which allow the effective controlof the reverberation time, are described.
2.1. The Textile Felt
The viscoelastic multilayer used in the proposed solution, as shown in Figure 1,contains two 16 mm-thick layers of textile felt (FLT) with a mass density of 928 g/m2. Thismaterial is formed by recycled textile fibers that come from waste from the textile industry.Some photographs of the material can be seen in Figure 2.
Buildings 2022, 12, x FOR PEER REVIEW 3 of 20
Sound absorption and sound transmission tests were carried out for each analyzed con-figuration.
Finally, the effectiveness of the presented solution was assessed with in-situ tests in a couple of enclosures destined to function as a radio studio, which required both types of acoustic treatments. The proposed solution is validated with the obtained results in the in-situ installations.
2. Materials This section describes the most relevant characteristics of each of the elements that
make up the multi-functional solution. The proposed solution consists of a plasterboard lining system formed by a viscoelastic multilayer—composed of two layers of textile felt with the same density and thickness, thermally adhered to a high-density viscoelastic membrane forming a sandwich—combined with perforated plasterboard. First, the char-acteristics of the viscoelastic multilayer as a solution for sound insulation in conjunction with the base wall are presented, including the airflow resistivity in the case of the textile felts. Subsequently, the characteristics of the perforated plates, which allow the effective control of the reverberation time, are described.
2.1. The Textile Felt The viscoelastic multilayer used in the proposed solution, as shown in Figure 1, con-
tains two 16 mm-thick layers of textile felt (FLT) with a mass density of 928 g/m2. This material is formed by recycled textile fibers that come from waste from the textile indus-try. Some photographs of the material can be seen in Figure 2.
Figure 2. Materials: the textile felt (FLT).
To validate its acoustic performance, the first step was to check if the porous material was optimal for acoustic solutions. In Appendix D of the ISO 12354-1 [22]—used to obtain the sound reduction index improvement of additional layers—a requirement of a mini-mum airflow resistivity of 5 kPa·s/m2 for the porous material filling the cavity is set, so the first step was to validate this requirement.
Airflow Resistivity of the Textile Felt Airflow resistivity is one of the main non-acoustic parameters used to characterize
the sound absorption properties of a porous material. It is used in practice for selecting appropriate materials for noise control and building acoustic applications.
Several organizations, including ISO and ASTM, described the standardized labora-tory procedures for measuring airflow resistivity, specifically through standards ISO 9053-1 [23], ISO 9053-2 [24] and ASTM C522-03 [25]. Implementation of these standardized procedures requires rather complex and unusual instrumentation in acoustic laboratories, and it is also necessary to measure sound pressures at a very low frequency. These facts
Figure 2. Materials: the textile felt (FLT).
To validate its acoustic performance, the first step was to check if the porous materialwas optimal for acoustic solutions. In Appendix D of the ISO 12354-1 [22]—used to obtainthe sound reduction index improvement of additional layers—a requirement of a minimumairflow resistivity of 5 kPa·s/m2 for the porous material filling the cavity is set, so the firststep was to validate this requirement.
Airflow Resistivity of the Textile Felt
Airflow resistivity is one of the main non-acoustic parameters used to characterizethe sound absorption properties of a porous material. It is used in practice for selectingappropriate materials for noise control and building acoustic applications.
Several organizations, including ISO and ASTM, described the standardized laboratoryprocedures for measuring airflow resistivity, specifically through standards ISO 9053-1 [23],ISO 9053-2 [24] and ASTM C522-03 [25]. Implementation of these standardized proceduresrequires rather complex and unusual instrumentation in acoustic laboratories, and it isalso necessary to measure sound pressures at a very low frequency. These facts led tothe development and use of alternative methods to measure airflow resistivity. Somediscussion about some of them can be found in the literature [26–35].
In this work, flow resistance tests were carried out following the procedure describedby one of these alternative methods to the standards: the Ingard and Dear method [27].
Buildings 2022, 12, 123 4 of 20
Three circular samples of 41 mm were measured in an Ingard and Dear tube, andthe final results were obtained by calculating the arithmetic mean of the three. The testsyielded a value of 11.1 ± 0.8 kPa·s/m2, which is over the minimum limit of 5 kPa·s/m2
required in Appendix D of the ISO 12354-1, validating the material for its use inside theplasterboard lining system plenum.
2.2. The Viscoelastic Membrane
The other element that conforms to the viscoelastic multilayer is a 4 mm-thick high-density (12.8 kg/m2) viscoelastic membrane, as shown in Figure 3. The composition of themembrane, as described by the manufacturer, is:
• Elastomeric bitumen: asphalt bitumen modified with SBS elastomeric rubber.• Filler: ground calcium carbonate.• Armor: fiberglass felt.• Anti-stick: hot-melt polystyrene film.
Buildings 2022, 12, x FOR PEER REVIEW 4 of 20
led to the development and use of alternative methods to measure airflow resistivity. Some discussion about some of them can be found in the literature [26–35].
In this work, flow resistance tests were carried out following the procedure described by one of these alternative methods to the standards: the Ingard and Dear method [27].
Three circular samples of 41 mm were measured in an Ingard and Dear tube, and the final results were obtained by calculating the arithmetic mean of the three. The tests yielded a value of 11.1 ± 0.8 kPa·s/m2, which is over the minimum limit of 5 kPa·s/m2 re-quired in Appendix D of the ISO 12354-1, validating the material for its use inside the plasterboard lining system plenum.
2.2. The Viscoelastic Membrane The other element that conforms to the viscoelastic multilayer is a 4 mm-thick high-
density (12.8 kg/m2) viscoelastic membrane, as shown in Figure 3. The composition of the membrane, as described by the manufacturer, is: • Elastomeric bitumen: asphalt bitumen modified with SBS elastomeric rubber. • Filler: ground calcium carbonate. • Armor: fiberglass felt. • Anti-stick: hot-melt polystyrene film.
Figure 3. Materials: the viscoelastic membrane.
2.3. The Viscoelastic Multilayer (VLM) The viscoelastic multilayer (VLM) consists of three layers of the previously described
materials, forming a sandwich of two layers of the textile felt thermally adhered to the high-density viscoelastic membrane. It has a total thickness of 36 mm and a mass density of 8.4 kg/m2. Details of the viscoelastic multilayer can be seen in Figure 4.
Figure 4. Details of the viscoelastic multilayer.
2.4. The Perforated Plates Four different perforated plasterboards were used to form four different configura-
tions, each with different sound reduction and sound absorption properties.
Figure 3. Materials: the viscoelastic membrane.
2.3. The Viscoelastic Multilayer (VLM)
The viscoelastic multilayer (VLM) consists of three layers of the previously describedmaterials, forming a sandwich of two layers of the textile felt thermally adhered to thehigh-density viscoelastic membrane. It has a total thickness of 36 mm and a mass densityof 8.4 kg/m2. Details of the viscoelastic multilayer can be seen in Figure 4.
Buildings 2022, 12, x FOR PEER REVIEW 4 of 20
led to the development and use of alternative methods to measure airflow resistivity. Some discussion about some of them can be found in the literature [26–35].
In this work, flow resistance tests were carried out following the procedure described by one of these alternative methods to the standards: the Ingard and Dear method [27].
Three circular samples of 41 mm were measured in an Ingard and Dear tube, and the final results were obtained by calculating the arithmetic mean of the three. The tests yielded a value of 11.1 ± 0.8 kPa·s/m2, which is over the minimum limit of 5 kPa·s/m2 re-quired in Appendix D of the ISO 12354-1, validating the material for its use inside the plasterboard lining system plenum.
2.2. The Viscoelastic Membrane The other element that conforms to the viscoelastic multilayer is a 4 mm-thick high-
density (12.8 kg/m2) viscoelastic membrane, as shown in Figure 3. The composition of the membrane, as described by the manufacturer, is: • Elastomeric bitumen: asphalt bitumen modified with SBS elastomeric rubber. • Filler: ground calcium carbonate. • Armor: fiberglass felt. • Anti-stick: hot-melt polystyrene film.
Figure 3. Materials: the viscoelastic membrane.
2.3. The Viscoelastic Multilayer (VLM) The viscoelastic multilayer (VLM) consists of three layers of the previously described
materials, forming a sandwich of two layers of the textile felt thermally adhered to the high-density viscoelastic membrane. It has a total thickness of 36 mm and a mass density of 8.4 kg/m2. Details of the viscoelastic multilayer can be seen in Figure 4.
Figure 4. Details of the viscoelastic multilayer.
2.4. The Perforated Plates Four different perforated plasterboards were used to form four different configura-
tions, each with different sound reduction and sound absorption properties.
Figure 4. Details of the viscoelastic multilayer.
2.4. The Perforated Plates
Four different perforated plasterboards were used to form four different configurations,each with different sound reduction and sound absorption properties.
The plates have different aesthetics (perforation rates, sizes and shapes). Three ofthem have circular perforations and the fourth squared ones, all of which have a rangeof perforation rates from 8% to 18% and mass densities between 8 and 12 kg/m2. The

Buildings 2022, 12, 123 5 of 20
properties of each type of perforated plasterboard, presented in Figure 5, are detailedin Table 1.
Buildings 2022, 12, x FOR PEER REVIEW 5 of 20
The plates have different aesthetics (perforation rates, sizes and shapes). Three of them have circular perforations and the fourth squared ones, all of which have a range of perforation rates from 8% to 18% and mass densities between 8 and 12 kg/m2. The prop-erties of each type of perforated plasterboard, presented in Figure 5, are detailed in Table 1.
Table 1. Properties of the perforated plasterboards.
Perforated Plate
Thickness (mm)
Perf. Shape
Perforation Rate (%)
Perforation Size (mm)
Mass Density (kg/m2)
PRF1 12.5 Squared 16 12 x 12 8 PRF2 12.5 Circular 10 8, 15, 20 10 PRF3 12.5 Circular 9 6 9 PRF4 12.5 Circular 18 12 8
(a)
(b)
(c)
(d)
Figure 5. Detail of the perforated plates: (a) PRF1; (b) PRF2; (c) PRF3; (d) PRF4.
3. Assessment of the Acoustic Behavior of the Proposed Solution Different tests were conducted to assess the acoustic behavior of the proposed mul-
tifunctional solution, designed to provide sound insulation and acoustic conditioning im-provements.
Four different plasterboard lining system configurations were assessed, one with each perforated plasterboard described in Table 1, combined with the viscoelastic multi-layer.
Sound transmission tests were carried out in a reduced size transmission chamber for small samples to determine the characteristics of the four proposed configurations as
Figure 5. Detail of the perforated plates: (a) PRF1; (b) PRF2; (c) PRF3; (d) PRF4.
Table 1. Properties of the perforated plasterboards.
PerforatedPlate
Thickness(mm)
Perf.Shape
PerforationRate(%)
PerforationSize
(mm)
MassDensity(kg/m2)
PRF1 12.5 Squared 16 12 × 12 8PRF2 12.5 Circular 10 8, 15, 20 10PRF3 12.5 Circular 9 6 9PRF4 12.5 Circular 18 12 8
3. Assessment of the Acoustic Behavior of the Proposed Solution
Different tests were conducted to assess the acoustic behavior of the proposed multifunc-tional solution, designed to provide sound insulation and acoustic conditioning improvements.
Four different plasterboard lining system configurations were assessed, one with eachperforated plasterboard described in Table 1, combined with the viscoelastic multilayer.
Sound transmission tests were carried out in a reduced size transmission chamberfor small samples to determine the characteristics of the four proposed configurations assolutions for sound insulation. In addition, an estimation of the airborne noise improvementprovided by this solution was carried out based on the guidelines of Annex D of the ISO12354-1 standard.
To assess the suitability of the proposed solution for acoustic conditioning, soundabsorption tests in diffuse field conditions were also carried out for each configuration.These tests were carried out in a reverberation chamber.

Buildings 2022, 12, 123 6 of 20
3.1. Validation of the Proposed Solution for Sound Insulation3.1.1. Sound Reduction Index, R (dB)
To estimate the sound insulation properties of the presented solution, the soundreduction index, R (dB), of the four proposed configurations was assessed.
The entire ISO 10140 standard is related to the laboratory measurement of soundinsulation of building elements. The ISO 10140-2 standard [36] in particular indicates theprocedure for the measurement of sound insulation to airborne noise in compliance withthe ISO 10140-4 [37] and the ISO 10140-5 [38] standards.
Since a normalized transmission chamber as described in the ISO-10140-5 standardwas not available in the Escola Politècnica Superior de Gandia (EPSG) laboratories, areduced size transmission chamber that reproduces the geometry of standard transmissionchambers to scale was used. The design of this chamber was carried out according to theISO 10140-5 standard, following a similar approach as described in [39]. The details of thedesign and building process of the chamber are presented in [40], where this chamber wasused to evaluate the performance of new sustainable solutions for sound insulation. Someimages of the setup for the tests are presented in Figure 6, where the chamber during oneof the tests and the detail of the mounting of one of the proposed configurations in thesample holder can be seen. As can be observed, no studs were used during these tests,so the results should not be compared with usual double-leaf plasterboard systems, andshould only be used to compare the proposed configurations.
Buildings 2022, 12, x FOR PEER REVIEW 6 of 20
solutions for sound insulation. In addition, an estimation of the airborne noise improve-ment provided by this solution was carried out based on the guidelines of Annex D of the ISO 12354-1 standard.
To assess the suitability of the proposed solution for acoustic conditioning, sound absorption tests in diffuse field conditions were also carried out for each configuration. These tests were carried out in a reverberation chamber.
3.1. Validation of the Proposed Solution for Sound Insulation 3.1.1. Sound Reduction Index, R (dB)
To estimate the sound insulation properties of the presented solution, the sound re-duction index, R (dB), of the four proposed configurations was assessed.
The entire ISO 10140 standard is related to the laboratory measurement of sound in-sulation of building elements. The ISO 10140-2 standard [36] in particular indicates the procedure for the measurement of sound insulation to airborne noise in compliance with the ISO 10140-4 [37] and the ISO 10140-5 [38] standards.
Since a normalized transmission chamber as described in the ISO-10140-5 standard was not available in the Escola Politècnica Superior de Gandia (EPSG) laboratories, a re-duced size transmission chamber that reproduces the geometry of standard transmission chambers to scale was used. The design of this chamber was carried out according to the ISO 10140-5 standard, following a similar approach as described in [39]. The details of the design and building process of the chamber are presented in [40], where this chamber was used to evaluate the performance of new sustainable solutions for sound insulation. Some images of the setup for the tests are presented in Figure 6, where the chamber during one of the tests and the detail of the mounting of one of the proposed configurations in the sample holder can be seen. As can be observed, no studs were used during these tests, so the results should not be compared with usual double-leaf plasterboard systems, and should only be used to compare the proposed configurations.
(a)
(b)
Figure 6. Setup for the sound transmission tests: (a) the transmission chamber during one of the tests; (b) detail of one of the tested configurations placed in the sample holder.
A total of six configurations were assessed in the reduced size transmission chamber (Table 2). Each tested configuration consisted of a combination of some of these materials: non-perforated plasterboards (PB), the viscoelastic multilayer (VLM), the textile felt (FLT) and one of the perforated plasterboards (PRFx).
Besides the initial four proposed configurations formed by a non-perforated plaster-board, the viscoelastic multilayer and each of the perforated plasterboards, two additional configurations were tested to have further information to compare: one consisting of a sandwich of two non-perforated plasterboards and one layer of the textile felt, and a sec-ond one consisting of a sandwich of two non-perforated plasterboards and the viscoelastic multilayer.
Figure 6. Setup for the sound transmission tests: (a) the transmission chamber during one of the tests;(b) detail of one of the tested configurations placed in the sample holder.
A total of six configurations were assessed in the reduced size transmission chamber(Table 2). Each tested configuration consisted of a combination of some of these materials:non-perforated plasterboards (PB), the viscoelastic multilayer (VLM), the textile felt (FLT)and one of the perforated plasterboards (PRFx).
Table 2. Test configurations for the sound reduction index tests.
Test Configuration Description
1 PB + FLT + PB2 PB + VLM + PB3 PB + VLM + PRF14 PB + VLM + PRF25 PB + VLM + PRF36 PB + VLM + PRF4
Besides the initial four proposed configurations formed by a non-perforated plas-terboard, the viscoelastic multilayer and each of the perforated plasterboards, two addi-
Buildings 2022, 12, 123 7 of 20
tional configurations were tested to have further information to compare: one consist-ing of a sandwich of two non-perforated plasterboards and one layer of the textile felt,and a second one consisting of a sandwich of two non-perforated plasterboards and theviscoelastic multilayer.
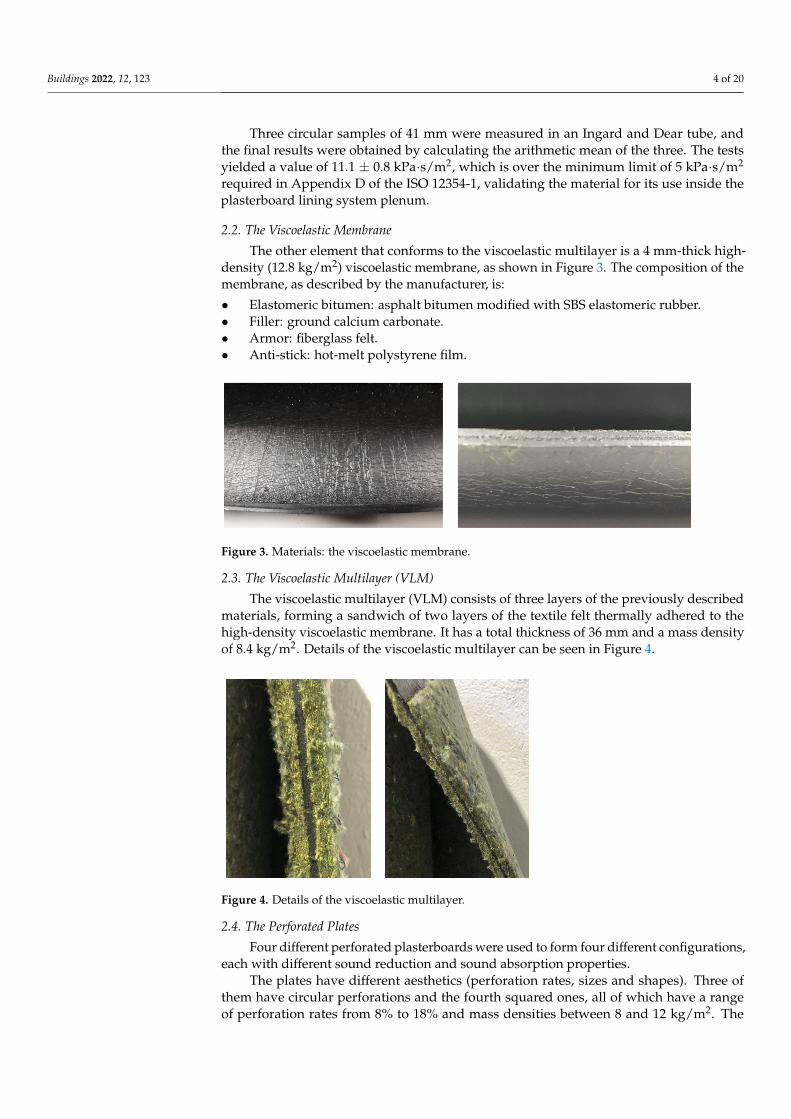
The results of each test are presented graphically in Figure 7. The sandwich configura-tions with the non-perforated plasterboards mark the upper and lower limits for the soundreduction index. In the case of the configurations with perforated plates, as expected, thoseusing plasterboards with higher density and lower perforation rate are the ones with betterperformance for sound insulation.
Buildings 2022, 12, x FOR PEER REVIEW 7 of 20
Table 2. Test configurations for the sound reduction index tests.
Test Configuration Description 1 PB + FLT + PB 2 PB + VLM + PB 3 PB + VLM + PRF1 4 PB + VLM + PRF2 5 PB + VLM + PRF3 6 PB + VLM + PRF4
The results of each test are presented graphically in Figure 7. The sandwich configu-rations with the non-perforated plasterboards mark the upper and lower limits for the sound reduction index. In the case of the configurations with perforated plates, as ex-pected, those using plasterboards with higher density and lower perforation rate are the ones with better performance for sound insulation.
Figure 7. Sound reduction index, R (dB), of the assessed configurations.
3.1.2. Estimation of the Airborne Sound Insulation One of the main objectives of the proposed solution is to provide good levels of noise
reduction improvement. Appendix D of the ISO 12354-1 standard [22] defines a procedure to estimate the sound reduction index improvement of additional layers (ΔRA). These es-timations are similar to the one proposed in the basic document for noise protection (DB-HR) [41], part of the Spanish Technical Building Code [42] published by the Spanish gov-ernment.
This section presents a prediction of the airborne sound insulation provided by the proposed solution. This prediction was obtained according to the ISO 12354-1 standard guidelines, starting from the estimated resonance frequency of the proposed solution. The different assembly elements are adjusted as far as possible until a value for its resonance frequency is obtained within the target range to improve sound insulation.
Figure 7. Sound reduction index, R (dB), of the assessed configurations.
3.1.2. Estimation of the Airborne Sound Insulation
One of the main objectives of the proposed solution is to provide good levels ofnoise reduction improvement. Appendix D of the ISO 12354-1 standard [22] definesa procedure to estimate the sound reduction index improvement of additional layers(∆RA). These estimations are similar to the one proposed in the basic document for noiseprotection (DB-HR) [41], part of the Spanish Technical Building Code [42] published by theSpanish government.
This section presents a prediction of the airborne sound insulation provided by theproposed solution. This prediction was obtained according to the ISO 12354-1 standardguidelines, starting from the estimated resonance frequency of the proposed solution. Thedifferent assembly elements are adjusted as far as possible until a value for its resonancefrequency is obtained within the target range to improve sound insulation.

Buildings 2022, 12, 123 8 of 20
To make these estimates, we start from the main sheet of mass m1 and a lining systemwith absorbent material of thickness d and a plate of mass m2 (see Figure 1). The resonantfrequency, f0, is calculated according to Equation (1):
f0 =10002π
√0.111
d
(1
m1+
1m2
). (1)
This resonant frequency, f0, is the main control parameter for the system’s design. It isvalid as long as the airflow resistivity is higher than 5 kPa·s/m2.
Since the main objective is that the proposed solution provides both sound absorptionand sound insulation, the assembly can be divided as follows: the main wall with thefirst textile felt and the viscoelastic membrane would be in charge of the sound insulationimprovement, in the most conservative case, and the second textile felt with the perforatedpanel (which must have the corresponding veil) would provide the sound absorptionimprovement part.
Considering the viscoelastic layer of mass m2 =6.8 kg/m2 and the 16 mm thicktextile felt with an airflow resistivity of 11.1 kPa·s/m2, Equation (1) must introduce massesof 70 kg/m2 upwards for the main sheet, which are much higher than the mass of theviscoelastic layer. This means that Equation (1) can be simplified and gives a fixed value:
f0 ≈ 53
√1
d·m2(2)
To achieve an improvement in airborne sound insulation, f0 must be less than 200 Hz(or not within the 200 Hz band). For the case under study, applying the available dataof each of the materials, the resonance frequency, f0, is in the range of 161 to 177 Hz,considering a margin between 14–16 mm of the textile felt (since it is known that itsthickness can be reduced due to material manipulation). If Table D.1 of the ISO 12354-1standard is applied, taking into account that f0 is rounded to the third-octave band towhich it belongs (in this case, 160 Hz, whose band is from 143 to 180 Hz), an improvementin the acoustic reduction index can be obtained using a lining, assuming metal or woodenstuds or slats are not directly connected to the primary structural element.
Applying the standard with a 2 dB security correction, we obtained the improvementof the sound reduction index presented in Table 3.
Table 3. Theoretical estimation of the sound reduction index improvement of additional layers.
Main sheet (kg/m2) 70 100 140 160 180 200 250 300 350
∆RA (dB) 10 9 8 7 6 5 3 2 1
For these estimates to be correct, the following conditions must be met:
• There must be continuity in the viscoelastic membrane.• The thickness of the textile felt should be kept between 14–16 mm, with a gap of
4–5 mm between the material and the main sheet.
The effect of the textile felt and the veil with the perforations of the plasterboard willalso be positive, but it is difficult to quantify it. However, if the perforation rate is too high,this improvement could also decrease.
An estimation of the sound reduction index improvement of additional layers fromexperimental data is presented in Table 4.

Buildings 2022, 12, 123 9 of 20
Table 4. Estimation of the sound reduction index improvement of additional layers, ∆RA (dB), fromexperimental data.
Main sheet(kg/m2) 70 100 140 160 180 200 250 300 350 400 500
∆RA(dB)
PB 14 13 12 11 10 9 7 6 5 4 2PRF1 3 2 1 - - - - - - - -PRF2 8 7 6 5 4 3 1 - - - -PRF3 8 7 6 5 4 3 1 - - - -PRF4 6 5 4 3 2 1 - - - - -
It must be taken into account that the assembly for these measurements did not followthe usual installation procedure since no studs or slats were used. They were carried outjust to compare the behavior of the different perforated plates. It is expected that in normalinstallation conditions, these levels of improvement could be higher.
3.2. Validation of the Proposed Solution for Acoustic Conditioning
To validate the presented solution as an effective solution for reverberation time con-trol, the sound absorption of the proposed solution in diffuse field conditions was evaluated.
Sound Absorption of the Complete Solution in Diffuse Field Conditions
The sound absorbing performance of the proposed solution was assessed with thefour perforated plasterboards, the main properties of which are described in Table 1. Anadditional test was carried out without any perforated plate over the viscoelastic multilayer.
These tests were conducted following the ISO 354 standard [43]. Other standards suchas the ISO 11654 [44] and the ASTM C423 [45] were also used to obtain additional results.The former considers the parameter αw, which is a weighted version of the absorptioncoefficient that allows representation of the absorption of a material with a unique value;the latter includes the 80 Hz band in the evaluated frequency range and also considers theparameters “sound absorption average” (SAA) and “noise reduction coefficient” (NRC).
In this case, the tests were carried out in the standard reverberation chamber of theEscola Politècnica Superior de Gandia, which has a volume of 238 m2 and a total surfacearea of 236 m2. The surface area of the assessed configurations was 11.4 m2. Some imagesfrom the tests are presented in Figure 8.
Buildings 2022, 12, x FOR PEER REVIEW 9 of 20
Table 4. Estimation of the sound reduction index improvement of additional layers, ΔRA (dB), from experimental data.
Main sheet (kg/m2) 70 100 140 160 180 200 250 300 350 400 500
ΔRA (dB)
PB 14 13 12 11 10 9 7 6 5 4 2 PRF1 3 2 1 - - - - - - - - PRF2 8 7 6 5 4 3 1 - - - - PRF3 8 7 6 5 4 3 1 - - - - PRF4 6 5 4 3 2 1 - - - - -
It must be taken into account that the assembly for these measurements did not fol-low the usual installation procedure since no studs or slats were used. They were carried out just to compare the behavior of the different perforated plates. It is expected that in normal installation conditions, these levels of improvement could be higher.
3.2. Validation of the Proposed Solution for Acoustic Conditioning To validate the presented solution as an effective solution for reverberation time con-
trol, the sound absorption of the proposed solution in diffuse field conditions was evalu-ated.
Sound Absorption of the Complete Solution in Diffuse Field Conditions The sound absorbing performance of the proposed solution was assessed with the
four perforated plasterboards, the main properties of which are described in Table 1. An additional test was carried out without any perforated plate over the viscoelastic multi-layer.
These tests were conducted following the ISO 354 standard [43]. Other standards such as the ISO 11654 [44] and the ASTM C423 [45] were also used to obtain additional results. The former considers the parameter αw, which is a weighted version of the absorp-tion coefficient that allows representation of the absorption of a material with a unique value; the latter includes the 80 Hz band in the evaluated frequency range and also con-siders the parameters “sound absorption average” (SAA) and “noise reduction coeffi-cient” (NRC).
In this case, the tests were carried out in the standard reverberation chamber of the Escola Politècnica Superior de Gandia, which has a volume of 238 m2 and a total surface area of 236 m2. The surface area of the assessed configurations was 11.4 m2. Some images from the tests are presented in Figure 8.
Figure 8. Sound absorption tests in the reverberation chamber of the EPSG–UPV.
Figure 9 shows the results of the sound absorption coefficient of the assessed config-urations in one-third of octave bands, and Tables 5 and 6 show the overall values accord-ing to standards ISO 11654 and ASTM C423, respectively.
Figure 8. Sound absorption tests in the reverberation chamber of the EPSG–UPV.
Figure 9 shows the results of the sound absorption coefficient of the assessed configu-rations in one-third of octave bands, and Tables 5 and 6 show the overall values accordingto standards ISO 11654 and ASTM C423, respectively.

Buildings 2022, 12, 123 10 of 20Buildings 2022, 12, x FOR PEER REVIEW 10 of 20
Figure 9. ISO 354 results for the assessed configurations.
As expected, the perforated plasterboards with higher perforation rates yield higher values for the sound absorption coefficient. It can also be seen that the absorption curve can also be tunned with the perforations of the plasterboards, but this is not the objective of this work.
Table 5. UNE-EN ISO 11654 results and classification.
VLM VLM + PRF1
VLM + PRF2
VLM + PRF3
VLM + PRF4
αw 0.60 (H) 0.65 0.55 0.55 0.65 CLASS C C D D C
Table 6. ASTM C423 results.
VLM VLM + PRF1
VLM + PRF2
VLM + PRF3
VLM + PRF4
NRC 0.60 0.70 0.60 0.55 0.70 SAA 0.58 0.70 0.60 0.56 0.68
4. An Example Application: A Radio Studio To validate the proposed solution in a real scenario, an installation in a couple of
enclosures destined to function as a radio studio was carried out. The enclosures are lo-cated on the top floor of one of the Escola Politècnica Superior de Gandia buildings. Figure 10 shows the building plan with the location of each room.
Figure 9. ISO 354 results for the assessed configurations.
Table 5. UNE-EN ISO 11654 results and classification.
VLM VLM +PRF1
VLM +PRF2
VLM +PRF3
VLM +PRF4
αw 0.60 (H) 0.65 0.55 0.55 0.65CLASS C C D D C
Table 6. ASTM C423 results.
VLM VLM +PRF1
VLM +PRF2
VLM +PRF3
VLM +PRF4
NRC 0.60 0.70 0.60 0.55 0.70SAA 0.58 0.70 0.60 0.56 0.68
As expected, the perforated plasterboards with higher perforation rates yield highervalues for the sound absorption coefficient. It can also be seen that the absorption curvecan also be tunned with the perforations of the plasterboards, but this is not the objectiveof this work.
4. An Example Application: A Radio Studio
To validate the proposed solution in a real scenario, an installation in a couple ofenclosures destined to function as a radio studio was carried out. The enclosures arelocated on the top floor of one of the Escola Politècnica Superior de Gandia buildings.Figure 10 shows the building plan with the location of each room.

Buildings 2022, 12, 123 11 of 20Buildings 2022, 12, x FOR PEER REVIEW 11 of 20
Figure 10. Building floor plans with the enclosures under study.
As observed in the building plan, the location and the characteristics of the enclosures are not favorable for a radio studio, as both of them are very small and are surrounded by common areas. The dimensions of the rooms are presented in Table 7.
Table 7. Dimensions of the enclosures.
Enclosure Volume (m3)
Total Area (m2)
Floor Area (m2)
Studio room 32.0 63 13 Control room 12.3 39 6
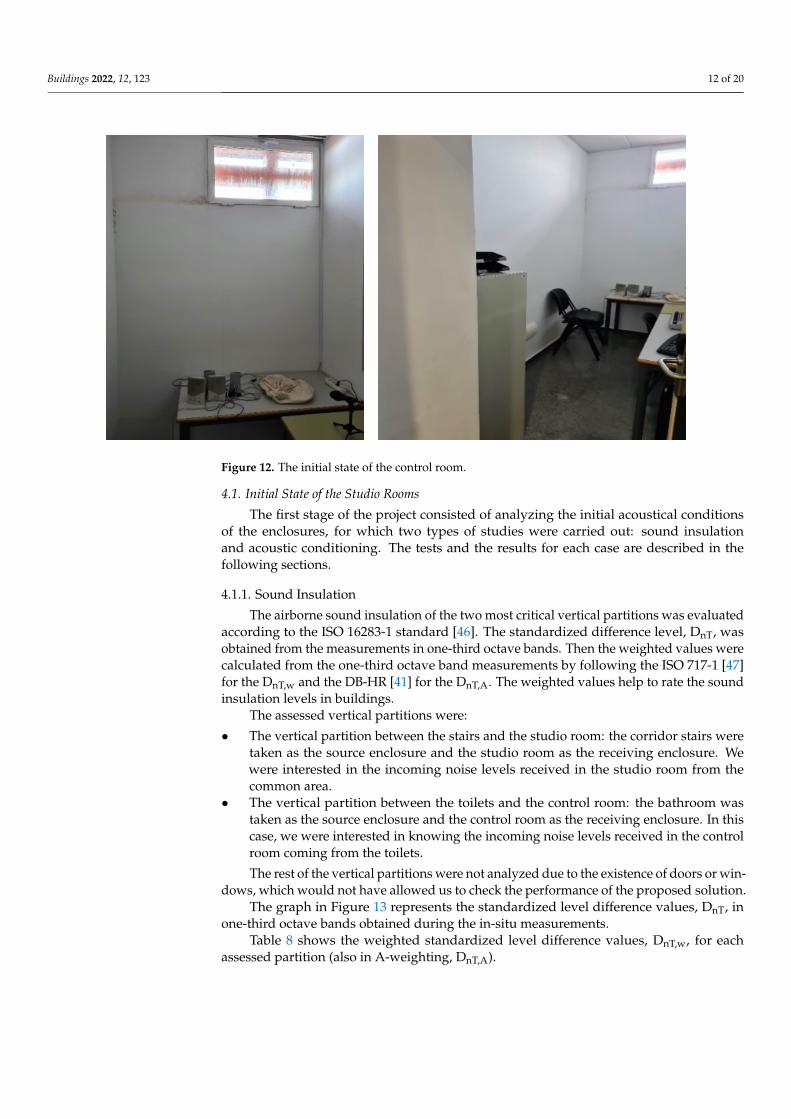
Some pictures of the studio room are presented in Figure 11 and photographs of the control room in Figure 12.
Figure 11. The initial state of the studio room.
Figure 12. The initial state of the control room.
Figure 10. Building floor plans with the enclosures under study.
As observed in the building plan, the location and the characteristics of the enclosuresare not favorable for a radio studio, as both of them are very small and are surrounded bycommon areas. The dimensions of the rooms are presented in Table 7.
Table 7. Dimensions of the enclosures.
Enclosure Volume(m3)
Total Area(m2)
Floor Area(m2)
Studio room 32.0 63 13Control room 12.3 39 6
Some pictures of the studio room are presented in Figure 11 and photographs of thecontrol room in Figure 12.
Buildings 2022, 12, x FOR PEER REVIEW 11 of 20
Figure 10. Building floor plans with the enclosures under study.
As observed in the building plan, the location and the characteristics of the enclosures are not favorable for a radio studio, as both of them are very small and are surrounded by common areas. The dimensions of the rooms are presented in Table 7.
Table 7. Dimensions of the enclosures.
Enclosure Volume (m3)
Total Area (m2)
Floor Area (m2)
Studio room 32.0 63 13 Control room 12.3 39 6
Some pictures of the studio room are presented in Figure 11 and photographs of the control room in Figure 12.
Figure 11. The initial state of the studio room.
Figure 12. The initial state of the control room.
Figure 11. The initial state of the studio room.
Buildings 2022, 12, 123 12 of 20
Buildings 2022, 12, x FOR PEER REVIEW 11 of 20
Figure 10. Building floor plans with the enclosures under study.
As observed in the building plan, the location and the characteristics of the enclosures are not favorable for a radio studio, as both of them are very small and are surrounded by common areas. The dimensions of the rooms are presented in Table 7.
Table 7. Dimensions of the enclosures.
Enclosure Volume (m3)
Total Area (m2)
Floor Area (m2)
Studio room 32.0 63 13 Control room 12.3 39 6
Some pictures of the studio room are presented in Figure 11 and photographs of the control room in Figure 12.
Figure 11. The initial state of the studio room.
Figure 12. The initial state of the control room. Figure 12. The initial state of the control room.
4.1. Initial State of the Studio Rooms
The first stage of the project consisted of analyzing the initial acoustical conditionsof the enclosures, for which two types of studies were carried out: sound insulationand acoustic conditioning. The tests and the results for each case are described in thefollowing sections.
4.1.1. Sound Insulation
The airborne sound insulation of the two most critical vertical partitions was evaluatedaccording to the ISO 16283-1 standard [46]. The standardized difference level, DnT, wasobtained from the measurements in one-third octave bands. Then the weighted values werecalculated from the one-third octave band measurements by following the ISO 717-1 [47]for the DnT,w and the DB-HR [41] for the DnT,A. The weighted values help to rate the soundinsulation levels in buildings.
The assessed vertical partitions were:
• The vertical partition between the stairs and the studio room: the corridor stairs weretaken as the source enclosure and the studio room as the receiving enclosure. Wewere interested in the incoming noise levels received in the studio room from thecommon area.
• The vertical partition between the toilets and the control room: the bathroom wastaken as the source enclosure and the control room as the receiving enclosure. In thiscase, we were interested in knowing the incoming noise levels received in the controlroom coming from the toilets.
The rest of the vertical partitions were not analyzed due to the existence of doors or win-dows, which would not have allowed us to check the performance of the proposed solution.
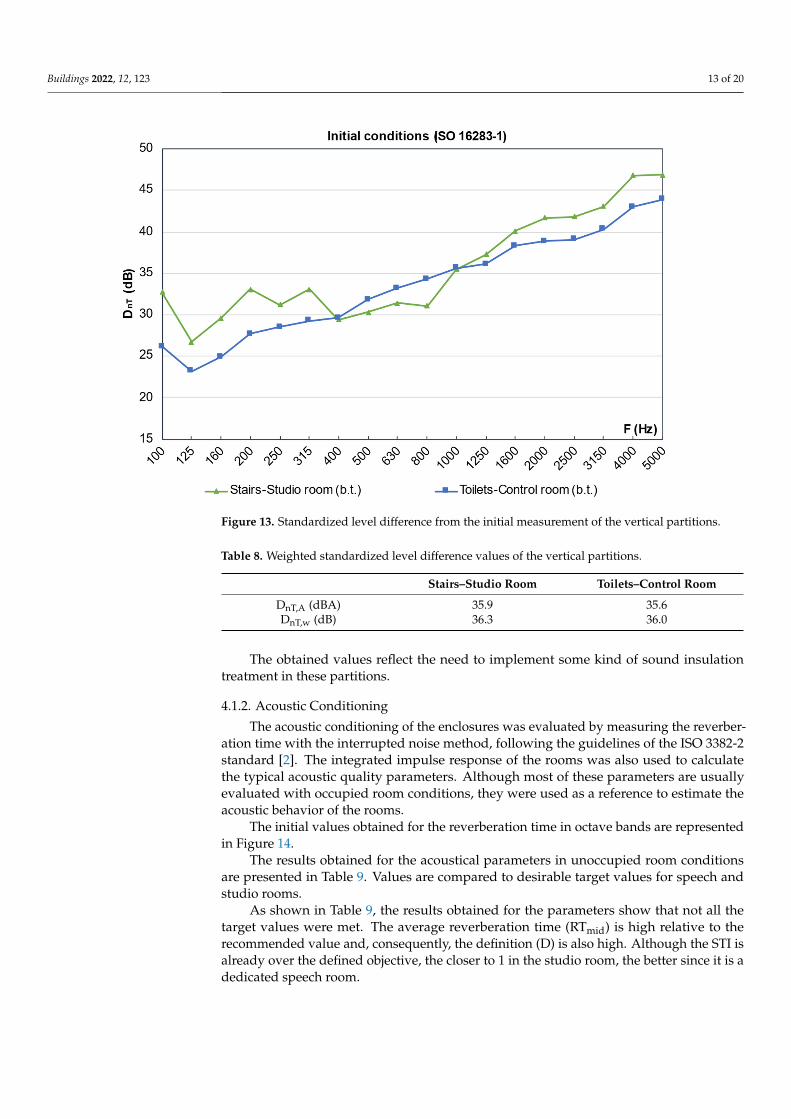
The graph in Figure 13 represents the standardized level difference values, DnT, inone-third octave bands obtained during the in-situ measurements.
Table 8 shows the weighted standardized level difference values, DnT,w, for eachassessed partition (also in A-weighting, DnT,A).
Buildings 2022, 12, 123 13 of 20
Buildings 2022, 12, x FOR PEER REVIEW 12 of 20
4.1. Initial State of the Studio Rooms The first stage of the project consisted of analyzing the initial acoustical conditions of
the enclosures, for which two types of studies were carried out: sound insulation and acoustic conditioning. The tests and the results for each case are described in the following sections.
4.1.1. Sound Insulation The airborne sound insulation of the two most critical vertical partitions was evalu-
ated according to the ISO 16283-1 standard [46]. The standardized difference level, DnT, was obtained from the measurements in one-third octave bands. Then the weighted val-ues were calculated from the one-third octave band measurements by following the ISO 717-1 [47] for the DnT,w and the DB-HR [41] for the DnT,A. The weighted values help to rate the sound insulation levels in buildings.
The assessed vertical partitions were: • The vertical partition between the stairs and the studio room: the corridor stairs were
taken as the source enclosure and the studio room as the receiving enclosure. We were interested in the incoming noise levels received in the studio room from the common area.
• The vertical partition between the toilets and the control room: the bathroom was taken as the source enclosure and the control room as the receiving enclosure. In this case, we were interested in knowing the incoming noise levels received in the control room coming from the toilets. The rest of the vertical partitions were not analyzed due to the existence of doors or
windows, which would not have allowed us to check the performance of the proposed solution.
The graph in Figure 13 represents the standardized level difference values, DnT, in one-third octave bands obtained during the in-situ measurements.
Figure 13. Standardized level difference from the initial measurement of the vertical partitions.
Table 8 shows the weighted standardized level difference values, DnT,w, for each as-sessed partition (also in A-weighting, DnT,A).
Figure 13. Standardized level difference from the initial measurement of the vertical partitions.
Table 8. Weighted standardized level difference values of the vertical partitions.
Stairs–Studio Room Toilets–Control Room
DnT,A (dBA) 35.9 35.6DnT,w (dB) 36.3 36.0
The obtained values reflect the need to implement some kind of sound insulationtreatment in these partitions.
4.1.2. Acoustic Conditioning
The acoustic conditioning of the enclosures was evaluated by measuring the reverber-ation time with the interrupted noise method, following the guidelines of the ISO 3382-2standard [2]. The integrated impulse response of the rooms was also used to calculatethe typical acoustic quality parameters. Although most of these parameters are usuallyevaluated with occupied room conditions, they were used as a reference to estimate theacoustic behavior of the rooms.
The initial values obtained for the reverberation time in octave bands are representedin Figure 14.
The results obtained for the acoustical parameters in unoccupied room conditionsare presented in Table 9. Values are compared to desirable target values for speech andstudio rooms.
As shown in Table 9, the results obtained for the parameters show that not all thetarget values were met. The average reverberation time (RTmid) is high relative to therecommended value and, consequently, the definition (D) is also high. Although the STI isalready over the defined objective, the closer to 1 in the studio room, the better since it is adedicated speech room.

Buildings 2022, 12, 123 14 of 20
Buildings 2022, 12, x FOR PEER REVIEW 13 of 20
Table 8. Weighted standardized level difference values of the vertical partitions.
Stairs–Studio Room Toilets–Control Room DnT,A (dBA) 35.9 35.6 DnT,w (dB) 36.3 36.0
The obtained values reflect the need to implement some kind of sound insulation treatment in these partitions.
4.1.2. Acoustic Conditioning The acoustic conditioning of the enclosures was evaluated by measuring the rever-
beration time with the interrupted noise method, following the guidelines of the ISO 3382-2 standard [2]. The integrated impulse response of the rooms was also used to calculate the typical acoustic quality parameters. Although most of these parameters are usually evaluated with occupied room conditions, they were used as a reference to estimate the acoustic behavior of the rooms.
The initial values obtained for the reverberation time in octave bands are represented in Figure 14.
(a) (b)
Figure 14. The initial reverberation time of the enclosures: (a) studio room; (b) control room.
The results obtained for the acoustical parameters in unoccupied room conditions are presented in Table 9. Values are compared to desirable target values for speech and studio rooms.
Table 9. Measured parameters of the enclosures under study.
Acoustical Parameter Studio Room (Unoccupied)
Control Room (Unoccupied)
Target Value (Occupied)
RTmid (s), (500 Hz–1 kHz)
0.9 1.0 0.2 ≤ RTmid ≤ 0.4
STI 0.72 0.73 STI ≥ 0.60 C50 (dB),
(500 Hz–4 kHz) 3.8 4.5 >2 dB
Definition, D, (125 Hz–4 kHz) 0.30 0.33 D > 0.50
As shown in Table 9, the results obtained for the parameters show that not all the target values were met. The average reverberation time (RTmid) is high relative to the rec-ommended value and, consequently, the definition (D) is also high. Although the STI is
Figure 14. The initial reverberation time of the enclosures: (a) studio room; (b) control room.
Table 9. Measured parameters of the enclosures under study.
Acoustical Parameter Studio Room(Unoccupied)
Control Room(Unoccupied)
Target Value(Occupied)
RTmid (s),(500 Hz–1 kHz) 0.9 1.0 0.2 ≤ RTmid ≤ 0.4
STI 0.72 0.73 STI ≥ 0.60
C50 (dB),(500 Hz–4 kHz) 3.8 4.5 >2 dB
Definition, D,(125 Hz–4 kHz) 0.30 0.33 D > 0.50
4.2. Acoustic Treatment
The multifunctional solution proposed in this work was perfect for this project since itallowed us to treat sound insulation and acoustic conditioning problems at once.
From the results of the four different configurations previously assessed (presented inSection 3.1), it can be seen that each of the four perforated plasterboard lining configurationsprovide different benefits, so a combination of them was used according to the needs ofeach room and vertical partition. Figure 15 shows the distribution of the perforatedplasterboards, detailed in Table 1, over the base walls.
Buildings 2022, 12, x FOR PEER REVIEW 14 of 20
already over the defined objective, the closer to 1 in the studio room, the better since it is a dedicated speech room.
4.2. Acoustic Treatment The multifunctional solution proposed in this work was perfect for this project since
it allowed us to treat sound insulation and acoustic conditioning problems at once. From the results of the four different configurations previously assessed (presented
in Section 3.1), it can be seen that each of the four perforated plasterboard lining configu-rations provide different benefits, so a combination of them was used according to the needs of each room and vertical partition. Figure 15 shows the distribution of the perfo-rated plasterboards, detailed in Table 1, over the base walls.
The PB + VLM + PRF4 was used in the wall between the toilets and the control room vertical partition. Despite not being the best for sound insulation, this partition required a high degree of absorption since the loudspeakers of the control room were going to be located in the front wall, which also contains the window between the two rooms, so it is highly reflective. In the case of the wall between the stairs and the studio room, the PB + VLM + PRF2 configuration has been used. In this case, the selection was mainly dictated by its better properties for sound insulation since sound absorption was not so critical in this room.
Figure 15. Distribution of the different perforated plasterboards over the rooms.
Some pictures of the rooms after installing the different configurations of the pro-posed solution can be seen in Figure 16.
(a) (b)
Figure 15. Distribution of the different perforated plasterboards over the rooms.

Buildings 2022, 12, 123 15 of 20
The PB + VLM + PRF4 was used in the wall between the toilets and the control roomvertical partition. Despite not being the best for sound insulation, this partition requireda high degree of absorption since the loudspeakers of the control room were going to belocated in the front wall, which also contains the window between the two rooms, so it ishighly reflective. In the case of the wall between the stairs and the studio room, the PB +VLM + PRF2 configuration has been used. In this case, the selection was mainly dictatedby its better properties for sound insulation since sound absorption was not so critical inthis room.
Some pictures of the rooms after installing the different configurations of the proposedsolution can be seen in Figure 16.
Buildings 2022, 12, x FOR PEER REVIEW 14 of 20
already over the defined objective, the closer to 1 in the studio room, the better since it is a dedicated speech room.
4.2. Acoustic Treatment The multifunctional solution proposed in this work was perfect for this project since
it allowed us to treat sound insulation and acoustic conditioning problems at once. From the results of the four different configurations previously assessed (presented
in Section 3.1), it can be seen that each of the four perforated plasterboard lining configu-rations provide different benefits, so a combination of them was used according to the needs of each room and vertical partition. Figure 15 shows the distribution of the perfo-rated plasterboards, detailed in Table 1, over the base walls.
The PB + VLM + PRF4 was used in the wall between the toilets and the control room vertical partition. Despite not being the best for sound insulation, this partition required a high degree of absorption since the loudspeakers of the control room were going to be located in the front wall, which also contains the window between the two rooms, so it is highly reflective. In the case of the wall between the stairs and the studio room, the PB + VLM + PRF2 configuration has been used. In this case, the selection was mainly dictated by its better properties for sound insulation since sound absorption was not so critical in this room.
Figure 15. Distribution of the different perforated plasterboards over the rooms.
Some pictures of the rooms after installing the different configurations of the pro-posed solution can be seen in Figure 16.
(a) (b)
Figure 16. Images of the rooms with the proposed multifunctional solution installed: (a) studio room;(b) control room.
4.3. Acoustic Behavior after Treatment4.3.1. Sound Insulation
The comparison between the results for the standardized level difference before andafter applying the proposed solution in the stairs–studio room vertical partition is presentedin Figure 17. It can be affirmed that in almost every one-third octave band, especially inmedium and high frequencies, the proposed solution improves the standardized leveldifference of the treated wall.
Table 10 presents the values of the standardized weighted level difference DnT,wand also the A-weighted version, DnT,A, before and after the acoustic treatment. As canbe seen, the installed solution provided a 6 dB improvement in sound insulation in theweighted values.
The comparison between the results for the standardized level difference before andafter by applying the proposed solution in the stairs–studio room vertical partition ispresented in Figure 18. Again, it can be seen that the proposed solution improves the soundinsulation in almost every one-third octave band.

Buildings 2022, 12, 123 16 of 20
Buildings 2022, 12, x FOR PEER REVIEW 15 of 20
Figure 16. Images of the rooms with the proposed multifunctional solution installed: (a) studio room; (b) control room.
4.3. Acoustic Behavior after Treatment 4.3.1. Sound Insulation
The comparison between the results for the standardized level difference before and after applying the proposed solution in the stairs–studio room vertical partition is pre-sented in Figure 17. It can be affirmed that in almost every one-third octave band, espe-cially in medium and high frequencies, the proposed solution improves the standardized level difference of the treated wall.
Figure 17. Standardized level difference of the stairs–studio room vertical partition.
Table 10 presents the values of the standardized weighted level difference DnT,w and also the A-weighted version, DnT,A, before and after the acoustic treatment. As can be seen, the installed solution provided a 6 dB improvement in sound insulation in the weighted values.
Table 10. Weighted standardized level difference values for the stairs–studio room vertical parti-tion, before and after treatment.
Before Treatment After Treatment Improvement DnT,A (dBA) 35.9 41.4 5.5 DnT,w (dB) 36.3 42.3 6.0
The comparison between the results for the standardized level difference before and after by applying the proposed solution in the stairs–studio room vertical partition is pre-sented in Figure 18. Again, it can be seen that the proposed solution improves the sound insulation in almost every one-third octave band.
Figure 17. Standardized level difference of the stairs–studio room vertical partition.
Table 10. Weighted standardized level difference values for the stairs–studio room vertical partition,before and after treatment.
Before Treatment After Treatment Improvement
DnT,A (dBA) 35.9 41.4 5.5DnT,w (dB) 36.3 42.3 6.0
Buildings 2022, 12, x FOR PEER REVIEW 16 of 20
Figure 18. Standardized level difference of the toilets–control room vertical partition.
In this case, as expected, the sound insulation improvement is lower than in the pre-vious one. As shown in Table 11, there is an improvement of almost 4 dB in the weighted standardized level difference values after applying the acoustic treatment.
Table 11. Weighted standardized level difference values for the toilets–control room vertical parti-tion, before and after treatment.
Before Treatment After Treatment Improvement DnT,A (dBA) 35.6 39.3 3.7 DnT,w (dB) 36.0 39.8 3.8
4.3.2. Acoustic Conditioning To validate the proposed solution, the same in-situ measurements were made as in
the assessment of the initial condition of the rooms. The final values obtained for the re-verberation time in octave bands are represented in Figure 19. As can be seen in the re-sults, the reverberation time was reduced considerably. It is expected to be reduced a little bit more, especially in mid and high frequencies, when the rooms are populated with peo-ple and furniture. Control room compliance was not validated according to the EBU Tech 3276 recommendations [48] since it was not the objective of this work. Nevertheless, the room was left in optimal conditions to comply with them.
Figure 18. Standardized level difference of the toilets–control room vertical partition.

Buildings 2022, 12, 123 17 of 20
In this case, as expected, the sound insulation improvement is lower than in theprevious one. As shown in Table 11, there is an improvement of almost 4 dB in theweighted standardized level difference values after applying the acoustic treatment.
Table 11. Weighted standardized level difference values for the toilets–control room vertical partition,before and after treatment.
Before Treatment After Treatment Improvement
DnT,A (dBA) 35.6 39.3 3.7DnT,w (dB) 36.0 39.8 3.8
4.3.2. Acoustic Conditioning
To validate the proposed solution, the same in-situ measurements were made as inthe assessment of the initial condition of the rooms. The final values obtained for thereverberation time in octave bands are represented in Figure 19. As can be seen in theresults, the reverberation time was reduced considerably. It is expected to be reduced alittle bit more, especially in mid and high frequencies, when the rooms are populated withpeople and furniture. Control room compliance was not validated according to the EBUTech 3276 recommendations [48] since it was not the objective of this work. Nevertheless,the room was left in optimal conditions to comply with them.
Buildings 2022, 12, x FOR PEER REVIEW 17 of 20
(a) (b)
Figure 19. The final reverberation time of the rooms: (a) studio room; (b) control room.
A comparison of the acoustic parameter values obtained before and after the acoustic treatment is presented in Table 12.
Table 12. Comparison of the acoustic parameters of the rooms.
Parameter Studio Room (Unoccupied)
Control Room (Unoccupied)
Target Value (Occupied)
Before Treat.
After Treat.
Before Treat.
After Treat.
RTmid (s), (500 Hz–1 kHz)
0.9 0.3 1.0 0.2 0.2 ≤ RTmid ≤ 0.4
STI 0.72 0.91 0.73 0.91 ≥0.60 C50 (dB),
(500 Hz–4 kHz) 3.8 15.2 4.5 19.5 >2
Definition, D, (125 Hz–4 kHz) 0.30 0.97 0.30 0.99 >0.50
The average reverberation time (RTmid) decreased compared to the initial state, and with it, the rest of the acoustic quality parameters also improved considerably. This is due to the perforated plasterboards and the highly absorbent textile felt of the viscoelastic multilayer material used in the plenum.
5. Discussion A multifunctional solution that can be used to improve sound insulation and acoustic
conditioning simultaneously has been presented. This means a significant saving in in-stallation costs.
Four different configurations have been assessed, each one with different aesthetics (perforation rates, sizes and shapes), yielding results of direct application to the market.
It has been proven that the combination of the viscoelastic multilayer with the perfo-rated plates can be used for acoustic conditioning, yielding values over 0.5 for the sound absorption coefficient in all the interest range for building acoustics. The higher values were reached with perforation rates between 16-18% and diameters or square sides of 12mm. These results could be tuned by making controlled changes in the air plenum or the perforation rate and size.
Figure 19. The final reverberation time of the rooms: (a) studio room; (b) control room.
A comparison of the acoustic parameter values obtained before and after the acoustictreatment is presented in Table 12.
The average reverberation time (RTmid) decreased compared to the initial state, andwith it, the rest of the acoustic quality parameters also improved considerably. This isdue to the perforated plasterboards and the highly absorbent textile felt of the viscoelasticmultilayer material used in the plenum.

Buildings 2022, 12, 123 18 of 20
Table 12. Comparison of the acoustic parameters of the rooms.
Parameter Studio Room(Unoccupied)
Control Room(Unoccupied)
Target Value(Occupied)
BeforeTreat.
AfterTreat.
BeforeTreat.
AfterTreat.
RTmid (s),(500 Hz–1 kHz) 0.9 0.3 1.0 0.2 0.2 ≤ RTmid ≤ 0.4
STI 0.72 0.91 0.73 0.91 ≥0.60
C50 (dB),(500 Hz–4 kHz) 3.8 15.2 4.5 19.5 >2
Definition, D,(125 Hz–4 kHz) 0.30 0.97 0.30 0.99 >0.50
5. Discussion
A multifunctional solution that can be used to improve sound insulation and acous-tic conditioning simultaneously has been presented. This means a significant saving ininstallation costs.
Four different configurations have been assessed, each one with different aesthetics(perforation rates, sizes and shapes), yielding results of direct application to the market.
It has been proven that the combination of the viscoelastic multilayer with the perfo-rated plates can be used for acoustic conditioning, yielding values over 0.5 for the soundabsorption coefficient in all the interest range for building acoustics. The higher valueswere reached with perforation rates between 16-18% and diameters or square sides of12mm. These results could be tuned by making controlled changes in the air plenum or theperforation rate and size.
It has also been proven that besides the excellent performance for acoustic conditioning,the solution also provides good levels of improvement in noise reduction. It is foreseeablethat some of these levels of improvement could be increased with some adjustments inthe viscoelastic multilayer. The increase of the mass density of the viscoelastic membranewould increase the levels of improvement in noise reduction, and the increase in thethickness of the textile felt would improve the sound absorption of the complete solution.However, it has to be taken into account that these changes require an analysis to find agood compromise between the modifications and the improvements provided by them.Therefore, these studies are left for future works.
Finally, two small enclosures with unfavorable acoustic conditioning and soundinsulation conditions were treated with the proposed multifunctional solution to functionas a radio studio. The poor initial acoustic conditions were revealed during the analysis ofthe initial in-situ measurements. After treating the rooms with the proposed multifunctionalsolution, improvements between 4 and 6 dB in the weighted standardized difference levelswere obtained, and the acoustic quality parameters also improved considerably.
This study shows that these two usual acoustic problems in building acoustics can beaddressed with the same solution.
Author Contributions: Conceptualization, J.A.; methodology, J.A.; validation, J.A., R.d.R. and J.C.R.;formal analysis, J.A.; investigation, J.A. and J.C.R.; resources, J.A. and R.d.R.; data curation, J.C.R.;writing—original draft preparation, J.C.R.; writing—review and editing, J.A., R.d.R. and J.C.R.;supervision, J.A.; project administration, J.A. and R.d.R.; funding acquisition, J.A. and R.d.R. Allauthors have read and agreed to the published version of the manuscript.

Buildings 2022, 12, 123 19 of 20
Funding: This work is included within the project IMINOA/2019/110: DESARROLLO DE SISTEMADE AISLAMIENTO Y ACONDICIONAMIENTO ACÚSTICO, through the program PROYECTOSDE INNOVACIÓN DE PYME (INNOVA-CV), in the action INNOVACIÓN PYME. INNOVACIÓNDE PRODUCTO (INNOVAProD-CV) of the Institut Valencià de Competitivitat Empresarial (IVACE).It has also been financially supported by the Conselleria de Innovación, Universidades, Ciencia ySociedad - Generalitat Valenciana, through the ACIF-2020 program (grant number ACIF/2020/401),and the European Social Fund.
Conflicts of Interest: The authors declare no conflict of interest.
References1. Kuerer, R.C. Classes of Acoustical Comfort in Housing: Improved Information about Noise Control in Buildings. Appl. Acoust.
2002, 52, 197–210. [CrossRef]2. Huang, L.; Zhu, Y.; Ouyang, Q.; Cao, B. A Study on the Effects of Thermal, Luminous, and Acoustic Environments on Indoor
Environmental Comfort in Offices. Build. Environ. 2012, 49, 304–309. [CrossRef]3. Hongisto, V.; Mäkilä, M.; Suokas, M. Satisfaction with Sound Insulation in Residential Dwellings—The Effect of Wall Construction.
Build. Environ. 2015, 85, 309–320. [CrossRef]4. Rychtáriková, M.; Muellner, H.; Chmelík, V.; Roozen, N.B.; Urbán, D.; Garcia, D.P.; Glorieux, C. Perceived Loudness of Neighbour
Sounds Heard Through Heavy and Light-Weight Walls with Equal Rw + C50–5000. Acta Acust. United Acust. 2016, 102, 58–66.[CrossRef]
5. Alonso, A.; Patricio, J.; Suárez, R.; Escandón, R. Acoustical Retrofit of Existing Residential Buildings: Requirements andRecommendations for Sound Insulation between Dwellings in Europe and Other Countries Worldwide. Build. Environ. 2020, 174,10677. [CrossRef]
6. Liao, G.; Luan, C.; Wang, Z.; Liu, J.; Yao, X.; Fu, J. Acoustic Metamaterials: A Review of Theories, Structures, FabricationApproaches, and Applications. Adv. Mater. Technol. 2021, 6, 1–29. [CrossRef]
7. Kumar, S.; Lee, H. The Present and Future Role of Acoustic Metamaterials for Architectural and Urban Noise Mitigations.Acoustics 2019, 1, 590–607. [CrossRef]
8. Beranek, L.L.; Work, G.A. Sound Transmission through Multiple Structures Containing Flexible Blankets. J. Acoust. Soc. Am. 1949,21, 419–428. [CrossRef]
9. Alba, J.; Marant, V.; Aguilera, J.L.; Ramis, J.; del Rey, R. Technical Note: Prediction Models of Airborne Sound Insulation ofMultilayer Materials with Viscoelastic Thin Sheets. Build. Acoust. 2008, 15, 325–334. [CrossRef]
10. Rubino, C.; Bonet Aracil, M.; Gisbert-Payá, J.; Liuzzi, S.; Stefanizzi, P.; Zamorano Cantó, M.; Martellotta, F. Composite Eco-FriendlySound Absorbing Materials Made of Recycled Textile Waste and Biopolymers. Materials 2019, 12, 4020. [CrossRef]
11. Padhye, R.; Nayak, R. Acoustic Textiles. Textile Science and Clothing Technology; Springer: Melbourne, Australia, 2016.12. Seddeq, H.S.; Aly, N.M.; Marwa, A.A.; Elshakankery, M.H. Investigation on Sound Absorption Properties for Recycled Fibrous
Materials. J. Ind. Text. 2013, 43, 56–73. [CrossRef]13. Arenas, J.P.; Sakagami, K. Sustainable Acoustic Materials. Sustainability 2020, 12, 6540. [CrossRef]14. Arenas, J.P.; del Rey, R.; Alba, J.; Oltra, R. Sound-Absorption Properties of Materials Made of Esparto Grass Fibers. Sustainability
2020, 12, 5533. [CrossRef]15. Parlato, M.C.M.; Porto, S.M.C. Organized Framework of Main Possible Applications of Sheep Wool Fibers in Building Components.
Sustainability 2020, 12, 761. [CrossRef]16. Arenas, J.P.; Asdrubali, F. Eco-Materials with Noise Reduction Properties. In Handbook of Ecomaterials; Springer International
Publishing: Cham, Switzerland, 2019; Volume 5, pp. 3031–3056. [CrossRef]17. Buratti, C.; Belloni, E.; Lascaro, E.; Merli, F.; Ricciardi, P. Rice Husk Panels for Building Applications: Thermal, Acoustic and
Environmental Characterization and Comparison with Other Innovative Recycled Waste Materials. Constr. Build. Mater. 2018,171, 338–349. [CrossRef]
18. del Rey, R.; Berto, L.; Alba, J.; Arenas, J.P. Acoustic Characterization of Recycled Textile Materials Used as Core Elements in NoiseBarriers. Noise Control Eng. J. 2015, 63, 439–447. [CrossRef]
19. Asdrubali, F.; Schiavoni, S.; Horoshenkov, K.V. A Review of Sustainable Materials for Acoustic Applications. Build. Acoust. 2012,19, 283–312. [CrossRef]
20. Pereira, A.; Gaspar, A.; Mendes, P.A.; Mateus, D.; Carbajo, J.; Ramis, J.; Poveda, P. On the Use of Perforated Sound AbsorptionSystems for Variable Acoustics Room Design. Buildings 2021, 11, 543. [CrossRef]
21. Cucharero, J.; Hänninen, T.; Makkonen, M.; Lokki, T. Acoustic Coatings—A Discreet Way to Control Acoustic Environment. Front.Built Environ. 2021, 7, 665332. [CrossRef]
22. ISO 12354-1:2017. Building Acoustics—Estimation of Acoustic Performance of Buildings from the Performance of Elements—Part 1:Airborne Sound Insulation between Rooms; International Organization for Standardization: Geneva, Switzerland, 2017.
23. ISO 9053-1:2018. Acoustics—Determination of Airflow Resistance—Part 1: Static Airflow Method; International Organization forStandardization: Geneva, Switzerland, 2018.

Buildings 2022, 12, 123 20 of 20
24. ISO 9053-2:2020. Acoustics—Determination of Airflow Resistance—Part 2: Alternating Airflow Method; International Organization forStandardization: Geneva, Switzerland, 2020.
25. ASTM C522-03. Standard Test Method for Airflow Resistance of Acoustical Materials; ASTM International: West Conshohocken, PA,USA, 2016. [CrossRef]
26. Stinson, M.R.; Daigle, G.A. Electronic System for the Measurement of Flow Resistance. J. Acoust. Soc. Am. 1988, 83, 2422–2428.[CrossRef]
27. Ingard, K.U.; Dear, T.A. Measurement of Acoustic Flow Resistance. J. Sound Vib. 1985, 103, 567–572. [CrossRef]28. Woodcock, R.; Hodgson, M. Acoustic Methods for Determining the Effective Flow Resistivity of Fibrous Materials. J. Sound Vib.
1992, 153, 186–191. [CrossRef]29. Ren, M.; Jacobsen, F. A Method of Measuring the Dynamic Flow Resistance and Reactance of Porous Materials. Appl. Acoust.
1993, 39, 265–276. [CrossRef]30. Picard, M.A.; Solana, P.; Urchueguía, J.F. A Method of Measuring the Dynamic Flow Resistance and the Acoustic Measurement of
the Effective Static Flow Resistance in Stratified Rockwool Samples. J. Sound Vib. 1998, 216, 495–505. [CrossRef]31. Sebaa, N.; Fellah, Z.E.A.; Fellah, M.; Lauriks, W.; Depollier, C. Measuring Flow Resistivity of Porous Material via Acoustic
Reflected Waves. J. Appl. Phys. 2005, 98, 084901. [CrossRef]32. Panneton, R.; Olny, X. Acoustical Determination of the Parameters Governing Viscous Dissipation in Porous Media. J. Acoust. Soc.
Am. 2006, 119, 2027–2040. [CrossRef]33. Doutres, O.; Salissou, Y.; Atalla, N.; Panneton, R. Evaluation of the Acoustic and Non-Acoustic Properties of Sound Absorbing
Materials Using a Three-Microphone Impedance Tube. Appl. Acoust. 2010, 71, 506–509. [CrossRef]34. Dragonetti, R.; Ianniello, C.; Romano, R.A. Measurement of the Resistivity of Porous Materials with an Alternating Air-Flow
Method. J. Acoust. Soc. Am. 2011, 129, 753–764. [CrossRef]35. Alba, J.; Arenas, J.P.; del Rey, R.; Rodríguez, J.C. An Electroacoustic Method for Measuring Airflow Resistivity of Porous
Sound-Absorbing Materials. Appl. Acoust. 2019, 150, 132–137. [CrossRef]36. ISO 10140-2:2021. Acoustics—Laboratory Measurement of Sound Insulation of Building Elements—Part 2: Measurement of Airborne
Sound Insulation; International Organization for Standardization: Geneva, Switzerland, 2021.37. ISO 10140-4:2021. Acoustics—Laboratory Measurement of Sound Insulation of Building Elements—Part 4: Measurement Procedures and
Requirements; International Organization for Standardization: Geneva, Switzerland, 2021.38. ISO 10140-5:2021. Acoustics—Laboratory Measurement of Sound Insulation of Building Elements—Part 5: Requirements for Test Facilities
and Equipment; International Organization for Standardization: Geneva, Switzerland, 2021.39. Godinho, L.; Masgalos, R.; Pereira, A.; Branco, F.G. On the Use of a Small-Sized Acoustic Chamber for the Analysis of Impact
Sound Reduction by Floor Coverings. Noise Control Eng. J. 2010, 58, 658–668. [CrossRef]40. del Rey, R.; Alba, J.; Rodríguez, J.C.; Bertó, L. Characterization of New Sustainable Acoustic Solutions in a Reduced Sized
Transmission Chamber. Buildings 2019, 9, 60. [CrossRef]41. Ministerio de Fomento de España. Documento Básico HR Protección Frente al Ruido (DB-HR). Available online: https://www.
codigotecnico.org/images/stories/pdf/proteccionRuido/DccHR.pdf (accessed on 20 December 2021).42. España. REAL DECRETO 314/2006, de 17 de Marzo, Por El Que Se Aprueba El Código Técnico de La Edificación. Boletín Oficial del
Estado. 28 March 2006, pp. 11816–11831. Available online: https://noticias.juridicas.com/base_datos/Admin/rd314-2006.html(accessed on 10 November 2021).
43. ISO 354:2003. Acoustics—Measurement of Sound Absorption in a Reverberation Room; International Organization for Standardization:Geneva, Switzerland, 2003.
44. ISO 11654:1997. Acoustics—Sound Absorbers for Use in Buildings—Rating of Sound Absorption; International Organization forStandardization: Geneva, Switzerland, 1997.
45. ASTM C423-17. Standard Test Method for Sound Absorption and Sound Absorption Coefficients by the Reverberation Room Method; ASTMInternational: West Conshohocken, PA, USA, 2017.
46. ISO 16283-1:2014. Acoustics—Field Measurement of Sound Insulation in Buildings and of Building Elements—Part 1: Airborne SoundInsulation; International Organization for Standardization: Geneva, Switzerland, 2014.
47. ISO 717-1:2013. Acoustics—Rating of Sound Insulation in Buildings and of Building Elements—Part 1: Airborne Sound Insulation;International Organization for Standardization: Geneva, Switzerland, 2013.
48. European Broadcasting Union. EBU Tech. 3276—Listening Conditions for the Assessment of Sound Programme Material: Monophonicand Two—Channel Stereophonic, 2nd ed.; Grand–Saconnex: Geneva, Switzerland, 1998; Volume 3276.