Origins of Product Heterogeneity in the Spheripol High Impact Polypropylene Process
10
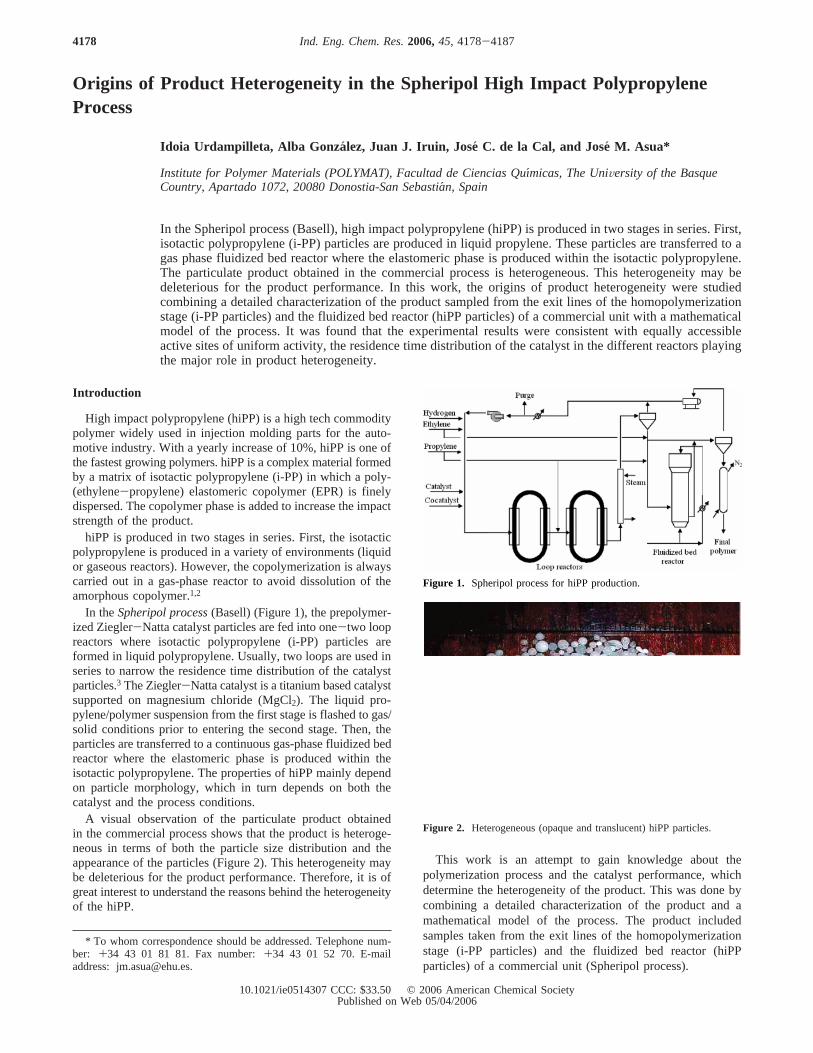
Origins of Product Heterogeneity in the Spheripol High Impact Polypropylene Process Idoia Urdampilleta, Alba Gonza ´ lez, Juan J. Iruin, Jose ´ C. de la Cal, and Jose ´ M. Asua* Institute for Polymer Materials (POLYMAT), Facultad de Ciencias Quı ´micas, The UniVersity of the Basque Country, Apartado 1072, 20080 Donostia-San Sebastia ´ n, Spain In the Spheripol process (Basell), high impact polypropylene (hiPP) is produced in two stages in series. First, isotactic polypropylene (i-PP) particles are produced in liquid propylene. These particles are transferred to a gas phase fluidized bed reactor where the elastomeric phase is produced within the isotactic polypropylene. The particulate product obtained in the commercial process is heterogeneous. This heterogeneity may be deleterious for the product performance. In this work, the origins of product heterogeneity were studied combining a detailed characterization of the product sampled from the exit lines of the homopolymerization stage (i-PP particles) and the fluidized bed reactor (hiPP particles) of a commercial unit with a mathematical model of the process. It was found that the experimental results were consistent with equally accessible active sites of uniform activity, the residence time distribution of the catalyst in the different reactors playing the major role in product heterogeneity. Introduction High impact polypropylene (hiPP) is a high tech commodity polymer widely used in injection molding parts for the auto- motive industry. With a yearly increase of 10%, hiPP is one of the fastest growing polymers. hiPP is a complex material formed by a matrix of isotactic polypropylene (i-PP) in which a poly- (ethylene-propylene) elastomeric copolymer (EPR) is finely dispersed. The copolymer phase is added to increase the impact strength of the product. hiPP is produced in two stages in series. First, the isotactic polypropylene is produced in a variety of environments (liquid or gaseous reactors). However, the copolymerization is always carried out in a gas-phase reactor to avoid dissolution of the amorphous copolymer. 1,2 In the Spheripol process (Basell) (Figure 1), the prepolymer- ized Ziegler-Natta catalyst particles are fed into one-two loop reactors where isotactic polypropylene (i-PP) particles are formed in liquid polypropylene. Usually, two loops are used in series to narrow the residence time distribution of the catalyst particles. 3 The Ziegler-Natta catalyst is a titanium based catalyst supported on magnesium chloride (MgCl 2 ). The liquid pro- pylene/polymer suspension from the first stage is flashed to gas/ solid conditions prior to entering the second stage. Then, the particles are transferred to a continuous gas-phase fluidized bed reactor where the elastomeric phase is produced within the isotactic polypropylene. The properties of hiPP mainly depend on particle morphology, which in turn depends on both the catalyst and the process conditions. A visual observation of the particulate product obtained in the commercial process shows that the product is heteroge- neous in terms of both the particle size distribution and the appearance of the particles (Figure 2). This heterogeneity may be deleterious for the product performance. Therefore, it is of great interest to understand the reasons behind the heterogeneity of the hiPP. This work is an attempt to gain knowledge about the polymerization process and the catalyst performance, which determine the heterogeneity of the product. This was done by combining a detailed characterization of the product and a mathematical model of the process. The product included samples taken from the exit lines of the homopolymerization stage (i-PP particles) and the fluidized bed reactor (hiPP particles) of a commercial unit (Spheripol process). * To whom correspondence should be addressed. Telephone num- ber: +34 43 01 81 81. Fax number: +34 43 01 52 70. E-mail address: [email protected]. Figure 1. Spheripol process for hiPP production. Figure 2. Heterogeneous (opaque and translucent) hiPP particles. 4178 Ind. Eng. Chem. Res. 2006, 45, 4178-4187 10.1021/ie0514307 CCC: $33.50 © 2006 American Chemical Society Published on Web 05/04/2006
-
Upload
independent -
Category
Documents
-
view
0 -
download
0
Transcript of Origins of Product Heterogeneity in the Spheripol High Impact Polypropylene Process
Origins of Product Heterogeneity in the Spheripol High Impact PolypropyleneProcess
Idoia Urdampilleta, Alba Gonzalez, Juan J. Iruin, JoseC. de la Cal, and Jose´ M. Asua*
Institute for Polymer Materials (POLYMAT), Facultad de Ciencias Quı´micas, The UniVersity of the BasqueCountry, Apartado 1072, 20080 Donostia-San Sebastia´n, Spain
In the Spheripol process (Basell), high impact polypropylene (hiPP) is produced in two stages in series. First,isotactic polypropylene (i-PP) particles are produced in liquid propylene. These particles are transferred to agas phase fluidized bed reactor where the elastomeric phase is produced within the isotactic polypropylene.The particulate product obtained in the commercial process is heterogeneous. This heterogeneity may bedeleterious for the product performance. In this work, the origins of product heterogeneity were studiedcombining a detailed characterization of the product sampled from the exit lines of the homopolymerizationstage (i-PP particles) and the fluidized bed reactor (hiPP particles) of a commercial unit with a mathematicalmodel of the process. It was found that the experimental results were consistent with equally accessibleactive sites of uniform activity, the residence time distribution of the catalyst in the different reactors playingthe major role in product heterogeneity.
Introduction
High impact polypropylene (hiPP) is a high tech commoditypolymer widely used in injection molding parts for the auto-motive industry. With a yearly increase of 10%, hiPP is one ofthe fastest growing polymers. hiPP is a complex material formedby a matrix of isotactic polypropylene (i-PP) in which a poly-(ethylene-propylene) elastomeric copolymer (EPR) is finelydispersed. The copolymer phase is added to increase the impactstrength of the product.
hiPP is produced in two stages in series. First, the isotacticpolypropylene is produced in a variety of environments (liquidor gaseous reactors). However, the copolymerization is alwayscarried out in a gas-phase reactor to avoid dissolution of theamorphous copolymer.1,2
In theSpheripol process(Basell) (Figure 1), the prepolymer-ized Ziegler-Natta catalyst particles are fed into one-two loopreactors where isotactic polypropylene (i-PP) particles areformed in liquid polypropylene. Usually, two loops are used inseries to narrow the residence time distribution of the catalystparticles.3 The Ziegler-Natta catalyst is a titanium based catalystsupported on magnesium chloride (MgCl2). The liquid pro-pylene/polymer suspension from the first stage is flashed to gas/solid conditions prior to entering the second stage. Then, theparticles are transferred to a continuous gas-phase fluidized bedreactor where the elastomeric phase is produced within theisotactic polypropylene. The properties of hiPP mainly dependon particle morphology, which in turn depends on both thecatalyst and the process conditions.
A visual observation of the particulate product obtainedin the commercial process shows that the product is heteroge-neous in terms of both the particle size distribution and theappearance of the particles (Figure 2). This heterogeneity maybe deleterious for the product performance. Therefore, it is ofgreat interest to understand the reasons behind the heterogeneityof the hiPP.
This work is an attempt to gain knowledge about thepolymerization process and the catalyst performance, whichdetermine the heterogeneity of the product. This was done bycombining a detailed characterization of the product and amathematical model of the process. The product includedsamples taken from the exit lines of the homopolymerizationstage (i-PP particles) and the fluidized bed reactor (hiPPparticles) of a commercial unit (Spheripol process).
* To whom correspondence should be addressed. Telephone num-ber: +34 43 01 81 81. Fax number:+34 43 01 52 70. E-mailaddress: [email protected].
Figure 1. Spheripol process for hiPP production.
Figure 2. Heterogeneous (opaque and translucent) hiPP particles.
4178 Ind. Eng. Chem. Res.2006,45, 4178-4187
10.1021/ie0514307 CCC: $33.50 © 2006 American Chemical SocietyPublished on Web 05/04/2006
Experimental Section
Samples of i-PP and hiPP taken from the same Spheripolprocess (Basell) were supplied by Repsol-YPF. The isotacticPP particles were produced in the two loop reactors andconstituted the feed of the fluidized bed reactor. The hiPPparticles were the product of the fluidized bed reactor. Theaverage residence times were 124 and 100 aut (arbitrary unitsof time) for the first and second loop reactors and 60 aut forthe fluidized bed reactor. It is worth pointing out that, forproprietary reasons, neither the characteristics of the catalystnor the process conditions could be disclosed and somemagnitudes are given in arbitrary units (au).
Particle Size Distribution. Particle size distributions weredetermined by screening using testing sieves.
Atomic Absorption Spectroscopy (AAS).The titanium (Ti)content of the polypropylene particles was determined in aGBCAVanta Σ atomic absorption spectrometer equipped with agraphite furnace atomizer, a hollow-cathode lamp for Ti, andpyrolytically coated tubes. The method used is described inAppendix I.
Atomic Force Microscopy (AFM). The AFM measurementswere performed with aNanoscope IVfrom Digital Instruments.All scans were performed with commercial Si scanning probemicroscopy (SPM) tips. Height, phase, and amplitude imageswere performed simultaneously in tapping mode at the funda-mental resonance frequency of the Si cantilever with typicalscan rates of 0.5 line/s. The free oscillating amplitude was 2.0V, while the set point amplitude was individually chosen foreach sample. Details for sample preparation are given else-where.4 AFM has also been used by other authors to study themorphology of hiPP.5
Differential Scanning Calorimeter (DSC).The thermogramswere obtained at a heating rate of 20°C/min.
Rubber Extraction. EPR was extracted by placing theparticles in a Soxhlet over 7 days in boilingn-hexane.
Scanning Electron Microscopy (SEM).The whole particlesas well as cryosectionated particles were coated with gold andthen examined in the SE microscope.
Sorption Measurements.Gravimetric sorption experimentswere carried out in an electromagnetic balanceIGA 2 (Hiden).The experimental results of the gained mass of propylene orethylene in particles at a determinate pressure and temperaturewere modeled using the solution of the material balances forspherical geometry (eq 1).6
where
In these equations,M0 is the initial mass of the particles,Mt,and M∞ are the mass of the samples at timet (seconds) andunder equilibrium,r is the effective diffusion length in theparticles, andDeff is the effective diffusion coefficient.
Mercury Intrusion Porosimetry. The pore structure wasdetermined by mercury intrusion in anAutopore II 9220.
NMR. 13C NMR spectra were measured on a270 BrukerAVance 300 DPX. The samples were dissolved in a mixture of1,2,4-triclorobencene and deuterated bencene. The instrumentalparameters used were the following: (i) pulse angle 90°; (ii)
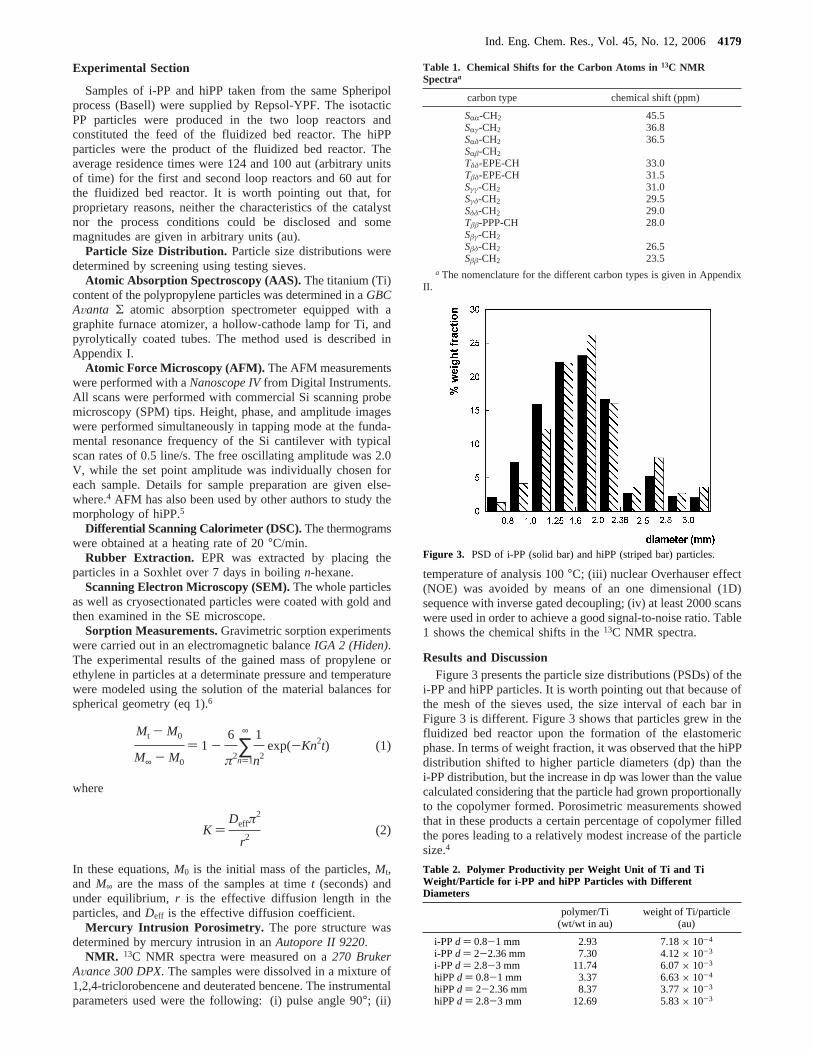
temperature of analysis 100°C; (iii) nuclear Overhauser effect(NOE) was avoided by means of an one dimensional (1D)sequence with inverse gated decoupling; (iv) at least 2000 scanswere used in order to achieve a good signal-to-noise ratio. Table1 shows the chemical shifts in the13C NMR spectra.
Results and DiscussionFigure 3 presents the particle size distributions (PSDs) of the
i-PP and hiPP particles. It is worth pointing out that because ofthe mesh of the sieves used, the size interval of each bar inFigure 3 is different. Figure 3 shows that particles grew in thefluidized bed reactor upon the formation of the elastomericphase. In terms of weight fraction, it was observed that the hiPPdistribution shifted to higher particle diameters (dp) than thei-PP distribution, but the increase in dp was lower than the valuecalculated considering that the particle had grown proportionallyto the copolymer formed. Porosimetric measurements showedthat in these products a certain percentage of copolymer filledthe pores leading to a relatively modest increase of the particlesize.4
Mt - M0
M∞ - M0
) 1 -6
π2∑n)1
∞ 1
n2exp(-Kn2t) (1)
K )Deffπ
2
r2(2)
Table 1. Chemical Shifts for the Carbon Atoms in13C NMRSpectraa
carbon type chemical shift (ppm)
SRR-CH2 45.5SRγ-CH2 36.8SRδ-CH2 36.5SRâ-CH2
Tδδ-EPE-CH 33.0Tâδ-EPE-CH 31.5Sγγ-CH2 31.0Sγδ-CH2 29.5Sδδ-CH2 29.0Tââ-PPP-CH 28.0Sâγ-CH2
Sâδ-CH2 26.5Sââ-CH2 23.5
a The nomenclature for the different carbon types is given in AppendixII.
Figure 3. PSD of i-PP (solid bar) and hiPP (striped bar) particles.
Table 2. Polymer Productivity per Weight Unit of Ti and TiWeight/Particle for i-PP and hiPP Particles with DifferentDiameters
polymer/Ti(wt/wt in au)
weight of Ti/particle(au)
i-PPd ) 0.8-1 mm 2.93 7.18× 10⁻⁴
i-PPd ) 2-2.36 mm 7.30 4.12× 10⁻³
i-PPd ) 2.8-3 mm 11.74 6.07× 10⁻³
hiPPd ) 0.8-1 mm 3.37 6.63× 10⁻⁴
hiPPd ) 2-2.36 mm 8.37 3.77× 10⁻³
hiPPd ) 2.8-3 mm 12.69 5.83× 10⁻³
Ind. Eng. Chem. Res., Vol. 45, No. 12, 20064179
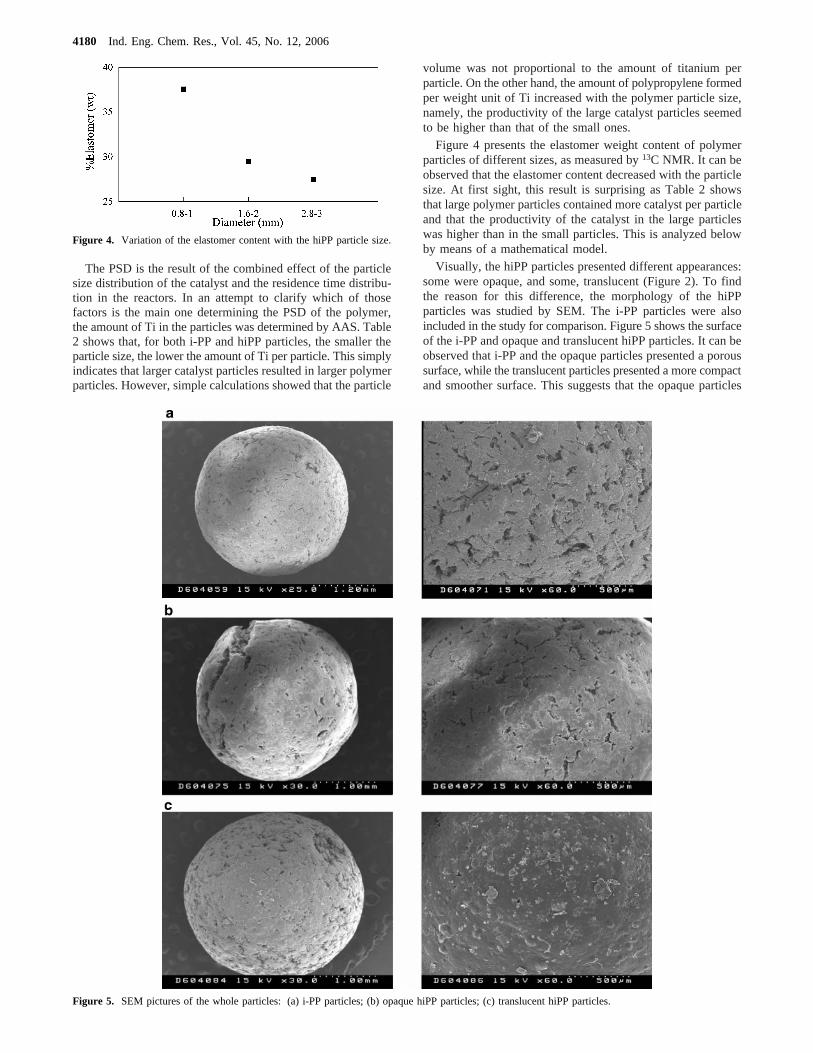
The PSD is the result of the combined effect of the particlesize distribution of the catalyst and the residence time distribu-tion in the reactors. In an attempt to clarify which of thosefactors is the main one determining the PSD of the polymer,the amount of Ti in the particles was determined by AAS. Table2 shows that, for both i-PP and hiPP particles, the smaller theparticle size, the lower the amount of Ti per particle. This simplyindicates that larger catalyst particles resulted in larger polymerparticles. However, simple calculations showed that the particle
volume was not proportional to the amount of titanium perparticle. On the other hand, the amount of polypropylene formedper weight unit of Ti increased with the polymer particle size,namely, the productivity of the large catalyst particles seemedto be higher than that of the small ones.
Figure 4 presents the elastomer weight content of polymerparticles of different sizes, as measured by13C NMR. It can beobserved that the elastomer content decreased with the particlesize. At first sight, this result is surprising as Table 2 showsthat large polymer particles contained more catalyst per particleand that the productivity of the catalyst in the large particleswas higher than in the small particles. This is analyzed belowby means of a mathematical model.
Visually, the hiPP particles presented different appearances:some were opaque, and some, translucent (Figure 2). To findthe reason for this difference, the morphology of the hiPPparticles was studied by SEM. The i-PP particles were alsoincluded in the study for comparison. Figure 5 shows the surfaceof the i-PP and opaque and translucent hiPP particles. It can beobserved that i-PP and the opaque particles presented a poroussurface, while the translucent particles presented a more compactand smoother surface. This suggests that the opaque particles
Figure 4. Variation of the elastomer content with the hiPP particle size.
Figure 5. SEM pictures of the whole particles: (a) i-PP particles; (b) opaque hiPP particles; (c) translucent hiPP particles.
4180 Ind. Eng. Chem. Res., Vol. 45, No. 12, 2006
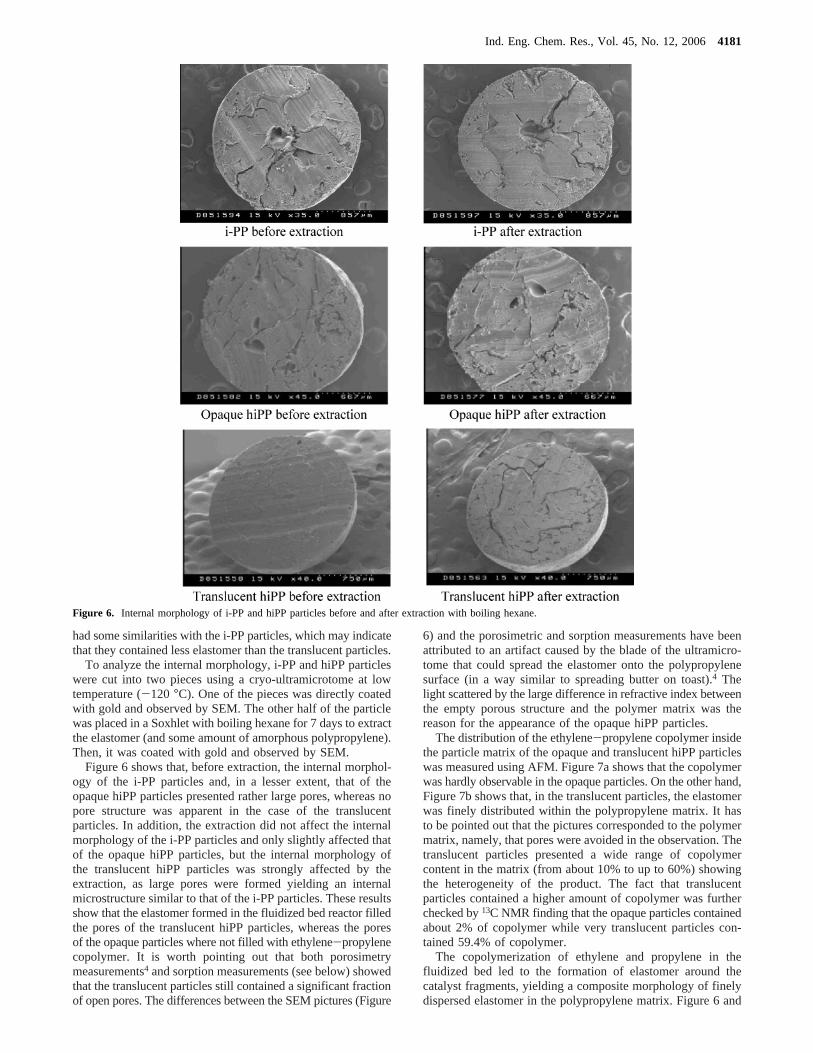
had some similarities with the i-PP particles, which may indicatethat they contained less elastomer than the translucent particles.
To analyze the internal morphology, i-PP and hiPP particleswere cut into two pieces using a cryo-ultramicrotome at lowtemperature (-120 °C). One of the pieces was directly coatedwith gold and observed by SEM. The other half of the particlewas placed in a Soxhlet with boiling hexane for 7 days to extractthe elastomer (and some amount of amorphous polypropylene).Then, it was coated with gold and observed by SEM.
Figure 6 shows that, before extraction, the internal morphol-ogy of the i-PP particles and, in a lesser extent, that of theopaque hiPP particles presented rather large pores, whereas nopore structure was apparent in the case of the translucentparticles. In addition, the extraction did not affect the internalmorphology of the i-PP particles and only slightly affected thatof the opaque hiPP particles, but the internal morphology ofthe translucent hiPP particles was strongly affected by theextraction, as large pores were formed yielding an internalmicrostructure similar to that of the i-PP particles. These resultsshow that the elastomer formed in the fluidized bed reactor filledthe pores of the translucent hiPP particles, whereas the poresof the opaque particles where not filled with ethylene-propylenecopolymer. It is worth pointing out that both porosimetrymeasurements4 and sorption measurements (see below) showedthat the translucent particles still contained a significant fractionof open pores. The differences between the SEM pictures (Figure
6) and the porosimetric and sorption measurements have beenattributed to an artifact caused by the blade of the ultramicro-tome that could spread the elastomer onto the polypropylenesurface (in a way similar to spreading butter on toast).4 Thelight scattered by the large difference in refractive index betweenthe empty porous structure and the polymer matrix was thereason for the appearance of the opaque hiPP particles.
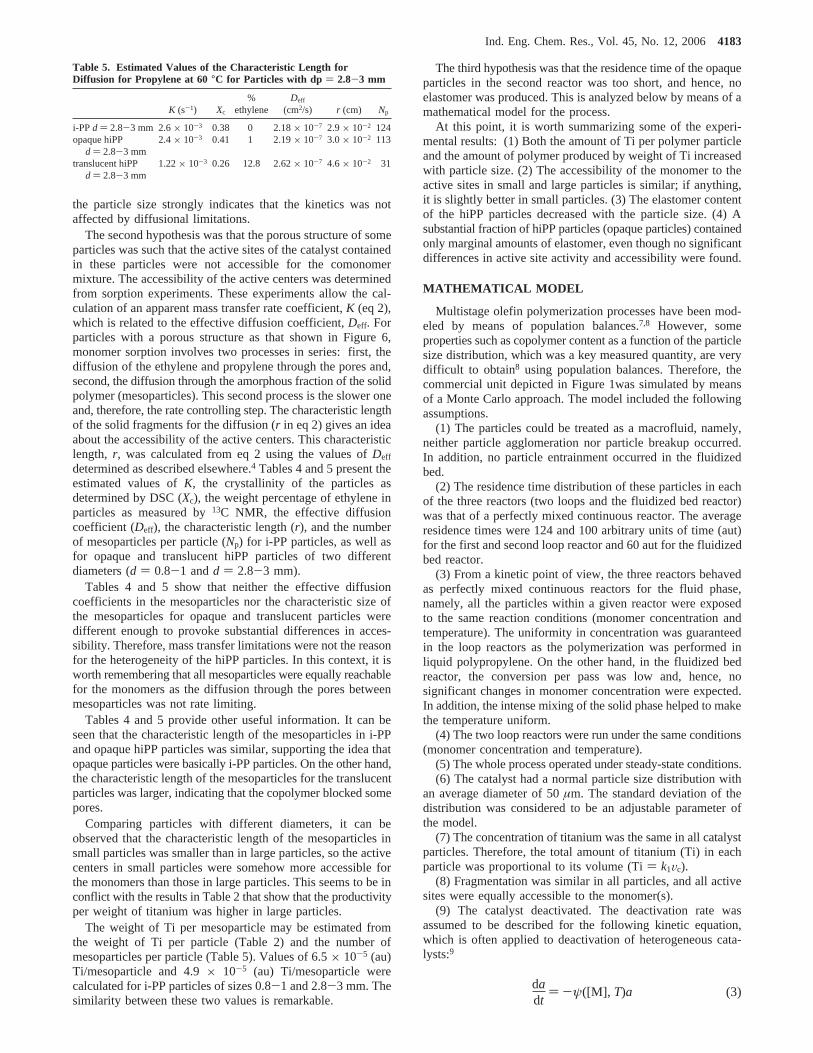
The distribution of the ethylene-propylene copolymer insidethe particle matrix of the opaque and translucent hiPP particleswas measured using AFM. Figure 7a shows that the copolymerwas hardly observable in the opaque particles. On the other hand,Figure 7b shows that, in the translucent particles, the elastomerwas finely distributed within the polypropylene matrix. It hasto be pointed out that the pictures corresponded to the polymermatrix, namely, that pores were avoided in the observation. Thetranslucent particles presented a wide range of copolymercontent in the matrix (from about 10% to up to 60%) showingthe heterogeneity of the product. The fact that translucentparticles contained a higher amount of copolymer was furtherchecked by13C NMR finding that the opaque particles containedabout 2% of copolymer while very translucent particles con-tained 59.4% of copolymer.
The copolymerization of ethylene and propylene in thefluidized bed led to the formation of elastomer around thecatalyst fragments, yielding a composite morphology of finelydispersed elastomer in the polypropylene matrix. Figure 6 and
Figure 6. Internal morphology of i-PP and hiPP particles before and after extraction with boiling hexane.
Ind. Eng. Chem. Res., Vol. 45, No. 12, 20064181
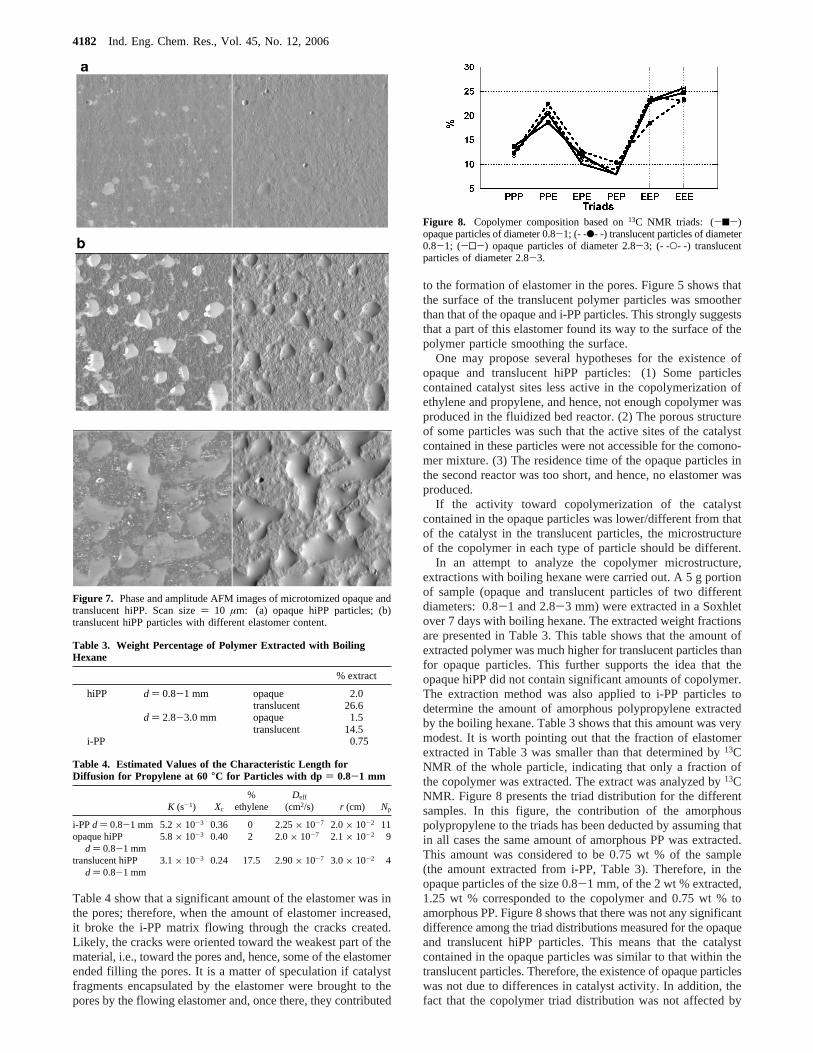
Table 4 show that a significant amount of the elastomer was inthe pores; therefore, when the amount of elastomer increased,it broke the i-PP matrix flowing through the cracks created.Likely, the cracks were oriented toward the weakest part of thematerial, i.e., toward the pores and, hence, some of the elastomerended filling the pores. It is a matter of speculation if catalystfragments encapsulated by the elastomer were brought to thepores by the flowing elastomer and, once there, they contributed
to the formation of elastomer in the pores. Figure 5 shows thatthe surface of the translucent polymer particles was smootherthan that of the opaque and i-PP particles. This strongly suggeststhat a part of this elastomer found its way to the surface of thepolymer particle smoothing the surface.
One may propose several hypotheses for the existence ofopaque and translucent hiPP particles: (1) Some particlescontained catalyst sites less active in the copolymerization ofethylene and propylene, and hence, not enough copolymer wasproduced in the fluidized bed reactor. (2) The porous structureof some particles was such that the active sites of the catalystcontained in these particles were not accessible for the comono-mer mixture. (3) The residence time of the opaque particles inthe second reactor was too short, and hence, no elastomer wasproduced.
If the activity toward copolymerization of the catalystcontained in the opaque particles was lower/different from thatof the catalyst in the translucent particles, the microstructureof the copolymer in each type of particle should be different.
In an attempt to analyze the copolymer microstructure,extractions with boiling hexane were carried out. A 5 g portionof sample (opaque and translucent particles of two differentdiameters: 0.8-1 and 2.8-3 mm) were extracted in a Soxhletover 7 days with boiling hexane. The extracted weight fractionsare presented in Table 3. This table shows that the amount ofextracted polymer was much higher for translucent particles thanfor opaque particles. This further supports the idea that theopaque hiPP did not contain significant amounts of copolymer.The extraction method was also applied to i-PP particles todetermine the amount of amorphous polypropylene extractedby the boiling hexane. Table 3 shows that this amount was verymodest. It is worth pointing out that the fraction of elastomerextracted in Table 3 was smaller than that determined by13CNMR of the whole particle, indicating that only a fraction ofthe copolymer was extracted. The extract was analyzed by13CNMR. Figure 8 presents the triad distribution for the differentsamples. In this figure, the contribution of the amorphouspolypropylene to the triads has been deducted by assuming thatin all cases the same amount of amorphous PP was extracted.This amount was considered to be 0.75 wt % of the sample(the amount extracted from i-PP, Table 3). Therefore, in theopaque particles of the size 0.8-1 mm, of the 2 wt % extracted,1.25 wt % corresponded to the copolymer and 0.75 wt % toamorphous PP. Figure 8 shows that there was not any significantdifference among the triad distributions measured for the opaqueand translucent hiPP particles. This means that the catalystcontained in the opaque particles was similar to that within thetranslucent particles. Therefore, the existence of opaque particleswas not due to differences in catalyst activity. In addition, thefact that the copolymer triad distribution was not affected by
Figure 7. Phase and amplitude AFM images of microtomized opaque andtranslucent hiPP. Scan size) 10 µm: (a) opaque hiPP particles; (b)translucent hiPP particles with different elastomer content.
Table 3. Weight Percentage of Polymer Extracted with BoilingHexane
% extract
hiPP d ) 0.8-1 mm opaque 2.0translucent 26.6
d ) 2.8-3.0 mm opaque 1.5translucent 14.5
i-PP 0.75
Table 4. Estimated Values of the Characteristic Length forDiffusion for Propylene at 60 °C for Particles with dp ) 0.8-1 mm
K (s-1) Xc
%ethylene
Deff
(cm2/s) r (cm) Np
i-PPd ) 0.8-1 mm 5.2× 10⁻³ 0.36 0 2.25× 10⁻⁷ 2.0× 10⁻² 11opaque hiPP
d ) 0.8-1 mm5.8× 10-3 0.40 2 2.0× 10⁻⁷ 2.1× 10⁻² 9
translucent hiPPd ) 0.8-1 mm
3.1× 10⁻³ 0.24 17.5 2.90× 10⁻⁷ 3.0× 10⁻² 4
Figure 8. Copolymer composition based on13C NMR triads: (-9-)opaque particles of diameter 0.8-1; (- -b- -) translucent particles of diameter0.8-1; (-0-) opaque particles of diameter 2.8-3; (- -O- -) translucentparticles of diameter 2.8-3.
4182 Ind. Eng. Chem. Res., Vol. 45, No. 12, 2006
the particle size strongly indicates that the kinetics was notaffected by diffusional limitations.
The second hypothesis was that the porous structure of someparticles was such that the active sites of the catalyst containedin these particles were not accessible for the comonomermixture. The accessibility of the active centers was determinedfrom sorption experiments. These experiments allow the cal-culation of an apparent mass transfer rate coefficient,K (eq 2),which is related to the effective diffusion coefficient,Deff. Forparticles with a porous structure as that shown in Figure 6,monomer sorption involves two processes in series: first, thediffusion of the ethylene and propylene through the pores and,second, the diffusion through the amorphous fraction of the solidpolymer (mesoparticles). This second process is the slower oneand, therefore, the rate controlling step. The characteristic lengthof the solid fragments for the diffusion (r in eq 2) gives an ideaabout the accessibility of the active centers. This characteristiclength, r, was calculated from eq 2 using the values ofDeff
determined as described elsewhere.4 Tables 4 and 5 present theestimated values ofK, the crystallinity of the particles asdetermined by DSC (Xc), the weight percentage of ethylene inparticles as measured by13C NMR, the effective diffusioncoefficient (Deff), the characteristic length (r), and the numberof mesoparticles per particle (Np) for i-PP particles, as well asfor opaque and translucent hiPP particles of two differentdiameters (d ) 0.8-1 andd ) 2.8-3 mm).
Tables 4 and 5 show that neither the effective diffusioncoefficients in the mesoparticles nor the characteristic size ofthe mesoparticles for opaque and translucent particles weredifferent enough to provoke substantial differences in acces-sibility. Therefore, mass transfer limitations were not the reasonfor the heterogeneity of the hiPP particles. In this context, it isworth remembering that all mesoparticles were equally reachablefor the monomers as the diffusion through the pores betweenmesoparticles was not rate limiting.
Tables 4 and 5 provide other useful information. It can beseen that the characteristic length of the mesoparticles in i-PPand opaque hiPP particles was similar, supporting the idea thatopaque particles were basically i-PP particles. On the other hand,the characteristic length of the mesoparticles for the translucentparticles was larger, indicating that the copolymer blocked somepores.
Comparing particles with different diameters, it can beobserved that the characteristic length of the mesoparticles insmall particles was smaller than in large particles, so the activecenters in small particles were somehow more accessible forthe monomers than those in large particles. This seems to be inconflict with the results in Table 2 that show that the productivityper weight of titanium was higher in large particles.
The weight of Ti per mesoparticle may be estimated fromthe weight of Ti per particle (Table 2) and the number ofmesoparticles per particle (Table 5). Values of 6.5× 10⁻⁵ (au)Ti/mesoparticle and 4.9× 10⁻⁵ (au) Ti/mesoparticle werecalculated for i-PP particles of sizes 0.8-1 and 2.8-3 mm. Thesimilarity between these two values is remarkable.
The third hypothesis was that the residence time of the opaqueparticles in the second reactor was too short, and hence, noelastomer was produced. This is analyzed below by means of amathematical model for the process.
At this point, it is worth summarizing some of the experi-mental results: (1) Both the amount of Ti per polymer particleand the amount of polymer produced by weight of Ti increasedwith particle size. (2) The accessibility of the monomer to theactive sites in small and large particles is similar; if anything,it is slightly better in small particles. (3) The elastomer contentof the hiPP particles decreased with the particle size. (4) Asubstantial fraction of hiPP particles (opaque particles) containedonly marginal amounts of elastomer, even though no significantdifferences in active site activity and accessibility were found.
MATHEMATICAL MODEL
Multistage olefin polymerization processes have been mod-eled by means of population balances.7,8 However, someproperties such as copolymer content as a function of the particlesize distribution, which was a key measured quantity, are verydifficult to obtain8 using population balances. Therefore, thecommercial unit depicted in Figure 1was simulated by meansof a Monte Carlo approach. The model included the followingassumptions.
(1) The particles could be treated as a macrofluid, namely,neither particle agglomeration nor particle breakup occurred.In addition, no particle entrainment occurred in the fluidizedbed.
(2) The residence time distribution of these particles in eachof the three reactors (two loops and the fluidized bed reactor)was that of a perfectly mixed continuous reactor. The averageresidence times were 124 and 100 arbitrary units of time (aut)for the first and second loop reactor and 60 aut for the fluidizedbed reactor.
(3) From a kinetic point of view, the three reactors behavedas perfectly mixed continuous reactors for the fluid phase,namely, all the particles within a given reactor were exposedto the same reaction conditions (monomer concentration andtemperature). The uniformity in concentration was guaranteedin the loop reactors as the polymerization was performed inliquid polypropylene. On the other hand, in the fluidized bedreactor, the conversion per pass was low and, hence, nosignificant changes in monomer concentration were expected.In addition, the intense mixing of the solid phase helped to makethe temperature uniform.
(4) The two loop reactors were run under the same conditions(monomer concentration and temperature).
(5) The whole process operated under steady-state conditions.(6) The catalyst had a normal particle size distribution with
an average diameter of 50µm. The standard deviation of thedistribution was considered to be an adjustable parameter ofthe model.
(7) The concentration of titanium was the same in all catalystparticles. Therefore, the total amount of titanium (Ti) in eachparticle was proportional to its volume (Ti) k1Vc).
(8) Fragmentation was similar in all particles, and all activesites were equally accessible to the monomer(s).
(9) The catalyst deactivated. The deactivation rate wasassumed to be described for the following kinetic equation,which is often applied to deactivation of heterogeneous cata-lysts:9
Table 5. Estimated Values of the Characteristic Length forDiffusion for Propylene at 60 °C for Particles with dp ) 2.8-3 mm
K (s-1) Xc
%ethylene
Deff
(cm2/s) r (cm) Np
i-PPd ) 2.8-3 mm 2.6× 10⁻³ 0.38 0 2.18× 10⁻⁷ 2.9× 10⁻² 124opaque hiPP
d ) 2.8-3 mm2.4× 10-3 0.41 1 2.19× 10⁻⁷ 3.0× 10⁻² 113
translucent hiPPd ) 2.8-3 mm
1.22× 10⁻³ 0.26 12.8 2.62× 10⁻⁷ 4.6× 10⁻² 31
dadt
) -ψ([M], T)a (3)
Ind. Eng. Chem. Res., Vol. 45, No. 12, 20064183
where a is the activity of the catalyst (a ) 1 for the freshcatalyst) andψ([M], T) is the deactivation function that dependson process conditions ([M]: monomer concentration andT:temperature). Therefore, the deactivation function in the loopreactors,ψloop, was different from that of the fluidized bed(ψfluidized).
The exit activity of a catalyst particle that stayed a timet1 ina particular reactor is
whereae is the activity of the catalyst at the entrance of thereactor.
The average activity during the time that the catalyst particlewas staged in the reactor is:
ψloop([M], T) and ψfluidized([M], T) were considered to beadjustable parameters of the model
(10) In the fluidized bed reactor, the average porosity of theparticles varied from 12% for the i-PP particles to 7% for hiPPparticles.4 These are average values. Considering the heteroge-neity of the hiPP particles, it is expected that these particlespresented a wide range of porosities. In the model, it wasconsidered that the newly formed elastomer was first accom-modated within the matrix of i-PP until a critical weight fractionof elastomer was reached. The excess of elastomer was placedin the pores. The critical weight fraction of elastomer withinthe i-PP matrix (wcrit) was an adjustable parameter of the model.
(11) The polymerization rate in a polymer particle was
where [M] is the concentration of monomer in the active siteand T is the temperature;f([M], T) also accounts for therelationship between the amount of titanium and the totalnumber of active sites. According to the assumptions above,the two loop reactors operated under the same conditions, andhence, the amount of i-PP produced in those reactors from acatalyst particle of volumeVc that stayed a timet1 in the firstloop reactor and a timet2 in the second loop reactor was
Similarly, the amount of copolymer formed from a catalystparticle of volumeVc that stayed in the fluidized bed reactor atime t3 was
Thek1, floop([M], T), andffluidized([M], T) terms were estimatedby fitting the experimental data.
Therefore, the model contained seven parameters: (i)Sstandard deviation of the catalyst particle size distribution; (ii)wcrit critical weight fraction of elastomer within the i-PP matrix;(iii) k1 concentration of titanium in the catalyst particles; (iv)ψloop([M], T) deactivation function in the loop reactors; (v)ψfluidized([M], T) deactivation function in the fluidized bedreactor; (vi)floop([M], T) pooled kinetic parameter in the loopreactors; (vii)ffluidized([M], T) pooled kinetic parameter in thefluidized bed reactor.
To estimate these parameters, seven independent pieces ofinformation were available: (i) particle size distribution of i-PP;(ii) particle size distribution of hiPP; (iii) distribution of theweight of Ti per particle in i-PP; (iv) distribution of the weightof Ti per particle in hiPP; (v) polymer productivity as a functionof particle size in i-PP; (vi) polymer productivity as a functionof particle size in hiPP; (vii) distribution of elastomer in particlesof different sizes.
At least 50 000 particles were simulated in the Monte Carloapproach. The size of the catalyst particle was randomly selectedfrom the normal particle size distribution with a mean of 50µm and a standard deviationS. The time spent by this particlein each reactor (t1, t2, and t3) was randomly selected byconsidering the residence time distributions characteristic ofperfectly mixed continuous reactors (E(t) ) (1/τi) exp(-t/τi)).The amount of i-PP was calculated by eq 7, and that of hiPP,by eq 8.
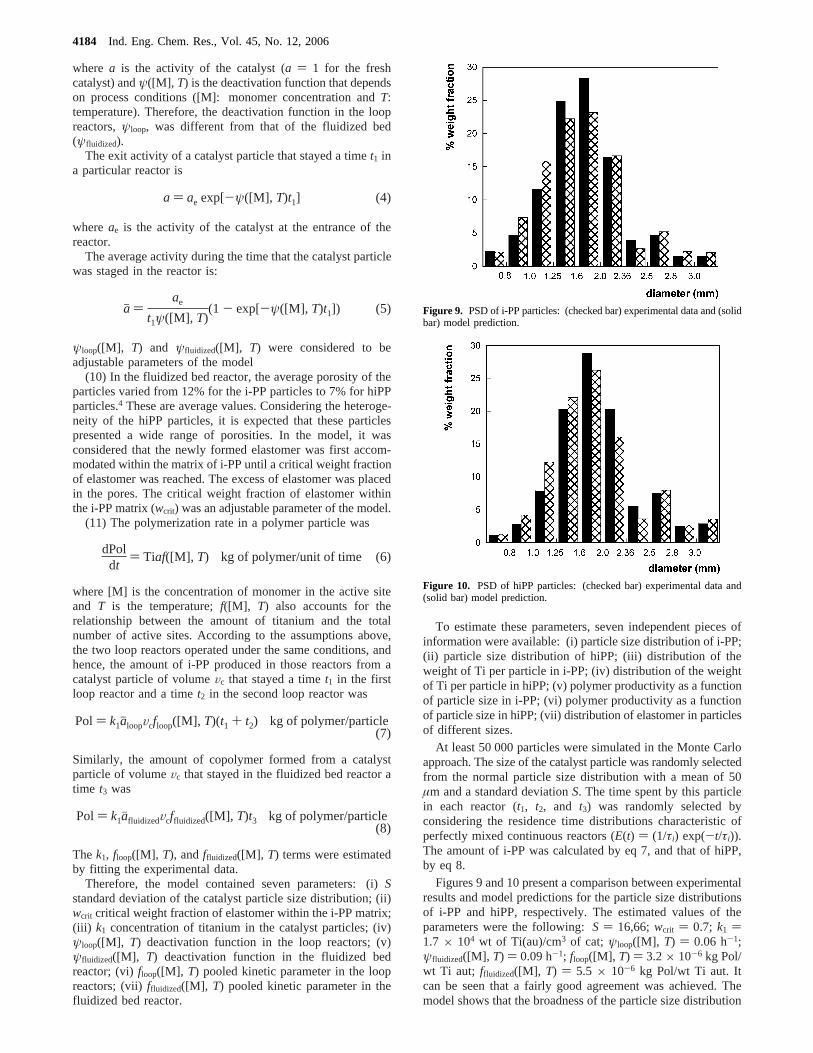
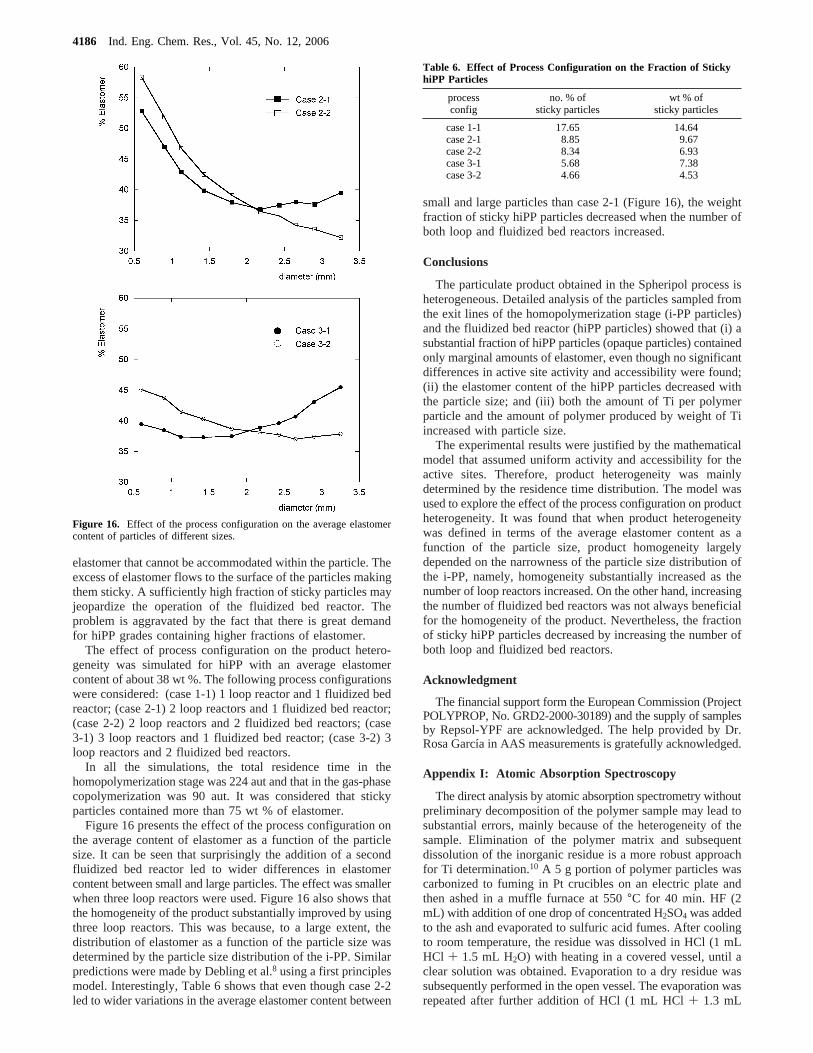
Figures 9 and 10 present a comparison between experimentalresults and model predictions for the particle size distributionsof i-PP and hiPP, respectively. The estimated values of theparameters were the following:S ) 16,66;wcrit ) 0.7; k1 )1.7 × 10⁴ wt of Ti(au)/cm3 of cat; ψloop([M], T) ) 0.06 h-1;ψfluidized([M], T) ) 0.09 h-1; floop([M], T) ) 3.2× 10⁻⁶ kg Pol/wt Ti aut; ffluidized([M], T) ) 5.5 × 10⁻⁶ kg Pol/wt Ti aut. Itcan be seen that a fairly good agreement was achieved. Themodel shows that the broadness of the particle size distribution
a ) ae exp[-ψ([M], T)t1] (4)
aj )ae
t1ψ([M], T)(1 - exp[-ψ([M], T)t1]) (5)
dPoldt
) Tiaf([M], T) kg of polymer/unit of time (6)
Pol ) k1ajloopVcfloop([M], T)(t1 + t2) kg of polymer/particle(7)
Pol ) k1ajfluidizedVcffluidized([M], T)t3 kg of polymer/particle(8)
Figure 9. PSD of i-PP particles: (checked bar) experimental data and (solidbar) model prediction.
Figure 10. PSD of hiPP particles: (checked bar) experimental data and(solid bar) model prediction.
4184 Ind. Eng. Chem. Res., Vol. 45, No. 12, 2006

of the catalyst played a major role in determining the PSD ofthe polymer particles.
Figures 11 and 12 compare experimental results and modelpredictions for the effect of particle size on the catalyst content.It can be seen that good agreement was achieved and that themodel accounted for the fact that the volume of the polymerparticle was not proportional to the amount of catalyst in theparticle (in the figures, the catalyst content is represented versusthe particle diameter and not versus the particle volume).According to the model, the reason was that large polymerparticles resulted from both large catalyst particles and longresidence times.
Figures 13 and 14 present the effect of the particle size onthe polymer productivity per weight unit of Ti. It can be seenthat, in agreement with the experimental results, the modelpredicts that the productivity of the catalyst was higher in largeparticles. The model shows that this was not due to a higherintrinsic activity of the catalyst in the large particles but to thefact that large particles result from long residence times, namely,that the catalyst acted for a longer period of time.
Figure 15 shows that the mathematical model accounted forthe decrease in elastomer content with the particle size. It hasto be pointed out that these values are average copolymercontents for a given particle size. Within each particle size, therewere particles with low (opaque) and high (translucent) elas-tomer contents. The model showed that, on average, the amountof elastomer formed per unit of Ti was the same in small andlarge i-PP particles and as the amount of i-PP per Ti unit was
higher in the large particles, the relative gain of copolymer washigher for the small particles.
In the foregoing, it has been demonstrated that the math-ematical model provided a good description of the two-stagehiPP process described in Figure 1. The model was used toexplore the effect of other process configurations on the productheterogeneity, paying special attention to the formation of stickyhiPP particles. These are particles containing an excess of
Figure 11. Weight of Ti/particle vs particle diameter for i-PP particles:(9) experimental data and (‚‚‚) model prediction.
Figure 12. Weight of Ti/particle vs particle diameter for hiPP particles:(9) experimental data and (‚‚‚) model prediction.
Figure 13. Polymer/Ti (wt/wt in au) vs particle diameter for i-PPparticles: (9) experimental data and (‚‚‚) model prediction.
Figure 14. Polymer/Ti (wt/wt in au) vs particle diameter for hiPPparticles: (9) experimental data and (‚‚‚) model prediction.
Figure 15. Elastomer content vs particle diameter: (9) experimental dataand (‚‚‚) model prediction.
Ind. Eng. Chem. Res., Vol. 45, No. 12, 20064185
elastomer that cannot be accommodated within the particle. Theexcess of elastomer flows to the surface of the particles makingthem sticky. A sufficiently high fraction of sticky particles mayjeopardize the operation of the fluidized bed reactor. Theproblem is aggravated by the fact that there is great demandfor hiPP grades containing higher fractions of elastomer.
The effect of process configuration on the product hetero-geneity was simulated for hiPP with an average elastomercontent of about 38 wt %. The following process configurationswere considered: (case 1-1) 1 loop reactor and 1 fluidized bedreactor; (case 2-1) 2 loop reactors and 1 fluidized bed reactor;(case 2-2) 2 loop reactors and 2 fluidized bed reactors; (case3-1) 3 loop reactors and 1 fluidized bed reactor; (case 3-2) 3loop reactors and 2 fluidized bed reactors.
In all the simulations, the total residence time in thehomopolymerization stage was 224 aut and that in the gas-phasecopolymerization was 90 aut. It was considered that stickyparticles contained more than 75 wt % of elastomer.
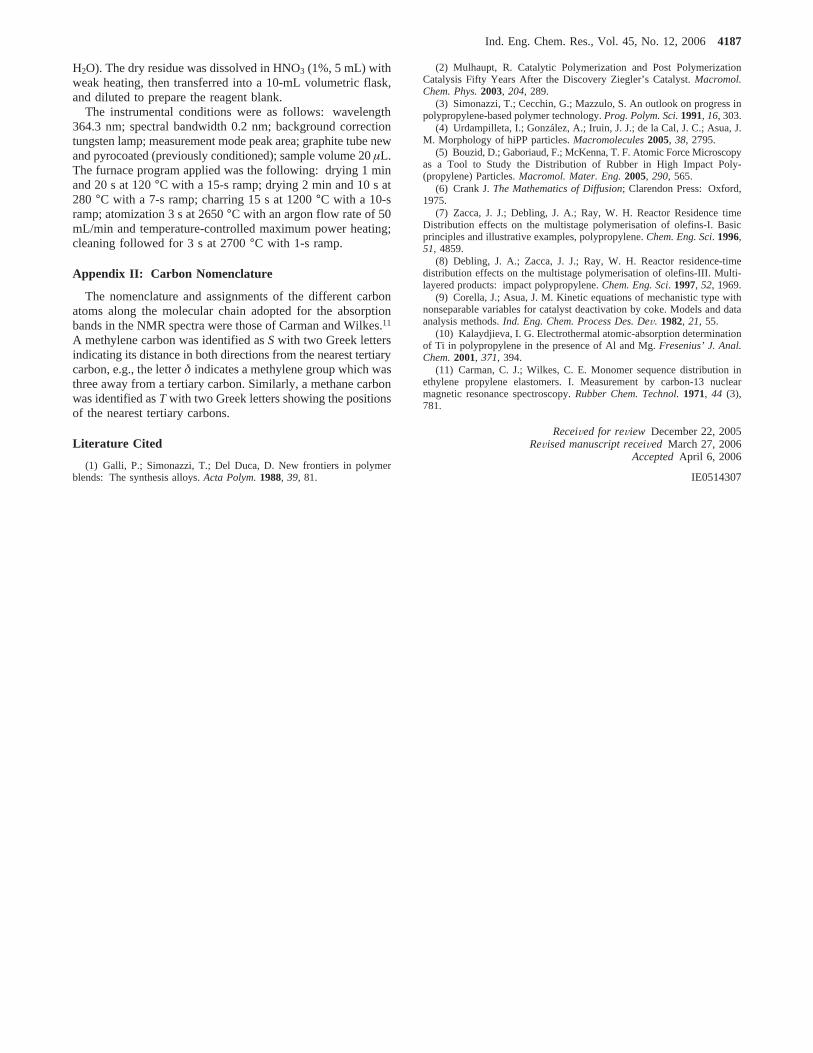
Figure 16 presents the effect of the process configuration onthe average content of elastomer as a function of the particlesize. It can be seen that surprisingly the addition of a secondfluidized bed reactor led to wider differences in elastomercontent between small and large particles. The effect was smallerwhen three loop reactors were used. Figure 16 also shows thatthe homogeneity of the product substantially improved by usingthree loop reactors. This was because, to a large extent, thedistribution of elastomer as a function of the particle size wasdetermined by the particle size distribution of the i-PP. Similarpredictions were made by Debling et al.8 using a first principlesmodel. Interestingly, Table 6 shows that even though case 2-2led to wider variations in the average elastomer content between
small and large particles than case 2-1 (Figure 16), the weightfraction of sticky hiPP particles decreased when the number ofboth loop and fluidized bed reactors increased.
Conclusions
The particulate product obtained in the Spheripol process isheterogeneous. Detailed analysis of the particles sampled fromthe exit lines of the homopolymerization stage (i-PP particles)and the fluidized bed reactor (hiPP particles) showed that (i) asubstantial fraction of hiPP particles (opaque particles) containedonly marginal amounts of elastomer, even though no significantdifferences in active site activity and accessibility were found;(ii) the elastomer content of the hiPP particles decreased withthe particle size; and (iii) both the amount of Ti per polymerparticle and the amount of polymer produced by weight of Tiincreased with particle size.
The experimental results were justified by the mathematicalmodel that assumed uniform activity and accessibility for theactive sites. Therefore, product heterogeneity was mainlydetermined by the residence time distribution. The model wasused to explore the effect of the process configuration on productheterogeneity. It was found that when product heterogeneitywas defined in terms of the average elastomer content as afunction of the particle size, product homogeneity largelydepended on the narrowness of the particle size distribution ofthe i-PP, namely, homogeneity substantially increased as thenumber of loop reactors increased. On the other hand, increasingthe number of fluidized bed reactors was not always beneficialfor the homogeneity of the product. Nevertheless, the fractionof sticky hiPP particles decreased by increasing the number ofboth loop and fluidized bed reactors.
Acknowledgment
The financial support form the European Commission (ProjectPOLYPROP, No. GRD2-2000-30189) and the supply of samplesby Repsol-YPF are acknowledged. The help provided by Dr.Rosa Garcı´a in AAS measurements is gratefully acknowledged.
Appendix I: Atomic Absorption Spectroscopy
The direct analysis by atomic absorption spectrometry withoutpreliminary decomposition of the polymer sample may lead tosubstantial errors, mainly because of the heterogeneity of thesample. Elimination of the polymer matrix and subsequentdissolution of the inorganic residue is a more robust approachfor Ti determination.10 A 5 g portion of polymer particles wascarbonized to fuming in Pt crucibles on an electric plate andthen ashed in a muffle furnace at 550°C for 40 min. HF (2mL) with addition of one drop of concentrated H2SO4 was addedto the ash and evaporated to sulfuric acid fumes. After coolingto room temperature, the residue was dissolved in HCl (1 mLHCl + 1.5 mL H2O) with heating in a covered vessel, until aclear solution was obtained. Evaporation to a dry residue wassubsequently performed in the open vessel. The evaporation wasrepeated after further addition of HCl (1 mL HCl+ 1.3 mL
Figure 16. Effect of the process configuration on the average elastomercontent of particles of different sizes.
Table 6. Effect of Process Configuration on the Fraction of StickyhiPP Particles
processconfig
no. % ofsticky particles
wt % ofsticky particles
case 1-1 17.65 14.64case 2-1 8.85 9.67case 2-2 8.34 6.93case 3-1 5.68 7.38case 3-2 4.66 4.53
4186 Ind. Eng. Chem. Res., Vol. 45, No. 12, 2006
H2O). The dry residue was dissolved in HNO3 (1%, 5 mL) withweak heating, then transferred into a 10-mL volumetric flask,and diluted to prepare the reagent blank.
The instrumental conditions were as follows: wavelength364.3 nm; spectral bandwidth 0.2 nm; background correctiontungsten lamp; measurement mode peak area; graphite tube newand pyrocoated (previously conditioned); sample volume 20µL.The furnace program applied was the following: drying 1 minand 20 s at 120°C with a 15-s ramp; drying 2 min and 10 s at280 °C with a 7-s ramp; charring 15 s at 1200°C with a 10-sramp; atomization 3 s at2650°C with an argon flow rate of 50mL/min and temperature-controlled maximum power heating;cleaning followed for 3 s at2700°C with 1-s ramp.
Appendix II: Carbon Nomenclature
The nomenclature and assignments of the different carbonatoms along the molecular chain adopted for the absorptionbands in the NMR spectra were those of Carman and Wilkes.11
A methylene carbon was identified asSwith two Greek lettersindicating its distance in both directions from the nearest tertiarycarbon, e.g., the letterδ indicates a methylene group which wasthree away from a tertiary carbon. Similarly, a methane carbonwas identified asT with two Greek letters showing the positionsof the nearest tertiary carbons.
Literature Cited
(1) Galli, P.; Simonazzi, T.; Del Duca, D. New frontiers in polymerblends: The synthesis alloys.Acta Polym.1988, 39, 81.
(2) Mulhaupt, R. Catalytic Polymerization and Post PolymerizationCatalysis Fifty Years After the Discovery Ziegler’s Catalyst.Macromol.Chem. Phys.2003, 204, 289.
(3) Simonazzi, T.; Cecchin, G.; Mazzulo, S. An outlook on progress inpolypropylene-based polymer technology.Prog. Polym. Sci.1991, 16, 303.
(4) Urdampilleta, I.; Gonza´lez, A.; Iruin, J. J.; de la Cal, J. C.; Asua, J.M. Morphology of hiPP particles.Macromolecules2005, 38, 2795.
(5) Bouzid, D.; Gaboriaud, F.; McKenna, T. F. Atomic Force Microscopyas a Tool to Study the Distribution of Rubber in High Impact Poly-(propylene) Particles.Macromol. Mater. Eng.2005, 290, 565.
(6) Crank J.The Mathematics of Diffusion; Clarendon Press: Oxford,1975.
(7) Zacca, J. J.; Debling, J. A.; Ray, W. H. Reactor Residence timeDistribution effects on the multistage polymerisation of olefins-I. Basicprinciples and illustrative examples, polypropylene.Chem. Eng. Sci. 1996,51, 4859.
(8) Debling, J. A.; Zacca, J. J.; Ray, W. H. Reactor residence-timedistribution effects on the multistage polymerisation of olefins-III. Multi-layered products: impact polypropylene.Chem. Eng. Sci. 1997, 52, 1969.
(9) Corella, J.; Asua, J. M. Kinetic equations of mechanistic type withnonseparable variables for catalyst deactivation by coke. Models and dataanalysis methods.Ind. Eng. Chem. Process Des. DeV. 1982, 21, 55.
(10) Kalaydjieva, I. G. Electrothermal atomic-absorption determinationof Ti in polypropylene in the presence of Al and Mg.Fresenius’ J. Anal.Chem.2001, 371, 394.
(11) Carman, C. J.; Wilkes, C. E. Monomer sequence distribution inethylene propylene elastomers. I. Measurement by carbon-13 nuclearmagnetic resonance spectroscopy.Rubber Chem. Technol.1971, 44 (3),781.
ReceiVed for reView December 22, 2005ReVised manuscript receiVed March 27, 2006
AcceptedApril 6, 2006
IE0514307
Ind. Eng. Chem. Res., Vol. 45, No. 12, 20064187