1 X X X X X - IGATS Instituto de Gestão, Administração e ...

This article was originally published in a journal published byElsevier, and the attached copy is provided by Elsevier for the
author’s benefit and for the benefit of the author’s institution, fornon-commercial research and educational use including without
limitation use in instruction at your institution, sending it to specificcolleagues that you know, and providing a copy to your institution’s
administrator.
All other uses, reproduction and distribution, including withoutlimitation commercial reprints, selling or licensing copies or access,
or posting on open internet sites, your personal or institution’swebsite or repository, are prohibited. For exceptions, permission
may be sought for such use through Elsevier’s permissions site at:
http://www.elsevier.com/locate/permissionusematerial
Autho
r's
pers
onal
co
py
Order–disorder phase transitions and high-temperature oxide ion
conductivity of Er2+xTi2�xO7�d (x = 0, 0.096)
A.V. Shlyakhtina a,*, A.V. Levchenko b, J.C.C. Abrantes c, V.Yu. Bychkov a,V.N. Korchak a, V.A. Rassulov d, L.L. Larina e, O.K. Karyagina e, L.G. Shcherbakova a
a Semenov Institute of Chemical Physics, Russian Academy of Sciences, ul. Kosygina 4, Moscow 119991, Russiab Institute of Problems of Chemical Physics, Russian Academy of Sciences, Chernogolovka, Moscow Region 142432, Russia
c UIDM, ESTG, Instituto Politecnico de Viana do Castelo, Apartado 574, 4901-908 Viana do Castelo, Portugald All-Russia Research Institute of Mineral Resources, Staromonetnyi per. 31, Moscow 119017, Russia
e Emanuel Institute of Biochemical Physics, Russian Academy of Sciences, ul. Kosygina 4, Moscow 119991, Russia
Received 24 January 2006; received in revised form 9 June 2006; accepted 19 July 2006
Available online 22 August 2006
Abstract
The Er2+xTi2�xO7�d (x = 0.096; 35.5 mol% Er2O3) solid solution and the stoichiometric pyrochlore-structured compound
Er2Ti2O7 (x = 0; 33.3 mol% Er2O3) are characterized by X-ray diffraction (phase analysis and Rietveld method), thermal analysis
and optical spectroscopy. Both oxides were synthesized by thermal sintering of co-precipitated powders. The synthesis study was
performed in the temperature range 650–1690 8C. The amorphous phase exists below 700 8C. The crystallization of the ordered
pyrochlore phase (P) in the range 800–1000 8C is accompanied by oxygen release. The ordered pyrochlore phase (P) exists in the
range 1000�1200 8C. Heat-treatment at T � 1600 8C leads to the formation of an oxide ion-conducting phase with a distorted
pyrochlore structure (P2) and an ionic conductivity of about 10�3 S/cm at 740 8C. Complex impedance spectra are used to
separately assess the bulk and grain-boundary conductivity of the samples. At 700 8C and oxygen pressures above 10�10 Pa, the
Er2+xTi2�xO7�d (x = 0, 0.096) samples are purely ionic conductors.
# 2006 Elsevier Ltd. All rights reserved.
Keywords: A. Ceramics; A. Oxides; B. Chemical synthesis; C. Electrochemical measurements; C. Impedance spectroscopy
1. Introduction
A2B2O7 pyrochlore-structured oxides have recently been the subject of intense attention owing to their unusual
electrical, magnetic, dielectric, optical and catalytic properties [1–3], which make them attractive materials for solid
oxide fuel cells, oxygen sensors, thermistors, resistors and switches. High-temperature oxide-ion conduction has been
recently found in Ca-doped Gd2Ti2O7 [4] and disordered Gd2(Ti1�xZrx)2O7 and Y2(Ti1�xZrx)2O7 pyrochlores [5,6].
Ionic conduction in the zirconate titanates is due to the formation of Frenkel defects in their oxygen sublattice,
accompanied by anti-site cation disordering [7]. Since reducing the difference in ionic radius between the A and B
cations in the pyrochlore structure favours cation disordering, Yb2Ti2O7 and Lu2Ti2O7 are likely to have disordered
www.elsevier.com/locate/matresbu
Materials Research Bulletin 42 (2007) 742–752
* Corresponding author. Tel.: +7 495 137 83 03; fax: +7 495 242 02 53.
E-mail addresses: [email protected], [email protected] (A.V. Shlyakhtina).
0025-5408/$ – see front matter # 2006 Elsevier Ltd. All rights reserved.
doi:10.1016/j.materresbull.2006.07.011
Autho
r's
pers
onal
co
py
cation sublattices. Indeed, in 2004–2005 the systems Ln2O3–TiO2 (Ln = Yb–Lu) were shown to contain
Ln2+xTi2�xO7�d (x = 0–0.44) solid solutions with a 740 8C ionic conductivity in the range 10�3 to 10�2 S/cm [8–11].
The Ln2O3–TiO2 (Ln = Dy–Lu) phase diagrams are similar in that all of them show a continuous order–disorder
(pyrochlore–fluorite) phase transition within the homogeneity range of the Ln2+xTi2�xO7�d pyrochlore-like solid
solutions and that the solid solution range broadens with increasing temperature [12]. In Er2O3–TiO2 system, the
composition range of pyrochlore-like solid solutions is about 5 mol% in width at 1400 8C and 25 mol% at 1600 8C[13]. The homogeneity range of Ln2Ti2O7 (Ln = Lu, Yb, Ho, Dy) at 1600 8C is �24 mol% in width in the system
Lu2O3–TiO2, �27 mol% in Yb2O3–TiO2, �30 mol% in Ho2O3–TiO2 and 10 mol% in Dy2O3–TiO2 [12]. As shown
previously [10,11,14–16], the Ln2+xTi2�xO7�d (Ln = Yb, Lu; 34.5–44 mol% Ln2O3) pyrochlore-like solid solutions
heat-treated between 1400 and 1600 8C possess a 740 8C ionic conductivity of �10�3 S/cm. Authors [8,10,11] were
the first to show that the stoichiometric rare-earth titanates Ln2Ti2O7 (Ln = Tm–Lu) undergo a high-temperature
(>1615 8C) order–disorder transition. The resulting high-temperature phases have a distorted pyrochlore structure
(P2) and a 740 8C oxide ion conductivity of up to 10�2 S/cm [9–11], which is comparable to that of the well-known
solid electrolyte ZrO2 (9 mol% Y2O3).
Ln2Ti2O7 (Ln = Tm–Lu) in [8–11] were prepared by coprecipitation followed by freeze-drying and thermal
annealing in the temperature range 650–1670 8C. Stoichiometric Ln2Ti2O7 (Ln = Tm–Lu) materials were shown to
have a low-temperature fluorite phase (possibly metastable) (F*), which transforms into the pyrochlore phase (F*–P
phase transition) above 740 8C [17]. Sm2Zr2O7 and Gd2Zr2O7 prepared through coprecipitation were also reported to
undergo a low-temperature (�800 8C) transition from a metastable fluorite to pyrochlore phase [18].
Thus, the mixed oxides Ln2Ti2O7 (Ln = Tm–Lu) in the Ln2O3–TiO2 (Ln = Tm–Lu) systems undergo F*–P1–P–P2
phase transitions with increasing temperature and a continuous P–F transition with increasing Ln2O3 content.
It is no doubt of interest to investigate pyrochlore-like solid solutions based on other rare-earth titanates, in
particular Er2+xTi2�xO7�d (x = 0, 0.096).
The main purpose of this work is to study the formation of Er2+xTi2�xO7�d (x = 0, 0.096) in a broad temperature
range, 110–1690 8C, using samples prepared by hydroxide coprecipitation, and to analyze the influence of defect
structure on the electrical properties of both oxides Er2+xTi2�xO7�d (x = 0, 0.096), obtained at 1600–1690 8C –
potential oxide-ion conductors.
2. Experimental
Er2+xTi2�xO7�d samples with x = 0 and 0.096 were prepared by hydroxide coprecipitation followed by heat-
treatment. Er(III) and Ti(IV) hydroxides were precipitated by adding appropriate chloride solutions to aqueous
ammonia at pH 10.8. The precipitate was separated from the solution by centrifugation, washed several times with hot
water to remove chloride ions and then dried at 105 8C for 24 h. The resultant powders were heat-treated in the range
110–1690 8C for 2–49 h in order to analyze in detail the process of Er2+xTi2�xO7�d (x = 0, 0.096) formation.
In addition, the powders dried at 105 8C for 24 h were fired at 650 8C for 2 h and then pressed at 10 MPa into disks
10 mm in diameter and 2 mm in thickness, which were used to prepare Er2+xTi2�xO7�d (x = 0, 0.096) ceramics by
sintering at 1600–1690 8C, followed by furnace-cooling.
After firing at 650 8C for 2 h, the samples were characterized by thermal analysis (DTA + TG) in flowing helium
(20 ml/min) during heating from 30 to 1000 8C at a rate of 10 8C/min using a SETARAM SETSYS Evolution 16/18
thermal analyzer in conjunction with a Pfeiffer OMNISTAR GSD 301 mass spectrometer. The TG module included an
alumina tube mounted in a vertical tubular furnace. The carrier gas was introduced into the alumina tube from above,
and a small part of the gas flow downstream of the sample was directed to the mass spectrometer through a stainless
steel capillary. The time delay between thermal analysis and mass spectrometric measurements was about 8 s. Ion
currents at m/z = 2, 4, 15, 16, 17, 28, 30, 32 and 44 were detected in on-line measurements. The gas flow rate was
stabilized by the flow controller of the thermal analyzer.
Phase composition of powder and ceramic samples was determined by X-ray diffraction (XRD) on a DRON-3M
diffractometer (Cu Ka radiation, 35 kV, 28 mA). The defect structure of the samples was inferred from Rietveld
analysis results (Cu Ka radiation, 2u = 10–808, step size of 0.058, counting time of 3 s/step) [19].
Microstructures were examined by scanning electron microscopy (LEO SUPRA 50VP).
Reflectance spectra of powders andceramics were measured as described elsewhere [20], using a set-up built around an
MSFU L-312 microscope-spectrophotometer. Reference spectra were taken using a certified MS-20 opal glass sample.
A.V. Shlyakhtina et al. / Materials Research Bulletin 42 (2007) 742–752 743
Autho
r's
pers
onal
co
py
In electrical conductivity measurements, we used Pt/Er2+xTi2�xO7�d/Pt cells. Electrical contacts were made by
applying Pt paste to the two faces of the ceramic disk, followed by firing at 1000 8C. Total conductivity was
determined by impedance spectroscopy in the frequency range 20 Hz to 1 MHz and at temperatures from 300 to
1000 8C using a Hewlett-Packard 4284A precision LCR bridge. Electronic conductivity was measured by the Hebb–
Wagner method at 700, 800, 900 and 1000 8C. In this case, the sample was glass sealed onto an impermeable alumina
disc, on the irreversible electrod side (cathode), to avoid access of oxygen to this electrode. Total conductivity versus
oxygen partial pressure data were obtained by the reoxidation method. To this end, a mixture of 95% N2 and 5% H2
was passed through the system in order to reduce the oxygen partial pressure (measured by a ZrO2-based sensor) to
10�17–10�13 Pa. Next, the gas flow was shut off and the impedance was measured at 10 min intervals until the oxygen
partial pressure increased to 105 Pa.
3. Results and discussion
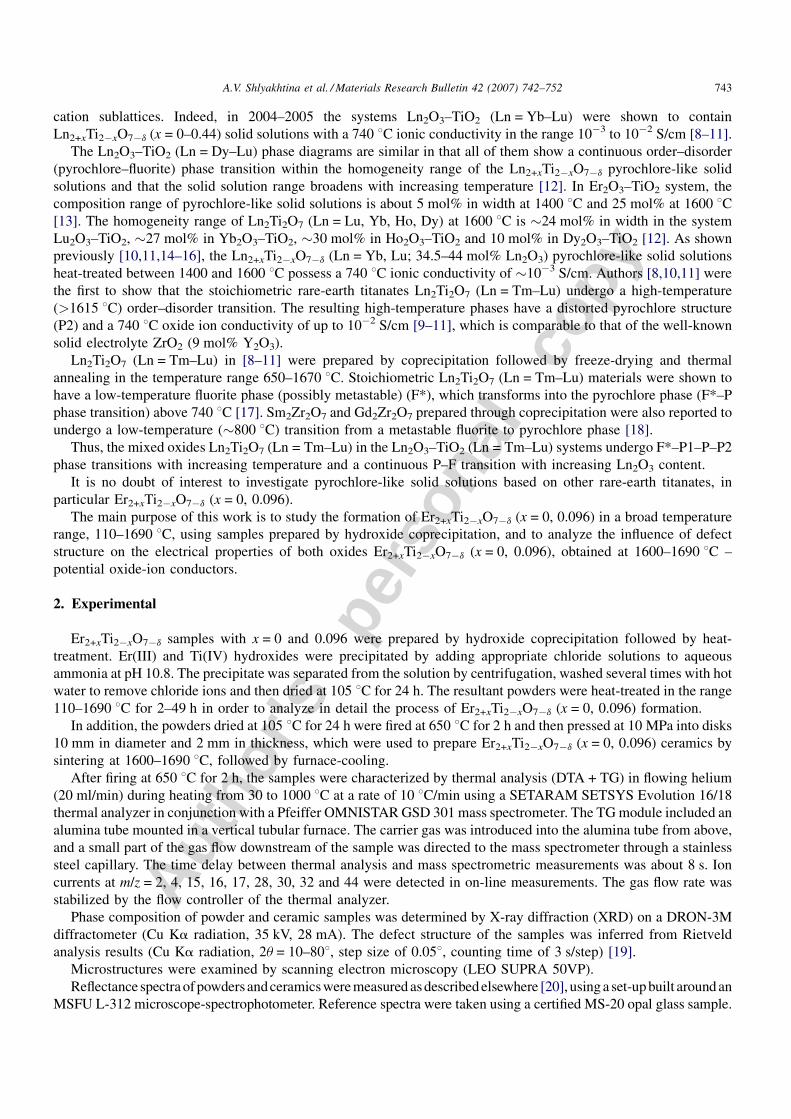
Fig. 1a presents the DTA and TG data obtained in flowing helium for the sample with the final composition
Er2.096Ti1.904O6.952 (35.5 mol% Er2O3) prepared through hydroxide coprecipitation and firing at 650 8C (2 h). The
DTA curve shows a well-defined exothermic peak at 800 8C (Fig. 1a, curve 1), accompanied by weight loss �0.3%
(initial mass of the sample is 51.3 mg) (Fig. 1a, curve 2). Mass spectrometric analysis of the gas released during
heating from 30 to 1000 8C indicates that the 800 8C exotherm arises from CO2 release in the initial stages of the
process (780–850 8C) (Fig. 1b, curve 3). A major weight loss occurs below 950 8C and is due to oxygen (Fig. 1b, curve
4) and water (Fig. 1b, curve 5) release. It seems likely that the CO2 release is associated with the decomposition of the
residual erbium hydroxycarbonate, which may form during drying of the coprecipitated hydroxides in air. The oxygen
A.V. Shlyakhtina et al. / Materials Research Bulletin 42 (2007) 742–752744
Fig. 1. (a) Thermal analysis data for the sample with Er:Ti = 2.096:1.904 after drying at 105 8C for 24 h and firing at 650 8C for 2 h: (1) DTA and (2)
TG curves. (b) Mass spectrometry results for the gas released during heating of the sample from 30 to 1000 8C: (1) DTA, (2) TG, (3) CO2, (4) O2, and
(5) H2O.
Autho
r's
pers
onal
co
py
release attests, most likely, to the formation of ordered pyrochlore P (diffraction pattern is in perfect agreement with
JCPDS PDF data).
In earlier studies of Ln2Ti2O7 (Ln = Tm–Lu) formation from a coprecipitated hydroxide mixture after freeze-
drying, DTA also showed an exothermic peak at 780–820 8C [8,10]. The present results for Er2.096Ti1.904O6.952
(35.5 mol% Er2O3) suggest that in this case the exotherm is due to the decomposition of the residual erbium
hydroxycarbonate, which initiates the crystallization of a pyrochlore phase (P) accompanied by oxygen release.
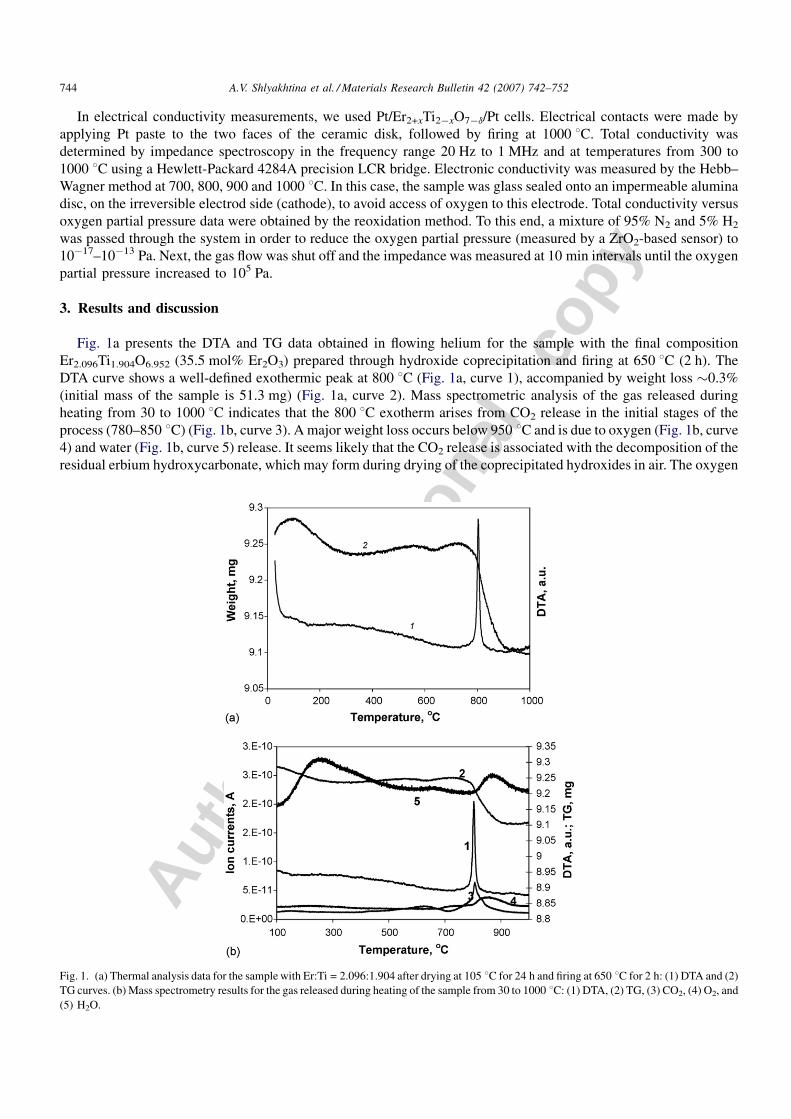
According to XRD results (Fig. 2), the imperfect pyrochlore structure (P1) is formed at 700–800 8C, directly from an
amorphous state (Fig. 2, curves 4 and 5). It seems likely that the XRD amorphous phase existing below 700 8C has the
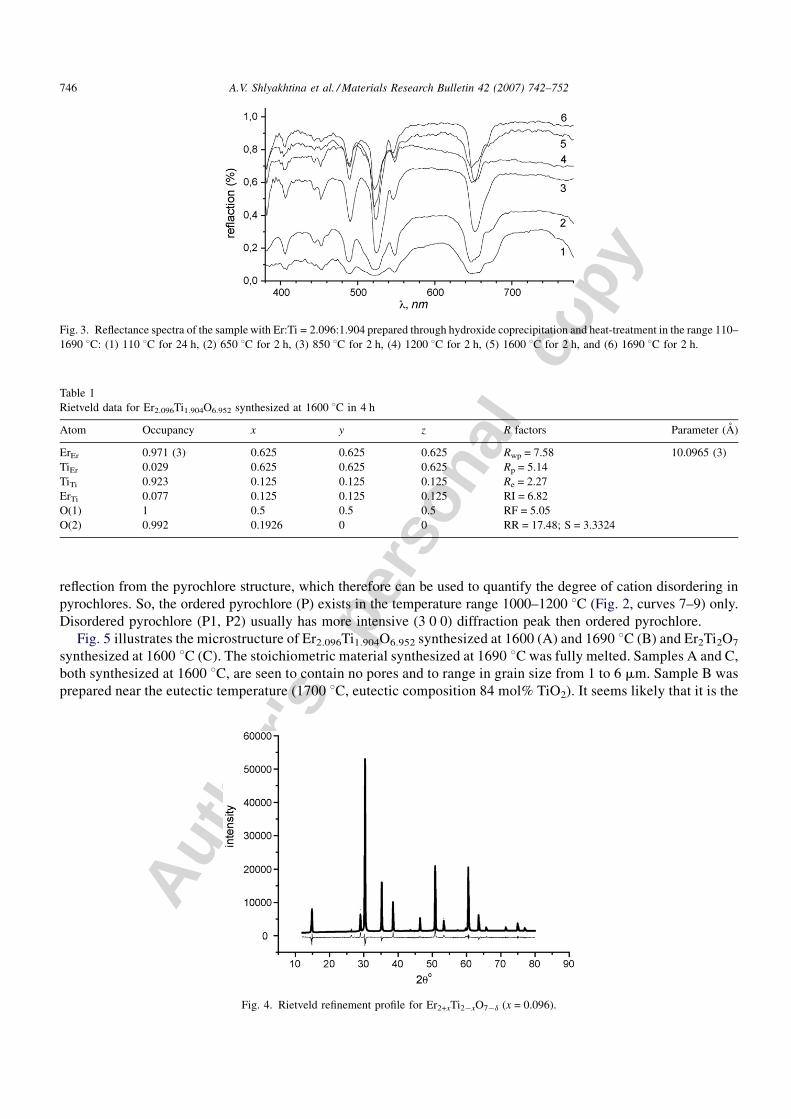
pyrochlore structure short range. The assumption that the amorphous phase has the pyrochlore structure short range is
supported by optical spectroscopy data (Fig. 3, curves 1–6), which shows the same structure type in the temperature
region 110–1690 8C. The mass spectroscopy results show the main CO2 release (Fig. 1b, curve 3) below 850 8C and
we can suppose low-temperature disordered pyrochlore (P1)—Er2.096Ti1.904O6.952 existence at this temperature.
Note that the (3 0 0) diffraction peak (2u = 26.78) from the pyrochlore structure is present after heat-treatment at
850 8C (Fig. 2, curve 6) and also at heat-treatment temperatures above 1200 8C (Fig. 2, curves 10–13) but is missing in
the range 1000–1200 8C, where the pyrochlore phase is ordered (Fig. 2, curves 7–9). The (3 0 0) peak from ordered
pyrochlores is typically very weak and difficult to detect. The presence of this peak points to distortion of the cubic
pyrochlore structure.
The Rietveld analysis results for Er2.096Ti1.904O6.952 synthesized at 1600 8C are presented in Table 1 and Fig. 4. The
fraction of TiEr anti-site defects is 2.9 at.% and that of ErTi is 7.7 at.%. Thus, Er2.096Ti1.904O6.952 synthesized at
1600 8C contains 2.9% TiEr + ErTi anti-structure pairs and 4.8 at.% non-stoichiometric ErTi anti-site defects. In
addition, there are oxygen vacancies in position 48f. TiEr + ErTi anti-structure pairs increase the intensity of the (3 0 0)
A.V. Shlyakhtina et al. / Materials Research Bulletin 42 (2007) 742–752 745
Fig. 2. XRD patterns of the sample with Er:Ti = 2.096:1.904 after heat-treatment in the range 110–1690 8C: (1) 110 8C for 24 h, (2) 650 8C for 2 h,
(3) 650 8C for 24 h, (4) 700 8C for 49 h, (5) 800 8C for 2 h, (6) 850 8C for 2 h, (7) 1000 8C for 2 h, (8) 1100 8C for 2 h, (9) 1200 8C for 2 h, (10)
1300 8C for 2 h, (11) 1400 8C for 2 h, (12) 1600 8C for 2 h, and (13) 1690 8C for 2 h. Inset: (1) 110 8C for 24 h, (2) 650 8C for 2 h, (3) 650 8C for 24 h,
and (4) 700 8C for 49 h.
Autho
r's
pers
onal
co
pyreflection from the pyrochlore structure, which therefore can be used to quantify the degree of cation disordering in
pyrochlores. So, the ordered pyrochlore (P) exists in the temperature range 1000–1200 8C (Fig. 2, curves 7–9) only.
Disordered pyrochlore (P1, P2) usually has more intensive (3 0 0) diffraction peak then ordered pyrochlore.
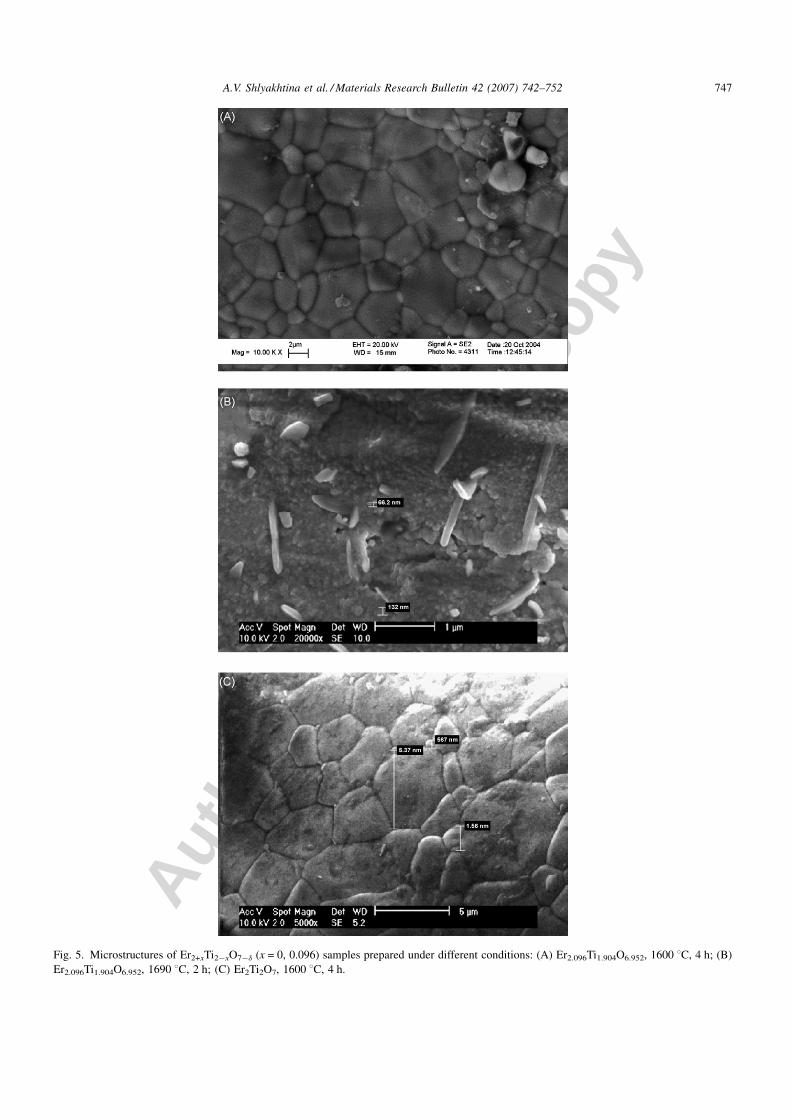
Fig. 5 illustrates the microstructure of Er2.096Ti1.904O6.952 synthesized at 1600 (A) and 1690 8C (B) and Er2Ti2O7
synthesized at 1600 8C (C). The stoichiometric material synthesized at 1690 8C was fully melted. Samples A and C,
both synthesized at 1600 8C, are seen to contain no pores and to range in grain size from 1 to 6 mm. Sample B was
prepared near the eutectic temperature (1700 8C, eutectic composition 84 mol% TiO2). It seems likely that it is the
A.V. Shlyakhtina et al. / Materials Research Bulletin 42 (2007) 742–752746
Fig. 3. Reflectance spectra of the sample with Er:Ti = 2.096:1.904 prepared through hydroxide coprecipitation and heat-treatment in the range 110–
1690 8C: (1) 110 8C for 24 h, (2) 650 8C for 2 h, (3) 850 8C for 2 h, (4) 1200 8C for 2 h, (5) 1600 8C for 2 h, and (6) 1690 8C for 2 h.
Table 1
Rietveld data for Er2.096Ti1.904O6.952 synthesized at 1600 8C in 4 h
Atom Occupancy x y z R factors Parameter (A)
ErEr 0.971 (3) 0.625 0.625 0.625 Rwp = 7.58 10.0965 (3)
TiEr 0.029 0.625 0.625 0.625 Rp = 5.14
TiTi 0.923 0.125 0.125 0.125 Re = 2.27
ErTi 0.077 0.125 0.125 0.125 RI = 6.82
O(1) 1 0.5 0.5 0.5 RF = 5.05
O(2) 0.992 0.1926 0 0 RR = 17.48; S = 3.3324
Fig. 4. Rietveld refinement profile for Er2+xTi2�xO7�d (x = 0.096).
Autho
r's
pers
onal
co
py
A.V. Shlyakhtina et al. / Materials Research Bulletin 42 (2007) 742–752 747
Fig. 5. Microstructures of Er2+xTi2�xO7�d (x = 0, 0.096) samples prepared under different conditions: (A) Er2.096Ti1.904O6.952, 1600 8C, 4 h; (B)
Er2.096Ti1.904O6.952, 1690 8C, 2 h; (C) Er2Ti2O7, 1600 8C, 4 h.
Autho
r's
pers
onal
co
py
presence of liquid phase during synthesis which is responsible for its unusual microstructure (Fig. 5B), made up of
fine grains ranging from 50 to 150 nm in size in combination with plates 1–2 mm in size, which obviously grew during
cooling from the liquid phase present in small amounts at 1690 8C. In contrast to samples A and C, sample B
contained pores. The density of the samples determined by the Archimedes method was about 97% of their X-ray
density.
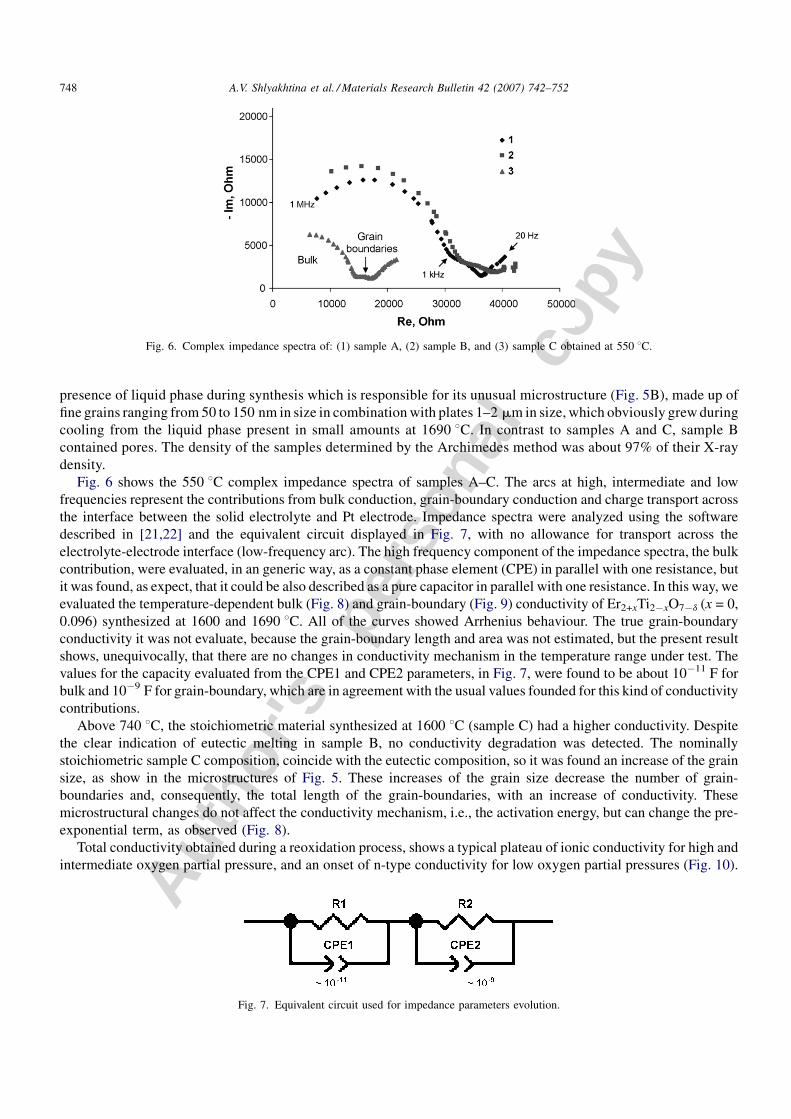
Fig. 6 shows the 550 8C complex impedance spectra of samples A–C. The arcs at high, intermediate and low
frequencies represent the contributions from bulk conduction, grain-boundary conduction and charge transport across
the interface between the solid electrolyte and Pt electrode. Impedance spectra were analyzed using the software
described in [21,22] and the equivalent circuit displayed in Fig. 7, with no allowance for transport across the
electrolyte-electrode interface (low-frequency arc). The high frequency component of the impedance spectra, the bulk
contribution, were evaluated, in an generic way, as a constant phase element (CPE) in parallel with one resistance, but
it was found, as expect, that it could be also described as a pure capacitor in parallel with one resistance. In this way, we
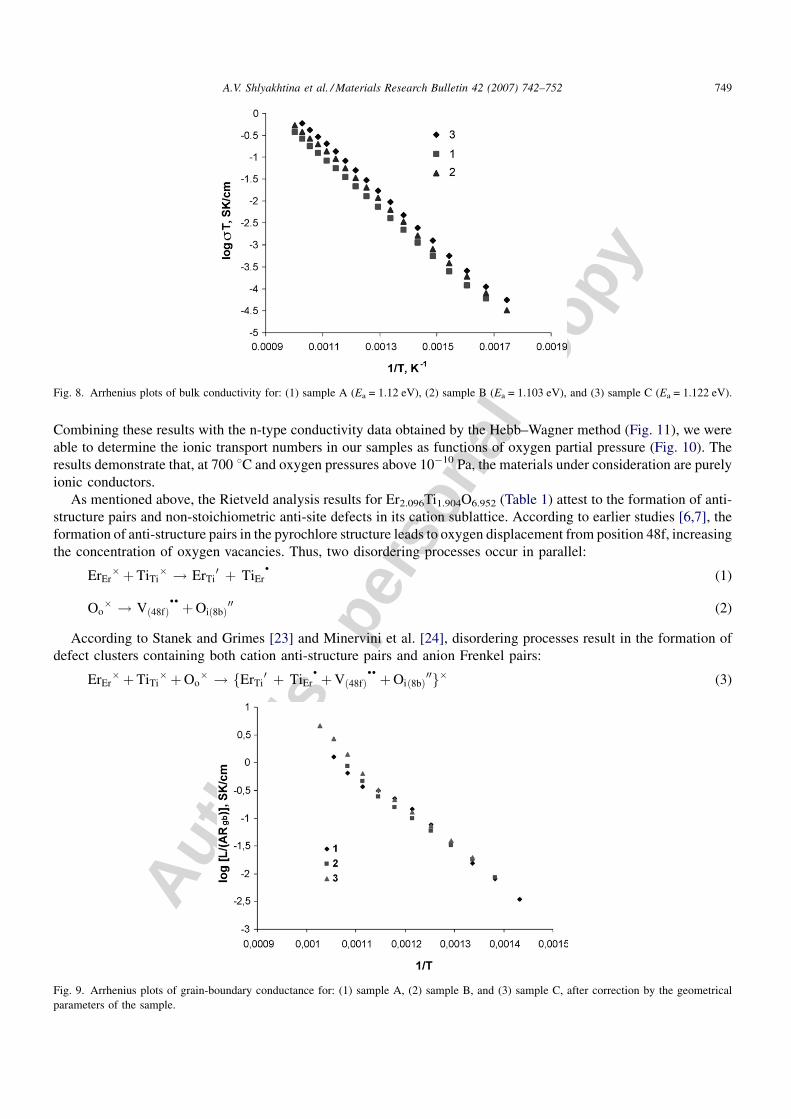
evaluated the temperature-dependent bulk (Fig. 8) and grain-boundary (Fig. 9) conductivity of Er2+xTi2�xO7�d (x = 0,
0.096) synthesized at 1600 and 1690 8C. All of the curves showed Arrhenius behaviour. The true grain-boundary
conductivity it was not evaluate, because the grain-boundary length and area was not estimated, but the present result
shows, unequivocally, that there are no changes in conductivity mechanism in the temperature range under test. The
values for the capacity evaluated from the CPE1 and CPE2 parameters, in Fig. 7, were found to be about 10�11 F for
bulk and 10�9 F for grain-boundary, which are in agreement with the usual values founded for this kind of conductivity
contributions.
Above 740 8C, the stoichiometric material synthesized at 1600 8C (sample C) had a higher conductivity. Despite
the clear indication of eutectic melting in sample B, no conductivity degradation was detected. The nominally
stoichiometric sample C composition, coincide with the eutectic composition, so it was found an increase of the grain
size, as show in the microstructures of Fig. 5. These increases of the grain size decrease the number of grain-
boundaries and, consequently, the total length of the grain-boundaries, with an increase of conductivity. These
microstructural changes do not affect the conductivity mechanism, i.e., the activation energy, but can change the pre-
exponential term, as observed (Fig. 8).
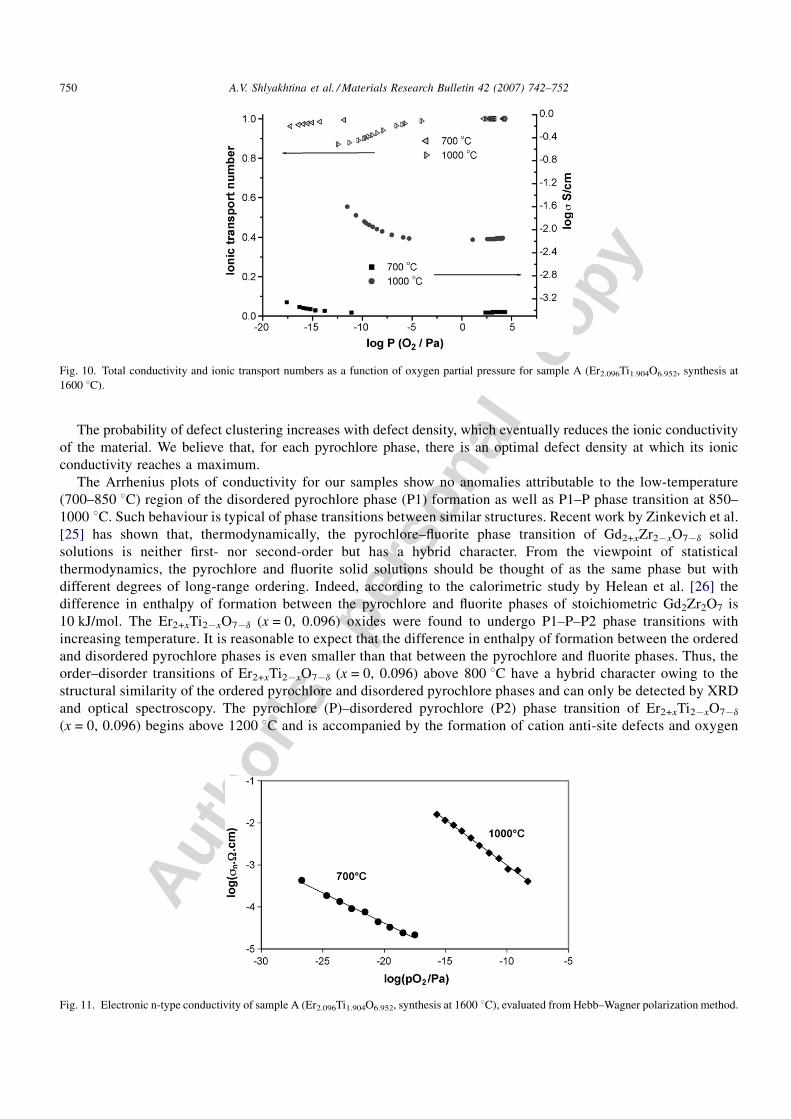
Total conductivity obtained during a reoxidation process, shows a typical plateau of ionic conductivity for high and
intermediate oxygen partial pressure, and an onset of n-type conductivity for low oxygen partial pressures (Fig. 10).
A.V. Shlyakhtina et al. / Materials Research Bulletin 42 (2007) 742–752748
Fig. 6. Complex impedance spectra of: (1) sample A, (2) sample B, and (3) sample C obtained at 550 8C.
Fig. 7. Equivalent circuit used for impedance parameters evolution.
Autho
r's
pers
onal
co
py
Combining these results with the n-type conductivity data obtained by the Hebb–Wagner method (Fig. 11), we were
able to determine the ionic transport numbers in our samples as functions of oxygen partial pressure (Fig. 10). The
results demonstrate that, at 700 8C and oxygen pressures above 10�10 Pa, the materials under consideration are purely
ionic conductors.
As mentioned above, the Rietveld analysis results for Er2.096Ti1.904O6.952 (Table 1) attest to the formation of anti-
structure pairs and non-stoichiometric anti-site defects in its cation sublattice. According to earlier studies [6,7], the
formation of anti-structure pairs in the pyrochlore structure leads to oxygen displacement from position 48f, increasing
the concentration of oxygen vacancies. Thus, two disordering processes occur in parallel:
ErEr� þTiTi
� ! ErTi0 þ TiEr
�(1)
Oo� ! Vð48fÞ
�� þOið8bÞ00 (2)
According to Stanek and Grimes [23] and Minervini et al. [24], disordering processes result in the formation of
defect clusters containing both cation anti-structure pairs and anion Frenkel pairs:
ErEr� þTiTi
� þOo� ! fErTi
0 þ TiEr� þVð48fÞ
�� þOið8bÞ00g� (3)
A.V. Shlyakhtina et al. / Materials Research Bulletin 42 (2007) 742–752 749
Fig. 8. Arrhenius plots of bulk conductivity for: (1) sample A (Ea = 1.12 eV), (2) sample B (Ea = 1.103 eV), and (3) sample C (Ea = 1.122 eV).
Fig. 9. Arrhenius plots of grain-boundary conductance for: (1) sample A, (2) sample B, and (3) sample C, after correction by the geometrical
parameters of the sample.
Autho
r's
pers
onal
co
py
The probability of defect clustering increases with defect density, which eventually reduces the ionic conductivity
of the material. We believe that, for each pyrochlore phase, there is an optimal defect density at which its ionic
conductivity reaches a maximum.
The Arrhenius plots of conductivity for our samples show no anomalies attributable to the low-temperature
(700–850 8C) region of the disordered pyrochlore phase (P1) formation as well as P1–P phase transition at 850–
1000 8C. Such behaviour is typical of phase transitions between similar structures. Recent work by Zinkevich et al.
[25] has shown that, thermodynamically, the pyrochlore–fluorite phase transition of Gd2+xZr2�xO7�d solid
solutions is neither first- nor second-order but has a hybrid character. From the viewpoint of statistical
thermodynamics, the pyrochlore and fluorite solid solutions should be thought of as the same phase but with
different degrees of long-range ordering. Indeed, according to the calorimetric study by Helean et al. [26] the
difference in enthalpy of formation between the pyrochlore and fluorite phases of stoichiometric Gd2Zr2O7 is
10 kJ/mol. The Er2+xTi2�xO7�d (x = 0, 0.096) oxides were found to undergo P1–P–P2 phase transitions with
increasing temperature. It is reasonable to expect that the difference in enthalpy of formation between the ordered
and disordered pyrochlore phases is even smaller than that between the pyrochlore and fluorite phases. Thus, the
order–disorder transitions of Er2+xTi2�xO7�d (x = 0, 0.096) above 800 8C have a hybrid character owing to the
structural similarity of the ordered pyrochlore and disordered pyrochlore phases and can only be detected by XRD
and optical spectroscopy. The pyrochlore (P)–disordered pyrochlore (P2) phase transition of Er2+xTi2�xO7�d
(x = 0, 0.096) begins above 1200 8C and is accompanied by the formation of cation anti-site defects and oxygen
A.V. Shlyakhtina et al. / Materials Research Bulletin 42 (2007) 742–752750
Fig. 10. Total conductivity and ionic transport numbers as a function of oxygen partial pressure for sample A (Er2.096Ti1.904O6.952, synthesis at
1600 8C).
Fig. 11. Electronic n-type conductivity of sample A (Er2.096Ti1.904O6.952, synthesis at 1600 8C), evaluated from Hebb–Wagner polarization method.

Autho
r's
pers
onal
co
py
vacancies. This transformation can be thought of as the first step of a high-temperature P–F phase transition.
Together with the high density of the samples sintered near the eutectic temperature (1600–1690 8C), it ensures
high oxygen-ion conductivity, �10�3 S/cm at 740 8C.
4. Conclusion
Heat-treatment of Er2+xTi2�xO7�d (x = 0, 0.096) at temperatures above 1600 8C was shown to lead to the formation
of pyrochlore-like solid solutions with high oxide ion conductivity, about 10�3 S/cm at 740 8C. Complex impedance
spectra were used to separately assess the bulk and grain-boundary conductivity of the samples. At 700 8C and oxygen
pressures above 10�10 Pa, the oxygen ion transport number in the solid solutions is unity. Rietveld analysis results
indicate that Er2.096Ti1.904O6.952 synthesized at 1600 8C contains about 2.9 at.% TiEr + ErTi anti-structure pairs,
4.8 at.% non-stoichiometric ErTi anti-site defects and oxygen vacancies in position 48f.
The Er2+xTi2�xO7�d (x = 0, 0.096) oxides are shown to undergo P1–P–P2 phase transitions in the range 700–
1690 8C. The low-temperature disordered pyrochlore (P1) forms at T � 850 8C, immediately after the decomposition
of the erbium hydroxycarbonate. P1 transformed to ordered pyrochlore (P) at T > 850 8C.
The pyrochlore–disordered pyrochlore (P–P2) phase transition, which can be thought of as the first step of a high-
temperature order–disorder (pyrochlore–fluorite) transformation, occurs above 1200 8C. The formation of a
disordered pyrochlore phase P2 at 1600–1690 8C in Er2+xTi2�xO7�d and Er2Ti2O7 is no doubt a basic condition for the
development of high-temperature ionic conduction.
Acknowledgements
This work was financially supported by the Presidium of the Russian Academy of Sciences through the basic
research program ‘‘ Synthesis of Inorganic Substances with Controlled Properties and Fabrication of Related
Functional Materials’’, grants nos. 12/04, 9/05, and program no. 8/06 of Fundamental Investigations of Presidium RAS
and the European Science Foundation Scientific Programme ‘‘OSSEP’’ (travel grant).
We are grateful to A.V. Knotko (Moscow University, Chemical Department) for performing Rietveld profile
analysis.
References
[1] B.C.H. Steele, Oxygen ion conductors, in: T.T. Takahashi (Ed.), High conductivity Solid Ionic Conductors, Recent Trends and Applications,
World Scientific Publishing, Singapore, 1989, pp. 402–446.
[2] J.C. Boivin, G. Mairesse, Chem. Mater. 10 (1998) 2870.
[3] A.R. West, Solid State Chemistry and Its Applications, Wiley, Chichester, 1985.
[4] S.A. Kramer, H.L. Tuller, Solid State Ionics 72 (1994) 15.
[5] P.K. Moon, H.L. Tuller, Solid State Ionics 28–30 (1988) 470.
[6] B.J. Wuensch, K.W. Eberman, C. Heremans, E.M. Ku, P. Onnerud, E.M.E. Yeo, S.M. Haile, J.K. Stalick, J.D. Jorgensen, Solid State Ionics 129
(2000) 111.
[7] P.J. Wilde, C.R.A. Catlow, Solid Sate Ionics 112 (1998) 173.
[8] A.V. Shlyakhtina, L.G. Shcherbakova, A.V. Knotko, A.V. Steblevskii, J. Solid State Electrochem. 8 (2004) 661.
[9] A.V. Shlyakhtina, A.E. Ukshe, L.G. Shcherbakova, Russ. J. Electrochem. 41 (3) (2005) 298.
[10] A.V. Shlyakhtina, J.C.C. Abrantes, L.L. Larina, L.G. Shcherbakova, Solid State Ionics 176 (2005) 1653.
[11] A.V. Shlyakhtina, A.V. Knotko, M.V. Boguslavskii, S.Yu. Stefanovich, D.V. Peryshkov, I.V. Kolbanev, L.G. Shcherbakova, Solid State Ionics
176 (2005) 2297.
[12] L.G. Shcherbakova, L.G. Mamsurova, G.E. Sukhanova, Soedineniya redkozemel’nykh elementov. Karbonaty, oksalaty, nitraty, titanaty (Rare-
Earth Compounds: Carbonates, Oxalates, Nitrates, and Titanates), Nauka, Moscow, 1984, pp. 194–224.
[13] M.A. Petrova, A.S. Novikova, R.G. Grebenshchikov, Dokl. Akad. Nauk. SSSR 246 (1979) 121.
[14] A.V. Shlyakhtina, J.C.C. Abrantes, A.V. Levchenko, S.Yu. Stefanovich, A.V. Knotko, L.L. Larina, L.G. Shcherbakova, Mater. Sci. Forum 514–
516 (2006) 422.
[15] A. Levchenko, J.C.C. Abrantes, A.V. Shlyakhtina, L.G. Shcherbakova, J.R. Frade, A.L. Horovistiz, Mater. Sci. Forum 514–516 (2006)
417.
[16] A.V. Shlyakhtina, A.V. Mosunov, S.Yu. Stefanovich, A.V. Knotko, O.K. Karyagina, L.G. Shcherbakova, Inorg. Mater. 41 (3) (2005)
264.
[17] A.V. Shlyakhtina, L.G. Shcherbakova, A.V. Knotko, Ferroelectrics 294 (2003) 175.
[18] L.N. Fomina, S.F. Palguev, Zh. Neorg. Khim. 22 (1977) 326.
A.V. Shlyakhtina et al. / Materials Research Bulletin 42 (2007) 742–752 751

Autho
r's
pers
onal
co
py
[19] F. Izumi, Rietveld analysis programs RIETAN and PREMOS and special applications, in: R.A. Young (Ed.), The Rietveld Method, Oxford
University Press, Oxford, 1993, pp. 236–253.
[20] Determination of Metallic Minerals from Their Reflection Spectra, Leningrad, Nedra, 1985.
[21] B. Boukamp, Solid State Ionics 20 (1986) 31.
[22] J.C.C. Abrantes, J.R. Frade, ISA—Impedance Spectroscopy Analysis, Software Package, 2003.
[23] C.R. Stanek, R.W. Grimes, J. Am. Ceram. Soc. 85 (8) (2002) 2139.
[24] L. Minervini, R.W. Grimes, K.E. Sickafus, J. Am. Ceram. Soc. 83 (2000) 1873.
[25] M. Zinkevich, Ch. Wang, F.M. Morales, M. Ruhle, F. Aldinger, J. Alloys Compd. 398 (2005) 261.
[26] K. Helean, B.D. Begg, A. Navrotsky, B. Ebbinghaus, W.J. Weber, R.C. Ewing, Mater. Res. Soc. Proc. 663 (2001) 691.
A.V. Shlyakhtina et al. / Materials Research Bulletin 42 (2007) 742–752752
Copyright © 2022 FDOKUMEN