Orangutans and the Economics of Sustainable Forest ...
84
ORANGUTANS AND THE ECONOMICS OF SUSTAINABLE FOREST MANAGEMENT IN SUMATRA
-
Upload
khangminh22 -
Category
Documents
-
view
0 -
download
0
Transcript of Orangutans and the Economics of Sustainable Forest ...
ORANGUTANS AND THE ECONOMICS OF SUSTAINABLE FOREST MANAGEMENT IN SUMATRA
Wich et al. (eds.) 2011. Orangutans and the Economics of Sustainable Forest Management in Sumatra. UNEP/GRASP/PanEco/YEL/ICRAF/GRID-Arendal.
ISBN: 978-82-7701-095-3
Printed at Birkeland Trykkeri AS, Norway
orangutanreport.un-grasp.orgwww.un-grasp.org
This report was made possible by financial support from the Government of Norway and the Government of Monaco.
Front cover photos:An orangutan infant playing with a stick (Molly Brooks)Clearing of the rainforest in Aceh (Ullsteinbild/TopFoto)Back cover photo:Mother and infant orangutan high up in the forest canopy (Perry van Duijnhoven)
UNEP promotes environmentally sound practices
globally and in its own activities. This pub-lication is printed on fully recycled paper, FSC
certified, post-consumer waste and chlorine-free. Inks are vegetable-based and coatings are water-
based. Our distribution policy aims to reduce UNEP’s carbon footprint.
Editors: Serge Wich, Riswan, Johann Jenson, Johannes Refisch and Christian Nellemann
ContentsForewords
SummaryIntroductionThe Sumatran orangutanChallenges for the protection of orangutans and their habitatPolicies and laws for the protection of forests and orangutans New green business opportunitiesConclusion and recommendations
ReferencesAnnexes
7
13162028434672
7480
ORANGUTANS AND THE ECONOMICS OF SUSTAINABLE FOREST MANAGEMENT IN SUMATRA
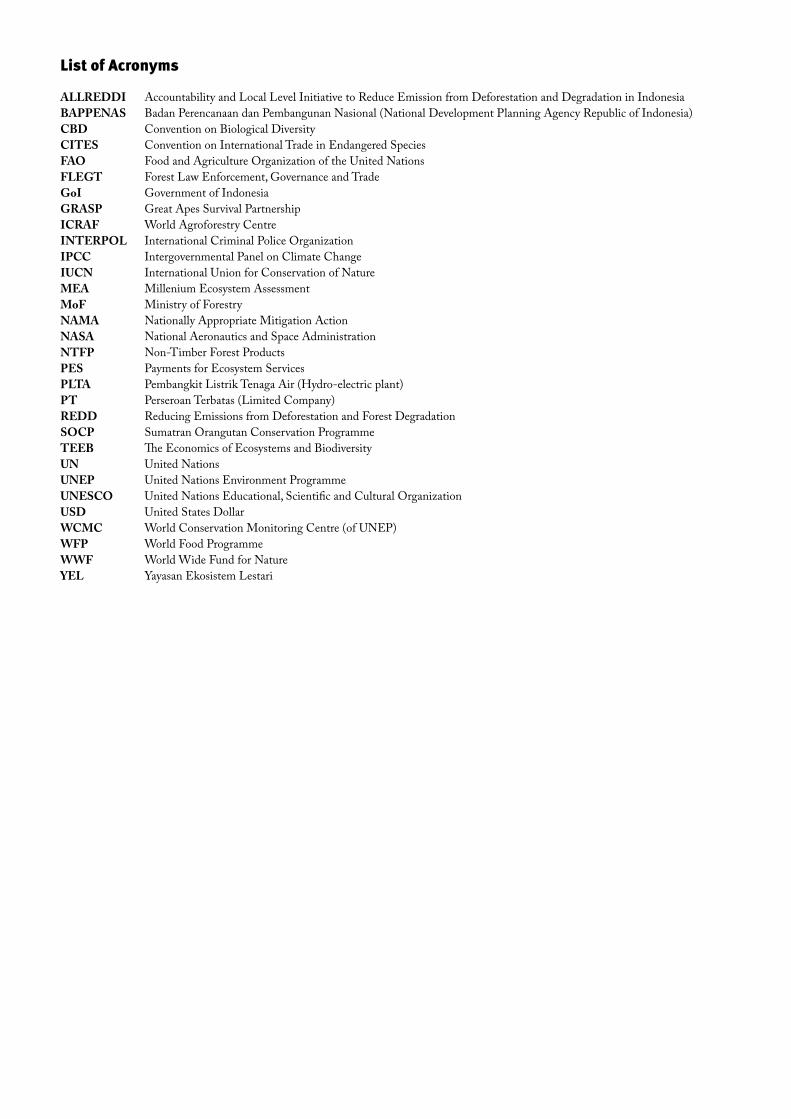
ALLREDDIBAPPENASCBDCITESFAOFLEGTGoIGRASPICRAFINTERPOLIPCCIUCNMEAMoFNAMANASANTFPPESPLTAPTREDDSOCPTEEBUNUNEPUNESCOUSDWCMCWFPWWFYEL
Accountability and Local Level Initiative to Reduce Emission from Deforestation and Degradation in IndonesiaBadan Perencanaan dan Pembangunan Nasional (National Development Planning Agency Republic of Indonesia)Convention on Biological DiversityConvention on International Trade in Endangered SpeciesFood and Agriculture Organization of the United NationsForest Law Enforcement, Governance and TradeGovernment of IndonesiaGreat Apes Survival PartnershipWorld Agroforestry CentreInternational Criminal Police OrganizationIntergovernmental Panel on Climate ChangeInternational Union for Conservation of NatureMillenium Ecosystem AssessmentMinistry of ForestryNationally Appropriate Mitigation ActionNational Aeronautics and Space AdministrationNon-Timber Forest ProductsPayments for Ecosystem ServicesPembangkit Listrik Tenaga Air (Hydro-electric plant)Perseroan Terbatas (Limited Company)Reducing Emissions from Deforestation and Forest DegradationSumatran Orangutan Conservation ProgrammeThe Economics of Ecosystems and BiodiversityUnited NationsUnited Nations Environment ProgrammeUnited Nations Educational, Scientific and Cultural OrganizationUnited States DollarWorld Conservation Monitoring Centre (of UNEP)World Food ProgrammeWorld Wide Fund for NatureYayasan Ekosistem Lestari
List of Acronyms
The editors acknowledge the support of the Great Apes Survival Partnership (GRASP), Aceh Green, Badan Pengelola Kawasan Ekosistem Leuser (BPKEL), District Government of Nagan Raya, District Government of Aceh Barat Daya, District Government of Central Ta-panuli, District Government of South Tapanuli, District Government of North Tapanuli, Leuser International Foundation (LIF), Gunung Leuser National Park, Ministry of Forestry of Indonesia, United Nations Educational, Scientific and Cultural Organization (UNESCO), World Agricultural Centre (ICRAF), Sumatran Orangutan Conservation Programme (SOCP), Yayasan Ekosistem Lestari (YEL), World Wildlife fund (WWF), PanEco Foundation, United Nations Environment Programme (UNEP), the Government of Norway, the Govern-ment of Monaco, the Biodiversity and Agricultural Commodities Program (BACP) from the International Finance Corporation (IFC) and the Australian Orangutan Project. Maps were created with ArcGIS from Esri. We also thank Perry van Duijnhoven, Eluned Price and Nikki Meith, and Denis Ruysschaert for his work as coordinator of the early work on the publication.
List of reviewers and data contributors Arantzazu Acha De La Presa, UNESCO, IndonesiaMarc Ancrenaz, Hutan, MalaysiaNeville Ash, UNEP, KenyaPieter van Beukering, Free University, The NetherlandsHelen Buckland, Sumatran Orangutan Society, UKDave Dellatore, Sumatran Orangutan Society, IndonesiaDavid Duthie, Secretariat Convention on Biodiversity, Canada Agus Fahmuddin, Indonesian Soil Research Institute, Indonesia Panut Hadisiswoyo, Orangutan Information Centre, Indonesia Jean-Charles Jacquemard, PT Socfindo and Agricultural Research for Development (CIRAD), Indonesia Mark Leighton, Great Ape World Heritage Species Project, USALian Pin Koh, Eidgenössische Technische Hochschule (ETH), SwitzerlandAnnaleis Martin, Australian Orangutan Programme, AustraliaErik Meijaard, People and Nature Consulting, IndonesiaDideudonné Musibono, University of Kinshasa, Democratic Re-public of CongoWilliam Oluput, Bushmeat-Free Eastern Africa Network (BEAN), UgandaSusan Page, University of Leicester, UK Glaudy Perdanahardja, UNESCO, IndonesiaJack Rieley, Rieley Consultants, UKCarel van Schaik, University of Zurich, SwitzerlandMarcel Silvius, Wetlands International, The NetherlandsSuci Utami Atmoko, Universitas Nasional, IndonesiaG. Viswanatha Reddy, Leuser International Foundation, IndonesiaHenk Wösten, Alterra, The Netherlands
Acknowledgements
EditorsSerge Wich, PanEco, Indonesia/University of Zurich, SwitzerlandRiswan, Yayasan Ekosistem Lestari, IndonesiaJohann Jenson, UNEP/GRASP, KenyaJohannes Refisch, UNEP/GRASP, KenyaChristian Nellemann, UNEP/GRID-Arendal, Norway
List of authors and contributorsAsril Abbdullah, Yayasan Ekosistem Lestari, IndonesiaAdji Abimayu Darsoyo, Yayasan Ekosistem Lestari, IndonesiaSuherry Aprianto, Yayasan Ekosistem Lestari, IndonesiaFitri Basalamah, Yayasan Ekosistem Lestari, IndonesiaJulie Belmont, UNEP, KenyaMario Boccucci, UNEP, KenyaSonya Dewi, World Agroforestry Centre (ICRAF), IndonesiaAndree Ekadinata, World Agroforestry Centre (ICRAF), Indonesia Gabriella Frederiksson, PanEco, IndonesiaGunung Gea, Yayasan Ekosistem Lestari, IndonesiaINTERPOL Environmental Crime Programme, France Feri Johana, World Agroforestry Centre (ICRAF), Indonesia Pushpam Kumar, UNEP, KenyaBetha Lusiana, World Agroforestry Centre (ICRAF), Indonesia Endri Martini, World Agroforestry Centre (ICRAF), Indonesia Rachmat Mulia, World Agroforestry Centre (ICRAF), Indonesia Eluk Mulyoutami, World Agroforestry Centre (ICRAF), IndonesiaMeine van Noordwijk, World Agroforestry Centre (ICRAF), IndonesiaNuzuar, Yayasan Ekosistem Lestari, IndonesiaRahayu Oktaviani, World Agroforestry Centre (ICRAF), Indonesia Wahida Patwa-Shah, UNEP, KenyaCharlotte Paulet, PanEco, IndonesiaRavi Prabhu, UNEP, KenyaSubekti Rahayu, World Agroforestry Centre (ICRAF), IndonesiaKatarina Riswandi, World Agroforestry Centre (ICRAF), Indonesia Denis Ruysschaert, PanEco, SwitzerlandZuraidah Said, World Agroforestry Centre (ICRAF), Indonesia Pinda Sianturi, Yayasan Ekosistem Lestari, Indonesia Ian Singleton, PanEco, IndonesiaPanggalih Susetyo, Yayasan Ekosistem Lestari, Indonesia Hesti Lestari Tata, World Agroforestry Centre (ICRAF), IndonesiaGraham Usher, PanEco, IndonesiaAtiek Widayati, World Agroforestry Centre (ICRAF), IndonesiaMatthew Woods, Carbon Africa, KenyaYuliana Wulan, World Agroforestry Centre (ICRAF), Indonesia
6 7
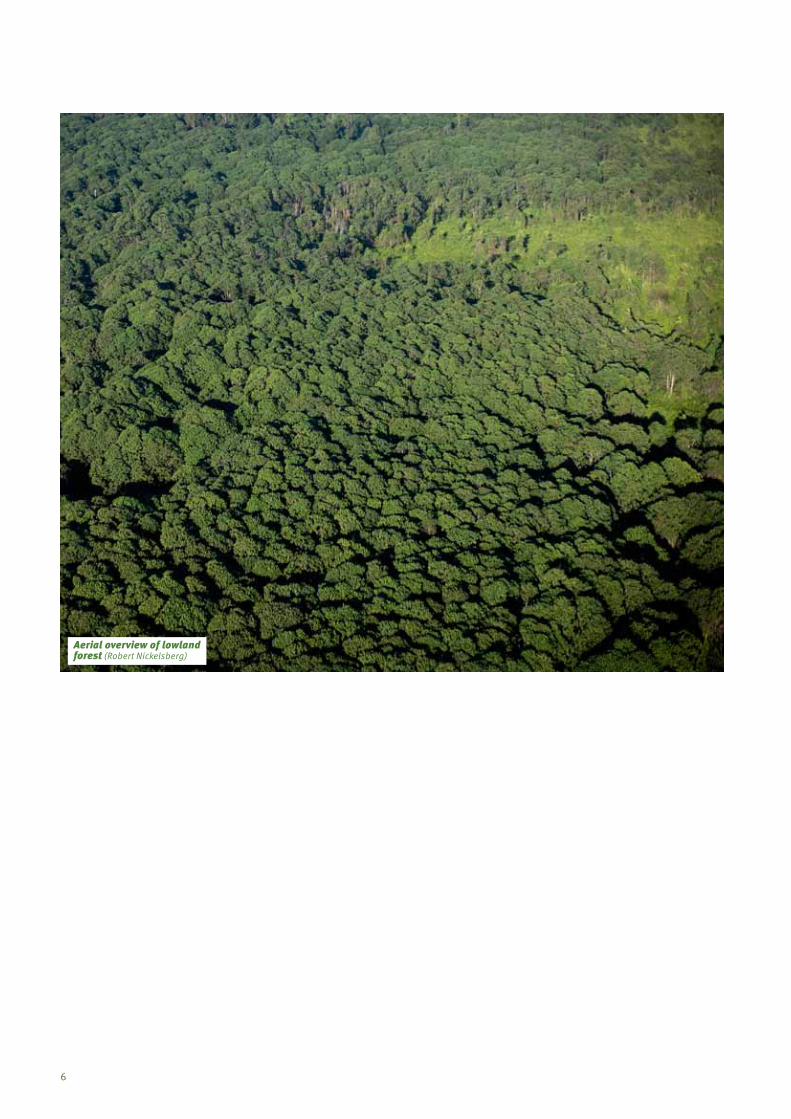
Aerial overview of lowland forest (Robert Nickelsberg)

6 7
Foreword by UNEP Executive director
Over the past century, wild orangutan populations in Southeast Asia are estimated to have decreased by nearly 92%. The main threat to their future survival is the loss of habitat from road development and agricultural expansion to illegal timber harvesting, mining and human encroach-ment on the last two islands where they survive – Borneo and Sumatra.
The Great Apes Survival Partnership (GRASP) was established by UNEP 10 years ago involving a consortium of partners with a mandate to lift the threat of imminent extinction to great apes through its unique partnerships of range states, conservation organizations, donor governments, and inter-governmental agencies.
This GRASP report, Orangutans and the Economics of Sustainable Forest Management in Sumatra, offers a detailed analysis of the market forces driving orangutans to extinction and presents trans-formative economic arguments to catalyze a different development path.
Sustainably managing the more than 8,640 km2 of Sumatran orangutan habitat left is vital to conserving the extraordinary variety of forest and other ecosystem services needed for long-term human well-being. The preliminary economic data included in this report suggests that the poten-tial derived from these services far outweighs current land conversion revenue for agriculture and other current uses.
The report comes in advance of the Rio+20 meeting in June 2012 where smart policies and creative economic instruments are at the centre of one of the two major themes – a Green Economy in the context of sustainable development and poverty eradication.
REDD+ (Reducing Emissions from Deforestation and forest Degradation), being developed to support the UN climate convention, is one such instrument that echoes to the challenges facing countries, communities and species such as the orangutan.
Indonesia, with support from nations such as Norway, is already piloting REDD+ projects. This new report indicates that scaling up and embedding such policies within local and national econo-mies offers multiple environmental, social and economic benefits that include a more hopeful future for the country’s great apes.
2011 is the International Year of the Forests: This new GRASP report illuminates how land-use management in the forests and peatlands of Sumatra can be dramatically improved. In doing so, it can serve as a foundation for assisting communities and species across the range of the great apes in Africa and Asia.
Achim SteinerUN Under-Secretary General andUNEP Executive Director
8 9
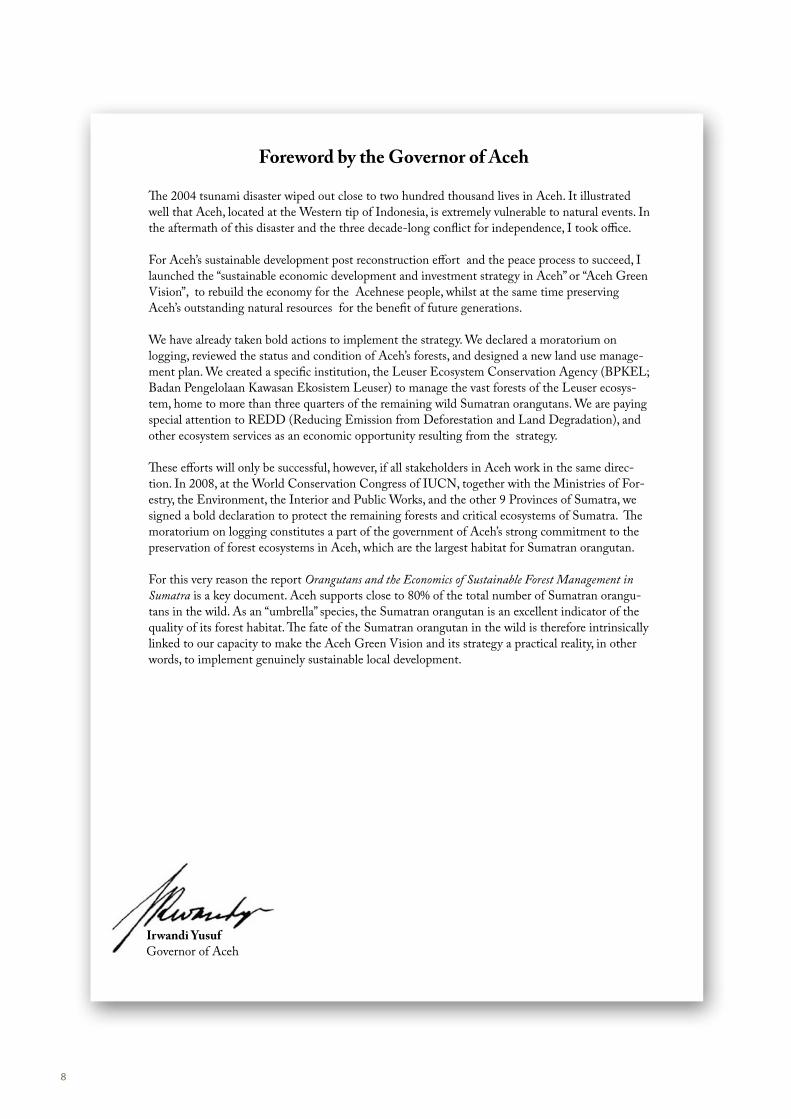
Foreword by the Governor of Aceh
The 2004 tsunami disaster wiped out close to two hundred thousand lives in Aceh. It illustrated well that Aceh, located at the Western tip of Indonesia, is extremely vulnerable to natural events. In the aftermath of this disaster and the three decade-long conflict for independence, I took office.
For Aceh’s sustainable development post reconstruction effort and the peace process to succeed, I launched the “sustainable economic development and investment strategy in Aceh” or “Aceh Green Vision”, to rebuild the economy for the Acehnese people, whilst at the same time preserving Aceh’s outstanding natural resources for the benefit of future generations.
We have already taken bold actions to implement the strategy. We declared a moratorium on logging, reviewed the status and condition of Aceh’s forests, and designed a new land use manage-ment plan. We created a specific institution, the Leuser Ecosystem Conservation Agency (BPKEL; Badan Pengelolaan Kawasan Ekosistem Leuser) to manage the vast forests of the Leuser ecosys-tem, home to more than three quarters of the remaining wild Sumatran orangutans. We are paying special attention to REDD (Reducing Emission from Deforestation and Land Degradation), and other ecosystem services as an economic opportunity resulting from the strategy.
These efforts will only be successful, however, if all stakeholders in Aceh work in the same direc-tion. In 2008, at the World Conservation Congress of IUCN, together with the Ministries of For-estry, the Environment, the Interior and Public Works, and the other 9 Provinces of Sumatra, we signed a bold declaration to protect the remaining forests and critical ecosystems of Sumatra. The moratorium on logging constitutes a part of the government of Aceh’s strong commitment to the preservation of forest ecosystems in Aceh, which are the largest habitat for Sumatran orangutan.
For this very reason the report Orangutans and the Economics of Sustainable Forest Management in Sumatra is a key document. Aceh supports close to 80% of the total number of Sumatran orangu-tans in the wild. As an “umbrella” species, the Sumatran orangutan is an excellent indicator of the quality of its forest habitat. The fate of the Sumatran orangutan in the wild is therefore intrinsically linked to our capacity to make the Aceh Green Vision and its strategy a practical reality, in other words, to implement genuinely sustainable local development.
Irwandi YusufGovernor of Aceh
8 9
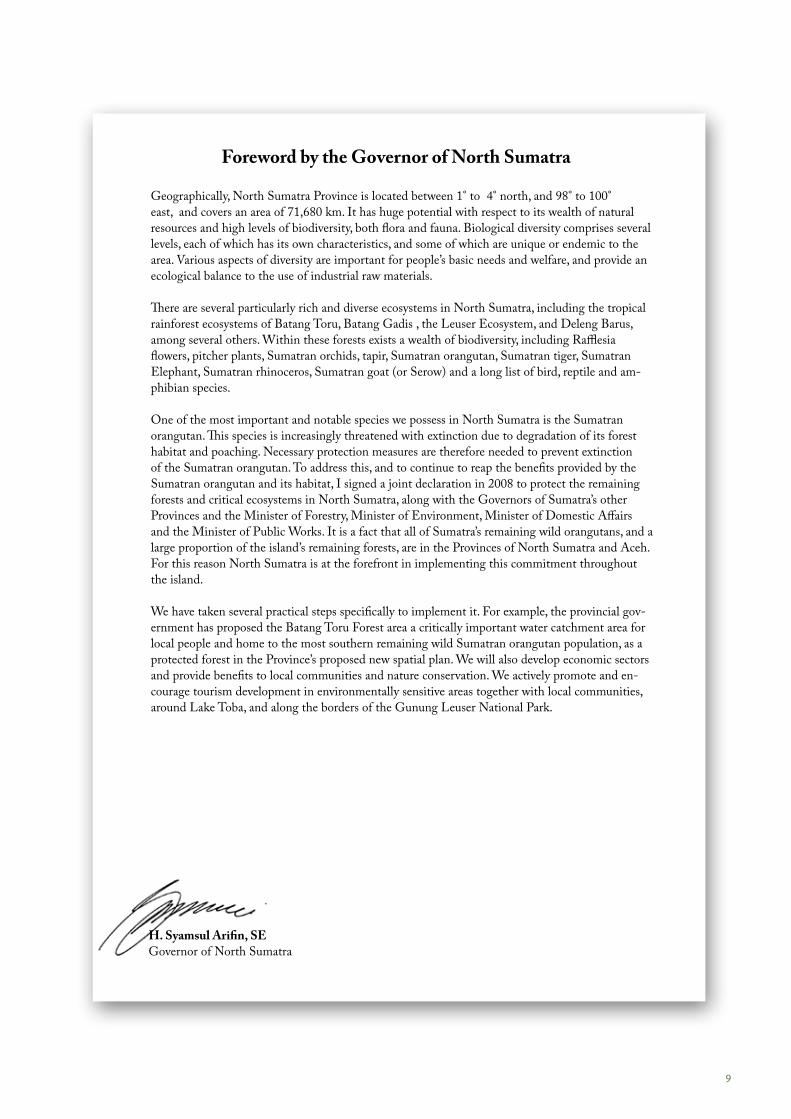
Foreword by the Governor of North Sumatra
Irwandi YusufGovernor of Aceh
Geographically, North Sumatra Province is located between 1° to 4° north, and 98° to 100° east, and covers an area of 71,680 km. It has huge potential with respect to its wealth of natural resources and high levels of biodiversity, both flora and fauna. Biological diversity comprises several levels, each of which has its own characteristics, and some of which are unique or endemic to the area. Various aspects of diversity are important for people’s basic needs and welfare, and provide an ecological balance to the use of industrial raw materials.
There are several particularly rich and diverse ecosystems in North Sumatra, including the tropical rainforest ecosystems of Batang Toru, Batang Gadis , the Leuser Ecosystem, and Deleng Barus, among several others. Within these forests exists a wealth of biodiversity, including Rafflesia flowers, pitcher plants, Sumatran orchids, tapir, Sumatran orangutan, Sumatran tiger, Sumatran Elephant, Sumatran rhinoceros, Sumatran goat (or Serow) and a long list of bird, reptile and am-phibian species.
One of the most important and notable species we possess in North Sumatra is the Sumatran orangutan. This species is increasingly threatened with extinction due to degradation of its forest habitat and poaching. Necessary protection measures are therefore needed to prevent extinction of the Sumatran orangutan. To address this, and to continue to reap the benefits provided by the Sumatran orangutan and its habitat, I signed a joint declaration in 2008 to protect the remaining forests and critical ecosystems in North Sumatra, along with the Governors of Sumatra’s other Provinces and the Minister of Forestry, Minister of Environment, Minister of Domestic Affairs and the Minister of Public Works. It is a fact that all of Sumatra’s remaining wild orangutans, and a large proportion of the island’s remaining forests, are in the Provinces of North Sumatra and Aceh. For this reason North Sumatra is at the forefront in implementing this commitment throughout the island.
We have taken several practical steps specifically to implement it. For example, the provincial gov-ernment has proposed the Batang Toru Forest area a critically important water catchment area for local people and home to the most southern remaining wild Sumatran orangutan population, as a protected forest in the Province’s proposed new spatial plan. We will also develop economic sectors and provide benefits to local communities and nature conservation. We actively promote and en-courage tourism development in environmentally sensitive areas together with local communities, around Lake Toba, and along the borders of the Gunung Leuser National Park.
H. Syamsul Arifin, SEGovernor of North Sumatra
10 11
Foreword by the Ministry of Forestry
“We have already felt for ourselves the consequences of environmental damage, such as landslides, floods, forest fires and so on. We must encourage a form of development that is environmentally friendly.”
(Susilo Bambang Yudhoyono, president, Republic of Indonesia)
Indonesia is blessed with bountiful natural resources and vast expanses of natural forests. The forests are home to unique species including the world’s largest arboreal mammal - the Sumatran orangutan. Forests in Indonesia provide ecosystem services that are crucial to the local and global community and our country recognises the importance of biodiversity and the associated ecosys-tem services to the extent that an expansive network of protected areas and national conservation programmes have been established to secure these for future generations. At the same time, Indo-nesia has been trying to develop economically and often this has come at the expense of forests. Unfortunately, forest loss also means these same ecosystem services are being compromised. At a local level, landslides, floods, and changes in water regulation are the result, while at the global scale carbon dioxide emissions from deforestation and forest degradation must stimulate global efforts for climate change mitigation and adaptation.
In December 2009, at the United Nations Climate Change Conference in Copenhagen, Indonesia amerged as a green leader by committing to reduce the country’s greenhouse gas emissions by 26% by 2020, and up to 41% with external aid. With a huge amount of carbon stored in Indonesia’s forests and especially forests within the country’s extensive peatlands, improved forest management is vital to avoiding carbon emissions from deforestation and forest degradation. Indonesia therefore welcomes current initiatives that attempt to contribute to a green economy where strong economic development is inextricably linked to biodiversity conservation and ecosystem services.
Indonesia has already taken bold steps to develop a sustainable economy based on improved for-est management. The country has joined the United Nations collaborative programme on Reducing Emissions from Deforestation and forest Degradation (UN-REDD) seeking to reduce carbon emis-sions from deforestation and forest degradation. In May 2010, Indonesia signed a US$ 1 Billion deal with Norway to improve sustainable forest management, including biodiversity conservation.
Thus we welcome this publication linking the plight of one of Indonesia’s most cherished species, the orangutan, with the ecosystem services provided by the forests where they live. We value the findings of the scientific and economic research that demontsrates that carbon could stimulate the development of a green economy in Indonesia where conservation of natural forests works in synergy with sustainable development.
While Indonesia and the international community still have yet considerable strides to make to realize a green economic future, we at present are firmly committed.
Ir. Novianto Bambang W, MSIDirector of Biodiversity ConservationDirectorate General of Forest Protection and Nature ConservationMinistry of Forestry
10 11
Foreword by PanEco
Ir. Novianto Bambang W, MSIDirector of Biodiversity ConservationDirectorate General of Forest Protection and Nature ConservationMinistry of Forestry
Here at the beginning of the 21st century the very survival of the Sumatran orangutan, our enig-matic Asian relative, is in serious jeopardy. Indeed it is our own generation, and the decisions we make today, that will determine whether the Sumatran orangutan continues to exist in the wild or not. Beyond the obvious ethical issues the species’ extinction would evoke, it would also highlight very obvious societal contradictions. Despite the fact that there is global public support for orangu-tan conservation, that there are significant funds available, and that there are numerous policies and laws in existence to protect orangutans and their habitat, both nationally and internationally, the wild population of the Sumatran orangutan continues to decline sharply and today there are only a very few thousand left.
I have always felt that the discrepancy between the degree of good will and support for conserva-tion, and the reality on the ground, has its roots in our overall approach to development gener-ally. Development normally occurs at the expense of the environment, in a top down approach that excludes many local stakeholders and does not account for the sustainability of local natural resources. This is why, after establishing the very first Sumatran orangutan rehabilitation centre in 1973, I have always striven to develop economic activities in synergy with conservation efforts that help to safeguard the natural environment. At first as an individual, and later through the PanEco Foundation, I have for some decades now focussed my efforts on the development and promotion of organic farming, sustainable tourism, and professional environmental education. This has led to some pioneering achievements, including in 1978 the foundation of the first environmental conser-vation NGO in Indonesia, the Green Indonesia Foundation, and in 1990 the setting up of the first Indonesian environmental education centre, in Seloliman, East Java. Upon the signing of an MOU with the Indonesian Government in 1999, PanEco began its new Sumatran Orangutan Conserva-tion Programme (SOCP) and built the first fully equipped medical quarantine centre for Sumatran orangutans in 2000. In the ensuing years, the first new, reintroduced population of Sumatran oran-gutans has been successfully established in the Bukit Tigapuluh National Park, in central Sumatra.
For these reasons, after almost 40 years of struggle, I warmly welcome this urgently needed report, Orangutans and the Economics of Sustainable Forest Management in Sumatra. Thanks to consider-able support from UNEP, there is now a comprehensive user-friendly document showing clearly that Sumatran orangutan conservation and human well-being are in fact very closely interlinked. PanEco’s successes against the steady destruction of the forests should not be seen as small achieve-ments, but more as the seeds of much bigger changes. They represent practical examples for how together we could re-design a society where a living space for the Sumatran orangutan is secured, in harmony with the well-being of the local human population, and with the ultimate benefit of helping establish a globally more sustainable economy. Securing a future in the wild for one of our closest living relatives, the Sumatran orangutan, is a moral obligation, which we simply must fulfil, and on which we will be judged by future generations. This report provides both the facts regarding the Sumatran orangutans’ desperate plight in the wild, and the tools to do something about it, and at the same time to benefit some of the most disadvantaged members of human society too! With the publication of this report, no one will be able to use the excuse that they “did not know”.
Regina FreyPresident

12 13
An orangutan infant playing with a leaf (Molly Brooks)

12 13
Deforestation is responsible for approximately 17% of global greenhouse gas emissions, and is therefore a major contribu-tor to climate change, but also to the loss of biodiversity and ecosystem services and a direct threat to Asia’s great ape – the orangutan. Between 2005-2010, Indonesia had accelerating for-est loss compared to 2000-2005 and is within the highest five countries for percentage of primary forest loss globally. This ac-celeration in forest loss not only negatively impacts forests and biodiversity, but also local and global ecosystem services such as water supply, human health and food security in addition to cli-mate change mitigation. Much of the deforestation is caused by both illegal and short-term economic gains, often undermining long-term development goals.
This study explores opportunities for a more sustainable path-way to development and looks for reconciliation between forest and biodiversity conservation and economic progress. It focuses on two pilot sites on the island of Sumatra, namely Tripa swamp and the mountain forests of Batang Toru, both hosting signifi-cant orangutan populations. The assessment quantifies the eco-nomic trade-offs between unsustainable and sustainable forms of land use, and considers the role of Reducing Emissions from Deforestation and Degradation (REDD) and broader Payment for Ecosystem Services (PES) schemes in achieving balanced conservation and development objectives.
The tropical rainforests where Sumatran orangutans occur hold some of the most spectacular biodiversity on the planet: Sumatran tigers, Sumatran elephants, and Sumatran rhinoceroses are notable endemic fauna among a bewildering diversity of other animal and plant species. As such, these forests form an incredibly important area for conservation. Nevertheless, they are among the fastest dis-appearing forests in the world as they are rapidly being converted to other land uses such as oil palm and timber plantations.
Between 1985 and 2007, nearly half of the forest on Sumatra disappeared. The two Indonesian provinces where Sumatran orangutans occur, Aceh and North Sumatra, have witnessed a total forest loss of 22.4% and 43.4%, respectively from 1985-2008/9. While the annual rate of forest loss was highest dur-ing the 1985-1990 period (Aceh 2.0%, North Sumatra 4.2%) and decreased during 1990-2000 (Aceh 0.7%, North Sumatra 1.2%), forest loss increased again from 2000-2008/9 (Aceh 0.9%, North Sumatra 2.3%).
Only around 8,641km2 of orangutan habitat now remains on Sumatra, which equates to 17% of the remaining forest in Aceh and North Sumatra. Of this, 78% is within the Leuser Ecosys-tem, which is situated in Aceh and North Sumatra. The coastal peat swamp forests on the western edge of the Leuser Ecosys-tem represent only 11% of the remaining forest area where oran-gutans occur, but hold 31% of the orangutan’s total numbers and are therefore critically important to their conservation.
In both Aceh and North Sumatra, the rate of forest loss is highest in peatlands, mainly due to draining and burning for oil palm expansion, resulting in very high release of greenhouse
gases otherwise stored in the peat, and in lowland forests below 500 m altitude. During 1985-2007 forest loss on non-peatland below 500 m was 36% in Aceh and 61% in North Sumatra. For forest on peat swamps forest loss was 35% in Aceh and 78% in North Sumatra.
Deforestation is driven by both global demand for products such as vegetable oil and timber, and a more localized demand for agricultural products. For orangutan habitat in the Leuser Ecosystem on peatlands, 79% of the deforestation during the 1985-2007 period was attributable to oil palm expansion, com-pared with 19% for non-peatland forest. The drivers of defor-estation are facilitated by road expansion (both legal and illegal) as settlers, agriculturalists or loggers move in along the roads.
A critical challenge in reducing deforestation lies in the struc-ture of forestry concessions and land management and subse-quent enforcement. While central government laws and policies are in place to guide and regulate forest use and development, road construction, logging, agricultural expansion and mining occur in areas nominally off-limit to such activities, including inside protected areas.
Forest conversion for other land uses is often considered key to the rapid economic development of Indonesia. However, such conversion also comes at a cost. The same forests that are being turned into oil palm or timber plantations and other land uses fulfil an important role in the lives of the local people, provide for much of their livelihood and can help ensure important eco-system service functions such as water regulation for irrigation of agricultural lands, disasters and risk reduction and the regula-tion of climate at local and global scales.
While illegal logging is widespread, some legitimate logging operations harvest wood from land beyond their allocated con-cession boundaries and much of the forest-based development does not provide long-term development for local populations. For example, as the forests are logged, their function as a water
Summary
Cleared lowland forest area (Nick Lyon/Cockroach Productions)
14 15
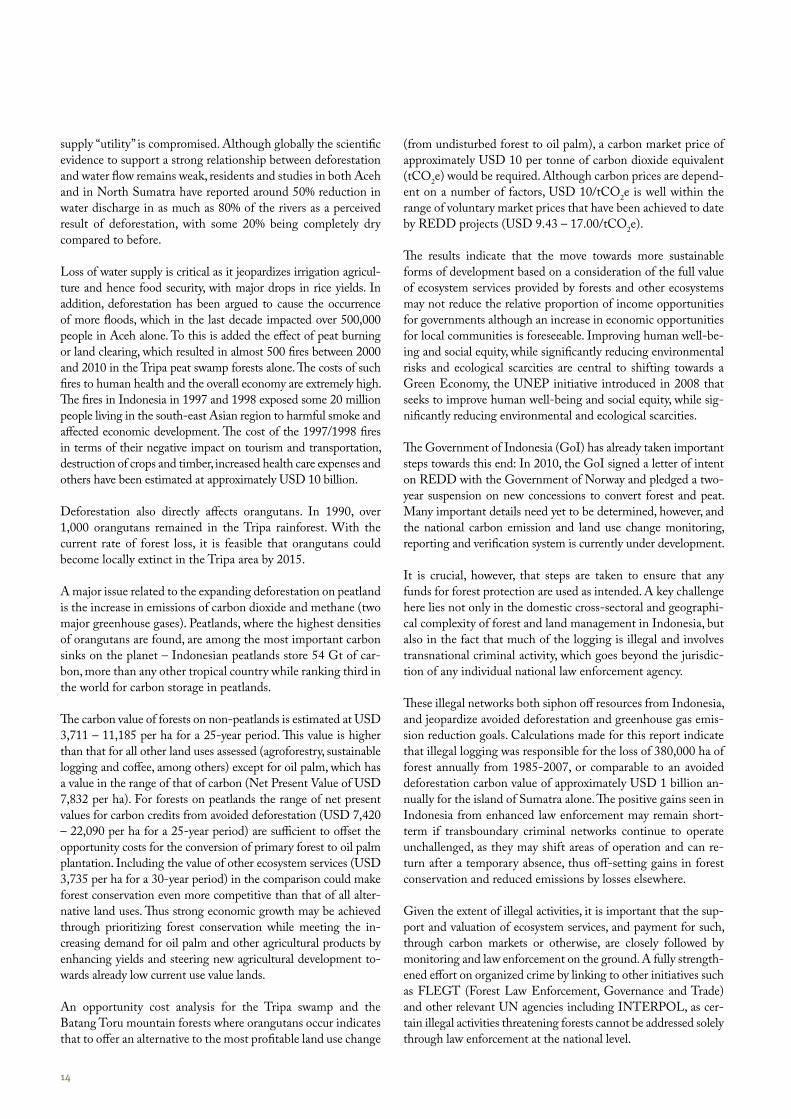
supply “utility” is compromised. Although globally the scientific evidence to support a strong relationship between deforestation and water flow remains weak, residents and studies in both Aceh and in North Sumatra have reported around 50% reduction in water discharge in as much as 80% of the rivers as a perceived result of deforestation, with some 20% being completely dry compared to before.
Loss of water supply is critical as it jeopardizes irrigation agricul-ture and hence food security, with major drops in rice yields. In addition, deforestation has been argued to cause the occurrence of more floods, which in the last decade impacted over 500,000 people in Aceh alone. To this is added the effect of peat burning or land clearing, which resulted in almost 500 fires between 2000 and 2010 in the Tripa peat swamp forests alone. The costs of such fires to human health and the overall economy are extremely high. The fires in Indonesia in 1997 and 1998 exposed some 20 million people living in the south-east Asian region to harmful smoke and affected economic development. The cost of the 1997/1998 fires in terms of their negative impact on tourism and transportation, destruction of crops and timber, increased health care expenses and others have been estimated at approximately USD 10 billion.
Deforestation also directly affects orangutans. In 1990, over 1,000 orangutans remained in the Tripa rainforest. With the current rate of forest loss, it is feasible that orangutans could become locally extinct in the Tripa area by 2015.
A major issue related to the expanding deforestation on peatland is the increase in emissions of carbon dioxide and methane (two major greenhouse gases). Peatlands, where the highest densities of orangutans are found, are among the most important carbon sinks on the planet – Indonesian peatlands store 54 Gt of car-bon, more than any other tropical country while ranking third in the world for carbon storage in peatlands.
The carbon value of forests on non-peatlands is estimated at USD 3,711 – 11,185 per ha for a 25-year period. This value is higher than that for all other land uses assessed (agroforestry, sustainable logging and coffee, among others) except for oil palm, which has a value in the range of that of carbon (Net Present Value of USD 7,832 per ha). For forests on peatlands the range of net present values for carbon credits from avoided deforestation (USD 7,420 – 22,090 per ha for a 25-year period) are sufficient to offset the opportunity costs for the conversion of primary forest to oil palm plantation. Including the value of other ecosystem services (USD 3,735 per ha for a 30-year period) in the comparison could make forest conservation even more competitive than that of all alter-native land uses. Thus strong economic growth may be achieved through prioritizing forest conservation while meeting the in-creasing demand for oil palm and other agricultural products by enhancing yields and steering new agricultural development to-wards already low current use value lands.
An opportunity cost analysis for the Tripa swamp and the Batang Toru mountain forests where orangutans occur indicates that to offer an alternative to the most profitable land use change
(from undisturbed forest to oil palm), a carbon market price of approximately USD 10 per tonne of carbon dioxide equivalent (tCO2e) would be required. Although carbon prices are depend-ent on a number of factors, USD 10/tCO2e is well within the range of voluntary market prices that have been achieved to date by REDD projects (USD 9.43 – 17.00/tCO2e).
The results indicate that the move towards more sustainable forms of development based on a consideration of the full value of ecosystem services provided by forests and other ecosystems may not reduce the relative proportion of income opportunities for governments although an increase in economic opportunities for local communities is foreseeable. Improving human well-be-ing and social equity, while significantly reducing environmental risks and ecological scarcities are central to shifting towards a Green Economy, the UNEP initiative introduced in 2008 that seeks to improve human well-being and social equity, while sig-nificantly reducing environmental and ecological scarcities.
The Government of Indonesia (GoI) has already taken important steps towards this end: In 2010, the GoI signed a letter of intent on REDD with the Government of Norway and pledged a two-year suspension on new concessions to convert forest and peat. Many important details need yet to be determined, however, and the national carbon emission and land use change monitoring, reporting and verification system is currently under development.
It is crucial, however, that steps are taken to ensure that any funds for forest protection are used as intended. A key challenge here lies not only in the domestic cross-sectoral and geographi-cal complexity of forest and land management in Indonesia, but also in the fact that much of the logging is illegal and involves transnational criminal activity, which goes beyond the jurisdic-tion of any individual national law enforcement agency.
These illegal networks both siphon off resources from Indonesia, and jeopardize avoided deforestation and greenhouse gas emis-sion reduction goals. Calculations made for this report indicate that illegal logging was responsible for the loss of 380,000 ha of forest annually from 1985-2007, or comparable to an avoided deforestation carbon value of approximately USD 1 billion an-nually for the island of Sumatra alone. The positive gains seen in Indonesia from enhanced law enforcement may remain short-term if transboundary criminal networks continue to operate unchallenged, as they may shift areas of operation and can re-turn after a temporary absence, thus off-setting gains in forest conservation and reduced emissions by losses elsewhere.
Given the extent of illegal activities, it is important that the sup-port and valuation of ecosystem services, and payment for such, through carbon markets or otherwise, are closely followed by monitoring and law enforcement on the ground. A fully strength-ened effort on organized crime by linking to other initiatives such as FLEGT (Forest Law Enforcement, Governance and Trade) and other relevant UN agencies including INTERPOL, as cer-tain illegal activities threatening forests cannot be addressed solely through law enforcement at the national level.

14 15
1. Immediately designate new areas for REDD+. These forest-ed areas should be selected taking into account the multiple benefits for carbon storage and sequestration and their role in conserving orangutan habitat and/or other biodiversity and for the protection of ecosystem services such as those derived from watersheds, ensuring water supply and quality for irriga-tion and food security as well as urban and rural populations.
2. Strengthen integrated spatial land use planning across ministries and at the regional, provincial and national level by maintaining a master spatial planning database or map containing defined boundaries of protected forests or for-ests included in protection schemes whether under REDD or for other purposes.
3. Streamline the spatial planning framework to integrate various levels of government processes and to ensure that there exists only a single legally binding spatial plan with clearly defined land uses while registering all planned land use change activities onto the same master map and pro-hibiting those activities not registered.
4. Focus further resource development including the planned expansion of oil palm plantations on low current use value lands by taking into account all social and environmental im-
plications and avoid agricultural and timber concessions on high conservation value lands. Designated areas should be reflected in the master map.
5. Improve ecosystem valuation studies based on quantified ecosystem services data and establish income-generating alternatives for existing and new areas that are important for biodiversity and ecosystem services protection.
6. Build on experience gained elsewhere in Indonesia with a broad-based ‘rewards’ approach and building on PES schemes from countries such as Costa Rica. Between the commodification, compensation and co-investment para-digms of PES schemes, an appropriate combination needs to be selected to effectively control illegal resource depletion, compensate voluntary efforts to forego resource depletion rights and invest in lucrative Green Economy alternatives.
7. Support and develop a specific REDD-related programme between relevant UN agencies, INTERPOL, existing initia-tives such as the FLEGT and including but not limited to the appropriate Indonesian authorities and authorities in other relevant countries to address and identify key areas and measures to reduce illegal logging and trade, including the transnational organized nature of illegal logging.
Recommendations
16 17
Around 1 billion in the middle of the 19th century, the world’s human population is now closer to 7 billion. This exponential growth rate and congruent rise in consumption is having a dra-matic impact on our planet (CBD 2010). Approximately 40% of the world’s natural forests have disappeared in the last 300 years (FAO 2006); since 1900 the world has lost about 50% of its natural wetlands, including carbon-rich peatlands (Moser et al. 1996); the rate of species extinctions attributable to hu-man activities is estimated to be 1,000 times more rapid than historical natural extinction rates (MEA 2005a); and the rate of biodiversity loss continues unabated (Butchart et al. 2010). This while it is becoming increasingly clear that loss of biodiversity tends to reduce overall ecosystem productivity and resilience, and there is growing evidence that the maintenance of multiple ecosystem processes requires large numbers of species (Naeem et al. 2009). Thus it is important to protect flora and fauna not only for their intrinsic value, but also for the many supporting ecosystem services they provide, many of which contribute di-
rectly to human well-being. The overall effect of rapid human population growth and consumption is that approximately 60% of the world’s ecosystem services, such as clean water, food, timber, climate regulation, protection against natural hazards, erosion control, recreation and medicinal sources, have been severely degraded in just the last 50 years (MEA 2005a). The peatlands where the highest densities of orangutans are found are among the most important carbon sinks on the planet. In fact, Indonesian peatlands store 54 Gt of carbon, more than any other tropical country ( Joosten 2009).
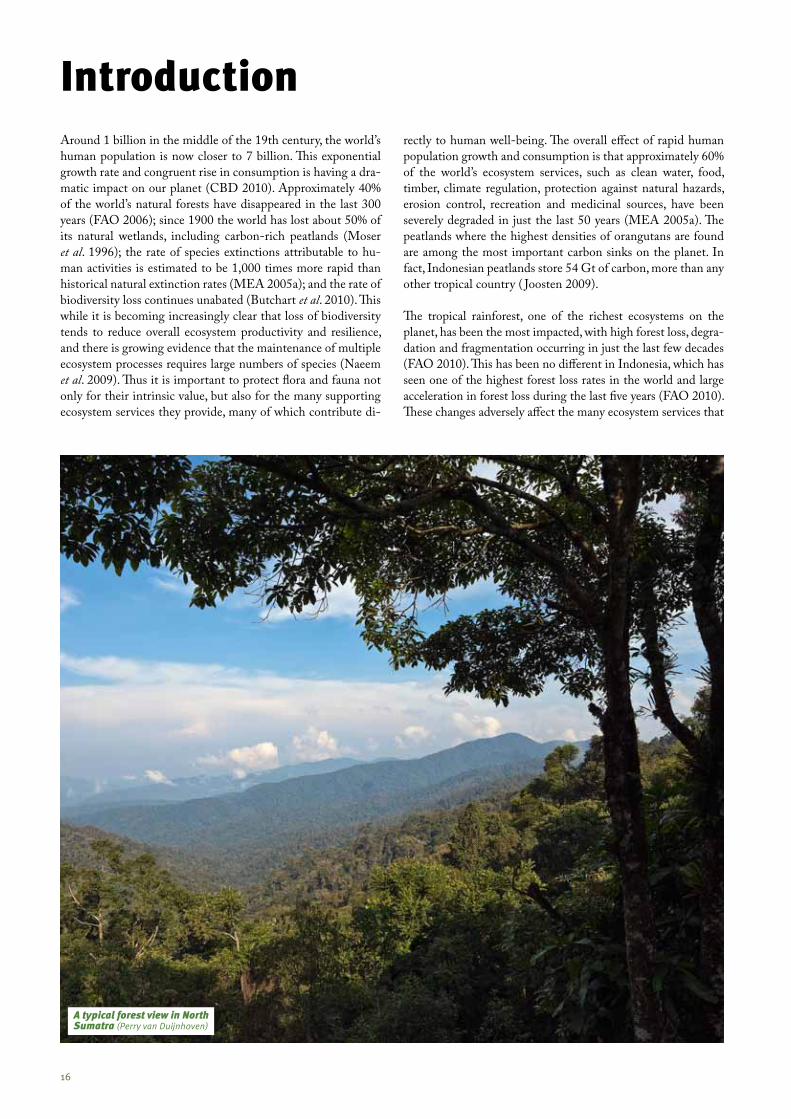
The tropical rainforest, one of the richest ecosystems on the planet, has been the most impacted, with high forest loss, degra-dation and fragmentation occurring in just the last few decades (FAO 2010). This has been no different in Indonesia, which has seen one of the highest forest loss rates in the world and large acceleration in forest loss during the last five years (FAO 2010). These changes adversely affect the many ecosystem services that
Introduction
A typical forest view in North Sumatra (Perry van Duijnhoven)
16 17
benefit all of humanity, particularly the 1.6 billion that depend to some extent on the world’s forests and the 350 million forest-dwelling people whose subsistence livelihoods depend on them entirely (World Bank 2006; Thompson et al. 2009). Such servic-es include regulation of water flow to irrigate agricultural lands, protection against floods and landslides, providing clean water for drinking, bathing and fishing, providing non-timber forest products, and regulation of climate by acting as an immense car-bon store sequestering carbon from the atmosphere.
Many of these ecosystem services are not fully recognized and are frequently taken for granted. Only a limited number of re-sources that can be commercially exploited, such as timber, have been routinely considered in ecosystem economic analyses to date and have been pursued for economic growth. This very lack of economic valuation of ecosystem services represents one of the main underlying causes of their loss (TEEB 2009). More recently, however, studies are increasingly focusing on estimating
the value of the ecosystem services that forests and their bio-diversity provide, and incorporating them into economic mod-els (TEEB 2009). Fully accounting for all of these services is of vital importance to making informed decisions in long-term development planning at all levels of government, from local to national. Valuations of ecosystem services will help to ensure that those services are properly understood and appreciated in plan-ning processes, so that both productivity and sustainability can be maximized, leading to sustained economic development.
Although there is a growing awareness that loss of biodiver-sity and ecosystem degradation is a serious problem, many still fail to fully appreciate the inextricable link between biodi-versity, ecosystem services and economic development. There is a pressing need to better document and understand these changes to our planet and the threats they pose to human sur-vival, so that appropriate mitigation and adaptation measures can be developed and implemented.
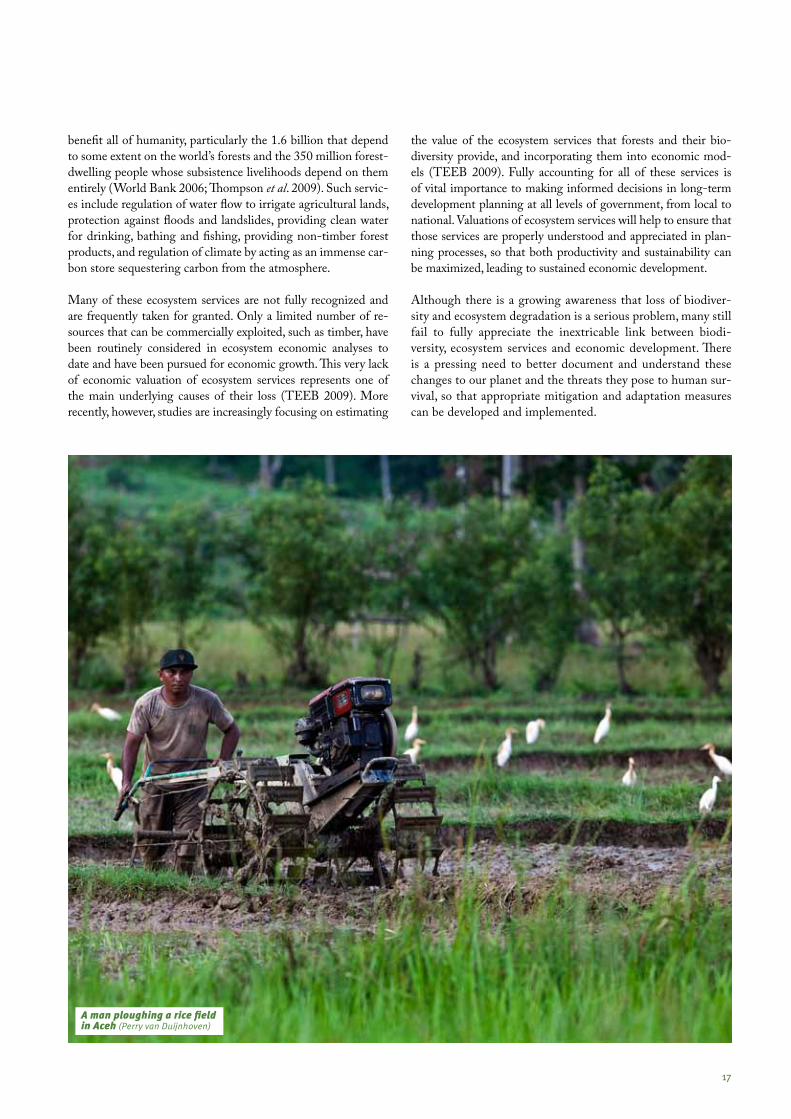
A man ploughing a rice field in Aceh (Perry van Duijnhoven)
18 19
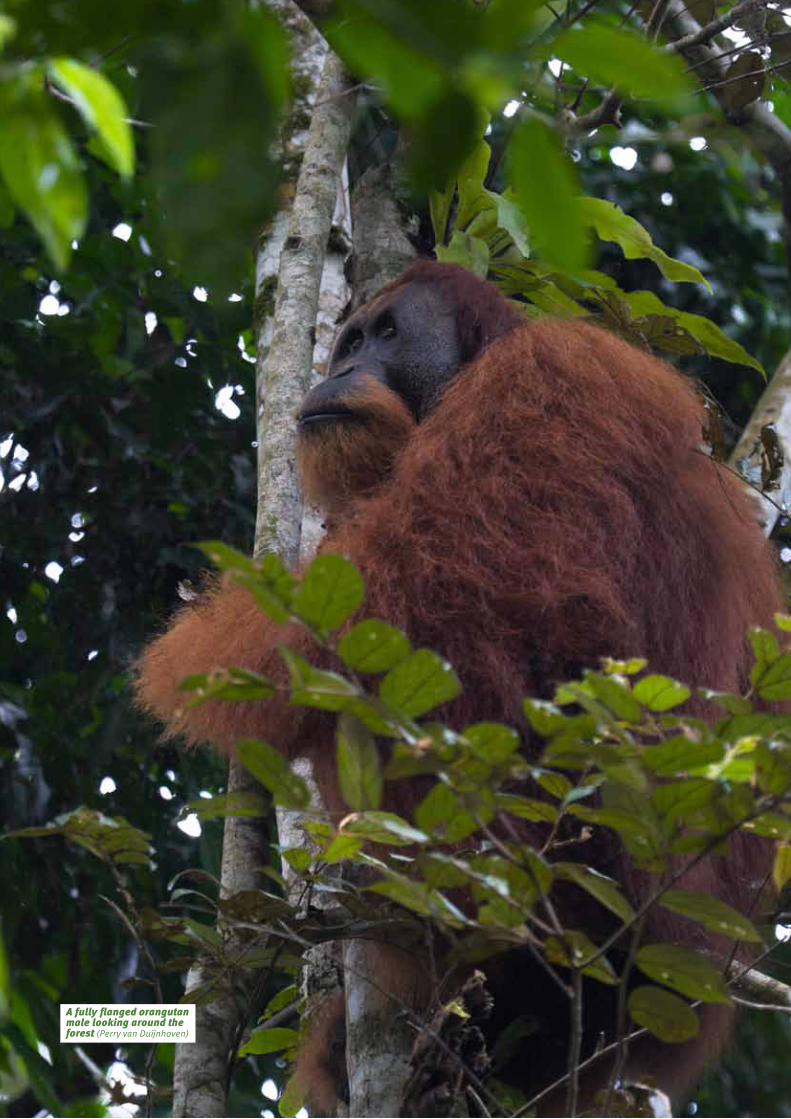
A fully flanged orangutan male looking around the forest (Perry van Duijnhoven)
18 19
Study zonesBatang Toru Tripa Orangutan distribution
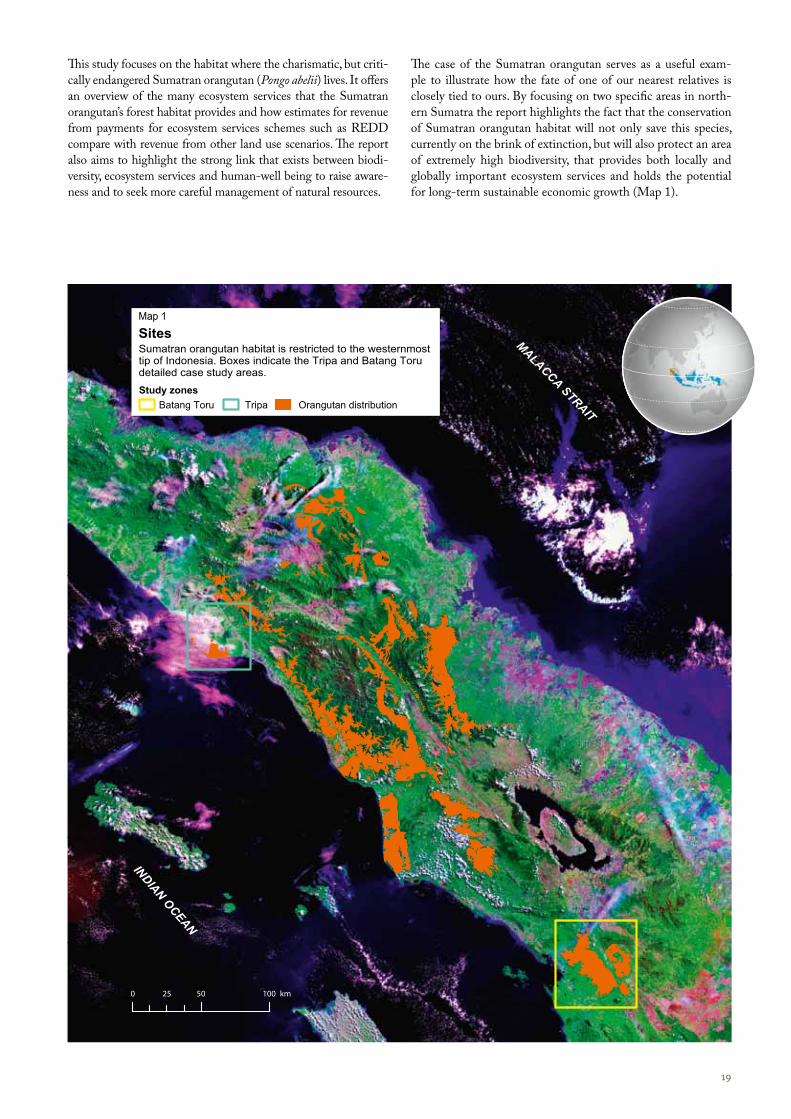
SitesSumatran orangutan habitat is restricted to the westernmost tip of Indonesia. Boxes indicate the Tripa and Batang Toru detailed case study areas.
This study focuses on the habitat where the charismatic, but criti-cally endangered Sumatran orangutan (Pongo abelii) lives. It offers an overview of the many ecosystem services that the Sumatran orangutan’s forest habitat provides and how estimates for revenue from payments for ecosystem services schemes such as REDD compare with revenue from other land use scenarios. The report also aims to highlight the strong link that exists between biodi-versity, ecosystem services and human-well being to raise aware-ness and to seek more careful management of natural resources.
The case of the Sumatran orangutan serves as a useful exam-ple to illustrate how the fate of one of our nearest relatives is closely tied to ours. By focusing on two specific areas in north-ern Sumatra the report highlights the fact that the conservation of Sumatran orangutan habitat will not only save this species, currently on the brink of extinction, but will also protect an area of extremely high biodiversity, that provides both locally and globally important ecosystem services and holds the potential for long-term sustainable economic growth (Map 1).
Map 1
20 21
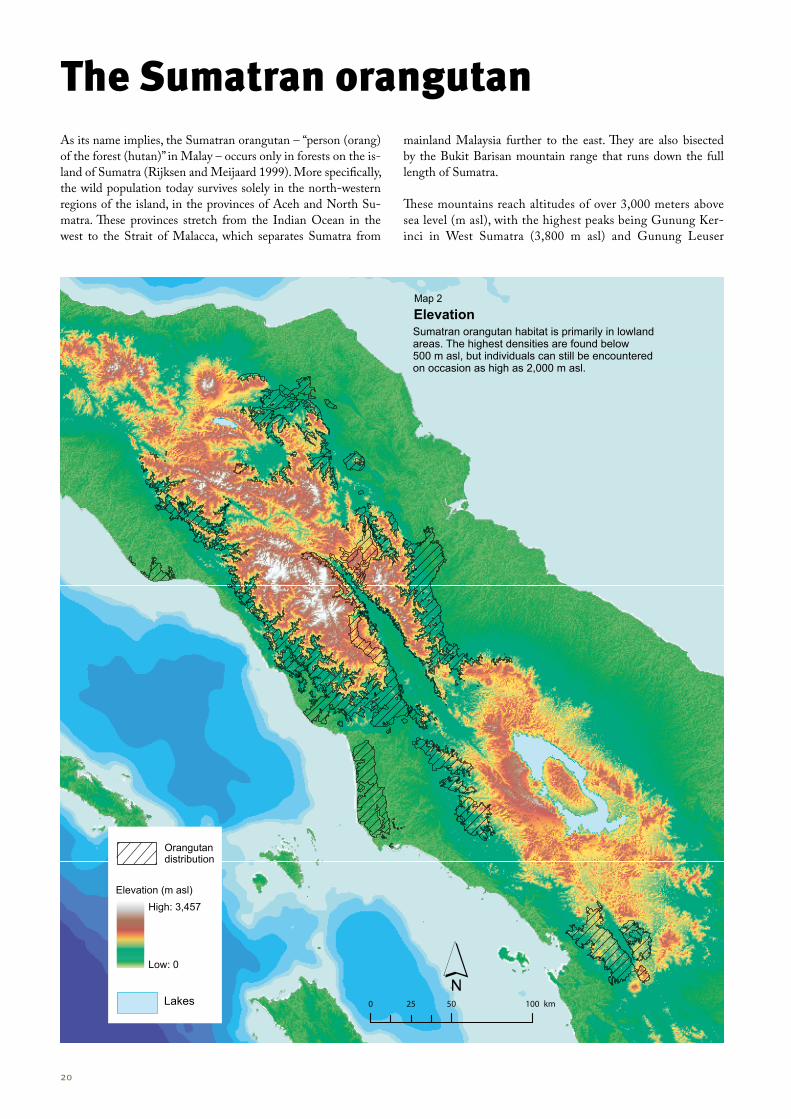
ElevationSumatran orangutan habitat is primarily in lowland areas. The highest densities are found below 500 m asl, but individuals can still be encountered on occasion as high as 2,000 m asl.
Orangutandistribution
High: 3,457
Low: 0
Elevation (m asl)
Lakes
As its name implies, the Sumatran orangutan – “person (orang) of the forest (hutan)” in Malay – occurs only in forests on the is-land of Sumatra (Rijksen and Meijaard 1999). More specifically, the wild population today survives solely in the north-western regions of the island, in the provinces of Aceh and North Su-matra. These provinces stretch from the Indian Ocean in the west to the Strait of Malacca, which separates Sumatra from
mainland Malaysia further to the east. They are also bisected by the Bukit Barisan mountain range that runs down the full length of Sumatra.
These mountains reach altitudes of over 3,000 meters above sea level (m asl), with the highest peaks being Gunung Ker-inci in West Sumatra (3,800 m asl) and Gunung Leuser
The Sumatran orangutan
Map 2
20 21
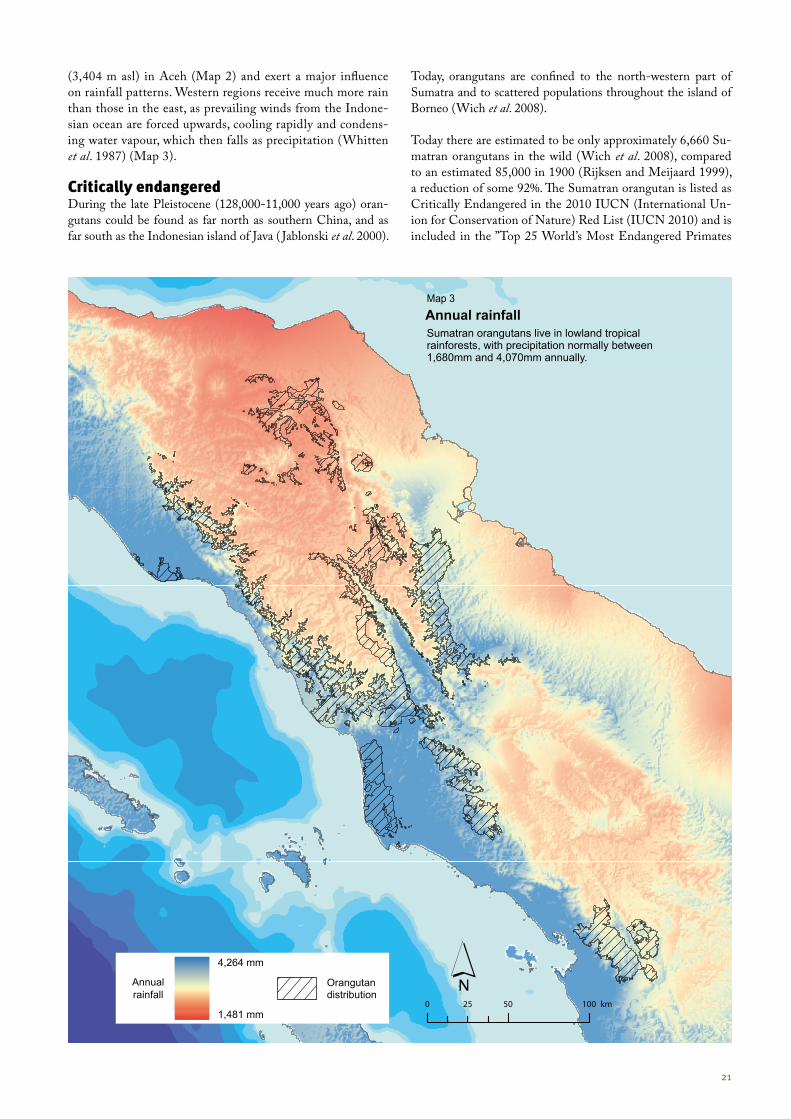
Sumatran orangutans live in lowland tropical rainforests, with precipitation normally between 1,680mm and 4,070mm annually.
Annual rainfall
Orangutan distribution
Annualrainfall
4,264 mm
1,481 mm
(3,404 m asl) in Aceh (Map 2) and exert a major influence on rainfall patterns. Western regions receive much more rain than those in the east, as prevailing winds from the Indone-sian ocean are forced upwards, cooling rapidly and condens-ing water vapour, which then falls as precipitation (Whitten et al. 1987) (Map 3). Critically endangeredDuring the late Pleistocene (128,000-11,000 years ago) oran-gutans could be found as far north as southern China, and as far south as the Indonesian island of Java ( Jablonski et al. 2000).
Today, orangutans are confined to the north-western part of Sumatra and to scattered populations throughout the island of Borneo (Wich et al. 2008).
Today there are estimated to be only approximately 6,660 Su-matran orangutans in the wild (Wich et al. 2008), compared to an estimated 85,000 in 1900 (Rijksen and Meijaard 1999), a reduction of some 92%. The Sumatran orangutan is listed as Critically Endangered in the 2010 IUCN (International Un-ion for Conservation of Nature) Red List (IUCN 2010) and is included in the ”Top 25 World’s Most Endangered Primates
Map 3
22 23
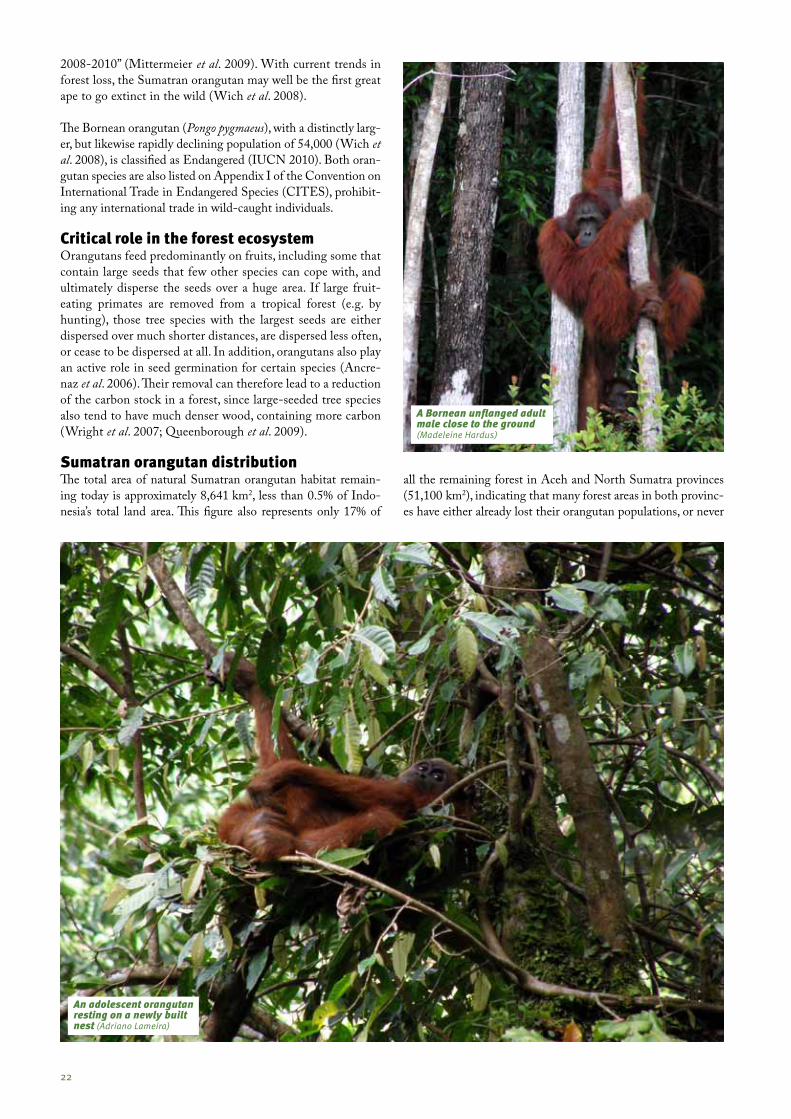
2008-2010” (Mittermeier et al. 2009). With current trends in forest loss, the Sumatran orangutan may well be the first great ape to go extinct in the wild (Wich et al. 2008).
The Bornean orangutan (Pongo pygmaeus), with a distinctly larg-er, but likewise rapidly declining population of 54,000 (Wich et al. 2008), is classified as Endangered (IUCN 2010). Both oran-gutan species are also listed on Appendix I of the Convention on International Trade in Endangered Species (CITES), prohibit-ing any international trade in wild-caught individuals.
Critical role in the forest ecosystemOrangutans feed predominantly on fruits, including some that contain large seeds that few other species can cope with, and ultimately disperse the seeds over a huge area. If large fruit-eating primates are removed from a tropical forest (e.g. by hunting), those tree species with the largest seeds are either dispersed over much shorter distances, are dispersed less often, or cease to be dispersed at all. In addition, orangutans also play an active role in seed germination for certain species (Ancre-naz et al. 2006). Their removal can therefore lead to a reduction of the carbon stock in a forest, since large-seeded tree species also tend to have much denser wood, containing more carbon (Wright et al. 2007; Queenborough et al. 2009).
Sumatran orangutan distributionThe total area of natural Sumatran orangutan habitat remain-ing today is approximately 8,641 km2, less than 0.5% of Indo-nesia’s total land area. This figure also represents only 17% of
all the remaining forest in Aceh and North Sumatra provinces (51,100 km2), indicating that many forest areas in both provinc-es have either already lost their orangutan populations, or never
A Bornean unflanged adult male close to the ground (Madeleine Hardus)
An adolescent orangutan resting on a newly built nest (Adriano Lameira)
22 23
Provincial capital
Province boundary
District boundary
Orangutan distribution
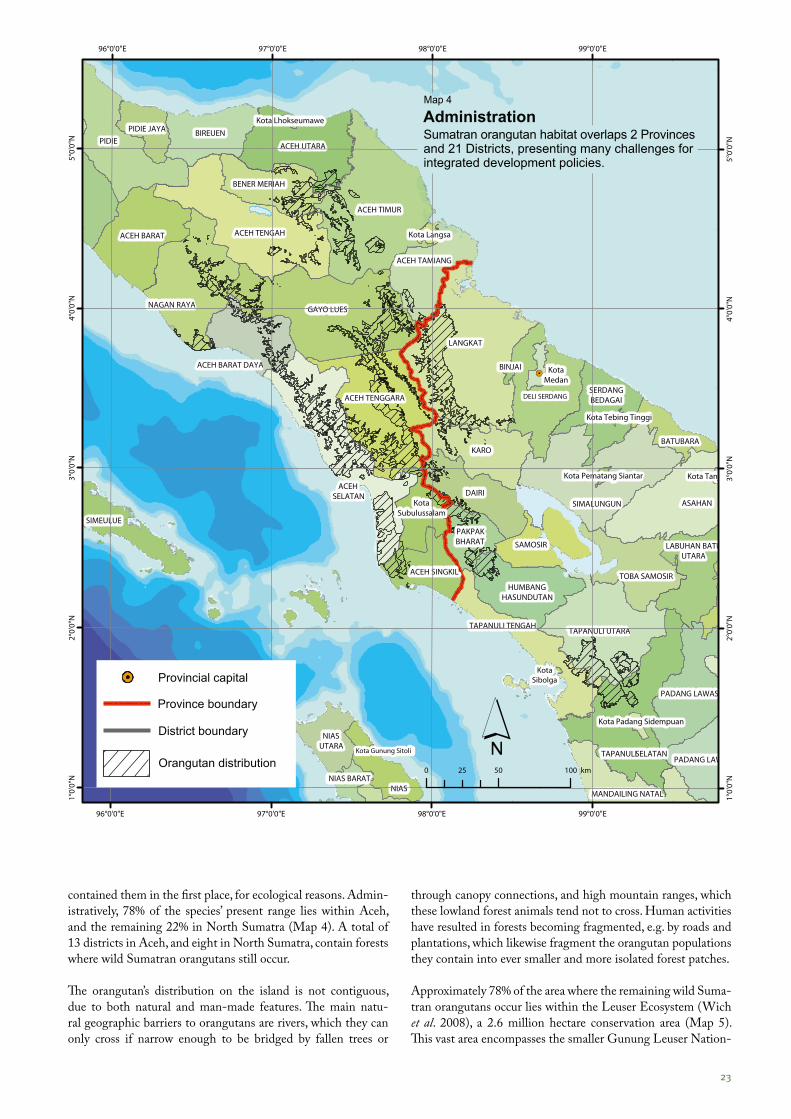
Administration Sumatran orangutan habitat overlaps 2 Provinces and 21 Districts, presenting many challenges forintegrated development policies.
contained them in the first place, for ecological reasons. Admin-istratively, 78% of the species’ present range lies within Aceh, and the remaining 22% in North Sumatra (Map 4). A total of 13 districts in Aceh, and eight in North Sumatra, contain forests where wild Sumatran orangutans still occur. The orangutan’s distribution on the island is not contiguous, due to both natural and man-made features. The main natu-ral geographic barriers to orangutans are rivers, which they can only cross if narrow enough to be bridged by fallen trees or
through canopy connections, and high mountain ranges, which these lowland forest animals tend not to cross. Human activities have resulted in forests becoming fragmented, e.g. by roads and plantations, which likewise fragment the orangutan populations they contain into ever smaller and more isolated forest patches.
Approximately 78% of the area where the remaining wild Suma-tran orangutans occur lies within the Leuser Ecosystem (Wich et al. 2008), a 2.6 million hectare conservation area (Map 5). This vast area encompasses the smaller Gunung Leuser Nation-
Map 4
24 25
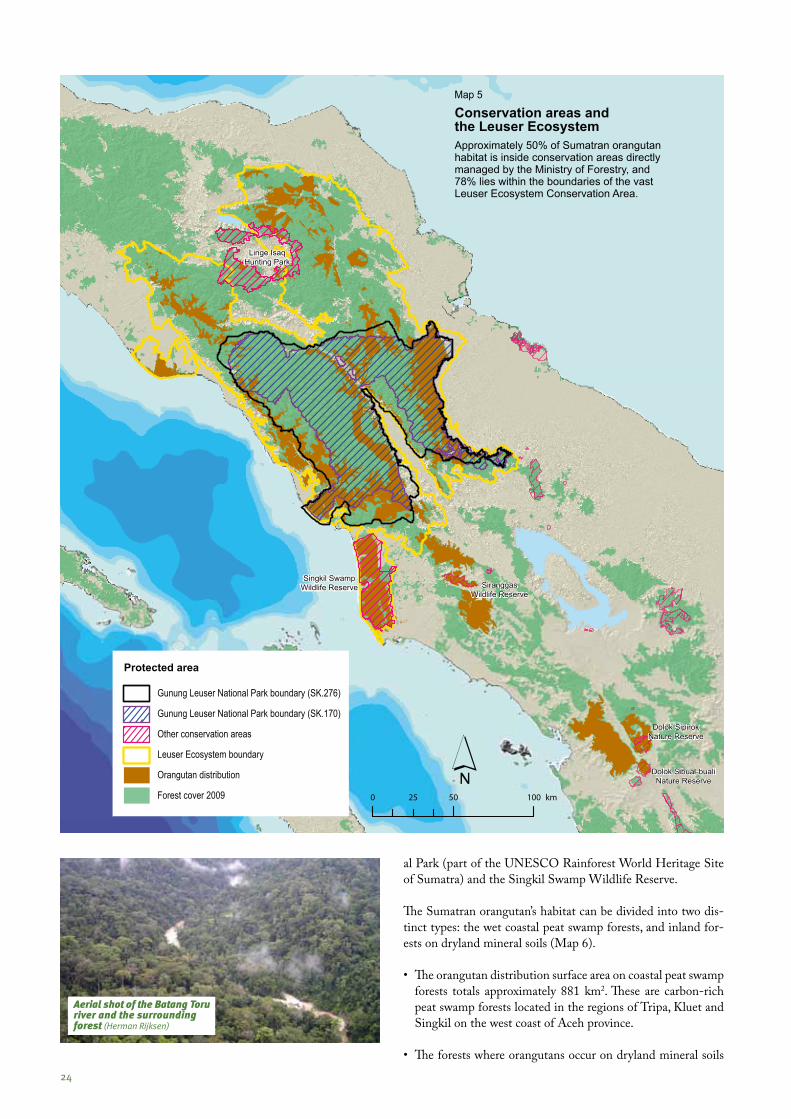
Conservation areas and the Leuser EcosystemApproximately 50% of Sumatran orangutan habitat is inside conservation areas directly managed by the Ministry of Forestry, and 78% lies within the boundaries of the vast Leuser Ecosystem Conservation Area.
Protected area
Gunung Leuser National Park boundary (SK.276)
Gunung Leuser National Park boundary (SK.170)
Other conservation areas
Leuser Ecosystem boundary
Orangutan distribution
Forest cover 2009
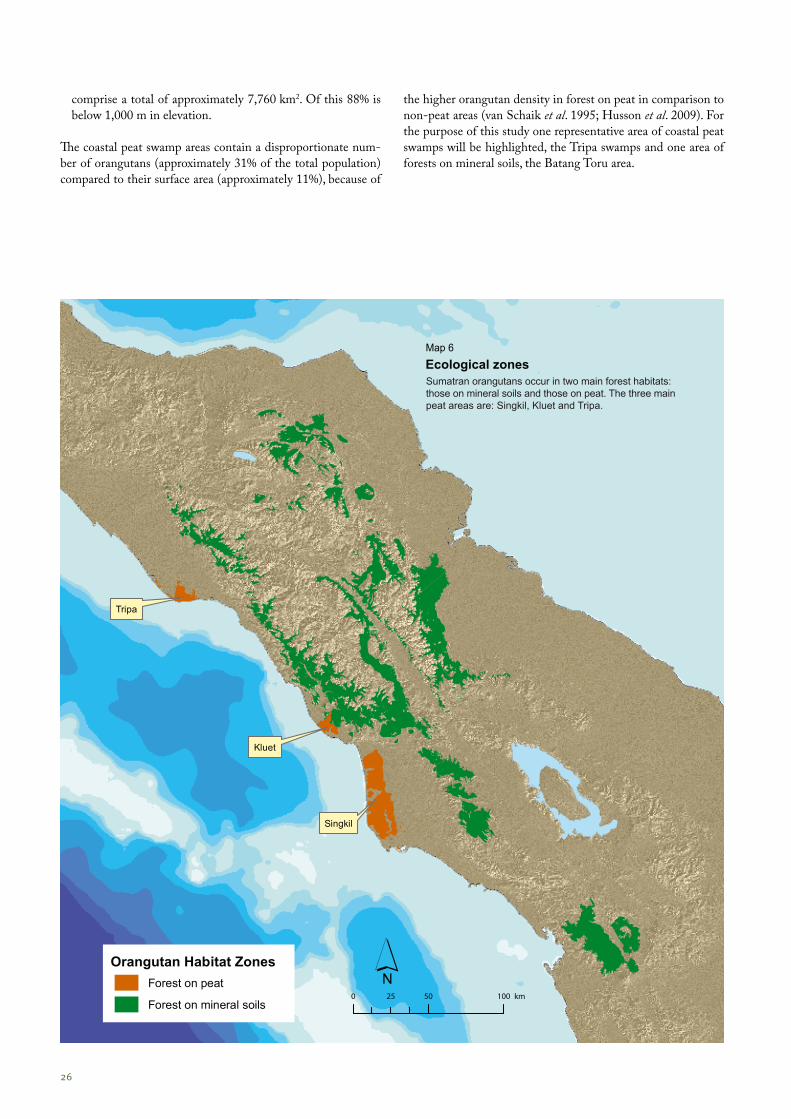
al Park (part of the UNESCO Rainforest World Heritage Site of Sumatra) and the Singkil Swamp Wildlife Reserve. The Sumatran orangutan’s habitat can be divided into two dis-tinct types: the wet coastal peat swamp forests, and inland for-ests on dryland mineral soils (Map 6).
• The orangutan distribution surface area on coastal peat swamp forests totals approximately 881 km2. These are carbon-rich peat swamp forests located in the regions of Tripa, Kluet and Singkil on the west coast of Aceh province.
• The forests where orangutans occur on dryland mineral soils
Map 5
Aerial shot of the Batang Toru river and the surrounding forest (Herman Rijksen)
24 25
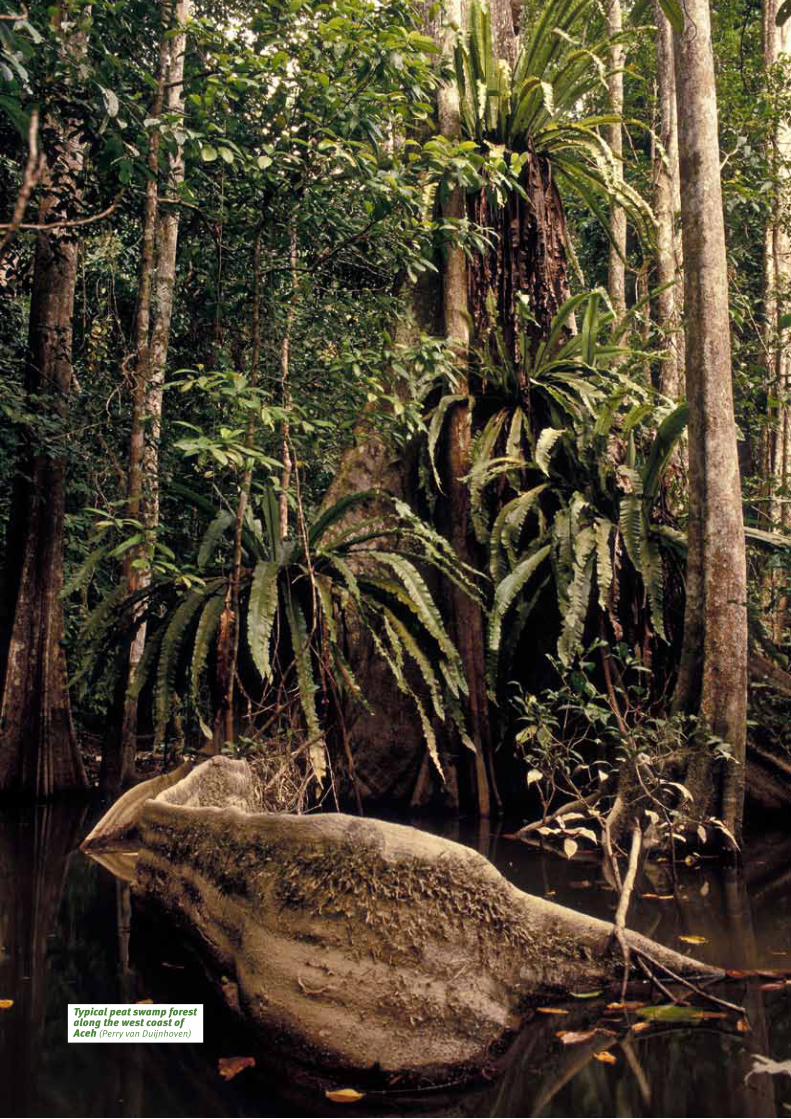
Typical peat swamp forest along the west coast of Aceh (Perry van Duijnhoven)
26 27
comprise a total of approximately 7,760 km2. Of this 88% is below 1,000 m in elevation.
The coastal peat swamp areas contain a disproportionate num-ber of orangutans (approximately 31% of the total population) compared to their surface area (approximately 11%), because of
the higher orangutan density in forest on peat in comparison to non-peat areas (van Schaik et al. 1995; Husson et al. 2009). For the purpose of this study one representative area of coastal peat swamps will be highlighted, the Tripa swamps and one area of forests on mineral soils, the Batang Toru area.
Map 6Ecological zonesSumatran orangutans occur in two main forest habitats: those on mineral soils and those on peat. The three main peat areas are: Singkil, Kluet and Tripa.
Orangutan Habitat ZonesForest on peat
Forest on mineral soils
Singkil
Kluet
Tripa
Sumatran orangutans occur in two main forest habitats: those on mineral soils and those on peat. The three main peat areas are: Singkil, Kluet and Tripa.
Ecological zonesMap 6
26 27
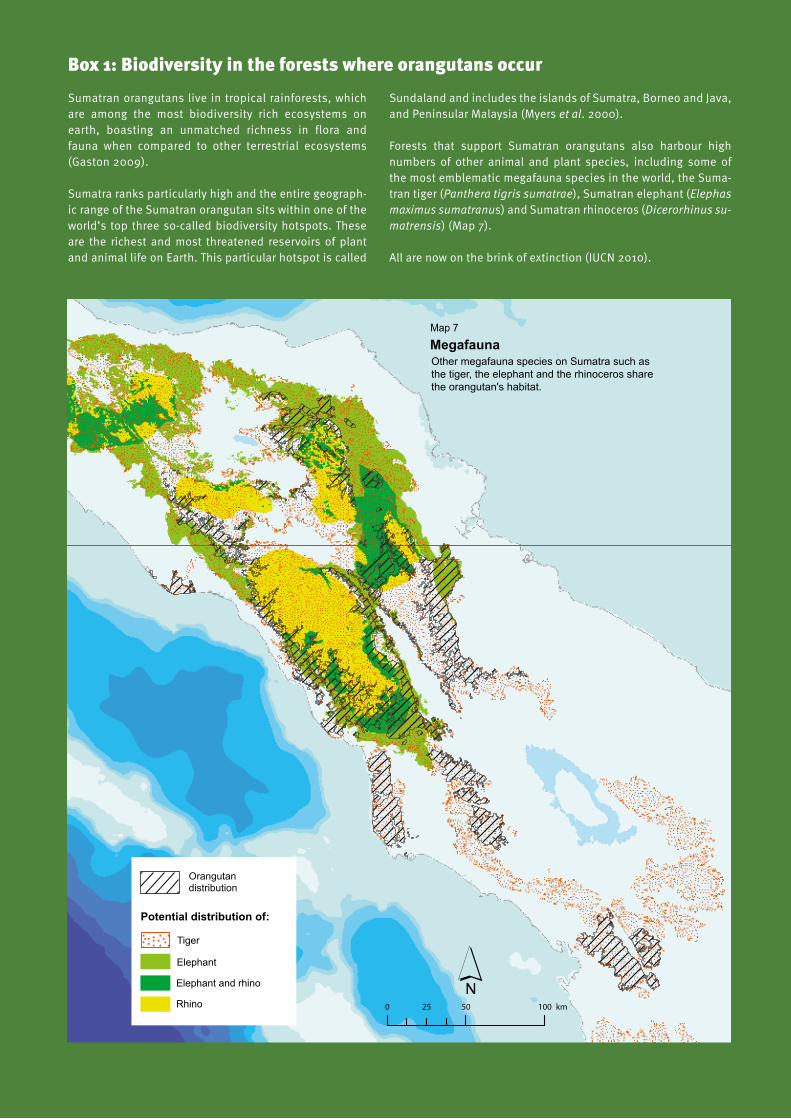
Orangutan distribution
Megafauna Other megafauna species on Sumatra such asthe tiger, the elephant and the rhinoceros sharethe orangutan's habitat.
Potential distribution of:
Tiger
Elephant
Elephant and rhino
Rhino
Sumatran orangutans live in tropical rainforests, which are among the most biodiversity rich ecosystems on earth, boasting an unmatched richness in flora and fauna when compared to other terrestrial ecosystems (Gaston 2009).
Sumatra ranks particularly high and the entire geograph-ic range of the Sumatran orangutan sits within one of the world’s top three so-called biodiversity hotspots. These are the richest and most threatened reservoirs of plant and animal life on Earth. This particular hotspot is called
Box 1: Biodiversity in the forests where orangutans occur
Sundaland and includes the islands of Sumatra, Borneo and Java, and Peninsular Malaysia (Myers et al. 2000).
Forests that support Sumatran orangutans also harbour high numbers of other animal and plant species, including some of the most emblematic megafauna species in the world, the Suma-tran tiger (Panthera tigris sumatrae), Sumatran elephant (Elephas maximus sumatranus) and Sumatran rhinoceros (Dicerorhinus su-matrensis) (Map 7).
All are now on the brink of extinction (IUCN 2010).
Map 7
28 29
Vulnerability of orangutansOrangutans are extremely vulnerable to extinction due to a combination of factors: they have an exceptionally slow repro-ductive rate, they require vast areas of contiguous rainforest to live in, and they are very much restricted to lowland forest areas.
Sumatran orangutan females give birth to just one infant at a time, only every eight or nine years (Wich et al. 2009). As a direct consequence of this slow reproductive rate, orangu-tan populations are very susceptible to even very low levels of hunting. Indeed, the loss of as little as 1% of females each year through hunting or other unnatural causes of mortality can place a population on an irreversible trajectory to extinction (Marshall et al. 2009a).
For orangutan populations to be viable over the long term they need vast tracts of contiguous rainforest, at least 500 km2 (Marshall et al. 2009b). This is because orangutans tend to live at very low densities, as low as just one individual per km2 or less in many areas, although densities can also reach as high as seven individuals per km2 in some parts of Sumatra (van Schaik et al. 1995; Husson et al. 2009). But also because Suma-tran orangutans utilize very large home ranges. In some areas, a
single adult male may occupy a home range as large as 100 km2 or more (Singleton et al. 2009).
Finally, Sumatran orangutan populations are largely restricted to lowland rainforest (Rijksen and Meijaard 1999), with most Sumatran orangutans living below 500 m and rarely venturing higher than 1,500 m asl. These forests are most threatened by con-version to other land uses, particularly for agricultural expansion.
Orangutans are most threatened by forest loss which results from a combination of road development, expansion of large-scale agriculture, logging concessions, mining and small-scale encroachment. These threats can be directly attributed to in-adequate cross-sectoral land use planning, reflecting needs for short-term economic growth, and a lack of environmental law enforcement (Robertson and van Schaik 2001).
Forest lossFrom the time humans arrived on Sumatra approximately 40,000 years ago until very recently, the island was largely cov-ered in lush tropical rainforest (Cribb 2000). However, during the last two centuries most of the forests have been converted to other land uses, dominated by people. Forest loss in Sumatra is
Challenges for the protection of orangutans and their habitat
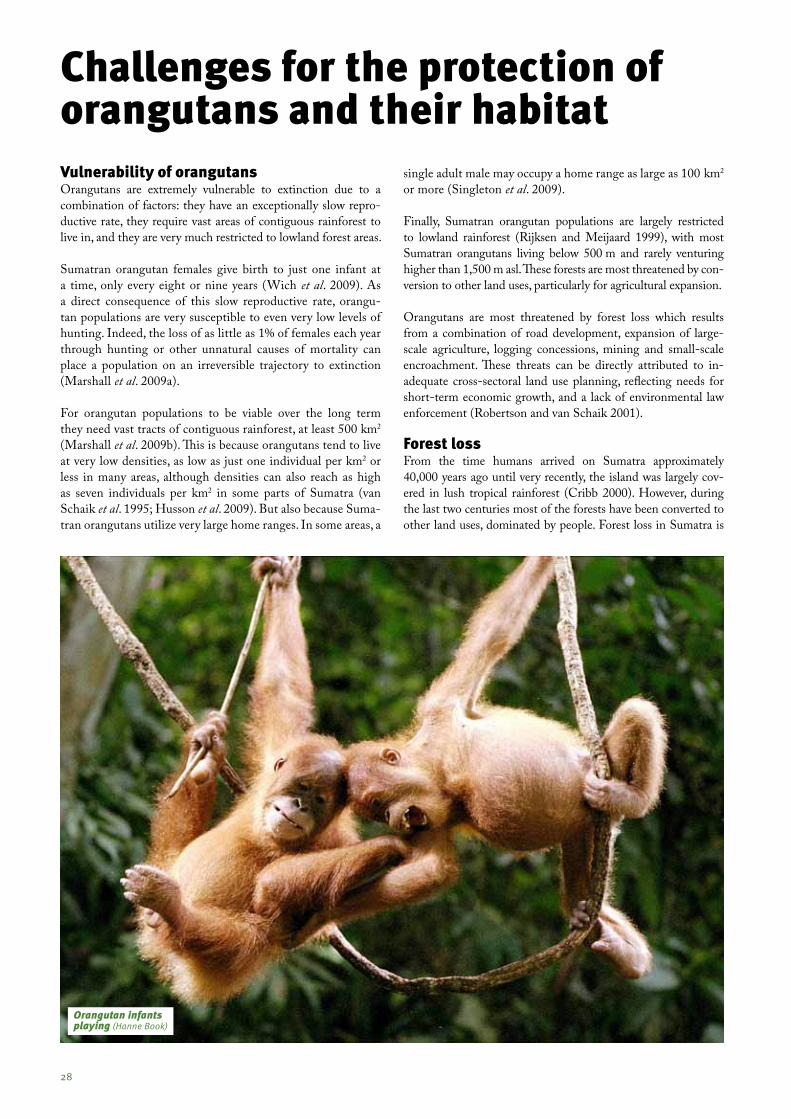
Orangutan infants playing (Hanne Book)
28 29
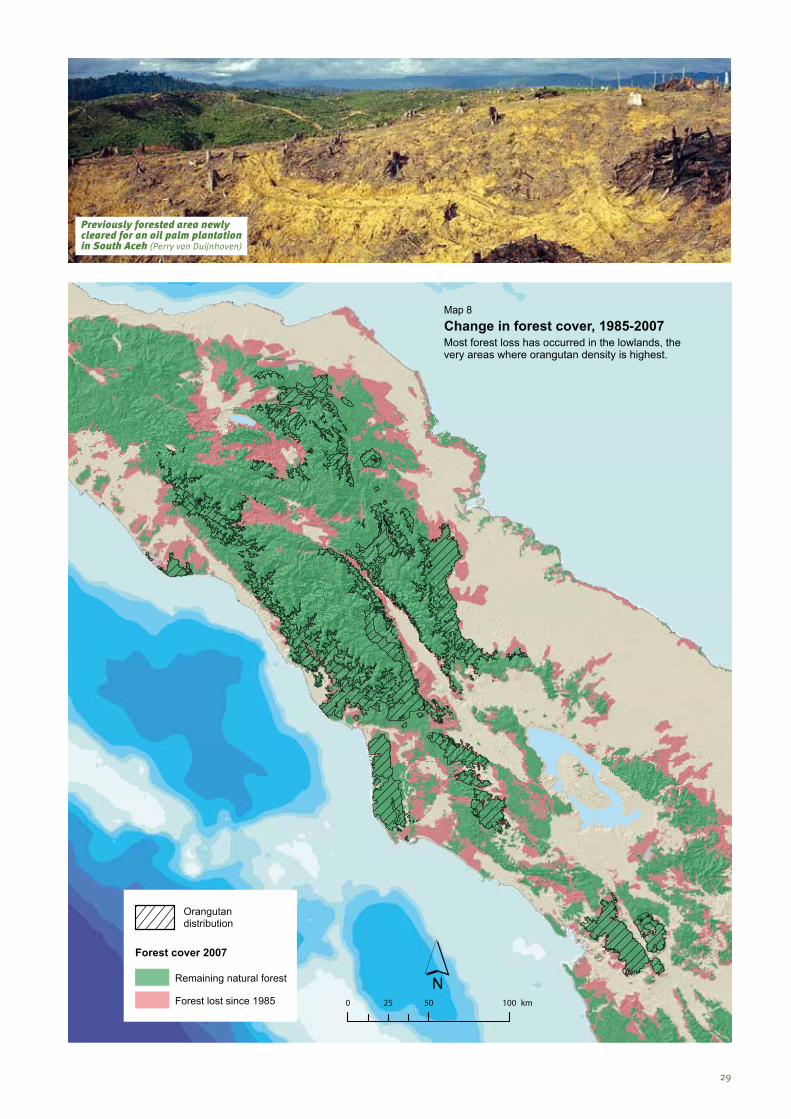
Change in forest cover, 1985-2007Most forest loss has occurred in the lowlands, the very areas where orangutan density is highest.
Forest cover 2007
Orangutan distribution
Forest lost since 1985
Remaining natural forest
Map 8
Previously forested area newly cleared for an oil palm plantation in South Aceh (Perry van Duijnhoven)
30 31
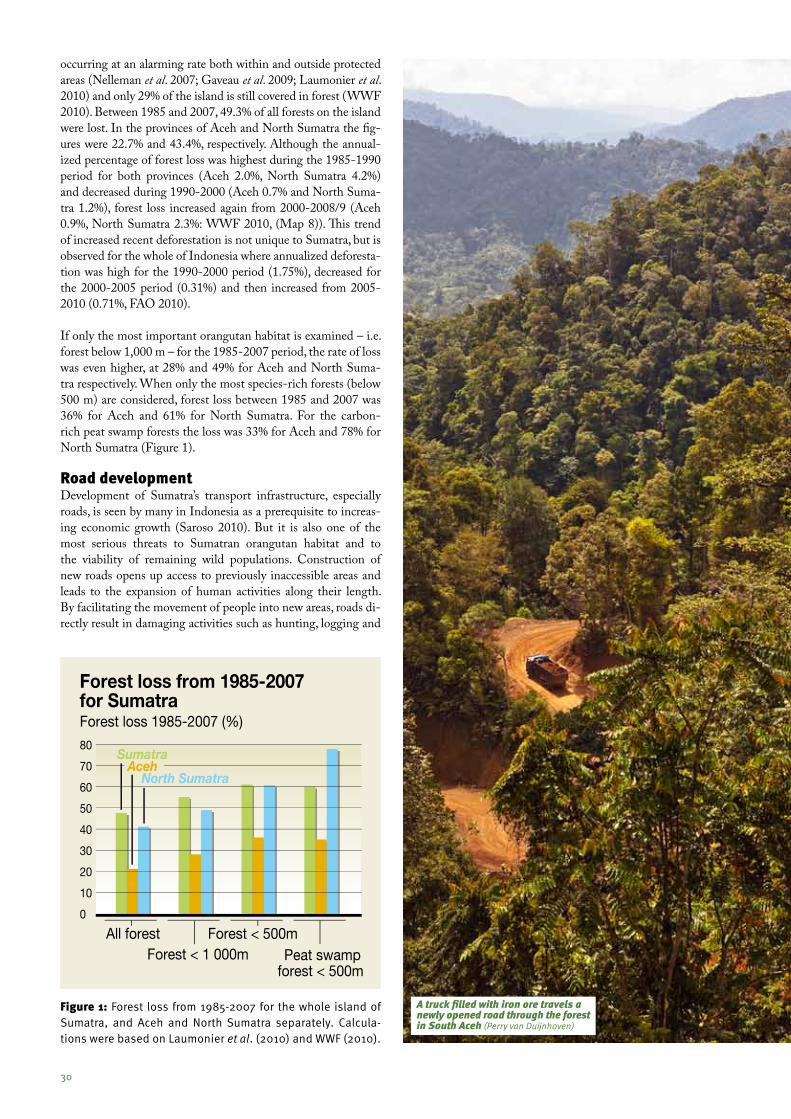
occurring at an alarming rate both within and outside protected areas (Nelleman et al. 2007; Gaveau et al. 2009; Laumonier et al. 2010) and only 29% of the island is still covered in forest (WWF 2010). Between 1985 and 2007, 49.3% of all forests on the island were lost. In the provinces of Aceh and North Sumatra the fig-ures were 22.7% and 43.4%, respectively. Although the annual-ized percentage of forest loss was highest during the 1985-1990 period for both provinces (Aceh 2.0%, North Sumatra 4.2%) and decreased during 1990-2000 (Aceh 0.7% and North Suma-tra 1.2%), forest loss increased again from 2000-2008/9 (Aceh 0.9%, North Sumatra 2.3%: WWF 2010, (Map 8)). This trend of increased recent deforestation is not unique to Sumatra, but is observed for the whole of Indonesia where annualized deforesta-tion was high for the 1990-2000 period (1.75%), decreased for the 2000-2005 period (0.31%) and then increased from 2005-2010 (0.71%, FAO 2010). If only the most important orangutan habitat is examined – i.e. forest below 1,000 m – for the 1985-2007 period, the rate of loss was even higher, at 28% and 49% for Aceh and North Suma-tra respectively. When only the most species-rich forests (below 500 m) are considered, forest loss between 1985 and 2007 was 36% for Aceh and 61% for North Sumatra. For the carbon-rich peat swamp forests the loss was 33% for Aceh and 78% for North Sumatra (Figure 1).
Road developmentDevelopment of Sumatra’s transport infrastructure, especially roads, is seen by many in Indonesia as a prerequisite to increas-ing economic growth (Saroso 2010). But it is also one of the most serious threats to Sumatran orangutan habitat and to the viability of remaining wild populations. Construction of new roads opens up access to previously inaccessible areas and leads to the expansion of human activities along their length. By facilitating the movement of people into new areas, roads di-rectly result in damaging activities such as hunting, logging and
Forest loss from 1985-2007 for Sumatra
Sumatra
All forest
Forest loss 1985-2007 (%)
80
70
60
50
40
30
20
10
0
Forest < 1 000mforest < 500mPeat swamp
Forest < 500m
AcehNorth Sumatra
Figure 1: Forest loss from 1985-2007 for the whole island of Sumatra, and Aceh and North Sumatra separately. Calcula-tions were based on Laumonier et al. (2010) and WWF (2010).
A truck filled with iron ore travels a newly opened road through the forest in South Aceh (Perry van Duijnhoven)
30 31
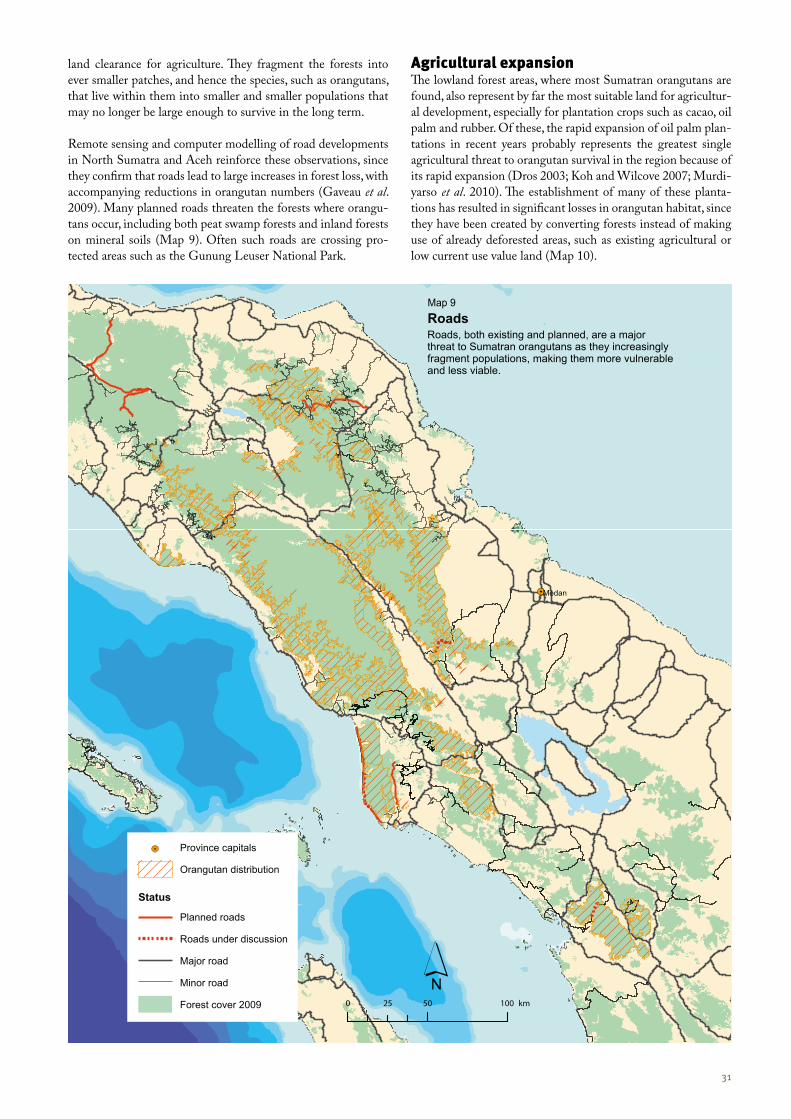
RoadsRoads, both existing and planned, are a major threat to Sumatran orangutans as they increasingly fragment populations, making them more vulnerable and less viable.
Status
Orangutan distribution
Province capitals
Planned roads
Roads under discussion
Major road
Minor road
Forest cover 2009
land clearance for agriculture. They fragment the forests into ever smaller patches, and hence the species, such as orangutans, that live within them into smaller and smaller populations that may no longer be large enough to survive in the long term.
Remote sensing and computer modelling of road developments in North Sumatra and Aceh reinforce these observations, since they confirm that roads lead to large increases in forest loss, with accompanying reductions in orangutan numbers (Gaveau et al. 2009). Many planned roads threaten the forests where orangu-tans occur, including both peat swamp forests and inland forests on mineral soils (Map 9). Often such roads are crossing pro-tected areas such as the Gunung Leuser National Park.
Agricultural expansionThe lowland forest areas, where most Sumatran orangutans are found, also represent by far the most suitable land for agricultur-al development, especially for plantation crops such as cacao, oil palm and rubber. Of these, the rapid expansion of oil palm plan-tations in recent years probably represents the greatest single agricultural threat to orangutan survival in the region because of its rapid expansion (Dros 2003; Koh and Wilcove 2007; Murdi-yarso et al. 2010). The establishment of many of these planta-tions has resulted in significant losses in orangutan habitat, since they have been created by converting forests instead of making use of already deforested areas, such as existing agricultural or low current use value land (Map 10).
Map 9
32 33
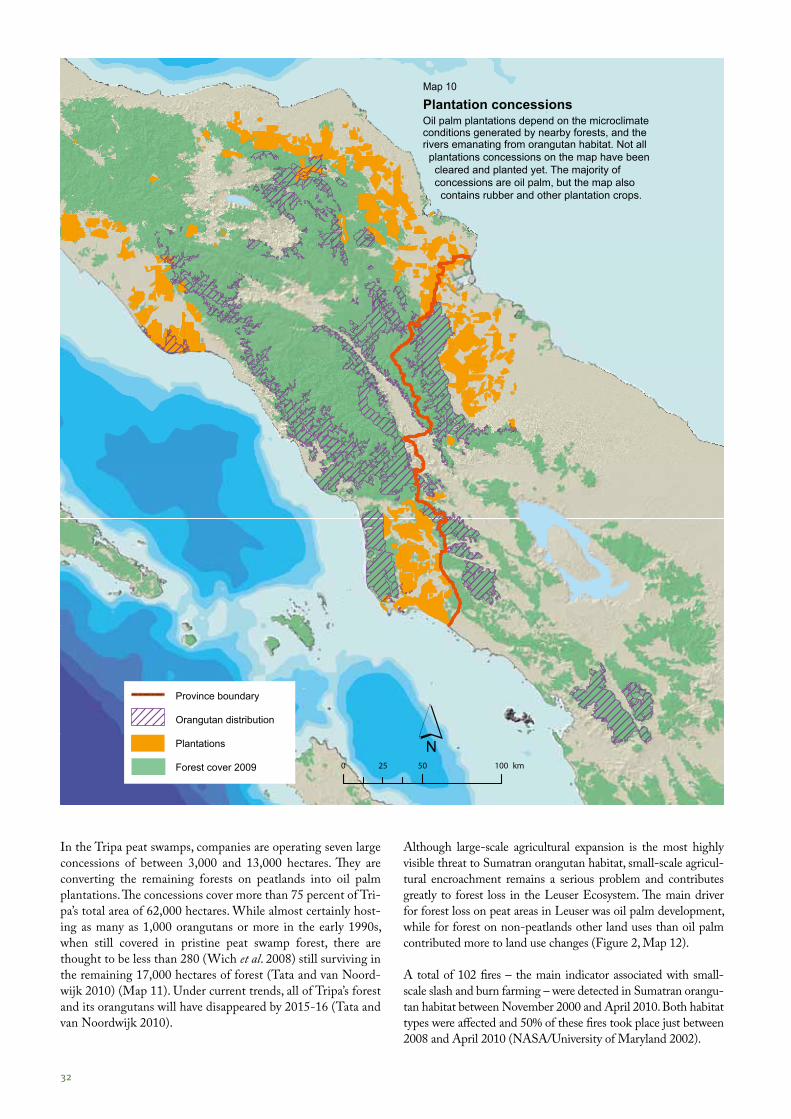
Plantation concessionsOil palm plantations depend on the microclimate conditions generated by nearby forests, and therivers emanating from orangutan habitat. Not all plantations concessions on the map have been cleared and planted yet. The majority of concessions are oil palm, but the map also contains rubber and other plantation crops.
Province boundary
Orangutan distribution
Plantations
Forest cover 2009
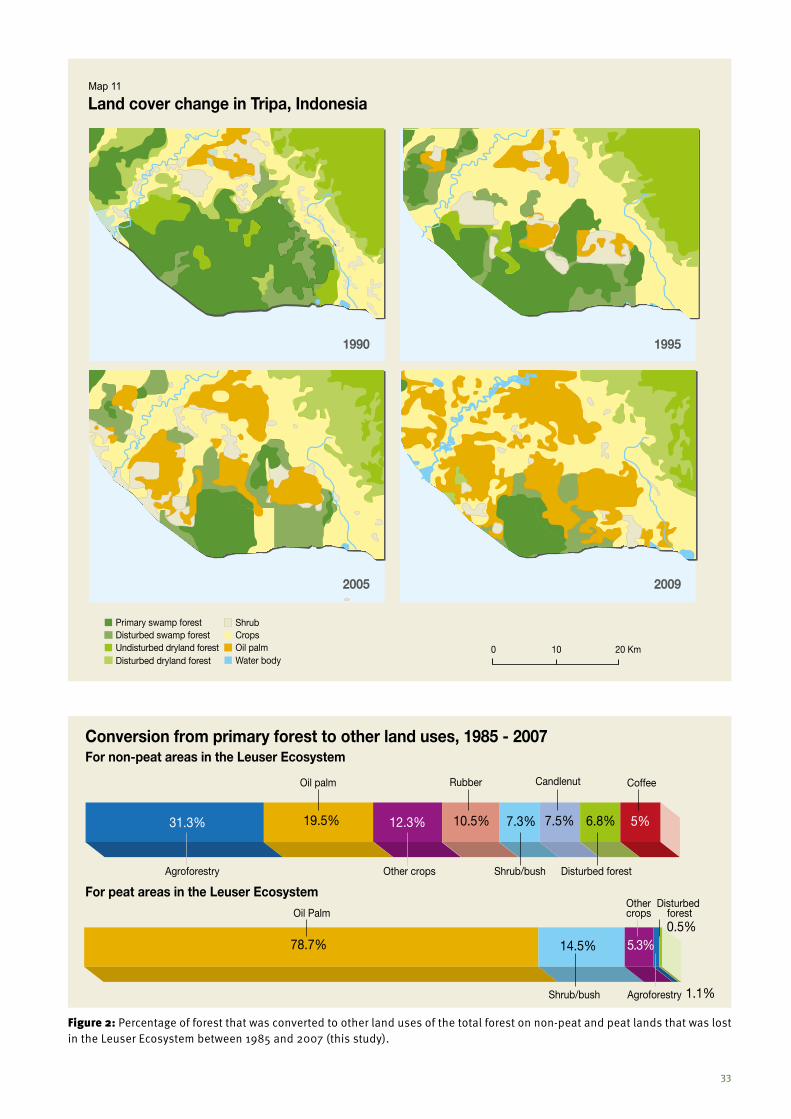
In the Tripa peat swamps, companies are operating seven large concessions of between 3,000 and 13,000 hectares. They are converting the remaining forests on peatlands into oil palm plantations. The concessions cover more than 75 percent of Tri-pa’s total area of 62,000 hectares. While almost certainly host-ing as many as 1,000 orangutans or more in the early 1990s, when still covered in pristine peat swamp forest, there are thought to be less than 280 (Wich et al. 2008) still surviving in the remaining 17,000 hectares of forest (Tata and van Noord-wijk 2010) (Map 11). Under current trends, all of Tripa’s forest and its orangutans will have disappeared by 2015-16 (Tata and van Noordwijk 2010).
Although large-scale agricultural expansion is the most highly visible threat to Sumatran orangutan habitat, small-scale agricul-tural encroachment remains a serious problem and contributes greatly to forest loss in the Leuser Ecosystem. The main driver for forest loss on peat areas in Leuser was oil palm development, while for forest on non-peatlands other land uses than oil palm contributed more to land use changes (Figure 2, Map 12).
A total of 102 fires – the main indicator associated with small-scale slash and burn farming – were detected in Sumatran orangu-tan habitat between November 2000 and April 2010. Both habitat types were affected and 50% of these fires took place just between 2008 and April 2010 (NASA/University of Maryland 2002).
Map 10
32 33
Land cover change in Tripa, Indonesia
1990 1995
2005 2009
Primary swamp forest
0 10 20 KmUndisturbed dryland forestDisturbed dryland forest
ShrubCropsOil palmWater body
Disturbed swamp forest
Figure 2: Percentage of forest that was converted to other land uses of the total forest on non-peat and peat lands that was lost in the Leuser Ecosystem between 1985 and 2007 (this study).
Conversion from primary forest to other land uses, 1985 - 2007
Agroforestry
Agroforestry
Shrub/bush
Shrub/bush
Rubber
Other crops
Other crops
31.3% 7.3%
14.5%0.5%
1.1%
10.5%
Oil palm
Oil Palm
Candlenut
Disturbed forest
Disturbed forest
Coffee
19.5%
78.7%
7.5% 6.8% 5%12.3%
5.3%
For non-peat areas in the Leuser Ecosystem
For peat areas in the Leuser Ecosystem
Map 11
34 35
Leuser Ecosystem Boundary
Crops
Disturbed forest
Agroforestry cultivation
Kemiri (Candlenut)
Rubber
Oil Palm
Coffee
Shrub/Bush
Type of Land use:
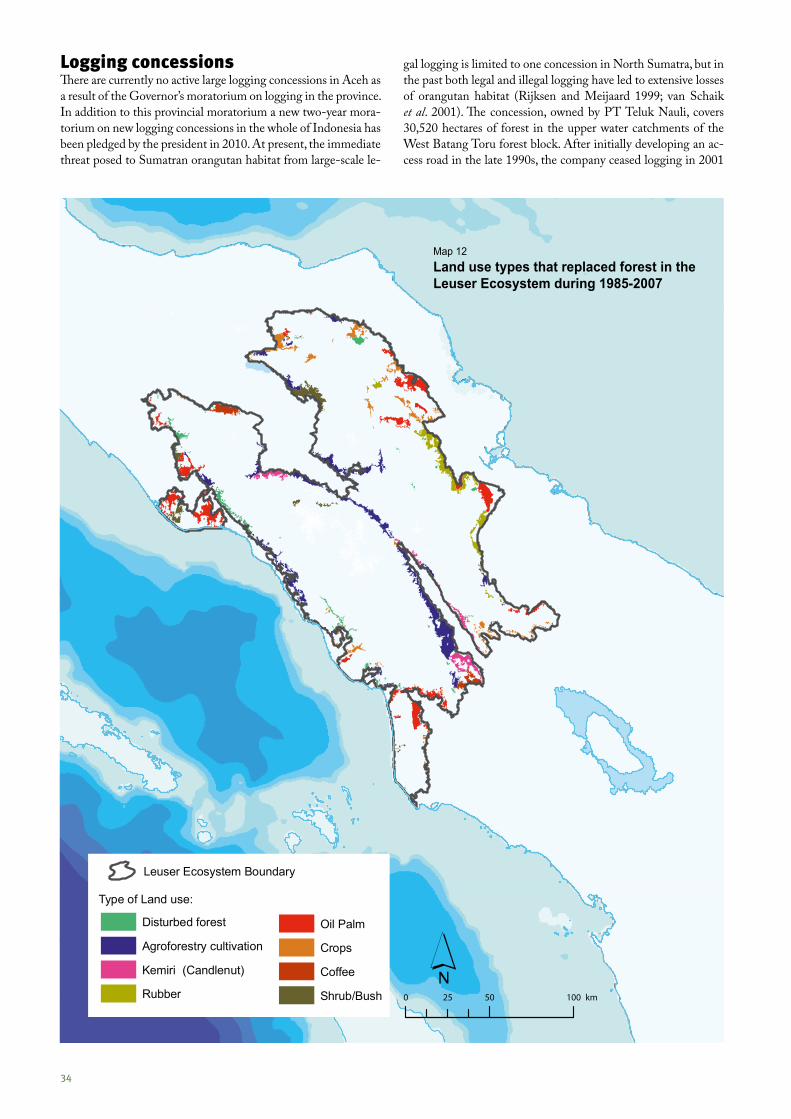
Logging concessionsThere are currently no active large logging concessions in Aceh as a result of the Governor’s moratorium on logging in the province. In addition to this provincial moratorium a new two-year mora-torium on new logging concessions in the whole of Indonesia has been pledged by the president in 2010. At present, the immediate threat posed to Sumatran orangutan habitat from large-scale le-
gal logging is limited to one concession in North Sumatra, but in the past both legal and illegal logging have led to extensive losses of orangutan habitat (Rijksen and Meijaard 1999; van Schaik et al. 2001). The concession, owned by PT Teluk Nauli, covers 30,520 hectares of forest in the upper water catchments of the West Batang Toru forest block. After initially developing an ac-cess road in the late 1990s, the company ceased logging in 2001
Map 12Land use types that replaced forest in the Leuser Ecosystem during 1985-2007
34 35
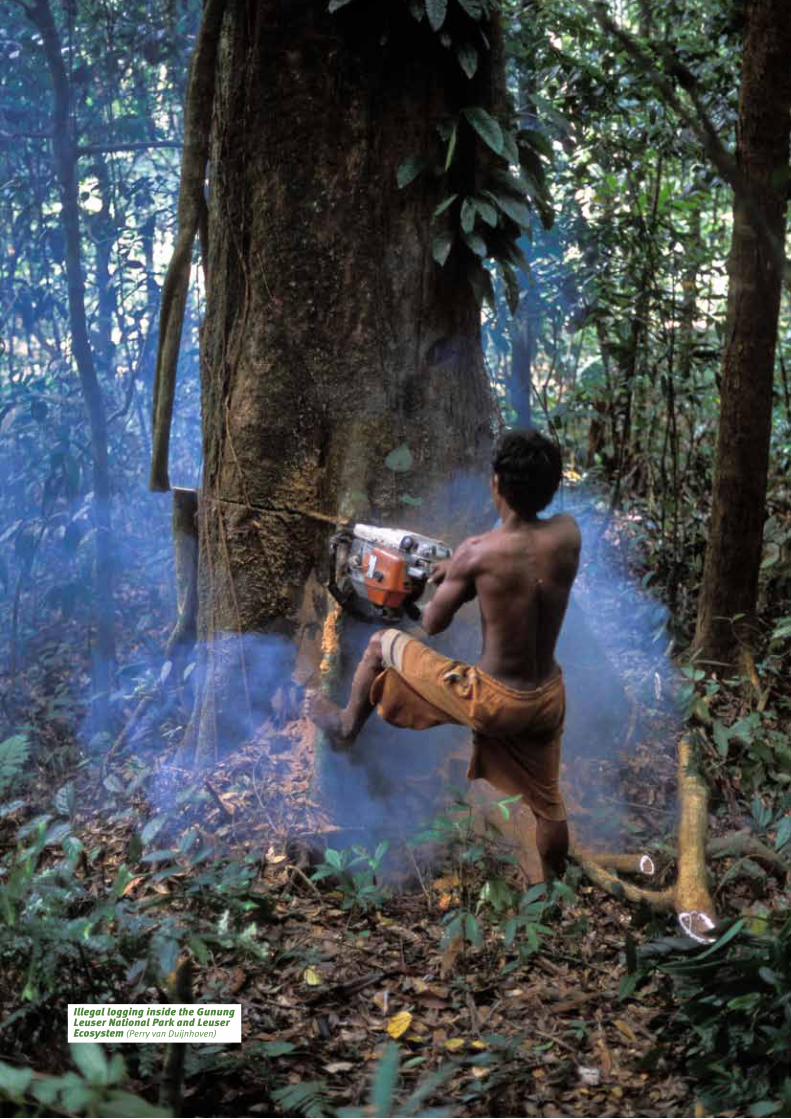
Illegal logging inside the Gunung Leuser National Park and Leuser Ecosystem (Perry van Duijnhoven)
36 37
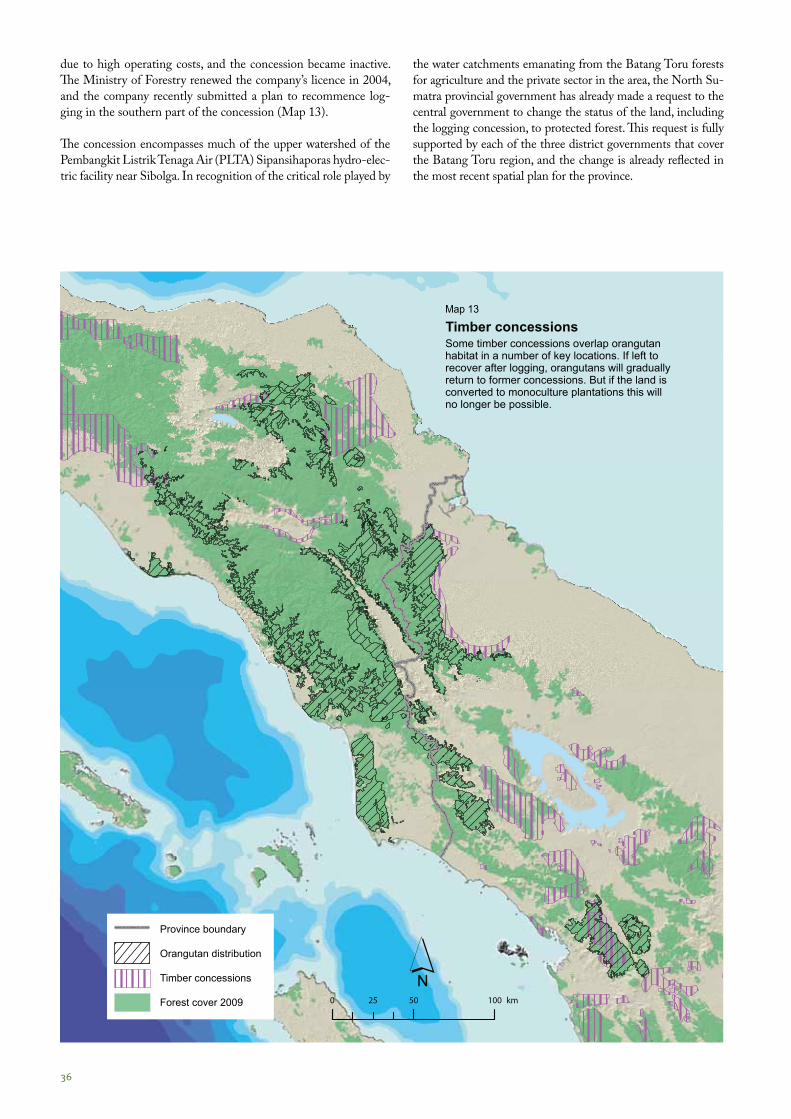
Timber concessionsSome timber concessions overlap orangutan habitat in a number of key locations. If left to recover after logging, orangutans will gradually return to former concessions. But if the land isconverted to monoculture plantations this willno longer be possible.
Province boundary
Orangutan distribution
Timber concessions
Forest cover 2009
due to high operating costs, and the concession became inactive. The Ministry of Forestry renewed the company’s licence in 2004, and the company recently submitted a plan to recommence log-ging in the southern part of the concession (Map 13). The concession encompasses much of the upper watershed of the Pembangkit Listrik Tenaga Air (PLTA) Sipansihaporas hydro-elec-tric facility near Sibolga. In recognition of the critical role played by
the water catchments emanating from the Batang Toru forests for agriculture and the private sector in the area, the North Su-matra provincial government has already made a request to the central government to change the status of the land, including the logging concession, to protected forest. This request is fully supported by each of the three district governments that cover the Batang Toru region, and the change is already reflected in the most recent spatial plan for the province.
Map 13

36 37
Mining explorationThe mining industry is a potential threat to Sumatranorangutan habitat in a number of important areas, both directly by its own activities and indirectly by road access.
Province boundary
Orangutan distribution
Mining exploration areas
Forest cover 2009
MiningWith declining revenues from oil and gas production in Aceh, and the end of the civil conflict in 2005, there is in-creasing pressure on the provincial government to target rev-enue from expanding the mining sector. Potential minerals for mining within Sumatran orangutan habitat in Aceh and North Sumatra include precious metals, coal, iron ore and bauxite. Mining threats to orangutan populations in northern Sumatra include a major gold mine near the town of Batang
Toru and iron ore mining that has been proposed in the Alas valley, and planned development of coal mining in the hill forests inland of the Tripa swamps (Map 14). Mining itself can be a relatively minor problem, if operations can be con-fined to small restricted areas, and if correctly managed to avoid downstream effects (i.e. water and soil contamination). The main problem for orangutans is more often the develop-ment of access to remote mining sites, with its corresponding increase in habitat destruction.
Map 14
38 39
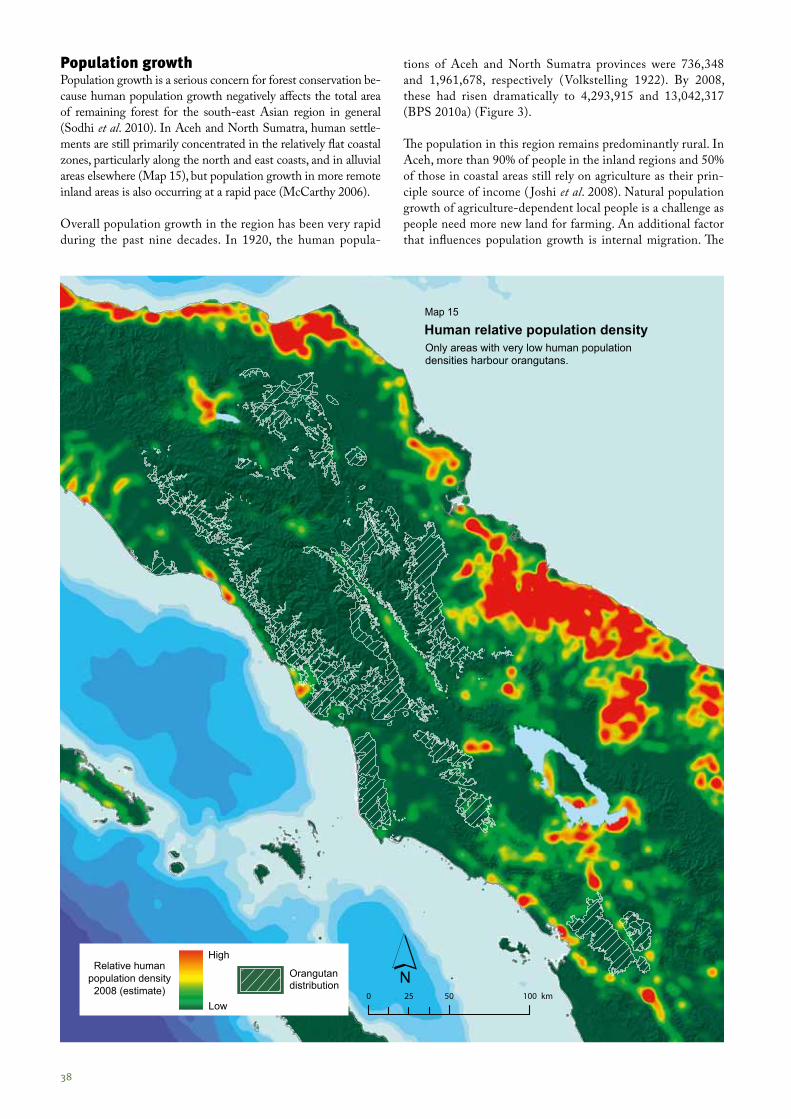
Only areas with very low human population densities harbour orangutans.
Human relative population density
Relative humanpopulation density
2008 (estimate)
High
Low
Orangutandistribution
Population growthPopulation growth is a serious concern for forest conservation be-cause human population growth negatively affects the total area of remaining forest for the south-east Asian region in general (Sodhi et al. 2010). In Aceh and North Sumatra, human settle-ments are still primarily concentrated in the relatively flat coastal zones, particularly along the north and east coasts, and in alluvial areas elsewhere (Map 15), but population growth in more remote inland areas is also occurring at a rapid pace (McCarthy 2006).
Overall population growth in the region has been very rapid during the past nine decades. In 1920, the human popula-
tions of Aceh and North Sumatra provinces were 736,348 and 1,961,678, respectively (Volkstelling 1922). By 2008, these had risen dramatically to 4,293,915 and 13,042,317 (BPS 2010a) (Figure 3).
The population in this region remains predominantly rural. In Aceh, more than 90% of people in the inland regions and 50% of those in coastal areas still rely on agriculture as their prin-ciple source of income ( Joshi et al. 2008). Natural population growth of agriculture-dependent local people is a challenge as people need more new land for farming. An additional factor that influences population growth is internal migration. The
Map 15
38 39
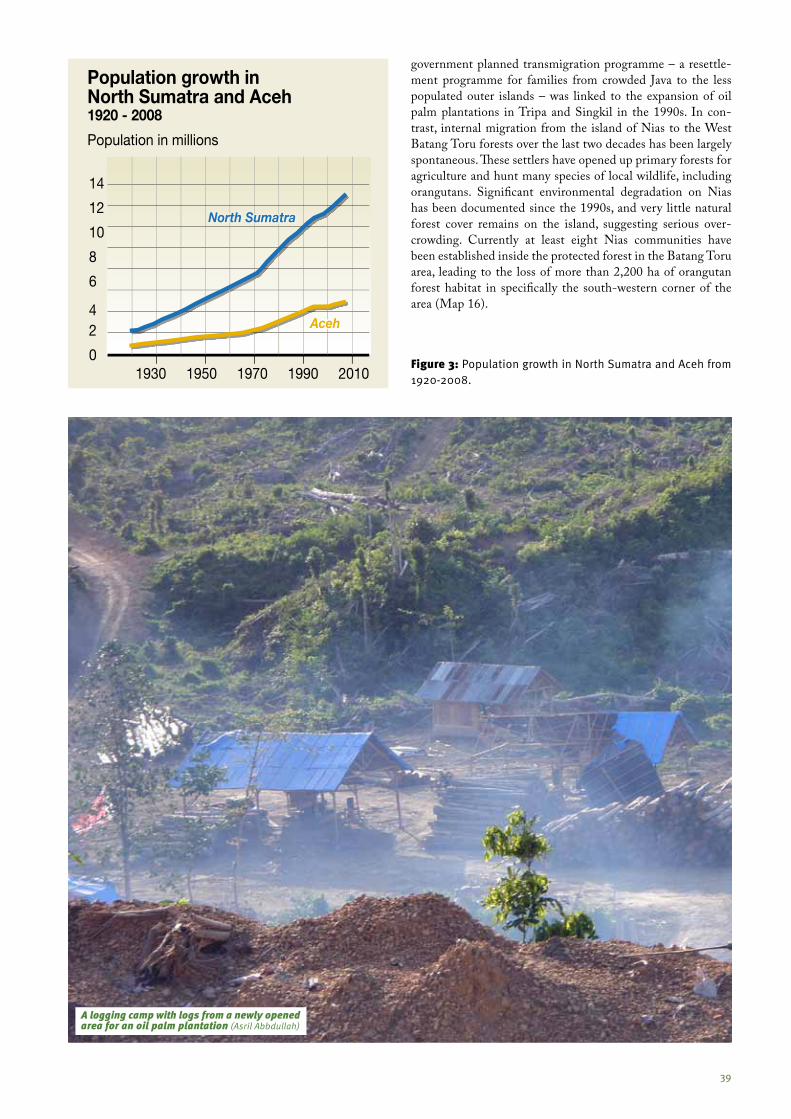
Population growth in North Sumatra and Aceh1920 - 2008
Population in millions
201019901970195019300
24
6
8
10
12
14
Aceh
North Sumatra
Figure 3: Population growth in North Sumatra and Aceh from 1920-2008.
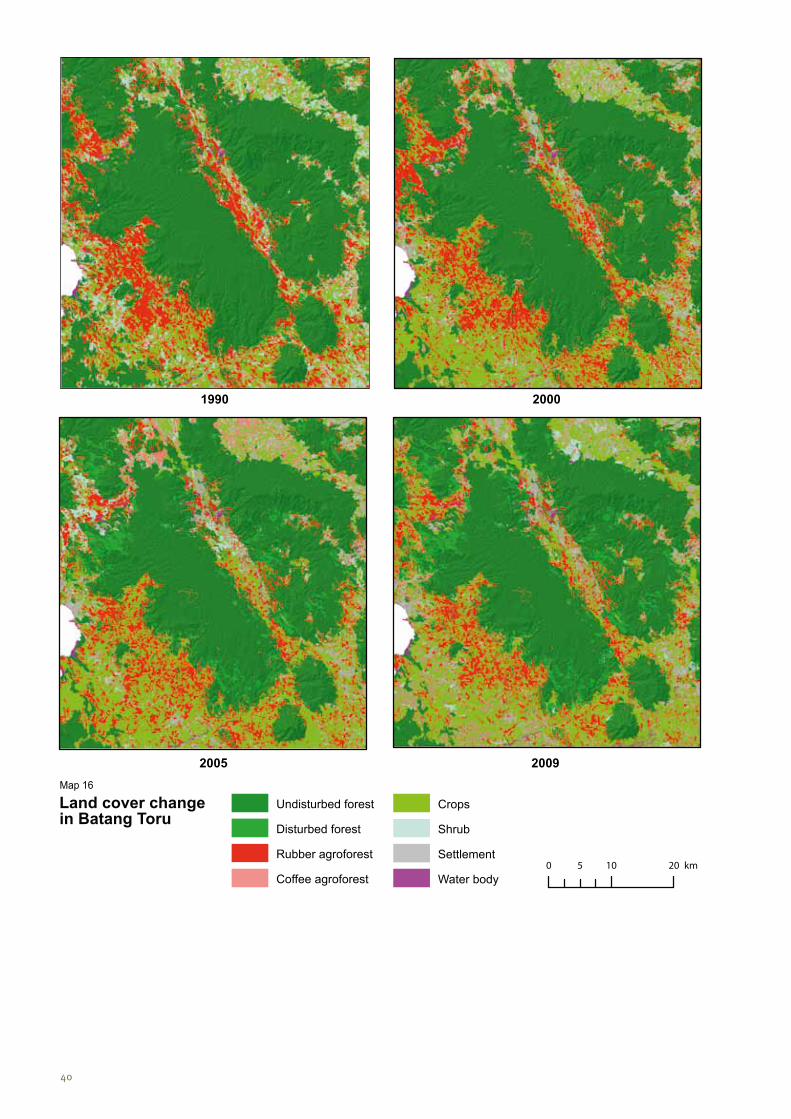
government planned transmigration programme – a resettle-ment programme for families from crowded Java to the less populated outer islands – was linked to the expansion of oil palm plantations in Tripa and Singkil in the 1990s. In con-trast, internal migration from the island of Nias to the West Batang Toru forests over the last two decades has been largely spontaneous. These settlers have opened up primary forests for agriculture and hunt many species of local wildlife, including orangutans. Significant environmental degradation on Nias has been documented since the 1990s, and very little natural forest cover remains on the island, suggesting serious over-crowding. Currently at least eight Nias communities have been established inside the protected forest in the Batang Toru area, leading to the loss of more than 2,200 ha of orangutan forest habitat in specifically the south-western corner of the area (Map 16).
A logging camp with logs from a newly opened area for an oil palm plantation (Asril Abbdullah)
40 41
Undisturbed forest
Disturbed forest
Rubber agroforest
Coffee agroforest
Crops
Shrub
Settlement
Water body
Land cover change in Batang Toru
2000
2005 2009
1990
Map 16
40 41
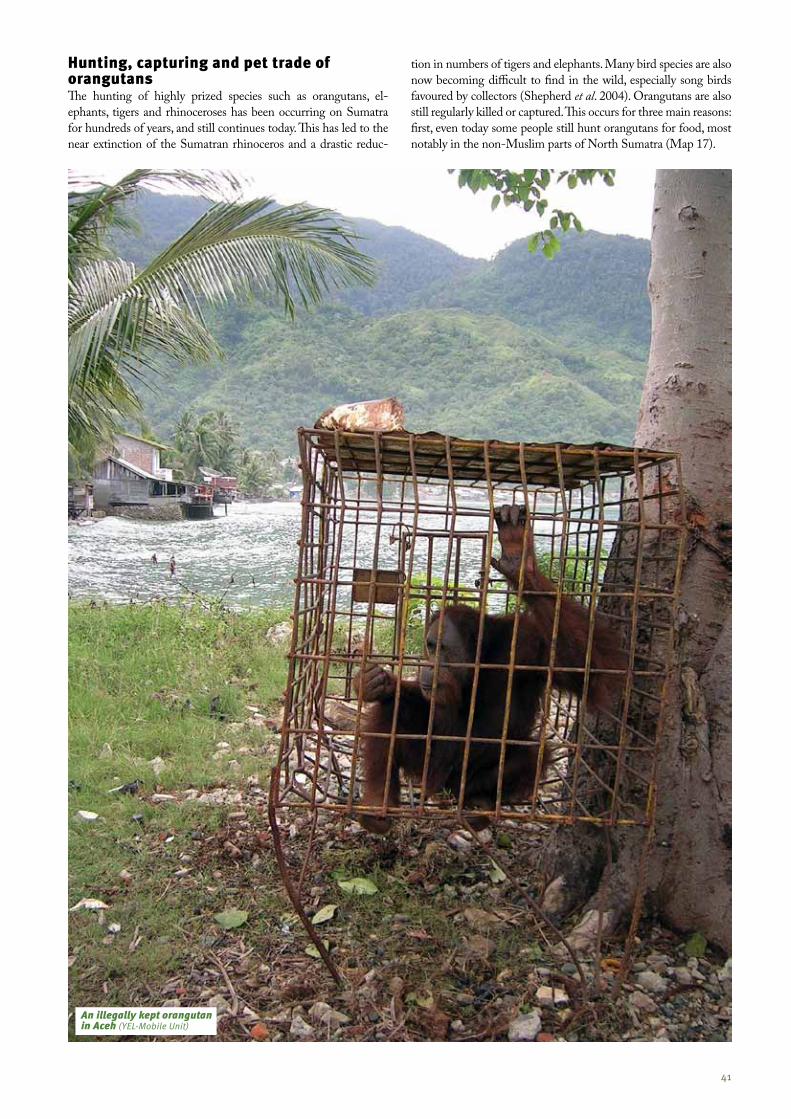
Hunting, capturing and pet trade of orangutansThe hunting of highly prized species such as orangutans, el-ephants, tigers and rhinoceroses has been occurring on Sumatra for hundreds of years, and still continues today. This has led to the near extinction of the Sumatran rhinoceros and a drastic reduc-
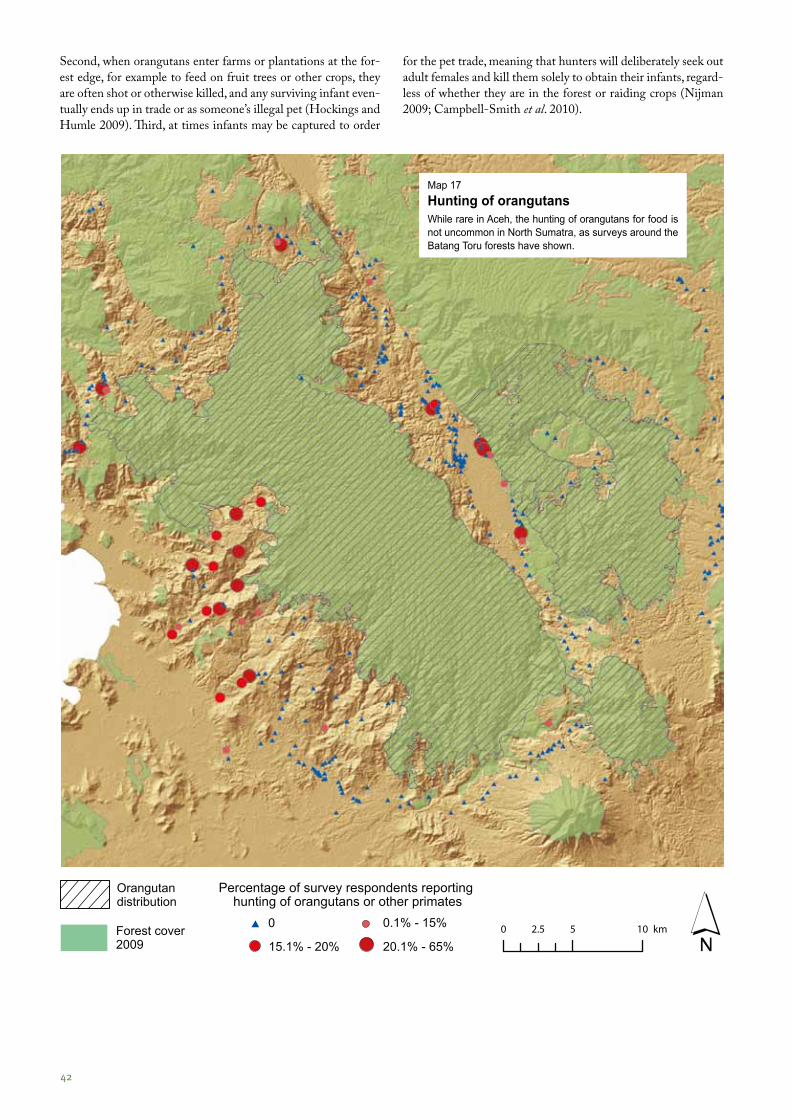
tion in numbers of tigers and elephants. Many bird species are also now becoming difficult to find in the wild, especially song birds favoured by collectors (Shepherd et al. 2004). Orangutans are also still regularly killed or captured. This occurs for three main reasons: first, even today some people still hunt orangutans for food, most notably in the non-Muslim parts of North Sumatra (Map 17).
An illegally kept orangutan in Aceh (YEL-Mobile Unit)
42 43
Orangutan distribution
Percentage of survey respondents reporting hunting of orangutans or other primates
Forest cover 2009
0 0.1% - 15%
15.1% - 20% 20.1% - 65%
Second, when orangutans enter farms or plantations at the for-est edge, for example to feed on fruit trees or other crops, they are often shot or otherwise killed, and any surviving infant even-tually ends up in trade or as someone’s illegal pet (Hockings and Humle 2009). Third, at times infants may be captured to order
for the pet trade, meaning that hunters will deliberately seek out adult females and kill them solely to obtain their infants, regard-less of whether they are in the forest or raiding crops (Nijman 2009; Campbell-Smith et al. 2010).
Map 17Hunting of orangutansWhile rare in Aceh, the hunting of orangutans for food is not uncommon in North Sumatra, as surveys around the Batang Toru forests have shown.

42 43
Forest statusMost Sumatran orangutan habitat is protected by Indonesian law. Some areas remain highly threatened, however, including the Batang Toru Forest (production forest), and the Tripa Swamp Forest (not part of the formal forest estate).
Conservation areas:
Leuser Ecosystem
Conservation forest(National park, wildlife reserve,hunting park, nature reserve)
Non-forest estate
Protection forest
Limited production forest
Production forest
Convertible forest
Orangutan distribution
Forest status
Other area status:
In order to mitigate the above-mentioned challenges to con-servation of habitat and species, the Indonesian government has created a very comprehensive system of functional forest categories, and institutions responsible for managing its forests (appendix 1) (Map 18). The Indonesian government has also developed an extensive list of policies and laws to protect its wildlife, including the Sumatran orangutan (appendix 2).
Orangutans have been protected under national law since 1931, but most of the institutional framework for nature conserva-
tion was developed in the 1980s and 1990s, concurrent with the growth of industrial-scale forestry. In the early 1980s, In-donesia developed an extensive national parks system, supple-menting and upgrading its existing network of nature reserves dating mostly from Dutch colonial times. The Gunung Leuser National Park itself was the first of the new parks, established in 1980 for its exceptional biodiversity, which includes the Suma-tran orangutan. In 1998 a much wider area, the Leuser Ecosys-tem, that includes a much greater proportion of the orangutan’s range, was delimited by presidential decree. In 2008 part of the
Policies and laws for the protection of forests and orangutans
Map 18
44 45
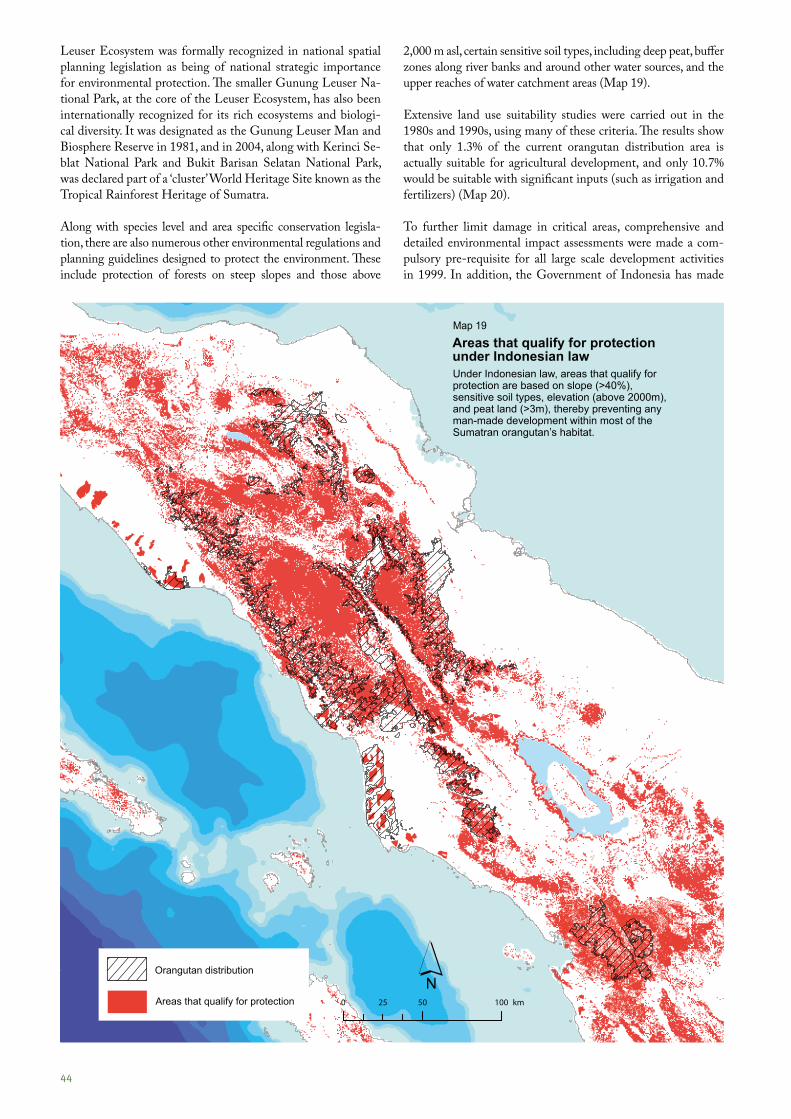
Areas that qualify for protection under Indonesian lawUnder Indonesian law, areas that qualify forprotection are based on slope (>40%),sensitive soil types, elevation (above 2000m),and peat land (>3m), thereby preventing anyman-made development within most of theSumatran orangutan’s habitat.
Orangutan distribution
Areas that qualify for protection
Leuser Ecosystem was formally recognized in national spatial planning legislation as being of national strategic importance for environmental protection. The smaller Gunung Leuser Na-tional Park, at the core of the Leuser Ecosystem, has also been internationally recognized for its rich ecosystems and biologi-cal diversity. It was designated as the Gunung Leuser Man and Biosphere Reserve in 1981, and in 2004, along with Kerinci Se-blat National Park and Bukit Barisan Selatan National Park, was declared part of a ‘cluster’ World Heritage Site known as the Tropical Rainforest Heritage of Sumatra.
Along with species level and area specific conservation legisla-tion, there are also numerous other environmental regulations and planning guidelines designed to protect the environment. These include protection of forests on steep slopes and those above
2,000 m asl, certain sensitive soil types, including deep peat, buffer zones along river banks and around other water sources, and the upper reaches of water catchment areas (Map 19).
Extensive land use suitability studies were carried out in the 1980s and 1990s, using many of these criteria. The results show that only 1.3% of the current orangutan distribution area is actually suitable for agricultural development, and only 10.7% would be suitable with significant inputs (such as irrigation and fertilizers) (Map 20). To further limit damage in critical areas, comprehensive and detailed environmental impact assessments were made a com-pulsory pre-requisite for all large scale development activities in 1999. In addition, the Government of Indonesia has made
Map 19
44 45
several new regulations that are aimed at improving the spatial planning process and protecting the environment (appendix 2).
In addition to the above, the Government of Indonesia has ratified and integrated into national law many international en-vironmental treaties and conventions (e.g. the Convention on Biological Diversity, Convention on International Trade in En-dangered Species, the Convention on Wetlands of International Importance, the UNESCO World Heritage Convention). Most of these support orangutan conservation at the national and international level. In 2007, the Indonesian government also released its own Indonesian National Orangutan Conservation Strategy and Action Plan (2007-2017, Ministry of Forestry 2009) to protect orangutans and their habitat, which was subse-quently signed into law and officially launched by the president.
Despite these policies and laws, forest loss on Sumatra con-tinues at a very high rate, as shown by this report and others (WWF 2010). It is thus clear that additional efforts to reduce forest loss are needed. Setting up systems under which ecosys-tem services (such as climate regulation) are valued and paid are a promising effort that could lead to a reduction in forest loss. Based on an analysis by the Government of Indonesia that assessed which aspects of forest protection and land use plan-ning would need to be improved to enable a solid framework for the implementation of REDD, the recommendation was that these efforts should focus on improving poor spatial planning processes and regulations, ineffective forest management units, weak management of forest land, land tenure inconsistencies, weak legal frameworks and the lack of firm law enforcement (BAPPENAS/UN-REDD 2010).
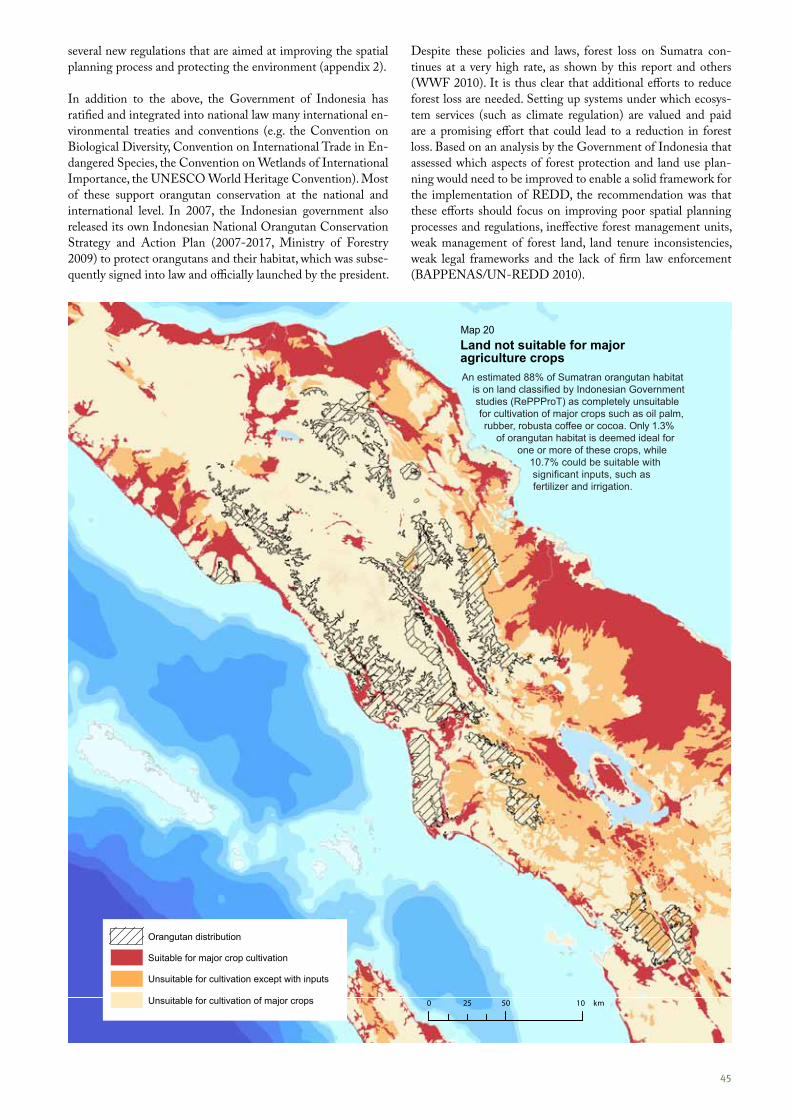
Land not suitable for major agriculture cropsAn estimated 88% of Sumatran orangutan habitat
is on land classified by Indonesian Government studies (RePPProT) as completely unsuitable for cultivation of major crops such as oil palm, rubber, robusta coffee or cocoa. Only 1.3%
of orangutan habitat is deemed ideal for one or more of these crops, while
10.7% could be suitable with significant inputs, such as fertilizer and irrigation.
0 50 1025 km
Orangutan distribution
Suitable for major crop cultivation
Unsuitable for cultivation except with inputs
Unsuitable for cultivation of major crops
Map 20
46 47
“We have reached substantial net gains in human well-being and economic development, but these gains are at growing cost of degradation to many ecosystem services”(Millenium Ecosystem Assessment, 2005c)
Management of the world’s ecosystems is now clearly recognised as un-sustainable, already causing damage to some people and, unless efforts are taken to turn the tide, it will substantially diminish the long-term benefits obtained from ecosystems. The profit earned from nature can be characterized under the term of ecosystems services, defined as the beneficial outcomes, for the natural environment or people, that result from ecosystem functions. Some examples of ecosystem services are 1.) support of the food chain, 2.) harvesting of animals or plants, and 3.) the provision of clean water or scenic views. These services have been divid-ed into four categories, from provisioning to supporting services (Box 2).
One of the primary objectives of this study is to highlight the numer-ous ecosystem services that orangutan habitat in Sumatra provides,
showing the relationships that exist between economic development, human well-being and the maintenance of these services. In this context, the alarming loss of biodi-versity that is occurring in the region can be considered a huge threat to the ecosystem’s capacity to provide essential services. This decrease in diversity tends to reduce overall ecosystem production and stability, and there is increasing evidence that the maintenance of multiple ecosystem pro-cesses requires a very large number of species (Naeem et al. 2009). Thus it is important to protect flora and fauna not only for their intrinsic value, but also for the many support-ing services they offer.
The current economic system, which is based on the assump-tion that most of what is taken from the environment is a public good, or, in other words, that it is “free”, is leading humanity to either overexploit what nature provides or to destroy it completely. This has created an economic system in which one service has been maximized (usually produc-tivity) at the expense of others (usually ecosystem services). Under this economic paradigm, ecosystem services are not attributed their true value, which subsequently has led to un-sustainable use and the progressive depletion of ecosystems.
While the Millennium Ecosystem Assessment (MEA) high-lights the pressing concern that ecological degradation is leading to permanent reduction or loss of critical ecosystem services and to subsequent reductions in human well-being, recent efforts have focused on how the services that ecosystems provides should be properly evaluated and their true value in-tegrated into decision-making processes (TEEB 2008, 2009).
“You cannot manage what you do not measure.”Pavan Sukhdev (TEEB 2008)
The Economics of Ecosystems and Biodiversity (TEEB) initiative strongly highlights the urgent need to include ecosystem services and especially forest carbon into na-tional accounts. Because tools for valuing biodiversity and ecosystem services are rapidly being developed and govern-ments all over the world are using these, it is becoming clear that there are transformational opportunities for economic growth to the benefit of the world’s degraded ecosystems.
This chapter aims to demonstrate the pathways towards a Green Economy for Indonesia and in particular for land use planners and policymakers in Northern Sumatra. Results from a 2010 Great Apes Survival Partnership (GRASP)-UNEP funded research project on carbon valuation of for-ests in Tripa and Batang Toru are combined here with out-puts from several economic studies in the Leuser National Park area over the past decade. This work shows that, by in-tegrating ecosystem services values, and especially avoided carbon emissions from deforestation, it is possible to offset the revenue projections under business as usual scenarios for many land uses, and for forests on peatlands more sus-tainable forms of revenue generation appear to surpass rev-enue projections for even the oil palm industry.
New green business opportunities
Each ecosystem is a dynamic complex of plant, animal and microorganism communities and the non-living environ-ment interacting as a functional unit.
Ecosystem services are the benefits people obtain from eco-systems. The human species is fundamentally dependent on the flow of ecosystem services. While many of the services are strongly interlinked, they can be separated into four main categories: provisioning, regulating, cultural and supporting.
Provisioning services are products obtained from ecosys-tems, including food, fibre, energy sources, genetic resourc-es, natural medicines, fresh water and ornamental resources.
Regulating services are the benefits obtained from the regu-lation of ecosystem processes, including air quality regula-tion, climate regulation both locally (i.e. temperature and precipitation) and globally (i.e. sequestering or emitting greenhouse gases), water regulation, erosion regulation, wa-ter purification, disease regulation, pest regulation, pollina-tion and natural hazard regulation.
Cultural services are the non-material benefits people obtain from ecosystems through spiritual enrichment, cognitive de-velopment, reflection, recreation and aesthetic experiences.
Supporting services are those that are necessary for the pro-duction of all other ecosystem services. These services differ from those above in that their impacts on people are often indirect, or occur over a very long time, whilst the others tend to have relatively direct and short-term impacts on people. They include such things as soil formation, photosynthesis, nutrient cycling and water cycling.
Millennium Ecosystem Assessment (MEA 2005a, b, c)
Box 2: Ecosystem Services
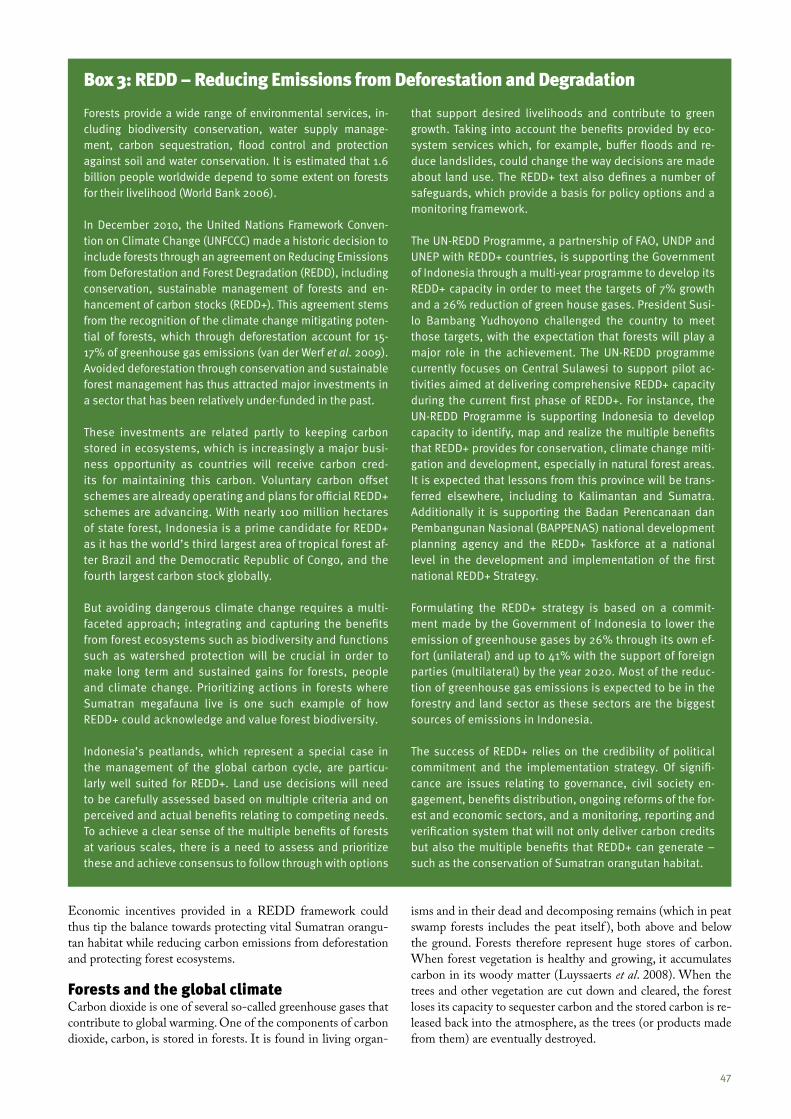
46 47
Economic incentives provided in a REDD framework could thus tip the balance towards protecting vital Sumatran orangu-tan habitat while reducing carbon emissions from deforestation and protecting forest ecosystems.
Forests and the global climateCarbon dioxide is one of several so-called greenhouse gases that contribute to global warming. One of the components of carbon dioxide, carbon, is stored in forests. It is found in living organ-
isms and in their dead and decomposing remains (which in peat swamp forests includes the peat itself ), both above and below the ground. Forests therefore represent huge stores of carbon. When forest vegetation is healthy and growing, it accumulates carbon in its woody matter (Luyssaerts et al. 2008). When the trees and other vegetation are cut down and cleared, the forest loses its capacity to sequester carbon and the stored carbon is re-leased back into the atmosphere, as the trees (or products made from them) are eventually destroyed.
Forests provide a wide range of environmental services, in-cluding biodiversity conservation, water supply manage-ment, carbon sequestration, flood control and protection against soil and water conservation. It is estimated that 1.6 billion people worldwide depend to some extent on forests for their livelihood (World Bank 2006).
In December 2010, the United Nations Framework Conven-tion on Climate Change (UNFCCC) made a historic decision to include forests through an agreement on Reducing Emissions from Deforestation and Forest Degradation (REDD), including conservation, sustainable management of forests and en-hancement of carbon stocks (REDD+). This agreement stems from the recognition of the climate change mitigating poten-tial of forests, which through deforestation account for 15-17% of greenhouse gas emissions (van der Werf et al. 2009). Avoided deforestation through conservation and sustainable forest management has thus attracted major investments in a sector that has been relatively under-funded in the past.
These investments are related partly to keeping carbon stored in ecosystems, which is increasingly a major busi-ness opportunity as countries will receive carbon cred-its for maintaining this carbon. Voluntary carbon offset schemes are already operating and plans for official REDD+ schemes are advancing. With nearly 100 million hectares of state forest, Indonesia is a prime candidate for REDD+ as it has the world’s third largest area of tropical forest af-ter Brazil and the Democratic Republic of Congo, and the fourth largest carbon stock globally.
But avoiding dangerous climate change requires a multi-faceted approach; integrating and capturing the benefits from forest ecosystems such as biodiversity and functions such as watershed protection will be crucial in order to make long term and sustained gains for forests, people and climate change. Prioritizing actions in forests where Sumatran megafauna live is one such example of how REDD+ could acknowledge and value forest biodiversity.
Indonesia’s peatlands, which represent a special case in the management of the global carbon cycle, are particu-larly well suited for REDD+. Land use decisions will need to be carefully assessed based on multiple criteria and on perceived and actual benefits relating to competing needs. To achieve a clear sense of the multiple benefits of forests at various scales, there is a need to assess and prioritize these and achieve consensus to follow through with options
Box 3: REDD – Reducing Emissions from Deforestation and Degradation
that support desired livelihoods and contribute to green growth. Taking into account the benefits provided by eco-system services which, for example, buffer floods and re-duce landslides, could change the way decisions are made about land use. The REDD+ text also defines a number of safeguards, which provide a basis for policy options and a monitoring framework.
The UN-REDD Programme, a partnership of FAO, UNDP and UNEP with REDD+ countries, is supporting the Government of Indonesia through a multi-year programme to develop its REDD+ capacity in order to meet the targets of 7% growth and a 26% reduction of green house gases. President Susi-lo Bambang Yudhoyono challenged the country to meet those targets, with the expectation that forests will play a major role in the achievement. The UN-REDD programme currently focuses on Central Sulawesi to support pilot ac-tivities aimed at delivering comprehensive REDD+ capacity during the current first phase of REDD+. For instance, the UN-REDD Programme is supporting Indonesia to develop capacity to identify, map and realize the multiple benefits that REDD+ provides for conservation, climate change miti-gation and development, especially in natural forest areas. It is expected that lessons from this province will be trans-ferred elsewhere, including to Kalimantan and Sumatra. Additionally it is supporting the Badan Perencanaan dan Pembangunan Nasional (BAPPENAS) national development planning agency and the REDD+ Taskforce at a national level in the development and implementation of the first national REDD+ Strategy.
Formulating the REDD+ strategy is based on a commit-ment made by the Government of Indonesia to lower the emission of greenhouse gases by 26% through its own ef-fort (unilateral) and up to 41% with the support of foreign parties (multilateral) by the year 2020. Most of the reduc-tion of greenhouse gas emissions is expected to be in the forestry and land sector as these sectors are the biggest sources of emissions in Indonesia.
The success of REDD+ relies on the credibility of political commitment and the implementation strategy. Of signifi-cance are issues relating to governance, civil society en-gagement, benefits distribution, ongoing reforms of the for-est and economic sectors, and a monitoring, reporting and verification system that will not only deliver carbon credits but also the multiple benefits that REDD+ can generate – such as the conservation of Sumatran orangutan habitat.
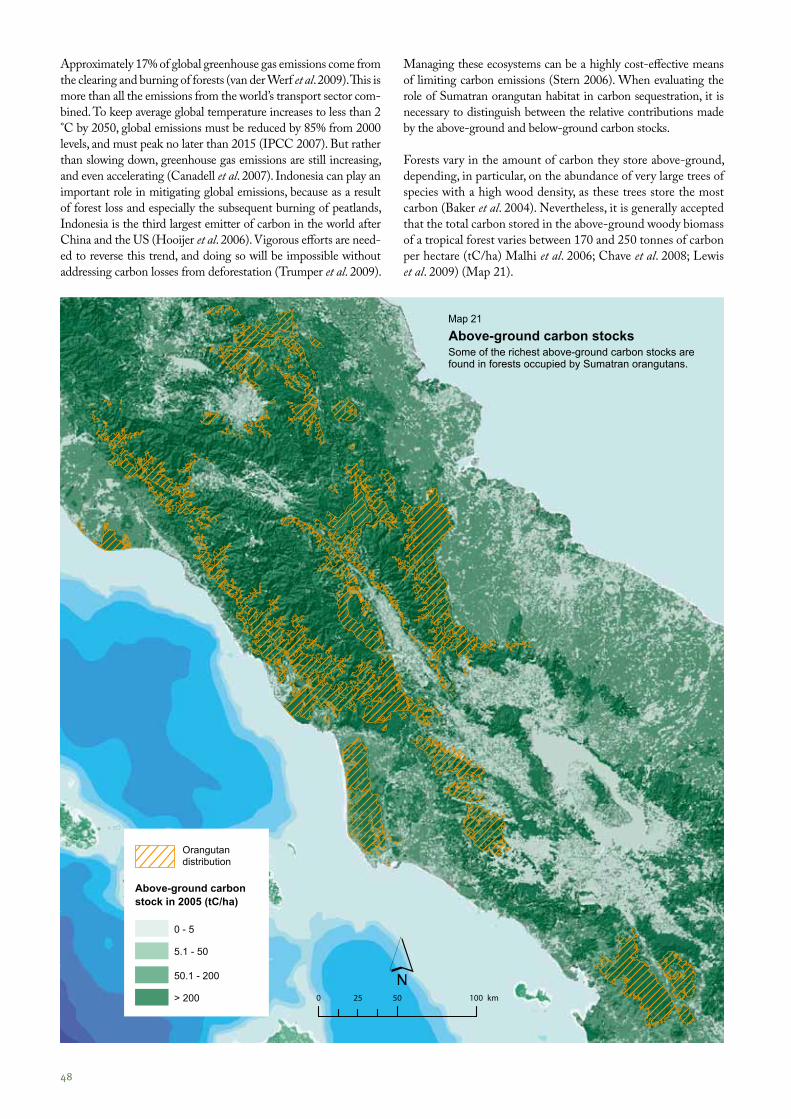
48 49
Above-ground carbon stocksSome of the richest above-ground carbon stocks are found in forests occupied by Sumatran orangutans.
Above-ground carbon stock in 2005 (tC/ha)
0 - 5
5.1 - 50
50.1 - 200
> 200
Orangutan distribution
Approximately 17% of global greenhouse gas emissions come from the clearing and burning of forests (van der Werf et al. 2009). This is more than all the emissions from the world’s transport sector com-bined. To keep average global temperature increases to less than 2 °C by 2050, global emissions must be reduced by 85% from 2000 levels, and must peak no later than 2015 (IPCC 2007). But rather than slowing down, greenhouse gas emissions are still increasing, and even accelerating (Canadell et al. 2007). Indonesia can play an important role in mitigating global emissions, because as a result of forest loss and especially the subsequent burning of peatlands, Indonesia is the third largest emitter of carbon in the world after China and the US (Hooijer et al. 2006). Vigorous efforts are need-ed to reverse this trend, and doing so will be impossible without addressing carbon losses from deforestation (Trumper et al. 2009).
Managing these ecosystems can be a highly cost-effective means of limiting carbon emissions (Stern 2006). When evaluating the role of Sumatran orangutan habitat in carbon sequestration, it is necessary to distinguish between the relative contributions made by the above-ground and below-ground carbon stocks.
Forests vary in the amount of carbon they store above-ground, depending, in particular, on the abundance of very large trees of species with a high wood density, as these trees store the most carbon (Baker et al. 2004). Nevertheless, it is generally accepted that the total carbon stored in the above-ground woody biomass of a tropical forest varies between 170 and 250 tonnes of carbon per hectare (tC/ha) Malhi et al. 2006; Chave et al. 2008; Lewis et al. 2009) (Map 21).
Map 21
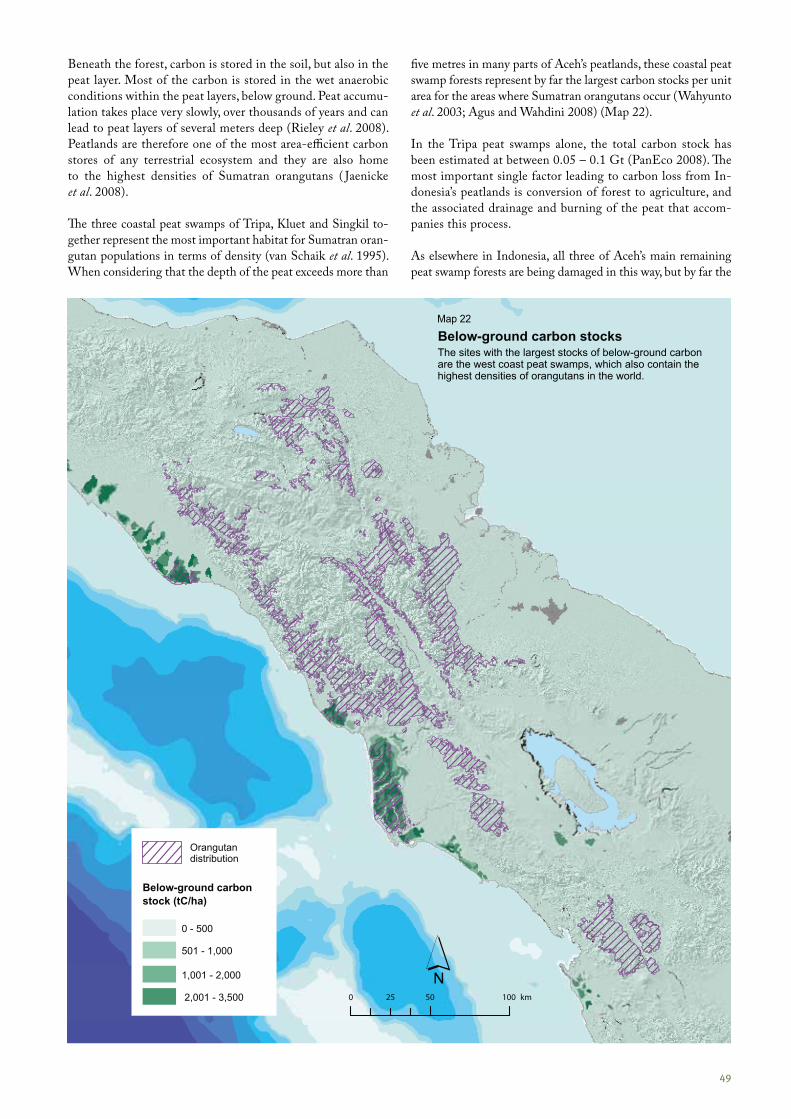
48 49
Below-ground carbon stocksThe sites with the largest stocks of below-ground carbonare the west coast peat swamps, which also contain thehighest densities of orangutans in the world.
Below-ground carbon stock (tC/ha)
0 - 500
501 - 1,000
1,001 - 2,000
2,001 - 3,500
Orangutan distribution
Beneath the forest, carbon is stored in the soil, but also in the peat layer. Most of the carbon is stored in the wet anaerobic conditions within the peat layers, below ground. Peat accumu-lation takes place very slowly, over thousands of years and can lead to peat layers of several meters deep (Rieley et al. 2008). Peatlands are therefore one of the most area-efficient carbon stores of any terrestrial ecosystem and they are also home to the highest densities of Sumatran orangutans ( Jaenicke et al. 2008).
The three coastal peat swamps of Tripa, Kluet and Singkil to-gether represent the most important habitat for Sumatran oran-gutan populations in terms of density (van Schaik et al. 1995). When considering that the depth of the peat exceeds more than
five metres in many parts of Aceh’s peatlands, these coastal peat swamp forests represent by far the largest carbon stocks per unit area for the areas where Sumatran orangutans occur (Wahyunto et al. 2003; Agus and Wahdini 2008) (Map 22).
In the Tripa peat swamps alone, the total carbon stock has been estimated at between 0.05 – 0.1 Gt (PanEco 2008). The most important single factor leading to carbon loss from In-donesia’s peatlands is conversion of forest to agriculture, and the associated drainage and burning of the peat that accom-panies this process. As elsewhere in Indonesia, all three of Aceh’s main remaining peat swamp forests are being damaged in this way, but by far the
Map 22
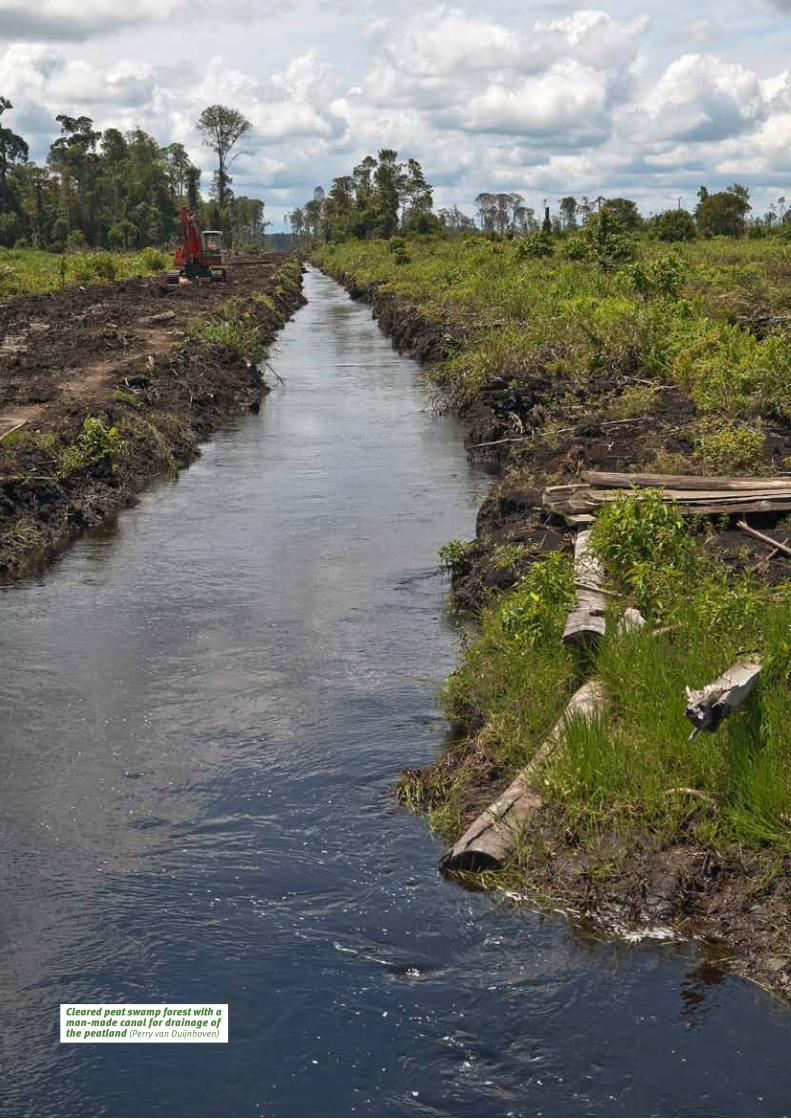
50 51
Cleared peat swamp forest with a man-made canal for drainage of the peatland (Perry van Duijnhoven)
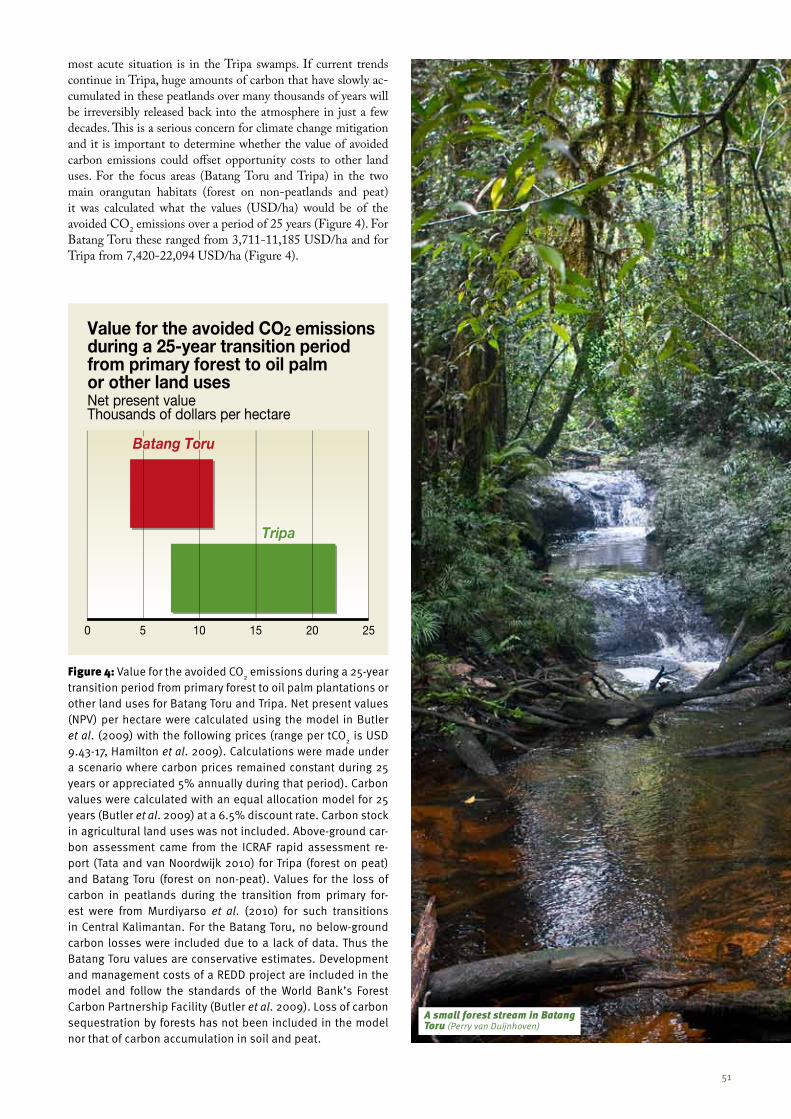
50 51
most acute situation is in the Tripa swamps. If current trends continue in Tripa, huge amounts of carbon that have slowly ac-cumulated in these peatlands over many thousands of years will be irreversibly released back into the atmosphere in just a few decades. This is a serious concern for climate change mitigation and it is important to determine whether the value of avoided carbon emissions could offset opportunity costs to other land uses. For the focus areas (Batang Toru and Tripa) in the two main orangutan habitats (forest on non-peatlands and peat) it was calculated what the values (USD/ha) would be of the avoided CO2 emissions over a period of 25 years (Figure 4). For Batang Toru these ranged from 3,711-11,185 USD/ha and for Tripa from 7,420-22,094 USD/ha (Figure 4).
Figure 4: Value for the avoided CO2 emissions during a 25-year transition period from primary forest to oil palm plantations or other land uses for Batang Toru and Tripa. Net present values (NPV) per hectare were calculated using the model in Butler et al. (2009) with the following prices (range per tCO2 is USD 9.43-17, Hamilton et al. 2009). Calculations were made under a scenario where carbon prices remained constant during 25 years or appreciated 5% annually during that period). Carbon values were calculated with an equal allocation model for 25 years (Butler et al. 2009) at a 6.5% discount rate. Carbon stock in agricultural land uses was not included. Above-ground car-bon assessment came from the ICRAF rapid assessment re-port (Tata and van Noordwijk 2010) for Tripa (forest on peat) and Batang Toru (forest on non-peat). Values for the loss of carbon in peatlands during the transition from primary for-est were from Murdiyarso et al. (2010) for such transitions in Central Kalimantan. For the Batang Toru, no below-ground carbon losses were included due to a lack of data. Thus the Batang Toru values are conservative estimates. Development and management costs of a REDD project are included in the model and follow the standards of the World Bank’s Forest Carbon Partnership Facility (Butler et al. 2009). Loss of carbon sequestration by forests has not been included in the model nor that of carbon accumulation in soil and peat.
Value for the avoided CO2 emissions during a 25-year transition period from primary forest to oil palm or other land uses
Batang Toru
Net present valueThousands of dollars per hectare
2520151050
Tripa
A small forest stream in Batang Toru (Perry van Duijnhoven)

52 53
WaterRivers and streams emanating from forests are utilized in many ways, both by communities close to the forest edge and those liv-ing much further away. Fresh water is used for drinking, cooking, bathing and irrigating agricultural lands. Water sources within Su-matran orangutan habitat also supply hydroelectric power plants, including several small plants in the Leuser Ecosystem and a much larger plant, PLTA Sipansihaporas, in the Batang Toru area. The inland forests play a key role in ensuring downstream freshwater supplies, since the non-alluvial inland areas of the region tend to have very little or no underlying groundwater resources. (Map 23).
The economies of both provinces depend heavily on agricul-ture, such as rice and corn production. In 2008 agriculture con-tributed 26.2% of Aceh’s gross domestic product and 22.8% of
There exist a variety of international and national car-bon markets under which carbon credits may be traded. A broad distinction can be made between compliance and voluntary markets. Under voluntary markets, credits are traded on a voluntary basis, while under compliance markets the credits are generated and traded according to regulatory requirements, usually part of a legally binding cap-and-trade system.
The most important compliance market is the European Union Emission Trading Scheme (EU-ETS). Other compli-ance schemes have been established, such as, the New South Wales Greenhouse Gas Reduction Scheme (NSW GGAS) and the New Zealand Emissions Trading Scheme and (NZ ETS). Individual country buyers are also actively sourcing compliance carbon credits to help meet their Kyoto Protocol emission reduction targets.
Thus far, developing countries have not been required to set legally binding emission reduction targets and neither have they established national or regional cap-and-trade systems, although there are moves in this di-rection. Therefore, developing countries may only enter carbon markets through project-based mechanisms. The most important mechanism to date is the Clean Devel-opment Mechanism, although voluntary schemes are an-other viable option.
At present, the compliance market is by far the largest mar-ket and there is a possibility that REDD project credits will be included after 2012 under a successor agreement to or the extension of the Kyoto Protocol, as well as in certain national or regional markets.
For REDD projects in Indonesia the voluntary market is at present the most important.
Voluntary marketsUnder voluntary trading, parties not bound by specific caps or regulations can voluntarily offset carbon emis-sions by investing in particular projects. Buyers in this
Box 4: Carbon Markets
market are from both developed and developing coun-tries and can for example be governments, organizations and individuals.
In this market, purchases are mainly driven by corporate social responsibility (CSR) or anticipation of future compli-ance demand and initiatives. For example some compa-nies seek to be regarded as ”carbon neutral”, while some individuals aim to make their own behavior carbon neutral when air travelers purchase carbon offsets.
There are a growing number of voluntary market options including over-the-counter (OTC) deals and more transpar-ent trading platforms, such as the Climate Action Reserve of the United States. Important in the voluntary markets are third party certification standards such as the Volun-tary Carbon Standard (VCS) and the Gold Standard, as well as some developed with emphasis on community and bio-diversity co-benefits, such as the Climate, Community & Biodiversity Alliance (CCBA) standard. The VCS and CCBA standards are most popular among REDD project propo-nents in developing countries.
Carbon prices differ depending on which compliance or voluntary market is used, but below are some indicative values for forest projects, which include REDD, afforesta-tion and reforestation projects.
For REDD project credits traded over-the-counter the aver-age price ranged from USD 9.43/tCO2 to USD 17/tCO2 with a weighted price average of USD 13.33 (data from REDD projects from 1990-2009 (Hamilton et al. 2009)).
Market
Overall rangeOverall average1
Compliance market average2
Voluntary OTC
Price USD/tCO2
0.65-50.007.8810.248.44
1. Volume-weighted average2. Volume-weighted average for NSW GGAS, CDM, AAU’s and NZ ETS.
A rice field in Beutong, Aceh (Perry van Duijnhoven)

52 53
HydrogeologyMost of the Sumatran orangutan's forests inlandoverlay very poor aquifers, meaning the foreststhemselves are the main regulator of waterresources for downstream agriculture.
Aquifer productivity
HighModerateLocally productiveLowNoneNo data
Orangutan distribution
Map 23
North Sumatra’s (BPS 2010b, c). Since most agricultural activi-ties occur on the flat coastal and alluvial plains, the integrity and sustainability of the water ecosystem services provided by the inland and upland forests is of paramount importance to the millions of people they support in these lowland regions. The forest’s ability to capture and hold water is vital, since it slows and regulates its release. The area where orangutans occur over-laps with 44 large water catchment areas and is thus very im-portant to guarantee proper functioning of ecosystem services related to water (Map 24).
“Up to 45% of the largest cities in the world depend to some extent on forested water catchment areas for their water supply.”(Dudley and Stolton 2005)
Residents in both Aceh and North Sumatra have reported ma-jor reductions in river discharge over recent decades, which they attribute to the logging of upstream forests, negatively affecting freshwater fisheries and agricultural water resources. The same communities also report significantly reduced rice yields during the same period. One study reports that in 2000 approximately 50 percent of the streams in Aceh had less than 50% of the water flow in the springtime compared to 1990. Approximately 20% of the flows are reported to have been completely dry throughout the year. For North Sumatra the situation is comparable: on aver-age 80% of the rivers contain less than 50% of the usual water flow compared to 10 years ago and approximately 15% of the riv-ers had completely fallen dry (LMU 2000). Water shortages can have direct impacts on agriculture, as in 1998 when over 5,000 ha
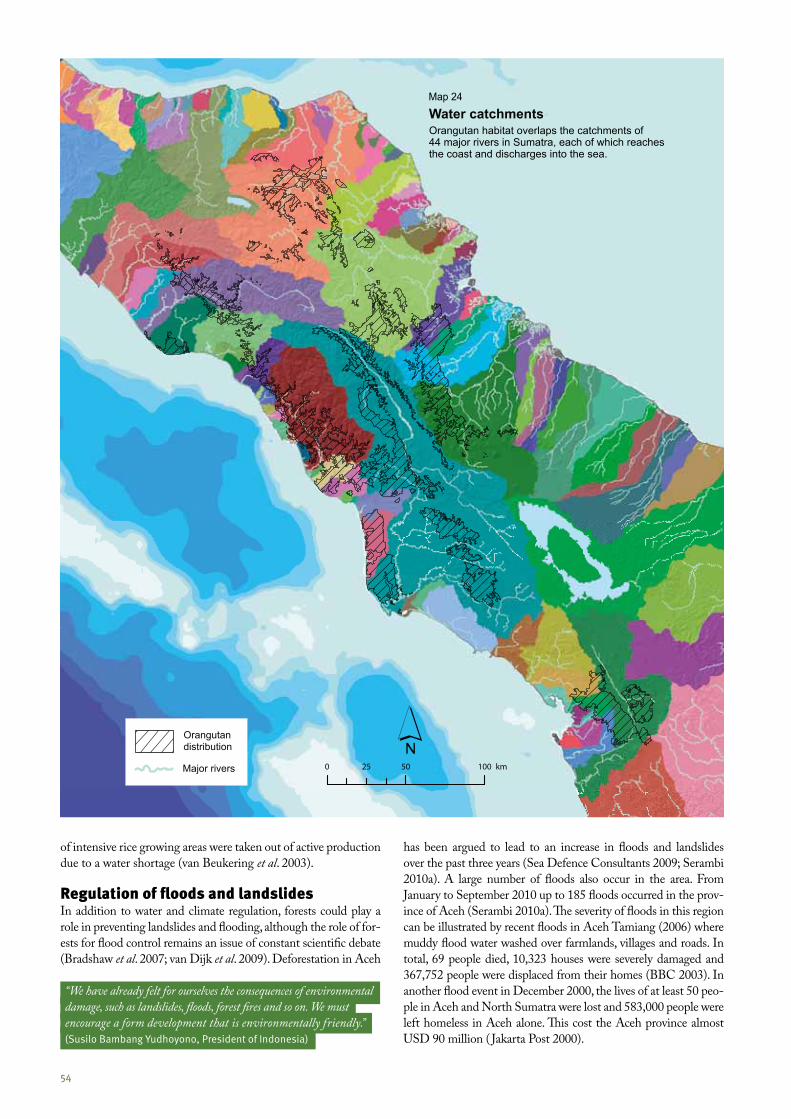
54 55
Water catchmentsOrangutan habitat overlaps the catchments of 44 major rivers in Sumatra, each of which reaches the coast and discharges into the sea.
Orangutan distribution
Major rivers
of intensive rice growing areas were taken out of active production due to a water shortage (van Beukering et al. 2003). Regulation of floods and landslidesIn addition to water and climate regulation, forests could play a role in preventing landslides and flooding, although the role of for-ests for flood control remains an issue of constant scientific debate (Bradshaw et al. 2007; van Dijk et al. 2009). Deforestation in Aceh
has been argued to lead to an increase in floods and landslides over the past three years (Sea Defence Consultants 2009; Serambi 2010a). A large number of floods also occur in the area. From January to September 2010 up to 185 floods occurred in the prov-ince of Aceh (Serambi 2010a). The severity of floods in this region can be illustrated by recent floods in Aceh Tamiang (2006) where muddy flood water washed over farmlands, villages and roads. In total, 69 people died, 10,323 houses were severely damaged and 367,752 people were displaced from their homes (BBC 2003). In another flood event in December 2000, the lives of at least 50 peo-ple in Aceh and North Sumatra were lost and 583,000 people were left homeless in Aceh alone. This cost the Aceh province almost USD 90 million ( Jakarta Post 2000).
Map 24
“We have already felt for ourselves the consequences of environmental damage, such as landslides, floods, forest fires and so on. We must encourage a form development that is environmentally friendly.”(Susilo Bambang Yudhoyono, President of Indonesia)

54 55
A washed away road near Beutung, Aceh (Perry van Duijnhoven)
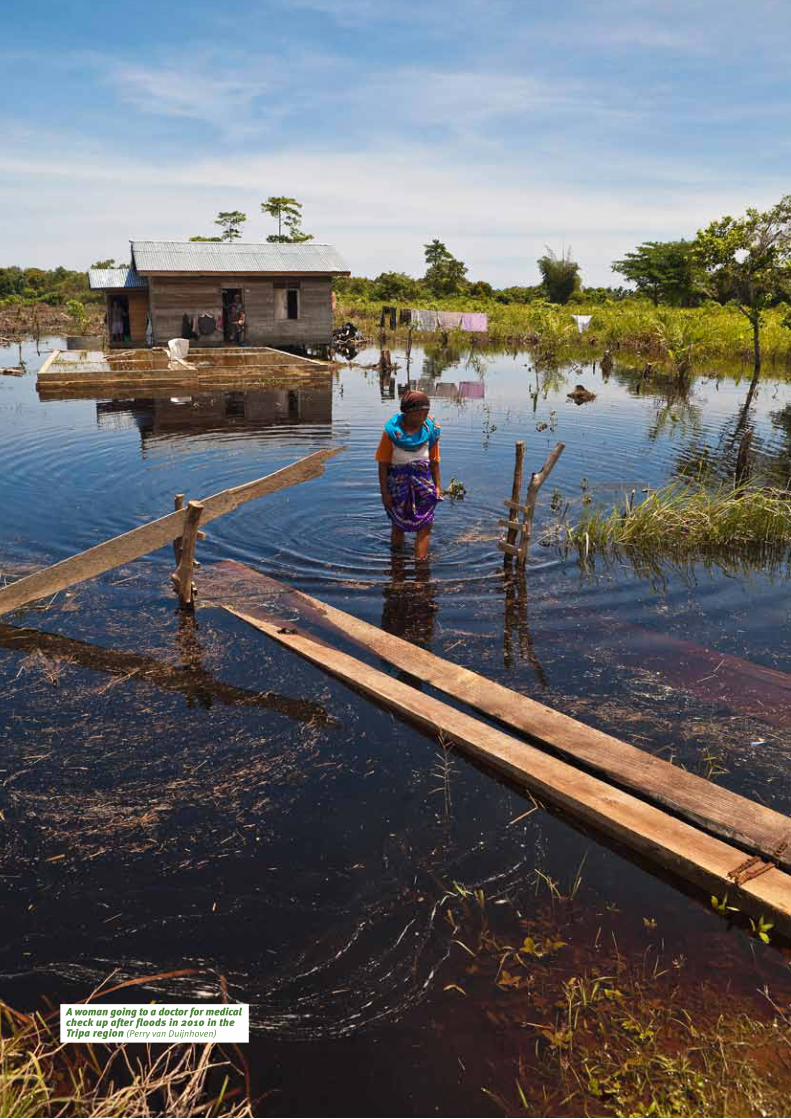
56 57
A woman going to a doctor for medical check up after floods in 2010 in the Tripa region (Perry van Duijnhoven)
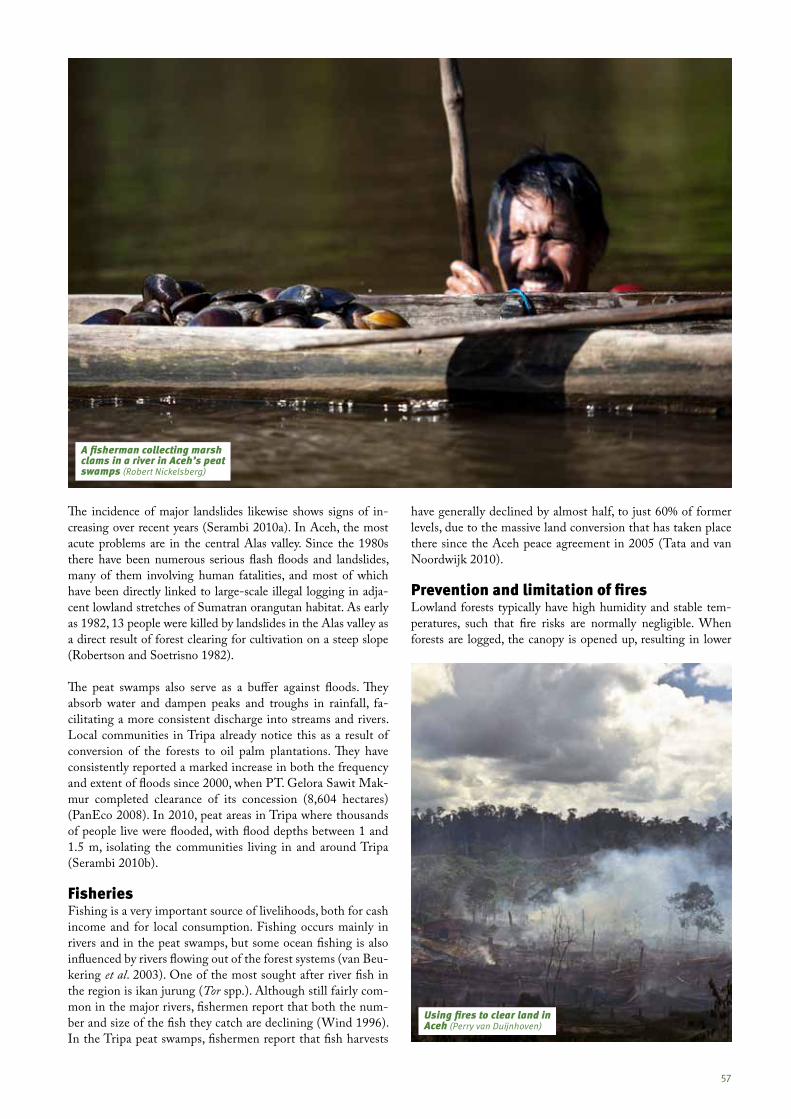
56 57
The incidence of major landslides likewise shows signs of in-creasing over recent years (Serambi 2010a). In Aceh, the most acute problems are in the central Alas valley. Since the 1980s there have been numerous serious flash floods and landslides, many of them involving human fatalities, and most of which have been directly linked to large-scale illegal logging in adja-cent lowland stretches of Sumatran orangutan habitat. As early as 1982, 13 people were killed by landslides in the Alas valley as a direct result of forest clearing for cultivation on a steep slope (Robertson and Soetrisno 1982).
The peat swamps also serve as a buffer against floods. They absorb water and dampen peaks and troughs in rainfall, fa-cilitating a more consistent discharge into streams and rivers. Local communities in Tripa already notice this as a result of conversion of the forests to oil palm plantations. They have consistently reported a marked increase in both the frequency and extent of floods since 2000, when PT. Gelora Sawit Mak-mur completed clearance of its concession (8,604 hectares) (PanEco 2008). In 2010, peat areas in Tripa where thousands of people live were flooded, with flood depths between 1 and 1.5 m, isolating the communities living in and around Tripa (Serambi 2010b).
FisheriesFishing is a very important source of livelihoods, both for cash income and for local consumption. Fishing occurs mainly in rivers and in the peat swamps, but some ocean fishing is also influenced by rivers flowing out of the forest systems (van Beu-kering et al. 2003). One of the most sought after river fish in the region is ikan jurung (Tor spp.). Although still fairly com-mon in the major rivers, fishermen report that both the num-ber and size of the fish they catch are declining (Wind 1996). In the Tripa peat swamps, fishermen report that fish harvests
have generally declined by almost half, to just 60% of former levels, due to the massive land conversion that has taken place there since the Aceh peace agreement in 2005 (Tata and van Noordwijk 2010).
Prevention and limitation of firesLowland forests typically have high humidity and stable tem-peratures, such that fire risks are normally negligible. When forests are logged, the canopy is opened up, resulting in lower
Using fires to clear land in Aceh (Perry van Duijnhoven)
A fisherman collecting marsh clams in a river in Aceh’s peat swamps (Robert Nickelsberg)
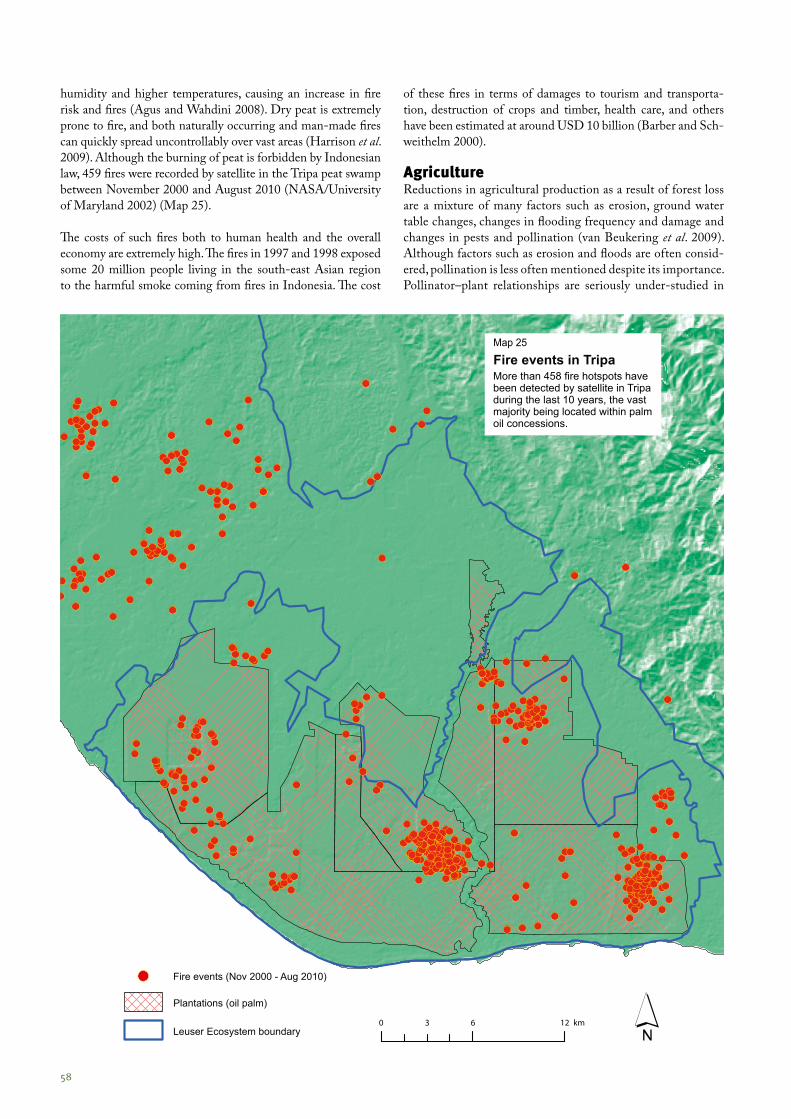
58 59
Fire events (Nov 2000 - Aug 2010)
Plantations (oil palm)
Leuser Ecosystem boundary
Fire events in TripaMore than 458 fire hotspots have been detected by satellite in Tripa during the last 10 years, the vast majority being located within palm oil concessions.
humidity and higher temperatures, causing an increase in fire risk and fires (Agus and Wahdini 2008). Dry peat is extremely prone to fire, and both naturally occurring and man-made fires can quickly spread uncontrollably over vast areas (Harrison et al. 2009). Although the burning of peat is forbidden by Indonesian law, 459 fires were recorded by satellite in the Tripa peat swamp between November 2000 and August 2010 (NASA/University of Maryland 2002) (Map 25).
The costs of such fires both to human health and the overall economy are extremely high. The fires in 1997 and 1998 exposed some 20 million people living in the south-east Asian region to the harmful smoke coming from fires in Indonesia. The cost
of these fires in terms of damages to tourism and transporta-tion, destruction of crops and timber, health care, and others have been estimated at around USD 10 billion (Barber and Sch-weithelm 2000).
AgricultureReductions in agricultural production as a result of forest loss are a mixture of many factors such as erosion, ground water table changes, changes in flooding frequency and damage and changes in pests and pollination (van Beukering et al. 2009). Although factors such as erosion and floods are often consid-ered, pollination is less often mentioned despite its importance. Pollinator–plant relationships are seriously under-studied in
Map 25
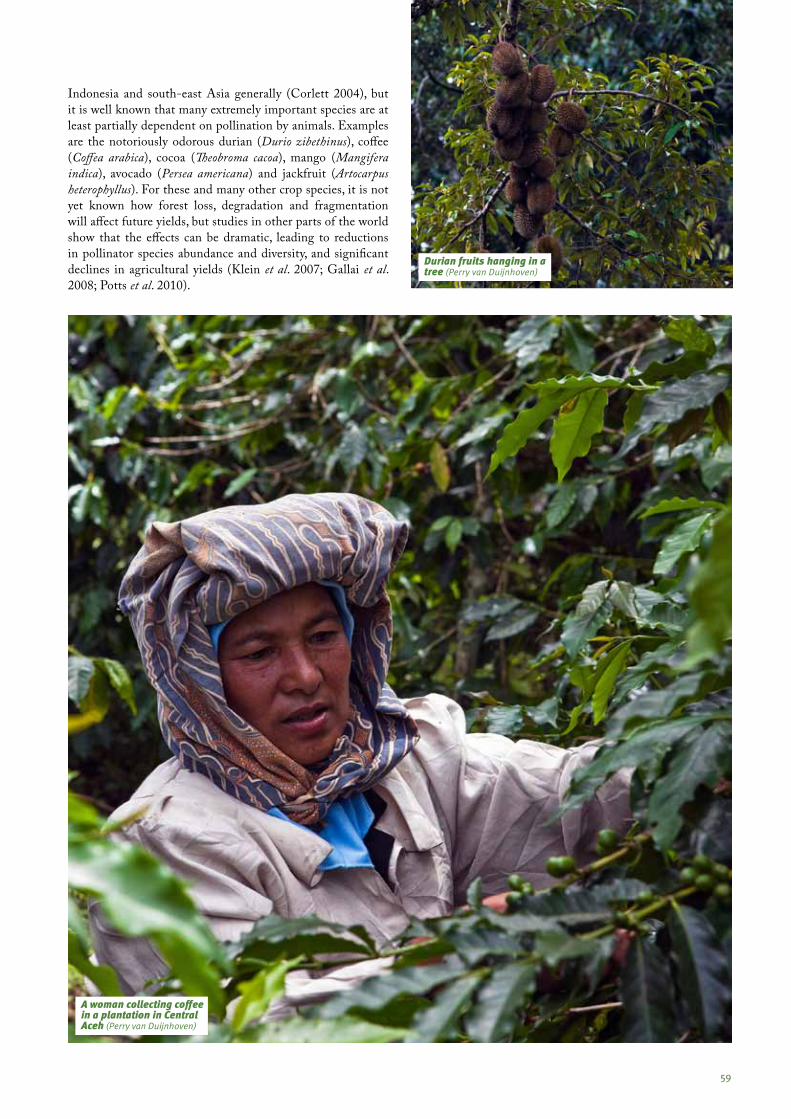
58 59
Indonesia and south-east Asia generally (Corlett 2004), but it is well known that many extremely important species are at least partially dependent on pollination by animals. Examples are the notoriously odorous durian (Durio zibethinus), coffee (Coffea arabica), cocoa (Theobroma cacoa), mango (Mangifera indica), avocado (Persea americana) and jackfruit (Artocarpus heterophyllus). For these and many other crop species, it is not yet known how forest loss, degradation and fragmentation will affect future yields, but studies in other parts of the world show that the effects can be dramatic, leading to reductions in pollinator species abundance and diversity, and significant declines in agricultural yields (Klein et al. 2007; Gallai et al. 2008; Potts et al. 2010).
A woman collecting coffee in a plantation in Central Aceh (Perry van Duijnhoven)
Durian fruits hanging in a tree (Perry van Duijnhoven)
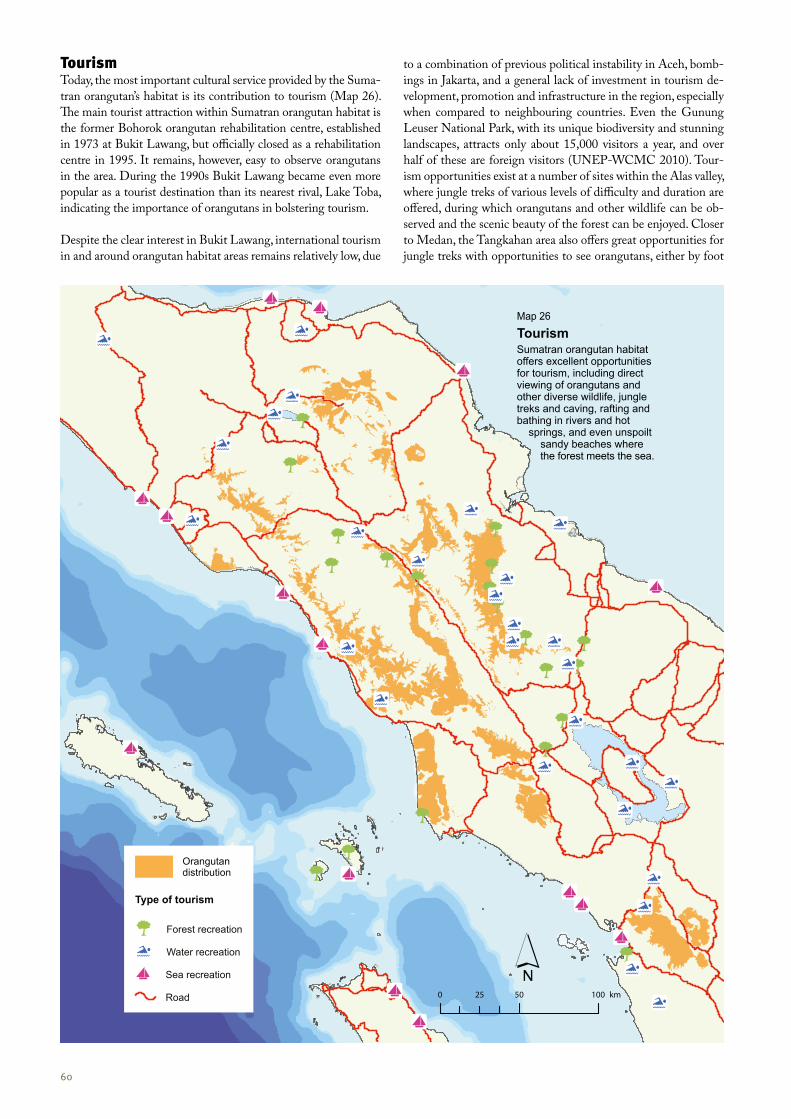
60 61
Type of tourism
Orangutan distribution
Forest recreation
Water recreation
Sea recreation
Road
TourismSumatran orangutan habitat offers excellent opportunities for tourism, including direct viewing of orangutans and other diverse wildlife, jungle treks and caving, rafting and bathing in rivers and hot springs, and even unspoilt sandy beaches where the forest meets the sea.
TourismToday, the most important cultural service provided by the Suma-tran orangutan’s habitat is its contribution to tourism (Map 26). The main tourist attraction within Sumatran orangutan habitat is the former Bohorok orangutan rehabilitation centre, established in 1973 at Bukit Lawang, but officially closed as a rehabilitation centre in 1995. It remains, however, easy to observe orangutans in the area. During the 1990s Bukit Lawang became even more popular as a tourist destination than its nearest rival, Lake Toba, indicating the importance of orangutans in bolstering tourism.
Despite the clear interest in Bukit Lawang, international tourism in and around orangutan habitat areas remains relatively low, due
to a combination of previous political instability in Aceh, bomb-ings in Jakarta, and a general lack of investment in tourism de-velopment, promotion and infrastructure in the region, especially when compared to neighbouring countries. Even the Gunung Leuser National Park, with its unique biodiversity and stunning landscapes, attracts only about 15,000 visitors a year, and over half of these are foreign visitors (UNEP-WCMC 2010). Tour-ism opportunities exist at a number of sites within the Alas valley, where jungle treks of various levels of difficulty and duration are offered, during which orangutans and other wildlife can be ob-served and the scenic beauty of the forest can be enjoyed. Closer to Medan, the Tangkahan area also offers great opportunities for jungle treks with opportunities to see orangutans, either by foot
Map 26
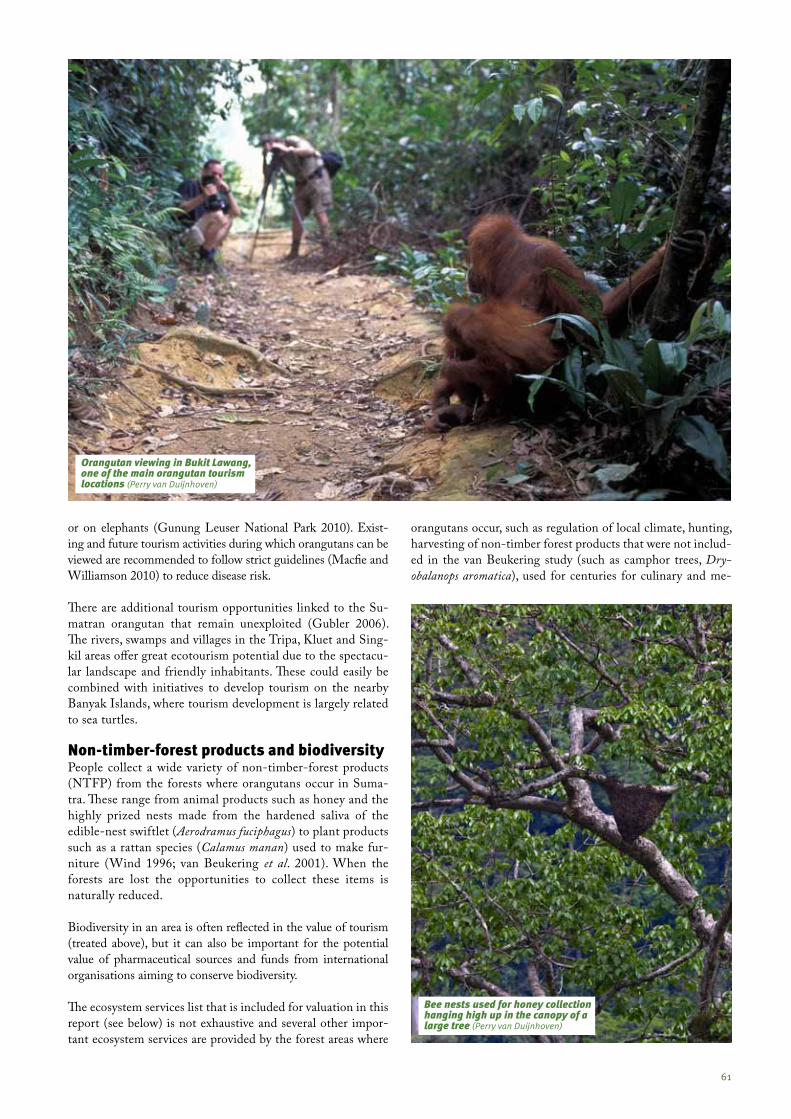
60 61
or on elephants (Gunung Leuser National Park 2010). Exist-ing and future tourism activities during which orangutans can be viewed are recommended to follow strict guidelines (Macfie and Williamson 2010) to reduce disease risk.
There are additional tourism opportunities linked to the Su-matran orangutan that remain unexploited (Gubler 2006). The rivers, swamps and villages in the Tripa, Kluet and Sing-kil areas offer great ecotourism potential due to the spectacu-lar landscape and friendly inhabitants. These could easily be combined with initiatives to develop tourism on the nearby Banyak Islands, where tourism development is largely related to sea turtles.
Nontimberforest products and biodiversityPeople collect a wide variety of non-timber-forest products (NTFP) from the forests where orangutans occur in Suma-tra. These range from animal products such as honey and the highly prized nests made from the hardened saliva of the edible-nest swiftlet (Aerodramus fuciphagus) to plant products such as a rattan species (Calamus manan) used to make fur-niture (Wind 1996; van Beukering et al. 2001). When the forests are lost the opportunities to collect these items is naturally reduced.
Biodiversity in an area is often reflected in the value of tourism (treated above), but it can also be important for the potential value of pharmaceutical sources and funds from international organisations aiming to conserve biodiversity.
The ecosystem services list that is included for valuation in this report (see below) is not exhaustive and several other impor-tant ecosystem services are provided by the forest areas where
orangutans occur, such as regulation of local climate, hunting, harvesting of non-timber forest products that were not includ-ed in the van Beukering study (such as camphor trees, Dry-obalanops aromatica), used for centuries for culinary and me-
Bee nests used for honey collection hanging high up in the canopy of a large tree (Perry van Duijnhoven)
Orangutan viewing in Bukit Lawang, one of the main orangutan tourism locations (Perry van Duijnhoven)
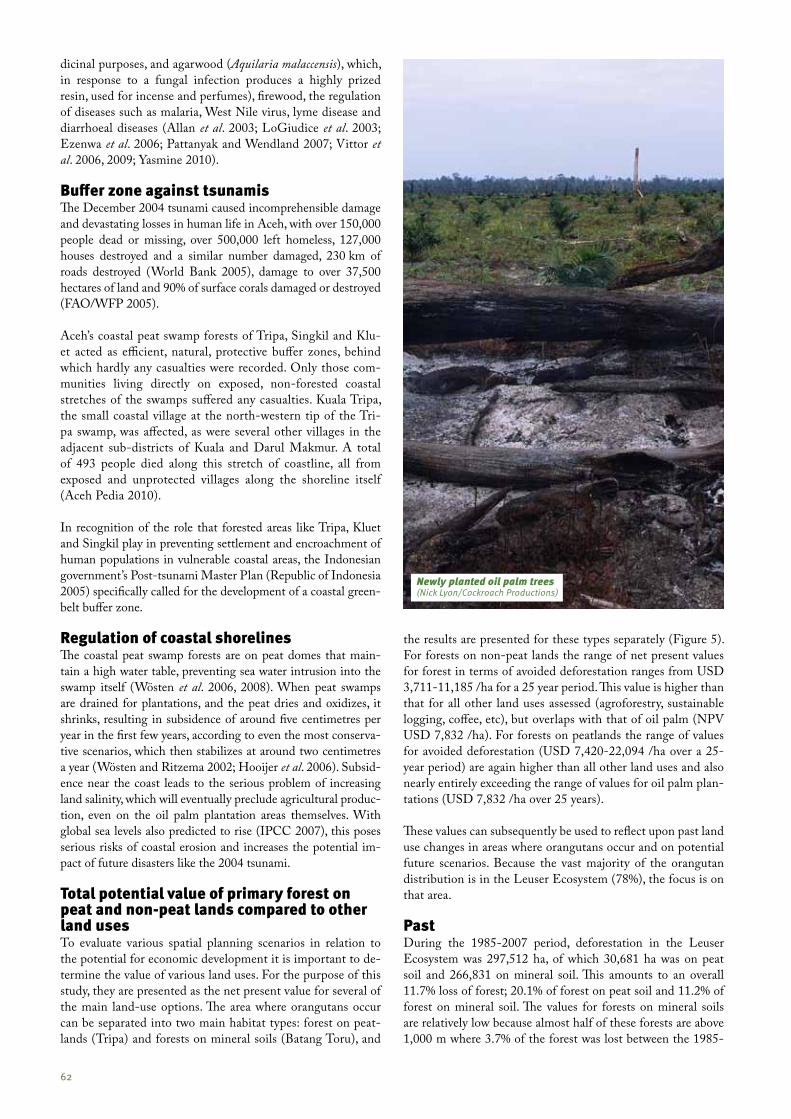
62 63
dicinal purposes, and agarwood (Aquilaria malaccensis), which, in response to a fungal infection produces a highly prized resin, used for incense and perfumes), firewood, the regulation of diseases such as malaria, West Nile virus, lyme disease and diarrhoeal diseases (Allan et al. 2003; LoGiudice et al. 2003; Ezenwa et al. 2006; Pattanyak and Wendland 2007; Vittor et al. 2006, 2009; Yasmine 2010).
Buffer zone against tsunamisThe December 2004 tsunami caused incomprehensible damage and devastating losses in human life in Aceh, with over 150,000 people dead or missing, over 500,000 left homeless, 127,000 houses destroyed and a similar number damaged, 230 km of roads destroyed (World Bank 2005), damage to over 37,500 hectares of land and 90% of surface corals damaged or destroyed (FAO/WFP 2005).
Aceh’s coastal peat swamp forests of Tripa, Singkil and Klu-et acted as efficient, natural, protective buffer zones, behind which hardly any casualties were recorded. Only those com-munities living directly on exposed, non-forested coastal stretches of the swamps suffered any casualties. Kuala Tripa, the small coastal village at the north-western tip of the Tri-pa swamp, was affected, as were several other villages in the adjacent sub-districts of Kuala and Darul Makmur. A total of 493 people died along this stretch of coastline, all from exposed and unprotected villages along the shoreline itself (Aceh Pedia 2010).
In recognition of the role that forested areas like Tripa, Kluet and Singkil play in preventing settlement and encroachment of human populations in vulnerable coastal areas, the Indonesian government’s Post-tsunami Master Plan (Republic of Indonesia 2005) specifically called for the development of a coastal green-belt buffer zone.
Regulation of coastal shorelinesThe coastal peat swamp forests are on peat domes that main-tain a high water table, preventing sea water intrusion into the swamp itself (Wösten et al. 2006, 2008). When peat swamps are drained for plantations, and the peat dries and oxidizes, it shrinks, resulting in subsidence of around five centimetres per year in the first few years, according to even the most conserva-tive scenarios, which then stabilizes at around two centimetres a year (Wösten and Ritzema 2002; Hooijer et al. 2006). Subsid-ence near the coast leads to the serious problem of increasing land salinity, which will eventually preclude agricultural produc-tion, even on the oil palm plantation areas themselves. With global sea levels also predicted to rise (IPCC 2007), this poses serious risks of coastal erosion and increases the potential im-pact of future disasters like the 2004 tsunami.
Total potential value of primary forest on peat and nonpeat lands compared to other land usesTo evaluate various spatial planning scenarios in relation to the potential for economic development it is important to de-termine the value of various land uses. For the purpose of this study, they are presented as the net present value for several of the main land-use options. The area where orangutans occur can be separated into two main habitat types: forest on peat-lands (Tripa) and forests on mineral soils (Batang Toru), and
the results are presented for these types separately (Figure 5). For forests on non-peat lands the range of net present values for forest in terms of avoided deforestation ranges from USD 3,711-11,185 /ha for a 25 year period. This value is higher than that for all other land uses assessed (agroforestry, sustainable logging, coffee, etc), but overlaps with that of oil palm (NPV USD 7,832 /ha). For forests on peatlands the range of values for avoided deforestation (USD 7,420-22,094 /ha over a 25-year period) are again higher than all other land uses and also nearly entirely exceeding the range of values for oil palm plan-tations (USD 7,832 /ha over 25 years).
These values can subsequently be used to reflect upon past land use changes in areas where orangutans occur and on potential future scenarios. Because the vast majority of the orangutan distribution is in the Leuser Ecosystem (78%), the focus is on that area.
PastDuring the 1985-2007 period, deforestation in the Leuser Ecosystem was 297,512 ha, of which 30,681 ha was on peat soil and 266,831 on mineral soil. This amounts to an overall 11.7% loss of forest; 20.1% of forest on peat soil and 11.2% of forest on mineral soil. The values for forests on mineral soils are relatively low because almost half of these forests are above 1,000 m where 3.7% of the forest was lost between the 1985-
Newly planted oil palm trees (Nick Lyon/Cockroach Productions)
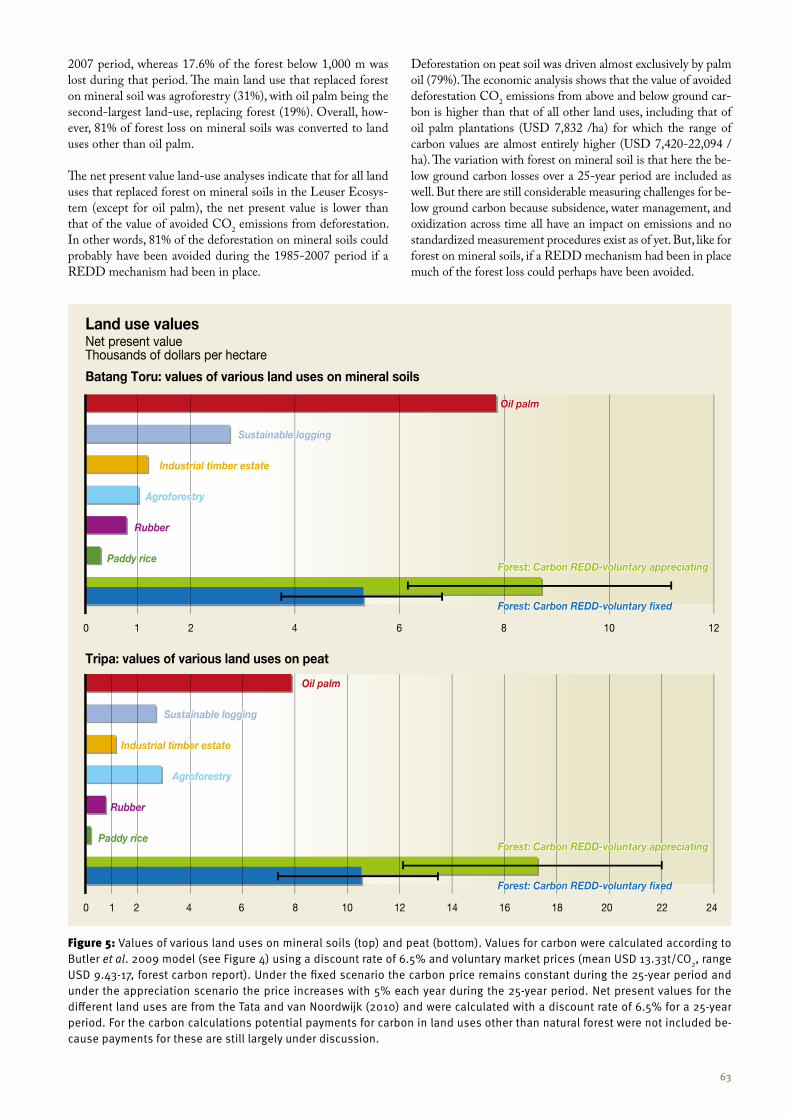
62 63
Figure 5: Values of various land uses on mineral soils (top) and peat (bottom). Values for carbon were calculated according to Butler et al. 2009 model (see Figure 4) using a discount rate of 6.5% and voluntary market prices (mean USD 13.33t/CO2, range USD 9.43-17, forest carbon report). Under the fixed scenario the carbon price remains constant during the 25-year period and under the appreciation scenario the price increases with 5% each year during the 25-year period. Net present values for the different land uses are from the Tata and van Noordwijk (2010) and were calculated with a discount rate of 6.5% for a 25-year period. For the carbon calculations potential payments for carbon in land uses other than natural forest were not included be-cause payments for these are still largely under discussion.
Land use values
Batang Toru: values of various land uses on mineral soils
Net present valueThousands of dollars per hectare
10 12864210
Oil palm
Sustainable logging
Industrial timber estate
Agroforestry
Rubber
Paddy riceForest: Carbon REDD-voluntary appreciating
Forest: Carbon REDD-voluntary fixed
Tripa: values of various land uses on peat
20 2416128421 6 10 14 18 220
Oil palm
Sustainable logging
Industrial timber estate
Agroforestry
Rubber
Paddy riceForest: Carbon REDD-voluntary appreciating
Forest: Carbon REDD-voluntary fixed
2007 period, whereas 17.6% of the forest below 1,000 m was lost during that period. The main land use that replaced forest on mineral soil was agroforestry (31%), with oil palm being the second-largest land-use, replacing forest (19%). Overall, how-ever, 81% of forest loss on mineral soils was converted to land uses other than oil palm.
The net present value land-use analyses indicate that for all land uses that replaced forest on mineral soils in the Leuser Ecosys-tem (except for oil palm), the net present value is lower than that of the value of avoided CO2 emissions from deforestation. In other words, 81% of the deforestation on mineral soils could probably have been avoided during the 1985-2007 period if a REDD mechanism had been in place.
Deforestation on peat soil was driven almost exclusively by palm oil (79%). The economic analysis shows that the value of avoided deforestation CO2 emissions from above and below ground car-bon is higher than that of all other land uses, including that of oil palm plantations (USD 7,832 /ha) for which the range of carbon values are almost entirely higher (USD 7,420-22,094 /ha). The variation with forest on mineral soil is that here the be-low ground carbon losses over a 25-year period are included as well. But there are still considerable measuring challenges for be-low ground carbon because subsidence, water management, and oxidization across time all have an impact on emissions and no standardized measurement procedures exist as of yet. But, like for forest on mineral soils, if a REDD mechanism had been in place much of the forest loss could perhaps have been avoided.
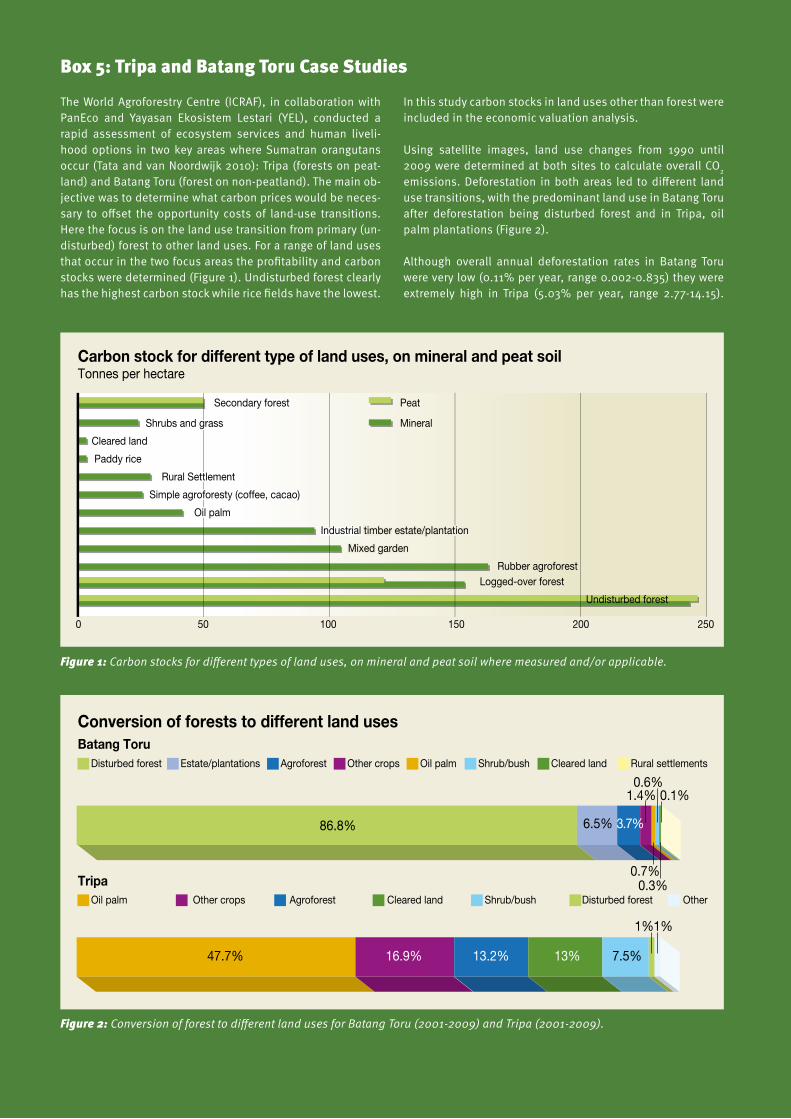
64 65
The World Agroforestry Centre (ICRAF), in collaboration with PanEco and Yayasan Ekosistem Lestari (YEL), conducted a rapid assessment of ecosystem services and human liveli-hood options in two key areas where Sumatran orangutans occur (Tata and van Noordwijk 2010): Tripa (forests on peat-land) and Batang Toru (forest on non-peatland). The main ob-jective was to determine what carbon prices would be neces-sary to offset the opportunity costs of land-use transitions. Here the focus is on the land use transition from primary (un-disturbed) forest to other land uses. For a range of land uses that occur in the two focus areas the profitability and carbon stocks were determined (Figure 1). Undisturbed forest clearly has the highest carbon stock while rice fields have the lowest.
Figure 1: Carbon stocks for different types of land uses, on mineral and peat soil where measured and/or applicable.
Figure 2: Conversion of forest to different land uses for Batang Toru (2001-2009) and Tripa (2001-2009).
In this study carbon stocks in land uses other than forest were included in the economic valuation analysis.
Using satellite images, land use changes from 1990 until 2009 were determined at both sites to calculate overall CO2 emissions. Deforestation in both areas led to different land use transitions, with the predominant land use in Batang Toru after deforestation being disturbed forest and in Tripa, oil palm plantations (Figure 2).
Although overall annual deforestation rates in Batang Toru were very low (0.11% per year, range 0.002-0.835) they were extremely high in Tripa (5.03% per year, range 2.77-14.15).
Carbon stock for different type of land uses, on mineral and peat soilTonnes per hectare
200 250150100500
Secondary forest
Shrubs and grass
Peat
Mineral
Cleared land
Paddy rice
Rural Settlement
Simple agroforesty (coffee, cacao)
Oil palm
Industrial timber estate/plantation
Mixed garden
Rubber agroforestLogged-over forest
Undisturbed forest
Conversion of forests to different land uses
Disturbed forest Estate/plantations Agroforest Other crops Oil palm Shrub/bush Cleared land Rural settlements
Oil palm Other crops Agroforest Cleared land Shrub/bush Disturbed forest Other
86.8%
47.7% 16.9% 13.2% 13% 7.5%
1%1%
6.5%
1.4%
0.7%0.3%
0.6%0.1%
3.7%
Batang Toru
Tripa
Box 5: Tripa and Batang Toru Case Studies
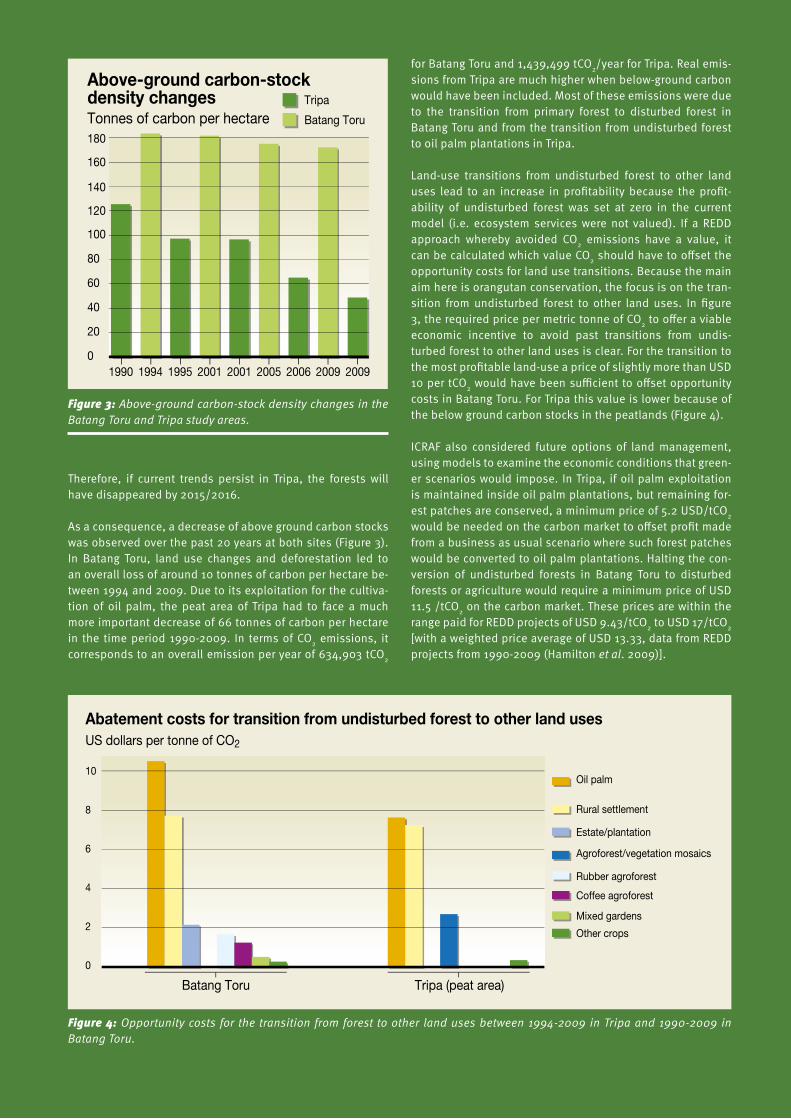
64 65
Figure 3: Above-ground carbon-stock density changes in the Batang Toru and Tripa study areas.
Figure 4: Opportunity costs for the transition from forest to other land uses between 1994-2009 in Tripa and 1990-2009 in Batang Toru.
Therefore, if current trends persist in Tripa, the forests will have disappeared by 2015/2016.
As a consequence, a decrease of above ground carbon stocks was observed over the past 20 years at both sites (Figure 3). In Batang Toru, land use changes and deforestation led to an overall loss of around 10 tonnes of carbon per hectare be-tween 1994 and 2009. Due to its exploitation for the cultiva-tion of oil palm, the peat area of Tripa had to face a much more important decrease of 66 tonnes of carbon per hectare in the time period 1990-2009. In terms of CO2 emissions, it corresponds to an overall emission per year of 634,903 tCO2
for Batang Toru and 1,439,499 tCO2/year for Tripa. Real emis-sions from Tripa are much higher when below-ground carbon would have been included. Most of these emissions were due to the transition from primary forest to disturbed forest in Batang Toru and from the transition from undisturbed forest to oil palm plantations in Tripa.
Land-use transitions from undisturbed forest to other land uses lead to an increase in profitability because the profit-ability of undisturbed forest was set at zero in the current model (i.e. ecosystem services were not valued). If a REDD approach whereby avoided CO2 emissions have a value, it can be calculated which value CO2 should have to offset the opportunity costs for land use transitions. Because the main aim here is orangutan conservation, the focus is on the tran-sition from undisturbed forest to other land uses. In figure 3, the required price per metric tonne of CO2 to offer a viable economic incentive to avoid past transitions from undis-turbed forest to other land uses is clear. For the transition to the most profitable land-use a price of slightly more than USD 10 per tCO2 would have been sufficient to offset opportunity costs in Batang Toru. For Tripa this value is lower because of the below ground carbon stocks in the peatlands (Figure 4).
ICRAF also considered future options of land management, using models to examine the economic conditions that green-er scenarios would impose. In Tripa, if oil palm exploitation is maintained inside oil palm plantations, but remaining for-est patches are conserved, a minimum price of 5.2 USD/tCO2 would be needed on the carbon market to offset profit made from a business as usual scenario where such forest patches would be converted to oil palm plantations. Halting the con-version of undisturbed forests in Batang Toru to disturbed forests or agriculture would require a minimum price of USD 11.5 /tCO2 on the carbon market. These prices are within the range paid for REDD projects of USD 9.43/tCO2 to USD 17/tCO2 [with a weighted price average of USD 13.33, data from REDD projects from 1990-2009 (Hamilton et al. 2009)].
Abatement costs for transition from undisturbed forest to other land usesUS dollars per tonne of CO2
Batang Toru Tripa (peat area)
10
8
6
4
2
0
Mixed gardens
Rural settlement
Agroforest/vegetation mosaics
Other crops
Oil palm
Estate/plantation
Coffee agroforest
Rubber agroforest
Above-ground carbon-stock density changes Tonnes of carbon per hectare
Tripa
1990 1994 1995 2005 200620012001 2009 2009
Batang Toru
100
120
140
160
180
80
60
40
20
0
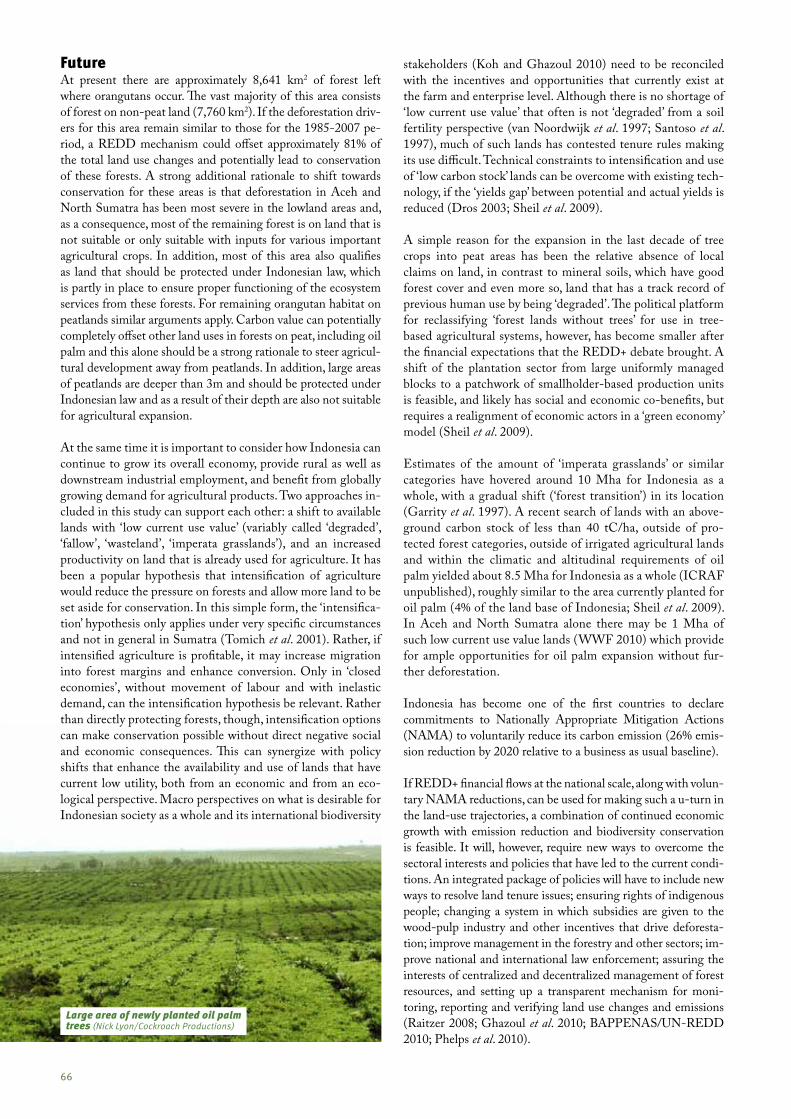
66 67
Future At present there are approximately 8,641 km2 of forest left where orangutans occur. The vast majority of this area consists of forest on non-peat land (7,760 km2). If the deforestation driv-ers for this area remain similar to those for the 1985-2007 pe-riod, a REDD mechanism could offset approximately 81% of the total land use changes and potentially lead to conservation of these forests. A strong additional rationale to shift towards conservation for these areas is that deforestation in Aceh and North Sumatra has been most severe in the lowland areas and, as a consequence, most of the remaining forest is on land that is not suitable or only suitable with inputs for various important agricultural crops. In addition, most of this area also qualifies as land that should be protected under Indonesian law, which is partly in place to ensure proper functioning of the ecosystem services from these forests. For remaining orangutan habitat on peatlands similar arguments apply. Carbon value can potentially completely offset other land uses in forests on peat, including oil palm and this alone should be a strong rationale to steer agricul-tural development away from peatlands. In addition, large areas of peatlands are deeper than 3m and should be protected under Indonesian law and as a result of their depth are also not suitable for agricultural expansion.
At the same time it is important to consider how Indonesia can continue to grow its overall economy, provide rural as well as downstream industrial employment, and benefit from globally growing demand for agricultural products. Two approaches in-cluded in this study can support each other: a shift to available lands with ‘low current use value’ (variably called ‘degraded’, ‘fallow’, ‘wasteland’, ‘imperata grasslands’), and an increased productivity on land that is already used for agriculture. It has been a popular hypothesis that intensification of agriculture would reduce the pressure on forests and allow more land to be set aside for conservation. In this simple form, the ‘intensifica-tion’ hypothesis only applies under very specific circumstances and not in general in Sumatra (Tomich et al. 2001). Rather, if intensified agriculture is profitable, it may increase migration into forest margins and enhance conversion. Only in ‘closed economies’, without movement of labour and with inelastic demand, can the intensification hypothesis be relevant. Rather than directly protecting forests, though, intensification options can make conservation possible without direct negative social and economic consequences. This can synergize with policy shifts that enhance the availability and use of lands that have current low utility, both from an economic and from an eco-logical perspective. Macro perspectives on what is desirable for Indonesian society as a whole and its international biodiversity
stakeholders (Koh and Ghazoul 2010) need to be reconciled with the incentives and opportunities that currently exist at the farm and enterprise level. Although there is no shortage of ‘low current use value’ that often is not ‘degraded’ from a soil fertility perspective (van Noordwijk et al. 1997; Santoso et al. 1997), much of such lands has contested tenure rules making its use difficult. Technical constraints to intensification and use of ‘low carbon stock’ lands can be overcome with existing tech-nology, if the ‘yields gap’ between potential and actual yields is reduced (Dros 2003; Sheil et al. 2009).
A simple reason for the expansion in the last decade of tree crops into peat areas has been the relative absence of local claims on land, in contrast to mineral soils, which have good forest cover and even more so, land that has a track record of previous human use by being ‘degraded’. The political platform for reclassifying ‘forest lands without trees’ for use in tree-based agricultural systems, however, has become smaller after the financial expectations that the REDD+ debate brought. A shift of the plantation sector from large uniformly managed blocks to a patchwork of smallholder-based production units is feasible, and likely has social and economic co-benefits, but requires a realignment of economic actors in a ‘green economy’ model (Sheil et al. 2009).
Estimates of the amount of ‘imperata grasslands’ or similar categories have hovered around 10 Mha for Indonesia as a whole, with a gradual shift (‘forest transition’) in its location (Garrity et al. 1997). A recent search of lands with an above-ground carbon stock of less than 40 tC/ha, outside of pro-tected forest categories, outside of irrigated agricultural lands and within the climatic and altitudinal requirements of oil palm yielded about 8.5 Mha for Indonesia as a whole (ICRAF unpublished), roughly similar to the area currently planted for oil palm (4% of the land base of Indonesia; Sheil et al. 2009). In Aceh and North Sumatra alone there may be 1 Mha of such low current use value lands (WWF 2010) which provide for ample opportunities for oil palm expansion without fur-ther deforestation.
Indonesia has become one of the first countries to declare commitments to Nationally Appropriate Mitigation Actions (NAMA) to voluntarily reduce its carbon emission (26% emis-sion reduction by 2020 relative to a business as usual baseline).
If REDD+ financial flows at the national scale, along with volun-tary NAMA reductions, can be used for making such a u-turn in the land-use trajectories, a combination of continued economic growth with emission reduction and biodiversity conservation is feasible. It will, however, require new ways to overcome the sectoral interests and policies that have led to the current condi-tions. An integrated package of policies will have to include new ways to resolve land tenure issues; ensuring rights of indigenous people; changing a system in which subsidies are given to the wood-pulp industry and other incentives that drive deforesta-tion; improve management in the forestry and other sectors; im-prove national and international law enforcement; assuring the interests of centralized and decentralized management of forest resources, and setting up a transparent mechanism for moni-toring, reporting and verifying land use changes and emissions (Raitzer 2008; Ghazoul et al. 2010; BAPPENAS/UN-REDD 2010; Phelps et al. 2010).
Large area of newly planted oil palm trees (Nick Lyon/Cockroach Productions)
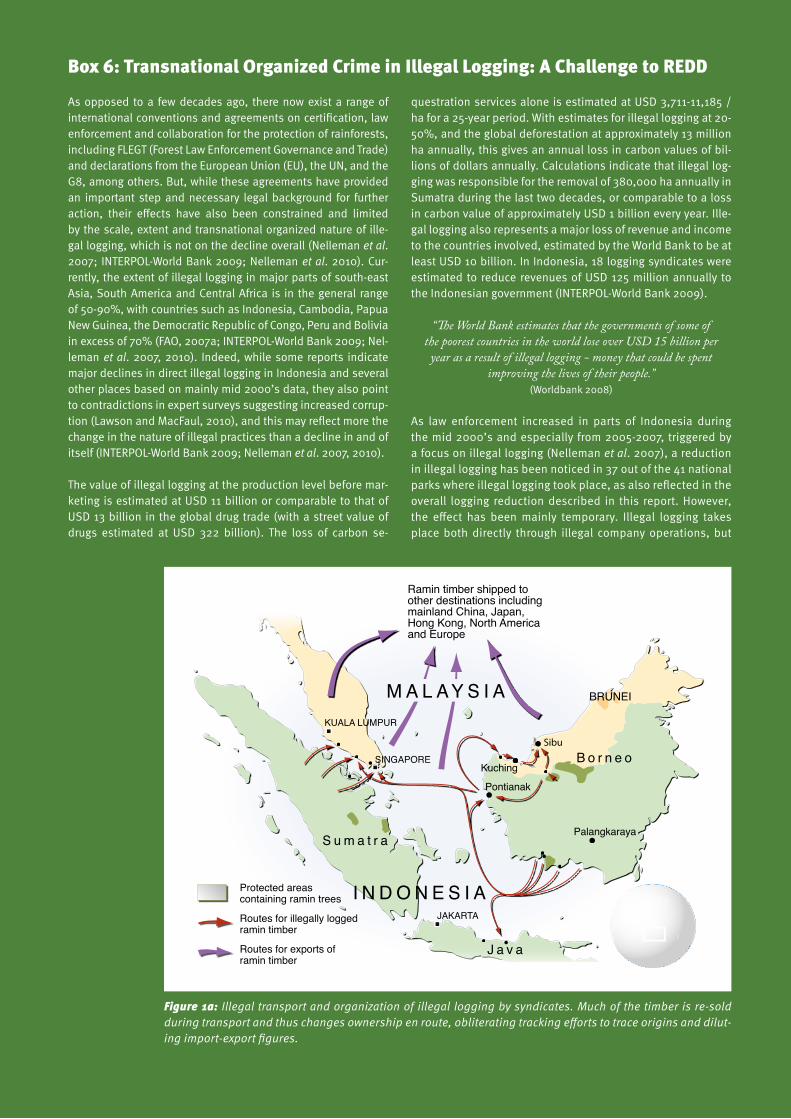
66 67
Figure 1a: Illegal transport and organization of illegal logging by syndicates. Much of the timber is re-sold during transport and thus changes ownership en route, obliterating tracking efforts to trace origins and dilut-ing import-export figures.
Box 6: Transnational Organized Crime in Illegal Logging: A Challenge to REDD
questration services alone is estimated at USD 3,711-11,185 /ha for a 25-year period. With estimates for illegal logging at 20-50%, and the global deforestation at approximately 13 million ha annually, this gives an annual loss in carbon values of bil-lions of dollars annually. Calculations indicate that illegal log-ging was responsible for the removal of 380,000 ha annually in Sumatra during the last two decades, or comparable to a loss in carbon value of approximately USD 1 billion every year. Ille-gal logging also represents a major loss of revenue and income to the countries involved, estimated by the World Bank to be at least USD 10 billion. In Indonesia, 18 logging syndicates were estimated to reduce revenues of USD 125 million annually to the Indonesian government (INTERPOL-World Bank 2009).
“The World Bank estimates that the governments of some of the poorest countries in the world lose over USD 15 billion per
year as a result of illegal logging - money that could be spent improving the lives of their people.”
(Worldbank 2008)
As law enforcement increased in parts of Indonesia during the mid 2000’s and especially from 2005-2007, triggered by a focus on illegal logging (Nelleman et al. 2007), a reduction in illegal logging has been noticed in 37 out of the 41 national parks where illegal logging took place, as also reflected in the overall logging reduction described in this report. However, the effect has been mainly temporary. Illegal logging takes place both directly through illegal company operations, but
As opposed to a few decades ago, there now exist a range of international conventions and agreements on certification, law enforcement and collaboration for the protection of rainforests, including FLEGT (Forest Law Enforcement Governance and Trade) and declarations from the European Union (EU), the UN, and the G8, among others. But, while these agreements have provided an important step and necessary legal background for further action, their effects have also been constrained and limited by the scale, extent and transnational organized nature of ille-gal logging, which is not on the decline overall (Nelleman et al. 2007; INTERPOL-World Bank 2009; Nelleman et al. 2010). Cur-rently, the extent of illegal logging in major parts of south-east Asia, South America and Central Africa is in the general range of 50-90%, with countries such as Indonesia, Cambodia, Papua New Guinea, the Democratic Republic of Congo, Peru and Bolivia in excess of 70% (FAO, 2007a; INTERPOL-World Bank 2009; Nel-leman et al. 2007, 2010). Indeed, while some reports indicate major declines in direct illegal logging in Indonesia and several other places based on mainly mid 2000’s data, they also point to contradictions in expert surveys suggesting increased corrup-tion (Lawson and MacFaul, 2010), and this may reflect more the change in the nature of illegal practices than a decline in and of itself (INTERPOL-World Bank 2009; Nelleman et al. 2007, 2010).
The value of illegal logging at the production level before mar-keting is estimated at USD 11 billion or comparable to that of USD 13 billion in the global drug trade (with a street value of drugs estimated at USD 322 billion). The loss of carbon se-
Ramin timber shipped to other destinations including mainland China, Japan, Hong Kong, North America and Europe
Protected areascontaining ramin trees
Routes for illegally loggedramin timber
Routes for exports oframin timber
JAKARTA
KUALA LUMPUR
SINGAPORE
I N D O N E S I A
M A L AY S I A BRUNEI
B o r n e o
S u m a t r a
J a v a
Palangkaraya
Pontianak
Kuching
Sibu
C
M
Y
CM
MY
CY
CMY
K
routes_for_exports_of_illegally_logged_ramin_timber_in_indonesia.pdf 1 4/8/11 3:42 AM
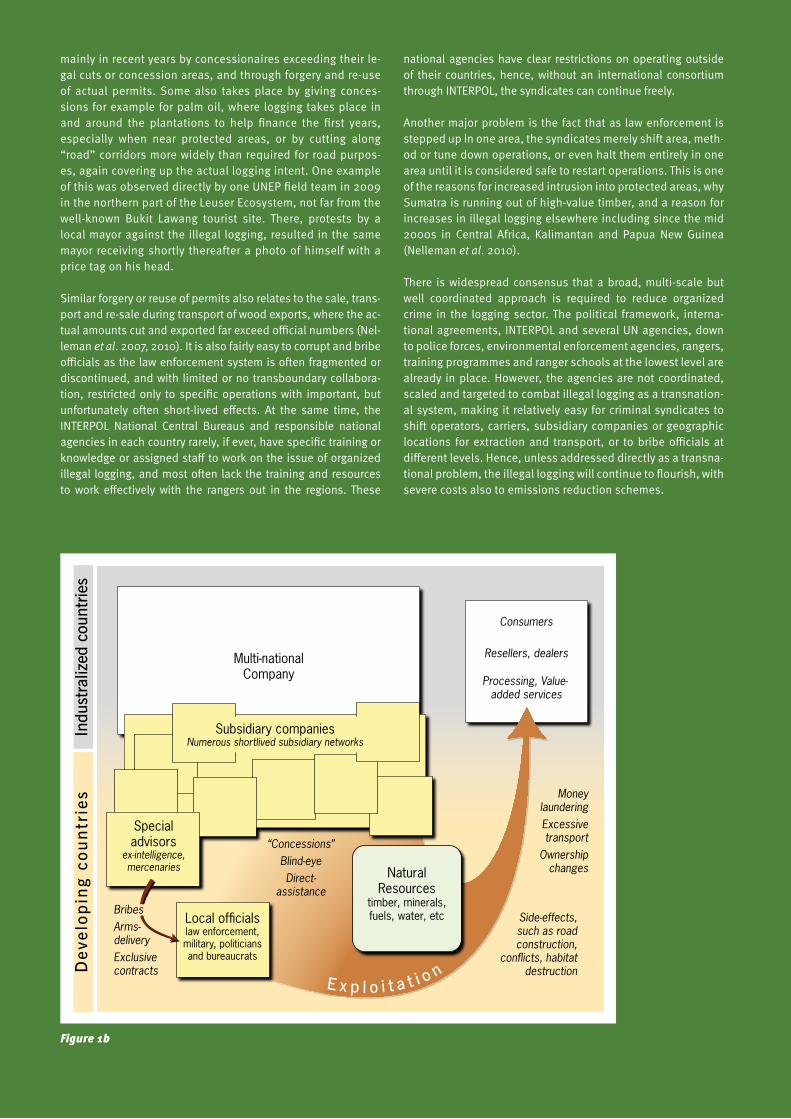
68 69
mainly in recent years by concessionaires exceeding their le-gal cuts or concession areas, and through forgery and re-use of actual permits. Some also takes place by giving conces-sions for example for palm oil, where logging takes place in and around the plantations to help finance the first years, especially when near protected areas, or by cutting along “road” corridors more widely than required for road purpos-es, again covering up the actual logging intent. One example of this was observed directly by one UNEP field team in 2009 in the northern part of the Leuser Ecosystem, not far from the well-known Bukit Lawang tourist site. There, protests by a local mayor against the illegal logging, resulted in the same mayor receiving shortly thereafter a photo of himself with a price tag on his head.
Similar forgery or reuse of permits also relates to the sale, trans-port and re-sale during transport of wood exports, where the ac-tual amounts cut and exported far exceed official numbers (Nel-leman et al. 2007, 2010). It is also fairly easy to corrupt and bribe officials as the law enforcement system is often fragmented or discontinued, and with limited or no transboundary collabora-tion, restricted only to specific operations with important, but unfortunately often short-lived effects. At the same time, the INTERPOL National Central Bureaus and responsible national agencies in each country rarely, if ever, have specific training or knowledge or assigned staff to work on the issue of organized illegal logging, and most often lack the training and resources to work effectively with the rangers out in the regions. These
national agencies have clear restrictions on operating outside of their countries, hence, without an international consortium through INTERPOL, the syndicates can continue freely.
Another major problem is the fact that as law enforcement is stepped up in one area, the syndicates merely shift area, meth-od or tune down operations, or even halt them entirely in one area until it is considered safe to restart operations. This is one of the reasons for increased intrusion into protected areas, why Sumatra is running out of high-value timber, and a reason for increases in illegal logging elsewhere including since the mid 2000s in Central Africa, Kalimantan and Papua New Guinea (Nelleman et al. 2010).
There is widespread consensus that a broad, multi-scale but well coordinated approach is required to reduce organized crime in the logging sector. The political framework, interna-tional agreements, INTERPOL and several UN agencies, down to police forces, environmental enforcement agencies, rangers, training programmes and ranger schools at the lowest level are already in place. However, the agencies are not coordinated, scaled and targeted to combat illegal logging as a transnation-al system, making it relatively easy for criminal syndicates to shift operators, carriers, subsidiary companies or geographic locations for extraction and transport, or to bribe officials at different levels. Hence, unless addressed directly as a transna-tional problem, the illegal logging will continue to flourish, with severe costs also to emissions reduction schemes.
Figure 1b
Local officialslaw enforcement,military, politicians and bureaucrats
NaturalResources
timber, minerals, fuels, water, etc
Multi-nationalCompany
Specialadvisors
ex-intelligence, mercenaries
Subsidiary companiesNumerous shortlived subsidiary networks
BribesArms-deliveryExclusivecontracts
“Concessions”Blind-eyeDirect-
assistance
Side-effects, such as road construction,
conflicts, habitat destruction
Money launderingExcessive transport
Ownership changes
Processing, Value-added services
Resellers, dealers
Consumers
E x p l o i t a t i o nDev
elo
pin
g co
un
trie
sIn
dust
raliz
ed c
ount
ries
C
M
Y
CM
MY
CY
CMY
K
corporation.pdf 2007-01-22 17:28:25
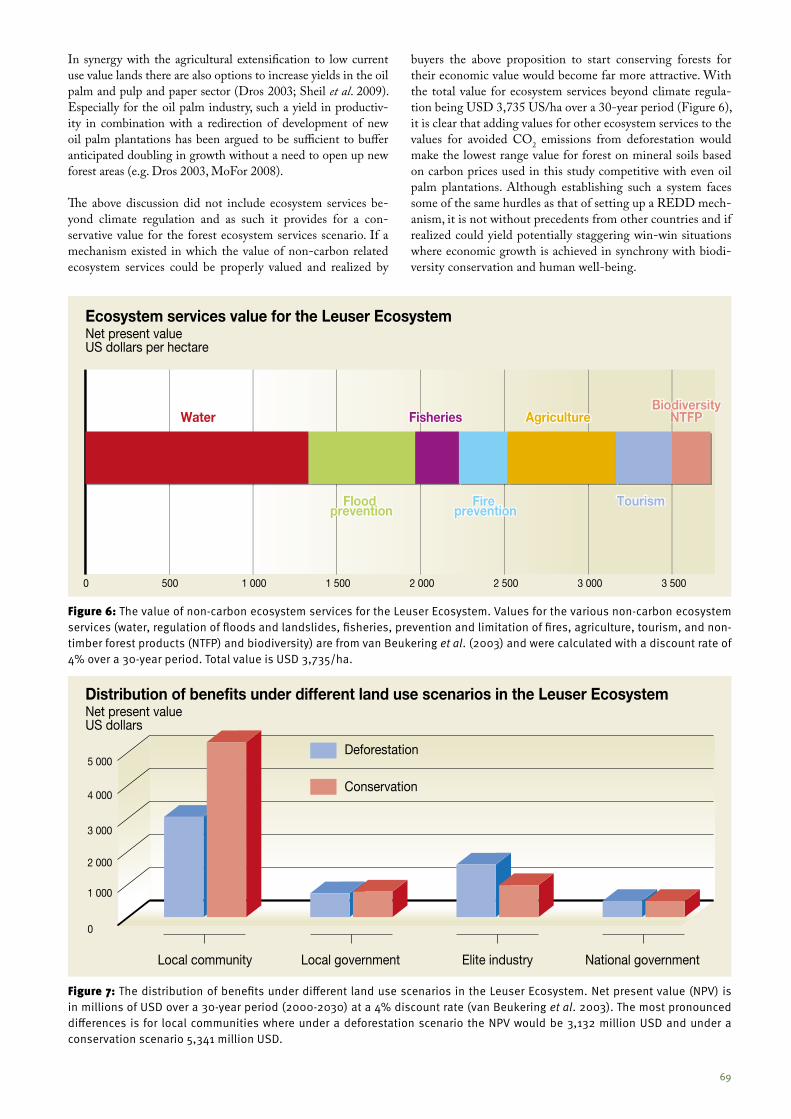
68 69
Figure 6: The value of non-carbon ecosystem services for the Leuser Ecosystem. Values for the various non-carbon ecosystem services (water, regulation of floods and landslides, fisheries, prevention and limitation of fires, agriculture, tourism, and non-timber forest products (NTFP) and biodiversity) are from van Beukering et al. (2003) and were calculated with a discount rate of 4% over a 30-year period. Total value is USD 3,735/ha.
Ecosystem services value for the Leuser EcosystemNet present valueUS dollars per hectare
2 500 3 000 3 5002 0001 5001 000500
Water
Flood prevention
Fire prevention
Tourism
Fisheries AgricultureBiodiversity
NTFP
0
In synergy with the agricultural extensification to low current use value lands there are also options to increase yields in the oil palm and pulp and paper sector (Dros 2003; Sheil et al. 2009). Especially for the oil palm industry, such a yield in productiv-ity in combination with a redirection of development of new oil palm plantations has been argued to be sufficient to buffer anticipated doubling in growth without a need to open up new forest areas (e.g. Dros 2003, MoFor 2008).
The above discussion did not include ecosystem services be-yond climate regulation and as such it provides for a con-servative value for the forest ecosystem services scenario. If a mechanism existed in which the value of non-carbon related ecosystem services could be properly valued and realized by
buyers the above proposition to start conserving forests for their economic value would become far more attractive. With the total value for ecosystem services beyond climate regula-tion being USD 3,735 US/ha over a 30-year period (Figure 6), it is clear that adding values for other ecosystem services to the values for avoided CO2 emissions from deforestation would make the lowest range value for forest on mineral soils based on carbon prices used in this study competitive with even oil palm plantations. Although establishing such a system faces some of the same hurdles as that of setting up a REDD mech-anism, it is not without precedents from other countries and if realized could yield potentially staggering win-win situations where economic growth is achieved in synchrony with biodi-versity conservation and human well-being.
Figure 7: The distribution of benefits under different land use scenarios in the Leuser Ecosystem. Net present value (NPV) is in millions of USD over a 30-year period (2000-2030) at a 4% discount rate (van Beukering et al. 2003). The most pronounced differences is for local communities where under a deforestation scenario the NPV would be 3,132 million USD and under a conservation scenario 5,341 million USD.
Distribution of benefits under different land use scenarios in the Leuser EcosystemNet present valueUS dollars
5 000
0
1 000
2 000
3 000
4 000
Local community Local government
Deforestation
Conservation
Elite industry National government
70 71
In the above analyses no attention has been given to the vari-ous stakeholders and how a business-as-usual scenario with its negative effects on ecosystem services or conservation sce-nario with payments for ecosystem services would benefit these various stakeholders. Although much more work remains to be done on this aspect, one analysis shows that the local commu-nity would benefit most from a scenario under which the forest is conserved, negative effects on ecosystem services are avoid-ed and payments for ecosystem services are realized. Industry would gain most under a business-as-usual scenario, while local and national government benefits do not differ much for the two scenarios (Figure 7).
Opportunities in the regionBecause orangutans also occur on the island of Borneo, where specifically the Indonesian part of the island (Kalimantan) has large peatlands (Hooijer et al. 2006) and contains significant numbers of orangutans (Wich et al. 2008), it is important to as-sess whether by valuing ecosystem services, forests can compete with other forms of land use here as well. One study focusing on this issue (Venter et al. 2009) for Kalimantan found that for for-ests on carbon-rich peatlands, carbon prices needed to be in the range of USD 1.63-4.66 t/CO2 to offset timber profits and sub-sequent transition into oil palm plantations. For forests on min-eral soils the carbon prices to offset opportunity costs for oil palm
Payments for Ecosystem Services (PES) is an economic in-strument that consists of offering incentives to landowners in exchange for managing their land to provide some sort of ecological service that benefits society more broadly. A payment for environmental services scheme usually entails:
1. voluntary transaction between a provider and a beneficiary2. a well-defined environmental service (ES), or a form of
land use likely to secure that service 3. involves at least one buyer and one seller4. if and only if the provider continues to supply that provi-
sion of ES as a result of considered effort (conditionality).
Strict interpretations of this definition suggest that the PES concept cannot be applied in the majority of situa-tions in developing countries, as property rights of poten-tial ‘sellers’ remain contested, ES cannot be readily quan-tified and potential ‘buyers’ prefer ‘command and control’ approaches to securing the service. A broader concept of ‘rewards’ (van Noordwijk et al. 2004; Tomich et al. 2004; Kumar & Muradian 2009; TEEB 2010) has a wider applica-tion domain (Swallow et al. 2009) and has been applied in Indonesia and elsewhere in Asia (Leimona et al. 2009). Based on the Asian experience, three paradigms can be distinguished within the payment/rewards approach: 1.) commodification of ES (CES), 2.) compensation for oppor-tunities foregone (COS) and 3.) co-investment in steward-ship (CIS) (van Noordwijk and Leimona 2010). The latter concept is the most widely applicable and can include forms of tenure and management contracts for ‘watershed protection forest’ that are conditional on maintenance of ES, such as the ‘village forest’ agreements that are regu-lated in the 1999 Forestry Law but have not yet been widely applied (Akiefnawati et al. 2010).
Costa Rica has been a pioneer in a Green Economy mod-el, for based on public payment schemes as an incentive for private landowners to maintain or enhance precious ecosystem services (WWF PES InfoExchange Year 3 No 19) based on its forest legislation. Payments to landown-ers are made for the provision of four types of ecosystem services: 1.) carbon sequestration and storage (mitigation of greenhouse gas emissions); 2.) watershed protection
Box 7: Payments for Ecosystem Services
(hydrological services); 3.) landscape protection (conser-vation); and 4.) landscape beautification (for recreation and ecotourism). Under this system, landowners receive direct payments for the ecosystem services their lands are assumed to produce when they adopt sustainable forest management techniques that do not have negative im-pacts on the forest cover and which maintain quality of life (Oritz and Kellenberg 2001).
The Government of Costa Rica acts as the buyer/investor, seeking international stakeholder buy-in for carbon se-questration services and domestic stakeholder buy-in for expected hydrological services. This combination of do-mestic and international sales, together with tax revenue, international loans and donations, is used to finance en-vironmental service provisions (Chomitz et al. 1999). Costa Rica has made substantial progress in (involuntarily) charg-ing the ‘captive audience’ of water users, and more limited progress in charging beneficiaries of the biodiversity and carbon sequestration users (Pagiola 2008). Strong ‘path dependency’ in the way payments to service providers origi-nated in previous forest subsidy schemes, however, imply considerable room for improvement in the efficiency with which it generates environmental services (Pagiola 2008).
Lessons from other public incentive schemes (Jack et al., 2008) suggest lessons how the environmental, socioeco-nomic, political, and dynamic context of a PES policy is like-ly to interact with policy design to produce policy outcomes, including environmental effectiveness, cost-effectiveness, and poverty alleviation. While the initial success and vis-ibility of the Costa Rica program has encouraged experi-mentation elsewhere (FAO 2007b), a more critical literature (Porras et al. 2008; Swallow et al. 2009; Kosoy and Corbera 2010; Lele et al. 2010; van Noordwijk and Leimona 2010; Pascual et al. 2010; Peterson et al. 2010) is now emerging that suggests that a reframing of the way incentive-based mechanisms are perceived, and a deeper analysis of the social and psychological dimensions of human-decision making in response to external signals. Approaches that support collective action at local community level and ad-dress issues of conflict over land use rights are now seen as essential to achieve success.
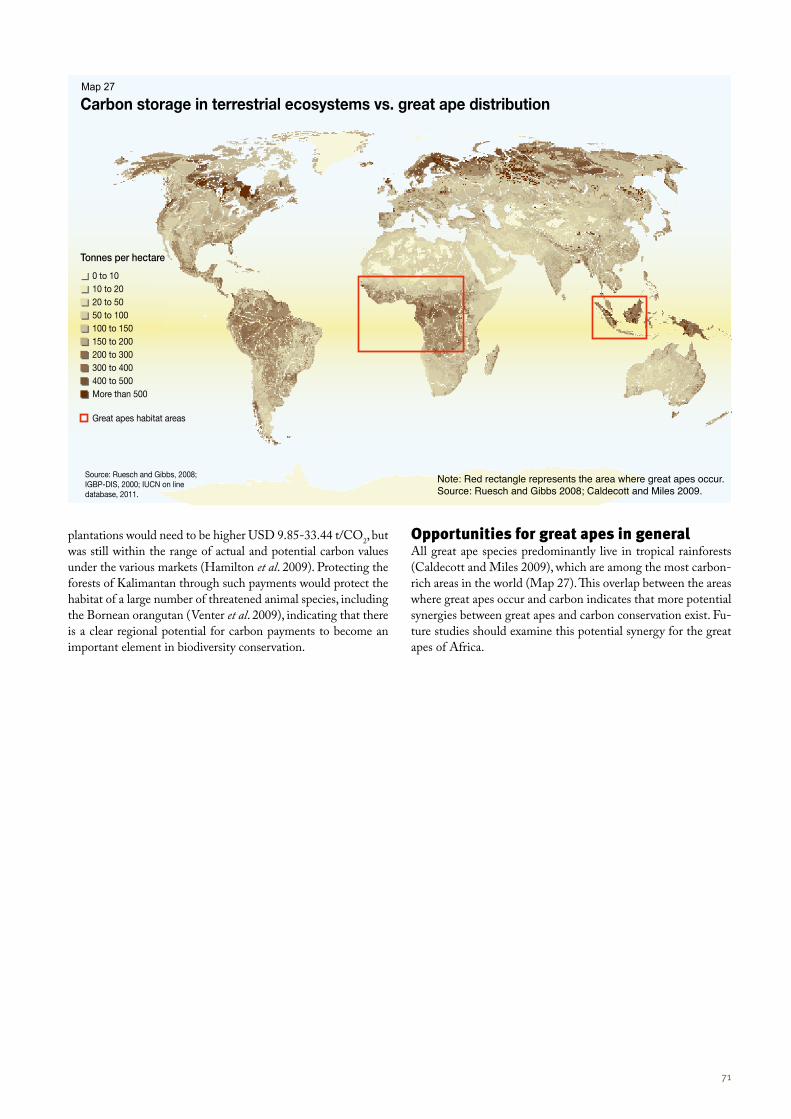
70 71
Carbon storage in terrestrial ecosystems vs. great ape distribution
Source: Ruesch and Gibbs, 2008; IGBP-DIS, 2000; IUCN on line database, 2011.
Tonnes per hectare
0 to 1010 to 2020 to 5050 to 100100 to 150150 to 200200 to 300300 to 400400 to 500More than 500
Great apes habitat areas
plantations would need to be higher USD 9.85-33.44 t/CO2, but was still within the range of actual and potential carbon values under the various markets (Hamilton et al. 2009). Protecting the forests of Kalimantan through such payments would protect the habitat of a large number of threatened animal species, including the Bornean orangutan (Venter et al. 2009), indicating that there is a clear regional potential for carbon payments to become an important element in biodiversity conservation.
Opportunities for great apes in generalAll great ape species predominantly live in tropical rainforests (Caldecott and Miles 2009), which are among the most carbon-rich areas in the world (Map 27). This overlap between the areas where great apes occur and carbon indicates that more potential synergies between great apes and carbon conservation exist. Fu-ture studies should examine this potential synergy for the great apes of Africa.
Note: Red rectangle represents the area where great apes occur.Source: Ruesch and Gibbs 2008; Caldecott and Miles 2009.
Map 27
72 73
Sumatran orangutan habitat is threatened by deforestation, with most pressure being exerted on carbon-rich peatland ar-eas. Under current forest loss rates, one of the three remaining large peat areas (Tripa) in Aceh will have completely lost its undisturbed forest by 2015-2016. Forest loss on peat and non-peat is accompanied by large losses to biodiversity in those areas. Under a business-as-usual scenario orangutans in Tripa would very likely be locally extinct within five years, whereas in 1990 there were likely more than 1,000 orangutans in the Tripa area. In the Leuser Ecosystem approximately 79% of deforestation in peatlands during 1985-2007 was driven by expansion of oil palm plantations. In forest on non-peatlands this percentage is much lower (19%) and the majority of deforestation was driven by a combination of mixed-agroforestry, rubber and candlenut. This forest loss has a negative impact on the ecosystem services that forests provide.
One of the main negative impacts of the transition from undis-turbed forest to other land uses is a reduction in carbon stocks and the accompanying emissions. Such emissions have placed Indo-nesia as the third highest carbon emitting country behind China and the US. This study shows that valuing forests for the carbon they contain and other ecosystem services can be competitive to the value of other land uses. At present, the only value for ecosys-tem services in Indonesia that is close to being realized is that for REDD projects. The range of values (USD 7,420-22,094 /ha for a 25-year period) for avoided CO2 emissions from deforestation on peatlands are almost completely higher than that of the most prof-itable other land use, that of oil palm (USD 7,832 US /ha over a 25-year period). In one of the main strongholds of the Sumatran orangutan, the Leuser Ecosystem, 79% of deforestation on peat-lands is driven by the expansion of oil palm plantations and 21% by land uses that are less profitable. In these same peatlands 30% of orangutans occur, thus conservation through a REDD scheme could simultaneously lead to the conservation of significant car-bon stocks and a large number of orangutans.
On non-peatlands, REDD schemes under current market prices would value the forest (USD 3,711-11,185 /ha for a 25-year period) higher than all land uses except oil palm for which the REDD value range would show considerable overlap with the value of oil palm (USD 7,832 /ha for a 25-year period). Because most deforestation (81%) on non-peatland areas, which is where 70% of the total orangutan numbers occur, was not driven by oil palm expansion, REDD has a great potential for orangutan habitat conservation on non-peatland as well. Adding potential payments for other ecosystem services to REDD would make this multiple-benefit approach even more competitive.
Nevertheless, it is also important to ensure that Sumatran or-angutan habitat conservation is not compromising the growing
demand for agricultural products and the economic growth tied to this. Because remaining orangutan habitat is relatively small (8,641km2) redirecting agricultural development away from or-angutan habitat towards low current use value land is possible in terms of the available low current use value land in Aceh and North Sumatra (WWF 2010). In order to achieve such a tran-sition of agriculture away from orangutan habitat towards low current use value lands a clear framework will need to be devel-oped that can resolve many issues such as land tenure, how to deal with transferring agricultural development from one area to another and funding.
In addition to redirecting agricultural expansion there is a clear need to make existing agriculture as intensive as possible to supply a growing demand without developing new agricul-tural lands at the expense of deforestation. Certainly in the oil palm industry there are ample opportunities to increase yields through better management practices.
Thus the development of a Green Economy can lead to a win-win situation where orangutan habitat is conserved, ecosystem services maintained and economic growth continued.
Indonesia has made the first important steps towards realiz-ing a future in which conservation and economic growth can work in synergy. The government emerged as a political world leader in tackling climate change when its president commit-ted in 2009 to reduce the country’s greenhouse gas emissions by 26% by 2020, and up to 41% with external aid. Following this commitment, the governments of Norway and Indone-sia signed a USD 1 billion agreement to conserve Indonesia’s forests and peatlands. Included in this deal is a pledged two-year moratorium on all new concessions for the conversion of peat and natural forests. Although promising, the value of the suspension for reductions in carbon emissions and biodiver-sity conservation depends on whether it will go further than a business-as-usual scenario. For the moratorium to achieve this, it is crucial that natural forests and peat are defined in such a way that they apply to all areas with forests, and not those limited to the Forest Estate (See Appendix 1), and to peat of all depths, and not only those deeper than 3m. Forest should also be defined in an operational way so that it can be mapped easily (Kompas 2011, Wich et al. 2011).
At the same time, Indonesia still faces many hurdles that could undermine the transition to a Green Economy and efforts to facilitate this transition should focus on improving spatial plan-ning processes and regulations, ineffective forest management units, weak management of forest land, land tenure inconsisten-cies, weak legal frameworks and the lack of firm national and international law enforcement.
Conclusion and recommendations
72 73
1. Immediately designate new areas for REDD+. These forest-ed areas should be selected taking into account the multiple benefits for carbon storage and sequestration and their role in conserving orangutan habitat and/or other biodiversity and for the protection of ecosystem services such as those derived from watersheds ensuring water supply and quality for irriga-tion and food security as well as urban and rural populations.
2. Strengthen integrated spatial land use planning across Ministries and at the regional, provincial and national level by maintaining a master spatial planning database or map containing defined boundaries of protected forests or for-ests included in protection schemes whether under REDD or for other purposes.
3. Streamline the spatial planning framework to integrate various levels of government processes and to ensure that there exists only a single legally binding spatial plan with clearly defined land uses while registering all planned land use change activities onto the same master map and pro-hibiting those activities not registered.
4. Focus further resource development including the planned expansion of oil palm plantations on low current use value lands by taking into account all social and environmental im-
plications and avoid agricultural and timber concessions on high conservation value lands. Designated areas should be reflected in the master map.
5. Improve ecosystem valuation studies based on quantified ecosystem services data and establish income-generating alternatives for existing and new areas that are important for biodiversity and ecosystem services protection.
6. Build on experience gained elsewhere in Indonesia with a broad-based ‘Rewards’ approach and building on PES schemes from countries such as Costa Rica. Between the commodification, compensation and co-investment para-digms of PES schemes, an appropriate combination needs to be selected to effectively control illegal resource depletion, compensate voluntary efforts to forego resource depletion rights and invest in lucrative Green Economy alternatives.
7. Support and develop a specific REDD-related programme between relevant UN agencies, INTERPOL, existing initia-tives such as the FLEGT and including but not limited to the appropriate Indonesian authorities and authorities in other relevant countries to address and identify key areas and measures to reduce illegal logging and trade, including the transnational organized nature of illegal logging.
Recommendations
74 75
Aceh Pedia 2010. www.acehblogger.org/Jumlah_korban_tsunami_di_acehAgus, F. and Wahdini, W. 2008. Assessment of Carbon Stock of Peat-
land at Tripa, Nagan Raya District, Nanggroe, Aceh Darussalam. Province of Indonesia. Indonesia Centre for Agriculture Land Resources Research and Development.
Akiefnawati, R., Villamor, G.B., Zulfikar, F.,Budisetiawan, I., Mulyou-tami, E., Ayat, A. and van Noordwijk, M. 2010. Stewardship agreement to reduce emissions from deforestation and degradation (REDD): case study from Lubuk Beringin’s Hutan Desa, Jambi Province, Sumatra, Indonesia. Int For Rev 12: 349-360.
Allan, B.F., Keesing, F. and Ostfeld, R.S. 2003. Effect of forest fragmenta-tion on Lyme disease risk. Cons Biol 17: 267-272.
ALLREDDI. http://www.worldagroforestrycentre.org/sea/projects/allreddi/Ancrenaz, M., Lackman-Ancrenaz, I., and Elahan, H. 2006. Seed spitting
and seed swallowing by wild orangutans (Pongo pygmaeus morio) in Sabah, Malaysia. J Trop Biol Cons 2: 65-70.
Baker, T.R., Phillips, O.L., Malhi, Y., Almeida, S., Arroyo, L., Di Fiore, A., Erwin, T., Killeen, T., Laurance, S.G., Laurance, W.F., Lewis, S.L., Lloyd, J., Monteagudo, A., Neill, D., Patino, S., Pitman, N., Silva, J.N.M. and Vasquez Martinez, R. 2004. Variation in wood density determines spa-tial patterns in Amazonian forest biomass. Glob Change Biol 10: 545-562.
BAPPENAS /UN-REDD (2010) National strategy for the reduction of emissions from deforestation and forest degradation: (Nastra RE DD+). Draft, October 2010.
Barber, C. and Schweithelm, J. 2000. Trail of fire: Forest fires and for-est policy in Indonesia’s era of crisis and reform. World Resources Institute (WRI), Washington DC.
BBC, 2003. “Sumatra illegal loggers slammed”. BBC NEWS Asia-Pacif-ic. 5 November 2003. http://news.bbc.co.uk/2/hi/asia-pacific/3242775.stm
van Beukering, P., Grogan, K., Hansfort, S.L. and Seager, D. 2009. An economic valuation of Aceh’s forests: The road toward sustainable develop-ment. Report commissioned by Fauna and Flora International.
van Beukering, P.J.H., Cesar, H.S.J. and Janssen, M.A. 2003. Economic valuation of the Leuser National Park on Sumatra, Indonesia. Ecol Econ 44: 43-62.
van Beukering, P.J.H., Cesar, H. and Janssen, M.A. 2001. Economic valu-ation of the Leuser Ecosystem on Sumatra, Indonesia: a Stakeholder Per-spective. Leuser Development Programme (LDP), Medan.
BPS (Badan Pusat Statistik) 2010a http://www.bps.go.id/tab_sub/view.php?tabel=1&daftar=1&id_subyek=12¬ab=1
BPS (Badan Pusat Statistik) 2010b. www.aceh.bps.go.idBPS (Badan Pusat Statistik) 2010c. www.sumut.bps.go.idBradshaw, C.J.A., Sodhi, N.S., Peh, K.S.-H. and Brook, B.W. 2007.
Global evidence that deforestation amplifies flood risk and severity in the developing world. Glob Change Biol 13: 2379 – 2395.
Butchart, S.H.M., Walpole, M., Collen, B, van Strien, A., Scharlemann, J.P.W., Almond, R.E.A., Baillie, J.E.M., Bomhard, B., Brown, C., Bruno, J., Carpenter, K.E., Carr, G.M., Chanson, J., Chenery, A.M., Csirke, J., David-son, N.C., Dentener, F., Foster, M., Galli, A., Galloway, J.N., Genovesi, P., Gregory, R.D., Hockings, M., Kapos, V., Lamarque, J-F., Leverington, F., Loh, J., McGeoch, M.A., McRae, L., Minasyan, A., Hernández Morcillo, M., Oldfield, T.E.E., Pauly, D., Quader, S., Revenga, C., Sauer, J.R., Skolnik, B., Spear, D., Stanwell-Smith, D., Stuart, S.N., Symes, A., Tierney, M., Tyr-rell, T.D., Vié, J-C. and Watson, R. 2010. Global biodiversity: Indicators of recent declines. Science 328: 1164-1168.
Butler, R.A., Koh, L. P. and Ghazoul, J. 2009. REDD in the red: palm oil could undermine carbon payment schemes. Cons Lett 2: 67-73.
Caldecott, J. and Miles, L. 2009. Atlas mondial des grandes signes et de leur conservation. UNESCO, Paris.
Campbell-Smith G., Simanjorang H.V., Leader-Williams N. and Linkie M. 2010. Local attitudes and perceptions towards crop-raiding by orangu-tans (Pongo abelii) and other non-human primates in northern Sumatra, Indonesia. Am J Primatol 72: 866-876.
Canadell, J.G., Le Quéré, C., Raupach, M.R., Field, C.B., Buitenhuis, E.T., Ciais, P., Conway, T.J., Gillett, N.P., Houghton, R.A. and Marland, G. 2007. Contributions to accelerating atmospheric CO2 growth from eco-nomic activity, carbon intensity and efficiency of natural sinks. Proc Natl Acad Sc 104: 18866-18870.
CBD 2010. Secretariat of the Convention on Biodiversity. 3rd Edition of Global Biodiversity Outlook, Montreal.
Chave, J., Olivier, J., Bongers, F., Chatelet, P., Forget, P.M., van der Meer, P., Norden, N., Riera, B. and Charles-Dominique, P. 2008. Above-ground biomass and productivity in rain forest of eastern South America. J Trop Ecol 24: 355-366.
Chomitz, K., Brenes, E. and Constantino, L. 1999. Financing environ-mental services: The Costa Rican experience and its implications. Sci Tot Environ 240:157–69.
Corlett, R.T. 2004. Flower visitors and pollination in the oriental (In-domalayan) region. Biol Rev 79: 497-532.
Cribb, R. 2000. Historical atlas of Indonesia. Curzon, London.van Dijk, A.I.J.M., van Noordwijk, M., Calder, I.R., Bruijnzeel, L.A.,
Schellekens, J. and Chappell J.N.A., 2009. Forest-flood relation still tenu-ous – comment on ‘Global evidence that deforestation amplifies flood risk and severity in the developing world’ by Bradshaw, C.J.A., Sodi, N.S., Peh, K. S-H., and Brook, B.W. Glob Change Biol 15: 110-115.
Dros, J.M. 2003. Accommodating growth. Two scenarios for oil palm production growth. AIDEnvironment.
Dudley, N. and Stolton, S. 2005. The Role of forest protected areas in sup-plying water to the world’s biggest cities: The urban imperative. In Tryzna, T. (ed.). California Institute of Public Affairs, Sacramento, CA, USA. Pp. 27-33.
Ekadinata, A., van Noordwijk, M., Dewi, S. and Minang, P.A. 2010. Re-ducing emissions from deforestation, inside and outside the ‘forest’. ASB Brief 16, World Agroforestry Centre, Nairobi (Kenya)
Ezenwa, V.O., Godsey, M.S., King, R.J. and Guptill, S.C. 2006. Avian diversity and West Nile virus: Testing associations between biodiversity and infectious disease risk. Proc Roy Soc B. 273: 109-17.
FAO 2010. Global forest resources assessment 2010.FAO 2006. Global forest resources assessment 2005.FAO 2007a. State of the world’s forests. 2007. FAO 2007b. The state of food and agriculture 2007. Paying farmers for
environmental services . FAO/WFP, 2005. Special report. Mission to Banda Aceh (Indonesia),
December 2005.Gallai, N., Salles, J.-M., Settele, J. and Vaissière, B.E. 2008. Economic
valuation of the vulnerability of world agriculture confronted with pollinator decline. Ecol Econ 68: 810-821.
Garrity, D.P., Soekardi, M., van Noordwijk, M., de la Cruz, R., Pathak, P.S., Gunasena, H.P.M., van So, N., Huijun, G. and Majid N.M. 1997. The Imperata grasslands of tropical asia: area, distribution and typology. Agrofor Sys 36: 3-29.
Gaston, K.J., 2000. Global patterns in biodiversity. Nature 405: 220-227.Gaveau, D.L.A., Wich, S.A., Epting, J., Juhn, D., Kanninen, M. and
Leader-Williams, N. 2009. The future of forests and orangutans (Pongo abe-lii) in Sumatra: Predicting impacts of oil palm plantations, road construction and mechanisms for reducing carbon emissions from deforestation. Environ Res Lett 4: 1-11.
Ghazoul, J., Butler, R.A., Mateo-Vega, J. And Koh, L.P. 2010. REDD: a reckoning of environment and development implications. Trends Ecol Evol 25:396-402.
Gubler R. 2006. Sustainable development of eco-tourism in Indonesia. PanEco, Switzerland.
Gunung Leuser National Park 2010. Tourism map.Hamilton, K., Chokkalingam, U. and Bendana, M. 2009. State of the for-
est carbon markets 2009. Ecosystem Marketplace Report.Harrison, M.E., Page, S.E and Limin, S.H. 2009. The global impact of
Indonesian forest fires. Biologist 56: 156-162.Hockings, K. and Humle, T. 2009. Best practice guidelines for the pre-
vention of conflict between humans and great apes. IUCN/SSC Primate Specialist Group (PSG), Gland, Switzerland
Hooijer, A., Silvius, M., Wösten, H. and Page, S. 2006. PEAT-CO2, Assessment of CO2 emissions from drained peatlands in SE Asia. Delft Hydraulics report.
Husson, S.J., Wich, S.A., Marshall, A.J., Dennis, R.D., Ancrenaz, M., Brassey, R., Gumal, M., Hearn, A.J., Meijaard, E., Simorangkir, T. and Sin-gleton, I. 2009. Orangutan distribution, density, abundance and impacts of disturbance. In: Wich, S.A., Utami Atmoko, S.S., Mitra Setia, T. and van
References
74 75
Schaik, C.P. (eds). Orangutans: Geographic variation in behavioural ecology and conservation. Oxford University Press, New York. Pp. 77-96.
INTERPOL-World Bank 2009. CHAINSAW project: An Interpol per-spective on law enforcement in illegal logging, O.I.P.C. INTERPOL, Lyon, France, www.interpol.int
IPCC 2007. Climate change 2007: Synthesis report. Contribution of the working group I, II and III to the fourth assessment report of the intergov-ernmental panel on climate change. Pachauri R.K. and Reisinger A. IPCC Geneva, Switzerland.
IUCN Red List, 2010. IUCN Red List of Threatened Species. http://www.iucnredlist.org
Jablonski, N.G., Whitfort, M.J., Roberts-Smith, N. and Xu, Q.Q. 2000. The Influence of life history and diet on the distribution of Catarrhine pri-mates during the Pleistocene in Eastern Asia. J Hum Evol 39: 131-157.
Jack, B.K., Kousky C., Katharine, R. E. and Sims, K.R.E. 2008. Design-ing payments for ecosystem services: Lessons from previous experience with incentive-based mechanisms. Proc Natl Acad Soc USA 105: 9465-9470.
Jaenicke, J., Riely, J.O., Mott, C., Kimman, P. and Siegert, F. 2008. De-termination of the amount of carbon stored in Indonesian peatlands. Geo-derma 147: 151-158.
Jakarta Post 2000. Relief work goes on amid foul weather, December 1, 2000.
Joosten, H. 2009. The global peatland CO2 picture. Wetlands InternationalJoshi, L. Budidarsono, S. and Nugraha, E. 2008. Economic and environ-
mental challenges in the post-tsunami post-conflict coast land and upland in Aceh and Nias. ICRAF/World Agroforestry Centre.
Klein, A.-M., Vaissière, B.E., Cane, J.H., Steffan-Dewenter, I., Cunning-ham, S.A., Kremen, C. and Tscharntke, T. 2007. Importance of pollinators in changing landscapes for world crops. Proc Roy Soc B. 74: 303-313.
Koh, L.P. and Ghazoul, J. 2010. Spatially explicit scenario analysis for reconciling agricultural expansion, forest protection, and carbon conserva-tion in Indonesia. Proc Natl Acad Sci USA 107:11140-11144.
Koh, L.P. and Wilcove, D.S. 2007. Cashing in palm oil for conservation. Nature 448: 993-994.
Kompas 2011. Moratorium hanya untuk hutan primer. Saturday Febru-ary 12th.
Kosoy, N. and Corbera, E. 2010. Payments for ecosystem services as com-modity fetishism. Ecol Econ 69: 1228-1236.
Kumar, Pushpam and Muradian, Roldan (eds.): Payment for Ecosystem services, Oxford University Press, 2009, New Delhi, 308 p
Laumonier, Y., Uryu, Y., Stüwe, M., Budiman, A., Setiabudi, B. and Had-ian, O. 2010. Eco-floristic sectors and deforestation threats in Sumatra: Identifying new conservation area network priorities for ecosystem-based land use planning. Biodiv Cons 19: 1153-1174.
Lawson, S. and MacFaul, L. 2010. Illegal logging and related trade. Chatham house, 2010.
Leimona, B., Joshi, L. and van Noordwijk, M. 2009. Can rewards for environmental services benefit the poor? Lessons from Asia. Int J Com Vol 3: 82-107.
Lele, S., Wilshusen, P., Brockington, D., Seidler, R. and Bawa, K. 2010. Beyond exclusion: alternative approaches to biodiversity conservation in the developing tropics. Curr Op in Environ Sustain 2: 94-100.
Lewis, S.L., Lopez-Gonzalez, G., Sonké, B., Affum-Baffoe, K., Baker, T.R.M., Ojo, L.O., Phillips, O.L., Reitsma, J.M., White, L., Comiskey, J.A., Marie-Noel, D., Ewango, C.E.N., Feldpausch, T.R., Hamilton, A.C., Gloor, M., Hart, T., Hladik, A., Lloyd, J., Lovett, J.C., Makana, J.R., Malhi, Y., Mbago, F.M., Ndangalasi, H.J., Peacock, J., Peh, K.S.H., Sheil, D., Sun-derland, T., Swine, M.D., Taplin, J., Talor, D., Thomas, S.C., Votere, R. and Woll, H. 2009. Increasing carbon storage in intact African tropical forests. Nature 457: 1003-1006.
LMU 2000. Consequences of logging and clearing catchments in the Leuser Ecosystem: A survey of failed irrigation schemes close to the Leus-er Ecosystem. Buffer Zone Division (BZD), Leuser Development Pro-gramme, Medan.
LoGiudice, K., Ostfeld, R.S., Schmidt, K.A. and Keesing, F. 2003. The ecology of infectious disease: Effects of host diversity and community com-position of Lyme disease risk. Proc Natl Acad Sci USA 100: 567-71.
Luyssaert, S., Schulze, E.D., Börnen, A., Knohl, A., Hessenmöller, D.,
Law, B.E., Ciais, P. and Grace, J. 2008. Old-growth forest as global carbon sinks. Nature 455: 213-215.
Macfie, E.J. and Williamson, E.A. 2010. Best practice guidelines for great ape tourism. Gland, Switzerland. IUCN/SSC Primate Specialist Group (PSG).
Malhi, Y., Wood, D., Baker, T.R., Wright, J., Phillips, O.L., Cochrane, T., Meir, P., Chave, J., Almeida, S., Arroyo, L., Higuchi, N., Killeen, T.J., Laurance, S.G., Laurance, W.F., Lewis, S.L., Monteagudo, A., Neill, D.A., Vargas, P.N., Pitman, N.C.A., Quesada, C.A., Salomao, R., Silva, J.N.M., Lezama, A.T., Terborgh, J., Martinez, R.V. and Vicenti, B. 2006. The region-al variation of the above ground biomass in old-growth Amazonian forests. Glob Change Biol 12: 1107-1138.
Marshall, A.J., Ancrenaz, M., Brearley, F.Q., Fredriksson, G.M., Ghaffar, N., Heydon, M., Husson, S.J., Leighton, M., McConkey, K.R., Morrogh-Bernard, H.C., Proctor, J., van Schaik, C.P., Yeager, C. and Wich, S.A. 2009a. The effects of forest phenology and floristics on populations of Bornean and Sumatran orangutans. In: Wich, S.A., Utami Atmoko, S.S., Mitra Setia, T. and van Schaik, C.P. (eds). Orangutans: Geographic variation in behavioural ecology and conservation. Oxford University Press, New York. Pp. 97-118.
Marshall, A.J., Lacy, R., Ancrenaz, M., Byers, O., Husson, S.J., Leighton, M., Meijaard, E., Rosen, N., Singleton, I., Stephens, S., Traylor-Holzer, K., Utami Atmoko, S.S., van Schaik, C.P. and Wich, S.A., 2009b. Orangutan population biology, life history and conservation. In: Wich, S.A., Utami Atmoko, S.S., Mitra Setia, T. and van Schaik, C.P. (eds). Orangutans: Geo-graphic variation in behavioural ecology and conservation. Oxford Univer-sity Press, New York. Pp. 311-326.
McCarthy, J.F., 2006. The fourth circle: A political ecology of Sumatra’s rainforest frontier. Stanford University Press, Stanford, California.
MEA, 2005a. Millennium Ecosystem Assessment. Global assessment reports Volume 1. Current state and trends assessment. Island Press, Wash-ington DC.
MEA, 2005b. Millennium Ecosystem Assessment. Living beyond Our means: Natural assets and human well-being. Island Press, Washington DC.
MEA, 2005c. Millennium Ecosystem Assessment. Ecosystems and hu-man well-being: Synthesis. Island Press, Washington DC.
Ministry of Forestry 2009. Orangutan Indonesia: Conservation strategies and action plan.
Mittermeier, R.A., Wallis, J., Rylands, A.B., Ganzhorn, J.U., Oates, J.F., Williamson, E.A., Palacios, E., Heymann, E.W., Kierulff, M.C.M., Yongcheng, L., Supriatna, J., Roos, C., Walker, S., Cortés-Ortiz, L. and Schwitzer, C. 2009. Primates in peril: The world’s 25 most endangered pri-mates 2008–2010. IUCN/SSC Primate Specialist Group (PSG), Interna-tional Primatological Society (IPS) and Conservation International (CI), Arlington, Virginia.
MoFor 2008. IFCA 2007 Consolidation report: Reducing emissions from deforestation and forest degradation in Indonesia, published by FOR-DA Indonesia
Moser, M. Prentice, C. and Frazier, S. 1996. A global overview of wet-land loss and degradation. Available at www.ramsar.org/about/about_wet-land_loss.htm
Murdiyarso, D., Hergoual, K. and Verschot, L.V. 2010. Opportunities for reducing greenhouse gas emissions in tropical peatlands. Proc Natl Acad Sci 107: 19655-19660.
Myers, N., Mittermeier, R.A., Mittermeier, C.G., da Fonesca, G.A.B. and Kent, J. 2000. Biodiversity hotspots for conservation priorities. Nature 403: 853-858.
Naeem, S., Bunker, D.E., Hector, A., Loreau, M. and Perrings, C. 2009. Introduction: The ecological and social implications of changing biodiver-sity. An overview of a decade of biodiversity and ecosystem functioning re-search. In: Naeem, S., Bunker, D.E., Hector, A., Loreau, M. and Perrings, C. (eds). Biodiversity, ecosystem functioning and human well-being: An ecological and economic perspective. Oxford University Press, Oxford. Pp. 3-13.
NASA/University of Maryland, 2002. MODIS Hotspot / Active fire de-tections. data set. MODIS rapid response project, NASA/GSFC [produc-er], University of Maryland, Fire Information for Resource Management System [distributors]. Available on-line http://maps.geog.umd.edu/firms/
Nelleman, C., Redmond, I. and Refisch, J. 2010. Last stand of the go-
76 77
rilla: Environmental crime and conflict in the Congo Basin. UNEP, Nairobi, www.unep.org
Nellemann, C., Miles, L., Kaltenborn, B.P., Virtue, M. and Ahlenius, H. 2007. The last stand of the orangutan – State of emergency: Illegal logging, fire and palm oil in Indonesia’s national parks. UNEP, GRID-Arendal, Nor-way, www.grida.no
Nijman, V. 2009. An assessment of trade in gibbons and orangutans in Sumatra, Indonesia. TRAFFIC Southeast Asia, Petaling Jaya, Malaysia.
van Noordwijk, M. and Minang, P.A. 2009. If we cannot define it, we cannot save it. ETFRN NEWS 50: 5-10
van Noordwijk, M. and B. Leimona. 2010. Principles for fairness and ef-ficiency in enhancing environmental services in Asia: payments, compen-sation, or co-investment? Ecology and Society 15(4): 17. [online] URL: http://www.ecologyandsociety.org/vol15/iss4/art17/
van Noordwijk, M., Chandler, F. and Tomich, T.P. 2004. An introduction to the conceptual basis of RUPES: Rewarding upland poor for the environ-mental services they provide. ICRAF-Southeast Asia, Bogor.
van Noordwijk, M., Hairiah, K., Partoharjono, S., Labios, R.V. and Gar-rity, D.P. 1997. Sustainable food-crop based production systems, as alterna-tive to Imperata grasslands? Agrofor Sys 36: 55-82.
Ortiz, E. and Kellenberg, J. 2001. Program of payments for ecological services in Costa Rica. Working paper, FONAFIFO, San José, Costa Rica.
PanEco, 2008. How palm-oil plantations at Tripa increase disaster risk, contribute to climate change and drive a unique Sumatran orangutan popu-lation to extinction: Value of Tripa peat swamp forest, Aceh, Sumatra, In-donesia.
Pascual, U., Muradian, R., Rodríguez, L.C. and Duraiappah, A. 2010. Exploring the links between equity and efficiency in payments for environ-mental services: A conceptual approach. Ecol Econ 69: 1237-1244.
Pattanyak, S.K. and Wendland, K.J. 2007. Nature’s care: Diarrhea, water-shed protection and biodiversity conservation in Flores, Indonesia. Biodiv Cons 16: 2801-2819.
Peterson, M.J., Hall, D.M., Feldpausch-Parker, A. M. and T.R. Peterson. 2010. Obscuring Ecosystem Function with Application of the Ecosystem Services Concept. Cons Biol 24: 113–119.
Phelps, J., Webb, E. L. and Agrawal, A. 2010. Does REDD+ threaten to recentralize forests governance. Science 328: 312-313.
Porras, I., Grieg-Gran, M. and Neves, N. 2008. All that glitters: A review of payments for watershed services in developing countries. International Institute for Environment and Development, London, UK.
Potts, S.G., Biesmeijer, J.C., Kremen, C., Neumann, P., Schweiger, O. and Kunin, W.E., 2010. Global pollinator declines: Trends, impacts and drivers. Trends Ecol Evol 25: 345-353.
Queenborough, S.A., Mazer, S.J., Vamosi, S.M., Garwood, N.C., Valen-cia, R. and Freckleton, R.P. 2009. Seed mass, abundance and breeding sys-tem among tropical forest species: Do dioecious species exhibit compensa-tory reproduction or abundances? J Ecol 97: 555‐566.
Raitzer, D.A. 2008 Assessing the impact of CIFOR’s influence on policy and practice in the Indonesian pulp and paper sector. Impact Assessment Paper. CIFOR, Bogor, Indonesia
Republic of Indonesia, 2005. Master plan for the rehabilitation and re-construction for the region and people of the provinces of Nanggroe Aceh Darussalam and Nias Islands, North Sumatra.
Rieley, J.O., Wüst, R.A.J., Jauhiainen, J., Page, S.E., Wösten, H., Hooijer, A., Siegert, F., Limin, S.H., Vasander, H. and Stahlhut, M. 2008. Tropical peatlands: Carbon stores, carbon gas emissions and contribution to climate change processes. In: Strack, M. (ed). Peatlands and Climate Change. Inter-national Peat Society, Jyväskylä, Finland. Pp. 148-181.
Rijksen, H.D. and Meijaard, E. 1999. Our vanishing relative: The status of wild orangutans at the close of the twentieth century. Tropenbos Publica-tions, Wageningen
Robertson, J.M.Y. and van Schaik, C.P. 2001. Causal factors underlying the dramatic decline of the Sumatran Orangutan. Oryx 35: 26-38.
Robertson, Y.J.M. and Soetrisno, B.R. 1982. Logging on slopes kills. Oryx 16: 229-230.
Ruesch, A.S. and Gibbs, H. 2008. New global biomass carbon map for the year 2000 based on IPCC Tier-1 methodology. Oak Ridge National Laboratory’s Carbon Dioxide Information Analysis Center: Oak Ridge,
USA. Available online from the Carbon Dioxide Information Analysis Center, URL: http://cdiac.ornl.gov.
Santoso, D., Adiningsih, S., Mutert, E., Fairhurst, T. and van Noordwijk, M. 1997. Site improvement and soil fertility management for reclamation of Imperata grasslands by smallholder agroforestry. Agrofor Sys 36: 181-202.
Saroso, O. 2010. Governors Want Speedy Sumatra Development. In: The Jakarta Post, 07 July 2010. http://www.thejakartapost.com/news/2010/07/24/governors-want-speedy-sumatra-development.html
van Schaik, C.P., Monk, K.A. and Robertson, J.M.Y. 2001. Dramatic de-cline in orangutan numbers in the Leuser Ecosystem, northern Sumatra. Oryx 35: 14-25.
van Schaik C.P., Azwar and Priatna D. 1995. Population estimates and habitat preferences of orangutans based on line transects of nests. In: Nadler, R.D., Galdikas, B.F.M., Sheeran, L.K. and Rosen, N. (eds).The neglected ape. Plenum Press, New York. Pp. 109-116
Sea Defence Consultants 2009. Land and water conservation in selected basins in Aceh.
Serambi 2010a. http://aceh.tribunnews.com/news/view/27604/hutan-aceh-berkurang-32-657-hektare-tahun
Serambi 2010b. Sep 24th 2010. Ribuan Warga Nagan Terkurung Banjir/Thousands of people isolated by flooding.
Sheil, D., Casson, A., Meijaard, E., van Noordwijk, M. Gaskell, J., Sun-derland-Groves, J.,Wertz, K. and Kanninen, M. 2009. The impacts and op-portunities of oil palm in Southeast Asia: What do we know and what do we need to know? Occasional paper no. 51. CIFOR, Bogor, Indonesia.
Shepherd, C.R., Sukumaran, J. and Wich, S.A. 2004. Open season: An analysis of the pet trade in Medan, Sumatra 1997-2001 TRAFFIC South-east Asia
Singleton, I., Knott, C.D., Morrogh-Bernard, H.C., Wich, S.A. and van Schaik, C.P. 2009. Ranging behaviour of orangutan females and social or-ganization. In: Wich, S.A., Utami Atmoko, S.S., Mitra Setia, T. and van Schaik, C.P. (eds). Orangutans: Geographic variation in behavioural ecology and conservation. Oxford University Press, New York. Pp. 205-213.
Sodhi, N.S., Posa M.R.C., Lee, T.M., Bickford, D., Koh, L.P. and Brook, B.W. 2010. The state and conservation of Southeast Asian biodiversity. Bio-div Cons 19: 317-328
Stern, N. 2006. The Stern review: The economics of climate change. Cam-bridge University Press.
Swallow, B.M., Kallesoe, M.F., Iftikhar, U.A., van Noordwijk, M., Bracer, C., Scherr, S.J., Raju, K.V., Poats, S.V., Kumar Duraiappah, A., Ochieng, B.O., Mallee, H. and Rumley, R. 2009. Compensation and Rewards for Environmental Services in the Developing World: Framing Pan-Tropical Analysis and Comparison. Ecology and Society 14 (2): 26. [online] URL: http://www.ecologyandsociety.org/vol14/iss2/art26/
Tata, H.L. and van Noordwijk, M. 2010. Human livelihoods, ecosystem services and the habitat of the Sumatran orangutan: Rapid assessment in Batang Toru and Tripa. World Agroforestry Centre (ICRAF) Southeast Asia Regional Office, Bogor, Indonesia.
TEEB (2009) TEEB climate issues update. September 2009TEEB (2008) The economics of ecosystems and biodiversity: An interim
report. European Commission, Brussels. www.teebweb.orgTEEB (2010) The Economics of Ecosystems and Biodiversity for Local
and Regional Policy MakersThompson, I., Mackey, B., McNulty, S. and Mosseler, A. 2009. Forest re-
silience, biodiversity, and climate change. A synthesis of the biodiversity/resilience/stability relationship in forest ecosystems. Secretariat of the Con-vention on Biological Diversity, Montreal. Technical Series no. 43
Tomich, T.P., van Noordwijk, M. and David E. Thomas, D.E. 2004. Envi-ronmental services and land use change in Southeast Asia: from recognition to regulation or reward? Agriculture, Ecosys Environ 104: 229-244.
Tomich, T.P., van Noordwijk, M., Budidarseno, S., Gillison, A., Ku-sumanto T., Murdiyarso, D., Stolle, F. and Fagi, A.M. 2001 Agricultural intensification, deforestation, and the environment: assessing tradeoffs in Sumatra, Indonesia. In: Lee D.R. and Barrett, C.B. (eds.) Tradeoffs or Syn-ergies? Agricultural Intensification, Economic Development and the Envi-ronment. CAB-International, Wallingford pp 221-244.
Tomich, T.P., Kuusipalo, J., Menz, K. and Byron N. 1997. Imperata eco-nomics and policy. Agrofor Sys 36: 233-261.
76 77
Trumper, K., Bertzky, M., Dickson, B., van der Heijden, G., Jenkins, M. and Manning, P. 2009. The natural fix? The role of ecosystems in climate mitigation. A UNEP rapid response assessment. UNEP-WCMC, Cam-bridge, UK
UNEP-WCMC 2010. http://www.unep-wcmc.org/sites/wh/pdf/SU-MATRA%20RAINFOREST.pdf
Venter, O., Meijaard, E., Possingham, H. P., Dennis, R., Sheil, D., Wich, S., Hovani, L. and Wilson, K. 2009. Confronting the carbon crisis- a safe-guard for tropical forest wildlife. Cons Lett 2: 123-129.
Vittor, A.Y., Pan, W., Gilman, R.H., Tielsch, J., Glass, G., Shields, T., Sánchez-Lozano, W., Pinedo, V.V., Salas-Cobos, E., Flores, S. and Pa, J.A. 2009. Linking deforestation to malaria in the Amazon: Characterization of the breeding habitat of the principal malaria vector, Anopheles darlingi. Am J Trop Med Hyg 81: 5-12.
Vittor, A.Y., Gilman, R.H., Tielsch, J., Glass, G., Shields, T., Lozano, W.S., Pinedo-Cancino, V. and Patz, J.A. 2006. The effect of deforestation on the human-biting rate of Anopheles darlingi, the primary vector of Fal-ciparum malaria in the Peruvian Amazon. Am J Trop Med Hyg 74: 3-11.
Volkstelling 1922. Uitkomsten der in de maand November 1920 ge-houden volksltelling. Batavia: Ruygrok
Wahyunto, R.S. and Subagjo, H. 2003. Map of peatland distribution area and carbon content in Sumatra. Wetlands International Indonesia Program and Wildlife Habitat Canada (WHC).
van der Werf, G.R., Morton, D.C., DeFries, R.S., Olivier, J.G.J., Kasib-hatla, P.S., Jackson, R.B., Collatz, G.J. and Randerson, J.T. 2009. CO2 emis-sions from forest loss. Nature GeoSci 2: 737-738
Whitten, A.J., Damanik, S.J., Jazanul, A. and Nazaruddin, H. 1987. The ecology of Sumatra. Gadjah Mada University Press, Yogyakarta, Indonesia.
Wich, S., van Noordwijk, M. and Koh, L.P. (2011) The Indonesian defor-estation moratorium: The devil is in the details. http://www.thejakartapost.com/news/2011/02/21/the-indonesian-deforestation-moratorium-the-devil-details.html
Wich, S.A., de Vries, H., Ancrenaz, M., Perkins, L., Shumaker, R.W., Suzuki, A. and van Schaik, C.P. 2009. Orangutan life history variation. In: Wich, S.A., Utami Atmoko, S.S., Mitra Setia, T. and van Schaik, C.P. (eds). Orangutans: Geographic variation in behavioural ecology and conservation.
Oxford University Press, New York. Pp. 65-75.Wich, S.A., Meijaard, E., Marshall, A.J., Husson, S., Ancrenaz, M., Lacy,
R.C., van Schaik, C.P., Sugardjito, J., Simorangkir, T., Taylor-Holzer, K., Doughty, M., Supriatna, J., Dennis, R., Gumal, M., Knott, C.D. and Single-ton, I. 2008. Distribution and conservation status of the orangutan (Pongo spp.) on Borneo and Sumatra: How many remain? Oryx 42: 329-339
Wind, J. 1996. Gunung Leuser National Park: History, threats and op-tions. In: van Schaik, C.P. and Supriatna, J. (eds). Leuser: A Sumatran sanc-tuary. Jakarta: Perdana Ciptamandiri. Pp. 4-27.
World Bank 2008. Forests Sourcebook. World Bank 2006. Sustaining Indonesia’s forests: Strategy for the World
Bank, 2006-2009.World Bank 2005. Rebuilding a better Aceh and Nias, World Bank Re-
port, June 2005.Wösten, J.H.M. and Ritzema, H.P. 2002. Challenges in land and water
management for peatland development in Sarawak. In: Rieley, J.O and Page, S.E. and Setiadi, B. (eds). Peatlands for people: Natural resource functions and sustainable management. Proceedings of the International Symposium on Tropical Peatland, 22-23 August 2001, Jakarta, Indonesia. BPPT and Indonesian Peat Association. Pp. 51-55.
Wösten, J.H.M., Clymans, E., Page, S.E., Rieley, J.O. and Limin, S.H. 2008. Peat-water interrelationship in a tropical peatland ecosystem in Southeast Asia. Catena 73: 212-224.
Wösten, J.H.M., Hooijer, A., Siderius, C., Rais, D.S. and Idris A. 2006. Tropical peatland water management modelling of the Air Hitam Laut catchment in Indonesia. Int J Riv Bas Manag 4: 233-244.
Wright, I.J., Ackerly, D.D., Bongers, F., Harms, K.E., Ibarra‐Manriquez, G. and Martinez‐Ramos, M. 2007. Relationships among key dimensions of plant trait variation in seven neotropical forests. Ann Bot 99: 1003-1015.
WWF 2010. Sumatra’s forests, their wildlife and the climate.WWF PES InfoExchange, Year 3 No. 19Sustainable financing and pay-
ment for environmental services, WWF News and analysis, Taking stock of the most advanced GEF-World Bank PES projects. Link: http://assets.panda.org/downloads/pesnewsletter19.pdf
Yasmine, F. 2010. Premilinary health assessment to the region of Tripa Bawa Sub-district of Darul Makmur, district of Nagan Raya.

78 79

78 79
Appendixes
80 81
The concept of ‘forest’ has multiple meanings and definitions, and there is considerable confusion where ecological, institutional and legal ownership issues interact at national scale, with further confusion added by interna-tional forest definitions in the context of climate policies that lack opera-tional clarity (van Noordwijk and Minang 2009). An ecological perspective on forests understood as ‘woody vegetation’ and the ecosystem services it provides, does not match with the institutional perspectives on ‘permanent forest estate’, and both apply to a considerable range of legal ownership per-spectives. While international forest definitions refer to a minimum area, a minimum (potential) crown cover and a minimum (potential) tree height and do not exclude plantation forestry or tree crop plantations from the for-est concept, the Indonesian forestry law of 1999, refers to forests primarily as the provider of functions. Forest essentially is to be understood as a land use designation (‘National Forest Estate’ or “Kawasan Hutan”), differenti-ated in the 1999 Forestry Law from land ownership. Only a small part (less than 20%) of the ‘kawasan hutan’ area has fulfilled the legal requirements for uncontested ownership by the State. Areas with high natural forest carbon stocks, orangutan populations and deep peat soils, such as remain in Tripa, are considered outside of this ‘National Forest Estate’ as concession rights for conversion to oil palm have been granted and the land belongs to the ‘other land uses’ category. Between 1990 and 2005 the CO2 emissions from decrease in woody vegetation have been as large outside as inside the ‘ka-wasan hutan’ and lands outside the kawasan could maintain the current high forest-related emission rates from Indonesia as a whole for nearly 7 years before they would be fully depleted (Ekadinata et al. 2010).
Within the permanent forest estate, four functional categories are:Conservation Areas (Kawasan Konservasi), or “Protected Areas”, that are strictly protected. They include National Parks (Taman Nasional), Strict Na-ture Reserves (Cagar Alam), Wildlife Reserves/Refuges (Suaka Margasat-wa), Hunting Parks (Taman Buru), and Forest Parks (Taman Hutan Raya). The Forest Parks are managed by Provincial or District Forestry Offices, all
other by the National Government (in this case the Directorate-General of Forest Protection and Nature Conservation of the Ministry of Forestry),Watershed Protection Forests (Hutan Lindung), where use for ‘provisioning services’ is limited to collection of non-timber forest products such as honey, fruit, nuts. They are managed by the Provincial or District Forestry Offices.Production Forests (Hutan Produksi), that are allocated primarily for timber production. There are two categories of production forest: ordinary Produc-tion Forest and Limited Production Forest (Hutan Produksi Terbatas) with stricter guidelines. Logging Concessions (Hak Pengusahaan Hutan) can be issued in Production Forests by the National Government, based on recom-mendations from the Provincial and District Authorities. Natural vegetation on ‘degraded forests’ can be licensed for conversion to plantation forestry within this category.
Conversion Forests (Hutan yang dapat dikonversi) can be converted into non-forest uses, including tree crop plantations, open-field agriculture and human settlement. Once the Minister of Forestry grants approval, other state agencies take control over the licensing.
Perpendicular to these functional categories, is the issue of land owner-ship (including “Hutan Kota” or municipal forests, and “Hutan Milik” or privately owned forests) and ‘co-management’ regime, such as community-based forest management (Hutan Kemasyarakatan or HKM), village forest (Hutan Desa, as HKM this can apply to production or watershed protection forest lands), or Hutan Adat, where indigenous community rights regimes still apply.
Significant orangutan habitat and populations are found across the different forest categories, and effective conflict resolution of issues about legal land status is a prerequisite for effective conservation of remaining populations. Of specific significance in that respect are the Tripa swamp (‘other land use’) and Batang Toru (‘production’ and ‘watershed protection’ forest).
Appendix 1: Forest categories and management authorities
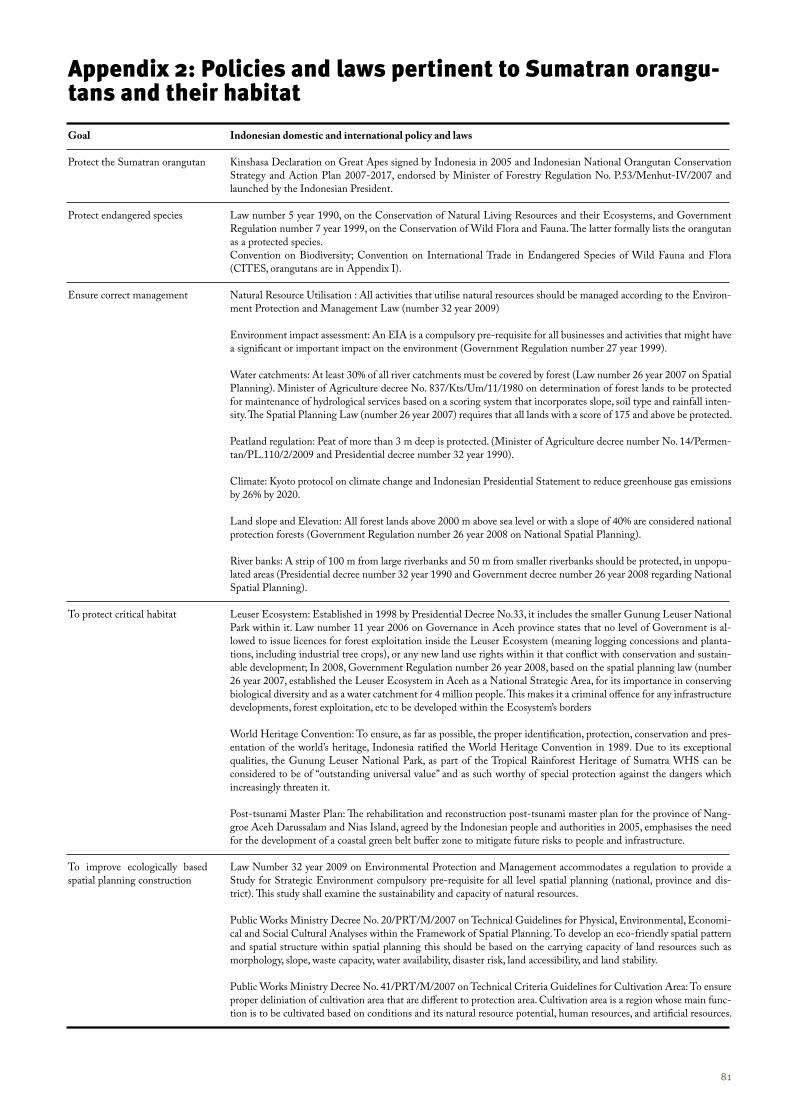
80 81
Goal
Protect the Sumatran orangutan
Protect endangered species
Ensure correct management
To protect critical habitat
To improve ecologically based spatial planning construction
Indonesian domestic and international policy and laws
Kinshasa Declaration on Great Apes signed by Indonesia in 2005 and Indonesian National Orangutan Conservation Strategy and Action Plan 2007-2017, endorsed by Minister of Forestry Regulation No. P.53/Menhut-IV/2007 and launched by the Indonesian President.
Law number 5 year 1990, on the Conservation of Natural Living Resources and their Ecosystems, and Government Regulation number 7 year 1999, on the Conservation of Wild Flora and Fauna. The latter formally lists the orangutan as a protected species.Convention on Biodiversity; Convention on International Trade in Endangered Species of Wild Fauna and Flora (CITES, orangutans are in Appendix I).
Natural Resource Utilisation : All activities that utilise natural resources should be managed according to the Environ-ment Protection and Management Law (number 32 year 2009)
Environment impact assessment: An EIA is a compulsory pre-requisite for all businesses and activities that might have a significant or important impact on the environment (Government Regulation number 27 year 1999).
Water catchments: At least 30% of all river catchments must be covered by forest (Law number 26 year 2007 on Spatial Planning). Minister of Agriculture decree No. 837/Kts/Um/11/1980 on determination of forest lands to be protected for maintenance of hydrological services based on a scoring system that incorporates slope, soil type and rainfall inten-sity. The Spatial Planning Law (number 26 year 2007) requires that all lands with a score of 175 and above be protected.
Peatland regulation: Peat of more than 3 m deep is protected. (Minister of Agriculture decree number No. 14/Permen-tan/PL.110/2/2009 and Presidential decree number 32 year 1990).
Climate: Kyoto protocol on climate change and Indonesian Presidential Statement to reduce greenhouse gas emissions by 26% by 2020.
Land slope and Elevation: All forest lands above 2000 m above sea level or with a slope of 40% are considered national protection forests (Government Regulation number 26 year 2008 on National Spatial Planning).
River banks: A strip of 100 m from large riverbanks and 50 m from smaller riverbanks should be protected, in unpopu-lated areas (Presidential decree number 32 year 1990 and Government decree number 26 year 2008 regarding National Spatial Planning).
Leuser Ecosystem: Established in 1998 by Presidential Decree No.33, it includes the smaller Gunung Leuser National Park within it. Law number 11 year 2006 on Governance in Aceh province states that no level of Government is al-lowed to issue licences for forest exploitation inside the Leuser Ecosystem (meaning logging concessions and planta-tions, including industrial tree crops), or any new land use rights within it that conflict with conservation and sustain-able development; In 2008, Government Regulation number 26 year 2008, based on the spatial planning law (number 26 year 2007, established the Leuser Ecosystem in Aceh as a National Strategic Area, for its importance in conserving biological diversity and as a water catchment for 4 million people. This makes it a criminal offence for any infrastructure developments, forest exploitation, etc to be developed within the Ecosystem’s borders
World Heritage Convention: To ensure, as far as possible, the proper identification, protection, conservation and pres-entation of the world’s heritage, Indonesia ratified the World Heritage Convention in 1989. Due to its exceptional qualities, the Gunung Leuser National Park, as part of the Tropical Rainforest Heritage of Sumatra WHS can be considered to be of “outstanding universal value” and as such worthy of special protection against the dangers which increasingly threaten it.
Post-tsunami Master Plan: The rehabilitation and reconstruction post-tsunami master plan for the province of Nang-groe Aceh Darussalam and Nias Island, agreed by the Indonesian people and authorities in 2005, emphasises the need for the development of a coastal green belt buffer zone to mitigate future risks to people and infrastructure.
Law Number 32 year 2009 on Environmental Protection and Management accommodates a regulation to provide a Study for Strategic Environment compulsory pre-requisite for all level spatial planning (national, province and dis-trict). This study shall examine the sustainability and capacity of natural resources.
Public Works Ministry Decree No. 20/PRT/M/2007 on Technical Guidelines for Physical, Environmental, Economi-cal and Social Cultural Analyses within the Framework of Spatial Planning. To develop an eco-friendly spatial pattern and spatial structure within spatial planning this should be based on the carrying capacity of land resources such as morphology, slope, waste capacity, water availability, disaster risk, land accessibility, and land stability.
Public Works Ministry Decree No. 41/PRT/M/2007 on Technical Criteria Guidelines for Cultivation Area: To ensure proper deliniation of cultivation area that are different to protection area. Cultivation area is a region whose main func-tion is to be cultivated based on conditions and its natural resource potential, human resources, and artificial resources.
Appendix 2: Policies and laws pertinent to Sumatran orangutans and their habitat
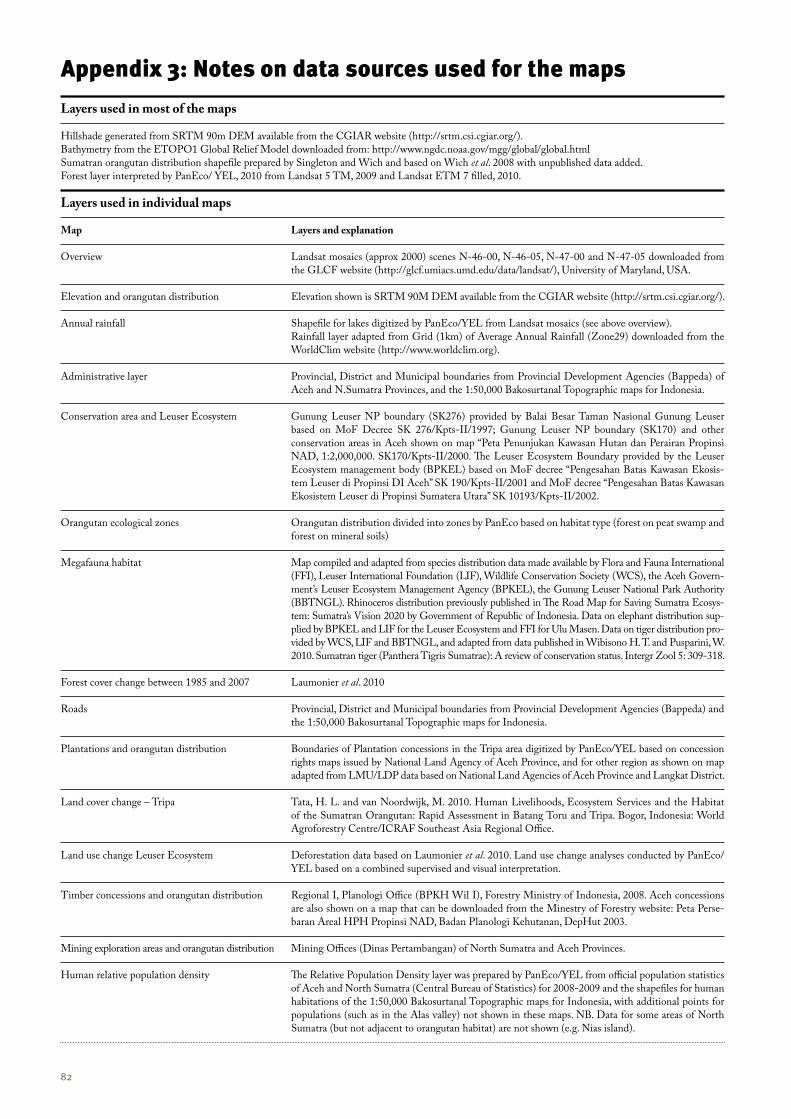
82 83
Map
Overview
Elevation and orangutan distribution
Annual rainfall
Administrative layer
Conservation area and Leuser Ecosystem
Orangutan ecological zones
Megafauna habitat
Forest cover change between 1985 and 2007
Roads
Plantations and orangutan distribution
Land cover change – Tripa
Land use change Leuser Ecosystem
Timber concessions and orangutan distribution
Mining exploration areas and orangutan distribution
Human relative population density
Layers and explanation
Landsat mosaics (approx 2000) scenes N-46-00, N-46-05, N-47-00 and N-47-05 downloaded from the GLCF website (http://glcf.umiacs.umd.edu/data/landsat/), University of Maryland, USA.
Elevation shown is SRTM 90M DEM available from the CGIAR website (http://srtm.csi.cgiar.org/).
Shapefile for lakes digitized by PanEco/YEL from Landsat mosaics (see above overview).Rainfall layer adapted from Grid (1km) of Average Annual Rainfall (Zone29) downloaded from the WorldClim website (http://www.worldclim.org).
Provincial, District and Municipal boundaries from Provincial Development Agencies (Bappeda) of Aceh and N.Sumatra Provinces, and the 1:50,000 Bakosurtanal Topographic maps for Indonesia.
Gunung Leuser NP boundary (SK276) provided by Balai Besar Taman Nasional Gunung Leuser based on MoF Decree SK 276/Kpts-II/1997; Gunung Leuser NP boundary (SK170) and other conservation areas in Aceh shown on map “Peta Penunjukan Kawasan Hutan dan Perairan Propinsi NAD, 1:2,000,000. SK170/Kpts-II/2000. The Leuser Ecosystem Boundary provided by the Leuser Ecosystem management body (BPKEL) based on MoF decree “Pengesahan Batas Kawasan Ekosis-tem Leuser di Propinsi DI Aceh” SK 190/Kpts-II/2001 and MoF decree “Pengesahan Batas Kawasan Ekosistem Leuser di Propinsi Sumatera Utara” SK 10193/Kpts-II/2002.
Orangutan distribution divided into zones by PanEco based on habitat type (forest on peat swamp and forest on mineral soils)
Map compiled and adapted from species distribution data made available by Flora and Fauna International (FFI), Leuser International Foundation (LIF), Wildlife Conservation Society (WCS), the Aceh Govern-ment’s Leuser Ecosystem Management Agency (BPKEL), the Gunung Leuser National Park Authority (BBTNGL). Rhinoceros distribution previously published in The Road Map for Saving Sumatra Ecosys-tem: Sumatra’s Vision 2020 by Government of Republic of Indonesia. Data on elephant distribution sup-plied by BPKEL and LIF for the Leuser Ecosystem and FFI for Ulu Masen. Data on tiger distribution pro-vided by WCS, LIF and BBTNGL, and adapted from data published in Wibisono H. T. and Pusparini, W. 2010. Sumatran tiger (Panthera Tigris Sumatrae): A review of conservation status. Intergr Zool 5: 309-318.
Laumonier et al. 2010
Provincial, District and Municipal boundaries from Provincial Development Agencies (Bappeda) and the 1:50,000 Bakosurtanal Topographic maps for Indonesia.
Boundaries of Plantation concessions in the Tripa area digitized by PanEco/YEL based on concession rights maps issued by National Land Agency of Aceh Province, and for other region as shown on map adapted from LMU/LDP data based on National Land Agencies of Aceh Province and Langkat District.
Tata, H. L. and van Noordwijk, M. 2010. Human Livelihoods, Ecosystem Services and the Habitat of the Sumatran Orangutan: Rapid Assessment in Batang Toru and Tripa. Bogor, Indonesia: World Agroforestry Centre/ICRAF Southeast Asia Regional Office.
Deforestation data based on Laumonier et al. 2010. Land use change analyses conducted by PanEco/YEL based on a combined supervised and visual interpretation.
Regional I, Planologi Office (BPKH Wil I), Forestry Ministry of Indonesia, 2008. Aceh concessions are also shown on a map that can be downloaded from the Minestry of Forestry website: Peta Perse-baran Areal HPH Propinsi NAD, Badan Planologi Kehutanan, DepHut 2003.
Mining Offices (Dinas Pertambangan) of North Sumatra and Aceh Provinces.
The Relative Population Density layer was prepared by PanEco/YEL from official population statistics of Aceh and North Sumatra (Central Bureau of Statistics) for 2008-2009 and the shapefiles for human habitations of the 1:50,000 Bakosurtanal Topographic maps for Indonesia, with additional points for populations (such as in the Alas valley) not shown in these maps. NB. Data for some areas of North Sumatra (but not adjacent to orangutan habitat) are not shown (e.g. Nias island).
Layers used in most of the maps
Hillshade generated from SRTM 90m DEM available from the CGIAR website (http://srtm.csi.cgiar.org/).Bathymetry from the ETOPO1 Global Relief Model downloaded from: http://www.ngdc.noaa.gov/mgg/global/global.htmlSumatran orangutan distribution shapefile prepared by Singleton and Wich and based on Wich et al. 2008 with unpublished data added.Forest layer interpreted by PanEco/ YEL, 2010 from Landsat 5 TM, 2009 and Landsat ETM 7 filled, 2010.
Layers used in individual maps
Appendix 3: Notes on data sources used for the maps
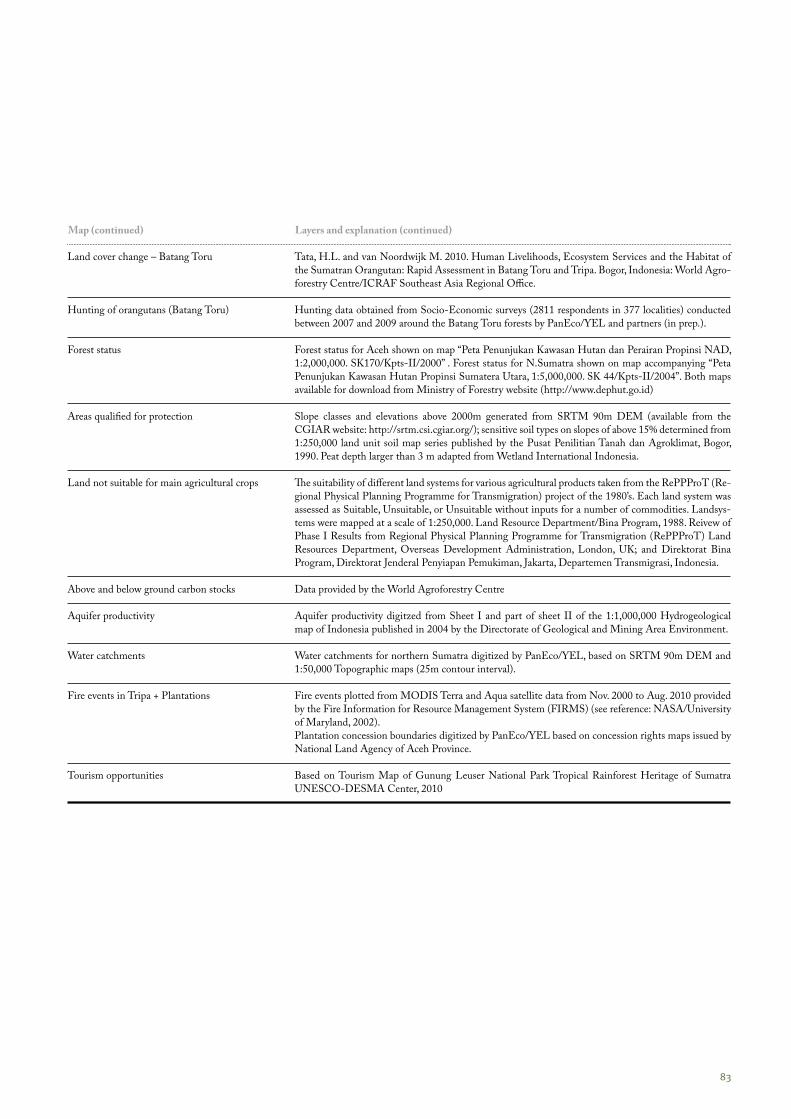
82 83
Map (continued) Layers and explanation (continued)
Land cover change – Batang Toru
Hunting of orangutans (Batang Toru)
Forest status
Areas qualified for protection
Land not suitable for main agricultural crops
Above and below ground carbon stocks
Aquifer productivity
Water catchments
Fire events in Tripa + Plantations
Tourism opportunities
Tata, H.L. and van Noordwijk M. 2010. Human Livelihoods, Ecosystem Services and the Habitat of the Sumatran Orangutan: Rapid Assessment in Batang Toru and Tripa. Bogor, Indonesia: World Agro-forestry Centre/ICRAF Southeast Asia Regional Office.
Hunting data obtained from Socio-Economic surveys (2811 respondents in 377 localities) conducted between 2007 and 2009 around the Batang Toru forests by PanEco/YEL and partners (in prep.).
Forest status for Aceh shown on map “Peta Penunjukan Kawasan Hutan dan Perairan Propinsi NAD, 1:2,000,000. SK170/Kpts-II/2000” . Forest status for N.Sumatra shown on map accompanying “Peta Penunjukan Kawasan Hutan Propinsi Sumatera Utara, 1:5,000,000. SK 44/Kpts-II/2004”. Both maps available for download from Ministry of Forestry website (http://www.dephut.go.id)
Slope classes and elevations above 2000m generated from SRTM 90m DEM (available from the CGIAR website: http://srtm.csi.cgiar.org/); sensitive soil types on slopes of above 15% determined from 1:250,000 land unit soil map series published by the Pusat Penilitian Tanah dan Agroklimat, Bogor, 1990. Peat depth larger than 3 m adapted from Wetland International Indonesia.
The suitability of different land systems for various agricultural products taken from the RePPProT (Re-gional Physical Planning Programme for Transmigration) project of the 1980’s. Each land system was assessed as Suitable, Unsuitable, or Unsuitable without inputs for a number of commodities. Landsys-tems were mapped at a scale of 1:250,000. Land Resource Department/Bina Program, 1988. Reivew of Phase I Results from Regional Physical Planning Programme for Transmigration (RePPProT) Land Resources Department, Overseas Development Administration, London, UK; and Direktorat Bina Program, Direktorat Jenderal Penyiapan Pemukiman, Jakarta, Departemen Transmigrasi, Indonesia.
Data provided by the World Agroforestry Centre
Aquifer productivity digitzed from Sheet I and part of sheet II of the 1:1,000,000 Hydrogeological map of Indonesia published in 2004 by the Directorate of Geological and Mining Area Environment.
Water catchments for northern Sumatra digitized by PanEco/YEL, based on SRTM 90m DEM and 1:50,000 Topographic maps (25m contour interval).
Fire events plotted from MODIS Terra and Aqua satellite data from Nov. 2000 to Aug. 2010 provided by the Fire Information for Resource Management System (FIRMS) (see reference: NASA/University of Maryland, 2002).Plantation concession boundaries digitized by PanEco/YEL based on concession rights maps issued by National Land Agency of Aceh Province.
Based on Tourism Map of Gunung Leuser National Park Tropical Rainforest Heritage of Sumatra UNESCO-DESMA Center, 2010
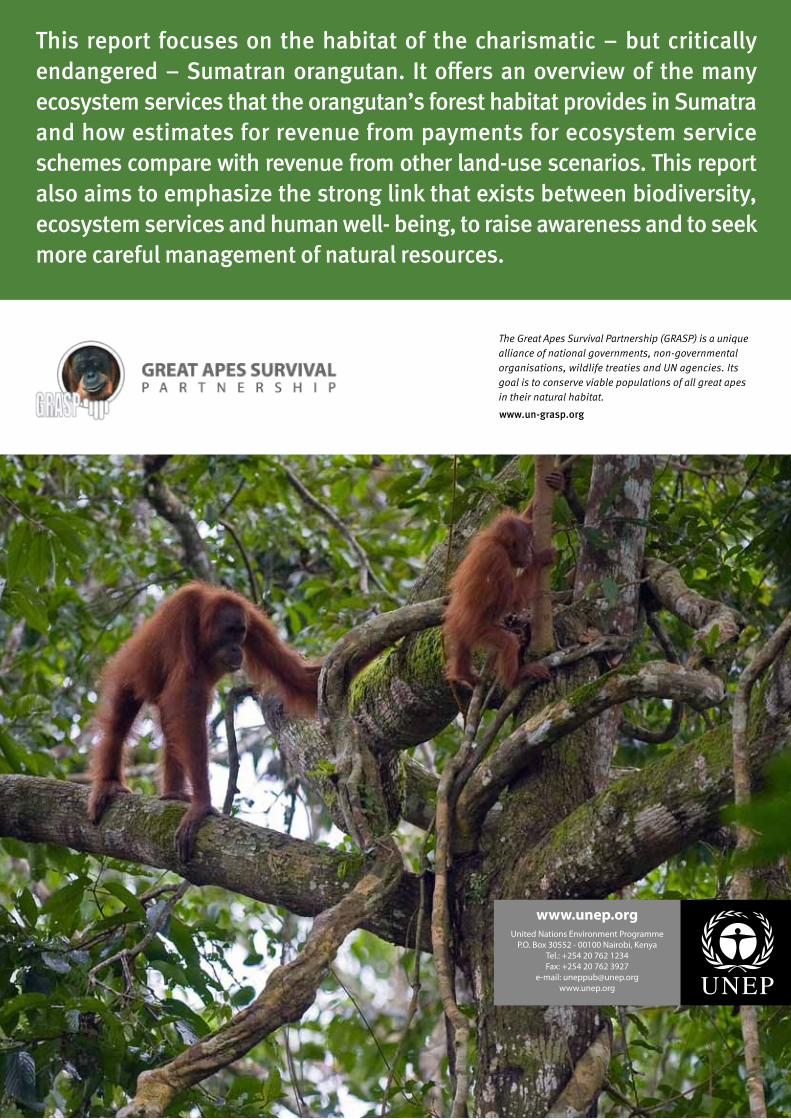
This report focuses on the habitat of the charismatic – but critically endangered – Sumatran orangutan. It offers an overview of the many ecosystem services that the orangutan’s forest habitat provides in Sumatra and how estimates for revenue from payments for ecosystem service schemes compare with revenue from other land-use scenarios. This report also aims to emphasize the strong link that exists between biodiversity, ecosystem services and human well- being, to raise awareness and to seek more careful management of natural resources.
The Great Apes Survival Partnership (GRASP) is a unique alliance of national governments, non-governmental organisations, wildlife treaties and UN agencies. Its goal is to conserve viable populations of all great apes in their natural habitat.www.un-grasp.org
www.unep.orgUnited Nations Environment Programme
P.O. Box 30552 - 00100 Nairobi, KenyaTel.: +254 20 762 1234Fax: +254 20 762 3927
e-mail: [email protected]