Oracle® Application Express - End User's Guide
149
Oracle® Application Express End User's Guide Release 18.1 E86880-03 May 2018
-
Upload
khangminh22 -
Category
Documents
-
view
4 -
download
0
Transcript of Oracle® Application Express - End User's Guide

Oracle® Application ExpressEnd User's Guide
Release 18.1E86880-03May 2018

Oracle Application Express End User's Guide, Release 18.1
E86880-03
Copyright © 2003, 2018, Oracle and/or its affiliates. All rights reserved.
Primary Author: John Godfrey
Contributing Authors: Terri Jennings, Christina Cho, Hilary Farrell, David Peake, Patrick Maniraho, CarstenCzarski
This software and related documentation are provided under a license agreement containing restrictions onuse and disclosure and are protected by intellectual property laws. Except as expressly permitted in yourlicense agreement or allowed by law, you may not use, copy, reproduce, translate, broadcast, modify,license, transmit, distribute, exhibit, perform, publish, or display any part, in any form, or by any means.Reverse engineering, disassembly, or decompilation of this software, unless required by law forinteroperability, is prohibited.
The information contained herein is subject to change without notice and is not warranted to be error-free. Ifyou find any errors, please report them to us in writing.
If this is software or related documentation that is delivered to the U.S. Government or anyone licensing it onbehalf of the U.S. Government, then the following notice is applicable:
U.S. GOVERNMENT END USERS: Oracle programs, including any operating system, integrated software,any programs installed on the hardware, and/or documentation, delivered to U.S. Government end users are"commercial computer software" pursuant to the applicable Federal Acquisition Regulation and agency-specific supplemental regulations. As such, use, duplication, disclosure, modification, and adaptation of theprograms, including any operating system, integrated software, any programs installed on the hardware,and/or documentation, shall be subject to license terms and license restrictions applicable to the programs.No other rights are granted to the U.S. Government.
This software or hardware is developed for general use in a variety of information management applications.It is not developed or intended for use in any inherently dangerous applications, including applications thatmay create a risk of personal injury. If you use this software or hardware in dangerous applications, then youshall be responsible to take all appropriate fail-safe, backup, redundancy, and other measures to ensure itssafe use. Oracle Corporation and its affiliates disclaim any liability for any damages caused by use of thissoftware or hardware in dangerous applications.
Oracle and Java are registered trademarks of Oracle and/or its affiliates. Other names may be trademarks oftheir respective owners.
Intel and Intel Xeon are trademarks or registered trademarks of Intel Corporation. All SPARC trademarks areused under license and are trademarks or registered trademarks of SPARC International, Inc. AMD, Opteron,the AMD logo, and the AMD Opteron logo are trademarks or registered trademarks of Advanced MicroDevices. UNIX is a registered trademark of The Open Group.
This software or hardware and documentation may provide access to or information about content, products,and services from third parties. Oracle Corporation and its affiliates are not responsible for and expresslydisclaim all warranties of any kind with respect to third-party content, products, and services unless otherwiseset forth in an applicable agreement between you and Oracle. Oracle Corporation and its affiliates will not beresponsible for any loss, costs, or damages incurred due to your access to or use of third-party content,products, or services, except as set forth in an applicable agreement between you and Oracle.

Contents
Preface
Audience x
Documentation Accessibility x
Related Documents x
Conventions xi
Changes in This Release
Changes in Oracle Application Express Release 18.1 xii
1 About Oracle Application Express
1.1 Browser Requirements 1-1
1.2 About Oracle Application Express 1-1
1.3 About Database Applications 1-2
1.4 About Websheet Applications 1-2
2 Using Interactive Grids
2.1 About Interactive Grids 2-2
2.2 About Editable Interactive Grids 2-3
2.3 Accessing Interactive Grids 2-4
2.3.1 About Interactive Grid URLs 2-4
2.3.2 Accessing an Interactive Grid 2-5
2.4 Using an Interactive Grid 2-5
2.4.1 Searching in an Interactive Grid 2-6
2.4.1.1 About the Search Bar 2-6
2.4.1.2 Using the Select Columns To Search Icon 2-7
2.4.2 Rearranging Columns Using Drag and Drop 2-7
2.4.3 Resizing Columns in an Interactive Grid 2-8
2.4.4 Sorting Columns in an Interactive Grid 2-8
2.4.5 Using Charts in an Interactive Grid 2-9
2.5 Customizing an Interactive Grid with the Actions Menu 2-11
iii

2.5.1 About the Actions Menu in an Interactive Grid 2-12
2.5.2 Changing the Column Display in an Interactive Grid 2-15
2.5.3 Filtering an Interactive Grid 2-16
2.5.3.1 About Filters in Interactive Grids 2-16
2.5.3.2 Creating a Row Filter in an Interactive Grid 2-17
2.5.3.3 Creating a Column Filter in an Interactive Grid 2-17
2.5.3.4 Editing a Filter in an Interactive Grid 2-18
2.5.3.5 Disabling a Filter in an Interactive Grid 2-18
2.5.3.6 Removing a Filter from an Interactive Grid 2-19
2.5.4 Selecting Column Sort Order in an Interactive Grid 2-20
2.5.5 Defining an Aggregation in an Interactive Grid 2-20
2.5.5.1 Creating an Aggregation in an Interactive Grid 2-20
2.5.5.2 Editing an Aggregation in an Interactive Grid 2-22
2.5.5.3 Removing an Aggregation in an Interactive Grid 2-23
2.5.6 Creating a Control Break from the Actions Menu in an Interactive Grid 2-24
2.5.7 Adding Highlighting to an Interactive Grid 2-25
2.6 Customizing an Interactive Grid with the Column Heading Menu 2-26
2.6.1 About the Column Heading Menu in an Interactive Grid 2-27
2.6.2 Displaying the Column Heading Menu 2-28
2.6.3 Creating a Control Break in an Interactive Grid 2-28
2.6.4 Creating an Aggregation with the Column Heading Menu 2-30
2.6.5 Freezing Columns in Place 2-30
2.6.6 Hiding Columns in an Interactive Grid 2-31
2.6.7 Unhiding Columns in an Interactive Grid 2-32
2.6.8 Filtering with the Column Heading Menu 2-33
2.7 Using an Editable Interactive Grid 2-34
2.7.1 Adding a Row in an Editable Interactive Grid 2-34
2.7.2 Editing Rows in an Interactive Grid 2-34
2.7.2.1 About the Row Actions Menu in an Editable Interactive Grid 2-35
2.7.2.2 About the Edit Button in an Editable Interactive Grid 2-36
2.7.2.3 Editing a Cell in an Interactive Grid 2-36
2.7.2.4 Editing Multiple Rows in an Editable Interactive Grid 2-37
2.7.3 Deleting a Row in an Interactive Grid 2-37
2.7.4 Modifying Multiple Rows and Cells in an Editable Interactive Grid 2-38
2.7.4.1 About Selection Modes in an Editable Interactive Grid 2-38
2.7.4.2 Changing Selection Mode in an Editable Interactive Grid 2-39
2.7.4.3 Copying to Multiple Rows in an Editable Interactive Grid 2-39
2.7.4.4 Copying to Multiple Cells in an Editable Interactive Grid 2-40
2.7.4.5 Filling Cells in an Editable Interactive Grid 2-40
2.7.4.6 Clearing Cells in an Interactive Grid 2-41
2.8 Saving Interactive Grids 2-42
iv

2.8.1 About Interactive Grid Report Types 2-42
2.8.2 Saving a Report in an Interactive Grid 2-43
2.8.3 Renaming a Report in an Interactive Grid 2-44
2.8.4 Deleting a Report in an Interactive Grid 2-44
2.9 Resetting Interactive Grids 2-44
2.9.1 Refreshing an Interactive Grid 2-45
2.9.2 Resetting an Interactive Grid 2-45
2.9.3 How the Reset Button Affects Saved Interactive Grid Reports 2-46
2.9.4 Reverting an Interactive Grid to a Specific Save State 2-47
2.10 Downloading or Emailing an Interactive Grid 2-47
3 Using Interactive Reports
3.1 About Interactive Reports 3-1
3.2 Accessing Interactive Reports 3-2
3.2.1 About Interactive Report URLs 3-3
3.2.2 Accessing an Interactive Report 3-3
3.3 Using the Search Bar 3-4
3.4 Using the Select Columns To Search Icon 3-4
3.5 Using the Column Heading Menu 3-5
3.6 Using Interactive Report Filters 3-6
3.7 Customizing an Interactive Report Using the Actions Menu 3-7
3.7.1 About the Actions Menu 3-8
3.7.2 Selecting Columns to Display 3-10
3.7.3 Adding a Filter 3-10
3.7.3.1 About Creating Filters 3-11
3.7.3.2 Adding, Editing, and Removing a Column Filter 3-11
3.7.3.3 Adding, Editing, and Removing a Row Filter 3-12
3.7.4 Selecting Column Sort Order 3-12
3.7.5 Creating a Control Break 3-13
3.7.6 Adding Highlighting 3-13
3.7.7 Computing Columns 3-15
3.7.7.1 Creating a Computation 3-15
3.7.7.2 Deleting a Computation 3-16
3.7.8 Defining an Aggregation Against a Column 3-17
3.7.8.1 Creating an Aggregation Against a Column 3-17
3.7.8.2 Removing a Column Aggregation 3-18
3.7.9 Creating a Chart from the Actions Menu 3-18
3.7.9.1 Creating a Chart 3-18
3.7.9.2 Editing a Chart 3-19
3.7.9.3 Deleting a Chart 3-19
v

3.7.10 Grouping Columns 3-20
3.7.10.1 Creating a Group By 3-20
3.7.10.2 Editing a Group By 3-21
3.7.10.3 Selecting a Group By Sort Order 3-22
3.7.10.4 Deleting a Group By 3-22
3.7.11 Managing Pivot Reports 3-22
3.7.11.1 Creating a Pivot Report 3-23
3.7.11.2 Editing a Pivot Report 3-24
3.7.11.3 Deleting a Pivot Report 3-24
3.7.12 Executing a Flashback Query 3-24
3.7.12.1 Creating a Flashback Query 3-24
3.7.12.2 Editing a Flashback Query 3-25
3.7.12.3 Deleting a Flashback Query 3-25
3.7.13 Saving an Interactive Report 3-25
3.7.13.1 About the Report List 3-26
3.7.13.2 About Configuration Dependencies 3-26
3.7.13.3 Saving a Public or Private Interactive Report 3-26
3.7.13.4 Renaming a Public or Private Interactive Report 3-27
3.7.13.5 Deleting a Public or Private Interactive Report 3-28
3.7.14 Resetting a Report 3-28
3.7.15 Downloading a Report 3-28
3.7.16 Subscribing to Report Updates by Email 3-29
3.7.16.1 How Report Subscriptions Work 3-29
3.7.16.2 Subscribing to Updated Report Results 3-29
4 Data Loading Wizard Examples
4.1 About Using the Data Loading Wizard 4-1
4.2 Importing Data from a File into Your Application 4-2
4.3 Copying and Pasting Data into Your Application 4-5
5 Using Websheets
5.1 About Websheet Applications 5-2
5.2 Accessing Websheets 5-2
5.2.1 About Websheet URLs 5-2
5.2.2 Accessing a Websheet 5-3
5.3 Using Websheets 5-4
5.3.1 Breadcrumb Sections 5-4
5.3.2 Navigation Sections 5-5
5.3.3 Showing and Hiding Page Sections 5-5
vi

5.3.4 Online Help 5-6
5.3.5 Signing out of a Websheet 5-6
5.3.6 About the Websheet Search Bar 5-6
5.3.7 Control Panel 5-7
5.4 Managing Websheet Pages 5-8
5.4.1 Adding a New Page 5-9
5.4.2 Copying an Existing Page 5-9
5.4.3 Editing Page Details 5-9
5.5 Adding and Editing Page Sections 5-10
5.5.1 About Page Section Types 5-10
5.5.2 Editing Page Sections 5-11
5.5.3 Deleting Page Sections 5-11
5.5.4 Editing Section Titles and Display Order 5-12
5.6 Adding and Editing Text Sections 5-12
5.6.1 Adding a Text Section 5-13
5.6.2 Editing a Text Section 5-14
5.7 Adding a Navigation Section 5-15
5.8 Managing Data Grids 5-16
5.8.1 About Data Grids 5-17
5.8.2 Creating a Data Grid 5-17
5.8.2.1 Creating a Data Grid from Scratch 5-17
5.8.2.2 Creating a Data Grid by Copying and Pasting Spreadsheet Data 5-18
5.8.3 Copying a Data Grid 5-18
5.8.4 Viewing and Editing a Data Grid 5-19
5.8.4.1 Accessing the Data Page 5-20
5.8.4.2 Toggling Check Boxes 5-21
5.8.4.3 Editing Data Grid Data 5-21
5.8.4.4 Editing Data Grid Columns Manually 5-22
5.8.4.5 Editing Data Grid Rows Manually 5-23
5.8.4.6 Editing a Single Data Grid Row 5-23
5.8.4.7 Adding Annotations to a Single Data Grid Row 5-24
5.8.4.8 Displaying Annotation Columns in a Data Grid Report 5-25
5.8.4.9 Displaying Pseudo Columns in a Data Grid Report 5-25
5.8.4.10 Editing Data Grid Properties 5-26
5.8.4.11 Creating a Bookmark Link to a Data Grid 5-26
5.8.5 Viewing the Data Grid Change History Log 5-27
5.8.6 Deleting a Data Grid 5-27
5.9 Adding and Editing Data Content 5-27
5.9.1 About Available Data Sources 5-27
5.9.2 Enabling Support for Creating Data Reports 5-28
5.9.3 About Incorporating Data into Websheet Pages 5-28
vii

5.10 Adding Data Reports 5-28
5.10.1 About Data Reports 5-29
5.10.2 Creating a Data Report 5-29
5.10.3 Viewing and Modifying a Data Report 5-30
5.10.4 Deleting a Data Report 5-31
5.11 Creating Data Sections Based on a Data Grid or Report 5-31
5.11.1 Adding a Data Section to a Page 5-31
5.11.2 Editing a Data Section 5-32
5.12 Creating Chart Sections 5-32
5.12.1 Adding a Chart Section 5-33
5.12.2 Editing a Chart Section 5-34
5.13 Understanding Markup Syntax 5-34
5.13.1 Linking to a Page 5-35
5.13.2 Linking to a Section 5-35
5.13.3 Linking to External URLs 5-36
5.13.4 Linking to a Data Grid 5-36
5.13.5 Using SQL and SQLVALUE Syntax 5-37
5.13.6 Advanced Data Grid Queries Rules 5-38
5.14 Managing Annotations 5-38
5.14.1 Managing Uploaded Files and Images 5-39
5.14.1.1 Uploading Files and Images 5-39
5.14.1.2 Including a Download Link in a Page Section 5-40
5.14.1.3 Displaying an Uploaded Image Inline 5-40
5.14.1.4 Editing or Deleting Uploaded Files 5-40
5.14.2 Adding Tags 5-41
5.14.2.1 Adding Tags 5-41
5.14.2.2 Editing Existing Tags 5-41
5.14.2.3 Deleting Existing Tags 5-42
5.14.3 Adding Notes 5-42
5.14.3.1 Adding Notes 5-42
5.14.3.2 Editing or Deleting Existing Notes 5-42
5.14.4 Viewing and Deleting Annotations 5-43
5.14.4.1 Accessing the Annotations Page 5-43
5.14.4.2 Deleting Annotations 5-43
5.15 Managing Websheet Applications 5-44
5.15.1 Changing Your Websheet Password 5-44
5.15.2 Emailing a Websheet Page 5-44
5.15.3 Printing a Websheet Page 5-45
5.16 Viewing Websheets 5-45
5.16.1 About Presentation Mode 5-46
5.16.2 Viewing the Page Directory 5-46
viii

5.16.3 Viewing Page History 5-47
5.16.4 Viewing the Websheet Directory 5-47
Index
ix

Preface
Oracle Application Express End User’s Guide offers an introduction to using OracleApplication Express applications from an end user's perspective. This guide explainshow to use interactive grids, interactive reports, Websheets, and use applications thatinclude the ability to upload data.
• Audience (page x)
• Documentation Accessibility (page x)
• Related Documents (page x)
• Conventions (page xi)
AudienceOracle Application Express End User's Guide is intended for end users who arerunning Oracle Application Express applications. To use this guide, you must have ageneral understanding of relational database concepts and an understanding of theoperating system environment under which you are running Oracle ApplicationExpress.
Documentation AccessibilityFor information about Oracle's commitment to accessibility, visit the OracleAccessibility Program website at http://www.oracle.com/pls/topic/lookup?ctx=acc&id=docacc.
Access to Oracle Support
Oracle customers that have purchased support have access to electronic supportthrough My Oracle Support. For information, visit http://www.oracle.com/pls/topic/lookup?ctx=acc&id=info or visit http://www.oracle.com/pls/topic/lookup?ctx=acc&id=trsif you are hearing impaired.
Related DocumentsFor more information, see these Oracle resources:
• Oracle Application Express Release Notes
• Oracle Application Express Installation Guide
• Oracle Application Express App Builder User’s Guide
• Oracle Application Express Administration Guide
• Oracle Application Express SQL Workshop Guide
Preface
x

• Oracle Application Express API Reference
• Oracle Application Express Application Migration Guide
• Oracle Application Express Accessibility Guide
ConventionsThe following text conventions are used in this document:
Convention Meaning
boldface Boldface type indicates graphical user interface elements associatedwith an action, or terms defined in text or the glossary.
italic Italic type indicates book titles, emphasis, or placeholder variables forwhich you supply particular values.
monospace Monospace type indicates commands within a paragraph, URLs, codein examples, text that appears on the screen, or text that you enter.
Preface
xi

Changes in This Release
• Changes in Oracle Application Express Release 18.1 (page xii)
Changes in Oracle Application Express Release 18.1The following are changes in Oracle Application Express End User’s Guide for OracleApplication Express release 18.1.
• Deprecated and Desupported Features (page xii)
• Other Changes (page xii)
Deprecated and Desupported FeaturesSee "Deprecated Features" and "Desupported Features" in Oracle Application ExpressRelease Notes.
Other ChangesThe following are additional changes in the release:
• All content has been updated to reflect new functionality.
• Screen captures and graphics have been added and updated to reflect the currentOracle Application Express user interface.
Changes in This Release
xii

1About Oracle Application Express
Oracle Application Express is a rapid web application development tool for the OracleDatabase.
• Browser Requirements (page 1-1)Oracle Application Express requires a JavaScript-enabled browser and supportsthe current and prior major release of Google Chrome, Mozilla Firefox, AppleSafari, Microsoft Internet Explorer, and Microsoft Edge.
• About Oracle Application Express (page 1-1)Oracle Application Express is a rapid web application development tool for theOracle Database.
• About Database Applications (page 1-2)A database application is an interactive user interface (UI) that enables you todisplay, add, update, or delete information stored in the Oracle Database orREST-based API. A database application can display information in many formats,including static and interactive reports, forms, charts, and interactive grids.
• About Websheet Applications (page 1-2)Websheet applications are interactive web pages that combine text with data. Youcan define these highly dynamic applications in a number of ways.
See Also:
"Quick Start" in Oracle Application Express App Builder User’s Guide
1.1 Browser RequirementsOracle Application Express requires a JavaScript-enabled browser and supports thecurrent and prior major release of Google Chrome, Mozilla Firefox, Apple Safari,Microsoft Internet Explorer, and Microsoft Edge.
Note:
Microsoft Internet Explorer 11 is the prior major release, with Microsoft Edgebeing the current Microsoft browser.
1.2 About Oracle Application ExpressOracle Application Express is a rapid web application development tool for the OracleDatabase.
1-1

Developers assemble an HTML interface (or application) on top of database objectswith wizards or direct input. Each application is a collection of linked pages using tabs,buttons, or hypertext links.
You can manage, manipulate, and display the data in an Oracle Database or REST-based API in an Oracle Application Express application.
Developers can build two types of applications in Oracle Application Express:
• Database applications
• Websheet applications
1.3 About Database ApplicationsA database application is an interactive user interface (UI) that enables you to display,add, update, or delete information stored in the Oracle Database or REST-based API.A database application can display information in many formats, including static andinteractive reports, forms, charts, and interactive grids.
This guide explains how you can customize interactive grids and interactive reports. Inan interactive grid or interactive report, you can customize the appearance of reportdata through searching, filtering, sorting, column selection, highlighting, and other datamanipulations. You can save your customizations in the application or, depending onthe developer’s configuration, you can also download reports locally for offline use.
This guide also explains how to import data into an Oracle Application Expressapplication using an existing application Data Loading Wizard.
1.4 About Websheet ApplicationsWebsheet applications are interactive web pages that combine text with data. You candefine these highly dynamic applications in a number of ways.
Websheet applications include navigation controls, search capabilities, and the abilityto add annotations such as files, notes, and tags. Websheet applications can besecured using access control lists and several built-in authentication models.
Chapter 1About Database Applications
1-2

2Using Interactive Grids
An interactive grid presents a set of data in a searchable, customizable report. In aneditable interactive grid, users can also add to, modify, and delete the data set directlyon the page.
• About Interactive Grids (page 2-2)Interactive grids feature many ways to change how the data is displayed. Optionsinclude the Actions menu, Column Heading menus, and the ability to rearrange thereport interactively using the mouse.
• About Editable Interactive Grids (page 2-3)Editable interactive grids possess all the same functionality of regular interactivegrids, plus some additional functions in the interface and the customization menus.You can add, edit, delete, and refresh much of the underlying data in an editablegrid.
• Accessing Interactive Grids (page 2-4)Access an interactive grid by logging into the database application and navigatingto the interactive grid URL.
• Using an Interactive Grid (page 2-5)Use the interactive grid’s menus and interface to search the grid, add elementssuch as filters and computations, reorganize with sort and breaks, and furthercustomize how the data displays.
• Customizing an Interactive Grid with the Actions Menu (page 2-11)Reconfigure and augment how an interactive grid displays data by using theActions menu.
• Customizing an Interactive Grid with the Column Heading Menu (page 2-26)Use the Column Heading menu to quickly customize a column in an interactivegrid.
• Using an Editable Interactive Grid (page 2-34)Editable interactive grids expand the functionality of regular interactive grids toenable you to more directly update a grid’s structure and contents. You can addand delete rows, edit cell contents, and refresh the grid with the latest updates.
• Saving Interactive Grids (page 2-42)Save your changes as a new report within the application. Name and keep theseinteractive grid reports Private or make them Public to share with other users.
• Resetting Interactive Grids (page 2-44)You can refresh, reset, or flashback a grid to revert your changes to it. Resettingan interactive grid can have different outcomes depending on the report type.
• Downloading or Emailing an Interactive Grid (page 2-47)Obtain the data of an interactive grid as a CSV or HTML file by selectingDownload in the Actions menu.
2-1

See Also:
"Managing Interactive Grids" in Oracle Application Express App BuilderUser’s Guide
2.1 About Interactive GridsInteractive grids feature many ways to change how the data is displayed. Optionsinclude the Actions menu, Column Heading menus, and the ability to rearrange thereport interactively using the mouse.
Interactive Grid Interface
By default, all interactive grids have a search bar, Actions menu, and Reset button.Interactive grids also have Column Heading Menus, which you access by clicking thename or heading of a column.
Chapter 2About Interactive Grids
2-2

You can hide, filter, freeze, highlight, sort, and create control breaks on individualcolumns with the Actions and Column Heading menus. Advanced users can alsodefine aggregations, which appear at the bottom of the column or column group.
Using the mouse, you can resize columns or drag and drop columns into differentplaces to directly customize the appearance of an interactive grid. (The width andorder of columns can also be configured in the Columns dialog.)
You can quickly chart the data with the Chart function. This feature is useful for quickdata visualization or even presentation, and responds immediately to changes in thedata.
You can quickly revert your modifications with the Reset function or perform anincremental revert with the Flashback function. You can use the Refresh function topull in the latest version of the data on the database (useful for highly dynamicdatasets).
Reports in Interactive Grids
You can save your customizations to an interactive grid within the application as areport.
2.2 About Editable Interactive GridsEditable interactive grids possess all the same functionality of regular interactive grids,plus some additional functions in the interface and the customization menus. You canadd, edit, delete, and refresh much of the underlying data in an editable grid.
About Editable Interactive Grids
While an interactive grid provides users with a searchable, sortable, and customizableset of data, with an editable interactive grid you can also change or update the data.An editable interactive grid allows you to select, add, and change a grid’s contents inreal time, similar to working in spreadsheet software.
Chapter 2About Editable Interactive Grids
2-3

Editable Cells
You can change the contents of an individual cell in real time by double-clicking a cell.
You can also toggle the Edit button to enable improved keyboard usability whenupdating multiple columns. For example, rather than pointing and clicking on every cellin the grid, you can use the Tab and Ctrl + Tab keys move focus across cells in a row.
Editable Rows
The primary way of adding new content to an editable interactive grid is by adding newrows. You can use the Row Actions menu to edit an individual row, or the SelectionActions menu to edit multiple rows at once.
2.3 Accessing Interactive GridsAccess an interactive grid by logging into the database application and navigating tothe interactive grid URL.
• About Interactive Grid URLs (page 2-4)You can access interactive grids directly with their URL. Interactive grid URLscontain an application ID and a page ID. When you access an application page,the session ID also generates in the address bar.
• Accessing an Interactive Grid (page 2-5)Access an interactive grid by navigating to the URL provided by your applicationdeveloper. Ensure the URL includes the application ID and page ID, but not thesession state ID.
2.3.1 About Interactive Grid URLsYou can access interactive grids directly with their URL. Interactive grid URLs containan application ID and a page ID. When you access an application page, the session IDalso generates in the address bar.
Parts of an Interactive Grid URL
The following is an example of an Interactive Grid URL:
http://apex.somewhere.com/pls/apex/f?p=4350:1:220883407765693447
f?p=
Indicates that you are accessing an Oracle Application Express application.
4350
The application ID. The application ID specifies which application to access.
1
The page ID. The page ID specifies which page to access within the application.Depending on how the developer configured the page, the page ID may be a word,such as home.
220883407765693447
The session ID. The Application Express engine uses the session ID to fetch sessionstate from the database. Oracle Application Express assigns new session IDs during
Chapter 2Accessing Interactive Grids
2-4

authentication processing, records the authenticated user's identity with the sessionID, and continually checks the session ID in each page request's URL or POST datawith the session cookie and the session record in the database.
WARNING:
Do not enter the session ID when you access an interactive grid URL.Entering information beyond the page ID displays an error.
See Also:
"About Session IDs" in Oracle Application Express App Builder User’s Guide
2.3.2 Accessing an Interactive GridAccess an interactive grid by navigating to the URL provided by your applicationdeveloper. Ensure the URL includes the application ID and page ID, but not thesession state ID.
If you do not have a URL or the URL does not work, contact the developer.
To access an interactive grid:
1. Click the supplied URL, or enter it in your browser's Address field.
A Login page appears.
2. On the Login page:
a. Username - Enter your username.
b. Password - Enter your password.
c. Click Log In.
Tip:
The language that displays differs depending upon who creates theapplication. For Oracle-supplied applications, including packagedapplications and the Oracle Application Express developmentenvironment, Sign In or Sign out displays. For applications you or yourdevelopers create, Log In or Log out displays.
The interactive grid appears.
2.4 Using an Interactive GridUse the interactive grid’s menus and interface to search the grid, add elements suchas filters and computations, reorganize with sort and breaks, and further customizehow the data displays.
Chapter 2Using an Interactive Grid
2-5

• Searching in an Interactive Grid (page 2-6)Search an interactive grid by entering criteria into the Search Bar.
• Rearranging Columns Using Drag and Drop (page 2-7)Drag and drop a column into place by clicking and holding the drag handle on thecolumn heading.
• Resizing Columns in an Interactive Grid (page 2-8)Resize the width of a column by clicking and holding the edge of a column headingand adjusting it with the mouse.
• Sorting Columns in an Interactive Grid (page 2-8)Specify the alphabetical, numerical, or chronological order of a column by clickingthe Sort Ascending and Sort Descending buttons on the column heading.
• Using Charts in an Interactive Grid (page 2-9)Create a chart in an interactive grid by selecting Chart in the Actions menu. Edit orremove the chart with the Edit Chart filter.
2.4.1 Searching in an Interactive GridSearch an interactive grid by entering criteria into the Search Bar.
Tip:
You can also search an interactive grid using a supported browser’s searchfunction (such as Ctrl + F or Cmd + F).
• About the Search Bar (page 2-6)You can perform text searches with the Search Bar at the top of an interactivegrid.
• Using the Select Columns To Search Icon (page 2-7)Narrow your search parameters by clicking the Select Columns to Search icon(magnifying glass).
2.4.1.1 About the Search BarYou can perform text searches with the Search Bar at the top of an interactive grid.
Select Columns to Search iconResembles a magnifying glass. Narrows your search.See "Using the Select Columns To Search Icon (page 2-7)."
Text areaDisplays entered search criteria (wildcard characters are implied).
Go buttonExecutes a search.
Chapter 2Using an Interactive Grid
2-6

2.4.1.2 Using the Select Columns To Search IconNarrow your search parameters by clicking the Select Columns to Search icon(magnifying glass).
To search a specific column:
1. Click the Select Columns to Search icon.
2. Select the name of a column.
3. (Optional) To enable case sensitive searching, select Case Sensitive.
4. Enter a search string in the Search field.
5. Press the Enter key or click Go.
The interactive grid reloads with a filter applied.To reset the search bar back to the default setting, click the Select Columns toSearch icon and select All Text Columns.
You may need to disable or remove existing filters for broader searching to take effect.
2.4.2 Rearranging Columns Using Drag and DropDrag and drop a column into place by clicking and holding the drag handle on thecolumn heading.
You can also rearrange the order of the columns in the Columns dialog.
To drag and drop a column:
1. Hover the mouse over a column heading to display the drag handle.
The mouse cursor also changes when it comes into contact with the drag handle.
2. Click and hold the drag handle.
3. Drag the column to the desired location.
The heading shifts out of place in the row.
4. While holding the mouse, use the indicator to determine which column to place thedragged column ahead of.
5. Release the mouse.
The column drops into place.
To undo all changes, click the Reset button.
Chapter 2Using an Interactive Grid
2-7

WARNING:
Resetting an interactive grid reverts it to a previously saved state. Anychanges since that time may be lost.
2.4.3 Resizing Columns in an Interactive GridResize the width of a column by clicking and holding the edge of a column headingand adjusting it with the mouse.
To resize a column with your mouse:
1. Hover your mouse cursor over the edge of column heading until the cursorchanges.
2. Click and hold the mouse.
3. Move the mouse left and right to achieve the desired width.
4. Release the mouse.
The column resizes.To undo all changes, click the Reset button.
WARNING:
Resetting an interactive grid reverts it to a previously saved state. Anychanges since that time may be lost.
2.4.4 Sorting Columns in an Interactive GridSpecify the alphabetical, numerical, or chronological order of a column by clicking theSort Ascending and Sort Descending buttons on the column heading.
Chapter 2Using an Interactive Grid
2-8

To specify the sort order of a column:
1. Hover the mouse in the column heading.
The Sort Ascending and Sort Descending buttons display.
2. Do one of the following:
• To sort a column in ascending order (A to Z, 1 to 9, earliest to latest), click theSort Ascending button (up arrow).
• To sort a column in descending order (Z to A, 9 to 1, latest to earliest), clickthe Sort Descending button (down arrow).
• To remove an existing sort, click the toggled button again (now labeled Don’tSort).
The column sorts.
2.4.5 Using Charts in an Interactive GridCreate a chart in an interactive grid by selecting Chart in the Actions menu. Edit orremove the chart with the Edit Chart filter.
To create a chart from the data in an interactive grid:
1. Click the Actions menu and select Chart.
The Chart dialog appears.
2. Select a chart type.
The dialog populates with options specific to the selected chart type. For example,a bar chart has a different set of configuration fields than a pie chart. Selectdifferent types to see the range of available options.
Chapter 2Using an Interactive Grid
2-9

3. Configure the chart settings.
For example, the following is a configuration for a Bar chart:
• Orientation - Select Vertical for the bars to increase toward the top of thechart, or Horizontal to increase toward the right.
• Label - Select the column to be used as the Label (the label appears beneathor beside the bar).
• Value - Select the column to be used as the Value (the value is the quantitythat determines the size of the bar).
• Aggregation - (Optional) Select an additional aggregation to be performed onthe column selected for the Value. Valid selections include: Count, CountDistinct, Minimum, Maximum, Sum, or Average.
4. Click Save.
The chart appears. The following is an example of a bar chart that depicts projectbudgets with a sum aggregation. To switch the view between Grid and Chart, click thetoggle that now appears at the top of the interactive grid.
Chapter 2Using an Interactive Grid
2-10

To reconfigure the chart, click the Edit Chart filter.
To remove a chart, click the Remove Chart icon (X) adjacent to the chart filter.
You can only create one chart at a time in an interactive grid. To create a secondchart, reconfigure the existing chart by clicking Edit Chart, or delete it by clicking theadjacent Remove Chart icon (X).
2.5 Customizing an Interactive Grid with the Actions MenuReconfigure and augment how an interactive grid displays data by using the Actionsmenu.
• About the Actions Menu in an Interactive Grid (page 2-12)The Actions Menu appears on the interactive grid toolbar. It contains functions andsubmenus for customizing and saving interactive grids.
• Changing the Column Display in an Interactive Grid (page 2-15)Edit which columns display and in what order by selecting Columns in the Actionsmenu.
• Filtering an Interactive Grid (page 2-16)Filter an interactive grid by column, row, or both, with text strings and usingoperators such as contains and equals.
Chapter 2Customizing an Interactive Grid with the Actions Menu
2-11

• Selecting Column Sort Order in an Interactive Grid (page 2-20)Specify the sort order (ascending or descending) of a column by selecting Sort onthe Data submenu. You can also specify how to handle NULL values.
• Defining an Aggregation in an Interactive Grid (page 2-20)Define an aggregation in an interactive grid by selecting Aggregate from theActions, Format submenu. Aggregates display after each control break and at theend of the interactive grid within the column for which they are defined.
• Creating a Control Break from the Actions Menu in an Interactive Grid(page 2-24)Break an interactive grid (that is, compartmentalize the layout) by column byselecting Control Break in the Actions, Format submenu.
• Adding Highlighting to an Interactive Grid (page 2-25)Apply color effects to an interactive grid by selecting Highlight in the Actions,Format submenu.
2.5.1 About the Actions Menu in an Interactive GridThe Actions Menu appears on the interactive grid toolbar. It contains functions andsubmenus for customizing and saving interactive grids.
Actions Menu
ColumnsDisplays the Columns dialog. Toggle which individual columns are visible in theinteractive grid, in what order they appear, and specify their display width (in pixels).
Chapter 2Customizing an Interactive Grid with the Actions Menu
2-12

See "Customizing an Interactive Grid with the Column Heading Menu (page 2-26)."
FilterDisplays the Filters dialog. Configure data filters to limit the rows returned.See "Filtering an Interactive Grid (page 2-16)."
DataSee Data Submenu (below).
FormatSee Format Submenu (below).
SelectionSee Selection Submenu (below).
ChartDisplays the Chart dialog. Create a chart by selecting a chart type and configuring therequired fields.See "Using Charts in an Interactive Grid (page 2-9)."
ReportSee Report Submenu (below).
DownloadDisplays the Download dialog. Download or email the interactive grid as a .csvor .html file.See "Downloading or Emailing an Interactive Grid (page 2-47)."
HelpLaunches a new window containing a summary of how to use interactive grids.
Data Submenu
The Data submenu enables you to change how the data displays. The Data submenucontains the following options:
SortDisplays the Sort dialog. Change the columns to sort on and determine whether tosort in ascending or descending order.See "Selecting Column Sort Order in an Interactive Grid (page 2-20)."
AggregateDisplays the Aggregate dialog. Perform mathematical computations against a column.See "Defining an Aggregation in an Interactive Grid (page 2-20)."
RefreshRepopulates the interactive grid with the most current data from the database.See "Refreshing an Interactive Grid (page 2-45)."
FlashbackDisplays the Flashback dialog. Reload the data as it existed at a previous point intime.See "Reverting an Interactive Grid to a Specific Save State (page 2-47)."
Format Submenu
The Format submenu enables you to change how the interactive grid displays. TheFormat submenu contains the following options:
Chapter 2Customizing an Interactive Grid with the Actions Menu
2-13

Control BreakDisplays the Control Break dialog. Pull the columns out of the grid and display themas break groups.See "Creating a Control Break from the Actions Menu in an Interactive Grid(page 2-24)."
HighlightDisplays the Highlight dialog. Customize the display colors of a row, column, orindividual cells of a grid. Advanced options are available for repeated values.See "Adding Highlighting to an Interactive Grid (page 2-25)."
Stretch Column Widths
Rows Per Page
Selection Submenu
The Selection submenu enables you to apply single actions to multiple rows or cells atonce in an interactive grid. The Selection submenu contains the following options:
Cell Selection / Row SelectionToggle between selecting individual cells or individual rows with a mouse click. Youcan also toggle between selection modes by pressing F8.
Copy to ClipboardCopies the text in the current selection to your clipboard. You can also copy thecurrent selection by pressing Ctrl + C or Cmd + C.
Delete RowsDeletes the selected rows.
Refresh RowsPopulates the selected rows with the most current data from the database.
Revert ChangesUndoes any unsaved changes made to the selected rows.
Copy DownCopies the value of the first selected rows or cells and applies it to the rest of theselection.Developer Tip: In Row Selection mode, you cannot copy the values of columns thathave the column attribute "Duplicate Copies Existing Value" set to No.
FillPrompts you for a value, then applies the value to all selected rows or cells.Developer Tip: In Row Selection mode, you cannot copy the values of columns thathave the column attribute "Duplicate Copies Existing Value" set to No.
ClearDeletes all values in the selected rows or cells.Developer Tip: In Row Selection mode, you cannot copy the values of columns thathave the column attribute "Duplicate Copies Existing Value" set to No.
Report Submenu
The Report submenu enables you to save, change, or delete changes that you maketo the interactive grid. The Report submenu contains the following options:
Chapter 2Customizing an Interactive Grid with the Actions Menu
2-14

SaveSaves changes to the current interactive grid.See "Saving Interactive Grids (page 2-42)."
Save AsDisplays the Report - Save As dialog. Save a new report of the interactive grid (youmust rename the report and select the report type).See "Saving Interactive Grids (page 2-42)."
EditDisplays the Report - Edit dialog. Change the interactive grid report’s name or type,depending on your privileges.See "Renaming a Report in an Interactive Grid (page 2-44)."
DeleteDeletes the current view of the interactive grid (not available for Primary reports).See "Deleting a Report in an Interactive Grid (page 2-44)."
ResetResets the interactive grid to the last saved state.See "Resetting an Interactive Grid (page 2-45)."
2.5.2 Changing the Column Display in an Interactive GridEdit which columns display and in what order by selecting Columns in the Actionsmenu.
To edit how columns display in an interactive grid:
Chapter 2Customizing an Interactive Grid with the Actions Menu
2-15

1. Click the Actions menu and select Columns.
The Columns dialog displays.
2. Edit the columns:
• Displayed - Select the check box to show a column in the grid; deselect acheck box to hide a column in the grid.
• Move Up and Move Down - Adjust the order in which a column appears in thegrid.
• Columns button - Toggle whether the list displays All, Displayed, or NotDisplayed (hidden) columns.
• Minimum Column Width (Pixel) - Adjust the displayed numeric value to widenor narrow the column (for example, a higher number widens the column).
3. Click Save.
The interactive grid refreshes.
2.5.3 Filtering an Interactive GridFilter an interactive grid by column, row, or both, with text strings and using operatorssuch as contains and equals.
• About Filters in Interactive Grids (page 2-16)You can narrow the contents of an interactive grid by applying a filter to it. Onceapplied, filters can be temporarily enabled or disabled or removed permanentlydirectly in the interactive grid. You can also click the filter name for quickreconfiguration.
• Creating a Row Filter in an Interactive Grid (page 2-17)Create a row filter to limit the number of rows returned in an interactive grid.Filtering by row filters for a term in any filterable column.
• Creating a Column Filter in an Interactive Grid (page 2-17)Filter a column in an interactive grid with a specified operator and value.
• Editing a Filter in an Interactive Grid (page 2-18)Edit a filter by clicking the name of a filter to open the Filters dialog. The Filtersdialog enables you to edit properties of any filter.
• Disabling a Filter in an Interactive Grid (page 2-18)Disable a filter by clicking the check box adjacent to the name of the filter.
• Removing a Filter from an Interactive Grid (page 2-19)Remove a filter by deleting it in the Filters dialog or by clicking the adjacentRemove Filter icon (X).
2.5.3.1 About Filters in Interactive GridsYou can narrow the contents of an interactive grid by applying a filter to it. Onceapplied, filters can be temporarily enabled or disabled or removed permanently directlyin the interactive grid. You can also click the filter name for quick reconfiguration.
Chapter 2Customizing an Interactive Grid with the Actions Menu
2-16

Existing filters display between the search bar and the grid.
Rather than deleting a filter, you can disable it by deselecting the adjacent checkbox.You can leave a filter disabled and save your report to preserve it for future usage.
To edit a filter, you can click its name or open the Filters dialog and select it in the list.
You can permanently remove a filter by clicking the adjacent Remove Filter icon (X)or by removing it from the list in the Filters dialog.
2.5.3.2 Creating a Row Filter in an Interactive GridCreate a row filter to limit the number of rows returned in an interactive grid. Filteringby row filters for a term in any filterable column.
To add a filter to the rows in an interactive grid:
1. Click the Actions menu.
2. Select Filter.
The Filters dialog displays.
3. In the Filters dialog:
a. Type - Select Row.
b. Search - Enter the text string to filter.
c. Case Sensitive - Enable to make the filter case sensitive.
4. Click Save.
The interactive grid applies the filter.
2.5.3.3 Creating a Column Filter in an Interactive GridFilter a column in an interactive grid with a specified operator and value.
Chapter 2Customizing an Interactive Grid with the Actions Menu
2-17

To add a filter to a column in an interactive grid:
1. Click the Actions menu.
2. Select Filter.
The Filters dialog displays.
3. In the Filters dialog:
a. Type - Select Column.
b. Column - Choose the column to filter.
c. Operator - Choose the filter logic.
d. Value - Enter the filter criterion.
4. Click Save.
The filter is added to the grid.
2.5.3.4 Editing a Filter in an Interactive GridEdit a filter by clicking the name of a filter to open the Filters dialog. The Filters dialogenables you to edit properties of any filter.
To edit an existing filter:
1. Click the name of a filter.
The Filters dialog displays.
2. Edit the filter by selecting new values.
Editable parameters include:
• the filter type (row, column, complex)
• the name of the row or column the filter applies to
• the filter operator
• the filtered value
Other filters can also be added, edited, enabled, and removed in this dialog.
3. To add a new filter:
a. Click the Add button (+) adjacent to the Filters list.
b. Configure the appropriate fields.
4. Click Save to apply your changes.
2.5.3.5 Disabling a Filter in an Interactive GridDisable a filter by clicking the check box adjacent to the name of the filter.
Disabling a filter is often preferable to deleting it because disabling saves the time ofrecreating and reconfiguring the same filter.
• To disable a filter in an interactive grid:
• Click the check box adjacent to the name of the filter.
The interactive grid reloads and the check box unchecks.To re-enable the filter, click the check box again.
Chapter 2Customizing an Interactive Grid with the Actions Menu
2-18

2.5.3.6 Removing a Filter from an Interactive GridRemove a filter by deleting it in the Filters dialog or by clicking the adjacent RemoveFilter icon (X).
Tip:
To temporarily disable a filter, deselect the adjacent check box either withinthe Filters dialog or above the interactive grid.
To remove a filter, do one of the following:
• Open the Filters dialog and delete it:
1. Click the Actions menu and select Filter.
The Filters dialog appears.
2. In the list of filters, select the filter to remove.
3. Click the Delete button (-).
4. Click Save.
• Above the interactive grid, click the Remove Filter icon (X) adjacent to a filter.
Chapter 2Customizing an Interactive Grid with the Actions Menu
2-19

2.5.4 Selecting Column Sort Order in an Interactive GridSpecify the sort order (ascending or descending) of a column by selecting Sort on theData submenu. You can also specify how to handle NULL values.
To sort by column:
1. Click the Actions menu, select Data, then Sort.
The Sort dialog appears.
2. In the Sort dialog: Select a column, the sort direction (Ascending orDescending), and the null sorting behavior (Default, Nulls Always Last, or NullsAlways First).
a. Column - Select a column.
b. Direction - Select Descending or Ascending.
c. Nulls - Select First or Last.
3. To add another sort rule, click the Add button (+).
4. Click Save.
The interactive grid reloads.
2.5.5 Defining an Aggregation in an Interactive GridDefine an aggregation in an interactive grid by selecting Aggregate from the Actions,Format submenu. Aggregates display after each control break and at the end of theinteractive grid within the column for which they are defined.
• Creating an Aggregation in an Interactive Grid (page 2-20)Create an aggregation in an interactive grid by selecting Aggregate in the Actions,Data submenu.
• Editing an Aggregation in an Interactive Grid (page 2-22)Edit an existing aggregations by selecting the Aggregate in the Actions, Datasubmenu.
• Removing an Aggregation in an Interactive Grid (page 2-23)Use the Aggregate dialog to remove an aggregation.
2.5.5.1 Creating an Aggregation in an Interactive GridCreate an aggregation in an interactive grid by selecting Aggregate in the Actions,Data submenu.
To create an aggregation against a column:
1. Click the Actions menu, select Data, then Aggregate.
The Aggregation dialog appears. (Some fields may be pre-filled.)
Chapter 2Customizing an Interactive Grid with the Actions Menu
2-20

2. In the Aggregation dialog:
a. Column – Select the column to define against
b. Aggregation – Select the type of aggregation to apply
c. Tooltip – (Optional) Add a label that appears when you hover the mouse overthe aggregation.
d. (Optional) Show Overall Value – Select to display the grand total of a column
3. To add another aggregation:
a. Click the Add icon (+).
A new Aggregation appears in the list.
b. Define the new aggregation as described in the previous step.
4. Click Save.
The result of the aggregation appears at the bottom of the last page of the report.
The following example is an interactive grid with two sum aggregations applied to twodifferent columns (a control break has also been applied to simplify the presentation):
Chapter 2Customizing an Interactive Grid with the Actions Menu
2-21

2.5.5.2 Editing an Aggregation in an Interactive GridEdit an existing aggregations by selecting the Aggregate in the Actions, Datasubmenu.
To edit an aggregation with the Aggregate dialog:
1. Click the Actions menu.
2. Select the Data submenu, then Aggregate.
The Aggregate dialog displays.
3. Select an aggregation.
4. Edit the aggregation. Editable fields include the column to define against, thefunction type, and the Show Grand Total option.
5. Click Save.
Chapter 2Customizing an Interactive Grid with the Actions Menu
2-22

2.5.5.3 Removing an Aggregation in an Interactive GridUse the Aggregate dialog to remove an aggregation.
Tip:
You can delete or disable an aggregation by interacting with the aggregationfilter above the interactive grid. To delete an aggregation, click the RemoveAggregation icon (X); to disable an aggregation, select the adjacent checkbox.
To remove an aggregation with the Aggregation dialog:
1. Click the Actions menu.
2. Select the Data submenu, then Aggregate.
The Aggregation dialog displays.
3. Do one of the following:
• To hide an aggregation from view in the grid, click the adjacent checkbox inthe Enabled column. This disables the aggregation and stores it for future usein the Aggregation dialog.
• To remove the selected aggregation from the grid completely andpermanently, click the Delete icon (—).
Chapter 2Customizing an Interactive Grid with the Actions Menu
2-23

4. Click Save.
2.5.6 Creating a Control Break from the Actions Menu in an InteractiveGrid
Break an interactive grid (that is, compartmentalize the layout) by column by selectingControl Break in the Actions, Format submenu.
Creating a break group pulls the columns out of the interactive grid and displays themas a master record.
To create a control break:
1. Click the Actions menu and select Format then Control Break.
The Control Break dialog displays.
2. In the Control Break dialog:
a. Column - Select the name of the column.
b. Direction - Select the sort direction (Ascending or Descending).
c. Nulls - Select the null sorting behavior (First or Last).
3. Click Save.
The interactive grid reloads with the control break applied for the selected column, anda control break filter appears above the grid near the toolbar.
In the following example, a control break has been applied to the interactive grid forthe Project column.
Chapter 2Customizing an Interactive Grid with the Actions Menu
2-24

To edit a control break, click the name to display the Control Break dialog. You canalso add, edit, and delete other control breaks in the Control Break dialog.
To remove a control break, click the Remove Control Break icon (X) on the controlbreak filter.
2.5.7 Adding Highlighting to an Interactive GridApply color effects to an interactive grid by selecting Highlight in the Actions, Formatsubmenu.
To highlight an interactive grid cell:
1. Click Actions and select Format then Highlight.
The Highlight dialog displays.
2. In the Highlight dialog:
a. Name - Enter the name of the highlight (this name displays as a filter abovethe interactive grid).
b. Highlight - Choose the Row or Column to apply the highlight.
c. Background Color - Select the color of the background in a highlighted cell.Choose a specific RGB value or a basic color from a list of presets.
d. Text Color - Select the color of the text in a highlighted cell. Choose a specificRGB value or a basic color from a list of presets.
Chapter 2Customizing an Interactive Grid with the Actions Menu
2-25

3. (Optional) In the Highlight dialog, configure advanced highlighting conditions. Forexample, to conditionally highlight all tasks with a Status of Closed:
a. Condition Type - Select Column.
b. Column - Select Status.
c. Operator - Select equals.
d. Value - Click the arrow to display the drop-down list of valid values and selectClosed from the drop-down list.
4. To add an additional highlight, click the Add icon (+); click the Delete icon (—) toremove an existing highlight.
5. Click Save.
2.6 Customizing an Interactive Grid with the ColumnHeading Menu
Use the Column Heading menu to quickly customize a column in an interactive grid.
• About the Column Heading Menu in an Interactive Grid (page 2-27)The Column Heading Menu contains buttons to sort, break, aggregate, freeze, andhide a column, as well as a text filter for searching within a column.
• Displaying the Column Heading Menu (page 2-28)Display a column’s Column Heading menu by clicking the heading of the column.
• Creating a Control Break in an Interactive Grid (page 2-28)Create a break group in an interactive grid by clicking the Control Break icon in theColumn Heading menu.
• Creating an Aggregation with the Column Heading Menu (page 2-30)Quickly apply an aggregation to an interactive grid by clicking the Aggregate iconin the Column Heading menu.
• Freezing Columns in Place (page 2-30)Freeze a column in place by clicking the Freeze icon in the Column Headingmenu. Freezing a column excludes it from the scrollable area so that the frozencolumn is always visible.
• Hiding Columns in an Interactive Grid (page 2-31)Hide a column in an interactive grid from view by clicking the Hide icon in theColumn Heading menu.
• Unhiding Columns in an Interactive Grid (page 2-32)Show a hidden column in an interactive grid by opening the Columns dialog andenabling it in the Displayed column.
• Filtering with the Column Heading Menu (page 2-33)Filter an interactive grid by the contents of a column by entering keywords in theSearch field of the Column Heading menu.
Chapter 2Customizing an Interactive Grid with the Column Heading Menu
2-26

2.6.1 About the Column Heading Menu in an Interactive GridThe Column Heading Menu contains buttons to sort, break, aggregate, freeze, andhide a column, as well as a text filter for searching within a column.
Overview
The Column Heading menu contains Sort Order buttons, a Toolbar, a Text Filter, anda unique list of the column’s contents.
Sort Order Buttons
The Sort Ascending and Sort Descending buttons appear at the right of everycolumn heading.
See "Sorting Columns in an Interactive Grid (page 2-8)."
Button Toolbar
The toolbar on the Column Heading menu contains the following buttons andfunctions.
Control BreakCreates a Control Break in the interactive grid based on the selected column.See "Creating a Control Break in an Interactive Grid (page 2-28)."
AggregateOpens the Aggregation dialog to define an aggregation against the selected column.See "Creating an Aggregation in an Interactive Grid (page 2-20)."
Chapter 2Customizing an Interactive Grid with the Column Heading Menu
2-27

FreezeFreezes the selected column in place, preventing horizontal scrolling.See "Freezing Columns in Place (page 2-30)."
HideHides the selected column from view.See "Hiding Columns in an Interactive Grid (page 2-31)."
Text Filter
The text filter dynamically limits the list of column contents based on the text stringentered into the filter field.
See "Filtering with the Column Heading Menu (page 2-33)."
2.6.2 Displaying the Column Heading MenuDisplay a column’s Column Heading menu by clicking the heading of the column.
To display a column’s Column Heading menu:
• Click the heading of a column in an interactive grid.
The Column Heading menu displays.
2.6.3 Creating a Control Break in an Interactive GridCreate a break group in an interactive grid by clicking the Control Break icon in theColumn Heading menu.
Chapter 2Customizing an Interactive Grid with the Column Heading Menu
2-28

Creating a break group pulls the columns out of the interactive grid and displays themas a master record.
To create a control break:
1. Click the heading of the desired break group column.
The Column Heading menu appears.
2. Click the Control Break icon.
The interactive grid reloads with the control break applied for the selected column, anda control break filter appears above the grid near the toolbar.
In the following example, a control break has been applied to the interactive grid forthe Project column.
Chapter 2Customizing an Interactive Grid with the Column Heading Menu
2-29

To remove a control break, click the Remove Control Break icon (X) on the controlbreak filter.
2.6.4 Creating an Aggregation with the Column Heading MenuQuickly apply an aggregation to an interactive grid by clicking the Aggregate icon inthe Column Heading menu.
To apply an aggregation against a selected column:
1. Click the heading of the column to display the Column Heading menu.
2. Click the Aggregate icon.
The Aggregation dialog appears.
3. Configure the aggregation.
4. Click Save.
The interactive grid reloads with the aggregation applied.
2.6.5 Freezing Columns in PlaceFreeze a column in place by clicking the Freeze icon in the Column Heading menu.Freezing a column excludes it from the scrollable area so that the frozen column isalways visible.
To freeze a column in place:
1. Click the heading of the column that you wish to freeze.
Chapter 2Customizing an Interactive Grid with the Column Heading Menu
2-30
The Column Heading menu appears.
2. Click the Freeze icon.
The scroll bar resizes to fit the new scrollable area.To unfreeze a frozen column, reopen the Column Heading menu and click theUnfreeze icon (snowflake).
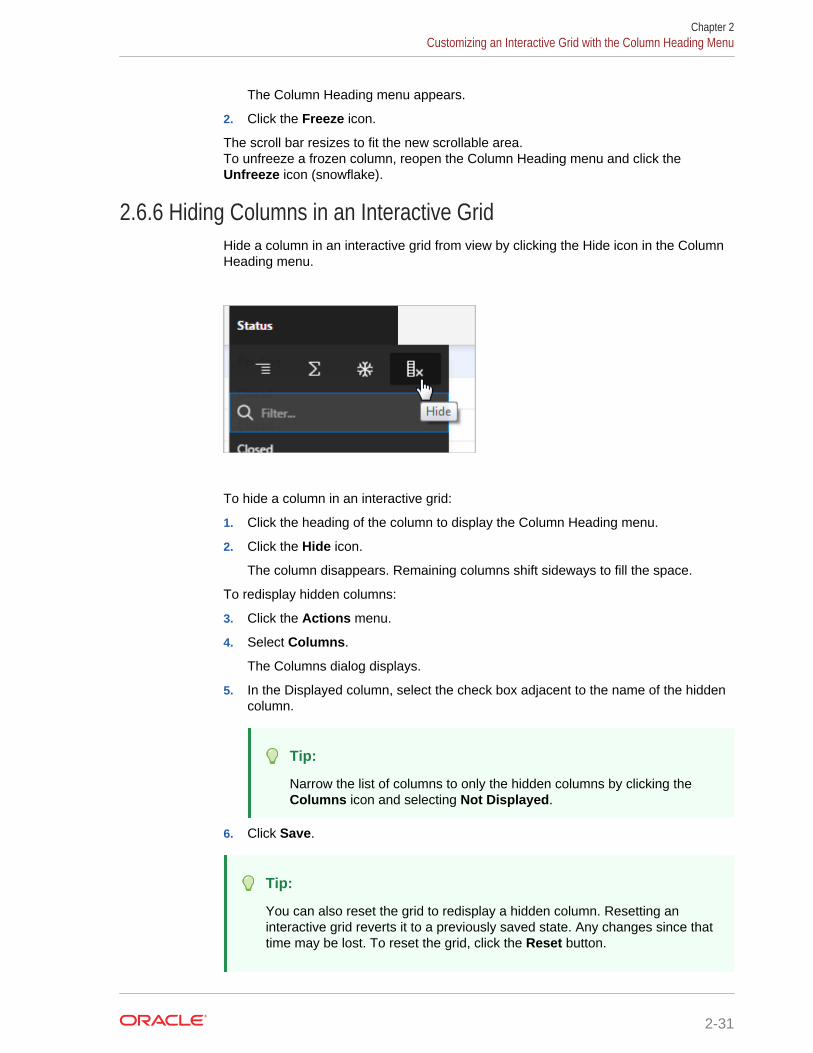
2.6.6 Hiding Columns in an Interactive GridHide a column in an interactive grid from view by clicking the Hide icon in the ColumnHeading menu.
To hide a column in an interactive grid:
1. Click the heading of the column to display the Column Heading menu.
2. Click the Hide icon.
The column disappears. Remaining columns shift sideways to fill the space.
To redisplay hidden columns:
3. Click the Actions menu.
4. Select Columns.
The Columns dialog displays.
5. In the Displayed column, select the check box adjacent to the name of the hiddencolumn.
Tip:
Narrow the list of columns to only the hidden columns by clicking theColumns icon and selecting Not Displayed.
6. Click Save.
Tip:
You can also reset the grid to redisplay a hidden column. Resetting aninteractive grid reverts it to a previously saved state. Any changes since thattime may be lost. To reset the grid, click the Reset button.
Chapter 2Customizing an Interactive Grid with the Column Heading Menu
2-31

2.6.7 Unhiding Columns in an Interactive GridShow a hidden column in an interactive grid by opening the Columns dialog andenabling it in the Displayed column.
To show a hidden column in an interactive grid:
1. Click the Actions menu.
2. Select Columns.
The Columns dialog displays.
3. In the Displayed column, select the check box adjacent to the name of the hiddencolumn.
Tip:
Narrow the list of columns to only the hidden columns by clicking theColumns icon and selecting Not Displayed.
4. Click Save.
The column appears in the interactive grid.
Chapter 2Customizing an Interactive Grid with the Column Heading Menu
2-32
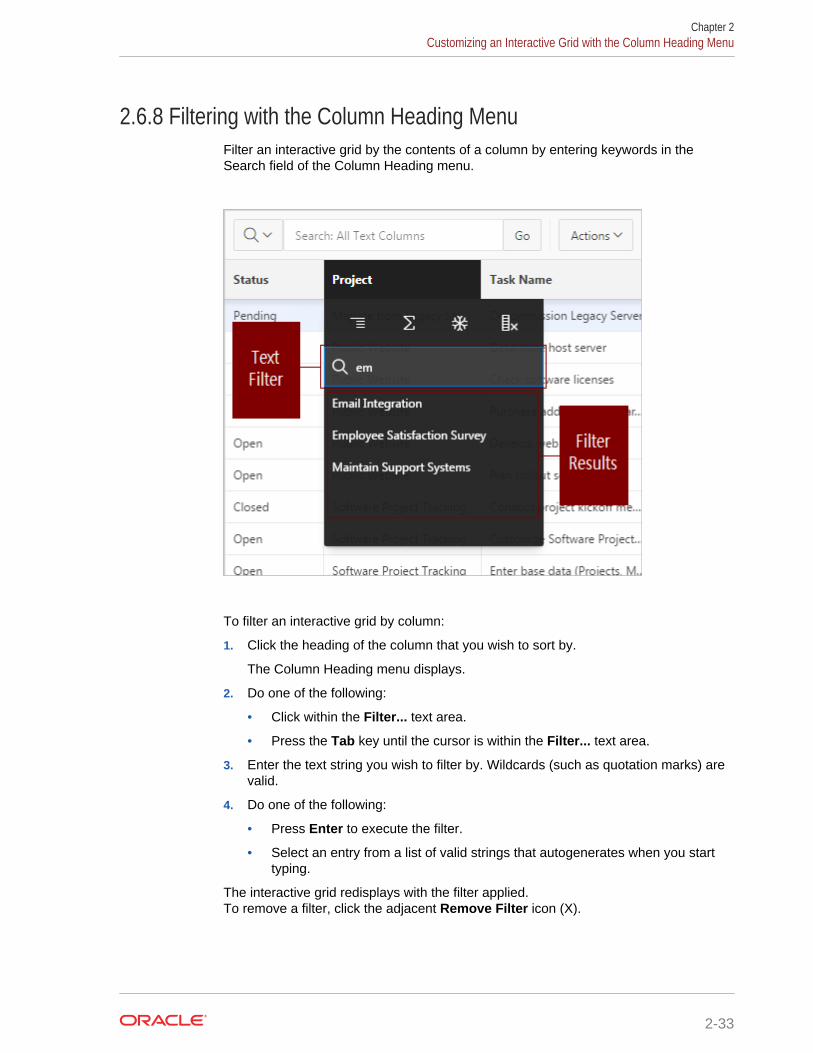
2.6.8 Filtering with the Column Heading MenuFilter an interactive grid by the contents of a column by entering keywords in theSearch field of the Column Heading menu.
To filter an interactive grid by column:
1. Click the heading of the column that you wish to sort by.
The Column Heading menu displays.
2. Do one of the following:
• Click within the Filter... text area.
• Press the Tab key until the cursor is within the Filter... text area.
3. Enter the text string you wish to filter by. Wildcards (such as quotation marks) arevalid.
4. Do one of the following:
• Press Enter to execute the filter.
• Select an entry from a list of valid strings that autogenerates when you starttyping.
The interactive grid redisplays with the filter applied.To remove a filter, click the adjacent Remove Filter icon (X).
Chapter 2Customizing an Interactive Grid with the Column Heading Menu
2-33

2.7 Using an Editable Interactive GridEditable interactive grids expand the functionality of regular interactive grids to enableyou to more directly update a grid’s structure and contents. You can add and deleterows, edit cell contents, and refresh the grid with the latest updates.
• Adding a Row in an Editable Interactive Grid (page 2-34)Click the Add Row button to add a new row to an editable interactive grid.
• Editing Rows in an Interactive Grid (page 2-34)Edit rows of an editable interactive grid with the Row Actions Menu, Edit button,and other functions in the interface.
• Deleting a Row in an Interactive Grid (page 2-37)Use the Row Actions Menu to delete a row from an editable interactive grid.
• Modifying Multiple Rows and Cells in an Editable Interactive Grid (page 2-38)Quickly modify the values of multiple rows and cells with the Actions, Selectionsubmenu.
2.7.1 Adding a Row in an Editable Interactive GridClick the Add Row button to add a new row to an editable interactive grid.
• To add a new row to the top of an editable interactive grid:
• Click the Add Row button.
A blank row appears at the top of the grid or below the currently selected row.
2.7.2 Editing Rows in an Interactive GridEdit rows of an editable interactive grid with the Row Actions Menu, Edit button, andother functions in the interface.
• About the Row Actions Menu in an Editable Interactive Grid (page 2-35)The Row Actions Menu appears in editable interactive grids. Users can quicklyedit the rows of an editable grid with functions such as adding, duplicating,deleting, refreshing, and reverting rows.
• About the Edit Button in an Editable Interactive Grid (page 2-36)
• Editing a Cell in an Interactive Grid (page 2-36)Double-click a cell in an editable interactive grid to edit the contents.
• Editing Multiple Rows in an Editable Interactive Grid (page 2-37)Select the desired rows of an editable interactive grid to edit, then select an optionfrom the Selection Actions menu.
Chapter 2Using an Editable Interactive Grid
2-34

2.7.2.1 About the Row Actions Menu in an Editable Interactive GridThe Row Actions Menu appears in editable interactive grids. Users can quickly edit therows of an editable grid with functions such as adding, duplicating, deleting, refreshing,and reverting rows.
Single Row ViewChanges the grid display to a single-page view of a row’s contents. Used for viewingan individual row in detail, one row at a time. Click the Previous and Next buttons tonavigate between rows in the grid. Click the Report View button to return to the grid.
Chapter 2Using an Editable Interactive Grid
2-35

Add RowAdds a new row below the current one.
Duplicate RowCreates a copy of the currently selected row and inserts the copy below the original.
Delete RowDeletes the row.
Refresh RowReloads the row by calling the database and pulling in any updates.Refresh a row to update it without reloading the entire application page.
Revert ChangesUndoes any changes to the row since the grid was last saved.
2.7.2.2 About the Edit Button in an Editable Interactive GridThe Edit button toggles Editing mode in editable interactive grids. When enabled, youcan single-click a cell to edit it; when disabled, you must double-click. While Editingmode enables quicker editing of multiple cells in succession, it can impede navigationin larger grids.
2.7.2.3 Editing a Cell in an Interactive GridDouble-click a cell in an editable interactive grid to edit the contents.
To edit the contents of a single cell in an editable interactive grid:
1. Double-click a cell.
Editing mode engages and a cursor displays in the cell.
2. Edit the cell contents.
Chapter 2Using an Editable Interactive Grid
2-36

3. Press Tab or Shift + Tab to edit an adjacent cell in the row or Enter or Shift +Enter to edit an adjacent cell in the column.
4. To exit editing mode, press Escape.
5. Click Save to save your changes.
Changes to the interactive grid are saved.
2.7.2.4 Editing Multiple Rows in an Editable Interactive GridSelect the desired rows of an editable interactive grid to edit, then select an optionfrom the Selection Actions menu.
To edit multiple rows in an editable interactive grid:
1. Select rows by selecting check boxes in the check box column.
Tip:
Click the check box in the column heading to select all rows. With allrows selected, click it again to deselect all rows.
2. In the column heading of the interactive grid, click the Selection Actions menuicon
3. Select a valid option. Options include Duplicate, Delete, Refresh, and Revert.
The selected change applies.
2.7.3 Deleting a Row in an Interactive GridUse the Row Actions Menu to delete a row from an editable interactive grid.
To delete a row from an editable grid:
1. Click the Row Actions menu icon adjacent to the row.
2. Select Delete Row.
The row is crossed out in the grid.
Chapter 2Using an Editable Interactive Grid
2-37
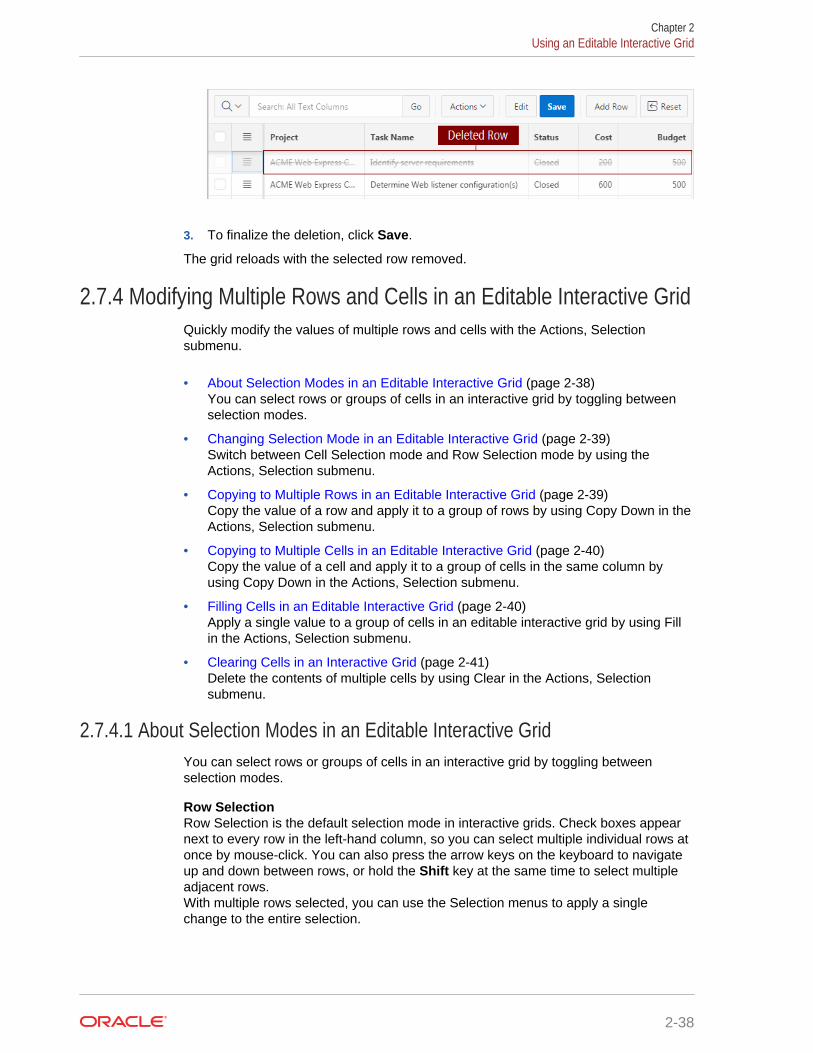
3. To finalize the deletion, click Save.
The grid reloads with the selected row removed.
2.7.4 Modifying Multiple Rows and Cells in an Editable Interactive GridQuickly modify the values of multiple rows and cells with the Actions, Selectionsubmenu.
• About Selection Modes in an Editable Interactive Grid (page 2-38)You can select rows or groups of cells in an interactive grid by toggling betweenselection modes.
• Changing Selection Mode in an Editable Interactive Grid (page 2-39)Switch between Cell Selection mode and Row Selection mode by using theActions, Selection submenu.
• Copying to Multiple Rows in an Editable Interactive Grid (page 2-39)Copy the value of a row and apply it to a group of rows by using Copy Down in theActions, Selection submenu.
• Copying to Multiple Cells in an Editable Interactive Grid (page 2-40)Copy the value of a cell and apply it to a group of cells in the same column byusing Copy Down in the Actions, Selection submenu.
• Filling Cells in an Editable Interactive Grid (page 2-40)Apply a single value to a group of cells in an editable interactive grid by using Fillin the Actions, Selection submenu.
• Clearing Cells in an Interactive Grid (page 2-41)Delete the contents of multiple cells by using Clear in the Actions, Selectionsubmenu.
2.7.4.1 About Selection Modes in an Editable Interactive GridYou can select rows or groups of cells in an interactive grid by toggling betweenselection modes.
Row SelectionRow Selection is the default selection mode in interactive grids. Check boxes appearnext to every row in the left-hand column, so you can select multiple individual rows atonce by mouse-click. You can also press the arrow keys on the keyboard to navigateup and down between rows, or hold the Shift key at the same time to select multipleadjacent rows.With multiple rows selected, you can use the Selection menus to apply a singlechange to the entire selection.
Chapter 2Using an Editable Interactive Grid
2-38

Cell SelectionYou can switch to Cell Selection mode in the Selection submenu in the Actions menuor by pressing F8.In Cell Selection mode, the check boxes disappear, and you can select individual cellsby mouse-click. You can also hold the Shift key and use mouse or the arrow keys toselect multiple adjacent cells.With multiple cells selected, you can use the Selection menus to apply a singlechange to the entire selection.
2.7.4.2 Changing Selection Mode in an Editable Interactive GridSwitch between Cell Selection mode and Row Selection mode by using the Actions,Selection submenu.
Interactive grids are in Row Selection mode by default. You can switch to selectionmodes to select groups of rows or cells.
1. To switch selection modes, do one of the following:
• Click the Actions menu, select Selection, and click Cell Selection or RowSelection.
• Press F8 on your keyboard (Tip: ensure only one or no objects are selected).
The selection mode switches.
2. To switch back, repeat this step.
2.7.4.3 Copying to Multiple Rows in an Editable Interactive GridCopy the value of a row and apply it to a group of rows by using Copy Down in theActions, Selection submenu.
To apply the value of an existing row to a group of rows below it:
1. Ensure you are in Row Selection mode.
2. Select the row you want to copy.
3. Do one of the following to select the rows you want to change:
• Using the mouse, click the adjacent check boxes. Using the check boxesenables you to apply changes to non-contiguous rows.
• Using the keyboard, press the down arrow key to quickly select a group ofadjacent rows below the first row (press the up arrow key to de-select rows).
4. Click the Actions menu, select Selection, and select Copy Down.
Tip:
You can also use the Selection Actions menu in the header row toquickly access several Selection submenu options (including CopyDown).
The first row is copied to the rows selected below it.
Chapter 2Using an Editable Interactive Grid
2-39

Tip:
Undo changes to the data by clicking Revert Changes in the Selection orSelection Actions menus.
2.7.4.4 Copying to Multiple Cells in an Editable Interactive GridCopy the value of a cell and apply it to a group of cells in the same column by usingCopy Down in the Actions, Selection submenu.
To apply the value of an existing cell to a group of cells below it:
1. Ensure you are in Cell Selection mode.
2. Select the cell you want to copy.
3. Do one of the following to select the cells you want to change (all cells in a singleselection must be contiguous):
• Using the mouse, hold the Shift key and click the last cell in the group.
• Using the keyboard, hold the Shift key and press the down arrow key toselect cells.
4. Click the Actions menu, select Selection, and select Copy Down.
Tip:
You can also use the Selection Actions menu in the header row toquickly access several Selection submenu options (including CopyDown).
The first cell is copied to the cells selected below it.
You can also select cells in adjacent columns and use Copy Down to copy the value ofthe different cells in each column to cells below it (values do not copy acrosscolumns).
Tip:
Undo changes to the data by clicking Revert Changes in the Selection orSelection Actions menus.
2.7.4.5 Filling Cells in an Editable Interactive GridApply a single value to a group of cells in an editable interactive grid by using Fill in theActions, Selection submenu.
You can also apply a single value to all the cells in a row (or a group of rows) by usingFill in Row Selection mode.
To
Chapter 2Using an Editable Interactive Grid
2-40

1. Ensure you are in Cell Selection mode (select Actions menu and then Selection,or press F8).
2. Select the first cell of the group.
3. Press and hold the Shift key, and use the mouse or arrow keys to select a groupof cells.
Tip:
All selected cells must be adjacent for a single Fill action. Repeat thisprocedure for non-adjacent cells.
4. Select the Actions menu, select Selection, and select Fill.
The Fill Selection dialog displays.
5. Enter a value. Click OK.
The entered value applies to the selected cells.
Tip:
Undo changes to the data by clicking Revert Changes in the Selection orSelection Actions menus.
2.7.4.6 Clearing Cells in an Interactive GridDelete the contents of multiple cells by using Clear in the Actions, Selection submenu.
You can also clear all of the cells in a row (or a group of rows) by using Fill in RowSelection mode.
To delete the contents of a group of adjacent cells:
1. Ensure you are in Cell Selection mode (select Actions menu and then Selection,or press F8).
2. Select the first cell of the group.
3. Press and hold the Shift key, and use the mouse or arrow keys to select a groupof cells.
Tip:
All selected cells must be adjacent for a single Clear action. Repeat thisprocedure for non-adjacent cells.
4. Select the Actions menu, select Selection, and select Clear.
The value of the selected cells is replaced with an empty text string.
You do not need to save the report because Clear directly affects the data in thedatabase.
Chapter 2Using an Editable Interactive Grid
2-41

Tip:
Undo changes to the data by clicking Revert Changes in the Selection orSelection Actions menus.
2.8 Saving Interactive GridsSave your changes as a new report within the application. Name and keep theseinteractive grid reports Private or make them Public to share with other users.
• About Interactive Grid Report Types (page 2-42)Reports in interactive grids have different uses and characteristics. You interactwith the Primary report of an interactive grid, and save your changes as Privatereports.
• Saving a Report in an Interactive Grid (page 2-43)Save your changes to an interactive grid by clicking Save As in the Actions, Reportsubmenu.
• Renaming a Report in an Interactive Grid (page 2-44)Change the name of an interactive grid report by selecting Edit in the Actions,Report submenu.
• Deleting a Report in an Interactive Grid (page 2-44)Delete a Private report from an interactive grid by selecting Delete in the Actions,Report submenu.
2.8.1 About Interactive Grid Report TypesReports in interactive grids have different uses and characteristics. You interact withthe Primary report of an interactive grid, and save your changes as Private reports.
The following is a list of default report types in Oracle Application Express, althoughdevelopers can choose to add more:
Private ReportYou can save a Private report of the interactive grid to preserve your changes to it(such as filters, aggregations, column order, visible columns, and othercustomizations).Private reports can only be viewed by the user who creates them.
Primary ReportThe default view of an interactive grid is the Primary report.While you can customize the look and organization of a Primary report, you cannotoverwrite or rename it. The Primary report is useful as a backup or a starting point forcustomizing new views of the interactive grid.
After you save at least one private report, a drop-down list appears on the toolbar nearthe Search bar. You can use this to select between reports.
Chapter 2Saving Interactive Grids
2-42

2.8.2 Saving a Report in an Interactive GridSave your changes to an interactive grid by clicking Save As in the Actions, Reportsubmenu.
To save a Private interactive grid:
1. Click the Actions menu and select Report then Save As.
The Save As dialog displays.
2. In the Save As dialog:
a. Type - Select Private.
b. Name - Enter a name for the grid.
3. Click Save.
Save further changes to the report by selecting Save in the Actions, Report Settingsubmenu.
The report is saved and a confirmation message displays.
If there is now more than one saved report available in the interactive grid, a drop-down list appears on the toolbar between the Search Bar and Actions menu.
Chapter 2Saving Interactive Grids
2-43

2.8.3 Renaming a Report in an Interactive GridChange the name of an interactive grid report by selecting Edit in the Actions, Reportsubmenu.
To rename a report:
1. Select the report from the drop-down list.
2. Click the Actions menu and select Report then Edit.
The Report Settings dialog displays.
3. Rename the report.
4. Click Save.
The report is saved.
2.8.4 Deleting a Report in an Interactive GridDelete a Private report from an interactive grid by selecting Delete in the Actions,Report submenu.
To delete an interactive grid report:
1. Select the report from the drop-down list.
2. Click the Actions menu and select Report then Delete.
A confirmation dialog appears.
3. Click OK.
The report is deleted and the Primary report reloads.
2.9 Resetting Interactive GridsYou can refresh, reset, or flashback a grid to revert your changes to it. Resetting aninteractive grid can have different outcomes depending on the report type.
Refresh an interactive grid to update it with the most recent version of the data in thedatabase. Reset an interactive grid to undo any changes since it was last saved.Flashback a grid to a point in the past (in minutes) to retrieve data from the databaseas it existed at that time, which ignores any changes made to the data in the databasesince that time.
Chapter 2Resetting Interactive Grids
2-44

• Refreshing an Interactive Grid (page 2-45)Update an interactive grid with the most current data available on the database byselecting Refresh in the Actions, Data submenu.
• Resetting an Interactive Grid (page 2-45)Undo changes to an interactive grid by clicking the Reset button or by selectingReset from the Actions, Report submenu.
• How the Reset Button Affects Saved Interactive Grid Reports (page 2-46)Clicking the Reset button reloads an interactive grid’s last saved state. The savedstate varies between report types.
• Reverting an Interactive Grid to a Specific Save State (page 2-47)Revert an interactive grid to a specific point in time by selecting the Flashback inthe Actions, Data submenu.
2.9.1 Refreshing an Interactive GridUpdate an interactive grid with the most current data available on the database byselecting Refresh in the Actions, Data submenu.
Refreshing an interactive grid is quicker than reloading the entire page in the browser.Refreshing is also a valuable feature for highly fluid data sets.
To refresh an interactive grid:
1. Click the Actions menu and select Data.
2. Select Refresh.
The grid refreshes. Updates to the data are applied, but not marked.
2.9.2 Resetting an Interactive GridUndo changes to an interactive grid by clicking the Reset button or by selecting Resetfrom the Actions, Report submenu.
WARNING:
Resetting an interactive grid reverts it to a previously saved state. Anychanges since that time may be lost.
Chapter 2Resetting Interactive Grids
2-45

To reset an interactive grid, do one of the following:
• Click the Reset button.
• Click the Actions menu, select Report, and select Reset.
The grid reloads the last saved state.
2.9.3 How the Reset Button Affects Saved Interactive Grid ReportsClicking the Reset button reloads an interactive grid’s last saved state. The savedstate varies between report types.
In a Primary report, the Reset button undoes all changes that you have made—including reorganization and new content—because only developers can overwritePrimary reports. To preserve your changes, save a Private report.
In a Private report, the Reset button undoes only the changes that you have madesince the last time you saved the report.
Chapter 2Resetting Interactive Grids
2-46
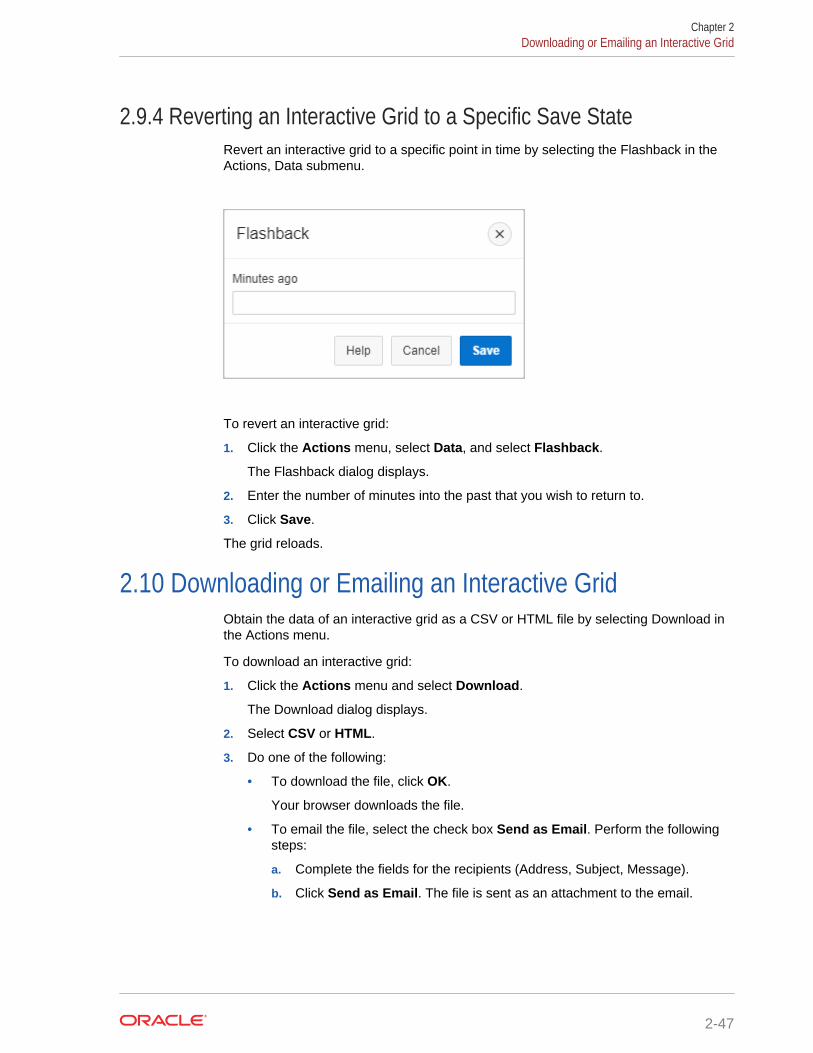
2.9.4 Reverting an Interactive Grid to a Specific Save StateRevert an interactive grid to a specific point in time by selecting the Flashback in theActions, Data submenu.
To revert an interactive grid:
1. Click the Actions menu, select Data, and select Flashback.
The Flashback dialog displays.
2. Enter the number of minutes into the past that you wish to return to.
3. Click Save.
The grid reloads.
2.10 Downloading or Emailing an Interactive GridObtain the data of an interactive grid as a CSV or HTML file by selecting Download inthe Actions menu.
To download an interactive grid:
1. Click the Actions menu and select Download.
The Download dialog displays.
2. Select CSV or HTML.
3. Do one of the following:
• To download the file, click OK.
Your browser downloads the file.
• To email the file, select the check box Send as Email. Perform the followingsteps:
a. Complete the fields for the recipients (Address, Subject, Message).
b. Click Send as Email. The file is sent as an attachment to the email.
Chapter 2Downloading or Emailing an Interactive Grid
2-47

3Using Interactive Reports
An interactive report is a formatted result of a SQL query.
• About Interactive Reports (page 3-1)In addition to interactive grids, Oracle Application Express includes two mainreport types: an interactive report and a classic report.
• Accessing Interactive Reports (page 3-2)An interactive report is contained in a page within a database application. Toaccess an interactive report you must go to the database application URL, log inusing your account credentials (that is, your username and password), and thennavigate to the report page.
• Using the Search Bar (page 3-4)A search bar displays above interactive reports and includes the followingfeatures.
• Using the Select Columns To Search Icon (page 3-4)The Select columns to search icon displays to the left of the search bar. Click thisicon to display a listing of all columns in the current report.
• Using the Column Heading Menu (page 3-5)Clicking a column heading in an interactive report displays the Column Headingmenu. Positioning the cursor over each icon displays a tooltip that describes itsfunction.
• Using Interactive Report Filters (page 3-6)When you customize an interactive report, a filter displays between the search barand the report.
• Customizing an Interactive Report Using the Actions Menu (page 3-7)Customize an interactive report by selecting options on the Actions menu.
See Also:
"Managing Interactive Reports" in Oracle Application Express App BuilderUser’s Guide
3.1 About Interactive ReportsIn addition to interactive grids, Oracle Application Express includes two main reporttypes: an interactive report and a classic report.
The main difference between these two report types is that interactive reports enableyou to customize the appearance of the data through searching, filtering, sorting,column selection, highlighting, and other data manipulations.
3-1

About Interactive Reports
The following is an example of an interactive report in the packaged application,Sample Reporting.
Interactive reports enable you to create highly customized reports. You can alter thereport layout by hiding or exposing specific columns and applying filters, highlighting,and sorting. You can also define breaks, aggregations, charts, group data, and addtheir own computations. Once customized, the report can be saved as either a privateor public report. Most interactive reports include a search bar, Actions menu, ColumnHeading menu, and edit icons in the first column of each row.
In contrast, classic reports support general keyword search capability, the ability tospecify the number of rows that display, and basic column sorting.
3.2 Accessing Interactive ReportsAn interactive report is contained in a page within a database application. To accessan interactive report you must go to the database application URL, log in using youraccount credentials (that is, your username and password), and then navigate to thereport page.
• About Interactive Report URLs (page 3-3)You can access interactive reports directly with their URL. Interactive report URLscontain an application ID and a page ID. When you access an application page,the session ID also generates in the address bar.
• Accessing an Interactive Report (page 3-3)Access an interactive grid by navigating to the URL provided by your applicationdeveloper. Ensure the URL includes the application ID and page ID, but not thesession state ID.
Chapter 3Accessing Interactive Reports
3-2

3.2.1 About Interactive Report URLsYou can access interactive reports directly with their URL. Interactive report URLscontain an application ID and a page ID. When you access an application page, thesession ID also generates in the address bar.
Parts of an Interactive Report URL
The following is an example of an Interactive Report URL:
http://apex.somewhere.com/pls/apex/f?p=4350:1:220883407765693447
f?p=
Indicates that you are accessing an Oracle Application Express application.
4350
The application ID. The application ID specifies which application to access.
1
The page ID. The page ID specifies which page to access within the application.Depending on how the developer configured the page, the page ID may be a word,such as home.
220883407765693447
The session ID. The Application Express engine uses the session ID to fetch sessionstate from the database. Oracle Application Express assigns new session IDs duringauthentication processing, records the authenticated user's identity with the sessionID, and continually checks the session ID in each page request's URL or POST datawith the session cookie and the session record in the database.
WARNING:
Do not enter the session ID when you access an interactive report URL.Entering information beyond the page ID displays an error.
3.2.2 Accessing an Interactive ReportAccess an interactive grid by navigating to the URL provided by your applicationdeveloper. Ensure the URL includes the application ID and page ID, but not thesession state ID.
If you do not have a URL or the URL does not work, contact the developer.
To access an interactive report:
1. Click the supplied URL, or enter it in your browser's Address field.
A Login page appears.
2. On the Login page:
a. Username - Enter your username.
b. Password - Enter your password.
Chapter 3Accessing Interactive Reports
3-3
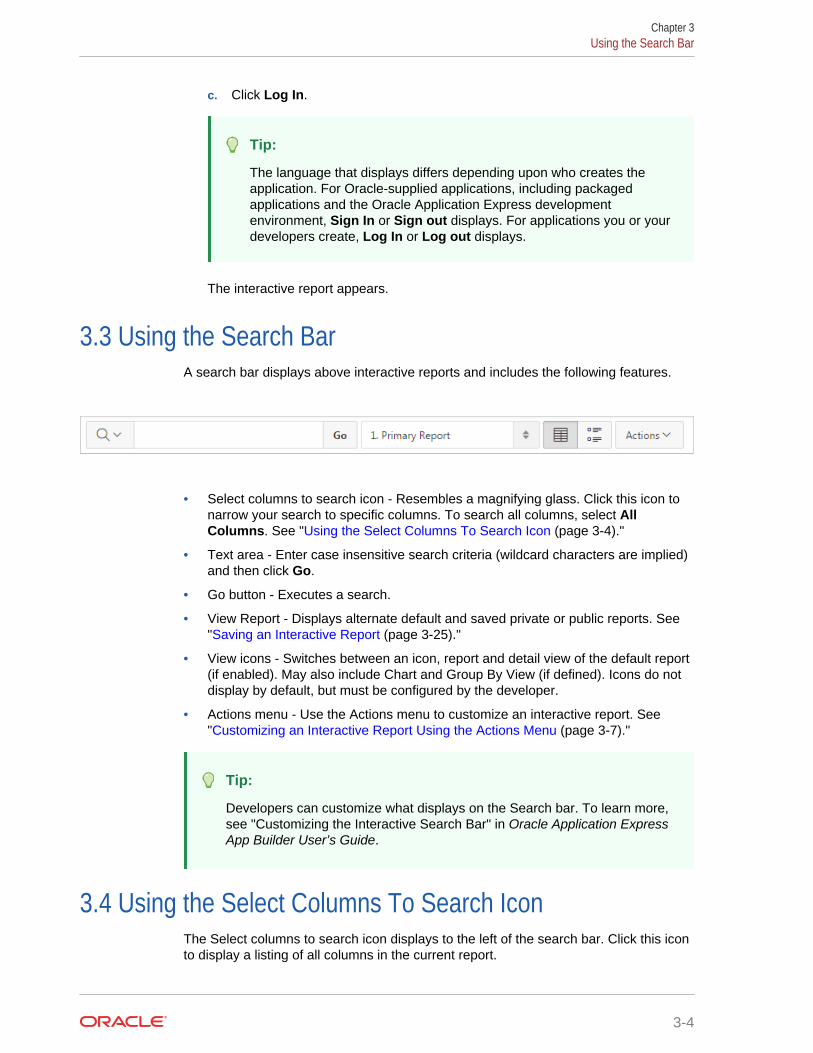
c. Click Log In.
Tip:
The language that displays differs depending upon who creates theapplication. For Oracle-supplied applications, including packagedapplications and the Oracle Application Express developmentenvironment, Sign In or Sign out displays. For applications you or yourdevelopers create, Log In or Log out displays.
The interactive report appears.
3.3 Using the Search BarA search bar displays above interactive reports and includes the following features.
• Select columns to search icon - Resembles a magnifying glass. Click this icon tonarrow your search to specific columns. To search all columns, select AllColumns. See "Using the Select Columns To Search Icon (page 3-4)."
• Text area - Enter case insensitive search criteria (wildcard characters are implied)and then click Go.
• Go button - Executes a search.
• View Report - Displays alternate default and saved private or public reports. See"Saving an Interactive Report (page 3-25)."
• View icons - Switches between an icon, report and detail view of the default report(if enabled). May also include Chart and Group By View (if defined). Icons do notdisplay by default, but must be configured by the developer.
• Actions menu - Use the Actions menu to customize an interactive report. See"Customizing an Interactive Report Using the Actions Menu (page 3-7)."
Tip:
Developers can customize what displays on the Search bar. To learn more,see "Customizing the Interactive Search Bar" in Oracle Application ExpressApp Builder User’s Guide.
3.4 Using the Select Columns To Search IconThe Select columns to search icon displays to the left of the search bar. Click this iconto display a listing of all columns in the current report.
Chapter 3Using the Search Bar
3-4

To search specific columns:
1. Click the Select columns to search icon and select a column.
2. Enter keywords in the Text area and click Go.
3. To disable the filter, select the Enable/Disable Filter check box.
4. To delete the filter, click the Remove Filter icon.
3.5 Using the Column Heading MenuClicking a column heading in an interactive report displays the Column Heading menu.Positioning the cursor over each icon displays a tooltip that describes its function.
Column Heading menu options include:
• Sort Ascending - Sorts the report by the column in ascending order.
• Sort Descending - Sorts the report by the column in descending order.
• Hide Column - Hides the column. Not all columns can be hidden. If a columncannot be hidden, the Hide Column icon does not display. To show a hiddencolumn, select Reset from the Actions menu.
• Control Break - Creates a break group on the column. This pulls the column out ofthe report as a master record. See "Creating a Control Break (page 3-13)."
• Column Information - Displays help text about the column, if available.
• Filter - Enter a case insensitive search criteria. Entering a value reduces the list ofvalues at the bottom of the menu. You can then select a value from the bottom.The selected value will be created as a filter using either the equal sign (=) orcontains depending on the List of Values Column Filter Type.
Chapter 3Using the Column Heading Menu
3-5

3.6 Using Interactive Report FiltersWhen you customize an interactive report, a filter displays between the search bar andthe report.
The following illustration shows a report with two filters Project = 'Bug Tracker' andStatus = 'On-Hold'. By default, filters display in the Report Settings area above thereport. You can show or hide the filter details by clicking the arrow to the left of thefilter name.
When you expand a filter and view the details, you can edit it as follows:
• Enable/Disable - To enable and disable a filter, select and deselect the check boxto the left of the filter name.
• Filter Edit - To edit a filter, click the filter name.
• Remove Filter - To remove a filter, select the Remove Filter icon to the right of thefilter name.
Chapter 3Using Interactive Report Filters
3-6
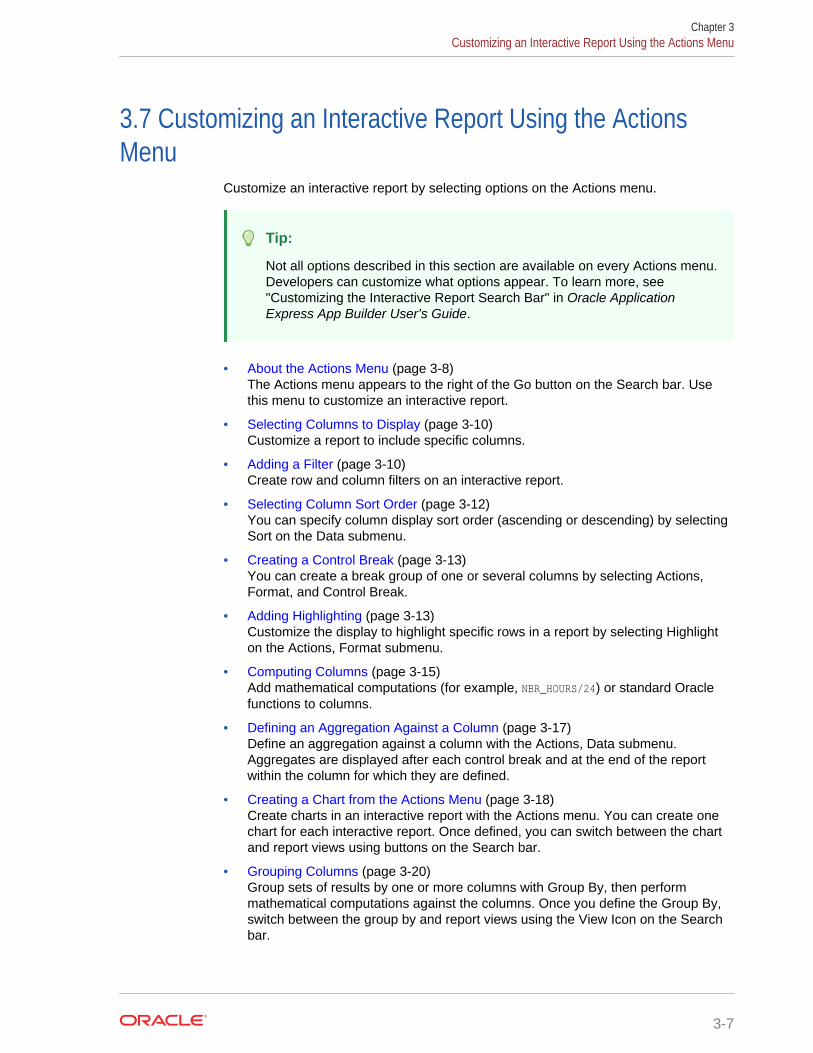
3.7 Customizing an Interactive Report Using the ActionsMenu
Customize an interactive report by selecting options on the Actions menu.
Tip:
Not all options described in this section are available on every Actions menu.Developers can customize what options appear. To learn more, see"Customizing the Interactive Report Search Bar" in Oracle ApplicationExpress App Builder User’s Guide.
• About the Actions Menu (page 3-8)The Actions menu appears to the right of the Go button on the Search bar. Usethis menu to customize an interactive report.
• Selecting Columns to Display (page 3-10)Customize a report to include specific columns.
• Adding a Filter (page 3-10)Create row and column filters on an interactive report.
• Selecting Column Sort Order (page 3-12)You can specify column display sort order (ascending or descending) by selectingSort on the Data submenu.
• Creating a Control Break (page 3-13)You can create a break group of one or several columns by selecting Actions,Format, and Control Break.
• Adding Highlighting (page 3-13)Customize the display to highlight specific rows in a report by selecting Highlighton the Actions, Format submenu.
• Computing Columns (page 3-15)Add mathematical computations (for example, NBR_HOURS/24) or standard Oraclefunctions to columns.
• Defining an Aggregation Against a Column (page 3-17)Define an aggregation against a column with the Actions, Data submenu.Aggregates are displayed after each control break and at the end of the reportwithin the column for which they are defined.
• Creating a Chart from the Actions Menu (page 3-18)Create charts in an interactive report with the Actions menu. You can create onechart for each interactive report. Once defined, you can switch between the chartand report views using buttons on the Search bar.
• Grouping Columns (page 3-20)Group sets of results by one or more columns with Group By, then performmathematical computations against the columns. Once you define the Group By,switch between the group by and report views using the View Icon on the Searchbar.
Chapter 3Customizing an Interactive Report Using the Actions Menu
3-7
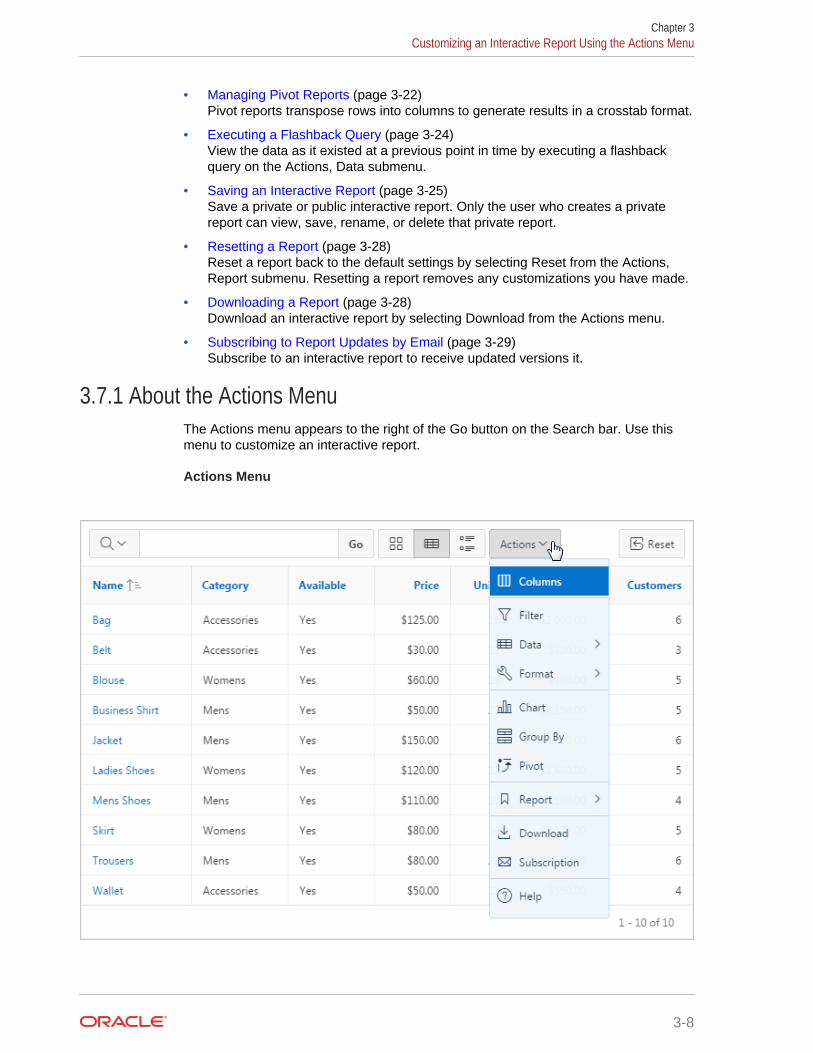
• Managing Pivot Reports (page 3-22)Pivot reports transpose rows into columns to generate results in a crosstab format.
• Executing a Flashback Query (page 3-24)View the data as it existed at a previous point in time by executing a flashbackquery on the Actions, Data submenu.
• Saving an Interactive Report (page 3-25)Save a private or public interactive report. Only the user who creates a privatereport can view, save, rename, or delete that private report.
• Resetting a Report (page 3-28)Reset a report back to the default settings by selecting Reset from the Actions,Report submenu. Resetting a report removes any customizations you have made.
• Downloading a Report (page 3-28)Download an interactive report by selecting Download from the Actions menu.
• Subscribing to Report Updates by Email (page 3-29)Subscribe to an interactive report to receive updated versions it.
3.7.1 About the Actions MenuThe Actions menu appears to the right of the Go button on the Search bar. Use thismenu to customize an interactive report.
Actions Menu
Chapter 3Customizing an Interactive Report Using the Actions Menu
3-8

The Actions menu contains the following options:
ColumnsSpecifies which columns to display and in what order. See "Selecting Columns toDisplay (page 3-10)."
FilterFocuses the report by adding or modifying the filter clause on the query. See "Addinga Filter (page 3-10)."
DataContains the Data submenu (see below).
FormatContains the Format submenu (see below).
ChartDisplays the report data as a chart. See "Creating a Chart from the Actions Menu(page 3-18)."
Group ByEnables users to group the result set by one or more columns and performmathematical computations against columns. See "Grouping Columns (page 3-20)."
PivotEnables users to define a Pivot report. See "Managing Pivot Reports (page 3-22)."
ReportContains the Report submenu.Manage your private and public reports of the interactive grid.Saves the interactive report. Depending upon their user credentials, users can savedifferent types of reports. See "Saving an Interactive Report (page 3-25)."Revert the grid to its last saved state with the Reset function.
ResetResets the report back to the default report settings. See "Resetting a Report(page 3-28)."
DownloadDownloads a report. Available download formats depend upon your installation andreport definition. See "Downloading a Report (page 3-28)."
SubscriptionSend an interactive report by email. See "Subscribing to Report Updates by Email(page 3-29)."
HelpProvides descriptions of how to customize interactive reports.
Data Submenu
The Actions Menu also contains the Data submenu. The Data submenu contains thefollowing options:
SortChanges the columns to sort on and determines whether to sort in ascending ordescending order. See "Selecting Column Sort Order (page 3-12)."
Chapter 3Customizing an Interactive Report Using the Actions Menu
3-9

AggregateEnables users to perform mathematical computations against a column. See "Definingan Aggregation Against a Column (page 3-17)."
ComputeEnables users to add computed columns to a report. See "Computing Columns(page 3-15)."
FlashbackEnables users to view the data as it existed at a previous point in time. See"Executing a Flashback Query (page 3-24)."
Format Submenu
The Actions Menu also contains the Format submenu. The Format submenu containsthe following options:
Control BreakCreates a break group on one or several columns. This pulls the columns out of theinteractive report and displays them as a master record. See "Creating a ControlBreak (page 3-13)."
HighlightDefines a filter that highlights the rows that meet the filter criteria. See "AddingHighlighting (page 3-13)."
3.7.2 Selecting Columns to DisplayCustomize a report to include specific columns.
To use the Select Columns option:
1. Click the Actions menu and select Columns.
The Select Columns dialog appears.
2. Select the columns you want to move. Click the center arrows to move a columnfrom Display in Report to Do Not Display. To select multiple columns at once,press and hold the CTRL key.
3. To change the order of the columns, click the Top, Up, Down, and Bottom arrowson the right.
4. Click Apply.
A revised report appears.
3.7.3 Adding a FilterCreate row and column filters on an interactive report.
• About Creating Filters (page 3-11)You can create a filter on an interactive report by adding or modifying the WHEREclause on the query.
• Adding, Editing, and Removing a Column Filter (page 3-11)Use the Actions menu to add, edit, or remove a column filter in an interactivereport.
Chapter 3Customizing an Interactive Report Using the Actions Menu
3-10

• Adding, Editing, and Removing a Row Filter (page 3-12)Use the Actions menu to add, edit, or remove a row filter in an interactive report.
3.7.3.1 About Creating FiltersYou can create a filter on an interactive report by adding or modifying the WHERE clauseon the query.
You can create two types of filters:
• Column - Creates a custom column filter. Select a column, select a standardOracle operator (=, !=, not in, between), and enter an expression to compareagainst. Expressions are case sensitive. Use the percent sign (%) as a wildcard.Note that the selected column does not need to be one that currently displays. Forexample:
STATE_NAME like A%
• Row - Creates a custom row filter. This filter creates a complex WHERE clausesusing column aliases and any Oracle functions or operators. For example:
G = 'VA' or G = 'CT'
Where G is the alias for CUSTOMER_STATE.
3.7.3.2 Adding, Editing, and Removing a Column FilterUse the Actions menu to add, edit, or remove a column filter in an interactive report.
To add a column filter:
1. Click the Actions menu and select Filter.
The Filter dialog appears.
2. For Filter Type, select Column.
3. In the Filter region, specify a column, an operator, and an expression and clickApply.
Chapter 3Customizing an Interactive Report Using the Actions Menu
3-11

Notice the filter that displays in the Report Settings area above the report. You canshow or hide the filter details by clicking the arrow to the left of the filter name.
To revise the filter:
4. Click the filter name (in this example, Project = 'Discussion Forum').
5. Edit your selections and click Apply.
6. To disable the filter, select the Enable/Disable Filter check box.
7. To delete the filter, click Remove Filter.
3.7.3.3 Adding, Editing, and Removing a Row FilterUse the Actions menu to add, edit, or remove a row filter in an interactive report.
To add a row filter:
1. Click the Actions menu and select Filter.
The Filter dialog appears.
2. For Filter Type, select Row.
3. In the Filter dialog:
a. Name - Enter a name that describes this filter.
b. Filter Expression - Enter an expression. Select a column and function oroperator at the bottom of the region. For example, I >=2500 displays projectscosting more than $5000.
c. Click Apply.
Notice the filter that displays in the Report Settings area above the report. Youcan show or hide the filter details by clicking the arrow to the left of the filtername.
4. To revise the filter:
a. Click the filter name.
b. Edit your selections and click Apply.
5. To disable the filter, select the Enable/Disable Filter check box.
6. To delete the filter, click Remove Filter.
3.7.4 Selecting Column Sort OrderYou can specify column display sort order (ascending or descending) by selecting Sorton the Data submenu.
You can also specify how to handle NULL values. Using the default setting alwaysdisplays NULL values last or always displays them first.
To sort by column:
1. Click the Actions menu and select Data and then Sort.
The Sort dialog appears.
2. Select a column, the sort direction (Ascending or Descending), and Null Sortingbehavior (Default, Nulls Always Last, or Nulls Always First).
Chapter 3Customizing an Interactive Report Using the Actions Menu
3-12

3. Click Apply.
3.7.5 Creating a Control BreakYou can create a break group of one or several columns by selecting Actions, Format,and Control Break.
Creating a break group pulls the columns out of the interactive report and displaysthem as a master record.
To create a break group:
1. Click the Actions menu and select Format and then Control Break.
The Control Break dialog appears.
2. Select a column and then a status (Enable or Disable).
3. Click Apply.
A revised report displays.
Note the defined filter displays in the Report Settings area above the report.
4. Click the left arrow to expand the filter.
5. To disable the Control Break filter, deselect the Enable/Disable Filter check box.To activate a disabled filter, select the Enable/Disable Filter check box again.
6. To delete the filter, click Remove Control Break.
3.7.6 Adding HighlightingCustomize the display to highlight specific rows in a report by selecting Highlight onthe Actions, Format submenu.
To add highlighting:
Chapter 3Customizing an Interactive Report Using the Actions Menu
3-13

1. Click the Actions menu and select Format and then Highlight.
The Highlight dialog appears.
2. Edit the following information:
a. Name - Enter a name that describes this filter.
b. Sequence - Enter a numeric value to identify the sequence in whichhighlighting rules are evaluated.
c. Enabled - Select Yes.
d. Highlight Type - Select Cell or Row.
e. Background Color - Select a new color for the background of the highlightedarea.
f. Text Color - Select a new color for the text in the highlighted area.
g. Highlight Condition - Select a column, an operator, and expression.
h. Click Apply.
Chapter 3Customizing an Interactive Report Using the Actions Menu
3-14

Tip:
Note the highlight On-Hold Projects displays in the Report Settings areaabove the report. You can show or hide the filter details by clicking thearrow to the left of the filter name.
3. To revise the highlight, click the highlight name and make the following edits:
a. Background Color - Select yellow.
b. Text Color - Select red.
c. Click Apply.
4. To disable the highlight, select the Enable/Disable check box.
5. To delete the highlight, click Remove Highlight.
3.7.7 Computing ColumnsAdd mathematical computations (for example, NBR_HOURS/24) or standard Oraclefunctions to columns.
• Creating a Computation (page 3-15)Use the Compute function in the Actions, Data submenu to add a computation to acolumn.
• Deleting a Computation (page 3-16)Open the Compute dialog to remove a computation.
3.7.7.1 Creating a ComputationUse the Compute function in the Actions, Data submenu to add a computation to acolumn.
To create a computation:
1. Click the Actions menu and select Data and then Compute.
The Compute dialog appears.
Chapter 3Customizing an Interactive Report Using the Actions Menu
3-15

2. In the Compute dialog:
a. Computation - Select New Computation.
b. Column Label - Enter the name of the new column to be created.
c. Format Mask - Select an Oracle format mask to be applied to the new column.(For example, $5,234.10).
3. Create the computation:
a. Columns - Select a column or alias.
b. Keypad - Select a shortcut for commonly used keys.
c. Functions - Select the appropriate function.
In the following example, a new column compares the actual cost to the budgetedamount, using the formula I - H, where I is the budgeted amount and H is thecost.
4. Click Apply.
The revised report appears containing a new Cost Analysis column.
3.7.7.2 Deleting a ComputationOpen the Compute dialog to remove a computation.
To delete a computation:
1. Click the Actions menu and select Data and then Compute.
The Compute dialog appears.
2. From Computation, select the computation.
The computation appears.
3. Click Delete.
Chapter 3Customizing an Interactive Report Using the Actions Menu
3-16

3.7.8 Defining an Aggregation Against a ColumnDefine an aggregation against a column with the Actions, Data submenu. Aggregatesare displayed after each control break and at the end of the report within the columnfor which they are defined.
• Creating an Aggregation Against a Column (page 3-17)Create an aggregation by selecting Aggregate in the Actions, Data submenu.
• Removing a Column Aggregation (page 3-18)Open the Aggregate dialog to remove an aggregation.
3.7.8.1 Creating an Aggregation Against a ColumnCreate an aggregation by selecting Aggregate in the Actions, Data submenu.
To create an aggregation against a column:
1. Click the Actions menu and select Data and then Aggregate.
The Aggregate dialog appears.
2. In the Aggregate dialog:
a. Aggregation - Select New Aggregation.
b. Function - Select one of the following: Sum; Average, Count, Count Distinct,Minimum, Maximum, or Median.
c. Column - Select a column.
This example creates a sum of the Cost column.
d. Click Apply.
Chapter 3Customizing an Interactive Report Using the Actions Menu
3-17

The computation appears at the bottom of the last page of the report. In thisexample, the aggregate shows the sum of all amounts in the Cost column.
3.7.8.2 Removing a Column AggregationOpen the Aggregate dialog to remove an aggregation.
To remove column aggregation:
1. Click the Actions menu and select Data and then Aggregate.
The Aggregate dialog appears.
2. From Aggregation, select a previously defined aggregation.
3. Click Delete.
3.7.9 Creating a Chart from the Actions MenuCreate charts in an interactive report with the Actions menu. You can create one chartfor each interactive report. Once defined, you can switch between the chart and reportviews using buttons on the Search bar.
• Creating a Chart (page 3-18)Use the Chart function in the Actions menu to create a chart in an interactivereport.
• Editing a Chart (page 3-19)Open the Chart dialog to edit a chart in an interactive report.
• Deleting a Chart (page 3-19)Open the Chart dialog to remove a chart in an interactive report.
3.7.9.1 Creating a ChartUse the Chart function in the Actions menu to create a chart in an interactive report.
To create a chart:
1. Click the Actions menu and select Chart.
The Chart dialog appears.
2. In the Chart dialog, specify the appropriate options.
a. Chart Type - Select the type of chart you want to create (horizontal bar,vertical bar, pie, or line).
Chapter 3Customizing an Interactive Report Using the Actions Menu
3-18

b. Label - Select the column to be used as the label.
c. Axis for Title for Label - Enter the title to display on the axis associated withthe column selected for Label (not available for pie chart)
d. Value - Select the column to be used as the Value. If your function is a COUNT,a Value does not need to be selected.
e. Axis Title for Value - Enter the title to display on the axis associated with thecolumn selected for Value (not available for pie chart).
f. Function - (Optional) Select a function to be performed on the column selectedfor Value.
g. Orientation - Select whether chart elements extend up and down or sideways.(Not applicable for pie charts.)
h. Sort - Select a sorting method.
3. Click Apply.
The chart appears.
Tip:
The Search bar now contains two icons: View Report and View Chart. Clickthese icons to toggle between chart and report views.
3.7.9.2 Editing a ChartOpen the Chart dialog to edit a chart in an interactive report.
To edit a chart:
1. While viewing a report:
a. Click the Actions menu and select Chart.
The Chart dialog appears.
b. Edit your selections and click Apply.
2. While viewing a chart:
a. Click Edit Chart.
b. Edit your selections and click Apply.
3.7.9.3 Deleting a ChartOpen the Chart dialog to remove a chart in an interactive report.
To delete a chart:
1. While viewing a report:
a. Click the Actions menu and select Chart.
The Chart dialog appears.
b. Click Delete.
2. While viewing a chart:
Chapter 3Customizing an Interactive Report Using the Actions Menu
3-19

a. Click Edit Chart.
b. Click Delete.
Tip:
You can also click the Remove Chart icon to the right of the Edit Chartfilter.
3.7.10 Grouping ColumnsGroup sets of results by one or more columns with Group By, then performmathematical computations against the columns. Once you define the Group By,switch between the group by and report views using the View Icon on the Search bar.
• Creating a Group By (page 3-20)Use the Group By function in the Actions menu to reorganize an interactive grid.
• Editing a Group By (page 3-21)Edit the properties of a grouping in the Goup By dialog.
• Selecting a Group By Sort Order (page 3-22)Specify group by column sort order (ascending or descending) by either clickingon the group by column heading or selecting Group By Sort on the Data submenu.
• Deleting a Group By (page 3-22)Delete a grouping in the Group By dialog.
3.7.10.1 Creating a Group ByUse the Group By function in the Actions menu to reorganize an interactive grid.
To use Group By:
1. Click the Actions menu and select Group By.
The Group By dialog appears.
2. In the Group by dialog:
a. Select a column to display. To add additional columns, click Add Group ByColumn.
b. Select the function, column, label, and format mask. To create a sum, click theSum check box. To add another function, click Add Function.
Chapter 3Customizing an Interactive Report Using the Actions Menu
3-20

c. Click Apply.
A Group By icon appears to the left of the Actions menu. The resulting report displaysthe Project, Task Name, and Budget columns. Additionally, a new column, Total Cost,displays on the right side.
3.7.10.2 Editing a Group ByEdit the properties of a grouping in the Goup By dialog.
To edit a group by:
1. Click Edit Group By.
The Group By dialog appears.
2. Edit the attributes.
3. To remove a previously defined Group by Column, select the default settingSelect Group By Column.
4. Click Apply.
Chapter 3Customizing an Interactive Report Using the Actions Menu
3-21
3.7.10.3 Selecting a Group By Sort OrderSpecify group by column sort order (ascending or descending) by either clicking on thegroup by column heading or selecting Group By Sort on the Data submenu.
You can also specify how to handle NULL values. Using the default setting alwaysdisplays NULL values last or always displays them first.
To sort a group by column:
1. Access a Group By view.
2. Click the Actions menu, select Data, and select Group By Sort.
Tip:
The Group By Sort menu is only visible when you are viewing Group Byview.
The Group By Sort dialog appears.
3. Select a column, the sort direction (Ascending or Descending), and Null Sortingbehavior (Default, Nulls Always Last, or Nulls Always First).
4. Click Apply.
3.7.10.4 Deleting a Group ByDelete a grouping in the Group By dialog.
To delete a group by:
1. Click Edit Group By.
The Group By dialog appears.
2. Click Delete.
Tip:
You can also click the Remove Group By icon to the right of the Edit GroupBy filter.
3.7.11 Managing Pivot ReportsPivot reports transpose rows into columns to generate results in a crosstab format.
Select pivot columns and rows and then provide the functions to be represented in thepivot report. Once created, pivot reports display a new icon in the search bar.
• Creating a Pivot Report (page 3-23)Create a pivot report by opening the Pivot dialog from the Actions menu.
Chapter 3Customizing an Interactive Report Using the Actions Menu
3-22

• Editing a Pivot Report (page 3-24)Edit a pivot report by clicking the Edit Pivot filter in an interactive report andopening the Pivot dialog.
• Deleting a Pivot Report (page 3-24)Remove a pivot report from an interactive report in the Pivot dialog.
3.7.11.1 Creating a Pivot ReportCreate a pivot report by opening the Pivot dialog from the Actions menu.
To create a pivot report:
1. Click the Actions menu and select Pivot.
The Pivot dialog appears.
2. In the Pivot dialog:
a. Pivot Columns - Select the columns to display (for example, Status). To addadditional columns, click Add Pivot Column.
b. Row Columns - Select the rows to display (for example, Project). To addadditional columns, click Add Row Column.
c. Computation:
• Select a function, column, label, and format mask.
• To create a sum, click the Sum check box (optional).
d. Click Apply.
The Search Bar now contains two icons: View Report and View Pivot. Click theseicons to toggle between the report view and the pivot view.
The following example shows a Pivot report that displays the number of closed, on-hold, open, and pending tasks associated with each project.
Chapter 3Customizing an Interactive Report Using the Actions Menu
3-23

3.7.11.2 Editing a Pivot ReportEdit a pivot report by clicking the Edit Pivot filter in an interactive report and openingthe Pivot dialog.
To edit a pivot report:
1. Click the Edit Pivot filter.
The Pivot dialog appears.
2. Edit the attributes.
3. To remove a previously defined column or row, select the default setting, SelectPivot Column and Select Row Column.
4. Click Apply.
3.7.11.3 Deleting a Pivot ReportRemove a pivot report from an interactive report in the Pivot dialog.
To delete a pivot report:
1. Click the Edit Pivot filter.
The Pivot dialog appears.
2. Click Delete.
Tip:
You can also click the Remove Pivot icon to the right of the Edit Pivot filter.
3.7.12 Executing a Flashback QueryView the data as it existed at a previous point in time by executing a flashback queryon the Actions, Data submenu.
The default amount of time that you can flashback is 3 hours (or 180 minutes) but theactual amount is different for each database.
• Creating a Flashback Query (page 3-24)Create a flashback query by using the Actions, Data submenu.
• Editing a Flashback Query (page 3-25)Edit a flashback query by clicking the flashback query filter in an interactive report.
• Deleting a Flashback Query (page 3-25)Delete a flashback query by using the flashback query filter dialog in an interactivereport.
3.7.12.1 Creating a Flashback QueryCreate a flashback query by using the Actions, Data submenu.
To execute a flashback query:
Chapter 3Customizing an Interactive Report Using the Actions Menu
3-24

1. Click the Actions menu and select Data then Flashback.
2. In the Flashback field, enter the number of minutes.
3. Click Apply.
3.7.12.2 Editing a Flashback QueryEdit a flashback query by clicking the flashback query filter in an interactive report.
To edit a flashback query:
1. Click flashback query filter.
The Flashback dialog appears.
2. Edit minute ago attribute.
3. Click Apply.
3.7.12.3 Deleting a Flashback QueryDelete a flashback query by using the flashback query filter dialog in an interactivereport.
To delete a flashback query:
1. Click the flashback query filter.
The Flashback dialog appears.
2. Click Delete.
Tip:
You can also click the Remove Flashback icon to the right of the flashbackquery filter.
3.7.13 Saving an Interactive ReportSave a private or public interactive report. Only the user who creates a private reportcan view, save, rename, or delete that private report.
• About the Report List (page 3-26)You can view different versions of an interactive report by selecting from a drop-down list of default or primary reports and private reports.
• About Configuration Dependencies (page 3-26)The ability to save an interactive report is configurable by the applicationdeveloper who creates the interactive report.
• Saving a Public or Private Interactive Report (page 3-26)End users can save an interactive report and classify it as Public or Private.
• Renaming a Public or Private Interactive Report (page 3-27)Rename a public or private report that you have created by clicking its reportname.
Chapter 3Customizing an Interactive Report Using the Actions Menu
3-25

• Deleting a Public or Private Interactive Report (page 3-28)Remove a public or private report that you have created by clicking its RemoveReport icon.
3.7.13.1 About the Report ListYou can view different versions of an interactive report by selecting from a drop-downlist of default or primary reports and private reports.
The following illustration shows the Reports list on the Search bar of an interactivereport.
This example shows two reports:
Default - Primary ReportThis is the initial report created by the application developer. Default, Primary reportscannot be renamed or deleted.
Private - 1. Open ProjectsThis is a Private report. Only the user who creates a private report can view, save,rename, or delete it.
3.7.13.2 About Configuration DependenciesThe ability to save an interactive report is configurable by the application developerwho creates the interactive report.
3.7.13.3 Saving a Public or Private Interactive ReportEnd users can save an interactive report and classify it as Public or Private.
PublicThe report can be saved, renamed, or deleted by the end user who created it. Otherusers can view and save the layout as another report.
PrivateOnly the end user that created the report can view, save, rename or delete the report.
To save a public or private interactive report:
Chapter 3Customizing an Interactive Report Using the Actions Menu
3-26

1. Go to the page containing the interactive report you want to save.
2. Customize the report (for example, hide columns, add filters, and so on).
3. Click the Actions menu and select Report then Save Report.
The Save Report dialog appears.
4. In Save Report:
a. Select either As Named Report or As Default Report Settings option.
Tip:
This option is available for only developers.
b. Name - Enter a name for the report.
c. Description - Enter an optional description.
d. Public - Select this check box to make the report viewable to all users.Deselect this check box to make the report private.
Tip:
The ability to save an interactive report as Public is determined byyour application developer.
e. Click Apply.
3.7.13.4 Renaming a Public or Private Interactive ReportRename a public or private report that you have created by clicking its report name.
To rename a public or private interactive report:
1. Select a public or private interactive report to rename.
2. Click the report name link.
3. Edit the attributes (for example, enter a new name).
4. Click Apply.
Chapter 3Customizing an Interactive Report Using the Actions Menu
3-27

3.7.13.5 Deleting a Public or Private Interactive ReportRemove a public or private report that you have created by clicking its Remove Reporticon.
To delete a public or private interactive report:
1. Click the Remove Report icon next to the report name link.
2. Click Apply.
3.7.14 Resetting a ReportReset a report back to the default settings by selecting Reset from the Actions, Reportsubmenu. Resetting a report removes any customizations you have made.
To reset a report:
1. Click the Actions menu and select Report then Reset.
2. Click Apply.
Tip:
You can also reset a report by clicking the Reset Report button in theSearch Bar.
3.7.15 Downloading a ReportDownload an interactive report by selecting Download from the Actions menu.
Available download formats depend upon your installation and report definition.Supported formats include comma-delimited file (CSV) format, HTML, Email, MicrosoftExcel (XLS) format, Adobe Portable Document Format (PDF), and Microsoft WordRich Text Format (RTF).
To download a report:
1. Click the Actions menu and select Download.
2. Select a report download format and follow the provided instructions.
Chapter 3Customizing an Interactive Report Using the Actions Menu
3-28

Tip:
The ability to download an interactive report is configurable by yourapplication developer.
3.7.16 Subscribing to Report Updates by EmailSubscribe to an interactive report to receive updated versions it.
• How Report Subscriptions Work (page 3-29)You can subscribe to a report by clicking Subscription on the Actions menu.
• Subscribing to Updated Report Results (page 3-29)Subscribe to a report by selecting Subscription in the Actions menu.
See Also:
"Managing Interactive Report Subscriptions" in Oracle Application ExpressAdministration Guide
3.7.16.1 How Report Subscriptions WorkYou can subscribe to a report by clicking Subscription on the Actions menu.
Emails sent from an interactive report contain a system generated email signature thatcannot be overwritten that identifies who originated the email.
To use Subscription:
• An Oracle Application Express administrator must configure email at the Instancelevel.
• The application developer configure enable the Subscription check box on theInteractive Report Attributes page.
3.7.16.2 Subscribing to Updated Report ResultsSubscribe to a report by selecting Subscription in the Actions menu.
Note:
Emails sent from a subscription include a system generated email signatureindicating who created the subscription. This signature cannot be removed.
To receive updated report results by email:
1. Click the Actions menu and select Subscription.
Chapter 3Customizing an Interactive Report Using the Actions Menu
3-29

The Subscription dialog appears.
2. Under Subscription:
a. Email Address - Enter the email addresses to receive the report. To includemultiple email addresses, separate each email address with a comma.
b. Subject - Enter text to display in the email subject line.
c. Frequency - Select the interval at which the report is sent.
d. Starting From - Select a start date and time.
e. Ending - Select an end date and time. Select a day, week, month, or year.
f. Click Apply.
Chapter 3Customizing an Interactive Report Using the Actions Menu
3-30

4Data Loading Wizard Examples
You can import data into an Oracle Application Express application using an existingapplication Data Loading Wizard.
Tip:
To use the functionality described in this section, your application must bebuilt with Data Upload capability. To learn more, see "Creating Applicationswith Data Loading Capability" in Oracle Application Express App BuilderUser’s Guide.
• About Using the Data Loading Wizard (page 4-1)You can run a Data Load Wizard to upload data from a file or copy and paste datathat you have entered directly into the wizard.
• Importing Data from a File into Your Application (page 4-2)Use the Data Load Wizard to import data into your application from a file, such asa text file.
• Copying and Pasting Data into Your Application (page 4-5)Use the Data Load wizard to copy and paste data from a file, such as a text file.
4.1 About Using the Data Loading WizardYou can run a Data Load Wizard to upload data from a file or copy and paste data thatyou have entered directly into the wizard.
Applications with data loading capability enables you to directly import data into a tablewhich has been configured by the application developer.
The Data Loading wizard for your application may have been built to include the abilityto apply table lookup and transformation rules during the data upload process. Beforethe data is actually imported into the database, you can preview the data after all lookup and transformation rules have been applied.
• Table Lookups - These rules automatically map data in the import file or copy andpaste field to data that is found in another table. For example, if the import filecontains a department name for the DEPTNO column but the upload table requires anumber for that column, use a table lookup rule to find the correspondingdepartment number for that department name in another table.
• Data transformation rules - These rules automatically perform formattingtransformations such as changing import data to uppercase, lowercase, and so on.For example, if the import file includes column data with both upper and lowercaseand the destination table requires all uppercase, data transformation rules canautomatically insert only uppercase into that column during data upload.
4-1

4.2 Importing Data from a File into Your ApplicationUse the Data Load Wizard to import data into your application from a file, such as atext file.
This procedure includes examples from the sample packaged application, SampleDatabase Application.
To upload data to your application, the application must have been built with DataUpload capability and the file must be formatted properly.
To upload data from a file:
1. Run the sample packaged application, Sample Database Application.
2. On the Customers page, click Upload Data.
The Data Load wizard appears. Next, select how to upload data.
3. For Import From, select Upload file, comma separated (*.csv) or tab delimited.
4. Under Data Load Source:
a. File Name - Browse to the file name containing the data to upload.
Chapter 4Importing Data from a File into Your Application
4-2

Tip:
To create a text file with sample data, copy and paste the datashown at the top of the page into a text file. If you use this sampledata, remember to enter a comma (,) in the Separator attribute.
b. Separator - Enter the column separator character. Enter a comma (,) forcomma separators or \t for tab separators.
c. Optionally Enclosed By - Enter a delimiter character.
Use this character to delineate the starting and ending boundary of a datavalue. If you specify a delimiter character, Data Workshop ignores whitespaceoccurring before the starting and ending boundary of a data value. You canalso use this option to enclose a data value with the specified delimitercharacter.
d. First Row has Column Names - Select this option if your data contains columnnames in the first row.
e. Optionally select Use Advanced Settings and configure the followingattributes:
• Decimal Character - Enter a decimal character to separate the integer anddecimal parts of a number. To learn more, see field-level Help.
• Group Separator - Enter a group separator to separate integer groups.Any non-numeric character can function as the group separator with a fewexceptions. To learn more, see field-level Help.
• Currency Symbol - If your data contains an international currency symbol,enter it here. See field-level Help for examples.
• File Character Set - Select the file character set associated with the file tobe uploaded.
• Date / Number Formats to use - Select Use application standard formatmasks to use the Application Date and Timestamp formats during dataloading or Provide custom formats for uploaded columns to input yourown.
f. Click Next.
The Data/Table Mapping page appears.
Chapter 4Importing Data from a File into Your Application
4-3
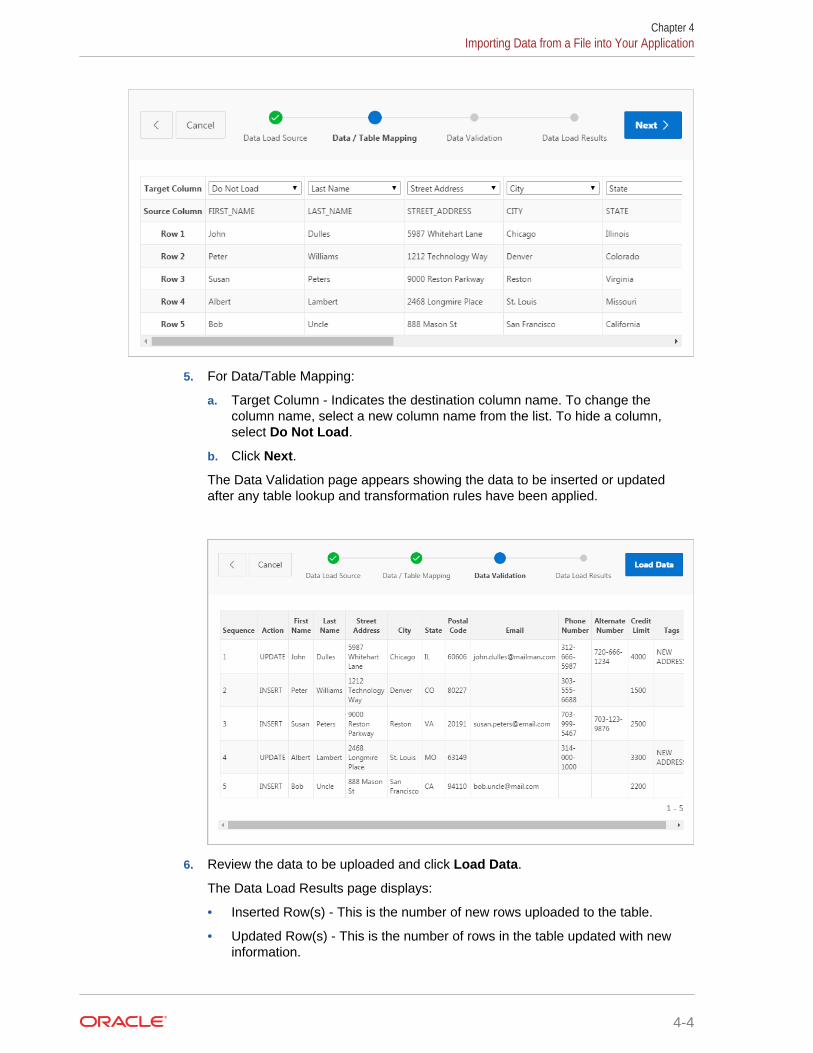
5. For Data/Table Mapping:
a. Target Column - Indicates the destination column name. To change thecolumn name, select a new column name from the list. To hide a column,select Do Not Load.
b. Click Next.
The Data Validation page appears showing the data to be inserted or updatedafter any table lookup and transformation rules have been applied.
6. Review the data to be uploaded and click Load Data.
The Data Load Results page displays:
• Inserted Row(s) - This is the number of new rows uploaded to the table.
• Updated Row(s) - This is the number of rows in the table updated with newinformation.
Chapter 4Importing Data from a File into Your Application
4-4

• Failed Row(s) - This is the number of rows from the upload file that were notadded or updated.
• To be Reviewed Row(s) - This is the number of rows needing review.
7. Click Finish.
4.3 Copying and Pasting Data into Your ApplicationUse the Data Load wizard to copy and paste data from a file, such as a text file.
This procedure includes an example from the sample packaged application, SampleDatabase Application.
To upload data to your application, the application must have been built with DataUpload capability and the pasted data must be formatted properly.
To upload data by copying and pasting:
1. Run the sample packaged application, Sample Database Application.
2. On the Customers page, click Upload Data.
The Data Load wizard appears. Next, select how to upload data.
3. From Import From, select Copy and Paste.
4. Under Data Source Load:
a. Copy and Paste Delimited Data - Copy the example comma-separated listshown in the Data Load Source dialog (First Name,Last Name,Street ...), andpaste it here.
b. Separator - Enter the column separator character. Enter a comma (,) forcomma separators or \t for tab separators.
Chapter 4Copying and Pasting Data into Your Application
4-5
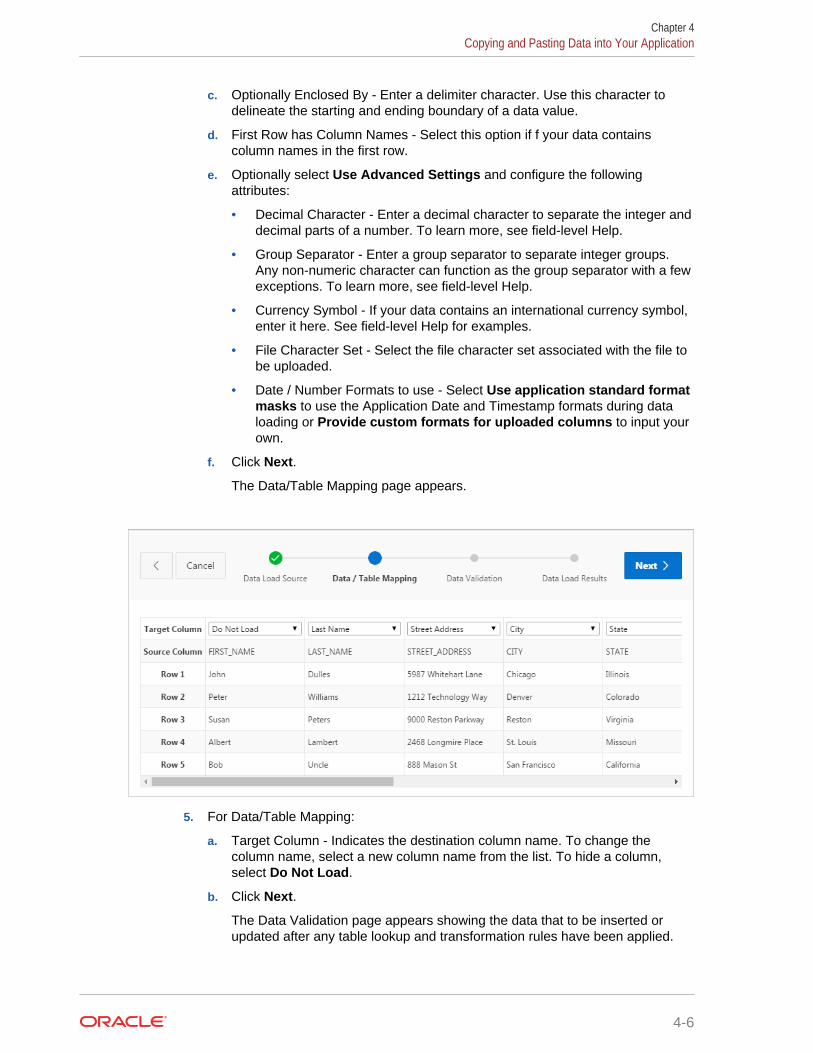
c. Optionally Enclosed By - Enter a delimiter character. Use this character todelineate the starting and ending boundary of a data value.
d. First Row has Column Names - Select this option if f your data containscolumn names in the first row.
e. Optionally select Use Advanced Settings and configure the followingattributes:
• Decimal Character - Enter a decimal character to separate the integer anddecimal parts of a number. To learn more, see field-level Help.
• Group Separator - Enter a group separator to separate integer groups.Any non-numeric character can function as the group separator with a fewexceptions. To learn more, see field-level Help.
• Currency Symbol - If your data contains an international currency symbol,enter it here. See field-level Help for examples.
• File Character Set - Select the file character set associated with the file tobe uploaded.
• Date / Number Formats to use - Select Use application standard formatmasks to use the Application Date and Timestamp formats during dataloading or Provide custom formats for uploaded columns to input yourown.
f. Click Next.
The Data/Table Mapping page appears.
5. For Data/Table Mapping:
a. Target Column - Indicates the destination column name. To change thecolumn name, select a new column name from the list. To hide a column,select Do Not Load.
b. Click Next.
The Data Validation page appears showing the data that to be inserted orupdated after any table lookup and transformation rules have been applied.
Chapter 4Copying and Pasting Data into Your Application
4-6

6. For Data Validation, review the data to be uploaded and click Load Data.
The Data Load Results page shows:
• Inserted Row(s) - This is the number of new rows uploaded to the table.
• Updated Row(s) - This is the number of rows in the table updated with newinformation.
• Failed Row(s) - This is the number of rows from the upload file that were notadded or updated.
• To be Reviewed Row(s) - This is the number of rows needing review.
7. Click Finish.
Chapter 4Copying and Pasting Data into Your Application
4-7

5Using Websheets
User interface elements common to all Websheets include breadcrumb sections,navigation sections, online help, search, and the Websheet control panel.
• About Websheet Applications (page 5-2)Websheet applications are interactive web pages that combine text with data. Youcan define these highly dynamic applications in a number of ways.
• Accessing Websheets (page 5-2)Users access a Websheet by loading the Websheet URL, logging in with theiraccount credentials (username and password), and navigating to the Websheetpage.
• Using Websheets (page 5-4)The Websheet application interface contains various elements for quick navigationand robust text editing.
• Managing Websheet Pages (page 5-8)You can add pages to a Websheet manually or copy existing pages.
• Adding and Editing Page Sections (page 5-10)You can add new sections to a Websheet page with the Create menu and editexisting sections with the Edit button and Edit menu.
• Adding and Editing Text Sections (page 5-12)You can create a Text section to add text to a Websheet page. You can typedirectly into a text section, or copy and paste content from a spreadsheet.
• Adding a Navigation Section (page 5-15)Add dynamically generated navigation to subordinate pages or page sections byclicking New Section in the Create menu and create a Navigation section.
• Managing Data Grids (page 5-16)Data grids are sets of data displayed in rows and columns. Data grids store data ina similar way to how spreadsheets store data. Once created, the structure can bemodified as needed over time.
• Adding and Editing Data Content (page 5-27)Add content to Websheets that is queried from your Oracle Database (such asdata grids and reports). Note: this function requires your application’s developer toenable the Allow SQL attribute.
• Adding Data Reports (page 5-28)Data reports are contributor defined queries on tables or views within theunderlying Oracle Database.
• Creating Data Sections Based on a Data Grid or Report (page 5-31)Add a data grid or data report to a Websheet with data sections.
• Creating Chart Sections (page 5-32)You can create inline charts based upon a data grid or report.
5-1

• Understanding Markup Syntax (page 5-34)You can use the following syntax for adding links to Websheet pages, pagesections, external URLs, data grids, or for including SQL or SQLVALUE syntax.
• Managing Annotations (page 5-38)Add commentary and additional details to a web sheet in annotations.
• Managing Websheet Applications (page 5-44)From a Websheet, you can change your Websheet password, email a Websheetto another user, and print a Websheet.
• Viewing Websheets (page 5-45)Use the options on the View menu to access presentation mode, view a pagedirectory, access a page history, and view an application directory.
See Also:
"Creating Websheet Applications" in Oracle Application Express App BuilderUser’s Guide
5.1 About Websheet ApplicationsWebsheet applications are interactive web pages that combine text with data. You candefine these highly dynamic applications in a number of ways.
Websheet applications include navigation controls, search capabilities, and the abilityto add annotations such as files, notes, and tags. Websheet applications can besecured using access control lists and several built-in authentication models.
5.2 Accessing WebsheetsUsers access a Websheet by loading the Websheet URL, logging in with their accountcredentials (username and password), and navigating to the Websheet page.
• About Websheet URLs (page 5-2)Websheet URLs contain an application ID and a page ID. When you access aWebsheet, the session ID also generates in the address bar.
• Accessing a Websheet (page 5-3)To access a Websheet, the Websheet developer provides you a URL and logincredentials (that is, a username and password). Ensure the URL includes theapplication ID and page ID, but not the session state ID.
5.2.1 About Websheet URLsWebsheet URLs contain an application ID and a page ID. When you access aWebsheet, the session ID also generates in the address bar.
Parts of a Websheet URL
The following is an example of a Websheet URL:
http://apex.somewhere.com/pls/apex/ws?p=4350:1:220883407765693447
Chapter 5About Websheet Applications
5-2

ws?p=
Indicates that you are accessing an Oracle Application Express Websheet application.
4350The application ID. Specifies which Websheet application.
1The page ID. Specifies which page within the application. Depending on how thedeveloper configured the page, the page ID may be a word, such as home.
220883407765693447The session ID. The Application Express engine uses the session ID to fetch sessionstate from the database. Oracle Application Express assigns new session IDs duringauthentication processing, records the authenticated user's identity with the sessionID, and continually checks the session ID in each page request's URL or POST datawith the session cookie and the session record in the database.
WARNING:
Do not enter the session state ID when you access a Websheet URL.Entering information beyond the page ID displays an error.
5.2.2 Accessing a WebsheetTo access a Websheet, the Websheet developer provides you a URL and logincredentials (that is, a username and password). Ensure the URL includes theapplication ID and page ID, but not the session state ID.
To access a Websheet:
1. Click the supplied URL, or enter it in your browser's Address field.
2. Enter your Websheet credentials:
a. Username - Enter your username.
b. Password - Enter your password.
c. Click Log In or Sign In.
Tip:
The language that displays differs depending upon who creates theapplication. For Oracle-supplied applications, including packagedapplications and the Oracle Application Express developmentenvironment, Sign In or Sign out displays. For applications you or yourdevelopers create, Log In or Log out displays.
The browser navigates to the Websheet.If you do not have a URL or the URL does not work, contact the person who createdthe Websheet.
Chapter 5Accessing Websheets
5-3

5.3 Using WebsheetsThe Websheet application interface contains various elements for quick navigation androbust text editing.
• Breadcrumb Sections (page 5-4)A breadcrumb displays at the top of every Websheet page. Click the down arrownext to the home breadcrumb to display a submenu of links to all Websheetpages.
• Navigation Sections (page 5-5)Websheets can contain multiple pages. Each navigation section includes ahierarchical tree that enables you to navigate between pages or page sections.
• Showing and Hiding Page Sections (page 5-5)To hide and show a section, click the arrow to the left of a section name.
• Online Help (page 5-6)A Help button displays in the upper right corner of each page. Clicking Helpdisplays a small Help system that provides an overview of Websheet functionality.
• Signing out of a Websheet (page 5-6)Click Sign out to log out of a Websheet.
• About the Websheet Search Bar (page 5-6)Perform case insensitive searches of application content in the Search Websheetsearch bar.
• Control Panel (page 5-7)For users with developer and administrator rights, the Control Panel displays onthe right side of most Websheet pages.
5.3.1 Breadcrumb SectionsA breadcrumb displays at the top of every Websheet page. Click the down arrow nextto the home breadcrumb to display a submenu of links to all Websheet pages.
To view another page, click the child breadcrumb entry.
Chapter 5Using Websheets
5-4

5.3.2 Navigation SectionsWebsheets can contain multiple pages. Each navigation section includes ahierarchical tree that enables you to navigate between pages or page sections.
Click the arrows on the left to expand or collapse the tree. To open a specific sectionor page, click it. Click Expand All to view all pages and page subsections. Click Resetto return the tree to the default display.
5.3.3 Showing and Hiding Page SectionsTo hide and show a section, click the arrow to the left of a section name.
Chapter 5Using Websheets
5-5

5.3.4 Online HelpA Help button displays in the upper right corner of each page. Clicking Help displays asmall Help system that provides an overview of Websheet functionality.
Available tabs include: About, Overview, Access Control, Markup Syntax, Data Grid,Application Content, and FAQ.
5.3.5 Signing out of a WebsheetClick Sign out to log out of a Websheet.
• To exit a running Websheet, click Sign out in the upper right corner.
Tip:
The language that displays differs depending upon who creates theapplication. For Oracle-supplied applications, including packagedapplications and the Oracle Application Express developmentenvironment, Sign In/Sign out displays. For applications you or yourdevelopers create, Log In/Log Out displays.
5.3.6 About the Websheet Search BarPerform case insensitive searches of application content in the Search Websheetsearch bar.
The Search Websheet field displays in the upper right of each Websheet page.
Chapter 5Using Websheets
5-6

To search a Websheet, click Search Websheet, enter your query, and press Enter.
Search results display in a report. To refresh the view, click the Search button.
Once the search results display, use the Search region on the right side of the page tocontrol what content to search. Searchable Content options include:
• Page Name
• Page Alias
• Page Description
• Section title
• Section content
• File Name, Alias, Description
• Tags
• Notes
• Data Grid Data
5.3.7 Control PanelFor users with developer and administrator rights, the Control Panel displays on theright side of most Websheet pages.
You can click the arrow to the right of the region title to hide or display the ControlPanel.
Chapter 5Using Websheets
5-7

The Websheet Control Panel contains the following options:
• New Sections. See "Adding and Editing Page Sections (page 5-10)."
• Edit Sections. See "Adding and Editing Page Sections (page 5-10)."
• New Page. See "Adding a New Page (page 5-9)."
• New Page as a Copy. See "Copying an Existing Page (page 5-9)."
• Edit Page. See "Editing Page Details (page 5-9)."
• Page Directory. See "Viewing the Page Directory (page 5-46)."
• New Data Grid. See "Creating a Data Grid (page 5-17)."
5.4 Managing Websheet PagesYou can add pages to a Websheet manually or copy existing pages.
Tip:
You can also add a new page by clicking New Page and New Page as aCopy on the Control Panel.
• Adding a New Page (page 5-9)Add a new page to a Websheet by clicking New Page in the Create menu.
• Copying an Existing Page (page 5-9)Copy a page in a Websheet by clicking New Page as a Copy in the Create Menu.
• Editing Page Details (page 5-9)Edit the details of a Websheet page (such as the name, parent page, anddescription) by clicking Edit Page in the Edit menu.
Chapter 5Managing Websheet Pages
5-8

5.4.1 Adding a New PageAdd a new page to a Websheet by clicking New Page in the Create menu.
To add a new Websheet page:
1. Run the Websheet application.
2. From the Create menu, select New Page.
3. On Create Page:
a. Name - Enter a page name. The page name displays as the window title andin the breadcrumb.
b. Page Alias - Identify the page alias. This alias enables you to link to this page.
c. Parent Page - If this page is part of a page hierarchy, then select the parentpage.
d. Click Create Page.
5.4.2 Copying an Existing PageCopy a page in a Websheet by clicking New Page as a Copy in the Create Menu.
To copy an existing page:
1. Run the Websheet application.
2. From the Create menu, select New Page as a Copy.
3. In New Page Name, enter the name of the new page.
4. Click Copy Page.
A success message appears.
5. Select one of the following:
• View Current Page
• View New Page
Tip:
You can change the parent page by editing the Page Details. See "EditingPage Details (page 5-9)."
5.4.3 Editing Page DetailsEdit the details of a Websheet page (such as the name, parent page, and description)by clicking Edit Page in the Edit menu.
On Page Details, you can change the page name, alias, parent page, or pagedescription.
To edit page details:
Chapter 5Managing Websheet Pages
5-9

1. Run the Websheet application.
2. From the Edit menu, select Edit Page.
3. On the Details Page:
• Name - Identifies the name of the page. The page name displays in thewindow title and in the breadcrumb.
• Alias - A page alias enables you to create links in page sections to otherpages. A page alias must be unique within an application.
• Owner - Identifies the owner of the page.
• Parent Page - Identifies the parent page. The defined parent page is used toconstruct breadcrumbs and navigation between pages.
• Page Description - Descriptive text that describes the page.
4. Click Apply Changes.
A success message appears.
Tip:
You can also edit page details by clicking Edit Page on the Control Panel.
5.5 Adding and Editing Page SectionsYou can add new sections to a Websheet page with the Create menu and edit existingsections with the Edit button and Edit menu.
• About Page Section Types (page 5-10)Websheets are organized into pages which consist of containers called sections.
• Editing Page Sections (page 5-11)Edit a section of a Websheet by clicking its Edit button.
• Deleting Page Sections (page 5-11)Delete a section of a Websheet by opening its Edit Section page.
• Editing Section Titles and Display Order (page 5-12)Change the title and display order of a section on the Edit Sections page.
5.5.1 About Page Section TypesWebsheets are organized into pages which consist of containers called sections.
To each Websheet page, you can add the following section types:
TextDisplay entered text, inline images, inline reports, links to reports, data grids, otherpages, files, external URLs, and so on. You can create and modify text sections usingan intuitive WYSIWIG editor. See "Adding and Editing Text Sections (page 5-12)."
Chapter 5Adding and Editing Page Sections
5-10

NavigationAdd dynamically generated navigation to subordinate pages or page sections. See"Adding a Navigation Section (page 5-15)."
DataCreate inline reports based upon a data grid or report. See "Creating Data SectionsBased on a Data Grid or Report (page 5-31)" and "Adding Data Reports(page 5-28)."
ChartCreate inline charts based upon a data grid or report. See "Creating Chart Sections(page 5-32)."
5.5.2 Editing Page SectionsEdit a section of a Websheet by clicking its Edit button.
To edit a page section:
1. Run the Websheet.
2. Click the Edit icon that displays in the upper right of each section.
The Edit Section page appears.
Tip:
The left side of the Edit Section page lists all sections on the currentpage. The current section is highlighted. To access another section,select it.
3. Edit the section and click Apply Changes.
5.5.3 Deleting Page SectionsDelete a section of a Websheet by opening its Edit Section page.
Chapter 5Adding and Editing Page Sections
5-11

To delete a page section:
1. Run the Websheet.
2. Click the Edit icon that displays in the upper right of the section.
The Edit Section page appears.
3. Click Delete.
5.5.4 Editing Section Titles and Display OrderChange the title and display order of a section on the Edit Sections page.
To edit all sections:
1. Run the Websheet application.
2. From the Edit menu, select Edit Sections.
The Edit Sections page appears.
3. To edit the section title, enter a new title.
4. To change the section order, click the Up and Down arrows adjacent to thesection title.
5. Click Apply Changes.
Tip:
You can also edit sections by clicking Edit Sections on the Control Panel.
5.6 Adding and Editing Text SectionsYou can create a Text section to add text to a Websheet page. You can type directlyinto a text section, or copy and paste content from a spreadsheet.
Chapter 5Adding and Editing Text Sections
5-12

Copying and pasting from a spreadsheet creates a new section for each spreadsheetrow.
• Adding a Text Section (page 5-13)Add a Text section to a Websheet by clicking New Section in the Create menu.
• Editing a Text Section (page 5-14)Edit and format a text section in a Websheet by clicking its Edit icon.
See Also:
• Deleting Page Sections (page 5-11)
• Understanding Markup Syntax (page 5-34)
5.6.1 Adding a Text SectionAdd a Text section to a Websheet by clicking New Section in the Create menu.
To add a text section:
1. Run the Websheet application.
2. From the Create menu, select New Section.
3. When prompted for the section type, select Text and click Next.
4. On Create Text Sections select either:
• Create single text section
• Create multiple text section from Spreadsheet
5. If you select Create single text section, specify the following:
a. Sequence - Enter the section display sequence.
b. Title - Enter a section title.
c. Content - Enter text. To learn more about formatting text, see "Editing a TextSection (page 5-14)."
d. Click Create Section.
6. If you select Create multiple text section from Spreadsheet, specify thefollowing:
a. First Row Contains Column Headings - Select this option if applicable.
b. Paste Spreadsheet Data - Paste a two column spreadsheet or other tabdelimited data. The first column must contain the section title and the secondcolumn must contain the section content.
c. Click Create Section.
Tip:
You can also add a new section by selecting New Section on theControl Panel.
Chapter 5Adding and Editing Text Sections
5-13

5.6.2 Editing a Text SectionEdit and format a text section in a Websheet by clicking its Edit icon.
To edit a text section:
1. Run the Websheet application.
2. Click the Edit icon that displays in the upper right of the section.
The Edit Section page appears.
3. Edit the text in the field provided.
4. To change the formatting, click the Expand Toolbar icon in the upper right corner.
Chapter 5Adding and Editing Text Sections
5-14

The Toolbar appears. When you pass your cursor over an icon, a descriptivetooltip displays.
5. To hide the toolbar, click the Collapse Toolbar icon.
6. To save your changes, click Apply Changes.
5.7 Adding a Navigation SectionAdd dynamically generated navigation to subordinate pages or page sections byclicking New Section in the Create menu and create a Navigation section.
To add a navigation section:
1. Run the Websheet application.
2. From the Create menu, select New Section.
3. When prompted for the section type, select Navigation and click Next.
4. For Navigation Type:
a. Select either:
• Page Navigation - Creates navigation of all pages in the Websheet.
• Section Navigation - Creates navigation for all sections on a page.
b. Click Next.
5. If you select Page Navigation, specify the following:
a. Sequence - Enter the section display sequence.
Chapter 5Adding a Navigation Section
5-15

b. Title - Enter a section title.
c. Starting Page - Select the starting page from which to display hierarchicalnavigation.
d. Maximum Levels - Select the maximum number of levels (or tree depth) todisplay.
e. Order Siblings By - Select the order of siblings by column. If not defined, thenthe siblings are sorted by the page name.
f. Click Create Section.
6. If you select Section Navigation, specify the following:
a. Sequence - Enter the section display sequence.
b. Title - Enter a section title.
c. Click Create Section.
5.8 Managing Data GridsData grids are sets of data displayed in rows and columns. Data grids store data in asimilar way to how spreadsheets store data. Once created, the structure can bemodified as needed over time.
• About Data Grids (page 5-17)You can define the structure of a data grid using column names, data sources, andbasic validations, or you can create a data grid by pasting spreadsheet data. Oncecreated, the structure can be modified as needed.
• Creating a Data Grid (page 5-17)You can create a data grid by either defining the structure (that is, the columnnames, data sources, and basic validations), or by pasting in spreadsheet data.
• Copying a Data Grid (page 5-18)Copy a data grid by clicking Copy in the Manage menu.
• Viewing and Editing a Data Grid (page 5-19)Once you create a data grid, you can view and edit it on the Data page.
• Viewing the Data Grid Change History Log (page 5-27)View the change history log of a data grid by selecting History in the Managemenu.
• Deleting a Data Grid (page 5-27)Delete a data grid by selecting Delete Data Grid in its Manage menu.
See Also:
• Adding and Editing Data Content (page 5-27)
• Understanding Markup Syntax (page 5-34)
Chapter 5Managing Data Grids
5-16

5.8.1 About Data GridsYou can define the structure of a data grid using column names, data sources, andbasic validations, or you can create a data grid by pasting spreadsheet data. Oncecreated, the structure can be modified as needed.
You can alter the layout of report data by selecting columns or by applying filters,highlighting, and sorting. You can also define breaks, aggregations, group bys,computations, and different charts.
Additionally, you can create multiple variations of a data grid and save them as namedreports, for either public or private viewing. You can also use the data from a data gridand include it as a chart or report within any page.
5.8.2 Creating a Data GridYou can create a data grid by either defining the structure (that is, the column names,data sources, and basic validations), or by pasting in spreadsheet data.
In addition to the defined columns, the following standard columns are always includedwithin each data grid: owner, created by, created on, updated by, updated on, roworder, and annotation (files, notes, links, and tags).
• Creating a Data Grid from Scratch (page 5-17)Create a data grid from scratch by clicking New Data Grid in the Create menu andselecting From Scratch.
• Creating a Data Grid by Copying and Pasting Spreadsheet Data (page 5-18)Create a data grid by copying and pasting spreadsheet data by clicking New DataGrid in the Create menu and selecting Copy and Paste.
5.8.2.1 Creating a Data Grid from ScratchCreate a data grid from scratch by clicking New Data Grid in the Create menu andselecting From Scratch.
When you create a data grid from scratch you must define the column names,datatypes, and basic values. Once you have created the basic structure, you can thenpopulate it with data.
To create a data grid from scratch:
1. Run the Websheet application.
2. From the Create menu, select New Data Grid.
Tip:
You can also select New Data Grid on the Control Panel.
3. When prompted for the section type, select From Scratch and click Next.
4. Specify the following:
a. Name - Enter a data grid name.
Chapter 5Managing Data Grids
5-17

b. Alias - Enter a data grid alias. Use this alias to link to this data grid within otherpage sections. A data grid alias must be unique within an application.
c. Define the data grid structure by specifying the column name and data type.To change the order, click the Up and Down arrow under Move.
Note:
To add more columns, click Add Column.
d. Click Create Data Grid.
The data grid appears.
5. To add data, click Add Row.
5.8.2.2 Creating a Data Grid by Copying and Pasting Spreadsheet DataCreate a data grid by copying and pasting spreadsheet data by clicking New Data Gridin the Create menu and selecting Copy and Paste.
To create a data grid by copying and pasting spreadsheet data:
1. Run the Websheet application.
2. From the Create menu, select New Data Grid.
Tip:
You can also select New Data Grid from the Create menu or the ControlPanel.
3. When prompted for the section type, select Copy and Paste and click Next.
4. Specify the following:
a. Name - Enter a data grid name.
b. Alias - Enter a data grid alias. You can use this alias to link to this data gridwithin page sections. A data grid alias must be unique within an application.
c. First Row Contains Column Headings - Select this option if applicable.
d. Paste Spreadsheet Data - Copy and paste the data you want to load from aspreadsheet program.
e. Click Upload.
A data grid appears.
5.8.3 Copying a Data GridCopy a data grid by clicking Copy in the Manage menu.
To copy a data grid:
1. Run the Websheet application.
2. From the Data Grid menu, select an existing data grid.
Chapter 5Managing Data Grids
5-18

The data grid appears.
3. From the Manage menu, select Copy.
4. Enter a new data grid name and click Copy.
5.8.4 Viewing and Editing a Data GridOnce you create a data grid, you can view and edit it on the Data page.
Tip:
Data grids display as an interactive report.
• Accessing the Data Page (page 5-20)Access the Data page by selecting View All in the Data Grid menu.
• Toggling Check Boxes (page 5-21)Toggle whether check boxes display when viewing a data grid by selecting ToggleCheckboxes in the Manage menu.
• Editing Data Grid Data (page 5-21)Edit the data in a data grid by clicking a valid cell or add a new row by clicking theAdd Row button.
• Editing Data Grid Columns Manually (page 5-22)Manually edit columns in a data grid by clicking Columns in the Manage menu.
• Editing Data Grid Rows Manually (page 5-23)Manually edit rows in a data grid by clicking Rows in the Manage menu.
• Editing a Single Data Grid Row (page 5-23)Edit a single row in a data grid by clicking its Edit Row icon (pencil).
• Adding Annotations to a Single Data Grid Row (page 5-24)Add annotations to a row in a data grid by clicking its Edit Row icon (pencil).
• Displaying Annotation Columns in a Data Grid Report (page 5-25)Choose which columns to display in a data grid by clicking the Actions menu andselecting Select Columns.
• Displaying Pseudo Columns in a Data Grid Report (page 5-25)Choose whether to display pseudo columns in a data grid report by clicking theActions menu and selecting Select Columns, then save the report.
• Editing Data Grid Properties (page 5-26)Change the name, alias, and description of a data grid on the Data Grid Propertiespage.
• Creating a Bookmark Link to a Data Grid (page 5-26)Create a bookmark link to a data grid by adding the appropriate syntax to the URLof its parent Websheet or retrieving the URL manually.
Chapter 5Managing Data Grids
5-19

See Also:
• Using Interactive Reports (page 3-1)
• Customizing an Interactive Report Using the Actions Menu (page 3-7)
5.8.4.1 Accessing the Data PageAccess the Data page by selecting View All in the Data Grid menu.
To access the Data page:
1. Run the Websheet application.
2. From the Data Grid menu, select View All.
An interactive report appears displaying all data grids. The report also appears inthe Report view.
Tip:
If icons display, then click the View Report icon.
By default, the Report view displays the data grid Name, Alias, Updated, andUpdated By columns. The Embed Tag column displays the syntax used to includea link to the report or data grid from within a section of a page.
3. Select a data grid.
The data grid appears.
Chapter 5Managing Data Grids
5-20

5.8.4.2 Toggling Check BoxesToggle whether check boxes display when viewing a data grid by selecting ToggleCheckboxes in the Manage menu.
Use the checkboxes for custom selections.
• To display checkboxes adjacent to each row:
• Click the Manage menu and select Toggle Checkboxes.
When enabled, check boxes display to the left of each row.
5.8.4.3 Editing Data Grid DataEdit the data in a data grid by clicking a valid cell or add a new row by clicking the AddRow button.
To edit data grid data:
1. Run the Websheet application.
2. From the Data Grid menu, select a data grid.
The data grid appears.
Chapter 5Managing Data Grids
5-21
3. Click a valid cell.
The cell expands into an editable text field.
4. When finished, click outside of the cell or press the Tab key to proceed to the nextcell in the column.
Changes are saved automatically.
To add another row:
5. Click the Add Row button.
A form appears.
6. Edit the fields provided. Each field is a column within the new row.
7. Click either Save or Save and Add Another.
Tip:
You can also edit an entire row by clicking the Edit Row button (pencil)adjacent to the row.
5.8.4.4 Editing Data Grid Columns ManuallyManually edit columns in a data grid by clicking Columns in the Manage menu.
To manually edit data grid columns:
1. Run the Websheet application.
2. From the Data Grid menu, select a data grid.
The data grid appears.
3. From the Manage menu, select Columns.
The following submenu displays:
AddAdds a new column. Enables you to define all column properties such as thecolumn name, group, type, value required, display as, list of values, default type,and so on.
Column PropertiesEditable properties include sequence, group, required value, display as, label,format, heading alignment, column alignment, default text, help text, and so on.
List of ValuesEnables you to restrict the values a user can enter. You associate a list of valueswith a column on Column Properties.
Column GroupsCreate a group and add columns to the group. Enables you to define the groupname and provide a description. You can select the columns for the new columngroup in the Column region by using the arrow keys.
ValidationEnables you to define a column validation, sequence, validation expression, anderror message.
Chapter 5Managing Data Grids
5-22

Delete ColumnsSelect columns to delete.
4. Select a submenu option and follow the on-screen instructions.
5.8.4.5 Editing Data Grid Rows ManuallyManually edit rows in a data grid by clicking Rows in the Manage menu.
To manually edit data grid rows:
1. Run the Websheet application.
2. From the Data Grid menu, select a data grid.
The data grid appears.
3. From the Manage Menu, select Rows.
The following submenu displays:
Add RowAdds a new row. Enables you to define the project, task, start date, end date, andso on.
Tip:
You can also click the Add Row button in the data grid to add a newrow.
Set Column ValuesSet a predefined value for a column for all rows, selected rows, or empty rows.
ReplaceSearch and replace row values for all rows or selected rows.
FillFill NULL column values with a column value from the above cell. Select a columnfrom which you want to fill the NULL column value.
Delete RowsSelect to delete all rows, selected rows, or rows with empty columns.
4. Select a submenu option and follow the on-screen instructions.
5.8.4.6 Editing a Single Data Grid RowEdit a single row in a data grid by clicking its Edit Row icon (pencil).
To manually edit a single data grid row:
1. Run the Websheet application.
2. From the Data Grid menu, select a data grid.
The data grid appears.
3. Locate the row to be edited and click the Edit Row icon.
The Add/Edit Row page appears.
Chapter 5Managing Data Grids
5-23
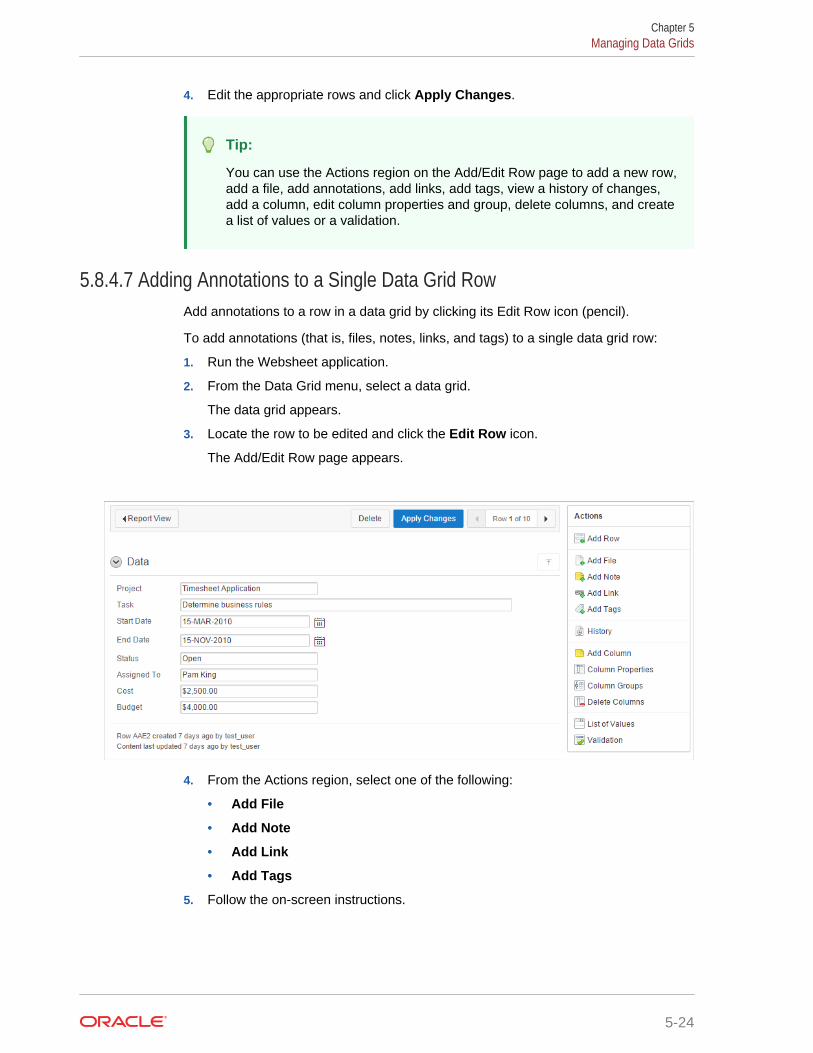
4. Edit the appropriate rows and click Apply Changes.
Tip:
You can use the Actions region on the Add/Edit Row page to add a new row,add a file, add annotations, add links, add tags, view a history of changes,add a column, edit column properties and group, delete columns, and createa list of values or a validation.
5.8.4.7 Adding Annotations to a Single Data Grid RowAdd annotations to a row in a data grid by clicking its Edit Row icon (pencil).
To add annotations (that is, files, notes, links, and tags) to a single data grid row:
1. Run the Websheet application.
2. From the Data Grid menu, select a data grid.
The data grid appears.
3. Locate the row to be edited and click the Edit Row icon.
The Add/Edit Row page appears.
4. From the Actions region, select one of the following:
• Add File
• Add Note
• Add Link
• Add Tags
5. Follow the on-screen instructions.
Chapter 5Managing Data Grids
5-24

5.8.4.8 Displaying Annotation Columns in a Data Grid ReportChoose which columns to display in a data grid by clicking the Actions menu andselecting Select Columns.
To display annotation columns (such as Files, Notes, Links, and Tags) in a data gridreport:
1. View the data grid report.
2. Click the Actions menu and then Select Columns.
3. In the Select Columns region, move the columns (for example, Files, Notes, Links,and Tags) to Display in Report.
4. Click Apply.
To ensure that all users can see the columns, developers can save the revised layoutas the default report.
To save a new default report:
5. Click the Actions menu and select Save Report.
The Save Report Region appears.
6. In Save Report:
a. Save - Select As Default Report Settings.
b. Name - Enter a name for the report.
c. Description - Enter an optional description.
d. Click Apply.
5.8.4.9 Displaying Pseudo Columns in a Data Grid ReportChoose whether to display pseudo columns in a data grid report by clicking theActions menu and selecting Select Columns, then save the report.
Data grids include the following pseudo columns:
OwnerThe username who created the row.
Row KeyThe user-friendly alphanumeric unique key to identify a row.
Row OrderThe unique number to identify a row.
Created ByThe username who created the row.
Created OnThe date when the row was created.
To display pseudo columns in a data grid report:
1. Include the pseudo columns in the data grid report:
a. View the data grid report.
Chapter 5Managing Data Grids
5-25

b. Click the Actions menu and then Select Columns.
c. In the Select Columns region, move the pseudo columns to Display in Report.
d. Click Apply.
2. Save a new default report:
a. Click the Actions menu and select Save Report.
The Save Report Region appears.
b. In Save Report:
i. Save - Select As Default Report Settings.
ii. Name - Enter a name for the report.
iii. Description - Enter an optional description.
iv. Click Apply.
5.8.4.10 Editing Data Grid PropertiesChange the name, alias, and description of a data grid on the Data Grid Propertiespage.
To edit data grid properties:
1. Run the Websheet application.
2. From the Data Grid menu, select a data grid.
The data grid appears.
3. From the Manage menu, click Properties.
The Data Grid Properties page appears.
4. Edit the fields provided and click Apply.
5.8.4.11 Creating a Bookmark Link to a Data GridCreate a bookmark link to a data grid by adding the appropriate syntax to the URL ofits parent Websheet or retrieving the URL manually.
To bookmark directly to a data grid or a row:
1. Use the following syntax:
ws?p=100000:DG_<data grid alias> ws?p=100000:DG_<data grid alias>::ROW_ID:<data grid row ID>
The data grid row ID is an ID column value of the APEX$_WS_ROWS table.
To get a link to a specific data grid row:
2. Run the data grid.
3. Click the Edit Row icon.
4. Note the URL in the browser.
Chapter 5Managing Data Grids
5-26
5.8.5 Viewing the Data Grid Change History LogView the change history log of a data grid by selecting History in the Manage menu.
The View Change History log displays a report of data grid changes. This report liststhe row, column name, old value, new value, user who authored the change, and howlong ago the change occurred.
To view a history of data grid changes:
1. Run the Websheet application.
2. From the Data Grid menu, select a data grid.
The data grid appears.
3. From the Manage menu, select History.
5.8.6 Deleting a Data GridDelete a data grid by selecting Delete Data Grid in its Manage menu.
To delete a data grid:
1. Run the Websheet application.
2. From the Data Grid menu, select a data grid.
The data grid appears.
3. From the Manage menu, select Delete Data Grid.
4. Confirm your selection and click Delete.
5.9 Adding and Editing Data ContentAdd content to Websheets that is queried from your Oracle Database (such as datagrids and reports). Note: this function requires your application’s developer to enablethe Allow SQL attribute.
• About Available Data Sources (page 5-27)You can include other Oracle Application Express data sources in Websheets.Once defined, you can incorporate these data sources into Websheet pagesections.
• Enabling Support for Creating Data Reports (page 5-28)To define a data report, your Websheet developer must enable the Allow SQLattribute on the Application Properties page.
• About Incorporating Data into Websheet Pages (page 5-28)Data grids and data reports can be incorporated into page sections in the followingways.
5.9.1 About Available Data SourcesYou can include other Oracle Application Express data sources in Websheets. Oncedefined, you can incorporate these data sources into Websheet page sections.
Websheets can include the following data sources:
Chapter 5Adding and Editing Data Content
5-27

Data GridsData grids are highly customizable, editable tabular reports. Data grids enable you tomaintain data within the Websheet that is stored within the Oracle Database. See"Managing Data Grids (page 5-16)."
ReportsReports are queries defined against tables or views that exist within your OracleDatabase. See "Adding Data Reports (page 5-28)."
5.9.2 Enabling Support for Creating Data ReportsTo define a data report, your Websheet developer must enable the Allow SQL attributeon the Application Properties page.
By default, this attribute is disabled.
• To enable support for creating data reports:
• Contact your developer.
Only a Websheet application developer can edit the Allow SQL attribute on theApplication Properties page.
5.9.3 About Incorporating Data into Websheet PagesData grids and data reports can be incorporated into page sections in the followingways.
Within a Data SectionSee "Adding Data Reports (page 5-28)."
Within a Chart SectionSee "Adding a Chart Section (page 5-33)."
Linking to a Data GridSee "Linking to a Data Grid (page 5-36)."
Include a single value or tabular results of queriesSee "Using SQL and SQLVALUE Syntax (page 5-37)."
5.10 Adding Data ReportsData reports are contributor defined queries on tables or views within the underlyingOracle Database.
Important:
Before you can add a data report, your Websheet application developer mustenable the Allow SQL attribute on the Websheet properties page. Bydefault, this attribute is disabled.
Chapter 5Adding Data Reports
5-28
• About Data Reports (page 5-29)Data reports, unlike data grids, are query-only and based on existing data from theOracle Database. You can specify the table or view name and retrieve all columnsor write a SQL statement to retrieve the required data.
• Creating a Data Report (page 5-29)Create a data report either by entering the table or view name or by providing aSQL query.
• Viewing and Modifying a Data Report (page 5-30)View a data report by selecting View All in the Report menu, then edit the report byclicking Edit Attributes.
• Deleting a Data Report (page 5-31)Delete a data report from a Websheet by clicking Delete in the Report Attributespage.
See Also:
• Adding and Editing Data Content (page 5-27)
• Understanding Markup Syntax (page 5-34)
• "Editing Websheet Application Properties" in Oracle Application ExpressApp Builder User’s Guide
5.10.1 About Data ReportsData reports, unlike data grids, are query-only and based on existing data from theOracle Database. You can specify the table or view name and retrieve all columns orwrite a SQL statement to retrieve the required data.
You can alter the layout of report data by selecting columns or by applying filters,highlighting, and sorting. You can also define breaks, aggregations, group by,computations, and different charts.
Additionally, you can create multiple variations of a data grid and save them as namedreports, for either public or private viewing. You can also use the data from a datareport and include it as a chart or report within any page.
5.10.2 Creating a Data ReportCreate a data report either by entering the table or view name or by providing a SQLquery.
To create a data report:
1. Run the Websheet application.
2. From the Report menu, select New Report.
Chapter 5Adding Data Reports
5-29

Tip:
You can also select New Report on the Control Panel.
The Create Report page appears.
3. For Report Source, identify how to develop your source. Options include:
• Table - Select Table and enter the following:
– Table or View Name - Select the name of the table or view on which tobase the report.
– Report Name - Enter the name of the report.
– Report Alias - Enter a report alias. A Report alias is used for linking to theReport within page sections. A Report alias must be unique within anapplication.
• SQL Query - Select SQL Query and enter the following:
– Report Name - Enter the name of the report.
– Report Alias - Enter a report alias. A Report alias is used for linking to theReport within page sections. A Report alias must be unique within aWebsheet.
– Query - Enter the SQL query that defines your report.
4. Click Next.
5. Confirm your selections and click Create Report.
5.10.3 Viewing and Modifying a Data ReportView a data report by selecting View All in the Report menu, then edit the report byclicking Edit Attributes.
To view or modify a data report:
1. Run the Websheet application.
2. From the Report menu, select View All.
The Report page appears.
3. Select the report.
The report appears.
4. To edit report attributes:
a. From the Manage menu, click Edit Attributes.
The Report Attributes page appears.
b. Edit the attributes and click Apply Changes.
5. To edit the report query:
a. From the Manage menu, click Edit Query.
The Report Query page appears.
b. Edit the report query and click Apply Changes to save your query.
Chapter 5Adding Data Reports
5-30

5.10.4 Deleting a Data ReportDelete a data report from a Websheet by clicking Delete in the Report Attributes page.
To delete a data report:
1. Run the Websheet application.
2. From the Report menu, select the report.
The report appears.
3. Select the report.
The report appears.
4. From the Manage menu, click Edit Attributes.
The Report Attributes page appears.
5. Click Delete.
5.11 Creating Data Sections Based on a Data Grid orReport
Add a data grid or data report to a Websheet with data sections.
• Adding a Data Section to a Page (page 5-31)Add a data section to a page by selecting Data in the New Section wizard, thenspecify how to import the desired data grid or report.
• Editing a Data Section (page 5-32)Edit a data section by clicking its adjacent Edit icon.
See Also:
Adding and Editing Data Content (page 5-27)
5.11.1 Adding a Data Section to a PageAdd a data section to a page by selecting Data in the New Section wizard, then specifyhow to import the desired data grid or report.
If you do not have a saved report with the settings you need, create it now beforeadding the section.
Once you create a data grid or report, you add it to a page by adding a data section.
To add a data section:
1. Run the Websheet application.
2. From the Create menu, select New Section.
3. When prompted for the section type, select Data and click Next.
Chapter 5Creating Data Sections Based on a Data Grid or Report
5-31

4. Specify the following:
a. Data Section Source - Select either Data Grid or Report.
b. Display Sequence - Enter the section display sequence.
c. Data Grid/Report - Select the data grid or report to be used to display the datasection.
d. Report Settings to Use - For the selected data grid or report, select the reportsettings to use. This selection enables you to filter the rows and columns youwant to display and set the columns to display.
e. Title - Enter the section title.
f. Maximum Row Count - Enter a value to define the maximum number of rowsto query.
g. Include - Select whether to add the following:
• Add Row (available if Data Section Source is data grid)
• Edit Row (available if Data Section Source is data grid)
• Search Field
h. Style - Choose a user interface style.
5. Click Next.
6. Click Create Section.
5.11.2 Editing a Data SectionEdit a data section by clicking its adjacent Edit icon.
Once you have added a data report to a page, you can change the section sequence,title, and user interface style.
To edit a data section:
1. Run the Websheet application.
2. Click the Edit icon that displays in the upper right of the section.
The Edit Section page appears.
3. Edit the fields provided. See item Help for more details.
4. To save your changes, click Apply Changes.
5.12 Creating Chart SectionsYou can create inline charts based upon a data grid or report.
• Adding a Chart Section (page 5-33)Add a chart section to a Websheet by clicking New Section in the Create menuand selecting Chart.
• Editing a Chart Section (page 5-34)Edit a chart section in a Websheet by clicking its adjacent Edit icon.
Chapter 5Creating Chart Sections
5-32

See Also:
Adding and Editing Data Content (page 5-27)
5.12.1 Adding a Chart SectionAdd a chart section to a Websheet by clicking New Section in the Create menu andselecting Chart.
To add a chart section:
1. Run the Websheet application.
2. Create a data grid or report.
3. From the Create menu, select New Section.
4. When prompted for the section type, select Chart and click Next.
5. On Select Chart Type:
a. Select one of the following:
• Column
• Horizontal Bar
• Pie
• Line
b. Click Next.
6. Specify the following:
a. Chart Source - Select either Data Grid or Report.
b. Display Sequence - Enter the section display sequence.
c. Data Grid/Report - Select the data grid or report to be used to display thechart.
d. Report Settings to Use - For the selected data grid or report, select the reportsettings to use. Use this option to filter the rows and columns you want todisplay.
If you do not have a saved report with the settings you need, then create itnow before adding the section.
e. Section Title - Enter the section title.
f. Click Next.
7. Specify the following:
a. Chart Label - Select the column to be used as the Label.
In Axis Title for Label, enter the title to display on the axis associated with thecolumn selected for Label.
b. Chart Value - Select the column to be used as the Value. If your function is aCOUNT, a Value does not need to be selected.
In Axis Title for Value, enter the title to display on the axis associated with thecolumn selected for Value.
Chapter 5Creating Chart Sections
5-33
c. Function - Select a function to be performed on the column selected for Value.
d. Sort - Select the chart sort direction.
Check Enable 3D to display the chart in 3D.
e. Click Next.
8. On the summary page, confirm your selections and click Create Section.
5.12.2 Editing a Chart SectionEdit a chart section in a Websheet by clicking its adjacent Edit icon.
To edit a chart section:
1. Run the Websheet application.
2. Click the Edit icon that displays in the upper right of the section.
The Edit Section page appears.
3. Edit the fields provided. See item Help for more details.
4. Click Apply Changes.
5.13 Understanding Markup SyntaxYou can use the following syntax for adding links to Websheet pages, page sections,external URLs, data grids, or for including SQL or SQLVALUE syntax.
Tip:
A Help button displays in the upper right corner of each Websheet page. TheHelp page, Markup Syntax, lists all the different syntax options described inthis section.
• Linking to a Page (page 5-35)You can include links in page sections to other pages in a Websheet by using thefollowing syntax.
• Linking to a Section (page 5-35)You can include links to a page section by using the following syntax.
• Linking to External URLs (page 5-36)You can include links to external URLs in page sections by using the followingsyntax.
• Linking to a Data Grid (page 5-36)You can include links to data grids within page sections by using the followingsyntax.
• Using SQL and SQLVALUE Syntax (page 5-37)You can include single value and tabular results of queries against data grids ortables and views within sections of a page by using SQL or SQLVALUE syntax.
• Advanced Data Grid Queries Rules (page 5-38)
Chapter 5Understanding Markup Syntax
5-34

See Also:
Managing Uploaded Files and Images (page 5-39)
5.13.1 Linking to a PageYou can include links in page sections to other pages in a Websheet by using thefollowing syntax.
If the page exists, a link displays. If the page does not exist, a link to create the pagedisplays. Note that the use of the page: identifier is optional.
Syntax:
[[ page: <page alias> | <link name> ]][[ <page alias> | <link name> ]]
Syntax Example:
[[page: home]] [[mypage | My Page]]
In Context Example:
One of the most colorful fish is the [[ clownfish | Clown fish]].
5.13.2 Linking to a SectionYou can include links to a page section by using the following syntax.
If the section exists, a link displays. If the section does not exist, a link to create thesection displays. Note that if the section is not prefaced by a page, it is assumed thesection is on the current page.
Syntax:
[[ section: <page alias> . <page section> | <link name> ]][[ section: <page section> | <link name> ]]
Syntax Example Linking Within the Current Page:
[[section: clownfish | Clown Fish]]
Syntax Example Linking to a Different Page:
[[section: fish.clownfish | Clown Fish]]
In Context Example:
One of the most colorful fish is the [[ section: clownfish | Clown fish]].Visit or fish page to see the [[ section: fish . clownfish | Clown fish]], also known as Nemo.
Chapter 5Understanding Markup Syntax
5-35

5.13.3 Linking to External URLsYou can include links to external URLs in page sections by using the following syntax.
Note that the use of the url: identifier is optional. To have the link open in a newbrowser window, use the popup prefix.
Syntax:
[[ url: <url> | <link name> ]][ popupurl: <url> | <link name> ]][[ <url> | <link name> ]]
Syntax Example:
[[url: http://www.company.com/store | commpanystore]][[popupurl: http://www.company.com/store | commpanystore]][[http://www.searchengine.com | searchengine]] [[http://www.searchengine.com ]]
In Context Example:
You can buy Company software on the [[http://www.company.com/store | Company Store]] website.
5.13.4 Linking to a Data GridYou can include links to data grids within page sections by using the following syntax.
You can use these links to view the data grid or to create new data.
Tip:
Note that data grid can be one or two words.
Syntax:
[[ data grid: <datagrid alias | <link name> ]][[ datagrid: <datagrid alias | <link name> ]][[ datagrid: <datagrid alias . <saved report name (may not be private)> | <link name> ]]
Syntax Example:
[[ data grid: todo list | To Do List ]][[ data grid: todo list . open todo items | To Do List ]][[ datagrid: todo list | To Do List ]]
In Context Example:
Please review the [[ data grid: todo list | To Do List ]] and ensure your tasks can be accomplished by Friday.
Chapter 5Understanding Markup Syntax
5-36

5.13.5 Using SQL and SQLVALUE SyntaxYou can include single value and tabular results of queries against data grids or tablesand views within sections of a page by using SQL or SQLVALUE syntax.
The SQLVALUE tag displays the first column of the first row returned by the SQL query.Use this syntax to embed data within a sentence (for example: There are currently 5types of cats.). For tabular results, use the SQL tag. Using SQL tag produces asearchable report. However, you can disable the search option by using the NOSEARCHsyntax.
When working with data grids, there are a few more options (shown under Syntax) anda few more rules. Basic rules when writing a data grid query include:
• Enclose the data grid name or data grid alias with braces. For example:
{Cat Facts}
• Enclose the data grid column names with double quotation marks. For example:
"Type of Cat"
See Also:
Advanced Data Grid Queries Rules (page 5-38)
Syntax for Queries Against Tables and Views:
[[sql: <select statement> ]][[sql: <select statement | limit="<maximum rows>" nosearch style="<style number>" ]][[sqlvalue: <select statement> ]]
Syntax for Data Grid Queries:
[[sql: <select statement> ]][[sql: <select statement | limit="<maximum rows>" nosearch style="<style number>" edit_row add_row show_sql ]][[sqlvalue: <select statement> ]][[sqlvalue: <select statement> | show_sql ]]
In Context SQL Tag Syntax Examples:
[[sql: select ename "Employee Name", sal "Salary" from emp order by sal desc | limit="10" style="2"]].[[sql: select "Type of Cat", "Estimated Population", "Largest Threats", "Top Speed", "Scientific Name", "IUCN Status", "Weight", "Study Date" from {Cat Facts} | add_row edit_row ]]
Chapter 5Understanding Markup Syntax
5-37
In Context SQLVALUE Tag Syntax Examples:
We have [[sqlvalue: select count(*) from emp]] employees in our database, [[sqlvalue: select count(*) from emp where deptno=10 ]] work in department 10.We are currently tracking [[sqlvalue: select count(*) from {Cat Facts} ]] types of cats.
5.13.6 Advanced Data Grid Queries RulesAdvanced data grid query rules include:
• The query must reference the data grid only once to include an edit or add row link(that is, you cannot join the data grid to itself within the query).
• The first column must be the primary key of the data grid to include an edit row link(that is, the column that uniquely identifies the row of data). If the "edit_row" optionis included and the query has a single select statement, the primary key column isincluded automatically. If the query contains multiple select statements, you canuse the "APXWS_DATA_GRID_PK" substitution (always enclosed with double quotationmarks) as the first column in the SELECT statement to include the primary key toinclude an edit row link.
• Report column names are the column name from the data grid, but can bemodified using standard SQL column aliasing syntax. For example, the followingdisplays the data from the Minimum Number column but the heading displays as Min:
select "Minimum Number" "Min" from ...
• If a column name is longer than 30 characters, you only include the first 30characters as the name. For example, use:
"% of Estimated Lions per Regio"
Instead of:
"% of Estimated Lions per Region"
• To display the query that is executed, include the "show_sql" option. By includingthis option, the query displays above the included report. Although this is a goodapproach for debugging, Oracle does not recommend "show_sql" for a productionapplication.
5.14 Managing AnnotationsAdd commentary and additional details to a web sheet in annotations.
Annotations can be in the form of uploaded files, notes, links, and tags. Annotationscan be added to both pages and data grid records.
• Managing Uploaded Files and Images (page 5-39)You can upload files and images to a Websheet page using the Files region. Onceuploaded, you can display uploaded images within a page section or embeddownload links to files.
• Adding Tags (page 5-41)You can add tags to facilitate keyword searching within a Websheet.
Chapter 5Managing Annotations
5-38
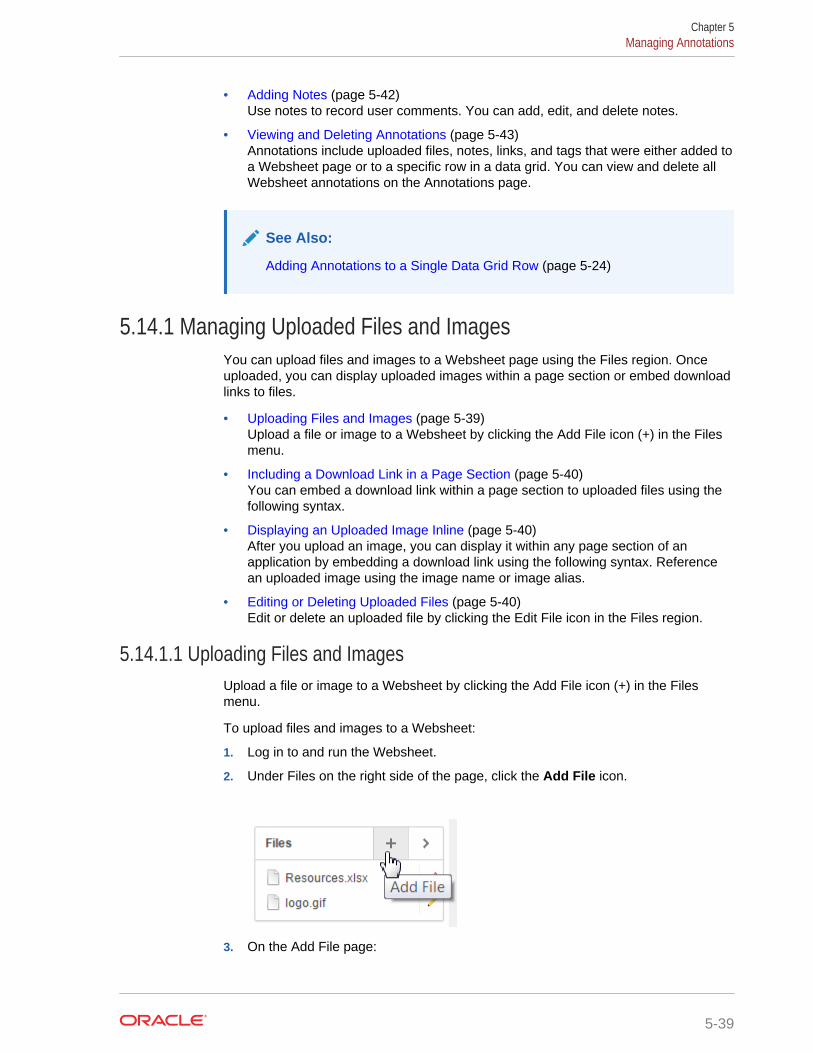
• Adding Notes (page 5-42)Use notes to record user comments. You can add, edit, and delete notes.
• Viewing and Deleting Annotations (page 5-43)Annotations include uploaded files, notes, links, and tags that were either added toa Websheet page or to a specific row in a data grid. You can view and delete allWebsheet annotations on the Annotations page.
See Also:
Adding Annotations to a Single Data Grid Row (page 5-24)
5.14.1 Managing Uploaded Files and ImagesYou can upload files and images to a Websheet page using the Files region. Onceuploaded, you can display uploaded images within a page section or embed downloadlinks to files.
• Uploading Files and Images (page 5-39)Upload a file or image to a Websheet by clicking the Add File icon (+) in the Filesmenu.
• Including a Download Link in a Page Section (page 5-40)You can embed a download link within a page section to uploaded files using thefollowing syntax.
• Displaying an Uploaded Image Inline (page 5-40)After you upload an image, you can display it within any page section of anapplication by embedding a download link using the following syntax. Referencean uploaded image using the image name or image alias.
• Editing or Deleting Uploaded Files (page 5-40)Edit or delete an uploaded file by clicking the Edit File icon in the Files region.
5.14.1.1 Uploading Files and ImagesUpload a file or image to a Websheet by clicking the Add File icon (+) in the Filesmenu.
To upload files and images to a Websheet:
1. Log in to and run the Websheet.
2. Under Files on the right side of the page, click the Add File icon.
3. On the Add File page:
Chapter 5Managing Annotations
5-39

a. File - Browse to locate the file to upload. Once uploaded, the file is associatedwith the current page. You can reference an uploaded file in any page usingthe image or file syntax.
b. Alias - A file alias enables you to embed download links or image links withinpage sections. A file alias must be unique within an application.
c. Description - Enter descriptive text to describe the file.
4. Click Add File.
5.14.1.2 Including a Download Link in a Page SectionYou can embed a download link within a page section to uploaded files using thefollowing syntax.
Syntax:
[[ file: < file name > | < link name > ]][[ file: < file alias > | < link name > ]]
Syntax Examples:
[[file: myfile ]][[file: myfile.xls ]][[file: myfile | My File ]]
File Markup Example:
This [[file: parts01.xls | spreadsheet ]] documents our part numbers.
5.14.1.3 Displaying an Uploaded Image InlineAfter you upload an image, you can display it within any page section of an applicationby embedding a download link using the following syntax. Reference an uploadedimage using the image name or image alias.
Images defined for the current page are used before images associated with otherpages. If image names are ambiguous, the most recently created image displays.
Syntax:
[[ image: < file name > | < properties > ]][[ image: < file alias > | < properties > ]]
Syntax Examples:
[[image: myimage ]][[image: theimagename.jpg ]][[image: myimage | width="600" alt="my image" ]]
Example:
This diagram [[image: diagram1]] illustrates the work flow.
5.14.1.4 Editing or Deleting Uploaded FilesEdit or delete an uploaded file by clicking the Edit File icon in the Files region.
Chapter 5Managing Annotations
5-40

To edit details or delete uploaded files:
1. Log in to and run the Websheet.
2. In the Files region, click theEdit File icon.
The Details page appears.
3. To edit file details:
a. Edit the fields provided. See item Help for more details.
b. To accept your changes, click Apply Changes.
4. To delete a file:
a. Click Delete.
b. To accept your changes, click OK.
5.14.2 Adding TagsYou can add tags to facilitate keyword searching within a Websheet.
• Adding Tags (page 5-41)Add tags to a Websheet page by clicking the Add tag icon (+) in the Tags region.
• Editing Existing Tags (page 5-41)Edit an existing tag by clicking its Edit Tag icon.
• Deleting Existing Tags (page 5-42)Delete a tag by clicking the View Tag icon in the Tags region then selecting it fordeletion.
5.14.2.1 Adding TagsAdd tags to a Websheet page by clicking the Add tag icon (+) in the Tags region.
To add tags to a Websheet page:
1. Log in to and run the Websheet.
2. Under Tags on the right side of the page, click the Add Tag icon.
3. Enter tags in the field provided. Separate multiple tags with a comma.
4. Click Apply Changes.
5.14.2.2 Editing Existing TagsEdit an existing tag by clicking its Edit Tag icon.
To edit existing tags:
1. Log in to and run the Websheet.
Chapter 5Managing Annotations
5-41
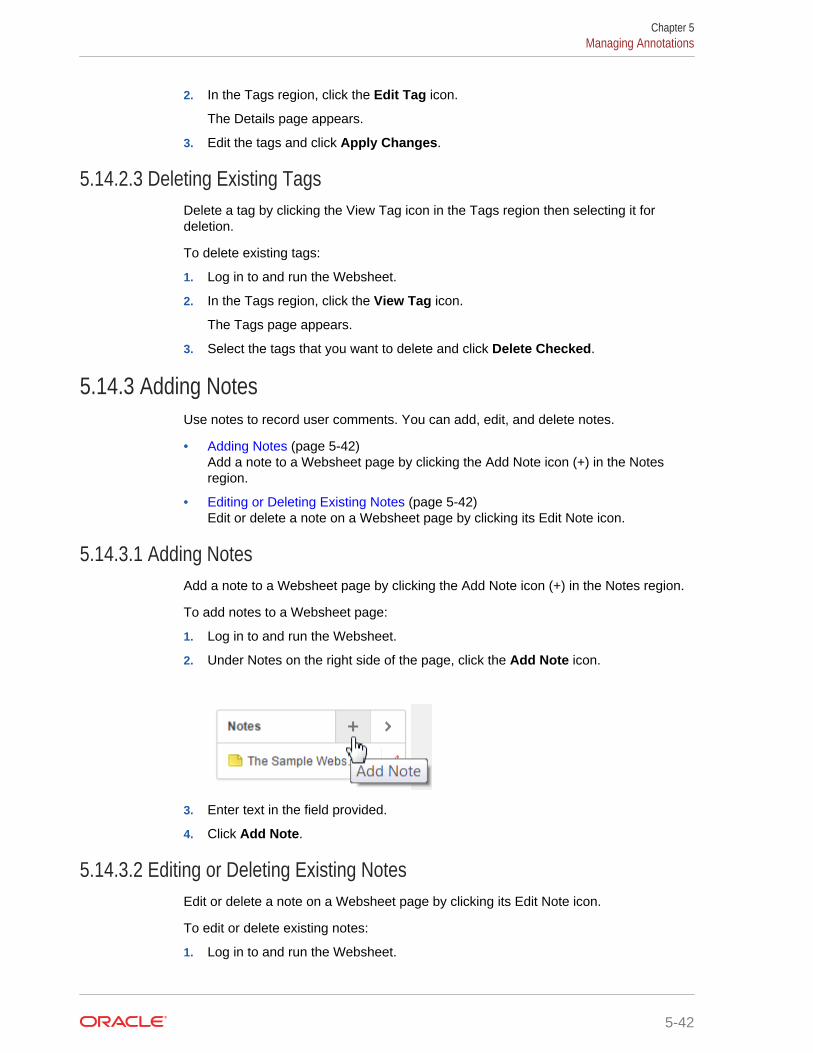
2. In the Tags region, click the Edit Tag icon.
The Details page appears.
3. Edit the tags and click Apply Changes.
5.14.2.3 Deleting Existing TagsDelete a tag by clicking the View Tag icon in the Tags region then selecting it fordeletion.
To delete existing tags:
1. Log in to and run the Websheet.
2. In the Tags region, click the View Tag icon.
The Tags page appears.
3. Select the tags that you want to delete and click Delete Checked.
5.14.3 Adding NotesUse notes to record user comments. You can add, edit, and delete notes.
• Adding Notes (page 5-42)Add a note to a Websheet page by clicking the Add Note icon (+) in the Notesregion.
• Editing or Deleting Existing Notes (page 5-42)Edit or delete a note on a Websheet page by clicking its Edit Note icon.
5.14.3.1 Adding NotesAdd a note to a Websheet page by clicking the Add Note icon (+) in the Notes region.
To add notes to a Websheet page:
1. Log in to and run the Websheet.
2. Under Notes on the right side of the page, click the Add Note icon.
3. Enter text in the field provided.
4. Click Add Note.
5.14.3.2 Editing or Deleting Existing NotesEdit or delete a note on a Websheet page by clicking its Edit Note icon.
To edit or delete existing notes:
1. Log in to and run the Websheet.
Chapter 5Managing Annotations
5-42

2. In the Notes region, click the Edit Note icon.
3. To edit file details:
a. Edit the fields provided. See item Help for more details.
b. To accept your changes, click Apply Changes.
4. To delete a note, click Delete.
5.14.4 Viewing and Deleting AnnotationsAnnotations include uploaded files, notes, links, and tags that were either added to aWebsheet page or to a specific row in a data grid. You can view and delete allWebsheet annotations on the Annotations page.
• Accessing the Annotations Page (page 5-43)Access the Annotations page by selecting Annotations in the View menu.
• Deleting Annotations (page 5-43)Delete annotations from a Websheet by selecting Annotations from the View menuthen selecting items for deletion.
5.14.4.1 Accessing the Annotations PageAccess the Annotations page by selecting Annotations in the View menu.
To access the Annotations page:
1. Log in to and run the Websheet.
2. From the View menu, select Annotations.
The Annotations page appears.
The Annotations page displays as an interactive report.
3. To view specific type of annotation, click the Files, Notes, Links, Tags, or TagCloud tabs.
5.14.4.2 Deleting AnnotationsDelete annotations from a Websheet by selecting Annotations from the View menuthen selecting items for deletion.
To delete uploaded files, notes, link, or tags:
1. Log in to and run the Websheet.
2. From the View menu, select Annotations.
The Annotations page appears.
3. Select an annotation type by clicking the appropriate tab at the top of the page.
4. If not selected, click the View Report icon.
5. Click the appropriate tab: Files, Notes, Links, Tags, or Tag Cloud.
6. Select the annotations to delete.
7. Click Delete Checked.
Chapter 5Managing Annotations
5-43
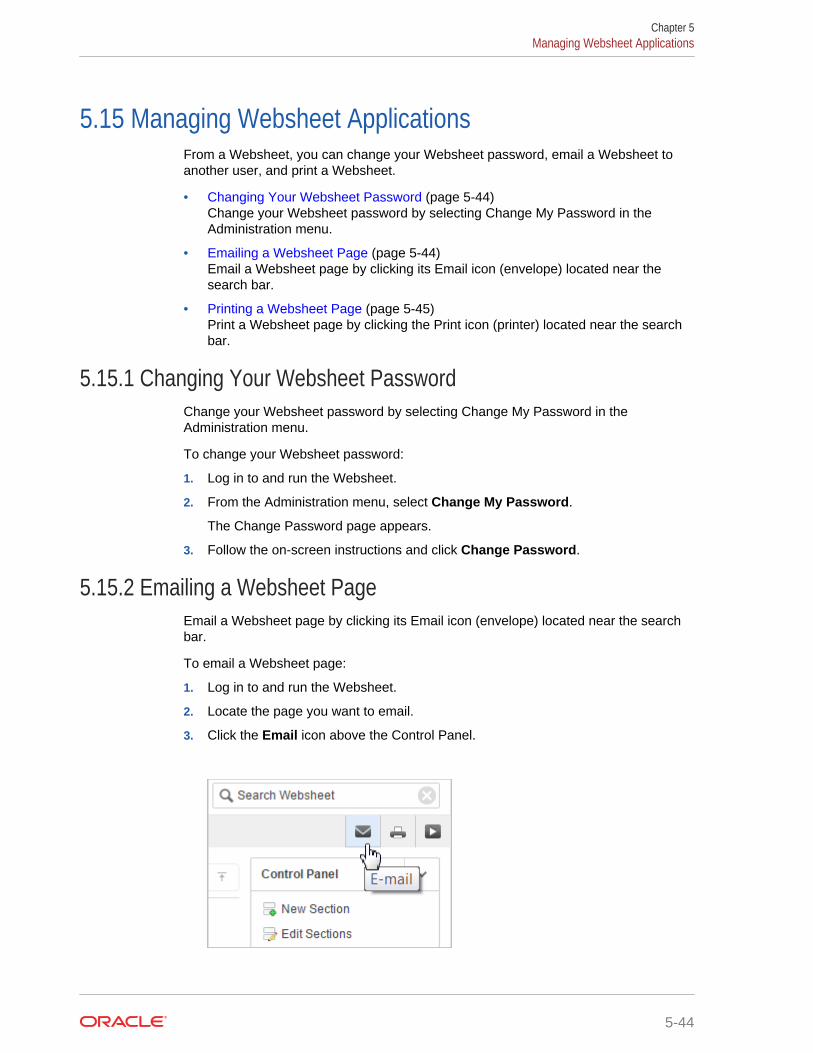
5.15 Managing Websheet ApplicationsFrom a Websheet, you can change your Websheet password, email a Websheet toanother user, and print a Websheet.
• Changing Your Websheet Password (page 5-44)Change your Websheet password by selecting Change My Password in theAdministration menu.
• Emailing a Websheet Page (page 5-44)Email a Websheet page by clicking its Email icon (envelope) located near thesearch bar.
• Printing a Websheet Page (page 5-45)Print a Websheet page by clicking the Print icon (printer) located near the searchbar.
5.15.1 Changing Your Websheet PasswordChange your Websheet password by selecting Change My Password in theAdministration menu.
To change your Websheet password:
1. Log in to and run the Websheet.
2. From the Administration menu, select Change My Password.
The Change Password page appears.
3. Follow the on-screen instructions and click Change Password.
5.15.2 Emailing a Websheet PageEmail a Websheet page by clicking its Email icon (envelope) located near the searchbar.
To email a Websheet page:
1. Log in to and run the Websheet.
2. Locate the page you want to email.
3. Click the Email icon above the Control Panel.
Chapter 5Managing Websheet Applications
5-44

4. On the Email Page:
a. To - Enter the target email address.
b. Subject - Enter a description of this email.
c. Body - Enter the email content you want to include along with the Websheetpage link.
5. Click Send.
An email link to the currently selected page is automatically included in your emailmessage.
5.15.3 Printing a Websheet PagePrint a Websheet page by clicking the Print icon (printer) located near the search bar.
To print a Websheet in printer-friendly mode:
1. Log in to and run the Websheet.
2. Click the Print icon above the Control Panel.
The page displays in printer-friendly mode.
3. Print the page.
5.16 Viewing WebsheetsUse the options on the View menu to access presentation mode, view a pagedirectory, access a page history, and view an application directory.
• About Presentation Mode (page 5-46)You can use Presentation mode to view a single Websheet page as apresentation. Each page section displays one at a time as a slide.
• Viewing the Page Directory (page 5-46)View the Page Directory by selecting Page Directory in the View menu.
• Viewing Page History (page 5-47)View the history of a page by selecting Page History in the View menu.
• Viewing the Websheet Directory (page 5-47)View the Websheet Directory by selecting Websheet Directory in the View menu.
Chapter 5Viewing Websheets
5-45

See Also:
• Managing Annotations (page 5-38)
• Managing Data Grids (page 5-16)
5.16.1 About Presentation ModeYou can use Presentation mode to view a single Websheet page as a presentation.Each page section displays one at a time as a slide.
Users can navigate between sections by using the right and left arrow keys, by usingthe right and left arrow controls on the top right of the page, or by entering a sectionnumber to quickly jump to a specific section.
You can view a Websheet in presentation mode by clicking the Presentation icon(play button) located near the search bar.
In Presentation mode, each page section displays as a separate page.
Use the navigation bar on the upper right of the page to scroll forward and backwardfrom section to section. To exit Presentation mode, click the Exit icon or press ESC.
5.16.2 Viewing the Page DirectoryView the Page Directory by selecting Page Directory in the View menu.
The page history report shows old and new section content up to 4000 bytes. If thecontent you want to view exceeds the length of the report display, you can also queryAPEX$_WS_WEBPG_SECTION_HISTORY in your workspace schema.
To access the Page Directory:
1. Log in to and run the Websheet.
2. From the View menu, select Page Directory.
The Page Directory displays as an interactive report. To learn more aboutinteractive reports and using the Actions menu, see
By default, the Page Directory displays in icon view.
Chapter 5Viewing Websheets
5-46

One page in each Websheet is designated as the home page. The home page isthe starting page that displays when you run the Websheet. In Icon view, the homepage displays as a page with an outline of home.
3. To view the page as a report, click the View Report icon.
By default, Report view displays the following columns: Name, Doc Type, Created,Created By, Updated On, Updated By, Parent Page, and Grand Parent Page.
5.16.3 Viewing Page HistoryView the history of a page by selecting Page History in the View menu.
The page history report shows old and new section content up to 4000 bytes. If thecontent you want to view exceeds the length of the report display, you can also queryAPEX$_WS_WEBPG_SECTION_HISTORY in your workspace schema.
To view the Page History report:
1. Log in to and run the Websheet.
2. Select a page.
3. From the View menu, select Page History.
The Page History displays as an interactive report.
A Search bar displays at the top of the page. Available controls include:
• Select columns to search - Resembles a magnifying glass. Click this icon tonarrow your search. To search all columns, select All Columns.
• Text area - Enter case insensitive search criteria (wildcard characters areimplied) to search for a page group by name and then click Go.
• Go button - Executes a search or applies a filter.
• View Icons - Displays each Websheet as a large icon.
• View Report - Displays each Websheet as a line in a report.
• Actions menu - Use the Actions menu to customize the report view.
4. To view changes in a Calendar format, click Calendar.
5.16.4 Viewing the Websheet DirectoryView the Websheet Directory by selecting Websheet Directory in the View menu.
Use the Websheet Directory to navigate to another Websheet application.
To access the Websheet Directory:
1. Log in to and run the Websheet.
2. From the View menu, select Websheet Directory.
A Search bar displays at the top of the page. Available controls include:
• Select columns to search - Resembles a magnifying glass. Click this icon tonarrow your search. To search all columns, select All Columns.
• Text area - Enter case insensitive search criteria (wildcard characters areimplied) to search for a page group by name and then click Go.
Chapter 5Viewing Websheets
5-47

• Go button - Executes a search or applies a filter.
• View Icons - Displays each Websheet as a large icon.
• View Report - Displays each Websheet as a line in a report.
• Actions menu - Use the Actions menu to customize the report view.
3. To view a Websheet, do one of the following:
• In Icon view, click the appropriate icon.
• In Report view, click the Run icon in the Actions column.
Chapter 5Viewing Websheets
5-48

Index
AActions menu
Aggregate, 3-8Chart, 3-8Compute, 3-8Control Break, 3-8Download, 3-8Filter, 3-8Flashback, 3-8Format, 3-8Group By, 3-8Help, 3-8Highlight, 3-8Reset, 3-8Rows Per Page, 3-8Save Report, 3-8Select Columns, 3-8, 3-10Sort, 3-8Subscription, 3-8
aggregationcreating, 3-17removing, 3-18
Allow SQL and PL/SQL, about enabling, 5-28annotations
adding to Websheet, 5-43deleting, 5-43
Application Expressbrowser requirement, 1-1
Bbrowser
requirement, 1-1
Cchart
deleting, 3-19editing, 3-19
Ddata
data (continued)about adding, 5-27about editing, 5-27incorporating into Websheet pages, 5-28
data gridaccessing Data page, 5-20adding annotation to single data row, 5-24copying, 5-18creating, 5-17deleting, 5-27editing columns manually, 5-22editing properties, 5-26editing rows manually, 5-23editing single row, 5-23pseudo columns, 5-25viewing and editing, 5-19viewing Change History log, 5-27
Data Loading Wizardabout, 4-1example import from text file, 4-2example of copying and pasting, 4-5using, 4-1
data reportsabout, 5-29creating, 5-29deleting, 5-31editing, 5-30, 5-32viewing, 5-30
data section, adding to a Websheet page, 5-31database applications, about, 1-2
Eeditable interactive grids, 2-34, 2-36
about, 2-3Cell Selection mode, 2-38, 2-39Clear, 2-41Copy Down, 2-39, 2-40Edit button, 2-36Fill, 2-40Row Actions menu, 2-35Row Selection mode, 2-38, 2-39rows, adding, 2-34rows, deleting, 2-37selection mode, 2-38, 2-39
Index-1

FFlashback query
creating, 3-24deleting, 3-25editing, 3-25
Ggroup by
about, 3-20creating, 3-20deleting, 3-22editing, 3-21sort order, 3-22
Iinteractive grid filters, 2-16
disabling, 2-18interactive grids, 2-1, 2-43
about, 2-2accessing, 2-4, 2-5Actions menu, 2-12aggregation, creating, 2-20aggregations, editing, 2-22aggregations, removing, 2-23break, 2-24, 2-28Cell Selection mode, 2-39chart, 2-9column heading menu
about, 2-27Column Heading menu, 2-28column sort order, 2-8, 2-20column width, 2-8columns, 2-15control break, 2-24, 2-28, 2-30delete report, 2-44download, 2-47drag and drop, 2-7editable, 2-3, 2-34email, 2-47filtering by column, 2-33filters, 2-16flashback, 2-47freezing columns, 2-30hiding columns, 2-31highlight, 2-25refresh, 2-45report types, 2-42reset, 2-45revert, 2-47Row Selection mode, 2-39search bar, 2-6selection mode, 2-39
interactive grids (continued)showing columns, 2-32update, 2-45URL of, 2-4
interactive report filters, 3-6editing, 3-6enabling and disabling, 3-6removing, 3-6showing and hiding details, 3-6
interactive reportsabout, 3-1about Column Heading menu, 3-5about search bar, 3-4accessing, 3-3adding computations, 3-15adding filters, 3-10adding highlighting, 3-13aggregating a column, 3-17charts, 3-18creating a chart, 3-18creating a control break, 3-13creating a pivot report, 3-22creating Flashback query, 3-24deleting Flashback query, 3-25deleting private report, 3-28deleting public report, 3-28downloading, 3-28editing Flashback query, 3-25executing a Flashback query, 3-24group by, 3-20grouping results by column, 3-20renaming private report, 3-27renaming public report, 3-27resetting, 3-28saving, 3-25saving as private, 3-26saving as public, 3-26Select columns to search icon, 3-4selecting column sort order, 3-12selecting columns to display, 3-10selecting sort order, 3-12subscribing to, 3-29URL of, 3-3using, 3-1using Actions menu, 3-8using filters, 3-6
Nnotes
adding to Websheets, 5-42deleting from Websheets, 5-42editing, 5-42
Index
Index-2

PPage Directory, viewing, 5-46pivot report
creating, 3-23creating deleting, 3-24editing, 3-24
private, 2-43pseudo columns, 5-25
Rrequirements
browser, 1-1
Ssingle data grid row, editing, 5-23single data row, adding annotation, 5-24
Uuploading data
copy and pasting data, 4-5Data Load Wizard, 4-1importing data from a file, 4-2
WWeb browser
requirements, 1-1Websheet applications
about, 1-2, 5-1, 5-2about adding charts, 5-32about adding data, 5-16about adding data sections, 5-16about annotations, 5-38about data grids, 5-17about data sections, 5-31about data sources, 5-27about sections, 5-10about text sections, 5-12
Websheet applications (continued)accessing Presentation Mode, 5-46adding chart sections, 5-33adding data sections, 5-31adding navigation, 5-15adding new pages, 5-9adding notes, 5-42adding tags, 5-41adding text sections, 5-13breadcrumb, 5-4common UI elements, 5-4Control Panel, 5-7copying a page, 5-9deleting sections, 5-11displaying tabular data, 5-17displaying uploaded images inline, 5-40editing charts, 5-34editing page details, 5-9editing section order, 5-12editing section titles, 5-12editing sections, 5-11editing text sections, 5-14emailing, 5-44including links to uploaded files, 5-40linking to a page, 5-35linking to data grid, 5-36linking to sections, 5-35linking to URLs, 5-36logging out, 5-6navigation sections, 5-4online Help, 5-6password, change, 5-44printing, 5-45pseudo columns, 5-25signing out, 5-6uploading files and images, 5-39URL of, 5-2using breadcrumbs, 5-4using SQL and SQLVALUE syntax, 5-37viewing directory, 5-47viewing Page Directory, 5-46viewing Page History, 5-47Websheet Search, 5-6
Index
3