Optimizing medium composition for TaqI endonuclease production by recombinant Escherichia coli cells...
7
Optimizing medium composition for TaqI endonuclease production by recombinant Escherichia coli cells using response surface methodology I ˙ . Emrah Nikerel a , Ebru Toksoy b , Betu ¨l Kırdar a , Ramazan Yıldırım a, * a Department of Chemical Engineering, Bog ˘azic¸i University, 34342 Bebek-Istanbul, Turkey b Department of Chemical Engineering, Marmara University, 80815 Go ¨ztepe-Istanbul, Turkey Received 24 October 2003; accepted 9 June 2004 Abstract The effect of medium composition on the TaqI endonuclease production, by recombinant Escherichia coli cells carrying a plasmid encoding TaqI endonuclease, was investigated using response surface methodology. The concentration of glucose, di-ammonium hydrogen phosphate, potassium di-hydrogen and magnesium sulphate in media were changed according to a central composite rotatable design consisting of 29 experiments and enzyme yields were determined. The results were fitted to a second order polynomial with an R 2 of 0.828. The model equation was then optimized using the Nelder–Mead simplex method to maximize enzyme yield within the experimental range studied. The optimum medium composition was found to be 6 g L 1 glucose, 1.5 g L 1 (NH 4 ) 2 HPO 4 ,8gL 1 KH 2 PO 4 , and 0.8 g L 1 MgSO 4 7H 2 O. The model prediction of 179 10 6 U g DCW 1 enzyme yield at optimum conditions was experimentally verified. This value is higher than any value obtained in the initial experiments as well as in the previously reported studies. The response surface methodology was found to be useful in improving the production of recombinant TaqI endonuclease in E. coli. # 2004 Elsevier Ltd. All rights reserved. Keywords: TaqI endonuclease; Medium design; Recombinant enzyme production; Response surface methodology; Statistical optimization 1. Introduction The emergence of a new biotechnological industry utiliz- ing recombinant DNA technologies for the production of highly specific biomolecules has increased the demand for sophisticated tools such as restriction enzymes, which enable the researchers to cut and paste DNA fragments. The TaqI restriction-modification system of the thermo- philic Gram-negative eubacterium Thermus aquaticus YT-1 consists of a type II restriction endonuclease that is highly specific to the double stranded palindromic target sequence 5 0 -TCGA-3 0 and TaqI methylase enzyme. TaqI methylase modifies the adenine residue on each strand of the same sequence by transferring a methyl group from its cofactor S-adenosyl-L-methionine. Since the optimum temperature for the growth of this bacterium is around 70 8C, the TaqI endonuclease is capable of cleaving DNA at the specific sites at temperatures markedly higher than other restriction endo- nucleases [1]. In addition, enzymes from thermophiles are more stable at conventional temperatures than those from mesophiles, and have prolonged shelf lives. These enzymes are extensively used in many molecular biology and bio- technology applications. The isolation of TaqI restriction endonuclease from Thermus aquaticus is associated with technical difficulties such as enzyme loss during downstream processing, and high operation costs. Therefore, the cloning of the gene encoding TaqI endonuclease into Escherichia coli is con- sidered to be advantageous for high-level production of this enzyme. The extracellular production of TaqI restriction endonu- clease as a fusion protein by recombinant E. coli cells has www.elsevier.com/locate/procbio Process Biochemistry 40 (2005) 1633–1639 * Corresponding author. Tel.: +90-212-3581540x2248; fax: +90-212-2872460. E-mail address: [email protected] (R. Yıldırım). 0032-9592/$ – see front matter # 2004 Elsevier Ltd. All rights reserved. doi:10.1016/j.procbio.2004.06.017
-
Upload
univ-paris1 -
Category
Documents
-
view
0 -
download
0
Transcript of Optimizing medium composition for TaqI endonuclease production by recombinant Escherichia coli cells...
Optimizing medium composition for TaqI endonuclease
production by recombinant Escherichia coli cells
using response surface methodology
I. Emrah Nikerela, Ebru Toksoyb, Betul Kırdara, Ramazan Yıldırıma,*
aDepartment of Chemical Engineering, Bogazici University, 34342 Bebek-Istanbul, TurkeybDepartment of Chemical Engineering, Marmara University, 80815 Goztepe-Istanbul, Turkey
Received 24 October 2003; accepted 9 June 2004
www.elsevier.com/locate/procbio
Process Biochemistry 40 (2005) 1633–1639
Abstract
The effect of medium composition on the TaqI endonuclease production, by recombinant Escherichia coli cells carrying a plasmid
encoding TaqI endonuclease, was investigated using response surface methodology. The concentration of glucose, di-ammonium hydrogen
phosphate, potassium di-hydrogen and magnesium sulphate in media were changed according to a central composite rotatable design
consisting of 29 experiments and enzyme yields were determined. The results were fitted to a second order polynomial with an R2 of 0.828.
The model equation was then optimized using the Nelder–Mead simplex method to maximize enzyme yield within the experimental range
studied. The optimum medium composition was found to be 6 g L�1 glucose, 1.5 g L�1 (NH4)2HPO4, 8 g L�1 KH2PO4, and 0.8 g L�1
MgSO4�7H2O. The model prediction of 179 � 106 U g DCW�1 enzyme yield at optimum conditions was experimentally verified. This value
is higher than any value obtained in the initial experiments as well as in the previously reported studies. The response surface methodology
was found to be useful in improving the production of recombinant TaqI endonuclease in E. coli.
# 2004 Elsevier Ltd. All rights reserved.
Keywords: TaqI endonuclease; Medium design; Recombinant enzyme production; Response surface methodology; Statistical optimization
1. Introduction
The emergence of a new biotechnological industry utiliz-
ing recombinant DNA technologies for the production of
highly specific biomolecules has increased the demand for
sophisticated tools such as restriction enzymes, which
enable the researchers to cut and paste DNA fragments.
The TaqI restriction-modification system of the thermo-
philic Gram-negative eubacterium Thermus aquaticus YT-1
consists of a type II restriction endonuclease that is highly
specific to the double stranded palindromic target sequence
50-TCGA-30 and TaqI methylase enzyme. TaqI methylase
modifies the adenine residue on each strand of the same
sequence by transferring a methyl group from its cofactor
* Corresponding author. Tel.: +90-212-3581540x2248;
fax: +90-212-2872460.
E-mail address: [email protected] (R. Yıldırım).
0032-9592/$ – see front matter # 2004 Elsevier Ltd. All rights reserved.
doi:10.1016/j.procbio.2004.06.017
S-adenosyl-L-methionine. Since the optimum temperature
for the growth of this bacterium is around 70 8C, the TaqI
endonuclease is capable of cleaving DNA at the specific sites
at temperatures markedly higher than other restriction endo-
nucleases [1]. In addition, enzymes from thermophiles are
more stable at conventional temperatures than those from
mesophiles, and have prolonged shelf lives. These enzymes
are extensively used in many molecular biology and bio-
technology applications.
The isolation of TaqI restriction endonuclease from
Thermus aquaticus is associated with technical difficulties
such as enzyme loss during downstream processing, and
high operation costs. Therefore, the cloning of the gene
encoding TaqI endonuclease into Escherichia coli is con-
sidered to be advantageous for high-level production of this
enzyme.
The extracellular production of TaqI restriction endonu-
clease as a fusion protein by recombinant E. coli cells has
I.E. Nikerel et al. / Process Biochemistry 40 (2005) 1633–16391634
been reported [2] and stability and extracellular secretion of
the fusion protein were further improved by the co-expres-
sion of TaqI methylase [3]. Cytoplasmic expression of TaqI
endonuclease in recombinant E. coli under the control of
various promoters has also been reported [4–6]. Higher
levels of TaqI endonuclease production were obtained by
the cloning of TaqI endonuclease gene under the control of
strong T7 phage promoter. Co-expression of methylase
activity under the control of a constitutive promoter, either
by cloning the TaqI methylase gene on a second plasmid or
by constructing a recombinant plasmid harboring both the
endonuclease and methylase genes, greatly improved the
yield and specific TaqI endonuclease productivity of recom-
binant cells [6].
Investigation of the fermentation characteristics of these
recombinant cells in different media both in shake flasks
and bioreactors suggested that the careful optimization of
medium composition may possibly lead to higher produc-
tivity in terms of TaqI endonuclease activity.
The optimization of fermentation conditions is an impor-
tant problem in the development of economically feasible
bioprocesses. Combinatorial interactions of medium com-
ponents with the cell metabolism and the production of the
desired compound are numerous and the optimum processes
may be developed using an effective experimental design
procedure [7]. Response surface methodology (RSM),
which is a collection of statistical techniques for designing
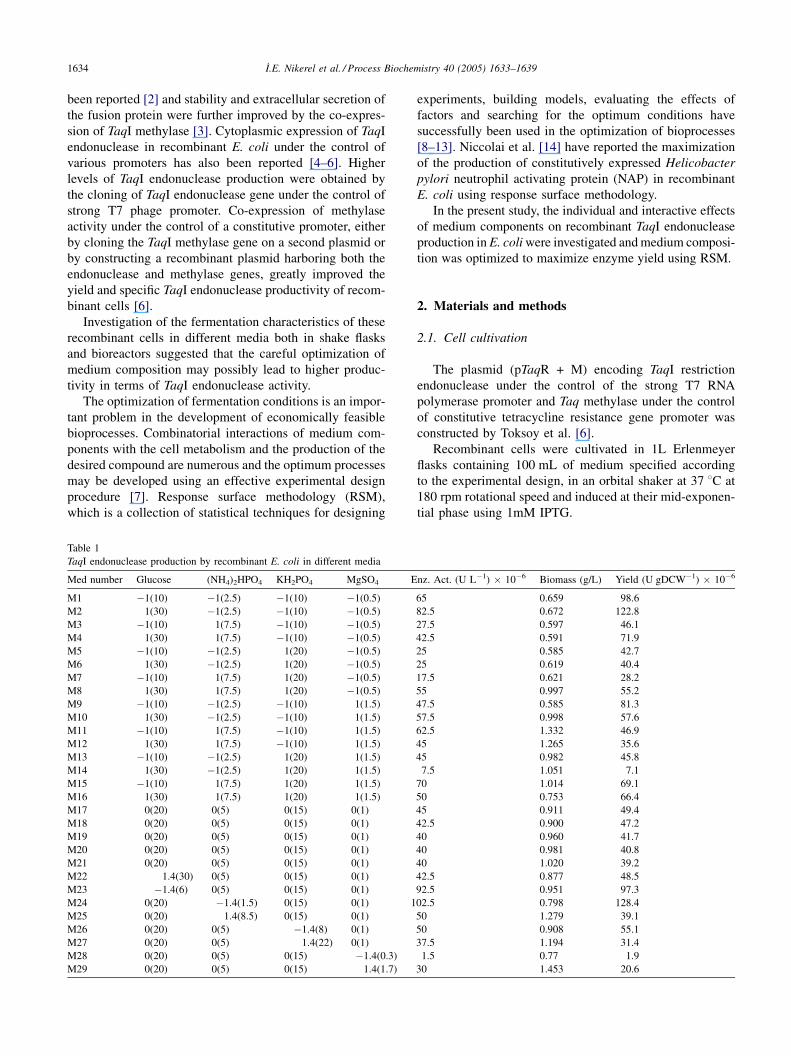
Table 1
TaqI endonuclease production by recombinant E. coli in different media
Med number Glucose (NH4)2HPO4 KH2PO4 MgSO4 E
M1 �1(10) �1(2.5) �1(10) �1(0.5)
M2 1(30) �1(2.5) �1(10) �1(0.5)
M3 �1(10) 1(7.5) �1(10) �1(0.5)
M4 1(30) 1(7.5) �1(10) �1(0.5)
M5 �1(10) �1(2.5) 1(20) �1(0.5)
M6 1(30) �1(2.5) 1(20) �1(0.5)
M7 �1(10) 1(7.5) 1(20) �1(0.5)
M8 1(30) 1(7.5) 1(20) �1(0.5)
M9 �1(10) �1(2.5) �1(10) 1(1.5)
M10 1(30) �1(2.5) �1(10) 1(1.5)
M11 �1(10) 1(7.5) �1(10) 1(1.5)
M12 1(30) 1(7.5) �1(10) 1(1.5)
M13 �1(10) �1(2.5) 1(20) 1(1.5)
M14 1(30) �1(2.5) 1(20) 1(1.5)
M15 �1(10) 1(7.5) 1(20) 1(1.5)
M16 1(30) 1(7.5) 1(20) 1(1.5)
M17 0(20) 0(5) 0(15) 0(1)
M18 0(20) 0(5) 0(15) 0(1)
M19 0(20) 0(5) 0(15) 0(1)
M20 0(20) 0(5) 0(15) 0(1)
M21 0(20) 0(5) 0(15) 0(1)
M22 1.4(30) 0(5) 0(15) 0(1)
M23 �1.4(6) 0(5) 0(15) 0(1)
M24 0(20) �1.4(1.5) 0(15) 0(1) 1
M25 0(20) 1.4(8.5) 0(15) 0(1)
M26 0(20) 0(5) �1.4(8) 0(1)
M27 0(20) 0(5) 1.4(22) 0(1)
M28 0(20) 0(5) 0(15) �1.4(0.3)
M29 0(20) 0(5) 0(15) 1.4(1.7)
experiments, building models, evaluating the effects of
factors and searching for the optimum conditions have
successfully been used in the optimization of bioprocesses
[8–13]. Niccolai et al. [14] have reported the maximization
of the production of constitutively expressed Helicobacter
pylori neutrophil activating protein (NAP) in recombinant
E. coli using response surface methodology.
In the present study, the individual and interactive effects
of medium components on recombinant TaqI endonuclease
production in E. coli were investigated and medium composi-
tion was optimized to maximize enzyme yield using RSM.
2. Materials and methods
2.1. Cell cultivation
The plasmid (pTaqR + M) encoding TaqI restriction
endonuclease under the control of the strong T7 RNA
polymerase promoter and Taq methylase under the control
of constitutive tetracycline resistance gene promoter was
constructed by Toksoy et al. [6].
Recombinant cells were cultivated in 1L Erlenmeyer
flasks containing 100 mL of medium specified according
to the experimental design, in an orbital shaker at 37 8C at
180 rpm rotational speed and induced at their mid-exponen-
tial phase using 1mM IPTG.
nz. Act. (U L�1) � 10�6 Biomass (g/L) Yield (U gDCW�1) � 10�6
65 0.659 98.6
82.5 0.672 122.8
27.5 0.597 46.1
42.5 0.591 71.9
25 0.585 42.7
25 0.619 40.4
17.5 0.621 28.2
55 0.997 55.2
47.5 0.585 81.3
57.5 0.998 57.6
62.5 1.332 46.9
45 1.265 35.6
45 0.982 45.8
7.5 1.051 7.1
70 1.014 69.1
50 0.753 66.4
45 0.911 49.4
42.5 0.900 47.2
40 0.960 41.7
40 0.981 40.8
40 1.020 39.2
42.5 0.877 48.5
92.5 0.951 97.3
02.5 0.798 128.4
50 1.279 39.1
50 0.908 55.1
37.5 1.194 31.4
1.5 0.77 1.9
30 1.453 20.6

I.E. Nikerel et al. / Process Biochemistry 40 (2005) 1633–1639 1635
Table 2
Parameters found for the full quadratic model and their significances
Yielda
Value P-value
b0 44.98 8.786 � 106
b1 �3.515 0.381
b2 �10.14 0.02070
b3 �12.00 0.00804
b4 �3.510 0.382
b5 13.42 0.03682
b6 4.956 0.272
b7 �1.981 0.655
b8 �9.444 0.04712
b9 18.96 0.00571
b10 15.17 0.00356
b11 8.081 0.08364
b12 �1.703 0.774
b13 8.744 0.06349
b14 �18.03 0.00784
a Yield = b0 + b1 � Glucose + b2 � (NH4)2HPO4 + b3 � KH2PO4 + b4
� MgSO4 + b5 � Glucose� Glucose + b6 � Glucose � (NH4)2HPO4 + b7
� Glucose � KH2PO4 + b8 � Glucose � MgSO4 + b9 � (NH4)2HPO4 �(NH4)2HPO4 + b10 � (NH4)2HPO4 � KH2PO4 + b11 � (NH4)2HPO4 �MgSO4 + b12 � KH2PO4 � KH2PO4 + b13 � KH2PO4 � MgSO4 + b14
� MgSO4 � MgSO4.
2.2. Experimental design
The production medium contained carbon source
(glucose), inorganic nitrogen ((NH4)2HPO4), potassium
(KH2PO4), magnesium (MgSO4�7H2O) and various vita-
mins and trace metals. The concentrations of glucose,
(NH4)2HPO4, KH2PO4 and MgSO4�7H2O were varied as
parameters, while the levels of thiamine and trace metal
solution were kept constant as described by Toksoy et al. [6].
A 24 full factorial central composite design (CCD) with
eight star points and five replicates at the centre points was
employed to fit a second order polynomial model. Twenty-
nine experiments were required for this procedure as given
in Table 1 [15]. The independent variables are coded for
statistical calculations according to the following equation:
Xi ¼Ui � U0
DU(1)
where, Xi is the independent variable coded value; Ui, the
real value of the independent variable; U0, real value of the
independent variable on the centre point and DU is the step
change. The modified R medium used in previous studies
was taken as the centre point [6]. The TaqI endonuclease
yield, which is defined as the enzyme activity per gram dry
cell weight (U gDCW�1) was used as the response variable.
MATLAB software (version 6.0, Stat-Ease Inc., Minnea-
polis, USA) was used for regression and graphical analyses
of the data obtained. The optimal concentrations of the
critical medium components were obtained by the
Nelder–Mead simplex search method.
2.3. Assays
Cells were grown in different medium compositions and
induced with 1 mM IPTG at an optical density of 0.65–0.7 at
600 nm. After 2 h of induction, the cells were harvested by
centrifugation at 4000 rpm for 10 min (Nuve NF 652,
TURKEY). The biomass concentration in gDCW L�1 and
TaqI endonuclease activity in crude extracts were deter-
mined as described by Toksoy et al. [6]. One unit of TaqI
endonuclease activity is defined as the amount required to
digest 1 mg of lambda DNA to completion in 1 h at 65 8C.
Table 3
ANOVA table for full quadratic model
Source SS SS (%) MS F F significance df
Regression 20277.4 83 1448.4 4.809 0.00291 14
Residual 4216.8 17 301.20 14
LOF error 4139.4 17(98) 413.94 21.3945 0.00481 10
Pure error 77.39 0(2) 19.35 4
Total 24494.2 100 28
3. Results and discussion
The biomass concentration and TaqI endonuclease activ-
ity were measured in 29 different medium compositions and
the corresponding enzyme yield (with an accuracy of � 5 �106 U gDCW�1) are presented in Table 1.
3.1. Construction of the representative model
The experimental results in Table 1 were fitted to a full
quadratic second order polynomial equation by applying
multiple regression analysis using MATLAB. The coded
variables were used in regression because they resulted in a
better fit than real values. The parameters found for this
equation and their significance levels are shown in Table 2.
The coefficient of multiple determination, R2 was found to
be 0.828, which means that the model could explain 82.8 per
cent of the total variations in the system. The relatively high
value of R2 indicates that the second order polynomial
equation is capable of representing the system under the
given experimental domain.
In order to check the adequacy of the model to represent
the system further, an analysis of variance (ANOVA) table
was constructed (Table 3). The F statistic was found to be
4.809 corresponding to F significance of 0.00291, which is
far below the confidence level of 0.05 indicating that the
model is adequate. This is also evident from the fact that the
plot of predicted versus experimental enzyme yields in Fig. 1
is close to y = x showing that the prediction of experimental
data is quite satisfactory.
3.2. Optimization of medium
The full quadratic model equation was optimized using
the Nelder–Mead simplex method to maximize enzyme
yield within the experimental range studied. The optimum

I.E. Nikerel et al. / Process Biochemistry 40 (2005) 1633–16391636
Fig. 1. Predicted vs. experimental enzyme yield.
medium composition was found to be �1.4 (6 g L�1) for
glucose, �1.4 (1.5 g L�1) for (NH4)2HPO4, �1.4 (8 g L�1)
for KH2PO4, and �0.4 (0.8 g L�1) for MgSO4�7H2O with a
prediction of 179.2 � 106 U gDCW�1 enzyme yield.
A new experiment was performed using the optimum
medium composition keeping all the other conditions the
same as those in initial experiments and the enzyme yield
was determined 178 � 106 U gDCW�1 which is in an
excellent agreement with the model prediction of 179.2 �106 U gDCW�1. It should also be noted that this yield is
much higher than the yields at the centre point (39.2–49.4 �106 U gDCW�1) as well as any other yield obtained in the
initial 29 experiments.
It can be concluded therefore that the predictive power of
the model is quite satisfactory, and the optimum medium
composition found is a real optimum under the conditions
studied.
3.3. Factor effects
To investigate the effects of four medium components as
well as their interaction on enzyme yield, the insignificant
terms in full quadratic model were removed using backward
Table 4
Parameters and their significance levels for the reduced model
Yielda
P-value
b0 44.36 5.128 � 10�7
b1 �10.14 0.01309
b2 �12.00 0.00430
b3 13.15 0.02654
b4 �9.444 0.03394
b5 18.69 0.00289
b6 15.17 0.00162
b7 8.081 0.06535
b8 8.744 0.04776
b9 �18.30 0.00340
a Yield = b0 + b1 � (NH4)2HPO4 + b2 � KH2PO4 + b3 � Glucose �Glucose + b4�Glucose�MgSO4 + b5� (NH4)2HPO4� (NH4)2HPO4 +
b6 � (NH4)2HPO4 � KH2PO4 + b7 � (NH4)2HPO4 � MgSO4 + b8 �KH2PO4 � MgSO4 + b9 � MgSO4 � MgSO4.
elimination method [15]. Table 4 summarizes the parameters
and their significance levels for the reduced model. The
linear main effect of glucose and MgSO4�7H2O, glucose-
MgSO4�7H2O interaction, glucose-(NH4)2HPO4 interaction
and the quadratic effect of KH2PO4 were found to be
insignificant compared to the other terms in the quadratic
equation as expected since the P-values of these terms were
larger than those of other terms in Table 2.
R2 slightly decreased from 0.828 to 0.788 by backward
elimination, while R2adjusted increased from 0.655 to 0.688 as
expected since the number of terms decreased from 14 to 9
in the model. F significance, on the other hand, decreased
dramatically from 0.00291 to 8.967 � 10�5 (Table 5)
indicating that the reduced model is statistically more sig-
nificant.
The reduced model was tested using the optimum med-
ium composition of the full quadratic model and the enzyme
yield of 168 � 106 U gDCW�1 was predicted. This value is
quite close to 179 � 106 U gDCW�1 prediction of the full
quadratic model and to the corresponding experimental
value of 178 � 106 U gDCW�1. This suggests that backward
elimination identified the insignificant terms fairly well and
therefore it can be used to analyze the effects of medium
components on the enzyme yield.
On the other hand, the reduced model resulted in its own
optimum medium composition of 1.4 (34 g L�1) for glucose,
�1.4 (1.5 g L�1) for (NH4)2HPO4, �1.4 (8 g L�1) for
KH2PO4, and �1 (0.5 l L�1) for MgSO4�7H2O with a pre-
dicted enzyme yield of 186 � 106 U gDCW�1. It should be
noted that the prediction of glucose is quite different than
�1.4 (6 g L�1) of the full quadratic model although the other
factors have the same or close optimum values. Apparently,
Table 5
ANOVA table for reduced model
Source SS SS (%) MS F F significance sf
Regression 308677 79 34297.5 7.845 8.967�10�5 9
Residual 83068.8 21 4372.0 19
LOF error 59973.6 15(72) 4613.4 1.1985 0.435 13
Pure error 23095.2 6(28) 3849.2 6
Total 391746 100 28

I.E. Nikerel et al. / Process Biochemistry 40 (2005) 1633–1639 1637
Fig. 2. Effects of medium components on enzyme yield. Open and filled symbols are experimental results at centre and optimum point, respectively; dashed and
solid lines are model prediction at centre and optimum point, respectively.
elimination of the linear effect of glucose as well as its
interactions with (NH4)2HPO4, and KH2PO4, reduced the
sensitivity of the model to � sign in coded variable. Indeed,
(glucose) � (glucose) term in reduced model has the same
value for 1.4 and �1.4, and the other glucose containing
(glucose) � (MgSO4�7H2O) term, may not be sufficient to
account for the sign change in glucose level. There can be
two possible explanations for this. First, the enzyme yield
may be indeed higher at the edges of glucose concentra-
tions than the intermediate values, and the reduced model
captured this trend. Second, it may just be a limitation of
the reduced model that it could not distinguish 1.4
(34 g L�1) glucose level from the real optimum of �1.4
(6 g L�1).
Both explanations turned out to be partially true. A new
experiment that was performed with the optimum medium
composition of reduced model (with 1.4. glucose level)
resulted 161 � 106 U gDCW�1 enzyme yield. Although
this value is lower than the 179 � 106 U gDCW�1 yield
of the full quadratic model (with �1.4 glucose level), it is
still much higher than the yield in any of 29 initial experi-
ments indicating that glucose indeed leads to a minimum
yield at the intermediate concentrations with the lower end
of range (�1.4) being better than the higher end (1.4) as far
as the enzyme yield is concerned. However, the discrepancy
between model prediction of 186 � 106 U gDCW�1 and the
experimental result of 161 � 106 U gDCW�1 for the
reduced model is much higher than that of the full quadratic
model confirming that the reduced model has some limita-
tions. It can be concluded that the second order term present
in both models dominantly explains the effects of glucose
concentrations with some contribution of other terms. This is
also evident from Fig. 2a that compares the effect of glucose
on enzyme yields under two distinct compositions of other
medium components. The solid line represents the model
prediction of glucose effect keeping the concentrations of
other factors constant at their optimum levels, while the
dashed line shows the model prediction when the other
factors are in their central compositions (experiments
M21, M22 and M23). The experimental values where the
data are available are also shown as filled and open circles
for the optimum and central composition of other factors,
respectively, and they were found to be in good agreement
with proposed model. The almost identical shapes of two
predicted responses suggest that the overall impact of inter-
actions of glucose with other components is not significant,
otherwise two plots would have different shapes. Although
the reduced model predicts that glucose and MgSO4�7H2O
interaction is significant (Fig. 3a), this interaction seems to
be balanced by other small interactions so that the glucose
has similar effects on enzyme yields at centre and optimum
compositions of other components.
The dependence of enzyme yield on (NH4)2HPO4 con-
centration was also analyzed by comparing its effects at the
optimum and centre compositions of other factors. Fig. 2b
shows that enzyme yield decreases with increasing
(NH4)2HPO4 at the centre point. The trend in this plot
suggests that first and second order effects should be present.
This was captured by the model considering that neither
linear nor the second order term was removed by backward

I.E. Nikerel et al. / Process Biochemistry 40 (2005) 1633–16391638
Fig. 3. Significant interactions among medium components predicted by the full quadratic model.
elimination. The behaviour of the model in optimum com-
position (solid line), however, is different than that of centre
composition (dashed line) indicating the presence of
some significant interactions. Indeed, the interaction of
(NH4)2HPO4 with KH2PO4, and MgSO4�7H2O as given in
Fig. 3b and 3c, respectively, were not removed by backward
elimination, and the (NH4)2HPO4 and KH2PO4 interaction is
the most significant term in full quadratic model with the
smallest P-value of 0.00356. This is expected since they
form the HPO42�/H2PO4
� buffer couple to maintain the pH.
Fig. 2c shows the effect of KH2PO4 on enzyme yield at
optimum and centre composition of other variables. The
model successfully predicted the linear dependence of
experimental yield on KH2PO4 at centre compositions of
other factors. The removal of the second order term by
backward elimination also confirms this linear dependence.
The un-parallelism between two plots may be attributed to
(NH4)2HPO4 and KH2PO4 interaction (Fig. 3b) as discussed
above. The contribution of KH2PO4 and MgSO4�7H2O
interaction (Fig. 3d) should be less significant since the
P-value (0.0836) is much greater than P-value (0.00356) of
the (NH4)2HPO4 and KH2PO4.
The backward elimination removed only the linear term
for MgSO4�7H2O from full quadratic model leaving the
second order term and interactions as significant. This is
supported by the experimental results as well as the model
prediction of enzyme yield when all the other factors were at
their centre levels as seen in Fig. 2d The same trend is
exhibited by the MgSO4�7H2O plot at optimum levels of
other parameters indicating that although this component
interacts with all other components (Fig. 3a, c and d), the
overall impact of interactions do not seem to contribute as
much as the second order terms otherwise there would be
some dissimilarity between the two plots. This figure also
indicates that the optimum level found for MgSO4�7H2O
was reasonable.
As conclusion, it was found that the medium containing
6 g L�1 of glucose, 1.5 g L�1 of (NH4)2HPO4, 8 g L�1 of
KH2PO4, and 0.8 g L�1 of MgSO4�7H2O should be used to
maximize TaqI endonuclease production under the condi-
tions studied. This medium composition resulted in an
enzyme yield of 178 � 106 U gDCW�1 which is much
higher than those obtained in the initial experiments as well
as the values reported in literature. This indicates that the
medium design using statistical techniques such as the
response surface methodology can be very useful in improv-
ing the production of recombinant TaqI endonuclease in
E. coli as well as in similar bioprocesses.

I.E. Nikerel et al. / Process Biochemistry 40 (2005) 1633–1639 1639
Acknowledgements
This research was supported by Bogazici University
Research Fund through Project No: 99A501.
References
[1] Slatko BE, Benner JS, Quinton TJ, Moran LS, Simcox TG, Van Cott
EM, Wilson GG. Cloning, sequencing and expression of the
TaqI restriction-modification system. Nucleic Acids Res 1987;15:
9781–9796.
[2] Toksoy E, Ozdinler PH, Onsan ZI, Kirdar B. High level secretion of
TaqI restriction endonuclease by recombinant Escherichia coli. Bio-
technol Tech 1999;13:803–8.
[3] Toksoy E, Onsan ZI, Kirdar B. Effect of the co-expression of methyl-
transferase activity on extracellular production of TaqI restriction
endonuclease in recombinant E. coli cells. Process Biochem
2001;37:527–34.
[4] Barany F. A genetic system for isolation and characterization of TaqI
restriction endonuclease mutants. Gene 1987;56:13–27.
[5] Toksoy E, Onsan ZI, Kirdar B. Expression of a thermostable restriction
endonuclease in recombinant Escherichia coli cells and optimization
of fermentation conditions. World J Microbiol Biotechnol 2002;
18:23–7.
[6] Toksoy E, Onsan ZI, Kirdar B. High-level production of TaqI restric-
tion endonuclease by three different expression systems in Eschercihia
coli cells using the T7 phage promoter. Appl Microbiol Biotechnol
2002;59:39–245.
[7] Oh S, Rheem S, Jaehun S, Kim S, Baek Y. Optimizing conditions for
the growth of Lactobacillus casei YIT 9018 in tryptone-yeast extract-
glucose medium by using response surface methodology. Appl
Environ Microbiol 1995;61:3809–14.
[8] Ooijkaas LP, Wilkinson EC, Tramper J, Buitelaar RM. Medium
optimization for spore production of Coniothyrium minitans using
statistically-based experimental designs. Biotechnol Bioeng 1999;64:
92–100.
[9] Wejse PL, Ingvorsen K, Mortensen KK. Xylanase production by a
novel halophilic bacterium increased 20-fold by response surface
methodology. Process Biochem 2003;32:721–7.
[10] Rodrigues RCLB, Felipe MA, Silva JBA, Vitolo M. Response surface
methodology for xylitol production from sugarcane bagasse hemi-
cellulosic hydrolyzate using controlled vacuum evaporation process
variables. Process Biochem 2003;38:1231–7.
[11] Francis F, Abdulhameed S, Nampoothiri KM, Ramachandran S,
Ghosh S, Szakacs G, Padney A. Use of response methodology for
optimizing process parameters for the production of a�amylase by
Aspergillus oryzae. Biochem Eng J 2002;15:107–15.
[12] Kılıc M, Bayraktar E, Ates S, Mehmetoglu Uul.. Investigation of
extractive citric acid fermentation using response surface methodol-
ogy. Process Biochem 2002;37:759–67.
[13] Elibol M, Ozer D. Response surface analysis of lipase production by
freely suspended Rhizopus arrhizus. Process Biochem 2002;38:367–
72.
[14] Niccolai A, Fontani S, Kapat A, Olivieri R. Maximization of recombi-
nant Helicobacter pylori neutrophil activating protein production in
Escherichia coli: improvement of a chemically defined medium using
response surface methodology. FEMS Microbiol Lett 2003;221:257–62.
[15] Montgomery DC, Runger GC. Applied Statistics and Probability for
Engineers. New York: John Wiley & Sons Inc.; 1994.