
Verification of Anchoring in Foundations of Wind Turbine Towers
66 IEEE TRANSACTIONS ON SUSTAINABLE ENERGY, VOL. 1, NO. 2, JULY 2010
Optimization of Wind Turbine Performance WithData-Driven Models
Andrew Kusiak, Member, IEEE, Zijun Zhang, and Mingyang Li, Student Member, IEEE
Abstract—This paper presents a multiobjective optimizationmodel of wind turbine performance. Three different objectives,wind power output, vibration of drive train, and vibration oftower, are used to evaluate the wind turbine performance. Neuralnetwork models are developed to capture dynamic equationsmodeling wind turbine performance. Due to the complexity andnonlinearity of these models, an evolutionary strategy algorithmis used to solve the multiobjective optimization problem. Datasets at two different frequencies, 10 s and 1 min, are used in thisstudy. Computational results with the two data sets are reported.Analysis of these results points to a reduction of wind turbinevibrations potentially larger than the gains reported in the paper.This is due to the fact that vibrations may occur at frequencieshigher than ones reflected in the 10-s data collected according tothe standard practice used in the wind industry.
Index Terms—Blade pitch angle, data analysis, data mining,drive train acceleration, evolutionary strategy (ES) algorithm,multiobjective optimization, neural networks (NNs), power opti-mization, torque, tower acceleration, wind turbine vibrations.
I. INTRODUCTION
I NTEREST in renewable energy has increased in recentyears due to environmental concerns and growing aware-
ness of the limited supply of fossil fuels. The anticipatedincrease in the cost of electricity generated from fossil fuelsdue to carbon taxation has become a catalyst in the quest forclean energy.
Wind energy has been most successfully commercializedamong all forms of renewable energy.1 Research in wind energyhas significantly intensified in recent years. Areas with the mostresearch progress include the design of wind turbines [1], [2],the design and reliability of wind farms [3]–[5], the controlof wind turbines [6], [7], [22], [23], wind energy conversion[8], [9], the prediction of wind power [10], [11], and condi-tion monitoring of wind turbines [12], [13]. Optimization hasbeen considered as one critical issue tightly involved in thesewind energy research areas. Boukhezzar et al. [27] designeda nonlinear controller for optimizing the power of the DFIGgenerator [27]. Abdelli et al. [28] applied a multiobjective
Manuscript received November 07, 2009; revised February 06, 2010; ac-cepted March 21, 2010. Date of publication April 12, 2010; date of current ver-sion June 23, 2010. This work was supported by funding from the Iowa EnergyCenter under Grant 07-01.
The authors are with the Intelligent Systems Laboratory, The University ofIowa, Iowa City, IA 52242 USA (e-mail: [email protected]).
Color versions of one or more of the figures in this paper are available onlineat http://ieeexplore.ieee.org.
Digital Object Identifier 10.1109/TSTE.2010.2046919
1Available: http://en.wikipedia.org/wiki/Wind_power.
genetic algorithm to optimize the efficiency of a small-scaleturbine.
The goal of this paper is to model and optimize wind turbineperformance in three objectives, maximization of the power pro-duced by a wind turbine, and minimization of vibrations of theturbine’s drive train and tower.
Numerous studies of wind power models have been reportedin the literature [27], [29]. A passive control method using atuned mass damper to mitigate vibrations of the blades andtower of a wind turbine was presented in [14]. The research re-ported in [15] discussed the estimation of aero-elastic dampingof operational wind turbine modes based on experiments. Themajority of the published research falls into parametric andphysics-based models. This paper illustrates nonlinear andnonparametric models for optimization of wind power andvibration using a data-driven approach. Such an approachhas been successfully applied to optimize power plants andindustrial processes [32].
The sources of wind turbine vibrations [25] are diverse. Thefocus of this paper is on vibrations attributed to the control ofwind turbines, e.g., control of the generator torque and bladepitch. Two parameters, drive train acceleration and tower ac-celeration, are selected to represent vibrations of the drive trainand tower. Two data-driven models of wind turbine vibrationsare developed, one to predict the drive train accelerations andthe other to predict the tower accelerations. The power outputis also modeled by a similar methodology. Neural network(NN) [16]–[18] is applied to extract these data-driven modelsfrom industrial (wind turbine) data. The three models are thenintegrated into a multiobjective optimization model [19]. Asthe models are nonparametric and nonlinear, obtaining analyt-ical form solutions is difficult, and therefore, an evolutionarystrategy (ES) algorithm [20], [21], [26] is used to solve them.Different control preferences lead to numerous control strate-gies.
The data used in this research was obtained from a large(150 MW) wind farm, and its sampling frequency is 0.1 Hz.Since the frequency of wind turbine vibrations is higher than0.1 Hz, the information loss due to the low (0.1 Hz) frequencyof available data has been reflected in the research results. Toaddress the information loss, a 1-min (lower frequency) data setis derived from the 0.1-Hz (10-s) data set. Computational exper-iments with the two data sets, i.e., 10 s and 1 min, demonstrateda potential for further reduction of turbine vibrations. Due tothe limited data frequency, this paper investigates the potentialfor vibration reduction by adjusting certain controllable param-eters, such as blade pitch angle and generator torque. Industrialimplementation of the approach proposed in this paper calls forhigher frequency data.
1949-3029/$26.00 © 2010 IEEE
Authorized licensed use limited to: The University of Iowa. Downloaded on June 25,2010 at 17:49:01 UTC from IEEE Xplore. Restrictions apply.
KUSIAK et al.: OPTIMIZATION OF WIND TURBINE PERFORMANCE WITH DATA-DRIVEN MODELS 67
TABLE ISAMPLE DATA SET OF 10-s DATA COLLECTED BY SCADA SYSTEM
TABLE IISAMPLE 1-min DATA COMPUTED BASED ON THE 10-s DATA
II. MODELING WIND TURBINE VIBRATIONS
AND POWER OUTPUT
A. Data Description
Two types of data sets, 10-s data and 1-min data of a wind tur-bine, are used in this research. The 10-s data was collected froma supervisory control and data acquisition (SCADA) system,and the 1-min data set was derived by averaging the values ofall parameters across each 60-s period from the 10-s data set.The total length of each data set is two months. The SCADAsystem contains values of more than 120 parameters; however,only certain parameters that could be potentially related to windturbine vibrations and their power output were selected based onthe domain expertise and past studies in wind energy. Tables Iand II demonstrate the general format of the data sets used inthis research.
The columns in Tables I and II represent the parameters re-lated to wind turbine vibrations and the power output. All datais time stamped.
B. Data Preprocessing
Data preprocessing is critical to the data mining for correct-ness and accuracy of the results. Some of the data errors mayhave been caused by sensor failures, transmission errors, andfailures of various subsystems. The errors usually appear as dataexceeding physical constraints or missing values. All incorrectdata were deleted from the data sets used in this paper.
C. Wind Turbine Vibration Model
In this paper, understanding and modeling vibrations of awind turbine from the operational data collected from the tur-bine are presented. Two significant vibration sources are con-sidered: vibrations due to the air passing through the wind tur-bine and vibrations due to the forces originating with the con-trol system that affect the torque and the blade pitch angle. Thevalues of the drive train acceleration recorded by the SCADAsystem are used to represent the vibration of the drive train ofa wind turbine, while the tower vibration is represented by theacceleration measurements from the tower.
1) Drive Train Vibration Model: In this research, drive trainpart acceleration is measured by a sensor installed at the bottomback of a nacelle. Since two identical drive train accelerationvalues are reported by the SCADA system, an average value of
the two is used in this paper. The vibration of the drive trainsystem is expressed as
(1)
where all parameters are time dependent, and represents thedrive train vibrations; is the wind speed, is the torque,is the blade pitch angle, and is the previous sampling timeperiod. Parameter selection is mainly based on domain knowl-edge. Details are presented in Table VIII. In addition, the symbol
represents model (1) derived from the data with an NN al-gorithm.
2) Tower Vibration Model: The sensor to measure tower ac-celeration is located near the connection of a nacelle and a tower.The model of a tower vibration is presented in
(2)
The parameters of model (2) are identical to those in model(1) with representing the tower vibrations. The symbolis used to represent model (2) extracted with an NN.
In models (1) and (2), the torque value at time and bladepitch angle at time are considered as controllable param-eters used to realize the potential for controlling vibrations ofa wind turbine. Wind speed at time and the past states of allparameters are considered as noncontrollable parameters.
D. Power Output Model
It is known that the power extracted from the wind is ex-pressed as the nonlinear expression
(3)
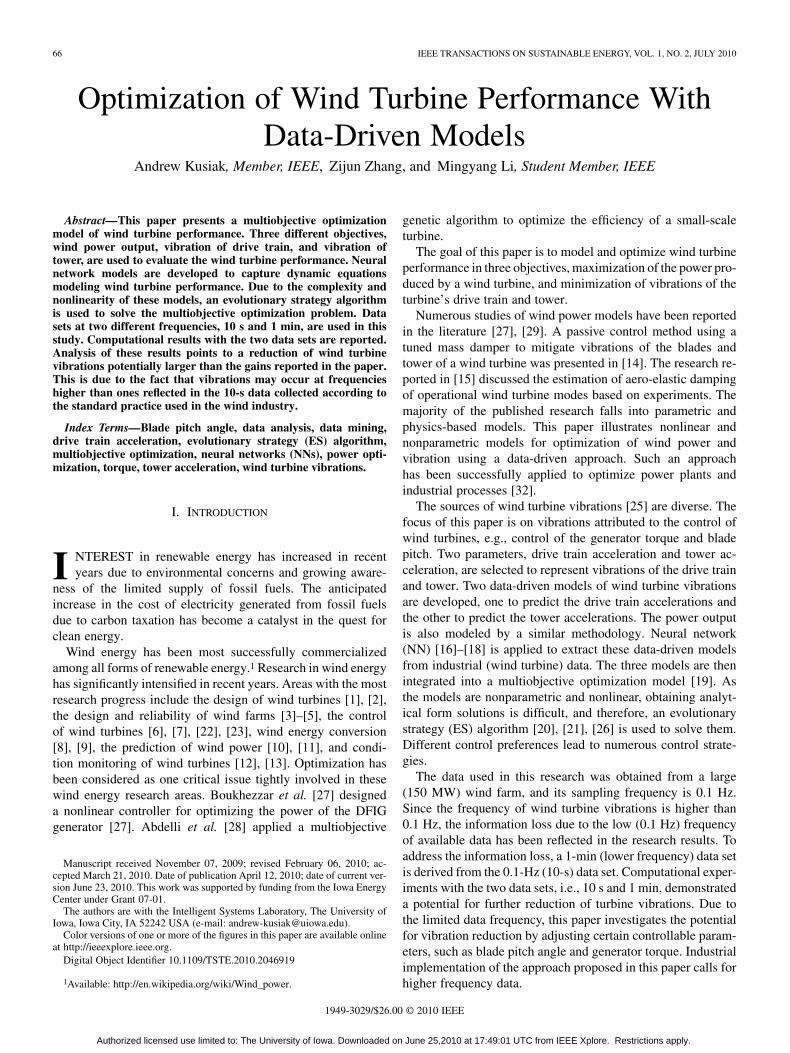
where the air flow density is represented by , is the rotor ra-dius, is the wind speed, and is the power coefficientfunction of the blade pitch angle and the tip-speed ratio .Model (3) does not exactly match the actual power curve illus-trated in Fig. 1. In this power curve, a given wind speed valueis mapped onto a range of power values for a variety of reasons,including sensor errors and faults of various types; for example,a small error in wind speed could result in a large error ofthe power output due to the cube relationship. To model actualpower curves, neural networks, -NN ( nearest neighbor) andother data-mining algorithms can be used. In this paper, an NNmodel is used to estimate power output, and it is expressedas
(4)
The notation used here is identical to the notation of model(1).
E. Validation of the Models
The accelerometers measuring accelerations are sensitive tonoise, and therefore, wavelet analysis is applied to denoise the
Authorized licensed use limited to: The University of Iowa. Downloaded on June 25,2010 at 17:49:01 UTC from IEEE Xplore. Restrictions apply.
68 IEEE TRANSACTIONS ON SUSTAINABLE ENERGY, VOL. 1, NO. 2, JULY 2010
Fig. 1. Prediction with a data-driven time-series models.
TABLE IIIMEAN SHIFT OF THE NOISED DRIVE TRAIN ACCELERATION
measured drive train and tower accelerations. This improvesstability of the models extracted by the data-mining algorithms.Comparative analysis is discussed to select the most appro-priate combination of order and level Daubechies wavelets [30],namely DB7 Level 10, DB7 Level 7, and DB5 Level 5. Thedifference between the mean of the original and denoised data(mean shift) is used as the selection criterion in the comparativeanalysis. A smaller mean shift is favored in data smoothing.Table III shows the difference between the mean shift of thedrive train acceleration for three combinations of the waveletorder and level. The data set from 10/1/2008 12:00:10 A.M. to10/8/2008 12:00:00 A.M. has been selected in this analysis.
As shown in Table III, DB5 Level 5 is selected based on itssmallest mean shift. To illustrate the value of data denoising, twoexperiments are developed. An NN is applied to extract modelsbased on the original data and the data denoised by DB5 Level5 for drive train acceleration. Training and test results of theexperiments are presented in Tables IV and V, respectively.
Four metrics (5)–(8), shown at the bottom of the page, areused to evaluate the performance of the data-derived models,the mean absolute error (MAE), the standard deviation of meanabsolute error (SD of MAE), the mean absolute percentage
TABLE IVTRAINING RESULTS OF THE NN MODEL
TABLE VTEST RESULTS OF THE NN MODEL
error (MAPE), and the standard deviation of mean absolutepercentage error (SD of MAPE) where is the value of thinstance predicted by the NN, is the observed value of thinstance, and means the total number of instances in the dataset.
Based on results in Tables IV and V, it is obvious that de-noising and smoothing data is beneficial for modeling. The largeMAPE and SD of MAPE for the original dataset in Table IV arecaused by the small values in the training set and the nature ofthese two metrics. For example, some instances with values assmall as 0.00002 are contained. A small error (the differencebetween the observed and predicted value) such as 2 results ina large MAPE of (7) and a large SD of MAPE in (8).
To build data-driven models, the 10-s and 1-min data sets aredivided into a training data set (2/3 of all data) and a test data set(1/3) of all data. In the 10-s data set, there are a total of 204 894instances, and in the 1-min data there are a total of 34 149 in-stances. Each training data set is used to train an NN, while thetest data set is used to test the accuracy of data-derived models.Four metrics (5)–(8) are used to evaluate the quality of models.
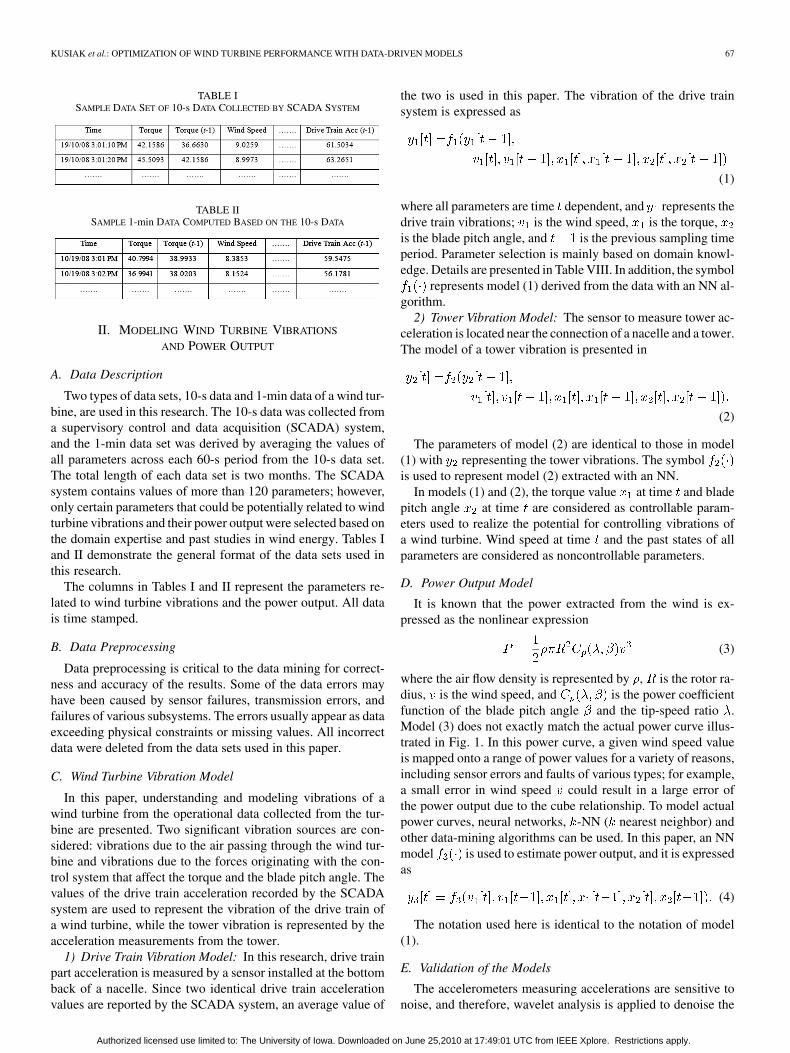
Table VI presents the test results of three NN models ex-tracted from the 10-s data set. The mean value of the drive trainacceleration in this data set is 67.24 and the standard devia-tion (SD) of the drive train acceleration is 36.81. As shown inTable VI, the MAE of the drive train acceleration predicted bythe NN model is 1.27, the corresponding MAPE is 0.02, whichmeans that the model is 98% accurate. For the tower accelera-tion, the mean value of the tower acceleration is 72.83 and the
(5)
(6)
(7)
(8)
Authorized licensed use limited to: The University of Iowa. Downloaded on June 25,2010 at 17:49:01 UTC from IEEE Xplore. Restrictions apply.
KUSIAK et al.: OPTIMIZATION OF WIND TURBINE PERFORMANCE WITH DATA-DRIVEN MODELS 69
TABLE VITEST RESULTS OF THE NN MODELS FOR 10-s DATA
Fig. 2. First 50 test points of the drive train acceleration for 10-s data.
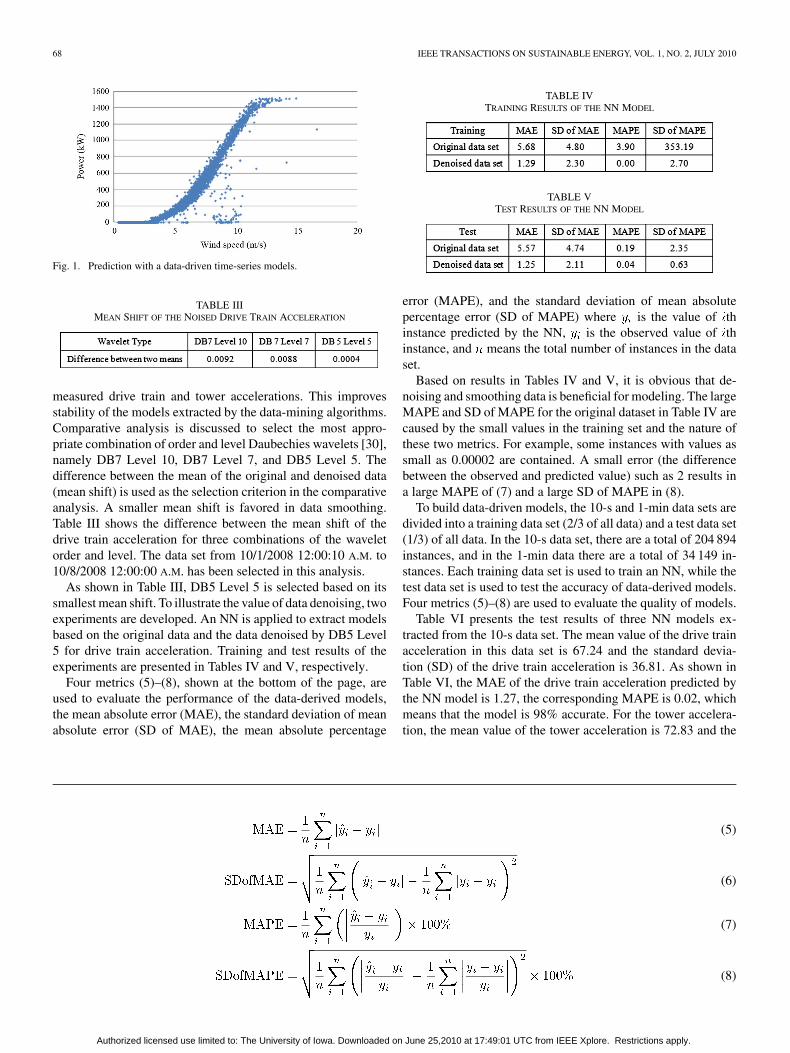
Fig. 3. First 50 test points of the tower acceleration for 10-s data.
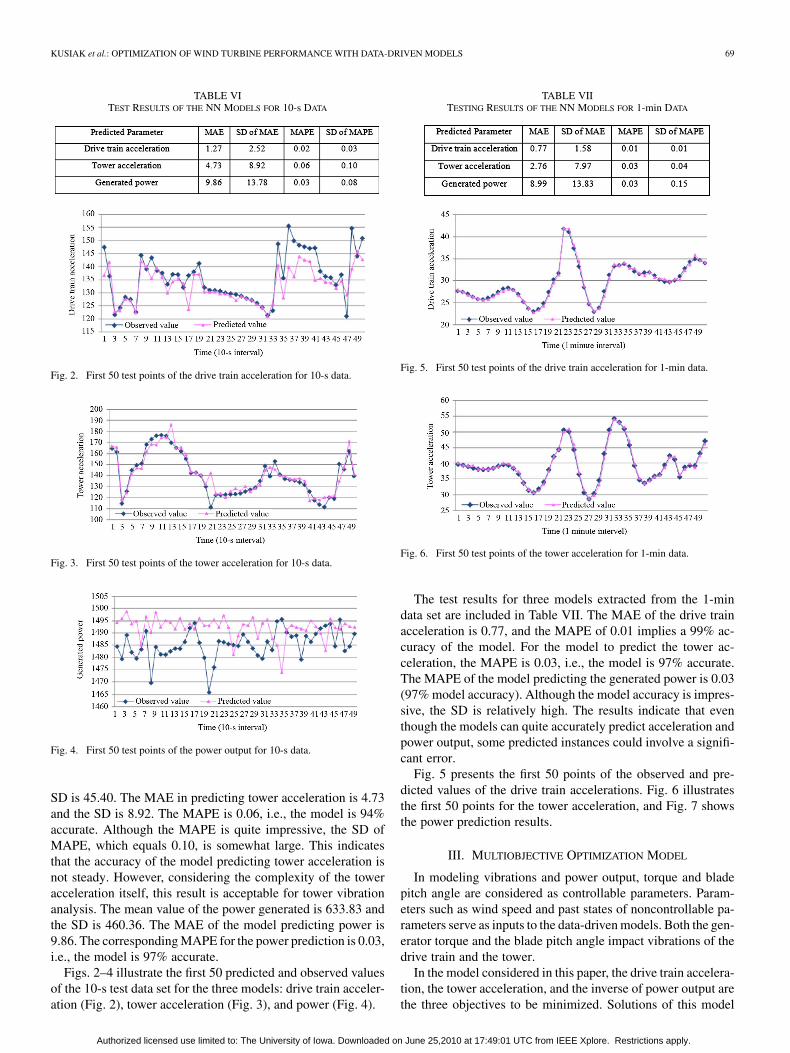
Fig. 4. First 50 test points of the power output for 10-s data.
SD is 45.40. The MAE in predicting tower acceleration is 4.73and the SD is 8.92. The MAPE is 0.06, i.e., the model is 94%accurate. Although the MAPE is quite impressive, the SD ofMAPE, which equals 0.10, is somewhat large. This indicatesthat the accuracy of the model predicting tower acceleration isnot steady. However, considering the complexity of the toweracceleration itself, this result is acceptable for tower vibrationanalysis. The mean value of the power generated is 633.83 andthe SD is 460.36. The MAE of the model predicting power is9.86. The corresponding MAPE for the power prediction is 0.03,i.e., the model is 97% accurate.
Figs. 2–4 illustrate the first 50 predicted and observed valuesof the 10-s test data set for the three models: drive train acceler-ation (Fig. 2), tower acceleration (Fig. 3), and power (Fig. 4).
TABLE VIITESTING RESULTS OF THE NN MODELS FOR 1-min DATA
Fig. 5. First 50 test points of the drive train acceleration for 1-min data.
Fig. 6. First 50 test points of the tower acceleration for 1-min data.
The test results for three models extracted from the 1-mindata set are included in Table VII. The MAE of the drive trainacceleration is 0.77, and the MAPE of 0.01 implies a 99% ac-curacy of the model. For the model to predict the tower ac-celeration, the MAPE is 0.03, i.e., the model is 97% accurate.The MAPE of the model predicting the generated power is 0.03(97% model accuracy). Although the model accuracy is impres-sive, the SD is relatively high. The results indicate that eventhough the models can quite accurately predict acceleration andpower output, some predicted instances could involve a signifi-cant error.
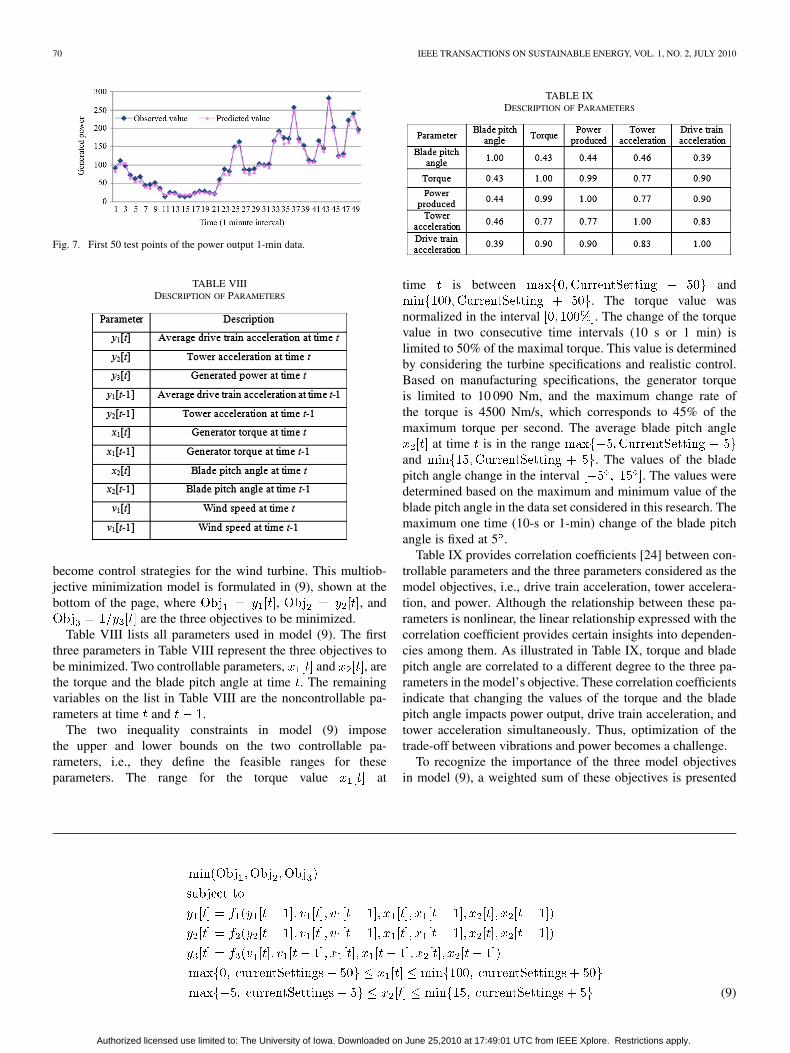
Fig. 5 presents the first 50 points of the observed and pre-dicted values of the drive train accelerations. Fig. 6 illustratesthe first 50 points for the tower acceleration, and Fig. 7 showsthe power prediction results.
III. MULTIOBJECTIVE OPTIMIZATION MODEL
In modeling vibrations and power output, torque and bladepitch angle are considered as controllable parameters. Param-eters such as wind speed and past states of noncontrollable pa-rameters serve as inputs to the data-driven models. Both the gen-erator torque and the blade pitch angle impact vibrations of thedrive train and the tower.
In the model considered in this paper, the drive train accelera-tion, the tower acceleration, and the inverse of power output arethe three objectives to be minimized. Solutions of this model
Authorized licensed use limited to: The University of Iowa. Downloaded on June 25,2010 at 17:49:01 UTC from IEEE Xplore. Restrictions apply.
70 IEEE TRANSACTIONS ON SUSTAINABLE ENERGY, VOL. 1, NO. 2, JULY 2010
Fig. 7. First 50 test points of the power output 1-min data.
TABLE VIIIDESCRIPTION OF PARAMETERS
become control strategies for the wind turbine. This multiob-jective minimization model is formulated in (9), shown at thebottom of the page, where , , and
are the three objectives to be minimized.Table VIII lists all parameters used in model (9). The first
three parameters in Table VIII represent the three objectives tobe minimized. Two controllable parameters, and , arethe torque and the blade pitch angle at time . The remainingvariables on the list in Table VIII are the noncontrollable pa-rameters at time and .
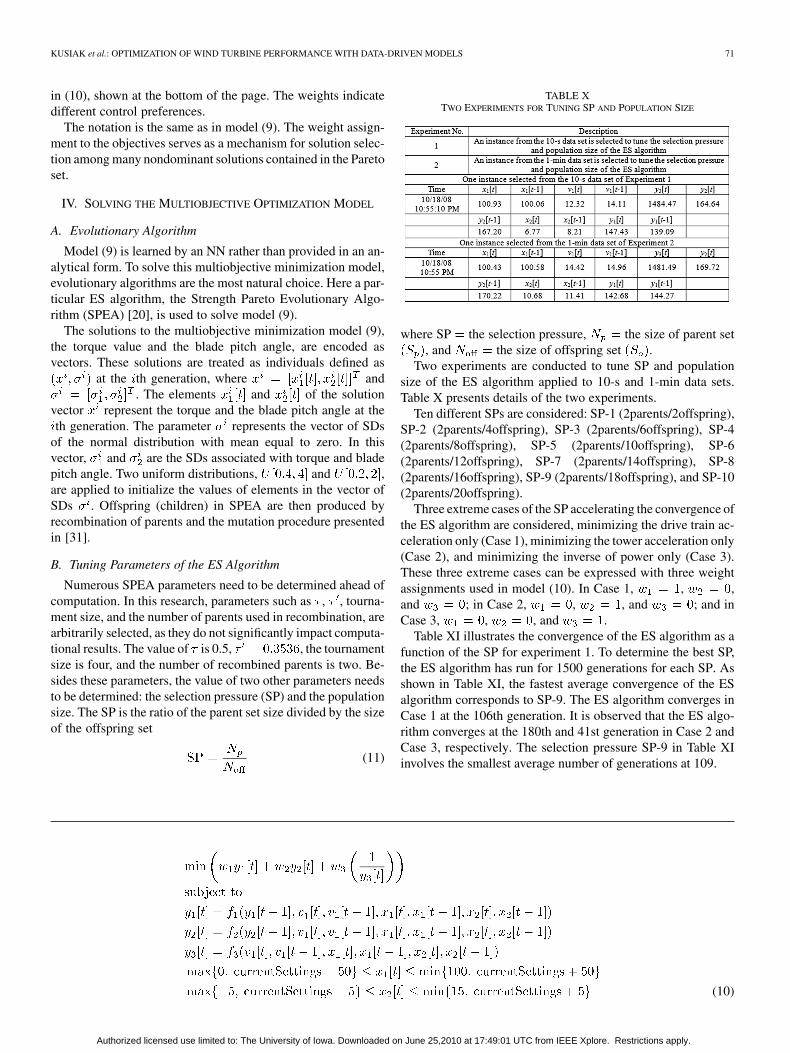
The two inequality constraints in model (9) imposethe upper and lower bounds on the two controllable pa-rameters, i.e., they define the feasible ranges for theseparameters. The range for the torque value at
TABLE IXDESCRIPTION OF PARAMETERS
time is between and. The torque value was
normalized in the interval . The change of the torquevalue in two consecutive time intervals (10 s or 1 min) islimited to 50% of the maximal torque. This value is determinedby considering the turbine specifications and realistic control.Based on manufacturing specifications, the generator torqueis limited to 10 090 Nm, and the maximum change rate ofthe torque is 4500 Nm/s, which corresponds to 45% of themaximum torque per second. The average blade pitch angle
at time is in the rangeand . The values of the bladepitch angle change in the interval . The values weredetermined based on the maximum and minimum value of theblade pitch angle in the data set considered in this research. Themaximum one time (10-s or 1-min) change of the blade pitchangle is fixed at 5 .
Table IX provides correlation coefficients [24] between con-trollable parameters and the three parameters considered as themodel objectives, i.e., drive train acceleration, tower accelera-tion, and power. Although the relationship between these pa-rameters is nonlinear, the linear relationship expressed with thecorrelation coefficient provides certain insights into dependen-cies among them. As illustrated in Table IX, torque and bladepitch angle are correlated to a different degree to the three pa-rameters in the model’s objective. These correlation coefficientsindicate that changing the values of the torque and the bladepitch angle impacts power output, drive train acceleration, andtower acceleration simultaneously. Thus, optimization of thetrade-off between vibrations and power becomes a challenge.
To recognize the importance of the three model objectivesin model (9), a weighted sum of these objectives is presented
(9)
Authorized licensed use limited to: The University of Iowa. Downloaded on June 25,2010 at 17:49:01 UTC from IEEE Xplore. Restrictions apply.
KUSIAK et al.: OPTIMIZATION OF WIND TURBINE PERFORMANCE WITH DATA-DRIVEN MODELS 71
in (10), shown at the bottom of the page. The weights indicatedifferent control preferences.
The notation is the same as in model (9). The weight assign-ment to the objectives serves as a mechanism for solution selec-tion among many nondominant solutions contained in the Paretoset.
IV. SOLVING THE MULTIOBJECTIVE OPTIMIZATION MODEL
A. Evolutionary Algorithm
Model (9) is learned by an NN rather than provided in an an-alytical form. To solve this multiobjective minimization model,evolutionary algorithms are the most natural choice. Here a par-ticular ES algorithm, the Strength Pareto Evolutionary Algo-rithm (SPEA) [20], is used to solve model (9).
The solutions to the multiobjective minimization model (9),the torque value and the blade pitch angle, are encoded asvectors. These solutions are treated as individuals defined as
at the th generation, where and. The elements and of the solution
vector represent the torque and the blade pitch angle at theth generation. The parameter represents the vector of SDs
of the normal distribution with mean equal to zero. In thisvector, and are the SDs associated with torque and bladepitch angle. Two uniform distributions, and ,are applied to initialize the values of elements in the vector ofSDs . Offspring (children) in SPEA are then produced byrecombination of parents and the mutation procedure presentedin [31].
B. Tuning Parameters of the ES Algorithm
Numerous SPEA parameters need to be determined ahead ofcomputation. In this research, parameters such as , , tourna-ment size, and the number of parents used in recombination, arearbitrarily selected, as they do not significantly impact computa-tional results. The value of is 0.5, , the tournamentsize is four, and the number of recombined parents is two. Be-sides these parameters, the value of two other parameters needsto be determined: the selection pressure (SP) and the populationsize. The SP is the ratio of the parent set size divided by the sizeof the offspring set
(11)
TABLE XTWO EXPERIMENTS FOR TUNING SP AND POPULATION SIZE
where SP the selection pressure, the size of parent set, and the size of offspring set .
Two experiments are conducted to tune SP and populationsize of the ES algorithm applied to 10-s and 1-min data sets.Table X presents details of the two experiments.
Ten different SPs are considered: SP-1 (2parents/2offspring),SP-2 (2parents/4offspring), SP-3 (2parents/6offspring), SP-4(2parents/8offspring), SP-5 (2parents/10offspring), SP-6(2parents/12offspring), SP-7 (2parents/14offspring), SP-8(2parents/16offspring), SP-9 (2parents/18offspring), and SP-10(2parents/20offspring).
Three extreme cases of the SP accelerating the convergence ofthe ES algorithm are considered, minimizing the drive train ac-celeration only (Case 1), minimizing the tower acceleration only(Case 2), and minimizing the inverse of power only (Case 3).These three extreme cases can be expressed with three weightassignments used in model (10). In Case 1, , ,and ; in Case 2, , , and ; and inCase 3, , , and .
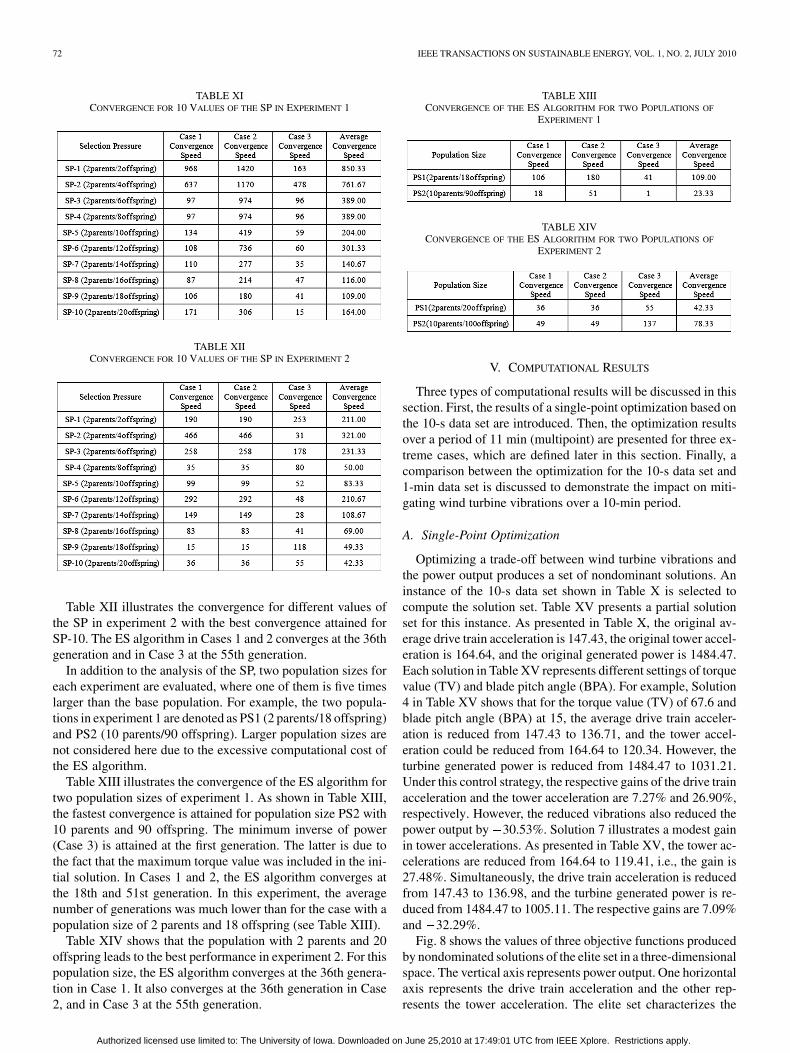
Table XI illustrates the convergence of the ES algorithm as afunction of the SP for experiment 1. To determine the best SP,the ES algorithm has run for 1500 generations for each SP. Asshown in Table XI, the fastest average convergence of the ESalgorithm corresponds to SP-9. The ES algorithm converges inCase 1 at the 106th generation. It is observed that the ES algo-rithm converges at the 180th and 41st generation in Case 2 andCase 3, respectively. The selection pressure SP-9 in Table XIinvolves the smallest average number of generations at 109.
(10)
Authorized licensed use limited to: The University of Iowa. Downloaded on June 25,2010 at 17:49:01 UTC from IEEE Xplore. Restrictions apply.
72 IEEE TRANSACTIONS ON SUSTAINABLE ENERGY, VOL. 1, NO. 2, JULY 2010
TABLE XICONVERGENCE FOR 10 VALUES OF THE SP IN EXPERIMENT 1
TABLE XIICONVERGENCE FOR 10 VALUES OF THE SP IN EXPERIMENT 2
Table XII illustrates the convergence for different values ofthe SP in experiment 2 with the best convergence attained forSP-10. The ES algorithm in Cases 1 and 2 converges at the 36thgeneration and in Case 3 at the 55th generation.
In addition to the analysis of the SP, two population sizes foreach experiment are evaluated, where one of them is five timeslarger than the base population. For example, the two popula-tions in experiment 1 are denoted as PS1 (2 parents/18 offspring)and PS2 (10 parents/90 offspring). Larger population sizes arenot considered here due to the excessive computational cost ofthe ES algorithm.
Table XIII illustrates the convergence of the ES algorithm fortwo population sizes of experiment 1. As shown in Table XIII,the fastest convergence is attained for population size PS2 with10 parents and 90 offspring. The minimum inverse of power(Case 3) is attained at the first generation. The latter is due tothe fact that the maximum torque value was included in the ini-tial solution. In Cases 1 and 2, the ES algorithm converges atthe 18th and 51st generation. In this experiment, the averagenumber of generations was much lower than for the case with apopulation size of 2 parents and 18 offspring (see Table XIII).
Table XIV shows that the population with 2 parents and 20offspring leads to the best performance in experiment 2. For thispopulation size, the ES algorithm converges at the 36th genera-tion in Case 1. It also converges at the 36th generation in Case2, and in Case 3 at the 55th generation.
TABLE XIIICONVERGENCE OF THE ES ALGORITHM FOR TWO POPULATIONS OF
EXPERIMENT 1
TABLE XIVCONVERGENCE OF THE ES ALGORITHM FOR TWO POPULATIONS OF
EXPERIMENT 2
V. COMPUTATIONAL RESULTS
Three types of computational results will be discussed in thissection. First, the results of a single-point optimization based onthe 10-s data set are introduced. Then, the optimization resultsover a period of 11 min (multipoint) are presented for three ex-treme cases, which are defined later in this section. Finally, acomparison between the optimization for the 10-s data set and1-min data set is discussed to demonstrate the impact on miti-gating wind turbine vibrations over a 10-min period.
A. Single-Point Optimization
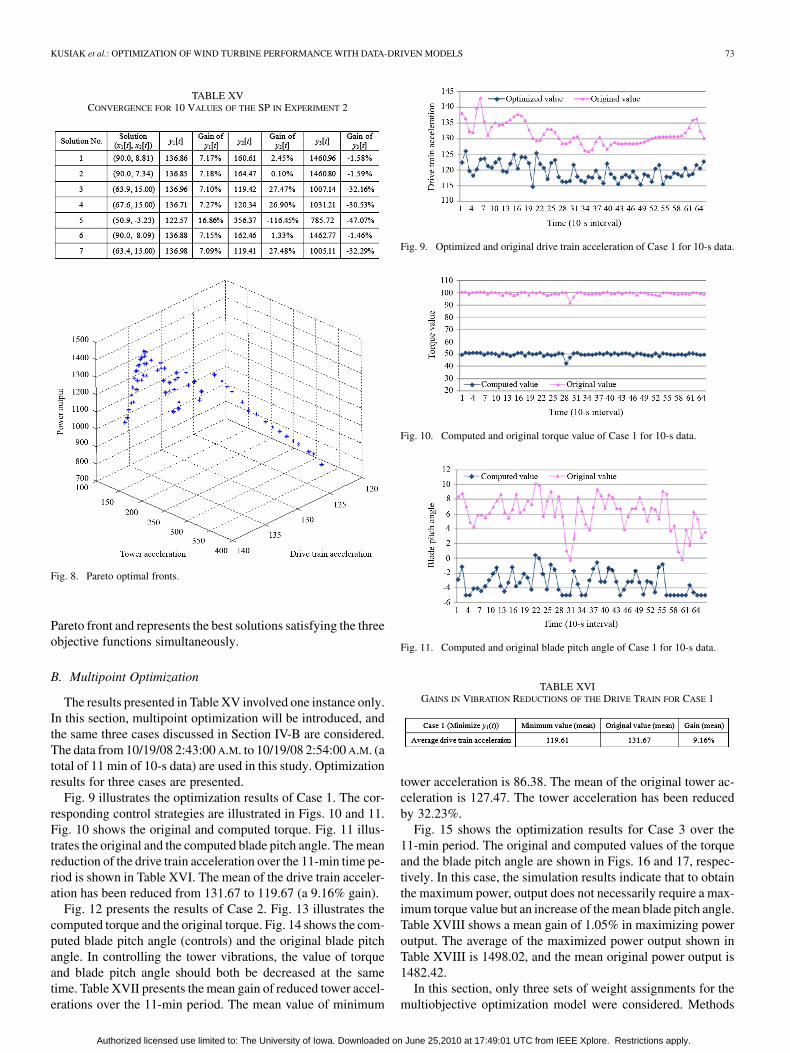
Optimizing a trade-off between wind turbine vibrations andthe power output produces a set of nondominant solutions. Aninstance of the 10-s data set shown in Table X is selected tocompute the solution set. Table XV presents a partial solutionset for this instance. As presented in Table X, the original av-erage drive train acceleration is 147.43, the original tower accel-eration is 164.64, and the original generated power is 1484.47.Each solution in Table XV represents different settings of torquevalue (TV) and blade pitch angle (BPA). For example, Solution4 in Table XV shows that for the torque value (TV) of 67.6 andblade pitch angle (BPA) at 15, the average drive train acceler-ation is reduced from 147.43 to 136.71, and the tower accel-eration could be reduced from 164.64 to 120.34. However, theturbine generated power is reduced from 1484.47 to 1031.21.Under this control strategy, the respective gains of the drive trainacceleration and the tower acceleration are 7.27% and 26.90%,respectively. However, the reduced vibrations also reduced thepower output by 30.53%. Solution 7 illustrates a modest gainin tower accelerations. As presented in Table XV, the tower ac-celerations are reduced from 164.64 to 119.41, i.e., the gain is27.48%. Simultaneously, the drive train acceleration is reducedfrom 147.43 to 136.98, and the turbine generated power is re-duced from 1484.47 to 1005.11. The respective gains are 7.09%and 32.29%.
Fig. 8 shows the values of three objective functions producedby nondominated solutions of the elite set in a three-dimensionalspace. The vertical axis represents power output. One horizontalaxis represents the drive train acceleration and the other rep-resents the tower acceleration. The elite set characterizes the
Authorized licensed use limited to: The University of Iowa. Downloaded on June 25,2010 at 17:49:01 UTC from IEEE Xplore. Restrictions apply.
KUSIAK et al.: OPTIMIZATION OF WIND TURBINE PERFORMANCE WITH DATA-DRIVEN MODELS 73
TABLE XVCONVERGENCE FOR 10 VALUES OF THE SP IN EXPERIMENT 2
Fig. 8. Pareto optimal fronts.
Pareto front and represents the best solutions satisfying the threeobjective functions simultaneously.
B. Multipoint Optimization
The results presented in Table XV involved one instance only.In this section, multipoint optimization will be introduced, andthe same three cases discussed in Section IV-B are considered.The data from 10/19/08 2:43:00 A.M. to 10/19/08 2:54:00 A.M. (atotal of 11 min of 10-s data) are used in this study. Optimizationresults for three cases are presented.
Fig. 9 illustrates the optimization results of Case 1. The cor-responding control strategies are illustrated in Figs. 10 and 11.Fig. 10 shows the original and computed torque. Fig. 11 illus-trates the original and the computed blade pitch angle. The meanreduction of the drive train acceleration over the 11-min time pe-riod is shown in Table XVI. The mean of the drive train acceler-ation has been reduced from 131.67 to 119.67 (a 9.16% gain).
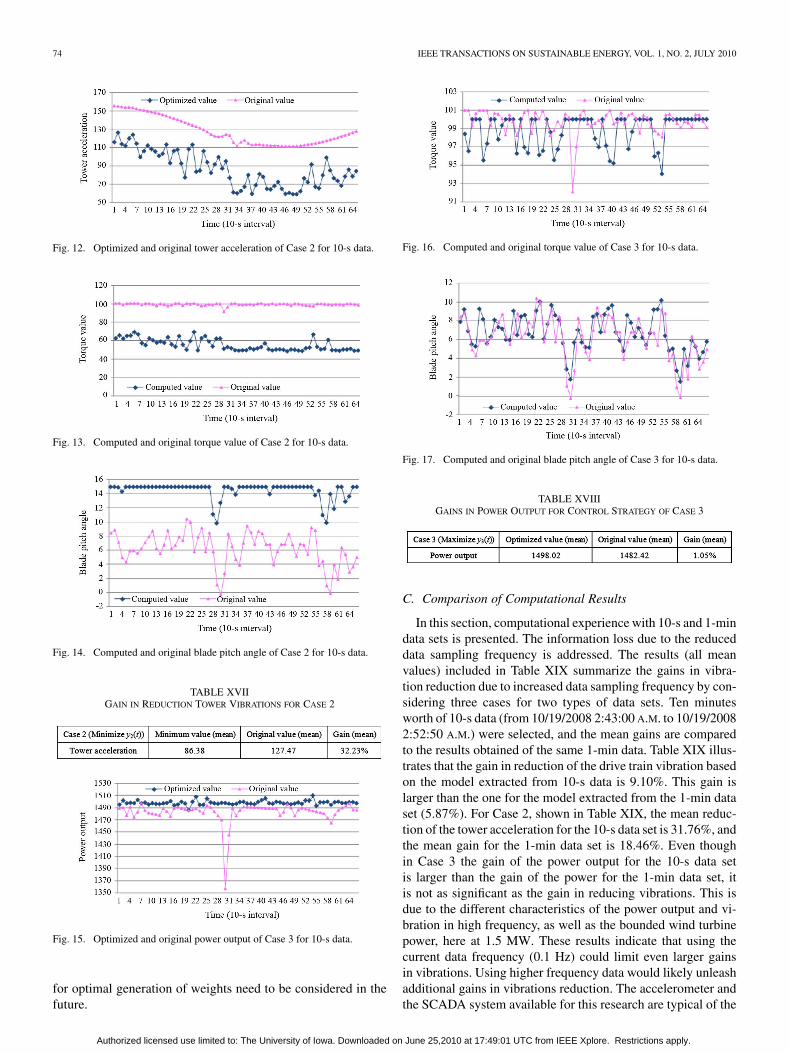
Fig. 12 presents the results of Case 2. Fig. 13 illustrates thecomputed torque and the original torque. Fig. 14 shows the com-puted blade pitch angle (controls) and the original blade pitchangle. In controlling the tower vibrations, the value of torqueand blade pitch angle should both be decreased at the sametime. Table XVII presents the mean gain of reduced tower accel-erations over the 11-min period. The mean value of minimum
Fig. 9. Optimized and original drive train acceleration of Case 1 for 10-s data.
Fig. 10. Computed and original torque value of Case 1 for 10-s data.
Fig. 11. Computed and original blade pitch angle of Case 1 for 10-s data.
TABLE XVIGAINS IN VIBRATION REDUCTIONS OF THE DRIVE TRAIN FOR CASE 1
tower acceleration is 86.38. The mean of the original tower ac-celeration is 127.47. The tower acceleration has been reducedby 32.23%.
Fig. 15 shows the optimization results for Case 3 over the11-min period. The original and computed values of the torqueand the blade pitch angle are shown in Figs. 16 and 17, respec-tively. In this case, the simulation results indicate that to obtainthe maximum power, output does not necessarily require a max-imum torque value but an increase of the mean blade pitch angle.Table XVIII shows a mean gain of 1.05% in maximizing poweroutput. The average of the maximized power output shown inTable XVIII is 1498.02, and the mean original power output is1482.42.
In this section, only three sets of weight assignments for themultiobjective optimization model were considered. Methods
Authorized licensed use limited to: The University of Iowa. Downloaded on June 25,2010 at 17:49:01 UTC from IEEE Xplore. Restrictions apply.
74 IEEE TRANSACTIONS ON SUSTAINABLE ENERGY, VOL. 1, NO. 2, JULY 2010
Fig. 12. Optimized and original tower acceleration of Case 2 for 10-s data.
Fig. 13. Computed and original torque value of Case 2 for 10-s data.
Fig. 14. Computed and original blade pitch angle of Case 2 for 10-s data.
TABLE XVIIGAIN IN REDUCTION TOWER VIBRATIONS FOR CASE 2
Fig. 15. Optimized and original power output of Case 3 for 10-s data.
for optimal generation of weights need to be considered in thefuture.
Fig. 16. Computed and original torque value of Case 3 for 10-s data.
Fig. 17. Computed and original blade pitch angle of Case 3 for 10-s data.
TABLE XVIIIGAINS IN POWER OUTPUT FOR CONTROL STRATEGY OF CASE 3
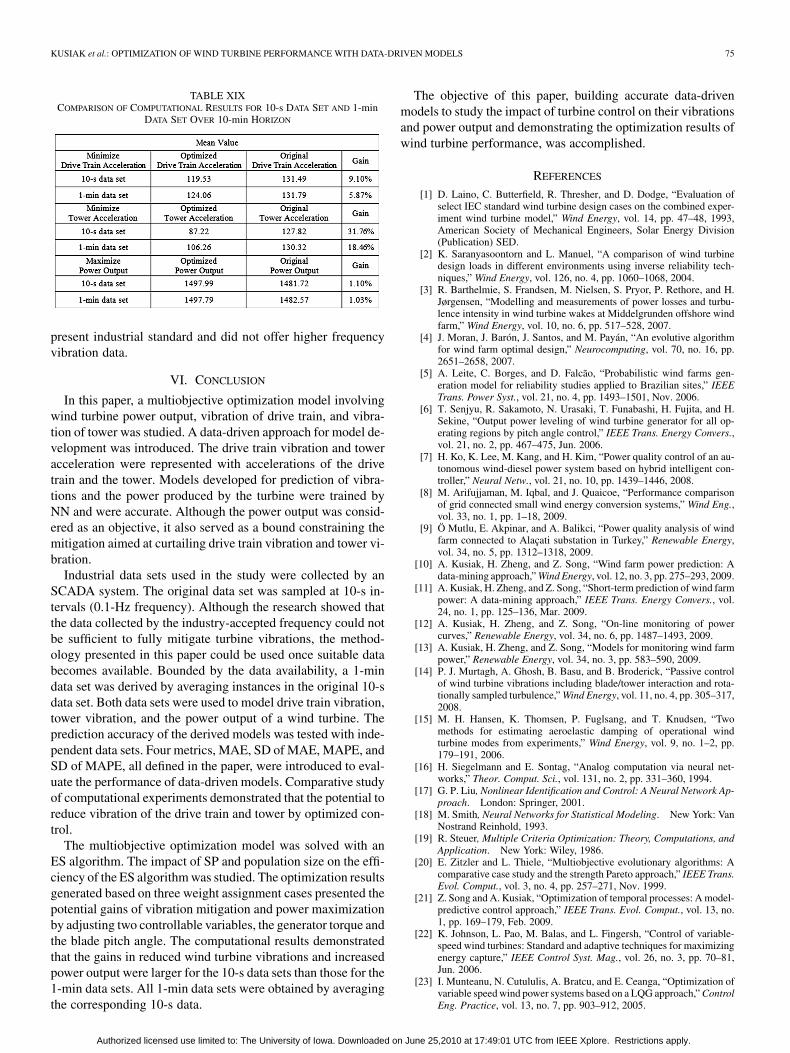
C. Comparison of Computational Results
In this section, computational experience with 10-s and 1-mindata sets is presented. The information loss due to the reduceddata sampling frequency is addressed. The results (all meanvalues) included in Table XIX summarize the gains in vibra-tion reduction due to increased data sampling frequency by con-sidering three cases for two types of data sets. Ten minutesworth of 10-s data (from 10/19/2008 2:43:00 A.M. to 10/19/20082:52:50 A.M.) were selected, and the mean gains are comparedto the results obtained of the same 1-min data. Table XIX illus-trates that the gain in reduction of the drive train vibration basedon the model extracted from 10-s data is 9.10%. This gain islarger than the one for the model extracted from the 1-min dataset (5.87%). For Case 2, shown in Table XIX, the mean reduc-tion of the tower acceleration for the 10-s data set is 31.76%, andthe mean gain for the 1-min data set is 18.46%. Even thoughin Case 3 the gain of the power output for the 10-s data setis larger than the gain of the power for the 1-min data set, itis not as significant as the gain in reducing vibrations. This isdue to the different characteristics of the power output and vi-bration in high frequency, as well as the bounded wind turbinepower, here at 1.5 MW. These results indicate that using thecurrent data frequency (0.1 Hz) could limit even larger gainsin vibrations. Using higher frequency data would likely unleashadditional gains in vibrations reduction. The accelerometer andthe SCADA system available for this research are typical of the
Authorized licensed use limited to: The University of Iowa. Downloaded on June 25,2010 at 17:49:01 UTC from IEEE Xplore. Restrictions apply.
KUSIAK et al.: OPTIMIZATION OF WIND TURBINE PERFORMANCE WITH DATA-DRIVEN MODELS 75
TABLE XIXCOMPARISON OF COMPUTATIONAL RESULTS FOR 10-s DATA SET AND 1-min
DATA SET OVER 10-min HORIZON
present industrial standard and did not offer higher frequencyvibration data.
VI. CONCLUSION
In this paper, a multiobjective optimization model involvingwind turbine power output, vibration of drive train, and vibra-tion of tower was studied. A data-driven approach for model de-velopment was introduced. The drive train vibration and toweracceleration were represented with accelerations of the drivetrain and the tower. Models developed for prediction of vibra-tions and the power produced by the turbine were trained byNN and were accurate. Although the power output was consid-ered as an objective, it also served as a bound constraining themitigation aimed at curtailing drive train vibration and tower vi-bration.
Industrial data sets used in the study were collected by anSCADA system. The original data set was sampled at 10-s in-tervals (0.1-Hz frequency). Although the research showed thatthe data collected by the industry-accepted frequency could notbe sufficient to fully mitigate turbine vibrations, the method-ology presented in this paper could be used once suitable databecomes available. Bounded by the data availability, a 1-mindata set was derived by averaging instances in the original 10-sdata set. Both data sets were used to model drive train vibration,tower vibration, and the power output of a wind turbine. Theprediction accuracy of the derived models was tested with inde-pendent data sets. Four metrics, MAE, SD of MAE, MAPE, andSD of MAPE, all defined in the paper, were introduced to eval-uate the performance of data-driven models. Comparative studyof computational experiments demonstrated that the potential toreduce vibration of the drive train and tower by optimized con-trol.
The multiobjective optimization model was solved with anES algorithm. The impact of SP and population size on the effi-ciency of the ES algorithm was studied. The optimization resultsgenerated based on three weight assignment cases presented thepotential gains of vibration mitigation and power maximizationby adjusting two controllable variables, the generator torque andthe blade pitch angle. The computational results demonstratedthat the gains in reduced wind turbine vibrations and increasedpower output were larger for the 10-s data sets than those for the1-min data sets. All 1-min data sets were obtained by averagingthe corresponding 10-s data.
The objective of this paper, building accurate data-drivenmodels to study the impact of turbine control on their vibrationsand power output and demonstrating the optimization results ofwind turbine performance, was accomplished.
REFERENCES
[1] D. Laino, C. Butterfield, R. Thresher, and D. Dodge, “Evaluation ofselect IEC standard wind turbine design cases on the combined exper-iment wind turbine model,” Wind Energy, vol. 14, pp. 47–48, 1993,American Society of Mechanical Engineers, Solar Energy Division(Publication) SED.
[2] K. Saranyasoontorn and L. Manuel, “A comparison of wind turbinedesign loads in different environments using inverse reliability tech-niques,” Wind Energy, vol. 126, no. 4, pp. 1060–1068, 2004.
[3] R. Barthelmie, S. Frandsen, M. Nielsen, S. Pryor, P. Rethore, and H.Jørgensen, “Modelling and measurements of power losses and turbu-lence intensity in wind turbine wakes at Middelgrunden offshore windfarm,” Wind Energy, vol. 10, no. 6, pp. 517–528, 2007.
[4] J. Moran, J. Barón, J. Santos, and M. Payán, “An evolutive algorithmfor wind farm optimal design,” Neurocomputing, vol. 70, no. 16, pp.2651–2658, 2007.
[5] A. Leite, C. Borges, and D. Falcão, “Probabilistic wind farms gen-eration model for reliability studies applied to Brazilian sites,” IEEETrans. Power Syst., vol. 21, no. 4, pp. 1493–1501, Nov. 2006.
[6] T. Senjyu, R. Sakamoto, N. Urasaki, T. Funabashi, H. Fujita, and H.Sekine, “Output power leveling of wind turbine generator for all op-erating regions by pitch angle control,” IEEE Trans. Energy Convers.,vol. 21, no. 2, pp. 467–475, Jun. 2006.
[7] H. Ko, K. Lee, M. Kang, and H. Kim, “Power quality control of an au-tonomous wind-diesel power system based on hybrid intelligent con-troller,” Neural Netw., vol. 21, no. 10, pp. 1439–1446, 2008.
[8] M. Arifujjaman, M. Iqbal, and J. Quaicoe, “Performance comparisonof grid connected small wind energy conversion systems,” Wind Eng.,vol. 33, no. 1, pp. 1–18, 2009.
[9] Ö Mutlu, E. Akpinar, and A. Balikci, “Power quality analysis of windfarm connected to Alaçati substation in Turkey,” Renewable Energy,vol. 34, no. 5, pp. 1312–1318, 2009.
[10] A. Kusiak, H. Zheng, and Z. Song, “Wind farm power prediction: Adata-mining approach,” Wind Energy, vol. 12, no. 3, pp. 275–293, 2009.
[11] A. Kusiak, H. Zheng, and Z. Song, “Short-term prediction of wind farmpower: A data-mining approach,” IEEE Trans. Energy Convers., vol.24, no. 1, pp. 125–136, Mar. 2009.
[12] A. Kusiak, H. Zheng, and Z. Song, “On-line monitoring of powercurves,” Renewable Energy, vol. 34, no. 6, pp. 1487–1493, 2009.
[13] A. Kusiak, H. Zheng, and Z. Song, “Models for monitoring wind farmpower,” Renewable Energy, vol. 34, no. 3, pp. 583–590, 2009.
[14] P. J. Murtagh, A. Ghosh, B. Basu, and B. Broderick, “Passive controlof wind turbine vibrations including blade/tower interaction and rota-tionally sampled turbulence,” Wind Energy, vol. 11, no. 4, pp. 305–317,2008.
[15] M. H. Hansen, K. Thomsen, P. Fuglsang, and T. Knudsen, “Twomethods for estimating aeroelastic damping of operational windturbine modes from experiments,” Wind Energy, vol. 9, no. 1–2, pp.179–191, 2006.
[16] H. Siegelmann and E. Sontag, “Analog computation via neural net-works,” Theor. Comput. Sci., vol. 131, no. 2, pp. 331–360, 1994.
[17] G. P. Liu, Nonlinear Identification and Control: A Neural Network Ap-proach. London: Springer, 2001.
[18] M. Smith, Neural Networks for Statistical Modeling. New York: VanNostrand Reinhold, 1993.
[19] R. Steuer, Multiple Criteria Optimization: Theory, Computations, andApplication. New York: Wiley, 1986.
[20] E. Zitzler and L. Thiele, “Multiobjective evolutionary algorithms: Acomparative case study and the strength Pareto approach,” IEEE Trans.Evol. Comput., vol. 3, no. 4, pp. 257–271, Nov. 1999.
[21] Z. Song and A. Kusiak, “Optimization of temporal processes: A model-predictive control approach,” IEEE Trans. Evol. Comput., vol. 13, no.1, pp. 169–179, Feb. 2009.
[22] K. Johnson, L. Pao, M. Balas, and L. Fingersh, “Control of variable-speed wind turbines: Standard and adaptive techniques for maximizingenergy capture,” IEEE Control Syst. Mag., vol. 26, no. 3, pp. 70–81,Jun. 2006.
[23] I. Munteanu, N. Cutululis, A. Bratcu, and E. Ceanga, “Optimization ofvariable speed wind power systems based on a LQG approach,” ControlEng. Practice, vol. 13, no. 7, pp. 903–912, 2005.
Authorized licensed use limited to: The University of Iowa. Downloaded on June 25,2010 at 17:49:01 UTC from IEEE Xplore. Restrictions apply.

76 IEEE TRANSACTIONS ON SUSTAINABLE ENERGY, VOL. 1, NO. 2, JULY 2010
[24] R. A. Fisher, “Frequency distribution of the values of the correlation co-efficient in samples from an indefinitely large population,” Biometrika,vol. 10, no. 4, pp. 507–521, 1915.
[25] V. Wowk, Machinery Vibration: Measurement and Analysis. NewYork: McGraw-Hill, 1991.
[26] K. Deb, Multi-Objective Optimization Using Evolutionary Algo-rithms. New York: Wiley, 2001.
[27] B. Boukhezzar and H. Siguerdidjane, “Nonlinear control with windestimation of a DFIG variable speed wind turbine for power captureoptimization,” Energy Convers. Manage., vol. 50, no. 4, pp. 885–892,2009.
[28] A. Abdelli, B. Sareni, and X. Roboam, “Optimization of a small passivewind turbine generator with multiobjective genetic algorithms,” Int. J.Appl. Electromagn. Mechanics, vol. 26, no. 3–4, pp. 175–182, 2007.
[29] B. Boukhezzar, H. Siguerdidjane, and M. Maureenhand, “Nonlinearcontrol of variable-speed wind turbines for generator torque limitingand power optimization,” J. Solar Energy Eng., vol. 128, no. 4, pp.516–530, 2006.
[30] I. Daubechies, Ten Lectures on Wavelets. Philadelphia, PA: Societyfor Industrial and Applied Mathematics, 1992.
[31] A. Kusiak, Z. Song, and H. Zheng, “Anticipatory control of wind tur-bines with data-driven predictive models,” IEEE Trans. Energy Con-vers., vol. 24, no. 3, pp. 766–774, Sep. 2009.
[32] Z. Song and A. Kusiak, “Constraint-based control of boiler efficiency:A data-mining approach,” IEEE Trans. Ind. Informat., vol. 3, no. 1, pp.73–83, Feb. 2007.
Andrew Kusiak (M’89) received the B.S. and M.S.degrees in engineering from the Warsaw Universityof Technology, Warsaw, Poland, in 1972 and 1974,respectively, and the Ph.D. degree in operationsresearch from the Polish Academy of Sciences,Warsaw, in 1979.
He is currently a Professor at the Intelligent Sys-tems Laboratory, Department of Mechanical and In-dustrial Engineering, The University of Iowa, IowaCity. He speaks frequently at international meetings,conducts professional seminars, and does consulta-
tion for industrial corporations. He has served on the editorial boards of over40 journals. He is the author or coauthor of numerous books and technical pa-pers in journals sponsored by professional societies, such as the Association forthe Advancement of Artificial Intelligence, the American Society of MechanicalEngineers, etc. His current research interests include applications of computa-tional intelligence in automation, wind and combustion energy, manufacturing,product development, and healthcare.
Prof. Kusiak is an Institute of Industrial Engineers Fellow and the Editor-in-Chief of the Journal of Intelligent Manufacturing.
Zijun Zhang received the B.S. degree from theChinese University of Hong Kong, Hong Kong,China, in 2008, the M.S. degree from the Universityof Iowa, Iowa City, IA, in 2009, and is currentlyworking toward the Ph.D. degree at the Departmentof Mechanical and Industrial Engineering, TheUniversity of Iowa, Iowa City.
His research concentrates on data mining and com-putational intelligence applied to systems modelingand optimization in wind energy and HVAC domains.He is a member of the Intelligent Systems Laboratory
at The University of Iowa.
Mingyang Li received the B.S. (2008) degree fromthe Huazhong University of Science and Technology,Hubei, China, the M.S. (2009) degree from the Uni-versity of Iowa, Iowa City, IA, and is working towardthe Ph.D. degree at the Department of Mechanicaland Industrial Engineering, The University of Iowa,Iowa City.
His research concentrates on applications of datamining and computational intelligence in systemmodeling and optimization.
Authorized licensed use limited to: The University of Iowa. Downloaded on June 25,2010 at 17:49:01 UTC from IEEE Xplore. Restrictions apply.
Copyright © 2022 FDOKUMEN