Why the molten salt fast reactor (MSFR) is the " best " Gen IV reactor

Energies 2009, 2, 180-189; doi:10.3390/en20200180
energies ISSN 1996-1073
www.mdpi.com/journal/energies
Article
Optimal Fixed Bed Reactor Network Configuration for the Efficient Recycling of CO2 into Methanol Ali Elkamel 1,*, Gholam Reza Zahedi 2, Chris Marton 1 and Ali Lohi 3
1 Department of Chemical Engineering, University of Waterloo, Waterloo, ON, N2L 3G1, Canada. 2 Simulation and Artificial Intelligence Research Center, Department of Chemical Engineering,
Faculty of Engineering, Razi University, Kermanshah, Iran. 3 Department of Chemical Engineering, University of Ryerson, Toronto, ON M5B2K3, Canada. * Author to whom correspondence should be addressed; E-Mail: [email protected] Received: 19 February 2009; in revised form: 2 April 2009 / Accepted: 3 April 2009 / Published: 7 April 2009
Abstract: An optimal design strategy of a network of fixed bed reactors for Methanol Production (MP) is proposed in this study. Both methanol production and profit spanning a production period of eight years have been set as objective functions to find the optimal production network. The conservation of mass and energy laws on a heterogeneous model of a single industrial methanol reactor was first developed. The model was solved numerically and was validated with industrial plant data. Different reactor network arrangements were then simulated in order to find an optimal superstructure. It was found that a structure of four reactors (two in series in parallel with another two in series) provide maximum production rate. The application of the more realistic objective function of profit showed that a configuration of two parallel reactors is the best configuration. This optimal structure produces 92 tons/day more methanol than a single reactor. Keywords: Methanol reactor, reactor configuration, optimal design, carbon dioxide.
OPEN ACCESS

Energies 2009, 2
181
1. Introduction
Originally, methanol was produced entirely from destructive distillation of wood, hence the common name wood alcohol. This production method was used exclusively from the middle of the 19th century until the early 20th century when the synthetic method of production, mixing of hydrogen with carbon oxides at high pressures, was discovered in the 1920s [1]. The distillation of wood was no longer effective. The product, obtained in very poor yield, was often badly contaminated with other organic products from the wood including resins and hydrocarbons as well as few higher carbon alcohols [2]. The method using methane as the main raw material and adding oxygen was effectively used until 1973, at which point it was banned. After a twenty year break, the method is making a return. This method is slightly flawed since it requires lots of energy input and the process produces several organic by-products other than methanol; mainly ethyl ether and ethanol. Nearly half of methanol produced worldwide is used directly in the synthesis of formaldehyde [1]. Methanol, however, has many other important uses in today's world. Unleaded gasoline contains methanol, either directly in the fuel or as MTBE, and this use accounts for nearly 10% of methanol consumed in the world. The remaining 40% of methanol is used widely in many fields. Methanol is used as a solvent in the synthesis of pharmaceuticals including vitamins and cholesterol. It is also used as a solvent to extract natural oils from animals and plants. It has further uses in the technological world in the form of antifreezes, as well as a fuel source in blowtorches, barbecues and ovens [2,3].
The main step in the methanol process is methanol synthesis. Methanol synthesis reactors are designed based on two technologies: high-pressure synthesis operating at 300 bar and low-pressure synthesis operating between 50 and 100 bar [4]. The methanol synthesis reactor selected here as a case study is a Lurgi type low pressure reactor [5]. The synthesis gas (CO2, CO, and H2) can be produced through a number of pathways including reforming of natural gas or liquid hydrocarbons, gasification of coal, and in some types of waste-to-energy gasification facilities. Methanol synthesis reactions occur in a set of vertical tubes packed by a CuO-based catalyst. The heat of exothermic reactions is removed from the tubes with boiling water that is recycled as coolant in the shell of the reactor. The operating period of the reactor starts with fresh catalyst and ends at a certain low activity (about 0.4) such that the operation of the reactor at that time is not economic. Catalyst lifetime of the reactor is about four years and after that, the old catalyst must be replaced with a fresh one [6]. Recently, there has been a trend to use reactors in series or parallel combinations. For example, Santacesaria et al. [7] compare different reactor configurations for biodisel production.
The motivation of the current study was to design an efficient reactor configuration for producing methanol from CO2. This is a common problem in process systems engineering where optimal flow sheet structures are sought. There are usually three general approaches to find optimal design configurations:
• The heuristic approach, which relies on intuition and engineering experience and thought. • The physical insight approach, which is based on exploiting basic physical principles. • The optimization approach, which depends on mathematical programming techniques.
The aim of superstructure optimization is to configure a network for generating the desired products from a given feed under the constraints imposed. A superstructure problem consists of the following major steps: 1) the construction of the network structural model; 2) the generation of a nonlinear/

Energies 2009, 2
182
linear mathematical model, and 3) the solution of this model. The method for creating superstructures usually considers (implicitly or explicitly) all possible alternatives so that the rigorous solution of the resultant mathematical model gives rise to a global optimum.
Several studies on methanol processes can be found in the literature. Lange [4] presented a review of methanol synthesis technologies. Lovick [6] studied dynamic modeling and optimization of methanol synthesis reactor and presented an industrial catalyst deactivation model. A review of modeling of methanol reactors can be found in Zahedi et al. [8,9], where we have studied various optimization aspects and also the optimal control of methanol reactors. In spite of the extensive literature on superstructure optimization in chemical reaction engineering, there has been no attempt to find an optimal reactor configuration for producing methanol from CO2. The objective of the current study is to find such a configuration. First a heterogeneous model for a single industrial methanol reactor is developed and validated against industrial plant data. Then various reactor configurations were simulated and based on economic considerations, the optimum reactor network was found. 2. Reactor modeling 2.1. Single reactor modeling
The reactor is Lurgi type fixed bed reactor, which has been studied in our previous works [8-9]. Based on Rezaei et al. [10] there is a small difference between heterogeneous and homogeneous methanol reactor modeling, but noting Heckl et al.’s [11] comments, which encourage the use of a more accurate mathematical model for superstructure design, the heterogeneous model has been employed in this research. In this model, the gradient between the solid and the fluid phases is considered. In addition, axial dispersion is neglected and it is assumed that there is no viscous flow on catalyst pellets and isotherm catalyst pellet. The following equations for the heterogeneous model can be written:
For the solid-phase:
aryykgdt
dyc Biisii
ists ρε +−= )( 1,...,2,1 −= Ni (1)
∑=
Δ−+−=rN
iifiBsfv
spsB HraTTha
dtdTc
1, )()( ρρ (2)
whereas isy and Ts are the solid-phase mole fraction and temperature, respectively. For the fluid-phase:
)( isiitvi
c
titB yykgca
zy
AF
tyc −−
∂∂
−=∂∂ε 1,...,2,1 −= Ni
(3)
)()( TTUAD
TThazT
AF
tTcc shellshell
c
isfv
c
tpgtB −
π+−+
∂∂
−=∂∂
ε (4)
whereas yi and T are the fluid-phase variables. The boundary conditions are:

Energies 2009, 2
183
;0, 00 === zatTTyy ii (5)
The initial conditions are:
;01,,,, ====== tataTTTTyyyy ssss
ssssisis
ssii (6)
where ssiy , ss
isy are profiles of mole fractions and ssT , sssT are temperature profiles along the reactor in
the fluid-phase and the solid-phase, respectively. The industrial reactor is Shiraz petrochemical complex reactor with specifications as listed in Table 1 [12].
Table 1. Design specifications of Shiraz industrial methanol reactor.
Quantity Value Number of tubes [-] 2962 Length of reactor [m] 7.022 Bulk density of bed [kg/m3] 1132 Void fraction of bed [m3/m3] 0.39 Internal radius of tubes [mm] 38 Catalyst diameter [mm] 5.4
2.2. Auxiliary equations
In the methanol synthesis, three overall reactions are possible: hydrogenation of carbon monoxide, hydrogenation of carbon dioxide that is strongly exothermic and reverse water-gas shift reaction:
OHCOHCOOHOHCHHCO
OHCHHCO
222
2322
32
32
+↔++↔+
↔+
The kinetic model and the equilibrium rate constants are selected from Graaf’s studies [13]. 2.3. Simulation
The solution of the steady state model was prepared as a building block for implementing the superstructure design and also to determine the concentrations and temperature profiles. In this case, the reactor bed was discretized into 30 subintervals. The resultant set of ordinary differential equations was solved using the Matlab ode15s solver [14]. The algebraic equations were solved by the “Gauss-Newton” method. The results of the simulation are shown in Figure 1. Table 2 shows validation of the model with the Shiraz methanol reactor using a catalyst deactivation of 0.4. At this deactivation, the process reached steady state conditions. This phenomenon occurs after about 1,100 days of operation.

Energies 2009, 2
184
Figure 1. Variation of methanol (a), carbon dioxide (b), and carbon monoxide (c) mole fractions along the reactor length.
Table 2. Comparison of steady state model and industrial reactor data.
Plant data (ton/day) Model (ton/day) 255.2 250.01
3. Superstructure
The aim of this section is to propose a search methodology for an optimal process flow sheet with no a priori knowledge of the application. This methodology is illustrated on the production of methanol, which is an energy vector of increasing importance. Figure 2 shows different schematics of proposed superstructures. These configurations can be defined by a matrix of 0s and 1s indicating the absence and the presence of a certain reactor at a certain location. An example of such a matrix X is illustrated in Figure 3. A general schematic of the proposed methodology for superstructure optimization is depicted in Figure 4. In this figure, fij represents the fraction of the rate of feed stream in output i which reaches reactor j. This variable is conventionally called “feed allocation ratio”. As different feeds with different compositions and temperatures reach each reactor a new feed with new physical properties is estimated in the physical properties block diagram.
There are various feeds with different compositions and temperatures which reach each reactor. So by writing a mass and energy balance equations at the entrance of the reactor, an equivalent feed stream to all incoming feeds is specified. In fact the physical property box, calculates equivalent entrance stream composition and temperature. As shown in Figure 4 for a specific configuration, the

Energies 2009, 2
185
first column reactor models are solved by a steady state model. The output of the first column is then fed to the next column. As different feed allocation ratios reach each reactor in column two, by applying the physical property estimation module, an equivalent stream composition is estimated. Appling the steady state model again, the output of the next column reactors is obtained. Finally using again the physical properties module and the model module, the output of this specific configuration can be obtained. This procedure is repeated for all configurations and finally by comparing the resulting objective functions, the optimum configuration is found. This is an exhaustive search for the optimal configuration and is possible since the number of possibilities in the present study is not prohibitively large.
Figure 2. Superstructure overview.
Figure 3. Superstructure connection variables.
Figure 4. Proposed algorithm for superstructure optimization.

Energies 2009, 2
186
4. Results and Discussion
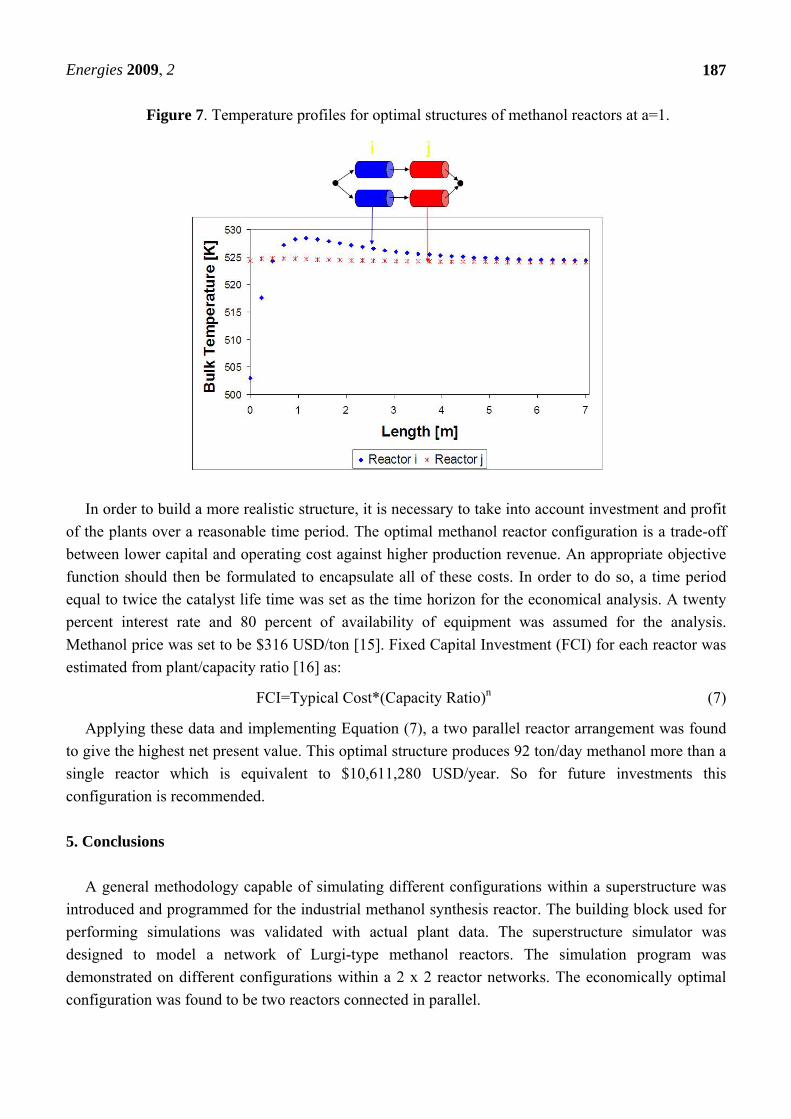
At the first step of optimization, the methanol production has been set as the objective function. Based on this criteria different reactor networks have been examined and the results are shown in Figure 5. Two possibilities are found to be the best configurations: two reactors in series which are parallel with another two reactors in series. The connections of the reactors can be parallel or cross current. Figures 6 and Figures 7 show the variation of methanol flow rate and temperature inside the reactor, respectively.
Figure 5. Methanol yield and MP for different reactor configurations at a=1.
Figure 6. methanol molar flow profiles for optimal configuration at a=1.
Energies 2009, 2
187
Figure 7. Temperature profiles for optimal structures of methanol reactors at a=1.
In order to build a more realistic structure, it is necessary to take into account investment and profit of the plants over a reasonable time period. The optimal methanol reactor configuration is a trade-off between lower capital and operating cost against higher production revenue. An appropriate objective function should then be formulated to encapsulate all of these costs. In order to do so, a time period equal to twice the catalyst life time was set as the time horizon for the economical analysis. A twenty percent interest rate and 80 percent of availability of equipment was assumed for the analysis. Methanol price was set to be $316 USD/ton [15]. Fixed Capital Investment (FCI) for each reactor was estimated from plant/capacity ratio [16] as:
FCI=Typical Cost*(Capacity Ratio)n (7)
Applying these data and implementing Equation (7), a two parallel reactor arrangement was found to give the highest net present value. This optimal structure produces 92 ton/day methanol more than a single reactor which is equivalent to $10,611,280 USD/year. So for future investments this configuration is recommended. 5. Conclusions
A general methodology capable of simulating different configurations within a superstructure was introduced and programmed for the industrial methanol synthesis reactor. The building block used for performing simulations was validated with actual plant data. The superstructure simulator was designed to model a network of Lurgi-type methanol reactors. The simulation program was demonstrated on different configurations within a 2 x 2 reactor networks. The economically optimal configuration was found to be two reactors connected in parallel.

Energies 2009, 2
188
Notation:
Ac [m2r] cross area of each tube
va [m2s.m-3
r] external particle surface area per unit of reactor volume
a [-] activity of catalyst
Pgc [j.mole-1] specific heat of the gas at constant pressure
Psc [j.mole-1] specific heat of the solid at constant pressure
tc [mole.m-3g] total concentration
iD [mr] tube inside diameter
tF [mole.s-1] total molar flow per tube
fh [W.m-2s.K-1] gas-solid heat transfer coefficient
ikg
N Nr
[m.s-1]
mass transfer coefficient for component i number of components number of reactions
R [j.mol-1.K-1] universal gas constant
ir [mole.kg-1s.s-1] reaction rate of component i
T [K] bulk gas phase temperature sT [K] temperature of gas on the solid surface
shellT [K] temperature of boiling water in the shell side
refT [K] reference temperature
t [s] time
shellU [W.m-2r.K-1] boiling water-gas overall heat transfer coefficient
iy [-] bulk gas phase mole fraction for component i s
iy [-] mole fraction of ith component in the solid phase
z [m] axial reactor coordinate
Greek letters: ΔHf,i [j.mol-1]
enthalpy of formation of component i
εB [m3g.m-3
r] void fraction of catalytic bed
εS [m3g.m-3
s] solid particles’ void fraction ρB density ( kg/m3 )
Superscripts and subscripts: 0 inlet conditions
0 initial conditions

Energies 2009, 2
189
References and Notes 1. Kirk-Othmer. Concise Encyclopedia of Chemical Technology; J. Wiley-Interscience: New York,
NY, U.S.A. 1985. 2. Merk, The Merck Index, 13th Edition; John Wiley & Sons, New York, NY, U.S.A., 2001. 3. Methanex. www.methanex.com, 2007 (accessed on April 1st, 2009). 4. Lange, J.P. Methanol synthesis: a short review of technology improvements. Catal. Today 2001,
64, 3-8. 5. Lurgi. Integrated low pressure methanol process; Technical report, Gas Chemie BmbH: Frankfurt
am Main, Germany. 1995. 6. Lovik, I. Modelling, Estimation and Optimization of the Methanol Synthesis with Catalyst
Deactivation. PhD Thesis, Norwegian University of Science and Technology, Trondheim, Norway, 2001.
7. Santacesaria, E.; Tesser, R.; Serio, M.D.; Guida, M.; Gaetano, D.; Garcia Agreda, A.; and Cammarota, F. Comparing Different Reactor Configurations for the Reduction of Free Acidity in raw Materials for Biodisel Production. Ind. Eng. Chem. Res. 2007, 46, 8355-8362.
8. Zahedi, G.; Elkamel, A.; Lohi, A.; Jahanmiri, A.; Rahimpor, M.R. Hybrid model formulation for the unsteady state simulation of a packed bed reactor for CO2 hydrogenation to methanol. Chem. Eng. J. 2005, 115, 113-120.
9. Zahedi, G., Elkamel, A., Lohi, A. Enhancing CO2 Conversion to Methanol Using Dynamic Optimization, Applied on Shell Temperature and Inlet Hydrogen during 4 Years Operation of Methanol Plant. Energy Sources 2007, 29, 1385–1396.
10. Rezaie, N.; Jahanmiri, A.; Moghtaderi, B.; Rahimpour, M.R. A comparison of homogeneous and heterogeneous dynamic models for industrial methanol reactors in the presence of catalyst deactivation. Chem. Eng. Process. 2005, 44, 911–921.
11. Heckl, I.; Kovacs, Z.; Friedler, F.; Fan, L.T.; Liu, J. Algorithmic synthesis of Chemical Engineering and processing an optimal sepration network comprising separators of different classes. Chem. Eng. Process. 2007, 46, 656-665.
12. SPC. Shiraz petrochemical complex methanol reactor long sheet, 2002-2005. 13. Graaf, G.H.; Stamhuis, E.J.; Beenackers, A.A.C.M. Kinetics of low-pressure methanol synthesis.
Chem. Eng. Sci. 1988, 43, 3185-3195. 14. Graaf, G.H.; Scholtens, H.; Stamhuis, E.J.; M.Beenackers, A.A.C. Intra-particle diffusion
limitations in low-pressure methanol synthesis. Chem. Eng. Sci. 1990 45, 773-783. 15. Mathwork. Available online: www.mathwork.com, 2008. 16. Methanex Methanol Price Sheet. Available online: www.methanex.com/products/methanol
price.html, 2005. 17. Peters, M.; Timmerhaus, K. Plant Design and Economics for Chemical Engineers. 4th ed.
McGraw-Hill: New York, NY, U.S.A., 1991.
© 2009 by the authors; licensee Molecular Diversity Preservation International, Basel, Switzerland. This article is an open-access article distributed under the terms and conditions of the Creative Commons Attribution license (http://creativecommons.org/licenses/by/3.0/).
Copyright © 2022 FDOKUMEN