Process Capability Indices for Shape Parameter of Weibull Distribution
Upload
independentCategory
view
1download
0
Journal of Food Engineeting 33 (1997) 11 l- 128 0 1997 Elsevier Science Limited.
All rights reserved. Printed in Great Britain PII: SO260-8774(97)00047-Z 0260-8774/97 $17.00 fO.00
ELSEVIER
Optimal Experimental Design for Estimating Parameters of the Bigelow Model
the Kinetic
Luis M. Cunha, Fernanda A. R. Oliveira,” Teresa R. S. Brand50 & Jorge C. Oliveira
Escola Superior de Biotecnologia, Universidade Cat6lica Portuguesa, Rua Dr. Ant6nio Bernardino de Almeida, 4200 Porto, Portugal
(Received 5 February 1997; accepted 33 June 1997)
ABSTRACT
The optimum experimental design for systems following the Bigelow model was studied by determining the sampling conditions that lead to a minimum confidence region for a number of observations equal to the number of parameters. For isothermal conditions, it was found that this corresponds to the sampling times when the fractional concentration of the decaying factor (vii) is equal to e-’ and that the experiments should be perjormed in the limit range of temperatures chosen. These results are identical to those described in the literature for a first-order Arrhenius model. For non-isothermal experiments with linearly increasing temperature, the optimal experimental design is obtained with a maximum heating rate, a minimum initial temperature and sampling times when the product of the fractional concentrations is e-’ (with nI ~0.70 and n2 E 0.19). The influence of the heating rate on the precision of the estimates is more significant for high z values and the influence of the initial temperature is more significant for low values of the heating rate. 0 1997 Elsevier Science Limited.
NOMENCLATURE
a Hunter colour scale value b Hunter colour scale value D ref Decimal reduction time at a reference temperature Tref (min) DT Decimal reduction time at a given temperature T (min)
*To whom correspondence should be addressed. Fax: (351) 2 590351, E-mail: fernanda@ esb.ucp.pt.
111
112 L. M. Cunha et al.
& F
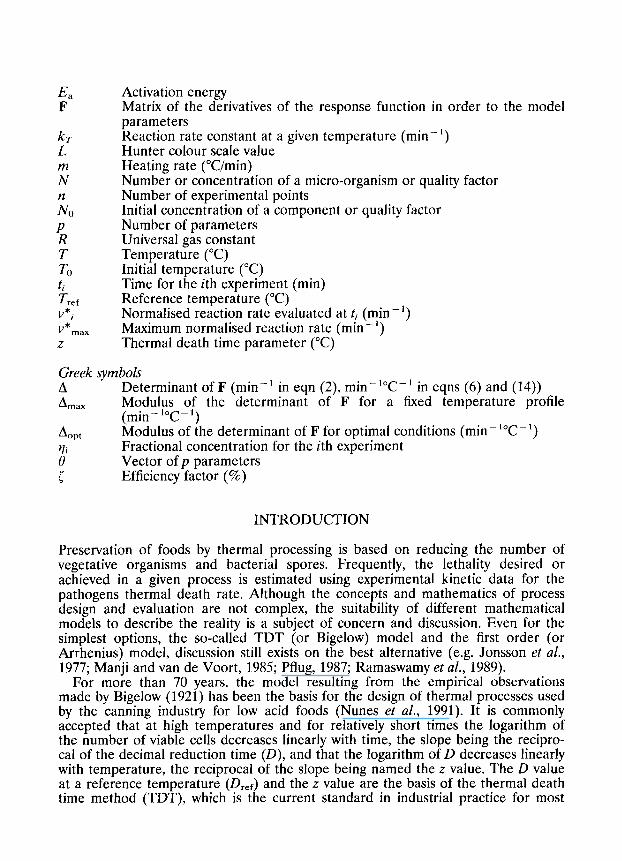
Activation energy Matrix of the derivatives of the response function in order to the model parameters
b- L
;
& P R T TO ti T ref v*;
* v max
z
Reaction rate constant at a given temperature (min-‘) Hunter colour scale value Heating rate (“C/min) Number or concentration of a micro-organism or quality factor Number of experimental points Initial concentration of a component or quality factor Number of parameters Universal gas constant Temperature (“C) Initial temperature (“C) Time for the ith experiment (min) Reference temperature (“C) Normalised reaction rate evaluated at tj (min-‘) Maximum normalised reaction rate (min - ‘) Thermal death time parameter (“C)
Greek symbols A Determinant of F (min-’ in eqn (2), min-‘“C-’ in eqns (6) and (14)) A max Modulus of the determinant of F for a fixed temperature profile
( min-‘“C-‘) A opt Modulus of the determinant of F for optimal conditions (min-‘“C-‘)
;3’ Fractional concentration for the ith experiment Vector of p parameters
i Efficiency factor (%)
INTRODUCTION
Preservation of foods by thermal processing is based on reducing the number of vegetative organisms and bacterial spores. Frequently, the lethality desired or achieved in a given process is estimated using experimental kinetic data for the pathogens thermal death rate. Although the concepts and mathematics of process design and evaluation are not complex, the suitability of different mathematical models to describe the reality is a subject of concern and discussion. Even for the simplest options, the so-called TDT (or Bigelow) model and the first order (or Arrhenius) model, discussion still exists on the best alternative (e.g. Jonsson et al., 1977; Manji and van de Voort, 198.5; Pflug, 1987; Ramaswamy et al., 1989).
For more than 70 years, the model resulting from the empirical observations made by Bigelow (1921) has been the basis for the design of thermal processes used by the canning industry for low acid foods (Nunes et al., 1991). It is commonly accepted that at high temperatures and for relatively short times the logarithm of the number of viable cells decreases linearly with time, the slope being the recipro- cal of the decimal reduction time (D), and that the logarithm of D decreases linearly with temperature, the reciprocal of the slope being named the z value. The D value at a reference temperature (D& and the z value are the basis of the thermal death time method (TDT), which is the current standard in industrial practice for most
Optimal design of experiments for the Bigelow model 113
sterilisation processes (Nunes et al., 1991). Assessment of quality loss in thermally processed foods has involved in many cases the application of a similar kinetic model for quality indicators (e.g. Shin and Bhowmik (1995) have used this model to describe kinetics of colour change in pea puree).
The kinetic parameters of the mathematical models are estimated by regression of experimental data obtained in most cases with isothermal experiments. The use of non-isothermal methods was first introduced by Rogers (1963) and was reported for the study of reaction kinetics (Rhim et al., 1989a; Nunes et al., 1991) and for the kinetics of colour change (Rhim et al., 1989b). These methods have significant advantages: minimisation of experimental requirements, overcoming thermal lag problems and providing a dynamic situation closer to the reality of most thermal processes. In all cases cited above a first-order rate with an Arrhenius type depend- ency on temperature was considered. Linear temperature profiles are the most common because they are very easy to obtain experimentally. The Arrhenius equa- tion considers an exponential variation of the rate constant with the reciprocal of temperature and this eventually leads to an integral that does not have an exact analytical solution (Rhim et al., 1989a). This is a clear drawback of the method, as the error introduced by either approximate analytical solutions or by numerical resolution of the integral impairs the accuracy of the regression. Curiously, the Bigelow model would not have this problem, as the integration of the process equation when the rate constant varies exponentially with temperature (instead of its reciprocal) is straightforward (Miles and Mackey, 1994). Moreira et al. (1993) have compared isothermal and non-isothermal methods for estimation of mass diffusion kinetics with an Arrhenius type temperature dependency, using numerical integration.
The estimation of kinetic parameters from experimental data involves the applica- tion of statistical methods in two phases: experimental design and data analysis. Although much more emphasis is often put on the latter, one should real&e that the general value of the information contained in the data is actually established when the experiment is designed and even a very careful data analysis is unable to recover information that is not present in the data (Bates and Watts, 1988). As Lenz and Lund (1980) stressed, much of the data currently found in the literature could have been obtained with considerable less effort by proper choice of experimental condi- tions. Furthermore, the quality of the experimental data greatly determines the quality of the parameters obtained in terms of precision and accuracy. This is of utmost importance if microbiological or chemical model parameters are then used in process design or assessment (Van Boekel, 1996).
Box and Lucas (1959) proposed an optimum design criterion for nonlinear models, based on establishing the sampling conditions that lead to a minimum confidence region, for a standard situation of a number of observations (n) equal to the number of parameters (p), which is also known as the D-optimal design (Bates and Watts, 1988). This criterion was applied to a first order model with Arrhenius temperature dependency at isothermal conditions (Box and Lucas, 1959) and to diffusional processes with an Arrhenius temperature dependency at non-isothermal conditions (Oliveira et al., 1995).
The main objective of this work was to establish the experimental conditions corresponding to the D-optimal design for systems described by the Bigelow model for both isothermal and non-isothermal experimental plans.
114 L. hf. Cunha et al.
MATHEMATICAL METHODS
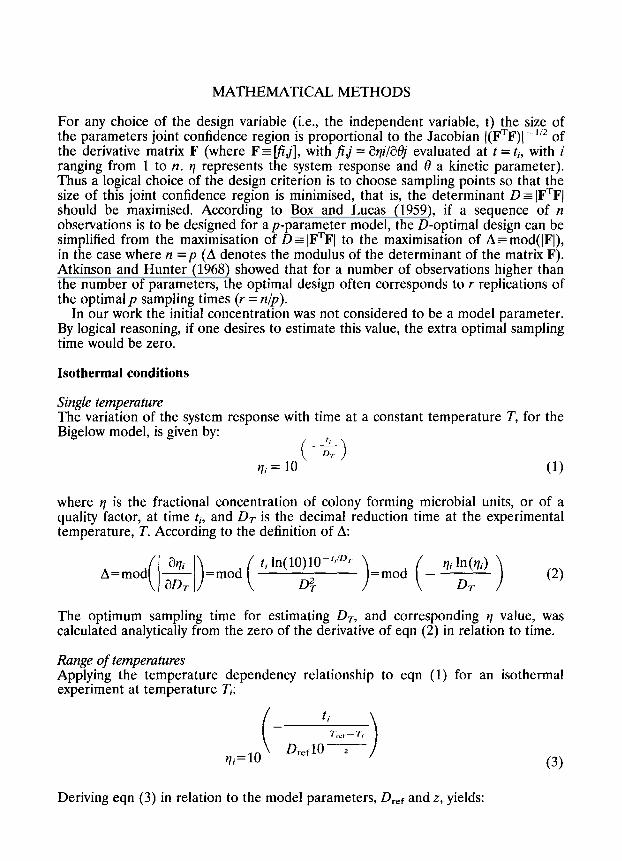
For any choice of the design variable (i.e., the independent variable, t) the size of the parameters joint confidence region is proportional to the Jacobian ((FTF)(-“* of the derivative matrix F (where Fr V;j], with fij = i3r$/aOj evaluated at t = ti, with i ranging from 1 to IZ. q represents the system response and 8 a kinetic parameter). Thus a logical choice of the design criterion is to choose sampling points so that the size of this joint confidence region is minimised, that is, the determinant o=lFTFl should be maximised. According to Box and Lucas (1959), if a sequence of 12 observations is to be designed for a p-parameter model, the D-optimal design can be simplified from the maximisation of D = lFTFl to the maximisation of A =mod(lFI), in the case where it =p (A denotes the modulus of the determinant of the matrix F). Atkinson and Hunter (1968) showed that for a number of observations higher than the number of parameters, the optimal design often corresponds to r replications of the optimal p sampling times (r = nip).
In our work the initial concentration was not considered to be a model parameter. By logical reasoning, if one desires to estimate this value, the extra optimal sampling time would be zero.
Isothermal conditions
Single temperature The variation of the system response with time at a constant temperature T, for the Bigelow model, is given by:
rl,= I$% I (1)
where q is the fractional concentration of colony forming microbial units, or of a quality factor, at time ti, and DT is the decimal reduction time at the experimental temperature, T. According to the definition of A:
Azmod( l$l)cmod ( tiln(lo)$fr’D” )=mod (_ rli ;r”’ ) (2)
The optimum sampling time for estimating &, and corresponding rl value, was calculated analytically from the zero of the derivative of eqn (2) in relation to time.
Range of temperatures Applying the temperature dependency relationship to eqn (1) for an isothermal experiment at temperature T;:
(3)
Deriving eqn (3) in relation to the model parameters, Dref and z, yields:

115 Optimal design of experiments for the Bigelow model
i
t; Tref - Ti T,c,-T, -
ti ln(10) 10 D,,flO - 2
arli I
-= = _ VI; ln(qi)
Wt?f DL &f (4)
t; Tref - T, - T,,, -r, - 2
arli tiln(10)2 10 Dref10 7 I
-= a.2 &fZ2
(T,,,- T)
(5)
From eqns (4) and (5) the determinant A was built for two sampling times, t, and t2, the former being the sampling time for one experiment at T, and the latter for one experiment at T2. For the sake of simplification, A is indicated in terms of ye, and q2:-
A=mod
@I @I - _ 8Dref a2
= mod 91 lrWr12 ln(q2)ln(10)
aq2 aq2 &2fZ2 V-T,) (6)
- _ aDref a2
The maximum value of A can be obtained by calculating analytically the zero values of the derivatives of eqn (6) in order to ql and q2, or by finding the conditions that maximise mod(T,- T,), mod(~,ln(~,)) and mod(~21n(~2)) simultaneously.
Non-isothermal conditions
Non-isothermal kinetic models are based on three equations: (i) the rate of reaction, (ii) the temperature dependency of the kinetic parameters, and (iii) the time- temperature relationship (Rhim et al., 1989a). For a constant heating rate, m, the latter is:
T(t) = To+mt (7)
where T,, is the initial temperature. The process equation becomes:
Solving the integral analytically and rearranging:
116 L. M. Cunha et al.
i
2
rj;= 10 - Drefm In (10)
l$?! [ 1”‘1_1]}
(9)
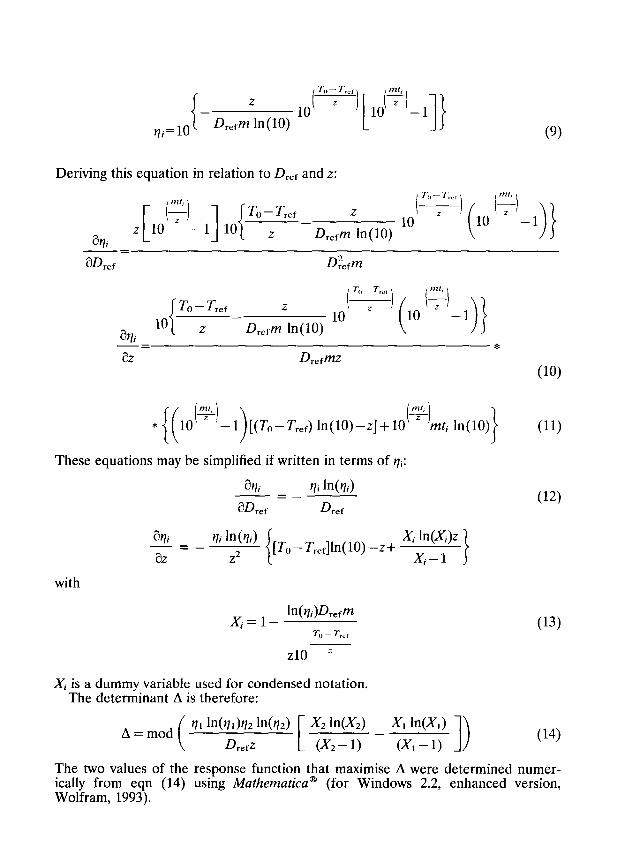
Deriving this equation in relation to Dref and z:
avli - Drefm ln(lO)
* {(l~~‘-l)[~To-T,.efJ ln(lO)--z]+lO@/mt hr(lO)~ (11)
These equations may be simplified if written in terms of vi:
avli Vi ln(uri) -=-
a&f D ref
arli vi In (4) -=- a2 z2
[To - T,,f]ln(lO) -z+ x$n!:)z I
with
X;=l- ln(rli)D,,fm
(12)
(13)
ZlO =
Xi is a dummy variable used for condensed notation. The determinant A is therefore:
A=mod (
VI Wdr12W2> X2WX2)
DrefZ [
X1 ln(&>
(X2-1) - (X1-1) (14)
The two values of the response function that maximise A were determined numer- ically from eqn (14) using Mathematics@ (for Windows 2.2, enhanced version, Wolfram, 1993).

Optimal design of experiments for the Bigelow model 117
RESULTS AND DISCUSSION
Optimal design for isothermal conditions
Single temperature The optimal sampling conditions obtained from eqn (2) are:
DT t= -; q=e-’
In( 10) (15)
Thus, the best design will be to take a sample at the time when the concentration is 36.8% of the initial value. These results are identical to those obtained by Box and Lucas (1959) for a first order decay model, considering the relationship between DT and the reaction rate, kT, of the first-order model (Ramaswamy et al., 1989):
In( 10) DT= ___
kT (16)
Temperature range From eqn (6) for a range of temperatures, A is maximised when mod(T*- T,) is maximum (T, and T2 are the limits of the temperature range considered) and ql and q2 are both e- ’ at the respective temperature (that is, the sampling times at temperatures T, and T2 are such that the concentration has decreased to 36.8% in both cases). These results are evident from eqn (6) and the previous result for a single temperature.
Considering the relationship between the z-value and the activation energy, E,, of the Arrhenius model (z = RTTJn( 10)/E,, Ramaswamy et al., 1989) and the relation between DT and kT expressed by eqn (16) it can be seen that the sampling times for a system following the Bigelow model over a range of temperatures are identical to the sampling times obtained by Box and Lucas (1959) for the optimal design of a system following the first-order decay model with an Arrhenius relationship.
Optimal design for non-isothermal conditions
As the complexity of eqn (14) prevented a direct analytical solution, the optimal design for the non-isothermal Bigelow model was numerically computed for dif- ferent sets of the parameters Dref and z. The q, and Q values that maximised A were determined for different values of the heating rate, m and of the initial temperature, T,,. It was found that, for all conditions, the value of A increased with the heating rate and decreased with the initial temperature, up to a given limit. The values of m and To beyond which there was no significant increase in the value of A were considered to be the mathematically optimum conditions, regardless of their physi- cal realisability, and the corresponding value of A will be named Aopt.
For these optimal conditions we have then found that for all the situations tested the sampling times t, and t2 were such that the fractional concentrations had exactly the same values. This solution of the optimisation problem was a pair of irrational numbers: vi = 0.70322 . . . and q2 = 0.19245 . . . . It was necessary to establish mathe-
118 L. I’M Cunha et al.
matically if these would be the solutions for all possible combinations of the system parameters. When the solution of an optimisational problem (zero of a derivative) is irrational, it is sometimes possible to find simple implicit equations that character- ise the solution. By mathematical manipulations, we found that all pairs of ye, and y12 values that verify the system:
are solutions of the equation obtained by finding the zero of the derivative of eqn (14) in relation to time (this can be verified by replacing eqns (17) and (18) in eqn (14)). It is noteworthy that eqn (17) expresses that the two samplmg. pomts are symmetrical in a logarithmic scale in relation to e -’ (the optimum samphng time for a constant temperature).The feasibility of the optimal experimental design thus obtained needed careful consideration, as the values of m and To may be outside reasonable limits. Table 1 shows the results obtained for To = 20°C and it can clearly be seen that the optimal experimental design may lead to sampling times that are too small and heating rates that are too high to be physically feasible, although the choice of 7’,, is much more favourable than what could be used in microbial death kinetics.
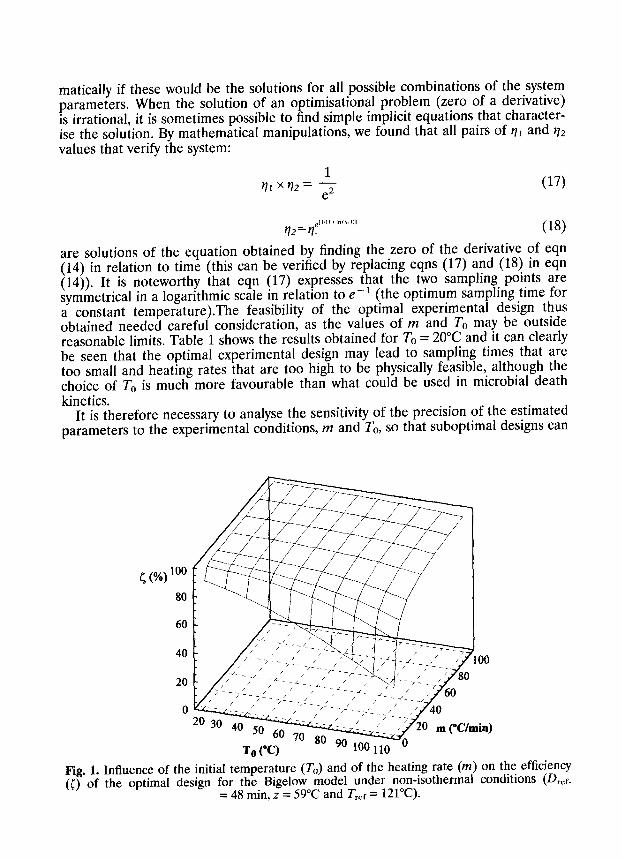
It is therefore necessary to analyse the sensitivity of the precision of the estimated parameters to the experimental conditions, m and T o, so that suboptimal designs can
80
60
40
Fig. 1. Influence of the initial temperature (TO) and of the heating rate (m) on the efficiency ([) of the optimal design for the Bigelow model under non-isothermal conditions (Dref_
= 48 min, z = 59°C and Tref = 121°C).
Optimal design of experiments for the Bigelow model 119
60 -
__ = (“Cl
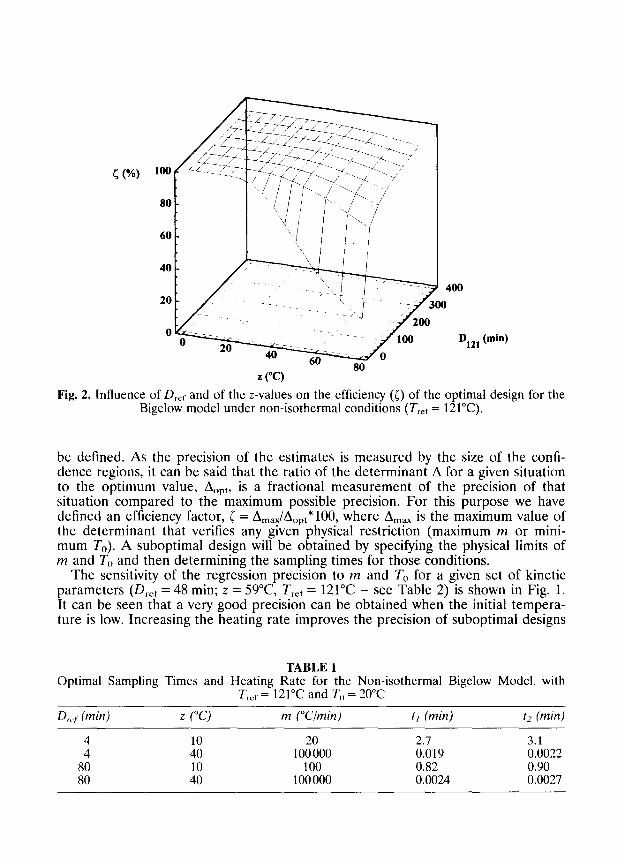
Fig. 2. Influence of Dref and of the z-values on the efficiency (0 of the optimal design for Bigelow model under non-isothermal conditions (Tref = 121°C).
the
be defined. As the precision of the estimates is measured by the size of the confi- dence regions, it can be said that the ratio of the determinant A for a given situation to the optimum value, A (,rt, is a fractional measurement of the precision of that situation compared to the maximum possible precision. For this purpose we have defined an efficiency factor, < = Amax/Aopt *lOO, where AmaX is the maximum value of the determinant that verifies any given physical restriction (maximum m or mini- mum 7’“). A suboptimal design will be obtained by specifying the physical limits of m and T,, and then determining the sampling times for those conditions.
The sensitivity of the regression precision to m and To for a given set of kinetic parameters (Dref = 48 min; z = 59°C Trer = 121°C - see Table 2) is shown in Fig. 1. It can be seen that a very good precision can be obtained when the initial tempera- ture is low. Increasing the heating rate improves the precision of suboptimal designs
TABLE 1 Optimal Sampling Times and Heating Rate for the Non-isothermal Bigelow Model, with
Tref = 121°C and 7’,, = 20°C
D,, (min) z (“CJ m (“Cimin) tl (min) t2 (mm)
: :: 100000 20 2.7 0.019 3.1 0.0022 80 10 100 0.82 0.90 80 40 100000 0.0024 0.0027
120 L. M. Cunha et al.
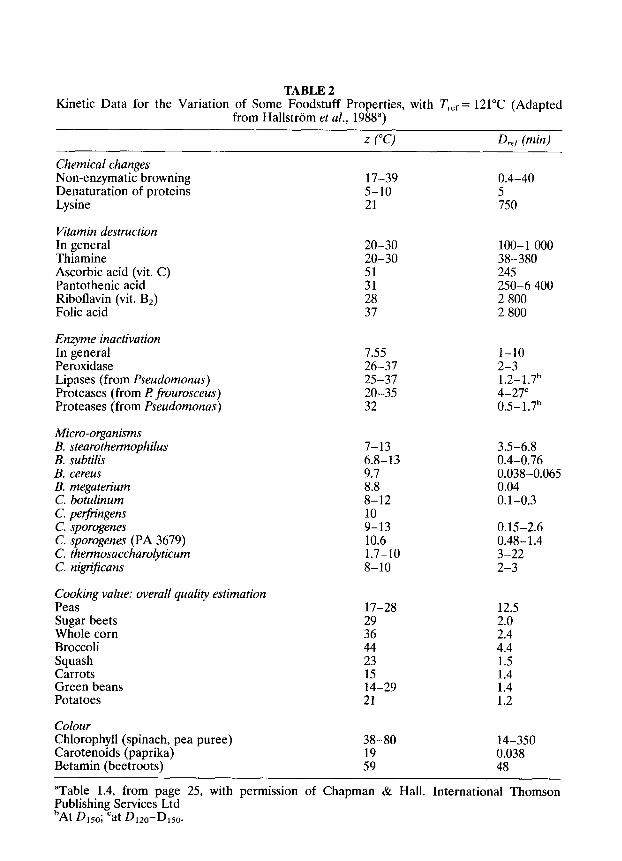
TABLE 2 Kinetic Data for the Variation of Some Foodstuff Properties, with Tref = 121°C (Adapted
from Hallstrom et al., 1988”)
2 (“C) D,t (min)
Chemical changes Non-enzymatic browning Denaturation of proteins Lysine
Vitamin destruction In general Thiamine Ascorbic acid (vit. C) Pantothenic acid Riboflavin (vit. B,) Folic acid
Enzyme inactivation In general Peroxidase Lipases (from Pseudomonas) Proteases (from p frourosceus) Proteases (from Pseudomonas)
Micro-organisms B. stearothetmophilus B. subtilis B. cereus B. megaterium C. botulinurn C. perfiingens C. sporogenes C. sporogenes (PA 3679) C. thermosaccharolyticum C. nigrtficans
Cooking value: overall quality estimation Peas Sugar beets Whole corn Broccoli Squash Carrots Green beans Potatoes
Colour Chlorophyll (spinach, pea puree) Carotenoids (paprika) Betamin (beetroots)
17-39 5-10 21
20-30 20-30
:: 28 37
7.55 l-10 26-37 2-3 25-37 1.2-1.7’ 20-35 4-27’ 32 0.5-1.7b
7-13 6.8-13 9.7 8.8 8-12 10 9-13 10.6 1.7-10 8-10
17-28 12.5
32: i.40 44 4:4 23 1.5
:i29 :.t 21 1:2
38-80
:99
0.4-40 5 750
100-l 000 38-380 245 250-6 400 2 800 2 800
3.5-6.8 0.4-0.76 0.038-0.065 0.04 0.1-0.3
0.15-2.6 0.48-1.4 3-22 2-3
14-350 0.038 48
“Table 1.4, from page 25, with permission of Chapman & Hall. International Thomson Publishing Services Ltd bAt D 150; ‘at DIZO-~~.

Optimal design qf experiments for the Bigelow model 121
significantly, but for high initial temperatures very high heating rates would be required, which can only be achieved in special equipment (such as a thermo- resistometer). The effect of the kinetic parameters on the sensitivity is shown in Fig. 2, for a given set of experimental conditions (m = l”C/min, T,, = 20°C). It can be seen that for a low initial temperature high precisions are obtained in virtually every range of Dref and z. of interest, as the efficiency of the suboptimal design only decreases in the area where z is very high and Dref is low, but this does not occur in food processing: quality factors have high z but also high Dref while micro-organisms show low Drtlf, but low z as well. The magnitude of kinetic parameters found in literature is shown in Table 2, from the values collected by HallstrGm et al. (1988). It can be concluded that the efficiency of the suboptimal design needs to be con- sidered only if there is a restriction on the initial temperature, either because the model does not apply at low temperatures (which is the obvious case of microbial thermal death), or because the heating medium cannot be initiated at a low tem- perature (this is the case of thermostatic oil baths).
It should be stressed that the choice of the reference temperature does not show any effect on the optimal design.
Reaction rate concept
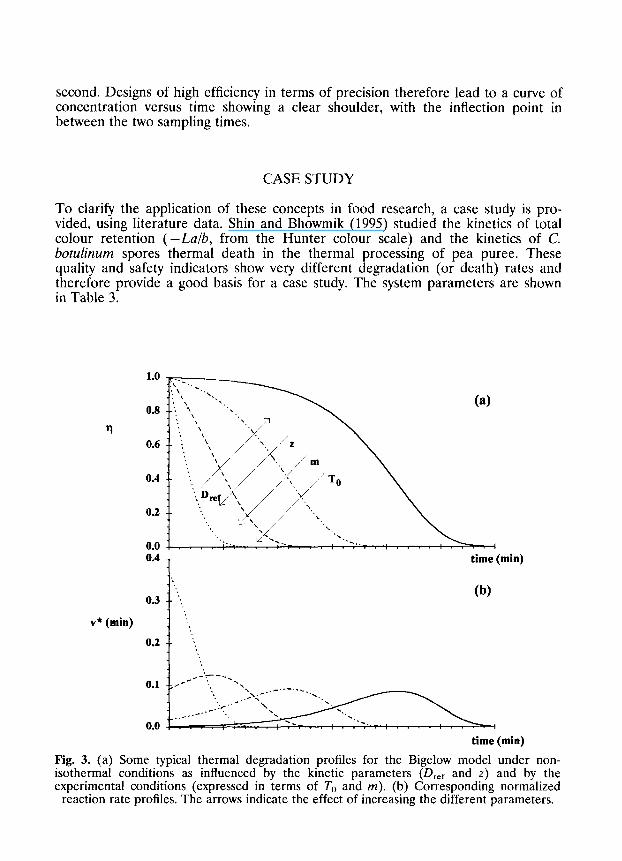
The thermal degradation rate is influenced by the kinetic parameters (Dref and z) and by the experimental conditions (T,, and m). Figure 3(a) shows the kinetic patterns for generic values of these four parameters and indicates the influence of each parameter on the curve. Evidently the shape of this curve is directly influenced by the changes on the rate of thermal degradation. To study if optimal and sub- optimal designs implied any given type of shape, the reaction rate was calculated from the model equations:
7;D- 7‘ III
-10 i mt, + r,, - T,,, 2 1 -1 z - 10
z 2 Drcfm ln( 10)
where v*; is the reaction rate at the sampling time t,. Figure 3(b) represents the reaction rates corresponding to the curves of Fig. 3(a), showing that there is a maximum rate at the time where the decay curve has an inflection point.
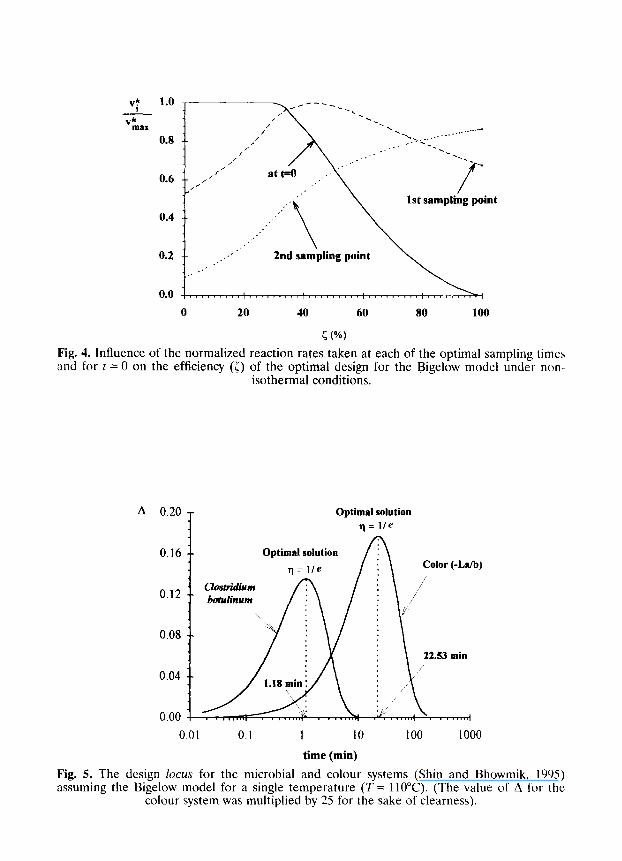
Figure 4 shows the initial reaction rate and the reaction rates of the two sub- optimal sampling times for several designs, normalised with the maximum reaction rate in each case, so that all designs fall in the same curves. It can be seen that sampling designs of high efficiency have low initial reaction rates and that the reaction rate of the first sampling point is lower than that of the second sampling point. In these cases (< > 80%), the maximum reaction rate occurs between the two sampling points. Situations where the initial reaction rate is high have very low design efficiencies and the first sampling point has a higher reaction rate than the
122 L.. M. Cunha et al.
second. Designs of high efficiency in terms of precision therefore lead to a curve of concentration versus time showing a clear shoulder, with the inflection point in between the two sampling times.
CASE STUDY
To clarify the application of these concepts in food research, a case study is pro- vided, using literature data. Shin and Bhowmik (1995) studied the kinetics of total colour retention (-La/b, from the Hunter colour scale) and the kinetics of C. botulinurn spores thermal death in the thermal processing of pea puree. These quality and safety indicators show very different degradation (or death) rates and therefore provide a good basis for a case study. The system parameters are shown in Table 3.
0.8
rl 0.6
0.3
v* (min)
0.2
0.1
0.0
(4
time (min)
time (min)
Fig. 3. (a) Some typical thermal degradation profiles for the Bigelow model under non- isothermal conditions as influenced by the kinetic parameters (Dref and z) and by the experimental conditions (expressed in terms of To and m). (b) Corresponding normalized
reaction rate profiles. The arrows indicate the effect of increasing the different parameters.
Optimal design of experiments for the Bigelow model 123
v* 1.0 I
vklx 0.8
0.6
0.4
0.2
0.0
0 20 40 60 80 100
r (%I
Fig. 4. Influence of the normalized reaction rates taken at each of the optimal sampling times and for t = 0 on the efficiency (0 of the optimal design for the Bigelow model under non-
isothermal conditions.
A 0.20
T
Optimal solution q=1/e
0.16
0.12
0.08
0.04
0.00
Clabirlium botulinum
0.01 0.1 1 10
time (mitt)
100 1000
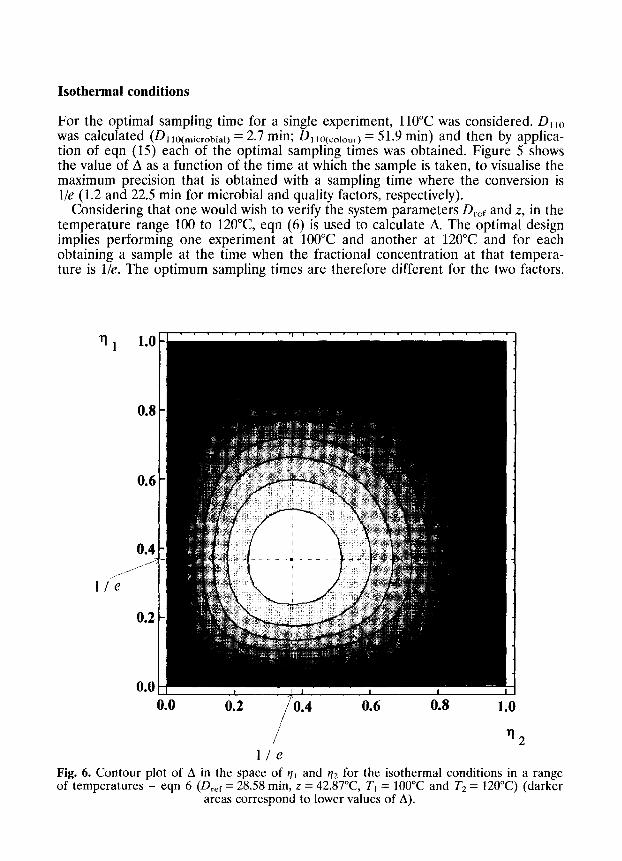
Fig. 5. The design locus for the microbial and colour systems (Shin and Bhowmik, 1995) assuming the Bigelow model for a single temperature (T = 110°C). (The value of A for the
colour system was multiplied by 25 for the sake of clearness).
124 L. A4. Cunha et al.
Isothermal conditions
For the optimal sampling time for a single experiment, 110°C was considered. Dllo was calculated (0, r0(microbiar) = 2.7 min; D, 10(colourj = 51.9 min) and then by applica- tion of eqn (15) each of the optimal sampling times was obtained. Figure 5 shows the value of A as a function of the time at which the sample is taken, to visualise the maximum precision that is obtained with a sampling time where the conversion is l/e (1.2 and 22.5 min for microbial and quality factors, respectively).
Considering that one would wish to verify the system parameters Dref and z, in the temperature range 100 to 120°C eqn (6) is used to calculate A. The optimal design implies performing one experiment at 100°C and another at 120°C and for each obtaining a sample at the time when the fractional concentration at that tempera- ture is l/e. The optimum sampling times are therefore different for the two factors.
0.8
0.6
0.4 _A ,/
1 1-2
0.2
0.0 0.0 0.2 '0.4
/ 0.6 0.8 1.0
/ t12 lie
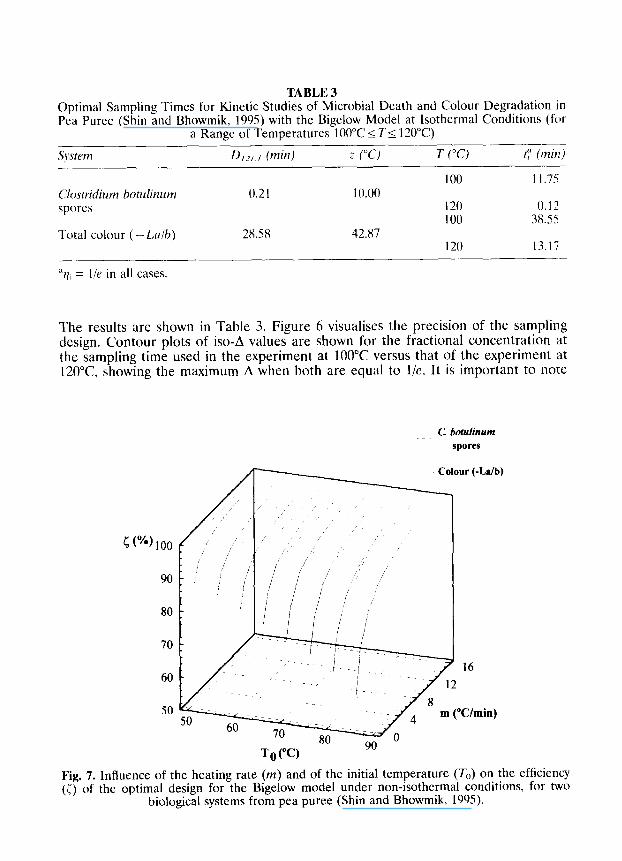
Fig. 6. Contour plot of A in the space of q, and q2 for the isothermal conditions in a range of temperatures - eqn 6 (Dref = 28.58 min, z = 42.87”C, T, = 100°C and T2 = 120°C) (darker
areas correspond to lower values of A).
Optimal design Qf experiments for the Bigelow model 125
TABLE 3 Optimal Sampling Times for Kinetic Studies of Microbial Death and Colour Degradation in Pea Puree (Shin and Bhowmik, 1995) with the Bigelow Model at Isothermal Conditions (for
a Range of Temperatures 100°C < T i 120°C) --
System D I>) I OW 2 (“CI T (“C) t:’ (mir!) -
100 1 I .75 Clustridium hotulinum 0.21 10.00 spores 120 0.12
100 38.55 Total colour (-La/h) 28.58 42.87
120 13.15 -
“11, = l/e in all cases.
The results are shown in Table 3. Figure 6 visualises the precision of the sampling design. Contour plots of iso-A values are shown for the fractional concentration at the sampling time used in the experiment at 100°C versus that of the experiment at 120°C showing the maximum A when both are equal to l/e. It is important to note
C botulinurn
spores
60
Colour (-La/b)
16
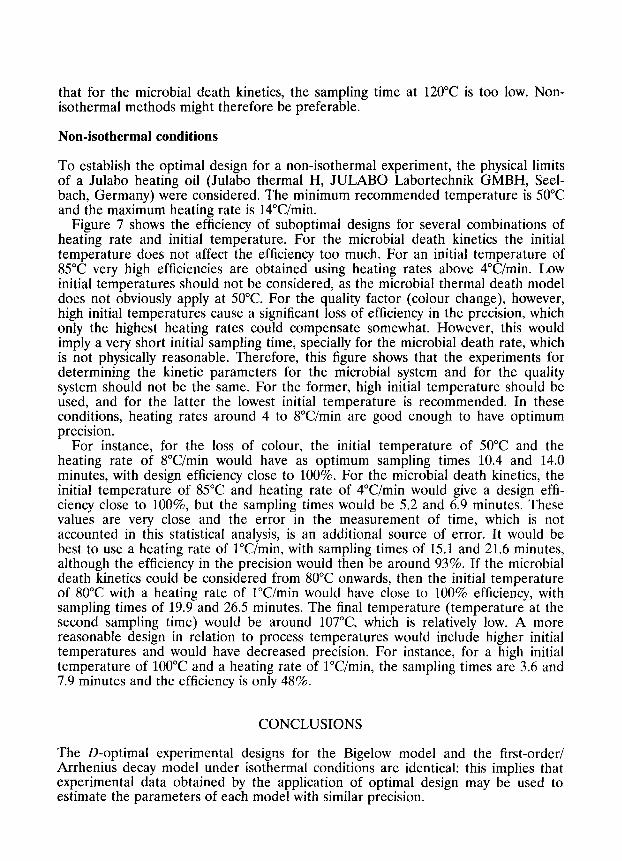
Fig. 7. Influence of the heating rate (m) and of the initial temperature (T,) on the efficiency (<) of the optimal design for the Bigelow model under non-isothermal conditions, for two
biological systems from pea puree (Shin and Bhowmik, 1995).
126 L. A4. Cunha et al.
that for the microbial death kinetics, the sampling time at 120°C is too low. Non- isothermal methods might therefore be preferable.
Non-isothermal conditions
To establish the optimal design for a non-isothermal experiment, the physical limits of a Julabo heating oil (Julabo thermal H, JULABO Labortechnik GMBH, Seel- bath, Germany) were considered. The minimum recommended temperature is 50°C and the maximum heating rate is lCC/min.
Figure 7 shows the efficiency of suboptimal designs for several combinations of heating rate and initial temperature. For the microbial death kinetics the initial temperature does not affect the efficiency too much. For an initial temperature of 85°C very high efficiencies are obtained using heating rates above 4Wmin. Low initial temperatures should not be considered, as the microbial thermal death model does not obviously apply at 50°C. For the quality factor (colour change), however, high initial temperatures cause a significant loss of efficiency in the precision, which only the highest heating rates could compensate somewhat. However, this would imply a very short initial sampling time, specially for the microbial death rate, which is not physically reasonable. Therefore, this figure shows that the experiments for determining the kinetic parameters for the microbial system and for the quality system should not be the same. For the former, high initial temperature should be used, and for the latter the lowest initial temperature is recommended. In these conditions, heating rates around 4 to 8”C/min are good enough to have optimum precision.
For instance, for the loss of colour, the initial temperature of 50°C and the heating rate of 8”C/min would have as optimum sampling times 10.4 and 14.0 minutes, with design efficiency close to 100%. For the microbial death kinetics, the initial temperature of 85°C and heating rate of 4”C/min would give a design effi- ciency close to lOO%, but the sampling times would be 5.2 and 6.9 minutes. These values are very close and the error in the measurement of time, which is not accounted in this statistical analysis, is an additional source of error. It would be best to use a heating rate of l”C/min, with sampling times of 15.1 and 21.6 minutes, although the efficiency in the precision would then be around 93%. If the microbial death kinetics could be considered from 80°C onwards, then the initial temperature of 80°C with a heating rate of l”C/min would have close to 100% efficiency, with sampling times of 19.9 and 26.5 minutes. The final temperature (temperature at the second sampling time) would be around 107°C which is relatively low. A more reasonable design in relation to process temperatures would include higher initial temperatures and would have decreased precision. For instance, for a high initial temperature of 100°C and a heating rate of l”C/min, the sampling times are 3.6 and 7.9 minutes and the efficiency is only 48%.
CONCLUSIONS
The D-optimal experimental designs for the Bigelow model and the first-order/ Arrhenius decay model under isothermal conditions are identical: this implies that experimental data obtained by the application of optimal design may be used to estimate the parameters of each model with similar precision.
Optimal design of experiments for the Bigelow model 127
Non-isothermal experiments using linearly increasing temperature histories should be started at the lowest possible temperature and use the highest possible heating rate. This is particularly important if the reaction under study has a low sensitivity to temperature (high z-values). When high heating rates may be applied, the effect of the initial temperature becomes less important.
High efficiencies of the precision (above 80% of the maximum possible precision, quantified in terms of the size of the confidence region) imply a low initial reaction rate and that the maximum reaction rate occurs between the two sampling points.
These conclusions should not be generalised for other kinetics. It is curious to note, for instance, that in a similar study conducted for diffusional processes where the influence of the temperature in the mass transfer rate is much lower, optimal results were obtained at intermediate heating rates, with both high and low heating rates decreasing the design efficiency (Oliveira et al., 1995).
ACKNOWLEDGEMENTS
The first and third authors acknowledge Junta National de Investigacao Cientifica e Tecnologica (JNICT) for financial support through ‘Sub-Programa Ciencia e Tecno- logia do 2” Quadro Comunitario de Apoio’. The authors acknowledge financial support from EU project AIRl-CT92-0746. We thank Jesus M. Frias for his valu- able suggestions and advice.
REFERENCES
Atkinson, A. C. & Hunter, W. G. (1968). The design of experiments for parameter estima- tion. Technomettics, 10, 27 l-289.
Bates, D. M. and Watts, D. G. (1988). Nonlinear Regression Analysis and Its Applications, pp. 121-127. Wiley, New York.
Bigelow, W. D. (1921). The logarithmic nature of thermal death time curves. J. Znfect. [Iis., 29,528-536.
Box, G. E. P. & Lucas, H. L. (1959). Design of experiments for non-linear situations. Biometrika, 46, V-90.
Hallstrom, B., Skjoldebrand, C.. Tragardh, C. (1988). Heat Transfer and Food Products. Elsevier Applied Science, London.
Jonsson, U., Snygg, B. G., Harnulv, B. G. & Zacrisson, T. (1977). Testing two models for the temperature dependence of the heat inactivation rate of Bacillus stearothermophilus spores. J. Food Sci., 42, 125 1 - 1252. (And p. 1263)
Lenz, M. K. & Lund, D. B. (1980). Experimental procedures for determining destruction kinetics of food components. Food Technol., 34, 5 l-55.
Manji, B. & van de Voort, F. R. (1985). Comparison of two models for process holding time calculations: convection system. J. Food Protect., 48, 359-363.
Miles, C. A. & Mackey, B. M. (1994). A mathematical analysis of microbial inactivation at linearly rising temperatures: calculation of the temperature rise needed to kill Listeria monocytogenes in different foods and methods for dynamic measurements of D and z values. .I. Appl. Bacten’ol., 77, 14-20.
Moreira, L. A., Oliveira, F. A. R., Silva, T. R. & Oliveira, J.C. (1993). Development of a non- isothermal method for determination of diffusional parameters. Znt. J. Food Sci. Technol.. 28,575-586.
Nunes, R. V., Rhim, J. W. & Swartzel, K. R. (1991). Kinetic parameter evaluation with linearly increasing temperature profiles: integral methods. J. Food Sci., 56, 1433-1437.
128 L. M. Cunha et al.
Oliveira, F. A. R., Silva, T. R. and Oliveira, J. C. (1995). Optimal experimental design for estimation of mass diffusion parameters using non-isothermal conditions. In Proceedings of the First International Symposium on Mathematical Modelling and Simulation in Agn’culture & Bio-Industries of IMACSIIFAC, 9-12 May 1995, Brussels, Belgium.
Pflug, I. J. (1987). Using the straight-line semilogarithmic microbial destruction models as an engineering design model for determining the F-value for heat processes. J. Food Protect., 50,342
Ramaswamy, H. S., van de Voort, F. R. & Ghazala, S. (1989). An analysis of TDT and Arrhenius methods for handling process and kinetic data. J. Food Sci., 54, 1322-1326.
Rhim, J. W., Nunes, R. V., Jones, V. A. & Swartzel, K. R. (1989). Determination of kinetic parameters using linearly increasing temperatures. J. Food Sci., 54, 446-450.
Rhim, J. W., Nunes, R. V., Jones, V. A. & Swartzel, K. R. (1989). Kinetics of color change of grape juice generated using linearly increasing temperatures. J. Food Sci., 54, 776-777.
Rogers, A. R. (1963). An accelerated storage test with programmed temperature rise. J. Pharm. Pharmacol., 15, lOlT-105T. (Supplement, Transactions of the British Pharma- ceutical Conference, Centenary Meeting London.)
Shin, S. & Bhowmik, S. R. (1995). Thermal kinetics of color changes in pea puree. J. Food Eng., 24, 77-86.
Van Boekel, M. A. J. S. (1996). Statistical aspects of kinetic modeling for food science problems. .I. Food Sci., 61,477-485. (And p. 489)
Wolfram, S. (1993). Mathematics. A System for Doing Mathematics by Computer, 2nd edn, pp. 703-704, 794. Addison-Wesley, Reading, MA.
Copyright © 2022 FDOKUMEN