OPERATING SMARTER FOCUS: - De Beers Group
220
Annual Report 2014 OPERATING SMARTER FOCUS:
-
Upload
khangminh22 -
Category
Documents
-
view
0 -
download
0
Transcript of OPERATING SMARTER FOCUS: - De Beers Group

AN
GLO
AM
ERIC
AN
PLC
AN
NU
AL R
EPO
RT 2014
Annual Report 2014
OPERATING SMARTER
FOCUS:

FOCUS: OPERATING SMARTEROur greatest challenge is to deliver the returns our shareholders expect but to do so in a way that creates shared value for all our partners and stakeholders.
To deliver on this commitment in a sustainable way, we have set out a clear strategy that will transform Anglo American. At the heart of this sit our new Organisation and Operating Models. These two clearly defined and focused approaches will see us operating smarter in every area of our business, across the value chain.
As we continue to embed these models, we are starting to witness significant progress. Clear authorities and accountabilities, operational improvements and a more disciplined approach to capital allocation are already helping us create a more effective and efficient organisation, for the benefit of all our stakeholders.
Other sources of information
Sustainable Development Report 2014
EFFECTIVEPARTNERSHIPS
FOCUS:
You can find this report and additional information about Anglo American on our corporate website.
Although we have chosen not to produce an ‘integrated report’, we have included a comprehensive overview of our non-financial performance in this report. More detailed information on our sustainability performance is provided in our Sustainable Development Report. This can be found on our corporate website.
For more information, visit www.angloamerican.com/ reporting

FINANCIAL PERFORMANCE
Strategic report02 Chairman’s statement04 At a glance06 Marketplace08 Chief Executive’s statement 10 Our strategy 14 Our business model 16 Key performance indicators 18 Group financial review22 Portfolio28 Performance36 People42 Risk48 Iron Ore and Manganese52 Coal56 Base Metals and Minerals57 Copper58 Nickel59 Niobium59 Phosphates60 Platinum62 De Beers64 Corporate and other
Governance65 Chairman’s introduction66 Directors69 Executive management71 The Board in 201476 Sustainability Committee77 Nomination Committee78 Audit Committee80 Audit Committee report82 Remuneration Committee83 Directors’ remuneration report84 Policy on director remuneration93 Director remuneration in 2014 101 Outstanding share interests 104 Remuneration in 2015 105 Committee members during 2014 106 Six-year remuneration and returns 108 Statement of directors’ responsibilities 108 Responsibility statement
Financial statements 110 Independent auditor’s report 112 Principal statements 116 Notes to the financial statements 163 Financial statements of the
parent company 166 Summary by business operation 167 Key financial data 168 Exchange rates and commodity prices
Ore Reserves and Mineral Resources 169 Introduction 170 Iron Ore 173 Manganese 174 Coal 182 Copper 187 Nickel 188 Niobium 190 Phosphates 191 Platinum Group Metals 194 Diamonds
Other information202 Performance measures204 Production statistics208 Quarterly production statistics209 Non-financial data210 The business – an overview212 Directors’ report215 Shareholder information216 Other Anglo American publications
Interim Final
2010
2011
2012
2013
40
46
53
53
28
25
32
32
Dividends per shareCents
2014
5332
2010
2011
2012
2013
1.4
7.4
8.5
10.7
Net debt$ bn
201412.9
2010
2011
2012
2013
5.7
4.9
5.9
6.1
Capital expenditure$ bn
20146.0
Throughout the Strategic Report we use a number of financial and non-financial measures to assess our performance. The measures are defined on page 202.
Attributable ROCE is based on underlying performance before the impact of impairments reported since 10 December 2013 and reflects realised prices and foreign exchange during the current period. For more detail on this calculation and its methodology, please refer to page 203.
‘Tonnes’ are metric tons, ‘Mt’ denotes million tonnes, ‘kt’ denotes thousand tonnes and ‘koz’ denotes thousand ounces; ‘$’ and ‘dollars’ denote US dollars and ‘cents’ denotes US cents.
UNDERLYING EBIT(2013: $6.6 bn)
$4.9 bnUNDERLYING EARNINGS(2013: $2.7 bn)
$2.2 bnUNDERLYING EARNINGS PER SHARE(2013: $2.09)
$1.73LOSS ATTRIBUTABLE TO EQUITY SHAREHOLDERS(2013: $(1.0) bn)
$(2.5) bn
Cover images Operation geologist Carlos Barros (left) and geology assistant contractor Oscar Ríos review the positioning of a power shovel at Los Bronces copper mine in Chile.
Power shovel and haul trucks in the open pit at Los Bronces, which produced more than 400,000 tonnes of copper in 2014.
Opposite Geology assistant contractor Oscar Ríos (left) and shift supervisor Antonio Manriquez examine the topography of Los Bronces’ open pit prior to relocating mobile mine equipment.
01Anglo American plc Annual Report 2014 1
PERFORMANCE HIGHLIGHTS CONTENTS

CHAIRMAN’S STATEMENT
Notably, our production performance in all our key businesses has been ahead of plan. During October 2014, we were able to ship our first ore from Minas-Rio earlier than expected and within the revised capital budget of $8.8 billion. This is testimony to the unrelenting endeavours of the team in Brazil. However, the dramatic drop in the iron ore pricing environment, which has been particularly acute in the near term and has also dragged down long term price expectations, has resulted in a $3.5 billion non-cash (post-tax) write down in the asset value of Minas-Rio.
Notwithstanding the tough pricing environment, there have been several encouraging developments. Our platinum operations in South Africa are recovering strongly from the prolonged strike in the first half of 2014, and we are making headway in restructuring the business, including the divestment of operations we no longer consider to be ‘core’. The operational turnaround at our two major copper interests in Chile, Los Bronces and Collahuasi, is well under way despite the challenges, at Los Bronces, posed by declining grades and ore hardness. At Sishen, our flagship iron ore asset in South Africa, we are on track to restore production to a 38 million tonnes per annum level in 2016. In Australia, where deteriorating prices for metallurgical coal are putting great pressure on our coal operations, we have managed to dramatically improve productivity, bringing down unit costs substantially at our key longwall operations.
SAFETY
I never fail to be impressed by the level of commitment shown throughout our Group – from Board level to the working face – in safety matters. That is why it is always sad and disappointing to report on loss of life in our business. In 2014, despite a steep reduction in fatal incidents (after taking the platinum strike into account), and ongoing declining trends in injuries, six people lost their lives – it is incumbent on us all to do whatever it takes to get this figure down to zero.
Under Tony O’Neill, our technical director, this is being given renewed direction, particularly with the emphasis being placed via our Operating Model on planned work, which is improving performance not only in safety, but in practically all areas of the business.
Allied to this, we are focusing on the deployment of new technologies, and particularly those concerning mechanisation and automation, in order to make mining less physically arduous and to eliminate, as far as possible, the potentially hazardous interface between employees and machinery and the rock face. This has led to tightening policy around transportation (along with falls of ground, the main cause of injuries in our Group), including stricter regulation around transport hire and the advance monitoring of road conditions.
These macro-economic conditions and the over-supply of certain mined commodities drove severe price decreases. Such developments are posing considerable challenges for the global mining industry. This is particularly the case in bulk commodities such as iron ore, where industry over-expansion created price levels that are more depressed than they might have been. Given these developments, Anglo American is taking further action to cushion the impact of downward price pressures.
ANGLO AMERICAN’S ROAD TO RECOVERY
ResultsThese challenging conditions are demonstrating the resilience of Anglo American’s strategy, based as it is on a diversified range of products attuned to different stages of the cycle. We delivered an underlying EBIT of $4.9 billion in 2014 (2013: $6.6 billion). We have also recommended a dividend of 53 cents per share at the final stage, giving a maintained total dividend for the year of 85 cents per share, and we expect the dividend to be funded from free cash flow from 2016 onwards. The Board’s commitment to providing a base dividend, which will be maintained or increased through the cycle, is unchanged.
PerformanceUnder the leadership of Mark Cutifani, considerable progress is being made, on this, the first year of our three-year journey towards realising the potential set out in our Driving Value strategic imperative.
In 2014, we passed a number of important milestones on the road to our ambition. This included making significant strides in our operational performance to meet our 2016 target of 15% ROCE at June 2013 prices and exchange rates. At that time we plan to deliver an additional $4 billion of incremental EBIT (compared to 2012), and are redoubling our efforts to create further improvements, including scaling down our capital expenditure for 2015 and 2016.
2014 saw a notable divergence in performance between the world’s major economies. In China, growth dipped slightly below the government’s 7½% target. Other emerging economies, the eurozone and Japan are in a fragile state, though the US strengthened significantly during the year.
Sir John Parker
02 Anglo American plc Annual Report 2014
STRATEGIC REPORT CHAIRMAN’S STATEMENT

DEVELOPING AND DEPLOYING NEW TECHNOLOGIES
In the past, Anglo American, deservedly, had a reputation for being a leader in mining technology, and the Board is giving its full backing to the executive and the Technical team as we endeavour to again lead the industry. Our intense focus on operational fundamentals – doing the basic things better – is already delivering substantial benefits.
Today, however, no mining company can be working wholly within its own silo, and that is why Anglo American is working with a range of global institutions and universities in the Americas, Australia, South Africa and the UK to support us in our drive to be at the forefront of mining technology.
We now want to move on to the next phase, with developments such as rock cutting lasers, alongside the deployment of digital engineering that can simulate mine and infrastructure conditions prior to the first shovel being put in the ground. In turn, the adoption of the latest construction techniques will greatly reduce the labour intensiveness and development risks of projects.
RESETTING THE SOUTH AFRICAN RELATIONSHIP
At Anglo American, we attach great importance to our relationships with our host governments. None is more important than South Africa, where we have substantial iron ore, platinum, thermal coal and diamond interests. These include projects such as the $2 billion extension into an underground diamond mine at Venetia, already under way, the potential New Largo coal mine development and the possible expansion of Platinum’s open pit at Mogalakwena.
We are also changing the role and composition of the Anglo American South Africa Board in order to: reinforce our commitment to, and strengthen our engagement with the country; and to co-ordinate our significant social and community programmes there through an integrated project management approach.
BOARD DEVELOPMENTS
During my time as your chairman, I have constantly sought to recruit people with the relevant skills sets and breadth of experience to make a real difference to the Board’s deliberations. This has brought to the boardroom not only mining knowledge, but also experience in such areas as management of major projects, modern engineering, construction, finance, investment expertise, global business experience, corporate leadership and healthcare. As a result, I believe that the Board is now not only stronger and more dynamic, but that it has helped to foster a relationship with the executive based on mutual trust and respect. This has created a boardroom culture where robust challenge is respected.
We are fortunate indeed to have Jack Thompson, who brings experience gained at all levels of the mining industry, as the chairman of the Sustainability Committee. I would also like to thank Byron Grote for the important perspectives he has brought to the Audit Committee in his first year as its chairman, and Sir Philip Hampton who diligently chairs our Remuneration Committee and serves as our senior independent director.
I am pleased to report that at year end, we had three female directors, constituting 25% of our Board, in line with the Davies Report 2015 target. We have also consciously built up our ethnic diversity.
OUR PEOPLE
I am encouraged by the extent to which we are being supported by our employees as we strive to make Anglo American a more efficient and effective organisation. Change is never comfortable for employees – but, as Mark Cutifani emphasised at our Investor Day in December, we have to adapt urgently given the pricing pressure on our business.
It is pleasing to note how far we have come already in restructuring the organisation, not least in the alignment of key people to key roles. Notably, in our all important Technical and Sustainability area, which is leading the way on our continuing journey to transform operational performance, we have seen the emergence of a revitalised organisation, with three-quarters of its top management recruited from across the global mining industry.
I wish to express my sincere gratitude to everyone who works for Anglo American for their hard work during a year of great change both internally and externally, and for their ongoing commitment to the Group in what undoubtedly will be a very challenging year ahead.
OUTLOOK
Against a background of a world economy that is likely to remain turbulent as the after-effects of the global financial crisis continue to linger, Anglo American is determined to be commercial in its approach, with a disciplined focus on margins and aligning output to anticipated market demand. Given this approach, our Group, with its differentiated range of early-, mid-, and late-stage products such as platinum and diamonds, is well placed to withstand both the vagaries of the cycle and to take advantage of the eventual upturn. Meanwhile, we are focused on delivering cost effective operational performance.
OUR STRATEGIC REPORT
Our 2014 strategic report, from pages 2 to 64, was reviewed and approved by the Board on 12 February 2015.
Sir John Parker Chairman
03
Strategic report
Anglo American plc Annual Report 2014

SANTIAGO
LONDON
JOHANNESBURG
BEIJING
BRISBANE
LUXEMBOURG
SINGAPORE
AR
BELO HORIZONTE
1 2
5
21 12
24
35 810
1 1 7
1
The origins of modern life – find out why mining matters, visit www.angloamerican.com/origins
04 Anglo American plc Annual Report 2014
STRATEGIC REPORT AT A GLANCE
IRON ORE AND MANGANESE9,400 employees(1)
• Of all the metals that make modern life possible, steel is the most widely used – and iron ore is its main ingredient. Steel is needed in many types of infrastructure and is therefore in great demand from emerging economies such as China and Brazil.
• Manganese is a vital component of stainless steel and many advanced alloys.
For more informationSee page 48
COAL
11,600 employees(1)
• Metallurgical coal is an essential ingredient in blast furnace steel production and accounts for around 70% of global steel output.
• Thermal coal is the heat source for around 40% of all electricity generated globally today and is vital in supporting the development of emerging economies.
For more informationSee page 52
COPPER
5,900 employees(1)
• Copper’s unique properties make it a vital material for urban and industrial growth.
• Around 60% of total global copper demand is for electrical wiring and equipment. Copper’s thermal conductivity makes it particularly suitable for air conditioning and refrigeration.
For more informationSee page 57
Base metals and minerals
1,957
Iron Ore and Manganese
Coal458
Copper1,193
Nickel21
Niobium 67
Phosphates57
Platinum32
De Beers1,363
Corporate and Other(215)
Total: $4,933 m
Underlying EBIT by business unit$ m
9,128
Iron Ore and Manganese
Coal4,640
Copper7,950
Nickel1,653
Niobium755
Phosphates351
Platinum7,810
De Beers10,642
Corporate and Other15
Total: $42,944 m
Net segment assets by business unit$ m
Anglo American is a global and diversified mining business that provides the raw materials essential for economic development and modern life. Our mining operations, growth projects and exploration and marketing activities extend across southern Africa, South America, Australia, North America, Asia and Europe.
OUR BUSINESS AT A GLANCE
OTHER SOUTH AMERICA
Coal
1 mine
Employees
300
BRAZIL
Iron Ore and Manganese
1 mine
Nickel
2 mines
Niobium
2 mines
Phosphates
1 mine
Employees
5,400
CHILE
Copper
5 mines
Employees
5,700
Bulk

SANTIAGO
LONDON
JOHANNESBURG
BEIJING
BRISBANE
LUXEMBOURG
SINGAPORE
AR
BELO HORIZONTE
1 2
5
21 12
24
35 810
1 1 7
1
05
Strategic report
Anglo American plc Annual Report 2014
For information about our material issues visit our Sustainable Development Report. This can be found on our corporate website www.angloamerican.com/reporting
NICKEL
1,700 employees(1)
• Around two-thirds of all refined nickel produced is used by the stainless steel industry.
• Nickel is used to make other alloys with special properties. Corrosion resistant alloys are used in chemical plants, while ‘super alloys’ withstand extreme temperatures and are used in aviation.
For more informationSee page 58
2,800 employees(1)
• Consists of Other Mining and Industrial, Exploration, and Corporate and unallocated costs.
• Other Mining and Industrial includes Tarmac Middle East businesses, and our share in the Lafarge Tarmac joint venture.
For more informationSee page 64
Corporate and other
NIOBIUM
500 employees(1)
• Around 90% of the niobium we produce is used as an alloying agent, giving steel many of the properties on which we depend.
• Niobium is a component of the high strength steels used for cars, ships, high pressure pipelines and infrastructure across the petroleum and construction industries.
For more informationSee page 59
PHOSPHATES
1,300 employees(1)
• Phosphorus is a basic component of all living things, and phosphates are a vital ingredient of fertilisers.
• We produce a wide variety of phosphate based fertilisers for the agricultural sector, as well as dicalcium phosphate for animal feed.
For more informationSee page 59
DE BEERS
10,300 employees(1)
• Diamonds are the ultimate precious stone for jewellery and this is reflected in De Beers’ famous A Diamond is Forever™ line.
• Retail jewellery demand drives the market for gem diamonds. The largest diamond jewellery market is the US, with China and India growing strongly.
For more informationSee page 62
PLATINUM
51,300 employees(1)
• Platinum’s diverse range of applications make it one of the most valued materials in the world today.
• Platinum and other platinum group metals (PGMs) are widely used in autocatalytic converters, in jewellery and a wide number of other industrial applications.
For more informationSee page 60
Precious metals and minerals
EUROPE
Corporate locations
2Employees
2,000Includes staff employed at De Beers’ European operations, principally Element 6, and Other Mining and Industrial.
CANADA
Coal
1 mine (2)
De Beers
2 mines
Employees
1,700
SOUTH AFRICA
Iron Ore and Manganese
5 mines
Coal
10 mines
Platinum
8 mines (3)
De Beers
3 mines
Employees
72,000
OTHER AFRICA
Platinum
1 mine
De Beers
6 mines/mining areas
Employees
4,100
AUSTRALIA/ASIA
Iron Ore and Manganese
1 mine
Coal
7 mines
Employees
3,600
(1) Average number of employees, excluding contractors and associates’ and joint ventures’ employees, and including a proportionate share of employees within joint operations.
(2) Peace River Coal’s operations were placed on care and maintenance in December 2014.
(3) Anglo American Platinum managed operations.
KEY
Commodity mined/produced andnumber of mines
2

STRATEGIC REPORT MARKETPLACE
MARKETPLACE REVIEW
THE ECONOMYGROWTH STABILISATION
Global real gross domestic product (GDP) increased by 3¼% in 2014, the same as in 2013, according to the International Monetary Fund (IMF). There was a notable divergence in performance, however, between the world’s major economies. Early in the year, extremely cold weather depressed activity in the United States (US), though the economy recovered through the spring and summer. After a recovery in the spring, the Chinese economy slowed in the second half of the year. In Japan, activity was robust at the start of 2014, but then slumped following an increase in the consumption sales tax. Europe’s growth remained weak in 2014, especially in the eurozone’s largest economies. Activity remained fragile in emerging economies.
At the start of 2014, there was growing optimism about prospects for the US economy, but the extreme winter weather contributed to a contraction in real GDP in the first quarter. The strong recovery in the spring and summer led to annualised GDP growth of more than 4½%. Improvements in the labour and housing markets and a steep fall in oil prices later in the year supported significant gains in consumer confidence. Business sentiment also improved, encouraging increases in capital spending. After a significant tightening in 2012–2013, the fiscal squeeze moderated in 2014, imparting a smaller drag on growth. The Federal Reserve gradually wound down its quantitative easing programme, completing it in October.
In the first six months of 2014, China’s economy grew in line with the government’s 7½% target, which was a little below the rate in the second half of 2013. The People’s Bank of China injected liquidity into distressed sectors of the economy and the government accelerated some infrastructure projects. In the second half of 2014, growth dropped below the government’s target, mainly reflecting the negative impact of a weakening property market and slower industrial activity. In response, the Bank cut interest rates and allowed the renminbi to drift lower, and the government eased house purchase restrictions and loosened mortgage terms.
The European economy remained fragile in 2014. Following two years of output contraction, the eurozone registered modest growth as the heavily indebted economies stabilised, with Germany being the strongest of the larger economies. But after robust gains early in 2014, the German economy weakened appreciably later in the year, reflecting the slowdown in its main export markets and the impact of a stronger euro, especially against the Japanese yen. The French economy stagnated and the Italian economy contracted again in 2014, with fiscal austerity and impaired banking systems compounding the effects of a stronger euro. The European Central Bank announced significant easing measures in the summer, but stopped short of outright quantitative easing.
After strong growth in the first quarter, the Japanese economy slumped in the subsequent six months. The government’s decision to increase the consumption sales tax in April had a bigger negative impact than expected and, as a result, the Bank of Japan announced an aggressive
scaling up of its quantitative and qualitative easing. The Abe government subsequently decided to postpone the second stage of the tax hike.
After the turmoil of 2013, many emerging economies experienced greater stability in 2014. Financial market sentiment improved significantly in India following the election of Narendra Modi as prime minister. While improvements in the real economy have been patchy, confidence is improving regarding India’s medium to longer term prospects. In Brazil and South Africa, growth finally stabilised after significant slowdowns. Russia’s economy weakened sharply in response to the escalating Ukrainian crisis and a significant fall in oil prices.
PROSPECTS
The world economy should strengthen in 2015–2016, with real GDP growth picking up to around 3½–3¾% per year, close to its historical average. Sharply lower oil prices should support activity in many oil consuming countries. The US is expected to lead the recovery, with GDP growth of at least 3% a year. In Europe and Japan, growth should remain more modest given continuing concerns around government finances and the health of their banking systems and corporate sectors.
The turbulence in emerging economies has led to a more cautious assessment of their medium term growth prospects. With a less favourable external environment and increasing domestic challenges, the IMF has recently revised down again its forecasts for growth over the next three to five years. Lower commodity prices could undermine activity in commodity producing economies. Still, the powerful logic of convergence in living standards suggests there is considerable growth potential, especially in Asia and Africa. There is a great onus on domestic policymakers to implement much needed reforms to unlock this potential.
COMMODITY MARKETSThroughout 2014, the prices of the commodities we produce displayed marked trend differences, as well as recording high volatility around those trends. Individual price performance reflected changing expectations of the macro-economic context, in particular global growth and the relative strength of the US dollar, the outlook for supply (which exceeded expectations in some key commodities) and the underlying industry cost structure of each commodity.
GDP per personin PPP terms, as % of US
20152010200520001995199019851980
0
5
10
15
20
25
30
35
40
Brazil
Source: IMF
ChinaIndiaSouth Africa
06 Anglo American plc Annual Report 2014
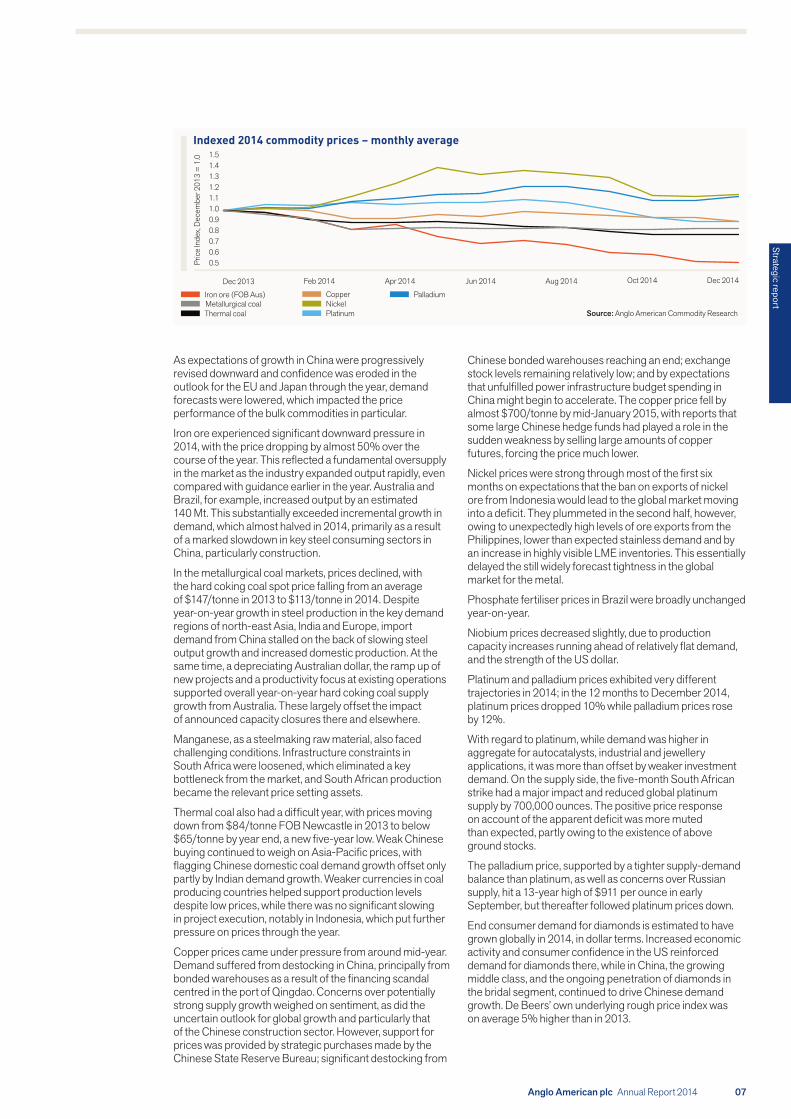
Indexed 2014 commodity prices – monthly average
Dec 2013 Dec 2014Oct 2014Aug 2014Feb 2014 Apr 2014 Jun 2014
Pric
e In
dex,
Dec
embe
r 201
3 =
1.0
0.50.6
0.90.80.7
1.31.21.11.0
1.41.5
Source: Anglo American Commodity Research
Iron ore (FOB Aus)
Thermal coalMetallurgical coal Nickel
Platinum
Copper Palladium
As expectations of growth in China were progressively revised downward and confidence was eroded in the outlook for the EU and Japan through the year, demand forecasts were lowered, which impacted the price performance of the bulk commodities in particular.
Iron ore experienced significant downward pressure in 2014, with the price dropping by almost 50% over the course of the year. This reflected a fundamental oversupply in the market as the industry expanded output rapidly, even compared with guidance earlier in the year. Australia and Brazil, for example, increased output by an estimated 140 Mt. This substantially exceeded incremental growth in demand, which almost halved in 2014, primarily as a result of a marked slowdown in key steel consuming sectors in China, particularly construction.
In the metallurgical coal markets, prices declined, with the hard coking coal spot price falling from an average of $147/tonne in 2013 to $113/tonne in 2014. Despite year-on-year growth in steel production in the key demand regions of north-east Asia, India and Europe, import demand from China stalled on the back of slowing steel output growth and increased domestic production. At the same time, a depreciating Australian dollar, the ramp up of new projects and a productivity focus at existing operations supported overall year-on-year hard coking coal supply growth from Australia. These largely offset the impact of announced capacity closures there and elsewhere.
Manganese, as a steelmaking raw material, also faced challenging conditions. Infrastructure constraints in South Africa were loosened, which eliminated a key bottleneck from the market, and South African production became the relevant price setting assets.
Thermal coal also had a difficult year, with prices moving down from $84/tonne FOB Newcastle in 2013 to below $65/tonne by year end, a new five-year low. Weak Chinese buying continued to weigh on Asia-Pacific prices, with flagging Chinese domestic coal demand growth offset only partly by Indian demand growth. Weaker currencies in coal producing countries helped support production levels despite low prices, while there was no significant slowing in project execution, notably in Indonesia, which put further pressure on prices through the year.
Copper prices came under pressure from around mid-year. Demand suffered from destocking in China, principally from bonded warehouses as a result of the financing scandal centred in the port of Qingdao. Concerns over potentially strong supply growth weighed on sentiment, as did the uncertain outlook for global growth and particularly that of the Chinese construction sector. However, support for prices was provided by strategic purchases made by the Chinese State Reserve Bureau; significant destocking from
Chinese bonded warehouses reaching an end; exchange stock levels remaining relatively low; and by expectations that unfulfilled power infrastructure budget spending in China might begin to accelerate. The copper price fell by almost $700/tonne by mid-January 2015, with reports that some large Chinese hedge funds had played a role in the sudden weakness by selling large amounts of copper futures, forcing the price much lower.
Nickel prices were strong through most of the first six months on expectations that the ban on exports of nickel ore from Indonesia would lead to the global market moving into a deficit. They plummeted in the second half, however, owing to unexpectedly high levels of ore exports from the Philippines, lower than expected stainless demand and by an increase in highly visible LME inventories. This essentially delayed the still widely forecast tightness in the global market for the metal.
Phosphate fertiliser prices in Brazil were broadly unchanged year-on-year.
Niobium prices decreased slightly, due to production capacity increases running ahead of relatively flat demand, and the strength of the US dollar.
Platinum and palladium prices exhibited very different trajectories in 2014; in the 12 months to December 2014, platinum prices dropped 10% while palladium prices rose by 12%.
With regard to platinum, while demand was higher in aggregate for autocatalysts, industrial and jewellery applications, it was more than offset by weaker investment demand. On the supply side, the five-month South African strike had a major impact and reduced global platinum supply by 700,000 ounces. The positive price response on account of the apparent deficit was more muted than expected, partly owing to the existence of above ground stocks.
The palladium price, supported by a tighter supply-demand balance than platinum, as well as concerns over Russian supply, hit a 13-year high of $911 per ounce in early September, but thereafter followed platinum prices down.
End consumer demand for diamonds is estimated to have grown globally in 2014, in dollar terms. Increased economic activity and consumer confidence in the US reinforced demand for diamonds there, while in China, the growing middle class, and the ongoing penetration of diamonds in the bridal segment, continued to drive Chinese demand growth. De Beers’ own underlying rough price index was on average 5% higher than in 2013.
07
Strategic report
Anglo American plc Annual Report 2014
Our diversified product portfolio provided us with a degree of insulation from the particularly sharp price falls for the bulk commodities of iron ore and coal, albeit in an environment where weaker commodity prices accounted for $2.4 billion(1) of underlying EBIT reduction. The operational turnaround of a number of our priority operations and the continued weakening of many producer country currencies ($1.3 billion positive impact to underlying EBIT) also helped to mitigate the effects of the generally adverse pricing environment. After adjusting for the platinum strike, copper equivalent unit costs(2) in local currency terms decreased by 3% (real) in 2014, and we have delivered a $500 million sustainable reduction in overhead and project study and evaluation costs compared to our 2012 baseline. Underlying EBIT of $4.9 billion, a 25% decrease, and underlying EBITDA of $7.8 billion, an 18% decrease, reflect the substantial operational progress we have made to restore the performance of our mines, though further progress is necessary to meet our return targets through the cycle. Underlying earnings reduced by 17% to $2.2 billion.
Our safety and environmental performance is a leading indicator of how we are running the business. The greater the degree of planned work and stable operations, the safer we will be. We have seen a very meaningful improvement across our key safety and environmental performance metrics, taking into account the five-month platinum strike, reflecting our focus on high risk activities, standards and controls. Despite the positive progress, I am saddened to report that we still lost six colleagues during the year, so we have a lot more work to do and our focus is unrelenting to achieve zero harm.
We have shown in 2014 that we are adapting and delivering and are on the right track to transform the performance of Anglo American. Our mining operations are the engine of our business and we have delivered higher and more consistent volumes, with a clear focus on increased stability, productivity, margins and returns. There is significantly more improvement potential as we continue to build the capability to achieve a step change in performance and returns from our exceptional resource endowment.
DELIVERING ON COMMITMENTS
We have delivered on the major operational and portfolio commitments for the year that we made to shareholders. Most prominently, we shipped our first ore from the Minas-Rio project in Brazil ahead of schedule in October, and expect to bring the project in $400 million below the revised budget. However, the steep drop in the iron ore price has resulted in a $3.5 billion post-tax write down in the carrying value of Minas-Rio. We are, though, clear about the asset’s potential and the differentiated nature of its high quality products in the market.
We have made substantial progress towards creating a platinum business fit for the future. We have defined the shape of our future platinum portfolio, taken the hard decisions to close down a number of shafts, restructured the assets that we plan to divest to demonstrate their long term commercial viability, set disposal processes under way and, most importantly, aligned our plans with government and with our employees.
I have been clear that a platform of operational excellence is fundamental to delivering the full potential of this business. Our top 16 priority assets contribute the majority of value to Anglo American and offer the scope for the greatest upside. The majority of those assets are now performing above plan (compared to only three in 2013) and the remainder are improving in line with our expectations.
We have focused urgent attention on the performance of our largest and most valuable mines, a number of which had become severely constrained in recent years due to a lack of mine development, with the positive results seen in our 2014 operational performance.
The redesign of the pit at the Sishen iron ore mine in South Africa and the implementation of our new Operating Model have successfully unlocked the challenge of excess waste material that needs to be mined to access the orebody. Sishen hit its target production level for 2014 of 35 million tonnes (Mt) of iron ore and is now on track to recover its production level to 38 Mt in 2016, in excess of our original 37 Mt target. At the same time, its sister mine at Kolomela continues to outperform its nameplate capacity of 9 Mt per annum, producing 11.6 Mt in 2014, due to plant throughput optimisation, delivering ore feed at a lower unit cost and complementing the improving Sishen performance.
Similarly, at our Los Bronces copper mine in Chile, the waste backlogs and other pit constraints of previous years have been cleared and the mine and plant have been stabilised, enabling record material to be mined in the year and continuous ore to be fed into the plant. At the Collahuasi joint operation, also in Chile, the performance of the mining operation has been stabilised and improved and attention will move to the plant in 2015. As a result of these interventions to turn around the operations, we have been able to steadily increase production expectations for our Copper business during the year, to achieve full year production of 748 kt of copper, a 7% increase on the original guidance for the year.
FOCUS: OPERATING SMARTER
STRATEGIC REPORT CHIEF EXECUTIVE’S STATEMENT
TRANSFORMING THE BUSINESS 2014 was a year of significant operational improvement against sharp commodity price declines amid generally adverse market conditions.
Mark Cutifani
(1) Excludes De Beers volume/price and impact of the strike at Platinum.
(2) See page 202 for the definition and calculation of copper equivalent unit costs.
08 Anglo American plc Annual Report 2014

The performance of our diamond business – De Beers – is a clear demonstration of the benefits and value of our diversified business model. The integration of De Beers into Anglo American is complete; De Beers contributed $1.4 billion of underlying EBIT in 2014, 28% of – and the second largest contributor to – the Group’s total, and delivered a 15% return on capital employed (ROCE).
DISCIPLINED ALLOCATION OF CAPITAL
Consistent with our focus on returns, we must be disciplined with our deployment of physical and financial resources to those assets that will provide us with the greatest value for capital employed and potential upside. Through our asset review process, we identified a number of assets – principally in our Platinum, Copper and Coal businesses – that are likely to deliver greater value under different ownership, enabling us to concentrate our resources on our most attractive priority assets. A number of sales processes are under way; however, our value hurdles will need to be met prior to divestment, in what is a challenging environment for asset sales. The proposed merger of Lafarge with Holcim, on which the sale of our 50% shareholding in Lafarge Tarmac to Lafarge is dependent, is progressing in line with the announced completion timetable of the first half of 2015 following a positive decision by the European Commission in December 2014, but remains subject to certain other conditions.
We are committed to maintaining a robust capital structure which balances long term business value growth with sustainable capital returns to shareholders. In 2014, net debt increased to $12.9 billion and we expect to touch a peak level of $13.5-$14 billion during 2015, after receipt of Lafarge Tarmac sales proceeds. Anglo American is fortunate to have a world class resource endowment, including a number of attractive, predominantly brownfield options, for organic growth. We will continue to allocate capital to our most value accretive options and pursue a syndication approach for major greenfield developments, in line with managing individual risk exposures and achieving our long term net debt target of $10-$12 billion, assisted by our asset disposal programme.
Our revised Operating Model is delivering strong underlying results and we are building on those foundations to complete the next phase of the transformation process. Our focus on ROCE drives the right behaviours within the business and we are moving all the levers within our control to deliver $4 billion(3) of additional EBIT in 2016 (compared to 2012 EBIT), all of which has now been fully scoped. We are intensifying our efforts to identify the additional EBIT necessary to mitigate recent downward pressure on prices.
PARTNERS IN THE FUTURE
Society’s expectations of the mining industry have long been in the spotlight, often for good reason, and our reputations can be shaped by the actions of others. At a global level, mining activity occupies a tiny fraction of the earth’s surface yet, to a community neighbouring a mine, it may feel somewhat different. The business imperative
is clear; that without securing and sustaining our social licences to operate, more operations and developments will face disruption, costs will escalate further and opportunities will be lost on all fronts. We are working tirelessly through partnerships with the likes of the Kellogg Innovation Network and faith groups to change the status quo, to listen to what our host communities need – not what we think they need – and to uplift the industry to realise our vision of becoming real partners in their future.
OUTLOOK
Despite the headlines of economic uncertainty and geopolitical tensions, the underlying fundamentals of our business – applying world class technical skills to world class assets – remain attractive over the long term. Declining ore grades, a very small number of new mineral discoveries and project developments, ever rising government and community expectations, and infrastructure and energy challenges all point towards a constrained supply picture for most of our products in a world where the major consuming economies are still growing, albeit at a slower pace of growth. China’s continuing growth slowdown has significantly altered the demand profile for many commodities, but successful reform and rebalancing should make the economy more resilient in the medium to longer term. While Europe and Japan are still struggling, we have seen more encouraging news on economic developments in the US and an apparent strengthening of India’s economy.
In the immediate term, I expect tough trading conditions to prevail during 2015, but we are determined to continue to build on our already very significant operational improvements, drive towards an effective and efficient organisation and culture, and to be unwavering in our capital discipline.
THANKS
On behalf of my executive colleagues, I would like to thank all our people – our employees and contractors – and the extensive network of stakeholders in our business for their continued dedication and support as we make the changes necessary to create a more agile, robust and sustainable Anglo American. We are transforming this business. We have a clear direction and we are creating a different, better future for Anglo American and for you all.
Lastly, I thank all the members of the Board, led by our chairman Sir John Parker, for sharing their extensive collective experience and providing the support for our strategy to deliver our full potential.
Mark Cutifani Chief Executive
09
Strategic report
Anglo American plc Annual Report 2014
(3) Attributable and at 30 June 2013 exchange rates and commodity prices.

10 Anglo American plc Annual Report 2014
(1) ROCE target is at 30 June 2013 exchange rates and commodity prices.
STRATEGIC REPORT OUR STRATEGY
THE DIVERSIFIED MINER
The mining industry continues to be at the heart of the world’s economic engine and will remain so for many decades to come. As the diversified miner, Anglo American provides many of the commodities and precious metals and minerals that are essential for economic development and modern life.
OUR WORLD
OUR AMBITION
HOW WE DELIVER
HOW WE WORK TOGETHER
WEARE
ANGLO AMERICAN
For almost a hundred years, we have been mining the raw materials that society needs to develop and prosper. We provide our investors with a balanced portfolio of opportunities as we find, plan and build, mine, process, move and market a diversified and high quality range of products, spanning bulk commodities, base metals and minerals, and precious metals and minerals.
Having a diversified portfolio gives us options in terms of how and where we choose to allocate capital to grow the business, improve margins, generate returns and ultimately deliver value, and helps protect us through commodity and economic cycles.
As a responsible miner, we are the
custodians of some of the world’s most precious resources that enable
economic development and modern
lifestyles
Our ambition is to double our 2014
operating profit by 2020, consistent with our 15% ROCE target
by 2016(1)
We must ensure the most efficient and
effective use of capital to unlock value for our
shareholders, who own our business

11
Strategic report
Anglo American plc Annual Report 2014
WE ARE ANGLO AMERICAN
OUR WORLD
OUR AMBITION
HOW WE DELIVER
HOW WE WORK TOGETHER
Our ability to manage this diversification for value provides us with a competitive advantage. Knowing where along the chain, from exploration to marketing, we can leverage value from each of our different products is one of the many skills required in managing a diversified portfolio.
While our aim as a business has always been to generate returns for our shareholders, how we accomplish this – by striving to make a real and lasting contribution to society – is fundamental and defines us as a company. We believe this is best done through forming mutually beneficial partnerships, as reflected in our vision: ‘Partners in the future’.
We are clear that the delivery of consistent and superior cash returns and capital appreciation to shareholders will only endure if we deliver value to society, as seen through the eyes of our key constituencies: employees, governments, social stakeholders, customers and business partners. Achieving this balance is fundamental to our effectiveness as an organisation and our sustainability as a business.
For more on how we deliver our strategy See pages 12–13
We are one of the industry leaders in resource development, mining and operational innovation to drive the delivery of exceptional returns from our assets for our shareholders. However, the delivery of returns to shareholders will only endure if we deliver value to society, as seen through the eyes of our key stakeholders.
We believe this is best done through forming mutually beneficial partnerships, as reflected in our mission: Together, we create sustainable value that makes a real difference. Working in this way we strive towards our ultimate vision, to be ‘Partners in the future’.
Mining remains at the heart of the world economy. Long term demand for products will continue to grow but the mining ‘supercycle’ of the past decade is over. Miners can no longer rely on high commodity prices to mask inefficiencies in their businesses.
The attractiveness of commodities, and stakeholder demands, can shift over time depending on business and social trends. Our diversified portfolio of products spans the economic development cycle and presents us with many options to create value and opportunities for all our stakeholders, and to work more effectively and efficiently as an organisation.
Through an ongoing focus on capital discipline and costs, we aim to double our 2014 operating profit by 2020, consistent with our 15% ROCE target by 2016(1).
Our strategy to achieve this ambition is split into three elements:
• Where we compete (Portfolio) • How we win (Performance) • Critical core skills (People)
The delivery of our strategy implies a major transformation. We have identified four immediate strategic imperatives to ensure the delivery of our strategy. 1. Deliver Driving Value2. Focus the portfolio3. Develop core business processes4. Create a high performance culture
We will measure results and ensure the implementation of our strategy through an holistic business scorecard that includes seven pillars of value.
Our Organisation Model empowers our people to realise their full potential and that of our assets by ensuring that the right people are in the right roles, doing the right work.
Our Operating Model provides a structured approach to how we define, organise and deliver that work to improve our performance, enabling consistent delivery against expectations.

12 12 Anglo American plc Annual Report 2014
STRATEGIC REPORT OUR STRATEGY
(1) ROCE target is at 30 June 2013 exchange rates and commodity prices.
The delivery of our strategy implies a major transformation of the business. It is an exciting opportunity and challenge that will require an integrated effort from all our people.
HOW WE DELIVER OUR STRATEGY
THE CHOICES THAT DEFINE OUR FUTURE
Our strategic elements
Where we compete: optimising our diverse portfolio
We will focus management time and prioritise capital on the mining assets that offer us the most attractive long term value creation potential.
How we win: maximising our performance
We will maintain a highly competitive mindset, with innovation and outstanding delivery at the forefront of how we drive change.
Critical core skills: creating a capable organisation
We will ensure that our people and organisation have the critical core skills, supported by key people systems, to ensure we improve our returns.
OUR AMBITION
To double our 2014 operating profit by 2020, consistent with our 15% ROCE target by 2016(1).
To enable us to achieve this target we have continued to develop a Group strategy with an ongoing focus on capital discipline and costs, based on our industry position as the diversified miner.
WHAT WE MUST DELIVER IN THE NEAR TERM
Our strategic imperatives
1. Deliver Driving Value
The delivery of this strategic imperative will help us rebuild our market credibility. We have already delivered a number of near term critical tasks:
• Minas-Rio first ore on ship and ramp up under way
• Restructure of Platinum business
• Operational turnaround at Copper • Sishen mine optimisation • Finalising the organisation structure.
Ongoing tasks:
• Roll out Operating Model to Priority 1 assets
• Deliver $500 million sustainable cost reductions
• Implement business scorecard • Reset our South African government and community relationships.
2. Focus the portfolio
Our resource and asset participation will focus on positions where we believe we can deliver consistent margins to support high returns through the respective price cycles.
• Achieve full potential in Priority 1 assets
• Prioritise high value projects (e.g. Quellaveco)
• Exit select Priority 3 and Priority 2 assets to simplify our portfolio and reduce net debt
• Rescale our overheads appropriately • Re-assess our value chain participation.
3. Develop core business processes
We aim to become industry leaders in critical areas, helping us to extract the maximum value from our assets and products.
Exploration Embed a self-funding model that positions us to compete for the next major undeveloped or potential resource in our selected commodities.
Operations Embed Anglo American’s Operating Model in our Priority 1 assets by the end of 2016.
Project delivery Drive our project delivery skills to the next level to reduce capital expenditure and provide more certainty around delivery of project outcomes.
Marketing Ensure maximum value creation across the entire value chain – from mine to customer.
4. Create a high performance culture
Our people, across all facets of the business, are integral to the delivery of our strategy. We aim to provide the right environment in which to create a high performance culture. We are creating an organisation where all people are treated in such a way that they willingly give the best they have got.
Create a high performance leadership team A high performance culture starts with developing a high performance leadership team capable of developing a broader plan for our wider organisational culture.
Organisation redesign We aim to retain and appoint the right people in critical organisation roles. We will continue to develop the organisation in this way.
Focused on delivery We will measure our progress through an holistic business scorecard comprising both financial and non-financial indicators, including our seven pillars of value.
13
Strategic report
Anglo American plc Annual Report 2014
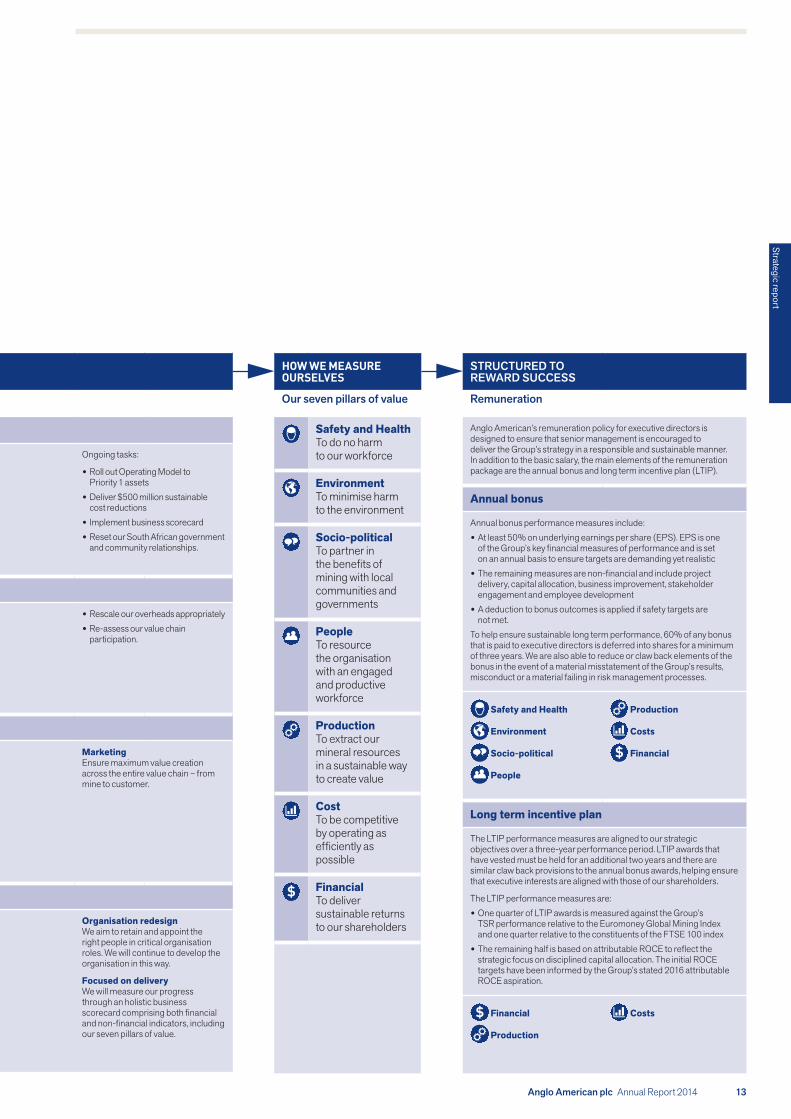
HOW WE MEASURE OURSELVES
Our seven pillars of value
Safety and HealthTo do no harm to our workforce
Environment To minimise harm to the environment
Socio-politicalTo partner in the benefits of mining with local communities and governments
PeopleTo resource the organisation with an engaged and productive workforce
ProductionTo extract our mineral resources in a sustainable way to create value
CostTo be competitive by operating as efficiently as possible
FinancialTo deliver sustainable returns to our shareholders
STRUCTURED TO REWARD SUCCESS
Remuneration
Anglo American’s remuneration policy for executive directors is designed to ensure that senior management is encouraged to deliver the Group’s strategy in a responsible and sustainable manner. In addition to the basic salary, the main elements of the remuneration package are the annual bonus and long term incentive plan (LTIP).
Annual bonus
Annual bonus performance measures include: • At least 50% on underlying earnings per share (EPS). EPS is one of the Group’s key financial measures of performance and is set on an annual basis to ensure targets are demanding yet realistic
• The remaining measures are non-financial and include project delivery, capital allocation, business improvement, stakeholder engagement and employee development
• A deduction to bonus outcomes is applied if safety targets are not met.
To help ensure sustainable long term performance, 60% of any bonus that is paid to executive directors is deferred into shares for a minimum of three years. We are also able to reduce or claw back elements of the bonus in the event of a material misstatement of the Group’s results, misconduct or a material failing in risk management processes.
Safety and Health
Environment
Socio-political
People
Production
Costs
Financial
Long term incentive plan
The LTIP performance measures are aligned to our strategic objectives over a three-year performance period. LTIP awards that have vested must be held for an additional two years and there are similar claw back provisions to the annual bonus awards, helping ensure that executive interests are aligned with those of our shareholders.
The LTIP performance measures are: • One quarter of LTIP awards is measured against the Group’s TSR performance relative to the Euromoney Global Mining Index and one quarter relative to the constituents of the FTSE 100 index
• The remaining half is based on attributable ROCE to reflect the strategic focus on disciplined capital allocation. The initial ROCE targets have been informed by the Group’s stated 2016 attributable ROCE aspiration.
Financial
Production
Costs
WHAT WE MUST DELIVER IN THE NEAR TERM
Our strategic imperatives
1. Deliver Driving Value
The delivery of this strategic imperative will help us rebuild our market credibility. We have already delivered a number of near term critical tasks:
• Minas-Rio first ore on ship and ramp up under way
• Restructure of Platinum business
• Operational turnaround at Copper • Sishen mine optimisation • Finalising the organisation structure.
Ongoing tasks:
• Roll out Operating Model to Priority 1 assets
• Deliver $500 million sustainable cost reductions
• Implement business scorecard • Reset our South African government and community relationships.
2. Focus the portfolio
Our resource and asset participation will focus on positions where we believe we can deliver consistent margins to support high returns through the respective price cycles.
• Achieve full potential in Priority 1 assets
• Prioritise high value projects (e.g. Quellaveco)
• Exit select Priority 3 and Priority 2 assets to simplify our portfolio and reduce net debt
• Rescale our overheads appropriately • Re-assess our value chain participation.
3. Develop core business processes
We aim to become industry leaders in critical areas, helping us to extract the maximum value from our assets and products.
Exploration Embed a self-funding model that positions us to compete for the next major undeveloped or potential resource in our selected commodities.
Operations Embed Anglo American’s Operating Model in our Priority 1 assets by the end of 2016.
Project delivery Drive our project delivery skills to the next level to reduce capital expenditure and provide more certainty around delivery of project outcomes.
Marketing Ensure maximum value creation across the entire value chain – from mine to customer.
4. Create a high performance culture
Our people, across all facets of the business, are integral to the delivery of our strategy. We aim to provide the right environment in which to create a high performance culture. We are creating an organisation where all people are treated in such a way that they willingly give the best they have got.
Create a high performance leadership team A high performance culture starts with developing a high performance leadership team capable of developing a broader plan for our wider organisational culture.
Organisation redesign We aim to retain and appoint the right people in critical organisation roles. We will continue to develop the organisation in this way.
Focused on delivery We will measure our progress through an holistic business scorecard comprising both financial and non-financial indicators, including our seven pillars of value.

14 Anglo American plc Annual Report 2014
STRATEGIC REPORT OUR BUSINESS MODEL
BUSINESS INPUT CAPITALS
FINANCIALOur shareholders own the business. They are entitled to attractive, sustainable returns, reflecting the risk they take in funding the business.
HUMANOur people are the business. We aim to resource the organisation with a capable, engaged and productive workforce. We are committed to ensuring no harm comes to any of our workforce.
INTELLECTUALWe aim to drive aggressive innovation to support consistent over-delivery on commitments. We link our technical and marketing knowledge to ensure we invest our efforts in the key leverage points in the ‘mine to market’ value chain.
NATURALIn order for us to mine, we first need to find locations rich in the minerals our customers need. Once operational, we require water, electricity and fuel in order to run our mines, process our products and move them to our customers.
MANUFACTUREDThroughout our value chain, we require a host of specialised equipment. The products we purchase, through our optimised supply chain, must deliver best value.
SOCIAL AND RELATIONSHIPSOpen and honest engagement with our stakeholders is critical in gaining and maintaining our social and legal licence to operate and, therefore, the sustainability of our business.
TOGETHER, WE CREATE SUSTAINABLE VALUE THAT MAKES A REAL DIFFERENCE
OUR BUSINESS MODEL
DIVERSIFIED MINING
RISK For more information on Risk See page 42
OUR ORGANISATION MODELHow we work together to deliver sustainable value
ORGANISATION STRUCTUREWe design our structures and roles to provide clear accountability and appropriate authority to get our work done.
PEOPLE SYSTEMSWe design merit based systems where people can work productively to their potential.
TEAM EFFECTIVENESSWe build positive, capable and effective teams.
Our portfolio is diverse in 3 ways...
Having this level of diversification helps shield us through economic downturns and industry turbulence and means we have a more balanced exposure to both political and currency risks.
2…the range of countries we operate in…
3…and that the
commodities and minerals we mine cover
all stages of the economic cycle
Our value chain is also diverse…As a company, we operate across the entire mining value chain – from exploration through to marketing. Although we are focused on resource development, mining and operations, we are developing other areas of the value chain, e.g. our marketing capabilities, when we can see opportunities to deliver increased value.
Find: our exploration teams discover mineral deposits in a safe and responsible way to replenish the resources that underpin our future success.
Plan and build: working with all our stakeholders, we plan and build some of the most effective, efficient and environmentally sound mines in the world.
Mine: we operate open cut and deep level mines. We apply almost a century of experience and technical expertise to ensure the safe and efficient extraction of minerals.
Process: we generate additional value by processing and refining many of our commodities.
Move and market: we provide products to our customers around the world, meeting their specific technical and logistical requirements.
1The
commodities and minerals we
mine…
For more information on our Organisation Model See page 38

15
Strategic report
Anglo American plc Annual Report 2014
BUSINESS OUTCOMES
FINANCIAL
Delivery of consistent and superior cash returns and capital appreciation that reflects free cash flow generated from operations and the recognition of a strong platform for future growth.
For more information on our KPI table See page 16
HUMAN
A healthy, motivated and fairly compensated workforce that is provided with the necessary training and development to achieve their personal and professional objectives and potential.
For more information on our KPI table See page 16
INTELLECTUAL
A high performance culture where we are leaders from both a personnel and operational perspective. The speed and application of leading resource development and mining practices helps us create a competitive and cost advantage.
For more information on our KPI table See page 16
NATURAL
We effectively manage and mitigate environmental risks by implementing robust policies and procedures, and create related opportunities that deliver long term benefits to our stakeholders.
For more information on our KPI table See page 16
MANUFACTURED
Through the effective delivery of our commodities and the collaborative business partnerships we build with our stakeholders, we develop products that benefit society at large.
For more information on our KPI table See page 16
SOCIAL AND RELATIONSHIPS
We create mutually beneficial partnerships with all our stakeholders. We are a development partner with the reputation, the resources and the rigour to deliver on our commitments to all parties.
For more information on our KPI table See page 16
DIVERSIFIED MINING
RISK
OUR OPERATING MODELA structured approach to how we set targets, plan, execute and improve our work.
SETTING OUT STRATEGIES AND TARGETS TO DELIVER PERFORMANCEWe have an operational planning process to ensure we deliver the business expectations.
DELIVERING THE RIGHT WORK, AT THE RIGHT TIME, IN THE RIGHT WAYThrough our work management process we plan, schedule, and resource work so we can do the work efficiently.
MONITORING HOW WE ARE DOING AGAINST THE PLANOur teams use analysis and feedback processes to improve and sustain our business.
Capital allocationHaving both portfolio and value chain diversification means we can focus our effort and capital at the points in the value chain that deliver most value, according to the commodity we are mining and the current and projected market conditions.
MOVE ANDMARKET
PLAN AND BUILD
MINE
PROCESS
FIND
For more information on our Operating Model See page 30
For more information on how we allocate capital See page 25

16 Anglo American plc Annual Report 2014
DESIGNED TO BE MEASURED
STRATEGIC REPORT KEY PERFORMANCE INDICATORS
(1) The table above reflects historically reported KPIs against our seven pillars. It does not represent our new business scorecard.(2) The results and targets in the KPI table above include wholly owned subsidiaries and joint operations over which Anglo American has management control.
PILLARS OF VALUE(1) KEY PERFORMANCE INDICATORS (KPIs)
Safety and Health To do no harm to our workforceFor more information see People on page 36
Work related fatal injury frequency rate (FIFR) FIFR is the number of employee or contractor fatal injuries due to all causes per 200,000 hours worked
New cases of occupational disease (NCOD)Number of new cases of occupational disease diagnosed among employees during the reporting period
Total recordable case frequency rate (TRCFR) TRCFR is the number of fatal injuries, lost time injuries and medical treatment cases for both employees and contractors per 200,000 hours worked
EnvironmentTo minimise harm to the environmentFor more information see Performance on page 28
Energy consumption Measured in million gigajoules (GJ)
Greenhouse gas (GHG) emissions Measured in million tonnes of CO2 equivalent emissions
Total new water consumed Total new water consumed includes water used for primary and non-primary activities, measured in million m3
Socio-politicalTo partner in the benefits of mining with local communities and governmentsFor more information see People on page 36
Corporate social investment Social investment as defined by the London Benchmarking Group includes donations, gifts in kind and staff time for administering community programmes and volunteering in company time and is shown as a percentage of underlying EBIT, less underlying EBIT of associates and joint ventures
Enterprise development Number of companies supported, and number of jobs sustained, by companies supported by Anglo American enterprise development initiatives
PeopleTo resource the organisation with an engaged and productive workforceFor more information see People on page 36
Voluntary labour turnover Number of permanent employee resignations as a percentage of total permanent employees
Gender diversity Percentage of women, and female managers, employed by the Group
ProductionTo extract our mineral resources in a sustainable way to create valueFor more information see Group Financial Review on page 18
Production volumes Production volumes for the year are discussed at a commodity level within each business unit section of the annual report (see pages 48–64). Quarterly production figures are shown on page 208
CostTo be competitive by operating as efficiently as possibleFor more information see Group Financial Review on page 18
Unit costs of production Unit costs of production are discussed at a commodity level within each business unit section of the annual report (see pages 48–64). Other factors that impact costs across the Group are discussed in the Group Financial Review (see page 18). See page 202 for the definition of real cash costs
FinancialTo deliver sustainable returns for our shareholdersFor more information see Group Financial Review on page 18
Attributable return on capital employed The return on adjusted capital employed attributable to equity shareholders of Anglo American. It excludes the portion of the return and capital employed attributable to non-controlling interests in operations where Anglo American has control but does not hold 100% of the equity. It is calculated as annualised underlying EBIT divided by adjusted capital employed
Underlying earnings per share Underlying earnings are net profit attributable to equity shareholders, before special items and remeasurements

17
Strategic report
Anglo American plc Annual Report 2014
RESULTS AND TARGETS(2)
FIFR(3)
Target: Zero fatal incidents
6 fatalities, 0.003 FIFR2014
2013(3)
15 fatalities, 0.008 FIFR
0.812014
20131.08
TRCFRTarget: 10% year-on-year reduction The ultimate goal of zero harm remains
1752014
2013209
NCOD Target: Zero (long term)
1082014
2013106
Energy consumptionMillion GJ total energy usedTarget: 7% saving vs. 2015 projected business as usual (BAU)Performance: 5% saving vs. 2014 BAU
17.42014
201317.1
GHG emissionsMt CO2 equivalentTarget: 19% saving vs. 2015 projected BAUPerformance: 22% saving vs. 2014 BAU
1952014
2013201
Total new water useMm3 new water usedTarget: 14% saving vs. 2020 projected BAUPerformance: 16% saving vs. 2014 BAU
$136 m2014
2013$127 m
Corporate social investment(4)
2014: 3.0% of underlying EBIT, less associates and joint ventures2013: 2.2% of underlying EBIT, less associates and joint ventures
58,2572014
201348,111
Enterprise developmentBusinesses supported
96,8732014
201376,543
Enterprise developmentJobs sustained
2.0%2014
20132.0%
Voluntary labour turnover
24%2014
201323%
Gender diversityManagers who are female
16%2014
201315%
Gender diversityWomen as a percentage of total workforce
8%2014
201311%
Group attributable ROCE
$1.732014
2013$2.09
Underlying EPS
(3) At the end of 2013 it was reported that two colleagues remained unaccounted for following the geotechnical event at the Port of Santana in which six people were involved. A certificate of presumed death has subsequently been issued for one person and the number of loss of life incidents in 2013 has been restated to 15.
(4) Included within the CSI expenditure figure for 2014 is expenditure relating to Zimele ($10.1 million) and social programmes delivered as part of Iron Ore Brazil’s licensing conditions ($3.5 million). These items were not included in previous years.
15%
Iron ore
Coal1%
Copper (attributable)(3%)
Nickel8%
Niobium4%
Phosphates (fertiliser)(7%)
5%
(21%)De Beers
Platinum (equivalent refined)
Production change% change versus 2013
20128%
20132%
2014(2%)
(1%)
20112%2010
Group real cash cost movements 2010–2014
2014 cash cost movement is normalised for the impact of the strike at Platinum. Data reported in 2012 includes results from De Beers from the date of acquisition
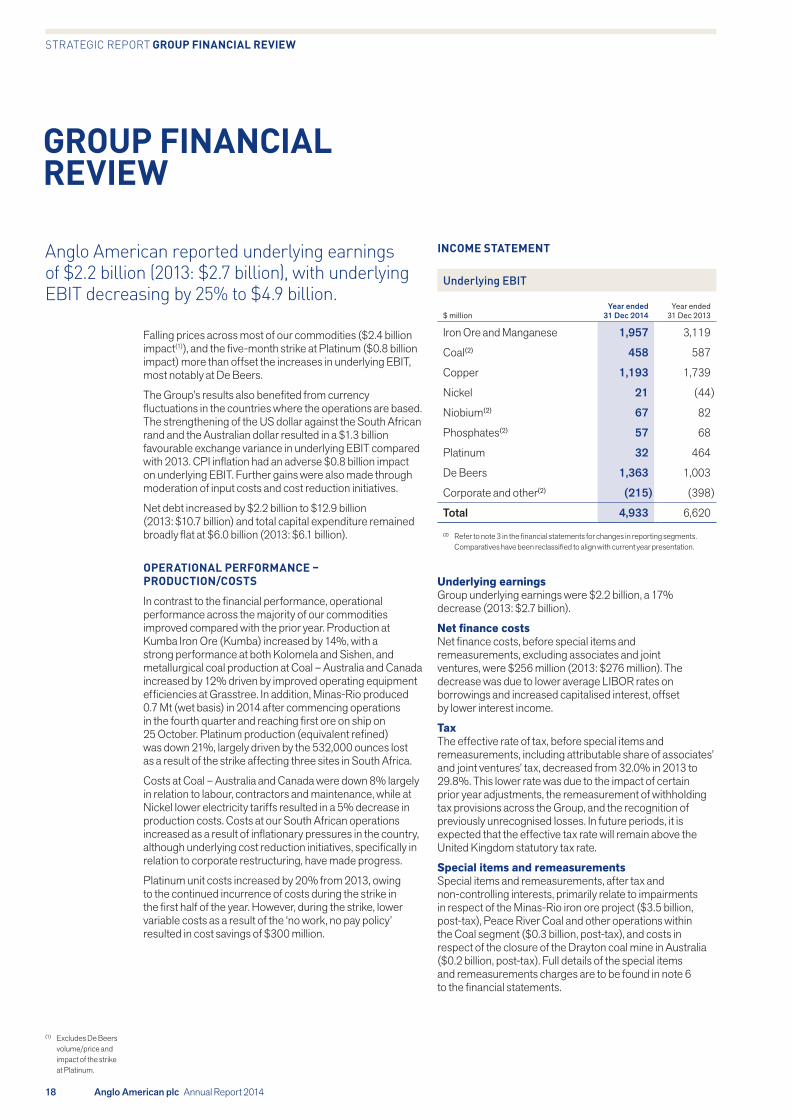
Anglo American reported underlying earnings of $2.2 billion (2013: $2.7 billion), with underlying EBIT decreasing by 25% to $4.9 billion.
INCOME STATEMENT
Underlying EBIT
$ millionYear ended
31 Dec 2014Year ended
31 Dec 2013
Iron Ore and Manganese 1,957 3,119
Coal(2) 458 587
Copper 1,193 1,739
Nickel 21 (44)
Niobium(2) 67 82
Phosphates(2) 57 68
Platinum 32 464
De Beers 1,363 1,003
Corporate and other(2) (215) (398)
Total 4,933 6,620
(2) Refer to note 3 in the financial statements for changes in reporting segments. Comparatives have been reclassified to align with current year presentation.
Underlying earningsGroup underlying earnings were $2.2 billion, a 17% decrease (2013: $2.7 billion).
Net finance costs Net finance costs, before special items and remeasurements, excluding associates and joint ventures, were $256 million (2013: $276 million). The decrease was due to lower average LIBOR rates on borrowings and increased capitalised interest, offset by lower interest income.
Tax The effective rate of tax, before special items and remeasurements, including attributable share of associates’ and joint ventures’ tax, decreased from 32.0% in 2013 to 29.8%. This lower rate was due to the impact of certain prior year adjustments, the remeasurement of withholding tax provisions across the Group, and the recognition of previously unrecognised losses. In future periods, it is expected that the effective tax rate will remain above the United Kingdom statutory tax rate.
Special items and remeasurements Special items and remeasurements, after tax and non-controlling interests, primarily relate to impairments in respect of the Minas-Rio iron ore project ($3.5 billion, post-tax), Peace River Coal and other operations within the Coal segment ($0.3 billion, post-tax), and costs in respect of the closure of the Drayton coal mine in Australia ($0.2 billion, post-tax). Full details of the special items and remeasurements charges are to be found in note 6 to the financial statements.
Falling prices across most of our commodities ($2.4 billion impact(1)), and the five-month strike at Platinum ($0.8 billion impact) more than offset the increases in underlying EBIT, most notably at De Beers.
The Group’s results also benefited from currency fluctuations in the countries where the operations are based. The strengthening of the US dollar against the South African rand and the Australian dollar resulted in a $1.3 billion favourable exchange variance in underlying EBIT compared with 2013. CPI inflation had an adverse $0.8 billion impact on underlying EBIT. Further gains were also made through moderation of input costs and cost reduction initiatives.
Net debt increased by $2.2 billion to $12.9 billion (2013: $10.7 billion) and total capital expenditure remained broadly flat at $6.0 billion (2013: $6.1 billion).
OPERATIONAL PERFORMANCE – PRODUCTION/COSTS
In contrast to the financial performance, operational performance across the majority of our commodities improved compared with the prior year. Production at Kumba Iron Ore (Kumba) increased by 14%, with a strong performance at both Kolomela and Sishen, and metallurgical coal production at Coal – Australia and Canada increased by 12% driven by improved operating equipment efficiencies at Grasstree. In addition, Minas-Rio produced 0.7 Mt (wet basis) in 2014 after commencing operations in the fourth quarter and reaching first ore on ship on 25 October. Platinum production (equivalent refined) was down 21%, largely driven by the 532,000 ounces lost as a result of the strike affecting three sites in South Africa.
Costs at Coal – Australia and Canada were down 8% largely in relation to labour, contractors and maintenance, while at Nickel lower electricity tariffs resulted in a 5% decrease in production costs. Costs at our South African operations increased as a result of inflationary pressures in the country, although underlying cost reduction initiatives, specifically in relation to corporate restructuring, have made progress.
Platinum unit costs increased by 20% from 2013, owing to the continued incurrence of costs during the strike in the first half of the year. However, during the strike, lower variable costs as a result of the ‘no work, no pay policy’ resulted in cost savings of $300 million.
(1) Excludes De Beers volume/price and impact of the strike at Platinum.
18 Anglo American plc Annual Report 2014
STRATEGIC REPORT GROUP FINANCIAL REVIEW
GROUP FINANCIAL REVIEW

Underlying earnings
Year ended 31 Dec 2014
$ millionUnderlying
EBIT
Net finance costs and
income tax expense
Non-controlling
interestsUnderlying
earnings
Iron Ore and Manganese 1,957 (583) (657) 717
Coal(1) 458 (154) (8) 296
Copper 1,193 (482) (218) 493
Nickel 21 (15) – 6
Niobium(1) 67 (37) – 30
Phosphates(1) 57 (22) – 35
Platinum 32 (14) 7 25
De Beers 1,363 (264) (176) 923
Corporate and other(1) (215) (111) 18 (308)
Total 4,933 (1,682) (1,034) 2,217
(1) Refer to note 3 in the financial statements for changes in reporting segments.
Reconciliation to loss for the period from underlying earnings
$ millionYear ended
31 Dec 2014Year ended
31 Dec 2013
Underlying earnings 2,217 2,673
Operating special items (4,374) (3,211)
Operating remeasurements (1) (550)
Non-operating special items (385) (469)
Financing special items and remeasurements 36 (130)
Special items and remeasurements tax 2 587
Non-controlling interests on special items and remeasurements 38 214
Share of associates’ and joint ventures’ special items and remeasurements (46) (75)
Loss for the financial period attributable to equity shareholders of the Company (2,513) (961)
Underlying earnings per share (US$) 1.73 2.09
BALANCE SHEET
Net assets of the Company totalled $32.2 billion at 31 December 2014 (31 December 2013: $37.4 billion).
This decrease resulted from impairments of $3.9 billion, the impact of the weaker South African rand and Australian dollar of $1.9 billion, depreciation of $2.8 billion and net drawdown of additional debt of $1.8 billion. This was partially offset by capital expenditure for the year of $6.0 billion, and capitalised interest of $0.4 billion.
GROUP ROCE
Attributable ROCE was 8% in 2014 (2013: 11%) as a consequence of weaker commodity prices, alongside ongoing capital expenditure, primarily at Minas-Rio and Grosvenor, partially offset by depreciating foreign exchange and a lower proportion of post-tax earnings attributable to non-controlling interests. The 8% in 2014 would have been 10% at 30 June 2013 exchange rates and commodity prices. Average attributable capital employed increased from $39.7 billion in 2013 to $40.4 billion in 2014. No improvement to ROCE has been realised as a result of the impairments at Minas-Rio and Coal, in line with the ROCE methodology as described on page 203.
19
Strategic report
Anglo American plc Annual Report 2014

Net debt
$ million 2014 2013
Opening net debt (10,652) (8,510)
EBITDA(1) 7,104 8,806
Working capital movements 9 (1,121)
Other cash flows from operations (164) 44
Cash flows from operations 6,949 7,729
Capital expenditure including related derivatives(1) (6,018) (6,075)
Cash tax paid (1,298) (1,201)
Dividends from associates, joint ventures and financial asset investments 460 264
Net interest (473) (533)
Dividends paid to non-controlling interests (823) (1,159)
Attributable free cash flow (1,203) (975)
Dividends paid to Company shareholders (1,099) (1,078)
Tax on sale of non-controlling interest in Anglo American Sur – (395)
Disposals 44 112
Purchase of shares by subsidiaries for employee share schemes (111) (92)
Other net debt movements 150 286
Total movement in net debt (2,219) (2,142)
Closing net debt (12,871) (10,652)
(1) See page 202 for the definition of EBITDA and capital expenditure.
Liquidity and fundingAt 31 December 2014, the Group had undrawn committed bank facilities of $8.4 billion and cash of $6.7 billion.
The Group’s forecasts and projection, taking account of reasonably possible changes in trading performance, indicate the Group’s ability to operate within the level of its current facilities for the foreseeable future.
At 31 December 2014, Anglo American’s ratings were Moody’s Baa2 (negative outlook) and Standard & Poor’s BBB (negative outlook).
Net debtNet debt is a measure of the Group’s financial position. The Group uses net debt to monitor the sources and uses of financial resources, the availability of capital to invest or return to shareholders, and the resilience of the balance sheet. Net debt is calculated as total borrowings less cash and cash equivalents (including derivatives which provide an economic hedge of debt).
The reconciliation in the table above is the method by which management reviews movements in net debt and comprises key movements in cash and any significant non-cash movements on net debt items.
Net debt increased by $2.2 billion to $12.9 billion (2013: $10.7 billion) and net debt to total capital at 31 December 2014 was 28.6%, compared with 22.2% at 31 December 2013.
Cash flow from operationsIn 2014, there was a cash reduction in working capital of $9 million compared with 2013. This was mainly driven by a $576 million decrease in debtors, reflecting the receipt of high year end 2013 debtors at Copper and Kumba following a production outperformance at the end of that year. There was no similar build in debtors at the end of 2014. This reduction has been offset by an increase in stock of $129 million, primarily due to rail and port constraints at Kumba, as well as stock increases at De Beers, partially offset by reductions in high stock levels due to strike action at Platinum. A decrease in creditors of $438 million, driven by working capital requirements at Cerrejón, offset the remaining year-on-year working capital movement.
20 Anglo American plc Annual Report 2014
STRATEGIC REPORT GROUP FINANCIAL REVIEW

Attributable free cash flowTotal capital expenditure remained broadly flat at $6.0 billion (2013: $6.1 billion). Capital expenditure is shown net of proceeds on the disposal of property, plant and equipment (2014: $71 million, 2013: $140 million) and is net of capital expenditure funded by the minority partner at Quellaveco (2014: $42 million, 2013: $46 million). Prior year comparatives have been re-presented to align with current year presentation.
Net debt is expected to continue to rise in 2015, as expenditure on the Group’s projects offsets cash generated from operations.
The majority of dividends paid to non-controlling interests of $823 million (2013: $1,159 million) were to minority shareholders of Copper and Kumba, where external dividends of $116 million and $674 million were paid respectively (2013: $474 million and $663 million).
Disposals are mainly due to the receipt of deferred proceeds related to the formation of the Lafarge Tarmac joint venture.
DIVIDENDS
Analysis of dividends
US cents per shareYear ended
31 Dec 2014Year ended
31 Dec 2013
Interim dividend 32 32
Recommended final dividend 53 53
Total dividends 85 85
Anglo American’s dividend policy is to provide a base dividend that will be maintained or increased through the cycle. Consistent with the policy, the Board has recommended to maintain the final dividend of 53 US cents per share, giving a total dividend of 85 US cents per share for the year (2013: 85 US cents per share), subject to shareholder approval at the Annual General Meeting to be held on 23 April 2015.
The maintenance of the level of the dividend reflects the Board’s confidence in the underlying business. This recommendation is consistent with the commitment to have a disciplined balance between the maintenance of a strong investment grade rating, returns to shareholders and sequencing of future investment in line with resulting funding capacity. From time to time any cash surplus to requirements will be returned to shareholders.
21
Strategic report
Anglo American plc Annual Report 2014

PORTFOLIO: WHERE WE COMPETE
FOCUS:
22 Anglo American plc Annual Report 2014
Images At the beneficiation plant at the Minas-Rio mine site in Conceição do Mato Dentro in Brazil, processing operator Aline de Oliveira Rosa (left) and crushing operator João Batista Ferreira da Silva inspect a conveyor.
In October 2014, the first iron ore from the Minas-Rio project was loaded on to a vessel at Açu, en route to China.
MINAS-RIO DELIVERS
The delivery of first ore on ship from the Minas-Rio iron ore project in Brazil, $400 million below the revised capital budget of $8.8 billion, represented one of our three major commitments to shareholders in 2014. The first cargo of more than 80,000 tonnes of iron ore for the blast furnace pellet feed market was loaded on to a chartered vessel at the dedicated export terminal at the port of Açu in Rio de Janeiro state in October, arriving eight weeks later at the port of Zhanjian in southern China.
What sets Minas-Rio apart is its rare magnitude and quality. One of the world’s biggest undeveloped iron ore resources, its Ore Reserves have more than doubled since 2013, and are currently 2.8 billion tonnes (at 34.4% Fe).
Minas-Rio produces high quality products, with a high iron content of around 67.5%, and low impurity (alumina
and silica are below 3%), and is expected to capture a significant portion of the pellet feed market. Real long term cash costs are likely to be around the $33–$35/tonne mark, placing it among the world’s major low cost iron ore operations.
The focus now at Minas-Rio is on a safe ramp up to between 24 and 26.5 million tonnes (wet basis) of saleable products of iron ore pellet feed in 2016.
Minas-Rio is favourably placed on the global cost curve and provides Anglo American with a major long life asset with which to compete in the global seaborne iron ore market. It also offers the optionality and the marketing benefits of being able to supply iron ore from two continents, providing Anglo American with clear competitive advantage.

COMPETINGBETTER
23Anglo American plc Annual Report 2014
EXPECTED PRODUCTION IN 2016(2)
24–26.5 Mt
RESERVE LIFE
45 yearsRESERVES(1)
~2.8 Bnt
LocationThe Minas-Rio mine site is located in the state of Minas Gerais and the port facility is located in Rio de Janeiro state, both in Brazil.Minas-RioThe Minas-Rio operation comprises a series of open pit mines and a beneficiation plant at the mine site, a 529 kilometre pipeline to transport iron ore in slurry form, a filtration/dewatering plant at the port, and the port itself – a dedicated deep water iron ore export terminal.
121
(1) At 34.4% Fe.(2) Refers to saleable product tonnes (wet basis with
average moisture content of 8.0 wt% of the wet mass).
Strategic report
KEY1 Minas-Rio operation2 Ferroport – export terminal

OPTIMISING OUR DIVERSE PORTFOLIO
A DIVERSIFIED APPROACH
The primary source of competitive advantage in the mining industry is to own high quality assets in the most attractive commodities. Leadership can be achieved by operating such assets to their full capability while optimising the development of their resource potential to ensure strong future asset positioning.
Given the dynamic industry landscape, the attractiveness of commodities can shift over time depending on business and social trends. The ability to anticipate trends and manage our portfolio within this context is critical to delivering sustainable business returns.
Understanding these industry ‘rules’, Anglo American has made clear choices about where it will compete. This has led to a diversified portfolio approach to position the company well to take advantage of opportunities across commodities, geographies and the mining value chain. This approach also helps us cope with downturns and other industry turbulence.
Within our portfolio, we maintain a clear and disciplined focus on our ‘Priority 1’ (P1) assets as these are our greatest source of both short term returns and of potential long term value creation.
A range of attractive commodities across geographiesWe participate in a range of commodities we believe possess attractive medium to long term fundamentals and which span all stages of the economic development cycle. Our diversified portfolio offers exposure to bulk commodities and base metals to precious metals and diamonds (through De Beers). Our bulk commodities include iron ore, manganese, metallurgical coal and thermal coal, all of which benefit from the continued industrialisation and urbanisation in emerging economies. Our base metals and minerals include copper, nickel, niobium and phosphates and offer mid-cycle exposure. In precious metals and minerals, we are the global leader in both platinum and diamonds. These areas are typically later cycle, with strong demand coming from more developed, higher GDP areas, such as the US, Japan and the major cities in China.
While copper, diamonds and iron ore are our top priorities and areas of investment, we are not limited by these preferences. We continue to review opportunities across our full range of preferred commodities.
Our portfolio is multi-regional, which further positions us to access the best opportunities and helps ensure a balance of political and currency risks. Our mining operations, growth projects and exploration and marketing activities extend across southern Africa, South America, Australia, North America, Asia and Europe.
At Anglo American, we believe that being a global diversified mining company positions us best for long term value creation.
Commodity diversification in 2014 and long term view(1)
EBIT (excluding Corporate and Exploration)% of total
Long term
CoalCopper
NickelNiobiumPhosphates
PlatinumDiamonds
2014
(1) Long term view is based on consensus prices and foreign exchange.
Iron Ore and Manganese
Consumables
Cycle stage diversification in 2014 and long term view(1)
EBIT (excluding Corporate and Exploration)% of total
Long term
Consumables (late)Infrastructure Other
EnergyFood
2014
(1) Long term view is based on consensus prices and foreign exchange.
24 Anglo American plc Annual Report 2014
PORTFOLIO: WHERE WE COMPETE

A clear focus on the best assetsWithin our diversified portfolio, we are increasingly focused on higher quality resources and assets which can deliver consistently high margins through commodity cycles. While we manage all holdings in this portfolio to the best of our ability, the clear focus is on P1 assets. P1 assets command the most attention of the business unit and Group management time and are prioritised for capital allocation to ensure they reach their full potential.
We determine asset priority through a careful assessment of strategic attractiveness and ultimate value creation potential. We consider and analyse a number of factors, including cost position, endowment and resource scale and quality, life and specific risk, alongside relevant qualitative factors. We then overlay our view of commodity attractiveness.
Our 16 P1 assets contributed 90% of our underlying EBIT in 2014. Furthermore, the majority of our capital expenditure related to P1 assets.
‘Priority 2’ (P2) assets are those which we believe have exciting cash generation potential, though not on the same scale as P1 assets. We nurture these assets and resource positions to deliver material contributions to returns, or redeploy our efforts and capital where this is not possible. We typically provide ‘lighter touch’ support to P2 assets which often act as a good training ground for talent and innovation.
Lowest priority assets are those that would be better managed by another operator because we choose not to invest in them fully, given finite resources and management time. Some are managed for value, while we look to exit others where appropriate. We are continuing to define and execute our asset divestment programme.
Selective value chain participationOur portfolio and operational focus is predominantly upstream, generally in resource and mine development and operations. We invest in downstream activities and facilities only if they help sustain or increase profits through the value chain and have developed leading capabilities in select areas.
OUR APPROACH TO CAPITAL ALLOCATION
Across the Group, we continue to apply our capital allocation model in line with our portfolio strategy, while maintaining the objective of optimising our investment in the business in order to deliver superior returns.
The model is built on the principles of living within our means and funding our growth from internal cash flow, a rigorous approach to capital approval, and managing our balance sheet to ensure appropriate levels of gearing and financial risk.
Our investment decisions reflect the ongoing application of our capital planning and review processes. Every year, capital plans from across the Group undergo a detailed prioritisation process that ensures our capital budget is affordable under a range of commodity price scenarios, is focused on the highest priority areas of our portfolio, is technically sound, and is advancing projects which we expect to deliver suitably attractive returns.
In addition to this, all material new investments (either in existing or new operations) are evaluated to ensure an appropriate balance between technical and financial risk and supporting the businesses to develop their most attractive new projects.
Study and evaluation expenditureThe Group continues to study a series of expansionary projects, with a range of options, to deliver profitable growth. Our focus is on ensuring we have a series of low risk, high return brownfield expansion options, targeted on our highest priority assets.
Studies in progress include examining the optimal expansion path for Platinum’s Mogalakwena mine, the potential to further optimise the Moranbah-Grosvenor metallurgical coal hub, life extension possibilities in South African thermal coal, and further optimisation of Kumba’s Kolomela mine. The Group has reviewed its approach to project development, with a new emphasis on ensuring that extensive desktop studies of available options are completed prior to moving projects through study phases, so that the most attractive projects are identified and then progressed in the most efficient manner through to execution. These include the Quellaveco copper project, where the feasibility study is expected to be completed in 2015. This revised approach has resulted in study and evaluation costs falling to $218 million in 2014, compared with $326 million in 2013.
South Africa
Geographic diversification in 2014 and long term view(1)
EBIT (excluding Corporate and Exploration)% of total
Long term
AustraliaChile
BrazilRest of the World
2014
(1) Long term view is based on consensus prices and foreign exchange.
25
Strategic report
Anglo American plc Annual Report 2014

Platinum group metals exploration accounted for $8 million and was mainly focused on reviewing and repositioning the project portfolio within South Africa’s Bushveld Complex. In addition, prospecting for platinum group metals was also conducted around our Unki platinum mine in Zimbabwe.
Diamond exploration was $37 million and related to work conducted in Angola, Botswana, Canada, India and South Africa. The exploration team continued to provide technical services to the resource extension programmes for the Jwaneng and Orapa mines in Botswana.
ExplorationExploration is a clear strategic choice for Anglo American to deliver transformative value creation via discovery of P1 assets, maximise value at key operations, and to position us to compete for the next major undeveloped or potential resource in our selected commodities. We continue to have a diversified portfolio of exploration opportunities in highly endowed brownfield environments as well as key land positions and partnerships in frontier belts. Through an emphasis on ‘Smart Discovery’, the team applies innovative exploration concepts and techniques to both frontier and established districts.
Global exploration activity for 2014 concentrated on greenfield projects across a number of mature and frontier locations, as well as on adding value, through increasing resources and reserves, to our operations and advanced projects across all our commodities. Exploration expenditure for the year amounted to $181 million (2013: $207 million) and spanned 19 countries.
Copper exploration expenditure of $37 million consisted mainly of near-mine and greenfield exploration drilling in Chile and assessing the potential in the Quellaveco district in Peru. Greenfield exploration was conducted in Argentina, Australia, Brazil, Chile, Colombia, Indonesia, Kalaallit Nunaat (Greenland), Peru, the US and Zambia. Polymetallic (copper-nickel-platinum group elements) exploration expenditure (included within the nickel commodity line as disclosed in note 4 to the financial statements) amounted to $15 million and was concentrated on the Sakatti project in northern Finland. Greenfield polymetallic exploration was also conducted in the Mosku region of Finland and the Canadian Arctic. Nickel exploration expenditure amounted to $1 million and targeted nickel sulphides in the Morro Sem Boné district in Brazil. Phosphates exploration expenditure totalled $4 million and was concentrated on assessment of district-wide greenfield prospects and further definition drilling at the advanced Morro Preto phosphates project in central Brazil.
Expenditure on metallurgical coal exploration totalled $8 million. This included drilling, seismic surveys in the Middlemount region in Australia, and coal quality analysis and resource assessment work on the tenements surrounding the Peace River Coal Trend Mine and Roman Project in Canada. Expenditure on thermal coal and coal bed methane (CBM) exploration in Africa amounted to $9 million. This was incurred primarily on coal drilling and analysis in South Africa and Botswana, and on CBM drilling and analysis in South Africa. Iron ore exploration expenditure of $25 million was concentrated around operations in South Africa and greenfield projects in Liberia.
%
Iron ore 25
Coal 17
Copper 37
Nickel 16
Phosphates 4
Platinum group metals 8
Diamonds 37
Central exploration activities 37
Total 181
15
10
20
9
2
4
20
20
100
Exploration expenditureby commodity in 2014$ m
26 Anglo American plc Annual Report 2014
PORTFOLIO: WHERE WE COMPETE
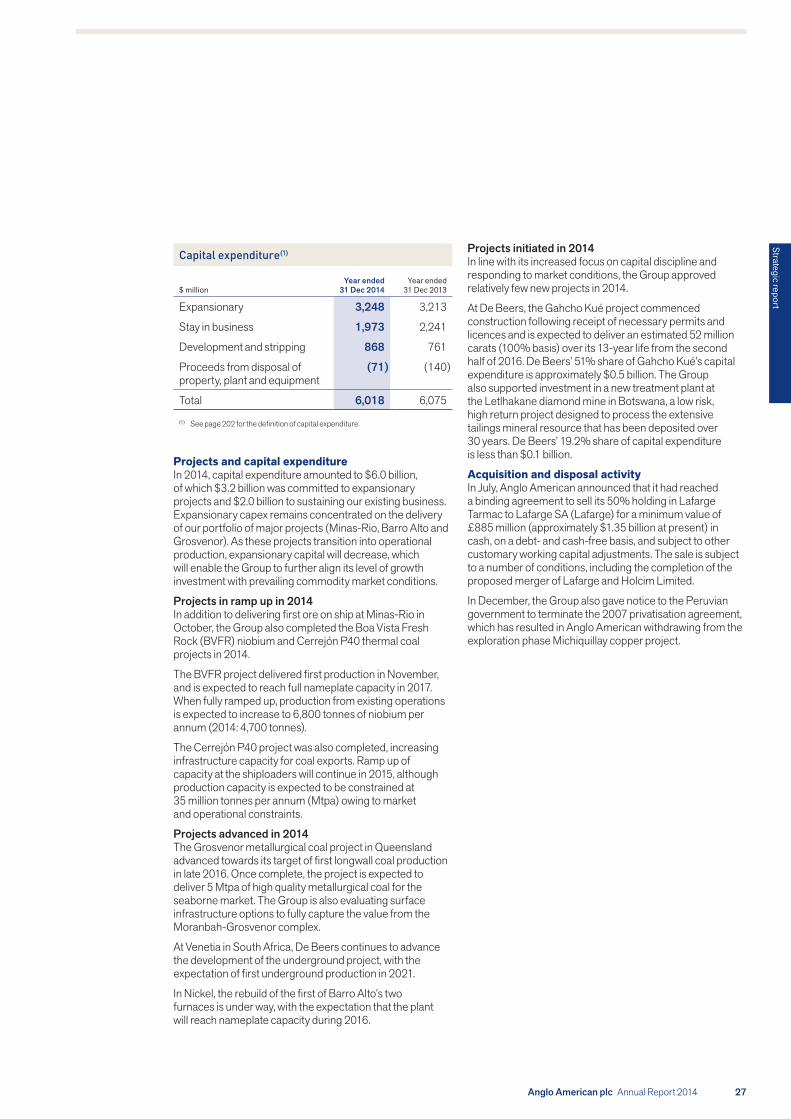
Projects and capital expenditureIn 2014, capital expenditure amounted to $6.0 billion, of which $3.2 billion was committed to expansionary projects and $2.0 billion to sustaining our existing business. Expansionary capex remains concentrated on the delivery of our portfolio of major projects (Minas-Rio, Barro Alto and Grosvenor). As these projects transition into operational production, expansionary capital will decrease, which will enable the Group to further align its level of growth investment with prevailing commodity market conditions.
Projects in ramp up in 2014In addition to delivering first ore on ship at Minas-Rio in October, the Group also completed the Boa Vista Fresh Rock (BVFR) niobium and Cerrejón P40 thermal coal projects in 2014.
The BVFR project delivered first production in November, and is expected to reach full nameplate capacity in 2017. When fully ramped up, production from existing operations is expected to increase to 6,800 tonnes of niobium per annum (2014: 4,700 tonnes).
The Cerrejón P40 project was also completed, increasing infrastructure capacity for coal exports. Ramp up of capacity at the shiploaders will continue in 2015, although production capacity is expected to be constrained at 35 million tonnes per annum (Mtpa) owing to market and operational constraints.
Projects advanced in 2014The Grosvenor metallurgical coal project in Queensland advanced towards its target of first longwall coal production in late 2016. Once complete, the project is expected to deliver 5 Mtpa of high quality metallurgical coal for the seaborne market. The Group is also evaluating surface infrastructure options to fully capture the value from the Moranbah-Grosvenor complex.
At Venetia in South Africa, De Beers continues to advance the development of the underground project, with the expectation of first underground production in 2021.
In Nickel, the rebuild of the first of Barro Alto’s two furnaces is under way, with the expectation that the plant will reach nameplate capacity during 2016.
Projects initiated in 2014In line with its increased focus on capital discipline and responding to market conditions, the Group approved relatively few new projects in 2014.
At De Beers, the Gahcho Kué project commenced construction following receipt of necessary permits and licences and is expected to deliver an estimated 52 million carats (100% basis) over its 13-year life from the second half of 2016. De Beers’ 51% share of Gahcho Kué’s capital expenditure is approximately $0.5 billion. The Group also supported investment in a new treatment plant at the Letlhakane diamond mine in Botswana, a low risk, high return project designed to process the extensive tailings mineral resource that has been deposited over 30 years. De Beers’ 19.2% share of capital expenditure is less than $0.1 billion.
Acquisition and disposal activityIn July, Anglo American announced that it had reached a binding agreement to sell its 50% holding in Lafarge Tarmac to Lafarge SA (Lafarge) for a minimum value of £885 million (approximately $1.35 billion at present) in cash, on a debt- and cash-free basis, and subject to other customary working capital adjustments. The sale is subject to a number of conditions, including the completion of the proposed merger of Lafarge and Holcim Limited.
In December, the Group also gave notice to the Peruvian government to terminate the 2007 privatisation agreement, which has resulted in Anglo American withdrawing from the exploration phase Michiquillay copper project.
Capital expenditure(1)
$ millionYear ended
31 Dec 2014Year ended
31 Dec 2013
Expansionary 3,248 3,213
Stay in business 1,973 2,241
Development and stripping 868 761
Proceeds from disposal of property, plant and equipment
(71) (140)
Total 6,018 6,075
(1) See page 202 for the definition of capital expenditure.
27
Strategic report
Anglo American plc Annual Report 2014

PERFORMANCE: HOW WE WIN
28 Anglo American plc Annual Report 2014
FOCUS:
Images HR development trainers Stephan Voges (left) and Lebogang Langa with the new rope-shovel simulator at Mogalakwena, Anglo American’s flagship platinum mine.
At a drilling site in Mogalakwena’s huge open pit, haul trucks await their turn to take away overburden covering the rich deposits of platinum group metals.
FOCUSING ON OUR BEST ASSETS
Mogalakwena is a Priority 1 asset and the flagship operation in our Platinum portfolio. Although the mine’s operating costs are already among the lowest in the industry, over the past two years the focus has been on implementing a number of business improvement initiatives to raise productivity and reduce costs further – maximising the value delivered from the asset, with minimal additional capital commitment.
The main initiatives include increasing the effectiveness of the mine’s drills, explosives, diesel, shovels and mining trucks. These are yielding significant improvements in availability and utilisation. For example, since 2012, drill penetration has improved by 36%, while mining truck utilisation – which has increased by 15% over the same period – is now considered to be world class.
In 2014, Mogalakwena delivered more than 350,000 ounces of platinum, an increase of 50,000 ounces over 2012. Collectively, the business improvement initiatives have resulted in a 33% increase in total tonnes mined over the past two years. In 2015, we will be implementing Anglo American’s Operating Model at the mine and expect to increase production to 360,000 ounces while incurring limited capital spend.
As well as improving operational performance in the short term, the team at Mogalakwena plans to maximise returns over the longer term. The strategic mining plan has been scrutinised and revised accordingly, with the resultant aim of reducing total tonnage mined by more than 85 million tonnes per annum (Mtpa), against the previous plan of in excess of 200 Mtpa. The consequent fall in the stripping ratio is estimated to save the company close to $3 billion in avoided cost increases over the next 20 years.

29Anglo American plc Annual Report 2014
IMPROVINGPERFORMANCE
MINING RATE POTENTIAL IN 2015
360 koz/pa
RESERVE LIFE
>26 yearsRESERVES (4E)
~135 Moz
LocationMogalakwena is situated 30 kilometres north-west of the town of Mokopane in South Africa’s Limpopo province and is the only operational platinum mine on the Bushveld Complex’s Northern Limb.Mogalakwena mineMogalakwena mines Platreef ore and consists of five open pits. The mining method is open pit truck and shovel and the current pit depths vary from 45 to 245 metres. The ore is milled at the new, fully operational North Concentrator and the older South Concentrator.
Strategic report

IMPROVING FUNDAMENTAL OPERATING PERFORMANCE
safer, more efficient, environmentally friendly and sustainable ways to unlock mineral value.
The third pillar is Anglo American’s Operating Model, which forms a strong foundation from which we can build and transform the business.
OPERATING MODEL FOCUS
Doing the fundamentals better is key to ensuring reliable and predictable performance. Using a single operating model for how we set targets, plan, manage, execute and improve our work brings a consistency of approach, a common language and way of working across the business, irrespective of history or culture. By getting the basics right, and operating our assets to their full potential, we will enhance our long term operational capability.
Key principlesThere are three basic principles underpinning the Operating Model:
Produce stability: Stable operations deliver predictable outcomes.
• Instability comes from unanticipated conditions or actions that destroy our ability to make reliable predictions.
• Stable and capable operations experience lower operating costs and fewer capital expenditure requirements.
Reduce variation: Lower variation in operational performance increases capability and efficiency.
• All processes have variation: the key is to reduce variation either at the input stage or within the process.
Provide clarity: Team members who have a clear understanding of their own work, and how their team works, produce consistent and repeatable outcomes.
Over the past year, we have continued to review our organisation and implement vital changes to ensure the sustainability of our business.
The Operating Model journey
Sponsors agree project scope. Project set up ensures it is adequately planned, resourced and scheduled.
Project set up
01
Systems, processes, new management routines tested and fine tuned. Transition plans prepared.
06
Site readiness
Roles and account-abilities are assigned in detail against the project scope and Operating Model design.
03
Configuration workshop
Working in the new way begins in daily operation. Compliance to the plan is measured.
08
GO LIVE
Dedicated site based project team trained in Operating Model and roll out process.
02
Detailed training
Training for employees whose work procedures have changed.
07
Role holder training
In-depth analysis to identify issues affecting success. Focus on social, technical, resourcing and KPIs.
04
Gap analysis
Critical issues are resolved and transition coaching is provided to embed new ways of working.
09
Stabilisation
Addressing all critical issues that will affect successful implementation.
05
Critical issue resolution
Lessons learned during implementation are captured and shared across the organisation.
10
Close out
RIGHT WORK, RIGHT TIME, RIGHT WAY
The changes implemented in 2014 have been far reaching. We are rebuilding our operational and technical capability to drive improved performance. As part of this focus, our new Operating Model is bringing a consistent and stable approach to how we do all our work – this includes the way we mitigate our environmental impact. By ensuring more predictable performance at our operations we are able to optimise the mine-to-market value chain, and ultimately respond better to customer demands.
REBUILDING TECHNICAL EXCELLENCE
Our business turnaround is dependent on rebuilding our operational and technical capability. To do this, our Technical and Sustainability function’s strategy has three pillars: technical leverage, technical innovation and Anglo American’s Operating Model. We have established a new leadership team whose focus is to deliver on all three pillars.
Technical leverage will come from having highly capable and knowledgeable people in the right roles. We have been able to demonstrate how technical leverage works in practice through an integrated approach to technical initiatives piloted at Minas-Rio in 2014. Teams from both Minas-Rio and elsewhere in Anglo American worked seamlessly, based on clear roles, responsibilities and accountabilities. In 2015, the same disciplined approach is being used to structure a jointly managed programme of improvement initiatives across our Los Bronces, Sishen, Mogalakwena and Kolomela operations. Across the Group our focus will be on raising operations to a consistent level of best practice, improving fundamental operating performance against a detailed framework of ‘what good looks like’.
Through FutureSmart™, Anglo American’s approach to innovation, we will accelerate our ability to use innovation and technology to address our critical challenges and to find
30 Anglo American plc Annual Report 2014
PERFORMANCE: HOW WE WIN

OutcomesCentral to the Operating Model is the discipline of planned work, which has been proven across many industries to deliver substantial benefits:
Productivity • Planned work is 30% more productive than unplanned work.
Costs • An unplanned breakdown of in-service equipment can cost 10 times more than a planned shutdown.
• Stable and capable operations experience lower operating costs, and have fewer capital expenditure requirements.
Safety • Planned work is 70% safer than unplanned work.
Environment • Most environmental discharges result from unplanned stoppages of in-service equipment.
The Operating Model pilot implementation took place at Kumba’s Sishen North mine during 2014. The main benefit identified has been the detailed integrated work schedule, designed to deliver safe production, in line with the forecast in the short to medium term mine plan. Through implementing the Operating Model in ore and internal waste operations, with a clear focus on how work is managed and executed, the mine is consistently delivering significantly higher average daily volumes. This has been achieved through:
• Improving scheduled work from 20% to around 70%
• A 23% efficiency improvement in total tonnes handled
• A 50% reduction in waiting time on shovels.
We expect this improvement to continue and stabilise as the programme embeds into working practices. Stabilisation is the period of greatest adjustment for most people. There are
new role holders in place, existing role holders performing new tasks, new management routines, and additional training in new systems and processes. It represents a transition phase stretching over many months. The Sishen North mine implementation is guiding the roll out to the rest of the mine, focused initially on waste mining, and at the Kolomela plant. Lessons from the pilot have been integrated into the overall implementation approach across the Group.
The Operating Model journeySuccessful implementation of the Operating Model is reliant on all of our people being clear about the work to be undertaken, and also on their being inspired to work together. Following nine months of preparation, we have now derived a comprehensive system for intervening in matters of operational performance. It is based on our two business models coming together. The Operating Model defines the work: right work, right time, right way; the Organisation Model defines accountability for its delivery: right people, right roles.
Roll out programmeBuilding capability internally is crucial to the programme’s success and its sustainability over the long term. Our Centre for Experiential Learning, a dedicated internal training facility, will support Operating Model skills development. Targeted at managerial and supervisory levels, and run on the lines of a professional adult learning institute, teams will learn to apply the Operating Model tools through a mix of virtual reality, modelling and real-time scenarios. This innovative and industry leading facility is planned to be fully operational from mid-2015.
Roll out of the programme has been carefully prioritised in terms of impact, readiness and resources. The initial focus is on the most important value creating assets and those with the greatest long term potential. Businesses not included in the early programme will receive training on some of the Operating Model’s key elements, in particular the analysis of data and business improvement.
2014 2015 2016 2017 2018
Sishen – North mine
Sishen – Rest of mine
Kolomela
Minas-Rio
Mogalakwena
Tumela
De Beers
Los Bronces
Moranbah North
Australia Coal – Other
Coal South Africa
Phosphates
Barro Alto
Corporate – Various
Mine
Operating Model – roll out schedule
31
Strategic report
Anglo American plc Annual Report 2014
In 2014, we completed a review of the ‘route to market’ for a number of commodities. This has resulted in several initiatives, including increasing direct sales to end customers rather than through sales agents.
During the year, we experienced significant uplift from direct PGM sales to new customers through concentrating on the Asian market. In addition, we adopted a more proactive approach to ruthenium and iridium marketing, thereby significantly increasing the revenue and profit contribution from these lesser known PGMs.
During 2014, a new copper concentrates sales book was created to improve commercial value, implement alternative approaches to pricing, and ultimately create long term strategic partnerships with customers.
Product optimisation continues to be an area of focus. During the year, Marketing worked closely with Kumba to generate a higher value product mix based on market demand. Such value creation is expected to increase in 2015 and 2016, as lump ore volumes continue to grow.
Various value chain optimisation activities in the year created additional earnings. These included the optimisation of the growing shipping portfolio by linking freight trades and optimising freight contracts and efficiencies. During 2014, the link was made with iron ore freight trades from South Africa to China and thermal coal freight trades from Indonesia to India, thereby realising cost benefits relative to stand-alone routes. With the addition of Minas-Rio volumes, there are now further opportunities to capture value through greater synergies across the Marketing portfolio.
Good progress has been made with the move into trading. This is a new activity for Anglo American and has been approached with a pilot in thermal coal. The initial focus has been primarily on asset backed trading (buying and selling physical materials, using associated financial trading tools to manage the price and delivery risks). Our trading strategy is designed to take advantage of the maturity of the thermal coal market by benefiting from opportunities to improve profitability and increase returns, and to build capabilities which will allow us to create additional future value. This includes improving capabilities in areas such as supporting processes, systems, position management, and active price management.
MARKETING PRODUCTS FOR FULL VALUE
As commodity markets and the business models of miners and traders evolve, we are changing our marketing approach and strategy to ensure maximum value creation across the entire value chain – from mine to customer.
The establishment, on 1 January 2014, of the Marketing business unit (‘Marketing’) forms an important step to enable us to improve customer focus and, in turn, refine our approach to our various markets. Marketing is now responsible for all sales and marketing activities for iron ore, metallurgical coal, thermal coal, platinum group metals (PGMs), copper, nickel, and niobium. Marketing is also responsible for the management of all associated risk. The management and improvement of risk systems, processes and standards was a major focus during 2014, as we bedded down the new business unit and initiated trading activities.
Through our dedicated sales and marketing hubs in Singapore, London and Luxembourg, we are now closer to our customers both geographically and commercially. Internally, collaboration and knowledge sharing are achieved through co-location of marketing teams and specialist resources, including shipping, market intelligence, trading, and risk and performance management.
Our aim is to generate additional profit through four principal levers:
Marketing excellence: getting the basics right.
Product optimisation: working with the mines to optimise product offering – for example, blending products to create the precise quality desired by individual customers.
Value chain optimisation: creating an efficient flow from mine to market so that customers get the right products, at the right time, and leveraging shipping services.
Trading: buying and selling third party material to complement the physical portfolio.
The target, which forms part of the Driving Value initiative, is an additional $400 million in EBIT by the end of 2016, with the majority of this generated through additional income. A large proportion of this additional value is currently being generated through the marketing excellence activities, with other levers becoming increasingly important over time.
32 Anglo American plc Annual Report 2014
PERFORMANCE: HOW WE WIN
MANAGING OUR IMPACT ON THE ENVIRONMENT
The benefit that mining delivers to society also comes with an impact on the environment; this can be disproportionately borne by the communities adjacent to the mines, many of which rely on the land and ecosystem services. Anglo American believes that it has a responsibility to manage its impact on the environment in such a way that, on balance, host communities can benefit from the mining activities. This implies striking the optimal balance between environmental and other impacts with the societal benefits of mining. Achieving an acceptable balance for our stakeholders influences our acceptance by society, and can influence our future access to mining opportunities and long term business success and viability.
Growing regulatory and social pressure, increasing demands for limited natural resources, the rising costs of and demand for energy and water, and mine closure and future land use issues, all support the business imperative for responsible environmental management. Within this context, the principal environmental risks facing our business are associated with water and climate change. In our Sustainable Development Report we also report on land management, biodiversity, waste and air quality as other important issues that require specific management attention.
We continue to make progress towards achieving our long term environmental goals and internal targets. Tangible improvements in reducing our impact include improved efficiencies, which achieve associated cost savings and productivity benefits.
Strategy and management approachWe seek to manage our environmental risks by understanding and evaluating both our impacts and benefits and by taking advantage of opportunities that deliver long term value to our stakeholders. Our environmental strategies have three main focus areas: driving operational excellence; investing in technology; and engaging and partnering with our stakeholders.
Anglo American’s Environment Way, which includes performance standards covering all our environmental impacts, guides our approach to robust and responsible environmental management. Our mine closure performance requirements and toolbox offer specific guidance on mine closure planning and we now have a dedicated team to provide expert input into mine closure planning and management.
Environmental incidentsThe reporting and understanding of significant environmental incidents is aligned with Anglo American’s learning from incidents process which ensures optimum learning from our mistakes. Anglo American reports environmental incidents in terms of five levels of severity according to their consequence and impact.
In 2014, 14 Level 3 (medium impact) environmental incidents were reported, and one Level 4 (high impact), which resulted in an acidic water discharge at Coal South Africa’s Landau mine polluting a stream causing some discolouration and metal precipitation for several kilometres. Systems at Landau have been improved and the stream remediation is complete. No Level 5 (major impact) incidents occurred during the year. All incidents are addressed on site and the root causes determined and mitigated in order to prevent repeats. Remedial action has been completed for three of the Level 3 incidents and is in progress at the rest. Where appropriate, learning points are shared with operational managers across the Group.
Environmental legislation is tightening and regulatory developments remain uncertain in a number of countries where we operate. Chile is enforcing legislation more rigorously, as part of the country’s environmental regulation reform process. Our Los Bronces operation is addressing a non-compliance relating to afforestation plans and waste dump acid drainage generation. A fine of $3.4 million was imposed for regulatory breaches associated with afforestation and water quality at El Soldado. Remediation plans are being implemented at both operations.
33
Strategic report
Anglo American plc Annual Report 2014

WATER
Like most of the mining industry, our business is highly reliant on water; this is of increasing significance given that more than 70% of our mines are in water stressed areas. For our operations to be sustained in the long term, we aim to protect water quality and support the access rights of other users. We also endeavour to play a leadership role in our water catchments through engagement, partnerships and innovation.
Strategy and management approachOur 10-year water strategy, launched in 2010, guides our approach to demonstrating leadership in water stewardship. All our operations have water programmes in place and employ the ‘avoid, minimise, mitigate’ hierarchy of controls to reduce our water consumption, moderate the potential impact we have on water quality and eliminate water related environmental incidents. Those operations in water stressed locations seek to go beyond our minimum requirements, using a risk based approach that aims to demonstrate leadership by working with partners and through implementing good practice technologies.
Our water management programme is supported by a mandatory water standard and delivered via operational water action plans. Every Anglo American operation works towards a water reduction target using our water efficiency target tool (WETT), which forecasts the projected business as usual demand of individual operations and tracks water saving projects. Operational targets are aggregated at business unit level, where they are included in business unit CEO performance contracts. These make up our Group target of a 14% reduction from our projected water consumption by 2020.
Our performanceAnglo American’s total consumption of new water (not re-used) decreased from 201 million m3 in 2013 to 195 million m3 in 2014. The reduction was primarily attributable to the limited production at Platinum’s strike affected operations, as well as water savings achieved through the implementation of the WETT programme. By the end of 2014 we had achieved an estimated 16% water saving against our projected water usage, exceeding our 2020 target. Water saving projects, which include more effective dust suppression, dewatering of tailings and more efficient ore separation, saved the Group approximately 36 million m3 of water. Water re-use/recycling levels remained at 69%, in line with 2013 levels.
Where operations and projects face high risks related to water, we have developed specific risk management action plans and guidance. Operations most exposed to water security risks and extreme weather risks include Los Bronces and Collahuasi in Chile, Catalão in Brazil, Venetia in South Africa and Moranbah North in Australia. Our principal water quality related risks are associated with high salinity and acid rock drainage at some of our coal operations in Australia and South Africa, tailings dam seepage at our Los Bronces and El Soldado operations in Chile, acid rock drainage from the Donoso waste rock dump at Los Bronces, and high salinity at De Beers’ Snap Lake mine in Canada. We continue to mitigate the risk of acid rock drainage through effective mine design and management procedures such as the concurrent rehabilitation of open cut operations and waste facilities, as well as water treatment solutions, including the use of mobile water treatment plants.
CLIMATE CHANGE AND ENERGY
Climate change has potentially significant implications for our activities, resulting from government policies, changing demand for our products, and physical impacts such as water scarcity and flooding at our operations and neighbouring communities.
Our host governments continue to develop climate change policies. In South Africa, the planned implementation of a carbon tax in 2016 would introduce a higher carbon cost for our business. In Chile, the government plans to introduce a carbon tax, in 2018, of $5 per metric ton of carbon dioxide emitted. In Australia, our Coal business will identify opportunities to participate in the new direct emissions reduction scheme.
%
Water re-used/recycled
New water used for primary activities
New water used for non-primary activities
Total
69
28
3
100
Total water required by use in 2014
Water consumed in ongoing business
million m3
Total water consumed against business as usual 2010–2014
0
100
50
150
200
250
2014
Water consumed by acquisitions, projects and corporate functions(1)
Water consumed by divested businessesWater savings
(1) Recent acquisitions, projects and corporate functions have not been included in the energy, GHG and water reduction target setting process.
2010 2011 2012 2013
34 Anglo American plc Annual Report 2014
PERFORMANCE: HOW WE WIN
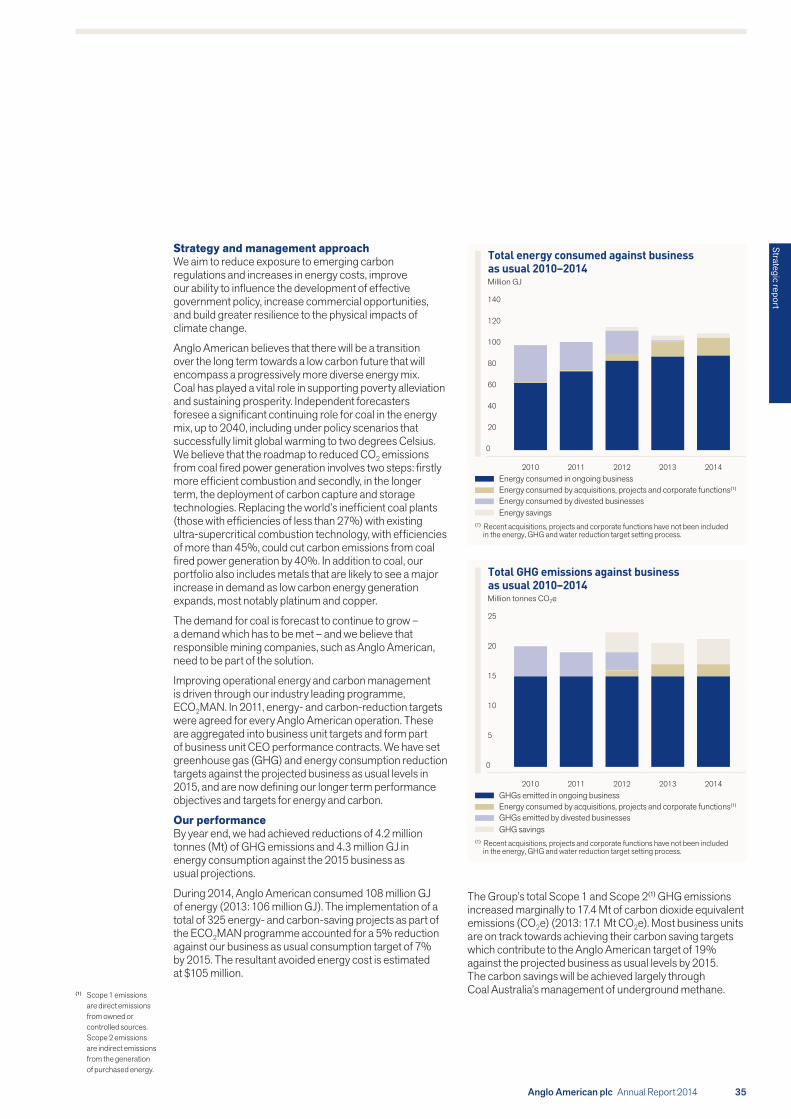
(1) Scope 1 emissions are direct emissions from owned or controlled sources. Scope 2 emissions are indirect emissions from the generation of purchased energy.
Strategy and management approachWe aim to reduce exposure to emerging carbon regulations and increases in energy costs, improve our ability to influence the development of effective government policy, increase commercial opportunities, and build greater resilience to the physical impacts of climate change.
Anglo American believes that there will be a transition over the long term towards a low carbon future that will encompass a progressively more diverse energy mix. Coal has played a vital role in supporting poverty alleviation and sustaining prosperity. Independent forecasters foresee a significant continuing role for coal in the energy mix, up to 2040, including under policy scenarios that successfully limit global warming to two degrees Celsius. We believe that the roadmap to reduced CO2 emissions from coal fired power generation involves two steps: firstly more efficient combustion and secondly, in the longer term, the deployment of carbon capture and storage technologies. Replacing the world’s inefficient coal plants (those with efficiencies of less than 27%) with existing ultra-supercritical combustion technology, with efficiencies of more than 45%, could cut carbon emissions from coal fired power generation by 40%. In addition to coal, our portfolio also includes metals that are likely to see a major increase in demand as low carbon energy generation expands, most notably platinum and copper.
The demand for coal is forecast to continue to grow – a demand which has to be met – and we believe that responsible mining companies, such as Anglo American, need to be part of the solution.
Improving operational energy and carbon management is driven through our industry leading programme, ECO2MAN. In 2011, energy- and carbon-reduction targets were agreed for every Anglo American operation. These are aggregated into business unit targets and form part of business unit CEO performance contracts. We have set greenhouse gas (GHG) and energy consumption reduction targets against the projected business as usual levels in 2015, and are now defining our longer term performance objectives and targets for energy and carbon.
Our performanceBy year end, we had achieved reductions of 4.2 million tonnes (Mt) of GHG emissions and 4.3 million GJ in energy consumption against the 2015 business as usual projections.
During 2014, Anglo American consumed 108 million GJ of energy (2013: 106 million GJ). The implementation of a total of 325 energy- and carbon-saving projects as part of the ECO2MAN programme accounted for a 5% reduction against our business as usual consumption target of 7% by 2015. The resultant avoided energy cost is estimated at $105 million.
The Group’s total Scope 1 and Scope 2(1) GHG emissions increased marginally to 17.4 Mt of carbon dioxide equivalent emissions (CO2e) (2013: 17.1 Mt CO2e). Most business units are on track towards achieving their carbon saving targets which contribute to the Anglo American target of 19% against the projected business as usual levels by 2015. The carbon savings will be achieved largely through Coal Australia’s management of underground methane.
35
Strategic report
Anglo American plc Annual Report 2014
Energy consumed in ongoing business
Million GJ
Total energy consumed against business as usual 2010–2014
0
80
60
40
20
100
120
140
2014
Energy consumed by acquisitions, projects and corporate functions(1)
Energy consumed by divested businessesEnergy savings
(1) Recent acquisitions, projects and corporate functions have not been included in the energy, GHG and water reduction target setting process.
2010 2011 2012 2013
GHGs emitted in ongoing business
Million tonnes CO2e
Total GHG emissions against business as usual 2010–2014
0
15
10
5
20
25
2014
Energy consumed by acquisitions, projects and corporate functions(1)
GHGs emitted by divested businessesGHG savings
(1) Recent acquisitions, projects and corporate functions have not been included in the energy, GHG and water reduction target setting process.
2010 2011 2012 2013
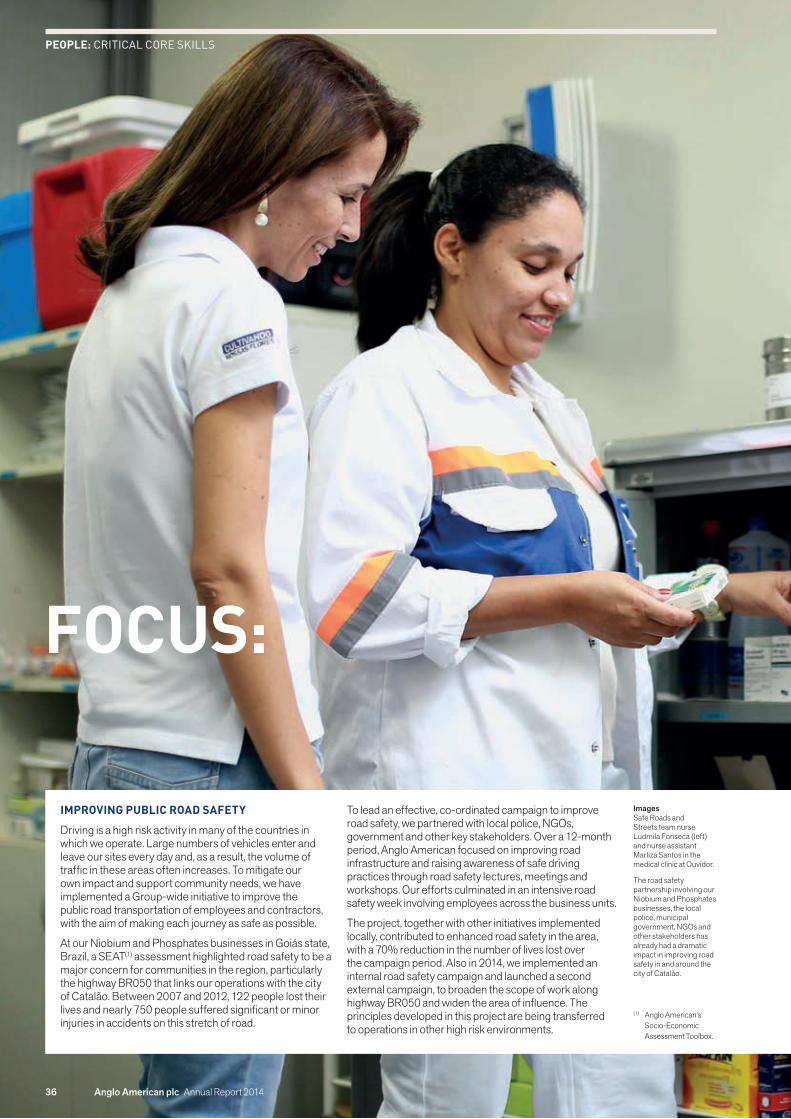
PEOPLE: CRITICAL CORE SKILLS
36 Anglo American plc Annual Report 2014
FOCUS:
Images Safe Roads and Streets team nurse Ludmila Fonseca (left) and nurse assistant Marliza Santos in the medical clinic at Ouvidor.
The road safety partnership involving our Niobium and Phosphates businesses, the local police, municipal government, NGOs and other stakeholders has already had a dramatic impact in improving road safety in and around the city of Catalão.
IMPROVING PUBLIC ROAD SAFETY
Driving is a high risk activity in many of the countries in which we operate. Large numbers of vehicles enter and leave our sites every day and, as a result, the volume of traffic in these areas often increases. To mitigate our own impact and support community needs, we have implemented a Group-wide initiative to improve the public road transportation of employees and contractors, with the aim of making each journey as safe as possible.
At our Niobium and Phosphates businesses in Goiás state, Brazil, a SEAT(1) assessment highlighted road safety to be a major concern for communities in the region, particularly the highway BR050 that links our operations with the city of Catalão. Between 2007 and 2012, 122 people lost their lives and nearly 750 people suffered significant or minor injuries in accidents on this stretch of road.
To lead an effective, co-ordinated campaign to improve road safety, we partnered with local police, NGOs, government and other key stakeholders. Over a 12-month period, Anglo American focused on improving road infrastructure and raising awareness of safe driving practices through road safety lectures, meetings and workshops. Our efforts culminated in an intensive road safety week involving employees across the business units.
The project, together with other initiatives implemented locally, contributed to enhanced road safety in the area, with a 70% reduction in the number of lives lost over the campaign period. Also in 2014, we implemented an internal road safety campaign and launched a second external campaign, to broaden the scope of work along highway BR050 and widen the area of influence. The principles developed in this project are being transferred to operations in other high risk environments.
(1) Anglo American’s Socio-Economic Assessment Toolbox.

37Anglo American plc Annual Report 2014
Strategic report
IMPLEMENTING SAFER ROADSREDUCTION IN LIVES LOST OVER LENGTH OF CAMPAIGN
70%NUMBER OF FAMILIES ESTIMATED TO HAVE BEEN REACHED VIA CHILDREN’S ROAD SAFETY WORKSHOPS
4,500
LocationCatalão is a city in the south of the state of Goiás, Brazil, close to the border with Minas Gerais, and is the centre of our Niobium and Phosphates business.
Niobium and PhosphatesOur Niobium business unit owns two niobium mines, while Phosphates comprises a mine and two chemical processing facilities.
Niobium’s main application is as an alloying agent in high strength steel alloys; phosphates are a principal ingredient of fertilisers.
Strategic report

WORKING TOGETHER
A diverse workforceBy year end, 24% of managers were women (2013: 23%), with 16% of our overall workforce being female (2013: 15%). Across our businesses, targets have been set to further increase female representation.
In our South African operations we continued to promote transformation. By year end, 60% of our management comprised ‘historically disadvantaged South Africans’ (HDSAs) (2013: 64%).
Fostering sound industrial relationsApproximately 76% of our permanent workforce is represented by work councils, trade unions or other similar bodies and covered by collective bargaining agreements.
In South Africa, the labour relations climate remains a particular challenge and concern. Labour instability has been exacerbated by inter-union conflict, and is underpinned by ongoing systemic societal challenges that are deeply rooted in the country’s history and in the legacy of the migrant labour system. The five-month strike at Platinum by the majority union AMCU highlighted the adversarial nature of the situation. The strike was eventually concluded through mutual dialogue and collaboration, with a three-year agreement signed on 24 June. The process nonetheless exacted a significant toll and reflected the need for us to improve relations with our employees and their representative bodies.
A number of long term interventions are being implemented, aimed at developing a more democratic and transparent industrial relations climate, where employees are recognised and respected as equals, based on a culture of trust and respect. Our approach focuses on building relationships with union leadership and jointly driving visible felt leadership programmes, implementing a proactive employee relations programme that engages employees directly, and rolling out a values and culture change programme.
Protecting labour rightsAs signatories to the United Nations Global Compact, we are committed to the labour rights principles provided in the International Labour Organization core conventions, including the right to freedom of association and collective bargaining, the eradication of child and forced labour and non-discrimination. We do not tolerate any form of labour rights abuse and full observance of these issues is also required of our suppliers in tenders. Compliance is audited.
Ensuring a safe working environmentEffectively managing safety and health in the workplace is a direct investment in our business and our employees. Our main priority is to prevent loss of life and serious injuries or disability by creating safe and healthy work environments. A detailed review of our safety and health performance is provided in our Sustainable Development Report, available online at www.angloamerican.com.
Our safety strategy focuses on improving our ability to anticipate and prevent harm to our people, and reduce safety related stoppages at operations. Our principal safety risks relate to transportation, moving machinery, fall of ground, working at heights and isolation/lock-out. Our risk based approach is outlined in Anglo American’s
Guided by our values – safety, care and respect, integrity, accountability, collaboration and innovation – our people apply their skills, knowledge and expertise to ensure we operate successfully and responsibly. It is our people who develop trusting and respectful relationships with communities, governments, suppliers, partners and peers to ensure that we deliver on our promises.
In return, we reward and recognise our people, supporting them in their careers and providing opportunities to help them develop and grow.
THE RIGHT PEOPLE IN THE RIGHT JOBS
In 2013, Anglo American initiated a process of restructuring the organisation, with the aim of ensuring that we have the right people in the right roles to deliver effectively and efficiently on our strategic objectives. The roll out of our new Organisation Model is creating a leaner organisation, with greater clarity on roles and accountabilities, and improved lines of communication between levels of the organisation, while also removing unnecessary work and duplication.
The restructuring of the Group Functions and business unit corporate centres was completed in 2014. The Organisation Model implementation programme is under way at Kumba and will progress during 2015 to other operational areas of the business that support our most important value creating assets.
Talent management and skills development We seek to offer safe, worthwhile and stimulating work, provide opportunities for personal development, pay competitively, recognise and reward excellence, encourage diversity and protect employee rights. Our approach is underpinned by our human resources standards, management systems and processes. Providing high quality training is a key attraction and retention tool. During the year we supported 3,602 graduates, bursars, apprentices and other trainees (2013: 2,974).
Formal learning is delivered at both business unit and Group level, with external training expenditure across Anglo American amounting to $106 million, 2.3% of total employee costs in 2014 (2013: $104 million, 2.0% of total employee costs).
Over the year, the number of permanent employee resignations as a percentage of total permanent employees was 2.0%, the same as in 2013.
We continue to provide basic literacy and numeracy to our employees, contractors and community members, through adult basic education and training and transferable skills programmes.
Our people are as vital to our success as our mining assets – they are the business. It is our people who are inspired to deliver sustainable value that makes a real difference.
38 Anglo American plc Annual Report 2014
PEOPLE: CRITICAL CORE SKILLS

Safety Way – a comprehensive framework of roles and responsibilities supported by a set of safety principles and mandatory safety standards. This underpins the delivery of our safety strategy, which is founded on three key principles: a mindset of zero harm; the elimination of repeat incidents; and the consistent application of simple, non-negotiable standards. Over the past year, we have focused on embedding and reinforcing five specific elements of our safety programme: leadership, front-line supervision, effective planning, incident management, and risk management.
Anglo American operates in some of the highest risk regions for road safety, in particular, South Africa, Brazil and Botswana. In 2014, we launched a Group-wide initiative to improve public road transportation of employees and contractors. Focus areas include standardising contracts for transportation of employees and contractors, and addressing human behaviour aspects.
We regret to report that in 2014, four employees and two contractors lost their lives in work related activities at operations managed by Anglo American. Even taking into account the suspension of activity at our platinum mines during the protracted period of industrial unrest, this still represented a substantial reduction on 2013 when 15 colleagues died on company business. Nevertheless, any loss of life remains unacceptable and we are committed to achieving and maintaining zero fatalities and zero harm.
We have made steady progress in managing safety and our key lagging safety performance indicators suggest that we are starting to achieve the desired step change in our performance. The reporting, investigation, analysis and improved sharing of high potential incidents through the learning from incidents process ensure improvement of controls on sites in order to prevent repeats. We believe that, by mining category and geographical area, we are performing well in the sector, and we aspire to become industry leaders.
During 2014, 48 regulatory stoppages and 17 non-compliance notices were issued across the Group relating to safety, with an additional number of voluntary stoppages as a result of conditions that were deemed potentially unsafe.
Promoting health and well-beingOur occupational health strategy is governed through a series of standards, guidelines and assurance processes aimed at preventing harm to the workforce. Our principal health risks relate to noise, inhalable hazards (specifically, particulate matter – dust), musculoskeletal disorders, alcohol and substance abuse, and fatigue. Our health and well-being programmes include the provision of care and treatment for HIV/AIDS and TB, as well as early diagnosis and preventative care for any other conditions that may lead to ill health in the long term. Another strategic focus is strengthening healthcare systems in underserviced rural areas that are home to many of our employees in South Africa, and building partnerships to improve access to quality healthcare.
During the year we made good progress in managing health risks and delivering on our health strategy, reflected in an improved performance across most of our parameters. Anglo American has not recorded any cases of silicosis since 2011, which is a positive indication of effective management of exposure to respirable crystalline silica over the past 10 years.
WORKING WITH STAKEHOLDERS
Our ability to realise mining’s full benefit to society requires strong relationships with stakeholders – principally employees and the communities around our operations, but also governments, shareholders, joint venture and civil society partners and suppliers. To create shared value for all our stakeholders we must understand their needs, concerns and aspirations, as well as the sustainability risks affecting our business, and consider them as part of our decision making processes as we develop new mines and continue to improve our existing operations.
4,000
0
500
1,500
2,500
3,000
3,500
1,000
2,000
2.5
0
0.5
1.5
2
1
2010 2011 2012 2013 2014Total recordable case frequency rate (TRCFR)Medical treatment cases Lost-time injuries
TRCFR
Lost time injuries, medical treatment cases and total recordable case frequency rate 2010-2014
FIFR
FIFRFatalities
Total number of fatal injuries and fatal injury frequency rate 2010–2014
0
10
5
15
20
25
30
0
0.006
0.004
0.002
0.008
0.010
0.012
0.014
0.016
2010 2011 2012 2013 2014
Fatalities
39
Strategic report
Anglo American plc Annual Report 2014
While specific interests and concerns typically vary by stakeholder group and region, industrial unrest in South Africa remains a particular priority. To address this, we continue to invest in enhancing our relationship with the South African government, and with communities around our Rustenburg and Limpopo mines. We are also engaging more closely with investors, under the leadership of chief executive Mark Cutifani, on the progressive business turnaround.
Finding solutions to increasingly complex societal challenges requires collaboration between business, government, civil society, labour, and research bodies. We place a strong emphasis, therefore, on developing partnerships with a broad range of stakeholders.
Social investment output indicators
Total number of community development projects delivering benefits to communities in 2014
3,047
Total number of businesses supported 58,257
Jobs created/maintained through enterprise development initiatives
96,873
Beneficiaries of education projects 127,369
Beneficiaries of sports, arts, culture and heritage projects
263,062
Beneficiaries of community development projects
691,502
Beneficiaries of disaster and emergency relief projects
335,936
Beneficiaries with improved livelihood 121,005
Managing our social performance Anglo American’s social performance strategy focuses on observing human rights, proactive engagement with our stakeholders and leveraging our business to support long term socio-economic development. Our approach is implemented through a comprehensive set of social performance requirements that are detailed in Anglo American’s Social Way. In 2014, we revised the requirements of the Social Way, in line with the latest best practices and standards and emerging stakeholder expectations. In-depth site audits of compliance with the updated Social Way will be undertaken on a three-year rotation basis from 2015, with desk based assessments of all sites conducted annually.
Within our host communities, our industry leading Socio-Economic Assessment Toolbox (SEAT), now in its third version, is our primary means to improve operations’ understanding of their socio-economic impacts (both positive and negative), enhance stakeholder dialogue and the management of social issues, build our ability to support local socio-economic development, and foster greater transparency and accountability.
Observing human rightsIncorporating respect for human rights into regular business practice is both a moral and business imperative. Our approach is aligned with the ‘Protect, Respect and Remedy’ framework set out in the UN Guiding Principles on Business and Human Rights. In 2014, we developed a stand-alone human rights policy (available online at www.angloamerican.com) and established the Anglo American human rights framework to address our principal human rights risks. Human rights commitments have been integrated into the Social Way, and will be further integrated into SEAT and other relevant policies, procedures, management systems and tools throughout the business.
Complaints and grievancesOur mandatory Group-wide social incident reporting mechanism, which includes complaints and grievances, is designed to ensure openness, accountability and respectfulness in our handling of any stakeholder grievances. The facility is a confidential and secure means for our local communities and other external stakeholders to raise concerns. All submissions are reviewed and responses provided and, where necessary, mitigating actions are implemented.
In addition, at Group level, an anonymous tip-off procedure called ‘Speak Up’ allows any of our stakeholders to confidentially report concerns and incidents relating to the integrity of our conduct. Disciplinary proceedings, including termination, are instituted where employees are found to have behaved contrary to our principles.
Responsible supply chain managementOur supplier sustainable development assurance programme addresses adherence to local legislative requirements and best practices in areas including safety, the environment, corruption, human rights and HIV management. A risk based approach is followed to identify suppliers to be audited, with a focus on small and medium enterprises, and we conduct follow-up audits to assess progress against improvement plans. During 2014, many of our largest contractors in South Africa received SEAT training, which includes our stance on responsible sourcing. In addition, business units have delivered presentations to smaller suppliers we have identified as being high risk. Incidents of non-compliance with contractual conditions typically involve minor issues that are easily addressed.
Community developmentOur socio-economic development strategy guides our approach to building resilience within communities to prosper beyond mine closure through a range of interconnected programmes. To support local markets, we focus on promoting local procurement, enterprise development and workforce development. These programmes create a strong platform for job creation within and outside the mining value chains. To improve the delivery of public services, we are concentrating on working with local governments to strengthen their capacity to deliver on their core public service obligations, and on sustainable community health and education initiatives. This new approach to socio-economic development delivery is being rolled out across the Group, with key sites being prioritised for early implementation.
40 Anglo American plc Annual Report 2014
PEOPLE: CRITICAL CORE SKILLS

Local procurementOur local procurement initiatives add value to the business and provide the anchor for boosting economic growth in communities around our operations. They are designed to optimise opportunities to integrate local businesses into our global supply chain and advise them on how to compete successfully for new business. In promoting inclusive procurement practices, we do not compromise on quality, delivery, service, safety, health and environmental performance, or on any technical requirements.
In 2014, expenditure with suppliers based in the communities close to our operations was $1.7 billion (2013: $1.6 billion). This represented 14% of total addressable supplier expenditure (2013: 12%), against a Group target of 13%.
In South Africa, our operations contribute to the country’s drive to promote black economic empowerment. In 2014, Anglo American managed businesses spent ZAR 39.3 billion (2013: ZAR 32.4 billion) with ‘historically disadvantaged South African’ businesses (excluding goods and services procured from the public sector and public enterprises).
Enterprise developmentOur enterprise development programmes are designed to foster the potential of local entrepreneurs to build local capacity and ensure that the local economy is able to provide opportunities, even after mine closure. The schemes integrate with our supply chain (more than $18 billion globally) and develop long term platforms for partnerships with governments, NGOs and private sector companies.
Our well established schemes, Zimele in South Africa and Emerge in Chile, have supported more than 95,000 jobs over the past seven years. Based on our experience with these schemes, we developed a best practice model, which was used to implement schemes in Botswana and Brazil in 2013, and in Peru in 2014. These three programmes have supported more than 1,500 jobs during 2014 and aim to support an additional 3,000 jobs by the end of 2015 and close to 10,000 by the end of 2016.
Building local capacityOur capacity development activities focus on strengthening the skills, competencies and abilities of employees, community members and key local institutions to promote robust, self-sufficient local economies long after our mines have closed. As we can only offer a limited number of jobs, diversifying our skills development initiatives to promote broader employment opportunities enables us to play a more productive role in meeting community expectations. Our activities included spending $6.1 million towards institutional capacity development in 2014 (2013: $3.1 million), often partnering with local municipalities on projects. In South Africa in 2014, we launched a major local government capacity building programme in 11 municipalities, in partnership with the Development Bank of Southern Africa, with an investment of $3 million.
Infrastructure developmentWe operate in areas that are often underdeveloped and remote, where we can create synergies with infrastructure associated with our mines – such as roads, health facilities and water – for the benefit of local communities. A particular focus is investing in housing development in South Africa, in areas where services are inadequate or do not exist. Across the Group’s businesses in the country, we invested $109 million on housing projects in 2014.
Corporate social investmentTo maximise development benefits, we prioritise the implementation of corporate social investment (CSI) programmes that are linked to our core functions and support activities where we have limited opportunities to contribute through our value chains and expertise. Anglo American’s CSI expenditure in local communities totalled $135.8 million(1) (2013: $127.5 million). This figure represents 3.0% of underlying EBIT, excluding associates and joint ventures.
%
Community 66,084development
Education and training 27,409
Other 13,249
Health and welfare 10,273
Institutional 6,133capacity development
Sports, arts, culture 4,891and heritage
Environment 2,352
Employee 2,184matched giving
Water and sanitation 1,721
Disaster and 1,477emergency relief
Total 135,773
$’000
49
20
10
7
4
4
2
2
1
1
100
Global expenditure by type
%
South Africa 73,143
Peru 18,255
Chile 17,906
Brazil 9,906
Canada 9,376
Namibia 3,419
Rest of World 1,911
United Kingdom 938
Botswana 919
Total 135,773
54
13
13
7
7
3
1
1
1
100
$’000
Global expenditure by country
(1) Included within the CSI expenditure figure for 2014 is expenditure relating to Zimele ($10.1 million) and social programmes delivered as part of Iron Ore Brazil’s licensing conditions ($3.5 million). These items were not included in previous years.
41
Strategic report
Anglo American plc Annual Report 2014

EFFECTIVE RISK MANAGEMENT
Understanding our key risks and developing appropriate responses are critical to our future success. We are committed to a robust system of risk identification and an effective response to such risks.
Byron Grote Chairman, Audit Committee
HOW WE MANAGE RISKManagement of risk is critical to the success of Anglo American. Our Group is exposed to a variety of risks that can have a financial, operational or reputational impact. Effective management of risk supports the delivery of our objectives and the achievement of sustainable growth.
HOW DOES RISK RELATE TO OUR STRATEGIC INTENTS?
Risks can arise from events outside of our control or from operational matters. Each of the key risks described on the following pages can have an impact on our ability to achieve our strategic intents. This is illustrated by reference to each of our strategic intents:
•Where we compete: optimising our diverse portfolio We will focus management time and prioritise capital on the mining assets that offer us the most attractive long term value creation potential
•How we win: maximising our performance We will maintain a highly competitive mindset, with innovation and outstanding delivery at the forefront of how we drive change
•Critical core skills: creating a capable organisation We will ensure that our people and organisation have the critical core skills, supported by key people systems, to ensure we improve our returns.
For more information on the Sustainability CommitteeSee page 76
For more information on the Audit CommitteeSee page 78
2 Analysing risks and controls to manage identified risks
1
Identifying risks
4 Reporting
and monitoring
3 Determining management actions required
Anglo American’s assessment of strategic, operational, project and sustainable development related risks
1
Identifying risks A robust methodology is used to identify key risks across the Group; at business units, operations and projects. This is being applied consistently through the development and ongoing implementation of a Group integrated risk management standard.
2
Analysing risks and controls to manage identified risks Once identified, the process will evaluate identified risks to establish root causes, financial and non-financial impacts and likelihood of occurrence. Consideration of risk treatments is taken into account to enable the creation of a prioritised register.
3
Determining management actions requiredEffectiveness and adequacy of controls are assessed. If additional controls are required, these will be identified and responsibilities assigned.
4
Reporting and monitoringManagement is responsible for monitoring progress of actions to treat key risks and is supported through the Group’s internal audit programme, which evaluates the design and effectiveness of controls. The risk management process is continuous; key risks are reported to the Audit Committee, with sustainability risks also being reported to the Sustainability Committee.
STRATEGIC REPORT RISK
42 Anglo American plc Annual Report 2014

As mining is a business that can span decades, many of its attendant risks are long term in nature, and there may not be any significant change year-on-year. The commentary provided on each risk is intended to highlight significant changes in the profile of individual risks or describe our experience of the risk over the course of 2014.
The risks defined in this report are those we believe are our principal risks. In previous years we have reported risks relating to climate change, counterparty, exploration, supply chain, contractors, Ore Reserves and Mineral Resources, bribery and corruption, joint ventures, and acquisitions and divestments, all of which we remain exposed to, though we do not consider them to be our principal risks. Therefore, such risks are not discussed in the report.
The risks included in this report could threaten our ability to achieve our 2016 objectives.
We also recognise that risks cannot be viewed in isolation. Emergence of one risk may be caused by one or more other risks, or may cause another risk to emerge. For example, project delivery or production risk can be influenced by risks relating to supply, inflation, political matters, legal and regulatory requirements, infrastructure or community relations. This interconnectivity, and the relationship of risks to our above-mentioned strategic elements, requires significant emphasis to be placed on the management of risk and the effectiveness of our risk controls, with the identification and understanding of our risks being the first step in what is a continuous process.
PRINCIPAL RISKS AT A GLANCE
EXTERNAL OPERATIONAL
Increased risk • Portfolio restructuring (new risk) • Commodity prices
• None
Decreased risk • None • Employees
No change in risk
• Political, legal and regulatory • Currency risk • Liquidity risk • Inflation • Information and cyber security
• Community relations • Environment • Event risk • Infrastructure
• Operational risk and project delivery • Safety and health
Pages 44–45 Pages 46–47
43
Strategic report
Anglo American plc Annual Report 2014

44 Anglo American plc Annual Report 2014
EXTERNAL RISKS
STRATEGIC REPORT RISK
COMMODITY PRICES Pillars of value:
The prices of all the commodities that Anglo American produces are subject to wide fluctuation.
Impact: Commodity price volatility can result in a material and adverse movement in the Group’s operating results, asset values, revenues and cash flows. Falling commodity prices could prevent us from completing transactions that are important to the business and which may have an adverse effect on Anglo American’s financial position.
If commodity prices remain weak for a sustained period, growth projects may not be viable and we may not be able to compete for new, complex projects that require significant capital investment. Commodity prices are one of the significant factors that rating agencies use to determine credit rating.
Root cause: Commodity prices are determined primarily by international markets and global supply and demand. Demand for commodities will largely be determined by the strength of the global economic environment.
Mitigation: Our diverse commodity portfolio provides some protection to this risk, and our policy is not to engage in commodity price hedging. We constantly monitor the markets in which we operate, reviewing capital expenditure programmes accordingly, so as to ensure the supply of our products reflects forecast market conditions.
Increased risk
Commentary: During 2014, prices of most of the commodities we mine weakened as a result of lacklustre economic conditions in many of our key markets and increased supply of some products. This trend is expected to continue for some time.
POLITICAL, LEGAL AND REGULATORY Pillars of value:
Wherever we operate, our businesses may be affected by political or regulatory developments, including changes to fiscal regimes or other regulatory regimes.
Impact: Potential impacts include restrictions on the export of currency, expropriation of assets, imposition of royalties or other taxes targeted at mining companies, and requirements for local ownership or beneficiation. Political instability can also result in civil unrest and nullification of existing agreements, mining permits or leases. Any of these may adversely affect the Group’s operations or results of those operations.
Root cause: The Group has no control over local political acts or changes in local tax rates. It recognises that its licence to operate through mining rights is dependent on a number of factors, including compliance with regulations.
Mitigation: The Group actively monitors regulatory and political developments on a continuous basis.
No change in risk
Commentary: Due to market conditions, industry appetite for developing projects is low, particularly where political risk is high. The commodity cycle downturn may reduce the ability of host governments to impose new taxes and royalties. However, there is a continuing need to manage government relations in this period of significant change.
INFORMATION AND CYBER SECURITY Pillars of value:
The Group is exposed to risk of attack by third parties on our information systems.
Impact: Attacks on our information systems may result in loss of sensitive or proprietary information and fraud. Damage is possible to equipment that is critical to mining or processing of ore, resulting in interruption to production.
Root cause: Cyber risk arises from criminal activity to cause disruption or attempts by third parties to access sensitive information. The pace of technological development makes it challenging for any organisation to prevent increasingly sophisticated methods of attacking information technology systems.
Mitigation: Anti-virus software and general computer controls provide a level of protection. In addition, monitoring of networks is undertaken to identify suspicious activity in order that appropriate action can be taken. We receive information on threats through security consultants and agencies on an ongoing basis. The Group also has an Information Security policy that introduces the measures expected of employees in handling sensitive information.
No change in risk
Commentary: The risk is unchanged but we recognise the threat is continually developing on a global basis.

45
Strategic report
Anglo American plc Annual Report 2014
INFLATION Pillars of value:
The Group is exposed to potentially high rates of inflation in the countries in which it operates.
Impact: Higher rates of inflation may increase future operational costs if there is no concurrent depreciation of the local currency against the US dollar, or an increase in the dollar price of the applicable commodity. This may have a negative impact on profit margins and financial results.
Root cause: Cost inflation in the mining sector is more apparent during periods of high commodity prices as demand for input goods and services can exceed supply.
Mitigation: We closely manage costs through our business improvement and supply chain initiatives and, where necessary, through adjusting employee and contractor numbers. The Driving Value programme has targeted a $500 million reduction in overheads by 2016.
No change in risk
Commentary: While operating improvements, restructuring and cost saving programmes are contributing to financial performance, some of the benefits will be offset through uncontrollable cost increases.
CURRENCY RISK Pillars of value:
The Group is exposed to currency risk when transactions are not conducted in US dollars.
Impact: Fluctuations in the exchange rates of the most important currencies influencing our own operating costs and asset valuations (the South African rand, Chilean peso, Brazilian real, Australian dollar, and pound sterling) may materially affect the Group’s financial results.
Root cause: The global nature of the Group’s businesses exposes the Group to currency risk.
Mitigation: Given our Group’s diversified nature, our policy is generally not to hedge currency risk. Mitigation in the form of foreign exchange hedging is limited to debt instruments and capital expenditure on major projects.
No change in risk
Commentary: Further description of currency risk and analysis of sensitivity to foreign exchange movement is provided on pages 156–157.
PORTFOLIO RESTRUCTURING Pillars of value:
Inability to achieve asset sales as planned.
Impact: Failure to achieve planned sales may influence cash flow generation targets and ability to achieve required levels of return.
Root cause: The current commodity market climate is creating a challenging environment in which to sell assets.
Mitigation: A strategy for the transaction process has been developed, aimed at maximising buyer interest.
New risk
Commentary: N/A
LIQUIDITY RISK Pillars of value:
Our Group is exposed to liquidity risk in terms of being able to fund operations and growth.
Impact: If we are unable to obtain sufficient credit as a result of prevailing capital market conditions, we may not be able to raise sufficient funds to meet ongoing financing needs, develop projects, compete for new projects requiring significant capital expenditure, or fund acquisitions. As a result, our revenues, operating results, cash flows or financial position may be adversely affected. The Group’s access to liquidity or cost of funding could be adversely influenced by any credit rating agency downgrade.
Root cause: Liquidity risk arises from uncertainty or volatility in the capital or credit markets owing to perceived weaknesses in the global economic environment, or possibly as a
response to shock events. Liquidity risk also arises when lenders are insecure about our long term cash generative capacity.
Mitigation: We have an experienced Treasury team which is responsible for ensuring that there are sufficient committed loan facilities in place to meet short term business requirements after taking into account cash flows from operations and holdings of cash, as well as any Group distribution restrictions. We limit exposure on liquid funds through a policy of minimum counterparty credit ratings, daily counterparty settlement limits and exposure diversification.
No change in risk
Commentary: All financing needs have been met, though capital availability for project development or acquisition is likely to be low until existing commitments are fulfilled or a stronger pricing environment exists.

46 Anglo American plc Annual Report 2014
OPERATIONAL RISKS
STRATEGIC REPORT RISK
INFRASTRUCTURE Pillars of value:
Inability to obtain adequate supporting facilities, services and installations (water, power, road, rail and port, etc.).
Impact: Failure to obtain supporting facilities may affect the sustainability and growth of the business, leading to loss of competitiveness, market share and reputation. Failure of rail or port facilities may result in delays and increased costs, lost revenue, and a worsening reputation with customers. Failure to procure shipping costs at competitive market rates may reduce profit margins.
Root cause: The potential disruption of ongoing generation and supply of power is a risk we face in
a number of countries. Our operations and projects can be located in areas where power and water supplies are not certain and may be affected by population growth, the effects of climate change or lack of investment by owners of infrastructure. We rely upon effective rail and port facilities for transporting our products. We use third parties to ship products to customers, if required.
Mitigation: We seek to work closely with suppliers of infrastructure to mitigate the risk of failure and have established contingency arrangements. Long term agreements with suppliers are sought where appropriate.
No change in risk
Commentary: Details of programmes to manage water consumption and power usage are provided on pages 34–35.
EVENT RISK Pillars of value:
Damage to physical assets from fire, explosion, natural catastrophe or breakdown of critical machinery.
Impact: The direct costs of repair or replacement combined with business interruption losses can result in financial losses.
Root cause: Some of our operations are located in areas exposed to natural catastrophes such as earthquake/extreme weather conditions. The nature of our operations exposes us to potential failure of mining pit slopes, underground shafts
and tailings dam walls, fire, explosion and breakdown of critical machinery, with long lead times for replacement.
Mitigation: Specialist consultants are engaged to analyse such event risks and provide recommendations to prevent or limit the effects of such a loss. Contingency plans are developed to respond to significant events and restore normal levels of business activity. Anglo American purchases insurance to protect itself against the financial consequences of an event, subject to availability and cost.
No change in risk
Commentary: Management continues to implement measures to mitigate this risk.
ENVIRONMENT Pillars of value:
Some of our operations create environmental risk in the form of dust, noise or leakage of polluting substances, or through the potential for uncontrolled breaches of tailings dam facilities. These can be harmful to our employees, contractors and the communities near our operations.
Impact: Potential impacts include fines and penalties for past, current or future events, statutory liability for environmental remediation and other financial consequences that may be
significant. Governments may force closure of mines on a temporary or permanent basis or refuse future mining right applications.
Root cause: The mining process, including blasting and processing of orebodies, can generate dust and noise and requires the storage of waste materials in liquid form.
Mitigation: The Group implements a number of standards to prevent, monitor and limit the impact of its operations on the environment.
No change in risk
Commentary: Our environmental performance during 2014 is detailed on pages 33–35.
COMMUNITY RELATIONS Pillars of value:
Disputes with communities may arise from time to time.
Impact: Failure to manage relationships with local communities, government and NGOs may disrupt operations and negatively affect Anglo American’s reputation as well as our ability to bring projects into production.
Root cause: We operate in several countries where ownership of rights in respect of land and resources is uncertain and where disputes in relation to
ownership or other community matters may arise. The Group’s operations can have an impact on local communities, including the need, from time to time, to relocate communities or infrastructure networks such as railways and utility services.
Mitigation: We have developed comprehensive processes to enable our business units to effectively manage relationships with communities and we actively seek to engage with, and support, all communities affected by our operations.
No change in risk
Commentary: Further description of our work during 2014 to maintain and improve relationships with our stakeholders is provided on pages 38–41.

47
Strategic report
Anglo American plc Annual Report 2014
SAFETY AND HEALTH Pillars of value:
Failure to maintain high levels of safety management can result in harm to our employees, contractors and communities near our operations. Occupational health risks to employees and contractors include noise induced hearing loss, occupational lung diseases and tuberculosis (TB). In sub-Saharan Africa in particular, HIV/AIDS is a threat to economic growth and development.
Impact: In addition to injury and damage to health, impacts could include fines and penalties for past, current or future issues, liability to employees or third parties, impairment of Anglo American’s reputation, industrial action or inability to attract and retain skilled employees. Government authorities may force closure of mines on a temporary or permanent basis or refuse mining right applications. The recruitment and retention of skilled people required to meet growth aspirations can be affected by high rates of HIV/AIDS.
Root cause: Mining is a hazardous industry and working conditions such as weather, altitude and temperature can add to the inherent dangers of mining, whether underground or in open pit mines.
Mitigation: Anglo American sets a very high priority on safety and health matters. A safety and health risk management process, global standards and a technical risk assurance programme form part of a consistently applied robust approach to mitigating safety, health and environmental risk. Anglo American provides free anti-retroviral therapy to employees with HIV/AIDS and undertakes education and awareness programmes to help prevent infection or spread of infection.
No change in risk
Commentary: Details of safety performance and our approach to health management are provided on pages 38–39.
OPERATIONAL RISK AND PROJECT DELIVERY Pillars of value:
Failure to meet production targets or project delivery timetables and budgets.
Impact: Increased unit costs may arise from failure to meet production targets, thus affecting our operational and financial performance. Failure to meet project delivery timetables and budgets may delay cash inflows, increase capital costs, incur contractual penalties, and reduce profitability, as well as have a negative impact on the Group’s reputation.
Root cause: Increasing regulatory, environmental, access and social approvals can increase construction costs and introduce delays.
Operational performance can be influenced by technical and engineering factors as well as events or circumstances that have an impact on other critical inputs to the mining and processing of minerals.
Mitigation: Management oversight of operating performance and project delivery through regular executive management briefings, a continuous focus on improvement of operations through our business improvement programme, and consistent application of the Group’s methodology for new projects, are vital aspects in managing this risk.
No change in risk
Commentary: The Minas-Rio project achieved first ore on ship during 2014 (refer to pages 22–23) and our focus is now on ramp up. We continued to see improved operational performance across our business units as a result of management actions.
EMPLOYEES Pillars of value:
The ability to recruit, develop and retain appropriate skills for the Group. Strikes or other industrial relations disputes may occur.
Impact: Failure to retain or recruit skilled employees may lead to increased costs, and interruptions to existing operations and new projects. Industrial disputes adversely affect production, costs and the results of operations.
Root cause: We are subject to global competition for skilled labour. Our assets and projects are often in remote places or in countries where it is a challenge to recruit suitably skilled employees.
In the key countries where the Group operates, the majority of employees are members of trade unions. Negotiations over wage levels or working conditions can sometimes fail to result in agreement.
Mitigation: Anglo American aims to be the employer of choice in the mining sector. A comprehensive human resources strategy has been devised to support that objective. The Group seeks constructive relationships and dialogue with trade unions and employees in all its businesses.
Decrease in risk
Commentary: During 2014 we completed the review of our Organisational Model, corporate structure and a number of business units. Implementation of the changes and restructuring programmes identified has progressed. Further details are provided on page 38.

IRON ORE AND MANGANESE
Paulo Castellari-Porchia CEO – Iron Ore Brazil
Norman Mbazima CEO – Kumba Iron Ore
KEY Open cut Other
2
1
16
14
3
2
15
1
1 KUMBA IRON ORE – SISHEN MINE 51.5% effective ownershipSishen mine, located in the Northern Cape province, produces a leading quality lump ore and also a premium fine ore. Sishen produced 35.5 Mt of iron ore in 2014.Reserve life: 16 years
2 KUMBA IRON ORE – KOLOMELA MINE 51.5% effective ownershipKolomela mine is situated close to Sishen mine and produced 11.6 Mt of iron ore in 2014.Reserve life: 21 years
3 KUMBA IRON ORE – THABAZIMBI MINE 51.5% effective ownershipThabazimbi mine is located in the Limpopo province and produced 1.1 Mt of iron ore in 2014.Reserve life: 9 years
4 KUMBA IRON ORE PORT OPERATIONS Sishen and Kolomela mines are serviced by a dedicated iron ore rail link, which transports iron ore to domestic customers and to Saldanha Bay where it is shipped to export markets. The rail and port operations are owned and operated by the state owned entity Transnet.
5 SAMANCOR MANGANESE – HOTAZEL 29% ownership (BHP Billiton owns 44% and has management control. Empowerment partners own 27%)Wessels is an underground mine of hydro-thermally enriched manganese of a high grade. Mamatwan is an opencast operation. The ore lends itself to technologically advanced beneficiation processes.Wessels reserve life: 46 years Mamatwan reserve life: 17 years
6 SAMANCOR MANGANESE – METALLOYS 40% ownership (BHP Billiton owns 60% and has management control)With four large electric furnaces, Metalloys produces high-carbon and medium-carbon ferromanganese.
1 MINAS-RIO 100% ownershipThe Minas-Rio operation is located in the states of Minas Gerais and Rio de Janeiro and includes an open pit mine and a beneficiation plant in Minas Gerais, producing direct reduction and blast furnace pellet feeds. The iron ore produced is transported to the port in Rio de Janeiro state through a 529 km pipeline. The mine produced 0.7 Mt (wet basis) of iron ore in 2014.Reserve life: 45 years
2 FERROPORT 50% ownershipFerroport owns and operates the iron ore handling and shipping facilities at the port of Açu, which is currently under construction (formerly referred to as LLX Minas-Rio).
1 GROOTE EYLANDT MINING COMPANY (GEMCO) 40% ownership (BHP Billiton owns 60% and has management control) The mining operation at GEMCO extracts high grade manganese ore and accounts for more than 15% of the world’s high grade ore production. Approximately 70% of its production is exported.Reserve life: 12 years
2 TASMANIAN ELECTRO METALLURGICAL COMPANY (TEMCO) 40% ownership (BHP Billiton owns 60% and has management control)TEMCO is a ferro-alloy smelter and remains the only manganese ferro-alloy plant in Australia. It produces high carbon ferro-manganese, silicomanganese and sinter.
SOUTH AFRICA
2
12
12
12
1
AUSTRALIABRAZIL
48 Anglo American plc Annual Report 2014
STRATEGIC REPORT IRON ORE AND MANGANESE

FINANCIAL AND OPERATING OVERVIEW
KumbaUnderlying EBIT decreased by 37% to $1.9 billion (2013: $3.0 billion), mainly attributable to the significant decline in the iron ore benchmark price, which declined 28% to an average of $97/tonne. In 2014, Kumba took steps to address its cost base and to establish a robust continuous improvement programme that builds off the implementation of Anglo American’s Operating Model. Total operating costs decreased by 4%. Despite the 14% increase in waste mining, a 12% weakening of the South African rand against the US dollar, and benefits from the Operating Model, more than offset this headwind.
Export sales increased by 4% to 40.5 Mt (2013: 39.1 Mt) as a result of higher iron ore production which increased by 14% to 48.2 Mt (2013: 42.4 Mt). Kumba rebuilt stock on the back of the higher production. Total finished product stocks increased to 6.5 Mt as at 31 December 2014 compared with 2.9 Mt at 31 December 2013.
Iron Ore BrazilFirst ore on ship was achieved on 25 October 2014, ahead of schedule and with total project capital expenditure expected to be $0.4 billion below the revised budget of $8.8 billion. Despite the project’s complexity and logistical challenges, Minas-Rio achieved an exceptional safety performance with very low lost time injury rates compared to other projects of similar scale. Delivery of the project is a significant milestone. The ramp up schedule continues and is expected to reach design capacity during the second quarter of 2016. Minas-Rio is a world class asset benefiting from long life (~45 years); high quality iron ore saleable product (~67% Fe); and a favourable cash cost, and is expected to be in the bottom half of the cash cost curve.
Underlying EBIT is expected to be capitalised until the end of 2015, by which time the Minas-Rio project is expected to have achieved commercial production capacity. In 2014, Iron Ore Brazil’s capitalised underlying EBIT loss was $57 million, while an amount of $34 million was charged to the income statement in relation to expenses that were not directly associated with the project.
Sales volumes of 0.2 Mt relate to three Panamax vessels transporting iron ore from Minas-Rio to customers in China. Iron ore production volumes for the year reached 0.7 Mt (wet basis).
SamancorUnderlying EBIT decreased by 15% to $178 million, driven by lower ore prices, offset to some extent by higher sales volumes and cost control.
MARKETS
Iron ore2014 2013
Average market prices (IODEX 62% Fe CFR China spot price – $/tonne)(1)
97 135
Average realised prices (Kumba export – $/tonne) 91 125
(1) Different products are priced against a number of different indices in the market. IODEX 62% has been used in this instance as a generic industry benchmark against which to compare average realised prices.
Demand for seaborne iron ore grew 6.7% (2013: 7.0%), or 79 Mt; however this was more than offset by seaborne supply which increased by 14.2%, or 167 Mt, on an equivalent basis. The result was a 28% decline in the average iron ore price, which reached $72 per tonne (Platts 62% benchmark) at the end of the year. Kumba’s achieved sales benefited from the inclusion of a significant share of high grade fines and lump products which attracted a market premium.
Manganese oreThe manganese ore market remained under pressure, with the benchmark ore price (CIF China) falling 16% over the prior year. Infrastructure constraints in South Africa were loosened, which eliminated a key bottleneck from the market. This resulted in South African production becoming the relevant price setting assets.
Key performance indicatorsProduction
volume (Mt)(1)Sales
volume (Mt)
Price ($/tonne)(2)
Revenue ($m)
UnderlyingEBITDA ($m)
UnderlyingEBIT ($m) Capex ($m) ROCE
Segment n/a n/a n/a 5,176 2,286 1,957 2,685 10%
Prior year n/a n/a n/a 6,517 3,390 3,119 2,518 19%
Kumba Iron Ore 48.2 45.3 91 4,388 2,162 1,911 763 60%
Prior year 42.4 43.7 125 5,643 3,266 3,047 655 99%
Iron Ore Brazil 0.7 0.2 n/a n/a (29) (34) 1,922 (1)%
Prior year – – n/a n/a (27) (31) 1,863 (1)%
Samancor n/a n/a n/a 788 251 178 n/a 22%
Prior year n/a n/a n/a 874 258 210 n/a 23%
Projects and Corporate n/a n/a n/a n/a (98) (98) n/a n/a
Prior year n/a n/a n/a n/a (107) (107) n/a n/a
(1) Iron Ore Brazil production is Mt (wet basis). (2) Prices for Kumba Iron Ore (Kumba) are the average realised export basket price.
49
Strategic report
Anglo American plc Annual Report 2014

OPERATING PERFORMANCE
Kumba Overall, Kumba showed a marked improvement in production as plans put in place over the past few years yielded benefits. These were complemented by the implementation of Anglo American’s Operating Model at Sishen in August.
Sishen production of 35.5 Mt increased 15% (2013: 30.9 Mt), with total tonnes mined rising to 229.9 Mt (2013: 208.8 Mt). Of this amount, 187.2 Mt was waste (2013: 167.8 Mt). Although below the waste target set at the start of the year, waste removal run rates are now meeting targets. Additional contractor capacity has been secured and the performance of Kumba’s own mining fleet improved. The vertical rate of advance at the mine was increased, further strengthening the exposed ore position. The strategic redesign of the western pushbacks of the pit, together with the improved waste removal run rates, have achieved appropriate waste removal during the year to ensure sufficient exposed ore to support a 2015 production target of 36 Mt.
Execution of the pit redesign plan has resulted in an improved mining plan that enables better use of equipment, and the deployment of two priority pushbacks. Around 780 Mt of waste was taken out of the revised life of mine plan, reducing the average life of mine stripping ratio from 4.4 to 3.9, and the reserve life from 18 years to 16 years at the end of 2014.
Kolomela maintained its strong performance, with total tonnes mined increasing by 18% to 70.4 Mt (2013: 59.9 Mt). The mine produced 11.6 Mt of iron ore (2013: 10.8 Mt), an increase of 7%, and mined 55.5 Mt of waste (2013: 46.7 Mt).
Pre-stripping of the third pit (19.4 Mt), in order to maintain flexibility, was completed during the year, with first ore exposed during November.
Thabazimbi lifted output to 1.1 Mt (2013: 0.6 Mt), with waste mining volumes increasing by 19% to 31.6 Mt (2013: 26.5 Mt).
Volumes railed on the Iron Ore Export Channel were 6% higher at 42.2 Mt (2013: 39.7 Mt) on the back of the improved performance at Sishen and Kolomela, accounting for 31.7 Mt and 10.5 Mt, respectively.
To facilitate the expansion of Sishen mine to the west, Phase 1 of the Dingleton relocation project was completed, with 71 homes in Dingleton North being moved to the new host site. Phase 2, the relocation of the 428 remaining houses, buildings and businesses, has commenced and is progressing well.
SamancorProduction of manganese ore remained consistent at 3.3 Mt (attributable basis), with a record performance in the second half. Production benefited from improved ore recovery and plant availability in South Africa, which offset the impact of weather related stoppages in the first quarter in Australia.
Production of manganese alloys increased by 14% to 286,100 tonnes (attributable basis) owing to greater furnace stability and availability in South Africa and Australia.
OPERATIONAL OUTLOOK
KumbaKumba will focus on optimising its production portfolio by reconfiguring its project portfolio to focus on low cost production. The target is an additional ~5 Mt in South Africa over the next three to five years, through incremental volumes from projects at Sishen and Kolomela.
Additional port capacity through the use of the Saldanha Multi-Purpose Terminal is expected to optimise port throughput. Sishen is aiming to increase production to around 36 Mt in 2015, as it ramps up its waste stripping to around 250 Mt. This will be supported by the Dingleton relocation project and ongoing implementation of Anglo American’s Operating Model. Following the planned commissioning of a new modular plant in 2015, production guidance has been increased by 1 Mt to 38 Mt in both 2016 and 2017.
Kolomela’s life of mine production capacity has been increased to 11 Mtpa from 2015, and studies are in progress which could result in increasing production further to 12 Mt in 2016 and to 13 Mtpa from 2017. The future of Thabazimbi mine in Kumba’s portfolio is currently being assessed.
Iron Ore BrazilIron ore production of between 11 Mt and 14 Mt (wet basis) is expected in 2015. Nameplate capacity is expected to be reached by the second quarter of 2016, with production of between 24 Mt and 26.5 Mt (wet basis) expected in 2016. In addition to the safe ramp up of operations, activities also include the completion of the outstanding construction works and the regular cycle of licence and permit renewals required for the mining operations.
50 Anglo American plc Annual Report 2014
STRATEGIC REPORT IRON ORE AND MANGANESE

51
Strategic report
Anglo American plc Annual Report 2014
During 2013, Kumba undertook and concluded various analyses and geological studies in order to better understand the orebody at Sishen mine, and determine how best to mine it successfully and sustainably.
The outcome of this review has been the development of a revised mining plan, with a resultant reduction of almost 780 Mt of waste stripping over the life of the mine, along with a number of other initiatives aimed at improving efficiencies and ensuring that Sishen is able to meet its revised production targets.
Sishen is on track to meet its target of 38 Mt of iron ore production in 2016 as a result of the following initiatives:
• The implementation of Anglo American’s Operating Model, a project being piloted at Sishen to improve productivity through scheduled work. Initiated in August 2014, this is already yielding significant benefits, including improving scheduled work from 20% to ~70%, a 50% reduction in waiting time on shovels, and a 23% efficiency improvement in total tonnes handled.
• The Dingleton relocation project to facilitate Sishen’s westward expansion has now commenced. In the current phase, 17 private homeowners and the occupants of 54 municipal houses in the northern section of Dingleton had been relocated by the end of 2014, with the rest to follow by the end of 2016.
• Two new waste dumps are being constructed to reduce the distance trucks are required to travel to move waste.
• A five-year fleet and associated infrastructure plan is currently under way, which includes an on-site maintenance facility to safely and efficiently service the mine’s haul trucks. This, along with increasing the fleet of trucks, is set to increase capacity for moving ore as the mine ramps up.
Following the success of the Operating Model pilot at Sishen North, further roll outs are planned at Sishen pre-strip and Kolomela plant during 2015, followed by roll out at all other areas.
DEVELOPING SISHEN FOR THE FUTUREImageMining safety officer Kobus Ellis and shovel operator Pitrus Skhungweni at Sishen mine. Next to them is a giant shovel, capable of delivering a payload of 108 tonnes in one scoop, which is being used to remove the calcrete overburden in the South Western portion of the pit.

52 Anglo American plc Annual Report 2014
STRATEGIC REPORT COAL
COAL
7
1
2
64
53
6
9 8
2
11
710
5
4
1
3
1 MORANBAH NORTH (MC) 88% ownershipAn underground longwall mining operation based in Queensland’s Bowen Basin with a mining lease covering 100 km2. In 2014, the mine produced 4.2 Mt of hard coking coal. Reserve life: 18 years
2 DAWSON (MC/TC) 51% ownershipDawson is based in Queensland’s Bowen Basin and produced 4.2 Mt of coking and thermal coals in 2014.Reserve life: 14 years
3 FOXLEIGH (MC) 70% ownershipFoxleigh is based in Queensland’s Bowen Basin and produced 2.0 Mt of high quality pulverised coal injection (PCI) coal in 2014.Reserve life: 13 years
4 CAPCOAL (MC/TC) 70% ownershipCapcoal produced 7.6 Mt of hard coking, PCI and thermal coals in 2014.Reserve life: 27 years (open cut) and 9 years (underground)
5 JELLINBAH & LAKE VERMONT (MC) 23.3% ownershipThe mines produced a combined (attributable) production of 2.9 Mt of coking, PCI and thermal coals in 2014.
6 CALLIDE (TC) 100% ownershipCallide is located in Queensland and produced 7.6 Mt of thermal coal in 2014.Reserve life: 31 years
7 DRAYTON (TC) 88.2% ownershipDrayton Mine is based in the Hunter Valley in New South Wales and produced 3.1 Mt of thermal coal in 2014.Reserve life: 1 year
1
1
1 PEACE RIVER COAL (MC) 100% ownershipPeace River Coal’s operations were placed on care and maintenance in December 2014, owing to weak market conditions. In 2014, the mine produced 1.5 Mt of metallurgical coal.
1 CERREJÓN (TC) 33.3% ownershipAnglo American, BHP Billiton and Glencore each have a one-third shareholding in Cerrejón. In 2014, Cerrejón produced 11.2 Mt of thermal coal for the export market.Reserve life: 18 years
COLOMBIACANADA
1 GOEDEHOOP (TC) 100% ownershipProduced 4.8 Mt of thermal coal for the export market in 2014.Reserve life: 11 years
2 GREENSIDE (TC) 100% ownershipThis export biased operation produced 3.6 Mt of thermal coal for both the export and domestic markets in 2014. Reserve life: 14 years
3 KLEINKOPJE (TC) 100% ownershipThis export biased operation produced 3.9 Mt of thermal coal for both the export and domestic markets in 2014. Reserve life: 11 years
4 LANDAU (TC) 100% ownershipThis export biased operation produced 4.2 Mt of thermal coal for both the export and domestic markets in 2014. Reserve life: 4 years
5 ZIBULO (TC) 73% ownershipAnglo American has a 73% stake in Anglo American Inyosi Coal (AAIC), a broad based black empowerment entity. AAIC wholly owns Zibulo mine which produced 5.1 Mt of thermal coal for both the export and domestic markets in 2014.Reserve life: 21 years
6 MAFUBE (TC) 50% ownershipMafube is an export biased joint operation with Exxaro and produced 3.8 Mt of thermal coal for both the export and domestic markets in 2014. Reserve life: 17 years
7 KRIEL (TC) 73% ownershipKriel, wholly owned by AAIC, produced 6.9 Mt of thermal coal for Eskom, the domestic state owned power utility.Reserve life: 6 years
8 NEW DENMARK (TC) 100% ownershipIn 2014, New Denmark produced 3.8 Mt of thermal coal for Eskom.Reserve life: 25 years
9 NEW VAAL (TC) 100% ownershipIn 2014, New Vaal produced 16.7 Mt of thermal coal for Eskom.Reserve life: 17 years
10 ISIBONELO (TC) 100% ownershipIsibonelo produced 5.3 Mt of thermal coal in the year for Sasol Synthetic Fuels.Reserve life: 13 years
11 RICHARDS BAY COAL TERMINAL 23.2% ownershipExport thermal coal is routed through the Richards Bay Coal Terminal to customers throughout the Atlantic, Mediterranean and Asia-Pacific regions.
SOUTH AFRICA
AUSTRALIA
Seamus French CEO
KEY Open cut Underground Open cut/
underground Other
MC Metallurgical CoalTC Thermal CoalAll volumes are expressed on an attributable basis.

Key performance indicatorsProduction
volume (Mt)Sales
volume (Mt)
Price ($/tonne) Revenue ($m)
UnderlyingEBITDA ($m)
UnderlyingEBIT ($m) Capex ($m) ROCE
Segment 100 100 n/a 5,808 1,207 458 1,045 7%
Prior year 99 99 n/a 6,400 1,347 587 1,263 8%
Australia and Canada 33 34 111 2,970 543 (1) 952 (1)%
Prior year 31 32 140 3,396 672 106 1,049 1%
South Africa 56 55 70 2,083 463 350 93 30%
Prior year 57 57 77 2,187 479 356 214 27%
Colombia 11 11 67 755 255 163 n/a 15%
Prior year 11 11 73 817 299 228 n/a 20%
Projects and Corporate n/a n/a n/a n/a (54) (54) n/a n/a
Prior year n/a n/a n/a n/a (103) (103) n/a n/a
(1) Australia and Canada is the weighted average metallurgical coal sales price achieved. South Africa is the weighted average export thermal coal price achieved.
(1)
FINANCIAL AND OPERATING OVERVIEW
Australia and CanadaAustralia and Canada recorded an underlying EBIT of $(1) million. The loss was attributable to a 21% decrease in the average quarterly hard coking coal (HCC) benchmark coal price, reducing underlying EBIT by $528 million. The impact was offset by productivity improvements that resulted in a 12% increase in metallurgical coal production despite market related production curtailments, significant cost reductions across the Australian operations and favourable Australian dollar exchange rate movements. Underlying EBIT included a higher onerous contract provision release at Callide, an $86 million loss at Peace River Coal in Canada, which was placed on care and maintenance in December 2014, and the impact of lower insurance receipts.
Cost savings across labour, contractors and maintenance, combined with productivity improvements, resulted in the lowest unit costs since 2010, with Australian export FOB cash unit costs reducing by 9% from 2013, in local currency terms.
A focus on higher margin products resulted in a favourable product mix, with the proportion of HCC sales to total export sales increasing by 3% to 55%.
South AfricaSouth Africa’s underlying EBIT of $350 million was flat year-on-year owing to a strong operational performance, lower costs and favourable currency movement which mitigated a 10% reduction in realised export prices. FOB cash unit costs at trade mines decreased by 5%, benefiting from the weaker rand and a focus on productivity and cost efficiency primarily related to maintenance and contractor costs, as well as lower overhead costs owing to the business restructuring. Underlying EBIT also included $38 million from the opportunistic sale of reserves and a surplus dragline.
ColombiaUnderlying EBIT was $163 million, 29% down on the prior year, mainly owing to weaker prices reducing underlying EBIT by $73 million, offset in part by favourable exchange rate movements and cost reductions.
MARKETS
Metallurgical coal 2014 2013
Average market prices ($/tonne)(1) 125 159Average realised prices ($/tonne, FOB) 111 140
(1) Represents the quarterly average benchmark.
The metallurgical coal market experienced growing Australian production and resilient US supply, which resulted in a surplus of seaborne metallurgical coal, while domestic Chinese production increased. As a key steelmaking ingredient, global demand growth for seaborne volumes slowed to 4%, with imports into China declining by 16% to 63 Mt. This was partially offset, however, by a 19% increase in demand from India to 49 Mt. Seaborne metallurgical coal prices have traded within a narrow range since April 2014, with spot price indices trading at historical lows throughout the year. Term contract prices have, however, maintained a consistent premium above these spot indices. The average quarterly HCC reference price decreased by 21% during 2014, to $125/tonne, reaching a low of $119/tonne in the fourth quarter.
Thermal coal 2014 2013
Average market prices ($/tonne, FOB Australia) 71 84
Average realised prices – Export Australia ($/tonne, FOB) 72 84
Average realised prices – Export South Africa ($/tonne, FOB) 70 77
Average realised prices – Domestic South Africa ($/tonne) 19 19
Average realised prices – Colombia ($/tonne, FOB) 67 73
Thermal coal prices decreased during 2014 as supply growth in the market encountered softening demand growth, particularly in China. China’s stronger hydro-electricity power performance displaced thermal coal in domestic generation and resulted in aggressive coal price discounting, ultimately dragging down the seaborne thermal coal price. The price of FOB Newcastle thermal coal decreased during the year by 27% from $85/tonne to a low of $62/tonne, ending the year at $65/tonne.
53
Strategic report
Anglo American plc Annual Report 2014

OPERATING PERFORMANCE
Australia and CanadaAustralia and Canada achieved record metallurgical coal production of 20.9 Mt, chiefly attributable to a step change in performance at Grasstree following its implementation of the management operating system and improvements across all Australian open cut operations.
Australian export thermal coal production decreased by 17%, mainly the result of lower production at the Drayton open cut mine as the mine nears the end of its life.
Underground operations increased production by 11% to record their best ever output. This was offset, however, by a 14% decrease in production at Moranbah North, from the prior year’s record performance, owing to equipment design issues. Given the current market conditions, Moranbah North plans to rectify these issues during the planned longwall move in the third quarter of 2015.
Production at the open cut operations rose by 5%, mainly as a result of the productivity improvements at Dawson following the implementation of the management operating system and a recovery in production at Callide following the flooding and rail closures in the first quarter of 2013. Foxleigh open cut mine recorded a record output, reflecting productivity improvements.
South AfricaExport production at 18.2 Mt was 7% higher, with all operations delivering an increase in production. Trade mine productivity, measured through the percentage of benchmark overall equipment effectiveness, increased by 6% for the underground operations and 5% for the opencast operations.
Domestic production at 37.6 Mt decreased by 5%, primarily owing to Eskom reducing offtake from New Vaal, and planned production decreases at Kriel prior to a move to new mining areas.
ColombiaOur share of Cerrejón’s output of 11.2 Mt was 2% higher than in 2013. In 2014, production was impacted by high dust emissions associated with the extended drought conditions that constrained production up until August, followed by heavy rainfall that led to production stoppages.
OPERATIONAL OUTLOOK
Australia and CanadaPeace River Coal operations in Canada were placed on care and maintenance in December 2014 owing to weak market conditions. The Drayton South project which was intended to extend the life of Drayton mine has not yet received regulatory approval. A new development application and accompanying Environmental Impact Statement will be submitted early in 2015.
Metallurgical coal production in 2015 is expected to remain broadly flat at 20 to 21 Mt as the increase in output from Australian underground operations and Grosvenor development coal will be offset by the suspension of activity at Peace River Coal.
South AfricaExport production is expected to be approximately 17 to 18 Mt in 2015, as productivity improvement benefits are offset by logistics constraints and challenges associated with the ageing of the current coal reserves.
ColombiaProduction is expected to be approximately 35 Mt (100% basis), subject to permitting and market conditions.
54 Anglo American plc Annual Report 2014
STRATEGIC REPORT COAL

55
Strategic report
Anglo American plc Annual Report 2014
Our Coal South Africa business has developed and patented bioconversion technology that could significantly accelerate and improve the quality of opencast mine rehabilitation.
Known as Fungcoal, the process harnesses fungi and weathered coal to produce natural fertilisers. The research project is a partnership with Rhodes University’s Institute for Environmental Biotechnology in South Africa and began in 2004, when Coal South Africa investigated solutions to accelerate and improve the quality of rehabilitation at its opencast mines.
The technology was trialled at four of our coal mines at a collective cost of $1.5 million. The outcomes of the research showed that certain fungi have the ability to break down and liquefy coal that has been exposed to the elements. In certain applications, it showed extremely positive results, both on rehabilitated mining pits and coal discard facilities. In addition to being more cost effective in certain applications than traditional rehabilitation, the technology will enhance the
quality of existing rehabilitation by increasing the organic content and the humic acid concentrations in the soil, thereby improving vegetation health and reducing soil compaction – which is a significant rehabilitation challenge facing the industry.
We are effectively developing a complete toolkit of organisms to restore the ecology of land that has been disturbed, so that it can be returned to communities for economic activity almost immediately after mining. The technology is expected to achieve in six months, or one growing season, what nature does in 60 years.
The next steps will be to establish a thorough record of land rehabilitated with Fungcoal and to gain a greater understanding of the product’s use in other applications and over a longer period of time. Engagement with regulators will take place as the project moves closer to the commercial phase.
FUNGCOAL BIOCONVERSION TECHNOLOGYImageKleinkopje colliery rehabilitation planner Gustav Le Roux and environmental co-ordinator Dolly Mthethwa inspect the results of the Fungcoal trials on the Klipan discard dump, where a bacterium has been introduced to reduce the rough discard into viable organic material in which plants can grow.

BASE METALS AND MINERALS
6
51
1423
COPPER1 COLLAHUASI
44% ownershipThe Collahuasi mine is a joint operation with Glencore (44%) and a Mitsui-led consortium (12%). In 2014, Anglo American’s share of production was 207,000 tonnes of copper.Reserve life: 70 years
2 LOS BRONCES 50.1% ownershipPart of Anglo American Sur, the Los Bronces mine produced 404,500 tonnes of copper, together with associated by-products such as molybdenum and silver, in 2014.Reserve life: 35 years
3 EL SOLDADO
50.1% ownershipPart of Anglo American Sur, the El Soldado mine produced 32,400 tonnes of copper in 2014.Reserve life: 13 years
4 CHAGRES 50.1% ownershipPart of Anglo American Sur, the Chagres smelter produced 128,500 fine tonnes of copper anode/blister in 2014.
5 MANTOS BLANCOS 100% ownershipThe Mantos Blancos mine produced 52,400 tonnes of copper in 2014.Reserve life: 10 years
6 MANTOVERDE
100% ownershipThe Mantoverde mine produced 51,800 tonnes of copper in 2014.Reserve life: 5 years
CHILE
Duncan Wanblad CEO: Base Metals and Minerals
KEY Open cut Other Open cut Other Open cut Open cut Other
1
34
12
5
NICKEL 1 BARRO ALTO 2 CODEMIN
100% ownershipBarro Alto is a ferronickel producer, based in Goiás, Brazil. In 2014, Barro Alto produced 28,300 tonnes of nickel. Codemin, located close to Barro Alto, is currently fed with ore from the Barro Alto mine and produced 8,900 tonnes of nickel in 2014.Reserve life: 22 years
NIOBIUM3 BOA VISTA
100% ownership The Boa Vista operation produces and exports ferroniobium. Ore is mined from the Boa Vista open cut mine and is processed, together with tailings from the adjacent Phosphates operations, at the Boa Vista and new Boa Vista Fresh Rock processing plants at Catalão in Goiás. In 2014, 4,700 tonnes of niobium were produced. Reserve life: 21 years
PHOSPHATES4 CHAPADÃO5 CUBATÃO
100% ownership Anglo American’s phosphates business is the second largest phosphate fertiliser producer in Brazil. Mining and beneficiation of the phosphate ore to produce phosphorus pentoxide (P2O5) concentrate takes place at the Chapadão mine in Ouvidor, in Goiás state, Brazil. Further processing into intermediate and final products occurs at processing plants located in Catalão, adjacent to the Chapadão mine, and at Cubatão, near the port of Santos in the state of São Paulo. In 2014, 1.1 Mt of phosphate fertiliser was produced.Reserve life: 34 years
BRAZILBRAZIL
56 Anglo American plc Annual Report 2014
STRATEGIC REPORT BASE METALS AND MINERALS

FINANCIAL AND OPERATING OVERVIEW
Copper recorded an underlying EBIT of $1,193 million, 31% lower, largely due to an 8% decline in the average realised copper price and a 2% decrease in sales volumes.
Operating costs have increased owing to inflation, higher treatment and refining charges, and an increase in mine development at Los Bronces, partially offset by the benefits of a weaker Chilean peso. At the end of 2014, 164,700 tonnes of copper were provisionally priced at 287 c/lb. Provisional pricing plus final liquidation of copper sales resulted in a negative EBIT adjustment of $196 million for 2014, versus a negative EBIT adjustment of $92 million in 2013.
MARKETS 2014 2013
Average market prices (c/lb) 311 332Average realised prices (c/lb) 300 326
The average LME copper cash settlement price decreased by 6% in the year to 311 c/lb (2013: 332 c/lb). The copper price fell sharply in March due to fears of large scale destocking in China. Despite a rebound in the price following the Qingdao warehousing scandal in June, the recovery was tempered by a mild Chinese summer, leading to slower growth in the production of air conditioners, while usage of copper and copper alloys in Europe exhibited seasonal weakness. On the supply side, strong output from many of the largest producing mines and the ramp up of new production more than offset constraints in exports from Indonesia.
OPERATING PERFORMANCE
Production at Los Bronces was 404,500 tonnes, 3% lower than in 2013. Strong throughput performance was achieved as a result of higher mine extraction rates improving the continuity of ore supply and debottlenecking of the plants. This was offset by expected lower grades. Material mined increased by 13% and reached record levels of 145 Mt, with waste stripping increasing by 14% to 62 Mt.
Anglo American’s share of Collahuasi’s production of 207,000 tonnes was 6% higher than the prior year. This was a reflection of continued high grades resulting from improved fleet and primary crusher performance allowing accelerated extraction from the Rosario pit, as well as throughput recovering from the 49-day shutdown of the SAG Mill 3 in 2013. Material mined also reached record levels at Collahuasi, increasing by 9% to 251 Mt (100% basis).
Production at El Soldado decreased by 37% following expected lower grades arising from the intersection with a geological fault encountered in 2013. Output at Mantos Blancos and Mantoverde decreased by 4% and 9% respectively, owing to expected lower grades.
OPERATIONAL OUTLOOK
Production guidance for 2015 is in the range of 720,000 to 750,000 tonnes as lower throughput rates at Los Bronces, resulting from constrained water supply during the first half of the year, are only partially offset by higher ore grades. Production is expected to be maintained at similar levels to 2014 at the other operations.
COPPER: Key performance indicatorsProduction volume (kt)
Sales volume (kt)
Realised price (c/lb) Revenue ($m)
UnderlyingEBITDA ($m)
UnderlyingEBIT ($m) Capex ($m) ROCE
Copper 748 755 300 4,827 1,902 1,193 728 18%
Prior year 775 768 326 5,392 2,402 1,739 959 25%
(1) Attributable production volumes.
57
Strategic report
Anglo American plc Annual Report 2014
(1)

NICKEL: Key performance indicatorsProduction
volume (t)Sales
volume (t)
Realised price (c/lb) Revenue ($m)
UnderlyingEBITDA ($m)
UnderlyingEBIT ($m) Capex ($m)(1) ROCE
Nickel 37,200 36,100 731 142 28 21 14 1%
Prior year 34,400 33,800 646 136 (37) (44) (28) (2)%
(1) Cash capital expenditure for Nickel of $164 million (2013: $76 million) is offset by the capitalisation of $150 million (2013: $104 million) of net operating cash inflows generated by Barro Alto, which has not yet reached commercial production.
FINANCIAL AND OPERATING OVERVIEW
Nickel’s underlying EBIT was $21 million, a $65 million improvement over the prior year (2013: $44 million loss), owing to a $24 million favourable non-cash balance sheet gain, as a result of a weakening in the Venezuelan bolivar (relating to remaining Minera Loma de Níquel creditors), higher pricing, favourable exchange rates and improved cash costs at Codemin.
Underlying EBIT from the Barro Alto project continues to be capitalised as the asset is not yet in commercial production. Barro Alto’s underlying EBIT, before capitalisation, was $152 million, a $208 million improvement over the prior year (2013: $56 million loss) owing to higher pricing, improved cash costs, gains on excess electricity sales and favourable exchange rates.
MARKETS 2014 2013
Average market prices (c/lb) 765 680Average realised prices (c/lb) 731 646
The average LME nickel cash settlement price increased by 13% in the year to 765 c/lb (2013: 680 c/lb). Demand levels improved while supply was constrained due to a reduction in nickel pig iron (NPI) production in China following the Indonesian nickel ore ban, and reductions in output from certain other producers. Overall, nickel consumption increased by 6%, while supply decreased by 2%.
The sizeable market surplus of 184,000 tonnes in 2013 was reduced to 43,000 tonnes by the end of 2014.
OPERATING PERFORMANCE
Nickel production increased by 8% as the improved performance at Barro Alto’s furnaces, and recovery from the operational issues experienced in 2013, more than offset the impact of the Line 2 rebuild which started in October 2014. At Codemin, output was 4% lower, reflecting the planned mining of lower grades.
OPERATIONAL OUTLOOK
Production is expected to decline to a range of 20,000 to 25,000 tonnes in 2015, as a consequence of the rebuild of Barro Alto’s two furnaces, thereafter increasing to between 40,000 and 45,000 tonnes in 2016.
58 Anglo American plc Annual Report 2014
STRATEGIC REPORT BASE METALS AND MINERALS
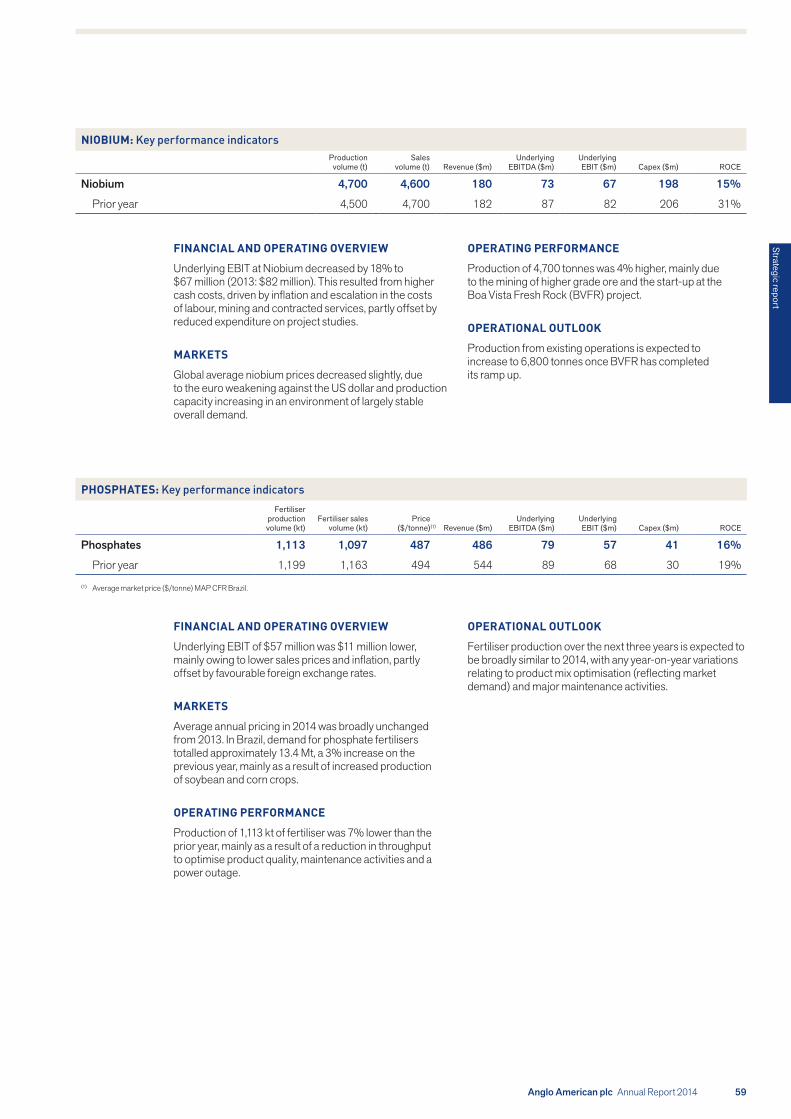
NIOBIUM: Key performance indicatorsProduction
volume (t)Sales
volume (t) Revenue ($m)Underlying
EBITDA ($m)UnderlyingEBIT ($m) Capex ($m) ROCE
Niobium 4,700 4,600 180 73 67 198 15%
Prior year 4,500 4,700 182 87 82 206 31%
PHOSPHATES: Key performance indicatorsFertiliser
production volume (kt)
Fertiliser sales volume (kt)
Price($/tonne)(1) Revenue ($m)
UnderlyingEBITDA ($m)
UnderlyingEBIT ($m) Capex ($m) ROCE
Phosphates 1,113 1,097 487 486 79 57 41 16%
Prior year 1,199 1,163 494 544 89 68 30 19%
(1) Average market price ($/tonne) MAP CFR Brazil.
FINANCIAL AND OPERATING OVERVIEW
Underlying EBIT at Niobium decreased by 18% to $67 million (2013: $82 million). This resulted from higher cash costs, driven by inflation and escalation in the costs of labour, mining and contracted services, partly offset by reduced expenditure on project studies.
MARKETS
Global average niobium prices decreased slightly, due to the euro weakening against the US dollar and production capacity increasing in an environment of largely stable overall demand.
FINANCIAL AND OPERATING OVERVIEW
Underlying EBIT of $57 million was $11 million lower, mainly owing to lower sales prices and inflation, partly offset by favourable foreign exchange rates.
MARKETS
Average annual pricing in 2014 was broadly unchanged from 2013. In Brazil, demand for phosphate fertilisers totalled approximately 13.4 Mt, a 3% increase on the previous year, mainly as a result of increased production of soybean and corn crops.
OPERATING PERFORMANCE
Production of 1,113 kt of fertiliser was 7% lower than the prior year, mainly as a result of a reduction in throughput to optimise product quality, maintenance activities and a power outage.
OPERATING PERFORMANCE
Production of 4,700 tonnes was 4% higher, mainly due to the mining of higher grade ore and the start-up at the Boa Vista Fresh Rock (BVFR) project.
OPERATIONAL OUTLOOK
Production from existing operations is expected to increase to 6,800 tonnes once BVFR has completed its ramp up.
OPERATIONAL OUTLOOK
Fertiliser production over the next three years is expected to be broadly similar to 2014, with any year-on-year variations relating to product mix optimisation (reflecting market demand) and major maintenance activities.
59
Strategic report
Anglo American plc Annual Report 2014

PLATINUM
1 UNKI Ownership 100% The mine is a mechanised, trackless bord and pillar underground operation based on the Great Dyke of Zimbabwe. Production: 61.3 koz Reserve life: 31 years
2 MOGALAKWENA Ownership 100% Consists of five open pits, mined using the truck and shovel method.Production: 369.8 koz Reserve life: >26 years(1)
3 DISHABA Ownership 100% Consists of one vertical shaft, one raise bore and four decline shafts.Production: 79.4 koz Reserve life: >26 years(1)
4 TUMELA Ownership 100% Consists of three vertical and four decline shaft systems. Production: 131.4 koz Reserve life: 16 years
5 UNION Ownership 85% Consists of two vertical shafts. Production: 86.9 koz Reserve life: 23 years
6 BAFOKENG-RASIMONE PLATINUM MINE Ownership 33% Consists of two decline shafts and a concentrator. Production: 186.9 koz Reserve life: >26 years(1)
7 THEMBELANI Ownership 100% Consists of two vertical shaft systems. Production: 98.9 kozReserve life: 14 years
8 BATHOPELE Ownership 100% Consists of two decline shafts. Production: 82.2 koz Reserve life: 15 years
9 SIPHUMELELE Ownership 100%Consists of one shaft system. Production: 45.7 koz Reserve life: 10 years
10 TWICKENHAM Ownership 100% Projects on the Eastern Limb of the Bushveld complex. Steady state expected in 2020.Production: 11.4 koz Reserve life: 19 years
11 KROONDAL Ownership 50%Production: 252.2 koz Reserve life: 9 years
12 PANDORA Ownership 42.5%,Production: 341 kt Reserve life: 25 years
13 MOTOTOLO Ownership 50% Production: 120.0 koz Reserve life: 5 years(2)
14 MODIKWA Ownership 50%Production: 103.0 kozReserve life: >28 years(1)
15 BOKONI Ownership 49% Production: 106.9 koz Reserve life: >25 years(1)
16 17 20 POLOKWANE, MORTIMER AND WATERVAL SMELTERSConcentrate is received from the concentrators operated by Platinum, joint venture partners and third parties and is smelted at one of the three smelting complexes, producing furnace matte. Tonnes smelted in 2014: 1,077 kt
18 19 PRECIOUS METAL REFINERY (PMR) AND RUSTENBURG BASE METAL REFINERY (RBMR)The PMR and RBMR refine the precious metal and base metal concentrates. Base metal production in 2014: 32.2 kt
2
3 4
15
14
135
A
JOHANNESBURG
16
6
17
10
1
ZIMBABWE
SOUTH AFRICA: BUSHVELD COMPLEX BUSHVELD COMPLEX
12
11
9
187
8
20
19
A
(1) Reserve Life truncated to the last year of current Mining Right.
(2) Only five years of Ore Reserves are declared as per Glencore policy.
60 Anglo American plc Annual Report 2014
STRATEGIC REPORT PLATINUM
Chris Griffith CEO: Anglo American Platinum Limited
KEY Open cut Underground Other
Anglo American Platinum Limited (Platinum) is 78% owned by Anglo American.

Production at Rustenburg and Union was also reduced following the planned restructuring and optimisation of these mines during 2013, and the closure of the last of the decline sections at Union mine during the fourth quarter of 2014, all of which accounted for a further reduction of 114,000 ounces.
These losses were partially compensated by strong performances from Mogalakwena mine and increases at some of Platinum’s independently managed operations. Production from these operations rose by 2%, led by a 15% increase at Bokoni, 5% at BRPM and 4% at Kroondal.
The record production at Mogalakwena mine was due to higher head grades and increased concentrator throughput, supported by improved mining performance. On-mine production increased by 9% to 348,000 ounces, while toll concentrating activities at a third party concentrator yielded 22,000 ounces.
Refined platinum production was 21% lower at 1.89 million ounces (2013: 2.38 million ounces) owing to production shortfalls at the strike affected operations. However, this was partially offset by a drawdown of pipeline metal inventory. The pipeline was steadily increased to normal operating levels by year end, once the mines had ramped up to full production. Refined palladium output decreased by 11%, while refined production of rhodium decreased by 22%, reflecting the industrial action, a different ore source mix from operations, and different pipeline processing times for each metal. Refined nickel production increased by 25% to 28,200 tonnes, which was boosted by an additional 2,000 tonnes from toll refining, resulting in an overall increase in base metal production to 47,600 tonnes, an increase of 10,000 tonnes.
Sales volumes exceeded production volumes owing to the drawdown of built up metal inventory, but were 9% lower than 2013.
OPERATIONAL OUTLOOK
As a result of the successful post-strike ramp up of operations during the third quarter of 2014, Platinum is expected to return to baseline production (equivalent refined and refined production) and sales of between 2.3 and 2.4 million platinum ounces in 2015, with reduced output from the decline closures at Union mine in the fourth quarter of 2014 being offset by improved output through the implementation of operational improvement plans.
FINANCIAL AND OPERATING OVERVIEW
Underlying EBIT decreased by $432 million to $32 million (2013: $464 million) as a consequence of the five-month industrial action in South Africa, which had a material impact on production. Sales volumes were also impacted, though to a lesser extent, as sales commitments were met through the drawdown of both pipeline and refined product inventory.
Year-on-year cash operating costs per equivalent refined platinum ounce increased by 20% to $2,112 per ounce, owing primarily to lower production from strike impacted mines that continued to incur fixed overhead costs during the period of industrial unrest and increased input costs, including the wage settlement which added approximately 9% to the cost of employment, and electricity costs. The impact of the strike was partially mitigated by applying the ‘no work, no pay’ principle and implementing strict cost controls. The weaker rand also had a favourable impact on unit costs.
In addition to the higher operating costs, the drawdown of metal inventory during the year to fulfil sales commitments also impacted cost of sales adversely.
MARKETS 2014 2013
Average platinum market price ($/oz) 1,385 1,487Average palladium market price ($/oz) 803 725Average rhodium market price ($/oz) 1,173 1,067Average gold market price ($/oz) 1,266 1,410US$ basket price – ($/Pt oz) 2,428 2,360Rand basket price – (ZAR/Pt oz) 26,307 22,702
Platinum group metal (PGM) prices in 2014 reflected the impact of the strike, producers selling from normal working inventory and inventory built up ahead of the anticipated industrial action, and macro-economic factors negatively affecting prices in the second half. For the year as a whole, the average platinum market price decreased by 7% to $1,385 per ounce, with an average platinum price in the first half of $1,438 per ounce and in the second half of $1,335 per ounce. Palladium and rhodium market prices increased by 11% and 10% to $803 per ounce and $1,173 per ounce respectively, and the dollar basket price increased by 3% to $2,428 per ounce.
OPERATING PERFORMANCE
Total equivalent refined platinum production decreased by 21% to 1.84 million ounces (2013: 2.32 million ounces). The decline in production was primarily owing to the impact of the strike, which commenced on 23 January and ended on 24 June, and affected all of Platinum’s managed underground mines. This resulted in a steep fall in output from Rustenburg, Amandelbult and Union mines and a loss of 424,000 ounces of platinum. The build up to steady state production in the third quarter resulted in a further loss of 108,000 ounces, bringing the total strike related impact to 532,000 ounces.
Key performance indicatorsEquivalent refined
production volume (koz)
Sales volume (koz)
Price$/Pt oz(1) Revenue ($m)
UnderlyingEBITDA ($m)
UnderlyingEBIT ($m) Capex ($m) ROCE
Platinum 1,842 2,115 2,428 5,396 527 32 576 0%
Prior year 2,320 2,320 2,360 5,688 1,048 464 601 5%
(1) Average US$ basket price.
61
Strategic report
Anglo American plc Annual Report 2014

DE BEERS
62 Anglo American plc Annual Report 2014
STRATEGIC REPORT DE BEERS
De Beers is 85% owned by Anglo American, with the remaining 15% held by the Government of the Republic of Botswana (GRB).
1
4
32
AUSTRALIA
In Botswana, De Beers’ mining interests are held through Debswana Diamond Company, a 50:50 partnership between De Beers and the GRB. In 2014, Debswana produced 24.2 million carats. Debswana is consolidated on a 19.2% pre-tax proportionate basis.
1 JWANENG 50% ownershipOne of the richest diamond mines, by value, in the world.Life of mine: 19 years
2 ORAPA 50% ownershipHolds the largest resource, by volume, in the world.Life of mine: 15 years
3 LETLHAKANE 50% ownershipNearing end of mine life – to be extended through treatment of tailings.Life of mine: 3 years
4 DAMTSHAA 50% ownershipConsists of four small kimberlite pipes, although only two are currently mined.Life of mine: 18 years
BOTSWANABOTSWANA MINING OPERATIONS
MIDSTREAM DOWNSTREAM OTHER
2
3
1
De Beers Consolidated Mines (DBCM) has been an empowered South African company since 2006, with 26% owned by broad based black economic empowerment partner, Ponahalo Holdings. In 2014, DBCM recovered 4.6 million carats. The sale of Namaqualand Mines to TransHex Group was concluded in October 2014.
1 KIMBERLEY 74% ownershipTailings processing facility in Kimberley, Northern Cape region.Life of mine: 4 years
2 VOORSPOED 74% ownershipAlso a source of large and coloured stones.Life of mine: 7 years
3 VENETIA 74% ownershipSouth Africa’s largest diamond mine with an underground project currently in progress.Life of mine: 30 years
SOUTH AFRICASOUTH AFRICA MINING OPERATIONS
Namdeb Holdings, a 50:50 partnership between De Beers and the Government of the Republic of Namibia (GRN), has historically been a source of high value gemstones. Namdeb Holdings has terrestrial and marine operations. In 2014, Namdeb Holdings’ production was 1.9 million carats.
1 NAMDEB 50% ownershipConsists of Southern Coastal Mines (Mining Area No. 1), Northern Coastal Mines (Elizabeth Bay and Beach and Marine Contractors) and Orange River Mines (Daberas and Sendelingsdrif).Life of mine: 17 years
2 DEBMARINE NAMIBIA 50% ownershipOffshore mining conducted by a fleet of five vessels. Life of mine: 15 years
21
NAMIBIA MINING OPERATIONS
De Beers Global Sightholder Sales (DBGSS) 100% ownershipBased in Gaborone, DBGSS is De Beers’ primary rough diamond sales operation.Auction Sales (AS) 100% ownershipBased in Singapore, AS is De Beers’ online rough diamond sales platform.
Diamond Trading Company Botswana (DTCB) 50% ownership with GRBBased in Gaborone, DTCB sorts and values Debswana’s rough diamond production.Namibia Diamond Trading Company (NDTC)50% ownership with GRNBased in Windhoek, NDTC sorts and values Namdeb’s rough diamond production and sells
rough diamonds to local Sightholder factories.De Beers Sightholder Sales South Africa (DBSSSA)74% ownership with 26% held by Ponahalo HoldingsDBSSSA sorts and values DBCM’s rough diamond production and sells rough diamonds to local Sightholder factories and government run State Diamond Trader.
De Beers Diamond Jewellers (DBDJ) 50% ownershipDBDJ is an independently managed, high end jewellery JV with LVMH Moët Hennessy-Louis Vuitton.Forevermark 100% ownershipDiamond brand from The De Beers Group of Companies and De Beers’ primary marketing operation.
Element Six (E6)Technologies 100% ownership. Abrasives 60% ownership.E6 is the global leader in design and production of synthetic diamond supermaterials.
1 SNAP LAKE 100% ownershipLocated in the Northwest Territories.Life of mine: 12 years
2 VICTOR 100% ownershipLocated in northern Ontario.Life of mine: 5 years
3 GAHCHO KUÉ (UNDER CONSTRUCTION) 51% ownershipLocated in the Northwest Territories, Gahcho Kué production is expected to commence in the second half of 2016. Life of mine: 13 years
2
31
CANADA MINING OPERATIONS
In Canada, De Beers operates the Snap Lake and Victor mines and is also a joint venture partner with Mountain Province Diamonds in the Gahcho Kué project in the Northwest Territories. In 2014, 1.8 million carats were produced from De Beers’ mining operations in Canada.
Philippe Mellier CEO – De Beers Group
KEY Open cut Underground Other

(4) Scheduled Inferred Resources (below 401 metres below ground level) included in the Cut-8 estimates constitute 81% (89.3 Mct) of the estimated carats. Not all Inferred Resources may be upgraded to Ore Reserves, even after additional drilling. The numbers given are scheduled tonnes and carats as per the 2014 Life of Mine plan and reflect changes made to the Cut-6 and Cut-7 designs following the Cut-6 slope failure in 2013. The scheduled tonnes and carats exclude the fourth pipe that is intersected during Cut-8 and stockpiled for treatment at the end of the 2014 Life of Mine plan.
No. 1 plant maintenance stoppage that occurred in 2013. Jwaneng Cut-8 waste mining is progressing well, with just over 50% of the 500 million tonnes of waste stripping required to expose the ore now complete. During 2018, Cut-8 will become the main source of ore for Jwaneng and extend the life of one of the world’s richest diamond mines to at least 2033, providing access to an estimated 91 million tonnes of ore, containing approximately 110 million carats(4).
In Namibia, production was marginally higher at 1.9 million carats (Namdeb (land operations) 0.6 million and Debmarine Namibia 1.3 million), driven by strong operational improvement by the MV Mafuta vessel. Namdeb production was broadly in line with the previous year, despite a 19-day strike in the third quarter. Namdeb Holdings has received a 15-year licence extension for both land and sea operations to 2035.
In South Africa, a 2% decrease in output to 4.6 million carats (Venetia 3.2 million, Voorspoed 0.7 million and Kimberley 0.7 million), was principally due to lower grades at Kimberley.
In Canada, production was slightly lower at 1.8 million carats (Snap Lake 1.2 million and Victor 0.6 million). A decline in production at Snap Lake of 0.1 million carats was due to the impact of flooding, forest fire smoke protocols, and reviewing and implementing revised ground support standards. Work continues to optimise Snap Lake to enable economic access to the promising, though challenging, orebody.
Element Six (E6) enjoyed a year of solid growth, with a strong performance in the synthetic industrial diamond product groups, both for abrasives and advanced technology applications. This growth was offset partially by weakness in tungsten carbide sales in the first six months. In order to continue improving customer service and operating efficiencies, E6 announced in April that it would close its plant in Robertsfors, Sweden, to focus on its primary plants in Shannon, Ireland, and Springs, South Africa.
BrandsForevermark saw strong growth in 2014, with retail outlets up by 20%. The brand is now available in more than 1,500 outlets in 34 markets. Since the launch of Forevermark, more than one million diamonds have received the Forevermark inscription and unique identification number.
In 2014, De Beers Diamond Jewellers opened a new store in Selfridges in London and a concession in Saks Fifth Avenue, New York. There are now 35 De Beers stores in 12 key consumer markets around the world.
OPERATIONAL OUTLOOK
Diamond production (on a 100% basis) for 2015 is forecast to be in the range of 32 to 34 million carats, subject to market demand.
FINANCIAL AND OPERATING OVERVIEW
De Beers’ underlying EBIT increased by 36% to $1.4 billion (2013: $1.0 billion). The increase was due primarily to solid demand across key markets, particularly the US, which resulted in strong revenue growth. Operating costs benefited from favourable exchange rate movements, which offset underlying inflationary pressures.
De Beers’ total sales rose 11% to $7.1 billion, with rough diamond sales up 12% to $6.5 billion. Higher rough diamond revenue was driven principally by a 12% increase in consolidated sales volumes to 32.7 million carats. Average realised diamond prices were in line with 2013 at $198/carat, driven by a 5% higher average rough price index in 2014, offset by a marginally lower product mix.
MARKETS
Consumer demand for diamond jewellery showed positive growth in local currency terms in all the main markets in 2014. The economic recovery gained momentum in the US, the largest consumer diamond market, which resulted in healthy diamond jewellery sales growth throughout the year. Growth in diamond jewellery demand in China continued, albeit at more modest levels, reflecting slowing economic growth. Macro-economic conditions in India started improving in the final quarter of 2014, following the election of a new government earlier in the year, which boosted consumer confidence, lifting hopes that growth will return.
Polished prices ended the year broadly in line with where they started in 2014, with the increase in the first half of the year being offset by a reduction in the second half. Rough diamond prices increased over the course of 2014, albeit with some softness experienced towards the end of 2014 and early in 2015.
In July, De Beers announced details of a new approach to its rough diamond Sightholder sales contracts. The new contract period, which will start in March 2015 and run for three years, with an option for De Beers to extend, requires, amongst other things, its rough diamond customers to comply with more rigorous financial and governance criteria in order to be eligible for supply.
OPERATING PERFORMANCE
Mining and manufacturingDe Beers’ full year production increase of 5% to 32.6 million carats (2013: 31.2 million carats) reflected a strong performance from Debswana, partly offset by slightly lower production at Snap Lake and Kimberley, with all other regions performing broadly in line with 2013.
Debswana benefited from greater efficiency at its processing plants following operational improvement initiatives, producing 24.2 million carats (Orapa 12.9 million and Jwaneng 11.3 million). Performance was enhanced by recovery from the carry-over effects through 2012 and 2013 of the Jwaneng slope failure clean-up as well as the Orapa
Key performance indicators
Production volume
(’000 carats)
Consolidated sales
volume(’000 carats) Price ($/ct) Revenue ($m)
UnderlyingEBITDA ($m)
UnderlyingEBIT ($m) Capex ($m) ROCE
De Beers 32,605 32,730 198 7,114 1,818 1,363 689 15%
Prior year 31,159 29,277 198 6,404 1,451 1,003 476 11%
(1) Represents diamond production on a 100% basis and is not directly comparable to consolidated sales volumes.(2) Sales volumes (100% basis) were 34.4 million carats in 2014 (2013: 29.8 million carats).(3) Average realised price.
(3)(1) (2)
63
Strategic report
Anglo American plc Annual Report 2014

CORPORATE AND OTHER
ExplorationAnglo American exploration expenditure of $181 million represented a decrease of 13%, following reductions in diamonds, metallurgical coal and nickel exploration costs. Decreases are mainly attributable to an overall reduction in drilling activities.
Corporate activities and unallocated costsUnderlying EBIT was a $96 million loss, a decrease of $82 million.
Corporate costs decreased by 24% ($118 million), of which $44 million resulted from corporate cost savings initiatives embedded during the year. Further reductions were mainly owing to a lower share scheme charge of $27 million (a decrease of 39%) and a foreign exchange gain of $19 million compared to 2013. This was partly offset by a 20% reduction in the allocation of corporate costs to business units of $59 million, reflecting the lower corporate cost base.
FINANCIAL AND OPERATING OVERVIEW
Other Mining and IndustrialUnderlying EBIT of $62 million was an improvement on the underlying operating loss of $13 million in 2013, mainly attributable to an improved performance from the Lafarge Tarmac joint venture.
Lafarge Tarmac joint ventureAnglo American’s share in the underlying EBIT of the joint venture was $78 million, a $69 million increase over 2013. Improved market conditions, combined with synergy delivery and efficiency initiatives, have led to improved margins and cash generation. The outlook for the UK construction market remains positive and further growth is expected in 2015.
Following the announcement on 7 July 2014 of an agreement in principle, the Group reached a binding agreement on 24 July 2014 to sell its 50% ownership interest in Lafarge Tarmac to Lafarge SA (Lafarge) for a minimum value of £885 million (approximately $1.35 billion at present) in cash, on a debt- and cash-free basis and subject to other customary working capital adjustments. The sale is subject to a number of conditions, including the completion of the proposed merger of Lafarge and Holcim Limited.
Key performance indicators
Revenue ($m)Underlying
EBITDA ($m)UnderlyingEBIT ($m) Capex ($m)
Segment 1,859 (88) (215) 42
Prior year 1,800 (257) (398) 50
Other Mining and Industrial 1,854 162 62 2
Prior year 1,795 81 (13) 48
Exploration – (180) (181) –
Prior year – (205) (207) 1
Corporate activities and unallocated costs 5 (70) (96) 40
Prior year 5 (133) (178) 1
64 Anglo American plc Annual Report 2014
STRATEGIC REPORT CORPORATE AND OTHER
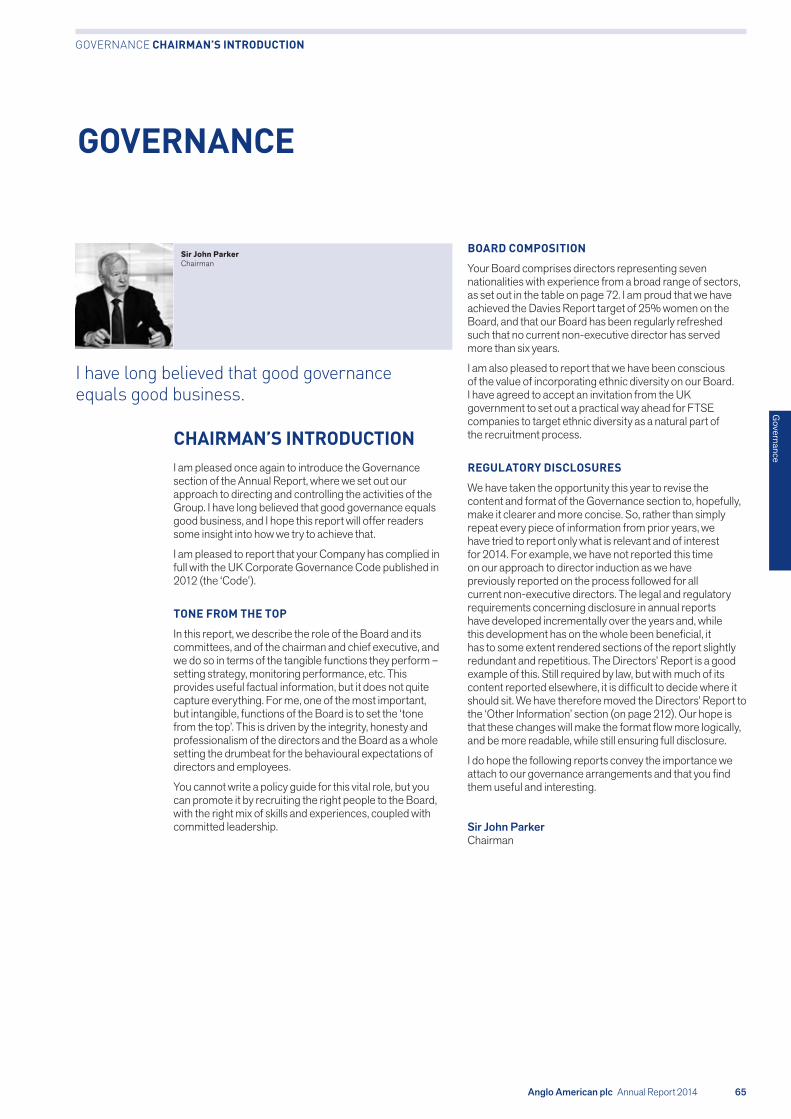
I have long believed that good governance equals good business.
GOVERNANCE
BOARD COMPOSITION
Your Board comprises directors representing seven nationalities with experience from a broad range of sectors, as set out in the table on page 72. I am proud that we have achieved the Davies Report target of 25% women on the Board, and that our Board has been regularly refreshed such that no current non-executive director has served more than six years.
I am also pleased to report that we have been conscious of the value of incorporating ethnic diversity on our Board. I have agreed to accept an invitation from the UK government to set out a practical way ahead for FTSE companies to target ethnic diversity as a natural part of the recruitment process.
REGULATORY DISCLOSURES
We have taken the opportunity this year to revise the content and format of the Governance section to, hopefully, make it clearer and more concise. So, rather than simply repeat every piece of information from prior years, we have tried to report only what is relevant and of interest for 2014. For example, we have not reported this time on our approach to director induction as we have previously reported on the process followed for all current non-executive directors. The legal and regulatory requirements concerning disclosure in annual reports have developed incrementally over the years and, while this development has on the whole been beneficial, it has to some extent rendered sections of the report slightly redundant and repetitious. The Directors’ Report is a good example of this. Still required by law, but with much of its content reported elsewhere, it is difficult to decide where it should sit. We have therefore moved the Directors’ Report to the ‘Other Information’ section (on page 212). Our hope is that these changes will make the format flow more logically, and be more readable, while still ensuring full disclosure.
I do hope the following reports convey the importance we attach to our governance arrangements and that you find them useful and interesting.
Sir John Parker Chairman
Sir John Parker Chairman
CHAIRMAN’S INTRODUCTIONI am pleased once again to introduce the Governance section of the Annual Report, where we set out our approach to directing and controlling the activities of the Group. I have long believed that good governance equals good business, and I hope this report will offer readers some insight into how we try to achieve that.
I am pleased to report that your Company has complied in full with the UK Corporate Governance Code published in 2012 (the ‘Code’).
TONE FROM THE TOP
In this report, we describe the role of the Board and its committees, and of the chairman and chief executive, and we do so in terms of the tangible functions they perform – setting strategy, monitoring performance, etc. This provides useful factual information, but it does not quite capture everything. For me, one of the most important, but intangible, functions of the Board is to set the ‘tone from the top’. This is driven by the integrity, honesty and professionalism of the directors and the Board as a whole setting the drumbeat for the behavioural expectations of directors and employees.
You cannot write a policy guide for this vital role, but you can promote it by recruiting the right people to the Board, with the right mix of skills and experiences, coupled with committed leadership.
65Anglo American plc Annual Report 2014
Governance
GOVERNANCE CHAIRMAN’S INTRODUCTION

CHAIRMAN
Sir John ParkerGBE, FREng, DSc (Eng), ScD (Hon), DSc (Hon), DUniv (Hon), FRINA
72, joined the Board as a non-executive director on 9 July 2009 and became chairman on 1 August 2009. Sir John is also chairman of the Nomination Committee and is a member of the Sustainability Committee. Sir John is recognised as a highly experienced and independent chairman and brings a wealth of leadership experience across a range of industries in many countries, including in South Africa.
He is a non-executive director of Carnival Corporation and Airbus Group as well as deputy chairman of DP World. Sir John is a Visiting Fellow of the University of Oxford and was the President of the Royal Academy of Engineering from 2011 to 2014. Sir John was previously chairman of National Grid plc, senior non-executive director and chair of the Court of the Bank of England, joint chair of Mondi and chair of BVT and P&O plc.
FINANCE DIRECTOR
René MédoriDoctorate in Economics
57, was appointed to the Board on 1 June 2005, becoming finance director on 1 September 2005. René is a member of the GMC and chairman of the CorpCo and the Investment Committee (InvestCo). René brings significant financial and commercial expertise from capital intensive businesses, supplying products to the oil refining, steel and mining industries and experience in international finance in the UK, Europe and the US.
He is a non-executive director of Anglo American Platinum Limited and Petrofac Limited. René is a former finance director of The BOC Group plc and was a non-executive director of SSE plc (formerly Scottish and Southern Energy plc).
DIRECTORS
CHIEF EXECUTIVE
Mark CutifaniBE (Mining Engineering)
56, was appointed as a director and chief executive with effect from 3 April 2013, and is chairman of the Group Management Committee (GMC) and a member of the Corporate Committee (CorpCo) and the Sustainability Committee. Mark has over 38 years’ experience of the mining industry across a wide range of geographies and commodities.
Mark is a non-executive director of Anglo American Platinum Limited and Chairman of the De Beers group of companies, and the previous CEO of AngloGold Ashanti Limited. Before joining AngloGold Ashanti, Mark was chief operations officer (COO) at Vale Inco, where he was responsible for Vale’s global nickel business. Prior to this he held senior executive positions with the Normandy Group, Sons of Gwalia, Western Mining Corporation, Kalgoorlie Consolidated Gold Mines and CRA (Rio Tinto).
SENIOR INDEPENDENT DIRECTOR
Sir Philip HamptonMA, ACA, MBA
61, joined the Board on 9 November 2009. He is chairman of the Remuneration Committee and a member of the Audit and Nomination Committees. Sir Philip is chairman of The Royal Bank of Scotland and brings to Anglo American significant financial, strategic and boardroom experience across a number of industries. Sir Philip was appointed to the board of GSK as a non-executive director and chair-designate in 2015.
His previous appointments include chairman of J Sainsbury plc, finance director of Lloyds TSB Group plc, BT Group plc, BG Group plc, British Gas plc and British Steel plc, executive director of Lazards, and non-executive director of RMC Group plc and Belgacom SA. Sir Philip succeeded David Challen as the senior independent director at the conclusion of the 2014 AGM.
Anglo American plc Annual Report 201466
GOVERNANCE DIRECTORS

NON-EXECUTIVE DIRECTORS
Judy DlaminiMBChB, DOH, MBA, DBL
55, was appointed to the Board on 1 January 2014 and is a member of the Audit and Remuneration Committees. Judy is a successful businesswoman with longstanding public company board experience across a range of geographies and sectors, including mining.
She is the chairman of Aspen Pharmacare and founder and chairman of Mbekani Group, a South African healthcare investment company. Judy served as a non-executive director of Northam Platinum between 2004 and 2013, and as a member of that company’s committees on: health; safety and environmental; investment; and social, ethics and human resources. She started her career as a medical practitioner and after spending two years at HSBC, she began to develop her entrepreneurial interests. Judy is also a founder and trustee of Mkhiwa Trust, a family vehicle for social responsibility initiatives, and has served as a non-executive director on the boards of Discovery Holdings and Woolworths Holdings.
Byron GrotePhD Quantitative Analysis
66, was appointed to the Board on 19 April 2013. He is chairman of the Audit Committee and a member of the Remuneration Committee. Byron contributes broad business, financial and board experience in numerous geographies.
He is a non-executive director of Unilever NV, Unilever plc, Standard Chartered and Akzo Nobel. Byron has extensive management experience across the oil and gas industry. He served on the BP plc board from 2000 until 2013 and was BP’s chief financial officer during much of that period.
Phuthuma NhlekoBSc (Eng), MBA
54, joined the Board on 9 March 2011 and is a member of the Audit and Nomination Committees. Phuthuma is also chairman of Pembani Group (Pty) Limited and Afrisam South Africa (Pty) Limited and a non-executive director of BP plc. He is chairman of MTN Group Ltd, having formerly been the President and CEO from 2002 to 2011. He brings broad business experience and previously served as a director on a number of boards in South Africa: Nedbank Group; Alexander Forbes; Bidvest; and Old Mutual (SA).
Ray O’RourkeKBE, HonFREng, CEng, FIEI, FICE
68, joined the Board on 11 December 2009. He is a member of the Nomination, Remuneration and Sustainability Committees. Ray has a proven track record in delivering complex and large-scale projects around the world, mobilising large numbers of people with great success and applying leading project management and engineering practices. As a member of the Sustainability Committee, he has a keen interest in safety.
Ray founded the O’Rourke Group in 1977, having begun his career at Kier and J Murphy & Sons. In 2001, the O’Rourke Group acquired John Laing to form Laing O’Rourke, now Europe’s largest privately owned construction company, of which Ray is chairman.
67Anglo American plc Annual Report 2014
Governance

NON-EXECUTIVE DIRECTORS continued
Mphu RamatlapengMD, MHSc
62, was appointed to the Board on 8 July 2013 and is a member of the Sustainability Committee. Mphu is a highly experienced leader who brings a broad range of South African and international health expertise at board level across both the public and private sectors. She has a clear vision and deep understanding of the social benefits of effective healthcare programmes and capacity building through partnership.
Mphu is the Executive Vice President of HIV/AIDS and Tuberculosis programmes for the Clinton Health Access Initiative and also the Vice Chair of the Global Fund to Fight AIDS, TB and Malaria. She served as Minister of Health and Social Welfare of Lesotho between 2007 and 2012. In this role, she championed Lesotho’s significant achievements in reducing the transmission of HIV from mother to child. Across her career, she has also been a leading advocate for women in business, including serving as founding board member of Women in Business in Lesotho.
Jim RutherfordBSc (Econ), MA (Econ)
55, joined the Board on 4 November 2013. Jim is a member of the Sustainability and Audit Committees. He has extensive experience in investment management and investment banking, both as an institutional investor and analyst. He brings to the Board considerable financial insight from the perspective of the capital markets and a deep strategic understanding of the mining industry.
Between 1997 and 2013, he was a Senior Vice President of Capital International Investors, a division of the Capital Group, and had responsibility for investments in the mining and metals industry with a broad global geographic coverage. Prior to joining Capital Group, Jim was an investment analyst covering the South American mining and metals industry for HSBC James Capel in New York.
Anne StevensBSc, PhD
66, joined the Board on 14 May 2012 and is a member of the Audit and Nomination Committees. Anne brings a wealth of experience and wide-ranging commercial acumen from a number of global industries. She has experience gained across North, Central and South America.
Anne has served on the board of Lockheed Martin Corporation as a non-executive director since 2002, and is also the chairman of a privately held IT services business, SA IT. Anne’s 16-year career with the Ford Motor Company culminated in her appointment as COO for the Americas, a position she held until 2006. Prior to joining Ford in 1990, Anne spent 10 years in a number of engineering, product development, and sales and marketing roles at Exxon Chemical Co, and three years as chairman and CEO of Carpenter Technology.
Jack ThompsonBSc, PhD
64, joined the Board on 16 November 2009, is chairman of the Sustainability Committee and a member of the Remuneration Committee. Jack brings experience gained at all levels of the mining industry and has received wide recognition as a mining executive. He is currently a non-executive director of Tidewater Inc.
Jack was previously chairman and CEO of Homestake Mining Co., vice chairman of Barrick Gold Corp. and has served on the boards of Centerra Gold Inc., Century Aluminum Co., Molycorp Inc., Phelps Dodge Corp., Rinker Group Ltd., and Stillwater Mining.
David Challen and Sir CK Chow also served on the Board from the beginning of the year until the 2014 AGM.
Anglo American plc Annual Report 201468
GOVERNANCE DIRECTORS

Chris GriffithB Eng (Mining) Hons, Pr Eng
50, was appointed CEO of Anglo American Platinum Limited with effect from 1 September 2012. He was previously CEO of Kumba Iron Ore from 2008. Prior to this he was Anglo American Platinum’s head of operations for joint ventures. Chris has been with Anglo American for 25 years.
Norman MbazimaFCCA, FZICA
56, was appointed CEO of Kumba Iron Ore with effect from 1 September 2012. He joined Anglo American in 2001 at Konkola Copper Mines plc. He was subsequently appointed global CFO for Anglo Coal. He became executive director of finance at Anglo American Platinum Limited in June 2006 and later stepped in as joint acting CEO. Norman was CEO of Scaw Metals from May 2008 and later CEO of Thermal Coal from October 2009, a position he held until 2012.
Philippe MellierMSc (Mechanical Engineering), MBA
59, was appointed CEO of De Beers Group in July 2011. He began his career in 1980 with the Ford Motor Company, where he occupied various senior management positions over 19 years. In 1999, Philippe joined Renault as a senior vice president in charge of European sales, and was a member of the management board. In 2001 he moved to Volvo AB to become chairman and CEO of Renault Trucks, and a member of the Volvo Group executive committee. In 2003, Philippe became president of Alstom Transport and was appointed executive vice president of Alstom Group a year later.
EXECUTIVE MANAGEMENT
GROUP MANAGEMENT COMMITTEE MEMBERS
Mark CutifaniSee page 66 for biographical details.
René MédoriSee page 66 for biographical details.
Paulo Castellari-PorchiaBcom, MBA
44, is CEO of Iron Ore Brazil. He was previously CEO of Anglo American’s Phosphates and Niobium businesses in Brazil and served in Anglo American’s former Base Metals division. Paulo’s career with the Group started in 1993 and has included positions at AngloGold Ashanti and Minorco in a number of operational, corporate finance and capital project roles.
Seamus FrenchB Eng (Chemical)
52, is CEO of Coal. He joined WMC Resources in Australia in 1994, initially in a strategic planning and business development role, and progressed to various operational management roles, gaining extensive experience in the gold and nickel businesses before advancing to the position of executive general manager, copper-uranium division. Seamus joined BHP Billiton as global vice president, business excellence, following its takeover of WMC in 2005. He was appointed regional CEO of Anglo Coal Australia in 2007, bringing strong skills in operations, safety, and business improvement to the role. He was CEO of Metallurgical Coal between 2009 and 2013.
69Anglo American plc Annual Report 2014
Governance
GOVERNANCE EXECUTIVE MANAGEMENT

Duncan WanbladBSc (Eng) Mech, GDE (Eng Management)
48, is CEO of Base Metals and Minerals. He began his career at Johannesburg Consolidated Investment Company Limited in 1990. Between 2009 and 2013, Duncan held the position of Group director, Other Mining and Industrial businesses. He was appointed to the board of Anglo American Platinum Limited in 2004 and was appointed joint interim CEO of Anglo American Platinum in 2007, before taking over as CEO of Anglo American’s copper operations in 2008.
Peter WhitcuttBCom (Hons), CA (SA), MBA
49, is Group director, strategy, business development and marketing. He joined Anglo American in 1990 within the corporate finance division. He worked on the merger of Minorco with Anglo American, the listing of Anglo American in 1999, and the subsequent unwinding of the cross-holding with De Beers. Peter was appointed Group head of finance in 2003, CFO of Base Metals in August 2008 and to his present position in October 2009, which was expanded to include marketing in 2013.
Khanyisile Kweyama was a member of the GMC during the year, before being seconded to Business Unity South Africa to take up the position of CEO for two years, effective 2 January 2015.
GROUP MANAGEMENT COMMITTEE continued
Phil MitchellBEc, CPA
54, Group Director, HR and corporate affairs. Phil has extensive experience in the mining industry, following a 32-year career with Rio Tinto. He has worked across many commodity businesses in roles spanning finance, business development and M&A, including negotiations with governments and employees as part of a number of different strategic initiatives. Phil holds an economics degree from the Australian National University.
Tony O’NeillMBA, BASc (Eng)
57, is Group director, technical and sustainability, and joined Anglo American in 2013. He is a member of the Sustainability and Investment Committees. He is also a non-executive director of De Beers, Kumba Iron Ore and Anglo American Platinum Limited.
Tony joined AngloGold Ashanti in July 2008 as Executive Vice President – Business and Technical Development and served as Joint Acting CEO until July 2013. His 36-year career in the mining industry has spanned iron ore, copper, nickel and gold, and includes his roles as operations executive at Newcrest Mining and as the head of the gold business at Western Mining Corporation. Tony is a mining engineer with an MBA from the University of Melbourne.
Anglo American plc Annual Report 201470
GOVERNANCE EXECUTIVE MANAGEMENT

THE ROLE OF THE BOARD
The Board provides leadership to the Group and is responsible for its long term success. It seeks to achieve this by establishing the ‘tone from the top’, through setting Group strategy and approving business plans, monitoring performance, overseeing risk management and ensuring the right people are in place via board and executive succession planning.
The Board is supported by a number of committees, to which it has delegated certain powers. The role of these committees is summarised below, and their membership and activities during the year are detailed on pages 76–82.
Under the Group’s governance arrangements, certain key decisions can only be made by the Board and may not be delegated. The schedule of ‘Matters Reserved for the Anglo American plc Board’, and the committees’ terms of reference, detailing the specific responsibilities of the Board and its committees can be found online.
For more information, visit www.angloamerican.com/aboutus/ourapproach
Role of the chairman Sir John Parker manages the Board. His main responsibilities include:
• Board leadership • Board composition and succession planning • Governance • Advising, providing counsel and acting as confidant to the chief executive • Ambassador for the Group • Available for shareholders
Role of the chief executiveMark Cutifani manages the Group. His main responsibilities include:
• Executive leadership • Formulation of Group strategy • Approval and monitoring of business plans • Organisational structure and senior appointments • Acquisitions and disposals and business development • Shareholder relations
Role of the senior independent director (SID)Sir Philip Hampton, as the SID, is available to discuss any concerns with shareholders that cannot be addressed through the normal chairman/chief executive channels. He also acts as a sounding board and confidant for the chairman and as an intermediary for other directors, if necessary.
Governance structure
Board committees Executive committees
The BoardProvides leadership to the Group and is responsible for its long term success.
Sustainability CommitteeOversees management of sustainability issues, including safety, health. environment, social and governmental relations.See page 76 for more details.
Audit CommitteeOversight of financial reporting, audit, internal control and risk management.See page 78 for more details.
Nomination CommitteeResponsible for board composition, appointment of directors and senior management and succession planning.See page 77 for more details.
Remuneration CommitteeDetermines the remuneration of executive directors, the chairman and senior management and oversees remuneration policy for all employees.See page 82 for more details.
Group Management Committee (GMC)Principal executive committee. Responsible for formulating strategy, setting targets/budgets and managing the Group’s portfolio.
For more information see ‘GMC Rules’ on the Group’s website.
Corporate Committee (CorpCo)Reviews corporate policies and processes, and financial performance and budgets at BU level.
Operational Committee (OpCo)Responsible for driving operational best practices across the Group and the setting of technical standards.
Investment Committee (InvestCo)Responsible for making recommendations to the GMC on capital investment proposals.
THE BOARD IN 2014
71Anglo American plc Annual Report 2014
Governance
GOVERNANCE THE BOARD IN 2014

BOARD COMPOSITION
The Board currently comprises the chairman, two executive directors and nine independent non-executive directors. Board composition is regularly refreshed, with all the current non-executive directors having been appointed within the last six years. In terms of diversity, the Company has
achieved the Davies Report target of 25% women on the Board, and contains directors from Australia, France, Ireland, Lesotho, South Africa, the UK, and the US, with a broad range of professional experience as set out in the table below.
Board diversityNationality
Australia South Africa
France UK
Ireland UK/US
Lesotho US
Professional experience
Percentage of Board membership
Automotive
8%Educational/ government/ public entities 17%Energy
17%Engineering/ construction
33%Finance
33%Medical/ healthcare
17%Mining
25%Other global multinational
58%Social enterprises
8%Telecoms
17%
Anglo American plc Annual Report 201472
GOVERNANCE THE BOARD IN 2014

BOARD DISCUSSIONS
The chairman has developed and maintains a two-year rolling agenda which sets the framework for Board meetings and seeks to ensure that each meeting covers an appropriate range of topics – from routine business, through operational reports and project updates, to special items and matters of strategy and business development – and that over the course of a year, the Board covers its whole remit.
Each meeting includes a wide-ranging report from the chief executive and a report from the finance director on the Group’s financial performance. Reports from the committee chairmen, updates on major projects and certain other administrative matters are also reported at each Board meeting.
In addition to these regular items, the following matters were discussed, among others, during 2014:
February • Annual results and dividend recommendation • Strategic development – update • Cyber risk • Litigation update • Results of the 2013 Board and Committee evaluation
April • Business Report – Minas-Rio • AGM preview • Barro Alto capex proposal • Various major supply contracts for approval
June • Business Report – Sishen mine • De Beers’ Gahcho Kué project • Board Strategy sessions – two days
July • Interim results and interim dividend recommendation • Business Report – Coal • Strategy update • Litigation update
October • Business Report – Platinum (including a Board visit to Mogalakwena mine) • Commodity pricing update • Sishen heavy mining equipment plan
December • December Investor Day presentation • Budget and Business Plans 2015–2017 • Business Report – Base Metals • Commodity pricing – update and long term outlook
Board and Committee meetings 2014 – frequency and attendance of members
Independent Board Audit Sustainability Remuneration Nomination
Sir John Parker
n/a 6/6 – 4/4 – 2/2
Mark Cutifani
No 6/6 – 4/4 – –
René Médori
No 6/6 – – – –
David Challen(1)
Yes 2/2 1/1 – 2/2 1/1
Sir CK Chow(1)
Yes 2/2 – – 2/2 1/1
Judy Dlamini
Yes 6/6 3/3 – 3/3 –
Byron Grote
Yes 6/6 3/3 – 3/3 –
Sir Philip Hampton
Yes 6/6 3/3 – 3/3 2/2
Phuthuma Nhleko
Yes 5/6(2) 2/3(2) – – 2/2
Ray O’Rourke
Yes 6/6 – 3/4(3) 3/3 2/2
Mphu Ramatlapeng
Yes 6/6 – 4/4 – –
Jim Rutherford
Yes 6/6 2/2(4) 4/4 – –
Anne Stevens
Yes 6/6 3/3 – – 2/2
Jack Thompson
Yes 6/6 – 4/4 3/3 –
(1) Meetings attended prior to retirement.(2) Mr Nhleko did not attend the December Board and Committee meetings to avoid a potential conflict of interest.(3) Mr O’Rourke was unable to attend one Sustainability Committee meeting due to a diary clash.(4) Meetings attended since appointment.
73Anglo American plc Annual Report 2014
Governance
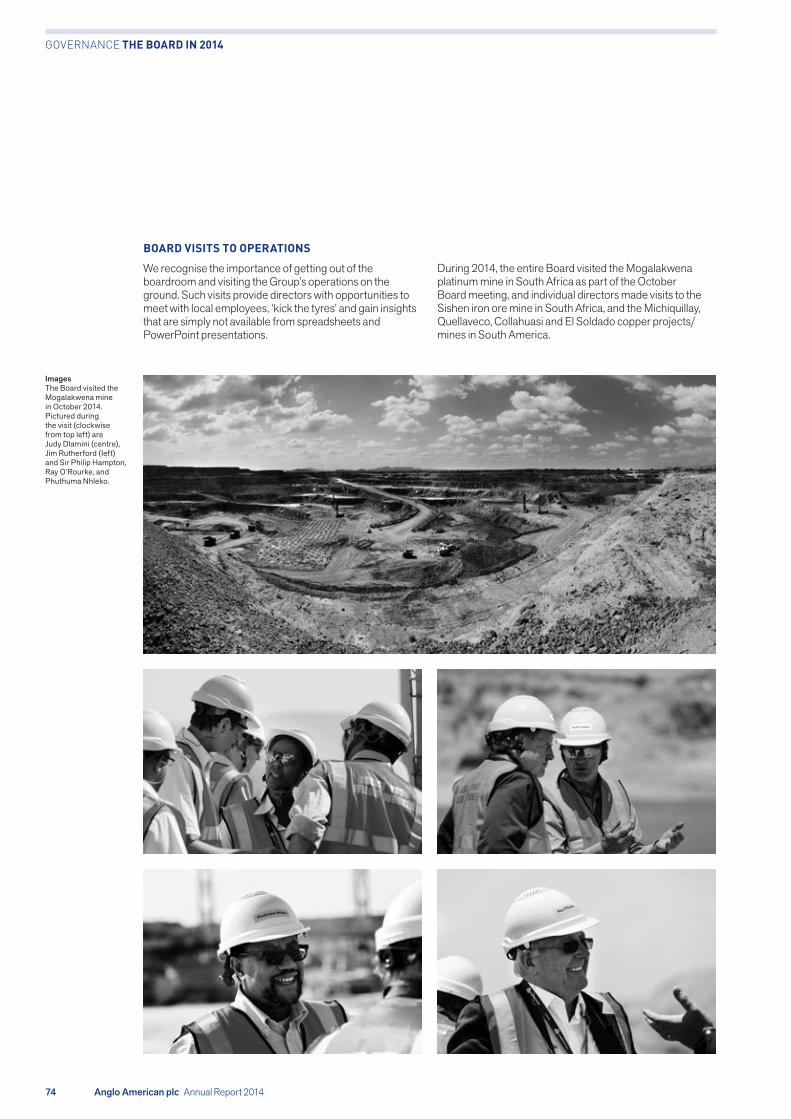
BOARD VISITS TO OPERATIONS
We recognise the importance of getting out of the boardroom and visiting the Group’s operations on the ground. Such visits provide directors with opportunities to meet with local employees, ‘kick the tyres’ and gain insights that are simply not available from spreadsheets and PowerPoint presentations.
During 2014, the entire Board visited the Mogalakwena platinum mine in South Africa as part of the October Board meeting, and individual directors made visits to the Sishen iron ore mine in South Africa, and the Michiquillay, Quellaveco, Collahuasi and El Soldado copper projects/ mines in South America.
Images The Board visited the Mogalakwena mine in October 2014. Pictured during the visit (clockwise from top left) are Judy Dlamini (centre), Jim Rutherford (left) and Sir Philip Hampton, Ray O’Rourke, and Phuthuma Nhleko.
Anglo American plc Annual Report 201474
GOVERNANCE THE BOARD IN 2014

BOARD EVALUATION
In accordance with the Code, we conduct an externally facilitated evaluation every three years, with the next being due to take place during the course of 2015. Between the externally facilitated reviews, the Board undertakes an online, questionnaire based evaluation of its, and the committees’, performance. This is augmented by one-to-one interviews by the chairman with the non-executive directors.
The evaluation undertaken in late 2013 and reviewed by the Board in February 2014 found that, overall, the Board and its committees were performing well. The areas for improvement included: shorter presentations and longer discussions and, in terms of strategic discussions, more information on industry trends and competitor benchmarking was requested. That these suggested improvements are not new underlines the fact that improving board performance is an iterative, ongoing exercise, which is never entirely complete.
A further internal evaluation was undertaken in late 2014, the results of which were reviewed by the Board in February 2015.
Overall, performance of the Board was highly rated. However, as one would expect from an engaged board, there is the opportunity for further improvements. At a time of increased volatility in the industry the Board needs to continue its focus on the management of risks. It also needs to strengthen its links with the Management of the Businesses to ensure that the expertise and experience of Board members is utilised in support of restructuring and strategic change. Suggestions to improve our strategic debates, especially around our Strategy Day, will also be addressed.
An action plan incorporating key suggestions for improvements will be debated at our next Board meeting to implement agreed change.
INVESTOR RELATIONS
The Company maintains an active engagement with its key financial audiences, including institutional shareholders and buy and sell-side analysts, as well as potential shareholders. The Investor Relations department manages the interaction with these audiences and regular presentations take place at the time of interim and final results as well as during the rest of the year, including an annual capital markets day. An active programme of communication with potential shareholders is also maintained.
Any significant concerns raised by a shareholder in relation to the Company and its affairs are communicated to the Board. The Board is briefed on a regular basis by the Investor Relations department and analysts’ reports are circulated to the directors. Feedback from meetings held between executive management, or the Investor Relations department, and institutional shareholders, is also communicated to the Board.
During the year there were regular presentations to, and meetings with, institutional investors in the UK, South Africa, continental Europe, the US and Asia Pacific to communicate the strategy and performance of Anglo American. Executive directors as well as key executives, including business unit heads, host such presentations, which include seminars for investors and analysts and one-on-one meetings.
Throughout the year, executive management also presents at industry conferences that are mainly organised by investment banks for their institutional investor base.
The chairman, the senior independent director and other non-executive directors are available to shareholders to discuss any matter they wish to raise. The Company’s website provides the latest news and historical financial information, details about forthcoming events for shareholders and analysts, and other information regarding Anglo American.
75Anglo American plc Annual Report 2014
Governance

COMMITTEE DISCUSSIONS IN 2014
At each meeting, the Committee reviews a detailed quarterly report covering the Group’s performance across a range of sustainability areas including: safety; occupational health; political and regulatory risk; and environment and social performance. In addition to these standing agenda items, the following matters were discussed during 2014:
February • business unit sustainability report: Kumba Iron Ore
• key HR risks, derived from the overall sustainability risk report
• safety update – focused on increased use of leading indicators and on audits and reviews to measure the effectiveness of controls.
April • regulatory update – summary of evolving issues and regulatory developments
• an update on sustainability activities within the supply chain
• government and social affairs update – focused on licensing/permitting and on social performance and socio-economic development
• presentation from the President of the World Business Council for Sustainable Development.
July • detailed update on occupational health and hygiene
• business unit sustainability report: Base Metals and Minerals
• industry benchmarking: benchmarking the Group’s performance against industry peers across a range of sustainability metrics
• presentation by the Cambridge Institute for Sustainability Leadership.
October • business unit sustainability report: Coal
• integrated reporting: Professor Mervyn King gave a presentation on the work of the International Integrated Reporting Council.
ROLE AND RESPONSIBILITIES
The Committee changed its name to the Sustainability Committee (from the Safety & Sustainable Development Committee) during the year and adopted new terms of reference to reflect its focus on the whole range of sustainability issues facing the Group.
The Committee’s purpose is to oversee, on behalf of the Board, material management policies, processes and strategies designed to manage safety, health, environment, socio-political and people risks. It aims to achieve compliance with sustainable development responsibilities and commitments and strive for an industry leadership position on sustainability.
The new terms of reference are available to view online.For more information, visit www.angloamerican.com/aboutus/ourapproach
COMPOSITION
• Jack Thompson – Chairman • Mark Cutifani • Tony O’Neill • Ray O’Rourke • Sir John Parker • Mphu Ramatlapeng • Jim Rutherford
Jack Thompson Chairman, Sustainability Committee
SUSTAINABILITY COMMITTEE
Anglo American plc Annual Report 201476
GOVERNANCE SUSTAINABILITY COMMITTEE

Sir John Parker Chairman, Nomination Committee
COMPOSITION
• Sir John Parker – Chairman • Sir Philip Hampton • Phuthuma Nhleko • Ray O’Rourke • Anne Stevens
NOMINATION COMMITTEE
ROLE AND RESPONSIBILITIES
• Setting guidelines (with the approval of the Board) for the types of skills, experience and diversity being sought when making a search for new directors. With the assistance of external consultants, identifying and reviewing in detail potential candidates available in the market and agreeing a ‘longlist’ of candidates for each directorship. Following further discussion and research, deciding upon a shortlist of candidates for interview. Interviewing of shortlisted candidates by the Committee members who then convene to discuss their impressions and conclusions, culminating in a recommendation to the Board.
• Making recommendations as to the composition of the Board and its committees and the balance between executive directors and non-executive directors (NEDs), with the aim of cultivating a diverse board with the appropriate mix of skills, experience, independence and knowledge.
• Ensuring that the HR function of the Group regularly reviews and updates the succession plans of directors and senior managers for subsequent debate with the NEDs and chief executive.
COMMITTEE DISCUSSIONS IN 2014
The Committee met twice during 2014, discussing the following matters:
February • discussed the composition of the Board committees and agreed to propose to the Board that Judy Dlamini be appointed to the Remuneration Committee and Jim Rutherford be appointed to the Audit Committee
• recommended the appointment of Sir Philip Hampton as senior independent director
• noted that the Company would achieve the 25% Davies target for women on the Board, and discussed how the ‘pipeline’ of potential candidates could be expanded through, for example, greater mentoring.
October • discussed the appointment of the Group Company Secretary and agreed that John Mills’ nomination be submitted to the Board
• noted the service profiles of the current NEDs and the Chairman’s proposal of a structured approach to the ongoing review of NED appointments. The Committee agreed this proposal be submitted to the Board
• agreed to recommend to the Board the proposal that Phil Mitchell join the GMC.
77Anglo American plc Annual Report 2014
Governance
GOVERNANCE NOMINATION COMMITTEE

AUDIT COMMITTEE
FAIR, BALANCED AND UNDERSTANDABLE
A key requirement of our financial statements is for the report and accounts to be fair, balanced and understandable. The Audit Committee and the Board are satisfied that the Annual Report and Accounts meet this requirement as appropriate weight has been given to both positive and negative developments in the year.
In justifying this statement, the Audit Committee has considered the robust process which operates in creating the report and accounts, including:
• clear guidance and instruction is given to all contributors
• revisions to regulatory requirements, including the Code, are monitored on an ongoing basis
• early-warning meetings are conducted between business unit management and the auditors in advance of the year end reporting process
• input is provided by senior management and corporate functions
• a thorough process of review, evaluation and verification of the inputs from business units is undertaken to ensure accuracy and consistency
• further reviews are conducted by senior management
• a review is conducted by external advisors appointed to advise management on best practice with regard to creation of the report and accounts
• a meeting of the Audit Committee is held to review and consider the draft annual report and accounts in advance of the final sign-off
• final sign-off is provided by the Board.
COMPOSITION
• Byron Grote – Chairman • Judy Dlamini • Sir Philip Hampton • Phuthuma Nhleko • Jim Rutherford • Anne Stevens
Byron Grote Chairman, Audit Committee
ROLE AND RESPONSIBILITIES
• Monitoring the integrity of the annual and interim financial statements.
• Making recommendations to the Board concerning the adoption of the annual and interim financial statements.
• Overseeing the Group’s relations with the external auditors.
• Making recommendations to the Board on the appointment, retention and removal of the external auditors.
• Reviewing and monitoring the effectiveness of the Group’s internal control and risk management systems.
• Approving the terms of reference and plans of the internal audit function.
• Approving the internal audit plan and reviewing regular reports from the head of internal audit on effectiveness of the internal control system.
• Receiving reports from management on the key risks of the Group. Further details of such risks are provided on pages 42–47.
Anglo American plc Annual Report 201478
GOVERNANCE AUDIT COMMITTEE

December • reviewed the significant accounting issues that would impact the 2014 financial results
• reviewed an update on the outcome of regulatory review of the statutory audit market
• approved the external audit plan for the 2014 audit and external auditor’s view on the key audit risks
• received a report from management on Treasury matters and plans for 2015
• reviewed the risks associated with sale of assets announced for disposal
• reviewed the status of an investigation into an alleged fraud conducted in Australia and Chile by a former employee
• reviewed the Committee’s Terms of Reference.
The Audit Committee report is set out below.
COMMITTEE DISCUSSIONS IN 2014
The Audit Committee held three meetings in 2014. The key issues reviewed included the following:
February • reviewed in detail the significant accounting issues, the going concern assessment and the press release for the 2013 financial results
• reviewed the results of the external audit work
• considered the position regarding tendering of the external auditor appointment
• noted the effective tax rate and developments in mining taxation
• reviewed the Ore Reserves and Mineral Resources report
• reviewed a report on completion of the 2013 internal audit plan and discussed the significant findings.
July • evaluated management’s proposed accounting treatment and disclosure relating to various matters including the proposed sale of the Group’s stake in the Lafarge Tarmac joint venture
• reviewed the assumptions underpinning the going concern assessment
• satisfied itself that the external auditor was in agreement with the accounting treatment and judgement proposed by management on the significant accounting items
• received a report on the progress of the internal audit plan for 2014
• reviewed the risk profile of Anglo American and each of its business units
• reviewed the governance framework for the Marketing business unit
• reviewed an analysis of pricing outlooks and comparison.
79Anglo American plc Annual Report 2014
Governance

ENSURING INDEPENDENCE OF THE EXTERNAL AUDITORS
Anglo American’s policy on auditors’ independence is consistent with the ethical standards published by the Audit Practices Board.
A key factor that may impair auditors’ independence is a lack of control over non-audit services provided by the external auditors. In essence, the external auditors’ independence is deemed to be impaired if the auditors provide a service that:
• results in the auditors acting as a manager or employee of the Group
• puts the auditors in the role of advocate for the Group
• creates a mutuality of interest between the auditors and the Group.
Anglo American addresses this issue through three primary measures, namely:
• disclosure of the extent and nature of non-audit services
• the prohibition of selected services – this includes the undertaking of internal audit services
• prior approval by the Audit Committee chairman of non-audit services where the cost of the proposed assignment is likely to exceed $50,000.
Anglo American’s policy on the provision of non-audit services is regularly reviewed. The definition of prohibited non-audit services corresponds with the European Commission’s recommendations on auditors’ independence and with the Ethical Standards issued by the Audit Practices Board in the UK.
Other safeguards • The external auditors are required to adhere to a rotation policy based on best practice and professional standards in the United Kingdom. The standard period for rotation of the audit engagement partner is five years and, for any key audit partner, seven years. The audit engagement partner was appointed in 2010 and will rotate off at the conclusion of the 2014 audit in accordance with this requirement. The appointment of a replacement engagement partner has been approved by the Audit Committee.
• Any partner designated as a key audit partner of Anglo American shall not be employed by Anglo American in a key management position unless a period of at least two years has elapsed since the conclusion of the last relevant audit.
• The external auditors are required to assess periodically, whether in their professional judgement, they are independent of the Group.
• The Audit Committee ensures that the scope of the auditors’ work is sufficient and that the auditors are fairly remunerated.
• The Audit Committee has primary responsibility for making recommendations to the Board on the appointment, re-appointment and removal of the external auditors.
• The Audit Committee has the authority to engage independent counsel and other advisers as they determine necessary in order to resolve issues on auditors’ independence.
• An annual assessment is undertaken of the auditors’ effectiveness, independence and objectivity. The effectiveness assessment involves a review with the senior finance managers in each of the business units and relevant corporate functions.
Conclusions of the Audit Committee for 2014The Audit Committee has satisfied itself that the UK professional and regulatory requirements for audit lead engagement partner rotation were adhered to and the external auditors’ independence was not impaired.
The Audit Committee held meetings with the external auditors without the presence of management on two occasions and the chairman of the Audit Committee held regular meetings with the audit engagement partner during the year.
Consideration given to the appointment of the external auditors The Audit Committee’s assessment of the external auditors’ performance and independence underpins its recommendation to the Board to propose to shareholders the re-appointment of Deloitte LLP as auditors until the conclusion of the AGM in 2016. Resolutions to authorise the Board to re-appoint and determine the remuneration of Deloitte LLP will be proposed at the AGM on 23 April 2015.
Audit TenderAnglo American recognises the outcome of the reviews of the statutory audit market undertaken by the EU and the Competition and Markets Authority including the associated transition rules. Under these arrangements, Anglo American will undertake, at the latest, a tender and rotation of the audit appointment at the time of the rotation of the lead engagement partner, which is due after completion of the 2019 audit.
Audit Committee actions in 2015Priorities for 2015 will include assessment of risks for which the Audit Committee has responsibility, monitoring significant financial matters and review of new regulatory requirements for audit committees with respect to reporting and governance.
AUDIT COMMITTEE REPORT
Anglo American plc Annual Report 201480
GOVERNANCE AUDIT COMMITTEE REPORT

The role of internal auditThe Group has an internal audit department that reports centrally, with responsibility for reviewing and providing assurance on the adequacy of the internal control environment across all of Anglo American’s operations.
The head of internal audit is responsible for reporting and following up on the findings of this internal audit work with local management and the Audit Committee on a regular basis.
Internal audit teams operated in all of the Group’s principal divisions in the period under review, reporting findings to local senior management. The internal audit function’s mandate and annual audit coverage plans have been approved by the Audit Committee.
The Audit Committee met independently with the head of internal audit during the year.
Obtaining assurance on the internal control environmentThe system of internal control, which is embedded in all key operations, provides reasonable rather than absolute assurance that the Group’s business objectives will be achieved within the risk tolerance levels defined by the Board. Regular management reporting, which provides a balanced assessment of key risks and controls, is an important component of board assurance.
During 2014, Anglo American detected a fraud committed by a project director for a development project in Australia involving an override of management controls in procurement and payments to fictitious suppliers. The project director had performed a similar role in Chile previously and forensic investigation established a similar fraud had been committed in that project. A separate fraud was identified in the Copper business perpetrated by a key contractor to the Los Bronces mine. In each case, the losses suffered were not material. The Company is taking steps to improve its controls to address identified weaknesses.
Whistleblowing programmeThe Group has had a whistleblowing programme in place for a number of years in all its managed operations.
This facility operates in addition to a standardised Group-wide stakeholder complaints and grievance procedure that is operated at all managed operations (see the 2014 Sustainable Development Report for more details). The whistleblowing programme, which is monitored by the Audit Committee, is designed to enable employees, customers, suppliers, managers or other stakeholders, on a confidential basis, to raise concerns in cases where conduct is deemed to be contrary to our values.
During 2014, 302 (2013: 372) reports were received via the global ‘Speak Up’ facility covering a broad spectrum of concerns, including:
• ethical
• criminal
• supplier relationships
• health and safety
• HR issues.
Reports received were kept strictly confidential and were referred to appropriate line managers within the Group for resolution. Where necessary, action was taken to address the issues raised. A governance process is in place to ensure all reports are analysed and acted upon.
81Anglo American plc Annual Report 2014
Governance

REMUNERATION COMMITTEE
ROLE AND RESPONSIBILITIES
• Establishing and developing the Group’s general policy on executive and senior management remuneration.
• Determining specific remuneration packages for the chairman and executive directors.
• Designing the Company’s share incentive schemes.
COMMITTEE DISCUSSIONS IN 2014
The Committee held three meetings in 2014, discussing the following matters:
February • reviewed executive director personal key performance indicators for 2014 and Group financial and safety targets to ensure alignment with Group strategy
• discussed the chief executive’s and finance director’s performance in 2013 to adjudicate on bonus outcomes and an appropriate reduction of bonuses in light of impairments being taken for the financial year
• reviewed executive directors’ shareholdings in the Company prior to 2014 share awards being made
• reviewed the forecast vesting of 2011 Bonus Share Plan (BSP) and Long Term Incentive Plan (LTIP) awards
• reviewed the 2013 Directors’ remuneration report ahead of publication
• reviewed corporate governance issues in the previous quarter.
April • confirmed the adoption of the final rules of the Anglo American Bonus Share Plan 2014
• confirmed the vesting of 2011 BSP and LTIP awards and the granting of 2014 BSP and LTIP awards
• reviewed and approved the proposal for Return on Capital Employed targets for the 2014 LTIP award
• discussed investor feedback on executive remuneration prior to the vote on the Directors’ remuneration report
• discussed the effect of 2013 impairments on future remuneration outcomes
• reviewed corporate governance issues that had arisen since the previous meeting.
December • reviewed directors’ salaries, taking into account the general salary review for the broader employee population
• considered GMC remuneration elements and the retention effect provided by unvested share incentives
• discussed the executive directors’ draft personal key performance indicators for 2015
• discussed potential changes to the Directors’ remuneration report for 2014
• reviewed and updated its terms of reference
• reviewed corporate governance issues that had arisen since the previous meeting.
The Directors’ remuneration report is set out opposite.
COMPOSITION
• Sir Philip Hampton – Chairman • Judy Dlamini • Byron Grote • Ray O’Rourke • Jack Thompson
Anglo American plc Annual Report 201482
GOVERNANCE REMUNERATION COMMITTEE

1. INTRODUCTORY LETTER
Dear Shareholder,
The role of the Company’s Remuneration Committee remains to ensure that the remuneration arrangements for executive directors and other members of the Group Management Committee offer them every encouragement to enhance the Company’s performance and deliver our strategy in a responsible manner. It is also our task to ensure that the rewards received by the executive directors are proportionate to the levels of performance achieved and the returns received by you as shareholders. As a Committee, we therefore have to give full consideration to the Company’s strategy, its performance, your interests and the interests of the wider communities we affect.
As reported by the chief executive in his introduction to this year’s Annual Report, it has been a challenging year for Anglo American. Whilst 2014 has seen a marked softening of commodity prices, the Company is continuing its operational turnaround and delivering on many of its strategic objectives, for example:
• completing the Minas-Rio project, with first iron ore shipped before the end of October and production being ramped up
• rolling out a revised operating model to improve operational performance
• continuing the review of its asset portfolio
• implementing organisational change.
DIRECTORS’ REMUNERATION REPORT
The role of the Company’s Remuneration Committee remains to ensure that the remuneration arrangements for executive directors offer every encouragement for them to enhance the Company’s performance and deliver our strategy in a responsible manner.
The economic challenges and business performance are reflected in the remuneration received by executive directors in 2014. Specifically:
• underlying earnings were ahead of the targets set at the start of the year
• the relatively subdued level of earnings over the last three years means that the required three-year earnings growth was not achieved and, therefore, of the Enhancement Shares initially awarded in 2012, none vested at the end of 2014
• the results of the Company’s longer term efficiency programmes mean that half the Long Term Incentive Plan (LTIP) awards initially granted to executive directors in 2012 are likely to vest. The remainder will not vest as the full value of these savings has yet to be returned to you, as shareholders, in the form of superior Total Shareholder Return (TSR).
We have chosen to reproduce the Company’s Remuneration Policy (as approved at the 2014 Annual General Meeting (AGM)) in full, rather than an abridged version, so that the Implementation Report for 2014, starting on page 93, will be more meaningful for you.
The Remuneration Policy continues to support the delivery of our strategic objectives as evidenced by the performance measures and targets for both the Bonus Share Plan (BSP) and LTIP awards made in 2014, both of which are outlined in the Implementation Report.
I am pleased to report that the strengthening of the malus and clawback provisions of the BSP and LTIP, introduced for awards made from 2014 onwards, meet the requirements of the revised Corporate Governance Code that will apply for the 2015 reporting year.
Sir Philip Hampton Chairman, Remuneration Committee
Sir Philip Hampton Chairman, Remuneration Committee
83
Governance
Anglo American plc Annual Report 2014

Figure 1: Key aspects of the remuneration policy for executive directors
Purpose Maximum opportunity Operation
Basic salary To recruit and retain high calibre executives
Standard maximum increase 5% of salary
(the Committee retains the discretion to exceed this in certain situations as explained under Operation)
Basic salary levels are reviewed annually by the Committee, taking account of Company performance, individual performance, levels of increase for the broader UK population and inflation
Reference may also be made to median levels within relevant FTSE 50 and global extractive companies
The Committee also considers the impact of any basic salary increase on the total remuneration package
Annual increases are typically within the standard maximum given
However, there may be occasions when the Committee needs to recognise, for example, development in role, change in responsibility and/or specific retention issues. In these circumstances, the Committee may offer a higher annual increase, the rationale for which will be explained to shareholders in the relevant remuneration report
Maximum levels will be reviewed to take account of any significant rise in inflation levels
Salary levels on recruitment and promotion to the Board are covered below
Bonus Share Plan (BSP)
To encourage and reward delivery of the Company’s strategic priorities
To help ensure, through the share-based elements, that any resulting performance is sustained over the longer term in line with shareholder interests
Maximum (threshold) 210% of salary (0% of salary)
Performance measures At least 50% – underlying earnings per share (EPS)
Up to 50% – individual objectives linked to the Company’s strategic priorities
A deduction to the above is applied if safety targets are not met
Form and timing of payment 40%: cash award at end of year
40%: Bonus Shares vesting three years after end of bonus year
20%: Bonus Shares as above but subject to a further two-year deferral period
Each year executive directors participate in the BSP, which rewards EPS and individual performance targets
The EPS measure has been chosen as it is one of the Company’s key measures of performance. As EPS performance in our sector can be highly volatile owing to external factors, the individual objectives measure was chosen to provide a balance and reflect management’s underlying activity towards delivering the company’s strategy regardless of price or other volatility
The EPS targets are set each year to ensure they are demanding yet realistic. They primarily reflect internal budgets and price expectations for the year. Consideration is also given to prior performance and external expectations. The individual objectives are based on the Company’s strategic priorities for the year
Dividends are payable on Bonus Shares during any deferral period
The Committee is able to reduce any unvested Bonus Share awards, vested awards subject to a deferral period or future awards in the event of a material misstatement in the Company’s results, misconduct or a material failing in risk management processes that has given, or is likely to give, rise to significant and lasting value destruction for the Company
2. POLICY ON DIRECTOR REMUNERATION
2.1 Remuneration policyFigures 1 and 2 summarise key aspects of the Company’s remuneration policy for executive and non-executive directors. This policy and the policy on termination set out in Figure 4 took effect for the purposes of S226D of the Companies Act on approval by shareholders at the AGM held on 24 April 2014. The Company has been operating these policies since 1 January 2014 and intends that these
policies should apply until the Company’s 2017 AGM, subject to any unforeseen developments. It is the Committee’s intention that commitments entered into before these policies took formal effect and which are inconsistent with them should be honoured, as explained further below.
Figure 1 shows the Remuneration Policy approved at the AGM in 2014, updated to reflect the fact that some historical information is no longer relevant.
84
GOVERNANCE DIRECTORS’ REMUNERATION REPORT
Anglo American plc Annual Report 2014

Figure 1: Key aspects of the remuneration policy for executive directors
Purpose Maximum opportunity Operation
Bonus Share Plan (BSP) continued
Discretions Given the volatility mentioned above, the Committee does not intend to make adjustments to BSP outcomes to reflect either positive or negative short term fluctuations in EPS performance driven by external factors such as commodity prices. It reserves the discretion to make adjustments to outcomes in very exceptional circumstances whether related to internal or external factors (for example, on a sequestration of assets during the year). Shareholders will be given details of any adjustments in the following remuneration report
Under the BSP Rules, the Company also has the standard discretion to take appropriate action in the event of unforeseen events which affect the Bonus Shares (for example, on a variation in share capital) and to settle the Bonus Shares in cash (for example, on a termination)
Long Term Incentive Plan (LTIP)
To encourage and reward disciplined capital allocation and the generation of long term sustainable shareholder returns
Maximum award 350% of salary
Performance measures 50%: Attributable Return on Capital Employed (ROCE)
50%: Total shareholder returns (TSR) relative to sector and leading UK comparator companies
Performance period Three years
Additional holding period Two years
Vesting at threshold ROCE: 25% of award portion
TSR: 25% of award portion
The Committee makes an annual conditional award of shares to each executive director
The ROCE measure has been selected to reflect the strategic focus on disciplined capital allocation and the TSR measures to reflect the extent to which value is being delivered to shareholders
Each year, the Committee reviews the performance targets prior to grant to ensure they remain sufficiently stretching. The initial ROCE targets have been informed by the Company’s stated 2016 attributable ROCE aspiration and each year will be set with reference to current budgets. The relative TSR targets are set such that only a quarter of the award is payable for median performance whilst maximum vesting requires exceptional relative performance
Dividend equivalents are paid on any shares that vest
The Committee is able to reduce any unvested awards, vested awards subject to a holding period or future grants in the event of a material misstatement in the Company’s results, misconduct or a material failing in risk management processes that has given, or is likely to give, rise to significant and lasting value destruction for the Company
Discretions As is the case for the BSP, the Committee does not intend to make adjustments to LTIP outcomes to reflect either positive or negative short term fluctuations in performance driven by external factors such as commodity prices. It reserves the discretion to make adjustments to outcomes in very exceptional circumstances whether related to internal or external factors (for example, on a sequestration of assets). Shareholders will be given details of any adjustments in the following remuneration report
Under the LTIP Rules, the Company also has the standard discretion to take appropriate action in the event of unforeseen events during an award cycle (for example, on a variation in share capital)
85
Governance
Anglo American plc Annual Report 2014
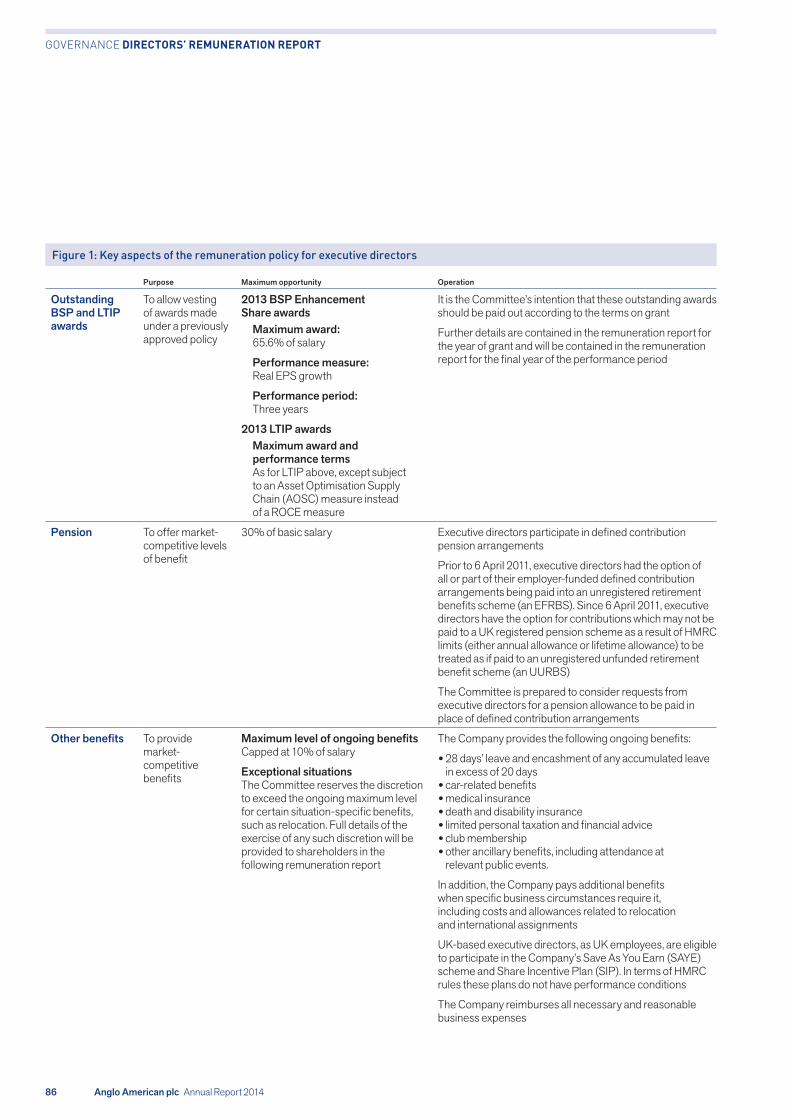
Figure 1: Key aspects of the remuneration policy for executive directors
Purpose Maximum opportunity Operation
Outstanding BSP and LTIP awards
To allow vesting of awards made under a previously approved policy
2013 BSP Enhancement Share awards
Maximum award: 65.6% of salary
Performance measure: Real EPS growth
Performance period: Three years
2013 LTIP awards Maximum award and performance terms As for LTIP above, except subject to an Asset Optimisation Supply Chain (AOSC) measure instead of a ROCE measure
It is the Committee’s intention that these outstanding awards should be paid out according to the terms on grant
Further details are contained in the remuneration report for the year of grant and will be contained in the remuneration report for the final year of the performance period
Pension To offer market-competitive levels of benefit
30% of basic salary Executive directors participate in defined contribution pension arrangements
Prior to 6 April 2011, executive directors had the option of all or part of their employer-funded defined contribution arrangements being paid into an unregistered retirement benefits scheme (an EFRBS). Since 6 April 2011, executive directors have the option for contributions which may not be paid to a UK registered pension scheme as a result of HMRC limits (either annual allowance or lifetime allowance) to be treated as if paid to an unregistered unfunded retirement benefit scheme (an UURBS)
The Committee is prepared to consider requests from executive directors for a pension allowance to be paid in place of defined contribution arrangements
Other benefits To provide market-competitive benefits
Maximum level of ongoing benefits Capped at 10% of salary
Exceptional situations The Committee reserves the discretion to exceed the ongoing maximum level for certain situation-specific benefits, such as relocation. Full details of the exercise of any such discretion will be provided to shareholders in the following remuneration report
The Company provides the following ongoing benefits:
• 28 days’ leave and encashment of any accumulated leave in excess of 20 days • car-related benefits • medical insurance • death and disability insurance • limited personal taxation and financial advice • club membership • other ancillary benefits, including attendance at relevant public events.
In addition, the Company pays additional benefits when specific business circumstances require it, including costs and allowances related to relocation and international assignments
UK-based executive directors, as UK employees, are eligible to participate in the Company’s Save As You Earn (SAYE) scheme and Share Incentive Plan (SIP). In terms of HMRC rules these plans do not have performance conditions
The Company reimburses all necessary and reasonable business expenses
86
GOVERNANCE DIRECTORS’ REMUNERATION REPORT
Anglo American plc Annual Report 2014

Figure 1: Key aspects of the remuneration policy for executive directors
Purpose Maximum opportunity Operation
Recruitment and promotion arrangements
To secure the appointment and promotion of high calibre executives
Maximum annual award(for ongoing arrangements)
BSP: 210% of salary
LTIP: 350% of salary
The ongoing remuneration arrangements for a newly recruited or promoted executive director will reflect the remuneration policy in place for executive directors at the time of the appointment. The ongoing components will therefore comprise basic salary, BSP awards, LTIP awards, benefits, pension and SAYE/SIP on the bases set out above
The initial basic salary level for a newly recruited or promoted executive director will be set to reflect the individual’s experience, salary levels within the Company and market levels. Where basic salary is set below the level that might be expected, given the executive’s relative inexperience, and the executive then develops successfully into the role, the Committee has the discretion to give a salary increase in the year(s) after appointment above the standard maximum level of 5%
For external appointments, the Committee may also offer additional cash and/or share-based elements to replace any remuneration forfeited, when it considers this to be in the best interests of the Company and its shareholders. The terms of any share-based elements offered will reflect the nature, time horizons and performance requirements of remuneration forfeited and will have performance conditions attached. Shareholders will be informed of any such payments at the time of appointment. The Company has retained its Discretionary Option Plan to use in such circumstances, if appropriate. If necessary, the Company can go outside of existing plans as currently permitted under the Listing Rules
It is the Committee’s intention that the restricted awards granted to Mark Cutifani on appointment will be released in accordance with the terms on grant. These awards were made under the approved policy at the time, as disclosed in the 2012 Report
For internal appointments, any commitments made before appointment and not relating to appointment are allowed to pay out according to their terms
For external and internal appointments, the Committee may agree that the Company will meet certain relocation expenses as appropriate
87
Governance
Anglo American plc Annual Report 2014

Figure 2: Key aspects of the remuneration policy for non-executive directors
Purpose Maximum opportunity Operation
Chairman – Fees
To attract and retain a high calibre chairman by offering a market-competitive fee level
Maximum increase Equivalent to annual increase of 5% of fee level
The chairman is paid a single fee for all his responsibilities
The level of this fee is reviewed every two to three years by the Committee and chief executive, with reference to UK market levels (FTSE 30 companies), and a recommendation is then made to the Board (in the absence of the chairman)
Fees are paid in cash with the flexibility to forgo all or part of the net fees to acquire shares in the Company
Chairman – Benefits
To provide market-competitive benefits
Maximum benefits £30,000
Reasonable use of a car and driver
Medical insurance
Reimbursement of reasonable and necessary expenses
Non-executive directors – Fees
To attract and retain high calibre non-executive directors by offering market-competitive fees
Maximum increase for each type of fee Equivalent to annual increase of 5% of fee level
The non-executives are paid a basic fee. The chairmen of the main board committees and the senior independent director are paid an additional fee to reflect their extra responsibilities
These fee levels are reviewed every few years by the chairman and executive directors, with reference to UK market levels, and a recommendation is then made to the Board
Fees are paid in cash with the flexibility to forgo all or part of the net fees to acquire shares in the Company
Reimbursement of necessary and reasonable expenses
Other fees/payments
To have the flexibility to provide additional fees/benefits if required
Maximum additional fee £30,000
The Company has the discretion to pay an additional fee, up to the equivalent of the committee chairmanship fee (currently £30,000), to a non-executive director should the Company require significant additional time commitment from the non-executive director in exceptional or unforeseen circumstances
The Company has no current intention to use this discretion
88
GOVERNANCE DIRECTORS’ REMUNERATION REPORT
Anglo American plc Annual Report 2014
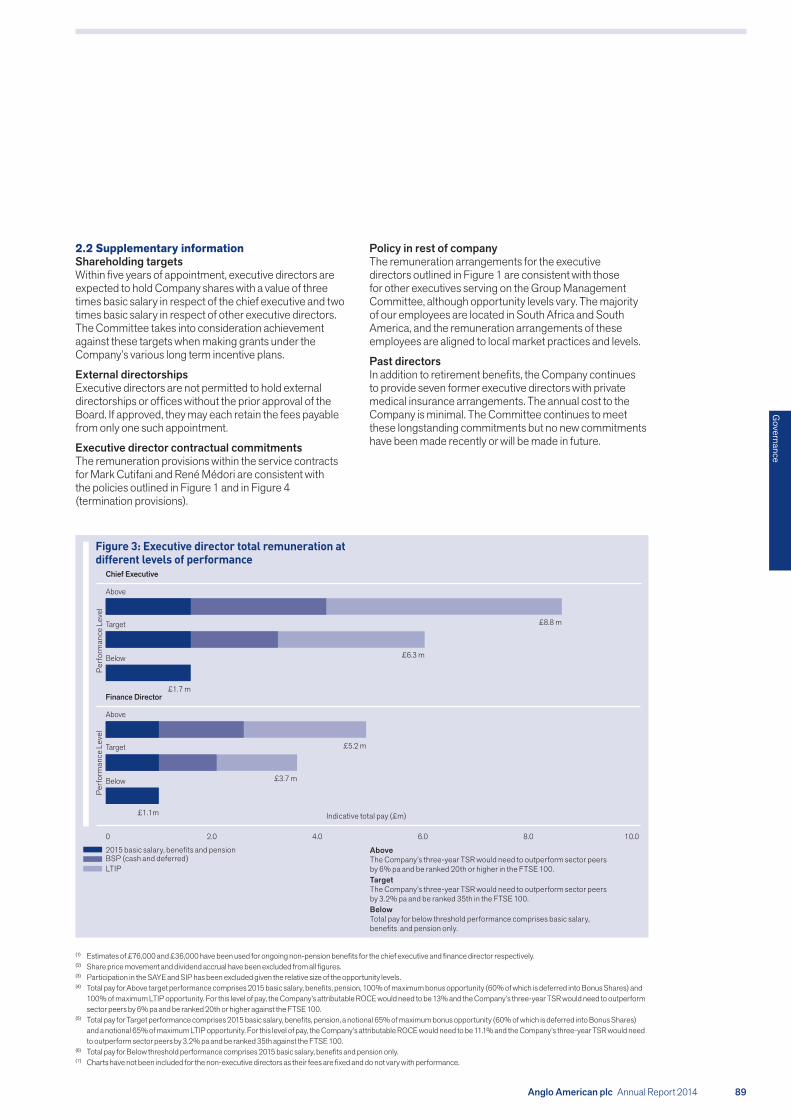
Chief Executive
Above
Below
Target
Above
Below
Target
Figure 3: Executive director total remuneration at different levels of performance
0 10.08.06.04.02.0
LTIPBSP (cash and deferred)2015 basic salary, benefits and pension Above
The Company’s three-year TSR would need to outperform sector peers by 6% pa and be ranked 20th or higher in the FTSE 100.TargetThe Company’s three-year TSR would need to outperform sector peers by 3.2% pa and be ranked 35th in the FTSE 100.BelowTotal pay for below threshold performance comprises basic salary, benefits and pension only.
Per
form
ance
Lev
elP
erfo
rman
ce L
evel
Indicative total pay (£m)
£8.8 m
£6.3 m
£1.7 mFinance Director
£5.2 m
£3.7 m
£1.1m
2.2 Supplementary informationShareholding targetsWithin five years of appointment, executive directors are expected to hold Company shares with a value of three times basic salary in respect of the chief executive and two times basic salary in respect of other executive directors. The Committee takes into consideration achievement against these targets when making grants under the Company’s various long term incentive plans.
External directorshipsExecutive directors are not permitted to hold external directorships or offices without the prior approval of the Board. If approved, they may each retain the fees payable from only one such appointment.
Executive director contractual commitmentsThe remuneration provisions within the service contracts for Mark Cutifani and René Médori are consistent with the policies outlined in Figure 1 and in Figure 4 (termination provisions).
Policy in rest of companyThe remuneration arrangements for the executive directors outlined in Figure 1 are consistent with those for other executives serving on the Group Management Committee, although opportunity levels vary. The majority of our employees are located in South Africa and South America, and the remuneration arrangements of these employees are aligned to local market practices and levels.
Past directorsIn addition to retirement benefits, the Company continues to provide seven former executive directors with private medical insurance arrangements. The annual cost to the Company is minimal. The Committee continues to meet these longstanding commitments but no new commitments have been made recently or will be made in future.
(1) Estimates of £76,000 and £36,000 have been used for ongoing non-pension benefits for the chief executive and finance director respectively.(2) Share price movement and dividend accrual have been excluded from all figures.(3) Participation in the SAYE and SIP has been excluded given the relative size of the opportunity levels.(4) Total pay for Above target performance comprises 2015 basic salary, benefits, pension, 100% of maximum bonus opportunity (60% of which is deferred into Bonus Shares) and
100% of maximum LTIP opportunity. For this level of pay, the Company’s attributable ROCE would need to be 13% and the Company’s three-year TSR would need to outperform sector peers by 6% pa and be ranked 20th or higher against the FTSE 100.
(5) Total pay for Target performance comprises 2015 basic salary, benefits, pension, a notional 65% of maximum bonus opportunity (60% of which is deferred into Bonus Shares) and a notional 65% of maximum LTIP opportunity. For this level of pay, the Company’s attributable ROCE would need to be 11.1% and the Company’s three-year TSR would need to outperform sector peers by 3.2% pa and be ranked 35th against the FTSE 100.
(6) Total pay for Below threshold performance comprises 2015 basic salary, benefits and pension only.(7) Charts have not been included for the non-executive directors as their fees are fixed and do not vary with performance.
89
Governance
Anglo American plc Annual Report 2014

2.3 Indicative total remuneration levelsThe Company’s policy for executive directors results in a significant portion of the remuneration received by executive directors being dependent on Company performance. Figure 3 illustrates how the total pay opportunities for the chief executive and the finance director vary under three different performance scenarios:
• Above – representing 100% of maximum for variable pay opportunity
• Target – representing a notional 65% of maximum for variable pay opportunity
• Below – representing 0% of maximum for variable pay opportunity.
These charts are indicative as share price movement and dividend accrual have been excluded. All assumptions made are noted below the charts.
2.4 Policy on termination and change in control2.4.1 Executive directorsFigure 4 sets out the Company’s policy on termination. This policy is consistent with provisions relating to termination of employment in the executive directors’ service agreements and with provisions in the incentive plan rules with one
Figure 4: Principles of determining payments for loss of office
Notice periods Notice periods do not exceed 12 months
Upon appointment the Committee can agree an extended Company notice period for the first year following appointment
‘Good Leaver’ Voluntary Resignation ‘Bad Leaver’
Circumstances of departure of executive directors
Typical reasons include retirement, redundancy, death, ill-health, injury, disability or as defined by the Committee
Where departure is on mutually agreed terms, the Committee may treat the departing executive as a Good Leaver in terms of one or more elements of remuneration. The Committee uses this discretion judiciously and shareholders will be notified of any exercise as soon as reasonable
Typically termination for cause
Salary and benefits for notice period
Salary and benefits continue to be paid to the date of termination of employment, including any notice period and/or garden leave period
The Company may terminate employment with immediate effect and, in lieu of the unexpired portion of any 12-month notice period, make a series of monthly payments based on salary and benefits (or make a lump sum payment based on salary only). Any monthly payments will be reduced to take account of any salary received from alternative employment
Salary and benefits continue to be paid to the date of termination of employment, including any notice period and/or garden leave period
The Company may terminate employment with immediate effect and, in lieu of the unexpired portion of any 12-month notice period, make a series of monthly payments based on salary and benefits (or make a lump sum payment based on salary only). Any monthly payments will be reduced to take account of any amounts received from alternative employment
Immediate termination with no notice period
Bonus accrued prior to termination
A time prorated bonus award may be made by the Company, with the Committee’s approval, and can be paid wholly in cash
No accrued bonus is payable No accrued bonus is payable
exception. René Médori’s service agreement contains a longstanding provision under which the Company may pay a lump sum in lieu of any notice period, comprising salary, bonus and pension contributions in respect of the unexpired notice period, with the bonus element calculated based on the average bonus percentage paid over the last three years and prorated based on the time employed during the bonus year. The Committee intends, if required, to meet this obligation but does not intend to include such a clause in any future service agreements.
Figure 5 sets out key provisions relating to change of control, where there is no termination. There are no provisions for enhanced payments in the event of a change of control of the Company.
2.4.2 Non-executive directorsAll non-executive directors have letters of appointment with the Company for an initial period of three years, subject to annual re-appointment at the AGM. The Chairman’s appointment may be terminated by the Company with six months’ notice. The appointment letters for the Chairman and non-executive directors provide that no compensation is payable on termination, other than any accrued fees and expenses.
90
GOVERNANCE DIRECTORS’ REMUNERATION REPORT
Anglo American plc Annual Report 2014
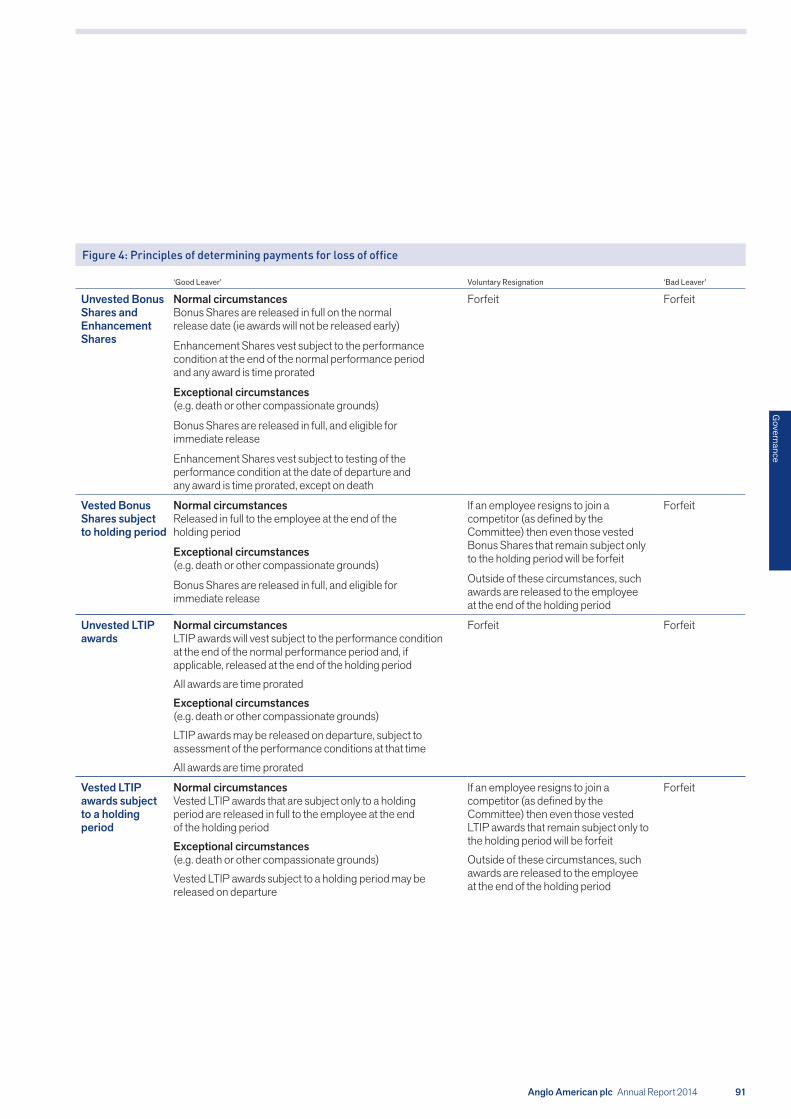
Figure 4: Principles of determining payments for loss of office
‘Good Leaver’ Voluntary Resignation ‘Bad Leaver’
Unvested Bonus Shares and Enhancement Shares
Normal circumstancesBonus Shares are released in full on the normal release date (ie awards will not be released early)
Enhancement Shares vest subject to the performance condition at the end of the normal performance period and any award is time prorated
Exceptional circumstances (e.g. death or other compassionate grounds)
Bonus Shares are released in full, and eligible for immediate release
Enhancement Shares vest subject to testing of the performance condition at the date of departure and any award is time prorated, except on death
Forfeit Forfeit
Vested Bonus Shares subject to holding period
Normal circumstancesReleased in full to the employee at the end of the holding period
Exceptional circumstances (e.g. death or other compassionate grounds)
Bonus Shares are released in full, and eligible for immediate release
If an employee resigns to join a competitor (as defined by the Committee) then even those vested Bonus Shares that remain subject only to the holding period will be forfeit
Outside of these circumstances, such awards are released to the employee at the end of the holding period
Forfeit
Unvested LTIP awards
Normal circumstancesLTIP awards will vest subject to the performance condition at the end of the normal performance period and, if applicable, released at the end of the holding period
All awards are time prorated
Exceptional circumstances (e.g. death or other compassionate grounds)
LTIP awards may be released on departure, subject to assessment of the performance conditions at that time
All awards are time prorated
Forfeit Forfeit
Vested LTIP awards subject to a holding period
Normal circumstancesVested LTIP awards that are subject only to a holding period are released in full to the employee at the end of the holding period
Exceptional circumstances (e.g. death or other compassionate grounds)
Vested LTIP awards subject to a holding period may be released on departure
If an employee resigns to join a competitor (as defined by the Committee) then even those vested LTIP awards that remain subject only to the holding period will be forfeit
Outside of these circumstances, such awards are released to the employee at the end of the holding period
Forfeit
91
Governance
Anglo American plc Annual Report 2014

2.5 Development of director remuneration policyIn developing and reviewing the Company’s remuneration policy for executive directors and other senior executives, the Committee is receptive to the views of shareholders and sensitive to the relationship between the arrangements for executive directors and those for other employee groups.
Specifically:
• whenever any significant changes are made to remuneration, the Committee seeks feedback from investors. The Committee also listens to and takes into consideration investor views and comments throughout the year. For example, greater clarity has been provided in the remuneration policy in respect of the maximum level of ongoing benefits for executive directors
• the Committee considers the general basic salary increase for the broader UK employee population when determining the annual salary increases for the executive directors. The rate of basic salary increase for the chief executive and the finance director, at 3% and 2% of salary for 2014 and 2015 respectively, has been the same as the general increase, in both years, for the UK employee population
Figure 5: Policy on change in control
Incentive plan provisions relating to change of control (without termination)
Bonus Shares and Enhancement Shares The Bonus Shares awarded under the BSP will be released
The Enhancement Shares awarded under the BSP will only vest to the extent that the performance condition has been met at the time of the change of control
LTIP awards The number of shares that vest under the LTIP will be calculated by reference to the extent to which the applicable performance conditions have been met at the time of the change of control
Vested Bonus Shares and LTIP awards subject to holding period The Bonus Shares and LTIP awards will be released
Figure 4: Principles of determining payments for loss of office
‘Good Leaver’ Voluntary Resignation ‘Bad Leaver’
Unvested Restricted Shares
There is no standard policy in respect of the treatment of any restricted share awards to executive directors. Terms are set on a case-by-case basis
For the restricted shares currently held by the chief executive, if he leaves as a ‘Good Leaver’ before the remaining designated release dates, any unvested shares would be released on the earlier of the remaining release dates or one year from the date of the chief executive ceasing to be the Company’s chief executive
Generally Forfeit Forfeit
Other Limited disbursements (for example, legal costs, relocation costs, untaken holiday)
None None
• each year the Committee also reviews in detail how the arrangements for the executive directors compare to those for other members of the Group Management Committee to ensure an appropriate relationship and to support career development and succession.
Given the geographic spread of the Company’s workforce, the Committee does not consider that consulting with employees on the remuneration policy for directors is a sensible use of resources. Many of the Company’s UK-based employees are shareholders, through the SAYE and SIP schemes, and they, like other shareholders, are able to express their views on director remuneration at each general meeting.
2.6 Payments under previous policiesThe Committee reserves the right to make any remuneration payments and payments for loss of office, notwithstanding that they are not in line with the policy set out above, where the terms of the payment were agreed (i) before the policy or the relevant legislation came into effect or (ii) at a time when the relevant individual was not a director of the Company and, in the opinion of the Committee, the payment was not in consideration for the individual becoming a director of the Company. For these purposes ‘payments’ includes the satisfaction of awards of variable remuneration and, in relation to awards of shares, the terms of the payment which are agreed at the time the award is granted.
92
GOVERNANCE DIRECTORS’ REMUNERATION REPORT
Anglo American plc Annual Report 2014

Figure 7: BSP outcomes for 2014 (cash bonus and Bonus Shares)(all amounts in ’000)
MARK CUTIFANI(2013: £1,218)
£1,557RENE MEDORI(2013: £979)
£960
3. DIRECTOR REMUNERATION IN 2014
The information set out in this section has been subject to external audit.
Figures 6 to 11 show the outcomes for 2014 of the main components of executive director remuneration, including the expected vesting of share awards with a performance period ending in 2014, and Figure 12 sets out the total remuneration outcomes.
Conditional share awards made in 2014 are set out in Figure 15 in Section 4.1.
3.1 Basic salary for 2014Figure 6 sets out the basic salaries for 2014.
Mark Cutifani was appointed chief executive with effect from 3 April 2013. His annual salary level on appointment was £1,200,000. Mark Cutifani received a salary increase of 3% in 2014.
René Médori received a salary increase of 3% in 2014.
3.2 Annual BSP outcomes for 2014Figure 7 shows the BSP outcomes for 2014. Figures 8a and 8b summarise the annual financial and personal strategic measures for the 2014 BSP for Mark Cutifani and René Médori, along with the performance targets, where relevant, the level of performance achieved and the resulting award levels. Key details of the performance delivered over 2014 are set out under BSP Key Performance Aspects.
The Committee reviewed the annual targets set at the beginning of 2014 and, in light of the positive results achieved across the group in 2013, decided to raise threshold performance expectations to a more stretching level in 2014 (threshold of $1.50). To ensure the core structure of the incentive scheme remained the same, the potential pay out at threshold performance was increased to 17.6%, on this measure, with no payment for performance below threshold. The resulting target and maximum outcomes remained the same.
The executives’ individual objectives were set at the start of the year and reflect the Company’s strategic priorities for the year. Each category contained between one and five specific objectives. Some of these are reflected under BSP Key Performance Aspects. Given the non-financial nature of these, specific quantitative targets were not set but, at the end of the year, the Committee made a detailed assessment of performance against each, leading to the evaluations shown in Figures 8a and 8b. The overall outcome for each executive director was then adjusted by the safety deductor (based on loss of life, lost time injury frequency rate (LTIFR) and a risk and change management rating).
Figure 6: Basic salaries for 2014 (all amounts in ’000)
MARK CUTIFANI(2013: £891)
£1,236RENE MEDORI(2013: £765)
£788
93
Governance
Anglo American plc Annual Report 2014

Below Threshold Target Above Maximum
Overall performance 60%
Resulting BSP award 60% of maximum bonus award (126% of salary) (40% payable in cash, 60% as Bonus Shares, with deferred receipt. Two-thirds of the Bonus Shares will vest after a further three years, subject to continued employment; for the remaining third, there is a further two-year holding period in addition to the three-year vesting period)
Group safety performance Static/declining ImprovingStrongly
improvingBest practice/
world class
Deductor (7.5%)
Figure 8a: BSP performance assessment for 2014 – Chief Executive
Mark Cutifani
Corporate financial (50% of award) Below
Threshold$1.50 = 8.8%
of award
Target $1.67 = 20%
of award Above
Maximum$2.25 = 50%
of awardAchieved
(% of award)
Earnings per Share 21.5%
Personal/Strategic (50% of award) Below Threshold Target Above Maximum
Strategic development (15%)
Talent management (10%)
Business improvement (15%)
Endowment (5%)
Stewardship (5%)
Overall personal performance 46%
BSP KEY PERFORMANCE ASPECTS
• Further improvement in year-on-year production performance across the majority of businesses, most notably at Kumba (+14%), Coal – Australia and Canada (+12% in metallurgical coal), Coal – South Africa (+5% trade production) and De Beers (+5%). An exception to this performance was at Platinum, which lost 532 koz as a result of a strike during 2014. Group 4% increase on Copper Equivalent (Cu Eq.) basis (strike adjusted).
• Real unit costs down across the Group with increased production, cost savings at Coal Australia and decreasing commodity input costs, partially offset by labour and logistics costs increases, notably in South Africa.
• Improvement in number of Priority 1 assets exceeding budget in 3 out of 4 quarters, from 6 in 2013 to 8 in 2014.
• Exceeded targeted 35Mt of production at Sishen mine.
• Minas-Rio first iron ore shipped in October 2014. Ramp up proceeding on plan.
• Significant progress in the Platinum restructuring process; sales execution process under way for Union. Rustenburg sale preparation has commenced. Announcement of intention to divest four small copper assets.
• Review and update of capital allocation ongoing. 2014 capex of $6.0 bn, below guidance of $7.0-$7.5 bn. Notice given to Peruvian government to terminate the 2007 privatisation agreement for Michiquillay in line with focusing on early stage pipeline opportunities.
• Continued implementation of organisational redesign. Completion of redesign processes in Nickel, Niobium and Phosphates, Coal and Group.
• Continued, increased engagement with host governments in all principal geographies.
• Continued progress achieved in the drive for safety improvement – reductions in lost time and total injury rates, with LTIFR falling from 0.49 to 0.35 and total recordable case frequency rate (TRCFR) falling from 1.08 to 0.81.
94
GOVERNANCE DIRECTORS’ REMUNERATION REPORT
Anglo American plc Annual Report 2014

Below Threshold Target Above Maximum
Overall performance 58%
Resulting BSP award 58% of maximum bonus award (121.8% of salary) (40% payable in cash, 60% as Bonus Shares, with deferred receipt. Two-thirds of the Bonus Shares will vest after a further three years, subject to continued employment; for the remaining third, there is a further two-year holding period in addition to the three-year vesting period)
Group safety performance Static/declining ImprovingStrongly
improvingBest practice/
world class
Deductor (7.5%)
BSP KEY PERFORMANCE ASPECTS
• Further improvement in year-on-year production performance across the majority of businesses, most notably at Kumba (+14%), Coal – Australia and Canada (+12% in metallurgical coal), Coal – South Africa (+5% trade production) and De Beers (+5%). An exception to this performance was at Platinum, which lost 532 koz as a result of a strike during 2014. Group 4% increase on Cu Eq. basis (strike adjusted).
• Real unit costs down across the Group with increased production, cost savings at Coal Australia and decreasing commodity input costs, partially offset by labour and logistics costs increases, notably in South Africa.
• Minas-Rio first iron ore shipped in October 2014. Ramp up proceeding on plan.
• Significant progress in the Platinum restructuring process; sales execution process under way for Union. Rustenburg sale preparation has commenced. Announcement of intention to divest four small copper assets.
• Review and update of capital allocation ongoing. 2014 capex of $6.0 bn, below guidance of $7.0-$7.5 bn. Notice given to Peruvian government to terminate the 2007 privatisation agreement for Michiquillay in line with focusing on early stage pipeline opportunities.
• Net debt of $12.9 bn delivered below guidance of $13.5-$14.0 bn in the face of weakening operational cashflows.
• In 2014, the Group issued corporate bonds with the US dollar equivalent value of $3.2 bn through accessing the European, US and South African capital markets.
• Continued progress achieved in the drive for safety improvement – reductions in lost time and total injury rates, with LTIFR falling from 0.49 to 0.35 and TRCFR falling from 1.08 to 0.81.
Figure 8b: BSP performance assessment for 2014 – Finance Director
René Médori
Corporate financial (50% of award) Below
Threshold$1.50 = 8.8%
of award
Target $1.67 = 20%
of award Above
Maximum$2.25 = 50%
of awardAchieved
(% of award)
Earnings per Share 21.5%
Personal/Strategic (50% of award) Below Threshold Target Above Maximum
Organisation/Driving Value targets (10%)
Treasury (10%)
Tax (10%)
Capital allocation (5%)
Information Management (5%)
Finance Function operational targets (10%)
Overall personal performance 44%
95
Governance
Anglo American plc Annual Report 2014

3.3 BSP Enhancement Share outcomes for 2014 In 2012, René Médori was awarded 16,538 Enhancement Shares under the BSP. Vesting was subject to the Company’s real EPS growth over the three-year period to 31 December 2014. The growth targets set on award were the UK Retail Price Index (RPI) +9% for threshold performance (resulting in 44% of the award vesting) and RPI +15% for maximum performance (resulting in 100% of award vesting). Threshold performance was not achieved over the three-year period, resulting in no vesting of the shares.
Figure 9: Enhancement Share vesting outcomes for 2014(all amounts in ’000)
RENE MEDORI(2013: £0)
£0
SECTOR INDEX COMPARISON (25% OF TOTAL AWARD)
• The Sector Index measure compares the Company’s three-year TSR performance with the weighted median of six international mining companies.
• Vesting required the Company’s TSR performance to be at least equal to the weighted median.
• As at 31 December 2014, the Company’s TSR performance was below the weighted median; it is therefore not expected that any shares will vest for this part of the award.
FTSE 100 COMPARISON (25% OF TOTAL AWARD)
• The FTSE 100 measure compares the Company’s three-year TSR performance with the constituents of the FTSE 100.
• Vesting required the Company’s TSR performance to be at least equal to the median TSR of the FTSE 100.
• As at 31 December 2014, the Company’s TSR performance was ranked below the 50th percentile of the FTSE 100; it is therefore expected that no shares for this part of the award will vest.
AOSC (50% OF TOTAL AWARD)
• The AOSC measure rewards the delivery of additional operating profit and capital expenditure savings delivered through the Company’s Asset Optimisation and Supply Chain programmes.
• Minimum vesting required cumulative savings to 31 December 2014 of $4.6 bn and maximum vesting required cumulative savings of $5.6 bn.
• Actual performance was $7.7 bn, leading to 100% vesting of this part of the award (50% of the overall award).
Figure 10: LTIP assessment for 2014
3.4 Long Term Incentive Plan outcomes for 2014
In 2012, René Médori received an LTIP grant of 85,048 conditional shares vesting subject to (a) the Company’s TSR performance relative to (i) a weighted group of international mining companies and (ii) FTSE 100 companies over the three-year period to announcement of the 2014 results, and (b) the level of savings delivered by the Asset Optimisation and Supply Chain programmes to 31 December 2014.
Figure 10 sets out further details of the measures and the Company’s expected performance against each. As the performance period for the TSR measures ends immediately after the date of this report on the announcement of the 2014 results, performance and vesting in respect of the TSR measures are based on the latest available information as at 31 December 2014. Figure 11 sets out the assumed outcome for René Médori, including accrued dividend equivalents.
96
GOVERNANCE DIRECTORS’ REMUNERATION REPORT
Anglo American plc Annual Report 2014

SECTOR INDEX COMPARISON (25% OF TOTAL AWARD)
• The Sector Index measure compares the Company’s three-year TSR performance with the weighted median of six international mining companies.
• Vesting required the Company’s TSR performance to be at least equal to the weighted median.
• As at 31 December 2014, the Company’s TSR performance was below the weighted median; it is therefore not expected that any shares will vest for this part of the award.
FTSE 100 COMPARISON (25% OF TOTAL AWARD)
• The FTSE 100 measure compares the Company’s three-year TSR performance with the constituents of the FTSE 100.
• Vesting required the Company’s TSR performance to be at least equal to the median TSR of the FTSE 100.
• As at 31 December 2014, the Company’s TSR performance was ranked below the 50th percentile of the FTSE 100; it is therefore expected that no shares for this part of the award will vest.
AOSC (50% OF TOTAL AWARD)
• The AOSC measure rewards the delivery of additional operating profit and capital expenditure savings delivered through the Company’s Asset Optimisation and Supply Chain programmes.
• Minimum vesting required cumulative savings to 31 December 2014 of $4.6 bn and maximum vesting required cumulative savings of $5.6 bn.
• Actual performance was $7.7 bn, leading to 100% vesting of this part of the award (50% of the overall award).
Figure 10: LTIP assessment for 2014
3-year TSR performance against Sector Index % pa
Vest
ing
(% o
f tot
al L
TIP
aw
ard)
25%
7.5%
0%Threshold: 0% pa Max: 5% pa
Vesting schedule and actual performance to 31 December 2014
Arrow represents expected vesting
3-year TSR ranking vs FTSE 100 index
Vest
ing
(% o
f tot
al L
TIP
aw
ard)
25%
7.5%
0%Threshold: 50th
Arrow represents expected vesting
Max: 80th
Vesting schedule and actual performance to 31 December 2014
Anglo American’s AOSC efficiency($ bn)
Vest
ing
(% o
f tot
al L
TIP
aw
ard)
50%
0%Min: $4.6 bn
Arrow represents actual vesting
Actual: $7.7 bnMax: $5.6 bn
Vesting schedule and actual performance
Figure 11: LTIP vesting outcomes for 2014(all amounts in ‘000)
RENE MEDORI(2013: £303)
£618LTIP KEY PERFORMANCE ASPECTS
• Actions taken on the back of the 2013 Asset Review process continued to assist in delivering AOSC benefits across all businesses during 2014. The implementation of either quick return or long term value initiatives identified during the asset review process was kick-started during 2014.
• Specific AO highlights include improvements in Longwall cutting hours at Moranbah and Grasstree (Coal in Australia), increased average throughput at Los Bronces SAG Mill (Copper) and secondary crusher debottlenecking at Mogalakwena North (Platinum).
• Specific SC highlights include Global Framework Agreements with Komatsu and Caterpillar which resulted in preferential pricing; increased rail capacity and reduced rail rates in Kumba; and electricity cost savings derived through the resale of electricity at Iron Ore Brazil and Nickel.
• Continuing Improvement in relationships with suppliers are driving reduced cost, lead time and supply risk to our business.
• Should the 2012 LTIP awards vest at 50%, 42,524 shares are receivable by René Médori. At a share price of £12.98 (the average for the last quarter of 2014), this results in a value of £551,962. Dividend equivalents over the vesting period will also be payable at vesting, estimated to be £66,105.
97
Governance
Anglo American plc Annual Report 2014

Figure 12: Total remuneration outcomes for 2014
Total basicsalary(1)
£’000
Benefitsin kind(2)
£’000Pension(3)
£’000
Annual performance bonus – cash
and BonusShares(4)
£’000
2012 Enhancement
Share Award(5)
£’000
2012 LTIP
Award(6)
£’000Other(7)
£’000
Total2014
£’000
Total2013
£’000
Executive Directors Section 3.1 Section 3.2 Section 3.3 Section 3.4
Mark Cutifani 1,236 561 371 1,557 – – – 3,725
Mark Cutifani (2013) 891 860 267 1,218 – – 2,069 5,305
René Médori 788 62 237 960 0 618 0 2,665
René Médori (2013) 765 53 230 979 0 303 0 2,330
Former Executive Directors(8)
Cynthia Carroll – – – – 0 509 509
Cynthia Carroll (2013) 406 25 122 472 0 437 0 1,462
Total fees 2014
£’000
Benefits in kind 2014
£’000
Total2014
£’000
Total fees 2013
£’000
Benefits in kind 2013
£’000
Total2013
£’000
Non-executive Directors
Sir John Parker(9) 700 22 722 675 2 677
David Challen(10) 45 – 45 130 – 130
Sir CK Chow(10) 26 – 26 80 – 80
Judy Dlamini 80 – 80 – – –
Byron Grote 101 – 101 56 – 56
Sir Philip Hampton 131 – 131 105 – 105
Phuthuma Nhleko 80 – 80 80 – 80
Ray O’Rourke(11) 80 – 80 80 – 80
Mphu Ramatlapeng 80 – 80 38 – 38
Jim Rutherford 80 – 80 13 – 13
Anne Stevens 80 – 80 80 – 80
Jack Thompson 110 – 110 97 – 97
Peter Woicke – – – 32 – 32
98
GOVERNANCE DIRECTORS’ REMUNERATION REPORT
Anglo American plc Annual Report 2014
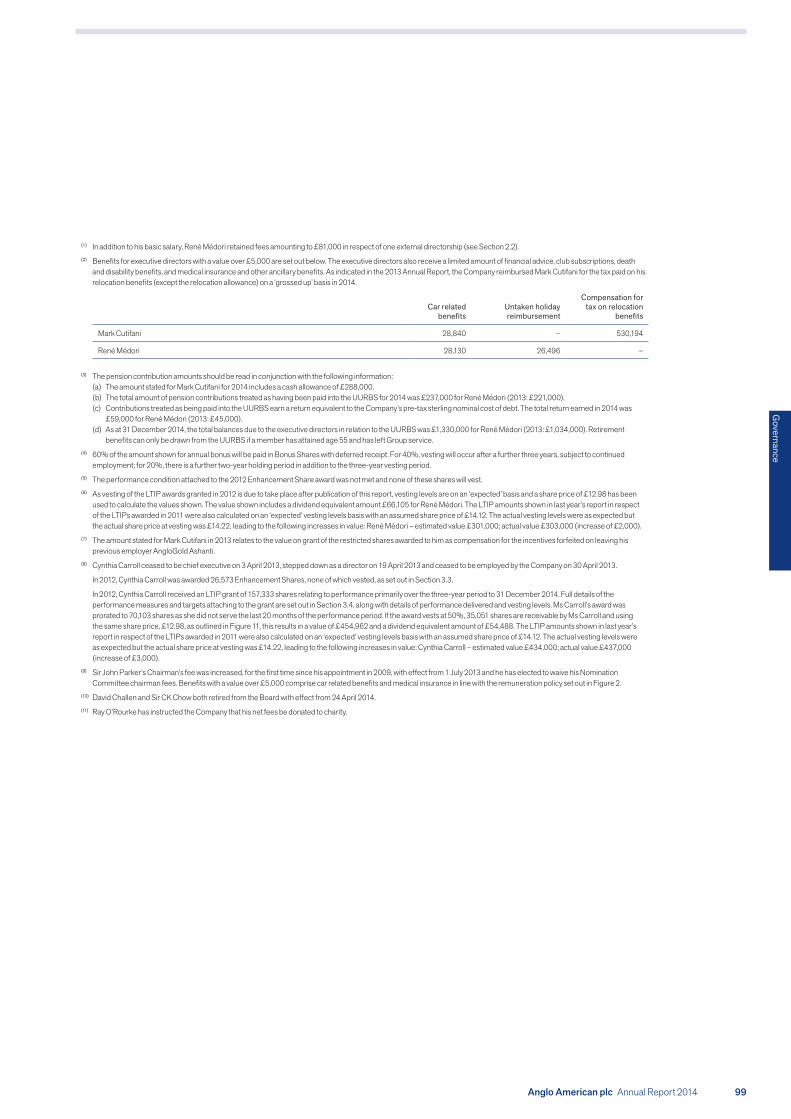
(1) In addition to his basic salary, René Médori retained fees amounting to £81,000 in respect of one external directorship (see Section 2.2).(2) Benefits for executive directors with a value over £5,000 are set out below. The executive directors also receive a limited amount of financial advice, club subscriptions, death
and disability benefits, and medical insurance and other ancillary benefits. As indicated in the 2013 Annual Report, the Company reimbursed Mark Cutifani for the tax paid on his relocation benefits (except the relocation allowance) on a ‘grossed up’ basis in 2014.
Car related benefits
Untaken holiday reimbursement
Compensation for tax on relocation
benefits
Mark Cutifani 28,840 – 530,194
René Médori 28,130 26,496 –
(3) The pension contribution amounts should be read in conjunction with the following information:(a) The amount stated for Mark Cutifani for 2014 includes a cash allowance of £288,000.(b) The total amount of pension contributions treated as having been paid into the UURBS for 2014 was £237,000 for René Médori (2013: £221,000).(c) Contributions treated as being paid into the UURBS earn a return equivalent to the Company’s pre-tax sterling nominal cost of debt. The total return earned in 2014 was
£59,000 for René Médori (2013: £45,000).(d) As at 31 December 2014, the total balances due to the executive directors in relation to the UURBS was £1,330,000 for René Médori (2013: £1,034,000). Retirement
benefits can only be drawn from the UURBS if a member has attained age 55 and has left Group service.(4) 60% of the amount shown for annual bonus will be paid in Bonus Shares with deferred receipt. For 40%, vesting will occur after a further three years, subject to continued
employment; for 20%, there is a further two-year holding period in addition to the three-year vesting period. (5) The performance condition attached to the 2012 Enhancement Share award was not met and none of these shares will vest.(6) As vesting of the LTIP awards granted in 2012 is due to take place after publication of this report, vesting levels are on an ‘expected’ basis and a share price of £12.98 has been
used to calculate the values shown. The value shown includes a dividend equivalent amount £66,105 for René Médori. The LTIP amounts shown in last year’s report in respect of the LTIPs awarded in 2011 were also calculated on an ‘expected’ vesting levels basis with an assumed share price of £14.12. The actual vesting levels were as expected but the actual share price at vesting was £14.22, leading to the following increases in value: René Médori – estimated value £301,000; actual value £303,000 (increase of £2,000).
(7) The amount stated for Mark Cutifani in 2013 relates to the value on grant of the restricted shares awarded to him as compensation for the incentives forfeited on leaving his previous employer AngloGold Ashanti.
(8) Cynthia Carroll ceased to be chief executive on 3 April 2013, stepped down as a director on 19 April 2013 and ceased to be employed by the Company on 30 April 2013. In 2012, Cynthia Carroll was awarded 26,573 Enhancement Shares, none of which vested, as set out in Section 3.3. In 2012, Cynthia Carroll received an LTIP grant of 157,333 shares relating to performance primarily over the three-year period to 31 December 2014. Full details of the
performance measures and targets attaching to the grant are set out in Section 3.4, along with details of performance delivered and vesting levels. Ms Carroll’s award was prorated to 70,103 shares as she did not serve the last 20 months of the performance period. If the award vests at 50%, 35,051 shares are receivable by Ms Carroll and using the same share price, £12.98, as outlined in Figure 11, this results in a value of £454,962 and a dividend equivalent amount of £54,488. The LTIP amounts shown in last year’s report in respect of the LTIPs awarded in 2011 were also calculated on an ‘expected’ vesting levels basis with an assumed share price of £14.12. The actual vesting levels were as expected but the actual share price at vesting was £14.22, leading to the following increases in value: Cynthia Carroll – estimated value £434,000; actual value £437,000 (increase of £3,000).
(9) Sir John Parker’s Chairman’s fee was increased, for the first time since his appointment in 2009, with effect from 1 July 2013 and he has elected to waive his Nomination Committee chairman fees. Benefits with a value over £5,000 comprise car related benefits and medical insurance in line with the remuneration policy set out in Figure 2.
(10) David Challen and Sir CK Chow both retired from the Board with effect from 24 April 2014.(11) Ray O’Rourke has instructed the Company that his net fees be donated to charity.
99
Governance
Anglo American plc Annual Report 2014

Figure 14: Distribution statement for 2014
Distribution statement 2014 2013
Underlying earnings(1) (Total Group)
$m 2,217 2,673
% change (17.1) (6.5)
Dividends payable for year (Total) $m 1,081 1,084
% change (0.3) 0.1
Payroll costs for all employees $m 5,072 5,255
% change (3.5) (2.2)
Employee numbers ’000 95 98
% change (3.1) (6.7)
(1) Please see note 5 of the consolidated financial statements for details on how underlying earnings are calculated.
Figure 13: Change in chief executive’s remuneration compared to UK employees
Salary Benefits Bonus
Chief Executive £’000 1,236 561 1,557
% change 3.0 (34.8) (5.1)
London employees(2) Average % change (per capita)
3.1 3.1 4.7
(1) The chief executive’s BSP for 2013 was calculated on the basic salary he received in 2013. To make the comparison with the prior year BSP meaningful, the year-on-year change has been calculated with reference to an ‘annualised’ BSP for 2013.
(2) Benefits for London employees comprise pension and car allowances (where applicable), these being the most material.
3.5 Change in the chief executive’s remuneration in 2014 relative to London employees Figure 13 sets out the chief executive’s basic salary, benefits and BSP amounts for 2014 and the year-on-year change. We show the average change in each element for London employees, which is considered to be the most relevant employee comparator group given the Group-wide nature of roles performed at Head Office.
3.6 Distribution statement for 2014Figure 14 sets out the total spend on employee reward over 2014, compared to profit generated by the Company and the dividends received by investors. Underlying earnings are shown, as these are one of the Company’s key measures of performance and employee numbers help put the payroll costs of employees into context.
(1)
100
GOVERNANCE DIRECTORS’ REMUNERATION REPORT
Anglo American plc Annual Report 2014
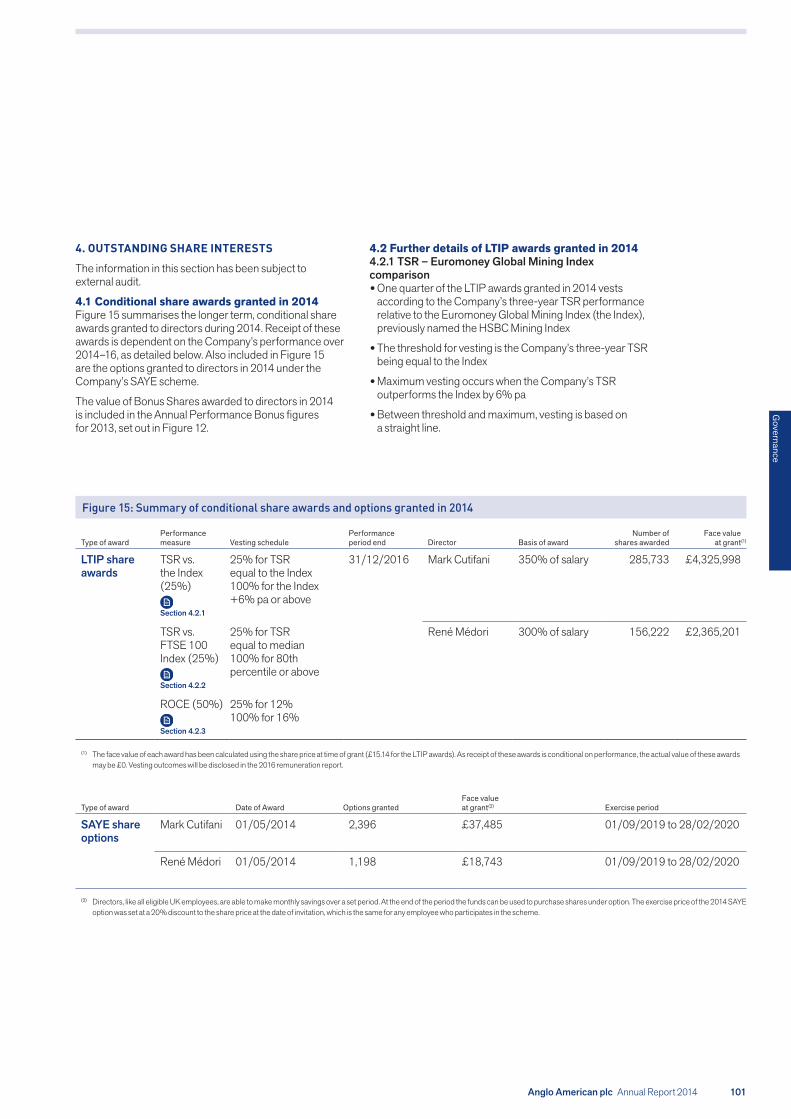
4. OUTSTANDING SHARE INTERESTS
The information in this section has been subject to external audit.
4.1 Conditional share awards granted in 2014Figure 15 summarises the longer term, conditional share awards granted to directors during 2014. Receipt of these awards is dependent on the Company’s performance over 2014–16, as detailed below. Also included in Figure 15 are the options granted to directors in 2014 under the Company’s SAYE scheme.
The value of Bonus Shares awarded to directors in 2014 is included in the Annual Performance Bonus figures for 2013, set out in Figure 12.
4.2 Further details of LTIP awards granted in 20144.2.1 TSR – Euromoney Global Mining Index comparison
• One quarter of the LTIP awards granted in 2014 vests according to the Company’s three-year TSR performance relative to the Euromoney Global Mining Index (the Index), previously named the HSBC Mining Index
• The threshold for vesting is the Company’s three-year TSR being equal to the Index
• Maximum vesting occurs when the Company’s TSR outperforms the Index by 6% pa
• Between threshold and maximum, vesting is based on a straight line.
Figure 15: Summary of conditional share awards and options granted in 2014
Type of awardPerformance measure Vesting schedule
Performanceperiod end Director Basis of award
Number of shares awarded
Face value at grant(1)
LTIP share awards
TSR vs. the Index (25%)
Section 4.2.1
25% for TSRequal to the Index100% for the Index+6% pa or above
31/12/2016 Mark Cutifani 350% of salary 285,733 £4,325,998
TSR vs. FTSE 100 Index (25%)
Section 4.2.2
25% for TSR equal to median 100% for 80th percentile or above
René Médori 300% of salary 156,222 £2,365,201
ROCE (50%)
Section 4.2.3
25% for 12%100% for 16%
(1) The face value of each award has been calculated using the share price at time of grant (£15.14 for the LTIP awards). As receipt of these awards is conditional on performance, the actual value of these awards may be £0. Vesting outcomes will be disclosed in the 2016 remuneration report.
Type of award Date of Award Options grantedFace value at grant(2) Exercise period
SAYE share options
Mark Cutifani 01/05/2014 2,396 £37,485 01/09/2019 to 28/02/2020
René Médori 01/05/2014 1,198 £18,743 01/09/2019 to 28/02/2020
(2) Directors, like all eligible UK employees, are able to make monthly savings over a set period. At the end of the period the funds can be used to purchase shares under option. The exercise price of the 2014 SAYE option was set at a 20% discount to the share price at the date of invitation, which is the same for any employee who participates in the scheme.
101
Governance
Anglo American plc Annual Report 2014

4.2.2 TSR – FTSE 100 comparison • One quarter of the LTIP awards granted in 2014 vests according to the Company’s three-year TSR performance compared with the TSR performance of the constituents of the FTSE 100 Index
• Threshold vesting occurs when the Company’s three-year TSR is equal to the median TSR of the FTSE 100 constituents
• Maximum vesting occurs when the Company’s TSR is equal to or exceeds the TSR of the FTSE 100 company whose TSR performance is ranked at the 80th percentile
• Between target and maximum, vesting is based on a straight line basis.
The performance targets for both TSR measures were set to ensure that an appropriate level of performance would be required for each level of vesting. PwC, using a Monte Carlo model, have assessed the probability of achieving full vesting as approximately 20% and chance of achieving threshold vesting as 50%.
Total shareholder return for both the TSR measures is calculated based on average returns over the three months prior to the end of the financial year. It is assumed that all dividends are reinvested on the ex-dividend date.
4.2.3 Return on Capital Employed (ROCE) • Vesting of one half of LTIP awards granted in 2014 depends on the performance of the Company’s attributable ROCE over the three-year period to 31 December 2016
• The measure, tied to underlying achieved business return, aligns management reward with those of our shareholders. It is not adjusted for price or foreign exchange movements and refers to the externally reported attributable ROCE in the year of assessment, 2016
• By design, attributable ROCE covers the financial outcomes of all management actions, both on balance sheet and income statement. The company’s Driving Value programme supports delivery of EBIT in the measure, through its focus on operational improvement, efficiencies and also improved marketing performance. Balance sheet efficiency is being progressed through Anglo American’s greater focus on capital efficiency and debt reduction.
4.3 Total interests in sharesFigure 17 summarises the total interests of the directors in shares of Anglo American plc as at 12 February 2015 (and at the end of the 2014 financial year). These include beneficial and conditional interests. As already disclosed, Mark Cutifani is required to hold interests in shares to a value of three times basic salary (built up over five years) and René Médori to a value of two times salary.
The vesting schedule of Mark Cutifani’s one-off share award means that he is expected to have a net shareholding of beneficial shares equal to 60% of basic salary by the 2015 AGM. Incentives awarded under the Company’s LTIP from 2013 will start to vest, subject to the satisfaction of performance conditions, from 2016 onwards and under the BSP from 2017. The requirements for René Médori will have been exceeded by the 2015 AGM.
102
GOVERNANCE DIRECTORS’ REMUNERATION REPORT
Anglo American plc Annual Report 2014

Figure 16: Shares in Anglo American plc
Beneficial
Conditional (no performance
conditions)Conditional
(with performance conditions)Conditional
(no performance conditions) Total
DirectorsBSP
Bonus Shares
BSP Enhancement
Shares LTIP SAYE/SIP Other
Mark Cutifani(1)at 12 February 2015 32,747 47,055 – 530,061 2,673 70,545 683,081
(at 31 December 2014) 32,734 47,055 – 530,061 2,660 70,545 683,055
René Médori(2)at 12 February 2015 140,668 71,615 25,346 358,488 2,525 – 598,642
(at 31 December 2014) 140,650 71,615 25,346 358,488 2,517 – 598,616
Sir John Parkerat 12 February 2015 54,456 – – – – – 54,456
(at 31 December 2014) 54,456 – – – – – 54,456
Judy Dlamini(3)at 12 February 2015 – – – – – – –
(at 31 December 2014) – – – – – – –
Byron Grote(4) at 12 February 2015 16,000 – – – – – 16,000
(at 31 December 2014) 16,000 – – – – – 16,000
Sir Philip Hamptonat 12 February 2015 7,719 – – – – – 7,719
(at 31 December 2014) 6,869 – – – – – 6,869
Phuthuma Nhlekoat 12 February 2015 10,766 – – – – – 10,766
(at 31 December 2014) 9,494 – – – – – 9,494
Ray O’Rourke(4)at 12 February 2015 76,965 – – – – – 76,965
(at 31 December 2014) 76,965 – – – – – 76,965
Mphu Ramatlapengat 12 February 2015 1,135 – – – – – 1,135
(at 31 December 2014) 881 – – – – – 881
Jim Rutherfordat 12 February 2015 4,595 – – – – – 4,595
(at 31 December 2014) 3,279 – – – – – 3,279
Anne Stevensat 12 February 2015 2,122 – – – – – 2,122
(at 31 December 2014) 2,122 – – – – – 2,122
Jack Thompson(4)at 12 February 2015 14,950 – – – – – 14,950
(at 31 December 2014) 14,950 – – – – – 14,950
Former Directors(5)
David Challen(at 24 April 2014) 1,820 – – – – – 1,820
Sir CK Chow(at 24 April 2014) 5,500 – – – – – 5,500
(1) Mark Cutifani was appointed to the Board as chief executive with effect from 3 April 2013. ‘Other’ interests above comprise 70,545 shares in the Company which will vest, subject to Mr Cutifani’s continued appointment as chief executive, in two remaining tranches, as follows: 67,475 shares in February 2015 and 3,070 shares in February 2016.
(2) René Médori’s beneficial interests in 138,990 shares held at the date of this report arise as a result of his wife’s interests in shares.(3) Judy Dlamini was appointed to the Board on 1 January 2014.(4) Included in the interests of Messrs Grote, O’Rourke and Thompson are unsponsored ADRs representing 0.5 ordinary shares of $0.54945 each.(5) Interests are shown as at date of resignation.
103
Governance
Anglo American plc Annual Report 2014

5. REMUNERATION IN 2015
The Company’s policy on executive director remuneration for 2015 is summarised in the policy statements in Figure 1. Figure 17 summarises how that policy will be implemented in 2015. It is the Company’s intention that the fees for non-executive directors will remain at their 2014 levels during 2015, although this will be kept under review.
The EPS performance range for 2015 is considered to be commercially sensitive, although it will be disclosed in the 2015 remuneration report.
The Committee determined the target range of 9–13% for the LTIP in 2015 based upon the following considerations:
Figure 17: Summary of key remuneration aspects in 2015
ElementPerformance measure 1, weighting and vesting schedule
Performance measure 2, weighting and vesting schedule Director Level
Basic salary – – Mark Cutifani £1,260,720 (2% increase)
René Médori £804,173 (2% increase)
BSP EPS (50%) Personal strategic measures (50%)
Personal and strategic objectives supporting the Company’s delivery on projects, business improvement, capital allocation, commercial activities, employee development and stakeholder engagement.
Mark Cutifani 210% of salary
René Médori 210% of salary
LTIP share awards
ROCE (50%)
25% for 9%
100% for 13%
TSR vs Euromoney Global Mining Index (25%)
25% for TSR equal to Index
100% for Index +6% pa or above
TSR vs FTSE 100 (25%)
25% for TSR equal to median
100% for 80th percentile or above
Mark Cutifani 350% of salary
René Médori 300% of salary
• A range of 9–13% is the equivalent of the 2014 LTIP target of 12–16% should prices remain at the levels seen in early 2015 over the performance period. It is clear that unless there is a significant increase in prices over the performance period, there will be zero vesting on the ROCE element of the 2014 LTIP, even if there are material operational improvements during that time
• The Threshold ROCE of 9% is higher than the 8% ROCE achieved in 2014 when prices were above the spot prices in early 2015
• The range is based upon a Capital Employed figure which is not reduced by the impairments made over the past two years.
104
GOVERNANCE DIRECTORS’ REMUNERATION REPORT
Anglo American plc Annual Report 2014

6. REMUNERATION COMMITTEE IN 2014
MembershipThe Committee comprised the non-executive directors shown during the year ended 31 December 2014.
External advisers to the CommitteeFigure 18 details the external advisers to the Committee and the fees paid for services provided during 2014. The fees are charged in accordance with the terms and conditions set out in each relevant engagement letter.
Both PricewaterhouseCoopers and Towers Watson are signatories to, and adhere to, the Code of Conduct for Remuneration Consultants (which can be found at (www.remunerationconsultantsgroup.com). In addition, the Committee chairman has regular direct dialogue with advisers. For these reasons, the Committee considers that the advice it receives is independent.
COMMITTEE MEMBERS DURING 2014
Judy Dlamini (from 24 April 2014)
Byron Grote
Ray O’Rourke
Sir Philip Hampton
David Challen (to 24 April 2014)
Jack Thompson
Figure 18: External advisers and fees
AdvisersOther services provided to the Company
Fees for Committee assistance
Pricewaterhouse Coopers LLP (PwC)
Appointed by the Company, with the agreement of the Committee, to support and advise on the Company’s incentive arrangements, in addition to the provision of specialist valuation services and market remuneration data
Investment advice, actuarial and audit work for various pension schemes; advice on internal audit projects; taxation, payroll and executive compensation advice
£6,000
Linklaters LLP (Linklaters)
Appointed by the Company, with the agreement of the Committee, to provide legal advice on long term incentives and directors’ service contracts
Legal advice on certain corporate matters
£15,500
Towers Watson (TW)
The Human Resources function engaged Towers Watson to provide advice on performance metrics in 2014
Human resources advice on various reward and other matters
£2,000
Deloitte LLP (Deloitte)
In its capacity as Group auditor, Deloitte undertakes an audit of sections 3 and 4 of the remuneration report annually. However, it provides no advice to the Committee
n/a
Note: Certain overseas operations within the Group are also provided with audit related services from Deloitte’s and PwC’s worldwide member firms and non-audit related services from TW.
105
Governance
Anglo American plc Annual Report 2014

Figure 19: Response to 2014 AGM shareholder voting
Number of votes
Vote For Against Abstain Company response to issues raised
Binding vote on 2013 remuneration policy
854,429,671 (95%)
48,556,157(5%)
9,604,261 During 2013 and in the lead-up to the 2014 AGM, the Committee consulted with leading investors over a number of proposed changes to the Company’s remuneration arrangements that were to apply for 2014, and refined these proposals in response to investor feedback.
Since the 2014 AGM, the Committee has continued its approach to understand and address investors’ concerns, which has led to the provision of greater clarity in parts of the remuneration policy and the contents of the Implementation Report.
Advisory vote on 2013 implementation report
847,094,937(95%)
45,535,173(5%)
19,959,979
Remuneration report voting resultsThe Committee considered the results of the shareholders’ vote on the 2013 remuneration report. As mentioned earlier in this report, feedback from investors at the time of the 2014 AGM, and more generally, helped shape clarifications to the remuneration policy for 2014 onwards.
7. SIX-YEAR REMUNERATION AND RETURNS
Figure 20a shows the Company’s TSR performance against the performance of the FTSE 100 Index from 1 January 2009 to 31 December 2014. The FTSE 100 Index was chosen as being a broad equity market index which includes companies of a comparable size and complexity to Anglo American.
TSR is calculated in US dollars, and assumes all dividends are reinvested. The TSR level shown as at 31 December each year is the average of the closing daily TSR levels for the five-day period up to and including that date.
Figure 20b shows the total remuneration earned by the incumbent chief executive over the same six-year period, along with the proportion of maximum opportunity earned in relation to each type of incentive. The total amounts are based on the same methodology as for Figure 12 (Total remuneration outcomes for 2014).
For the period 2009 to 2011, the TSR performance of the Company, and the remuneration received by Cynthia Carroll as chief executive, demonstrates that this was a period of strong operational performance and high commodity prices. These led to a doubling of profits and almost a doubling of underlying EPS in 2010.
Cynthia Carroll’s remuneration levels in 2011 also reflect record profits and strong EPS performance for the year in addition to the increase in value of the LTIP awards that vested at the end of 2011 – when granted the Company’s share price was £12.61; the share price at vesting was £26.00.
The outcome of longer term incentives from 2012, have been much lower, reflecting, in part, the impact of the fall in commodity prices on earnings and the returns delivered to shareholders.
Source: Datastream Return Index
100
150
125
175
200
225
250
275
300
2008 2009 2010 2011 2012 2013 2014
Valu
e of
a h
ypot
hetic
al $
100
inve
stm
ent
Figure 20a: Six-year TSR performance
106
GOVERNANCE DIRECTORS’ REMUNERATION REPORT
Anglo American plc Annual Report 2014

APPROVAL
This directors’ remuneration report has been approved by the Board of directors of Anglo American plc.
Signed on behalf of the Board of directors.
Sir Philip Hampton Chairman, Remuneration Committee
12 February 2015
Figure 20b: Chief Executive remuneration
Financial year ending31 December
200931 December
201031 December
201131 December
201231 December
201331 December
2014
Cynthia Carroll
Total remuneration (single figure, £’000) 4,379 4,235 8,113 3,203 1,462 –
BSP (% of maximum) 99% 88% 94% 35% 67% –
LTIP (% of maximum) 61% 50% 96% 50% 28% –
BSP Enhancement Shares (% of maximum) 0% 0% 100% 0% 0% –
Mark Cutifani
Total remuneration (single figure, £’000) – – – – 5,305 3,725
BSP (% of maximum) – – – – 65% 60%
107
Governance
Anglo American plc Annual Report 2014
We confirm that to the best of our knowledge:
(a) the financial statements, prepared in accordance with the applicable set of accounting standards, give a true and fair view of the assets, liabilities, financial position and loss of Anglo American plc and the undertakings included in the consolidation taken as a whole
(b) the strategic report includes a fair review of the development and performance of the business and the position of Anglo American plc and the undertakings included in the consolidation taken as a whole, together with a description of the principal risks and uncertainties that they face
(c) the annual report and financial statements, taken as a whole, are fair, balanced and understandable and provide the information necessary for shareholders to assess the Company’s performance, business model and strategy.
By order of the Board
Mark Cutifani René MédoriChief Executive Finance Director
Company law requires the directors to prepare financial statements for each financial year. The directors are required to prepare the Group financial statements in accordance with International Financial Reporting Standards (IFRS), as adopted by the European Union and Article 4 of the IAS regulation, and have elected to prepare the parent company financial statements in accordance with United Kingdom Generally Accepted Accounting Practice (United Kingdom Accounting Standards and applicable law). The directors must not approve the accounts unless they are satisfied that they give a true and fair view of the state of affairs of the Company and of the profit or loss of the Company for that period.
In preparing the parent company financial statements, the directors are required to:
• select suitable accounting policies and then apply them consistently
• make judgements and accounting estimates that are reasonable and prudent
• state whether applicable UK Accounting Standards have been followed, subject to any material departures disclosed and explained in the financial statements
• prepare the financial statements on the going concern basis unless it is inappropriate to presume that the Company will continue in business.
In preparing the Group financial statements, IAS 1 requires that directors:
• properly select and apply accounting policies
• present information, including accounting policies, in a manner that provides relevant, reliable, comparable and understandable information
• provide additional disclosures when compliance with the specific requirements in IFRS is insufficient to enable users to understand the impact of particular transactions, other events and conditions on the entity’s financial position and financial performance
• make an assessment of the Company’s ability to continue as a going concern.
The directors are responsible for keeping adequate accounting records that are sufficient to show and explain the Company’s transactions, disclose with reasonable accuracy at any time the financial position of the Company and enable them to ensure that the financial statements comply with the Companies Act 2006. They are also responsible for safeguarding the assets of the Company and hence for taking reasonable steps for the prevention and detection of fraud and other irregularities.
The directors are responsible for the maintenance and integrity of the corporate and financial information included on the Company’s website. Legislation in the United Kingdom governing the preparation and dissemination of financial statements may differ from legislation in other jurisdictions.
STATEMENT OF DIRECTORS’ RESPONSIBILITIES
The directors are responsible for preparing the Annual Report and the financial statements in accordance with applicable law and regulations.
RESPONSIBILITY STATEMENTfor the year ended 31 December 2014
Anglo American plc Annual Report 2014108
GOVERNANCE STATEMENT OF DIRECTORS’ RESPONSIBILITIES

Financial statements
Independent auditor’s report to the members of Anglo American plc 110
Principal statementsConsolidated income statement 112Consolidated statement of comprehensive income 112Consolidated balance sheet 113Consolidated cash flow statement 114Consolidated statement of changes in equity 115
Notes to the financial statements1 Critical accounting judgements and key sources
of estimation uncertainty116
2 Changes in accounting policies and disclosures 117
Notes to the Consolidated income statement3 Segmental information 1194 Operating profit from subsidiaries and joint operations 1225 Underlying EBIT and underlying earnings by segment 1236 Special items and remeasurements 1247 Net finance costs 1268 Income tax expense 1269 Earnings per share 12810 Dividends 129
Notes to the Consolidated balance sheet11 Intangible assets 12912 Property, plant and equipment 13013 Investments in associates and joint ventures 13014 Financial asset investments 13115 Inventories 13216 Trade and other receivables 13217 Trade and other payables 13218 Financial instruments 13319 Derivatives 13520 Provisions for liabilities and charges 13621 Deferred tax 137
Cash flow statement, net debt and related notes22 Capital expenditure 13823 Net debt 13924 Borrowings 14025 Commitments 142
Employee remuneration26 Employee numbers and costs 14327 Retirement benefits 14428 Share-based payments 147
Group structure and transactions29 Business combinations and formation of joint ventures 14930 Disposals of subsidiaries 14931 Non-controlling interests 149
Additional disclosures32 Called-up share capital and consolidated equity analysis 15033 Auditor’s remuneration 15234 Contingent liabilities 15235 Related party transactions 15336 Events occurring after end of year 15337 Group companies 15438 Financial risk management 15539 Accounting policies 158
Financial statements of the parent company 163
Summary by business operation 166
Key financial data 167
Exchange rates and commodity prices 168
CONTENTS
FINANCIAL STATEMENTS AND OTHER FINANCIAL INFORMATION
Anglo American plc Annual Report 2014 109

110 Anglo American plc Annual Report 2014
FINANCIAL STATEMENTS AND OTHER FINANCIAL INFORMATION
INDEPENDENT AUDITOR’S REPORT TO THE MEMBERS OF ANGLO AMERICAN PLC
Our assessment of risks of material misstatementThe assessed risks of material misstatement described below are those that had the greatest effect on our audit strategy, the allocation of resources in the audit and directing the efforts of the engagement team:
Risk How the scope of our audit responded to the risk
Impairments (notes 1 and 6)As a consequence of the current volatility in commodity prices and foreign exchange rates, the assessment of the recoverable amount of operating assets and development projects is a key judgement. This includes specifically the Minas-Rio project within the Iron Ore and Manganese segment (where a post-tax impairment of $3.5 billion has been recorded) and the mines within the Coal segment (where a post-tax impairment of $0.3 billion has been recorded).
We challenged management’s assessment as to whether indicators of impairment exist for specific assets. Where such indicators were identified, specifically in relation to the Minas-Rio project and the mines within the Coal segment, we obtained copies of the valuation models used to determine the value in use or fair value less costs of disposal of the relevant asset. We challenged the assumptions made by management in relation to these models, including the discount rate used, the short-term and long-term commodity prices, capital expenditure and operating cost forecasts and the expected production profiles, by comparison to recent third party forecast commodity price data, reference to third party documentation where available, review of reserves and resources reports, consultation with operational management and consideration of sensitivity analyses. We assessed whether the assumptions had been determined and applied on a consistent basis across the Group.
Taxation (notes 1, 8 and 21)The assessment of the Group’s taxation exposures in all jurisdictions is a key area of judgement particularly with respect to transfer pricing arrangements and the appropriateness of the recognition of deferred taxation assets.
We reviewed all potential taxation exposures within the Group and, through discussions with the Group’s tax department, the tax specialists within the audit team and review of relevant documentation, we assessed the appropriateness of the provisions raised.
We considered, in the context of our tax specialists’ prior experience of similar issues, the Group‘s transfer pricing arrangements and deferred taxation assets and liabilities to confirm that they are reasonable.
Special items and remeasurements (note 6)The assessment of the appropriateness of items disclosed within ‘special items and remeasurements’ is a key judgement because of their impact upon the underlying financial performance achieved by the Group.
We considered and challenged each item disclosed within ‘special items and remeasurements’ as defined in note 6 to the financial statements. We determined, through examination of the audit evidence obtained relating to the underlying transactions and discussion with management, whether such categorisation is appropriate and consistent with the Group’s stated policy and past practice for recognition of such items, and whether, taken as a whole, the income statement is fair and balanced in its presentation.
The description of risks above should be read in conjunction with the significant issues considered by the Audit Committee discussed on page 42.
Our audit procedures relating to these matters were designed in the context of our audit of the financial statements as a whole, and not to express an opinion on individual accounts or disclosures. Our opinion on the financial statements is not modified with respect to any of the risks described above, and we do not express an opinion on these individual matters.
Opinion on financial statements of Anglo American plcIn our opinion:
• the financial statements give a true and fair view of the state of the Group’s and of the parent company’s affairs as at 31 December 2014 and of the Group’s loss for the year then ended;
• the Group financial statements have been properly prepared in accordance with International Financial Reporting Standards (IFRS) as adopted by the European Union;
• the parent company financial statements have been properly prepared in accordance with United Kingdom Generally Accepted Accounting Practice (UK GAAP); and
• the financial statements have been prepared in accordance with the requirements of the Companies Act 2006 and, as regards the Group financial statements, Article 4 of the IAS Regulation.
The financial statements comprise the Consolidated income statement, the Consolidated statement of comprehensive income, the Consolidated balance sheet, the Consolidated cash flow statement, the Consolidated statement of changes in equity, the accounting policies, the related notes 1 to 39 and the balance sheet of the parent company and related information.
The financial reporting framework that has been applied in the preparation of the Group financial statements is applicable law and IFRSs as adopted by the European Union. The financial reporting framework that has been applied in the preparation of the parent company financial statements is applicable law and United Kingdom Accounting Standards (United Kingdom Generally Accepted Accounting Practice).
Going concernAs required by the Listing Rules we have reviewed the directors’ report on page 212 that the Group is a going concern. We confirm that:
• we have concluded that the directors’ use of the going concern basis of accounting in the preparation of the financial statements is appropriate; and
• we have not identified any material uncertainties that may cast significant doubt on the Group’s ability to continue as a going concern.
However, because not all future events or conditions can be predicted, this statement is not a guarantee as to the Group’s ability to continue as a going concern.

Anglo American plc Annual Report 2014 111
Financial statements
Our application of materialityWe define materiality as the magnitude of misstatement in the financial statements that makes it probable that the economic decisions of a reasonably knowledgeable person would be changed or influenced. We use materiality both in planning the scope of our audit work and in evaluating the results of our work.
We determined planning materiality for the Group to be $225 million (2013: $250 million), which is below 5% (2013: 5%) of pre-tax profit before special items and remeasurements, and below 1% (2013: 1%) of equity. Pre-tax profit is normalised for the materiality calculation to exclude special items (including impairments), remeasurements and other one off items that are audited separately and would, if included, significantly distort the materiality calculation year on year.
We agreed with the Audit Committee that we would report to the Committee all audit differences in excess of $10 million (2013: $10 million), as well as differences below that threshold that, in our view, warranted reporting on qualitative grounds. We also report to the Audit Committee on disclosure judgements in the financial statement that we identified when assessing the overall presentation of the financial statements.
An overview of the scope of our auditOur audit was scoped by obtaining an understanding of the Group and its environment, including internal control, and assessing the risks of material misstatement. Audit work to respond to the risks of material misstatement was performed directly by the audit engagement team.
All business units were subject to a full scope audit with the exception of Manganese where specific audit procedures were performed.
The Senior Statutory Auditor visits the principal location of each significant business unit at least once every year and key operational assets on a rotating basis.
Opinion on other matters prescribed by the Companies Act 2006In our opinion:
• the part of the Directors’ Remuneration report to be audited has been properly prepared in accordance with the Companies Act 2006; and
• the information given in the Strategic report and the Directors’ report for the financial year for which the financial statements are prepared is consistent with the financial statements.
Matters on which we are required to report by exceptionAdequacy of explanations received and accounting recordsUnder the Companies Act 2006 we are required to report to you if, in our opinion:
• we have not received all the information and explanations we require for our audit; or
• adequate accounting records have not been kept by the parent company, or returns adequate for our audit have not been received from branches not visited by us; or
• the parent company financial statements are not in agreement with the accounting records and returns.
We have nothing to report in respect of these matters.
Directors’ remunerationUnder the Companies Act 2006 we are also required to report if in our opinion certain disclosures of directors’ remuneration have not been made or the part of the Directors’ Remuneration report to be audited is not in agreement with the accounting records and returns. We have nothing to report arising from these matters.
Corporate Governance StatementUnder the Listing Rules we are also required to review the part of the Corporate Governance Statement relating to the Company’s compliance with ten provisions of the UK Corporate Governance Code. We have nothing to report arising from our review.
Our duty to read other information in the Annual ReportUnder International Standards on Auditing (UK and Ireland), we are required to report to you if, in our opinion, information in the Annual Report is:
• materially inconsistent with the information in the audited financial statements; or
• apparently materially incorrect based on, or materially inconsistent with, our knowledge of the Group acquired in the course of performing our audit; or
• otherwise misleading.
In particular, we are required to consider whether we have identified any inconsistencies between our knowledge acquired during the audit and the directors’ statement that they consider the Annual Report is fair, balanced and understandable and whether the Annual Report appropriately discloses those matters that we communicated to the Audit Committee which we consider should have been disclosed. We confirm that we have not identified any such inconsistencies or misleading statements.
Respective responsibilities of directors and auditorAs explained more fully in the Statement of Directors’ Responsibilities, the directors are responsible for the preparation of the financial statements and for being satisfied that they give a true and fair view. Our responsibility is to audit and express an opinion on the financial statements in accordance with applicable law and International Standards on Auditing (UK and Ireland). Those standards require us to comply with the Auditing Practices Board’s Ethical Standards for Auditors. We also comply with International Standard on Quality Control 1 (UK and Ireland). Our audit methodology and tools aim to ensure that our quality control procedures are effective, understood and applied. Our quality controls and systems include our dedicated professional standards review team and independent partner reviews.
This report is made solely to the Company’s members, as a body, in accordance with Chapter 3 of Part 16 of the Companies Act 2006. Our audit work has been undertaken so that we might state to the Company’s members those matters we are required to state to them in an auditor’s report and for no other purpose. To the fullest extent permitted by law, we do not accept or assume responsibility to anyone other than the Company and the Company’s members as a body, for our audit work, for this report, or for the opinions we have formed.
Scope of the audit of the financial statements An audit involves obtaining evidence about the amounts and disclosures in the financial statements sufficient to give reasonable assurance that the financial statements are free from material misstatement, whether caused by fraud or error. This includes an assessment of: whether the accounting policies are appropriate to the Group’s and the parent company’s circumstances and have been consistently applied and adequately disclosed; the reasonableness of significant accounting estimates made by the directors; and the overall presentation of the financial statements. In addition, we read all the financial and non-financial information in the Annual Report to identify material inconsistencies with the audited financial statements and to identify any information that is apparently materially incorrect based on, or materially inconsistent with, the knowledge acquired by us in the course of performing the audit. If we become aware of any apparent material misstatements or inconsistencies we consider the implications for our report.
Carl D. Hughes MA, FCA (Senior Statutory Auditor)for and on behalf of Deloitte LLPChartered Accountants and Statutory AuditorLondon, United Kingdom12 February 2015

112 Anglo American plc Annual Report 2014
FINANCIAL STATEMENTS AND OTHER FINANCIAL INFORMATION PRINCIPAL STATEMENTS
CONSOLIDATED INCOME STATEMENTfor the year ended 31 December 2014
2014 2013
US$ million Note
Before special items and
remeasurements
Special items and remeasurements
(note 6) Total
Before special items and
remeasurements
Special items and remeasurements
(note 6) TotalGroup revenue 3 27,073 – 27,073 29,342 – 29,342 Operating costs (22,560) (4,375) (26,935) (23,174) (3,761) (26,935) Operating profit 3, 4 4,513 (4,375) 138 6,168 (3,761) 2,407 Non-operating special items 6 – (385) (385) – (469) (469) Share of net income from associates and joint ventures 3, 13 254 (46) 208 243 (75) 168 (Loss)/profit before net finance costs and tax 4,767 (4,806) (39) 6,411 (4,305) 2,106
Investment income 242 – 242 271 – 271 Interest expense (497) (65) (562) (584) – (584) Other financing gains/(losses) (1) 101 100 37 (130) (93)
Net finance costs 7 (256) 36 (220) (276) (130) (406) (Loss)/profit before tax 4,511 (4,770) (259) 6,135 (4,435) 1,700 Income tax expense 8 (1,267) 2 (1,265) (1,861) 587 (1,274) (Loss)/profit for the financial year 3,244 (4,768) (1,524) 4,274 (3,848) 426 Attributable to:Non-controlling interests 31 1,027 (38) 989 1,601 (214) 1,387 Equity shareholders of the Company 2,217 (4,730) (2,513) 2,673 (3,634) (961)
(Loss)/earnings per share (US$)Basic 9 1.73 (3.69) (1.96) 2.09 (2.84) (0.75) Diluted 9 1.72 (3.68) (1.96) 2.08 (2.83) (0.75)
CONSOLIDATED STATEMENT OF COMPREHENSIVE INCOMEfor the year ended 31 December 2014
US$ million 2014 2013(Loss)/profit for the financial year (1,524) 426 Items that will not be reclassified to the income statement (net of tax)(1) Remeasurement of net retirement benefit obligation (6) 60 Share of associates’ and joint ventures’ other comprehensive income 1 –Net items that will not be reclassified to the income statement (5) 60 Items that have been or may subsequently be reclassified to the income statement (net of tax)(1) Net exchange differences:
Net loss (including associates and joint ventures) (1,943) (4,716) Cumulative loss transferred to the income statement on disposal of foreign operations 5 73
Revaluation of available for sale investments: Net revaluation loss (124) (56)Cumulative revaluation gain transferred to the income statement on disposal – (77) Impairment losses transferred to the income statement 3 14
Revaluation of cash flow hedges: Net loss (7) (12) Transferred to the initial carrying amount of hedged items – 4
Net items that have been or may subsequently be reclassified to the income statement (2,066) (4,770) Total comprehensive expense for the financial year (3,595) (4,284) Attributable to:Non-controlling interests 736 769 Equity shareholders of the Company (4,331) (5,053)
(1) Tax amounts are shown in note 8c. Comparatives have been reclassified to align with current year presentation.
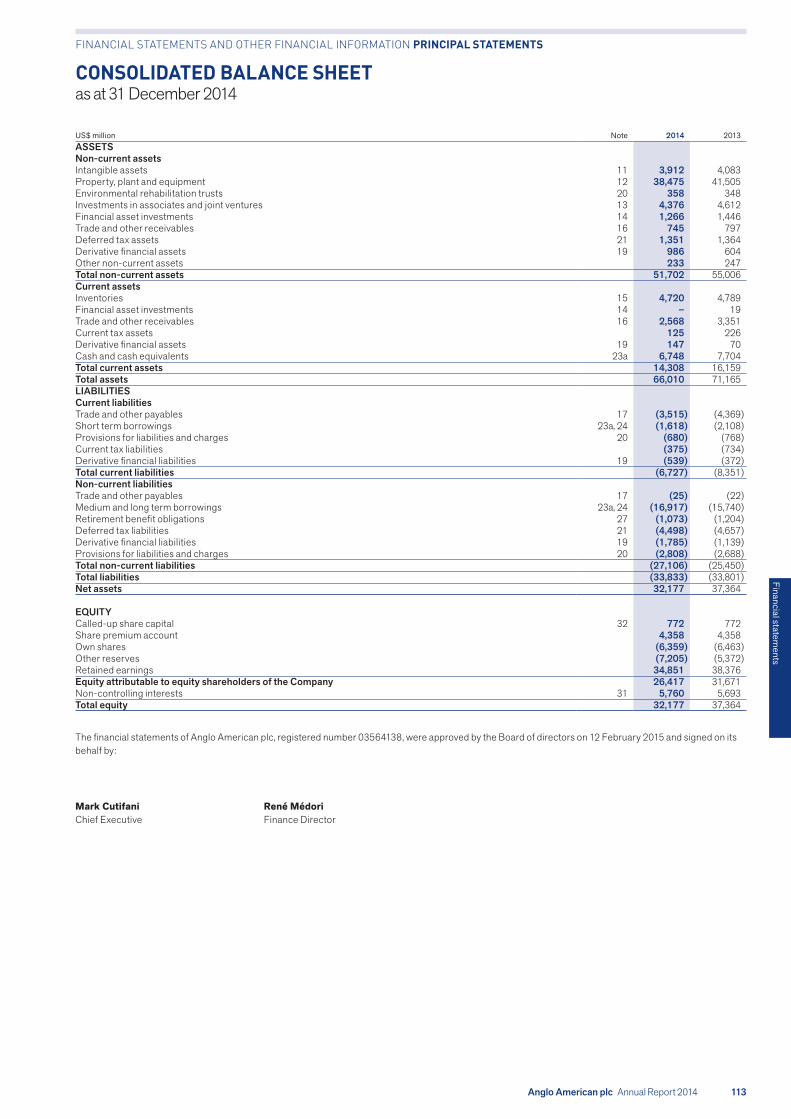
Anglo American plc Annual Report 2014 113
Financial statements
FINANCIAL STATEMENTS AND OTHER FINANCIAL INFORMATION PRINCIPAL STATEMENTS
CONSOLIDATED BALANCE SHEETas at 31 December 2014
US$ million Note 2014 2013ASSETSNon-current assetsIntangible assets 11 3,912 4,083 Property, plant and equipment 12 38,475 41,505 Environmental rehabilitation trusts 20 358 348 Investments in associates and joint ventures 13 4,376 4,612 Financial asset investments 14 1,266 1,446 Trade and other receivables 16 745 797 Deferred tax assets 21 1,351 1,364 Derivative financial assets 19 986 604 Other non-current assets 233 247 Total non-current assets 51,702 55,006 Current assets Inventories 15 4,720 4,789 Financial asset investments 14 – 19 Trade and other receivables 16 2,568 3,351 Current tax assets 125 226 Derivative financial assets 19 147 70 Cash and cash equivalents 23a 6,748 7,704 Total current assets 14,308 16,159 Total assets 66,010 71,165 LIABILITIES Current liabilities Trade and other payables 17 (3,515) (4,369) Short term borrowings 23a, 24 (1,618) (2,108) Provisions for liabilities and charges 20 (680) (768) Current tax liabilities (375) (734) Derivative financial liabilities 19 (539) (372) Total current liabilities (6,727) (8,351) Non-current liabilities Trade and other payables 17 (25) (22) Medium and long term borrowings 23a, 24 (16,917) (15,740) Retirement benefit obligations 27 (1,073) (1,204) Deferred tax liabilities 21 (4,498) (4,657) Derivative financial liabilities 19 (1,785) (1,139) Provisions for liabilities and charges 20 (2,808) (2,688) Total non-current liabilities (27,106) (25,450) Total liabilities (33,833) (33,801) Net assets 32,177 37,364
EQUITYCalled-up share capital 32 772 772 Share premium account 4,358 4,358 Own shares (6,359) (6,463) Other reserves (7,205) (5,372) Retained earnings 34,851 38,376 Equity attributable to equity shareholders of the Company 26,417 31,671 Non-controlling interests 31 5,760 5,693 Total equity 32,177 37,364
The financial statements of Anglo American plc, registered number 03564138, were approved by the Board of directors on 12 February 2015 and signed on its behalf by:
Mark Cutifani René MédoriChief Executive Finance Director

114 Anglo American plc Annual Report 2014
CONSOLIDATED CASH FLOW STATEMENTfor the year ended 31 December 2014
US$ million Note 2014 2013Cash flows from operating activities(Loss)/profit before tax (259) 1,700 Net finance costs including financing special items and remeasurements 220 406 Share of net income from associates and joint ventures (208) (168) Non-operating special items 6 385 469 Operating profit 4 138 2,407 Operating special items and remeasurements 6 4,375 3,761Cash element of operating special items (100) (146)Depreciation and amortisation 3 2,591 2,638 Share-based payment charges 170 201 Decrease in provisions (200) (56) Increase in inventories (129) (562) Decrease/(increase) in operating receivables 576 (541) Decrease in operating payables (438) (18) Other adjustments (34) 45 Cash flows from operations 6,949 7,729 Dividends from associates and joint ventures 13 435 246 Dividends from financial asset investments 25 18 Income tax paid (1,298) (1,201) Net cash inflows from operating activities 6,111 6,792
Cash flows from investing activitiesExpenditure on property, plant and equipment 22 (5,974) (6,125) Cash flows from derivatives related to capital expenditure 22 (157) (136) Proceeds from disposal of property, plant and equipment 22 71 140 Investments in associates and joint ventures 13 (81) (221) Purchase of financial asset investments 14 (12) – Net (advance)/repayment of loans granted 14 (80) 301 Interest received and other investment income 157 193 Disposal of subsidiaries, net of cash and cash equivalents disposed 30 44 13 Repayment of capitalised loans by associates 13 – 108 Net proceeds from disposal of interests in available for sale investments 14 – 99 Other investing activities (93) 3 Net cash used in investing activities (6,125) (5,625)
Cash flows from financing activitiesInterest paid (833) (907) Cash flows from derivatives related to financing activities 23b 203 181 Dividends paid to Company shareholders (1,099) (1,078) Dividends paid to non-controlling interests (823) (1,159) Proceeds from issuance of bonds 24 3,165 3,562Proceeds from other borrowings 1,419 1,127Repayment of borrowings (2,801) (3,717)Movements in non-controlling interests 42 71 Tax on sale of non-controlling interest in Anglo American Sur – (395) Sale of shares under employee share schemes 14 14 Purchase of shares by subsidiaries for employee share schemes(1) (111) (92) Other financing activities (3) (9) Net cash used in financing activities (827) (2,402) Net decrease in cash and cash equivalents (841) (1,235)
Cash and cash equivalents at start of year 23b 7,702 9,298 Cash movements in the year (841) (1,235) Effects of changes in foreign exchange rates (114) (361) Cash and cash equivalents at end of year 23b 6,747 7,702
(1) Includes purchase of Kumba Iron Ore Limited and Anglo American Platinum Limited shares for their respective employee share schemes.
FINANCIAL STATEMENTS AND OTHER FINANCIAL INFORMATION PRINCIPAL STATEMENTS

Anglo American plc Annual Report 2014 115
Financial statements
CONSOLIDATED STATEMENT OF CHANGES IN EQUITYfor the year ended 31 December 2014
US$ millionTotal share
capital(1)Own
shares(2)Retained earnings
Cumulative translation
adjustment reserve
Fair value and other reserves
(note 32)
Total equity attributable
to equity shareholders
of the Company
Non-controlling
interests Total equityAt 1 January 2013 5,129 (6,659) 40,343 (2,617) 1,415 37,611 6,127 43,738 Total comprehensive (expense)/income – – (901) (4,023) (129) (5,053) 769 (4,284) Dividends payable – – (1,078) – – (1,078) (1,273) (2,351)Changes in ownership interest in subsidiaries – – 38 – – 38 (14) 24 Issue of shares to non-controlling interests – – – – – – 47 47 Equity settled share-based payment schemes – 196 (43) – (1) 152 37 189Other 1 – 17 – (17) 1 – 1At 31 December 2013 5,130 (6,463) 38,376 (6,640) 1,268 31,671 5,693 37,364Total comprehensive (expense)/income – – (2,506) (1,703) (122) (4,331) 736 (3,595) Dividends payable – – (1,099) – – (1,099) (749) (1,848) Issue of shares to non-controlling interests – – – – – – 42 42 Equity settled share-based payment schemes – 104 31 – (8) 127 29 156 Other – – 49 – – 49 9 58 At 31 December 2014 5,130 (6,359) 34,851 (8,343) 1,138 26,417 5,760 32,177
(1) Includes share capital and share premium.(2) Own shares comprise shares of Anglo American plc held by the Company (treasury shares), its subsidiaries and employee benefit trusts.
DividendsNote 2014 2013
Proposed ordinary dividend per share (US cents) 10 53 53Proposed ordinary dividend (US$ million) 10 678 678
Ordinary dividends payable during the year per share (US cents) 10 85 85Ordinary dividends payable during the year (US$ million) 10 1,099 1,078
FINANCIAL STATEMENTS AND OTHER FINANCIAL INFORMATION PRINCIPAL STATEMENTS

116 Anglo American plc Annual Report 2014
FINANCIAL STATEMENTS AND OTHER FINANCIAL INFORMATION
1. CRITICAL ACCOUNTING JUDGEMENTS AND KEY SOURCES OF ESTIMATION UNCERTAINTY
In the course of preparing financial statements, management necessarily makes judgements and estimates that can have a significant impact on the financial statements. The most critical of these relate to estimation of Ore Reserves, assessment of fair value, impairment of assets, restoration, rehabilitation and environmental costs, deferred stripping, taxation, retirement benefits, contingent liabilities and joint arrangements. The use of inaccurate assumptions in assessments made for any of these estimates could result in a significant impact on financial results.
Ore Reserve estimatesWhen determining Ore Reserves, which may be used to calculate depreciation on the Group’s mining properties, assumptions that were valid at the time of estimation may change when new information becomes available. Any changes could affect prospective depreciation rates and asset carrying values.
The calculation of the unit of production rate of amortisation could be impacted to the extent that actual production in the future is different from current forecast production based on Proved and Probable Ore Reserves.
Factors which could impact useful economic lives of assets and Ore Reserve estimates include:
• changes to Proved and Probable Ore Reserves
• the grade of Ore Reserves varying significantly from time to time
• differences between actual commodity prices and commodity price assumptions used in the estimation of Ore Reserves
• renewal of mining licences
• unforeseen operational issues at mine sites
• adverse changes in capital, operating, mining, processing and reclamation costs, discount rates and foreign exchange rates used to determine Ore Reserves.
For further information refer to the unaudited Ore Reserves and Mineral Resources section of the Annual Report.
Assessment of fair value The assessment of fair value is principally used in accounting for business combinations, impairment testing and the valuation of certain financial assets and liabilities.
Fair value is determined based on observable market data (in the case of listed subsidiaries, market share price at 31 December of the respective entity) or discounted cash flow models (and other valuation techniques) using assumptions considered to be reasonable and consistent with those that would be applied by a market participant. Where discounted cash flows are used, the resulting fair value measurements are considered to be at level 3 in the fair value hierarchy as defined in IFRS 13 Fair Value Measurement as they depend to a significant extent on unobservable valuation inputs. The determination of assumptions used in assessing the fair value of identifiable assets and liabilities is subjective and the use of different valuation assumptions could have a significant impact on financial results.
In particular, expected future cash flows, which are used in discounted cash flow models, are inherently uncertain and could materially change over time. They are significantly affected by a number of factors including Ore Reserves and Resources, together with economic factors such as commodity prices, exchange rates, discount rates and estimates of production costs and future capital expenditure.
Cash flow projectionsCash flow projections are based on financial budgets and Life of Mine Plans or non-mine production plans, incorporating key assumptions as detailed below:
• Reserves and resources Ore Reserves and, where considered appropriate, Mineral Resources are incorporated in projected cash flows, based on Ore Reserves and Mineral Resource statements and exploration and evaluation work undertaken by appropriately qualified persons. Mineral Resources are included where management has a high degree of confidence in their economic extraction, despite additional evaluation still being required prior to meeting the requirements of reserve classification.
• Commodity and product prices Commodity and product prices are based on latest internal forecasts, benchmarked with external sources of information, to ensure they are within the range of available analyst forecasts. Where existing sales contracts are in place, the effects of such contracts are taken into account in determining future cash flows.
• Foreign exchange rates Foreign exchange rates are based on latest internal forecasts, benchmarked with external sources of information for relevant countries of operation. Foreign exchange rates are kept constant (on a real basis) from 2019 onwards.
• Discount rates Cash flow projections used in fair value less costs of disposal impairment models are discounted based on a real post-tax discount rate of 6.5% (2013: 6.5%). Adjustments to the rate are made for any risks that are not reflected in the underlying cash flows.
• Operating costs, capital expenditure and other operating factors Operating costs and capital expenditure are based on financial budgets covering a three year period. Cash flow projections beyond three years are based on Life of Mine Plans or non-mine production plans, as applicable, and internal management forecasts. Cost assumptions incorporate management experience and expectations, as well as the nature and location of the operation and the risks associated therewith. Underlying input cost assumptions are consistent with related output price assumptions. Other operating factors, such as the timelines of granting licences and permits are based on management’s best estimate of the outcome of uncertain future events at the balance sheet date.
Impairment of assetsIn making assessments for impairment, management necessarily applies its judgement in allocating assets, including goodwill, that do not generate independent cash flows to appropriate cash generating units (CGUs), and also in estimating the timing and value of underlying cash flows within the calculation of recoverable amount.
The calculation of recoverable amount is based on assessments of either fair value less costs of disposal or value in use. The cash flow projections used in these assessments are subject to the areas of judgement outlined above.
Subsequent changes to the CGU allocation, to the timing of cash flows or to the assumptions used to determine the cash flows could impact the carrying value of the respective assets.
Restoration, rehabilitation and environmental costsCosts for restoration of site damage, rehabilitation and environmental costs are estimated using either the work of external consultants or internal experts. Management uses its judgement and experience to provide for and amortise these estimated costs over the life of the mine.
Deferred strippingThe Group defers stripping costs onto the balance sheet where they are considered to improve access to ore in future periods. Where the amount to be capitalised cannot be specifically identified it is determined based on the volume of waste extracted compared with expected volume for the identified component of the orebody. This determination is dependent on an individual mine’s pit design and Life of Mine Plan and therefore changes to the pit design or Life of Mine Plan will result in changes to these estimates. Identification of the components of a mine’s orebody is made by reference to the Life of Mine Plan. The assessment depends on a range of factors including each mine’s specific operational features and materiality.
NOTES TO THE FINANCIAL STATEMENTS

Anglo American plc Annual Report 2014 117
Financial statements
1. CRITICAL ACCOUNTING JUDGEMENTS AND KEY SOURCES OF ESTIMATION UNCERTAINTY continuedTaxationThe Group’s tax affairs are governed by complex domestic tax legislations interlaced with the override of international tax treaties between countries and the interpretation of both by tax authorities and courts. In addition, in arriving at the tax charge in the financial statements a degree of judgement is required by management about the future taxable profits and repatriation of retained earnings. These judgements in turn are influenced, inter alia, by factors such as estimates of future production, commodity lines, operating costs, future capital expenditure, and dividend policies. Given the many uncertainties that could arise from any or all of these factors and judgements, future adjustments to the tax charge already recorded could occur. Where management is aware of potential uncertainties around these factors and judgements, provision is made and reviewed on a regular basis. These are subject to risk and changes may be required to the amount provided in respect of historic or future tax costs.
Retirement benefitsThe expected costs of providing pensions and post employment benefits under defined benefit arrangements relating to employee service during the period are determined based on financial and actuarial assumptions.
Assumptions in respect of the expected costs are set after consultation with qualified actuaries. While management believes the assumptions used are appropriate, a change in the assumptions used would affect the amounts recognised in the financial statements.
Contingent liabilitiesOn an ongoing basis the Group is a party to various legal disputes, the outcomes of which cannot be assessed with a high degree of certainty.
A provision is recognised where, based on the Group’s legal views and advice, it is considered probable that an outflow of resources will be required to settle a present obligation that can be measured reliably. Disclosure of contingent liabilities is made in note 34 unless the possibility of a loss arising is considered remote.
Joint arrangementsJoint arrangements are classified as joint operations or joint ventures according to the rights and obligations of the parties, as described in note 39k. When a joint arrangement has been structured through a separate vehicle, consideration has been given to the legal form of the separate vehicle, the terms of the contractual arrangement and, when relevant, other facts and circumstances. When the activities of an arrangement are primarily designed for the provision of output to the parties and, the parties are substantially the only source of cash flows contributing to the continuity of the operations of the arrangement, this indicates that the parties to the arrangement have rights to the assets and obligations for the liabilities. Certain joint arrangements that are structured through separate vehicles including Collahuasi, Debswana and Namdeb are accounted for as joint operations. These arrangements are primarily designed for the provision of output to the parties sharing joint control, indicating that the parties have rights to substantially all the economic benefits of the assets. The liabilities of the arrangements are in substance satisfied by cash flows received from the parties; this dependence indicates that the parties effectively have obligations for the liabilities. It is primarily these facts and circumstances that give rise to the classification as joint operations.
2. CHANGES IN ACCOUNTING POLICIES AND DISCLOSURESThe accounting policies applied are consistent with those adopted and disclosed in the Group financial statements for the year ended 31 December 2013, except for the adoption of amendments to IAS 36 Impairment of Assets: Recoverable Amount Disclosures for Non-Financial Assets.
The amendment introduces the requirement to disclose the recoverable amount of CGUs that have been impaired in the period. In addition, the amendment requires the disclosure of certain additional information on valuation assumptions, where the recoverable amount of a CGU is assessed on a fair value less costs of disposal basis using a discounted cash flow method. The required disclosures are reflected in these financial statements.
A number of other accounting pronouncements, principally amendments to existing standards, issued by the IASB became effective on 1 January 2014 and were adopted by the Group. The Group has early adopted IFRIC 21 Levies which has been endorsed by the European Union (EU) but is effective for annual periods beginning on or after 17 June 2014. These pronouncements have not had a material impact on the accounting policies applied by the Group.
The Group has not early adopted any other amendment, standard or interpretation that has been issued but is not yet effective. It is expected that where applicable, these standards and amendments will be adopted on each respective effective date.
New IFRS accounting standards, amendments and interpretations not yet adoptedThe following new IFRS accounting standards in issue but not yet effective (and not yet endorsed by the EU) are expected to have a significant impact on the Group:
IFRS 9 Financial Instruments IFRS 9 will replace IAS 39 Financial Instruments: Recognition and Measurement and addresses the following three key areas:
• Classification and measurement establishes a single, principles-based approach for the classification of financial assets, which is driven by cash flow characteristics and the business model in which an asset is held.
• Impairment introduces a new ‘expected loss’ impairment model, requiring expected credit losses to be recognised from when financial instruments are first recognised.
• Hedge Accounting aligns the accounting treatment with risk management practices of an entity.
IFRS 9 is expected to have a number of impacts on the Group financial statements including changes in the presentation of gains and losses on financial assets classified as available for sale.
IFRS 9 is effective for annual reporting periods beginning on or after 1 January 2018.
IFRS 15 Revenue from Contracts with CustomersIFRS 15 replaces IAS 11 and IAS 18 and establishes a unified framework for determining the timing, measurement and recognition of revenue. The focus of the new standard is to recognise revenue as performance obligations are met rather than based on the transfer of risks and rewards.
IFRS 15 includes a comprehensive set of disclosure requirements including qualitative and quantitative information about its contracts with customers to help investors understand the nature, amount, timing and uncertainty of revenue.
The Group’s revenue is predominantly derived from the sale of goods under arrangements in which the transfer of risks and rewards of ownership and the fulfilment of the Group’s performance obligations are likely to coincide. Therefore, for the majority of sales the timing and amount of revenue is unlikely to be materially affected by the adoption of the new standard. The standard is effective for annual reporting periods beginning on or after 1 January 2017.
FINANCIAL STATEMENTS AND OTHER FINANCIAL INFORMATION NOTES TO THE FINANCIAL STATEMENTS

118 Anglo American plc Annual Report 2014
FINANCIAL STATEMENTS AND OTHER FINANCIAL INFORMATION NOTES TO THE FINANCIAL STATEMENTS
2. CHANGES IN ACCOUNTING POLICIES AND DISCLOSURES continuedThe following new or amended IFRS accounting standards, amendments and interpretations in issue but not yet effective (and in some cases not yet adopted by the EU) are not expected to have a significant impact on the Group:
• Amendments to IAS 19 Employee Benefits: Defined Benefit Plans – Employee Contributions provides additional guidance on the accounting for contributions from employees or third parties set out in the formal terms of a defined benefit plan. The amendment is effective for annual periods beginning on or after 1 July 2014.
• Amendments to IAS 1 Presentation of Financial Statements: Disclosure Initiative provides guidance on the use of judgement in presenting financial statement information, including: the application of materiality, order of notes, use of subtotals, accounting policy referencing and disaggregation of financial and non-financial information.
• Amendments to IFRS 11 Joint Arrangements: Accounting for Acquisitions of Interests in Joint Operations provides guidance on accounting for the acquisition of an interest in a joint operation that constitutes a business.
• Amendments to IAS 16 Property, Plant and Equipment and IAS 38 Intangible Assets: Clarification of Acceptable Methods of Depreciation and Amortisation clarifies that there is a rebuttable presumption that revenue-based methods of depreciation are not appropriate.
• Amendments to IFRS 10 Consolidated Financial Statements and IAS 28 Joint Ventures: Sale or Contribution of Assets between an Investor and its Associate or Joint Venture removes an inconsistency between the two standards on the accounting treatment for gains and losses arising on the sale or contribution of assets by an investor to its associate or joint venture. Following the amendment, such gains and losses may only be recognised to the extent of the unrelated investor’s interest, except where the transaction involves assets that constitute a business.
Other issued standards and amendments that are not yet effective are not expected to have an impact on the financial statements.

Anglo American plc Annual Report 2014 119
Financial statements
FINANCIAL STATEMENTS AND OTHER FINANCIAL INFORMATION NOTES TO THE FINANCIAL STATEMENTS
3. SEGMENTAL INFORMATIONThe Group’s segments are aligned to the structure of business units based around core commodities. Each business unit has a management team that is accountable to the Chief Executive, and in the instance of Copper, Nickel, Niobium and Phosphates, the same management team is responsible for the management of all four business units, collectively referred to as Base Metals and Minerals. To align with changes in the management structure of the Group’s coal businesses and the way their results are internally reported, Coal South Africa and Coal Colombia (formerly the Thermal Coal segment) and Coal Australia and Canada (formerly the Metallurgical Coal segment) are now reported together as the Coal segment. Niobium and Phosphates are now reported as separate segments, having previously been aggregated and the Diamonds segment is now referred to as De Beers.
The Kumba Iron Ore, Iron Ore Brazil and Samancor business units have been aggregated as the ‘Iron Ore and Manganese’ segment on the basis of the ultimate product produced (ferrous metals).
The Other Mining and Industrial segment is no longer considered to be individually significant to the Group and is therefore now shown within ‘Corporate and other’ together with unallocated corporate costs and exploration costs. Exploration costs represent the cost of the Group’s exploration activities across all segments, and were previously reported separately. Comparatives have been reclassified to align with current year presentation.
The Group Management Committee evaluates the financial performance of the Group and its segments principally with reference to earnings before interest and tax (underlying EBIT). Underlying EBIT is operating profit presented before special items and remeasurements and includes the Group’s attributable share of associates’ and joint ventures’ underlying EBIT. Underlying EBIT of associates and joint ventures is the Group’s attributable share of revenue less operating costs before special items and remeasurements of associates and joint ventures.
Underlying EBITDA is underlying EBIT before depreciation and amortisation in subsidiaries and joint operations and includes the Group’s attributable share of associates’ and joint ventures’ underlying EBIT before depreciation and amortisation.
Segment revenue includes the Group’s attributable share of associates’ and joint ventures’ revenue. Segments predominantly derive revenue as follows – Iron Ore and Manganese: iron ore, manganese ore and alloys; Coal: metallurgical coal and thermal coal; Copper: copper; Nickel: nickel; Niobium: niobium; Phosphates: phosphates; Platinum: platinum group metals; and De Beers: rough and polished diamonds.
The segment results are stated after elimination of inter-segment transactions and include an allocation of corporate costs.
Segment resultsSee note 39a for the Group’s accounting policy on revenue recognition.
Revenue Underlying EBITUS$ million 2014 2013 2014 2013Iron Ore and Manganese 5,176 6,517 1,957 3,119 Coal 5,808 6,400 458 587 Copper 4,827 5,392 1,193 1,739 Nickel 142 136 21 (44) Niobium 180 182 67 82 Phosphates 486 544 57 68Platinum 5,396 5,688 32 464 De Beers 7,114 6,404 1,363 1,003 Corporate and other 1,859 1,800 (215) (398) Segment measure 30,988 33,063 4,933 6,620 Reconciliation: Less: associates and joint ventures (3,915) (3,721) (420) (452) Include: operating special items and remeasurements – – (4,375) (3,761) Statutory measure 27,073 29,342 138 2,407
Depreciation and amortisation Underlying EBITDAUS$ million 2014 2013 2014 2013Iron Ore and Manganese 329 271 2,286 3,390 Coal 749 760 1,207 1,347 Copper 709 663 1,902 2,402 Nickel 7 7 28 (37) Niobium 6 5 73 87Phosphates 22 21 79 89Platinum 495 584 527 1,048 De Beers 455 448 1,818 1,451 Corporate and other 127 141 (88) (257)
2,899(1) 2,900(1) 7,832 9,520 Less: associates and joint ventures (308) (262) (728) (714)
2,591 2,638 7,104 8,806
(1) In addition $129 million (2013: $131 million) of depreciation and amortisation charges arising due to the fair value uplift of the Group’s pre-existing 45% shareholding in De Beers has been included within operating remeasurements (see note 6), and $105 million (2013: $100 million) of pre-commercial production depreciation has been capitalised.
NOTES TO THE CONSOLIDATED INCOME STATEMENT

120 Anglo American plc Annual Report 2014
FINANCIAL STATEMENTS AND OTHER FINANCIAL INFORMATION NOTES TO THE FINANCIAL STATEMENTS
3. SEGMENTAL INFORMATION continuedUnderlying EBITDA is reconciled to underlying EBIT and to ‘(Loss)/profit before net finance costs and tax’:
US$ million 2014 2013 Underlying EBITDA 7,832 9,520 Depreciation and amortisation: subsidiaries and joint operations (2,591) (2,638) Depreciation and amortisation: associates and joint ventures (308) (262) Underlying EBIT 4,933 6,620 Operating special items and remeasurements (4,375) (3,761) Non-operating special items (385) (469) Associates’ and joint ventures’ net special items and remeasurements (46) (75) Share of associates’ and joint ventures’ net finance costs, tax and non-controlling interests (166) (209) (Loss)/profit before net finance costs and tax (39) 2,106
Associates’ and joint ventures’ results by segmentRevenue Underlying EBIT Share of net income
US$ million 2014 2013 2014 2013 2014 2013Iron Ore and Manganese 788 874 178 205 104 91 Coal 1,050 1,136 189 275 73 162 Platinum 263 228 (19) (19) (26) (30) De Beers 79 89 (9) (21) (6) (35) Corporate and other 1,735 1,394 81 12 63 (20)
3,915 3,721 420 452 208 168
Depreciation and amortisation Underlying EBITDAUS$ million 2014 2013 2014 2013Iron Ore and Manganese 73 48 251 253 Coal 106 86 295 361 Platinum 28 35 9 16 De Beers 3 5 (6) (16) Corporate and other 98 88 179 100
308 262 728 714
The reconciliation of associates’ and joint ventures’ underlying EBIT to ‘Share of net income from associates and joint ventures’ is as follows:
US$ million 2014 2013Associates’ and joint ventures’ underlying EBIT 420 452 Net finance costs (46) (36) Income tax expense (113) (158) Non-controlling interests (7) (15) Share of net income from associates and joint ventures (before special items and remeasurements) 254 243 Special items and remeasurements – (80) Special items and remeasurements tax (46) 3 Non-controlling interests on special items and remeasurements – 2 Share of net income from associates and joint ventures 208 168
Other non-cash expensesIn addition to depreciation and amortisation, other non-cash expenses include equity settled share-based payment charges and amounts in respect of provisions, excluding amounts recorded within special items. Significant other non-cash expenses included within underlying EBIT are as follows:
US$ million 2014 2013Iron Ore and Manganese 36 73 Coal 160 214 Copper 87 142 Nickel 7 16 Niobium 1 3 Phosphates 4 3Platinum 37 56 De Beers 94 42 Corporate and other 54 76
480 625
NOTES TO THE CONSOLIDATED INCOME STATEMENT

Anglo American plc Annual Report 2014 121
Financial statements
FINANCIAL STATEMENTS AND OTHER FINANCIAL INFORMATION NOTES TO THE FINANCIAL STATEMENTS
3. SEGMENTAL INFORMATION continuedSegment assets and liabilities
Segment assets(1) Segment liabilities(2) Net segment assets/(liabilities)US$ million 2014 2013 2014 2013 2014 2013 Iron Ore and Manganese 9,788 11,502 (660) (470) 9,128 11,032 Coal 6,897 7,483 (2,257) (2,305) 4,640 5,178 Copper 9,082 9,549 (1,132) (1,248) 7,950 8,301 Nickel 1,745 1,695 (92) (131) 1,653 1,564 Niobium 782 546 (27) (25) 755 521 Phosphates 412 409 (61) (77) 351 332 Platinum 8,729 9,584 (919) (999) 7,810 8,585 De Beers 12,070 12,688 (1,428) (1,489) 10,642 11,199 Corporate and other 365 610 (350) (680) 15 (70)
49,870 54,066 (6,926) (7,424) 42,944 46,642 Non-operating assets and liabilities 16,140 17,099 (26,907) (26,377) (10,767) (9,278)
66,010 71,165 (33,833) (33,801) 32,177 37,364
(1) Segment assets are operating assets and consist of intangible assets of $3,912 million (2013: $4,083 million), property, plant and equipment of $38,475 million (2013: $41,505 million), environmental rehabilitation trusts of $358 million (2013: $348 million), biological assets of $11 million (2013: $16 million), retirement benefit assets of $184 million (2013: $191 million), inventories of $4,720 million (2013: $4,789 million) and operating receivables of $2,210 million (2013: $3,134 million).
(2) Segment liabilities are operating liabilities and consist of non-interest bearing current liabilities of $2,984 million (2013: $3,392 million), operating provisions for liabilities and charges of $2,869 million (2013: $2,828 million) and retirement benefit obligations of $1,073 million (2013: $1,204 million).
Product analysisRevenue by productUS$ million 2014 2013Iron ore 4,029 5,365 Manganese ore and alloys 788 874 Metallurgical coal 2,290 2,610 Thermal coal 3,529 3,802 Copper 4,688 5,253 Nickel 638 461 Niobium 180 182Phosphates 486 544 Platinum 3,097 3,586 Palladium 1,058 1,052 Rhodium 280 316 Diamonds 7,104 6,391 Heavy building materials 1,854 1,695 Other 967 932
30,988 33,063
Geographical analysisRevenue by destinationThe Group’s geographical analysis of segment revenue allocated based on the country in which the customer is located is as follows:
US$ million 2014 2013South Africa 2,464 2,474 Other Africa 1,663 1,201 Brazil 939 1,019 Chile 1,033 1,692 Other South America 23 32 North America 1,218 1,084 Australia 275 277 China 5,109 6,469 India 3,079 2,505 Japan 3,496 3,769 Other Asia 3,580 3,252 United Kingdom (Anglo American plc’s country of domicile) 3,090 3,697 Other Europe 5,019 5,592
30,988 33,063
NOTES TO THE CONSOLIDATED INCOME STATEMENT

122 Anglo American plc Annual Report 2014
FINANCIAL STATEMENTS AND OTHER FINANCIAL INFORMATION NOTES TO THE FINANCIAL STATEMENTS
3. SEGMENTAL INFORMATION continuedNon-current assets by location
Intangible assets and property, plant and equipment Total non-current assets
US$ million 2014 2013 2014 2013South Africa 12,998 13,542 14,450 14,950 Botswana 5,138 5,748 5,138 5,748Other Africa 1,138 1,197 1,145 1,205Brazil 8,001 9,650 8,097 9,713 Chile 7,347 7,472 7,347 7,472 Other South America 740 556 1,750 1,727 North America 1,483 1,764 1,488 1,768 Australia and Asia 4,136 4,260 4,764 5,017 United Kingdom (Anglo American plc's country of domicile) 1,277 1,257 2,838 2,833 Other Europe 129 142 131 144 Non-current assets by location 42,387 45,588 47,148 50,577Unallocated assets 4,554 4,429 Total non-current assets 51,702 55,006
(1) Total non-current assets by location primarily comprise intangible assets, property, plant and equipment, environmental rehabilitation trusts and investments in associates and joint ventures.
4. OPERATING PROFIT FROM SUBSIDIARIES AND JOINT OPERATIONSUS$ million 2014 2013Group revenue 27,073 29,342 Cost of sales (23,305) (22,336) Gross profit 3,768 7,006 Selling and distribution costs (1,661) (1,780) Administrative expenses (1,937) (2,214) Other gains and losses (see below) 149 (398) Exploration expenditure (see below) (181) (207) Operating profit 138 2,407
US$ million 2014 2013Operating profit is stated after charging:Depreciation of property, plant and equipment (note 12)(1) (2,545) (2,579)Amortisation of intangible assets (note 11)(2) (46) (59)Rentals under operating leases (134) (142)Exploration expenditure (see below) (181) (207)Evaluation expenditure (see below) (218) (326)Research and development expenditure (101) (103) Operating special items (note 6) (4,374) (3,211) Employee costs (note 26) (4,514) (4,834)Provisional pricing adjustment(3) (219) (88) Royalties(4) (405) (629)
Other gains and losses comprise:Operating remeasurements (note 6) (1) (550) Other fair value losses on derivatives – realised (20) (21) Foreign exchange gains on other monetary items 172 182 Other (2) (9) Total other gains and losses 149 (398)
(1) In addition $110 million (2013: $111 million) of depreciation arising due to the fair value uplift of the Group’s pre-existing 45% shareholding in De Beers has been included within operating remeasurements (see note 6) and $105 million (2013: $100 million) of pre-commercial production depreciation has been capitalised.
(2) In addition $19 million (2013: $20 million) of amortisation arising due to the fair value uplift of the Group’s pre-existing 45% shareholding in De Beers has been included within operating remeasurements (see note 6).
(3) Provisionally priced contracts resulted in a total (realised and unrealised) loss in revenue of $226 million (2013: $76 million) and total (realised and unrealised) gain in operating costs of $7 million (2013: loss of $12 million).
(4) Excludes those royalties which meet the definition of income tax on profit and accordingly have been accounted for as taxes.
(1)
NOTES TO THE CONSOLIDATED INCOME STATEMENT
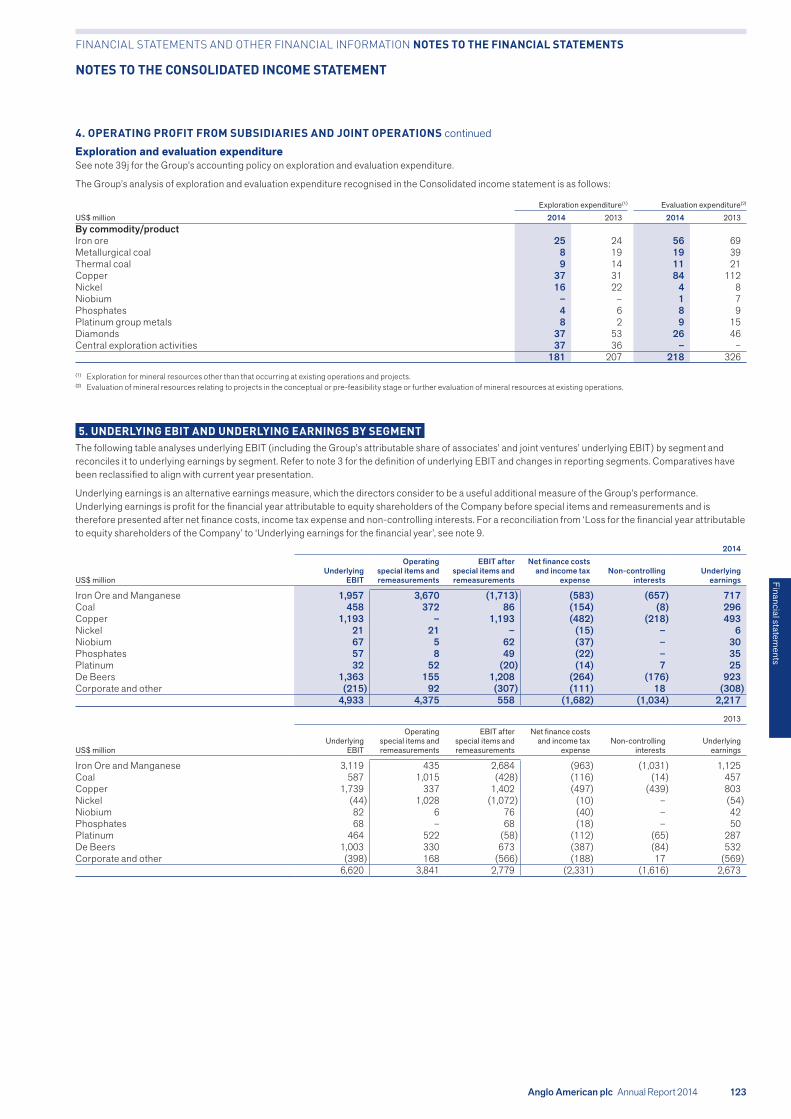
Anglo American plc Annual Report 2014 123
Financial statements
FINANCIAL STATEMENTS AND OTHER FINANCIAL INFORMATION NOTES TO THE FINANCIAL STATEMENTS
4. OPERATING PROFIT FROM SUBSIDIARIES AND JOINT OPERATIONS continued
Exploration and evaluation expenditureSee note 39j for the Group’s accounting policy on exploration and evaluation expenditure.
The Group’s analysis of exploration and evaluation expenditure recognised in the Consolidated income statement is as follows:
Exploration expenditure(1) Evaluation expenditure(2)
US$ million 2014 2013 2014 2013By commodity/productIron ore 25 24 56 69 Metallurgical coal 8 19 19 39 Thermal coal 9 14 11 21 Copper 37 31 84 112 Nickel 16 22 4 8 Niobium – – 1 7 Phosphates 4 6 8 9Platinum group metals 8 2 9 15 Diamonds 37 53 26 46 Central exploration activities 37 36 – –
181 207 218 326
(1) Exploration for mineral resources other than that occurring at existing operations and projects.(2) Evaluation of mineral resources relating to projects in the conceptual or pre-feasibility stage or further evaluation of mineral resources at existing operations.
5. UNDERLYING EBIT AND UNDERLYING EARNINGS BY SEGMENT The following table analyses underlying EBIT (including the Group’s attributable share of associates’ and joint ventures’ underlying EBIT) by segment and reconciles it to underlying earnings by segment. Refer to note 3 for the definition of underlying EBIT and changes in reporting segments. Comparatives have been reclassified to align with current year presentation.
Underlying earnings is an alternative earnings measure, which the directors consider to be a useful additional measure of the Group’s performance. Underlying earnings is profit for the financial year attributable to equity shareholders of the Company before special items and remeasurements and is therefore presented after net finance costs, income tax expense and non-controlling interests. For a reconciliation from ‘Loss for the financial year attributable to equity shareholders of the Company’ to ‘Underlying earnings for the financial year’, see note 9.
2014
US$ millionUnderlying
EBIT
Operating special items and remeasurements
EBIT after special items and remeasurements
Net finance costs and income tax
expenseNon-controlling
interestsUnderlying
earnings
Iron Ore and Manganese 1,957 3,670 (1,713) (583) (657) 717 Coal 458 372 86 (154) (8) 296 Copper 1,193 – 1,193 (482) (218) 493 Nickel 21 21 – (15) – 6 Niobium 67 5 62 (37) – 30 Phosphates 57 8 49 (22) – 35 Platinum 32 52 (20) (14) 7 25 De Beers 1,363 155 1,208 (264) (176) 923 Corporate and other (215) 92 (307) (111) 18 (308)
4,933 4,375 558 (1,682) (1,034) 2,217
2013
US$ millionUnderlying
EBIT
Operating special items and remeasurements
EBIT after special items and remeasurements
Net finance costs and income tax
expenseNon-controlling
interestsUnderlying
earnings
Iron Ore and Manganese 3,119 435 2,684 (963) (1,031) 1,125Coal 587 1,015 (428) (116) (14) 457Copper 1,739 337 1,402 (497) (439) 803Nickel (44) 1,028 (1,072) (10) – (54)Niobium 82 6 76 (40) – 42Phosphates 68 – 68 (18) – 50Platinum 464 522 (58) (112) (65) 287De Beers 1,003 330 673 (387) (84) 532Corporate and other (398) 168 (566) (188) 17 (569)
6,620 3,841 2,779 (2,331) (1,616) 2,673
NOTES TO THE CONSOLIDATED INCOME STATEMENT

124 Anglo American plc Annual Report 2014
6. SPECIAL ITEMS AND REMEASUREMENTSSpecial items are those items of financial performance that the Group believes should be separately disclosed on the face of the income statement to assist in the understanding of the underlying financial performance achieved by the Group. Such items are material by nature or amount to the year’s results and require separate disclosure in accordance with IAS 1 paragraph 97. Special items that relate to the operating performance of the Group are classified as operating special items and principally include impairment charges, onerous contract provisions and restructuring costs. Non-operating special items include costs in relation to closure of operations, profits and losses on disposals of investments and businesses as well as certain adjustments relating to business combinations.
Remeasurements comprise other items which the Group believes should be reported separately to aid an understanding of the underlying financial performance of the Group. Remeasurements include:
• Unrealised gains and losses on financial assets and liabilities that represent economic hedges, including accounting hedges related to financing arrangements. Where the underlying transaction is recorded in the income statement, the realised gains or losses are reversed from remeasurements and are recorded in underlying earnings in the same year as the underlying transaction for which the instruments provide the economic hedge. If the underlying transaction is recorded in the balance sheet, for example capital expenditure, the realised amount remains in remeasurements on settlement of the derivative. Such amounts are classified in the income statement as operating when the underlying exposure is in respect of the operating performance of the Group and otherwise as financing.
• Foreign exchange impacts arising in US dollar functional currency entities where tax calculations are generated based on local currency financial information and hence deferred tax is susceptible to currency fluctuations. Such amounts are included within income tax expense.
• The remeasurement and subsequent depreciation of a previously held equity interest as a result of a business combination.
US$ million 2014 2013Subsidiaries and joint operationsMinas-Rio impairment (3,800) –Coal impairments (363) (574) Platinum operations (44) (379) Impairment of Barro Alto – (1,012) Impairment of Michiquillay – (337) Other impairments and related charges (39) (172) Restructuring costs (128) (177) Onerous contract provisions – (434) Reversal of De Beers inventory uplift – (126) Operating special items (4,374) (3,211) Operating remeasurements (1) (550) Operating special items and remeasurements (4,375) (3,761) Closure of Drayton (222) –Disposal of Amapá (46) (175) Exit from Pebble – (311) Loss on formation of Lafarge Tarmac joint venture – (55) Ponahalo refinancing (58) –Atlatsa refinancing (note 35) 22 (37) Kumba Envision Trust (44) (54) Other (37) 163 Non-operating special items (385) (469) Financing special items and remeasurements 36 (130) Special items and remeasurements before tax and non-controlling interests (4,724) (4,360) Special items and remeasurements tax 2 587 Non-controlling interests on special items and remeasurements 38 214 Share of associates' and joint ventures' special items and remeasurements(1) (46) (75) Total special items and remeasurements (4,730) (3,634)
(1) Relates to the Coal segment (2013: Coal, De Beers and Corporate and other segments).
Operating special itemsMinas-RioThe Minas-Rio iron ore project (Minas-Rio) (Iron Ore and Manganese) in Brazil was acquired in two separate transactions in 2007 and 2008. Production commenced in the last quarter and successful delivery of First Ore On Ship (FOOS) was announced on 27 October 2014. The project is currently ramping up to capacity of 26.5 Mtpa over the next 18-20 months, and work continues to progress on the regular cycle of required licence and permit renewals.
An impairment charge of $4,960 million (before tax) was recorded in 2012 against the carrying value of Minas-Rio. This was based on the value in use of the cash generating unit (CGU) and reflected an increase in estimate of attributable project capital expenditure to $8.8 billion, including a $0.6 billion contingency as well as the impact of high inflation on operational costs. The long term iron ore price used in the 2012 valuation was within the range of published analyst forecasts.
The successful progress of the project up to delivery of FOOS indicates that the $0.6 billion of contingency will not be fully utilised and consequently total capital expenditure for the project now is estimated at $8.4 billion, on an attributable basis. In 2014, a material worsening of the pricing environment for iron ore has been in evidence, driven by revisions to the outlook for global GDP growth, especially in the context of weaker Chinese construction activity, whilst at the same time supply from Western Australia has ramped up to outstrip weakening demand. The value in use of Minas-Rio has been updated to reflect management’s best estimate of the future iron ore prices based on a detailed analysis of market fundamentals in the medium and long term. The long term price which is used in the valuation from 2024 onwards is within the range of published analyst forecasts and broadly in line with the mean.
The valuation of Minas-Rio at 31 December 2014 determined on a pre-tax discounted cash flow basis (real pre-tax discount rate of 8.5%) is $5.6 billion. Based on this valuation, the Group has recorded an impairment charge of $3,800 million (before tax) against the carrying value of the CGU. Of this charge, $971 million has been recorded against mining properties and $2,829 million against capital works in progress, with an associated deferred tax credit of $320 million. The post-tax impairment charge is $3,480 million. The valuation remains sensitive to price and further deterioration in long term prices may result in additional impairment.
FINANCIAL STATEMENTS AND OTHER FINANCIAL INFORMATION NOTES TO THE FINANCIAL STATEMENTS
NOTES TO THE CONSOLIDATED INCOME STATEMENT

Anglo American plc Annual Report 2014 125
Financial statements
6. SPECIAL ITEMS AND REMEASUREMENTS continuedCoalIn September 2014, the Group announced that it had decided, in view of the subdued hard coking coal price environment, to place Peace River Coal in British Columbia, Canada on care and maintenance to preserve the long term future of the operation. The recoverable amount of the Peace River Coal CGU has been assessed based on the operation’s fair value less costs of disposal, measured using discounted cash flow projections (see note 1).
Despite the decision to place the operation on care and maintenance, the decrease in hard coking coal prices has driven a decrease in the valuation of Peace River Coal to $0.1 billion. Based on this valuation, the Group has recorded an impairment charge of $265 million (before tax) against the carrying value of the CGU. The post-tax impairment charge is also $265 million. Of this charge, $124 million has been recorded against plant and equipment, $123 million against mining properties and the remainder against capital works in progress. The valuation remains sensitive to price and further deterioration in the pricing outlook may result in additional impairment. The long term hard coking coal price used in the valuation from 2019 onwards is within the range of published analyst forecasts and broadly in line with the mean. The remaining $98 million of the impairment charge recognised in special items ($69 million after tax) relates to other Coal assets in Australia.
PlatinumThe charge of $44 million relates to the closure of the declines at the Union operation in the Platinum business. The charge after tax and non-controlling interests is $21 million.
Restructuring costsRestructuring costs of $128 million principally relate to organisational changes as part of the Driving Value programme (2013: $177 million of which $146 million related to the implementation of the Platinum portfolio review). Restructuring costs after tax and non-controlling interests amount to $93 million.
2013Operating special items in 2013 principally comprised impairments and related charges in respect of the Barro Alto nickel project (Nickel), the Platinum portfolio review, the Michiquillay copper project (Copper), and the Foxleigh, Isibonelo and Kleinkopje coal operations (Coal).
Operating special items in 2013 also included charges relating to onerous contract provisions, principally at Callide (Coal), the reversal on sale of fair value uplifts recognised on inventories as part of the De Beers acquisition accounting, and costs associated with the Platinum portfolio review.
Operating remeasurementsOperating remeasurements reflect a net loss of $1 million (2013: $550 million) which principally comprises gains of $136 million in respect of derivatives related to capital expenditure in Iron Ore Brazil offset by a $129 million depreciation and amortisation charge (2013: $131 million) arising due to the fair value uplift on the pre-existing 45% shareholding in De Beers, which was required on acquisition of a controlling stake.
Derivatives in relation to Iron Ore Brazil which have been realised during the period had a cumulative net operating remeasurement loss of $140 million (2013: $137 million) since their inception.
Non-operating special itemsA charge of $222 million ($155 million after tax) has been recognised following the decision by the New South Wales Planning Assessment Committee (PAC) not to approve the Group’s application to proceed with the Drayton South project (Coal). The reserves of the existing Drayton operation are expected to be depleted during 2015 and the Drayton South project would have extended the life of the operation by approximately 27 years. Management is preparing a revised application for the project, to be submitted in the first half of 2015, and continues to work to allow operations to continue at Drayton. However, in view of the uncertainty caused by the PAC decision, assets associated with the project and the existing operation have been written down to their residual values, and a provision has been made for the cost of meeting contractual and other obligations beyond the life of the existing Drayton mine.
A $46 million charge has been recognised primarily in relation to the revaluation of deferred contingent consideration for the disposal of Amapá in 2013 (Corporate and other). The contingent consideration receivable is calculated on the basis of the market price for iron ore, which has seen a material worsening. There is no tax impact.
In November 2014, De Beers concluded the refinancing of its Black Economic Empowerment partner, Ponahalo Investments (RF) Proprietary Limited (Ponahalo), which owns a 26% share in De Beers’ principal South African subsidiary, De Beers Consolidated Mines (DBCM). The refinancing extended the period over which Ponahalo may repay borrowings that were used to finance the purchase of its share in DBCM in 2006 by seven years. A charge of $58 million has been recognised and no tax arises in relation to this transaction.
The Kumba Envision Trust charge of $44 million (2013: $54 million) relates to Kumba’s (Iron Ore and Manganese) broad based employee share scheme provided solely for the benefit of non-managerial Historically Disadvantaged South African employees who do not participate in other Kumba share schemes.
2013Non-operating special items in 2013 principally relate to the loss on disposal of Amapá, the Group’s exit from the Pebble project in Alaska (Copper), the loss recognised on the formation of the Lafarge Tarmac joint venture (Corporate and other), the Kumba Envision Trust charge, the gain on deferred proceeds of undeveloped coal assets in Australia (Coal) and the gain on disposal of the Group’s interest in Palabora Mining Company Limited (Corporate and other).
Financing special items and remeasurementsFinancing special items and remeasurements reflect a net gain of $36 million (2013: net loss of $130 million) principally comprising gains on derivatives relating to debt.
Special items and remeasurements taxTotal special items and remeasurements tax relating to subsidiaries and joint operations amounts to a credit of $2 million (2013: $587 million). This includes one-off tax charges of $105 million (2013: $188 million), tax credits on special items and remeasurements of $412 million (2013: $902 million) and tax remeasurement charges of $305 million (2013: $127 million).
One-off tax charges of $105 million comprise a $100 million charge for the derecognition of deferred tax assets at Peace River Coal (Coal), a $61 million charge for the derecognition of a deferred tax asset in Coal Australia relating to the Mineral Resource Rent Tax which was repealed in 2014, and a $56 million credit for the recognition of a deferred tax asset in Barro Alto.
Of the total tax credit of $2 million (2013: $587 million), $31 million relates to a current tax credit (2013: charge of $159 million) and $29 million relates to a deferred tax charge (2013: credit of $746 million).
FINANCIAL STATEMENTS AND OTHER FINANCIAL INFORMATION NOTES TO THE FINANCIAL STATEMENTS
NOTES TO THE CONSOLIDATED INCOME STATEMENT

126 Anglo American plc Annual Report 2014
7. NET FINANCE COSTSSee note 39b for the Group’s accounting policy on borrowing costs.
Net finance costs are presented net of hedges for respective interest bearing and foreign currency borrowings. The weighted average capitalisation rate applied to qualifying capital expenditure was 3.83% (2013: 4.79%).
US$ million 2014 2013Investment incomeInterest income from cash and cash equivalents 128 113 Other interest income 88 134 Net interest income on defined benefit arrangements 14 13 Dividend income from financial asset investments 25 18
255 278 Less: interest income capitalised (13) (7) Total investment income(1) 242 271
Interest expenseInterest and other finance expense (709) (731) Net interest cost on defined benefit arrangements (69) (74) Unwinding of discount relating to provisions (101) (106)
(879) (911) Less: interest expense capitalised 382 327 Total interest expense(1) (497) (584)
Other net financing (losses)/gainsNet foreign exchange losses (37) (21) Other net fair value gains 36 58 Total other net financing (losses)/gains (1) 37 Net finance costs before special items and remeasurements (256) (276)
Special items and remeasurements (note 6) 36 (130) Net finance costs after special items and remeasurements (220) (406)
(1) Interest income recognised at amortised cost is $152 million (2013: $172 million) and interest expense recognised at amortised cost is $286 million (2013: $324 million).
8. INCOME TAX EXPENSESee note 39c for the Group’s accounting policy on tax.
a) Analysis of charge for the yearUS$ million 2014 2013United Kingdom corporation tax credit (14) (1) South Africa tax 479 863 Other overseas tax 712 692 Prior year adjustments (68) 32 Current tax(1) 1,109 1,586 Deferred tax 158 275 Income tax expense before special items and remeasurements 1,267 1,861 Special items and remeasurements tax (2) (587) Income tax expense 1,265 1,274
(1) Includes royalties which meet the definition of income tax and are in addition to royalties recorded in operating costs.
FINANCIAL STATEMENTS AND OTHER FINANCIAL INFORMATION NOTES TO THE FINANCIAL STATEMENTS
NOTES TO THE CONSOLIDATED INCOME STATEMENT

Anglo American plc Annual Report 2014 127
Financial statements
8. INCOME TAX EXPENSE continuedb) Factors affecting tax charge for the yearThe effective tax rate for the year of (488.4)% (2013: 74.9%) is lower (2013: higher) than the applicable weighted average statutory rate of corporation tax in the United Kingdom of 21.5% (2013: 23.25%). The reconciling items, excluding the impact of associates and joint ventures, are:
US$ million 2014 2013(Loss)/profit before tax (259) 1,700 Less: share of net income from associates and joint ventures (208) (168) (Loss)/profit before tax (excluding associates and joint ventures) (467) 1,532 Tax on (loss)/profit (excluding associates and joint ventures) calculated at United Kingdom corporation tax rate of 21.5% (2013: 23.25%)
(100) 356
Tax effects of:Items non-taxable/deductible for tax purposesExploration expenditure 18 22 Non-taxable net foreign exchange gains (12) (16) Non-taxable net interest income (8) (9) Other non-deductible expenses 72 110 Other non-taxable income (138) (105)
Temporary difference adjustmentsCurrent year losses not recognised 79 25 Recognition of losses not previously recognised (143) (6) Utilisation of losses not previously recognised (13) (8)Write-off of losses previously recognised 65 29Adjustment in deferred tax due to change in tax rate 106 14Other temporary differences 95 (28)
Special items and remeasurements 1,014 427
Other adjustmentsSecondary tax on companies and dividend withholding taxes 193 242 Effect of differences between local and United Kingdom tax rates 106 173 Prior year adjustments to current tax (68) 31 Other adjustments (1) 17 Income tax expense 1,265 1,274
IAS 1 requires income from associates and joint ventures to be presented net of tax on the face of the income statement. Associates’ and joint ventures’ tax is therefore not included within the Group’s income tax expense. Associates’ and joint ventures’ tax included within ‘Share of net income from associates and joint ventures’ for the year ended 31 December 2014 is $159 million (2013: $155 million). Excluding special items and remeasurements this becomes $113 million (2013: $158 million).
The effective tax rate before special items and remeasurements including attributable share of associates’ and joint ventures’ tax for the year ended 31 December 2014 was 29.8%. This is lower than the equivalent effective tax rate of 32.0% for the year ended 31 December 2013 due to the impact of certain prior year adjustments, the remeasurement of withholding tax provisions across the Group and the recognition of previously unrecognised losses. In future periods it is expected that the effective tax rate will remain above the United Kingdom statutory tax rate.
c) Tax amounts included in other comprehensive incomeAn analysis of tax by individual item presented in the Consolidated statement of comprehensive income is presented below:
US$ million 2014 2013Tax credit/(charge) on items recognised directly in equity that will not be reclassified to the income statementRemeasurement of net retirement benefit obligation 9 (37)
Tax credit/(charge) on items recognised directly in equity that may subsequently be reclassified to the income statementNet exchange differences on translation of foreign operations (15) 156 Net loss on revaluation of available for sale investments 26 13 Net loss on cash flow hedges 4 4
24 136Tax credit on items transferred from equityTransferred to income statement: disposal of available for sale investments – 12Transferred to initial carrying amount of hedged items: cash flow hedges 1 –
1 12
d) Tax amounts recognised directly in equityNo significant amounts of tax have been charged directly to equity in 2014 (2013: a deferred tax credit of $106 million and current tax charge of $106 million were recognised directly in equity in relation to the disposal of a 24.5% interest in Anglo American Sur SA in 2011).
FINANCIAL STATEMENTS AND OTHER FINANCIAL INFORMATION NOTES TO THE FINANCIAL STATEMENTS
NOTES TO THE CONSOLIDATED INCOME STATEMENT

128 Anglo American plc Annual Report 2014
9. EARNINGS PER SHARE
US$ 2014 2013Loss per shareBasic (1.96) (0.75) Diluted (1.96) (0.75) Headline earnings per shareBasic 1.20 1.02 Diluted 1.19 1.02 Underlying earnings per shareBasic 1.73 2.09 Diluted 1.72 2.08
Basic and diluted earnings per share are shown based on headline earnings, a Johannesburg Stock Exchange (JSE) defined performance measure, and underlying earnings (explained in note 5) which the directors consider to be a useful additional measure of the Group’s performance.
The calculation of basic and diluted earnings per share is based on the following data:
Loss attributable to equity shareholders of the Company Headline earnings Underlying earnings
2014 2013 2014 2013 2014 2013(Loss)/earnings (US$ million)Basic and diluted (loss)/earnings (2,513) (961) 1,535 1,312 2,217 2,673 Number of shares (million)Basic number of ordinary shares outstanding 1,284 1,281 1,284 1,281 1,284 1,281 Effect of dilutive potential ordinary shares:
Share options and awards – – 5 4 5 4 Diluted number of ordinary shares outstanding 1,284 1,281 1,289 1,285 1,289 1,285
Diluted earnings per share is calculated by adjusting the weighted average number of ordinary shares in issue on the assumption of conversion of all potentially dilutive ordinary shares. Potential ordinary shares shall be treated as dilutive when, and only when, their conversion to ordinary shares would decrease earnings per share or increase loss per share from continuing operations.
Basic loss per share is equal to diluted loss per share as all 18,431,061 (2013: 16,688,080) potential ordinary shares are anti-dilutive and 178,808 (2013: 134,679) have been excluded from the calculation of diluted headline earnings per share and diluted underlying earnings per share as they are anti-dilutive.
Basic and diluted number of ordinary shares outstanding represent the weighted average for the year. The average number of ordinary shares in issue excludes shares held by employee benefit trusts and Anglo American plc shares held by Group companies.
The calculation of basic and diluted earnings per share, based on headline and underlying earnings, uses the following earnings data:
US$ million 2014 2013Loss for the financial year attributable to equity shareholders of the Company (2,513) (961) Operating special items 4,268 2,491 Operating special items – tax (362) (569) Operating special items – non-controlling interests (16) (53) Non-operating special items 218 456 Non-operating special items – tax (51) 10 Non-operating special items – non-controlling interests (9) (62) Headline earnings for the financial year 1,535 1,312 Operating special items(1) 106 800 Operating remeasurements 1 550 Non-operating special items(2) 167 13 Financing special items and remeasurements (36) 130 Tax special items 105 188 Special items and remeasurements tax 352 (219) Non-controlling interests on special items and remeasurements (13) (101) Underlying earnings for the financial year 2,217 2,673
(1) Includes restructuring costs (2013: onerous contract provisions, restructuring costs and the reversal of the inventory uplift in De Beers).(2) Principally relates to the Kumba Envision Trust and Ponahalo refinancing (2013: Kumba Envision Trust and elements of the Atlatsa refinancing).
FINANCIAL STATEMENTS AND OTHER FINANCIAL INFORMATION NOTES TO THE FINANCIAL STATEMENTS
NOTES TO THE CONSOLIDATED INCOME STATEMENT

Anglo American plc Annual Report 2014 129
Financial statements
10. DIVIDENDSDividends payable during the year are as follows:
US$ million 2014 2013Final ordinary dividend for 2013 – 53 US cents per ordinary share (2012: 53 US cents per ordinary share) 696 672 Interim ordinary dividend for 2014 – 32 US cents per ordinary share (2013: 32 US cents per ordinary share) 403 406
1,099(1) 1,078(1)
(1) Of this, $620 million (2013: $618 million) was recognised in the parent company.
Total dividends paid during the year were $1,099 million (2013: $1,078 million).
The directors are proposing a final dividend in respect of the financial year ended 31 December 2014 of 53 US cents per share. This will result in an estimated distribution of $678 million of shareholders’ funds, of which $421 million will be distributed by the parent company. These financial statements do not reflect this dividend payable as it is still subject to shareholder approval.
The employee benefit trust has waived the right to receive dividends on the shares it holds (see note 32).
11. INTANGIBLE ASSETSSee notes 39d, 39e and 39i for the Group’s accounting policy on intangible assets.
2014 2013
US$ million
Brands, contracts and other
intangibles(1) Goodwill Total
Brands,contracts and other
intangibles(1) Goodwill TotalNet book valueAt 1 January 1,415 2,668 4,083 1,615 2,954 4,569 Additions 22 – 22 15 – 15 Amortisation charge for the year(2) (65) – (65) (79) – (79) Impairments – – – (2) – (2)Remeasurements – 46 46 – (18) (18)Currency movements (13) (161) (174) (134) (268) (402) At 31 December 1,359 2,553 3,912 1,415 2,668 4,083
Cost 1,592 2,553 4,145 1,599 2,668 4,267 Accumulated amortisation (233) – (233) (184) – (184)
(1) Includes brands, contracts and other intangibles of $1,308 million (2013: $1,380 million) relating to De Beers, principally comprising assets that were recognised at fair value on acquisition of a controlling interest in De Beers in August 2012. Of these, $517 million (2013: $517 million) have indefinite useful lives.
(2) Includes $19 million (2013: $20 million) of amortisation arising due to the fair value uplift of the Group’s pre-existing 45% shareholding in De Beers. This has been included within operating remeasurements (see note 6).
Impairment tests for goodwillSee note 39f for the Group’s accounting policy on impairment of goodwill.
Goodwill is allocated for impairment testing purposes to cash generating units (CGUs) or groups of CGUs which reflect how it is monitored for internal management purposes. This allocation largely represents the Group’s segments. Any goodwill associated with CGUs subsumed within these segments is not significant when compared to the goodwill of the Group. The allocation of goodwill to CGUs or groups of CGUs is as follows:
US$ million 2014 2013Coal South Africa 88 88 Copper 124 124 Platinum 230 230 De Beers 1,895 2,056 Other 216 170
2,553 2,668
For the purposes of goodwill impairment testing, the recoverable amount of each of the CGUs or group of CGUs has been determined based on a fair value less costs of disposal basis. The key assumptions used in determining fair value less costs of disposal are set out in note 1. Management believes that any reasonably possible change in a key assumption on which the recoverable amounts are based would not cause the carrying amounts to exceed their recoverable amounts.
FINANCIAL STATEMENTS AND OTHER FINANCIAL INFORMATION NOTES TO THE FINANCIAL STATEMENTS
NOTES TO THE CONSOLIDATED BALANCE SHEET

130 Anglo American plc Annual Report 2014
12. PROPERTY, PLANT AND EQUIPMENTSee notes 39g to 39j for the Group’s accounting policies on property, plant and equipment.
2014 2013
US$ million
Mining propertiesand leases(1)
Land and buildings(2)
Plant and equipment
Capital worksin progress Total
Mining propertiesand leases(1)
Land and buildings(2)
Plant and equipment
Capital worksin progress Total
Net book valueAt 1 January 14,996 3,030 11,530 11,949 41,505 17,301 2,996 14,268 10,166 44,731Additions 596 46 311 5,452 6,405 827 43 209 5,818 6,897 Depreciation charge for the year(3) (1,065) (161) (1,534) – (2,760) (1,125) (135) (1,530) – (2,790) Impairments (1,242) (26) (213) (2,935) (4,416) (959) (147) (817) (401) (2,324) Disposal of assets (3) (20) (30) (3) (56) (286) (10) (52) (106) (454) Reclassifications 859 345 1,573 (2,777) – 1,432 599 780 (2,811) – Currency movements (1,123) (147) (522) (411) (2,203) (2,194) (316) (1,328) (717) (4,555) At 31 December 13,018 3,067 11,115 11,275 38,475 14,996 3,030 11,530 11,949 41,505
Cost 24,206 4,307 21,525 14,497 64,535 24,334 4,191 21,263 12,279 62,067 Accumulated depreciation (11,188) (1,240) (10,410) (3,222) (26,060) (9,338) (1,161) (9,733) (330) (20,562)
(1) Additions to mining properties and leases include amounts of $524 million (2013: $382 million) in relation to deferred stripping. (2) Net book value principally comprises freehold land and buildings.(3) Includes $2,545 million (2013: $2,579 million) of depreciation within operating profit, $110 million (2013: $111 million) of depreciation arising due to the fair value uplift on the pre-existing 45%
shareholding in De Beers which has been included within operating remeasurements (see note 6), and $105 million (2013: $100 million) of pre-commercial production depreciation which has been capitalised.
For information on the impairments recorded in the year see note 6.
Included in the additions is $369 million (2013: $320 million) of net interest expense incurred on borrowings funding the construction of qualifying assets which has been capitalised during the year.
Assets held under finance leases relate to plant and equipment with a net book value of $70 million (2013: $50 million), of which depreciation charges in the year amounted to $13 million (2013: $13 million).
13. INVESTMENTS IN ASSOCIATES AND JOINT VENTURESSee note 39k for the Group’s accounting policy on associates and joint arrangements, which includes joint ventures.
Details of principal associates and joint ventures are set out in note 37. 2014 2013
US$ million AssociatesJoint
ventures Total AssociatesJoint
ventures TotalAt 1 January 2,936 1,676 4,612 3,063 99 3,162Share of net income/(loss) from associates and joint ventures 140 68 208 238 (70) 168 Dividends received (432) (3) (435) (242) (4) (246) Investment in equity and capitalised loans 125 25 150 175 46 221 Repayment of capitalised loans – – – (108) – (108) Acquired through formation of joint ventures (note 29) – – – – 1,658 1,658 Impairment – – – – (98) (98) Other movements 1 28 29 – – – Currency movements (89) (99) (188) (190) 45 (145) At 31 December(2) 2,681 1,695 4,376 2,936 1,676 4,612
(1) Includes non-cash investment of $69 million relating to the refinancing of Atlatsa Resources Corporation (see note 35).(2) The fair value of the Group’s investment in its associate Atlatsa Resources Corporation at 31 December 2014 was $25 million (2013: $64 million).
The Group’s total investments in associates and joint ventures comprise:2014 2013
US$ million AssociatesJoint
ventures Total AssociatesJoint
ventures TotalEquity 2,294 1,695 3,989 2,553 1,676 4,229 Loans(1) 387 – 387 383 – 383
2,681 1,695 4,376 2,936 1,676 4,612
(1) The Group’s total investments in associates include long term loans which in substance form part of the Group’s net investment. These loans are not repayable in the foreseeable future.
(1)
FINANCIAL STATEMENTS AND OTHER FINANCIAL INFORMATION NOTES TO THE FINANCIAL STATEMENTS
NOTES TO THE CONSOLIDATED BALANCE SHEET

Anglo American plc Annual Report 2014 131
Financial statements
13. INVESTMENTS IN ASSOCIATES AND JOINT VENTURES continuedNone of the Group’s associates or joint ventures are considered to be individually material to the Group. We have therefore disclosed the Group’s share of the financial information of associates and joint ventures on an aggregated basis.
2014 2013
US$ million AssociatesJoint
ventures Total AssociatesJoint
ventures TotalNon-current assets 2,742 2,035 4,777 2,900 2,049 4,949 Current assets 924 626 1,550 1,234 725 1,959 Current liabilities (363) (557) (920) (451) (785) (1,236) Non-current liabilities (622) (409) (1,031) (747) (313) (1,060) Net assets 2,681 1,695 4,376 2,936 1,676 4,612
Revenue 2,101 1,814 3,915 2,238 1,483 3,721 Share of net income/(loss) from associates and joint ventures 140 68 208 238 (70) 168 Total comprehensive income/(expense) 141 68 209 238 (70) 168
Segmental information is provided in aggregate for associates and joint ventures in the table below. Refer to note 3 for changes in reporting segments. Comparatives have been reclassified to align with current year presentation.
Aggregate investmentUS$ million 2014 2013Iron Ore and Manganese 867 907 Coal 1,225 1,417Platinum 659 648 De Beers 33 29 Corporate and other 1,592 1,611
4,376 4,612
14. FINANCIAL ASSET INVESTMENTSSee notes 39l and 39m for the Group’s accounting policies on financial asset investments.
2014 2013
US$ millionLoans and
receivables
Available for sale
investments TotalLoans and
receivables
Available for sale
investments TotalAt 1 January 759 706 1,465 1,427 1,064 2,491Additions – 12 12 – – –Interest receivable 52 – 52 37 – 37 Net loans granted/(repaid)(1) 33 – 33 (424) – (424) Disposals – – – (9) (99) (108) Movements in fair value (1) (150) (151) (37) (69) (106) Currency movements (82) (63) (145) (235) (190) (425) At 31 December 761 505 1,266 759 706 1,465
(1) Includes net non-cash settlements of $47 million (2013: $123 million) relating to the refinancing of Atlatsa Resources Corporation (see note 35).
Maturity analysis of financial asset investments is as follows:
US$ million 2014 2013Current – 19 Non-current 1,266 1,446
1,266 1,465
FINANCIAL STATEMENTS AND OTHER FINANCIAL INFORMATION NOTES TO THE FINANCIAL STATEMENTS
NOTES TO THE CONSOLIDATED BALANCE SHEET

132 Anglo American plc Annual Report 2014
15. INVENTORIESSee note 39q for the Group’s accounting policy on inventories.
US$ million 2014 2013Raw materials and consumables 1,087 915 Work in progress 1,445 1,496 Finished products 2,188 2,378
4,720 4,789
The cost of inventories recognised as an expense and included in cost of sales amounted to $17,779 million (2013: $17,929 million). In 2013, an additional $126 million was recognised as an expense within operating special items relating to the reversal of fair value uplifts on De Beers inventory.
Inventories held at net realisable value amounted to $1,014 million (2013: $308 million).
Write-down of inventories (net of revaluation of provisionally priced purchases) amounted to $153 million (2013: $58 million).
16. TRADE AND OTHER RECEIVABLESTrade receivables do not incur any interest, are principally short term in nature and are measured at their nominal value (with the exception of receivables relating to provisionally priced sales, as set out in the revenue recognition accounting policy, see note 39a), net of appropriate provision for estimated irrecoverable amounts. Such provisions are raised based on an assessment of debtor ageing, past experience or known customer circumstances.
2014 2013
US$ millionDue within
one yearDue after one year Total
Due within one year
Due after one year Total
Trade receivables 1,807 161 1,968 2,596 235 2,831Other receivables 604 526 1,130 541 502 1,043Prepayments 157 58 215 214 60 274
2,568 745 3,313 3,351 797 4,148
The historical level of customer default is minimal and as a result the credit quality of year end trade receivables is considered to be high. Of the year end trade receivables balance, $61 million (2013: $65 million) were past due at 31 December, stated after an associated impairment provision of $30 million (2013: $19 million). The overdue debtor ageing profile is typical of the industry in which certain of the Group’s businesses operate. Given this, the use of payment security instruments (including letters of credit from acceptable financial institutions), and the nature of the related counterparties, these amounts are considered recoverable.
17. TRADE AND OTHER PAYABLESTrade payables are not interest bearing and are measured at their nominal value with the exception of amounts relating to purchases of provisionally priced concentrate which are marked to market (using the appropriate forward price) until settled.
US$ million 2014 2013Trade payables 1,931 2,364 Tax and social security 99 100 Other payables 478 903 Accruals and deferred income(1) 1,032 1,024
3,540 4,391
(1) Includes $25 million (2013: $22 million) of deferred income recorded within non-current liabilities.
FINANCIAL STATEMENTS AND OTHER FINANCIAL INFORMATION NOTES TO THE FINANCIAL STATEMENTS
NOTES TO THE CONSOLIDATED BALANCE SHEET

Anglo American plc Annual Report 2014 133
Financial statements
18. FINANCIAL INSTRUMENTSSee notes 39m and 39n for the Group’s accounting policies on impairment of financial assets, derivative financial instruments and hedge accounting.
The carrying amounts of financial assets and financial liabilities are as shown below. Where the carrying amount of a financial asset or liability does not approximate its fair value, this is also disclosed.
For financial assets and liabilities which are traded on an active market, such as listed investments or listed debt instruments, fair value is determined by reference to market value. For non-traded financial assets and liabilities, fair value is calculated using discounted cash flows, considered to be reasonable and consistent with those that would be used by a market participant, and based on observable market data where available, unless carrying value is considered to approximate fair value.
All derivatives that have been designated into hedge relationships have been separately disclosed. Comparatives have been reclassified to align with current year presentation.
2014
US$ million
At fair value through profit
and lossLoans and
receivablesAvailable
for saleDesignated into hedges
Financial liabilities at
amortised cost TotalFinancial assets
Trade and other receivables(1) 912 1,553 – – – 2,465 Derivative financial assets(2) 153 – – 980 – 1,133 Cash and cash equivalents – 6,748 – – – 6,748 Financial asset investments – 761 505 – – 1,266
1,065 9,062 505 980 – 11,612 Financial liabilities
Trade and other payables(1) (314) – – – (3,073) (3,387) Derivative financial liabilities(2) (2,277) – – (47) – (2,324) Borrowings(3) – – – (15,048) (3,487) (18,535)
(2,591) – – (15,095) (6,560) (24,246) Net financial assets/(liabilities) (1,526) 9,062 505 (14,115) (6,560) (12,634)
2013
US$ million
At fair value through profit
and lossLoans and
receivablesAvailable
for saleDesignated into hedges
Financial liabilities at
amortised cost TotalFinancial assets
Trade and other receivables(1) 1,652 2,222 – – – 3,874Derivative financial assets(2) 312 – – 362 – 674Cash and cash equivalents – 7,704 – – – 7,704Financial asset investments – 759 706 – – 1,465
1,964 10,685 706 362 – 13,717Financial liabilities
Trade and other payables(1) (279) – – – (3,923) (4,202) Derivative financial liabilities(2) (1,361) – – (150) – (1,511) Borrowings(3) – – – (14,619) (3,229) (17,848)
(1,640) – – (14,769) (7,152) (23,561) Net financial assets/(liabilities) 324 10,685 706 (14,407) (7,152) (9,844)
(1) Trade and other receivables exclude prepayments and tax receivables. Trade and other payables exclude tax and social security and deferred income.(2) Derivative instruments are analysed between those which are ‘Held for trading’ and those designated into hedge relationships in note 19.(3) Borrowings designated in fair value hedges represent listed debt. The fair value of these borrowings is $15,339 million (2013: $14,907 million), which is based on the quoted market price
and consequently categorised as level 1 in the fair value hierarchy. For the majority of borrowings at amortised cost the carrying value is considered to approximate the fair value. In certain circumstances the fair value of borrowings at amortised cost is based on management’s estimates of future cash flows and consequently the valuation is categorised as level 3 in the fair value hierarchy.
FINANCIAL STATEMENTS AND OTHER FINANCIAL INFORMATION NOTES TO THE FINANCIAL STATEMENTS
NOTES TO THE CONSOLIDATED BALANCE SHEET
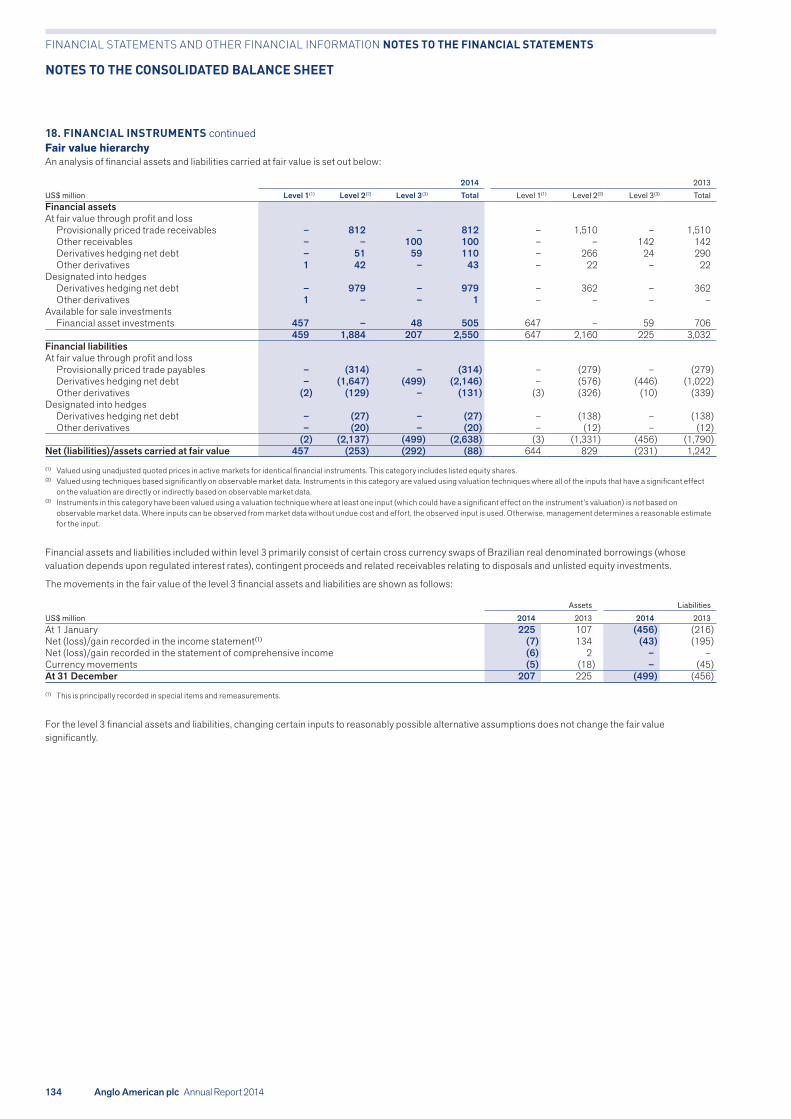
134 Anglo American plc Annual Report 2014
18. FINANCIAL INSTRUMENTS continued Fair value hierarchyAn analysis of financial assets and liabilities carried at fair value is set out below:
2014 2013US$ million Level 1(1) Level 2(2) Level 3(3) Total Level 1(1) Level 2(2) Level 3(3) TotalFinancial assetsAt fair value through profit and loss
Provisionally priced trade receivables – 812 – 812 – 1,510 – 1,510 Other receivables – – 100 100 – – 142 142 Derivatives hedging net debt – 51 59 110 – 266 24 290 Other derivatives 1 42 – 43 – 22 – 22
Designated into hedgesDerivatives hedging net debt – 979 – 979 – 362 – 362 Other derivatives 1 – – 1 – – – –
Available for sale investmentsFinancial asset investments 457 – 48 505 647 – 59 706
459 1,884 207 2,550 647 2,160 225 3,032 Financial liabilitiesAt fair value through profit and loss
Provisionally priced trade payables – (314) – (314) – (279) – (279) Derivatives hedging net debt – (1,647) (499) (2,146) – (576) (446) (1,022) Other derivatives (2) (129) – (131) (3) (326) (10) (339)
Designated into hedgesDerivatives hedging net debt – (27) – (27) – (138) – (138) Other derivatives – (20) – (20) – (12) – (12)
(2) (2,137) (499) (2,638) (3) (1,331) (456) (1,790) Net (liabilities)/assets carried at fair value 457 (253) (292) (88) 644 829 (231) 1,242
(1) Valued using unadjusted quoted prices in active markets for identical financial instruments. This category includes listed equity shares.(2) Valued using techniques based significantly on observable market data. Instruments in this category are valued using valuation techniques where all of the inputs that have a significant effect
on the valuation are directly or indirectly based on observable market data.(3) Instruments in this category have been valued using a valuation technique where at least one input (which could have a significant effect on the instrument’s valuation) is not based on
observable market data. Where inputs can be observed from market data without undue cost and effort, the observed input is used. Otherwise, management determines a reasonable estimate for the input.
Financial assets and liabilities included within level 3 primarily consist of certain cross currency swaps of Brazilian real denominated borrowings (whose valuation depends upon regulated interest rates), contingent proceeds and related receivables relating to disposals and unlisted equity investments.
The movements in the fair value of the level 3 financial assets and liabilities are shown as follows:
Assets Liabilities
US$ million 2014 2013 2014 2013At 1 January 225 107 (456) (216) Net (loss)/gain recorded in the income statement(1) (7) 134 (43) (195) Net (loss)/gain recorded in the statement of comprehensive income (6) 2 – –Currency movements (5) (18) – (45) At 31 December 207 225 (499) (456)
(1) This is principally recorded in special items and remeasurements.
For the level 3 financial assets and liabilities, changing certain inputs to reasonably possible alternative assumptions does not change the fair value significantly.
FINANCIAL STATEMENTS AND OTHER FINANCIAL INFORMATION NOTES TO THE FINANCIAL STATEMENTS
NOTES TO THE CONSOLIDATED BALANCE SHEET
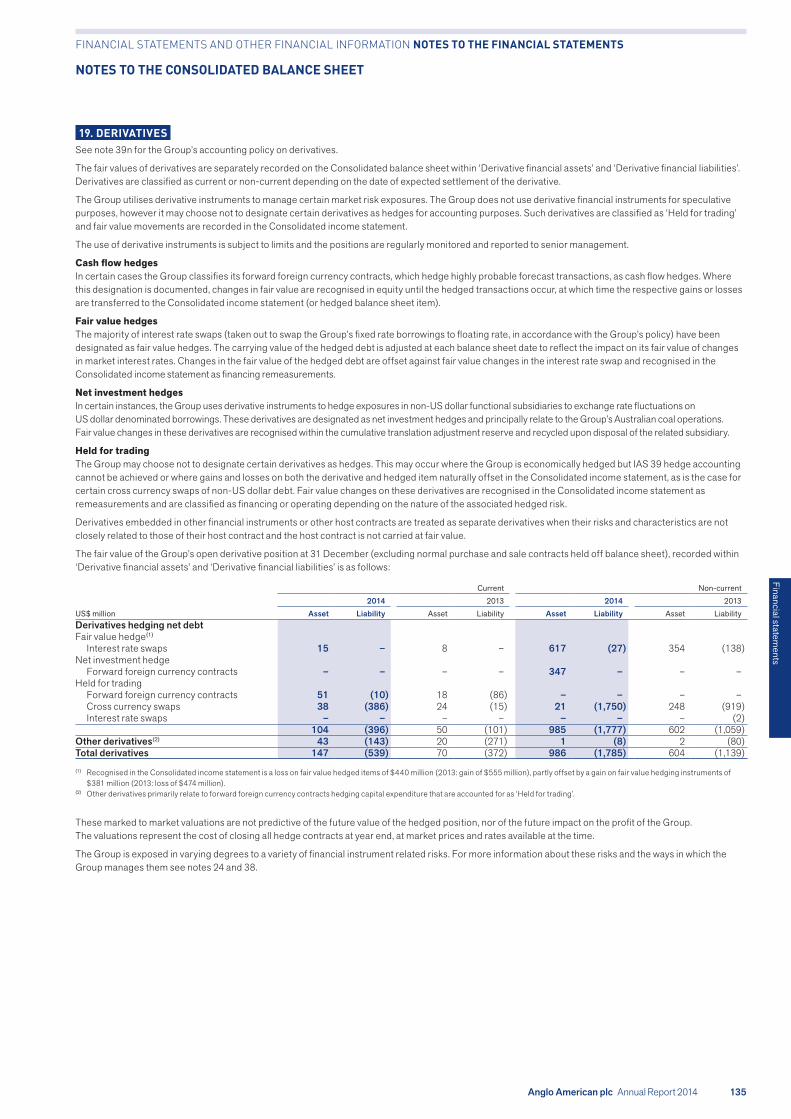
Anglo American plc Annual Report 2014 135
Financial statements
19. DERIVATIVESSee note 39n for the Group’s accounting policy on derivatives.
The fair values of derivatives are separately recorded on the Consolidated balance sheet within ‘Derivative financial assets’ and ‘Derivative financial liabilities’. Derivatives are classified as current or non-current depending on the date of expected settlement of the derivative.
The Group utilises derivative instruments to manage certain market risk exposures. The Group does not use derivative financial instruments for speculative purposes, however it may choose not to designate certain derivatives as hedges for accounting purposes. Such derivatives are classified as ‘Held for trading’ and fair value movements are recorded in the Consolidated income statement.
The use of derivative instruments is subject to limits and the positions are regularly monitored and reported to senior management.
Cash flow hedgesIn certain cases the Group classifies its forward foreign currency contracts, which hedge highly probable forecast transactions, as cash flow hedges. Where this designation is documented, changes in fair value are recognised in equity until the hedged transactions occur, at which time the respective gains or losses are transferred to the Consolidated income statement (or hedged balance sheet item).
Fair value hedgesThe majority of interest rate swaps (taken out to swap the Group’s fixed rate borrowings to floating rate, in accordance with the Group’s policy) have been designated as fair value hedges. The carrying value of the hedged debt is adjusted at each balance sheet date to reflect the impact on its fair value of changes in market interest rates. Changes in the fair value of the hedged debt are offset against fair value changes in the interest rate swap and recognised in the Consolidated income statement as financing remeasurements.
Net investment hedgesIn certain instances, the Group uses derivative instruments to hedge exposures in non-US dollar functional subsidiaries to exchange rate fluctuations on US dollar denominated borrowings. These derivatives are designated as net investment hedges and principally relate to the Group’s Australian coal operations. Fair value changes in these derivatives are recognised within the cumulative translation adjustment reserve and recycled upon disposal of the related subsidiary.
Held for tradingThe Group may choose not to designate certain derivatives as hedges. This may occur where the Group is economically hedged but IAS 39 hedge accounting cannot be achieved or where gains and losses on both the derivative and hedged item naturally offset in the Consolidated income statement, as is the case for certain cross currency swaps of non-US dollar debt. Fair value changes on these derivatives are recognised in the Consolidated income statement as remeasurements and are classified as financing or operating depending on the nature of the associated hedged risk.
Derivatives embedded in other financial instruments or other host contracts are treated as separate derivatives when their risks and characteristics are not closely related to those of their host contract and the host contract is not carried at fair value.
The fair value of the Group’s open derivative position at 31 December (excluding normal purchase and sale contracts held off balance sheet), recorded within ‘Derivative financial assets’ and ‘Derivative financial liabilities’ is as follows:
Current Non-current2014 2013 2014 2013
US$ million Asset Liability Asset Liability Asset Liability Asset LiabilityDerivatives hedging net debtFair value hedge(1)
Interest rate swaps 15 – 8 – 617 (27) 354 (138) Net investment hedge
Forward foreign currency contracts – – – – 347 – – –Held for trading
Forward foreign currency contracts 51 (10) 18 (86) – – – –Cross currency swaps 38 (386) 24 (15) 21 (1,750) 248 (919) Interest rate swaps – – – – – – – (2)
104 (396) 50 (101) 985 (1,777) 602 (1,059) Other derivatives(2) 43 (143) 20 (271) 1 (8) 2 (80) Total derivatives 147 (539) 70 (372) 986 (1,785) 604 (1,139)
(1) Recognised in the Consolidated income statement is a loss on fair value hedged items of $440 million (2013: gain of $555 million), partly offset by a gain on fair value hedging instruments of $381 million (2013: loss of $474 million).
(2) Other derivatives primarily relate to forward foreign currency contracts hedging capital expenditure that are accounted for as ‘Held for trading’.
These marked to market valuations are not predictive of the future value of the hedged position, nor of the future impact on the profit of the Group. The valuations represent the cost of closing all hedge contracts at year end, at market prices and rates available at the time.
The Group is exposed in varying degrees to a variety of financial instrument related risks. For more information about these risks and the ways in which the Group manages them see notes 24 and 38.
FINANCIAL STATEMENTS AND OTHER FINANCIAL INFORMATION NOTES TO THE FINANCIAL STATEMENTS
NOTES TO THE CONSOLIDATED BALANCE SHEET

136 Anglo American plc Annual Report 2014
20. PROVISIONS FOR LIABILITIES AND CHARGESSee note 39r for the Group’s accounting policy on environmental restoration and decommissioning obligations.
US$ millionEnvironmental
restoration DecommissioningEmployee
benefitsOnerous
contracts Other TotalAt 1 January 2014 1,155 488 418 702 693 3,456 Charged to the income statement 40 8 242 38 214 542 Capitalised 18 106 – – 63 187 Unwinding of discount 57 33 2 65 9 166 Amounts applied (27) (2) (183) (92) (194) (498) Unused amounts reversed (53) (11) (12) – (53) (129) Currency movements (100) (27) (30) (69) (10) (236) At 31 December 2014 1,090 595 437 644 722 3,488 Current 21 3 383 67 206 680 Non-current 1,069 592 54 577 516 2,808
Environmental restorationThe Group has an obligation to undertake restoration, rehabilitation and environmental work when environmental disturbance is caused by the development or ongoing production of a mining property. A provision is recognised for the present value of such costs, based on management’s best estimate of the legal and constructive obligations incurred. These estimates reflect industry best practice and currently applicable legislation. Significant changes in legislation could result in changes in provisions recognised. It is anticipated that these costs will be incurred over a period in excess of 20 years.
DecommissioningProvision is made for the present value of costs relating to the decommissioning of plant or other site restoration work. It is anticipated that these costs will be incurred over a period in excess of 20 years.
Employee benefitsProvision is made for statutory or contractual employee entitlements including long service leave, annual leave, sickness pay and similar obligations. It is anticipated that these costs will be incurred when employees choose to take their benefits.
Onerous contractsProvision is made for the present value of certain long term contracts where the unavoidable cost of meeting the Group’s obligations is expected to exceed the benefits to be received. It is anticipated these costs will be incurred over a period of up to 16 years.
OtherOther provisions primarily relate to restructuring costs, indemnities, legal and other claims. It is anticipated that the majority of these costs will be incurred over a five year period.
Environmental rehabilitation trustsThe Group makes contributions to controlled funds that were established to meet the cost of some of its restoration and environmental rehabilitation liabilities, primarily in South Africa. The funds comprise the following investments:
US$ million 2014 2013Equity 139 149 Bonds 155 134 Cash 64 65
358 348
These assets are primarily denominated in South African rand. Cash is held in short term fixed deposits or earns interest at floating inter-bank rates. Bonds earn interest at a weighted average fixed rate of 8.2% (2013: 8.2%) for an average period of four years (2013: five years). Equity investments are recorded at fair value through profit and loss and bonds are recorded at amortised cost.
These funds are not available for the general purposes of the Group. All income from these assets is reinvested to meet specific environmental obligations. These obligations are included in provisions stated above.
FINANCIAL STATEMENTS AND OTHER FINANCIAL INFORMATION NOTES TO THE FINANCIAL STATEMENTS
NOTES TO THE CONSOLIDATED BALANCE SHEET

Anglo American plc Annual Report 2014 137
Financial statements
21. DEFERRED TAXSee note 39c for the Group’s accounting policy on tax.
The movement in net deferred tax liabilities during the year is as follows:
US$ million 2014 2013At 1 January (3,293) (4,847)(Charged)/credited to the income statement (187) 471 Credited to the statement of comprehensive income 25 148 Credited directly to equity – 106Currency movements 308 829 At 31 December (3,147) (3,293) Comprising:Deferred tax assets 1,351 1,364 Deferred tax liabilities (4,498) (4,657)
The amount of deferred tax recognised in the Consolidated balance sheet is as follows:
US$ million 2014 2013Deferred tax assetsTax losses 573 593 Post employment benefits 66 71 Share-based payments 13 5 Enhanced tax depreciation 653 414 Other temporary differences 46 281
1,351 1,364 Deferred tax liabilitiesCapital allowances in excess of depreciation (2,845) (2,871) Fair value adjustments (1,068) (1,476) Tax losses 53 29 Derivatives 3 4 Provisions 255 436 Withholding tax (568) (570) Other temporary differences (328) (209)
(4,498) (4,657)
The amount of deferred tax (charged)/credited to the Consolidated income statement is as follows:
US$ million 2014 2013Capital allowances in excess of depreciation (523) (238) Fair value adjustments 12 73 Tax losses 20 187 Derivatives (39) 220 Provisions (14) 134 Withholding tax 2 (3) Other temporary differences 355 98
(187) 471
The Group has the following balances in respect of which no deferred tax asset has been recognised:
2014 2013
US$ million
Tax losses – revenue
Tax losses –
capital
Other temporary
differences Total
Tax losses – revenue
Tax losses –
capital
Other temporary
differences TotalExpiry dateWithin one year 3 – – 3 16 – – 16 Greater than one year, less than five years 420 – – 420 294 – – 294 Greater than five years 297 – 3,117 3,414 3 – 4,370 4,373 No expiry date 4,463 1,058 3,775 9,296 4,858 753 2,077 7,688
5,183 1,058 6,892 13,133 5,171 753 6,447 12,371
The Group also has unused tax credits of $11 million (2013: $17 million) for which no deferred tax asset is recognised in the Consolidated balance sheet. All of these credits expire within three months.
No deferred tax has been recognised in respect of temporary differences associated with investments in subsidiaries, branches, associates and interests in joint arrangements where the Group is in a position to control the timing of the reversal of the temporary differences and it is probable that such differences will not reverse in the foreseeable future. The aggregate amount of temporary differences associated with such investments in subsidiaries, branches, associates and interests in joint arrangements is represented by the contribution of those investments to the Group’s retained earnings and amounted to $17,488 million (2013: $19,117 million).
FINANCIAL STATEMENTS AND OTHER FINANCIAL INFORMATION NOTES TO THE FINANCIAL STATEMENTS
NOTES TO THE CONSOLIDATED BALANCE SHEET

138 Anglo American plc Annual Report 2014
22. CAPITAL EXPENDITURE Capital expenditure is defined as cash expenditure on property, plant and equipment including related derivatives, and is now presented net of proceeds from disposal of property, plant and equipment and includes direct funding for capital expenditure from non-controlling interests in order to match more closely the way in which it is managed. Comparatives have been re-presented to align with current year presentation.
Capital expenditure by segmentUS$ million 2014 2013 Iron Ore and Manganese 2,685 2,518 Coal(1) 1,045 1,263 Copper 728 959 Nickel(2) 14 (28) Niobium(1) 198 206 Phosphates(1) 41 30 Platinum 576 601 De Beers 689 476 Corporate and other(1) 42 50
6,018 6,075 Excluding:Cash outflows from derivatives related to capital expenditure (157) (136) Proceeds from disposal of property, plant and equipment 71 140 Direct funding for capital expenditure received from non-controlling interests 42 46 Expenditure on property, plant and equipment 5,974 6,125
(1) Refer to note 3 for changes in reporting segments. Comparatives have been reclassified to align with current year presentation. (2) Cash capital expenditure for Nickel of $164 million (2013: $76 million) is offset by the capitalisation of $150 million (2013: $104 million) of net operating cash inflows generated by Barro Alto
which has not yet reached commercial production.
Capital expenditure by categoryUS$ million 2014 2013Expansionary(1) 3,248 3,213 Stay-in-business 1,973 2,241 Stripping and development 868 761 Proceeds from disposal of property, plant and equipment (71) (140)
6,018 6,075
(1) The expansionary category includes the cash flows from derivatives related to capital expenditure and is net of direct funding for capital expenditure received from non-controlling interests.
FINANCIAL STATEMENTS AND OTHER FINANCIAL INFORMATION NOTES TO THE FINANCIAL STATEMENTS
CASH FLOW STATEMENT, NET DEBT AND RELATED NOTES

Anglo American plc Annual Report 2014 139
Financial statements
23. NET DEBTSee note 39o for the Group’s accounting policy on cash and debt.
Net debt is a measure of the Group’s financial position. The Group uses net debt to monitor the sources and uses of financial resources, the availability of capital to invest or return to shareholders, and the resilience of the balance sheet. Net debt is calculated as total borrowings less cash and cash equivalents (including derivatives which provide an economic hedge of net debt, see note 19).
a) Reconciliation to the balance sheet
Cash and cash equivalents Short term borrowingsMedium and
long term borrowingsUS$ million 2014 2013 2014 2013 2014 2013Balance sheet 6,748 7,704 (1,618) (2,108) (16,917) (15,740) Bank overdrafts (1) (2) 1 2 – –Net debt classifications 6,747 7,702 (1,617) (2,106) (16,917) (15,740)
b) Movement in net debt
US$ million
Cash and cash
equivalentsShort term
borrowings
Medium and long term
borrowings
Net debt excluding
derivatives
Derivatives hedging net debt
Net debt including
derivativesAt 1 January 2013 9,298 (2,490) (15,150) (8,342) (168) (8,510)Cash flow (1,235) 2,307 (3,279) (2,207) (181) (2,388) Disposal of businesses – 69 – 69 – 69 Reclassifications – (2,084) 2,084 – – – Movement in fair value – 24 521 545 (155) 390 Other non-cash movements – (5) (39) (44) – (44) Currency movements (361) 73 123 (165) (4) (169) At 31 December 2013 7,702 (2,106) (15,740) (10,144) (508) (10,652) Cash flow (841) 1,785 (3,568) (2,624) (203) (2,827) Reclassifications – (1,487) 1,487 – – –Movement in fair value – (7) (434) (441) (373) (814) Other non-cash movements – (2) (72) (74) – (74) Currency movements (114) 200 1,410 1,496 – 1,496 At 31 December 2014 6,747 (1,617) (16,917) (11,787) (1,084) (12,871)
c) Net debt by segmentThe Group’s policy is to hold the majority of its cash and borrowings at the corporate centre. Business units may from time to time raise borrowings in connection with specific capital projects, and subsidiaries with non-controlling interests have borrowings which are without recourse to the Group. Other than the impact of South African exchange controls (see 23d below), there are no significant restrictions over the Group’s ability to access these cash balances or repay these borrowings. Net debt by segment is stated after elimination of inter-segment balances.
US$ million 2014 2013 Iron Ore and Manganese (2,294) (1,413) Coal(1) 201 169 Copper 738 531 Nickel (262) (398) Niobium(1) 44 22 Phosphates(1) 32 46Platinum 24 (50) De Beers (126) (311) Corporate and other(1) (11,228) (9,248)
(12,871) (10,652)
(1) Refer to note 3 for changes in reporting segments. Comparatives have been reclassified to align with current year presentation.
d) South Africa net debtThe Group operates in South Africa where the existence of exchange controls may restrict the use of certain cash balances. The Group therefore monitors the cash and debt associated with these operations separately. These restrictions are not expected to have a material effect on the Group’s ability to meet its ongoing obligations. Below is a breakdown of net debt in South Africa.
US$ million 2014 2013Cash and cash equivalents 1,298 2,247 Short term borrowings (118) (512) Medium and long term borrowings (1,252) (1,000) Net (debt)/cash excluding derivatives (72) 735 Derivatives hedging net debt 1 4 Net (debt)/cash including derivatives (71) 739
FINANCIAL STATEMENTS AND OTHER FINANCIAL INFORMATION NOTES TO THE FINANCIAL STATEMENTS
CASH FLOW STATEMENT, NET DEBT AND RELATED NOTES
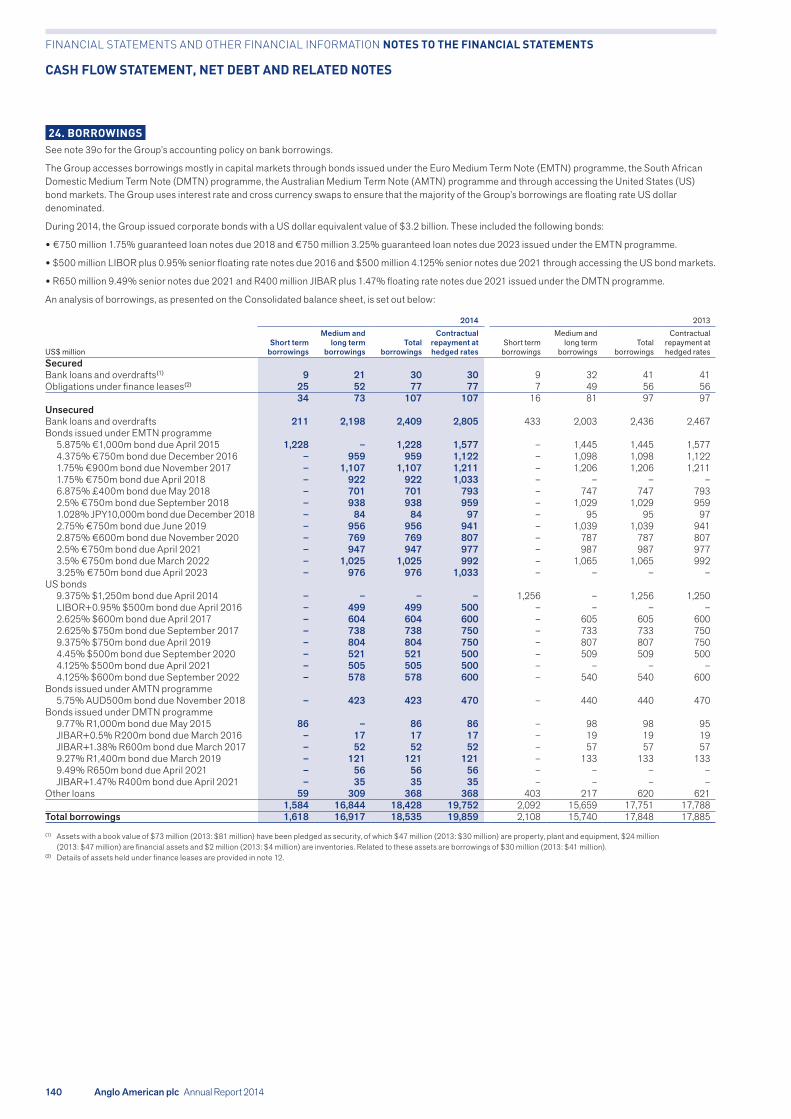
140 Anglo American plc Annual Report 2014
24. BORROWINGSSee note 39o for the Group’s accounting policy on bank borrowings.
The Group accesses borrowings mostly in capital markets through bonds issued under the Euro Medium Term Note (EMTN) programme, the South African Domestic Medium Term Note (DMTN) programme, the Australian Medium Term Note (AMTN) programme and through accessing the United States (US) bond markets. The Group uses interest rate and cross currency swaps to ensure that the majority of the Group’s borrowings are floating rate US dollar denominated.
During 2014, the Group issued corporate bonds with a US dollar equivalent value of $3.2 billion. These included the following bonds:
• €750 million 1.75% guaranteed loan notes due 2018 and €750 million 3.25% guaranteed loan notes due 2023 issued under the EMTN programme.
• $500 million LIBOR plus 0.95% senior floating rate notes due 2016 and $500 million 4.125% senior notes due 2021 through accessing the US bond markets.
• R650 million 9.49% senior notes due 2021 and R400 million JIBAR plus 1.47% floating rate notes due 2021 issued under the DMTN programme.
An analysis of borrowings, as presented on the Consolidated balance sheet, is set out below:
2014 2013
US$ millionShort term
borrowings
Medium and long term
borrowingsTotal
borrowings
Contractual repayment at hedged rates
Short term borrowings
Medium and long term
borrowingsTotal
borrowings
Contractual repayment at hedged rates
SecuredBank loans and overdrafts(1) 9 21 30 30 9 32 41 41 Obligations under finance leases(2) 25 52 77 77 7 49 56 56
34 73 107 107 16 81 97 97 UnsecuredBank loans and overdrafts 211 2,198 2,409 2,805 433 2,003 2,436 2,467 Bonds issued under EMTN programme
5.875% €1,000m bond due April 2015 1,228 – 1,228 1,577 – 1,445 1,445 1,577 4.375% €750m bond due December 2016 – 959 959 1,122 – 1,098 1,098 1,122 1.75% €900m bond due November 2017 – 1,107 1,107 1,211 – 1,206 1,206 1,211 1.75% €750m bond due April 2018 – 922 922 1,033 – – – –6.875% £400m bond due May 2018 – 701 701 793 – 747 747 793 2.5% €750m bond due September 2018 – 938 938 959 – 1,029 1,029 959 1.028% JPY10,000m bond due December 2018 – 84 84 97 – 95 95 97 2.75% €750m bond due June 2019 – 956 956 941 – 1,039 1,039 941 2.875% €600m bond due November 2020 – 769 769 807 – 787 787 807 2.5% €750m bond due April 2021 – 947 947 977 – 987 987 977 3.5% €750m bond due March 2022 – 1,025 1,025 992 – 1,065 1,065 992 3.25% €750m bond due April 2023 – 976 976 1,033 – – – –
US bonds9.375% $1,250m bond due April 2014 – – – – 1,256 – 1,256 1,250 LIBOR+0.95% $500m bond due April 2016 – 499 499 500 – – – –2.625% $600m bond due April 2017 – 604 604 600 – 605 605 600 2.625% $750m bond due September 2017 – 738 738 750 – 733 733 750 9.375% $750m bond due April 2019 – 804 804 750 – 807 807 750 4.45% $500m bond due September 2020 – 521 521 500 – 509 509 500 4.125% $500m bond due April 2021 – 505 505 500 – – – –4.125% $600m bond due September 2022 – 578 578 600 – 540 540 600
Bonds issued under AMTN programme5.75% AUD500m bond due November 2018 – 423 423 470 – 440 440 470
Bonds issued under DMTN programme9.77% R1,000m bond due May 2015 86 – 86 86 – 98 98 95 JIBAR+0.5% R200m bond due March 2016 – 17 17 17 – 19 19 19 JIBAR+1.38% R600m bond due March 2017 – 52 52 52 – 57 57 57 9.27% R1,400m bond due March 2019 – 121 121 121 – 133 133 133 9.49% R650m bond due April 2021 – 56 56 56 – – – –JIBAR+1.47% R400m bond due April 2021 – 35 35 35 – – – –
Other loans 59 309 368 368 403 217 620 621 1,584 16,844 18,428 19,752 2,092 15,659 17,751 17,788
Total borrowings 1,618 16,917 18,535 19,859 2,108 15,740 17,848 17,885
(1) Assets with a book value of $73 million (2013: $81 million) have been pledged as security, of which $47 million (2013: $30 million) are property, plant and equipment, $24 million (2013: $47 million) are financial assets and $2 million (2013: $4 million) are inventories. Related to these assets are borrowings of $30 million (2013: $41 million).
(2) Details of assets held under finance leases are provided in note 12.
FINANCIAL STATEMENTS AND OTHER FINANCIAL INFORMATION NOTES TO THE FINANCIAL STATEMENTS
CASH FLOW STATEMENT, NET DEBT AND RELATED NOTES

Anglo American plc Annual Report 2014 141
Financial statements
24. BORROWINGS continuedLiquidity riskThe Group ensures that there are sufficient committed loan facilities (including refinancing, where necessary) in order to meet short term business requirements, after taking into account cash flows from operations and its holding of cash and cash equivalents, as well as any Group distribution restrictions that exist. In addition, certain projects may be financed by means of limited recourse project finance, if appropriate.
The expected undiscounted cash flows of the Group’s net debt related and other financial liabilities, by remaining contractual maturity, based on conditions existing at the balance sheet date are as follows:
2014Net debt related financial liabilities
US$ million Borrowings
Expected future interest
payments
Derivatives hedging net debt
Other financial liabilities Total
Amount due for repayment within one year (1,602) (752) (175) (3,387) (5,916) Greater than one year, less than two years (1,866) (670) (101) – (2,637) Greater than two years, less than three years (2,806) (581) (47) – (3,434) Greater than three years, less than four years (3,555) (489) (277) – (4,321) Greater than four years, less than five years (2,053) (320) 44 – (2,329) Greater than five years (6,094) (556) (201) – (6,851) Total due for repayment after more than one year (16,374) (2,616) (582) – (19,572) Total (17,976) (3,368) (757) (3,387) (25,488)
2013Net debt related financial liabilities
US$ million Borrowings
Expected future interest
payments
Derivatives hedging net debt
Other financial liabilities Total
Amount due for repayment within one year (2,098) (762) 245 (4,204) (6,819) Greater than one year, less than two years (1,903) (720) 19 – (2,604) Greater than two years, less than three years (1,532) (540) 67 – (2,005) Greater than three years, less than four years (2,872) (470) 165 – (3,177) Greater than four years, less than five years (2,642) (417) 58 – (3,001) Greater than five years (6,580) (581) 476 – (6,685) Total due for repayment after more than one year (15,529) (2,728) 785 – (17,472) Total (17,627) (3,490) 1,030 (4,204) (24,291)
The Group had the following undrawn committed borrowing facilities at 31 December:
US$ million 2014 2013Expiry dateWithin one year(1) 1,073 1,318 Greater than one year, less than two years 525 637 Greater than two years, less than three years 1,172 1,449 Greater than three years, less than four years 597 – Greater than four years, less than five years 5,000 5,847
8,367 9,251
(1) Includes undrawn rand facilities equivalent to $0.9 billion (2013: $1.2 billion) in respect of facilities with 364 day maturity which roll automatically on a daily basis, unless notice is served.
In April 2014, the Group amended a $5 billion revolving credit facility, extending the maturity to 2019. The facility was undrawn as at 31 December 2014.
Capital risk managementThe Group’s objectives when managing capital are to safeguard the Group’s ability to continue as a going concern in order to provide returns for shareholders and benefits for other stakeholders and, with cognisance of forecast future market conditions and structuring, to maintain an optimal capital structure to enable the business to operate effectively.
In order to manage the short and long term capital structure, the Group has a number of options including raising and refinancing debt, adjusting returns to equity shareholders, managing the allocation of capital and divesting of non-core assets to reduce debt.
The Group monitors capital using various financial metrics including the ratio of net debt to total capital (gearing). Net debt is calculated as total borrowings less cash and cash equivalents (including derivatives which provide an economic hedge of net debt). Total capital is calculated as ‘Net assets’ (as shown in the Consolidated balance sheet) excluding net debt. Total capital and gearing are as follows:
US$ million 2014 2013Net assets 32,177 37,364 Net debt including related derivatives (note 23) 12,871 10,652 Total capital 45,048 48,016Gearing 28.6% 22.2%
Gearing has increased from 22.2% to 28.6% as net debt has increased and total capital has decreased. Net debt increased from $10.7 billion to $12.9 billion at 31 December 2014 as cash inflows from operating activities were offset by outflows primarily relating to capital expenditure and dividends to Anglo American plc shareholders as well as to non-controlling interests. Total capital decreased from $48.0 billion to $45.0 billion primarily due to the impact of impairments and the effect of a stronger US dollar on assets denominated in other currencies.
FINANCIAL STATEMENTS AND OTHER FINANCIAL INFORMATION NOTES TO THE FINANCIAL STATEMENTS
CASH FLOW STATEMENT, NET DEBT AND RELATED NOTES

142 Anglo American plc Annual Report 2014
24. BORROWINGS continued Market riskMarket risk is the risk that financial instrument fair values and related cash flows will fluctuate due to changes in market prices. The Group manages interest rate risks and foreign exchange risks on borrowings and cash with the use of cross currency swaps and interest rate swaps in order to ensure that the majority of borrowings are floating rate US dollar denominated. The Group does not hedge foreign exchange exposures on rand denominated borrowings in South Africa. For more information regarding the Group’s financial risk management see note 38.
The table below reflects the exposure of the Group’s net debt to currency and interest rate risk.
2014
US$ million
Cash and cash
equivalents
Floating rate
borrowings
Fixed rate
borrowings
Non-interest bearing
borrowings
Derivatives hedging net debt
Impact of currency
derivatives TotalUS dollar 6,151 (1,291) (3,896) – (1,087) (12,336) (12,459) Euro 24 – (9,827) – – 9,827 24 Rand 134 (703) (266) – 3 – (832) Brazilian real 211 (1,303) – – – 1,301 209 Australian dollar 61 – (423) – – 423 61 Sterling 29 – (701) – – 701 29 Other 137 (7) (117) – – 84 97 Impact of interest derivatives – (15,050) 15,050 – – – –Total 6,747 (18,354) (180) – (1,084) – (12,871)
2013
US$ million
Cash and cash
equivalents
Floating rate
borrowings
Fixed rate
borrowings
Non-interest bearing
borrowings
Derivatives hedging net debt
Impact of currency
derivatives TotalUS dollar 5,460 (942) (4,477) – (510) (11,257) (11,726) Euro 22 – (8,656) – – 8,656 22 Rand 1,225 (890) (231) (7) 2 – 99 Brazilian real 716 (1,319) (2) – – 1,319 714 Australian dollar 103 – (440) – – 440 103 Sterling 41 – (747) – – 747 41 Other 135 (25) (106) (4) – 95 95 Impact of interest derivatives – (14,468) 14,468 – – – – Total 7,702 (17,644) (191) (11) (508) – (10,652)
25. COMMITMENTSSee note 39x for the Group’s accounting policy on leases.
The Group had $1,936 million (2013: $3,391 million) outstanding capital commitments relating to subsidiaries and joint operations which were contracted but not provided.
In addition, the Group had outstanding commitments under contracts relating to shipping services of $2,124 million (2013: $1,168 million).
The Group’s share of joint ventures’ capital commitments, including its share of commitments made jointly with other investors, is $63 million (2013: $364 million).
At 31 December the Group had the following commitments under non-cancellable operating leases:
US$ million 2014 2013Expiry dateWithin one year 94 104 Greater than one year, less than two years 65 83 Greater than two years, less than five years 115 145 Greater than five years 80 145
354 477
Operating leases relate principally to land and buildings, vehicles and mining equipment.
FINANCIAL STATEMENTS AND OTHER FINANCIAL INFORMATION NOTES TO THE FINANCIAL STATEMENTS
CASH FLOW STATEMENT, NET DEBT AND RELATED NOTES

Anglo American plc Annual Report 2014 143
Financial statements
26. EMPLOYEE NUMBERS AND COSTSThe average number of employees, excluding contractors and associates’ and joint ventures’ employees, and including a proportionate share of employees within joint operations, was:
Thousand 2014 2013By segmentIron Ore and Manganese 9 8 Coal(1) 12 11 Copper 6 6 Nickel 2 2 Niobium(1) 1 1 Phosphates(1) 1 1Platinum 51 55 De Beers 10 10 Corporate and other(1) 3 4
95 98
(1) Refer to note 3 for changes in reporting segments. Comparatives have been reclassified to align with current year presentation.
The average number of employees by principal location of employment was:
Thousand 2014 2013South Africa 72 75 Other Africa 4 4 South America 11 11 North America 2 2 Australia and Asia 4 4 Europe 2 2
95 98
Payroll costs in respect of the employees included in the tables above were:
US$ million 2014 2013Wages and salaries 4,244 4,439 Social security costs 166 160 Post employment benefits(1) 404 395 Share-based payments (note 28) 258 261 Total payroll costs 5,072 5,255 Reconciliation:Less: employee costs capitalised (367) (265) Less: employee costs included within special items (191) (156) Employee costs included in operating costs 4,514 4,834
(1) Includes contributions to defined contribution pension and medical plans, current and past service costs related to defined benefit pension and medical plans and other benefits provided to certain employees during retirement (see note 27).
Key managementKey management personnel are those persons having authority and responsibility for planning, directing and controlling the activities of the Group, directly or indirectly, including any director (executive and non-executive) of the Group. Key management comprises members of the Board and the Group Management Committee.
Compensation for key management was as follows:
US$ million 2014 2013Salaries and short term employee benefits 31 30Social security costs 5 5Termination benefits 3 11Post employment benefits 3 4Share-based payments 18 21
60 71
Disclosure of directors’ emoluments, pension entitlements, share options and long term incentive plan awards required by the Companies Act 2006 and those specified for audit by Regulation 11 and Schedule 8 of the Large and Medium-Sized Companies and Groups (Accounts and Reports) Regulations 2008 are included in the Remuneration report.
FINANCIAL STATEMENTS AND OTHER FINANCIAL INFORMATION NOTES TO THE FINANCIAL STATEMENTS
EMPLOYEE REMUNERATION

144 Anglo American plc Annual Report 2014
27. RETIREMENT BENEFITSSee note 39t for the Group’s accounting policy on retirement benefits.
The Group operates a number of defined contribution and defined benefit pension plans. It also operates post employment medical plans, principally in South Africa.
Defined contribution plansThe defined contribution pension and medical cost represents the actual contributions payable by the Group to the various plans.
The assets of the defined contribution plans are held separately in independently administered funds. The charge in respect of these plans is calculated on the basis of the contribution payable by the Group in the financial year. The charge for the year for defined contribution pension plans (net of amounts capitalised) was $244 million (2013: $261 million) and for defined contribution medical plans (net of amounts capitalised) was $81 million (2013: $88 million).
Defined benefit pension plans and post employment medical plansThe Group operates defined benefit pension and medical plans across a number of segments. The most significant plans are in South Africa and the United Kingdom.
A summary of the movements in the net pension plan assets and retirement benefit obligations on the Consolidated balance sheet is as follows:
US$ million 2014 2013Net liability recognised at 1 January (1,013) (1,233) Net income statement charge (113) (88) Remeasurement of net defined benefit obligation (15) 97 Employer contributions 132 151 Other 31 (10)Currency movements 89 70Net liability recognised at 31 December (889) (1,013) Amounts recognised as:Defined benefit pension plans in surplus(1) 184 191Retirement benefit obligation – pension plans (615) (727)Retirement benefit obligation – medical plans (458) (477)
(889) (1,013)
(1) Included in ‘Other non-current assets’ on the Consolidated balance sheet.
The majority of the defined benefit pension plans are funded. The assets of these plans are held separately from those of the Group, in independently administered funds, in accordance with statutory requirements or local practice in the relevant jurisdiction. The unfunded liabilities are principally in relation to termination indemnity plans in Chile.
The post employment medical plans provide health benefits to retired employees and certain dependants. Eligibility for cover is dependent upon certain criteria. The majority of these plans are unfunded and are principally in South Africa.
Independent qualified actuaries carry out full valuations at least every three years using the projected unit credit method. The actuaries have updated the valuations to 31 December 2014. Assumptions are set after consultation with the qualified actuaries. While management believe the assumptions used are appropriate, a change in the assumptions used would impact the Group’s other comprehensive income.
Characteristics and risks of plansThe defined benefit plans are exposed to risks such as longevity, investment risk, inflation risk, interest rate risk and foreign exchange risk.
The weighted average duration of the South African plans is 12 years (2013: 12 years), United Kingdom plans is 18 years (2013: 19 years) and plans in other regions is 14 years (2013: 14 years). This represents the average period over which future benefit payments are expected to be made.
Employer contributions are made in accordance with the terms of each plan and may vary from year to year. Employer contributions made in the year ended 31 December 2014 were $132 million to pension plans and in addition $27 million of benefits were paid in relation to post employment medical plans. The Group expects to contribute $134 million to its pension plans and $25 million to its post employment medical plans in 2015.
The responsibility for the governance of the funded retirement benefit plans, including investment and funding decisions, lies with the Trustees of each scheme.
South AfricaThe pension plans in South Africa are in surplus, with the asset recognised on the Consolidated balance sheet restricted to the amount in the Employer Surplus Account, being plan assets less plan liabilities less any contingency reserves as recommended by the funds’ actuaries.
The Employer Surplus Account is the amount that the Group is entitled to by way of refund. All pension plans in South Africa are closed to new members and the majority of plans are closed to future benefit accrual. As the plans are in surplus no employer contributions are currently being made.
The Group’s provision of anti-retroviral therapy to HIV positive staff does not significantly impact the post employment medical plan liability.
United KingdomThe Group operates funded pension plans in the United Kingdom. These plans are closed to new members. The only plan still open to future benefit accrual will close to accrual on 30 September 2015.
Certain assets held by the main plans in the United Kingdom are structured to closely match the characteristics of the liabilities through a variety of investment strategies, including the use of interest rate hedging and inflation hedging to manage interest rate risk and inflation rate risk respectively.
The Group is committed to make payments to certain United Kingdom pension plans under deficit funding plans agreed with the respective Trustees. Where the present value of the agreed funding payments exceeds the liability in respect of the plans as measured under IFRS, and would therefore, when paid, give rise to a surplus as measured under IFRS, a provision is recognised for any part of that surplus that would not be recoverable. Any resulting surplus has been assessed to be fully recoverable and as such no provision has been recognised.
FINANCIAL STATEMENTS AND OTHER FINANCIAL INFORMATION NOTES TO THE FINANCIAL STATEMENTS
EMPLOYEE REMUNERATION

Anglo American plc Annual Report 2014 145
Financial statements
27. RETIREMENT BENEFITS continuedOtherOther pension and post employment medical plans primarily comprise obligations in Chile where legislation requires employers to provide for a termination indemnity, entitling employees to a cash payment made on the termination of an employment contract. The features of this provision meet the definition of a post employment benefit obligation and consequently an unfunded liability is recognised on the Consolidated balance sheet. Other plans are in Brazil, Canada and mainland Europe and consist of funded and unfunded pension plans and unfunded medical aid plans. These plans are not considered to be significant to the Group.
Actuarial assumptionsThe principal assumptions used to determine the actuarial present value of benefit obligations and pension charges and credits are detailed below (shown as weighted averages):
2014 2013South
AfricaUnited
Kingdom OtherSouth Africa
United Kingdom Other
Defined benefit pension plansAverage discount rate for plan liabilities 8.3% 3.6% 6.4% 8.8% 4.4% 7.3%Average rate of inflation 6.2% 3.1% 3.5% 6.4% 3.4% 3.5%Average rate of increase of pensions in payment 6.2% 3.2% 3.2% 6.4% 3.3% 3.4%Post employment medical plansAverage discount rate for plan liabilities 8.3% 3.9% 7.0% 8.8% 4.3% 8.1%Average rate of inflation 6.2% 3.3% 5.2% 6.4% 3.4% 5.7%Expected average increase in healthcare costs 7.9% 8.0% 7.7% 8.2% 8.1% 8.1%
Mortality assumptions are determined based on standard mortality tables with adjustments, as appropriate, to reflect experience of conditions locally. In South Africa, the PA90 tables are used. The main plans in the United Kingdom use either SAPS tables or Club Vita models with plan specific adjustments based on mortality investigations. The mortality tables used imply that a male or female aged 60 at the balance sheet date has the following future life expectancy (shown as weighted averages):
Male FemaleYears 2014 2013 2014 2013South Africa 19.9 19.8 24.6 24.6 United Kingdom 28.7 28.7 30.2 30.2Other 22.8 22.7 27.1 27.0
The table below summarises the expected life expectancy from the age of 60 for a male or female age 45 at the balance sheet date. When viewed together with the respective life expectancy at age 60 in the table above this indicates the anticipated improvement in life expectancy (shown as weighted averages):
Male FemaleYears 2014 2013 2014 2013South Africa 19.9 19.8 24.6 24.6 United Kingdom 29.7 29.7 31.9 32.0Other 23.3 23.2 27.5 27.3
Sensitivity analysisSignificant actuarial assumptions for the determination of pension and medical plan liabilities are the discount rate, inflation rate and mortality. The sensitivity analysis below has been provided by local actuaries on an approximate basis based on changes in the assumptions occurring at the end of the year assuming that all other assumptions are held constant and the effect of interrelationships is excluded. The effect on plan liabilities is as follows:
2014
US$ millionSouth Africa
United Kingdom Other Total
Discount rate – 0.5% decrease (79) (433) (21) (533) Inflation rate – pension plans – 0.5% increase (54) (222) (12) (288) Inflation rate – medical plans – 0.5% increase (23) – (4) (27) Life expectancy – increase by 1 year (65) (130) (5) (200)
Income statementThe amounts recognised in the Consolidated income statement are as follows:
2014 2013
US$ millionPension
plans
Post employment
medical plans Total
Pension plans
Post employment
medical plans Total
Amount charged within operating costs 54 4 58 23 4 27 Net charge to net finance costs 18 37 55 25 36 61 Total charge to the income statement 72 41 113 48 40 88
FINANCIAL STATEMENTS AND OTHER FINANCIAL INFORMATION NOTES TO THE FINANCIAL STATEMENTS
EMPLOYEE REMUNERATION

146 Anglo American plc Annual Report 2014
27. RETIREMENT BENEFITS continuedComprehensive incomeThe amounts recognised in the Consolidated statement of comprehensive income are as follows:
2014 2013
US$ millionPension
plans
Post employment
medical plans Total
Pension plans
Post employment
medical plans Total
Return on plan assets, excluding interest income 542 (1) 541 146 – 146 Actuarial (losses)/gains on plan liabilities(1) (527) (8) (535) 8 17 25Movement in surplus restriction (21) – (21) (74) – (74) Remeasurement of net defined benefit obligation (6) (9) (15) 80 17 97
(1) Comprises (losses)/gains from changes in financial and demographic assumptions as well as experience on plan liabilities.
Pension plan assets and liabilities by geographyThe split of the present value of funded and unfunded obligations in defined benefit pension plans and the fair value of pension assets at 31 December is as follows:
2014 2013
US$ millionSouth
AfricaUnited
Kingdom Other TotalSouth Africa
United Kingdom Other Total
Equity 454 885 11 1,350 515 1,232 14 1,761 Corporate bonds 275 1,368 66 1,709 – 817 51 868 Government bonds 687 1,513 37 2,237 936 1,189 62 2,187 Cash 69 48 1 118 74 211 1 286 Other – 203 10 213 41 166 6 213Fair value of pension plan assets(1) 1,485 4,017 125 5,627 1,566 3,615 134 5,315 Active members (9) (307) (35) (351) (11) (252) (38) (301) Deferred members (24) (1,672) (9) (1,705) (36) (1,494) (16) (1,546) Pensioners (1,136) (2,372) (93) (3,601) (1,183) (2,334) (93) (3,610) Present value of funded obligations (1,169) (4,351) (137) (5,657) (1,230) (4,080) (147) (5,457) Present value of unfunded obligations(2) – – (219) (219) – – (217) (217) Net surplus/(deficit) in pension plans 316 (334) (231) (249) 336 (465) (230) (359) Surplus restriction (182) – – (182) (177) – – (177) Recognised retirement benefit assets/(liabilities) 134 (334) (231) (431) 159 (465) (230) (536) Amounts in the Consolidated balance sheetDefined benefit pension plans in surplus 134 50 – 184 159 32 – 191 Retirement benefit obligation – pension plans – (384) (231) (615) – (497) (230) (727)
134 (334) (231) (431) 159 (465) (230) (536)
(1) The fair value of assets is used to determine the funding level of the plans. The fair value of the assets of the funded plans was sufficient to cover 99% (2013: 97%) of the benefits that had accrued to members after allowing for expected increases in future earnings and pensions.
(2) Includes $214 million (2013: $200 million) relating to active members.
All investments have been fair valued based on quoted market prices.
Movement analysisThe changes in the fair value of plan assets are as follows:
2014 2013
US$ millionPension
plans
Post employment
medical plans Total
Pension plans
Post employment
medical plans Total
At 1 January 5,315 17 5,332 5,327 21 5,348 Effects of settlements (4) – (4) (3) – (3) Interest income 284 1 285 269(1) 1 270 Return on plan assets, excluding interest income 542 (1) 541 146(1) – 146 Contributions paid by employer 132 – 132 151 – 151 Benefits paid(2) (236) (1) (237) (253) (1) (254) Other 6 – 6 (24) – (24)Currency movements (412) (2) (414) (298) (4) (302) At 31 December 5,627 14 5,641 5,315 17 5,332
(1) The actual return on assets in respect of pension plans was $826 million (2013: $415 million).(2) Includes $10 million (2013: $11 million) of benefits paid to defined contribution plans.(3) Includes $26 million refund of surplus plan assets as agreed with the pension plan Trustees. These funds relate to plans in South Africa and will be used to make future contributions to post
employment medical plans. The refund is included within ‘Other non-current assets’ on the Consolidated balance sheet.
(1)
(1)
(3)
FINANCIAL STATEMENTS AND OTHER FINANCIAL INFORMATION NOTES TO THE FINANCIAL STATEMENTS
EMPLOYEE REMUNERATION

Anglo American plc Annual Report 2014 147
Financial statements
27. RETIREMENT BENEFITS continuedThe changes in the present value of defined benefit obligations are as follows:
2014 2013
US$ millionPension
plans
Post employment
medical plans Total
Pension plans
Post employment
medical plans Total
At 1 January (5,674) (494) (6,168) (5,862) (602) (6,464) Current service costs (25) (4) (29) (23) (4) (27) Effects of curtailments/settlements (17) – (17) 3 – 3 Interest cost (302) (38) (340) (294) (37) (331) Actuarial (losses)/gains(1) (527) (8) (535) 8 17 25Benefits paid 241 27 268 242 28 270 Other (6) – (6) (2) – (2)Currency movements 434 45 479 254 104 358 At 31 December (5,876) (472) (6,348) (5,674) (494) (6,168)
(1) Includes losses of $557 million (2013: gains of $44 million) relating to changes in financial assumptions.
28. SHARE-BASED PAYMENTSSee note 39u for the Group’s accounting policy on share-based payments.
During the year ended 31 December 2014 the Group had share-based payment arrangements with employees relating to shares of the Company, the details of which are described in the Remuneration report. All of these Company schemes are equity settled, either by award of ordinary shares (BSP, LTIP and SIP) or award of options to acquire ordinary shares (ESOS, DOP and SAYE). The ESOS is now closed to new participants, having been replaced with the BSP. No options have been granted under the DOP.
The total share-based payment charge relating to Anglo American plc shares for the year is split as follows:
US$ million 2014 2013BSP 94 82 LTIP 60 52 Other schemes 3 10 Share-based payment charge relating to Anglo American plc shares(1) 157 144
(1) In addition, there are equity settled share-based payment charges of $58 million (2013: $65 million) relating to Kumba Iron Ore Limited shares and $35 million (2013: $52 million) relating to Anglo American Platinum Limited shares. Certain business units also operate cash settled employee share-based payment schemes. These schemes had a charge of $8 million (2013: nil).
Schemes settled by award of ordinary sharesThe fair value of ordinary shares awarded under the BSP, LTIP and LTIP–ROCE, being the more material share schemes, was calculated using a Black Scholes model. The fair value of shares awarded under the LTIP–TSR scheme was calculated using a Monte Carlo model. The assumptions used in these calculations are set out below:
2014 2013Arrangement(1) BSP LTIP LTIP–ROCE LTIP–TSR BSP LTIP LTIP–AOSC LTIP–TSRDate of grant 07/03/14 07/03/14 07/03/14 07/03/14 01/03/13 01/03/13 01/03/13 01/03/13Number of instruments 5,128,574 1,934,900 613,682 613,682 4,830,179 1,285,634 470,561 470,561 Share price at the date of grant (£) 14.63 14.63 14.63 14.63 19.00 19.00 19.00 19.00 Contractual life (years) 3 3 3 3 3 3 3 3 Vesting conditions (2) (2) (3) (4) (5) (2) (3) (4)
Expected volatility(6) 35% 35% 35% 35% 35% 35% 35% 35%Risk free interest rate(7) 1.1% 1.1% 1.1% 1.1% 0.3% 0.3% 0.3% 0.3%Expected departures 5% pa 5% pa 5% pa 5% pa 5% pa 5% pa 5% pa 5% pa Dividend yield 2.1% 2.1% 2.1% 2.1% 1.9% 1.9% 1.9% 1.9%Fair value at date of grant (weighted average) (£) 14.63 14.63 14.63 7.87 18.55 19.00 19.00 9.31
(1) The number of instruments used in the fair value models may differ from the total number of instruments awarded in the year due to awards made subsequent to the fair value calculations. The fair value calculated per the assumptions above has been applied to the total number of awards. The difference in income statement charge is not considered significant.
(2) Three years of continuous employment. (3) Variable vesting dependent on three years of continuous employment and Group ROCE (2013: AOSC) target being achieved. (4) Variable vesting dependent on three years of continuous employment and market based performance conditions being achieved.(5) Three years of continuous employment with enhancement shares having variable vesting based on non-market based performance conditions. (6) Based on historic volatility over the last five years.(7) The yield on zero-coupon UK government bonds with a term similar to the expected life of the award.
The charges arising in respect of the other Anglo American plc employee share schemes that the Group operated during the year are not considered material.
FINANCIAL STATEMENTS AND OTHER FINANCIAL INFORMATION NOTES TO THE FINANCIAL STATEMENTS
EMPLOYEE REMUNERATION

148 Anglo American plc Annual Report 2014
28. SHARE-BASED PAYMENTS continuedThe movements in the number of shares for the more significant share-based payment arrangements are as follows:
Bonus Share Plan(1)
Ordinary shares of 5486/91 US cents may be awarded under the terms of this scheme for no consideration.
Number of awards 2014 2013Outstanding at 1 January 10,871,470 9,656,833 Conditionally awarded in year 5,128,574 4,830,179 Vested in year (2,144,872) (2,234,189) Forfeited in year (1,751,162) (1,381,353) Outstanding at 31 December 12,104,010 10,871,470
(1) The BSP was approved by shareholders in 2004 as a replacement for the ESOS. Further information in respect of the BSP, including performance conditions, is shown in the Remuneration report.
Long Term Incentive Plan(1)
Ordinary shares of 5486/91 US cents may be awarded under the terms of this scheme for no consideration.
Number of awards 2014 2013Outstanding at 1 January 4,762,211 3,985,771 Conditionally awarded in year 3,162,264 2,226,755 Vested in year (986,324) (901,610) Forfeited or expired in year (806,153) (548,705) Outstanding at 31 December 6,131,998 4,762,211
(1) The early vesting of share awards is permitted at the discretion of the Company upon, inter alia, termination of employment, ill health or death. The LTIP awards are contingent on pre-established performance criteria being met. Further information in respect of this scheme is shown in the Remuneration report.
Schemes settled by award of optionsThe fair value of options granted under the SAYE scheme, being the only material option scheme, was calculated using a Black Scholes model. The assumptions used in these calculations for the current and prior year are set out in the table below:
Arrangement(1) 2014 SAYE 2013 SAYEDate of grant 01/05/14 19/04/13Number of instruments 133,625 87,224 Exercise price (£) 12.52 13.84 Share price at the date of grant (£) 15.64 15.97Contractual life (years) 3.5-5.5 3.5-5.5 Vesting conditions(2) 3-5 3-5Expected volatility(3) 35% 35%Dividend yield 2.1% 1.9%Expected option life (years)(4) 3.5-5.5 3.5-5.5 Risk free interest rate (weighted average)(5) 1.7% 0.5% Expected departures 5% pa 5% paFair value per option granted (weighted average) (£) 5.15 4.53
(1) The number of instruments used in the fair value models may differ from the total number of instruments awarded in the year due to awards made subsequent to the fair value calculations. The fair value calculated per the assumptions above has been applied to the total number of awards. The difference in income statement charge is not considered significant.
(2) Number of years of continuous employment. (3) Based on historic volatility over the last five years.(4) Average expected period to exercise.(5) The yield on zero-coupon UK government bonds with a term similar to the expected life of the option.
A reconciliation of option movements for the more significant share-based payment arrangements over the year to 31 December 2014 and the prior year is shown below. All options outstanding at 31 December 2014 with an exercise date on or prior to 31 December 2014 are deemed exercisable. Options were exercised regularly during the year and the weighted average share price for the year ended 31 December 2014 was £14.47 (2013: £15.79).
SAYE Share Option Scheme(1)
Options to acquire ordinary shares of 5486/91 US cents were outstanding under the terms of this scheme as follows:
2014 2013
Numberof options
Weighted average exercise
price £Number
of options
Weighted average exercise
price £Outstanding at 1 January 208,716 14.36 1,048,504 16.26 Granted in year 133,625 12.52 87,224 13.84 Exercised in year (61,319) 10.08 (366,319) 9.88 Forfeited in year (85,969) 17.14 (560,693) 20.76 Outstanding at 31 December 195,053 13.22 208,716 14.36
(1) The early exercise of share options is permitted at the discretion of the Company upon, inter alia, termination of employment, ill health or death.
Options outstanding at 31 December 2014 have a weighted average remaining contractual life of 3.5 years (2013: 1.9 years) and an exercise price range of £9.56 – £25.47 (2013: £9.56 – £25.47).
FINANCIAL STATEMENTS AND OTHER FINANCIAL INFORMATION NOTES TO THE FINANCIAL STATEMENTS
EMPLOYEE REMUNERATION

Anglo American plc Annual Report 2014 149
Financial statements
28. SHARE-BASED PAYMENTS continuedExecutive Share Option Scheme(1)
Options to acquire ordinary shares of 5486/91 US cents were outstanding under the terms of this scheme as follows:
2014 2013
Numberof options
Weighted average exercise
price £Number
of options
Weighted average exercise
price £Outstanding at 1 January 845,683 13.39 1,634,797 11.64 Exercised in year (687,383) 13.42 (760,114) 9.72 Forfeited in year (158,300) 13.25 (29,000) 11.07 Outstanding at 31 December – – 845,683 13.39
(1) Closed to new participants. The early exercise of share options is permitted at the discretion of the Company upon, inter alia, termination of employment, ill health or death.
29. BUSINESS COMBINATIONS AND FORMATION OF JOINT VENTURESSee note 39d for the Group’s accounting policy on business combinations and goodwill arising thereon.
2014There were no business combinations in the year ended 31 December 2014.
2013Lafarge Tarmac transactionOn 7 January 2013 the Group announced the completion of a 50:50 joint venture with Lafarge SA (Lafarge), combining their cement, aggregates, ready-mix concrete, asphalt and asphalt surfacing, maintenance services and waste services businesses in the United Kingdom.
The Group disposed of its interests in Tarmac Quarry Materials in exchange for a 50% interest in the newly formed joint venture, plus cash, deferred consideration and contingent consideration receivable for certain of Tarmac Quarry Materials’ operations that were sold pursuant to the Competition Commission’s conditions precedent to the formation of the joint venture.
This resulted in the derecognition of all assets and liabilities relating to the Tarmac Quarry Materials’ operations and recognition of an investment of $1,658 million in the Lafarge Tarmac joint venture (included in ‘Investments in associates and joint ventures’ on the Consolidated balance sheet). The Group recognised a net loss on disposal of $55 million in relation to the transaction.
30. DISPOSALS OF SUBSIDIARIES2014There were no significant disposals in the year ended 31 December 2014.
Disposal proceeds of $44 million received in 2014 primarily relate to deferred consideration from the sale of certain Tarmac Quarry Materials’ operations prior to the formation of the Lafarge Tarmac joint venture in 2013 (see note 29).
2013Disposals in 2013 related to the disposal of Amapá (Corporate and other segment).
31. NON-CONTROLLING INTERESTSNon-controlling interests that are material to the Group relate to the following subsidiaries:
• Kumba Iron Ore Limited (Kumba Iron Ore), which is a company incorporated in South Africa and listed on the JSE. Its principal mining operations are the Sishen, Kolomela and Thabazimbi iron ore mines which are located in South Africa. Non-controlling interests hold an effective 46.3% interest in the operations of Kumba Iron Ore, comprising the 30.3% interest held by other shareholders in Kumba Iron Ore and the 23% of Kumba Iron Ore’s principal operating subsidiary, Sishen Iron Ore Company (Proprietary) Limited, that is held by shareholders outside the Group.
• Anglo American Sur SA (Anglo American Sur), which is a company incorporated in Chile. Its principal operations are the Los Bronces and El Soldado copper mines and the Chagres smelting plant, which are located in Chile. Non-controlling interests hold a 49.9% interest in Anglo American Sur.
2014 2013
US$ millionKumba
Iron OreAnglo
American Sur Other(1) TotalKumba
Iron OreAnglo
American Sur Other(1) TotalProfit attributable to non-controlling interests 614 218 157 989 991 439 (43) 1,387 Equity attributable to non-controlling interests 1,060 2,212 2,488 5,760 1,185 2,060 2,448 5,693 Dividends paid to non-controlling interests (674) (116) (33) (823) (663) (474) (22) (1,159)
(1) Other consists of individually immaterial non-controlling interests.
FINANCIAL STATEMENTS AND OTHER FINANCIAL INFORMATION NOTES TO THE FINANCIAL STATEMENTS
GROUP STRUCTURE AND TRANSACTIONS

150 Anglo American plc Annual Report 2014
31. NON-CONTROLLING INTERESTS continuedSummarised financial information on a 100% basis and before inter-company eliminations for Kumba Iron Ore and Anglo American Sur is as follows:
2014 2013
US$ millionKumba
Iron OreAnglo
American SurKumba
Iron OreAnglo
American SurNon-current assets 3,405 4,746 3,200 4,854 Current assets 1,161 958 1,233 1,111 Current liabilities (841) (616) (516) (1,004) Non-current liabilities (1,271) (653) (1,190) (832) Net assets 2,454 4,435 2,727 4,129
Revenue 4,388 2,792 5,643 3,296 Profit for the financial year 1,339 441 2,103 880 Total comprehensive income 1,124 424 1,626 871 Net cash inflow from operating activities 1,657 1,136 2,501 1,306
There were no significant changes in ownership interests in subsidiaries in 2014 or 2013.
32. CALLED-UP SHARE CAPITAL AND CONSOLIDATED EQUITY ANALYSISCalled-up share capital
2014 2013Number of shares US$ million Number of shares US$ million
Called-up, allotted and fully paid:5% cumulative preference shares of £1 each 50,000 – 50,000 –
Ordinary shares of 5486/91 US cents each:At 1 January 1,405,465,332 772 1,405,459,753 772 Allotted during the year – – 5,579 –At 31 December 1,405,465,332 772 1,405,465,332 772
During 2014, no ordinary shares were allotted to non-executive directors (2013: 5,579 ordinary shares of 5486/91 US cents were allotted to certain non-executive directors by subscription of their post-tax directors’ fees).
Excluding shares held in treasury (but including the shares held by the Group in other structures, as outlined in the Tenon and Employee benefit trust sections below) the number and carrying value of called-up, allotted and fully paid ordinary shares as at 31 December 2014 was 1,396,671,247 and $767 million (2013: 1,394,149,340 and $766 million).
At general meetings, every member who is present in person has one vote on a show of hands and, on a poll, every member who is present in person or by proxy has one vote for every ordinary share held.
In the event of winding up, the holders of the cumulative preference shares will be entitled to the repayment of a sum equal to the nominal capital paid up, or credited as paid up, on the cumulative preference shares held by them and any accrued dividend, whether such dividend has been earned or declared or not, calculated up to the date of the winding up.
Own shares2014 2013
Number of shares US$ million Number of shares US$ millionOwn sharesTreasury shares 8,794,085 481 11,315,992 599Own shares held by subsidiaries and employee benefit trusts 116,665,530 5,878 115,691,282 5,864Total 125,459,615 6,359 127,007,274 6,463
The movement in treasury shares during the year is as follows:2014 2013
Number of shares US$ million Number of shares US$ millionTreasury sharesAt 1 January 11,315,992 599 14,505,120 801Transferred to employees in settlement of share awards (2,521,907) (118) (3,189,128) (202)At 31 December 8,794,085 481 11,315,992 599
FINANCIAL STATEMENTS AND OTHER FINANCIAL INFORMATION NOTES TO THE FINANCIAL STATEMENTS
ADDITIONAL DISCLOSURES

Anglo American plc Annual Report 2014 151
Financial statements
32. CALLED-UP SHARE CAPITAL AND CONSOLIDATED EQUITY ANALYSIS continued
TenonTenon Investment Holdings Proprietary Limited (Tenon), a wholly owned subsidiary of Anglo American South Africa Limited (AASA), has entered into agreements with Epoch Investment Holdings Proprietary Limited (Epoch), Epoch Two Investment Holdings Proprietary Limited (Epoch Two) and Tarl Investment Holdings Proprietary Limited (Tarl) (collectively the Investment Companies), each owned by independent charitable trusts whose trustees are independent of the Group. Under the terms of these agreements, the Investment Companies have purchased Anglo American plc shares on the market and have granted to Tenon the right to nominate a third party (which may include Anglo American plc but not any of its subsidiaries) to take transfer of the Anglo American plc shares each has purchased on the market. Tenon paid the Investment Companies 80% of the cost of the Anglo American plc shares including associated costs for this right to nominate, which together with subscriptions by Tenon for non-voting participating redeemable preference shares in the Investment Companies, provided all the funding required to acquire the Anglo American plc shares through the market. These payments by Tenon were sourced from the cash resources of AASA. Tenon is able to exercise its right of nomination at any time up to 31 December 2025 against payment of an average amount of $4.69 per share to Epoch, $7.29 per share to Epoch Two and $6.05 per share to Tarl which will be equal to 20% of the total costs respectively incurred by Epoch, Epoch Two and Tarl in purchasing shares nominated for transfer to the third party. These funds will then become available for redemption of the preference shares issued by the Investment Companies. The amount payable by the third party on receipt of the Anglo American plc shares will accrue to Tenon and, as these are own shares of the Company, any resulting gain or loss recorded by Tenon will not be recognised in the Consolidated income statement of Anglo American plc.
Under the agreements, the Investment Companies will receive dividends on the shares they hold and have agreed to waive the right to vote on those shares. The preference shares issued to the charitable trusts are entitled to a participating right of up to 10% of the profit after tax of Epoch and 5% of the profit after tax of Epoch Two and Tarl. The preference shares issued to Tenon will carry a fixed coupon of 3% plus a participating right of up to 80% of the profit after tax of Epoch and 85% of the profit after tax of Epoch Two and Tarl. Any remaining distributable earnings in the Investment Companies, after the above dividends, are then available for distribution as ordinary dividends to the charitable trusts.
The structure effectively provides Tenon with a beneficial interest in the price risk on these shares together with participation in future dividend receipts. The Investment Companies will retain legal title to the shares until Tenon exercises its right to nominate a transferee.
At 31 December 2014 the Investment Companies together held 112,300,129 (2013: 112,300,129) Anglo American plc shares, which represented 8.0% (2013: 8.1%) of the ordinary shares in issue (excluding treasury shares) with a market value of $2,100 million (2013: $2,451 million). The Investment Companies are not permitted to hold more than an aggregate of 10% of the issued share capital of Anglo American plc at any one time.
The Investment Companies are considered to be structured entities. Although the Group has no voting rights in the Investment Companies and cannot appoint or remove trustees of the charitable trusts, the Investment Companies continue to meet the accounting definition of a subsidiary in accordance with IFRS 10, and as a result are consolidated by the Group.
Employee benefit trustThe provision of shares to certain of the Company’s share option and share incentive schemes may be facilitated by an employee benefit trust or settled by the issue of treasury shares. Shares held by the trust are recorded as own shares, and the carrying value is shown as a reduction within shareholders’ equity. The employee benefit trust has waived the right to receive dividends on these shares. The costs of operating the trust are borne by the Group but are not material.
The market value of the 1 share (2013: 985 shares) held by the trust at 31 December 2014 was $19 (2013: $21,000).
Consolidated equity analysisFair value and other reserves comprise:
US$ million
Share-based payment
reserve
Available for sale reserve
Cash flow hedge
reserveOther
reserves(1)
Total fair value and other reserves
At 1 January 2013 549 694 15 157 1,415 Total comprehensive expense – (123) (6) – (129) Equity settled share-based payment schemes (1) – – – (1)Other – – – (17) (17)At 1 January 2014 548 571 9 140 1,268 Total comprehensive expense – (115) (7) – (122) Equity settled share-based payment schemes (8) – – – (8) At 31 December 2014 540 456 2 140 1,138
(1) Other reserves comprise a capital redemption reserve of $115 million (2013: $115 million), a revaluation reserve of $17 million (2013: $17 million) and a legal reserve of $8 million (2013: $8 million).
FINANCIAL STATEMENTS AND OTHER FINANCIAL INFORMATION NOTES TO THE FINANCIAL STATEMENTS
ADDITIONAL DISCLOSURES

152 Anglo American plc Annual Report 2014
33. AUDITOR’S REMUNERATION2014 2013
Paid/payable to Deloitte
Paid/payable to auditor (if not Deloitte) Paid/payable to Deloitte
Paid/payable to auditor (if not Deloitte)
US$ millionUnited
Kingdom Overseas Total OverseasUnited
Kingdom Overseas Total OverseasPaid to the Company’s auditor for audit of the Anglo American plc Annual Report 1.6 2.5 4.1 – 1.4 3.1 4.5 –
Paid to the Company’s auditor for other services to the GroupAudit of the Company’s subsidiaries 0.7 6.4 7.1 0.1 0.9 6.3 7.2 0.1 Total audit fees 2.3 8.9 11.2 0.1 2.3 9.4 11.7 0.1 Audit related assurance services(1) 0.7 1.7 2.4 – 0.5 1.4 1.9 – Taxation compliance services – 0.3 0.3 – – 0.4 0.4 – Taxation advisory services 0.2 1.0 1.2 – 0.1 1.2 1.3 –Other assurance services(2) 0.4 0.4 0.8 – 0.5 0.8 1.3 – Other non-audit services 0.3 0.3 0.6 – – 1.6 1.6 – Total non-audit fees 1.6 3.7 5.3 – 1.1 5.4 6.5 –
(1) Includes $1.4 million (2013: $1.5 million) for the interim review.(2) Includes $0.1 million (2013: $0.1 million) for the audit of Group pension plans.
34. CONTINGENT LIABILITIESThe Group is subject to various claims which arise in the ordinary course of business. Additionally, the Group has provided indemnities against certain liabilities as part of agreements for the sale or other disposal of business operations. Having taken appropriate legal advice, the Group believes that a material liability arising from the indemnities provided is remote.
The Group is required to provide guarantees in several jurisdictions in respect of environmental restoration and decommissioning obligations. The Group has provided for the estimated cost of these activities.
No contingent liabilities were secured on the assets of the Group at 31 December 2014 or 31 December 2013.
Anglo American South Africa Limited (AASA)AASA, a wholly owned subsidiary of the Company, is a defendant in a number of lawsuits filed in England and South Africa on behalf of former mineworkers (or their dependants or survivors) who allegedly contracted silicosis working for gold mining companies in which AASA was a shareholder and to which AASA provided various technical and administrative services.
In England: AASA is a defendant in a lawsuit filed in the High Court in London on behalf of approximately 2,700 named former mineworkers or their dependants.
In South Africa: (i) AASA is a defendant in approximately 4,400 separate lawsuits filed in the North Gauteng High Court (Pretoria) which have been referred to arbitration; and (ii) AASA is named as one of 32 defendants in a consolidated class certification application filed in South Africa.
AASA successfully contested the jurisdiction of the English courts to hear certain claims filed against it in that jurisdiction. AASA is defending the separate lawsuits filed in South Africa and will oppose the application for consolidated class certification in South Africa.
AASA, AngloGold Ashanti, Gold Fields, Harmony Gold and Sibanye Gold announced in November 2014 that they have formed an industry working group to address issues relating to compensation and medical care for occupational lung disease (OLD) in the gold mining industry in South Africa. The companies have begun to engage all stakeholders on these matters, including government, organised labour, other mining companies and legal representatives of claimants who have filed legal suits against the companies. These legal proceedings are being defended. The industry working group is seeking a comprehensive solution to address legacy compensation issues and future legal frameworks that is fair to past and current employees and enables companies to continue to be competitive over the long term.
Kumba Iron Ore21.4% undivided share of the Sishen mine mineral rightsSishen Iron Ore Company (Pty) Limited (SIOC) has not yet been awarded the 21.4% Sishen mining right, which it applied for early in 2014 following the Constitutional Court judgment on the matter in December 2013. The Constitutional Court ruled that SIOC held a 78.6% undivided share of the Sishen mining right and that, based on the provisions of the Minerals and Petroleum Resources Development Act (MPRDA), only SIOC can apply for, and be granted, the residual 21.4% share of the mining right at the Sishen mine. The grant of the mining right may be made subject to such conditions considered by the minister to be appropriate, provided that the proposed conditions are permissible under the MPRDA. Kumba Iron Ore is actively continuing its discussions with the Department of Mineral Resources (DMR) in order to finalise the grant of the residual right.
Kumba Iron Ore taxAt 31 December 2014, Kumba Iron Ore has certain unresolved tax matters that are currently under review with the South African Revenue Service (SARS). Kumba Iron Ore management has consulted with external tax and legal advisers, who support the positions taken. Nonetheless, Kumba Iron Ore management is actively discussing the issue with SARS with a view to seeking resolution and believes that the accounting for these matters is appropriate in the results for the year ended 31 December 2014.
FINANCIAL STATEMENTS AND OTHER FINANCIAL INFORMATION NOTES TO THE FINANCIAL STATEMENTS
ADDITIONAL DISCLOSURES

Anglo American plc Annual Report 2014 153
Financial statements
35. RELATED PARTY TRANSACTIONSThe Group has a related party relationship with its subsidiaries, joint operations, associates and joint ventures (see note 37). Members of the Board and the Group Management Committee are considered to be related parties.
The Company and its subsidiaries, in the ordinary course of business, enter into various sales, purchase and service transactions with joint operations, associates, joint ventures and others in which the Group has a material interest. These transactions are under terms that are no less favourable to the Group than those arranged with third parties. These transactions are not considered to be significant, other than purchases by De Beers from its joint operations in excess of its attributable share of their production, which amounted to $3,493 million (2013: $3,064 million).
Loans receivable(1) US$ million 2014 2013Associates 98 164 Joint ventures 329 265
427 429
(1) These loans are included in ‘Financial asset investments’.
At 31 December 2014 the directors of the Company and their immediate relatives controlled 0.1% (2013: 0.1%) of the voting shares of the Company.
Remuneration and benefits received by directors are disclosed in the Remuneration report. Remuneration and benefits of key management personnel, including directors, are disclosed in note 26.
Information relating to pension fund arrangements is disclosed in note 27.
Refinancing of AtlatsaIn January 2014, Platinum completed the second and final phase of the refinancing transaction for Atlatsa Resources Corporation (Atlatsa). Platinum sold its existing 27.0% indirect equity interest in Atlatsa to the controlling Black Economic Empowerment (BEE) shareholders and subscribed for equity shares in Atlatsa representing a 22.8% direct interest. In return the level of debt outstanding from Atlatsa was reduced. These transactions resulted in an increase in ‘Investments in associates’ of $69 million, a net decrease in ‘Financial asset investments’ of $47 million and a net gain of $22 million recorded within ‘Non-operating special items’.
The first phase of the refinancing transaction completed in December 2013. Platinum acquired certain properties from Bokoni Platinum Holdings Proprietary Limited, which is an associate of the Group and is controlled by Atlatsa. In return the level of debt outstanding from Atlatsa was reduced. A charge of $37 million was recorded within ‘Non-operating special items’ for the year ended 31 December 2013 in relation to this transaction.
36. EVENTS OCCURRING AFTER END OF YEARWith the exception of the proposed final dividend for 2014 (see note 10), there have been no reportable events since 31 December 2014.
FINANCIAL STATEMENTS AND OTHER FINANCIAL INFORMATION NOTES TO THE FINANCIAL STATEMENTS
ADDITIONAL DISCLOSURES

154 Anglo American plc Annual Report 2014
37. GROUP COMPANIESThe Group consists of the parent company, Anglo American plc, incorporated in the United Kingdom and its subsidiaries, joint operations, joint ventures and associates. For information on the Group’s policies and the nature of any significant judgements in relation to the basis of accounting for interests in other entities, see note 1. Further information on interests in associates and joint ventures is provided in note 13.
The Group holds certain interests in both consolidated and unconsolidated structured entities. Further details on consolidated structured entities can be found in note 32. Unconsolidated structured entities consist of employee benefit trusts and community investment vehicles, principally in South Africa. Financial support provided to these entities by the Group is not material.
The principal subsidiaries, joint operations, joint ventures and associates of the Group and the Group percentage of equity capital and joint arrangements are set out below. All these interests are held indirectly by the parent company and are consolidated within these financial statements. As permitted by section 410 of the Companies Act 2006, the Group has restricted the information provided to its principal subsidiaries in order to avoid a statement of excessive length.
Percentage of equity owned(2)
Subsidiary undertakings Country of incorporation(1) Business 2014 2013Iron Ore and ManganeseAnglo American Minério de Ferro Brasil SA Brazil Iron ore project 100% 100%Anglo Ferrous Brazil SA Brazil Iron ore 100% 100%Kumba Iron Ore Limited South Africa Iron ore 69.7% 69.7%Sishen Iron Ore Company (Proprietary) Limited(3) South Africa Iron ore 73.9% 73.9%
CoalAnglo American Metallurgical Coal Holdings Limited Australia Coal 100% 100%Anglo Coal(4) South Africa Coal 100% 100%Peace River Coal Inc. Canada Coal 100% 100%
CopperAnglo American Sur SA Chile Copper 50.1% 50.1%Anglo American Norte SA(5) Chile Copper 100% 100%Anglo American Quellaveco SA Peru Copper project 81.9% 81.9%
NickelAnglo American Níquel Brasil Limitada (Barro Alto) Brazil Nickel project 100% 100%Anglo American Níquel Brasil Limitada (Codemin) Brazil Nickel 100% 100%
NiobiumAnglo American Nióbio Brasil Limitada Brazil Niobium 100% 100%
PhosphatesAnglo American Fosfatos Brasil Limitada Brazil Phosphates 100% 100%
PlatinumAnglo American Platinum Limited(6) South Africa Platinum 78% 78%
De BeersDe Beers Consolidated Mines Proprietary Limited(7) South Africa Diamonds 74% 74%De Beers Société Anonyme Luxembourg Diamonds 85% 85%
Percentage of equity owned(8)
Proportionately consolidated joint operations Country of incorporation(1) Business 2014 2013Capcoal(9) Australia Coal 70% 70%Dawson(9) Australia Coal 51% 51%Drayton(9) Australia Coal 88.2% 88.2%Foxleigh(9) Australia Coal 70% 70%Moranbah North(9) Australia Coal 88% 88%Compañía Minera Doña Inés de Collahuasi SCM Chile Copper 44% 44%Debswana Diamond Company (Proprietary) Limited(10) Botswana Diamonds 50% 50%Namdeb Holdings (Proprietary) Limited(11) Namibia Diamonds 50% 50%
Percentage of equity owned(8)
Joint ventures Country of incorporation(1) Business 2014 2013LLX Minas-Rio Logística Comercial Exportadora SA(12) Brazil Port 50% 49%Lafarge Tarmac Holdings Limited United Kingdom Heavy building materials 50% 50%AI Futtain Tarmac Quarry Products Limited Dubai Heavy building materials 49% 49%Tarmac Oman Limited Hong Kong Heavy building materials 50% 50%Midmac Tarmac Qatar LLC Qatar Heavy building materials 50% 50%
See page 155 for footnotes.
FINANCIAL STATEMENTS AND OTHER FINANCIAL INFORMATION NOTES TO THE FINANCIAL STATEMENTS
ADDITIONAL DISCLOSURES

Anglo American plc Annual Report 2014 155
Financial statements
37. GROUP COMPANIES continuedPercentage of equity owned(8)
Associates Country of incorporation(1) Business 2014 2013Samancor Holdings Proprietary Limited(13)(14) South Africa Manganese 40% 40%Groote Eylandt Mining Company Pty Limited (GEMCO)(13) Australia Manganese 40% 40%Tasmanian Electro Metallurgical Company Pty Limited (TEMCO)(13) Australia Manganese 40% 40%Carbones del Cerrejón LLC Anguilla Coal 33.3% 33.3%Cerrejón Zona Norte SA Colombia Coal 33.3% 33.3%Jellinbah Group Pty Limited(15) Australia Coal 33.3% 33.3%
(1) The principal country of operation is the same as the country of incorporation for all entities with the exception of De Beers Société Anonyme (De Beers), which has worldwide operations.(2) The proportion of voting rights of subsidiaries held by the Group is the same as the proportion of equity owned.(3) The 73.9% interest in Sishen Iron Ore Company (Proprietary) Limited (SIOC) is held indirectly through Kumba Iron Ore, in which the Group has a 69.7% interest. A further 3.1% interest in SIOC
is held by the Kumba Envision Trust for the benefit of participants in Kumba’s broad based employee share scheme for non-managerial Historically Disadvantaged South African employees. The Trust meets the definition of a subsidiary under IFRS, and is therefore consolidated by Kumba Iron Ore. Consequently the effective interest in SIOC included in the Group’s results is 53.7%.
(4) A division of Anglo Operations Proprietary Limited, a wholly owned subsidiary.(5) Non-controlling interest of 0.018%.(6) The Group’s effective interest in Anglo American Platinum Limited is 79.8% (2013: 79.9%), which includes shares issued as part of a community empowerment deal.(7) The 74% interest in De Beers Consolidated Mines Proprietary Limited (DBCM) is held indirectly through De Beers. The 74% interest represents De Beers’ legal ownership share in DBCM. For
accounting purposes De Beers consolidates 100% of DBCM as it is deemed to control the BEE entity, Ponahalo, which holds the remaining 26%. The Group’s effective interest in DBCM is 85%.(8) All equity interests shown are ordinary shares.(9) The wholly owned subsidiary Anglo American Metallurgical Coal Holdings Limited holds the proportionately consolidated joint operations. These operations are unincorporated and
jointly controlled.(10) The 50% interest in Debswana Diamond Company (Proprietary) Limited is held indirectly through De Beers and is consolidated on a 19.2% proportionate basis, reflecting economic interest.
The Group’s effective interest in Debswana Diamond Company (Proprietary) Limited is 16.3%.(11) The 50% interest in Namdeb Holdings (Proprietary) Limited is held indirectly through De Beers. The Group’s effective interest in Namdeb Holdings (Proprietary) Limited is 42.5%.(12) Operating as Ferroport.(13) These entities have a 30 June year end.(14) Samancor Holdings Proprietary Limited is the parent company of Hotazel Manganese Mines (HMM) and the Metalloys Smelter. BEE shareholders hold a 27% interest in HMM and therefore the
Group’s effective ownership interest in HMM is 29%.(15) The Group’s effective interest in the Jellinbah operation is 23.3%. The entity has a 30 June year end.
38. FINANCIAL RISK MANAGEMENTThe Board approves and monitors the risk management processes, including documented treasury policies, counterparty limits and controlling and reporting structures. The risk management processes of the Group’s independently listed subsidiaries are in line with the Group’s own policy.
The types of risk exposure, the way in which such exposure is managed and quantification of the level of exposure in the Consolidated balance sheet at 31 December is as follows (subcategorised into credit risk, commodity price risk, foreign exchange risk and interest rate risk). See note 24 for liquidity risk.
Market risksa) Credit riskCredit risk is the risk that a counterparty to a financial instrument will cause a loss to the Group by failing to pay for its obligation. The Group’s principal financial assets are cash, trade and other receivables, investments and derivative financial instruments. The Group’s maximum exposure to credit risk primarily arises from these financial assets and is as follows:
US$ million 2014 2013Cash and cash equivalents 6,747 7,702 Trade and other receivables(1) 2,465 3,874 Financial asset investments(2) 761 759 Derivative financial assets 1,133 674
11,106 13,009
(1) Trade and other receivables exclude prepayments and tax receivables.(2) Financial asset investments exclude available for sale investments.
The Group limits credit risk on liquid funds and derivative financial instruments through diversification of exposures with a range of financial institutions approved by the Board. Counterparty limits are set for each financial institution with reference to credit ratings assigned by Standard & Poor’s, Moody’s and Fitch Ratings, shareholder equity (in case of relationship banks) and fund size (in case of asset managers).
Given the diverse nature of the Group’s operations (both in relation to commodity markets and geographically), and the use of payment security instruments (including letters of credit from financial institutions), it does not have significant concentration of credit risk in respect of trade receivables, with exposure spread over a large number of customers.
A provision for impairment of trade receivables is made where there is an identified loss event which, based on previous experience, is evidence of a reduction in the recoverability of the cash flows. Details of the credit quality of trade receivables and the associated provision for impairment are disclosed in note 16.
FINANCIAL STATEMENTS AND OTHER FINANCIAL INFORMATION NOTES TO THE FINANCIAL STATEMENTS
ADDITIONAL DISCLOSURES
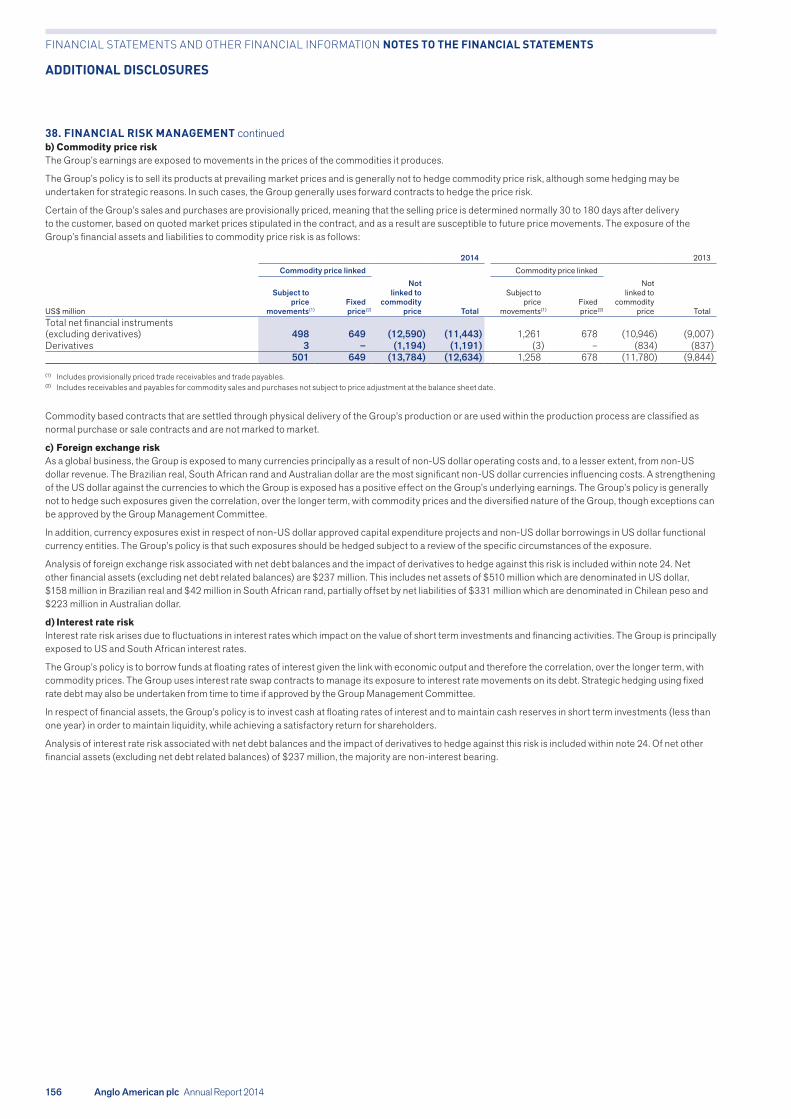
156 Anglo American plc Annual Report 2014
38. FINANCIAL RISK MANAGEMENT continuedb) Commodity price riskThe Group’s earnings are exposed to movements in the prices of the commodities it produces.
The Group’s policy is to sell its products at prevailing market prices and is generally not to hedge commodity price risk, although some hedging may be undertaken for strategic reasons. In such cases, the Group generally uses forward contracts to hedge the price risk.
Certain of the Group’s sales and purchases are provisionally priced, meaning that the selling price is determined normally 30 to 180 days after delivery to the customer, based on quoted market prices stipulated in the contract, and as a result are susceptible to future price movements. The exposure of the Group’s financial assets and liabilities to commodity price risk is as follows:
2014 2013Commodity price linked
Not linked to
commodity price Total
Commodity price linked
US$ million
Subject to price
movements(1)Fixedprice(2)
Subject to price
movements(1)Fixedprice(2)
Not linked to
commodity price Total
Total net financial instruments (excluding derivatives) 498 649 (12,590) (11,443) 1,261 678 (10,946) (9,007) Derivatives 3 – (1,194) (1,191) (3) – (834) (837)
501 649 (13,784) (12,634) 1,258 678 (11,780) (9,844)
(1) Includes provisionally priced trade receivables and trade payables.(2) Includes receivables and payables for commodity sales and purchases not subject to price adjustment at the balance sheet date.
Commodity based contracts that are settled through physical delivery of the Group’s production or are used within the production process are classified as normal purchase or sale contracts and are not marked to market.
c) Foreign exchange riskAs a global business, the Group is exposed to many currencies principally as a result of non-US dollar operating costs and, to a lesser extent, from non-US dollar revenue. The Brazilian real, South African rand and Australian dollar are the most significant non-US dollar currencies influencing costs. A strengthening of the US dollar against the currencies to which the Group is exposed has a positive effect on the Group’s underlying earnings. The Group’s policy is generally not to hedge such exposures given the correlation, over the longer term, with commodity prices and the diversified nature of the Group, though exceptions can be approved by the Group Management Committee.
In addition, currency exposures exist in respect of non-US dollar approved capital expenditure projects and non-US dollar borrowings in US dollar functional currency entities. The Group’s policy is that such exposures should be hedged subject to a review of the specific circumstances of the exposure.
Analysis of foreign exchange risk associated with net debt balances and the impact of derivatives to hedge against this risk is included within note 24. Net other financial assets (excluding net debt related balances) are $237 million. This includes net assets of $510 million which are denominated in US dollar, $158 million in Brazilian real and $42 million in South African rand, partially offset by net liabilities of $331 million which are denominated in Chilean peso and $223 million in Australian dollar.
d) Interest rate riskInterest rate risk arises due to fluctuations in interest rates which impact on the value of short term investments and financing activities. The Group is principally exposed to US and South African interest rates.
The Group’s policy is to borrow funds at floating rates of interest given the link with economic output and therefore the correlation, over the longer term, with commodity prices. The Group uses interest rate swap contracts to manage its exposure to interest rate movements on its debt. Strategic hedging using fixed rate debt may also be undertaken from time to time if approved by the Group Management Committee.
In respect of financial assets, the Group’s policy is to invest cash at floating rates of interest and to maintain cash reserves in short term investments (less than one year) in order to maintain liquidity, while achieving a satisfactory return for shareholders.
Analysis of interest rate risk associated with net debt balances and the impact of derivatives to hedge against this risk is included within note 24. Of net other financial assets (excluding net debt related balances) of $237 million, the majority are non-interest bearing.
FINANCIAL STATEMENTS AND OTHER FINANCIAL INFORMATION NOTES TO THE FINANCIAL STATEMENTS
ADDITIONAL DISCLOSURES

Anglo American plc Annual Report 2014 157
Financial statements
38. FINANCIAL RISK MANAGEMENT continuede) Financial instrument sensitivitiesFinancial instruments affected by market risk include borrowings, deposits, derivative financial instruments, trade receivables and trade payables. The following analysis is intended to illustrate the sensitivity of the Group’s financial instruments at 31 December to changes in foreign currencies, commodity prices and interest rates.
The sensitivity analysis has been prepared on the basis that the components of net debt, the ratio of fixed to floating interest rates of the debt and derivatives portfolio and the proportion of financial instruments in foreign currencies are all constant and on the basis of the hedge designations in place at 31 December. In addition, the commodity price impact for provisionally priced contracts is based on the related trade receivables and trade payables at 31 December. As a consequence, this sensitivity analysis relates to the position at 31 December.
The following assumptions were made in calculating the sensitivity analysis:
• all income statement sensitivities also impact equity
• for debt and other deposits carried at amortised cost, carrying value does not change as interest rates move
• no sensitivity is provided for interest accruals as these are based on pre-agreed interest rates and therefore are not susceptible to further rate changes
• no sensitivity has been calculated on derivatives and related underlying instruments designated into fair value hedge relationships as these are assumed materially to offset one another
• all hedge relationships are assumed to be fully effective
• debt with a maturity of less than one year is floating rate, unless it is a long term fixed rate debt in its final year
• translation of foreign subsidiaries and operations into the Group’s presentation currency has been excluded from the sensitivity.
Using the above assumptions, the following table shows the illustrative effect on the income statement and equity that would result from reasonably possible changes in the relevant commodity price.
2014 2013US$ million Income Equity Income EquityForeign currency sensitivities(1)
+10% US dollar to rand 61 61 16 16–10% US dollar to rand (61) (61) (16) (16)+10% US dollar to Brazilian real(2) (154) (154) (167) (167)–10% US dollar to Brazilian real(2) 154 154 155 155+10% US dollar to Australian dollar 30 30 37 37 –10% US dollar to Australian dollar (30) (30) (37) (37) +10% US dollar to Chilean peso 36 36 30 30 –10% US dollar to Chilean peso (40) (40) (32) (32) Commodity price sensitivities10% increase in the copper price 103 103 109 109 10% decrease in the copper price (103) (103) (109) (109) 10% increase in the platinum price (21) (21) (15) (15) 10% decrease in the platinum price 21 21 15 15 Interest rate sensitivity50bps increase in LIBOR(3) (4) (4) (7) (7)50bps decrease in LIBOR(3) 4 4 7 7
(1) + represents strengthening of US dollar against the respective currency.(2) Includes sensitivities for derivatives related to capital expenditure. (3) Without the impact of capitalised interest, the Group’s sensitivity to a 50bps increase and decrease in LIBOR would be $49 million (2013: $44 million) loss and gain respectively.
The above sensitivities are calculated with reference to a single moment in time and are subject to change due to a number of factors including:
• fluctuating trade receivable and trade payable balances
• derivative instruments and borrowings settled throughout the year
• fluctuating cash balances
• changes in currency mix.
As the sensitivities are limited to year end financial instrument balances, they do not take account of the Group’s sales and operating costs, which are highly sensitive to changes in commodity prices and exchange rates. In addition, each of the sensitivities is calculated in isolation whilst, in reality, commodity prices, interest rates and foreign currencies do not move independently.
FINANCIAL STATEMENTS AND OTHER FINANCIAL INFORMATION NOTES TO THE FINANCIAL STATEMENTS
ADDITIONAL DISCLOSURES

158 Anglo American plc Annual Report 2014
39. ACCOUNTING POLICIESBasis of preparationThe financial statements have been prepared in accordance with International Financial Reporting Standards (IFRS) and IFRS Interpretations Committee (IFRIC) interpretations as adopted for use by the European Union, with those parts of the Companies Act 2006 applicable to companies reporting under IFRS and with the requirements of the Disclosure and Transparency rules of the Financial Conduct Authority in the United Kingdom as applicable to periodic financial reporting. The financial statements have been prepared under the historical cost convention as modified by the revaluation of pension assets and liabilities and certain financial instruments. A summary of the principal Group accounting policies is set out below.
The preparation of financial statements in conformity with generally accepted accounting principles requires the use of estimates and assumptions that affect the reported amounts of assets and liabilities at the date of the financial statements and the reported amounts of revenues and expenses during the reporting period. Although these estimates are based on management’s best knowledge of the amount, event or actions, actual results ultimately may differ from those estimates.
As permitted by UK company law, the Group’s results are presented in US dollars, the currency in which its business is primarily conducted.
Going concernThe directors have, at the time of approving the financial statements, a reasonable expectation that the Company and the Group have adequate resources to continue in operational existence for the foreseeable future. Thus the going concern basis of accounting in preparing the financial statements continues to be adopted. Further details are contained in the Directors’ report on page 212.
Basis of consolidationThe financial statements incorporate a consolidation of the financial statements of the Company and entities controlled by the Company (its subsidiaries). Control is achieved where the Company is exposed, or has rights, to variable returns from its involvement with the investee and has the ability to affect those returns through its power over the investee.
The results of subsidiaries acquired or disposed of during the year are included in the income statement from the effective date of acquisition or up to the effective date of disposal, as appropriate.
Where necessary, adjustments are made to the results of subsidiaries, joint arrangements and associates to bring their accounting policies into line with those used by the Group. Intra-group transactions, balances, income and expenses are eliminated on consolidation, where appropriate.
For non-wholly owned subsidiaries, non-controlling interests are presented in equity separately from the equity attributable to shareholders of the Company. Profit or loss and other comprehensive income are attributed to the shareholders of the Company and to the non-controlling interest even if this results in the non-controlling interests having a deficit balance.
Changes in ownership interest in subsidiaries that do not result in a change in control are accounted for in equity. The carrying amounts of the controlling and non-controlling interests are adjusted to reflect the changes in their relative interests in the subsidiary. Any difference between the amount by which the non-controlling interest is adjusted and the fair value of the consideration paid or received is recorded directly in equity and attributed to the shareholders of the Company.
39a. Revenue recognitionRevenue is derived principally from the sale of goods and is measured at the fair value of consideration received or receivable, after deducting discounts, volume rebates, value added tax and other sales taxes. Sales of concentrate are stated at their invoiced amount which is net of treatment and refining charges. A sale is recognised when the significant risks and rewards of ownership have passed. This is usually when title and insurance risk have passed to the customer and the goods have been delivered to a contractually agreed location.
Revenue from metal mining activities is based on the payable metal sold.
Sales of certain commodities are provisionally priced such that the price is not settled until a predetermined future date and is based on the market price at that time. Revenue on these sales is initially recognised (when the above criteria are met) at the current market price. Provisionally priced sales are marked to market at each reporting date using the forward price for the period equivalent to that outlined in the contract. This mark to market adjustment is recognised in revenue.
Revenues from the sale of material by-products are included within revenue. Where a by-product is not regarded as significant, revenue may be credited against the cost of sales.
Interest income is accrued on a time basis, by reference to the principal outstanding and at the effective interest rate applicable.
Dividend income from investments is recognised when the shareholders’ rights to receive payment have been established.
39b. Borrowing costsInterest on borrowings directly relating to the financing of qualifying capital projects under construction is added to the capitalised cost of those projects during the construction phase, until such time as the assets are substantially ready for their intended use or sale which, in the case of mining properties, is when they are capable of commercial production. Where funds have been borrowed specifically to finance a project, the amount capitalised represents the actual borrowing costs incurred. Where the funds used to finance a project form part of general borrowings, the amount capitalised is calculated using a weighted average of rates applicable to relevant general borrowings of the Group during the period. All other borrowing costs are recognised in the income statement in the period in which they are incurred.
39c. TaxThe tax expense includes the current tax and deferred tax charge recognised in the income statement.
Current tax payable is based on taxable profit for the year. Taxable profit differs from net profit as reported in the income statement because it excludes items of income or expense that are taxable or deductible in other years and it further excludes items that are not taxable or deductible. The Group’s liability for current tax is calculated using tax rates that have been enacted or substantively enacted by the reporting date.
Deferred tax is recognised in respect of temporary differences between the carrying amounts of assets and liabilities for financial reporting purposes and the amounts used for taxation purposes. Deferred tax liabilities are generally recognised for all taxable temporary differences and deferred tax assets are recognised to the extent that it is probable that taxable profits will be available against which deductible temporary differences can be utilised. Such assets and liabilities are not recognised if the temporary differences arise from the initial recognition of goodwill or of an asset or liability in a transaction (other than in a business combination) that affects neither taxable profit nor accounting profit.
Deferred tax liabilities are recognised for taxable temporary differences arising on investments in subsidiaries, joint arrangements and associates except where the Group is able to control the reversal of the temporary difference and it is probable that the temporary difference will not reverse in the foreseeable future.
The carrying amount of deferred tax assets is reviewed at each reporting date and is adjusted to the extent that it is no longer probable that sufficient taxable profit will be available to allow all or part of the asset to be recovered.
Deferred tax is calculated at the tax rates that are expected to apply in the period when the liability is settled or the asset is realised, based on the laws that have been enacted or substantively enacted by the reporting date. Deferred tax is charged or credited to the income statement, except when it relates to items charged or credited directly to equity, in which case the deferred tax is also taken directly to equity.
Deferred tax assets and liabilities are offset when they relate to income taxes levied by the same taxation authority and the Group intends to settle its current tax assets and liabilities on a net basis in that taxation authority.
FINANCIAL STATEMENTS AND OTHER FINANCIAL INFORMATION NOTES TO THE FINANCIAL STATEMENTS
ADDITIONAL DISCLOSURES

Anglo American plc Annual Report 2014 159
Financial statements
39. ACCOUNTING POLICIES continued39d. Business combinations and goodwill arising thereonThe identifiable assets, liabilities and contingent liabilities of a subsidiary, a joint arrangement or an associate, which can be measured reliably, are recorded at their provisional fair values at the date of acquisition. Goodwill is the fair value of the consideration transferred (including contingent consideration and previously held non-controlling interests) less the fair value of the Group’s share of identifiable net assets on acquisition.
Where a business combination is achieved in stages, the Group’s previously held interests in the acquiree are remeasured to fair value at the acquisition date and the resulting gain or loss is recognised in the income statement.
Amounts arising from interests in the acquiree prior to the acquisition date that have previously been recognised in other comprehensive income are reclassified to the income statement, where such treatment would be appropriate if that interest were disposed of.
Transaction costs incurred in connection with the business combination are expensed. Provisional fair values are finalised within 12 months of the acquisition date.
Goodwill in respect of subsidiaries and joint operations is included within intangible assets. Goodwill relating to associates and joint ventures is included within the carrying value of the investment.
Where the fair value of the identifiable net assets acquired exceeds the cost of the acquisition, the surplus, which represents the discount on the acquisition, is recognised directly in the income statement in the period of acquisition.
For non-wholly owned subsidiaries, non-controlling interests are initially recorded at the non-controlling interest’s proportion of the fair values of net assets recognised at acquisition.
39e. Non-mining licences and other intangiblesNon-mining licences and other intangibles are measured at cost less accumulated amortisation and accumulated impairment losses. Intangible assets acquired as part of an acquisition of a business are capitalised separately from goodwill if the asset is separable or arises from contractual or legal rights and the fair value can be measured reliably on initial recognition. Intangible assets are amortised over their estimated useful lives, usually between 3 and 20 years, except goodwill and those intangible assets that are considered to have indefinite lives. For intangible assets with a finite life, the amortisation period is determined as the period over which the Group expects to obtain benefits from the asset, taking account of all relevant facts and circumstances including contractual lives and expectations about the renewal of contractual arrangements without significant incremental costs. An intangible asset is deemed to have an indefinite life when, based on an analysis of all of the relevant factors, there is no foreseeable limit to the period over which the asset is expected to generate cash flows for the Group. Amortisation methods, residual values and estimated useful lives are reviewed at least annually.
39f. Impairment of goodwillGoodwill arising on business combinations is allocated to the group of cash generating units (CGUs) that is expected to benefit from synergies of the combination, and represents the lowest level at which goodwill is monitored by the Group’s board of directors for internal management purposes. The recoverable amount of the CGU, or group of CGUs, to which goodwill has been allocated is tested for impairment annually, or when events or changes in circumstances indicate that it may be impaired.
Any impairment loss is recognised immediately in the income statement. Impairment of goodwill is not subsequently reversed.
39g. Property, plant and equipmentMining properties and leases include the cost of acquiring and developing mining properties and mineral rights.
Mining properties are depreciated to their residual values using the unit of production method based on Proved and Probable Ore Reserves and, in certain limited circumstances, other Mineral Resources. Mineral Resources are included in depreciation calculations where there is a high degree of confidence that they will be extracted in an economic manner. For diamond operations, depreciation calculations are based on Diamond Reserves and Resources included in the Life of Mine Plan. Depreciation is charged on new mining ventures from the date that the mining property is capable of commercial production. When there is little likelihood of a mineral right being exploited, or the value of the exploitable mineral right has diminished below cost, an impairment loss is recognised in the income statement.
Capital works in progress are measured at cost less any recognised impairment. Depreciation commences when the assets reach commercial production, at which point they are transferred to the appropriate asset class. Buildings and plant and equipment are depreciated to their residual values at varying rates on a straight line basis over their estimated useful lives or the Reserve Life, whichever is shorter. Estimated useful lives normally vary from up to 20 years for items of plant and equipment to a maximum of 50 years for buildings. Land is not depreciated.
When parts of an item of property, plant and equipment have different useful lives, they are accounted for as separate items (major components).
Depreciation methods, residual values and estimated useful lives are reviewed at least annually.
Assets held under finance leases are depreciated over the shorter of the lease term and the estimated useful lives of the assets.
Gains or losses on disposal of property, plant and equipment are determined by comparing the proceeds from disposal with the carrying amount. The gain or loss is recognised in the income statement.
39h. Deferred strippingThe removal of overburden and other mine waste materials is often necessary during the initial development of a mine site, in order to access the mineral ore deposit. The directly attributable cost of this activity is capitalised in full within mining properties and leases, until the point at which the mine is considered to be capable of commercial production. This is classified as expansionary capital expenditure, within investing cash flows.
The removal of waste material after the point at which a mine is capable of commercial production is referred to as production stripping.
When the waste removal activity improves access to ore extracted in the current period, the costs of production stripping are charged to the income statement as operating costs in accordance with the principles of IAS 2 Inventories.
Where production stripping activity both produces inventory and improves access to ore in future periods the associated costs of waste removal are allocated between the two elements. The portion which benefits future ore extraction is capitalised within stripping and development capital expenditure. If the amount to be capitalised cannot be specifically identified it is determined based on the volume of waste extracted compared with expected volume for the identified component of the orebody. Components are specific volumes of a mine’s orebody that are determined by reference to the Life of Mine Plan.
In certain instances significant levels of waste removal may occur during the production phase with little or no associated production. This may occur at both open pit and underground mines, for example longwall development. The cost of this waste removal is capitalised in full.
All amounts capitalised in respect of waste removal are depreciated using the unit of production method based on Proved and Probable Ore Reserves of the component of the orebody to which they relate.
The effects of changes to the Life of Mine Plan on the expected cost of waste removal or remaining reserves for a component are accounted for prospectively as a change in estimate.
FINANCIAL STATEMENTS AND OTHER FINANCIAL INFORMATION NOTES TO THE FINANCIAL STATEMENTS
ADDITIONAL DISCLOSURES

160 Anglo American plc Annual Report 2014
39. ACCOUNTING POLICIES continued39i. Impairment of property, plant and equipment and intangible assets excluding goodwillAt each reporting date, the Group reviews the carrying amounts of its property, plant and equipment and intangible assets to determine whether there is any indication that those assets are impaired. If such an indication exists, the recoverable amount of the asset is estimated in order to determine the extent of any impairment. Where the asset does not generate cash flows that are independent from other assets, the Group estimates the recoverable amount of the CGU to which the asset belongs. An intangible asset with an indefinite useful life is tested for impairment annually and whenever there is an indication that the asset may be impaired.
Recoverable amount is the higher of fair value less costs of disposal and value in use (VIU). In assessing VIU, the estimated future cash flows are discounted to their present value using a pre-tax discount rate that reflects current market assessments of the time value of money and the risks specific to the asset for which estimates of future cash flows have not been adjusted.
If the recoverable amount of an asset or CGU is estimated to be less than its carrying amount, the carrying amount of the asset or CGU is reduced to its recoverable amount. An impairment loss is recognised in the income statement.
Where an impairment loss subsequently reverses, the carrying amount of the asset or CGU is increased to the revised estimate of its recoverable amount, but so that the increased carrying amount does not exceed the carrying amount that would have been determined had no impairment been recognised for the asset or CGU. A reversal of an impairment loss is recognised in the income statement.
39j. Exploration, evaluation and development expenditureExploration and evaluation expenditure is expensed in the year in which it is incurred. When a decision is taken that a mining property is economically feasible, all subsequent evaluation expenditure is capitalised within property, plant and equipment including, where applicable, directly attributable pre-production development expenditure. Capitalisation of such expenditure ceases when the mining property is capable of commercial production.
Exploration properties acquired are recognised in the balance sheet at cost less any accumulated impairment losses. Such properties and capitalised evaluation and pre-production development expenditure prior to commercial production are assessed for impairment in accordance with the Group’s accounting policy stated above.
39k. Associates and joint arrangementsAssociates are investments over which the Group has significant influence, which is the power to participate in the financial and operating policy decisions of the investee, but without the ability to exercise control or joint control. Typically the Group owns between 20% and 50% of the voting equity of its associates.
Joint arrangements are arrangements in which the Group shares joint control with one or more parties. Joint control is the contractually agreed sharing of control of an arrangement, and exists only when decisions about the activities that significantly affect the arrangement’s returns require the unanimous consent of the parties sharing control.
Joint arrangements are classified as either joint operations or joint ventures based on the rights and obligations of the parties to the arrangement. In joint operations, the parties have rights to the assets and obligations for the liabilities relating to the arrangement, whereas in joint ventures, the parties have rights to the net assets of the arrangement.
Joint arrangements that are not structured through a separate vehicle are always joint operations. Joint arrangements that are structured through a separate vehicle may be either joint operations or joint ventures depending on the substance of the arrangement. In these cases, consideration is given to the legal form of the separate vehicle, the terms of the contractual arrangement and, when relevant, other facts and circumstances. When the activities of an arrangement are primarily designed for the provision of output to the parties, and the parties are substantially the only source of cash flows contributing to the continuity of the operations of the arrangement, this indicates the parties to the arrangements have rights to the assets and obligations for the liabilities.
The Group accounts for joint operations by recognising the assets, liabilities, revenue and expenses for which it has rights or obligations, including its share of such items held or incurred jointly.
Investments in associates and joint ventures are accounted for using the equity method of accounting except when classified as held for sale. The Group’s share of associates’ and joint ventures’ net income is based on their most recent audited financial statements or unaudited interim statements drawn up to the Group’s balance sheet date.
The total carrying values of investments in associates and joint ventures represent the cost of each investment including the carrying value of goodwill, the share of post acquisition retained earnings, any other movements in reserves and any long term debt interests which in substance form part of the Group’s net investment. The carrying values of associates and joint ventures are reviewed on a regular basis and if there is objective evidence that an impairment in value has occurred as a result of one or more events during the period, the investment is impaired.
The Group’s share of an associate’s or joint venture’s losses in excess of its interest in that associate or joint venture is not recognised unless the Group has an obligation to fund such losses. Unrealised gains arising from transactions with associates and joint ventures are eliminated against the investment to the extent of the Group’s interest in the investee. Unrealised losses are eliminated in the same way, but only to the extent that there is no evidence of impairment.
39l. Financial asset investmentsInvestments, other than investments in subsidiaries, joint arrangements and associates, are financial asset investments and are initially recognised at fair value. At subsequent reporting dates, financial assets classified as held-to-maturity or as loans and receivables are measured at amortised cost, less any impairment losses. Other investments are classified as either at fair value through profit or loss (which includes investments held for trading) or available for sale financial assets. Both categories are subsequently measured at fair value. Where investments are held for trading purposes, unrealised gains and losses for the period are included in the income statement within other gains and losses. For available for sale investments, unrealised gains and losses are recognised in equity until the investment is disposed of or impaired, at which time the cumulative gain or loss previously recognised in equity is recycled to the income statement.
39m. Impairment of financial assets (including receivables)A financial asset not measured at fair value through profit or loss is assessed at each reporting date to determine whether there is any objective evidence that it is impaired. A financial asset is impaired if objective evidence indicates that a loss event has occurred after the initial recognition of the asset.
An impairment loss in respect of a financial asset measured at amortised cost is calculated as the difference between its carrying amount and the present value of the estimated cash flows discounted at the asset’s original effective interest rate. Losses are recognised in the income statement. When a subsequent event causes the amount of impairment loss to decrease, the decrease in impairment loss is reversed through the income statement.
Impairment losses relating to available for sale investments are recognised when a decline in fair value is considered significant or prolonged. These impairment losses are recognised by transferring the cumulative loss that has been recognised in the statement of comprehensive income to the income statement. The loss recognised in the income statement is the difference between the acquisition cost and the current fair value.
39n. Derivative financial instruments and hedge accountingIn order to hedge its exposure to foreign exchange, interest rate and commodity price risk, the Group enters into forward, option and swap contracts. The Group does not use derivative financial instruments for speculative purposes. Commodity based (own use) contracts that meet the scope exemption in IAS 39 Financial Instruments: Recognition and Measurement are recognised in earnings when they are settled by physical delivery.
FINANCIAL STATEMENTS AND OTHER FINANCIAL INFORMATION NOTES TO THE FINANCIAL STATEMENTS
ADDITIONAL DISCLOSURES

Anglo American plc Annual Report 2014 161
Financial statements
39. ACCOUNTING POLICIES continuedAll derivatives are held at fair value in the balance sheet within ‘Derivative financial assets’ or ‘Derivative financial liabilities’ except if they are linked to settlement and delivery of an unquoted equity instrument and the fair value cannot be measured reliably, in which case they are carried at cost. A derivative cannot be measured reliably where the range of reasonable fair value estimates is significant and the probabilities of various estimates cannot be reasonably assessed.
Changes in the fair value of derivative financial instruments that are designated and effective as hedges of future cash flows (cash flow hedges) are recognised directly in equity. The gain or loss relating to the ineffective portion is recognised immediately in the income statement. If the cash flow hedge of a firm commitment or forecast transaction results in the recognition of a non-financial asset or liability, then, at the time the asset or liability is recognised, the associated gains or losses on the derivative that had previously been recognised in equity are included in the initial measurement of the asset or liability. For hedges that do not result in the recognition of a non-financial asset or liability, amounts deferred in equity are recognised in the income statement in the same period in which the hedged item affects profit or loss.
For an effective hedge of an exposure to changes in fair value, the hedged item is adjusted for changes in fair value attributable to the risk being hedged. The corresponding entry, along with gains or losses from remeasuring the associated derivative, are recognised in the income statement.
The gain or loss on hedging instruments relating to the effective portion of a net investment hedge is recognised in equity (within the cumulative translation adjustment reserve). The ineffective portion is recognised immediately in the income statement. Gains or losses accumulated in the cumulative translation adjustment reserve are recycled to the income statement on disposal of the foreign operations to which they relate.
Hedge accounting is discontinued when the hedging instrument expires or is sold, terminated, exercised, revoked, or no longer qualifies for hedge accounting. At that time, any cumulative gain or loss on the hedging instrument recognised in equity is retained until the forecast transaction occurs. If a hedge transaction is no longer expected to occur, the net cumulative gain or loss previously recognised in equity is recycled to the income statement for the period.
Changes in the fair value of any derivative instruments that are not designated in a hedge relationship are recognised immediately in the income statement and are classified within other gains and losses (operating costs) or net finance costs depending on the type of risk to which the derivative relates.
Derivatives embedded in other financial instruments or non-financial host contracts are treated as separate derivatives when their risks and characteristics are not closely related to those of their host contracts and the host contracts themselves are not carried at fair value with unrealised gains or losses reported in the income statement.
39o. Cash and debtCash and cash equivalentsCash and cash equivalents comprise cash in hand and on demand deposits, together with short term, highly liquid investments that are readily convertible to a known amount of cash and that are subject to an insignificant risk of changes in value. Bank overdrafts are shown within short term borrowings in current liabilities on the balance sheet. Cash and cash equivalents in the cash flow statement are shown net of overdrafts. Cash and cash equivalents are measured at amortised cost.
Financial liabilities and equity instrumentsFinancial liabilities and equity instruments are classified and accounted for as debt or equity according to the substance of the contractual arrangements entered into.
Bank borrowingsInterest bearing bank loans and overdrafts are initially recognised at fair value, net of directly attributable transaction costs. Finance charges, including premiums payable on settlement or redemption and direct issue costs are recognised in the income statement using the effective interest method. They are added to the carrying amount of the instrument to the extent that they are not settled in the period in which they arise.
FINANCIAL STATEMENTS AND OTHER FINANCIAL INFORMATION NOTES TO THE FINANCIAL STATEMENTS
ADDITIONAL DISCLOSURES
39p. Derecognition of financial assets and financial liabilitiesFinancial assets are derecognised when the right to receive cash flows from the asset has expired, the right to receive cash flows has been retained but an obligation to on-pay them in full without material delay has been assumed or the right to receive cash flows has been transferred together with substantially all the risks and rewards of ownership.
Financial liabilities are derecognised when the associated obligation has been discharged, cancelled or has expired.
39q. InventoriesInventory and work in progress are measured at the lower of cost and net realisable value. The production cost of inventory includes an appropriate proportion of depreciation and production overheads. Cost is determined on the following basis:
• Raw materials and consumables are measured at cost on a first in, first out (FIFO) basis or a weighted average cost basis.
• Work in progress and finished products are measured at raw material cost, labour cost and a proportion of manufacturing overhead expenses.
• Metal and coal stocks are included within finished products and are measured at average cost.
At precious metals operations that produce ‘joint products’, cost is allocated amongst products according to the ratio of contribution of these metals to gross sales revenues.
39r. Environmental restoration and decommissioning obligationsAn obligation to incur environmental restoration, rehabilitation and decommissioning costs arises when disturbance is caused by the development or ongoing production of a mining property. Such costs arising from the decommissioning of plant and other site preparation work, discounted to their net present value, are provided for and capitalised at the start of each project, as soon as the obligation to incur such costs arises.
These costs are recognised in the income statement over the life of the operation, through the depreciation of the asset and the unwinding of the discount on the provision. Costs for restoration of subsequent site damage which is created on an ongoing basis during production are provided for at their net present values and recognised in the income statement as extraction progresses.
Changes in the measurement of a liability relating to the decommissioning of plant or other site preparation work (that result from changes in the estimated timing or amount of the cash flow or a change in the discount rate), are added to or deducted from the cost of the related asset in the current period. If a decrease in the liability exceeds the carrying amount of the asset, the excess is recognised immediately in the income statement. If the asset value is increased and there is an indication that the revised carrying value is not recoverable, an impairment test is performed in accordance with the accounting policy set out above.
For some South African operations annual contributions are made to dedicated environmental rehabilitation trusts to fund the estimated cost of rehabilitation during and at the end of the life of the relevant mine. The Group exercises full control of these trusts and therefore the trusts are consolidated. The trusts’ assets are disclosed separately on the balance sheet as non-current assets. The trusts’ assets are measured based on the nature of the underlying assets in accordance with accounting policies for similar assets.
39s. Non-current assets and disposal groups held for sale Non-current assets and disposal groups are classified as held for sale if their carrying amount will be recovered through a sale transaction rather than through continuing use. This condition is regarded as met only when a sale is highly probable within one year from the date of classification, management is committed to the sale and the asset or disposal group is available for immediate sale in its present condition.
Non-current assets and disposal groups are classified as held for sale from the date these conditions are met and are measured at the lower of carrying amount and fair value less costs to sell. Any resulting impairment loss is recognised in the income statement. On classification as held for sale the assets are no longer depreciated. Comparative amounts are not adjusted.

162 Anglo American plc Annual Report 2014
39. ACCOUNTING POLICIES continued39t. Retirement benefitsThe Group operates both defined benefit and defined contribution pension plans for its employees as well as post employment medical plans. For defined contribution plans the amount recognised in the income statement is the contributions paid or payable during the year.
For defined benefit pension and post employment medical plans, full actuarial valuations are carried out at least every three years using the projected unit credit method and updates are performed for each financial year end. The average discount rate for the plans’ liabilities is based on AA rated corporate bonds of a suitable duration and currency or, where there is no deep market for such bonds, is based on government bonds. Pension plan assets are measured using year end market values.
Remeasurements comprising actuarial gains and losses, movements in asset surplus restrictions and the return on scheme assets (excluding interest income) are recognised immediately in the statement of comprehensive income and are not recycled to the income statement. Any increase in the present value of plan liabilities expected to arise from employee service during the year is charged to operating profit. The net interest income or cost on the net defined benefit asset or liability is included in investment income and interest expense respectively.
Past service cost is recognised immediately to the extent that the benefits are already vested and otherwise amortised on a straight line basis over the average period until the benefits vest.
The retirement benefit obligation recognised on the balance sheet represents the present value of the deficit or surplus of the defined benefit plans. Any recognised surplus is limited to the present value of available refunds or reductions in future contributions to the plan.
39u. Share-based paymentsThe Group makes equity settled share-based payments to certain employees, which are measured at fair value at the date of grant and expensed on a straight line basis over the vesting period, based on the Group’s estimate of shares that will eventually vest. For those share schemes with market related vesting conditions, the fair value is determined using the Monte Carlo method at the grant date. The fair value of share options issued with non-market vesting conditions has been calculated using the Black Scholes model. For all other share awards, the fair value is determined by reference to the market value of the shares at the grant date. For all share schemes with non-market vesting conditions, the likelihood of vesting has been taken into account when determining the relevant charge. Vesting assumptions are reviewed during each reporting period to ensure they reflect current expectations.
39v. Black Economic Empowerment (BEE) transactionsWhere the Group disposes of a portion of a South African based subsidiary or operation to a BEE company at a discount to fair value, the transaction is considered to be a share-based payment (in line with the principle contained in South Africa interpretation AC 503 Accounting for Black Economic Empowerment (BEE) Transactions).
The discount provided or value given is calculated in accordance with IFRS 2 and the cost, representing the fair value of the BEE credentials obtained by the subsidiary, is recorded in the income statement.
39w. Foreign currency transactions and translationForeign currency transactions by Group companies are recognised in the functional currencies of the companies at the exchange rate ruling on the date of the transaction. At each reporting date, monetary assets and liabilities that are denominated in foreign currencies are retranslated at the rates prevailing on the reporting date. Gains and losses arising on retranslation are included in the income statement for the period and are classified as either operating or financing depending on the nature of the monetary item giving rise to them.
Non-monetary assets and liabilities that are measured in terms of historical cost in a foreign currency are translated using the exchange rate at the date of the transaction.
On consolidation, the assets and liabilities of the Group’s foreign operations are translated into the presentation currency of the Group at exchange rates prevailing on the reporting date. Income and expense items are translated at the average exchange rates for the period where these approximate the rates at the dates of the transactions. Any exchange differences arising are classified within the statement of comprehensive income and transferred to the Group’s cumulative translation adjustment reserve. Exchange differences on foreign currency balances with foreign operations for which settlement is neither planned nor likely to occur in the foreseeable future, and therefore form part of the Group’s net investment in these foreign operations, are offset in the cumulative translation adjustment reserve.
Cumulative translation differences are recycled from equity and recognised as income or expense on disposal of the operation to which they relate.
Goodwill and fair value adjustments arising on the acquisition of foreign entities are treated as assets of the foreign entity and translated at the closing rate.
39x. LeasesIn addition to lease contracts, other significant contracts are assessed to determine whether, in substance, they are or contain a lease. This includes assessment of whether the arrangement is dependent on use of a specific asset and the right to use that asset is conveyed through the contract.
Rental costs under operating leases are recognised in the income statement in equal annual amounts over the lease term.
FINANCIAL STATEMENTS AND OTHER FINANCIAL INFORMATION NOTES TO THE FINANCIAL STATEMENTS
ADDITIONAL DISCLOSURES

Anglo American plc Annual Report 2014 163
Financial statements
FINANCIAL STATEMENTS AND OTHER FINANCIAL INFORMATION
FINANCIAL STATEMENTS OF THE PARENT COMPANY
Balance sheet of the Company, Anglo American plc, as at 31 December 2014US$ million Note 2014 2013Fixed assetsFixed asset investments 1 15,071 13,278 Current assetsAmounts due from subsidiaries 13,908 14,238 Prepayments and other debtors – 6 Cash at bank and in hand 3 33
13,911 14,277 Creditors due within one yearAmounts owed to group undertakings (309) (408) Other creditors (1) (5)
(310) (413) Net current assets 13,601 13,864 Total assets less current liabilities 28,672 27,142 Net assets 28,672 27,142
Capital and reservesCalled-up share capital 2 772 772 Share premium account 2 4,358 4,358 Capital redemption reserve 2 115 115 Other reserves 2 1,955 1,955 Share-based payment reserve 2 – 1 Profit and loss account 2 21,472 19,941 Total shareholders’ funds (equity) 28,672 27,142
The financial statements of Anglo American plc, registered number 03564138, were approved by the Board of directors on 12 February 2015 and signed on its behalf by:
Mark Cutifani René MédoriChief Executive Finance Director

164 Anglo American plc Annual Report 2014
1) Fixed asset investmentsInvestment in subsidiaries
US$ million 2014 2013CostAt 1 January 13,295 12,378 Capital contributions(1) 142 110 Additions 1,651 807 At 31 December 15,088 13,295 Provisions for impairment at 1 January and 31 December (17) (17)Net book value 15,071 13,278
(1) This amount is net of $6 million (2013: $30 million) of intra-group recharges.
During 2014 Anglo American plc (the Company) increased its investment in Anglo American Services (UK) Limited by $1,651 million in return for 10,000 additional shares.
2) Reconciliation of movements in equity shareholders’ funds
US$ millionCalled-up
share capital
Share premium
account
Capital redemption
reserveOther
reserves(1)
Share-based payment
reserve
Profit and lossaccount(2) Total
Balance at 1 January 2013 772 4,357 115 1,955 1 19,704 26,904 Profit for the financial year – – – – – 700 700 Dividends payable to Company shareholders(3) – – – – – (618) (618) Issue of treasury shares under employee share schemes – – – – – 15 15 Capital contribution to Group undertakings – – – – – 140 140 Other – 1 – – – – 1 Balance at 1 January 2014 772 4,358 115 1,955 1 19,941 27,142Profit for the financial year – – – – – 2,019 2,019 Dividends payable to Company shareholders(3) – – – – – (620) (620) Net purchase of treasury shares under employee share schemes – – – – – (17) (17) Capital contribution to Group undertakings – – – – – 148 148 Transfer between share-based payment reserve and profit and loss account – – – – (1) 1 –Balance at 31 December 2014 772 4,358 115 1,955 – 21,472 28,672
(1) At 31 December 2014 other reserves of $1,955 million (2013: $1,955 million) were not distributable under the Companies Act 2006.(2) At 31 December 2014 $2,685 million (2013: $2,685 million) of the Company profit and loss account of $21,472 million (2013: $19,941 million) was not distributable under the
Companies Act 2006.(3) Dividends payable relate only to shareholders on the United Kingdom principal register excluding dividends waived by Greenwood Nominees Limited as nominees for Butterfield Trust
(Guernsey) Limited, the trustee for the Anglo American employee share scheme. Dividends paid to shareholders on the Johannesburg branch register are distributed by a South African subsidiary in accordance with the terms of the Dividend Access Share Provisions of Anglo American plc’s Articles of Association. The directors are proposing a final dividend in respect of the year ended 31 December 2014 of 53 US cents per share (see note 10 of the Consolidated financial statements).
The audit fee in respect of the Company was $7,807 (2013: $8,133). Fees payable to Deloitte for non-audit services to the Company are not required to be disclosed because they are included within the consolidated disclosure in note 33.
FINANCIAL STATEMENTS AND OTHER FINANCIAL INFORMATION FINANCIAL STATEMENTS OF THE PARENT COMPANY
Anglo American plc Annual Report 2014 165
Financial statements
FINANCIAL STATEMENTS AND OTHER FINANCIAL INFORMATION FINANCIAL STATEMENTS OF THE PARENT COMPANY
3) Accounting policies: Anglo American plc (the Company)The Company balance sheet and related notes have been prepared in accordance with United Kingdom Accounting Standards (United Kingdom Generally Accepted Accounting Practice (UK GAAP)) and in accordance with UK company law. The financial information has been prepared on a historical cost basis as modified by the revaluation of certain financial instruments.
A summary of the principal accounting policies is set out below.
The preparation of financial statements in accordance with UK GAAP requires the use of estimates and assumptions that affect the reported amounts of assets and liabilities at the date of the financial statements and the reported amounts of revenues and expenses during the period. Actual results may differ from those estimated.
As permitted by section 408 of the Companies Act 2006, the profit and loss account of the Company is not presented as part of these financial statements. The profit after tax for the year of the Company amounted to $2,019 million (2013: $700 million).
Significant accounting policiesInvestmentsInvestments represent equity holdings in subsidiaries and are held at cost less provision for impairment.
Share-based paymentsThe Company has applied the requirements of FRS 20 Share-based Payment.
The Company makes equity settled share-based payments to the directors, which are measured at fair value at the date of grant and expensed on a straight line basis over the vesting period, based on the Company’s estimate of shares that will eventually vest. For those share schemes with market vesting conditions, the fair value is determined using a Monte Carlo model at the grant date. The fair value of share options issued with non-market vesting conditions has been calculated using a Black Scholes model. For all other share awards, the fair value is determined by reference to the market value of the share at the grant date. For all share schemes with non-market vesting conditions, the likelihood of vesting has been taken into account when determining the associated charge. Vesting assumptions are reviewed during each reporting period to ensure they reflect current expectations.
The Company also makes equity settled share-based payments to certain employees of certain subsidiary undertakings. Equity settled share-based payments that are made to employees of the Company’s subsidiaries are treated as increases in equity over the vesting period of the award, with a corresponding increase in the Company’s investments in subsidiaries, based on an estimate of the number of shares that will eventually vest.
Any payments received from subsidiaries are applied to reduce the related increases in investments in subsidiaries.
Accounting for share-based payments is the same as under IFRS 2 and details on the schemes and option pricing models relevant to the charge included in the Company financial statements are set out in note 28 to the Consolidated financial statements of the Group for the year ended 31 December 2014.
New accounting standards, amendments and interpretations not yet adoptedAnglo American plc intends to apply FRS 101 in its separate financial statements for the financial year ended 31 December 2015. Any objections should be notified to the Company Secretary by 31 May 2015.

166 Anglo American plc Annual Report 2014
FINANCIAL STATEMENTS AND OTHER FINANCIAL INFORMATION
Marketing activities are allocated to the underlying operation to which they relate.
Revenue(1) Underlying EBITDA(2) Underlying EBIT(3) Underlying earningsUS$ million 2014 2013 2014 2013 2014 2013 2014 2013Iron Ore and Manganese 5,176 6,517 2,286 3,390 1,957 3,119 717 1,125 Kumba Iron Ore 4,388 5,643 2,162 3,266 1,911 3,047 747(4) 1,171(4)
Iron Ore Brazil – – (29) (27) (34) (31) (32) (51) Samancor 788 874 251 258 178 210 78 92 Projects and corporate – – (98) (107) (98) (107) (76)(4) (87)(4)
Coal(5) 5,808 6,400 1,207 1,347 458 587 296 457Australia and Canada 2,970 3,396 543 672 (1) 106 (30) 111South Africa 2,083 2,187 463 479 350 356 271 283 Colombia 755 817 255 299 163 228 105 151 Projects and corporate – – (54) (103) (54) (103) (50) (88)
Copper 4,827 5,392 1,902 2,402 1,193 1,739 493 803 Anglo American Sur 2,792 3,300 1,185 1,642 762 1,220 301 464 Anglo American Norte 724 778 126 191 52 135 69 85 Collahuasi 1,311 1,314 707 718 495 533 207 386 Projects and corporate – – (116) (149) (116) (149) (84) (132)
Nickel 142 136 28 (37) 21 (44) 6 (54) Codemin 142 136 43 23 37 17 23 5 Loma de Níquel – – 22 (5) 22 (5) 22 (7) Barro Alto – – (25) (38) (26) (39) (25) (38) Projects and corporate – – (12) (17) (12) (17) (14) (14)
Niobium(5) 180 182 73 87 67 82 30 42 Catalão 180 182 75 94 69 89 31 48 Projects and corporate – – (2) (7) (2) (7) (1) (6)
Phosphates(5) 486 544 79 89 57 68 35 50 Copebrás 486 544 88 100 66 79 39 57 Projects and corporate – – (9) (11) (9) (11) (4) (7)
Platinum 5,396 5,688 527 1,048 32 464 25 287 Operations 5,396 5,688 585 1,121 90 537 80 356 Projects and corporate – – (58) (73) (58) (73) (55) (69)
De Beers 7,114 6,404 1,818 1,451 1,363 1,003 923 532 Operations 7,114 6,404 1,862 1,516 1,407 1,068 959 591 Projects and corporate – – (44) (65) (44) (65) (36) (59)
Corporate and other(5) 1,859 1,800 (88) (257) (215) (398) (308) (569) Other Mining and Industrial 1,854 1,795 162 81 62 (13) 44 (2)Exploration – – (180) (205) (181) (207) (163) (190) Corporate activities and unallocated costs 5 5 (70) (133) (96) (178) (189) (377)
30,988 33,063 7,832 9,520 4,933 6,620 2,217 2,673
(1) Revenue includes the Group’s attributable share of associates’ and joint ventures’ revenue. Revenue for copper is shown after deduction of treatment and refining charges (TC/RCs).(2) Underlying EBITDA is underlying EBIT before depreciation and amortisation in subsidiaries and joint operations, and includes the Group’s attributable share of associates’ and joint ventures’
underlying EBITDA.(3) Underlying EBIT is operating profit before special items and remeasurements, and includes the Group’s attributable share of associates’ and joint ventures’ underlying EBIT. (4) Of the projects and corporate expense, which includes a corporate cost allocation, $54 million (2013: $63 million) relates to Kumba Iron Ore. The total contribution from Kumba Iron Ore to the
Group’s underlying earnings is $693 million (2013: $1,108 million).(5) Refer to note 3 of the Consolidated financial statements for changes in reporting segments. Comparatives have been reclassified to align with current year presentation.
SUMMARY BY BUSINESS OPERATION

Anglo American plc Annual Report 2014 167
Financial statements
FINANCIAL STATEMENTS AND OTHER FINANCIAL INFORMATION
US$ million (unless otherwise stated) 2014 20132012
restated(1) 2011 2010 2009 2008 2007 2006(2) 2005(2)
Group revenue including associates and joint ventures 30,988 33,063 32,785 36,548 32,929 24,637 32,964 30,559 29,404 24,872Group revenue 27,073 29,342 28,680 30,580 27,960 20,858 26,311 25,470 24,991 20,132Underlying EBIT(3) 4,933 6,620 6,253 11,095 9,763 4,957 10,085 9,590 8,888 5,549Operating and non-operating special items and remeasurements (including associates and joint ventures) (4,760) (4,310) (5,755) (44) 1,727 (208) (330) (227) 24 16Net finance costs, tax and non-controlling interests of associates and joint ventures (212) (204) (281) (452) (423) (313) (783) (434) (398) (315)(Loss)/profit before net finance costs and tax (39) 2,106 217 10,599 11,067 4,436 8,972 8,929 8,514 5,250(Loss)/profit before tax (259) 1,700 (171) 10,782 10,928 4,029 8,571 8,821 8,443 5,030(Loss)/profit for the financial year (1,524) 426 (564) 7,922 8,119 2,912 6,120 8,172 6,922 3,933Non-controlling interests (989) (1,387) (906) (1,753) (1,575) (487) (905) (868) (736) (412)(Loss)/profit attributable to equity shareholders of the Company (2,513) (961) (1,470) 6,169 6,544 2,425 5,215 7,304 6,186 3,521(Loss)/earnings per share (US$) (1.96) (0.75) (1.17) 5.10 5.43 2.02 4.34 5.58 4.21 2.43Underlying earnings(4) 2,217 2,673 2,860 6,120 4,976 2,569 5,237 5,761 5,471 3,736Underlying earnings per share (US$) 1.73 2.09 2.28 5.06 4.13 2.14 4.36 4.40 3.73 2.58Ordinary dividend per share (US cents) 85.0 85.0 85.0 74.0 65.0 – 44.0 124.0 108.0 90.0Underlying EBITDA(5) 7,832 9,520 8,860 13,348 11,983 6,930 11,847 12,132 12,197 8,959Underlying EBITDA interest cover(6) 47.8 51.5 52.1 n/a 42.0 27.4 28.3 42.0 45.5 20.0Underlying operating margin 15.9% 20.0% 19.1% 30.4% 29.6% 20.1% 30.6% 28.4% 25.4% 18.5%Ordinary dividend cover (based on underlying earnings per share) 2.0 2.5 2.7 6.8 6.4 – 9.9 3.5 3.5 2.9Net assets 32,177 37,364 43,738 43,189 37,971 28,069 21,756 24,330 27,127 27,578Non-controlling interests (5,760) (5,693) (6,127) (4,097) (3,732) (1,948) (1,535) (1,869) (2,856) (3,957)Equity attributable to equity shareholders of the Company 26,417 31,671 37,611 39,092 34,239 26,121 20,221 22,461 24,271 23,621Total capital employed(7) 43,782 46,551 49,757 41,667 42,135 36,623 29,808 24,401 28,285 31,643Cash flows from operations 6,949 7,729 7,370 11,498 9,924 4,904 9,579 9,845 10,057 7,265Capital expenditure(8) (6,018) (6,075) (5,947) (5,672) (4,902) (4,707) (5,282) (4,002) (3,575) (1,831)Net debt(9) (12,871) (10,652) (8,510) (1,374) (7,384) (11,280) (11,340) (4,851) (3,131) (4,980)Dividends received from associates, joint ventures and financial asset investments 460 264 348 403 285 639 659 363 288 470Underlying EBITDA/average total capital employed(7) 17.3% 19.8% 19.4% 31.9% 30.4% 20.9% 43.7% 46.1% 40.7% 27.0%Net debt to total capital (gearing)(10) 28.6% 22.2% 16.3% 3.1% 16.3% 28.7% 34.3% 16.6% 10.3% 15.3%(1) Certain balances relating to 2012 were restated to reflect the adoption of new accounting pronouncements. See note 2 of the 2013 Consolidated financial statements for details.(2) Comparatives for 2006 and 2005 were adjusted in the 2007 Annual Report to reclassify amounts relating to discontinued operations where applicable.(3) Underlying EBIT is operating profit presented before special items and remeasurements and includes the Group’s attributable share of associates’ and joint ventures’ underlying EBIT.
Underlying EBIT of associates and joint ventures is the Group’s attributable share of revenue less operating costs before special items and remeasurements of associates and joint ventures.(4) Underlying earnings is profit attributable to equity shareholders of the Company before special items and remeasurements, and is therefore presented after net finance costs, income tax and
non-controlling interests.(5) Underlying EBITDA is underlying EBIT before depreciation and amortisation in subsidiaries and joint operations and includes the Group’s attributable share of associates’ and joint ventures’
underlying EBIT before depreciation and amortisation.(6) Underlying EBITDA interest cover is underlying EBITDA divided by net finance costs, excluding net foreign exchange gains and losses, unwinding of discount relating to provisions and other
liabilities, financing special items and remeasurements, and including the Group’s attributable share of associates’ and joint ventures’ net finance costs, which in 2011 resulted in a net finance income and therefore the ratio is not applicable.
(7) Total capital employed is net assets excluding net debt (including related hedges and net debt in disposal groups) and financial asset investments. Comparatives are presented on a consistent basis.
(8) Capital expenditure is defined as cash expenditure on property, plant and equipment including related derivatives, and is now presented net of proceeds from disposal of property, plant and equipment and includes direct funding for capital expenditure from non-controlling interests in order to match more closely the way in which it is managed. Comparatives have been re-presented to align with current year presentation.
(9) Net debt is calculated as total borrowings less cash and cash equivalents (including related hedges and net debt in disposal groups). (10) Net debt to total capital is calculated as net debt (including related hedges and net debt in disposal groups) divided by total capital. Comparatives are presented on a consistent basis.
KEY FINANCIAL DATA

168 Anglo American plc Annual Report 2014
FINANCIAL STATEMENTS AND OTHER FINANCIAL INFORMATION
US$ exchange rates 2014 2013Year end spot ratesRand 11.57 10.51Brazilian real 2.66 2.36Sterling 0.64 0.60Australian dollar 1.22 1.12Euro 0.82 0.73Chilean peso 607 526Botswana pula 9.51 8.76
Average rates for the yearRand 10.85 9.65Brazilian real 2.35 2.16Sterling 0.61 0.64Australian dollar 1.11 1.03Euro 0.75 0.75Chilean peso 571 495Botswana pula 8.97 8.39
Commodity prices 2014 2013Year end spot pricesIron ore (62% Fe CFR)(1) US$/tonne 72 135Thermal coal (FOB South Africa)(2) US$/tonne 66 85Thermal coal (FOB Australia)(2) US$/tonne 65 85Hard coking coal (FOB Australia)(3) US$/tonne 119 152Copper(4) US cents/lb 288 335Nickel(4) US cents/lb 677 663Platinum(5) US$/oz 1,210 1,358Palladium(5) US$/oz 798 711Rhodium(6) US$/oz 1,245 975
Average market prices for the yearIron ore (62% Fe CFR)(1) US$/tonne 97 135Thermal coal (FOB South Africa)(2) US$/tonne 72 80Thermal coal (FOB Australia)(2) US$/tonne 71 84Hard coking coal (FOB Australia)(7) US$/tonne 125 159Copper(4) US cents/lb 311 332Nickel(4) US cents/lb 765 680Platinum(5) US$/oz 1,385 1,487Palladium(5) US$/oz 803 725Rhodium(6) US$/oz 1,173 1,067
(1) Source: Platts.(2) Source: McCloskey.(3) Source: Represents the quarter four benchmark.(4) Source: London Metal Exchange (LME).(5) Source: London Platinum and Palladium Market (LPPM).(6) Source: Comdaq.(7) Source: Represents the average quarterly benchmark.
EXCHANGE RATES AND COMMODITY PRICES

ORE RESERVES AND MINERAL RESOURCES
Ore R
eserves and Mineral R
esources
INTRODUCTION
The Ore Reserve and Mineral Resource estimates presented in this Annual Report are prepared in accordance with the Anglo American plc (AA plc) Reporting of Exploration Results, Mineral Resources and Ore Reserves standard. This standard requires that the Australasian Code for Reporting of Exploration Results, Mineral Resources and Ore Reserves 2012 edition (the JORC Code) be used as a minimum standard. Some Anglo American plc subsidiaries have a primary listing in South Africa where public reporting is carried out in accordance with the South African Code for Reporting of Exploration Results, Mineral Resources and Mineral Reserves (the SAMREC Code). The SAMREC Code is similar to the JORC Code and the Ore Reserve and Mineral Resource terminology appearing in this section follows the definitions in both the JORC (2012) and SAMREC (2007 Edition as amended July 2009) Codes. Ore Reserves in the context of this Annual Report have the same meaning as ‘Mineral Reserves’ as defined by the SAMREC Code and the CIM (Canadian Institute of Mining and Metallurgy) Definition Standards on Mineral Resources and Mineral Reserves.
The information on Ore Reserves and Mineral Resources was prepared by or under the supervision of Competent Persons as defined in the JORC or SAMREC Codes. All Competent Persons have sufficient experience relevant to the style of mineralisation and type of deposit under consideration and to the activity which they are undertaking. All the Competent Persons consent to the inclusion in this report of the information in the form and context in which it appears. The names of the Competent Persons are lodged with the Anglo American plc Company Secretary and listed in the Ore Reserve and Mineral Resource Report 2014 along with their affiliation and years of relevant experience.
Anglo American Group companies are subject to a comprehensive programme of reviews aimed at providing assurance in respect of Ore Reserve and Mineral Resource estimates. The reviews are conducted by suitably qualified Competent Persons from within the Anglo American Group, or by independent consultants. The frequency and depth of the reviews is a function of the perceived risks and/or uncertainties associated with a particular Ore Reserve and Mineral Resource. The overall value of the entity and time that has lapsed since an independent third-party review is also considered. Those operations/projects that were subjected to independent third-party reviews during the year are indicated in footnotes to the tables.
The JORC and SAMREC Codes require due consideration of reasonable prospects for eventual economic extraction for Mineral Resource definition. These include long-range commodity price forecasts which are prepared by in-house specialists largely using estimates of future supply and demand and long-term economic outlooks. The calculation of Mineral Resource and Ore Reserve estimates are based on long-term prices determined at the beginning of the second quarter each year. Ore Reserves are dynamic and are more likely to be affected by fluctuations in the prices of commodities, uncertainties in production costs, processing costs and other mining, infrastructure, legal, environmental, social and governmental factors which may impact the financial condition and prospects of the Group. Mineral Resource estimates also change and tend to be influenced mostly by new information pertaining to the understanding of the deposit and secondly by the conversion to Ore Reserves. Unless otherwise stated, Mineral Resources are additional to (exclusive of) those resources converted to Ore Reserves and are reported on a dry tonnes basis.
The appropriate Mineral Resource classification is determined by the appointed Competent (or Qualified) Persons. The choice of appropriate category of Mineral Resource depends upon the quantity, distribution and quality of geoscientific information available and the level of confidence in these data.
To accommodate the various factors that are important in the development of a classified Mineral Resource estimate, a scorecard approach is generally used. Mineral Resource classification defines the confidence associated with different parts of the Mineral Resource. The confidence that is assigned refers collectively to the reliability of the Grade and Tonnage estimates. This reliability includes consideration for the fidelity of the base data, the geological continuity predicated by the level of understanding of the geology, the likely precision of the estimated grades and understanding of grade variability, as well as various other factors (in particular density) that may influence the confidence that can be placed on the Mineral Resource. Most business units have developed commodity-specific scorecard-based approaches to the classification of their Mineral Resources.
The estimates of Ore Reserves and Mineral Resources are stated as at 31 December 2014. The figures in the tables have been rounded and, if used to derive totals and averages, minor differences with stated results could occur.
This section of the Annual Report presenting the Ore Reserve and Mineral Resource estimates, should be considered the only valid source of Ore Reserve and Mineral Resource information for the Anglo American group exclusive of Kumba Iron Ore and Anglo American Platinum Limited which publish their own independent annual reports.
It is accepted that mine design and planning may include some Inferred Mineral Resources. Inferred Mineral Resources in the Life of Mine Plan (LOM Plan) are described as ‘Inferred (in LOM Plan)’ separately from the remaining Inferred Mineral Resources described as ‘Inferred (ex. LOM Plan)’, as required. These resources are declared without application of any modifying factors. Reserve Life reflects the scheduled extraction period in years for the total Ore Reserves in the approved Life of Mine Plan.
The Attributable Percentage that Anglo American holds in each operation and project is presented beside the name of each entity. Operations and projects which fall below the internal threshold for reporting (25% attributable interest) are excluded from the Ore Reserves and Mineral Resources estimates.
In South Africa, the Minerals and Petroleum Resources Development Act, Number 28 of 2002 (MPRDA) was implemented on 1 May 2004 (subsequently amended by the Minerals and Petroleum Resources Development Amendment Act 49 of 2008) effectively transferred custodianship of the previously privately held mineral rights to the State.
A Prospecting Right is a right issued in terms of the MPRDA that is valid for up to five years, with the possibility of a further extension of three years.
A Mining Right is a right issued in terms of the MPRDA and is valid for up to 30 years, with the possibility of a further extension of 30 years. The Minister of Mineral Resources will grant a renewal of the Mining Right if the terms and conditions of the Mining Right have been complied with and the applicant is not in contravention of any relevant provisions of the MPRDA.
In preparing the Ore Reserve and Mineral Resource statement for South African assets, Anglo American plc has adopted the following reporting principles in respect of Prospecting Rights and Mining Rights:
• Where applications for Mining Rights and Prospecting Rights have been submitted and these are still being processed by the relevant regulatory authorities, the relevant Ore Reserves and Mineral Resources have been included in the statement.
• Where applications for Mining Rights and Prospecting Rights have been initially refused by the regulatory authorities, but are the subject of ongoing legal process and discussions with the relevant authorities and where Anglo American plc has reasonable expectations that the Prospecting Rights will be granted in due course, the relevant Mineral Resources have been included in the statement (any associated comments appear in the footnotes).
ORE RESERVES AND MINERAL RESOURCES
Ore R
eserves and Mineral R
esources
Anglo American plc Annual Report 2014 169
The summary of Estimated Ore Reserves and Mineral Resources, Reserve and Resource Reconciliation Overview, Definitions and Glossary are contained in the separate Ore Reserve and Mineral Resource Report 2014 which is available in the Reporting Centre on the Anglo American website.

ORE RESERVES AND MINERAL RESOURCES
170 Anglo American plc Annual Report 2014
IRON ORE estimates as at 31 December 2014
KUMBA IRON OREThe Ore Reserve and Mineral Resource estimates were compiled in accordance with The South African Code for the Reporting of Exploration Results, Mineral Resources and Mineral Reserves (The SAMREC Code, 2007 Edition as amended July 2009). The figures reported represent 100% of the Ore Reserves and Mineral Resources. Rounding of figures may cause computational discrepancies. Reserve Life is reported from 2014 onwards and is aligned with the current approved Life of Mine Plan.
Anglo American plc’s interest in Kumba Iron Ore Limited is 69.7%. Detailed information appears in the Kumba Iron Ore Limited Annual Report.
Kumba Iron Ore – OperationsORE RESERVES
Reserve ROM Tonnes Grade Saleable ProductAttributable % Life Classification 2014 2013 2014 2013 2014 2013
Kolomela (OP) 51.5 21 Mt Mt %Fe %Fe Mt %Fe Mt %FeHematite Proved 83.3 101.3 64.6 64.4 83 64.6 101 64.4
Probable 104.7 98.7 64.3 64.5 104 64.3 99 64.5Total 188.0 200.0 64.4 64.4 188 64.4 200 64.4
Sishen (OP) 51.5 16 %Fe %FeHematite Proved 556.8 428.9 59.4 59.2 427 65.7 311 65.4
Probable 159.8 435.1 56.2 59.1 108 64.3 311 65.1Total 716.6 864.1 58.7 59.1 535 65.4 622 65.3
Thabazimbi (OP) 51.5 9 %Fe %FeHematite Proved 0.4 0.5 61.9 62.2 0 62.5 0 64.4
Probable 9.3 10.8 60.3 60.4 7 62.9 8 62.9Total 9.7 11.3 60.4 60.5 7 62.9 9 63.0
Kumba Iron Ore – OperationsMINERAL RESOURCES
Tonnes GradeAttributable % Classification 2014 2013 2014 2013
Kolomela (OP) 51.5 Mt Mt %Fe %FeHematite Measured 21.9 21.9 64.9 64.9
Indicated 81.2 42.0 64.1 63.4Measured and Indicated 103.1 64.0 64.3 63.9
Inferred (in LOM Plan) 44.1 50.1 64.5 64.2Inferred (ex. LOM Plan) 105.7 45.0 64.2 63.3
Total Inferred 149.8 95.2 64.3 63.8Sishen (OP) 51.5 %Fe %Fe
Hematite Measured 324.5 295.2 61.8 62.1Indicated 142.6 143.7 56.9 58.1
Measured and Indicated 467.1 438.9 60.3 60.8Inferred (in LOM Plan) 28.9 21.6 52.5 53.1
Inferred (ex. LOM Plan) 67.8 51.8 57.2 55.7Total Inferred 96.7 73.5 55.8 54.9
Thabazimbi (OP) 51.5 %Fe %FeHematite Measured 0.3 0.3 64.0 64.0
Indicated 10.8 9.8 62.1 62.8Measured and Indicated 11.1 10.1 62.1 62.8
Inferred (in LOM Plan) 1.4 1.6 59.5 59.7Inferred (ex. LOM Plan) 4.6 4.6 62.9 62.9
Total Inferred 6.0 6.2 62.1 62.1MINERAL RESOURCES ARE REPORTED AS ADDITIONAL TO ORE RESERVES.
Kumba Iron Ore – ProjectsMINERAL RESOURCES
Tonnes Grade GradeAttributable % Classification 2014 2013 2014 2013 2014 2013
Zandrivierspoort 25.8 Mt Mt %Fe %Fe %Fe3O4 %Fe3O4
Magnetite and Hematite Measured 107.0 107.0 34.7 34.7 41.5 41.5Indicated 206.4 206.4 34.4 34.4 42.5 42.5
Measured and Indicated 313.4 313.4 34.5 34.5 42.2 42.2Inferred 162.7 162.7 34.5 34.5 38.1 38.1
Mining method: OP = Open Pit. Reserve Life = The scheduled extraction period in years for the total Ore Reserves in the approved Life of Mine Plan. The tonnage is quoted as dry metric tonnes and abbreviated as Mt for million tonnes. The Mineral Resources are constrained by a resource pit shell, which defines the spatial limits of eventual economic extraction.
Due to the uncertainty that may be attached to some Inferred Mineral Resources, it cannot be assumed that all or part of an Inferred Mineral Resource will necessarily be upgraded to an Indicated or Measured Resource after continued exploration. Audits related to the generation of the Ore Reserve and Mineral Resource estimates were carried out by independent consultants during 2014 at Thabazimbi.

ORE RESERVES AND MINERAL RESOURCES
Anglo American plc Annual Report 2014 171
Ore R
eserves and Mineral R
esources
IRON ORE estimates as at 31 December 2014
EXPLANATORY NOTESKolomela – Ore Reserves: The decrease is primarily due to production. Ore Reserves are reported above a cut-off of 42.0 %Fe inclusive of dilution.Sishen – Ore Reserves: In addition to production, the decrease is due to an alignment of the Ore Reserve economic assumptions with budget parameters as well as a strategic redesign of the Sishen Mine waste pushback strategy in 2014 in order to achieve a lower cost (lower stripping ratio) Life of Mine Plan solution. A minor decrease in Ore Reserves due to the re-allocation of a portion of the conglomeratic ore body to Inferred Mineral Resource in accordance with the Kumba Iron Ore Mineral Resource Classification Guideline. Ore Reserves are reported above a cut-off of 40.0 %Fe inclusive of dilution. Thabazimbi – Ore Reserves: The decrease is primarily due to production. The Thabazimbi Mine is subject to a Life of Mine Plan review, which is currently ongoing. As a result, it was considered prudent to revert to the 2013 Ore Reserves (and Mineral Resources to retain alignment) in terms of public reporting. The 2014 Ore Reserve Statement for Thabazimbi Mine is therefore based on the 2013 Ore Reserves, depleted with the 2014 production. Ore Reserves are reported above a cut-off of 54.3 %Fe inclusive of dilution.Kolomela – Mineral Resources: The increase is due to new information that results in the initial declaration of resources from Kapstevel South orebody and updated geological models for Leeuwfontein. Mineral Resources are reported above a cut-off of 50.0 %Fe.Sishen – Mineral Resources: The increase is primarily due to incorporation of the previous ‘Stockpile’ material (Measured Resources: 7.3 Mt at 53.1 %Fe and Indicated Resources: 22.8 Mt at 50.8 %Fe) into the Mineral Resources as these are now considered as part of the modifying factors and therefore not reported separately. Mineral Resources are reported above a cut-off of 40.0 %Fe.Thabazimbi – Mineral Resources: The increase is due to incorporation of the previous ‘Stockpile’ material into the Mineral Resources as these are now considered as part of the modifying factors and therefore not reported separately. The 2014 Resource Statement for Thabazimbi Mine is based on the 2013 Mineral Resources (aligned with the decision to revert back to the 2013 Ore Reserves), depleted with the 2014 production. Mineral Resources are reported above a cut-off of 55.0 %Fe.Zandrivierspoort: The Zandrivierspoort Project Mineral Resources are reported above a cut-off of 21.7 %Fe.
Mineral TenureSishen: On 12 December 2013 the Constitutional Court (of South Africa) ruled that the Sishen Iron Ore Company (SIOC) had a 78.6% undivided share of the Sishen mining right. The Constitutional Court ruled further that, based on the provisions of the Mineral and Petroleum Resources Development Act (MPRDA), only SIOC can apply for and be granted the residual 21.4% undivided share of the Sishen Mining Right. The grant of the Mining Right may be made subject to such conditions considered by the Minister (of Mineral Resources) to be appropriate. SIOC has lodged applications to be granted the residual 21.4% undivided share of the Sishen Mining Right. Kumba Iron Ore is actively continuing its engagement with the South African Department of Mineral Resources (DMR) in order to finalise the grant of the residual right.
Based on the outcome of the Constitutional Court ruling, SIOC has a reasonable expectation for the grant of the 21.4% Mining Right and therefore declares 100% of the Sishen Ore Reserves and Mineral Resources in terms of the provisions of the SAMREC Code. SIOC derives 100% of the economic benefit of the material extracted from the Sishen Mine, and is not required to account to any other entity for the value thus derived. SIOC is mining lawfully in accordance with its approved Mine Works Programme. SIOC has submitted its applications to be granted the 21.4% Mining Right. At the time of reporting, the Mining Right had not yet been granted. In 2013, the attributable percentage was based on the Mining Rights held. For 2014, the attributable percentage is based on the full economic benefit to Sishen.
A Section 102 application to incorporate the old Transnet railway properties transecting the mining area from north to south was granted by the DMR on 28 February 2014. This resulted in Probable Reserves being upgraded back to Proved Reserves.

ORE RESERVES AND MINERAL RESOURCES
172 Anglo American plc Annual Report 2014
IRON ORE estimates as at 31 December 2014
IRON ORE BRAZILThe Ore Reserves and Mineral Resource estimates were compiled in accordance with the Australasian Code for Reporting of Exploration Results, Mineral Resources and Ore Reserves (The JORC Code, 2012) as a minimum standard. The figures reported represent 100% of the Ore Reserves and Mineral Resources. Rounding of figures may cause computational discrepancies. Reserve Life is reported from 2014 onwards and is aligned with the current approved Life of Mine Plan.
Iron Ore Brazil – OperationsORE RESERVES
Reserve ROM Tonnes Grade Saleable ProductAttributable % Life Classification 2014 2013 2014 2013 2014 2013
Serra do Sapo (OP) 100 45 Mt Mt %Fe %Fe Mt %Fe Mt %FeFriable Itabirite and Hematite Proved – – – – – – – –
Probable 1,414.6 1,385.3 37.9 38.8 690 67.5 686 67.5Total 1,414.6 1,385.3 37.9 38.8 690 67.5 686 67.5
Itabirite Proved – – – – – – – –Probable 1,384.3 – 30.9 – 534 67.5 – –
Total 1,384.3 – 30.9 – 534 67.5 – –
Iron Ore Brazil – OperationsMINERAL RESOURCES
Tonnes GradeAttributable % Classification 2014 2013 2014 2013
Serra do Sapo (OP) 100 Mt Mt %Fe %FeFriable Itabirite and Hematite Measured 192.7 187.7 31.8 31.8
Indicated 207.0 229.4 33.6 33.3Measured and Indicated 399.7 417.1 32.7 32.6
Inferred (in LOM Plan) 68.6 50.4 37.9 38.4Inferred (ex. LOM Plan) 18.7 21.8 32.1 32.3
Total Inferred 87.4 72.1 36.7 36.5Itabirite Measured 512.5 737.7 30.4 30.5
Indicated 1,036.1 2,092.9 31.1 31.2Measured and Indicated 1,548.6 2,830.5 30.9 31.0
Inferred (in LOM Plan) 178.8 – 31.1 –Inferred (ex. LOM Plan) 402.2 201.1 31.1 31.2
Total Inferred 581.0 201.1 31.1 31.2MINERAL RESOURCES ARE REPORTED AS ADDITIONAL TO ORE RESERVES.
Iron Ore Brazil – ProjectsMINERAL RESOURCES
Tonnes GradeAttributable % Classification 2014 2013 2014 2013
Itapanhoacanga 100 Mt Mt %Fe %FeFriable Itabirite and Hematite Measured 31.0 31.0 40.6 40.6
Indicated 117.5 117.5 41.3 41.3Measured and Indicated 148.6 148.6 41.1 41.1
Inferred 114.5 114.5 40.4 40.4Compact Itabirite Measured 23.2 23.2 33.6 33.6
Indicated 73.4 73.4 34.5 34.5Measured and Indicated 96.6 96.6 34.3 34.3
Inferred 57.0 57.0 34.5 34.5Serro 100 %Fe %Fe
Friable Itabirite and Hematite Measured 4.7 4.7 44.7 44.7Indicated 87.3 87.3 41.0 41.0
Measured and Indicated 92.0 92.0 41.2 41.2Inferred 32.8 32.8 41.0 41.0
Compact Itabirite Measured 7.3 7.3 33.0 33.0Indicated 274.4 274.4 32.1 32.1
Measured and Indicated 281.7 281.7 32.1 32.1Inferred 111.1 111.1 34.6 34.6
Mining method: OP = Open Pit. Reserve Life = The scheduled extraction period in years for the total Ore Reserves in the approved Life of Mine Plan.The ROM tonnage is quoted as dry metric tonnes and abbreviated as Mt for million tonnes.
Due to the uncertainty that may be attached to some Inferred Mineral Resources, it cannot be assumed that all or part of an Inferred Mineral Resource will necessarily be upgraded to an Indicated or Measured Resource after continued exploration.
EXPLANATORY NOTESMinas-Rio: Minas-Rio comprises the Serra do Sapo operation and the Itapanhoacanga project. Metallurgical test work confirms that the Compact Itabirite at Serra do Sapo is softer than Compact Itabirite mined in the Carajás and Iron Quadrangle areas. From 2014 onwards at Serra do Sapo, Compact Itabirite will be referred to as Itabirite and Semi-Compact Itabirite as Semi-Friable Itabirite.Serra do Sapo – Ore Reserves: Ore Reserves are reported above a cut-off of 25.0 %Fe inclusive of dilution. ROM Tonnes and grades are on a dry basis. Saleable Product tonnes are on a wet basis (average moisture content is 8.0 wt% of the wet mass) with quality stated on a dry basis. The increase in Friable Itabirite and Hematite is due to new drilling information and updated economic assumptions. Itabirite Ore Reserves are declared and included in the mine plan for the first time due to metallurgical studies confirming the viability of processing this ore type and results in an increase in the Reserve Life. The Ore Reserves exclude 1.9Mt (at 37.9 %Fe) of material stockpiled during pre-stripping operations.Serra do Sapo – Mineral Resources: Mineral Resources are reported above a cut-off of 25.0 %Fe. In-situ tonnes and grade are on a dry basis. Friable Itabirite and Hematite includes Friable Itabirite, Semi-Friable Itabirite, High Alumina Friable Itabirite, Soft Hematite and Canga.The decrease in Itabirite Mineral Resources is primarily due to coversion of resources to reserves which is partially offset by new drilling information which indicates additional resources in the Central domain.Itapanhoacanga: Mineral Resources are reported above a cut-off of 25.0 %Fe. In-situ tonnes and grade are on a dry basis.Friable Itabirite and Hematite includes Friable Itabirite, Semi-Compact Itabirite, Soft Hematite and Hard HematiteSerro: Mineral Resources are reported above a cut-off of 25.0 %Fe. In-situ tonnes and grade are on a dry basis. Friable Itabirite and Hematite includes Friable Itabirite, Semi-Compact Itabirite and Hard Hematite.
Audits related to the generation of the Ore Reserve and Mineral Resource estimates were carried out by independent consultants during 2014 at Serra do Sapo.Audits related to the generation of the Mineral Resource estimates were carried out by independent consultants during 2014 at Itapanhoacanga and Serro.

ORE RESERVES AND MINERAL RESOURCES
Anglo American plc Annual Report 2014 173
Ore R
eserves and Mineral R
esources
MANGANESE estimates as at 31 December 2014
SAMANCOR MANGANESEThe Ore Reserve and Mineral Resource estimates were compiled in accordance with the Australasian Code for Reporting of Exploration Results, Mineral Resources and Ore Reserves (The JORC Code, 2012) and The South African Code for the Reporting of Exploration Results, Mineral Resources and Mineral Reserves (The SAMREC Code, 2007 Edition as amended July 2009) as applicable. The figures reported represent 100% of the Ore Reserves and Mineral Resources (source: BHP Billiton). Rounding of figures may cause computational discrepancies.
Samancor Manganese – Operations Reserve Tonnes Grade Yield
ORE RESERVES Attributable % Life Classification 2014 2013 2014 2013 2014 2013GEMCO (OP) 40.0 12 Mt Mt %Mn %Mn % %
Proved 73.6 68.9 44.8 44.4 58.3 59.1Probable 16.0 27.6 42.6 44.7 57.0 58.7
Total 89.6 96.5 44.4 44.5 58.1 59.0Hotazel Manganese Mines 29.6 %Mn %Mn
Mamatwan (OP) 17 Proved 17.6 38.3 37.6 37.1Probable 43.0 30.5 37.1 36.9
Total 60.6 68.8 37.2 37.0Wessels (UG) 46 Proved 2.9 4.2 43.6 44.5
Probable 66.1 63.9 42.2 42.3Total 69.0 68.1 42.3 42.4
Samancor Manganese – Operations Tonnes Grade Yield
MINERAL RESOURCES Attributable % Classification 2014 2013 2014 2013 2014 2013GEMCO (OP) 40.0 Mt Mt %Mn %Mn % %
Measured 90.1 79.8 46.0 46.3 48.2 48.2Indicated 46.3 55.4 43.6 44.5 47.0 46.8
Measured and Indicated 136.4 135.2 45.2 45.6 47.7 47.6Inferred 33.5 35.4 42.7 43.2 49.2 48.6
Hotazel Manganese Mines 29.6 %Mn %Mn
Mamatwan (OP) Measured 25.8 58.6 35.7 35.5Indicated 69.0 54.5 35.1 34.5
Measured and Indicated 94.8 113.1 35.3 35.0Inferred 11.1 4.3 33.2 34.5
Wessels (UG) Measured 15.7 16.4 44.3 44.2Indicated 123.8 125.1 42.1 42.1
Measured and Indicated 139.5 141.5 42.3 42.4Inferred – – – –
MINERAL RESOURCES INCLUDE ORE RESERVES. Mining method: OP = Open Pit, UG = Underground. Reserve Life = The scheduled extraction period in years for the total Ore Reserves in the approved Life of Mine Plan. The tonnage is quoted as dry metric tonnes.
Due to the uncertainty that may be attached to some Inferred Mineral Resources, it cannot be assumed that all or part of an Inferred Mineral Resource will necessarily be upgraded to an Indicated or Measured Resource after continued exploration.
EXPLANATORY NOTESGEMCO – Ore Reserves: The decrease is due to production. Ore Reserves are reported above a cut-off of 40%Mn with a minimum of 1m thickness. Manganese grades are given as per washed ore samples and should be read together with their respective yields.Mamatwan – Ore Reserves: The decrease is primarily due to production as well as the use of a new block model. Ore Reserves for all zones are reported above a cut-off of 35.0 %Mn.Wessels – Ore Reserves: The change is due to depletion from mining which is offset by the use of a new block model. Ore Reserves for the Lower Body-HG ore type are reported above a cut-off of 45.0 %Mn and Lower Body-LG and Upper Body ore types are reported above a cut-off of 37.5 %Mn.GEMCO – Mineral Resources: New drilling information and the consequent updating of the resource model has allowed for the upgrading in resource confidence. A 40 %Mn washed product cut-off is used to define the Mineral Resource. The Premium Sands (PC-02) Project Mineral Resource estimates above a zero cut-off grade (Indicated: 12.8 Mt at 20.8 %Mn, Inferred: 2.3 Mt at 20.0 %Mn) are excluded from the table.Mamatwan – Mineral Resources: The decrease is due to a new geological model being used which utilised implicit modelling techniques as well as a change in the estimation parameters. A cut-off grade of 35.0 %Mn is used to declare Mineral Resources within the M, C and N Zones as well as within the X Zone. The Top Cut Resources are declared above a cut-off of 28.0 %Mn.Wessels – Mineral Resources: The decrease is due to a new geological model being used. A cut-off grade of 45.0 %Mn is used to declare Mineral Resources within the Lower Body-HG ore type and 37.5 %Mn in the Lower Body-LG and Upper Body ore types.
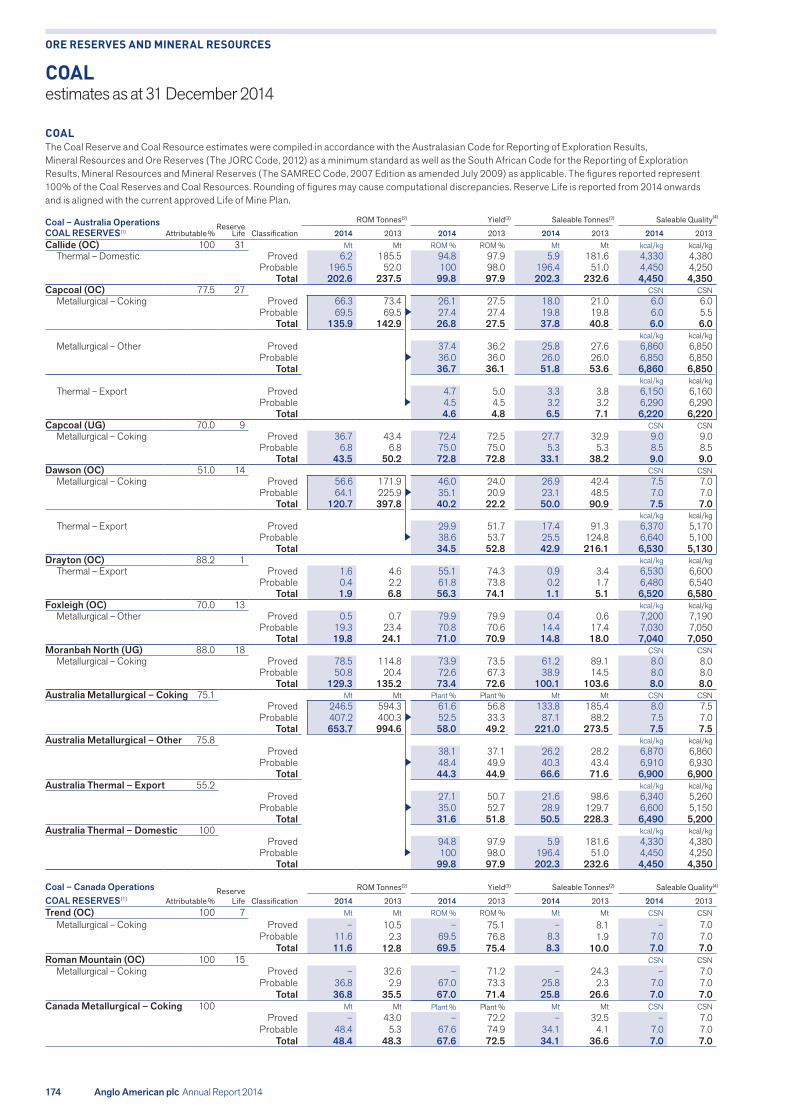
ORE RESERVES AND MINERAL RESOURCES
174 Anglo American plc Annual Report 2014
COAL The Coal Reserve and Coal Resource estimates were compiled in accordance with the Australasian Code for Reporting of Exploration Results, Mineral Resources and Ore Reserves (The JORC Code, 2012) as a minimum standard as well as the South African Code for the Reporting of Exploration Results, Mineral Resources and Mineral Reserves (The SAMREC Code, 2007 Edition as amended July 2009) as applicable. The figures reported represent 100% of the Coal Reserves and Coal Resources. Rounding of figures may cause computational discrepancies. Reserve Life is reported from 2014 onwards and is aligned with the current approved Life of Mine Plan.
Coal – Australia Operations ReserveROM Tonnes(2) Yield(3) Saleable Tonnes(2) Saleable Quality
COAL RESERVES(1) Attributable % Life Classification 2014 2013 2014 2013 2014 2013 2014 2013Callide (OC) 100 31 Mt Mt ROM % ROM % Mt Mt kcal/kg kcal/kg
Thermal – Domestic Proved 6.2 185.5 94.8 97.9 5.9 181.6 4,330 4,380Probable 196.5 52.0 100 98.0 196.4 51.0 4,450 4,250
Total 202.6 237.5 99.8 97.9 202.3 232.6 4,450 4,350Capcoal (OC) 77.5 27 CSN CSN
Metallurgical – Coking Proved 66.3 73.4 26.1 27.5 18.0 21.0 6.0 6.0Probable 69.5 69.5 27.4 27.4 19.8 19.8 6.0 5.5
Total 135.9 142.9 26.8 27.5 37.8 40.8 6.0 6.0kcal/kg kcal/kg
Metallurgical – Other Proved 37.4 36.2 25.8 27.6 6,860 6,850Probable 36.0 36.0 26.0 26.0 6,850 6,850
Total 36.7 36.1 51.8 53.6 6,860 6,850kcal/kg kcal/kg
Thermal – Export Proved 4.7 5.0 3.3 3.8 6,150 6,160Probable 4.5 4.5 3.2 3.2 6,290 6,290
Total 4.6 4.8 6.5 7.1 6,220 6,220Capcoal (UG) 70.0 9 CSN CSN
Metallurgical – Coking Proved 36.7 43.4 72.4 72.5 27.7 32.9 9.0 9.0Probable 6.8 6.8 75.0 75.0 5.3 5.3 8.5 8.5
Total 43.5 50.2 72.8 72.8 33.1 38.2 9.0 9.0Dawson (OC) 51.0 14 CSN CSN
Metallurgical – Coking Proved 56.6 171.9 46.0 24.0 26.9 42.4 7.5 7.0Probable 64.1 225.9 35.1 20.9 23.1 48.5 7.0 7.0
Total 120.7 397.8 40.2 22.2 50.0 90.9 7.5 7.0kcal/kg kcal/kg
Thermal – Export Proved 29.9 51.7 17.4 91.3 6,370 5,170Probable 38.6 53.7 25.5 124.8 6,640 5,100
Total 34.5 52.8 42.9 216.1 6,530 5,130Drayton (OC) 88.2 1 kcal/kg kcal/kg
Thermal – Export Proved 1.6 4.6 55.1 74.3 0.9 3.4 6,530 6,600Probable 0.4 2.2 61.8 73.8 0.2 1.7 6,480 6,540
Total 1.9 6.8 56.3 74.1 1.1 5.1 6,520 6,580Foxleigh (OC) 70.0 13 kcal/kg kcal/kg
Metallurgical – Other Proved 0.5 0.7 79.9 79.9 0.4 0.6 7,200 7,190Probable 19.3 23.4 70.8 70.6 14.4 17.4 7,030 7,050
Total 19.8 24.1 71.0 70.9 14.8 18.0 7,040 7,050Moranbah North (UG) 88.0 18 CSN CSN
Metallurgical – Coking Proved 78.5 114.8 73.9 73.5 61.2 89.1 8.0 8.0Probable 50.8 20.4 72.6 67.3 38.9 14.5 8.0 8.0
Total 129.3 135.2 73.4 72.6 100.1 103.6 8.0 8.0Australia Metallurgical – Coking 75.1 Mt Mt Plant % Plant % Mt Mt CSN CSN
Proved 246.5 594.3 61.6 56.8 133.8 185.4 8.0 7.5Probable 407.2 400.3 52.5 33.3 87.1 88.2 7.5 7.0
Total 653.7 994.6 58.0 49.2 221.0 273.5 7.5 7.5Australia Metallurgical – Other 75.8 kcal/kg kcal/kg
Proved 38.1 37.1 26.2 28.2 6,870 6,860Probable 48.4 49.9 40.3 43.4 6,910 6,930
Total 44.3 44.9 66.6 71.6 6,900 6,900Australia Thermal – Export 55.2 kcal/kg kcal/kg
Proved 27.1 50.7 21.6 98.6 6,340 5,260Probable 35.0 52.7 28.9 129.7 6,600 5,150
Total 31.6 51.8 50.5 228.3 6,490 5,200Australia Thermal – Domestic 100 kcal/kg kcal/kg
Proved 94.8 97.9 5.9 181.6 4,330 4,380Probable 100 98.0 196.4 51.0 4,450 4,250
Total 99.8 97.9 202.3 232.6 4,450 4,350
Coal – Canada Operations Reserve ROM Tonnes Yield Saleable Tonnes Saleable Quality
COAL RESERVES(1) Attributable % Life Classification 2014 2013 2014 2013 2014 2013 2014 2013Trend (OC) 100 7 Mt Mt ROM % ROM % Mt Mt CSN CSN
Metallurgical – Coking Proved – 10.5 – 75.1 – 8.1 – 7.0Probable 11.6 2.3 69.5 76.8 8.3 1.9 7.0 7.0
Total 11.6 12.8 69.5 75.4 8.3 10.0 7.0 7.0Roman Mountain (OC) 100 15 CSN CSN
Metallurgical – Coking Proved – 32.6 – 71.2 – 24.3 – 7.0Probable 36.8 2.9 67.0 73.3 25.8 2.3 7.0 7.0
Total 36.8 35.5 67.0 71.4 25.8 26.6 7.0 7.0Canada Metallurgical – Coking 100 Mt Mt Plant % Plant % Mt Mt CSN CSN
Proved – 43.0 – 72.2 – 32.5 – 7.0Probable 48.4 5.3 67.6 74.9 34.1 4.1 7.0 7.0
Total 48.4 48.3 67.6 72.5 34.1 36.6 7.0 7.0
(4)
(2) (3) (2) (4)
COAL estimates as at 31 December 2014

ORE RESERVES AND MINERAL RESOURCES
Anglo American plc Annual Report 2014 175
Ore R
eserves and Mineral R
esources
COAL estimates as at 31 December 2014
Coal – Colombia Operations Reserve ROM Tonnes Yield Saleable Tonnes Saleable Quality
COAL RESERVES(1) Attributable % Life Classification 2014 2013 2014 2013 2014 2013 2014 2013Cerrejón (OC) 33.3 18 Mt Mt ROM % ROM % Mt Mt kcal/kg kcal/kg
Thermal – Export Proved 574.6 645.1 96.3 96.0 561.2 626.6 6,150 6,150Probable 91.6 96.2 95.6 95.7 89.5 93.9 6,130 6,130
Total 666.2 741.3 96.2 96.0 650.7 720.4 6,150 6,150
Coal – South Africa Operations ReserveROM Tonnes Yield Saleable Tonnes Saleable Quality
COAL RESERVES(1) Attributable % Life Classification 2014 2013 2014 2013 2014 2013 2014 2013Goedehoop (UG) 100 11 Mt Mt ROM % ROM % Mt Mt kcal/kg kcal/kg
Thermal – Export Proved 40.6 29.5 58.0 52.5 24.0 15.8 5,970 6,200Probable 9.9 29.9 67.3 58.5 6.8 17.8 5,750 5,930
Total 50.5 59.4 59.8 55.5 30.8 33.6 5,920 6,060Greenside (UG) 100 14 kcal/kg kcal/kg
Thermal – Export Proved 29.1 23.0 72.8 68.4 21.9 16.2 6,010 6,080Probable 29.4 36.8 66.5 68.6 20.3 26.2 5,980 5,840
Total 58.5 59.8 69.6 68.5 42.2 42.5 6,000 5,930Isibonelo (OC) 100 13 kcal/kg kcal/kg
Synfuel Proved 59.0 65.2 100 100 59.0 65.2 4,680 4,690Probable – – – – – – – –
Total 59.0 65.2 100 100 59.0 65.2 4,680 4,690Kleinkopje (OC) 100 11 kcal/kg kcal/kg
Thermal – Export Proved 31.3 38.9 45.7 38.2 14.8 15.4 6,210 6,190Probable – – – – – – – –
Total 31.3 38.9 45.7 38.2 14.8 15.4 6,210 6,190kcal/kg kcal/kg
Thermal – Domestic Proved 20.3 30.7 6.4 11.9 4,630 4,580Probable – – – – – –
Total 20.3 30.7 6.4 11.9 4,630 4,580Kriel (UG&OC) 73.0 6 kcal/kg kcal/kg
Thermal – Domestic Proved 28.0 36.1 100 100 28.0 36.1 4,870 4,860Probable – 10.0 – 100 – 10.0 – 4,280
Total 28.0 46.1 100 100 28.0 46.1 4,870 4,730Landau (OC) 100 4 kcal/kg kcal/kg
Thermal – Export Proved 15.2 22.0 48.0 47.8 7.4 10.7 6,130 6,230Probable 10.2 12.2 46.3 46.6 4.8 5.8 6,160 6,250
Total 25.4 34.2 47.3 47.4 12.3 16.5 6,140 6,240kcal/kg kcal/kg
Thermal – Domestic Proved 21.3 15.6 3.3 3.5 4,210 4,390Probable 20.2 21.1 2.1 2.6 4,310 4,530
Total 20.9 17.6 5.3 6.1 4,250 4,450Mafube (OC) 50.0 17 kcal/kg kcal/kg
Thermal – Export Proved 5.8 10.2 50.0 51.2 2.9 5.3 6,260 6,260Probable 113.0 113.0 42.8 42.8 48.4 48.4 6,040 6,040
Total 118.7 123.2 43.2 43.5 51.3 53.7 6,050 6,060kcal/kg kcal/kg
Thermal – Domestic Proved 23.6 24.5 1.4 2.6 5,130 5,240Probable 18.4 18.4 21.1 21.1 5,060 5,050
Total 18.7 18.9 22.5 23.7 5,060 5,070New Denmark (UG) 100 25 kcal/kg kcal/kg
Thermal – Domestic Proved 19.5 25.8 100 100 19.5 25.8 5,020 5,040Probable 87.3 82.7 100 100 87.3 82.7 4,910 5,150
Total 106.8 108.6 100 100 106.8 108.6 4,930 5,120New Vaal (OC) 100 17 kcal/kg kcal/kg
Thermal – Domestic Proved 270.0 296.3 95.3 93.4 265.7 286.6 3,660 3,510Probable – – – – – – – –
Total 270.0 296.3 95.3 93.4 265.7 286.6 3,660 3,510Zibulo (UG&OC) 73.0 21 kcal/kg kcal/kg
Thermal – Export Proved 67.2 84.1 57.9 58.0 39.3 49.0 6,100 6,110Probable 35.6 34.2 46.2 46.8 16.6 16.1 6,100 6,110
Total 102.8 118.2 53.9 54.8 55.9 65.1 6,100 6,110kcal/kg kcal/kg
Thermal – Domestic Proved 14.7 14.6 9.9 12.2 4,830 4,840Probable 20.2 20.7 7.2 7.1 4,820 4,830
Total 16.6 16.4 17.1 19.3 4,830 4,840South Africa Thermal – Export 80.3 Mt Mt Plant % Plant % Mt Mt kcal/kg kcal/kg
Proved 565.7 631.1 58.4 57.8 110.4 112.5 6,070 6,150Probable 285.3 318.8 50.2 53.3 96.9 114.3 6,020 6,000
Total 851.0 949.9 54.6 55.5 207.3 226.8 6,050 6,070South Africa Thermal – Domestic 94.8 kcal/kg kcal/kg
Proved 91.1 91.3 334.2 378.7 3,910 3,840Probable 79.1 81.5 117.7 123.6 4,920 5,030
Total 88.0 88.9 451.8 502.3 4,170 4,130South Africa – Synfuel 100 kcal/kg kcal/kg
Proved 100 100 59.0 65.2 4,680 4,690Probable – – – – – –
Total 100 100 59.0 65.2 4,680 4,690Mining method: OC = Open Cast/Cut, UG = Underground. Reserve Life = The scheduled extraction period in years for the total Ore Reserves in the approved Life of Mine Plan. For the multi-product operations, the ROM tonnes apply to each product. The Saleable tonnes cannot be calculated directly from the ROM reserve tonnes using the air dried yields as presented since the difference in moisture content is not taken into account. Attributable percentages for country totals are weighted by Saleable tonnes and should not be directly applied to the ROM tonnes. Footnotes appear at the end of the section.
(2) (3) (2) (4)
(2) (3) (2) (4)
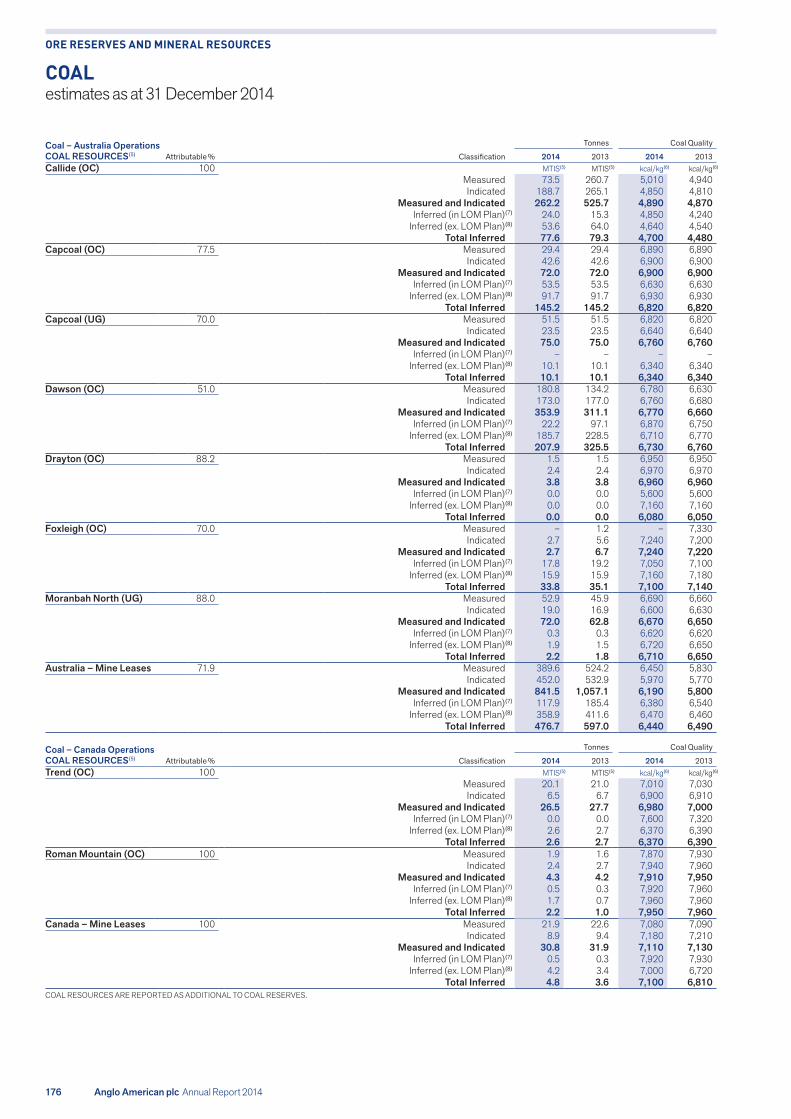
ORE RESERVES AND MINERAL RESOURCES
176 Anglo American plc Annual Report 2014
COAL estimates as at 31 December 2014
Coal – Australia Operations Tonnes Coal Quality
COAL RESOURCES(5) Attributable % Classification 2014 2013 2014 2013Callide (OC) 100 MTIS MTIS kcal/kg kcal/kg
Measured 73.5 260.7 5,010 4,940Indicated 188.7 265.1 4,850 4,810
Measured and Indicated 262.2 525.7 4,890 4,870Inferred (in LOM Plan) 24.0 15.3 4,850 4,240
Inferred (ex. LOM Plan) 53.6 64.0 4,640 4,540Total Inferred 77.6 79.3 4,700 4,480
Capcoal (OC) 77.5 Measured 29.4 29.4 6,890 6,890Indicated 42.6 42.6 6,900 6,900
Measured and Indicated 72.0 72.0 6,900 6,900Inferred (in LOM Plan) 53.5 53.5 6,630 6,630
Inferred (ex. LOM Plan) 91.7 91.7 6,930 6,930Total Inferred 145.2 145.2 6,820 6,820
Capcoal (UG) 70.0 Measured 51.5 51.5 6,820 6,820Indicated 23.5 23.5 6,640 6,640
Measured and Indicated 75.0 75.0 6,760 6,760Inferred (in LOM Plan) – – – –
Inferred (ex. LOM Plan) 10.1 10.1 6,340 6,340Total Inferred 10.1 10.1 6,340 6,340
Dawson (OC) 51.0 Measured 180.8 134.2 6,780 6,630Indicated 173.0 177.0 6,760 6,680
Measured and Indicated 353.9 311.1 6,770 6,660Inferred (in LOM Plan) 22.2 97.1 6,870 6,750
Inferred (ex. LOM Plan) 185.7 228.5 6,710 6,770Total Inferred 207.9 325.5 6,730 6,760
Drayton (OC) 88.2 Measured 1.5 1.5 6,950 6,950Indicated 2.4 2.4 6,970 6,970
Measured and Indicated 3.8 3.8 6,960 6,960Inferred (in LOM Plan) 0.0 0.0 5,600 5,600
Inferred (ex. LOM Plan) 0.0 0.0 7,160 7,160Total Inferred 0.0 0.0 6,080 6,050
Foxleigh (OC) 70.0 Measured – 1.2 – 7,330Indicated 2.7 5.6 7,240 7,200
Measured and Indicated 2.7 6.7 7,240 7,220Inferred (in LOM Plan) 17.8 19.2 7,050 7,100
Inferred (ex. LOM Plan) 15.9 15.9 7,160 7,180Total Inferred 33.8 35.1 7,100 7,140
Moranbah North (UG) 88.0 Measured 52.9 45.9 6,690 6,660Indicated 19.0 16.9 6,600 6,630
Measured and Indicated 72.0 62.8 6,670 6,650Inferred (in LOM Plan) 0.3 0.3 6,620 6,620
Inferred (ex. LOM Plan) 1.9 1.5 6,720 6,650Total Inferred 2.2 1.8 6,710 6,650
Australia – Mine Leases 71.9 Measured 389.6 524.2 6,450 5,830Indicated 452.0 532.9 5,970 5,770
Measured and Indicated 841.5 1,057.1 6,190 5,800Inferred (in LOM Plan) 117.9 185.4 6,380 6,540
Inferred (ex. LOM Plan) 358.9 411.6 6,470 6,460Total Inferred 476.7 597.0 6,440 6,490
Coal – Canada Operations Tonnes Coal Quality
COAL RESOURCES(5) Attributable % Classification 2014 2013 2014 2013Trend (OC) 100 MTIS MTIS kcal/kg kcal/kg
Measured 20.1 21.0 7,010 7,030Indicated 6.5 6.7 6,900 6,910
Measured and Indicated 26.5 27.7 6,980 7,000Inferred (in LOM Plan) 0.0 0.0 7,600 7,320
Inferred (ex. LOM Plan) 2.6 2.7 6,370 6,390Total Inferred 2.6 2.7 6,370 6,390
Roman Mountain (OC) 100 Measured 1.9 1.6 7,870 7,930Indicated 2.4 2.7 7,940 7,960
Measured and Indicated 4.3 4.2 7,910 7,950Inferred (in LOM Plan) 0.5 0.3 7,920 7,960
Inferred (ex. LOM Plan) 1.7 0.7 7,960 7,960Total Inferred 2.2 1.0 7,950 7,960
Canada – Mine Leases 100 Measured 21.9 22.6 7,080 7,090Indicated 8.9 9.4 7,180 7,210
Measured and Indicated 30.8 31.9 7,110 7,130Inferred (in LOM Plan) 0.5 0.3 7,920 7,930
Inferred (ex. LOM Plan) 4.2 3.4 7,000 6,720Total Inferred 4.8 3.6 7,100 6,810
COAL RESOURCES ARE REPORTED AS ADDITIONAL TO COAL RESERVES.
(5) (5) (6) (6)
(7)
(8)
(7)
(8)
(7)
(8)
(7)
(8)
(7)
(8)
(7)
(8)
(7)
(8)
(7)
(8)
(5) (5) (6) (6)
(7)
(8)
(7)
(8)
(7)
(8)

ORE RESERVES AND MINERAL RESOURCES
Anglo American plc Annual Report 2014 177
Ore R
eserves and Mineral R
esources
COAL estimates as at 31 December 2014
Coal – Colombia Operations Tonnes Coal Quality
COAL RESOURCES(5) Attributable % Classification 2014 2013 2014 2013Cerrejón (OC) 33.3 MTIS MTIS kcal/kg kcal/kg
Measured 942.1 911.3 6,540 6,410Indicated 161.2 162.9 6,570 6,340
Measured and Indicated 1,103.3 1,074.2 6,540 6,400Inferred (in LOM Plan) 58.8 68.0 6,710 6,770
Inferred (ex. LOM Plan) 32.5 29.5 6,910 6,580Total Inferred 91.3 97.5 6,780 6,710
Coal – South Africa Operations Tonnes Coal Quality
COAL RESOURCES(5) Attributable % Classification 2014 2013 2014 2013Goedehoop (UG) 100 MTIS MTIS kcal/kg kcal/kg
Measured 221.7 205.6 5,300 5,260Indicated 29.3 29.0 4,900 4,910
Measured and Indicated 250.9 234.6 5,250 5,210Inferred (in LOM Plan) 1.6 1.6 4,820 5,300
Inferred (ex. LOM Plan) 11.2 11.2 4,820 4,810Total Inferred 12.7 12.8 4,820 4,870
Greenside (UG) 100 Measured 19.0 18.4 5,660 5,680Indicated 1.3 1.7 5,140 5,140
Measured and Indicated 20.3 20.1 5,630 5,630Inferred (in LOM Plan) 0.5 1.9 5,390 5,730
Inferred (ex. LOM Plan) – 0.8 – 6,050Total Inferred 0.5 2.8 5,390 5,830
Isibonelo (OC) 100 Measured – – – –Indicated 16.8 16.3 5,400 5,390
Measured and Indicated 16.8 16.3 5,400 5,390Kleinkopje (OC) 100 Measured 28.6 28.0 5,010 5,020
Indicated – – – –Measured and Indicated 28.6 28.0 5,010 5,020
Kriel (UG&OC) 73.0 Measured 98.4 73.4 4,850 4,870Indicated 1.0 10.2 4,930 4,860
Measured and Indicated 99.4 83.5 4,850 4,870Inferred (in LOM Plan) – – – –
Inferred (ex. LOM Plan) – 18.8 – 4,950Total Inferred – 18.8 – 4,950
Landau (OC) 100 Measured 50.4 50.1 5,110 5,230Indicated 36.1 34.4 5,260 5,250
Measured and Indicated 86.5 84.5 5,170 5,240Inferred (in LOM Plan) – – – –
Inferred (ex. LOM Plan) 18.1 18.1 5,500 5,500Total Inferred 18.1 18.1 5,500 5,500
Mafube (OC) 50.0 Measured 53.3 53.9 5,330 5,300Indicated 4.3 4.3 4,370 4,370
Measured and Indicated 57.5 58.2 5,260 5,230Inferred (in LOM Plan) 0.9 0.9 4,040 4,040
Inferred (ex. LOM Plan) 1.2 1.2 5,360 5,360Total Inferred 2.1 2.1 4,770 4,770
New Denmark (UG) 100 Measured 70.3 65.8 5,790 5,800Indicated – 2.9 – 5,850
Measured and Indicated 70.3 68.7 5,790 5,800Inferred (in LOM Plan) – 14.4 – 5,270
Inferred (ex. LOM Plan) – 1.2 – 5,390Total Inferred – 15.6 – 5,280
Zibulo (UG&OC) 73.0 Measured 178.9 173.9 4,970 4,900Indicated 145.9 201.0 5,000 4,870
Measured and Indicated 324.9 375.0 4,980 4,890Inferred (in LOM Plan) 28.2 20.8 5,150 5,320
Inferred (ex. LOM Plan) 169.3 132.8 4,710 4,820Total Inferred 197.5 153.6 4,770 4,890
South Africa – Mine Leases 83.3 Measured 720.6 669.1 5,190 5,180Indicated 234.6 299.8 5,050 4,950
Measured and Indicated 955.1 968.9 5,160 5,110Inferred (in LOM Plan) 31.2 39.7 5,100 5,290
Inferred (ex. LOM Plan) 199.8 184.1 4,790 4,910Total Inferred 231.0 223.8 4,830 4,980
COAL RESOURCES ARE REPORTED AS ADDITIONAL TO COAL RESERVES.
(5) (5) (6) (6)
(7)
(8)
(5) (5) (6) (6)
(7)
(8)
(7)
(8)
(7)
(8)
(7)
(8)
(7)
(8)
(7)
(8)
(7)
(8)
(7)
(8)

ORE RESERVES AND MINERAL RESOURCES
178 Anglo American plc Annual Report 2014
COAL estimates as at 31 December 2014
Coal – Australia Projects ReserveROM Tonnes Yield Saleable Tonnes Saleable Quality
COAL RESERVES(1) Attributable % Life Classification 2014 2013 2014 2013 2014 2013 2014 2013Capcoal (UG) – Aquila 70.0 14 Mt Mt ROM % ROM % Mt Mt CSN CSN
Metallurgical – Coking Proved 35.4 26.3 68.2 69.2 25.5 19.2 9.0 9.0Probable 11.3 19.2 67.8 66.4 8.1 13.5 9.0 9.0
Total 46.6 45.5 68.1 68.0 33.5 32.7 9.0 9.0Grosvenor (UG) 100 34 CSN CSN
Metallurgical – Coking Proved 29.1 115.0 66.9 65.5 20.6 79.6 8.0 8.5Probable 163.8 78.7 62.5 61.9 108.1 51.4 8.5 8.0
Total 192.9 193.7 63.2 64.0 128.6 130.9 8.5 8.5Australia – Projects 93.8 Mt Mt Plant % Plant % Mt Mt CSN CSN
Metallurgical – Coking Proved 64.5 141.3 67.6 66.2 46.0 98.8 8.5 8.5Probable 175.1 97.9 62.9 62.8 116.2 64.9 8.5 8.0
Total 239.6 239.2 64.2 64.8 162.2 163.6 8.5 8.5
Coal – Australia Projects Tonnes Coal Quality
COAL RESOURCES(5) Attributable % Classification 2014 2013 2014 2013Capcoal (UG) – Aquila 70.0 MTIS MTIS kcal/kg kcal/kg
Measured 17.5 13.5 6,820 6,750Indicated 16.1 19.3 6,450 6,390
Measured and Indicated 33.6 32.8 6,640 6,540Inferred (in LOM Plan) 0.0 0.0 6,660 6,570
Inferred (ex. LOM Plan) 3.6 6.7 6,030 6,190Total Inferred 3.6 6.8 6,030 6,190
Dartbrook 83.3 Measured 386.1 386.1 5,720 5,720Indicated 24.8 24.8 5,460 5,460
Measured and Indicated 410.9 410.9 5,700 5,700Inferred 1.3 1.3 5,080 5,080
Drayton South 88.2 Measured 492.1 492.1 6,240 6,240Indicated 189.0 189.0 6,260 6,260
Measured and Indicated 681.1 681.1 6,250 6,250Inferred 90.7 90.7 5,950 5,950
Grosvenor (UG) 100 Measured 121.1 110.8 6,520 6,510Indicated 69.0 62.0 6,680 6,600
Measured and Indicated 190.1 172.9 6,580 6,540Inferred (in LOM Plan) 12.0 10.4 6,340 6,330
Inferred (ex. LOM Plan) 25.3 18.9 6,800 6,740Total Inferred 37.3 29.3 6,650 6,600
Moranbah South 50.0 Measured 481.9 487.1 6,270 6,300Indicated 222.5 208.1 6,420 6,470
Measured and Indicated 704.4 695.2 6,320 6,350Inferred 28.0 30.3 6,700 6,800
Teviot Brook 100 Measured 4.6 3.2 6,750 6,760Indicated 163.3 138.4 6,610 6,610
Measured and Indicated 167.9 141.6 6,610 6,610Inferred 32.2 34.1 6,510 6,540
Theodore 51.0 Measured – – – –Indicated 258.5 258.5 6,260 6,260
Measured and Indicated 258.5 258.5 6,260 6,260Inferred 106.0 106.0 6,160 6,160
Australia – Projects 73.9 Measured 1,503.3 1,492.8 6,150 6,150Indicated 943.2 900.2 6,370 6,370
Measured and Indicated 2,446.5 2,393.0 6,230 6,230Inferred (in LOM Plan) 12.1 10.4 6,340 6,330
Inferred (ex. LOM Plan) 287.2 288.1 6,240 6,240Total Inferred 299.2 298.5 6,240 6,240
COAL RESOURCES ARE REPORTED AS ADDITIONAL TO COAL RESERVES. Attributable percentages for country totals are weighted by Total MTIS. Due to the uncertainty that may be attached to some Inferred Coal Resources, it cannot be assumed that all or part of an Inferred Coal Resource will necessarily be upgraded to an Indicated or Measured Resource after continued exploration.
(2) (3) (2) (4)
(5) (5) (6) (6)
(7)
(8)
(7)
(8)
(7)
(8)

ORE RESERVES AND MINERAL RESOURCES
Anglo American plc Annual Report 2014 179
Ore R
eserves and Mineral R
esources
COAL estimates as at 31 December 2014
Coal – Canada Projects Tonnes Coal Quality
COAL RESOURCES(5) Attributable % Classification 2014 2013 2014 2013Belcourt Saxon 50.0 MTIS MTIS kcal/kg kcal/kg
Measured 166.7 166.7 6,500 6,500Indicated 4.3 4.3 6,500 6,500
Measured and Indicated 171.0 171.0 6,500 6,500Inferred 0.2 0.2 6,500 6,500
Coal – South Africa Projects Tonnes Coal Quality
COAL RESOURCES(5) Attributable % Classification 2014 2013 2014 2013Elders 73.0 MTIS MTIS kcal/kg kcal/kg
Measured 169.9 176.4 4,970 4,970Indicated 9.5 9.6 4,700 4,700
Measured and Indicated 179.5 186.0 4,960 4,950Inferred 20.1 22.4 4,830 4,750
Elders UG Extension 73.0 Measured 66.2 66.2 5,520 5,520Indicated 83.2 85.3 5,560 5,550
Measured and Indicated 149.4 151.5 5,540 5,540Inferred 84.7 90.0 5,460 5,460
Kriel Block F 100 Measured 47.7 49.0 5,300 5,310Indicated 11.1 13.8 5,360 5,360
Measured and Indicated 58.8 62.8 5,310 5,320Inferred – – – –
Kriel East 73.0 Measured 117.4 114.6 4,940 4,950Indicated 13.3 18.1 4,920 4,990
Measured and Indicated 130.7 132.7 4,940 4,960Inferred 7.5 6.6 4,880 4,880
New Largo 73.0 Measured 410.2 412.1 4,410 4,410Indicated 161.4 161.8 4,270 4,270
Measured and Indicated 571.6 573.9 4,370 4,370Inferred 13.5 13.4 5,290 5,300
Nooitgedacht 100 Measured 34.5 34.5 5,330 5,330Indicated 10.2 10.2 5,410 5,410
Measured and Indicated 44.7 44.7 5,350 5,350Inferred 10.8 10.8 5,280 5,280
South Rand 73.0 Measured 79.2 78.6 4,840 4,850Indicated 172.7 168.1 4,770 4,770
Measured and Indicated 251.9 246.7 4,790 4,790Inferred 225.1 157.2 4,600 4,780
Vaal Basin 100 Measured 348.2 378.8 4,320 4,330Indicated 203.3 223.6 4,190 4,220
Measured and Indicated 551.5 602.4 4,270 4,290Inferred 83.6 92.0 4,200 4,250
South Africa – Projects 81.5 Measured 1,273.3 1,310.2 4,650 4,650Indicated 664.8 690.6 4,590 4,600
Measured and Indicated 1,938.1 2,000.8 4,630 4,630Inferred 445.3 392.4 4,740 4,840
Attributable percentages for country totals are weighted by Total MTIS. Due to the uncertainty that may be attached to some Inferred Coal Resources, it cannot be assumed that all or part of an Inferred Coal Resource will necessarily be upgraded to an Indicated or Measured Resource after continued exploration.
(5) (5) (6) (6)
(5) (5) (6) (6)
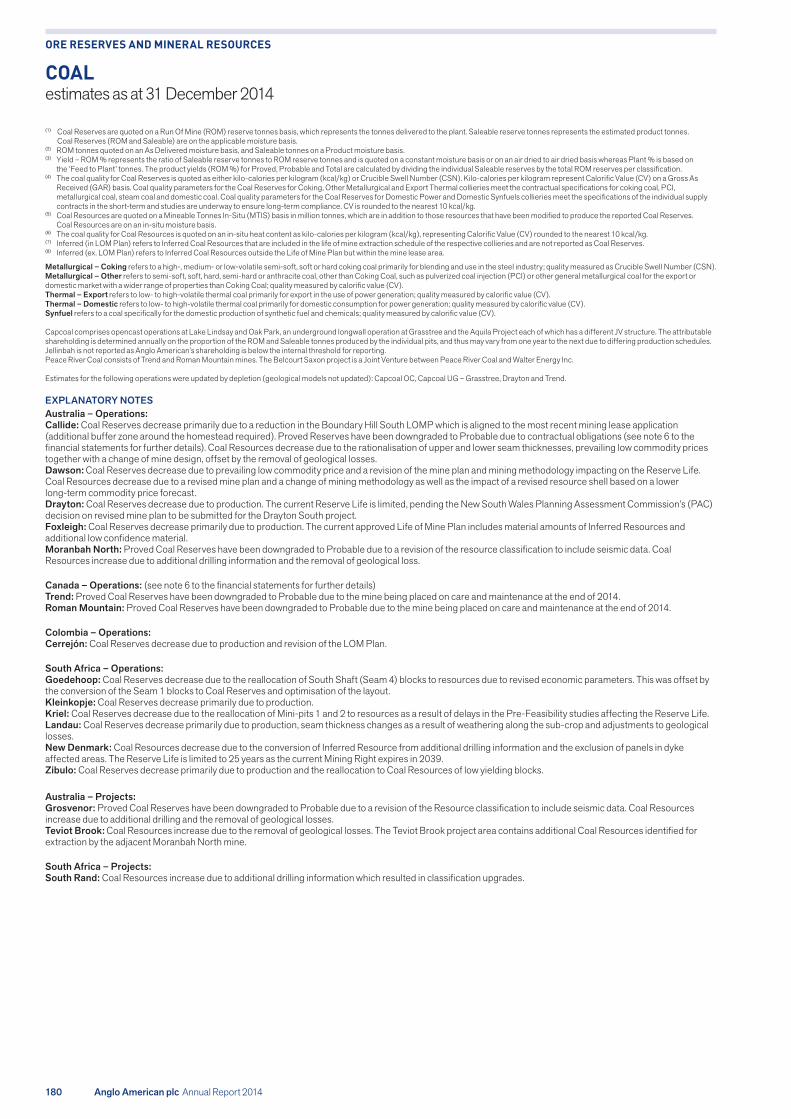
ORE RESERVES AND MINERAL RESOURCES
180 Anglo American plc Annual Report 2014
COAL estimates as at 31 December 2014
(1) Coal Reserves are quoted on a Run Of Mine (ROM) reserve tonnes basis, which represents the tonnes delivered to the plant. Saleable reserve tonnes represents the estimated product tonnes. Coal Reserves (ROM and Saleable) are on the applicable moisture basis.
(2) ROM tonnes quoted on an As Delivered moisture basis, and Saleable tonnes on a Product moisture basis.(3) Yield – ROM % represents the ratio of Saleable reserve tonnes to ROM reserve tonnes and is quoted on a constant moisture basis or on an air dried to air dried basis whereas Plant % is based on
the ‘Feed to Plant’ tonnes. The product yields (ROM %) for Proved, Probable and Total are calculated by dividing the individual Saleable reserves by the total ROM reserves per classification.(4) The coal quality for Coal Reserves is quoted as either kilo-calories per kilogram (kcal/kg) or Crucible Swell Number (CSN). Kilo-calories per kilogram represent Calorific Value (CV) on a Gross As
Received (GAR) basis. Coal quality parameters for the Coal Reserves for Coking, Other Metallurgical and Export Thermal collieries meet the contractual specifications for coking coal, PCI, metallurgical coal, steam coal and domestic coal. Coal quality parameters for the Coal Reserves for Domestic Power and Domestic Synfuels collieries meet the specifications of the individual supply contracts in the short-term and studies are underway to ensure long-term compliance. CV is rounded to the nearest 10 kcal/kg.
(5) Coal Resources are quoted on a Mineable Tonnes In-Situ (MTIS) basis in million tonnes, which are in addition to those resources that have been modified to produce the reported Coal Reserves. Coal Resources are on an in-situ moisture basis.
(6) The coal quality for Coal Resources is quoted on an in-situ heat content as kilo-calories per kilogram (kcal/kg), representing Calorific Value (CV) rounded to the nearest 10 kcal/kg. (7) Inferred (in LOM Plan) refers to Inferred Coal Resources that are included in the life of mine extraction schedule of the respective collieries and are not reported as Coal Reserves. (8) Inferred (ex. LOM Plan) refers to Inferred Coal Resources outside the Life of Mine Plan but within the mine lease area.
Metallurgical – Coking refers to a high-, medium- or low-volatile semi-soft, soft or hard coking coal primarily for blending and use in the steel industry; quality measured as Crucible Swell Number (CSN).Metallurgical – Other refers to semi-soft, soft, hard, semi-hard or anthracite coal, other than Coking Coal, such as pulverized coal injection (PCI) or other general metallurgical coal for the export or domestic market with a wider range of properties than Coking Coal; quality measured by calorific value (CV). Thermal – Export refers to low- to high-volatile thermal coal primarily for export in the use of power generation; quality measured by calorific value (CV). Thermal – Domestic refers to low- to high-volatile thermal coal primarily for domestic consumption for power generation; quality measured by calorific value (CV). Synfuel refers to a coal specifically for the domestic production of synthetic fuel and chemicals; quality measured by calorific value (CV).
Capcoal comprises opencast operations at Lake Lindsay and Oak Park, an underground longwall operation at Grasstree and the Aquila Project each of which has a different JV structure. The attributable shareholding is determined annually on the proportion of the ROM and Saleable tonnes produced by the individual pits, and thus may vary from one year to the next due to differing production schedules.Jellinbah is not reported as Anglo American’s shareholding is below the internal threshold for reporting. Peace River Coal consists of Trend and Roman Mountain mines. The Belcourt Saxon project is a Joint Venture between Peace River Coal and Walter Energy Inc. Estimates for the following operations were updated by depletion (geological models not updated): Capcoal OC, Capcoal UG – Grasstree, Drayton and Trend.
EXPLANATORY NOTESAustralia – Operations:Callide: Coal Reserves decrease primarily due to a reduction in the Boundary Hill South LOMP which is aligned to the most recent mining lease application (additional buffer zone around the homestead required). Proved Reserves have been downgraded to Probable due to contractual obligations (see note 6 to the financial statements for further details). Coal Resources decrease due to the rationalisation of upper and lower seam thicknesses, prevailing low commodity prices together with a change of mine design, offset by the removal of geological losses.Dawson: Coal Reserves decrease due to prevailing low commodity price and a revision of the mine plan and mining methodology impacting on the Reserve Life. Coal Resources decrease due to a revised mine plan and a change of mining methodology as well as the impact of a revised resource shell based on a lower long-term commodity price forecast.Drayton: Coal Reserves decrease due to production. The current Reserve Life is limited, pending the New South Wales Planning Assessment Commission’s (PAC) decision on revised mine plan to be submitted for the Drayton South project.Foxleigh: Coal Reserves decrease primarily due to production. The current approved Life of Mine Plan includes material amounts of Inferred Resources and additional low confidence material.Moranbah North: Proved Coal Reserves have been downgraded to Probable due to a revision of the resource classification to include seismic data. Coal Resources increase due to additional drilling information and the removal of geological loss.
Canada – Operations: (see note 6 to the financial statements for further details)Trend: Proved Coal Reserves have been downgraded to Probable due to the mine being placed on care and maintenance at the end of 2014.Roman Mountain: Proved Coal Reserves have been downgraded to Probable due to the mine being placed on care and maintenance at the end of 2014.
Colombia – Operations:Cerrejón: Coal Reserves decrease due to production and revision of the LOM Plan.
South Africa – Operations:Goedehoop: Coal Reserves decrease due to the reallocation of South Shaft (Seam 4) blocks to resources due to revised economic parameters. This was offset by the conversion of the Seam 1 blocks to Coal Reserves and optimisation of the layout. Kleinkopje: Coal Reserves decrease primarily due to production.Kriel: Coal Reserves decrease due to the reallocation of Mini-pits 1 and 2 to resources as a result of delays in the Pre-Feasibility studies affecting the Reserve Life.Landau: Coal Reserves decrease primarily due to production, seam thickness changes as a result of weathering along the sub-crop and adjustments to geological losses.New Denmark: Coal Resources decrease due to the conversion of Inferred Resource from additional drilling information and the exclusion of panels in dyke affected areas. The Reserve Life is limited to 25 years as the current Mining Right expires in 2039.Zibulo: Coal Reserves decrease primarily due to production and the reallocation to Coal Resources of low yielding blocks.
Australia – Projects:Grosvenor: Proved Coal Reserves have been downgraded to Probable due to a revision of the Resource classification to include seismic data. Coal Resources increase due to additional drilling and the removal of geological losses. Teviot Brook: Coal Resources increase due to the removal of geological losses. The Teviot Brook project area contains additional Coal Resources identified for extraction by the adjacent Moranbah North mine.
South Africa – Projects:South Rand: Coal Resources increase due to additional drilling information which resulted in classification upgrades.

ORE RESERVES AND MINERAL RESOURCES
Anglo American plc Annual Report 2014 181
Ore R
eserves and Mineral R
esources
COAL estimates as at 31 December 2014
Mineral Tenure:Callide: Mining Leases ML80121 and ML80186 are currently pending grant. There is reasonable expectation that such rights will not be withheld.Capcoal: Exploration Permit for Coal EPC2033 will expire in 2015 and an application for renewal will be submitted. There is reasonable expectation that such rights will not be withheld.Dawson: Mining Lease ML5644 will expire in 2015 and an application for its renewal has been submitted. There is reasonable expectation that such rights will not be withheld.Foxleigh: Grant of Mining Lease ML70310 is currently pending. There is reasonable expectation that such rights will not be withheld.
Cerrejón: Coal Reserves are estimated for the area defined by the current approved Mining Right which expires in 2033. In order to exploit the Coal Resources, a renewal will be applied for at the appropriate time. There is a reasonable expectation that such renewal will not be withheld.
Mafube: Application for conversion to a Mining Right at Nooitgedacht has been granted and executed in 2013. A Water Use Licence for the pans at Springboklaagte has been granted late in 2014, the mining schedule will be updated.New Largo: The New Largo Mining Right has been granted in August 2013; The execution of the mining right is awaited. Audits related to the generation of the Coal Reserve estimates were carried out by independent consultants during 2014 at the following operations and projects: Australia – CallideSouth Africa – Greenside, Isibonelo and Kriel in progress
Audits related to the generation of the Coal Resource estimates were carried out by independent consultants during 2014 at the following operations and projects:Australia – Callide (Dunn Creek), Foxleigh (Carlo Creek, Daggers Tip and Eagles Nest), Moranbah North-Grosvenor-Teviot Brook (combined geological model)Canada – Roman Mountain South Africa – Isibonelo and Zibulo in progress

ORE RESERVES AND MINERAL RESOURCES
182 Anglo American plc Annual Report 2014
COPPER estimates as at 31 December 2014
COPPERThe Ore Reserve and Mineral Resource estimates were compiled in accordance with the Australasian Code for Reporting of Exploration Results, Mineral Resources and Ore Reserves (The JORC Code, 2012) as a minimum standard. The figures reported represent 100% of the Ore Reserves and Mineral Resources. Rounding of figures may cause computational discrepancies for totals. Reserve Life is reported from 2014 onwards and is aligned with the current approved Life of Mine Plan.
Copper – Operations ORE RESERVES
Reserve Tonnes Grade Contained MetalAttributable % Life Classification 2014 2013 2014 2013 2014 2013
Collahuasi (OP) 44.0 70 Mt Mt %TCu %TCu kt ktOxide and Mixed Proved 17.7 – 0.67 – 118 –Heap Leach Probable 19.9 7.0 0.73 0.57 145 40
Total 37.5 7.0 0.70 0.57 263 40%TCu %TCu
Sulphide Proved 422.2 422.4 1.03 1.03 4,349 4,351Flotation – direct feed Copper Probable 1,601.9 1,683.0 0.99 0.98 15,859 16,494
Total 2,024.2 2,105.4 1.00 0.99 20,208 20,845%Mo %Mo
Proved 0.021 0.023 89 97Molybdenum Probable 0.023 0.023 368 387
Total 0.023 0.023 457 484%TCu %TCu
Low Grade Sulphide Proved 41.3 28.2 0.42 0.53 174 150Flotation – stockpile Copper Probable 1,151.5 1,137.8 0.48 0.48 5,527 5,427
Total 1,192.8 1,166.0 0.48 0.48 5,701 5,576%Mo %Mo
Proved 0.013 0.013 5 4Molybdenum Probable 0.010 0.010 115 109
Total 0.010 0.010 121 113El Soldado (OP) 50.1 13 %TCu %TCu
Sulphide Proved 53.4 48.1 0.85 0.94 454 452Flotation Probable 35.6 39.1 0.78 0.82 278 321
Total 89.0 87.2 0.82 0.89 731 773Oxide Proved – – – – – –Heap Leach Probable – 2.3 – 0.33 – 8
Total – 2.3 – 0.33 – 8Los Bronces (OP) 50.1 35 %TCu %TCu
Sulphide Proved 670.1 721.4 0.66 0.69 4,422 4,977Flotation Copper Probable 843.1 724.1 0.53 0.53 4,468 3,838
Total 1,513.2 1,445.4 0.59 0.61 8,891 8,815%Mo %Mo
Proved 0.015 0.015 101 108Molybdenum Probable 0.013 0.013 110 94
Total 0.014 0.014 210 202%TCu %TCu
Sulphide Proved 368.5 439.1 0.31 0.32 1,142 1,405Dump Leach Probable 177.1 158.5 0.27 0.29 478 460
Total 545.6 597.6 0.30 0.31 1,620 1,865Mantos Blancos (OP) 100 10 %ICu %ICu
Sulphide Proved 17.4 19.2 0.89 0.86 155 165Flotation Probable 29.4 29.3 0.70 0.72 205 211
Total 46.8 48.5 0.77 0.78 361 376%ASCu %ASCu
Oxide Proved 2.2 3.7 0.48 0.48 11 18Vat and Heap Leach Probable 12.7 12.0 0.32 0.44 41 53
Total 14.9 15.7 0.34 0.45 51 71%ASCu %ASCu
Oxide Proved 0.6 – 0.17 – 1 –Dump Leach Probable 37.5 36.2 0.20 0.23 74 83
Total 38.1 36.2 0.20 0.23 75 83Mantoverde (OP) 100 5 %ASCu %ASCu
Oxide Proved 38.3 38.9 0.52 0.53 199 206Heap Leach Probable 9.7 9.3 0.49 0.52 47 48
Total 47.9 48.1 0.51 0.53 246 254%ASCu %ASCu
Oxide Proved 30.9 20.1 0.19 0.22 59 44Dump Leach Probable 13.0 13.4 0.19 0.23 25 31
Total 43.9 33.4 0.19 0.22 83 75Mining method: OP = Open Pit. Reserve Life = The scheduled extraction period in years for the total Ore Reserves in the approved Life of Mine Plan. TCu = Total Copper, ICu = Insoluble Copper (total copper less acid soluble copper), ASCu = Acid Soluble Copper. El Soldado and Los Bronces are part of Anglo American Sur.Mantos Blancos and Mantoverde are part of Anglo American Norte.

ORE RESERVES AND MINERAL RESOURCES
Anglo American plc Annual Report 2014 183
Ore R
eserves and Mineral R
esources
COPPER estimates as at 31 December 2014
EXPLANATORY NOTESCopper Reserves: A minimum cut-off of 0.20% (TCu, ICu or ASCu) is applied to determine Ore Reserves on operations. Collahuasi – Oxide and Mixed: The increase is due to new economic assumptions in the mine plan for the Rosario Sur I and II areas. El Soldado – Sulphide (Flotation): The Ore Reserve estimates include mineralised void-fill material from the collapse of previously mined areas of approximately 178kt Contained Metal (20.6Mt at 0.86 %TCu)El Soldado – Oxide (Heap Leach): Production has exhausted the remaining Heap Leach material. Los Bronces – Sulphide (Dump Leach): The decrease is due to production and adjustment as a result of a modified cut-off grade strategy applied in the latest life of mine plan.Mantos Blancos – Oxide (Vat and Heap Leach): The decrease is due to production, a modified design of Phase 17 and exclusion of phase 21 from the latest life of mine plan. The decrease is partially offset by drilling of the Mercedes Dump and application of new estimation parameters.Mantos Blancos – Oxide (Dump Leach): The increase is due to a sonic drill campaign on the Mercedes Dump. The Dump Leach Reserves are comprised primarily of two major components, Mercedes Dump and Este Dump, split as follows:Este Dump – Probable: 7kt Contained Metal (3.6 Mt at 0.20 %ASCu).Mercedes Dump – Proved: 1kt Contained Metal (0.6 Mt at 0.17 %ASCu), Probable: 58kt Contained Metal (29.0 Mt at 0.20 %ASCu).Mantoverde – Oxide (Dump Leach): The increase is due to the application of new mine designs for Celso, Kuroki and Montecristo pits along with lower cut-off grades.
Mineral Tenure:Los Bronces: As per the latest Life of Mine Plan, the development of the Los Bronces Open Pit will require a modification to the Environmental Permits (EIA Process) as of 2030. This in accordance with the current limits approved in the EIA-LBDP 2007 (RCA N° 3159).
Audits related to the generation of the Ore Reserve and Mineral Resource estimates were carried out by independent consultants during 2014 at the following operations: El Soldado, Los Bronces, Mantos Blancos and Mantoverde.
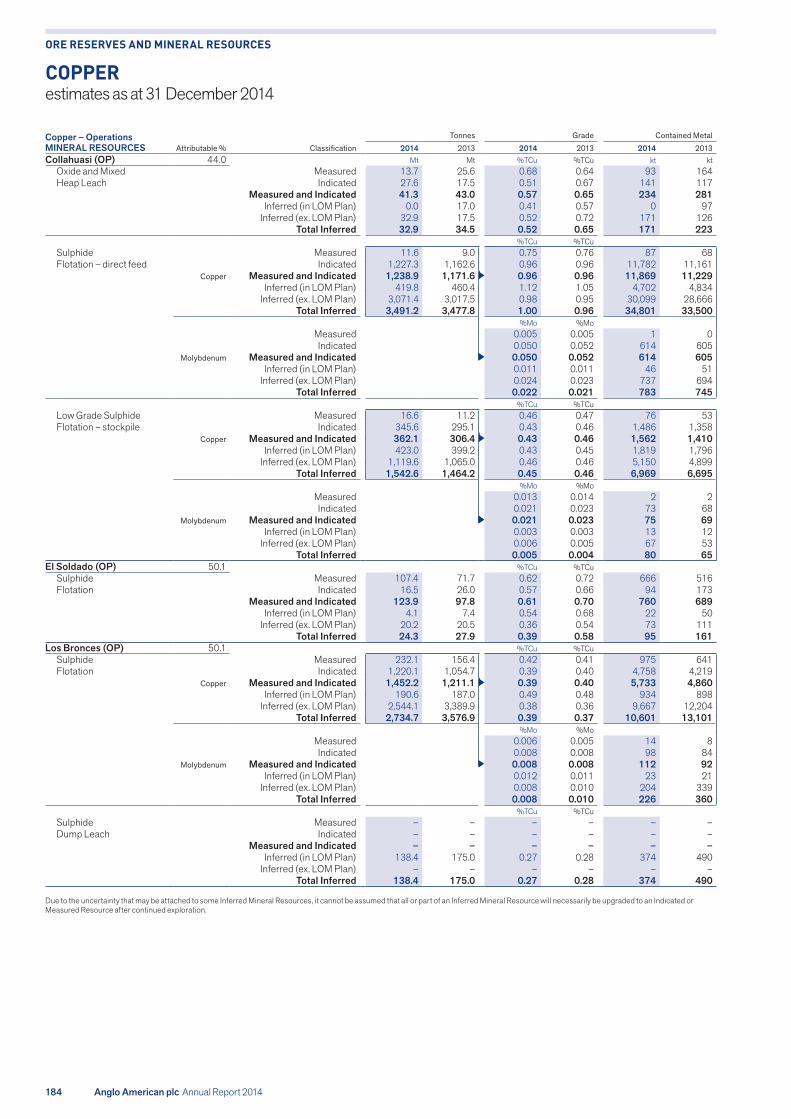
ORE RESERVES AND MINERAL RESOURCES
184 Anglo American plc Annual Report 2014
COPPER estimates as at 31 December 2014
Copper – Operations MINERAL RESOURCES
Tonnes Grade Contained MetalAttributable % Classification 2014 2013 2014 2013 2014 2013
Collahuasi (OP) 44.0 Mt Mt %TCu %TCu kt ktOxide and Mixed Measured 13.7 25.6 0.68 0.64 93 164Heap Leach Indicated 27.6 17.5 0.51 0.67 141 117
Measured and Indicated 41.3 43.0 0.57 0.65 234 281Inferred (in LOM Plan) 0.0 17.0 0.41 0.57 0 97
Inferred (ex. LOM Plan) 32.9 17.5 0.52 0.72 171 126Total Inferred 32.9 34.5 0.52 0.65 171 223
%TCu %TCuSulphide Measured 11.6 9.0 0.75 0.76 87 68Flotation – direct feed Indicated 1,227.3 1,162.6 0.96 0.96 11,782 11,161
Copper Measured and Indicated 1,238.9 1,171.6 0.96 0.96 11,869 11,229Inferred (in LOM Plan) 419.8 460.4 1.12 1.05 4,702 4,834
Inferred (ex. LOM Plan) 3,071.4 3,017.5 0.98 0.95 30,099 28,666Total Inferred 3,491.2 3,477.8 1.00 0.96 34,801 33,500
%Mo %MoMeasured 0.005 0.005 1 0
Indicated 0.050 0.052 614 605Molybdenum Measured and Indicated 0.050 0.052 614 605
Inferred (in LOM Plan) 0.011 0.011 46 51Inferred (ex. LOM Plan) 0.024 0.023 737 694
Total Inferred 0.022 0.021 783 745%TCu %TCu
Low Grade Sulphide Measured 16.6 11.2 0.46 0.47 76 53Flotation – stockpile Indicated 345.6 295.1 0.43 0.46 1,486 1,358
Copper Measured and Indicated 362.1 306.4 0.43 0.46 1,562 1,410Inferred (in LOM Plan) 423.0 399.2 0.43 0.45 1,819 1,796
Inferred (ex. LOM Plan) 1,119.6 1,065.0 0.46 0.46 5,150 4,899Total Inferred 1,542.6 1,464.2 0.45 0.46 6,969 6,695
%Mo %MoMeasured 0.013 0.014 2 2
Indicated 0.021 0.023 73 68Molybdenum Measured and Indicated 0.021 0.023 75 69
Inferred (in LOM Plan) 0.003 0.003 13 12Inferred (ex. LOM Plan) 0.006 0.005 67 53
Total Inferred 0.005 0.004 80 65El Soldado (OP) 50.1 %TCu %TCu
Sulphide Measured 107.4 71.7 0.62 0.72 666 516Flotation Indicated 16.5 26.0 0.57 0.66 94 173
Measured and Indicated 123.9 97.8 0.61 0.70 760 689Inferred (in LOM Plan) 4.1 7.4 0.54 0.68 22 50
Inferred (ex. LOM Plan) 20.2 20.5 0.36 0.54 73 111Total Inferred 24.3 27.9 0.39 0.58 95 161
Los Bronces (OP) 50.1 %TCu %TCuSulphide Measured 232.1 156.4 0.42 0.41 975 641Flotation Indicated 1,220.1 1,054.7 0.39 0.40 4,758 4,219
Copper Measured and Indicated 1,452.2 1,211.1 0.39 0.40 5,733 4,860Inferred (in LOM Plan) 190.6 187.0 0.49 0.48 934 898
Inferred (ex. LOM Plan) 2,544.1 3,389.9 0.38 0.36 9,667 12,204Total Inferred 2,734.7 3,576.9 0.39 0.37 10,601 13,101
%Mo %MoMeasured 0.006 0.005 14 8
Indicated 0.008 0.008 98 84Molybdenum Measured and Indicated 0.008 0.008 112 92
Inferred (in LOM Plan) 0.012 0.011 23 21Inferred (ex. LOM Plan) 0.008 0.010 204 339
Total Inferred 0.008 0.010 226 360%TCu %TCu
Sulphide Measured – – – – – –Dump Leach Indicated – – – – – –
Measured and Indicated – – – – – –Inferred (in LOM Plan) 138.4 175.0 0.27 0.28 374 490
Inferred (ex. LOM Plan) – – – – – –Total Inferred 138.4 175.0 0.27 0.28 374 490
Due to the uncertainty that may be attached to some Inferred Mineral Resources, it cannot be assumed that all or part of an Inferred Mineral Resource will necessarily be upgraded to an Indicated or Measured Resource after continued exploration.

ORE RESERVES AND MINERAL RESOURCES
Anglo American plc Annual Report 2014 185
Ore R
eserves and Mineral R
esources
COPPER estimates as at 31 December 2014
Copper – Operations continued Tonnes Grade Contained Metal
MINERAL RESOURCES (1) Attributable % Classification 2014 2013 2014 2013 2014 2013Mantos Blancos (OP) 100 Mt Mt %ICu %ICu kt kt
Sulphide Measured 28.8 28.0 0.76 0.75 219 210Flotation Indicated 61.9 58.8 0.59 0.61 365 359
Measured and Indicated 90.8 86.8 0.64 0.66 585 569Inferred (in LOM Plan) – 4.3 – 0.52 – 22
Inferred (ex. LOM Plan) 22.0 29.2 0.56 0.54 123 158Total Inferred 22.0 33.5 0.56 0.54 123 180
%ASCu %ASCuOxide Measured 4.5 4.6 0.48 0.46 21 21Vat and Heap Leach Indicated 13.9 13.6 0.41 0.40 57 55
Measured and Indicated 18.4 18.2 0.43 0.42 79 76Inferred (in LOM Plan) 9.1 18.2 0.19 0.25 17 45
Inferred (ex. LOM Plan) 7.1 12.5 0.42 0.40 30 50Total Inferred 16.3 30.7 0.29 0.31 47 95
%ASCu %ASCuOxide Measured 1.0 1.3 0.18 0.18 2 2Dump Leach Indicated 10.0 10.9 0.17 0.17 17 19
Measured and Indicated 11.0 12.2 0.17 0.17 19 21Inferred (in LOM Plan) 65.3 123.1 0.18 0.21 121 259
Inferred (ex. LOM Plan) 5.4 16.2 0.17 0.16 9 26Total Inferred 70.7 139.3 0.18 0.20 130 284
Mantoverde (OP) 100 %ASCu %ASCuOxide Measured 33.8 27.0 0.35 0.39 118 105Heap Leach Indicated 33.6 13.5 0.36 0.40 121 54
Measured and Indicated 67.4 40.5 0.35 0.39 239 159Inferred (in LOM Plan) 0.3 0.8 0.42 0.53 1 4
Inferred (ex. LOM Plan) 2.3 1.8 0.28 0.33 7 6Total Inferred 2.6 2.6 0.29 0.39 8 10
%ASCu %ASCuOxide Measured 13.9 – 0.16 – 22 –Dump Leach Indicated 11.5 – 0.15 – 17 –
Measured and Indicated 25.3 – 0.16 – 39 –Inferred (in LOM Plan) 1.2 0.9 0.17 0.22 2 2
Inferred (ex. LOM Plan) 1.0 – 0.15 – 2 –Total Inferred 2.3 0.9 0.16 0.22 4 2
MINERAL RESOURCES ARE REPORTED AS ADDITIONAL TO ORE RESERVES. Mining method: OP = Open Pit TCu = Total Copper, ICu = Insoluble Copper (total copper less acid soluble copper), ASCu = Acid Soluble Copper. Due to the uncertainty that may be attached to some Inferred Mineral Resources, it cannot be assumed that all or part of an Inferred Mineral Resource will necessarily be upgraded to an Indicated or Measured Resource after continued exploration. El Soldado and Los Bronces are part of Anglo American Sur.Mantos Blancos and Mantoverde are part of Anglo American Norte.
EXPLANATORY NOTESCopper Resources: A test of reasonable eventual economic extraction is applied through consideration of an optimised pit shell. Materials outside the optimised shell that have potential of eventual economic extraction via underground means are not included in the Mineral Resource statement. Mineral Resources are quoted above variable cut-off grades not lower than 0.2 %TCu.Los Bronces – Sulphide (Flotation) and Sulphide (Dump Leach): The overall decrease is due to updated economic assumptions leading to conversion of resources to reserves and new drilling information. Mantos Blancos – Oxide (Dump Leach): The decrease is due to due to removal of material for which metallurgical test work is outstanding. The Dump Leach Resources are comprised primarily of two major components, Mercedes Dump and Este Dump, split as follows:Este Dump – Inferred: 54kt Contained Metal (30.2 Mt at 0.18 %ASCu).Mercedes Dump – Measured: 2kt Contained Metal (1.0 Mt at 0.18 %ASCu), Indicated: 17kt Contained Metal (10.0 Mt at 0.17 %ASCu), Inferred : 72kt Contained Metal (38.6 Mt at 0.19 %ASCu).Mantoverde – Oxide (Heap Leach): The increase is due to new drilling information at Rebosadero, Quisco and Montecristo areas and the transfer of oxide material from the Mantoverde Development Project to the Mantoverde operation as a result of a change in the pit design.Mantoverde – Oxide (Dump Leach): The increase is due to changes in economic assumptions (lower cut-off grade applied).

ORE RESERVES AND MINERAL RESOURCES
186 Anglo American plc Annual Report 2014
COPPER estimates as at 31 December 2014
Copper – Projects ORE RESERVES
Reserve Tonnes Grade Contained MetalAttributable % Life Classification 2014 2013 2014 2013 2014 2013
Quellaveco (OP) 81.9 29 Mt Mt %TCu %TCu kt ktSulphide Proved 951.4 701.8 0.58 0.65 5,518 4,562Flotation Copper Probable 380.6 214.6 0.57 0.63 2,169 1,352
Total 1,332.0 916.4 0.58 0.65 7,687 5,914%Mo %Mo
Proved 0.018 0.019 171 133Molybdenum Probable 0.020 0.021 76 45
Total 0.019 0.019 247 178
Copper – ProjectsMINERAL RESOURCES
Tonnes Grade Contained MetalAttributable % Classification 2014 2013 2014 2013 2014 2013
Mantoverde Development Project 100 Mt Mt %TCu %TCu kt ktSulphide Measured 120.1 118.2 0.71 0.71 852 839Flotation Indicated 48.4 54.6 0.64 0.64 310 349
Measured and Indicated 168.5 172.8 0.69 0.69 1,162 1,189Inferred 144.6 147.9 0.62 0.61 897 902
%ASCu %ASCuOxide Measured 106.3 48.0 0.28 0.40 298 192Heap and Dump Leach Indicated 18.4 5.7 0.23 0.34 42 19
Measured and Indicated 124.7 53.7 0.27 0.39 340 211Inferred 18.9 3.4 0.19 0.32 36 11
Quellaveco (OP) 81.9 %TCu %TCuSulphide Measured 135.0 285.1 0.32 0.35 432 998Flotation Indicated 653.1 807.5 0.39 0.41 2,547 3,311
Copper Measured and Indicated 788.1 1,092.7 0.38 0.39 2,979 4,309Inferred (in LOM Plan) 12.6 6.9 0.67 0.79 84 54
Inferred (ex. LOM Plan) 771.5 858.0 0.32 0.33 2,469 2,831Total Inferred 784.0 864.9 0.33 0.33 2,553 2,886
%Mo %MoMeasured 0.008 0.010 11 29
Indicated 0.014 0.015 91 121Molybdenum Measured and Indicated 0.013 0.014 102 150
Inferred (in LOM Plan) 0.010 0.010 1 1Inferred (ex. LOM Plan) 0.010 0.011 77 93
Total Inferred 0.010 0.011 78 93West Wall 50.0 %TCu %TCu
Sulphide Measured – – – – – –Indicated 495.0 495.0 0.55 0.55 2,723 2,723
Measured and Indicated 495.0 495.0 0.55 0.55 2,723 2,723Inferred 970.0 970.0 0.48 0.48 4,656 4,656
Los Bronces Sur 50.1 %TCu %TCuSulphide Inferred 900.0 900.0 0.81 0.81 7,290 7,290
Los Bronces Underground 50.1 %TCu %TCuSulphide Inferred 1,200.0 1,200.0 1.46 1.46 17,520 17,520
MINERAL RESOURCES ARE REPORTED AS ADDITIONAL TO ORE RESERVES. Mining method: OP = Open Pit. Reserve Life = The scheduled extraction period in years for the total Ore Reserves in the approved Life of Mine Plan. TCu = Total Copper, ASCu = Acid Soluble Copper.
Due to the uncertainty that may be attached to some Inferred Mineral Resources, it cannot be assumed that all or part of an Inferred Mineral Resource will necessarily be upgraded to an Indicated or Measured Resource after continued exploration. Los Bronces Sur (previously known as San Enrique Monolito) and Los Bronces Underground (previously known as Los Sulfatos) are part of Anglo American Sur. Mantoverde Development Project is part of Anglo American Norte. West Wall is a Joint Venture with Glencore.
EXPLANATORY NOTESQuellaveco – Ore Reserves: A minimum cut-off of 0.30 %TCu is applied to determine Ore Reserves. The increase is due to a new mine plan which incorporates increase plant throughput and a new cut-off grade.Quellaveco – Mineral Resources: Mineral Resources are quoted above a 0.3 %TCu cut-off within an optimised pit shell. The decrease is due to a conversion of resources to reserves in a new mine plan.Mantoverde Development Project – Sulphide (Flotation): Mineral Resources are quoted above a 0.35 %TCu cut-off. Mantoverde Development Project – Oxide (Flotation): Mineral Resources are quoted above a 0.1 %ASCu (Dump Leach) or 0.2 %ASCu (Heap Leach) and less than 20 %CaCO3 cut-off. The increase is due to declaration of resources in new areas mainly in the Mantoverde Fault area with additional resources in the Mantoruso, Quisco and Celso areas. West Wall: Mineral Resources are quoted above a 0.3 %TCu cut-off within an optimised pit shell.
Los Bronces Sur (San Enrique Monolito): To align with the location of the deposit within the Los Bronces mining district, San Enrique Monolito will be referred to as Los Bronces Sur going forward. The test for reasonable prospects of eventual economic extraction is based on an underground operation.Los Bronces Underground (Los Sulfatos): To align with the location of the deposit within the Los Bronces mining district, Los Sulfatos will be referred to as Los Bronces Underground going forward. The reported resources include mineralisation inside a 1% nominal copper grade cut-off envelope down to the current drillhole depths of 1,000 metres below surface. The test for reasonable prospects of eventual economic extraction is based on an underground operation. Audits related to the generation of the Mineral Resource estimates were carried out by independent consultants during 2014 at the Mantoverde Development Project.

ORE RESERVES AND MINERAL RESOURCES
Anglo American plc Annual Report 2014 187
Ore R
eserves and Mineral R
esources
NICKEL estimates as at 31 December 2014
NICKELThe Ore Reserve and Mineral Resource estimates were compiled in accordance with the Australasian Code for Reporting of Exploration Results, Mineral Resources and Ore Reserves (The JORC Code, 2004) as a minimum standard. The figures reported represent 100% of the Ore Reserves and Mineral Resources. Rounding of figures may cause computational discrepancies for totals. Reserve Life is reported from 2014 onwards and is aligned with the current approved Life of Mine Plan.
Nickel – OperationsORE RESERVES
Reserve Tonnes Grade Contained MetalAttributable % Life Classification 2014 2013 2014 2013 2014 2013
Barro Alto (OP) 100 22 Mt Mt %Ni %Ni kt ktSaprolite Proved 15.3 20.0 1.67 1.71 255 342
Probable 24.1 25.2 1.42 1.42 342 358Total 39.3 45.3 1.52 1.55 597 700
Niquelândia (OP) 100 22 %Ni %NiSaprolite Proved 5.2 4.5 1.29 1.31 67 59
Probable 1.7 1.1 1.18 1.25 20 14Total 6.9 5.6 1.26 1.30 87 73
Nickel – OperationsMINERAL RESOURCES
Tonnes Grade Contained MetalAttributable % Classification 2014 2013 2014 2013 2014 2013
Barro Alto (OP) 100 Mt Mt %Ni %Ni kt ktSaprolite Measured 6.5 8.5 1.46 1.34 96 114
Indicated 9.3 7.7 1.38 1.31 128 101Measured and Indicated 15.9 16.3 1.41 1.32 224 215
Inferred (in LOM Plan) 26.9 32.5 1.43 1.51 385 491Inferred (ex. LOM Plan) 16.9 14.7 1.27 1.22 214 179
Total Inferred 43.8 47.2 1.37 1.42 600 670Ferruginous Laterite Measured 1.6 2.4 1.20 1.25 20 30
Indicated 7.3 5.6 1.09 1.17 79 65Measured and Indicated 8.9 7.9 1.11 1.19 99 95
Inferred (in LOM Plan) 1.4 1.2 1.07 1.08 15 13Inferred (ex. LOM Plan) 0.1 0.0 1.07 1.06 2 0
Total Inferred 1.5 1.2 1.07 1.08 16 13Niquelândia (OP) 100 %Ni %Ni
Saprolite Measured 1.9 2.5 1.23 1.21 23 31Indicated 1.8 2.4 1.25 1.20 23 28
Measured and Indicated 3.7 4.9 1.24 1.21 46 59Inferred (in LOM Plan) – – – – – –
Inferred (ex. LOM Plan) – – – – – –Total Inferred – – – – – –
MINERAL RESOURCES ARE REPORTED AS ADDITIONAL TO ORE RESERVES.
Nickel – Projects MINERAL RESOURCES
Tonnes Grade Contained MetalAttributable % Classification 2014 2013 2014 2013 2014 2013
Jacaré 100 Mt Mt %Ni %Ni kt ktFerruginous Laterite Measured 6.3 6.3 1.15 1.15 72 72
Indicated 53.8 53.8 1.21 1.21 653 653Measured and Indicated 60.1 60.1 1.21 1.21 726 726
Inferred 125.0 125.0 1.17 1.17 1,468 1,468Saprolite Measured – – – – – –
Indicated 39.6 39.6 1.49 1.49 589 589Measured and Indicated 39.6 39.6 1.49 1.49 589 589
Inferred 81.9 81.9 1.39 1.39 1,138 1,138
Mining method: OP = Open Pit. Reserve Life = The scheduled extraction period in years for the total Ore Reserves in the approved Life of Mine Plan.
Due to the uncertainty that may be attached to some Inferred Mineral Resources, it cannot be assumed that all or part of an Inferred Mineral Resource will necessarily be upgraded to an Indicated or Measured Resource after continued exploration.
EXPLANATORY NOTESBarro Alto – Ore Reserves: The decrease is due to increased haulage costs resulting in reallocation of Ore Reserves to Mineral Resources. This is partially offset by a change in the modelling method of dilution. The Ore Reserves are derived from a mine plan which targets a smelter feed with an iron grade below 19 %Fe and a SiO2/MgO ratio less than or equal to 1.80. Niquelândia – Ore Reserves: The increase is primarily due to changes in economic assumptions which enables conversion of resources to reserves. The Ore Reserves are derived from a mine plan which targets a smelter feed with an iron grade below 19 %Fe and a SiO2/MgO ratio less than or equal to 1.75. Niquelândia Mine is adjacent to the Codemin Ferro-Nickel smelter which is fed with ore from Barro Alto and is blended with Niquelândia ore to achieve an appropriate smelter feed chemistry.Barro Alto – Saprolite Mineral Resources: The decrease is due to new information enabling improved resource classification of material close to the basal contact of the orebody which offsets the reallocation from Ore Reserves. Transfer of material to a Low-MgO Stockpile also contributes to the decrease. The Low-MgO material (Measured: 7.2 Mt at 1.59 %Ni, excluded from the table) is used for blending when the appropriate smelter feed chemistry can be achieved. Mineral Resources are quoted above a 0.9 %Ni cut-off. Barro Alto – Ferruginous Laterite Mineral Resources: Material that is scheduled for stockpiling or has already been mined and stockpiled. A surface stockpile of 0.8 Mt at 1.36 %Ni (Measured) is excluded from the table.Niquelândia – Mineral Resources: The decrease is due to conversion of Mineral Resources to Ore Reserves. Mineral Resources are quoted above a 0.9 %Ni cut-off. Jacaré: The Mineral Resources are reported within a pit shell developed for the Concept Study with a cut-off of 1.3 %Ni. A minimum mineralised width of 1m must be present to allow material to be categorised as higher-grade Saprolite Mineral Resource. The Saprolite Resources are a combination of higher-grade Mineral Resources (>1.3 %Ni) that are expected to feed a pyrometallurgical treatment facility and lower-grade Mineral Resources (1.3 – 0.9 %Ni) that could be used to neutralise the acid in the proposed hydrometallurgical treatment of the Ferruginous Laterite material while still recovering Nickel in the process. The Plano de Aproveitamento Economico (PAE) is under consideration by Brazil’s Departamento Nacional de Produção Mineral (DNPM).

ORE RESERVES AND MINERAL RESOURCES
188 Anglo American plc Annual Report 2014
ANGLO AMERICAN NIÓBIO BRASIL LIMITADAThe Ore Reserve and Mineral Resource estimates were compiled in accordance with the Australasian Code for Reporting of Exploration Results, Mineral Resources and Ore Reserves (The JORC Code, 2012) as a minimum standard. The figures reported represent 100% of the Ore Reserves and Mineral Resources. Rounding of figures may cause computational discrepancies. Reserve Life is reported from 2014 onwards and is aligned with the current approved Life of Mine Plan.
Niobium – Operations Reserve Tonnes Grade Contained Product
ORE RESERVES Attributable % Life Classification 2014 2013 2014 2013 2014 2013Boa Vista (OP) 100 1 Mt Mt %Nb2O5 %Nb2O5 kt kt
Catalão II Carbonatite Complex Proved 0.8 0.8 1.23 1.21 10 10Oxide Probable 0.3 0.4 1.26 1.03 4 5
Total 1.1 1.3 1.24 1.15 14 14Mina II (OP) 100 1 %Nb2O5 %Nb2O5
Catalão I Carbonatite Complex Proved 0.3 0.4 1.17 1.16 4 4Oxide Probable – – – – – –
Total 0.3 0.4 1.17 1.16 4 4Tailings 100 21 %Nb2O5 %Nb2O5
Catalão I Carbonatite Complex Proved – – – – – –Phosphate Tailings Probable 19.4 14.5 0.69 0.69 134 100
Total 19.4 14.5 0.69 0.69 134 100
Niobium – Operations Tonnes Grade Contained Product
MINERAL RESOURCES Attributable % Classification 2014 2013 2014 2013 2014 2013Boa Vista (OP) 100 Mt Mt %Nb2O5 %Nb2O5 kt kt
Catalão II Carbonatite Complex Measured – 0.2 – 1.56 – 3Oxide Indicated 0.0 0.4 0.55 1.18 0 5
Measured and Indicated 0.0 0.6 0.55 1.30 0 8Inferred (in LOM Plan) 0.6 0.2 0.79 0.91 5 2
Inferred (ex. LOM Plan) 0.0 0.5 0.61 0.79 0 4Total Inferred 0.7 0.7 0.79 0.83 5 6
MINERAL RESOURCES ARE REPORTED AS ADDITIONAL TO ORE RESERVES.
Niobium – Projects Reserve Tonnes Grade Contained Product
ORE RESERVES Attributable % Life Classification 2014 2013 2014 2013 2014 2013Boa Vista (OP) 100 21 Mt Mt %Nb2O5 %Nb2O5 kt kt
Catalão II Carbonatite Complex Proved 0.9 0.2 1.14 1.24 10 3Fresh Rock Probable 27.2 23.8 0.87 0.95 236 226
Total 28.0 24.0 0.88 0.95 246 229
Niobium – Projects Tonnes Grade Contained Product
MINERAL RESOURCES Attributable % Classification 2014 2013 2014 2013 2014 2013Area Leste 100 Mt Mt %Nb2O5 %Nb2O5 kt kt
Catalão I Carbonatite Complex Measured – – – – – –Oxide Indicated – – – – – –
Measured and Indicated – – – – – –Inferred 2.9 2.9 1.25 1.25 37 37
Catalão I Carbonatite Complex Measured – – – – – –Fresh Rock Indicated – – – – – –
Measured and Indicated – – – – – –Inferred 11.8 11.8 1.17 1.17 138 138
Boa Vista (OP) 100 %Nb2O5 %Nb2O5
Catalão II Carbonatite Complex Measured – – – – – –Fresh Rock Indicated 0.6 4.8 0.92 0.98 5 47
Measured and Indicated 0.6 4.8 0.92 0.98 5 47Inferred (in LOM Plan) 6.0 1.3 0.95 0.86 57 11
Inferred (ex. LOM Plan) 4.5 9.2 1.24 1.11 56 102Total Inferred 10.5 10.5 1.08 1.08 113 113
Mina I 100 %Nb2O5 %Nb2O5
Catalão I Carbonatite Complex Measured – – – – – –Oxide Indicated – – – – – –
Measured and Indicated – – – – – –Inferred 1.7 1.7 0.79 0.79 13 13
Mina II 100 %Nb2O5 %Nb2O5
Catalão I Carbonatite Complex Measured 0.1 – 1.22 – 1 –Fresh Rock Indicated 2.4 – 1.19 – 29 –
Measured and Indicated 2.5 – 1.19 – 30 –Inferred 1.5 5.1 1.04 1.17 16 60
Morro do Padre 100 %Nb2O5 %Nb2O5
Catalão II Carbonatite Complex Measured – – – – – –Fresh Rock Indicated – – – – – –
Measured and Indicated – – – – – –Inferred 8.3 8.3 1.26 1.26 104 104
MINERAL RESOURCES ARE REPORTED AS ADDITIONAL TO ORE RESERVES.
Mining method: OP = Open Pit, UG = Underground. Reserve Life = The scheduled extraction period in years for the total Ore Reserves in the approved Life of Mine Plan.
Due to the uncertainty that may be attached to some Inferred Mineral Resources, it cannot be assumed that all or part of an Inferred Mineral Resource will necessarily be upgraded to an Indicated or Measured Resource after continued exploration.
NIOBIUM estimates as at 31 December 2014

ORE RESERVES AND MINERAL RESOURCES
Anglo American plc Annual Report 2014 189
Ore R
eserves and Mineral R
esources
NIOBIUM estimates as at 31 December 2014
EXPLANATORY NOTESBoa Vista – Oxide Ore Reserves (OP): The remaining Oxide Ore Reserves will be extracted as part of the combined Oxide and Fresh Rock mine plan.Phosphate Tailings Ore Reserves: The fines portion of the Phosphate tailings from Chapadão are processed in the Niobium Tailings Plant to recover Niobium. The increase is a result of optimisation of the Boa Vista Fresh Rock pit design enabling the tailings plant to continue operating once the Oxide Reserves are depleted.Boa Vista – Oxide Mineral Resources (OP): The decrease is due to conversion of Mineral Resource to Ore Reserves as a result of the increased size of the Fresh Rock pit. The Oxide Mineral Resources are reported above a 0.5 %Nb2O5 cut-off. Boa Vista – Fresh Rock Ore Reserves (OP): The increase is due to the optimisation of the pit design. The project is in the ramp-up phase.Area Leste – Oxide Mineral Resources: The Oxide Resources are reported above a 0.5 %Nb2O5 cut-off. Area Leste – Fresh Rock Mineral Resources: The Fresh Rock Resources are reported above a 0.7 %Nb2O5 cut-off. Boa Vista – Fresh Rock Mineral Resources (OP): The Fresh Rock Resources are reported above a 0.5 %Nb2O5 cut-off. The decrease is the result of conversion of Mineral Resources to Ore Reserves as a result of the optimisation of the pit design. Additional Mineral Resource estimates using an underground mining method as the basis for reasonable prospects for eventual economic extraction are:Inferred Resources: 106kt Contained Product (10.7 Mt at 0.99 %Nb2O5).Mina I – Oxide Mineral Resources: The Oxide Resources are reported above a 0.5 %Nb2O5 cut-off. Mina II – Fresh Rock Mineral Resources: The Fresh Rock Resources are reported above a 0.5 %Nb2O5 cut-off. The application of an open pit mining method is the basis for reasonable prospect for eventual economic extraction of this material. The decrease is due to a change in the planned pit slope angle which reduces the volume of the Resource Shell. A new block model has been completed but the underground design study demonstrating the viability of the extension to the orebody has not been completed yet. No Mineral Resource estimates are therefore declared using an underground mining method as the basis for reasonable prospects for eventual economic extraction.Morro do Padre – Fresh Rock Mineral Resources: The Fresh Rock Resources are reported above a 0.7 %Nb2O5 cut-off. Application of underground mining method is the basis for defining reasonable prospects for eventual economic extraction of this material. Following the reclassification of historical estimates to the Inferred category in order to ensure compliance with Anglo American standards, a systematic programme of re-analysis of historical samples and additional drilling is ongoing to upgrade the confidence in the project resources.

ORE RESERVES AND MINERAL RESOURCES
190 Anglo American plc Annual Report 2014
ANGLO AMERICAN FOSFATOS BRASIL LIMITADA The Ore Reserve and Mineral Resource estimates were compiled in accordance with the Australasian Code for Reporting of Exploration Results, Mineral Resources and Ore Reserves (The JORC Code, 2012) as a minimum standard. The figures reported represent 100% of the Ore Reserves and Mineral Resources. Rounding of figures may cause computational discrepancies. Reserve Life is reported from 2014 onwards and is aligned with the current approved Life of Mine Plan.
Phosphates – OperationsORE RESERVES Attributable %
Reserve Tonnes GradeLife Classification 2014 2013 2014 2013
Chapadão (OP) 100 34 Mt Mt %P2O5 %P2O5
Carbonatite Complex Proved 36.8 41.0 12.4 12.5Oxide Probable 75.1 77.0 13.0 13.0
Total 112.0 118.1 12.8 12.8
Phosphates – OperationsMINERAL RESOURCES Attributable %
Tonnes GradeClassification 2014 2013 2014 2013
Chapadão (OP) 100 Mt Mt %P2O5 %P2O5
Carbonatite Complex Measured – – – –Oxide Indicated 0.1 0.1 13.2 13.2
Measured and Indicated 0.1 0.1 13.2 13.2Inferred (in LOM Plan) 19.4 19.5 13.5 13.6
Inferred (ex. LOM Plan) 165.7 165.7 12.1 12.1Total Inferred 185.1 185.2 12.3 12.3
Phosphates – ProjectsMINERAL RESOURCES Attributable %
Tonnes GradeClassification 2014 2013 2014 2013
Coqueiros (OP) 100 Mt Mt %P2O5 %P2O5
Carbonatite Complex Measured 1.8 1.8 10.5 10.5Oxide Indicated 16.5 16.5 12.9 12.9
Measured and Indicated 18.3 18.3 12.6 12.6Inferred 26.2 26.2 11.2 11.2
Carbonatite Complex Measured 1.2 1.2 7.3 7.3Fresh Rock Indicated 34.0 34.0 8.5 8.5
Measured and Indicated 35.2 35.2 8.5 8.5Inferred 16.2 16.2 7.6 7.6
MINERAL RESOURCES ARE REPORTED AS ADDITIONAL TO ORE RESERVES. Mining method: OP = Open Pit. Reserve Life = The scheduled extraction period in years for the total Ore Reserves in the approved Life of Mine Plan.
Due to the uncertainty that may be attached to some Inferred Mineral Resources, it cannot be assumed that all or part of an Inferred Mineral Resource will necessarily be upgraded to an Indicated or Measured Resource after continued exploration.
Chapadão Mine is the formal name of the Anglo American Fosfatos Brasil Limitada Phosphate mining operation near Ouvidor.
EXPLANATORY NOTESChapadão – Oxide Ore Reserves: The decrease is due to production.Chapadão – Oxide Mineral Resources: Mineral Resources are quoted above a 6 %P2O5 cut-off and a CaO/P2O5 ratio between 1 and 1.5. Coqueiros: The Oxide mineralisation is defined by a cut-off grade of 7 %P2O5 and a CaO/ P2O5 ratio between 1 and 1.4. The Fresh Rock resources are defined by a cut-off grade of 5 %P2O5. The exploration drilling report submitted to Brazil’s Departamento Nacional de Produção Mineral (DNPM) has been approved with additional hydrogeological and geotechnical studies in progress.
Audits related to the generation of the Mineral Resource estimates were carried out by independent consultants during 2014 at Chapadão.
PHOSPHATES estimates as at 31 December 2014

ORE RESERVES AND MINERAL RESOURCES
Anglo American plc Annual Report 2014 191
Ore R
eserves and Mineral R
esources
PLATINUM GROUP METALS estimates as at 31 December 2014
ANGLO AMERICAN PLATINUM LIMITEDThe Ore Reserve and Mineral Resource estimates were compiled in compliance with The South African Code for the Reporting of Exploration Results, Mineral Resources and Mineral Reserves (The SAMREC Code, 2007 Edition as amended July 2009). Operations and Projects outside South Africa were compiled in accordance with the Australasian Code for Reporting of Exploration Results, Mineral Resources and Ore Reserves (The JORC Code, 2012) as a minimum standard. Details of the individual operations appear in Anglo American Platinum’s Annual Report. Merensky Reef and UG2 Reef Mineral Resources are reported over an economic and mineable cut appropriate to the specific reef. The figures reported represent 100% of the Mineral Resources and Ore Reserves attributable to Anglo American Platinum Limited unless otherwise noted. Rounding of figures may cause computational discrepancies. Reserve Life is reported from 2014 onwards and is aligned with the current approved Life of Mine Plan.
Anglo American plc’s ownership of Anglo American Platinum Limited is 78%.
Platinum – South Africa Operations Tonnes Grade Contained Metal Contained Metal
ORE RESERVES Classification 2014 2013 2014 2013 2014 2013 2014 2013Merensky Reef Mt Mt 4E PGE 4E PGE 4E tonnes 4E tonnes 4E Moz 4E Moz
Proved 58.2 55.0 4.69 4.79 273.0 263.3 8.8 8.5Probable 18.5 17.3 4.74 4.52 88.0 78.2 2.8 2.5
Total 76.7 72.3 4.70 4.72 361.0 341.5 11.6 11.0UG2 Reef Proved 328.4 316.2 3.96 4.13 1,301.0 1,306.8 41.8 42.0
Probable 83.3 91.0 4.13 4.20 344.0 381.7 11.0 12.3Total 411.7 407.2 4.00 4.15 1,645.0 1,688.5 52.9 54.3
Platreef Proved 688.8 705.8 2.72 2.73 1,870.0 1,925.2 60.1 61.9Primary stockpile Proved 38.1 28.7 1.71 1.59 65.0 45.7 2.1 1.5
Probable 847.6 901.4 2.68 2.70 2,268.0 2,433.7 72.9 78.2Total 1,574.5 1,635.9 2.67 2.69 4,203.0 4,404.6 135.2 141.6
All Reefs Proved 1,113.5 1,105.7 3.15 3.20 3,509.0 3,541.0 112.8 113.8Merensky, UG2 & Platreef Probable 949.4 1,009.6 2.84 2.87 2,700.0 2,893.6 86.8 93.0
Total 2,062.9 2,115.3 3.01 3.04 6,209.0 6,434.6 199.6 206.9Tailings Proved – – – – – – – –
Probable 20.9 23.7 1.06 1.08 22.0 25.5 0.7 0.8Total 20.9 23.7 1.06 1.08 22.0 25.5 0.7 0.8
Platinum – Zimbabwe Operations Tonnes Grade Contained Metal Contained Metal
ORE RESERVES Classification 2014 2013 2014 2013 2014 2013 2014 2013Main Sulphide Zone Mt Mt 4E PGE 4E PGE 4E tonnes 4E tonnes 4E Moz 4E Moz
Proved 11.7 14.1 3.56 3.72 42.0 52.3 1.3 1.7Probable 37.7 36.6 3.52 3.68 133.0 134.6 4.3 4.3
Total 49.5 50.7 3.54 3.69 175.0 186.9 5.6 6.0
Tonnes are quoted as dry metric tonnes. 4E PGE is the sum of Platinum, Palladium, Rhodium and Gold grades in grammes per tonne (g/t).Contained Metal is presented in metric tonnes and million troy ounces (Moz). Concentrator recoveries for Merensky Reef (UG) range from 86% to 89%, UG2 Reef (UG) from 78% to 87%, Platreef from 75% to 85% and Main Sulphide Zone from 70% to 78%. Tailings reprocessing recoveries range from 30% to 40%.
EXPLANATORY NOTESMerensky Reef and UG2 Reef: The pay limits built into the basic mining equation are directly linked to the 2015 Business plan. The pay limit is based on ‘Cost 4’ which consists of ‘Direct Cash Cost’ (on and off mine), ‘Other Indirect Costs’ and ‘Stay in Business Capital’ (on and off mine). The Ore Reserve pay-limit varies across all operations between 2.1g/t and 5.3g/t (4E PGE). The range is a function of various factors including depth of the orebody, geological complexity, mining method, infrastructure and economic parameters. Merensky Reef: The global Ore Reserve 4E ounce content and tonnage increased due to conversion of Mineral Resources to Ore Reserves mainly at Bokoni, BRPM and Thembelani mines. These increases were partially offset by the decrease in Ore Reserves mainly from Tumela Mine where Ore Reserves have been reallocated to Mineral Resources.UG2 Reef: The primary contribution to the overall decrease is production. Additionally the global Ore Reserve 4E content decreased but the tonnage increased largely due to the reallocation of Ore Reserves to Mineral Resources mainly at Dishaba, Tumela and Modikwa mines. Adjusted modifying factors applied to AAPL managed mines resulted in a tonnage increase and a grade decrease. These decreases were partially offset by the conversion of Mineral Resources to Ore Reserves mainly at Siphumelele 3 (managed by Aquarius Platinum Ltd), Mototolo and Thembelani mines. Platreef: The pay limit is 2.3 g/t 4E for the mining operations and varies between 1.0g/t and 1.7 g/t 4E for the stockpiles. The Ore Reserves 4E content and tonnage decreased as a result of a change in the detailed ramp designs associated with Cut 18 during planning optimisation which resulted in reallocation of Ore Reserves to Mineral Resources. The change in the design only affects the southern portion of the Mogalakwena pit. The anticipated Life of Mine Plan exceeds the current Mining Right expiry date.Platreef Primary stockpile: Mined ore retained for future treatment and reported separately as Proved Reserves but included in the Total Platreef Ore Reserves. All Reefs – Alternative units: Tonnage in million short tons (Mton) and associated grade in troy ounces per short ton (oz/ton) for 2014 is: Total: 2,274.0 Mton (2013: 2,331.7 Mton) at 0.088 oz/ton (2013: 0.089 oz/ton).Tailings: Operating tailings dams are not reported as part of the published Ore Reserves. At Rustenburg mines dormant dams have been evaluated and are separately reported as Probable Ore Reserves. The treatment of tailings is sensitive to both price and volume therefore resulting in tailings dam material being reported as Probable Reserves only.Main Sulphide Zone: The Ore Reserve tonnage and 4E content decreased mainly due to changes in the modifying factors as well as production. Anglo American Platinum Limited currently reports an effective 100% interest in Unki Mine, subject to the finalisation of the indigenisation agreement.Main Sulphide Zone – Alternative units: Tonnage in million short tons (Mton) and associated grade in troy ounces per short ton (oz/ton) for 2014 is: Total: 54.5 Mton (2013: 55.8 Mton) at 0.103 oz/ton (2013: 0.108 oz/ton).

ORE RESERVES AND MINERAL RESOURCES
192 Anglo American plc Annual Report 2014
PLATINUM GROUP METALS estimates as at 31 December 2014
Platinum – South Africa Operations Tonnes Grade Contained Metal Contained Metal
MINERAL RESOURCES Classification 2014 2013 2014 2013 2014 2013 2014 2013Merensky Reef Mt Mt 4E PGE 4E PGE 4E tonnes 4E tonnes 4E Moz 4E Moz
Measured 241.8 238.5 5.49 5.47 1,327.0 1,305.2 42.7 42.0Indicated 344.0 326.4 5.32 5.41 1,831.0 1,766.2 58.9 56.8
Measured and Indicated 585.8 564.9 5.39 5.44 3,158.0 3,071.4 101.5 98.8Inferred (in LOM Plan) 7.2 6.6 6.65 6.47 48.0 43.0 1.5 1.4
Inferred (ex. LOM Plan) 550.3 564.1 4.89 5.06 2,691.0 2,853.9 86.5 91.8Total Inferred 557.5 570.7 4.91 5.08 2,739.0 2,896.9 88.1 93.1
UG2 Reef Measured 669.8 656.5 5.19 5.19 3,474.0 3,409.5 111.7 109.6Indicated 684.4 681.4 5.16 5.16 3,532.0 3,516.4 113.5 113.1
Measured and Indicated 1,354.2 1,338.0 5.17 5.18 7,006.0 6,925.9 225.2 222.7Inferred (in LOM Plan) 3.3 4.3 4.74 4.79 16.0 20.4 0.5 0.7
Inferred (ex. LOM Plan) 591.1 596.4 5.35 5.35 3,161.0 3,189.4 101.6 102.5Total Inferred 594.4 600.6 5.34 5.34 3,177.0 3,209.8 102.1 103.2
Platreef Measured 152.8 155.1 2.66 2.62 407.0 406.1 13.1 13.1Indicated 790.9 740.9 2.23 2.17 1,765.0 1,605.0 56.8 51.6
Measured and Indicated 943.7 896.0 2.30 2.24 2,172.0 2,011.1 69.8 64.7Inferred (in LOM Plan) 70.7 72.9 2.59 2.61 183.0 190.2 5.9 6.1
Inferred (ex. LOM Plan) 1,104.1 1,101.9 1.82 1.81 2,005.0 1,997.5 64.5 64.2Total Inferred 1,174.8 1,174.8 1.86 1.86 2,188.0 2,187.7 70.3 70.3
All Reefs Measured 1,064.4 1,050.1 4.89 4.88 5,208.0 5,120.8 167.4 164.6Merensky, UG2 & Platreef Indicated 1,819.3 1,748.8 3.92 3.94 7,128.0 6,887.6 229.2 221.4
Measured and Indicated 2,883.7 2,798.9 4.28 4.29 12,336.0 12,008.4 396.6 386.1Inferred (in LOM Plan) 81.2 83.8 3.04 3.02 247.0 253.6 7.9 8.2
Inferred (ex. LOM Plan) 2,245.6 2,262.3 3.50 3.55 7,857.0 8,040.8 252.6 258.5Total Inferred 2,326.7 2,346.2 3.48 3.54 8,104.0 8,294.4 260.5 266.7
Tailings Measured 137.5 137.5 0.95 0.95 130.0 130.1 4.2 4.2Indicated 23.6 22.8 1.02 1.02 24.0 23.4 0.8 0.8
Measured and Indicated 161.0 160.3 0.96 0.96 154.0 153.5 5.0 4.9Inferred (in LOM Plan) – – – – – – – –
Inferred (ex. LOM Plan) 1.2 1.2 0.91 0.90 1.0 1.1 0.0 0.0Total Inferred 1.2 1.2 0.91 0.90 1.0 1.1 0.0 0.0
MINERAL RESOURCES ARE REPORTED AS ADDITIONAL TO ORE RESERVES.
Platinum – Zimbabwe Operations Tonnes Grade Contained Metal Contained Metal
MINERAL RESOURCES Classification 2014 2013 2014 2013 2014 2013 2014 2013Main Sulphide Zone Mt Mt 4E PGE 4E PGE 4E tonnes 4E tonnes 4E Moz 4E Moz
Measured 23.2 23.4 3.83 3.83 89.0 89.6 2.9 2.9Indicated 113.9 114.6 4.31 4.35 490.0 498.2 15.8 16.0
Measured and Indicated 137.1 138.1 4.22 4.26 579.0 587.8 18.6 18.9Inferred (in LOM Plan) 11.2 0.0 3.95 3.48 44.0 0.1 1.4 0.0
Inferred (ex. LOM Plan) 41.8 45.1 4.36 4.64 182.0 208.9 5.9 6.7Total Inferred 53.0 45.1 4.27 4.64 226.0 209.0 7.3 6.7
MINERAL RESOURCES ARE REPORTED AS ADDITIONAL TO ORE RESERVES.
Tonnes are quoted as dry metric tonnes. 4E PGE is the sum of Platinum, Palladium, Rhodium and Gold grades in grammes per tonne (g/t). Contained Metal is presented in metric tonnes and million troy ounces (Moz).
Due to the uncertainty that may be attached to some Inferred Mineral Resources, it cannot be assumed that all or part of an Inferred Mineral Resource will necessarily be upgraded to an Indicated or Measured Resource after continued exploration.
EXPLANATORY NOTESMerensky Reef and UG2 Reef: The Mineral Resources are estimated over a practical minimum mining width suitable for the deposit known as the ‘Resource Cut’. The ‘Resource Cut’ width takes cognisance of the mining method and geotechnical aspects in the hanging wall or footwall of the reef.Merensky Reef: The Mineral Resource 4E content decreased but the tonnage increased mainly due to an improved resource evaluation methodology applied to the Tumela Pothole Reef facies, partially offset by the Mineral Resources content and tonnage increase at Union, Rustenburg and Dishaba mines due to lower geological losses applied. UG2 Reef: The Mineral Resource 4E content and tonnage increased mainly at Union, Dishaba and Bokoni mines due to lower geological losses applied. A decrease of Mineral Resources occurred due to the disposal of Driekop, a reconciliation adjustment at Kroondal and Marikana and conversion of Mineral Resources to Ore Reserves at Mototolo. Platreef: A 1.0g/t 4E cut-off is used to define Platreef Mineral Resources. The Mineral Resources increased due to reallocation of Ore Reserves to Mineral Resources mainly as a result of changes in the detailed ramp designs associated with Cut 18. All Reefs – Alternative units: Tonnage in million short tons (Mton) and associated grade in troy ounces per short ton (oz/ton) for 2014 is: Measured and Indicated: 3,178.7 Mton (2013: 3,085.2 Mton) at 0.125 oz/ton (2013: 0.125 oz/ton).Total Inferred: 2,564.8 Mton (2013: 2,586.2 Mton) at 0.102 oz/ton (2013: 0.103 oz/ton).Tailings: Operating tailings dams are not reported as part of the Mineral Resources. At Rustenburg, Amandelbult and Union mines dormant tailings dams have been evaluated and are separately reported as Tailings Mineral Resources. Main Sulphide Zone: Anglo American Platinum currently reports an effective 100% interest in Southridge Limited, subject to the finalisation of the indigenisation agreement.Main Sulphide Zone – Alternative units: Tonnage in million short tons (Mton) and associated grade in troy ounces per short ton (oz/ton) for 2014 is: Measured and Indicated: 151.2 Mton (2013: 152.2 Mton) at 0.123 oz/ton (2013: 0.124 oz/ton).Total Inferred: 58.4 Mton (2013: 49.7 Mton) at 0.125 oz/ton (2013: 0.135 oz/ton).

ORE RESERVES AND MINERAL RESOURCES
Anglo American plc Annual Report 2014 193
Ore R
eserves and Mineral R
esources
PLATINUM GROUP METALS estimates as at 31 December 2014
Platinum – Other 3E ProjectsMINERAL RESOURCES
Tonnes Grade Contained Metal Contained MetalClassification 2014 2013 2014 2013 2014 2013 2014 2013
South Africa Mt Mt 3E PGE 3E PGE 3E tonnes 3E tonnes 3E Moz 3E MozBoikgantsho Measured – – – – – – – –Platreef Indicated 45.5 45.5 1.22 1.22 55.4 55.4 1.8 1.8
Measured and Indicated 45.5 45.5 1.22 1.22 55.4 55.4 1.8 1.8Inferred 3.3 3.3 1.14 1.14 3.8 3.8 0.1 0.1
3E PGE 3E PGESheba’s Ridge Measured 28.0 28.0 0.88 0.88 24.6 24.6 0.8 0.8
Indicated 34.0 34.0 0.85 0.85 29.1 29.1 0.9 0.9Measured and Indicated 62.0 62.0 0.87 0.87 53.6 53.6 1.7 1.7
Inferred 149.9 149.9 0.96 0.96 144.5 144.5 4.6 4.6Brazil 3E PGE 3E PGE
Pedra Branca Inferred 6.6 6.6 2.27 2.27 15.0 15.0 0.5 0.5
Tonnes are quoted as dry metric tonnes. 3E PGE is the sum of Platinum, Palladium and Gold grades in grammes per tonne (g/t). Contained Metal is presented in metric tonnes and million troy ounces (Moz).
Due to the uncertainty that may be attached to some Inferred Mineral Resources, it cannot be assumed that all or part of an Inferred Mineral Resource will necessarily be upgraded to an Indicated or Measured Resource after continued exploration.
EXPLANATORY NOTESBoikgantsho: Anglo American Platinum Limited holds an attributable interest of 100% of the Boikgantsho project. A cut-off grade of 1g/t (3E PGE) is applied for Mineral Resource definition. Sheba’s Ridge: Anglo American Platinum Limited holds an attributable interest of 35% of the Joint Venture between Anglo American Platinum Limited, Aquarius Platinum Limited and the South African Industrial Development Corporation (IDC). A cut-off grade of 0.5g/t (3E PGE) is applied for Mineral Resource definition.Pedra Branca: Anglo American Platinum Limited holds an attributable interest of 51% of the Joint Venture with Solitario Resources & Royalty. A cut-off of 0.7g/t (3E PGE) is applied for Mineral Resource definition.
The following operations and projects contributed to the combined 2014 Ore Reserve and Mineral Resource estimates stated per reef (excluding Other 3E Projects):
Operations: Reef Types Mining Method AAPL % Reserve Life Total Ore Reserves (4E Moz)Bafokeng Rasimone Platinum Mine (BRPM) MR/UG2 UG 33% > 26 5.3Bathopele Mine• UG2 UG 100% 15 3.8Bokoni Platinum Mine MR/UG2 UG 49% > 25 6.2Dishaba Mine MR/UG2 UG 100% > 26 15.7Kroondal and Marikana Platinum Mine UG2 UG & OC 50% 9 3.2Modikwa Platinum Mine MR/UG2 UG 50% > 28 3.7Mogalakwena Mine PR OP 100% > 26 135.2Mototolo Platinum Mine UG2 UG 50% 5* 1.0Pandora Mine UG2 UG 42.5% 25 1.0Siphumelele Mine• MR/UG2 UG 100% 10 1.5Thembelani Mine• MR/UG2 UG 100% 14 3.7Tumela Mine MR/UG2 UG 100% 16 5.6Twickenham Platinum Mine MR/UG2 UG 100% 19 4.8Union Mine MR/UG2 UG 85% 23 6.9Unki Mine MSZ UG 100% 31 5.6
Projects: %Der Brochen Project MR/UG2 100%Hoedspruit Portions (Rustenburg area) MR/UG2 37.5% to 100%
Reef Types: MR = Merensky Reef, UG2 = UG2 Reef, PR = Platreef, MSZ = Main Sulphide Zone. Mining method: OC = Open Cut, OP = Open Pit, UG = Underground. AAPL % = Anglo American Platinum Limited attributable interest. Reserve Life = The scheduled extraction period in years for the total Ore Reserves in the approved Life of Mine Plan, considering the combined MR and UG2 production where applicable within the current Mining Right plus any anticipated extension to the Mining Right for which an application has been submitted and where there is reasonable expectation that this extension to be granted. +Reserve Life truncated to the last year of current Mining Right. * Only five years of Ore Reserves are declared as per Glencore policy. • Rustenburg Mines.
Union North and South Mines have been merged into a single reporting entity. Anglo American Platinum Limited attributable portion of Driekop project has been fully disposed of during 2014.
Information was provided by the Joint Venture partners for the following operations and projects: Operations – BRPM, Bokoni, Kroondal, Marikana, Modikwa, Mototolo, Pandora (only Ore Reserve information for Modikwa). 3E Projects – Boikgantsho, Pedra Branca, Sheba’s Ridge. 4E Projects – Der Brochen, Portions of Hoedspruit (Rustenburg area) – previously reported under ‘Other Exploration Projects’.
Audits related to the generation of the Ore Reserve and Mineral Resource estimates were carried out by independent consultants during 2014 at the following operations: Bathopele, Siphumelele 1, Thembelani (including Khuseleka shaft), Tumela, Twickenham and Union mines.
+
+
+
+
+
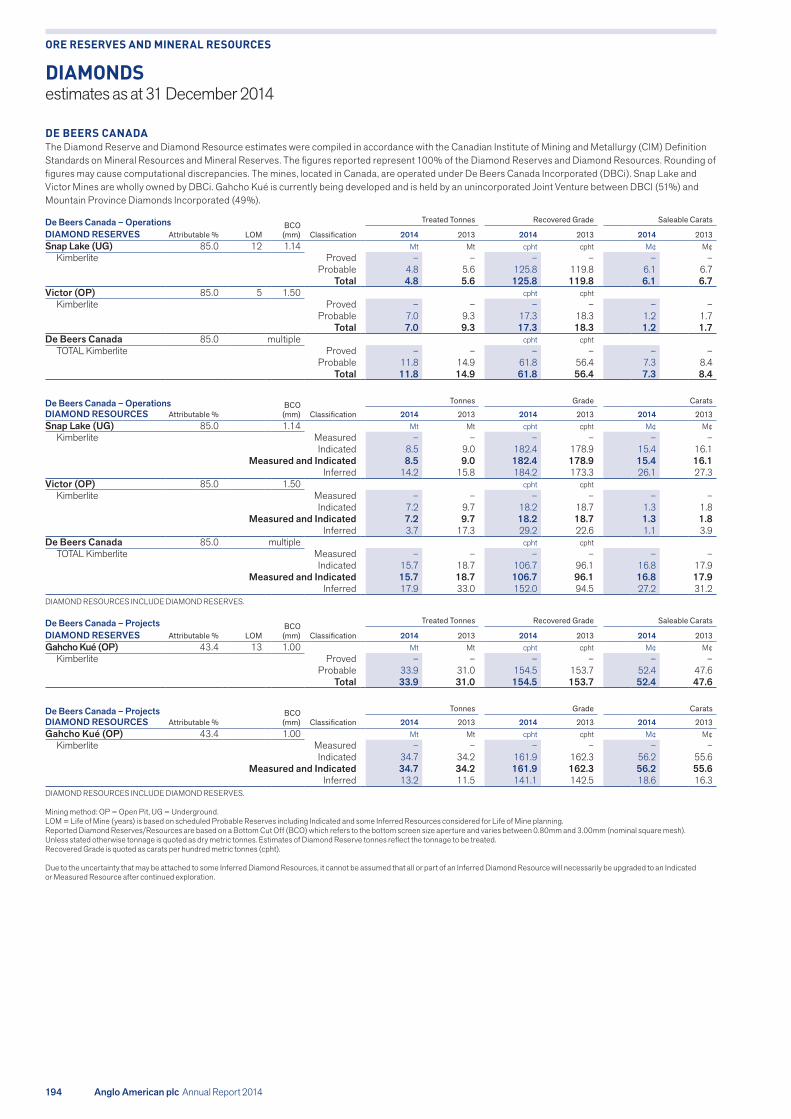
ORE RESERVES AND MINERAL RESOURCES
194 Anglo American plc Annual Report 2014
DE BEERS CANADAThe Diamond Reserve and Diamond Resource estimates were compiled in accordance with the Canadian Institute of Mining and Metallurgy (CIM) Definition Standards on Mineral Resources and Mineral Reserves. The figures reported represent 100% of the Diamond Reserves and Diamond Resources. Rounding of figures may cause computational discrepancies. The mines, located in Canada, are operated under De Beers Canada Incorporated (DBCi). Snap Lake and Victor Mines are wholly owned by DBCi. Gahcho Kué is currently being developed and is held by an unincorporated Joint Venture between DBCI (51%) and Mountain Province Diamonds Incorporated (49%).
De Beers Canada – OperationsLOM
BCO (mm)
Treated Tonnes Recovered Grade Saleable Carats
DIAMOND RESERVES Attributable % Classification 2014 2013 2014 2013 2014 2013Snap Lake (UG) 85.0 12 1.14 Mt Mt cpht cpht M¢ M¢
Kimberlite Proved – – – – – –Probable 4.8 5.6 125.8 119.8 6.1 6.7
Total 4.8 5.6 125.8 119.8 6.1 6.7Victor (OP) 85.0 5 1.50 cpht cpht
Kimberlite Proved – – – – – –Probable 7.0 9.3 17.3 18.3 1.2 1.7
Total 7.0 9.3 17.3 18.3 1.2 1.7De Beers Canada 85.0 multiple cpht cpht
TOTAL Kimberlite Proved – – – – – –Probable 11.8 14.9 61.8 56.4 7.3 8.4
Total 11.8 14.9 61.8 56.4 7.3 8.4
De Beers Canada – Operations BCO (mm)
Tonnes Grade Carats
DIAMOND RESOURCES Attributable % Classification 2014 2013 2014 2013 2014 2013Snap Lake (UG) 85.0 1.14 Mt Mt cpht cpht M¢ M¢
Kimberlite Measured – – – – – –Indicated 8.5 9.0 182.4 178.9 15.4 16.1
Measured and Indicated 8.5 9.0 182.4 178.9 15.4 16.1Inferred 14.2 15.8 184.2 173.3 26.1 27.3
Victor (OP) 85.0 1.50 cpht cphtKimberlite Measured – – – – – –
Indicated 7.2 9.7 18.2 18.7 1.3 1.8Measured and Indicated 7.2 9.7 18.2 18.7 1.3 1.8
Inferred 3.7 17.3 29.2 22.6 1.1 3.9De Beers Canada 85.0 multiple cpht cpht
TOTAL Kimberlite Measured – – – – – –Indicated 15.7 18.7 106.7 96.1 16.8 17.9
Measured and Indicated 15.7 18.7 106.7 96.1 16.8 17.9Inferred 17.9 33.0 152.0 94.5 27.2 31.2
DIAMOND RESOURCES INCLUDE DIAMOND RESERVES.
De Beers Canada – ProjectsLOM
BCO (mm)
Treated Tonnes Recovered Grade Saleable Carats
DIAMOND RESERVES Attributable % Classification 2014 2013 2014 2013 2014 2013Gahcho Kué (OP) 43.4 13 1.00 Mt Mt cpht cpht M¢ M¢
Kimberlite Proved – – – – – –Probable 33.9 31.0 154.5 153.7 52.4 47.6
Total 33.9 31.0 154.5 153.7 52.4 47.6
De Beers Canada – Projects BCO
(mm)
Tonnes Grade Carats
DIAMOND RESOURCES Attributable % Classification 2014 2013 2014 2013 2014 2013Gahcho Kué (OP) 43.4 1.00 Mt Mt cpht cpht M¢ M¢
Kimberlite Measured – – – – – –Indicated 34.7 34.2 161.9 162.3 56.2 55.6
Measured and Indicated 34.7 34.2 161.9 162.3 56.2 55.6Inferred 13.2 11.5 141.1 142.5 18.6 16.3
DIAMOND RESOURCES INCLUDE DIAMOND RESERVES. Mining method: OP = Open Pit, UG = Underground. LOM = Life of Mine (years) is based on scheduled Probable Reserves including Indicated and some Inferred Resources considered for Life of Mine planning. Reported Diamond Reserves/Resources are based on a Bottom Cut Off (BCO) which refers to the bottom screen size aperture and varies between 0.80mm and 3.00mm (nominal square mesh). Unless stated otherwise tonnage is quoted as dry metric tonnes. Estimates of Diamond Reserve tonnes reflect the tonnage to be treated. Recovered Grade is quoted as carats per hundred metric tonnes (cpht).
Due to the uncertainty that may be attached to some Inferred Diamond Resources, it cannot be assumed that all or part of an Inferred Diamond Resource will necessarily be upgraded to an Indicated or Measured Resource after continued exploration.
DIAMONDS estimates as at 31 December 2014

ORE RESERVES AND MINERAL RESOURCES
Anglo American plc Annual Report 2014 195
Ore R
eserves and Mineral R
esources
EXPLANATORY NOTESSnap Lake: The decrease in Diamond Reserve estimates is primarily due to production and a revision of the Diamond Resource estimates. Indicated Resource estimates are continuously generated from information gained from underground footwall drilling ahead of the mining face, resulting in a rolling Probable Reserve. Longer-term Diamond Reserve development is considered impractical due to technical and cost considerations. Estimates are based on both micro-diamonds and macro-diamonds.Victor: The decrease is primarily due to production. The Stockpile Probable Reserves at a 1.50mm BCO of 0.03 M¢ (0.25 Mt at 13.5 cpht) are excluded from the table. The inclusive Stockpile Resource estimates (including run of mine) at a 1.50 mm BCO of 0.03 M¢ (0.24 Mt at 13.9 cpht) Indicated and 0.01 M¢ (0.04 Mt at 30.8 cpht) Inferred Resource are excluded from the table. The geographically separate Tango Extension Inferred Resource estimates of 4.3 M¢ (22.0 Mt at 19.6 cpht, BCO 1.50mm) are no longer reported as part of the Victor resource. The increase in Tango Extension is due to the inclusion of two additional geological units.Gahcho Kué: The increase in saleable carats is due to the addition of Indicated Resources in the 5034 NE Pipe in combination with a revision of the LOM Plan. The estimates for 5034 NE and Tuzo are based on both micro-diamonds and macro-diamonds. During 2014 the Land Use Permit and Water Licence were issued. The project has been approved for implementation by Anglo American. The project is expected to treat approximately 35 Mt of ore containing an estimated 54 M¢ (100% basis). Scheduled Inferred Resources (1.2 Mt) constitute 2.6% (1.4 M¢) of the estimated carats. The estimates are scheduled tonnes and carats as per the 2014 Life of Mine Plan.
EXCLUSIVE DIAMOND RESOURCESSnap Lake (UG): 1.14 mm BCO – Indicated: 8.5 M¢ (4.9 Mt at 171.6 cpht); Inferred: 26.1 M¢ (14.2 Mt at 184.2 cpht). Victor (OP): 1.50 mm BCO – Indicated: 0.1 M¢ (0.3 Mt at 24.6 cpht); Inferred : 1.1 M¢ (3.7 Mt at 29.2 cpht). Gahcho Kué (OP): 1.00 mm BCO – Indicated: 3.3 M¢ (2.3 Mt at 140.6 cpht); Inferred: 18.6 M¢ (13.2 Mt at 141.1 cpht).
LOM and LICENCE INFORMATION
OperationsLOM Plan(years)
LOM PlanFinal Year
Mining LicenceLast Year
% Inferred carats in LOM Plan
DBCi – Snap Lake 12 2026 2021/2023 68%*DBCi – Victor 5 2019 2024 40%
* Snap Lake produces rolling reserves 2–3 years ahead of mining.
ProjectsLOM Plan(years)
LOM PlanFinal Year
Mining LicenceLast Year
% Inferred carats in LOM Plan
DBCi – Gahcho Kué 13 2028 2023 3%
Audits related to the generation of the Ore Reserve and Mineral Resource estimates were carried out by independent consultants during 2014 at Snap Lake and Victor.
DIAMONDS estimates as at 31 December 2014

ORE RESERVES AND MINERAL RESOURCES
196 Anglo American plc Annual Report 2014
DE BEERS CONSOLIDATED MINESThe Diamond Reserve and Diamond Resource estimates were compiled in accordance with The South African Code for the Reporting of Exploration Results, Mineral Resources and Mineral Reserves (The SAMREC Code, 2007 Edition as amended July 2009). The figures reported represent 100% of the Diamond Reserves and Diamond Resources. Rounding of figures may cause computational discrepancies. The mines, located in South Africa, are operated under De Beers Consolidated Mines Proprietary Limited (DBCM). DBCM is indirectly owned, through DBCM Holdings, by De Beers Société Anonyme (74%) and its broad based black economic empowerment partner Ponahalo Investments Proprietary Limited (26%).
Treated Tonnes Recovered Grade Saleable CaratsDe Beers Consolidated Mines – Operations BCO (mm)DIAMOND RESERVES Attributable % LOM Classification 2014 2013 2014 2013 2014 2013
Venetia 62.9 30 1.00 Mt Mt cpht cpht M¢ M¢Kimberlite (OP) Proved – – – – – –
Probable 27.5 31.3 101.1 96.3 27.9 30.1Total 27.5 31.3 101.1 96.3 27.9 30.1
Kimberlite (UG) Proved – – – – – –Life Extension Project Probable 95.0 91.3 75.1 74.2 71.3 67.7
Total 95.0 91.3 75.1 74.2 71.3 67.7Voorspoed (OP) 62.9 7 1.47 cpht cpht
Kimberlite Proved – – – – – –Probable 8.0 – 23.7 – 1.9 –
Total 8.0 – 23.7 – 1.9 –De Beers Consolidated Mines 62.9 multiple cpht cpht
TOTAL Kimberlite Proved – – – – – –Probable 130.5 122.6 77.4 79.8 101.1 97.9
Total 130.5 122.6 77.4 79.8 101.1 97.9
De Beers Consolidated Mines – Operations BCO (mm)
Tonnes Grade Carats
DIAMOND RESOURCES Attributable % Classification 2014 2013 2014 2013 2014 2013Namaqualand (OC) 62.9 multiple Mt Mt cpht cpht M¢ M¢
Beach Placers Measured – – – – – –Indicated 12.7 19.3 6.5 10.9 0.8 2.1
Measured and Indicated 12.7 19.3 6.5 10.9 0.8 2.1Inferred 39.5 70.8 1.4 4.8 0.6 3.4
Venetia 62.9 1.00 cpht cphtKimberlite (OP) Measured – – – – – –
Indicated 29.0 32.3 109.0 103.4 31.6 33.4Measured and Indicated 29.0 32.3 109.0 103.4 31.6 33.4
Inferred 26.5 27.9 18.1 17.5 4.8 4.9Kimberlite (UG) Measured – – – – – –Life Extension Project Indicated 108.5 108.0 87.0 87.8 94.3 94.8
Measured and Indicated 108.5 108.0 87.0 87.8 94.3 94.8Inferred 69.9 69.9 85.3 85.5 59.6 59.8
Voorspoed (OP) 62.9 1.47 cpht cphtKimberlite Measured – – – – – –
Indicated 9.1 – 26.2 – 2.4 –Measured and Indicated 9.1 – 26.2 – 2.4 –
Inferred 20.3 33.0 19.2 21.9 3.9 7.2De Beers Consolidated Mines 62.9 multiple cpht cpht
TOTAL Kimberlite and Beach Placer Measured – – – – – –Indicated 159.4 159.5 81.1 81.7 129.2 130.3
Measured and Indicated 159.4 159.5 81.1 81.7 129.2 130.3Inferred 156.2 201.6 44.1 37.3 68.9 75.3
DIAMOND RESOURCES INCLUDE DIAMOND RESERVES.
De Beers Consolidated Mines – Tailings Operations BCO (mm)
Tonnes Grade Carats
DIAMOND RESOURCES Attributable % Classification 2014 2013 2014 2013 2014 2013Kimberley Mines 62.9 1.15 Mt Mt cpht cpht M¢ M¢
TMR Measured – – – – – –Indicated – – – – – –
Measured and Indicated – – – – – –Inferred 25.9 32.1 10.8 12.1 2.8 3.9
Mining method: OP = Open Pit, UG = Underground. LOM = Life of Mine (years) is based on scheduled Probable Reserves including Indicated and some Inferred Resources considered for Life of Mine planning. Reported Diamond Reserves/Resources are based on a Bottom Cut Off (BCO) which refers to the bottom screen size aperture and varies between 0.80mm and 3.00mm (nominal square mesh). Unless stated otherwise tonnage is quoted as dry metric tonnes. Estimates of Diamond Reserve tonnes reflect the tonnage to be treated. Recovered Grade is quoted as carats per hundred metric tonnes (cpht). Due to the uncertainty that may be attached to some Inferred Diamond Resources, it cannot be assumed that all or part of an Inferred Diamond Resource will necessarily be upgraded to an Indicated or Measured Resource after continued exploration.
DIAMONDS estimates as at 31 December 2014

ORE RESERVES AND MINERAL RESOURCES
Anglo American plc Annual Report 2014 197
Ore R
eserves and Mineral R
esources
EXPLANATORY NOTESVenetia: The LOM is stated as 30 years which reflects the full duration of the current Venetia consolidated OP and UG Life of Mine Plan. The current Mining Right expires in 2038; Venetia Mine will apply to extend the Mining Right at the appropriate time in the future.Venetia (OP): The Life of Mine plan includes the K01, K02 and K03 pipes. The K01 estimates are based on both micro-diamonds and macro-diamonds. The planned production for 2015 includes a significant portion of Inferred Resources. The inclusive Old Recovery Tailings Resource estimates at a 0.80 mm BCO of 1.8 M¢ (0.05 Mt at 3804.4 cpht) Inferred Resource are excluded from the table.Venetia (UG): The Diamond Reserves increased due to an updated underground mine plan. The project is expected to treat approximately 133 Mt of ore containing an estimated 94 M¢. Scheduled Inferred Resources (37.7 Mt) constitute 24% (22.2 M¢) of the estimated carats. The estimates are scheduled tonnes and carats as per the 2014 Life of Mine Plan.Namaqualand: The sale of Namaqualand Mines (excluding the Buffels Marine mining right) to Emerald Panther Investments (PTY) Limited was concluded in 2014. The remaining Diamond Resource estimates reflects the tonnes and carats associated with the Buffels Marine mining right.Voorspoed: The change is due to production and refinement of the geological model. Indicated Resources are reported to a depth of 200mbgl. This has allowed for Probable Reserve estimates to be reported.Kimberley Mines: The decrease in the Diamond Resource estimates is due to production and model refinement. Kimberley Mines Central Treatment Plant (CTP) was initially established to treat ore from both Tailings Resources and underground mines. Subsequent to the conclusion of the sale of the underground operations to Petra Diamonds in May 2010, only Tailings Resources are being treated. The inclusive Stockpile estimates at a 1.15mm BCO of 0.04M¢ (0.35 Mt at 11.3 cpht) Inferred Resource are excluded from the table.
EXCLUSIVE DIAMOND RESOURCESVenetia (OP): 1.00 mm BCO – Indicated: 0.6 M¢ (0.5 Mt at 122.7 cpht); Inferred: 4.8 M¢ (26.5 Mt at 18.1 cpht). Venetia (UG): 1.00 mm BCO – Inferred: 59.6 M¢ (69.9 Mt at 85.3 cpht).Voorspoed (OP): 1.47 mm BCO – Indicated: 0.4 M¢ (1.4 Mt at 27.8 cpht); Inferred: 3.9 M¢ (20.3 Mt at 19.2 cpht).
LOM and LICENCE INFORMATION
OperationsLOM Plan(years)
LOM PlanFinal Year
Mining LicenceLast Year
% Inferred carats in LOM Plan
DBCM – Venetia 30 2044 2038 19%DBCM – Voorspoed 7 2021 2023 80%DBCM – Kimberley Mines 4 2018 2040 88%** The Kimberley Life of Mine Plan contains 12% low geoscientific confidence material which has not been classified as Diamond Resource.
Audits related to the generation of the Ore Reserve and Mineral Resource estimates were carried out by independent consultants during 2014 at Venetia.
DIAMONDS estimates as at 31 December 2014

ORE RESERVES AND MINERAL RESOURCES
198 Anglo American plc Annual Report 2014
DEBSWANA DIAMOND COMPANYThe Diamond Reserve and Diamond Resource estimates were compiled in accordance with The South African Code for the Reporting of Exploration Results, Mineral Resources and Mineral Reserves (The SAMREC Code, 2007 Edition as amended July 2009). The figures reported represent 100% of the Diamond Reserves and Diamond Resources. Rounding of figures may cause computational discrepancies. In Botswana the mines are owned in equal share by De Beers Société Anonyme and the Government of the Republic of Botswana through the Debswana Diamond Company joint venture. Two resource types are mined, Kimberlite and Tailings Mineral Resource (TMR).
Debswana – Operations LOM
BCO (mm)
Treated Tonnes Recovered Grade Saleable Carats
Classification 2014 2013 2014 2013 2014 2013DIAMOND RESERVES Attributable %Damtshaa (OP) 42.5 18 1.65 Mt Mt cpht cpht M¢ M¢
Kimberlite Proved – – – – – –Probable 25.0 25.0 18.8 16.6 4.7 4.1
Total 25.0 25.0 18.8 16.6 4.7 4.1Jwaneng (OP) 42.5 19 1.47 cpht cpht
Kimberlite Proved – – – – – –Probable 47.3 61.8 134.4 125.2 63.5 77.3
Total 47.3 61.8 134.4 125.2 63.5 77.3Letlhakane (OP) 42.5 3 1.65 cpht cpht
Kimberlite Proved – – – – – –Probable 1.8 3.2 18.4 19.9 0.3 0.6
Total 1.8 3.2 18.4 19.9 0.3 0.6Orapa (OP) 42.5 15 1.65 cpht cpht
Kimberlite Proved – – – – – –Probable 173.4 140.3 77.8 63.8 134.9 89.6
Total 173.4 140.3 77.8 63.8 134.9 89.6Debswana Diamond Company 42.5 multiple cpht cpht
TOTAL Kimberlite Proved – – – – – –Probable 247.4 230.3 82.2 74.6 203.5 171.7
Total 247.4 230.3 82.2 74.6 203.5 171.7
Debswana – Operations BCO (mm)
Tonnes Grade Carats
DIAMOND RESOURCES Attributable % Classification 2014 2013 2014 2013 2014 2013Damtshaa (OP) 42.5 1.65 Mt Mt cpht cpht M¢ M¢
Kimberlite Measured – – – – – –Indicated 29.3 29.3 21.5 21.5 6.3 6.3
Measured and Indicated 29.3 29.3 21.5 21.5 6.3 6.3Inferred 16.2 20.2 25.4 24.3 4.1 4.9
Jwaneng (OP) 42.5 1.47 cpht cphtKimberlite Measured – – – – – –
Indicated 53.0 61.8 119.7 119.5 63.4 73.8Measured and Indicated 53.0 61.8 119.7 119.5 63.4 73.8
Inferred 257.5 258.6 104.6 104.1 269.3 269.3Letlhakane (OP) 42.5 1.65 cpht cpht
Kimberlite Measured – – – – – –Indicated 13.0 15.3 31.0 28.4 4.0 4.3
Measured and Indicated 13.0 15.3 31.0 28.4 4.0 4.3Inferred 3.2 3.2 17.5 17.0 0.6 0.6
Orapa (OP) 42.5 1.65 cpht cphtKimberlite Measured – – – – – –
Indicated 286.1 155.5 94.5 70.9 270.3 110.3Measured and Indicated 286.1 155.5 94.5 70.9 270.3 110.3
Inferred 203.4 349.7 85.0 72.5 172.9 253.4Debswana Diamond Company 42.5 multiple cpht cpht
TOTAL Kimberlite Measured – – – – – –Indicated 381.5 261.9 90.2 74.4 344.0 194.8
Measured and Indicated 381.5 261.9 90.2 74.4 344.0 194.8Inferred 480.4 631.7 93.0 83.6 446.9 528.2
DIAMOND RESOURCES INCLUDE DIAMOND RESERVES. Mining method: OP = Open Pit, UG = Underground. LOM = Life of Mine (years) is based on scheduled Probable Reserves including Indicated and some Inferred Resources considered for Life of Mine planning. Reported Diamond Reserves/Resources are based on a Bottom Cut Off (BCO) which refers to the bottom screen size aperture and varies between 0.80mm and 3.00mm (nominal square mesh). Unless stated otherwise tonnage is quoted as dry metric tonnes. Estimates of Diamond Reserve tonnes reflect the tonnage to be treated. Recovered Grade is quoted as carats per hundred metric tonnes (cpht). Due to the uncertainty that may be attached to some Inferred Diamond Resources, it cannot be assumed that all or part of an Inferred Diamond Resource will necessarily be upgraded to an Indicated or Measured Resource after continued exploration.
DIAMONDS estimates as at 31 December 2014

ORE RESERVES AND MINERAL RESOURCES
Anglo American plc Annual Report 2014 199
Ore R
eserves and Mineral R
esources
Debswana – Operations BCO (mm)
Tonnes Grade Carats
DIAMOND RESOURCES Attributable % Classification 2014 2013 2014 2013 2014 2013Jwaneng 42.5 1.47 Mt Mt cpht cpht M¢ M¢
TMR Measured – – – – – –Indicated – – – – – –
Measured and Indicated – – – – – –Inferred 36.6 37.0 46.0 45.9 16.8 17.0
Debswana – Projects LOM
BCO (mm)
Treated Tonnes Recovered Grade Saleable Carats
Classification 2014 2013 2014 2013 2014 2013DIAMOND RESERVES Attributable %Letlhakane 42.5 24 1.15 Mt Mt cpht cpht M¢ M¢
TMR Proved – – – – – –Probable 34.9 34.9 24.2 25.4 8.5 8.9
Total 34.9 34.9 24.2 25.4 8.5 8.9
Debswana – Projects BCO (mm)
Tonnes Grade Carats
DIAMOND RESOURCES Attributable % Classification 2014 2013 2014 2013 2014 2013Letlhakane 42.5 1.15 Mt Mt cpht cpht M¢ M¢
TMR Measured – – – – – –Indicated 34.9 34.9 24.8 24.8 8.6 8.6
Measured and Indicated 34.9 34.9 24.8 24.8 8.6 8.6Inferred 51.9 49.6 27.1 27.1 14.1 13.4
DIAMOND RESOURCES INCLUDE DIAMOND RESERVES. LOM = Life of Mine (years) is based on scheduled Probable Reserves including Indicated and some Inferred Resources considered for Life of Mine planning. Reported Diamond Reserves/Resources are based on a Bottom Cut Off (BCO) which refers to the bottom screen size aperture and varies between 0.80mm and 3.00mm (nominal square mesh). Unless stated otherwise tonnage is quoted as dry metric tonnes. Estimates of Diamond Reserve tonnes reflect the tonnage to be treated. Recovered Grade is quoted as carats per hundred metric tonnes (cpht). Due to the uncertainty that may be attached to some Inferred Diamond Resources, it cannot be assumed that all or part of an Inferred Diamond Resource will necessarily be upgraded to an Indicated or Measured Resource after continued exploration.
EXPLANATORY NOTESDamtshaa: The increase in saleable carats is due to the application of revised plant recovery factors. Higher grade Inferred Resources from the BK/12 Kimberlite are mined for the first three years before including Probable Reserves from BK/9. The BK/9 and BK/12 inclusive Stockpile Inferred Resource estimates at a 1.65mm BCO of 0.1 M¢ (1.6 Mt at 8.1 cpht) are excluded from the table.Jwaneng – Kimberlite: The decrease due to production was largely offset by the increase associated with upgrading of Old Recovery Tailings to Inferred Resource status. The 2014 Life of Mine Plan includes the Cut 8 estimates of 91 Mt of ore to be treated containing an estimated 110 M¢ (North, Centre and South pipes excluding the 4th pipe which is mined as part of waste stripping and stockpiled). Scheduled Inferred Resources (below 401m) included in Cut 8 estimates (68.1 Mt) constitute 81% (89.3 M¢) of the estimated carats. The last three years of LOM includes treatment of Kimberlite stockpiles. The Stockpile Probable Reserves at a 1.47mm BCO of 0.9 M¢ (1.4 Mt at 62.2 cpht) are excluded from the table. The DK/2 inclusive Stockpile estimates at a 1.47mm BCO, consisting of 0.9 M¢ (1.4 Mt at 62.2 cpht) Indicated Resources and 4.8 M¢ (11.3 Mt at 42.7 cpht) Inferred Resources are excluded from the table. Jwaneng – TMR: Old Recovery Tailings estimates at a 1.00 mm BCO of 10.2 M¢ (0.1 Mt at 9,500 cpht) Inferred Resource are excluded from the table.Letlhakane – Kimberlite: The decrease is due to production. DK/1 and DK/2 inclusive Stockpile estimates at a 1.65mm BCO of 0.6 M¢ (3.6 Mt at 17.8 cpht) Inferred Resources are excluded from the table. Letlhakane – TMR: The decrease in saleable carats is primarily due to a downward adjustment of the TMR plant recovery factor. The project is expected to treat approximately 83 Mt of ore containing an estimated 21 M¢. Scheduled Inferred Resources (48.5 Mt) constitute 60% (12.8 M¢) of the estimated carats. The estimates are scheduled tonnes and carats as per the 2014 Life of Mine Plan.Orapa: A total of 91 M¢ is added to the Diamond Resource estimates by the inclusion of new information resulting in new grade estimates in the South Pipe model. This is associated with a material increase in the Diamond Reserve. These increases are partially offset by production. The Orapa (AK1 South Pipe) estimates are based on both micro-diamonds and macro-diamonds. The AK/1 Stockpile estimates at a 1.65mm BCO of 7.7 M¢ (17.4 Mt at 44.1 cpht) Inferred Resources are excluded from the table. The Tailings Resource estimates at a 1.47mm BCO of 88.3 M¢ (151.7 Mt at 58.2 cpht) Inferred Resource are excluded from the table; Large Diameter Auger Drilling at a wide spacing took place in 2014.
EXCLUSIVE DIAMOND RESOURCESDamtshaa (OP): 1.65 mm BCO – Indicated: 1.1 M¢ (4.3 Mt at 25.0 cpht); Inferred: 4.1 M¢ (16.2 Mt at 25.4 cpht).Jwaneng (OP): 1.47 mm BCO – Indicated: 3.6 M¢ (5.7 Mt at 64.2 cpht); Inferred: 269.3 M¢ (257.5 Mt at 104.6 cpht).Letlhakane (OP): 1.65 mm BCO – Indicated: 3.8 M¢ (11.3 Mt at 33.5 cpht); Inferred: 0.6 M¢ (3.2 Mt at 17.5 cpht).Letlhakane (TMR): 1.15 mm BCO – Inferred: 14.1 M¢ (51.9 Mt at 27.1 cpht).Orapa (OP): 1.65 mm BCO – Indicated: 121.1 M¢ (112.7 Mt at 107.4 cpht); Inferred: 172.9 M¢ (203.4 Mt at 85.0 cpht).
LOM and LICENCE INFORMATION
OperationsLOM Plan(years)
LOM PlanFinal Year
Mining LicenceLast Year
% Inferred carats in LOM Plan
Debswana – Damtshaa 18 2032 2029 34%Debswana – Jwaneng 19 2033 2029 68%Debswana – Letlhakane (Kimberlite) 3 2017 2029 83%Debswana – Letlhakane (TMR) 24 2039 2029 60%Debswana – Orapa 15 2029 2029 12%
Audits related to the generation of the Ore Reserve and Mineral Resource estimates were carried out by independent consultants during 2014 at Jwaneng and Orapa.
DIAMONDS estimates as at 31 December 2014

ORE RESERVES AND MINERAL RESOURCES
200 Anglo American plc Annual Report 2014
DIAMONDS estimates as at 31 December 2014
NAMDEB HOLDINGSThe Diamond Reserve and Diamond Resource estimates were compiled in accordance with The South African Code for the Reporting of Exploration Results, Mineral Resources and Mineral Reserves (The SAMREC Code, 2007 Edition as amended July 2009). The figures reported represent 100% of the Diamond Reserves and Diamond Resources. Rounding of figures may cause computational discrepancies. As of 1 October 2011 Namdeb Holdings (Pty) Ltd (NDBH), a 50/50 joint venture between De Beers Société Anonyme and the Government of the Republic of Namibia, holds the licences for both the land and sea operations. In addition, NDBH holds 100% ownership of the operating companies, Namdeb Diamond Corporation (Pty) Ltd and De Beers Marine Namibia (Pty) Ltd.
Treated Tonnes Recovered Grade Saleable CaratsNamdeb Holdings – Terrestrial Operations BCO (mm)DIAMOND RESERVES Attributable % LOM Classification 2014 2013 2014 2013 2014 2013
Elizabeth Bay (OC) 42.5 3 1.40 kt kt cpht cpht k¢ k¢Aeolian and Marine Proved – – – – – –
Probable 1,236 1,076 10.11 13.01 125 140Total 1,236 1,076 10.11 13.01 125 140
Mining Area 1 (OC) 42.5 17 2.00 cpht cphtBeaches Proved – – – – – –
Probable 4,652 3,124 2.47 0.51 115 16Total 4,652 3,124 2.47 0.51 115 16
Orange River (OC) 42.5 9 3.00 cpht cphtFluvial Placers Proved – – – – – –
Probable 34,178 36,711 0.93 0.95 319 349Total 34,178 36,711 0.93 0.95 319 349
Namdeb Holdings 42.5 multiple cpht cphtTOTAL Terrestrial Proved – – – – – –
Probable 40,066 40,911 1.40 1.23 559 505Total 40,066 40,911 1.40 1.23 559 505
Namdeb Holdings – Offshore Operations BCO (mm)
Area Recovered Grade Saleable Carats
DIAMOND RESERVES Attributable % LOM Classification 2014 2013 2014 2013 2014 2013Atlantic 1 (MM) 42.5 15 1.47 k m² k m² cpm² cpm² k¢ k¢
Marine Placer Proved – – – – – –Probable 17,872 69,642 0.11 0.08 1,997 5,504
Total 17,872 69,642 0.11 0.08 1,997 5,504
Namdeb Holdings – Terrestrial Operations BCO (mm)
Tonnes Grade Carats
DIAMOND RESOURCES Attributable % Classification 2014 2013 2014 2013 2014 2013Bogenfels (OC) 42.5 multiple kt kt cpht cpht k¢ k¢
Pocket Beach and Deflation Measured – – – – – –Indicated – – – – – –
Measured and Indicated – – – – – –Inferred 10,955 10,955 6.86 6.75 752 740
Douglas Bay (OC) 42.5 1.40 cpht cphtAeolian and Deflation Measured – – – – – –
Indicated 2,269 2,269 7.05 7.05 160 160Measured and Indicated 2,269 2,269 7.05 7.05 160 160
Inferred 127 127 0.79 0.79 1 1Elizabeth Bay (OC) 42.5 1.40 cpht cpht
Aeolian, Marine and Deflation Measured – – – – – –Indicated 2,091 2,491 9.71 11.20 203 279
Measured and Indicated 2,091 2,491 9.71 11.20 203 279Inferred 10,194 29,032 11.16 7.88 1,138 2,289
Mining Area 1 (OC) 42.5 2.00 cpht cphtBeaches Measured – – – – – –
Indicated 17,090 21,270 1.57 0.81 269 172Measured and Indicated 17,090 21,270 1.57 0.81 269 172
Inferred 269,080 283,369 1.26 1.18 3,381 3,344Orange River (OC) 42.5 3.00 cpht cpht
Fluvial Placers Measured – – – – – –Indicated 82,341 93,347 0.57 0.54 468 503
Measured and Indicated 82,341 93,347 0.57 0.54 468 503Inferred 41,015 45,658 0.42 0.35 174 162
Namdeb Holdings 42.5 multiple cpht cphtTOTAL Terrestrial Measured – – – – – –
Indicated 103,791 119,377 1.06 0.93 1,100 1,114Measured and Indicated 103,791 119,377 1.06 0.93 1,100 1,114
Inferred 331,371 369,141 1.64 1.77 5,446 6,536DIAMOND RESOURCES INCLUDE DIAMOND RESERVES.

ORE RESERVES AND MINERAL RESOURCES
Anglo American plc Annual Report 2014 201
Ore R
eserves and Mineral R
esources
DIAMONDS estimates as at 31 December 2014
Namdeb Holdings – Offshore Operations BCO (mm)
Area Grade Carats
DIAMOND RESOURCES Attributable % Classification 2014 2013 2014 2013 2014 2013Atlantic 1 (MM) 42.5 1.47 k m² k m² cpm² cpm² k¢ k¢
Marine Measured – – – – – –Indicated 119,968 126,801 0.10 0.09 12,274 11,349
Measured and Indicated 119,968 126,801 0.10 0.09 12,274 11,349Inferred 1,102,497 1,042,516 0.08 0.09 89,981 90,044
DIAMOND RESOURCES INCLUDE DIAMOND RESERVES. Mining method: OC = Open Cast, MM = Marine Mining. LOM = Life of Mine (years) is based on scheduled Probable Reserves including Indicated and some Inferred Resources considered for Life of Mine planning. Reported Diamond Reserves/Resources are based on a Bottom Cut Off (BCO) which refers to the bottom screen size aperture and varies between 0.80mm and 3.00mm (nominal square mesh). Unless stated otherwise tonnage is quoted as dry metric tonnes. Estimates of Diamond Reserve tonnes reflect the tonnage to be treated. Recovered Grade is quoted as carats per hundred metric tonnes (cpht) or as carats per square meter (cpm²). k m² = thousand square metres. Due to the uncertainty that may be attached to some Inferred Diamond Resources, it cannot be assumed that all or part of an Inferred Diamond Resource will necessarily be upgraded to an Indicated or Measured Resource after continued exploration.
Namdeb Land consists of Elizabeth Bay, Mining Area 1 and Orange River. Orange River consist of the Auchas, Daberas, Obib and Sendelingsdrif operations. Namdeb Marine consists of Atlantic 1.
EXPLANATORY NOTESElizabeth Bay: The decrease in saleable carats is primarily due to production and changes in economic assumptions mainly impacting Inferred Resources.Mining Area 1: The increase in saleable carats is primarily due to new information in the Ultra Shallow Water A zone (0–7m) at substantially higher grade. The increased Life of Mine includes a material portion of scheduled tonnes with low geoscientific confidence, planned to be upgraded to Inferred Resources on a continuous two-year rolling basis. Incremental Inferred Resource development is dependent on beach accretion for drilling and sampling. Beach accretion is a process through which an existing beach is built seaward to extend into areas previously under water. The accretion is accomplished by sand build-up derived from current mining and dredging activities. The inclusive Overburden Stockpile estimates at a 2.00mm BCO of 34 k¢ (9,227 kt at 0.37 cpht) Inferred Resource, the DMS and Recovery Tailings Resource estimates at a 2.00mm BCO of 679 k¢ (52,987 kt at 1.28 cpht) Inferred Resource are excluded from the table.Orange River: The decrease is primarily due to production. The mining transition from Daberas to Sendelingsdrif will be completed within the next three years.Atlantic 1: The decrease in reserve carats is primarily due to a planning methodology change. The Life of Mine remains the same and includes a material portion of Inferred Resources. Previously all Indicated Resources were used to declare the Diamond Reserve, whereas now only scheduled Indicated Resources in the Life of Mine are converted. This reduction in Diamond Reserve carats is partially offset by new information allowing conversion of additional Diamond Resources to Diamond Reserves and a faster mining rate which allows a lowering of the cut-off grade. Due to the high costs associated with resource development, Indicated Resources are converted to Diamond Reserves on an annual basis to ensure scheduled reserves are available two years ahead of current mining.Bogenfels: The increase in carats is due to application of a different estimation methodology.Bottom screen cut off details for Inferred Resource estimates are as follows: 1.40 mm BCO: 524 k¢ (7,913 kt at 6.62 cpht). 2.00 mm BCO: 228 k¢ (3,042 kt at 7.50 cpht).Midwater: The Midwater Resource comprises the offshore portion of the Diamond Area No. 1 (DA1) Mining Licences 43, 44 and 45, as well as the offshore licences ML 128A, B and C, at water depths greater than 30m. Midwater is not part of current operations or a project.The Aeolian, Fluvial and Marine inclusive Diamond Resource estimates at a 2.00mm BCO, consisting of 492 k¢ (2,533 k m² at 0.19 cpm²) Indicated Resources and 930 k¢ (12,720 k m² at 0.07 cpm²) are excluded from the table.
EXCLUSIVE DIAMOND RESOURCESElizabeth Bay (OC): 1.40 mm BCO – Indicated: 70 k¢ (930 kt at 7.53 cpht); Inferred: 1,138 k¢ (10,194 kt at 11.16 cpht).Mining Area 1 (OC): 2.00 mm BCO – Indicated: 154 k¢ (12,623 kt at 1.22 cpht); Inferred: 3,381 k¢ (269,080 kt at 1.26 cpht).Orange River (OC): 3.00 mm BCO – Indicated: 149 k¢ (48,163 kt at 0.31 cpht); Inferred: 174 k¢ (41,015 kt at 0.42 cpht).Atlantic 1 (MM): 1.47 mm BCO – Indicated: 7,150 k¢ (102,096 k m² at 0.07 cpm²); Inferred: 89,981 k¢ (1,102,497 k m² at 0.08 cpm²).
LOM and LICENCE INFORMATION
OperationsLOM Plan(years)
LOM PlanFinal Year
Mining LicenceLast Year
% Inferred carats in LOM Plan
Namdeb Holdings Terrestrial – Elizabeth Bay 3 2017 2035 81%*Namdeb Holdings Terrestrial – Mining Area 1 17 2031 2035 32%** Namdeb Holdings Terrestrial – Orange River 9 2023 2035 15%*Namdeb Holdings Offshore – Atlantic 1 15 2029 2035 90%**** Elizabeth Bay, Mining Area 1 and Orange River are integrated into a single mine plan. ** The Mining Area 1 Life of Mine Plan contains 65% low geoscientific confidence material which has not been classified as Diamond Resource.*** Atlantic 1 produces rolling reserves 2 years ahead of mining.
Audits related to the generation of the Ore Reserve and Mineral Resource estimates were carried out by independent consultants during 2014 at Atlantic 1.

202 Anglo American plc Annual Report 2014
Throughout this report a number of financial and non-financial measures are used to assess the Group’s performance. The measures are defined as follows:
Underlying EBITUnderlying EBIT is operating profit presented before special items and remeasurements and includes the Group’s attributable share of associates’ and joint ventures’ underlying EBIT. Underlying EBIT of associates and joint ventures is the Group’s attributable share of associates’ and joint ventures’ revenue less operating costs before special items and remeasurements of associates and joint ventures. See notes 3 and 5 to the financial statements for underlying EBIT.
Underlying earningsUnderlying earnings is an alternative earnings measure, which the directors consider to be a useful additional measure of the Group’s performance. Underlying earnings is profit for the financial year attributable to equity shareholders of the Company before special items and remeasurements and is therefore presented after net finance costs, income tax expense and non-controlling interests. See note 9 to the financial statements for the basis of calculation of underlying earnings. See note 6 to the financial statements for the definition of special items and remeasurements.
Net debtNet debt includes related hedges and net debt in disposal groups. See note 23 to the financial statements.
Capital expenditureCapital expenditure is defined as cash expenditure on property, plant and equipment, including related derivatives, and is now presented net of proceeds from disposal of property, plant and equipment and includes direct funding for capital expenditure from non-controlling interests in order to match more closely the way in which it is managed. Comparatives have been re-presented to align with current year presentation.
Underlying EBITDAUnderlying EBITDA is underlying EBIT before depreciation and amortisation in subsidiaries and joint operations and includes the Group’s attributable share of associates’ and joint ventures’ underlying EBIT before depreciation and amortisation. EBITDA, as presented in the net debt table on page 20 of this report excludes the Group’s attributable share of associates’ and joint ventures’ EBITDA.
Real cash costsReal cash costs are the annual increase/decrease in the Group’s operating cash costs versus the prior year, excluding depreciation, the impact of Consumer Price Inflation (CPI) and foreign exchange, and is after capitalisation of stripping costs.
Copper equivalent productionCopper equivalent production, expressed as copper equivalent tonnes, is a metric used to show changes in underlying production volume. Each commodity’s volumes are expressed as revenue, and then converted into a copper equivalent volume by dividing revenue by copper price (per tonne). The prices used for conversion by Anglo American are those from 30 June 2013. When aggregated, these give the Group’s production expressed in units of copper equivalent. Production volumes considered include both equity and purchased volumes (e.g. platinum concentrate from joint operation partners), as well as volumes from mines in pre-commercial production. Thabazimbi (iron ore) and domestic thermal coal production is excluded.
Copper equivalent unit costsCopper equivalent unit costs divide the gross costs associated with unit costs, by relevant copper equivalent volume. Only own equity volumes (and costs) are considered. Thabazimbi (iron ore) and domestic thermal coal production is excluded, as are operations not in commercial production. Both the copper equivalent production and copper equivalent unit cost metrics have been adjusted for the 532 koz of platinum production lost due to the strikes at Platinum operations.
Fatal-injury frequency rate (FIFR)FIFR is the number of employee or contractor fatal injuries due to all causes per 200,000 hours worked.
Lost time injury frequency rate (LTIFR)LTIFR is the number of lost time injuries (LTIs) for both employees and contractors per 200,000 hours worked. An LTI is a work related injury resulting in the person being unable to attend work or perform the routine functions of his/her job, on the next calendar day after the day of the injury, whether a scheduled workday or not. Restricted work cases are therefore counted as LTIs.
Total recordable case frequency rate (TRCFR)TRCFR is the number of fatal injuries, lost time injuries and medical treatment cases for both employees and contractors per 200,000 hours.
New cases of occupational disease (NCOD)NCOD is the sum of occupational diseases due to asbestosis, noise-induced hearing loss, silicosis, coal-workers’ pneumoconiosis, chronic obstructive airways disease, occupational tuberculosis, occupational asthma, hand/arm vibration syndrome, musculoskeletal disorders, dermatitis, occupational cancers and other occupational diseases.
Total energy consumedTotal amount of energy consumed is the sum of total energy from electricity purchased, total energy from fossil fuels and total energy from renewable fuels and is measured in million gigajoules (GJ).
Total new water consumedTotal amount of water used is the total new or make-up water entering the operation and used for the operation’s primary operational activities and is measured in million m3.
OTHER INFORMATION
PERFORMANCE MEASURES

OTHER INFORMATION
Anglo American plc Annual Report 2014 203
Other inform
ation
OTHER INFORMATION PERFORMANCE MEASURES
Attributable return on capital employed (ROCE)Attributable ROCE definitions:
• ROCE is a ratio that measures the efficiency and profitability of a company’s capital investments. It displays how effectively assets are generating profit for the size of invested capital and is calculated as underlying EBIT divided by capital employed.
• Adjusted ROCE is calculated as underlying EBIT divided by adjusted capital employed. Adjusted capital employed is net assets excluding net debt and financial asset investments, adjusted for remeasurements of a previously held equity interest as a result of business combinations and impairments incurred in the current year and reported since 10 December 2013. Earnings and return impacts from such impairments (due to reduced depreciation or amortisation expense) are not taken into account.
• Attributable ROCE is the return on the adjusted capital employed attributable to equity shareholders of Anglo American plc, and therefore excludes the portion of underlying EBIT and capital employed attributable to non-controlling interests in operations where Anglo American plc has control but does not hold 100% of the equity. Joint ventures, joint operations and associates are included in their proportionate interest and in line with appropriate accounting treatment.
• Attributable ROCE is based on realised prices and foreign exchange rates, and includes the below adjustments to capital employed.
Adjustments • Structural adjustments for the De Beers acquisition assuming ownership of 85% of De Beers for 1 January 2012 and disposals from Anglo American Sur assuming ownership of 50.1% from the start of 2012 have been included
• The De Beers fair value uplift which resulted from the revaluing upward of Anglo American plc’s pre-existing 45% share in De Beers is removed from opening 2012 capital employed onwards
• Impairments announced after 10 December 2013 are not removed from total capital employed. Earnings and return impacts from such impairments (due to reduced depreciation or amortisation expense) are not taken into account
• The impairments and disposals which will be removed from opening capital employed from 2012 and onwards, on a post-tax basis, are:
– Pebble loss on exit
– Michiquillay impairment
– Barro Alto furnace write-down consequent on the rebuild of both furnaces (not the impairment)
– Khomanani, Khuseleka 2 and Union Mine North declines, plus 2012 Platinum project asset scrappings
– Isibonelo and Kleinkopje impairments.
The 2014 attributable EBIT of $3,429 million is the underlying EBIT attributable to equity shareholders of Anglo American plc.
Reconciliation of total capital employed to average attributable capital employedUS$ billion 2014 2013 2012Net assets 32 37 44Less: financial asset investments (1) (2) (2)Add: net debt 13 11 9Less: De Beers fair value adjustment on 45% pre-existing stake(1) (1) (1) (2)Total capital employed 43 45 48Less: Impairments taken in 2013 that had been announced before 10 December 2013(2) – – (1)Add: 2013 impairments where no benefit taken for attributable ROCE purposes(3) 1 1 –2014 impairments where no benefit taken for attributable ROCE purposes(4) 4 – –Total capital employed 47 46 46Less: non-controlling interest capital employed (6) (6) (7)Closing attributable capital employed 41 40 40Average attributable capital employed 40 40 38
(1) Removal of the accounting fair value uplift adjustment on the Group’s pre-existing 45% holding following acquisition of control on 16 August 2012.(2) 2013 impairments and disposals (post-tax) reducing capital employed: Barro Alto furnace ($0.2 billion), Platinum portfolio review ($0.3 billion), Michiquillay ($0.3 billion), Isibonelo and
Kleinkopje ($0.2 billion), disposal of Amapá ($0.2 billion) and exit from Pebble ($0.3 billion).(3) 2013 impairments (post-tax) not removed from capital employed: Barro Alto impairment ($0.5 billion) and Foxleigh ($0.2 billion).(4) 2014 impairments (post-tax) not removed from capital employed: Minas-Rio ($3.5 billion) and Coal impairments ($0.3 billion).

OTHER INFORMATION
204 Anglo American plc Annual Report 2014
OTHER INFORMATION
The figures below include the entire output of consolidated entities and the Group’s attributable share of joint operations, associates and joint ventures where applicable, except for Collahuasi in the Copper segment and De Beers’ joint ventures which are quoted on a 100% basis.
2014 2013Iron Ore and Manganese (tonnes)Kumba Iron OreLump 31,268,800 27,086,600Fines 16,927,700 15,286,500Total Kumba production 48,196,500 42,373,100Sishen 35,540,600 30,938,500Kolomela 11,568,100 10,808,700Thabazimbi 1,087,800 625,900Total Kumba production 48,196,500 42,373,100Kumba sales volumeRSA export iron ore 40,467,700 39,076,000RSA domestic iron ore 4,819,800 4,631,400Minas-RioPellet feed (wmt) 687,700 –Minas-Rio sales volumesExport – pellet feed (wmt) 239,600 –SamancorManganese ore(1) 3,308,600 3,301,700Manganese alloys(1)(2) 286,100 251,100Samancor sales volumeManganese ore 3,382,100 3,262,100Manganese alloys 294,800 248,700
Coal (tonnes)AustraliaMetallurgical – Export Coking 13,442,300 11,711,600Metallurgical – Export PCI 5,990,800 5,260,200Production total 19,433,100 16,971,800Thermal – Export 5,173,900 6,264,000Thermal – Domestic 7,114,600 6,239,400Production total 12,288,500 12,503,400CanadaMetallurgical – Export Coking 1,393,600 1,663,800Metallurgical – Export PCI 79,000 20,000Production total 1,472,600 1,683,800South AfricaThermal – Export 18,213,100 17,031,300Thermal – Domestic (Eskom) 30,988,500 33,567,400Thermal – Domestic (Non-Eskom) 6,594,900 5,992,000Production total 55,796,500 56,590,700Colombia Thermal – Export 11,227,000 11,001,000Production total 11,227,000 11,001,000Total Metallurgical coal production 20,905,700 18,655,600Total Export Thermal coal production 34,614,000 34,296,300Total Domestic Thermal coal production 44,698,000 45,798,800Total Coal production 100,217,700 98,750,700Weighted average achieved US$/t FOB pricesAustralia and CanadaMetallurgical – Export(3) 111 140Thermal – Export 72 84Thermal – Domestic 35 39South AfricaThermal – Export 70 77Thermal – Domestic 19 19ColombiaThermal – Export 67 73Sales volumesAustralia and CanadaMetallurgical – Export(4) 20,568,200 19,044,500Thermal – Export 5,966,200 6,371,600Thermal – Domestic 7,293,100 6,125,400South AfricaThermal – Export 17,572,800 17,501,800Thermal – Domestic 37,217,300 39,044,100ColombiaThermal – Export 11,314,000 11,152,000
(1) Saleable production.(2) Production includes medium carbon ferro-manganese.(3) Within export coking and export PCI coals there are different grades of coal with different weighted average prices compared to benchmark.(4) Includes both hard coking coal and PCI sales volumes.
PRODUCTION STATISTICS

OTHER INFORMATION
Anglo American plc Annual Report 2014 205
Other inform
ation
OTHER INFORMATION PRODUCTION STATISTICS
2014 2013Coal (tonnes) (continued)Coal by mine (tonnes)AustraliaCallide 7,557,000 6,317,800Capcoal (incl. Grasstree) 7,642,800 6,061,400Dawson 4,240,200 3,985,700Drayton 3,104,800 3,710,700Foxleigh 2,034,500 1,966,600Jellinbah 2,923,700 2,516,500Moranbah North 4,218,600 4,916,500Production total 31,721,600 29,475,200CanadaPeace River Coal 1,472,600 1,683,800Production total 1,472,600 1,683,800South AfricaGoedehoop 4,771,600 4,680,800Greenside 3,624,100 3,269,500Isibonelo 5,262,600 5,066,800Kleinkopje 3,911,800 3,997,200Kriel 6,878,100 8,102,700Landau 4,178,400 4,084,000Mafube 1,675,400 1,825,400New Denmark 3,767,900 3,586,900New Vaal 16,672,800 17,105,700Zibulo 5,053,800 4,871,700Production total 55,796,500 56,590,700Colombia Carbones del Cerrejón 11,227,000 11,001,000Production total 11,227,000 11,001,000 Total Coal production 100,217,700 98,750,700
Copper (tonnes) on a contained metal basis unless stated otherwise(1)
Collahuasi 100% basis (Anglo American share 44%)Ore mined 65,845,300 80,955,500Ore processed – Oxide 6,657,500 7,028,900Ore processed – Sulphide 48,936,100 47,559,000Ore grade processed – Oxide (% ASCu)(2) 0.72 0.81Ore grade processed – Sulphide (% TCu)(3) 1.08 1.07Production – Copper cathode 25,000 28,400Production – Copper in concentrate 445,400 416,100Total copper production for Collahuasi 470,400 444,500Anglo American’s share of copper production for Collahuasi(4) 207,000 195,600Anglo American Sur Los Bronces mine(5) Ore mined 57,666,200 56,938,200Marginal ore mined 26,236,100 17,221,300Ore processed – Sulphide 54,147,700 51,960,500Ore grade processed – Sulphide (% TCu) 0.78 0.83Production – Copper cathode 36,200 37,800Production – Copper in sulphate – 600Production – Copper in concentrate 368,300 378,000Production total 404,500 416,400El Soldado mine(5)
Ore mined 3,118,400 8,576,700Ore processed – Sulphide 7,203,600 7,312,500Ore grade processed – Sulphide (% TCu) 0.58 0.88Production – Copper cathode 1,200 1,200Production – Copper in concentrate 31,200 50,400Production total 32,400 51,600Chagres Smelter(5)
Ore smelted 132,100 149,800Production 128,500 145,200Total copper production for Anglo American Sur 436,900 468,000
(1) Excludes Anglo American Platinum’s copper production.(2) ASCu = acid soluble copper.(3) TCu = total copper.(4) Anglo American’s share of Collahuasi production is 44%.(5) Anglo American ownership interest of Anglo American Sur is 50.1%. Production is stated at 100% as Anglo American consolidates Anglo American Sur.

OTHER INFORMATION
206 Anglo American plc Annual Report 2014
OTHER INFORMATION PRODUCTION STATISTICS
2014 2013Copper (tonnes) (continued)Anglo American NorteMantos Blancos mineOre processed – Sulphide 4,402,400 4,329,600Ore grade processed – Sulphide (% TCu) 0.69 0.73Production – Copper cathode 26,700 29,500Production – Copper in concentrate 25,700 25,100Production total 52,400 54,600Mantoverde mine Ore processed – Oxide 10,312,800 10,385,200Ore processed – Marginal ore 8,646,100 8,280,400Ore grade processed – Oxide (% ASCu) 0.48 0.57Ore grade processed – Marginal ore (% ASCu) 0.23 0.25Production – Copper cathode 51,800 56,800Total copper production for Anglo American Norte 104,200 111,400Total Copper segment copper production 1,011,500 1,023,900Total Attributable copper production(1) 748,100 775,000Total Attributable payable copper production 725,900 752,100Attributable sales volumes 755,100 768,200Total Attributable payable sales volumes 732,600 745,400
Nickel (tonnes) unless stated otherwise(2)
Barro AltoOre mined 2,510,400 1,998,900 Ore processed 1,827,400 1,616,300 Ore grade processed – %Ni 1.81 1.82 Production 28,300 25,100 Codemin Ore mined 6,800 6,800 Ore processed 593,600 602,400 Ore grade processed – %Ni 1.67 1.71Production 8,900 9,300 Total Nickel segment nickel production 37,200 34,400 Sales volumes 36,100 33,800
Niobium (tonnes) unless otherwise statedOre mined 985,900 1,228,800Ore processed 1,084,000 963,100Ore grade processed – %Nb 1.04 1.17Production 4,700 4,500Sales volumes 4,600 4,700
Phosphates (tonnes) unless otherwise statedConcentrate 1,415,700 1,406,300Concentrate grade – %P2O5 37.0 37.2Phosphoric acid 295,000 317,100Fertiliser(3) 1,112,500 1,199,000High analysis fertiliser 184,700 209,400Low analysis fertiliser 927,700 989,700Dicalcium phosphate (DCP) 164,100 159,600Fertiliser sales volumes 1,096,600 1,163,300
PlatinumRefined productionPlatinum (troy oz) 1,889,500 2,379,500Palladium (troy oz) 1,225,400 1,380,800Rhodium (troy oz) 229,400 294,700Copper refined (tonnes)(4) 12,500 8,300Copper matte (tonnes)(4) 6,200 5,800Nickel refined (tonnes)(4) 20,500 16,800Nickel matte (tonnes)(4) 7,700 5,800Gold (troy oz) 95,600 100,000Equivalent refinedPlatinum (troy oz) 1,841,900 2,320,4004E built-up head grade (g/tonne milled)(5) 3.00 3.26
(1) Difference between total copper production and attributable copper production arises from Anglo American’s 44% interest in Collahuasi.(2) Excludes Anglo American Platinum’s nickel production.(3) 2013 fertiliser includes updated production quantification methodology in the acidulation plant at Cubatão.(4) Nickel and copper refined through third parties is now shown as production of nickel matte and copper matte. Nickel and copper matte, per the table, reflect matte sold to a third party in Q2 2013
from 2012 and 2013 production stockpiles.(5) 4E: the grade measured as the combined content of the four most valuable precious metals: platinum, palladium, rhodium and gold.
PRODUCTION STATISTICS

Anglo American plc Annual Report 2014 207
Other inform
ation
OTHER INFORMATION PRODUCTION STATISTICS
2014 2013De BeersCarats recovered 100% basisOrapa 12,074,000 11,375,000Letlhakane 548,000 682,000Damtshaa 303,000 264,000Jwaneng 11,312,000 10,386,000Debswana 24,237,000 22,707,000Namdeb 613,000 602,000Debmarine Namibia 1,273,000 1,160,000Namdeb Holdings 1,886,000 1,762,000Kimberley 722,000 815,000Venetia 3,201,000 3,192,000Voorspoed 711,000 717,000DBCM 4,634,000 4,724,000Snap Lake 1,201,000 1,312,000Victor 647,000 654,000De Beers Canada 1,848,000 1,966,000Total carats recovered 32,605,000 31,159,000

OTHER INFORMATION
208 Anglo American plc Annual Report 2014
Quarter ended % Change (Quarter ended)31 December
201430 September
201430 June
201431 March
201431 December
201331 December 2014 v 30 September 2014
31 December 2014 v 31 December 2013
Iron Ore and Manganese (tonnes)Iron ore – Kumba 12,431,600 12,972,100 11,465,000 11,327,800 11,285,700 (4)% 10%Iron ore – Minas-Rio 687,700 – – – – nm nmManganese ore(1) 882,100 866,000 868,300 692,200 846,000 2% 4%Manganese alloys(1)(2) 80,400 68,400 72,500 64,800 66,200 18% 21%
Coal (tonnes)Australia Metallurgical – Export 4,760,200 4,690,100 4,359,500 5,623,300 4,375,800 1% 9%Thermal – Export 1,871,600 1,574,600 958,400 769,300 1,584,700 19% 18%Thermal – Domestic 1,966,300 2,074,400 1,846,000 1,227,900 1,688,800 (5)% 16%CanadaMetallurgical – Export 171,400 400,000 471,200 430,000 357,600 (57)% (52)%South AfricaThermal – Export 4,782,800 5,007,600 4,273,600 4,149,100 4,602,000 (4)% 4%Thermal – Domestic (Eskom) 7,434,600 8,000,200 8,146,800 7,406,900 7,617,800 (7)% (2)%Thermal – Domestic (Non-Eskom) 1,761,400 1,862,800 1,611,200 1,359,500 1,234,100 (5)% 43%ColombiaThermal – Export 3,002,300 2,368,800 2,907,700 2,948,200 3,290,300 27% (9)%
Copper (tonnes)(3)(4) 174,800 176,900 194,400 202,000 214,300 (1)% (18)%
Nickel (tonnes)(5) 6,700 10,700 10,600 9,200 10,200 (37)% (34)%
Niobium (tonnes) 1,300 1,200 1,100 1,100 1,200 8% 8%
Phosphates (tonnes)Concentrate 355,600 362,700 349,500 347,900 353,400 (2)% 1%Phosphoric Acid 78,600 81,300 81,300 53,800 78,000 (3)% 1%Fertiliser 284,900 284,700 275,700 267,200 299,000 0% (5)%Dicalcium phosphate (DCP) 44,800 44,100 43,600 31,600 38,700 2% 16%
PlatinumPlatinum (troy oz) 573,700 460,000 420,600 435,200 692,100 25% (17)%Palladium (troy oz) 357,700 316,400 294,600 256,700 428,200 13% (16)%Rhodium (troy oz) 71,700 48,400 48,700 60,600 83,500 48% (14)%Copper refined (tonnes) 2,600 2,800 3,900 3,200 1,800 (7)% 44%Copper matte (tonnes) 1,400 1,300 2,300 1,200 1,400 8% 0%Nickel refined (tonnes) 4,800 5,200 5,600 4,900 5,200 (8)% (8)%Nickel matte (tonnes) 1,800 1,800 2,700 1,400 100 0% 1,700%Gold (troy oz) 28,900 14,600 26,700 25,400 26,700 98% 8%Equivalent refined platinum (troy oz) 593,900 532,800 358,200 357,000 520,300 11% 14%
De Beers (diamonds recovered – carats)100% basisDiamonds 8,366,000 8,193,000 8,515,000 7,531,000 9,132,000 2% (8)%
(1) Saleable production. (2) Production includes medium carbon ferro-manganese.(3) Excludes Anglo American Platinum’s copper production.(4) Copper segment attributable production.(5) Excludes Anglo American Platinum’s nickel production.
QUARTERLY PRODUCTION STATISTICS

OTHER INFORMATION
Anglo American plc Annual Report 2014 209
Other inform
ation
NON-FINANCIAL DATA
2014 2013 2012 2011 2010Safety(1)
Work-related fatalities 6 15 13 17 15Fatal-injury frequency rate (FIFR)(3) 0.003 0.008 0.007 0.009 0.008Total recordable case frequency rate (TRCFR)(3) 0.81 1.08 1.29 2.01 1.44Lost time injury frequency rate (LTIFR)(3) 0.35 0.49 0.58 0.64 0.64Occupational health(1)
New cases of occupational disease (NCOD)(3) 175 209 174 197 268Occupational disease incidence rate (per 200,000 hours) (ODIR) 0.175 0.217 0.185 0.205 0.284Environment(1)
Total CO2 emissions (Mt CO2e) 17 17 18 19 20Total energy consumed (million GJ)(3) 108 106 113 102 100Total new water consumed (million m3)(3) 195 201 156 124 125Human Resources(1)(4)
Women in management (%)(5) 24 23 23 22 21Historically Disadvantaged South Africans in management (%)(6) 60 64 62 51 46Resignations (%)(7) 2.0 2.0 2.4 2.7 2.4Redundancies (%)(8) 0.9 4.1 0.6 1.4 2.1Dismissals (%)(9) 1.0 1.5 1.4 1.1 1.3Other reasons for leaving (%)(10) 1.9 2.7 2.4 0.3 2.8Social(1)
CSI spend (total in US$ million)(11) 136 127 146 129 112CSI spend (% of underlying EBIT)(11) 3 2 3 1 1Procurement: BEE spend (rand billion) 39.3 32.4 25.8 23.3 20.9Businesses supported through enterprise development initiatives 58,257 48,111 40,217 38,681 9,392Jobs created/maintained through enterprise development programmes 96,873 76,543 64,927 47,070 17,200
(1) The data includes wholly owned subsidiaries and joint ventures over which Anglo American has management control, and does not include independently managed operations such as Collahuasi, Carbones del Cerrejón and Samancor. De Beers data are included from September 2012. Divested businesses are included up until the point of divestment.
(2) 2013 data revised due to issue of certificate of presumed death for one previously unaccounted for individual.(3) See page 202 for definitions.(4) Excludes Other Mining and Industrial.(5) Women in management is the number of female managers as a percentage of all managers in the workforce excluding contractors.(6) Historically Disadvantaged South Africans in management is the percentage of managers at Anglo American in South Africa who are ‘Historically Disadvantaged South Africans’.(7) The number of people who resigned as a percentage of the total workforce excluding contractors.(8) The number of people who have been retrenched as a percentage of total workforce excluding contractors.(9) The number of people who have been dismissed or have resigned to avoid dismissal, as a percentage of total workforce excluding contractors.(10) The number of people who left for reasons other than those shown above, for example retirement, ill health and death, as a percentage of total workforce excluding contractors.(11) CSI spend is the sum of donations for charitable purposes and community investment (which includes cash and in-kind donations and staff time) as well as investments in commercial initiatives
with public benefit (such as enterprise development). Included within the CSI expenditure figure for 2014 is expenditure relating to Zimele ($10.1 million) and social programmes delivered as part of Iron Ore Brazil’s licensing conditions ($3.5 million). These items were not included in previous years.
(12) Subsequent to the publication of the 2013 Annual Report, the provisional BEE spend figure for 2013 provided at the time of publication was revised from ZAR 37.6 billion to ZAR 32.4 billion following the validation process. The final figure of ZAR 32.4 billion was declared in the Transformation Report to the South African Government published in June 2014.
(2)
(12)

OTHER INFORMATION
210 Anglo American plc Annual Report 2014
THE BUSINESS – AN OVERVIEWas at 31 December 2014
Iron Ore and Manganese
Kumba Iron Ore (South Africa) 69.7%Sishen Iron Ore Company(1) 73.9%Minas-Rio (Brazil) 100%Ferroport (Brazil)(2) 50%Samancor (South Africa and Australia) 40%
Coal Overall ownership: 100%
100% owned Other interestsAustralia AustraliaCallide Capcoal 70%Grosvenor Dartbrook 83.3%Monash Energy Holdings Ltd Dawson 51%
Drayton 88.2%Canada Foxleigh 70%Peace River Coal Moranbah North 88%
Jellinbah 23.3%South AfricaGoedehoop Australia – otherGreenside Dalrymple Bay Coal Terminal Pty Ltd 25.4%Isibonelo Newcastle Coal Shippers Pty Ltd 17.6%Kleinkopje MBD Energy Ltd 19.2%LandauNew Denmark South AfricaNew Vaal Mafube 50%
Phola plant 50%Kriel(3) 73%Zibulo(3) 73%
South Africa – otherRichards Bay Coal Terminal 23.2%
ColombiaCarbones del Cerrejón 33.3%
Copper Overall ownership: 100%
100% owned Other interestsChile ChileMantos Blancos(4) Chagres 50.1%Mantoverde(4) El Soldado 50.1%
Los Bronces 50.1%Collahuasi 44%
PeruQuellaveco 81.9%
Nickel Overall ownership: 100%
100% ownedBrazilCodeminBarro Alto
Niobium Overall ownership: 100%
100% ownedBrazilAnglo American Nióbio Brasil Limitada
Phosphates Overall ownership: 100%
100% ownedBrazilAnglo American Fosfatos Brasil Limitada
(1) The 73.9% interest in Sishen Iron Ore Company (SIOC) is held indirectly through Kumba Iron Ore, in which the Group has a 69.7% interest. A further 3.1% interest in SIOC is held by the Kumba Envision Trust for the benefit of participants in Kumba’s broad based employee share scheme for non-managerial Historically Disadvantaged South African employees. The Trust meets the definition of a subsidiary under IFRS, and is therefore consolidated by Kumba Iron Ore. Consequently the effective interest in SIOC included in the Group’s results is 53.7%.
(2) Ferroport owns and operates the iron ore handling and shipping facilities at the port of Açu which is currently under construction (formerly referred to as LLX Minas-Rio).(3) Kriel and Zibulo form part of the Anglo American Inyosi Coal Black Economic Empowerment (BEE) company of which Anglo American owns 73%.(4) Non-controlling interest of 0.018%.

Anglo American plc Annual Report 2014 211
Other inform
ation
OTHER INFORMATION THE BUSINESS – AN OVERVIEW
Platinum Overall ownership: 78%(1)
100% owned Other interestsSouth Africa South AfricaBathopele Mine Union Section 85%Thembelani Mine Masa Chrome Company 50.1%Siphumelele MineTumela Mine Joint operations or sharing agreementsDishaba Mine Modikwa Platinum Joint Operation 50%Mogalakwena Mine Kroondal Pooling and Sharing Agreement 50%Western Limb Tailings Retreatment Mototolo Joint Operation 50%Waterval Smelter (including converting process)Mortimer Smelter AssociatesPolokwane Smelter Bokoni 49%Rustenburg Base Metals Refinery Pandora 42.5%Precious Metals Refinery Bafokeng-Rasimone 33%Twickenham Mine Atlatsa Resources Corporation 23%
Johnson Matthey Fuel Cells 17.5%ZimbabweUnki Mine South Africa – other
Wesizwe Platinum Limited 13%Royal Bafokeng Platinum Limited 11.6%
De Beers Overall ownership: 85%
100% owned Other interestsSouth AfricaDe Beers Consolidated Mines(2) 74%
VenetiaVoorspoedKimberleyDe Beers Sightholder Sales South Africa
BotswanaDebswana(4) 50%
DamtshaaJwanengOrapaLetlhakane
CanadaDe Beers Canada
Gahcho Kué 51%
NamibiaNamdeb Holdings(3) 50%
Namdeb Diamond CorporationMining Area 1Orange RiverElizabeth BayAlluvial Contractors
Debmarine NamibiaAtlantic 1
SalesDTC Botswana 50%Namibia DTC 50%
Synthetic Diamond SupermaterialsElement Six Abrasives 60%
BrandsDe Beers Diamond Jewellers 50%
CanadaDe Beers Canada
Snap LakeVictor
SalesDe Beers Global Sightholder SalesAuction Sales
BrandsForevermark
South AfricaDe Beers Group Services (Exploration and Services)De Beers Marine
Synthetic Diamond SupermaterialsElement Six Technologies
Corporate and other
100% owned Other interestsVergelegen (South Africa) Aggregates and building materials
Lafarge Tarmac Holdings Limited 50%Tarmac Middle East 50%Exxaro Resources (southern Africa and Australia) 9.8%
(1) The Group’s effective interest in Anglo American Platinum is 79.8%, which includes shares issued as part of a community empowerment deal.(2) The 74% interest in De Beers Consolidated Mines (DBCM) is held indirectly through De Beers Société Anonyme (De Beers). The 74% interest represents De Beers’ legal ownership share in
DBCM. For accounting purposes De Beers consolidates 100% of DBCM as it is deemed to control the BEE entity which holds the remaining 26%. The Group’s effective interest in DBCM is 85%.(3) The 50% interest in Namdeb Holdings is held indirectly through De Beers. In November 2011 the Government of the Republic of Namibia and De Beers restructured their mining partnership,
creating a 50:50 holding company, Namdeb Holdings (Pty) Limited, with full ownership of Namdeb Diamond Corporation (Pty) Limited and De Beers Marine Namibia (Pty) Limited (now trading as Debmarine Namibia). All mining licences were transferred to the newly formed company. The Group’s effective interest in Namdeb Holdings is 42.5%.
(4) The 50% interest in Debswana is held indirectly through De Beers. The Group’s effective interest in Debswana is 16.3%.

212 Anglo American plc Annual Report 2014
OTHER INFORMATION
DIRECTORS’ REPORT
This section includes certain disclosures which are required by law to be included in the Directors’ Report.
In accordance with the Companies Act 2006, the following items have been reported in other sections of the Annual Report and are included in this Directors’ Report by reference:
• Details of the directors of the Company can be found on pages 66–68
• Directors’ interests in shares at 31 December 2014 and any changes thereafter can be found on page 103 of the Directors’ remuneration report
• Post-balance sheet events are set out in note 36 to the financial statements on page 153
• The Strategic Report on pages 2–64 gives a fair review of the business and an indication of likely future developments
• Details of the Group’s governance arrangements and its compliance with the Code can be found on pages 65–108
• Comprehensive details of the Group’s approach to financial risk management are given in Note 38 to the financial statements on page 155
• The Group’s disclosure of its greenhouse gas emissions can be found on page 35.
Going concernThe financial position of the Group, its cash flows, liquidity position and borrowing facilities are set out in the Group performance section on pages 18–21. In addition, detail is given on the Group’s policy on managing liquidity risk in the Risk section on pages 42–47, with further details of our policy on financial risk management being set out in note 38 to the financial statements. The Group’s net debt at 31 December 2014 was $12.9 billion (2013: $10.7 billion), representing a gearing level of 28.6% (2013: 22.2%). Details of borrowings and facilities are set out in note 24 and net debt is set out in note 23.
The directors have considered the Group’s cash flow forecasts for the period to the end of March 2016. The Board is satisfied that the Group’s forecasts and projections, taking account of reasonably possible changes in trading performance, show that the Group will be able to operate within the level of its current facilities for the foreseeable future. For this reason the Group continues to adopt the going concern basis in preparing its financial statements.
DividendsAn interim dividend of 32 US cents per ordinary share was paid on 18 September 2014. The directors are recommending that a final dividend of 53 US cents per ordinary share be paid on 28 April 2015 to ordinary shareholders on the register at the close of business on 20 March 2015, subject to shareholder approval at the AGM to be held on 23 April 2015. This would bring the total dividend in respect of 2014 to 85 US cents per ordinary share. In accordance with International Financial Reporting Standards (IFRS), the final dividend will be accounted for in the financial statements for the year ended 31 December 2015.
Share capitalThe Company’s issued share capital as at 31 December 2014, together with details of share allotments and issue of treasury shares during the year, is set out in note 32 on page 150.
The Company was authorised by shareholders at the AGM held on 24 April 2014, to purchase its own shares in the market. No shares were purchased under this authority during 2014. This authority will expire at the 2015 AGM and, in accordance with usual practice, a resolution to renew it for another year will be proposed.
Significant shareholdingsThe Company has been notified of the following significant shareholdings:
Company Number
of sharesPercentage
of voting rightsPublic Investment Corporation (PIC) 116,355,956 8.33Coronation Asset Management (Pty) Ltdat 12 February 2015 70,145,508 5.02(at 31 December 2014) 69,352,522 4.96Genesis Asset Managers, LLP 55,426,734 3.97Tarl Investment Holdings Limited(1) 47,275,613 3.38Epoch Two Investment Holdings Limited(1) 42,166,686 3.02
(1) Epoch Two Investment Holdings Ltd (Epoch 2) and Tarl Investment Holdings Limited (Tarl) are two of the independent companies that have purchased shares as part of Anglo American’s share buy-back programme. Epoch 2 and Tarl have waived their right to vote all the shares they hold, or will hold, in Anglo American plc.
Disclosure table pursuant to Listing Rule LR9.8.4CListing Rule Information to be included Disclosure9.8.4(1) Interest capitalised by the Group See note 7, page 1269.8.4(2) Unaudited financial information
(LR9.2.18)None
9.8.4(4) Long term incentive scheme only involving a director (LR9.4.3)
None
9.8.4(5) Directors’ waivers of emoluments See page 999.8.4(6) Directors’ waivers of future
emolumentsSee page 99
9.8.4(7) Non pro-rata allotments for cash (issuer)
Treasury Shares have been issued pursuant to the exercise of options awarded under shareholder-approved schemes
9.8.4(8) Non pro-rata allotments for cash (major subsidiaries)
None
9.8.4(9) Listed company is a subsidiary of another company
Not applicable
9.8.4(10) Contracts of significance involving a director
None
9.8.4(11) Contracts of significance involving a controlling shareholder
Not applicable
9.8.4(12) Waivers of dividends See note 32, page 1519.8.4(13) Waivers of future dividends See note 32, page 1519.8.4(14) Agreement with a controlling
shareholder LR9.2.2AR(2)(a)Not applicable
Sustainable developmentThe Sustainable Development Report 2014 will be published online on 16 March 2015. This report focuses on the safety, sustainable development, health and environmental performance of the Group’s managed operations, its performance with regard to the Company’s Good Citizenship Business Principles, and the operational dimensions of its social programmes.
Audit informationThe directors confirm that, so far as they are aware, there is no relevant audit information of which the auditors are unaware, and that all directors have taken all reasonable steps to make themselves aware of any relevant audit information and to establish that the auditors are aware of that information.
Employment and other policiesThe Group’s key operating businesses are empowered to manage within the context of the different legislative and social demands of the diverse countries in which those businesses operate, subject to the standards embodied in Anglo American’s Good Citizenship Business Principles. Within all the Group’s businesses, the safe and effective performance of employees and the maintenance of positive employee relations are of fundamental importance. Managers are charged with ensuring that the following key principles are upheld:
• adherence to national legal standards on employment and workplace rights at all times

Anglo American plc Annual Report 2014 213
Other inform
ation
OTHER INFORMATION DIRECTORS’ REPORT
• in addition, adherence to the International Labour Organisation’s core labour rights, including: prohibition of child labour; prohibition of inhumane treatment of employees and any form of forced labour, physical punishment or other abuse; recognition of the right of our employees to freedom of association and the promotion of workplace equality; and the elimination of all forms of unfair discrimination
• continual promotion of safe and healthy working practices
• provision of opportunities for employees to enhance their work related skills and capabilities
• adoption of fair and appropriate procedures for determining terms and conditions of employment.
It is our policy that people with disabilities should have full and fair consideration for all vacancies. Employment of disabled people is considered on merit and with regard only to the ability of any applicant to carry out the role. We endeavour to retain the employment of, and arrange suitable retraining for, any employees in the workforce who become disabled during their employment. Where possible we will adjust a person’s working environment to enable them to stay in our employment.
Further, the Group is committed to treating employees at all levels with respect and consideration, to investing in their development and to ensuring that their careers are not constrained by discrimination or arbitrary barriers.
The Good Citizenship Business Principles are supplemented by four Anglo American ‘Way’ documents, covering the safety, environmental, occupational health and social aspects of responsible operation and sustainable development. These set out specific standards for each of these subject areas, in line with international best practice.
Copies of the Good Citizenship Business Principles and the Anglo American ‘Way’ documents may be accessed on the Company’s website.
In addition, all Anglo American suppliers must commit to adhering to the requirements set out in the ‘Sustainable Development in Supply Chain Policy’, which is available on the Company’s website.
The Business Integrity Policy and its 11 Performance Standards support our anti-corruption commitment by making it clear that we will neither give, nor accept, bribes, nor permit others to do so in our name, either in our dealings with public officials or with our suppliers and customers. The Policy sets out the standards of conduct required at every level of Anglo American, including our subsidiaries, joint ventures and associates, in combating corrupt behaviour of all types. It also sets out the requirements of those with whom we do business and those who work on our behalf.
The Business Integrity Policy and Performance Standards have been translated into all the main languages that we use at our operations. Two dedicated business integrity managers, who operate within a broader risk management and business assurance team, oversee implementation of the policy by working with senior managers in our business units and corporate functions and assisting them to put in place adequate procedures for managing corruption risks (including extensive face-to-face training of employees in high-risk roles).
Our internal audit team provide assurance on anti-corruption controls on an annual basis and all stakeholders are able to confidentially report breaches, or potential breaches, of the Business Integrity Policy through our independently-managed Speak Up facility.
The Group has a social intranet called Eureka! which helps employees to connect, communicate and collaborate more effectively. In addition, the Company regularly publishes Optima (available on the Company’s website) and Our World, which contain items of news, current affairs and information relevant to Group employees.
Political donationsNo political donations were made during 2014. Anglo American has an established policy of not making donations to, or incurring expenses for the benefit of, any political party in any part of the world, including any political party or political organisation as defined in the Political Parties, Elections and Referendums Act 2000.
Additional information for shareholdersSet out below is a summary of certain provisions of the Company’s current Articles and applicable English law concerning companies (the Companies Act 2006 (the ‘Companies Act’)) required as a result of the implementation of the Takeovers Directive in English law. This is a summary only and the relevant provisions of the Articles or the Companies Act should be consulted if further information is required.
Dividends and distributionsSubject to the provisions of the Companies Act, the Company may, by ordinary resolution, from time to time declare dividends not exceeding the amount recommended by the Board. The Board may pay interim dividends whenever the financial position of the Company, in the opinion of the Board, justifies such payment.
The Board may withhold payment of all, or any part of any dividends or other monies payable in respect of the Company’s shares, from a person with a 0.25% interest or more (as defined in the Articles) if such a person has been served with a notice after failing to provide the Company with information concerning interests in those shares required to be provided under the Companies Act.
Rights and obligations attaching to sharesThe rights and obligations attaching to the ordinary and preference shares are set out in the Articles. The Articles may only be changed by a special resolution passed by the shareholders.
VotingSubject to the Articles generally and to any special rights or restrictions as to voting attached by or in accordance with the Articles to any class of shares, on a show of hands every member who is present in person at a general meeting shall have one vote and, on a poll, every member who is present in person or by proxy shall have one vote for every share of which he/she is the holder. It is, and has been for some years, the Company’s practice to hold a poll on every resolution at shareholder meetings.
Where shares are held by trustees/nominees in respect of the Group’s employee share plans and the voting rights attached to such shares are not directly exercisable by the employees, it is the Company’s practice that such rights are not exercised by the relevant trustee/nominee.
Under the Companies Act, members are entitled to appoint a proxy, who need not be a member of the Company, to exercise all or any of their rights to attend and to speak and vote on their behalf at a general meeting or class meeting. A member may appoint more than one proxy in relation to a general meeting or class meeting provided that each proxy is appointed to exercise the rights attached to a different share or shares held by that member. A member that is a corporation may appoint one or more individuals to act on its behalf at a general meeting or class meeting as a corporate representative. The debate around s323 of the Companies Act has been resolved so that where a shareholder appoints more than one corporate representative in respect of its shareholding, but in respect of different shares, those corporate representatives can act independently of each other, and validly vote in different ways.
Restrictions on votingNo member shall, unless the directors otherwise determine, be entitled in respect of any share held by him/her to vote either personally or by proxy at a shareholders’ meeting, or to exercise any other right conferred by membership in relation to shareholders’ meetings, if any call or other sum presently payable by him/her to the Company in respect of that share remains unpaid. In addition, no member shall be entitled to vote if he/she has been served with a notice after failing to provide the Company with information concerning interests in those shares required to be provided under the Companies Act.
Issue of sharesSubject to the provisions of the Companies Act relating to authority and pre-emption rights and of any resolution of the Company in a UK general meeting, all unissued shares of the Company shall be at the disposal of the directors and they may allot (with or without conferring a right of renunciation), grant options over, or otherwise dispose of them to such persons at such times, and on such terms, as they think proper.

214 Anglo American plc Annual Report 2014
OTHER INFORMATION DIRECTORS’ REPORT
Shares in uncertificated formDirectors may determine that any class of shares may be held in uncertificated form, and title to such shares may be transferred by means of a relevant system, or that shares of any class should cease to be so held and transferred. Subject to the provisions of the Companies Act, the CREST regulations and every other statute, statutory instrument, regulation or order for the time being in force concerning companies and affecting the Company (together, the Statutes), the directors may determine that any class of shares held on the branch register of members of the Company resident in South Africa, or any other overseas branch register of the members of the Company, may be held in uncertificated form in accordance with any system outside the UK that enables title to such shares to be evidenced and transferred without a written instrument and which is a relevant system. The provisions of the Articles shall not apply to shares of any class that are in uncertificated form to the extent that the Articles are inconsistent with the holding of shares of that class in uncertificated form, the transfer of title to shares of that class by means of a relevant system or any provision of the CREST regulations.
Deadlines for exercising voting rightsVotes are exercisable at a general meeting of the Company in respect of which the business being voted upon is being heard. Votes may be exercised in person, by proxy, or in relation to corporate members, by corporate representative. The Articles provide a deadline for submission of proxy forms of not less than 48 hours before the time appointed for the holding of the meeting or adjourned meeting.
Variation of rightsSubject to statute, the Articles specify that rights attached to any class of shares may be varied with the written consent of the holders of not less than three-quarters in nominal value of the issued shares of that class, or with the sanction of an extraordinary resolution passed at a separate general meeting of the holders of those shares. At every such separate general meeting the quorum shall be two persons holding, or representing by proxy, at least one-third in nominal value of the issued shares of the class (calculated excluding any shares held as treasury shares). The rights conferred upon the holders of any shares shall not, unless otherwise expressly provided in the rights attaching to those shares, be deemed to be varied by the creation or issue of further shares ranking pari passu with them.
Transfer of sharesAll transfers of shares that are in certificated form may be effected by transfer in writing in any usual or common form or in any other form acceptable to the directors and may be under hand only. The instrument of transfer shall be signed by, or on behalf of, the transferor and (except in the case of fully paid shares) by or on behalf of the transferee. The transferor shall remain the holder of the shares concerned until the name of the transferee is entered in the register of shareholders. All transfers of shares that are in uncertificated form may be effected by means of the CREST system.
The directors may decline to recognise any instrument of transfer relating to shares in certificated form unless it:
(a) is in respect of only one class of share; and
(b) is lodged at the transfer office (duly stamped if required) accompanied by the relevant share certificate(s) and such other evidence as the directors may reasonably require to show the right of the transferor to make the transfer (and, if the instrument of transfer is executed by some other person on his/her behalf, the authority of that person so to do).
The directors may, in the case of shares in certificated form, in their absolute discretion and without assigning any reason therefore, refuse to register any transfer of shares (not being fully paid shares) provided that, where any such shares are admitted to the Official List of the London Stock Exchange, such discretion may not be exercised in such a way as to prevent dealings in the shares of that class from taking place on an open and proper basis. The directors may also refuse to register an allotment or transfer of shares (whether fully paid or not) in favour of more than four persons jointly.
If the directors refuse to register an allotment or transfer, they shall send the refusal to the allottee or the transferee within two months after the date on which the letter of allotment or transfer was lodged with the Company.
A shareholder does not need to obtain the approval of the Company, or of other shareholders of shares in the Company, for a transfer of shares to take place.
DirectorsDirectors shall not be fewer than 10 nor more than 18 in number. A director is not required to hold any shares of the Company by way of qualification. The Company may by ordinary resolution increase or reduce the maximum or minimum number of directors.
Powers of directorsSubject to the Articles, the Companies Act and any directions given by special resolution, the business of the Company will be managed by the Board who may exercise all the powers of the Company.
The Board may exercise all the powers of the Company to borrow money and to mortgage or charge any of its undertaking, property and uncalled capital and to issue debentures and other securities, whether outright or as collateral security, for any debt, liability or obligation of the Company or of any third party.
The Company may by ordinary resolution declare dividends, but no dividend shall be payable in excess of the amount recommended by the directors. Subject to the provisions of the Articles and to the rights attaching to any shares, any dividends or other monies payable on or in respect of a share may be paid in such currency as the directors may determine. The directors may deduct from any dividend payable to any member all sums of money (if any) presently payable by him/her to the Company on account of calls or otherwise in relation to shares of the Company. The directors may retain any dividends payable on shares on which the Company has a lien, and may apply the same in or towards satisfaction of the debts, liabilities or engagements in respect of which the lien exists.
Appointment and replacement of directorsThe directors may from time to time appoint one or more directors.
The Board may appoint any person to be a director (so long as the total number of directors does not exceed the limit prescribed in the Articles). Any such director shall hold office only until the next AGM and shall then be eligible for election.
The Articles provide that at each AGM all those directors who have been in office for three years or more since their election, or last re-election, shall retire from office. In addition, a director may at any AGM retire from office and stand for re-election. However, in accordance with the Code, all directors will be subject to annual re-election.
Significant agreements: Change of controlAt 31 December 2014, Anglo American had committed bilateral and syndicated borrowing facilities totalling $11.0 billion with a number of relationship banks which contain change of control clauses. $6.2 billion of the Group’s bond issues also contain change of control provisions. In aggregate, this financing is considered significant to the Group and in the event of a takeover (change of control) of the Company, these contracts may be cancelled, become immediately payable or be subject to acceleration. In the ordinary course of its business the Group’s subsidiaries enter into a number of other commercial agreements, some of which would alter or terminate upon a change of control of the Company. None of these are considered by the Group to be significant to the Group as a whole.
Purchases of own sharesAt the AGM held on 24 April 2014, authority was given for the Company to purchase, in the market, up to 208.9 million Ordinary Shares of 5486⁄91 US cents each. The Company did not purchase any of its own shares under this authority during 2014.
IndemnitiesTo the extent permitted by law and the Articles, the Company has made qualifying third-party indemnity provisions for the benefit of its directors during the year, which remain in force at the date of this report. Copies of these indemnities are open for inspection at the Company’s registered office.
By order of the Board
John MillsCompany Secretary 12 February 2015

Anglo American plc Annual Report 2014 215
Other inform
ation
OTHER INFORMATION
Annual General MeetingWill be held at 14:30 on Thursday 23 April 2015, at The Queen Elizabeth II Conference Centre, Broad Sanctuary, Westminster, London SW1P 3EE.
Shareholding enquiriesEnquiries relating to shareholdings should be made to the Company’s UK Registrars, Equiniti, or the South African Transfer Secretaries, Link Market Services South Africa (Pty) Limited, at the relevant address below:
UK RegistrarsEquiniti Aspect House Spencer Road Lancing West Sussex BN99 6DA England
Telephone: In the UK: 0871 384 2026*From outside the UK: +44 121 415 7558
Transfer Secretaries in South AfricaLink Market Services South Africa (Pty) Limited 13th Floor, Rennie House 19 Ameshoff Street Braamfontein 2001, South Africa (PO Box 4844, Johannesburg, 2000) Telephone: +27 (0) 11 713 0800
Enquiries on other matters should be addressed to the Company Secretary at the following address:
Registered and Head OfficeAnglo American plc 20 Carlton House Terrace London SW1Y 5AN England
Telephone: +44 (0) 20 7968 8888 Fax: +44 (0) 20 7968 8500 Registered number: 3564138 www.angloamerican.com
On the Investors section of the Group website a whole range of useful information for shareholders can be found, including amongst other things:
– investor calendar – share price and tools – dividend information – AGM information – FAQs.* Calls to all 0871 numbers stated in this notice are charged at 8p per minute plus network
extras. Lines are open 08:30 to 17:30 Monday to Friday.
Electronic communicationShareholders may elect to receive, electronically, notification of the availability on the Company’s website of future shareholder correspondence e.g. Annual Reports and Accounts and Notices of AGMs.
By registering for this service, UK shareholders can also vote online in respect of future AGMs and access information on their shareholding including, for example, dividend payment history, sales and purchases and indicative share prices. In order to register for the services, UK shareholders should contact the UK registrars or log on to www.shareview.co.uk and follow the on-screen instructions. It will be necessary to have a shareholder reference number when registering, which is shown on share certificates, dividend tax vouchers and proxy cards. New UK shareholders also have the option to elect via their proxy card.
DividendsDividends are declared and paid in US dollars to shareholders with registered addresses in all countries except the UK, eurozone countries and South Africa where they are paid in sterling, euros and South African rand respectively. Shareholders outside South Africa may elect to receive their dividends in US dollars.
Shareholders with bank accounts in the UK or South Africa can have their cash dividends credited directly to their own accounts. Shareholders should contact the relevant registrar to make use of this facility. South African branch register shareholders would need South African exchange control approval to mandate their dividends to an account outside South Africa.
The Company operates a dividend reinvestment plan (DRIP), which enables shareholders to reinvest their cash dividends into purchasing Anglo American shares. Details of the DRIP and how to join are available from Anglo American’s UK Registrars and South African Transfer Secretaries and on the Company’s website.
ShareGiftThe Company supports ShareGift, the charity share donation scheme administered by The Orr Mackintosh Foundation (registered charity number 1052686). Through ShareGift, shareholders with very small numbers of shares which might be considered uneconomic to sell are able to donate them to charity. Donated shares are aggregated and sold by ShareGift, the proceeds being passed on to a wide range of charities. For those shareholders who wish to use ShareGift, transfer forms are available from the Registrars and further details of the scheme can be found on the website www.sharegift.org.
Share dealing serviceTelephone, internet and postal share dealing services have been arranged through Equiniti, providing a simple way for UK residents to buy or sell Anglo American shares. For telephone transactions call 0845 603 7037 during normal office hours and for internet dealing log on to www.shareview.co.uk/dealing. You will need your shareholder reference number, found on share certificates, dividend tax vouchers and proxy cards. For further details on the postal dealing service call 0871 384 2026* (or +44 121 415 7558 from overseas).
Unsolicited mailUnder the Companies Act, the Company is obliged to make the share register available upon request on payment of the appropriate fee. Because of this, some shareholders may receive unsolicited mail. If you wish to limit the receipt of addressed marketing mail you can register with the Mailing Preference Service (MPS). The quickest way to register with the MPS is via the website: www.mpsonline.org.uk. Alternatively you can register by telephone on: 020 7291 3310, or by email to: [email protected], or by writing to MPS Freepost LON20771, London W1E 0ZT.
SHAREHOLDER INFORMATION

OTHER INFORMATION
216 Anglo American plc Annual Report 2014
• Sustainable Development Report 2014 • Fact Book 2014 • Notice of 2015 AGM and Shareholder Information Booklet • Business Unit Sustainable Development Reports (2014) • Optima – Anglo American’s current affairs journal • Good Citizenship: Business Principles • The Environment Way • The Occupational Health Way • The Projects Way • The Safety Way • The Social Way • The People Development Way • www.facebook.com/angloamerican • www.twitter.com/angloamerican • www.linkedin.com/company/anglo-american • www.youtube.com/angloamerican • www.flickr.com/angloamerican • www.slideshare.com/angloamerican
The Company implemented electronic communications in 2008 in order to reduce the financial and environmental costs of producing the Annual Report. More information about this can be found in the attached Notice of AGM. In this regard we would encourage downloading of reports from our website.
Financial and sustainable development reports may be found at: www.angloamerican.com/reportingcentre
However, the 2014 Annual Report and the booklet containing the Notice of AGM and other shareholder information are available free of charge from the Company, its UK Registrars and the South African Transfer Secretaries.
If you would like to receive paper copies of Anglo American’s publications, please write to:
Investor RelationsAnglo American plc 20 Carlton House Terrace London SW1Y 5AN England
Alternatively, publications can be ordered online at: www.angloamerican.com/siteservices/requestreport
Charitable partnersThis is just a selection of the charities which Anglo American, Anglo American Chairman’s Fund and the Anglo American Group Foundation have worked with in 2014:
OTHER ANGLO AMERICAN PUBLICATIONS
Designed and produced by SALTERBAXTER MSLGROUP
This document is printed on Amadeus 50 Silk and Amadeus 100 Offset which has been independently certified according to the rules of the Forest Stewardship Council® (FSC). All the paper in this report is at least 50% recycled, with pages 65–216 being 100% recycled. The recycled fibre is bleached in a Process Chlorine Free (PCF) process and the virgin fibre is Elemental Chlorine Free (ECF) bleached.
Printed in the UK by Pureprint using its alcofree® and pureprint® environmental printing technology, and vegetable inks were used throughout. Pureprint is a CarbonNeutral® company.
Both manufacturing paper mill and the printer are registered to the Environmental Management System ISO 14001 and are Forest Stewardship Council® (FSC) chain-of-custody certified.

Anglo American plc20 Carlton House TerraceLondon SW1Y 5ANEngland
Tel +44 (0)20 7968 8888Fax +44 (0)20 7968 8500Registered number 3564138
www.angloamerican.com
Find us on FacebookFollow us on Twitter
AN
GLO
AM
ERIC
AN
PLC
AN
NU
AL R
EPO
RT 2014