
Stronger Smarter Institute Research & Impact Footprinting Full ...
Upload
khangminh22Category
view
0download
0
Wide-Area Awareness: Smarter Power Grid Monitoring and Analysis
Galina Antonova
ABB Inc., Canada
Sergiu Paduraru
ABB AB, Sweden
Jorge Naccarino
Ventyx, an ABB company
Elmo Price
ABB Inc., USA
Abstract
Wide-Area Awareness has been identified as one of the priority action areas for the US Smart Grid developments. The National Institute of Standards and Technology, NIST, was assigned by the US Department of Energy, DoE, to drive Smart Grid developments and harmonization efforts in the power industry.
Wide-Area Monitoring and Analysis Systems that use Synchrophasor measurements are undergoing a rapid development cycle to address a new wave of industry requirements. The power industry is becoming very involved with these initiatives at all levels. Standards development bodies are revising standards at record speeds. Utilities are launching pilot projects, supported by stimulus funds, for the initial proof-of-concept testing that will be followed by larger system installations. Equipment and system vendors are working closely with standards developers and utilities to add features not yet standardized into their products. Consultants and researchers are trying to figure out how these new concepts will fit together, and provide the necessary support and guidance.
This paper outlines current research and standardization activities in the area of Synchrophasors and Wide-Area Monitoring Systems. It covers the basic technology, existing and potential future applications, including wide-area protection and control. Special attention is given to new time synchronization mechanisms, such as IEEE 1588 power profile. Known standardization gaps, testing and interoperability challenges are also discussed.
I. Introduction
Why Synchrophasors
Consider the ability to measure the voltage magnitude and phase angle at every system bus and current magnitude and phase angle at every branch (lines, transformers and other series elements) in the power system network simultaneously and continuously and having them instantly available where we need them when we need them. System load distribution is directly measurable allowing maximum safe load transfer, the system branch, load and shunt impedances are directly verifiable to validate system models, an accurate system state for anticipated contingencies can instantly be computed and prepared for, abnormalities are readily identifiable and solutions promptly implemented and more. Further, having secure access to this data at all hierarchical levels of the power system grid, i.e. in the substation, utility regional centers, utility operations centers, Independent System Operator (ISO) centers, and even at national or continental grids, where data can be acted upon accordingly in real time or manually and archived for future planning or event analysis. Such capabilities bring reliable and efficient power delivery. Considering the advancements in communication networks (Ethernet) and synchrophasor technology, this goal is very nearly reachable.
Vision
Today, power system protection and control is divided into two segments as shown in Figure 1, unit protection and Supervisory Control and Data Acquisition (SCADA). The protection of individual equipment such as a line, bus, transformer, etc. is referred to as unit protection. Unit protection responds fast to faults within the unit’s protection zone isolating the fault from the system from 0.01s to 0.1s or more. Inability to clear the fault may precipitate a system instability condition that requires further action locally by the protection or remotely by SCADA/Energy Management System (EMS). Such situations have occurred that could not be controlled locally by protection or remotely by SCADA/EMS leading to an
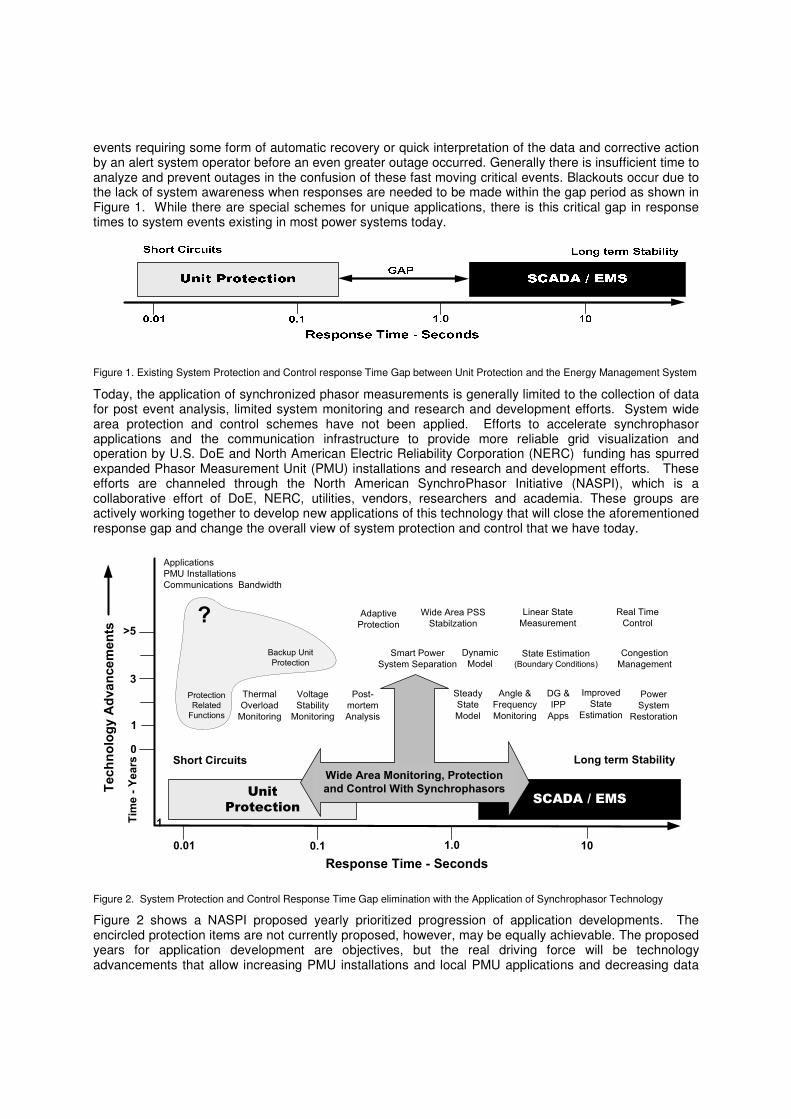
events requiring some form of automatic recovery or quick interpretation of the data and corrective action by an alert system operator before an even greater outage occurred. Generally there is insufficient time to analyze and prevent outages in the confusion of these fast moving critical events. Blackouts occur due to the lack of system awareness when responses are needed to be made within the gap period as shown in Figure 1. While there are special schemes for unique applications, there is this critical gap in response times to system events existing in most power systems today.
Figure 1. Existing System Protection and Control response Time Gap between Unit Protection and the Energy Management System
Today, the application of synchronized phasor measurements is generally limited to the collection of data for post event analysis, limited system monitoring and research and development efforts. System wide area protection and control schemes have not been applied. Efforts to accelerate synchrophasor applications and the communication infrastructure to provide more reliable grid visualization and operation by U.S. DoE and North American Electric Reliability Corporation (NERC) funding has spurred expanded Phasor Measurement Unit (PMU) installations and research and development efforts. These efforts are channeled through the North American SynchroPhasor Initiative (NASPI), which is a collaborative effort of DoE, NERC, utilities, vendors, researchers and academia. These groups are actively working together to develop new applications of this technology that will close the aforementioned response gap and change the overall view of system protection and control that we have today.
���� ��� ��� ��
��������� �� ������
�����
���������� � ������
������������� ������ ���������
��������������� ���
����������
�� ����������
���������������������
�������
���������
��������
������
������
���������
�������
!"�������
��������
#�������
���$������
��������
���%
�������
�����
�����"���
������
&�������
'(���
����
���
�������
������
�����
������&��������)���������������*
������������
���������������
'������
�������������
��������
+ �������������
���$��,����
����� ����
������
-�����������
���������������"��
���������
���.��� ���
���������
�
����������
��������
������
�������!�������"#��������
�������� ����������������
�
$%
�
�
&
�� ��'����
�
Figure 2. System Protection and Control Response Time Gap elimination with the Application of Synchrophasor Technology
Figure 2 shows a NASPI proposed yearly prioritized progression of application developments. The encircled protection items are not currently proposed, however, may be equally achievable. The proposed years for application development are objectives, but the real driving force will be technology advancements that allow increasing PMU installations and local PMU applications and decreasing data
latency over the communications network (increasing bandwidth). With the emergence of the applications identified in Figure 2 it is not unreasonable to expect that the use of synchrophasor data will expand to ultimately be the fundamental data used for energy management at all levels. It will also provide opportunities for different concepts for unit protection, particularly backup protection and system functions like power swing trip blocking, out-of-step tripping and load shedding.
II. Technology Overview
What is a Synchrophasor?
A synchrophasor is defined as a phasor that is calculated from “time-tagged” data samples of a power system sinusoidal voltage or current using a standard time signal as the reference for the measurement. However, before elaborating on this definition a simple discussion of a phasor is provided.
Phasor
First, consider a vector as applied to basic power system analysis. A vector is used to represent fixed complex quantities such as impedances that have real and reactive (imaginary) components. They are represented either by Cartesian (rectangular) coordinates, e.g. Z = R + jX, or with polar representation ZLθ (also in exponential form Zejθ) where Z = (R2 + X2)1/2 and θ = tan-1(X/R). They are fixed complex numbers and their magnitude and angle do not change.
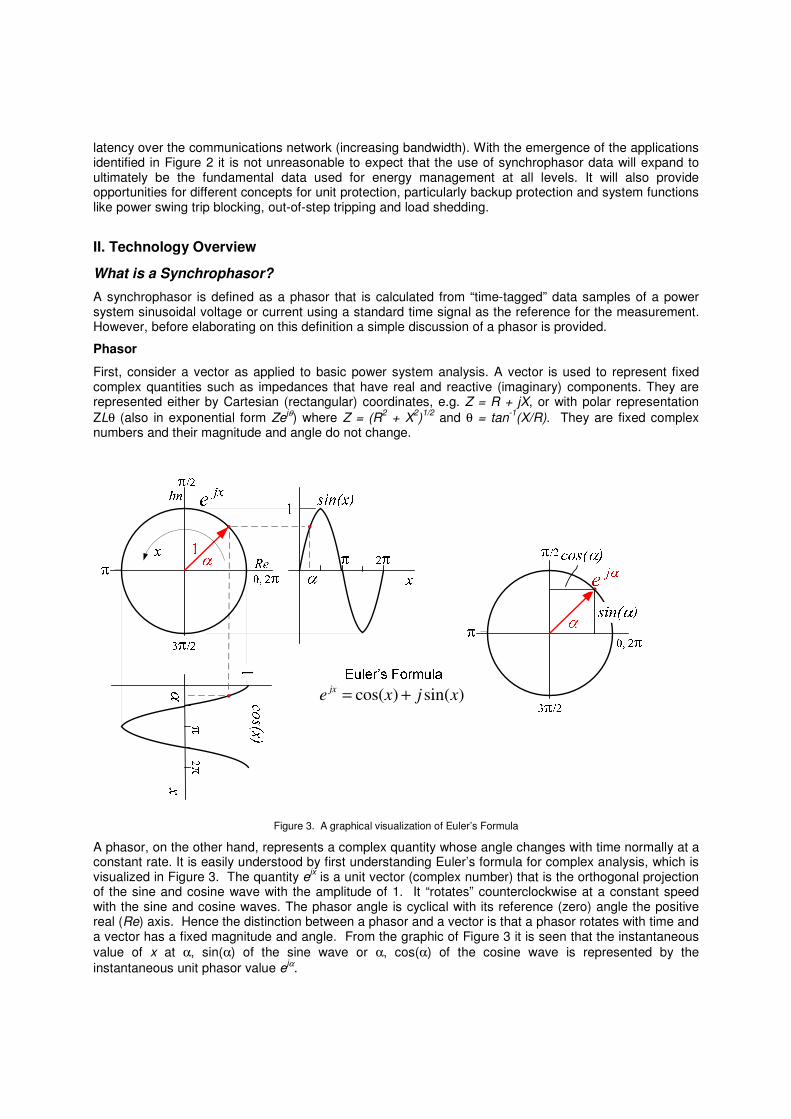
)sin()cos( xjxe jx +=
Figure 3. A graphical visualization of Euler’s Formula
A phasor, on the other hand, represents a complex quantity whose angle changes with time normally at a constant rate. It is easily understood by first understanding Euler’s formula for complex analysis, which is visualized in Figure 3. The quantity ejx is a unit vector (complex number) that is the orthogonal projection of the sine and cosine wave with the amplitude of 1. It “rotates” counterclockwise at a constant speed with the sine and cosine waves. The phasor angle is cyclical with its reference (zero) angle the positive real (Re) axis. Hence the distinction between a phasor and a vector is that a phasor rotates with time and a vector has a fixed magnitude and angle. From the graphic of Figure 3 it is seen that the instantaneous value of x at α, sin(α) of the sine wave or α, cos(α) of the cosine wave is represented by the instantaneous unit phasor value ejα.
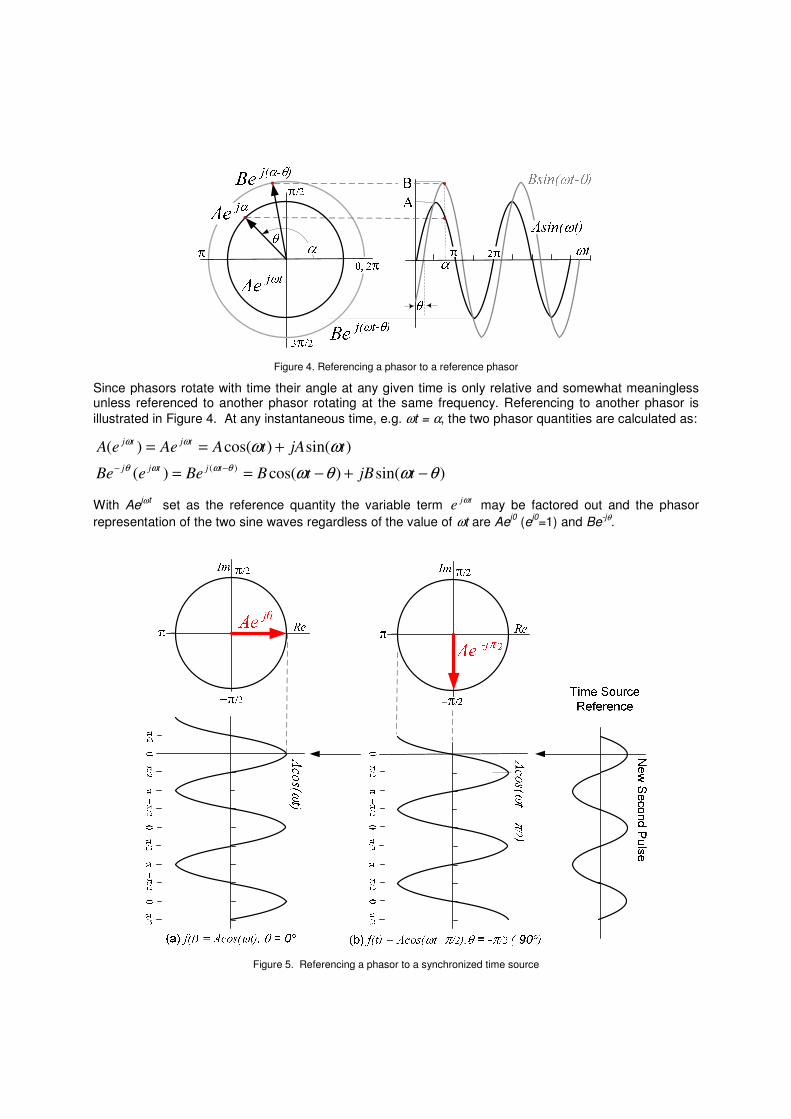
Figure 4. Referencing a phasor to a reference phasor
Since phasors rotate with time their angle at any given time is only relative and somewhat meaningless unless referenced to another phasor rotating at the same frequency. Referencing to another phasor is illustrated in Figure 4. At any instantaneous time, e.g. ωt = α, the two phasor quantities are calculated as:
)sin()cos()(
)sin()cos()()( θωθω
ωωθωωθ
ωω
−+−==+==
−− tjBtBBeeBe
tjAtAAeeAtjtjj
tjtj
With Aejωt set as the reference quantity the variable term tje ω may be factored out and the phasor representation of the two sine waves regardless of the value of ωt are Aej0 (ej0=1) and Be-jθ.
Figure 5. Referencing a phasor to a synchronized time source

Synchrophasor
Similarly, a phasor can be referenced to a time source that is synchronized to a specific frequency. The phase angle, θ, of a function f(t) = Acos(ωt + θ) is relative to a cosine function at nominal system frequency synchronized to Coordinated Universal Time (UTC). Basically a new one second pulse is generated where the reference cosine function at its maximum positive value. The phase angle θ of f(t) is defined to be 0° when the maximum of f(t) occurs at the UTC second rollover [1 pulse per second (PPS) time signal], and –90° when the positive zero crossing (from negative to positive) occurs at the UTC second rollover. Figure 5 illustrates this relationship for phasors representing the two cosine functions, f(t) = Acos(ωt) and f(t) = Acos(ωt – π/2).
Off-nominal Frequency Operation
To this point we have discussed phasors and synchrophasors that are derived from sinusoidal time functions with a constant nominal frequency. To see the effect of off-nominal frequency operation consider the follow equation:
Where ω0 is the deviation from nominal frequency. Expressing f(t) as an exponential and factoring out the nominal frequency reference quantity e j�t we have:
We can see from the latter equation that the phase angle ω0t+θ will change with time. If the deviation from nominal frequency ω0 is zero the phase angle will be constant. If ω0 is positive then the phase angle rotate with time in the positive direction (counterclockwise). If ω0 is negative then the phase angle will appear to rotate with time in the negative direction (clockwise).
Root Mean Squared (RMS) quantities
In the previous discussion the phasor magnitudes of the exponential functions are equal to the peak
magnitude of the sinusoidal functions because the equation is correct. In power system analysis it is customary to use the rms value of the sinusoidal quantity for the purpose of computing the average power or volt-amperes when representing it as a phasor, which in this case is
.
Implementation of Synchrophasors
With today’s network and timing technology, synchrophasor measurements may be made from widely dispersed locations across the power system, giving us a snapshot of the system state at any near instant of time.
This is illustrated in Figure 6. Each phasor is computed within a PMU function from sampled voltage or current sinusodial wave data using Fourier transforms and time-tagged to a common clock reference as defined in IEEE Standard C37.118 – 2005, see [2]. The synchrophasors are then streamed from all the connected PMU’s at a frequency generally in the range of 15 Hz to 60 Hz and are then collected, time synchronized and archived by the Phasor Data Concentrator (PDC) function and served with minimum latency to other client applications for system awareness monitoring, analysis and protection and control actions. This technology, which allows us to communicate and use time synchronized data in local areas or from around the system, is opening the door to new opportunities for improved system monitoring, protection and control.
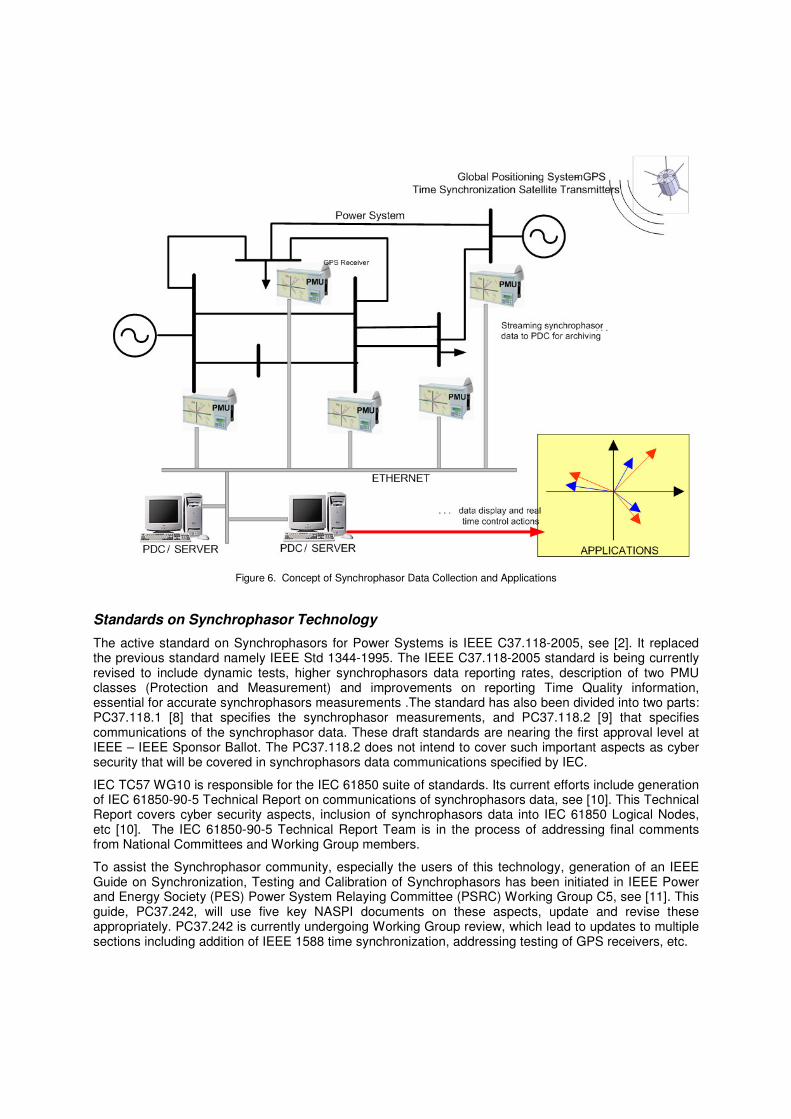
Figure 6. Concept of Synchrophasor Data Collection and Applications
Standards on Synchrophasor Technology
The active standard on Synchrophasors for Power Systems is IEEE C37.118-2005, see [2]. It replaced the previous standard namely IEEE Std 1344-1995. The IEEE C37.118-2005 standard is being currently revised to include dynamic tests, higher synchrophasors data reporting rates, description of two PMU classes (Protection and Measurement) and improvements on reporting Time Quality information, essential for accurate synchrophasors measurements .The standard has also been divided into two parts: PC37.118.1 [8] that specifies the synchrophasor measurements, and PC37.118.2 [9] that specifies communications of the synchrophasor data. These draft standards are nearing the first approval level at IEEE – IEEE Sponsor Ballot. The PC37.118.2 does not intend to cover such important aspects as cyber security that will be covered in synchrophasors data communications specified by IEC.
IEC TC57 WG10 is responsible for the IEC 61850 suite of standards. Its current efforts include generation of IEC 61850-90-5 Technical Report on communications of synchrophasors data, see [10]. This Technical Report covers cyber security aspects, inclusion of synchrophasors data into IEC 61850 Logical Nodes, etc [10]. The IEC 61850-90-5 Technical Report Team is in the process of addressing final comments from National Committees and Working Group members.
To assist the Synchrophasor community, especially the users of this technology, generation of an IEEE Guide on Synchronization, Testing and Calibration of Synchrophasors has been initiated in IEEE Power and Energy Society (PES) Power System Relaying Committee (PSRC) Working Group C5, see [11]. This guide, PC37.242, will use five key NASPI documents on these aspects, update and revise these appropriately. PC37.242 is currently undergoing Working Group review, which lead to updates to multiple sections including addition of IEEE 1588 time synchronization, addressing testing of GPS receivers, etc.
Another new effort that aims to assist the Synchrophasor community is a generation of a guide on functional requirements and testing for PDCs. This effort is in its initial stages, and will result in PC37.244 guide. Initial input into this work as well will come from NASPI, see [12]. The first Working Group meeting will take place at IEEE PES PSRC May 2011 meeting.
Multiple standardization efforts on Synchrophasors present both challenges and opportunities. Challenges include possibly different specifications and/or interpretations by different standardization groups, and luck of approved standards which makes it very difficult for vendors to proceed with new product developments. On another hand, variety of standardization activities presents unique opportunities for cooperation and collaboration between different standardization bodies, and, arguably more importantly, the users and the vendors. Such cooperation enables the broader community to take a leadership role in shaping this technology in the most constructive and technically viable way beneficial for the power industry as a whole.
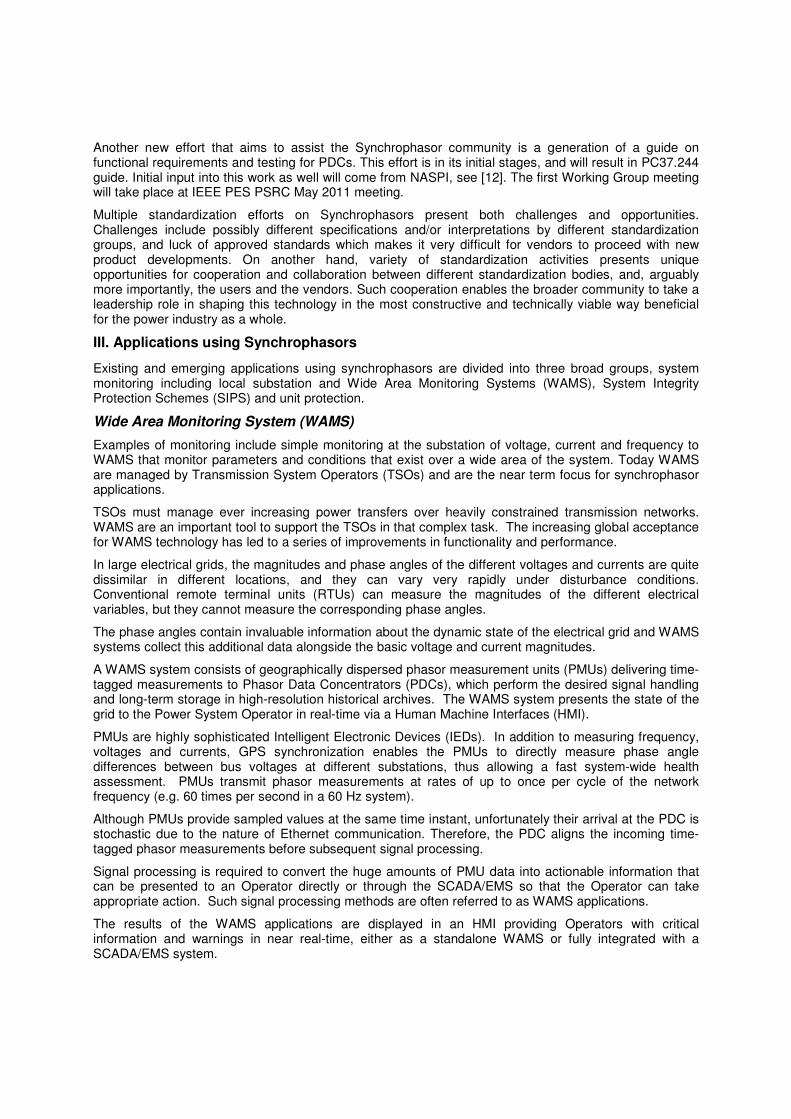
III. Applications using Synchrophasors
Existing and emerging applications using synchrophasors are divided into three broad groups, system monitoring including local substation and Wide Area Monitoring Systems (WAMS), System Integrity Protection Schemes (SIPS) and unit protection.
Wide Area Monitoring System (WAMS)
Examples of monitoring include simple monitoring at the substation of voltage, current and frequency to WAMS that monitor parameters and conditions that exist over a wide area of the system. Today WAMS are managed by Transmission System Operators (TSOs) and are the near term focus for synchrophasor applications.
TSOs must manage ever increasing power transfers over heavily constrained transmission networks. WAMS are an important tool to support the TSOs in that complex task. The increasing global acceptance for WAMS technology has led to a series of improvements in functionality and performance.
In large electrical grids, the magnitudes and phase angles of the different voltages and currents are quite dissimilar in different locations, and they can vary very rapidly under disturbance conditions. Conventional remote terminal units (RTUs) can measure the magnitudes of the different electrical variables, but they cannot measure the corresponding phase angles.
The phase angles contain invaluable information about the dynamic state of the electrical grid and WAMS systems collect this additional data alongside the basic voltage and current magnitudes.
A WAMS system consists of geographically dispersed phasor measurement units (PMUs) delivering time-tagged measurements to Phasor Data Concentrators (PDCs), which perform the desired signal handling and long-term storage in high-resolution historical archives. The WAMS system presents the state of the grid to the Power System Operator in real-time via a Human Machine Interfaces (HMI).
PMUs are highly sophisticated Intelligent Electronic Devices (IEDs). In addition to measuring frequency, voltages and currents, GPS synchronization enables the PMUs to directly measure phase angle differences between bus voltages at different substations, thus allowing a fast system-wide health assessment. PMUs transmit phasor measurements at rates of up to once per cycle of the network frequency (e.g. 60 times per second in a 60 Hz system).
Although PMUs provide sampled values at the same time instant, unfortunately their arrival at the PDC is stochastic due to the nature of Ethernet communication. Therefore, the PDC aligns the incoming time-tagged phasor measurements before subsequent signal processing.
Signal processing is required to convert the huge amounts of PMU data into actionable information that can be presented to an Operator directly or through the SCADA/EMS so that the Operator can take appropriate action. Such signal processing methods are often referred to as WAMS applications.
The results of the WAMS applications are displayed in an HMI providing Operators with critical information and warnings in near real-time, either as a standalone WAMS or fully integrated with a SCADA/EMS system.
WAMS archives provide invaluable information during the post-fault analysis of a disturbance. The high-resolution data from a WAMS system contains information that helps to illustrate the overall transmission system response to a disturbance, providing better understanding of the system’s dynamic behavior and also assists in the calibration of computer models in the system.
System Integrity Protection Schemes (SIPS)
When monitored data is used to detect abnormal system conditions for which automatic corrective action is taken then it is a component of a SIPS.
A SIPS is provided to protect the integrity of the power system or any strategic portion of it. SIPS is any automatic protection scheme designed to detect abnormal or predetermined system conditions, and take corrective actions other than and/or in addition to unit protection. The SIPS may reside: in a distribution or transmission substation requiring data collection, logic analysis and corrective actions done within the substation, a local subsystem area generally requiring communications between two or more substations in a local system area for data collection, logic analysis and corrective actions, and at a system-wide location, the operations center, where logic analysis is more complex and communications of system-wide data and corrective actions are required.
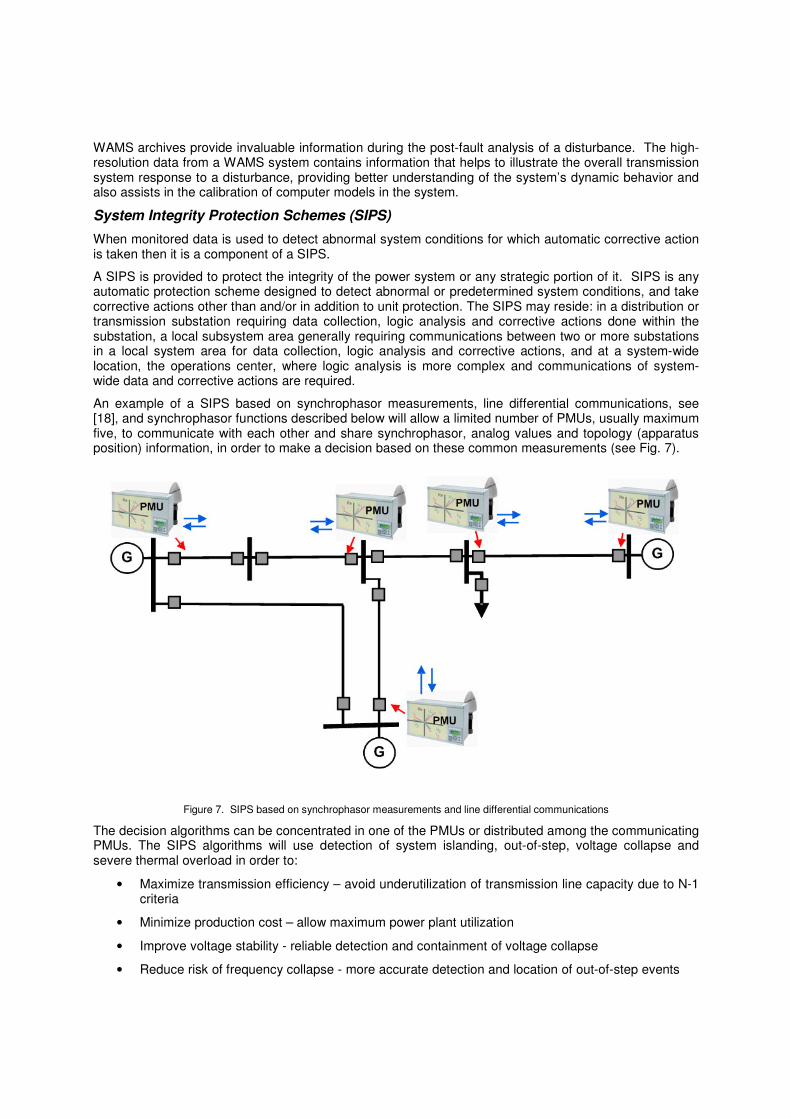
An example of a SIPS based on synchrophasor measurements, line differential communications, see [18], and synchrophasor functions described below will allow a limited number of PMUs, usually maximum five, to communicate with each other and share synchrophasor, analog values and topology (apparatus position) information, in order to make a decision based on these common measurements (see Fig. 7).
Figure 7. SIPS based on synchrophasor measurements and line differential communications
The decision algorithms can be concentrated in one of the PMUs or distributed among the communicating PMUs. The SIPS algorithms will use detection of system islanding, out-of-step, voltage collapse and severe thermal overload in order to:
• Maximize transmission efficiency – avoid underutilization of transmission line capacity due to N-1 criteria
• Minimize production cost – allow maximum power plant utilization
• Improve voltage stability - reliable detection and containment of voltage collapse
• Reduce risk of frequency collapse - more accurate detection and location of out-of-step events
• Minimize hazard to life and property – more reliable detection of islanding of wind farms and distributed generators
The advantage of having direct communication between the PMUs (using the LDCMs) is a faster and often more reliable data transfer. This, combined with the limited amount of data required (only max. 40 phasors), is ensuring a short decision time and therefore – reliable protection for distributed generators – for example.
A Wide-Area Monitoring Protection and Control (WAMPC) System is also a commonly used term for a SIPS, which is exclusively using the synchrophasor data to perform direct protection and control functionality upon the power system it is protecting. Because of their specifics of operation, the WAMPC systems are having reaction times in the lower range of the synchrophasor applications (see Figure 2), typically in between 3 – 7 cycles.
These are the synchrophasor applications that put the most strain on the communication infrastructure, device calculation latency and data reliability and availability (at the PDC levels). The PMUs have to deliver the data faster and the PDCs waiting time for incoming data is largely minimized.
The data used as a trigger for such applications is a far from the over-current function that started it all… Now we’re talking about a combination of factors involving – for example voltage instability, frequency instability, power swings and out-of-steps – sometimes from different parts of the system, all these heavy computational functions in their turn.
In order to be effective, a system protection and control function must have an array of countermeasures at its disposal, from the “simple ones” – like topology control (opening/tripping and closing primary devices) to more subtle ones – like controlling Static Var Compensators (SVCs), or blunter ones like activating a braking resistor on a generator.
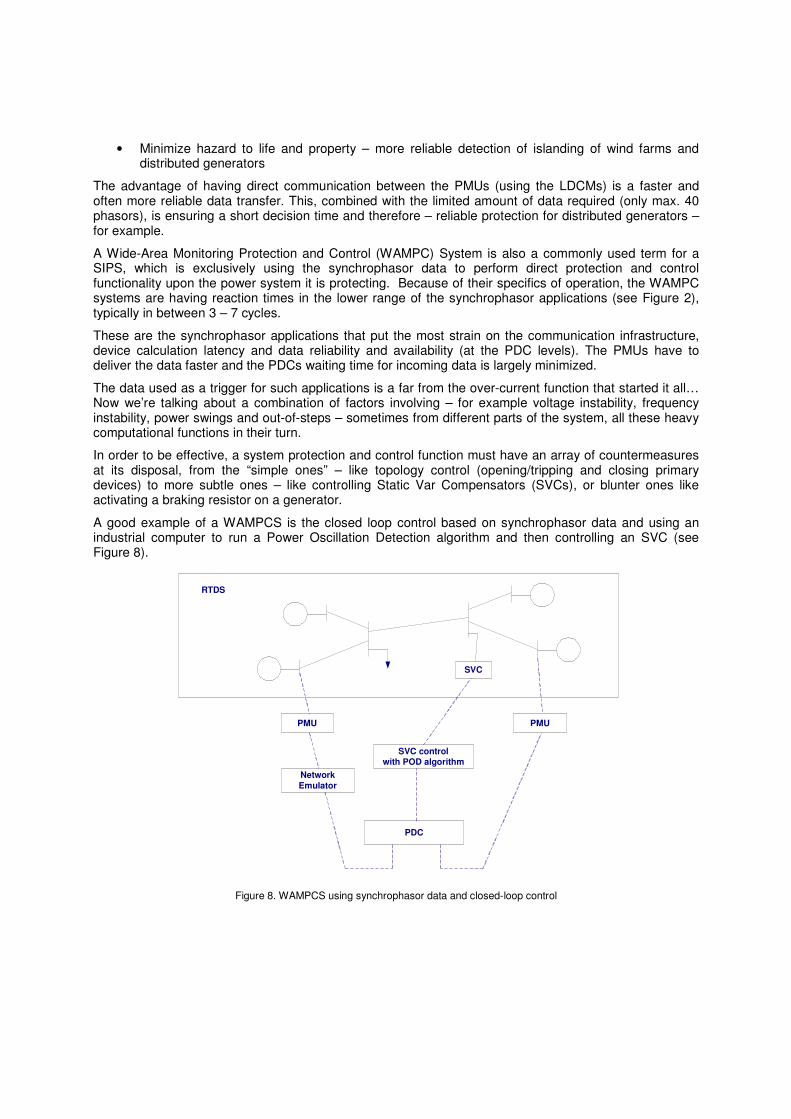
A good example of a WAMPCS is the closed loop control based on synchrophasor data and using an industrial computer to run a Power Oscillation Detection algorithm and then controlling an SVC (see Figure 8).
Figure 8. WAMPCS using synchrophasor data and closed-loop control
SVC
RTDS
PMU
PDC
SVC controlwith POD algorithm
PMU
Network Emulator

Unit Protection
Unit protection includes those schemes that are designed to detect faulted system apparatus, lines, transformers, generators, busses and etc., and isolate them from the remainder of the system. Due to current synchrophasor reporting rates the stochastic nature of Ethernet communication unit protection applications are further on the time horizon for development. However, current standard activities are including new data rates and other enhancements to address unit protection requirements.
Synchrophasor Functions and Applications
It is difficult to categorize synchrophasor functions along the lines of monitoring, WAMS, SIPS or protection because they may stand alone as a monitoring application or be a component of a SIPS or unit protection system. Following are a number of synchrophasor functions that demonstrate how synchrophasors may be used in these systems to improve system awareness and integrity. Applications may be applied to address substation, subsystem or system wide requirements.
Substation Applications
A number of monitoring and control applications that occur at the substation and support system operation have been widely used for years and fall under the definition of a SIPS. These include voltage regulation, reactive load compensation, under-voltage and under-frequency load shedding and more. These functions measure quantities at the substation and take automatic corrective actions when measured quantities are outside of specified parameter ranges. These functions, enhancements to these functions, and functions yet to be invented are desired to perform local control at the substation in support of the overall system operation. It might also be desirable to enable or disable these local substation functions from the system operations center depending on system requirements. Having these functions employed in the PMU allows efficient coordination of local substation control with system operations to better manage wide area disturbances.
Substation Monitoring
Some examples of local monitoring functions that can be immediately implemented for local control are:
• Over or under frequency
• Over-frequency
• Positive or negative rate of change of frequency
• Over or under voltage
• Over-current
Substation Unit Protection
Residing in the substation are protective relays that are designed to detect faulted equipment and isolate them from the rest of the system. In some cases, such as line protection, attempted restoration of the equipment may be automatic and controlled from the substation protection. Theoretically voltage and current synchrophasors are logical quantities to use for unit protection. Phasors are used in unit protection algorithms to a large degree. With the correct synchrophasors faults can be easily located and cleared with automatic restoration where appropriate. Currently primary unit protection schemes are not yet practical for a number of reasons
Synchrophasor data latency, the time to get from PMU measurement to the application, is too long and is therefore limited at best to backup protection applications.
The availability of all the necessary quantities, per phase and sequence values, is limited by existing communication bandwidths.
It is not unreasonable to expect that these issues will be addressed in the years to come as synchrophasor communications bandwidth increases and new protection concepts and algorithms are developed.
Voltage Instability Predictor (VIP)
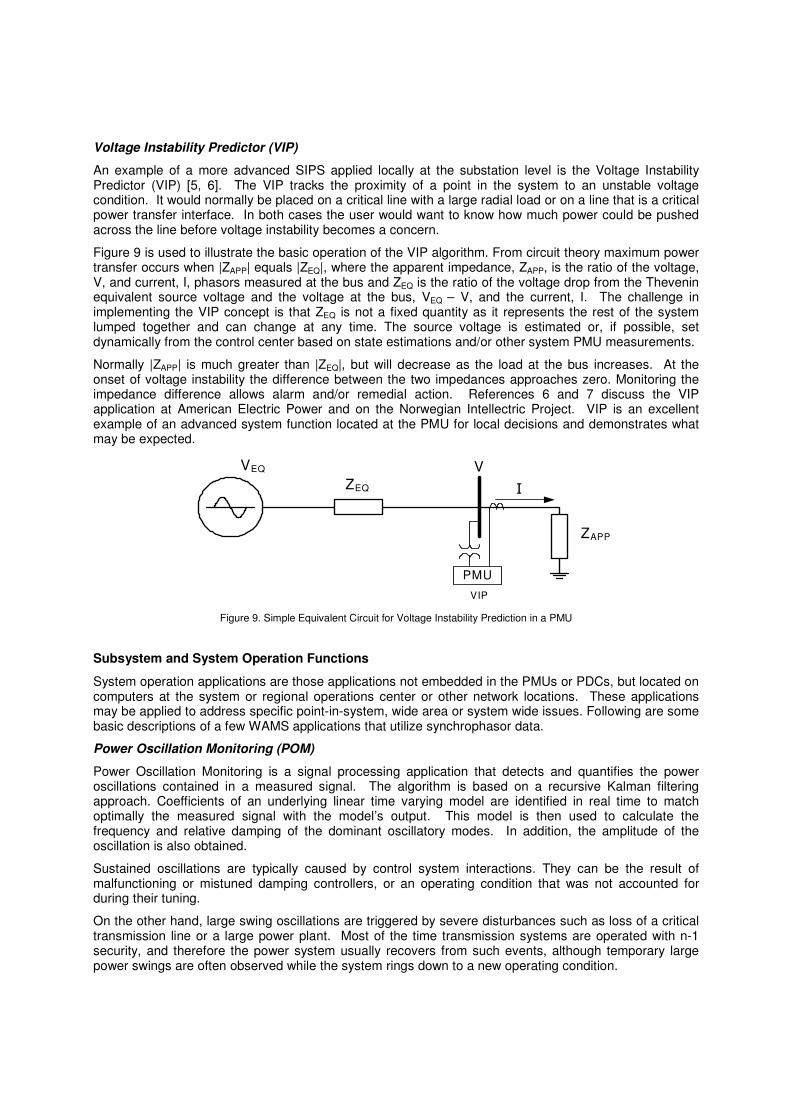
An example of a more advanced SIPS applied locally at the substation level is the Voltage Instability Predictor (VIP) [5, 6]. The VIP tracks the proximity of a point in the system to an unstable voltage condition. It would normally be placed on a critical line with a large radial load or on a line that is a critical power transfer interface. In both cases the user would want to know how much power could be pushed across the line before voltage instability becomes a concern.
Figure 9 is used to illustrate the basic operation of the VIP algorithm. From circuit theory maximum power transfer occurs when |ZAPP| equals |ZEQ|, where the apparent impedance, ZAPP, is the ratio of the voltage, V, and current, I, phasors measured at the bus and ZEQ is the ratio of the voltage drop from the Thevenin equivalent source voltage and the voltage at the bus, VEQ – V, and the current, I. The challenge in implementing the VIP concept is that ZEQ is not a fixed quantity as it represents the rest of the system lumped together and can change at any time. The source voltage is estimated or, if possible, set dynamically from the control center based on state estimations and/or other system PMU measurements.
Normally |ZAPP| is much greater than |ZEQ|, but will decrease as the load at the bus increases. At the onset of voltage instability the difference between the two impedances approaches zero. Monitoring the impedance difference allows alarm and/or remedial action. References 6 and 7 discuss the VIP application at American Electric Power and on the Norwegian Intellectric Project. VIP is an excellent example of an advanced system function located at the PMU for local decisions and demonstrates what may be expected.
VEQ V
ZAPP
ZEQ
PMU
VIP
�
Figure 9. Simple Equivalent Circuit for Voltage Instability Prediction in a PMU
Subsystem and System Operation Functions
System operation applications are those applications not embedded in the PMUs or PDCs, but located on computers at the system or regional operations center or other network locations. These applications may be applied to address specific point-in-system, wide area or system wide issues. Following are some basic descriptions of a few WAMS applications that utilize synchrophasor data.
Power Oscillation Monitoring (POM)
Power Oscillation Monitoring is a signal processing application that detects and quantifies the power oscillations contained in a measured signal. The algorithm is based on a recursive Kalman filtering approach. Coefficients of an underlying linear time varying model are identified in real time to match optimally the measured signal with the model’s output. This model is then used to calculate the frequency and relative damping of the dominant oscillatory modes. In addition, the amplitude of the oscillation is also obtained.
Sustained oscillations are typically caused by control system interactions. They can be the result of malfunctioning or mistuned damping controllers, or an operating condition that was not accounted for during their tuning.
On the other hand, large swing oscillations are triggered by severe disturbances such as loss of a critical transmission line or a large power plant. Most of the time transmission systems are operated with n-1 security, and therefore the power system usually recovers from such events, although temporary large power swings are often observed while the system rings down to a new operating condition.
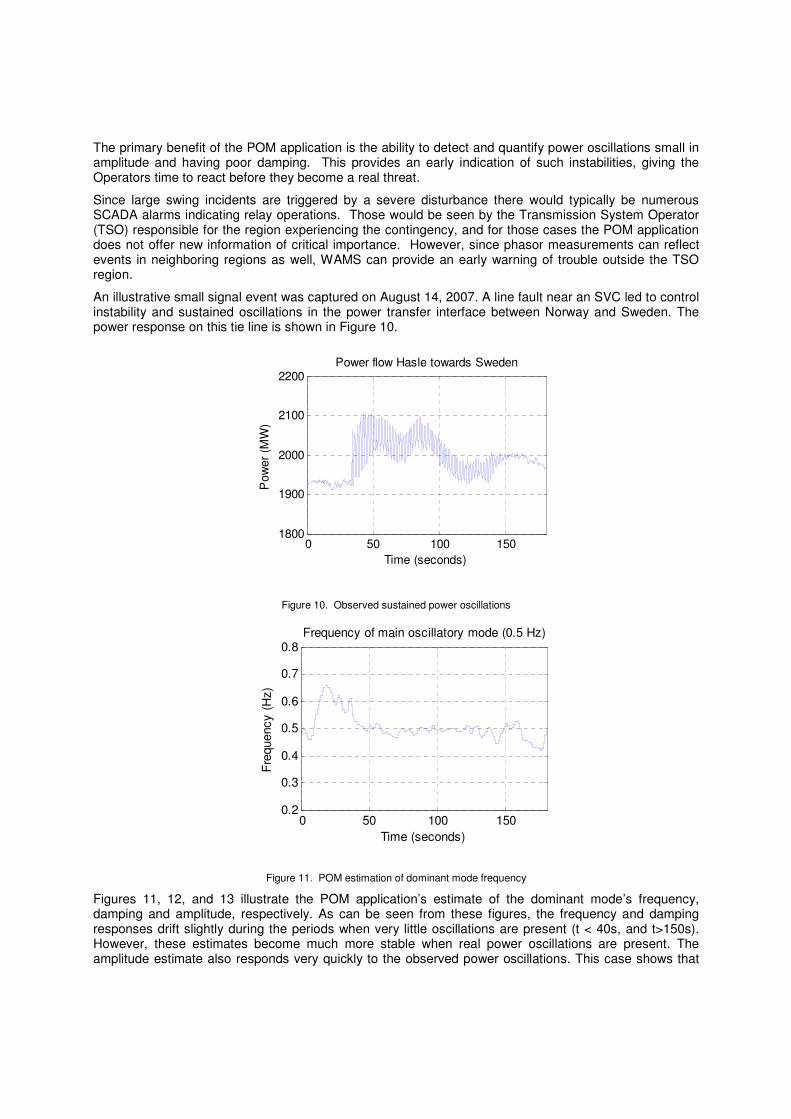
The primary benefit of the POM application is the ability to detect and quantify power oscillations small in amplitude and having poor damping. This provides an early indication of such instabilities, giving the Operators time to react before they become a real threat.
Since large swing incidents are triggered by a severe disturbance there would typically be numerous SCADA alarms indicating relay operations. Those would be seen by the Transmission System Operator (TSO) responsible for the region experiencing the contingency, and for those cases the POM application does not offer new information of critical importance. However, since phasor measurements can reflect events in neighboring regions as well, WAMS can provide an early warning of trouble outside the TSO region.
An illustrative small signal event was captured on August 14, 2007. A line fault near an SVC led to control instability and sustained oscillations in the power transfer interface between Norway and Sweden. The power response on this tie line is shown in Figure 10.
0 50 100 1501800
1900
2000
2100
2200
Time (seconds)
Pow
er (
MW
)
Power flow Hasle towards Sweden
Figure 10. Observed sustained power oscillations
0 50 100 1500.2
0.3
0.4
0.5
0.6
0.7
0.8
Time (seconds)
Freq
uenc
y (H
z)
Frequency of main oscillatory mode (0.5 Hz)
Figure 11. POM estimation of dominant mode frequency
Figures 11, 12, and 13 illustrate the POM application’s estimate of the dominant mode’s frequency, damping and amplitude, respectively. As can be seen from these figures, the frequency and damping responses drift slightly during the periods when very little oscillations are present (t < 40s, and t>150s). However, these estimates become much more stable when real power oscillations are present. The amplitude estimate also responds very quickly to the observed power oscillations. This case shows that
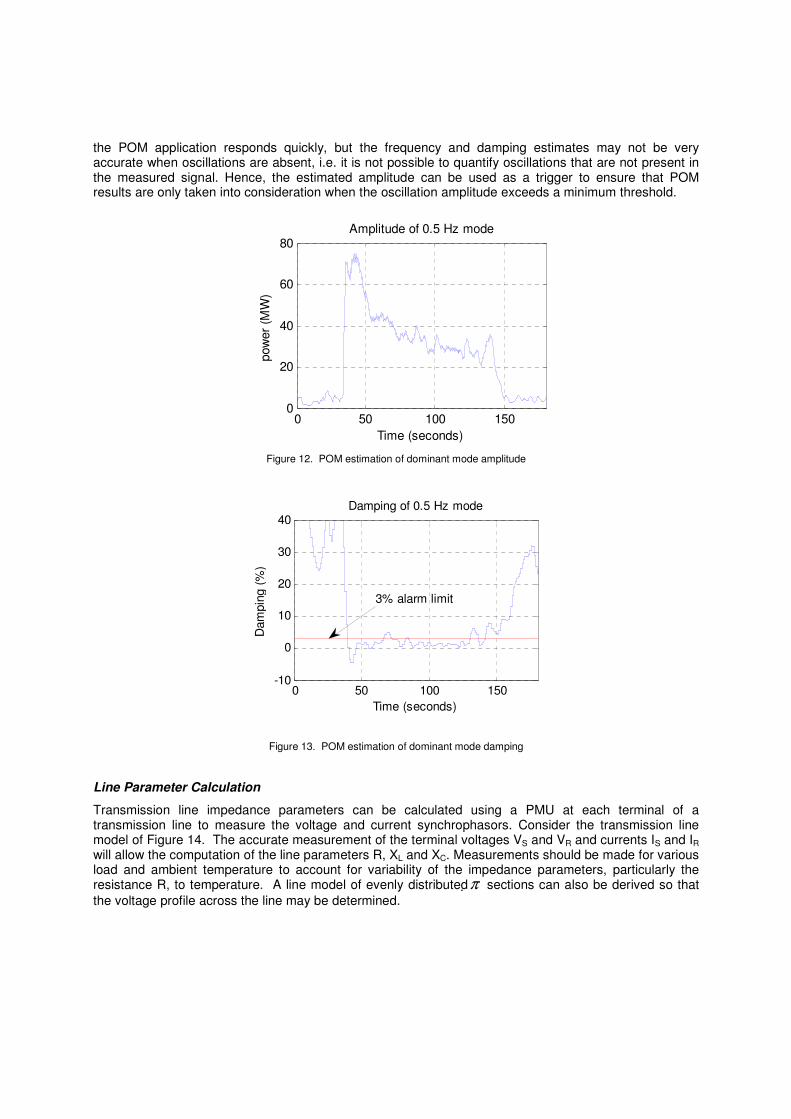
the POM application responds quickly, but the frequency and damping estimates may not be very accurate when oscillations are absent, i.e. it is not possible to quantify oscillations that are not present in the measured signal. Hence, the estimated amplitude can be used as a trigger to ensure that POM results are only taken into consideration when the oscillation amplitude exceeds a minimum threshold.
0 50 100 1500
20
40
60
80
Time (seconds)
pow
er (M
W)
Amplitude of 0.5 Hz mode
Figure 12. POM estimation of dominant mode amplitude
0 50 100 150-10
0
10
20
30
40
Time (seconds)
Dam
ping
(%)
Damping of 0.5 Hz mode
3% alarm limit
Figure 13. POM estimation of dominant mode damping
Line Parameter Calculation
Transmission line impedance parameters can be calculated using a PMU at each terminal of a transmission line to measure the voltage and current synchrophasors. Consider the transmission line model of Figure 14. The accurate measurement of the terminal voltages VS and VR and currents IS and IR will allow the computation of the line parameters R, XL and XC. Measurements should be made for various load and ambient temperature to account for variability of the impedance parameters, particularly the resistance R, to temperature. A line model of evenly distributed /π sections can also be derived so that the voltage profile across the line may be determined.
R XL
VS
IRIS
VR
ICS ICRXC
2XC
2
Figure 14. Transmission Line Impedance π Section Model
Transmission Line Thermal Monitoring
Loading of transmission lines is generally constrained by thermal limits rather than voltage stability concerns. Line resistance calculations based on synchrophasor measurement provide an economical approach to line thermal monitoring and will allow full use of the transmission capacity independent of actual temperature and wind measurements. It is recognized that a transmission line may be routed through several different environments where temperature and wind velocity conditions will be different. It is suggested, however, that an average conductor temperature calculation based on real time assessment of measured parameters of the transmission line will provide a reasonable and economic method to evaluate the transmission line’s loadability. Such an approach may complement or replace existing devices that measure the transmission line’s thermal capacity to provide an economical means to give early warning in case of overload, dynamically control transmission line capacity, and provide indirect estimation of line sagging.
ED EE EF
EG
EH
EJ
EK
EL EM
EN
EO
EP
EQ ER
ES
ET
DE F
G
K
J
L
O P
M
S
H
N
R T
Q
Y
X
Z
ZPS�SP
�SR
�SM
�ST
� Equivalent
PMU
PMU
PMU
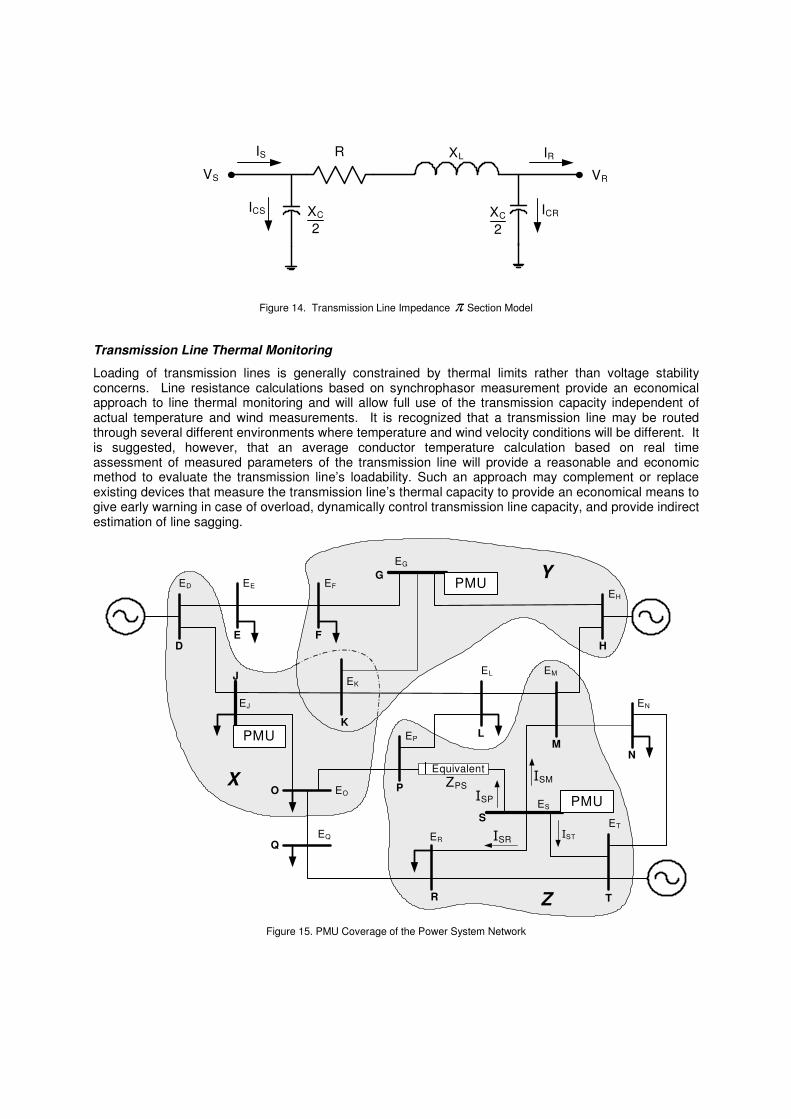
Figure 15. PMU Coverage of the Power System Network
Phasor-enhanced State Estimator (SE)
State Estimation is a process that defines the state of the power system to allow the system operator to make better decisions aimed at maintaining the power system integrity during system events that cause unwanted outages of generation or transmission capacity. Improvement in the accuracy of the state estimation of the power system network is one of the most immediate benefits of PMU application. Currently a state estimation is made using measured power system data collected over a long period of time (minutes) and is characterized by a variance in measurement accuracy across the system. Solutions may take several minutes or longer and divergences typically occur during those evolving disturbances when a good state estimation is most needed. The industry is constantly developing methods to improve state estimation accuracy.
The application of a sufficient number of PMUs across the system will improve the State Estimation solutions to the point they will be called state calculations. Consider the placement of PMUs at busses G, J and S on the power system shown in Figure 15.
The PMU at bus S measures accurately the voltage phasor (amplitude and angle), ES, and current phasors ISP, ISM, ISR and IST. Having these phasor quantities and an accurate system model, the voltage phasors at the remote busses M, P, R and T can be directly calculated with linear equations. These busses are therefore defined as “observable” to bus S, the PMU location.
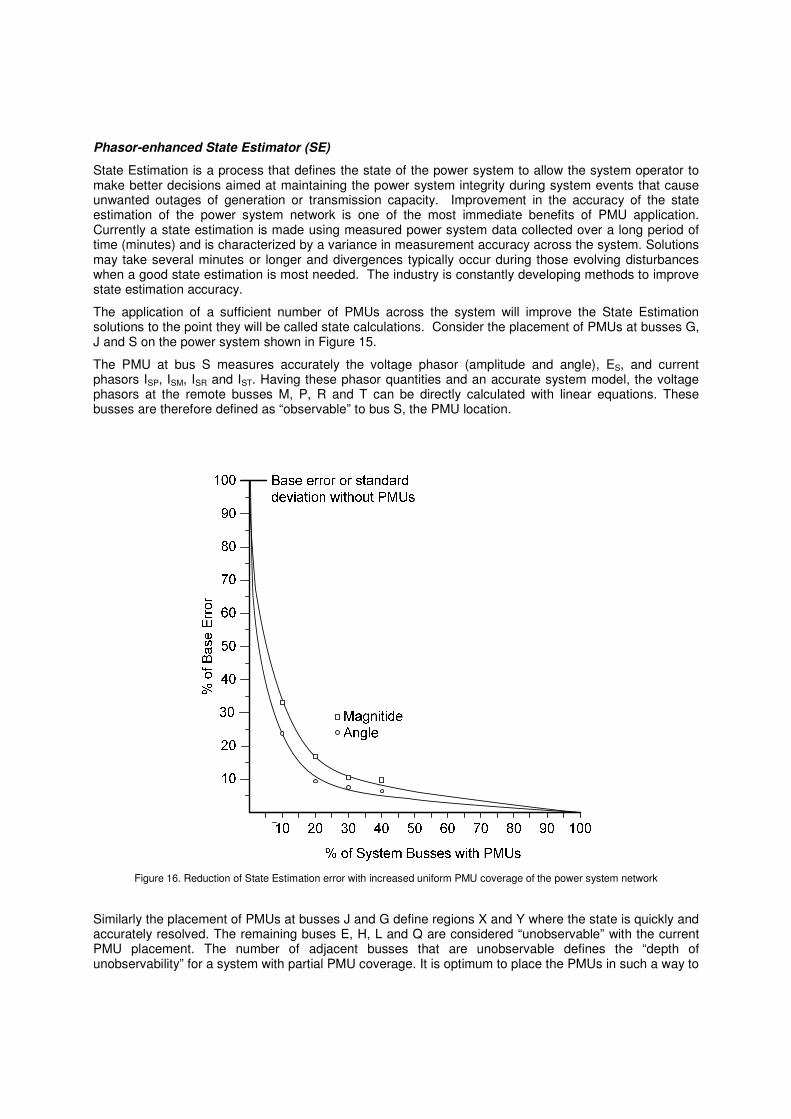
Figure 16. Reduction of State Estimation error with increased uniform PMU coverage of the power system network
Similarly the placement of PMUs at busses J and G define regions X and Y where the state is quickly and accurately resolved. The remaining buses E, H, L and Q are considered “unobservable” with the current PMU placement. The number of adjacent busses that are unobservable defines the “depth of unobservability” for a system with partial PMU coverage. It is optimum to place the PMUs in such a way to
maintain a uniform depth of unobservability. For this configuration the depth of unobservability is one and state voltage and current quantities at the unobservable busses can be estimated by linear interpolation with reasonable accuracy. Figure 16 shows the reduction in state estimation error with increasing power system coverage with optimally placed PMUs.
The PMU measurements are integrated into the Orthogonal State Estimator by the approach of directly adding PMU measurements to the SE measurement vector and the Jacobian matrix that are used by SE to solve the network. This approach enables SE to calculate the network solution based on both PMU and conventional measurements simultaneously, with the advantage of having increased measurement redundancy and obtaining better solution accuracy.
The conventional measurements used by SE include MW, MVAr, KV, Ampere, and Tap. The PMU measurements used by SE include phase angles at bus voltages and phase angles at branch currents. All the PMU measurements used by SE are assumed time-aligned, synchronized, with respect to a common time reference (GPS time reference), and obtained from a time snapshot.
There are two methods of PMU data integration typically supported in the State Estimator. These two methods are summarized below. The best method to use in each case depends on the type of PMU measurements available.
Direct PMU Measurement Integration: This method uses direct voltage angle and current angle measurements from PMU. This method synchronizes SE and PMU angle references by adding an artificial reference angle as a state variable that represents the angle of the SE slack bus relative to the PMU time reference and is estimated along with other network state variables by the SE solution process. In this method the voltage and current angle measurements are modeled as:
a) Voltage angle measurement at bus bar k
A’k = Ak + ARef
where:
A’k Voltage angle measurement at bus bar k, relative to the PMU time reference
Ak Voltage angle state variable at bus bar k, relative to the SE slack bus
ARef Artificial reference angle state variable, i.e., the angle of the SE slack bus relative to the PMU time reference
b) Current angle measurement at branch km
C’km = Ckm + ARef
where:
C’km Current angle measurement at branch km, relative to the PMU time reference
Ckm SE calculated current angle at branch km, relative to the SE slack bus
ARef Artificial reference angle state variable, i.e., the angle of the SE slack bus relative to the PMU time reference
Derived PMU Measurement Integration: This method uses derived PMU measurements of voltage angle differences and branch power factor angles measurements as input to SE. This method eliminates requirements for synchronizing SE and PMU angle references by removing the PMU time reference from calculation of the derived measurements. In this method the derived voltage angle differences and branch power factor angles measurements are modeled as:
a) Voltage angular difference measurement between bus bar k and bus bar m
A’km = A’k - A’m = Ak – Am
where:
A’km Voltage angular difference measurement between bus bar k and bus bar m
A’k Voltage angle measurement at bus bar k, relative to the PMU time reference
A’m Voltage angle measurement at bus bar m, relative to the PMU time reference
Ak Voltage angle state variable at bus bar k, relative to the SE slack bus
Am Voltage angle state variable at bus bar m, relative to the SE slack bus
b) Power Factor Angle Measurement at branch km
CPF’km = C’km - A’k = Ckm - Ak
where:
CPF’km Power factor angle measurement at branch km
C’km Current angle measurement at branch km, relative to the PMU time reference
A’k Voltage angle measurement at bus bar k, relative to the PMU time reference
Ckm SE calculated current angle at branch km, relative to the SE slack bus
Ak Voltage angle state variable at bus bar k, relative to the SE slack bus
The Phasor-enhanced State Estimator adopts a one-pass solution algorithm that solves the observable and unobservable portions of the network simultaneously. All the PMU and conventional measurements defined in the network model are used as input to solve the entire network.
Voltage Stability Monitoring (VSM)
Voltage Stability Monitoring is a WAMS application that provides power system operators with on-line information to perform a real-time assessment of the power margin with respect to voltage stability. The power margin is the amount of additional active power that can be transported on a transmission corridor without jeopardizing the voltage stability of the grid.
VSM computes the power margin by monitoring the actual loading point on the PV-Curve against the maximum deliverable power PMAX, as illustrated in Figure 17. A graphical VSM display such as this gives the Operator a fast overview of the current situation.
The VSM application is designed to monitor transmission corridors and it delivers the dynamic current and voltage phasors and resulting calculations in real-time. The phasor measurements are taken by two GPS-synchronized PMUs at both ends of the corridor, which deliver precise measurements in real-time. No other measuring equipment is required for VSM.
The VSM application is designed for general transmission corridors that may comprise several physical lines and it can be easily adapted to the individual needs of each utility. The VSM application can be deployed on standalone PDCs or can be integrated in SCADA/EMS or Network Control systems with RTU interfaces.
In addition to the graphical presentation of the Power Voltage (PV)-Curves, VSM provides the Operators with information about voltage and current phasors at both ends of the corridor, with calculated values such as active and reactive power as well as the power flow direction, so that the Operators are always informed with exact real-time data on the current voltage stability situation, as the basis for further steps.
Actions the Operator may take to improve voltage stability range from rescheduling generation, adjusting the reactive power compensation, blocking tap changers in the load area, or in extreme cases load shedding.
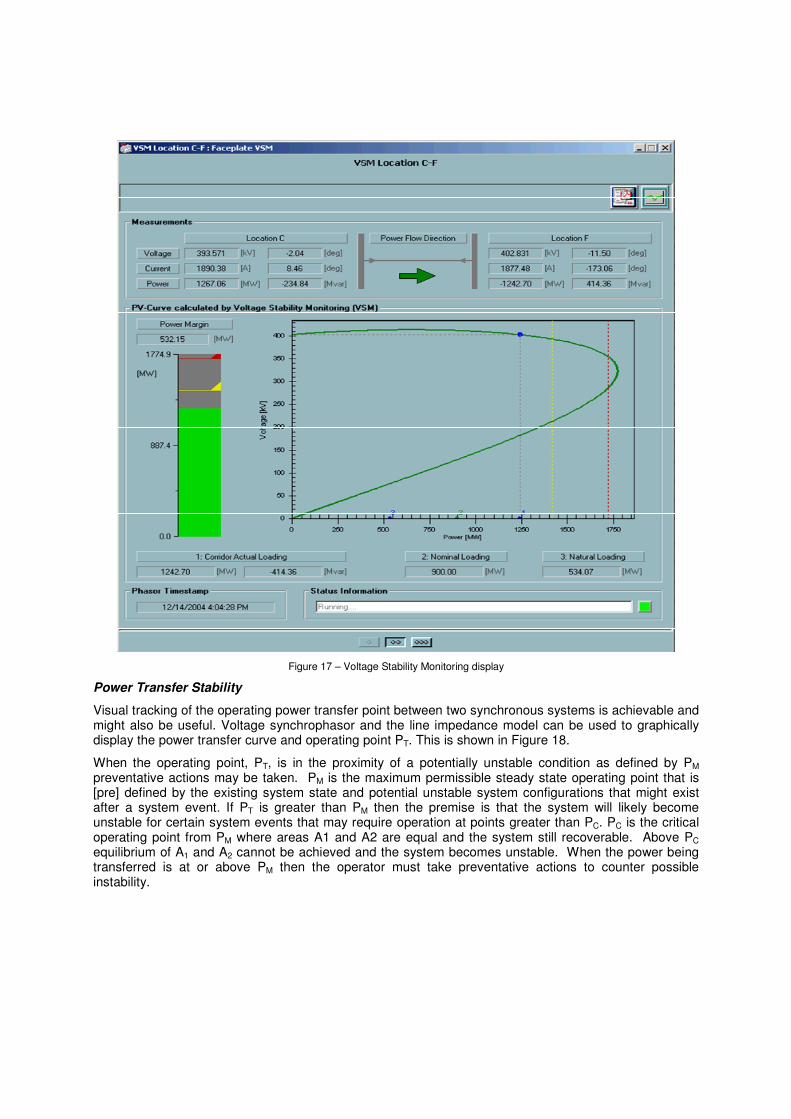
Figure 17 – Voltage Stability Monitoring display
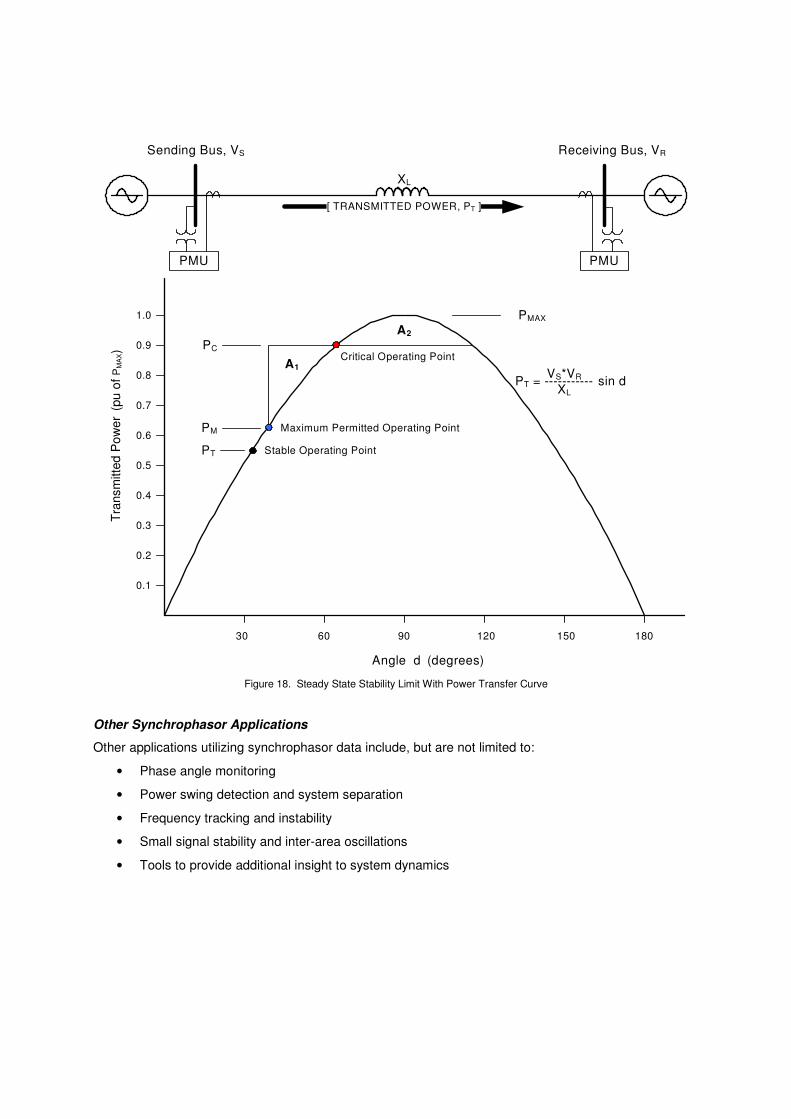
Power Transfer Stability
Visual tracking of the operating power transfer point between two synchronous systems is achievable and might also be useful. Voltage synchrophasor and the line impedance model can be used to graphically display the power transfer curve and operating point PT. This is shown in Figure 18.
When the operating point, PT, is in the proximity of a potentially unstable condition as defined by PM preventative actions may be taken. PM is the maximum permissible steady state operating point that is [pre] defined by the existing system state and potential unstable system configurations that might exist after a system event. If PT is greater than PM then the premise is that the system will likely become unstable for certain system events that may require operation at points greater than PC. PC is the critical operating point from PM where areas A1 and A2 are equal and the system still recoverable. Above PC equilibrium of A1 and A2 cannot be achieved and the system becomes unstable. When the power being transferred is at or above PM then the operator must take preventative actions to counter possible instability.
Sending Bus, VS Receiving Bus, VR
[ TRANSMITTED POWER, PT ]
0.1
0.2
0.3
0.4
0.5
0.6
0.7
0.8
0.9
1.0
30 60 90 120 150 180
Tran
smitt
ed P
ower
(pu
of P
MA
X)
Angle d (degrees)
Stable Operating Point
PMAX
PT
PMU PMU
XL
PCCritical Operating Point
A1
A2
Maximum Permitted Operating PointPM
PT = -----------VS*VR
XLsin d
Figure 18. Steady State Stability Limit With Power Transfer Curve
Other Synchrophasor Applications
Other applications utilizing synchrophasor data include, but are not limited to:
• Phase angle monitoring
• Power swing detection and system separation
• Frequency tracking and instability
• Small signal stability and inter-area oscillations
• Tools to provide additional insight to system dynamics
III. Future Developments
Technological Gaps and Next Steps
One of the main issues that the synchrophasors technology is facing is the data availability and reliability. As [14] reveals very clear, the data flow from the PT and CT values to the control centers having synchrophasor applications is long and any link in the chain can provoke a data availability issue.
Synchrophasor data can have bad quality, bad time stamp, can arrive late at the PDC or the PDC can align the data badly. And the same things can be repeated in between the PDCs. If one does the math from the statistical data collected on the Eastern Interconnection, it will be clear that bad data counts appeared for almost a third of the total data.
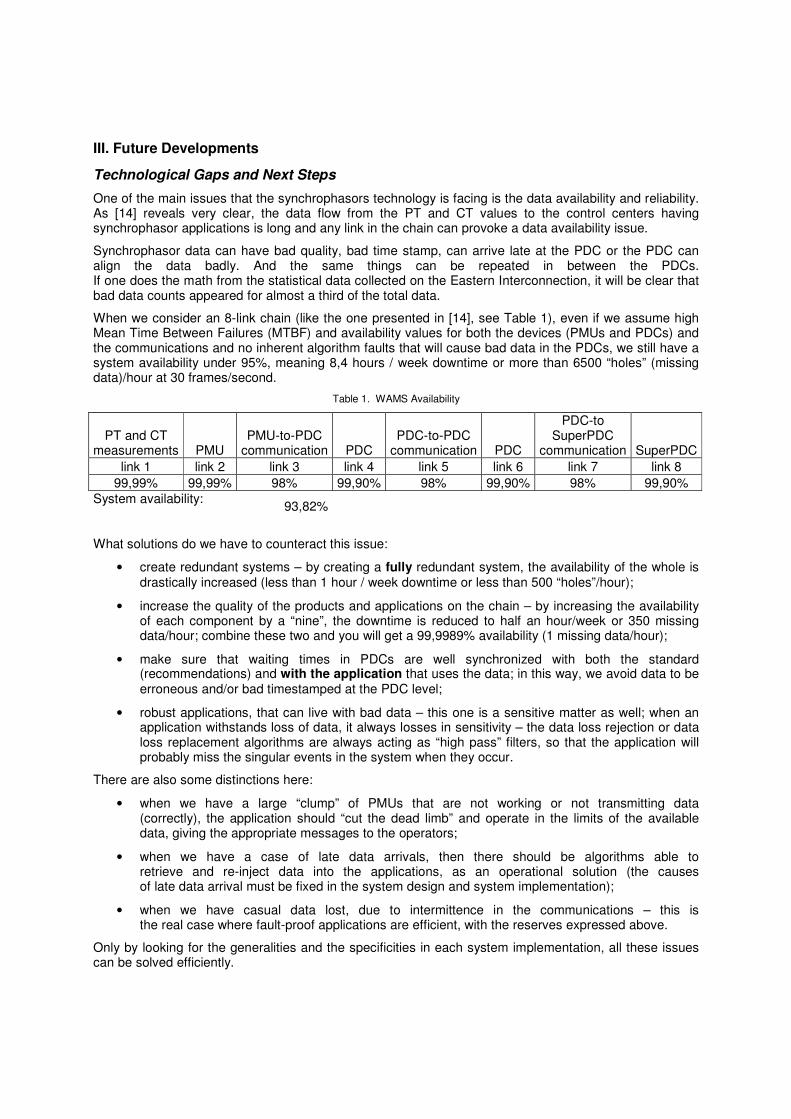
When we consider an 8-link chain (like the one presented in [14], see Table 1), even if we assume high Mean Time Between Failures (MTBF) and availability values for both the devices (PMUs and PDCs) and the communications and no inherent algorithm faults that will cause bad data in the PDCs, we still have a system availability under 95%, meaning 8,4 hours / week downtime or more than 6500 “holes” (missing data)/hour at 30 frames/second.
Table 1. WAMS Availability
PT and CT measurements PMU
PMU-to-PDC communication PDC
PDC-to-PDC communication PDC
PDC-to SuperPDC
communication SuperPDC link 1 link 2 link 3 link 4 link 5 link 6 link 7 link 8
99,99% 99,99% 98% 99,90% 98% 99,90% 98% 99,90% System availability: 93,82%
What solutions do we have to counteract this issue:
• create redundant systems – by creating a fully redundant system, the availability of the whole is drastically increased (less than 1 hour / week downtime or less than 500 “holes”/hour);
• increase the quality of the products and applications on the chain – by increasing the availability of each component by a “nine”, the downtime is reduced to half an hour/week or 350 missing data/hour; combine these two and you will get a 99,9989% availability (1 missing data/hour);
• make sure that waiting times in PDCs are well synchronized with both the standard (recommendations) and with the application that uses the data; in this way, we avoid data to be erroneous and/or bad timestamped at the PDC level;
• robust applications, that can live with bad data – this one is a sensitive matter as well; when an application withstands loss of data, it always losses in sensitivity – the data loss rejection or data loss replacement algorithms are always acting as “high pass” filters, so that the application will probably miss the singular events in the system when they occur.
There are also some distinctions here:
• when we have a large “clump” of PMUs that are not working or not transmitting data (correctly), the application should “cut the dead limb” and operate in the limits of the available data, giving the appropriate messages to the operators;
• when we have a case of late data arrivals, then there should be algorithms able to retrieve and re-inject data into the applications, as an operational solution (the causes of late data arrival must be fixed in the system design and system implementation);
• when we have casual data lost, due to intermittence in the communications – this is the real case where fault-proof applications are efficient, with the reserves expressed above.
Only by looking for the generalities and the specificities in each system implementation, all these issues can be solved efficiently.
Time Synchronization
Synchronization requirements for power system applications differ significantly. Some applications require relative synchronization (synchronization of merging units), others need traceability to universal time coordinated (UTC) either locally or over a wide area (event recorders, synchrophasors). Synchronization of sampled analogue values and measurements used for protection is critical and demands high security and dependability.
Synchrophasor measurements are normally relative to UTC time, and their precision greatly depends on time synchronization accuracy. Note that these measurements can be collected over small or very large geographical area, and measurements from remote devices need to be correlated for system analysis and protection decisions. Time sources and time distribution must be reliable, available and accessible by PMU devices in the whole system.
Accuracy limits for the synchrophasor measurements, as defined in [2] shall not exceed 1% Total Vector Error (TVE). This translates to a maximum time error of ± 26 microseconds for 60 Hz system and ± 31 microseconds for 50 Hz system. To provide synchrophasor measurements with specified measurement accuracy, much tighter requirements are placed on system time synchronization. It has been generally agreed that ± 1 microsecond time accuracy of UTC is desired at device inputs to achieve the specified measurement accuracy of 1% TVE.
Time synchronization is today’s systems is normally performed using GPS time sources traceable to UTC, dedicated synchronization networks and 1PPS signals. Current developments on time synchronization technologies offer a new approach that uses Ethernet communications infrastructure to distribute precise time, thus eliminating the need for dedicated synchronization network, cables, testing during commissioning, installation and maintenance.
IEEE Std 1588
IEEE Standard for a Precision Clock Synchronization Protocol for Networked Measurement and Control System was initially released in 2002 and revised in 2008 [15]. The standard describes a protocol for distributing time with sub-microsecond time accuracy over various communication technologies, such as Ethernet, UDP/IP, DeviceNet, etc. The key advantages of this standard are that timing can be distributed over the same network as application data, and that time accuracies generally not achievable by other time distribution protocols become possible.
The second version of the IEEE 1588 Standard specifies many new features of the Precision Time Protocol (PTP), mandatory and optional, including conceptually new devices (transparent clocks), new message formats, etc. Development of this version was driven by five main industries: test and measurement, telecom, industrial automation, power and military. As a result, it was impossible to specify a single set of interoperable functions, as requirements for these industries differ significantly. To address this challenge a concept of IEEE 1588 profile was introduced, as a clearly defined subset of protocol features, the use of which will meet specific industry requirements. Two default profiles are defined in the Annex J of the second version of the IEEE 1588 Standard [15]. Industries are expected to define their own profiles to address specific requirements of their applications.
IEEE 1588 Profile for Power System Applications: PC37.238
The IEEE Power System Relaying Committee (PSRC) and Substation Committee (SUB), both operating under the IEEE Power and Energy Society (PES) formed a joined Working Group to develop IEEE 1588 power profile. The PSRC H7/Sub C7 Working Group functions in close co-ordination with IEC TC57 WG10 and other committees with similar interests. The group develops PC37.238 Draft Standard Profile for Use of IEEE Std. 1588 in Power System Applications [16]. The PC37.238 completed IEEE Sponsor ballot on November 21, 2010 and first recirculation was closed on February 17, 2011. Comment resolution for the current draft PC37.238 D5.7 is currently under way. Standard’s approval is expected in the summer 2011. During standard’s development profile interoperability tests, called plug-fests, were conducted. The profile as well has been evaluated for the IEEE 1588 Testbed project.
Main Function
PC37.238 specifies how to distribute time from a device that is synchronized to universal time (e.g. to UTC via GPS) to devices that require time to support their application functions (e.g. IEDs with line differential protection, phasor measurement units, merging units, digital event recorders).
Devices
A device that is synchronized to the universal time is called a grandmaster clock. Devices that can only receive time from grandmaster clock are called slaves or slave-only clocks. Network devices that interconnect grandmaster and slave clocks are called transparent clocks, these are usually Ethernet switches.
Performance Requirements
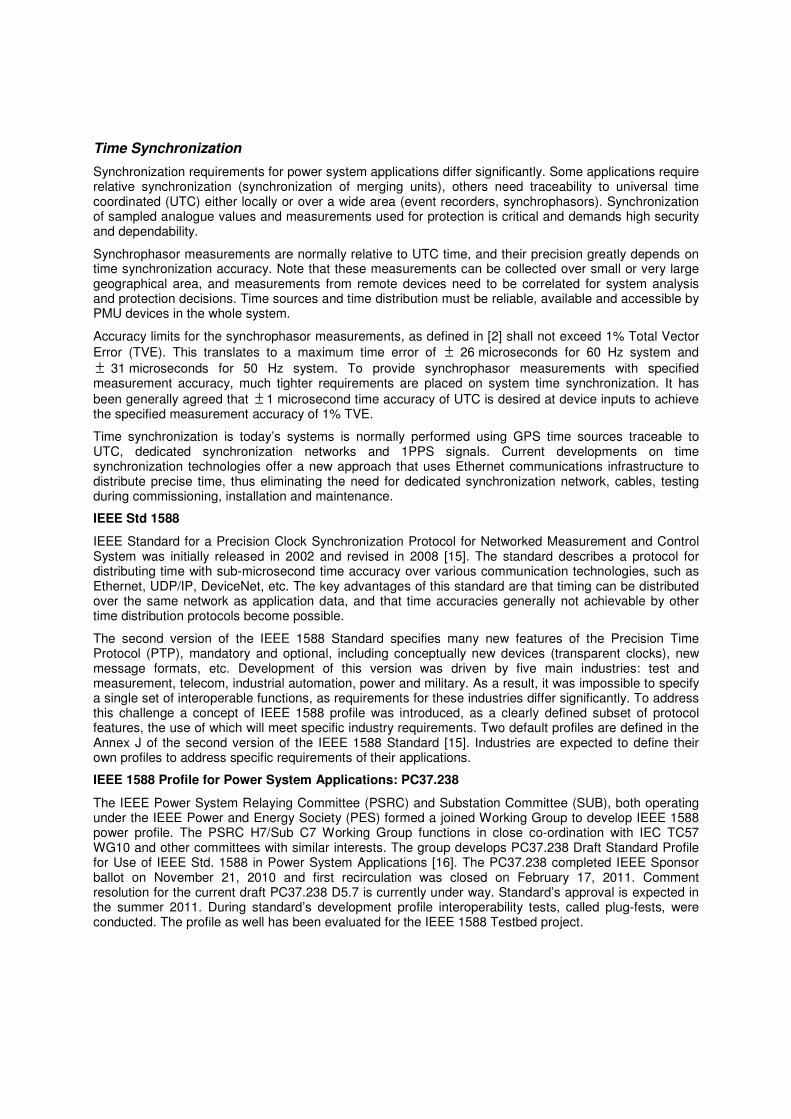
Normative performance requirements are specified in PC37.238 Annex B. As depicted in Figure 19 time at a slave device connected to grandmaster clock over 16 network hops shall be within +/-1 microsecond from grandmaster time. Note that all devices, including intermediate nodes have to support PC37.238.
Figure 19. PC37.238 performance requirements
Operation
Time is distributed using Sync messages that contain the time at the grandmaster at the instant a given Sync message was issued. A best grandmaster selection is performed using Announce messages. Path delay measurements are preformed using point-to-point PDelay messages.
Mapping
All PC37.238 messages are mapped directly into Layer 2 / Ethernet frames and are transmitted over Ethernet cables (fibre or copper). Multicast Destination MAC address and IEEE 802.1Q VLAN tags are used for Priority assignment and per-VLAN traffic separation, if desired.
Best Grandmaster Selection and Redundancy
For redundancy there should be two or three devices capable of being grandmasters. These devices are called grandmaster-capable clocks. On start-up, failure or planned maintenance outage, an automatic selection of the best master is performed that results in one device becoming a system’s grandmaster. Selection of the grandmaster is based on device qualifications, including achievable clock accuracy.
Grandmaster Identification
A feature unique to PC37.238 is the addition of an extension to communicate grandmaster identification. This information helps to minimize the effects of transient states on synchronization and operation, when
distributed time is not traceable. It communicates to applications if data they require used the time from the same grandmaster.
TimeInaccuracy
A new parameter, TimeInaccuracy, is proposed to communicate the best estimate of the current worst-case time error (its magnitude) between device’s time and traceable time. It includes error contributions from grandmaster clocks, local clock and time distribution network (Ethernet switches with transparent clock functionality). This information is provided to applications.
Local Time
Local time extension is also provided, as some applications may require this, e.g. for reporting (not operation) functions.
Management
A PC37.238 SNMP MIB is defined for device configuration and status information. MIB support is mandatory only for grandmaster-capable devices.
“Smart” Features
Time accuracy in sub-microsecond range can be achieved because of the following “smart” features offered by IEEE 1588 and supported by PC37.238 draft standard:
• Correction for variable delays in the protocol stack
• Correction for cable delay
• Correction for residence time in intermediate devices
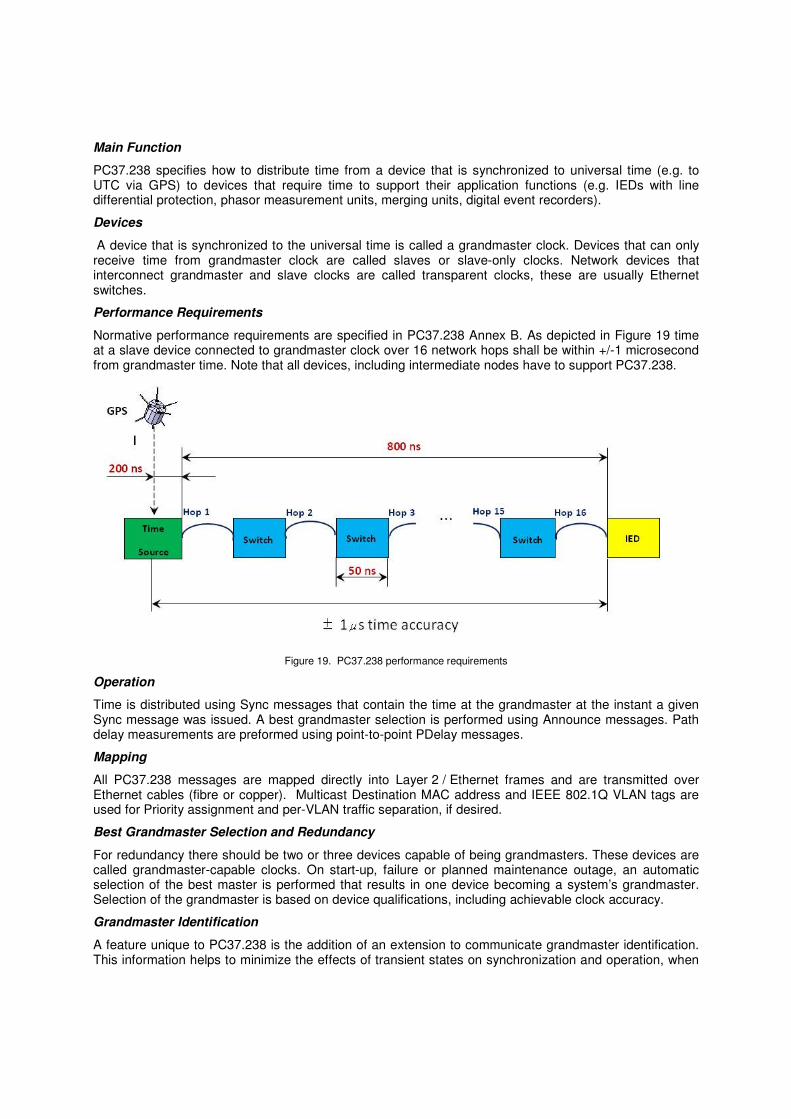
The above three features remove sources of non-deterministic latency, making more precise time synchronization possible. Figure 20 illustrates these features.
�
������������
������������ ���
� � ���
� ��� �� ���� �
������������������ ���������
�� �� ��� �� �� ���
� ���
����
�
���� ����
� ���� �� �������� ��� �������
� � � �
� ��� ��� �������
� ���
����
�
� ���
����
�
� ���
����
�
Figure 20. Compensation for variable delay sources
Variable delay introduced by communication protocol stack (1) is avoided by timestamping Sync messages just before they are transmitted into physical media. Timestamp point is between Media Access Control (MAC) block and Physical interface, typically called PHY at the Media Independent Interface (MII), in case of 100Mb/s Ethernet. Some PC37.238 devices can support “on-the-fly” timestamping, i.e. inserting the precise actual grandmaster time while Sync message is being transmitted over MII interface. Other devices may support two-step operation mode with a Follow_up message
transmitted right after Sync message. Follow_up message contains the precise grandmaster time when its associated Sync message was transmitted over grandmaster’s MII interface.
Two other variable delay sources are dealt with using peer-to-peer transparent clock functionality. These devices are typically Ethernet switches that measure cable delay and residence time then provide these in a special field, called CorrectionField, to the end devices, so that they can add these delays to the received grandmaster time before adjusting their clocks.
Cable delay (2) is measured using peer-to-peer delay measurement mechanism. It uses PDelay message exchange to measure the delay on each point-to-point link. Point-to-point delay measurements enable faster convergence times upon grandmaster changes, as cable delays are measured for all links, including those blocked by Spanning Tree Protocols, regardless of whether the link is currently on the time distribution path or not. Cable delay correction is very important as each 100m copper link introduces approximately 500ns delay, which is half of the full time accuracy budget of 1 microsecond.
Transparent clocks, which are Ethernet switches supporting PC37.238, also measure residence time, the time that Sync message carrying grandmaster time actually spends inside the switch. This time is variable and depends on traffic loads that lead to varying store-and-forward queuing delays. Transparent clock and residence time concepts are shown in Figure 20.
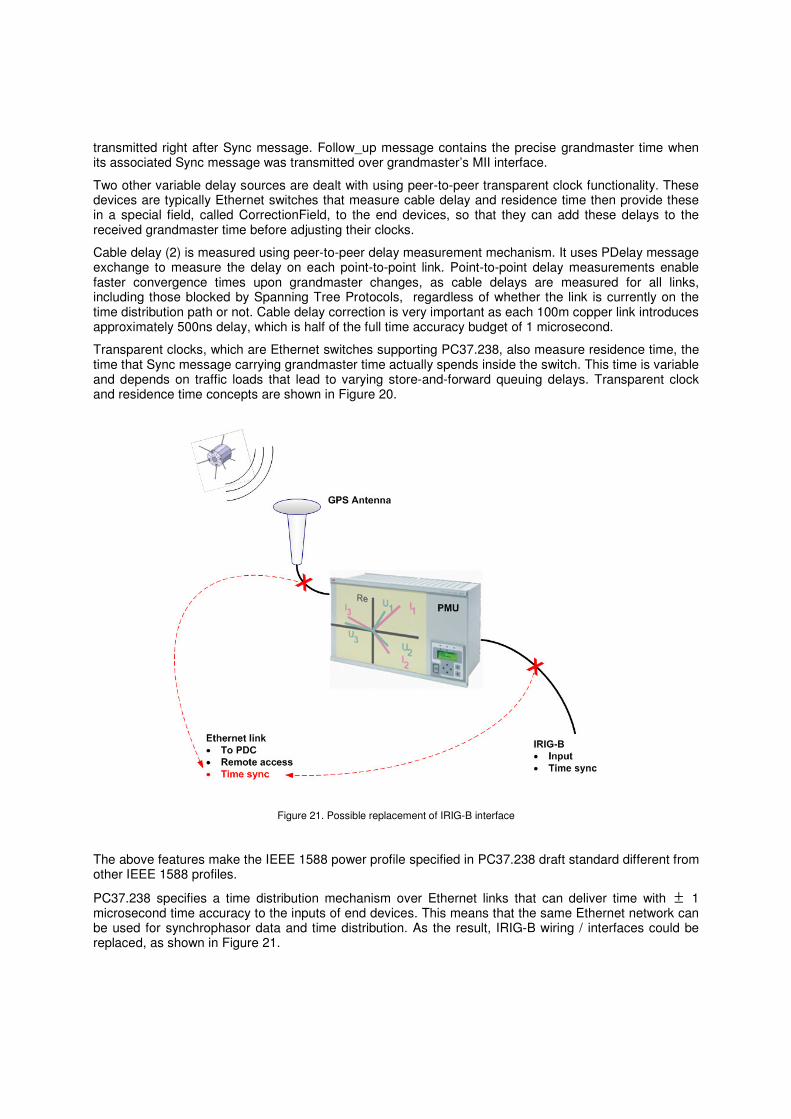
Figure 21. Possible replacement of IRIG-B interface
The above features make the IEEE 1588 power profile specified in PC37.238 draft standard different from other IEEE 1588 profiles.
PC37.238 specifies a time distribution mechanism over Ethernet links that can deliver time with ± 1 microsecond time accuracy to the inputs of end devices. This means that the same Ethernet network can be used for synchrophasor data and time distribution. As the result, IRIG-B wiring / interfaces could be replaced, as shown in Figure 21.
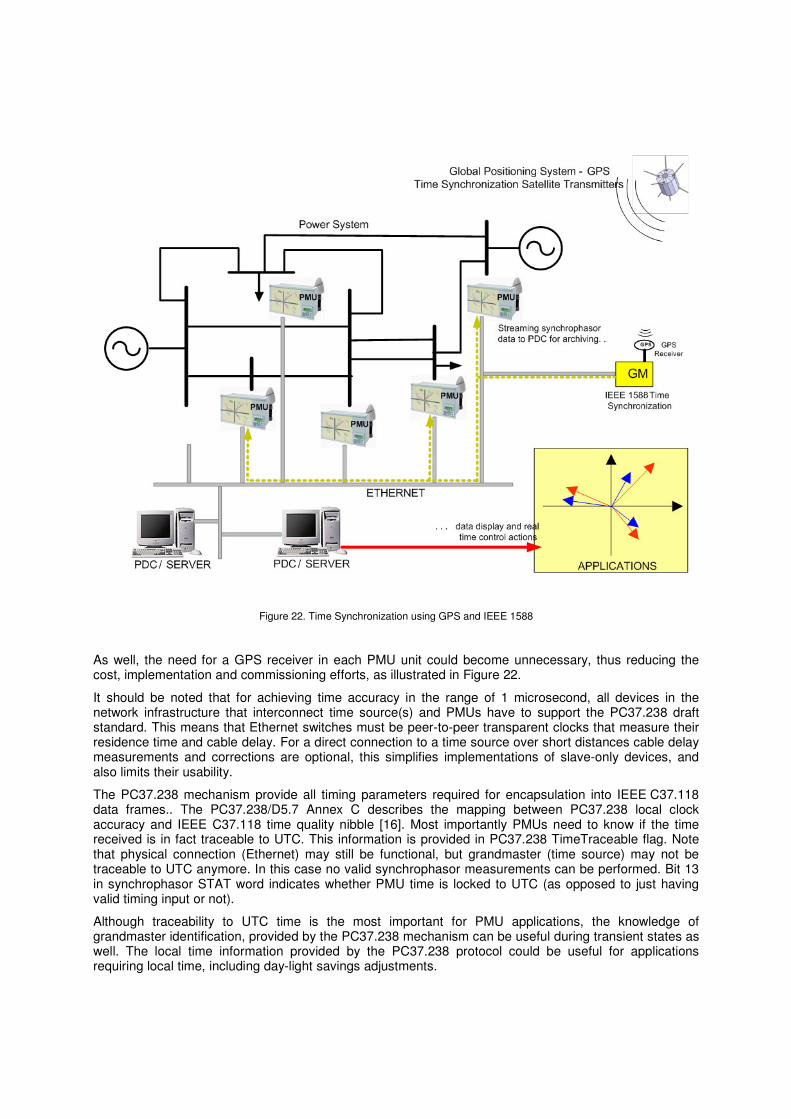
Figure 22. Time Synchronization using GPS and IEEE 1588
As well, the need for a GPS receiver in each PMU unit could become unnecessary, thus reducing the cost, implementation and commissioning efforts, as illustrated in Figure 22.
It should be noted that for achieving time accuracy in the range of 1 microsecond, all devices in the network infrastructure that interconnect time source(s) and PMUs have to support the PC37.238 draft standard. This means that Ethernet switches must be peer-to-peer transparent clocks that measure their residence time and cable delay. For a direct connection to a time source over short distances cable delay measurements and corrections are optional, this simplifies implementations of slave-only devices, and also limits their usability.
The PC37.238 mechanism provide all timing parameters required for encapsulation into IEEE C37.118 data frames.. The PC37.238/D5.7 Annex C describes the mapping between PC37.238 local clock accuracy and IEEE C37.118 time quality nibble [16]. Most importantly PMUs need to know if the time received is in fact traceable to UTC. This information is provided in PC37.238 TimeTraceable flag. Note that physical connection (Ethernet) may still be functional, but grandmaster (time source) may not be traceable to UTC anymore. In this case no valid synchrophasor measurements can be performed. Bit 13 in synchrophasor STAT word indicates whether PMU time is locked to UTC (as opposed to just having valid timing input or not).
Although traceability to UTC time is the most important for PMU applications, the knowledge of grandmaster identification, provided by the PC37.238 mechanism can be useful during transient states as well. The local time information provided by the PC37.238 protocol could be useful for applications requiring local time, including day-light savings adjustments.
IV. Conclusions
Since the introduction of the synchrophasors 25 years ago, the industry has accepted the new technology at a slow pace, gradually trying to understand and adopt – first the synchrophasor-capable devices, then the applications using these devices (mostly visualization and post-fault analysis).
In the last years however, fuelled by the recent DoE funding and NASPI activities, the synchrophasor community is increasing at a lightening speed and the number and quality of the applications offered to the industry have ten folded almost overnight.
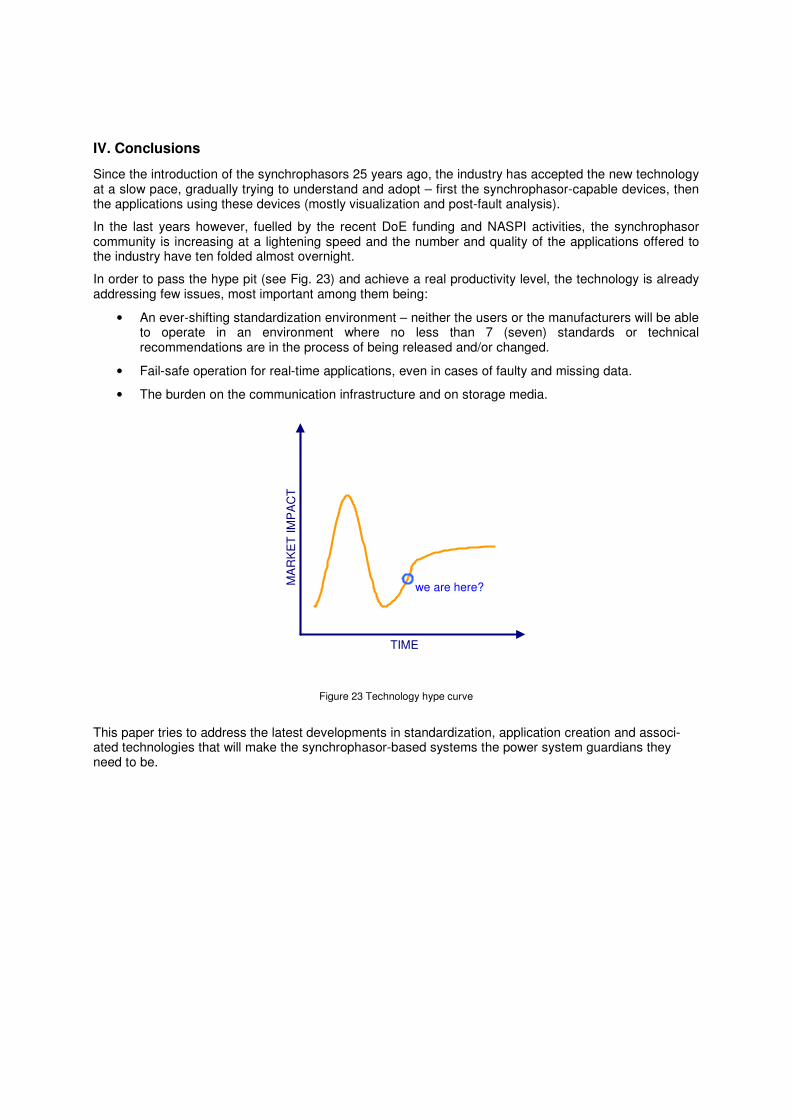
In order to pass the hype pit (see Fig. 23) and achieve a real productivity level, the technology is already addressing few issues, most important among them being:
• An ever-shifting standardization environment – neither the users or the manufacturers will be able to operate in an environment where no less than 7 (seven) standards or technical recommendations are in the process of being released and/or changed.
• Fail-safe operation for real-time applications, even in cases of faulty and missing data.
• The burden on the communication infrastructure and on storage media.
Figure 23 Technology hype curve
This paper tries to address the latest developments in standardization, application creation and associ-ated technologies that will make the synchrophasor-based systems the power system guardians they need to be.
MA
RK
ET
IMP
AC
T
TIME
we are here?
V. References
[1] IEEE Std 1344 - 1995. “IEEE Standard for Synchrophasors for Power Systems.”
[2] IEEE Std C37.118 - 2005, “IEEE Standard for Synchrophasors for Power Systems.”
[3] D. Karlsson, L Broski, S Ganesan, “Maximizing Power System Stability Through Wide Area Protection,” 57th Annual Conference for Protective Relay Engineers, Texas A&M University, College Station, Texas, March 2004.
[4] Ali Abur, “Strategies for Placing PMUs and Benefits Gained,” [Presentation], EIPP Working Group Meeting, Chattanooga, TN, April 20, 2005
[5] D. E. Julian, R. P. Schulz, K. T. Vu, W. H. Quaintance, N. B. Bhatt, D. Novosel, “Quantifying Proximity to Voltage Collapse Using the Voltage Instability Predictor (VIP),” Power Engineering Summer Meeting, Vol. 2, 931 – 936, July 2000.
[6] A. Leirbukt, K. Uhlen, M. T. Palsson, J. O. Gjerde, K. Vu, O. Kirkeluten, “Voltage Monitoring and Control for Enhanced Utilization of Power Grids”, Power System Conference and Exposition, IEEE PES Vol. 1, 342 – 347, October 2004.
[7] E. Price, “Practical Considerations for Implementing Wide Area Monitoring, Protection and Control Systems,” 59th Annual Conference for Protective Engineers, Texas A&M University, April 2006.
[8] Draft PC37.118.1 / D2.12 “Draft Standard for Synchrophasor Measurements for Power Systems.”
[9] Draft PC37.118.2 / D1/4 “Draft Standard for Synchrophasor Data Transfer for Power Systems.”
[10] Draft IEC TR 61850-90-5 “Use of IEC 61850 to transmit synchrophasor information according to IEEE C37.118.”
[11] PC37.242 / D0 “Draft Guide for Synchronization, Calibration, Testing, and Installation of Phasor Measurement Units (PMU) for Power System Protection and Control.”
[12] NASPI documents on PDC requirements to be used for PC37.244 “Guide for Phasor Data Concentrator Requirements for Power System Protection, Control, and Monitoring” , refer to http://www.naspi.org
[13] P. Myrda and Data and Networking Task Team, “NASPINet Demo”, North-American Synchro-Phasor Initiative, February 25th , 2011, Fort Worth, TX, USA.
[14] Technical Panel, “Synchro-Phasor Data Quality”, North-American Synchro-Phasor Initiative, February 25th, 2011, Fort Worth, TX, USA
[15] IEEE Std 1588-2008 “IEEE Standard for a Precision Clock Synchronization Protocol for Networked Measurement and Control Systems.”
[16] PC37.238 / D5.7 “Draft Standard Profile for Use of IEEE Std. 1588 Precision Time Protocol in Power System Applications.”
[17] V. Madani, D. Novosel, S. Hotowitz, etc, IEEE PSRC Report on Global Industry Experiences With System Integrity Protection Schemens (SIPS), IEEE Transactions on Power Delivery, Vol. 25, NO 4, October 2010.
[18] IEEE Std C37.94 – 2002 (R2008) “IEEE Standard for N Times 64 Kilobit Per Second Optical Fiber Interfaces Between Teleprotection and Multiplexer Equipment.”
Copyright © 2022 FDOKUMEN