Open Source Independent Review and Interpretation System
72
Open Source Independent Review and Interpretation System Version 2.2 User’s Guide National Center for Biotechnology Information National Library of Medicine National Institutes of Health U.S. Department of Health & Human Services
-
Upload
khangminh22 -
Category
Documents
-
view
0 -
download
0
Transcript of Open Source Independent Review and Interpretation System
Open Source Independent Review and Interpretation System
Version 2.2 User’s Guide
National Center for Biotechnology Information
National Library of Medicine National Institutes of Health
U.S. Department of Health & Human Services

Osiris User’s Guide Page 2 Version 2.2 Rev. 1
Table of Contents
Table of Contents .............................................................................................................. 2
Background ......................................................................................................................... 4
Getting Started ................................................................................................................... 5
Obtaining and Installing OSIRIS ...................................................................................................................................... 5
A Quick Tutorial .................................................................................................................................................................... 5
Configuration ......................................................................................................................................................................... 9
Lab Settings ...................................................................................................................................................................................9
Add a new Operating Procedure .............................................................................................................................................................. 10
General - .fsa and .hid files .......................................................................................................................................................................... 10
File/Sample names ....................................................................................................................................................................................... 10
Locus/ILS Thresholds .................................................................................................................................................................................. 13
Sample Thresholds........................................................................................................................................................................................ 14
Assignments .................................................................................................................................................................................................... 19
Acceptance/Review ...................................................................................................................................................................................... 21
Grid Colors .................................................................................................................................................................................. 22
Analysis ...............................................................................................................................23
OSIRIS Report Files ........................................................................................................25
Analysis Report Table ...................................................................................................................................................... 25
Using Table Cells to Display Information ......................................................................................................................... 26
Plot Preview Graph and Graph Menu ......................................................................................................................... 27
Table Toolbar and Menu (Editing) .............................................................................................................................. 28
OSIRIS Plot Files ..............................................................................................................33
Graph Toolbar .................................................................................................................................................................... 35
Resizing Plots ...................................................................................................................................................................... 37
Export Graphic File ........................................................................................................................................................... 38
Viewport and Zooming .................................................................................................................................................... 38
Export Setup Tutorial ....................................................................................................40
Osiris User’s Guide Page 3 Version 2.2 Rev. 1
OSIRIS Artifact Handling ..............................................................................................42
Appendices ........................................................................................................................46
Appendix A. Program Elements ................................................................................................................................... 46
Compiled Software ................................................................................................................................................................... 46
Message Book ............................................................................................................................................................................ 46
Operating Procedures and Kit definitions ....................................................................................................................... 47
Kit definitions ............................................................................................................................................................................ 47
Elements Defined:....................................................................................................................................................................................... 47
Positive Controls Defined in Default Operating Procedures ................................................................................................ 47
Core/Extended/Interlocus Boundaries ........................................................................................................................................... 48
Appendix B. Upgrading an Operating Procedure to a new version OSIRIS .................................................. 49
To copy the new message book to the old version of the OP: ................................................................................... 49
To copy the lab settings of a previous version OP to an updated version: ........................................................... 50
Updating OPs with a batch file ............................................................................................................................................. 51
Determining OP names in file folders ................................................................................................................................ 52
Appendix C. Sample Rework ......................................................................................................................................... 52
Appendix D. Quality Assurance and Automation Uses ........................................................................................ 53
Appendix E. User Defined File Export ........................................................................................................................ 55
Appendix F. Artifact List .................................................................................................................................................. 57
Appendix G. Adding a New Kit ...................................................................................................................................... 62
New Kit ......................................................................................................................................................................................... 63
New Internal Lane Standards (ILS’s) ..................................................................................................................................................... 63
Kit Colors .......................................................................................................................................................................................................... 63
Ladder................................................................................................................................................................................................................ 64
Operating Procedure .................................................................................................................................................................................... 65
Synthesizing a custom allelic ladder .................................................................................................................................. 66
Appendix H. Dynamic Baseline Analysis .................................................................................................................. 67
Detecting the true baseline: .................................................................................................................................................. 67
Checking calculated dynamic baseline goodness-of-fit ............................................................................................... 68
Appendix I. Troubleshooting and FAQ ...................................................................................................................... 69
Troubleshooting ....................................................................................................................................................................... 69
FAQ ................................................................................................................................................................................................ 71
Osiris User’s Guide Revision History .......................................................................................................................... 72

Osiris User’s Guide Page 4 Version 2.2 Rev. 1
Background OSIRIS (Open Source, Independent Review and Interpretation System) is a public domain quality assurance software package that facilitates the assessment of multiplex short tandem repeat (STR) DNA profiles based on laboratory-specific protocols. OSIRIS evaluates the raw electrophoresis data contained in an .fsa or .hid file using an independently derived mathematically-based sizing algorithm. OSIRIS currently supports ABI capillary analytical platforms and numerous commercially available CODIS-compliant marker kits. OSIRIS searches for peaks by iteratively fitting expected parametric data signatures to the observed data, usually achieving matches with correlations in excess of 0.999. Parametric peak locations are determined with sub-second accuracy and transformed to base pair coordinates. Traditional sizing methods for DNA fragments usually rely on either the local or global Southern methods to interpolate the internal lane standard (ILS) into base pair estimates. OSIRIS departs from this approach, using instead the correspondence between a sample’s ILS and an associated allelic ladder to map the time scale of the ladder into that of the sample. This integration of the ladder with the sample permits a straightforward and accurate comparison of sample peaks with ladder locus peaks. Typically, OSIRIS-analyzed sample peaks align within 0.1 base pair of the position within a locus. Thus, in addition to providing reliable and accurate peak analysis, OSIRIS offers two new peak quality measures – fit level and sizing residual. Based on a laboratory’s own protocols, these two measures can enhance quality metrics currently available to assess STR DNA profiles. OSIRIS can be customized to accommodate laboratory-specific signatures including settings sensitive to typical background noise and can include any customized naming conventions or additional internal laboratory controls. When used in complement with other analysis methods, OSIRIS can provide a second independent assessment of data and may alleviate the need for human review of passing profiles. OSIRIS was initiated in response to recommendations of a multidisciplinary advisory group (the Kinship and DNA Analysis Panel, KADAP) empanelled by the U.S. Department of Justice. KADAP was assembled to assist the New York City Office of the Medical Examiner (OCME) and New York State Police (NYSPD) DNA laboratories in the difficult and unprecedented legal and humanitarian challenges the World Trade Center victim identifications raised by developing guidelines and recommendations for management of the identification process, focusing on ways to enhance the number and quality of identifications that could be made1. Developed in collaboration with state, local and federal forensic laboratories and NIST, the National Center for Biotechnology Information (NCBI) created OSIRIS using C++ and object oriented design to facilitate the development of add-on applications by those using the program. NCBI performs internal quality assurance on its programs and will maintain OSIRIS at http://www.ncbi.nlm.nih.gov/projects/SNP/osiris as part of its extensive public domain toolkit for exploring and managing genetic data.
1 NIJ Journal (2007) 256; Identifying Remains: Lessons Learned From 9/11

Osiris User’s Guide Page 5 Version 2.2 Rev. 1
Getting Started
Obtaining and Installing OSIRIS OSIRIS for Microsoft Windows XP, Vista, or Windows 7 and Apple Macintosh OSX 10.6 can be downloaded at http://www.ncbi.nlm.nih.gov/projects/SNP/osiris. When using the version for Microsoft Windows, if replacing an old OSIRIS version with a newer one, the old version must first be uninstalled before the newer version is installed. To uninstall an older version for Windows, go to the ‘Start’ menu and select Programs -> Osiris ->
Uninstall OSIRIS. Alternatively, you can go to the Control Panel and select Add or Remove Programs,
and then scroll down to highlight Osiris and select the “Remove” button. You can now install the new version of OSIRIS. When using Microsoft Windows, once OSIRIS has been downloaded, open the file from Windows Explorer and follow the installation instructions. The only installation option is selecting the location for the installation. If a previous version of OSIRIS was removed prior to installation, the new version should be installed in the same location as the older version in order to use the prior settings that are saved from your previous install. See Appendix B regarding updating settings from a prior installation. When viewing the electronic version of this guide you may navigate to sections indicated in the table of contents by using bookmarks and by selecting hyperlinks in the document.
A Quick Tutorial This is a quick overview on using OSIRIS. The files shown in the examples illustrated in this guide are included with your OSIRIS download. All of the .fsa and .hid example files were created by the Human Identity Team at the National Institute of Standards and Technology (NIST). We recommended that you use the Quick Tutorial along with the provided NIST files to help familiarize yourself with OSIRIS. Details of OSIRIS’ features will be described in the later chapters. The demonstration files include files from a number of kits in use in the forensic community in the U.S., including Applied Biosystems Identifiler and GlobalFiler, and Promega PowerPlex16 and Fusion. The Fusion and GlobalFiler files are in .hid format. Included in the Identifiler directory is a set of samples with specific artifacts with the locus indicated in the filename. Below is an illustration of the opening window. Note the menu bar availability above the logo. The logo disappears after a moment.
Osiris User’s Guide Page 6 Version 2.2 Rev. 1
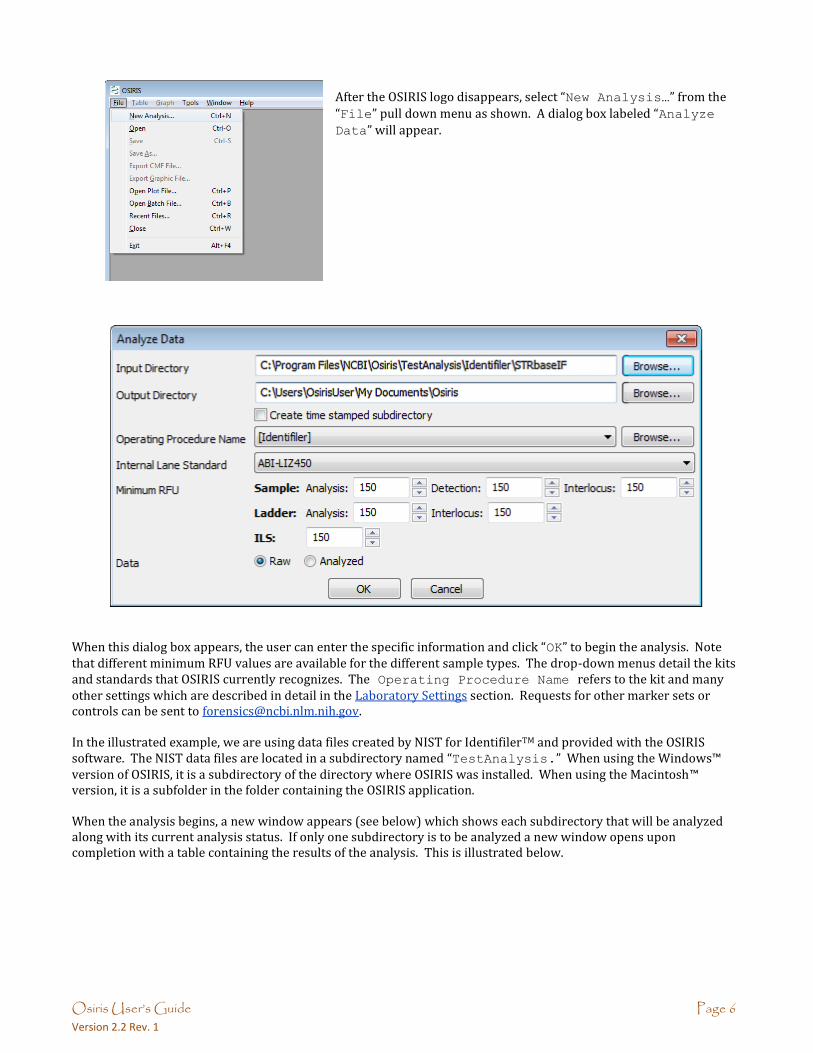
After the OSIRIS logo disappears, select “New Analysis…” from the
“File” pull down menu as shown. A dialog box labeled “Analyze
Data” will appear.
When this dialog box appears, the user can enter the specific information and click “OK” to begin the analysis. Note that different minimum RFU values are available for the different sample types. The drop-down menus detail the kits and standards that OSIRIS currently recognizes. The Operating Procedure Name refers to the kit and many other settings which are described in detail in the Laboratory Settings section. Requests for other marker sets or controls can be sent to [email protected]. In the illustrated example, we are using data files created by NIST for IdentifilerTM and provided with the OSIRIS software. The NIST data files are located in a subdirectory named “TestAnalysis.” When using the Windows™ version of OSIRIS, it is a subdirectory of the directory where OSIRIS was installed. When using the Macintosh™ version, it is a subfolder in the folder containing the OSIRIS application. When the analysis begins, a new window appears (see below) which shows each subdirectory that will be analyzed along with its current analysis status. If only one subdirectory is to be analyzed a new window opens upon completion with a table containing the results of the analysis. This is illustrated below.

Osiris User’s Guide Page 7 Version 2.2 Rev. 1
From the table above, the user can choose which peak data to display (alleles, base pairs (BPS), RFU, time, peak area), view plots containing the data, and edit the data. This is accomplished using the toolbar buttons at the top of the table window, the pull down menu labeled “Table” on the menu bar, or by right clicking the table cell of interest to display a popup menu. Note that when a cell is highlighted on a table, notices and detailed information appear in the bottom

Osiris User’s Guide Page 8 Version 2.2 Rev. 1
right pane of the window. There is a “Preview” option on the toolbar menus that toggle the display of a plot showing the peaks of the currently selected sample and allele. This is on by default but can be turned off in order to show more rows in the table. As you may have noticed, there are many colors used for the table cells. These colors can be modified and are explained in the “Grid Colors” section. Allele calls and artifacts can be edited as described in the “Table Toolbar and Menu (Editing)” section.
To view a more detailed graphical representation of one of the samples, click on the row of the desired sample and select the “Graph” button on the toolbar. Following is an example.
The image above shows a graph of the electropherograms. By default, there is a separate plot for each channel. The toolbar at the top of each plot as well as the pull down menu labeled “Graph” provides many options which are described in detail in the section titled “OSIRIS Plot Files.” Recently viewed files can be accessed through a dialogue window by selecting “Recent Files…” from the “File” pull down menu, as shown at right. An example is shown below:

Osiris User’s Guide Page 9 Version 2.2 Rev. 1
This list shows up to 1000 files that have been opened by OSIRIS and can be sorted by name, type, last time viewed, modification time, or location. To open a file, double-click on the file name or select one or more files and select the “OK” button. You may select and view up to 10 files at a time. To search for a desired file, simply type part of the file
name in the “Search” text box at the top of the window and the list will be updated immediately to filter out all files that do not match the search criteria.
This concludes the quick-start tutorial. More detailed information about OSIRIS’ features can be found in subsequent sections of this guide.
Configuration OSIRIS has a number of parameters that can be configured to your specific protocols including laboratory settings and the colors to display in the analysis table.
Lab Settings The laboratory settings are maintained in one or more Operating Procedures. These Operating Procedures define a specific kit or marker set along with many lab settings which can be configured in OSIRIS. OSIRIS provides many predefined Operating Procedures, one for each supported marker set. These pre-defined Operating Procedures cannot be modified by the user but are used as templates for creating new operation procedures with laboratory specific settings. User-created Operating Procedures can be protected from unauthorized changes by setting the permissions of the \Osiris\site\Volumes directory where the Operating Procedure folders are stored. If a systems administrator is unavailable to help with these settings please contact us at [email protected] and put “OSIRIS Permissions Request” in the subject line. To configure OSIRIS, select the “Lab Settings” option under “Tools” on the menu bar as shown in the figure. This brings up the Lab Settings window with many options including: File Names, Locus/ILS Thresholds, Sample Thresholds, Allele Exceptions, and Acceptance/Review, which are discussed in the following sections.

Osiris User’s Guide Page 10 Version 2.2 Rev. 1
Add a new Operating Procedure To add a new Operating Procedure, click the “New” button and select a predefined or previously created procedure and enter the new procedure name. The names of the predefined Operating Procedures are enclosed in brackets. It is recommended that any newly created procedures not have a name enclosed in brackets in order to easily distinguish them. The new procedure can be saved at any time by clicking on the “Apply” button at the bottom of the lab settings window and is also saved when closing the window by clicking on the “OK” button. The following sections describe in detail the available lab settings for an Operating Procedure. If a laboratory is going to add positive controls or accepted off-ladder alleles to an Operating Procedure, the user can save time by entering those, then using the new Operating Procedure as a template for modified Operating Procedures.
General - .fsa and .hid files The first ‘tab’ in the lab settings window is labeled ‘General’ and is used for basic settings. These settings include the setting for the default internal lane standard, whether the files are Raw or Analyzed data, and whether the file type is .fsa or .hid. Other lab settings may also need to be adjusted when customizing an Operating Procedure for one file type or the other. Three other settings, Protocol, Lot Nr., and notes do not affect the analysis, but are used for documenting the analysis and are copied to the output files during an analysis.
File/Sample names The “File/Sample Names” tab is used to determine the type of an .fsa or .hid file by its file or sample name,
using the “Search by:” “File name” or “Sample name” radio buttons, which control whether OSIRIS looks for sample type strings in the sample file names or sample names. As selected in the figure, OSIRIS will only search the file name for sample type stings. Note that if this setting is changed after analysis, the samples must be reanalyzed for the change to take effect. This allows users flexibility to use either the file name or the sample name in the file to designate samples controls and ladders. The names shown in the figure include ladder, positive control, negative control, and all types defined by the guidelines for creating CMF files. You cannot add or delete the categories from this list defined by the CODIS CMF guidelines. However, you can customize any of the sample types within each category to match names used in your laboratory. At a minimum, users must specify enough information to identify ladder, positive control and negative control files.

Osiris User’s Guide Page 11 Version 2.2 Rev. 1
In the following example, OSIRIS identifies a file as a negative control if it finds a name containing one of the character strings in the large text box in the middle of the window shown below “Negative Control.” You can also add any names that are commonly used by your laboratory or remove any names that you don’t want from the OSIRIS default list by editing the list. OSIRIS comes with a number of commonly used name strings for standard controls. When OSIRIS encounters any of these strings in a name it will automatically assign the control type to the sample and check to make sure that the control meets expectations. In the example below, any sample with a listed string in its file name will be identified by OSIRIS as a negative control. It will (a) identify that a valid ILS exists for the sample, (b) determine that primer peaks are present in the sample and (c) determine if there are other peaks in other channels and notify the user if any of these conditions are violated for the criteria set for negative controls. Similarly, if the negative control string used in your lab is NOT on the list, OSIRIS will issue a warning stating that no negative control was found.
Following are some example file names and whether or not they would be identified as negative controls given the specifications in the figure above. If “Search by: Sample name” is selected, it will search sample names instead.
File Name Negative Control f001-neg.fsa yes, contains ‘neg’ sample( - ) ctrl.fsa no (spaces within parentheses) ctl-positive.fsa yes, although the name is misleading, it contains ‘ctl-’ NormanEvanGordon(neg).fsa yes cntrl-1.fsa yes, contains ‘cntrl-’
The user must ensure that the search criteria are not ambiguous. For example, if “ctrl-” is used to indicate a
negative control, and “positive” is used to indicate a positive control, then a file named “ctrl-positive.fsa” is ambiguous and might produce unpredictable results. We recommend that users delete strings not used in their laboratory to avoid having samples that inadvertently contain control name strings.

Osiris User’s Guide Page 12 Version 2.2 Rev. 1
Positive control name search criteria are entered in the list in the figure above. OSIRIS can use several predefined positive controls and user-defined positive controls to validate control allele values. The user can enter a predefined positive control name in the “Standard Control Name” box, such as 9947a shown in the figure above, to set the default to validate 9947a positive control values. In this case, if any of the strings in the Positive Control list above is in a file name, OSIRIS will designate it a positive control and validate the allele values for 9947a. Appendix A has a list of the positive controls predefined for each kit. The default can be overridden to validate a different predefined control by putting both the search string and control name in the name search criteria, such as “pos9948.fsa”to designate the positive as 9948 instead of 9947a in the
example above. Alternatively, “9948” could be entered in the list above, in which case “9948.fsa” would be validated as a 9948 positive control. The default positive control can be changed to 9948 by entering that value in the “Standard Control Name” box in the figure above. The “Standard Control Name” will display in the last column of the locus table in the table view. User-defined custom positive controls are entered in the Assignments tab as described below. A user-defined positive control can be set to the default positive control as described below. Following are some example file names and whether or not they would be identified as positive controls given the specifications in the figure above.
File Name Positive Control
Positive Control
9947a.fsa No, doesn’t contain a string in the list above pos9947a.fsa Yes, contains ‘pos’ 9947a (default) Positive.fsa Yes, contains ‘pos’ 9947a (default) pos9948.fsa Yes, contains ‘pos’ 9988 ctl-positive.fsa No, although the name contains ‘pos’, it also
contains ‘ctl-’, OSIRIS checks for negative controls first

Osiris User’s Guide Page 13 Version 2.2 Rev. 1
Locus/ILS Thresholds The “Locus/ILS Thresholds” section is used for setting maxima and minima for a number of different locus and ILS thresholds for samples and ladders. As shown here, default thresholds can be set for each value, or these can be overridden (or set individually if there is no default value) for each locus. ILS thresholds are set by scrolling to the right all the way to the last column in the Locus Limits for
Ladders/ILS table.
Fractional filter – a threshold to
eliminate allele calls and to make critical artifact calls non-critical below a proportion of the highest peak in the locus. For interlocus peaks the proportion is of the highest peak in any of the loci in the channel. If the fractional filter is set to 0.2, and the highest peak in the locus is 1000 RFU, critical artifacts and allele peaks below 200 RFU will not be called and any artifacts will not be critical.
Pull-up fractional filter – a threshold to make critical artifacts non-critical and eliminate allele calls for
pull-up peaks below a fraction of the highest peak in a locus. If the pull-up fractional filter is set to 0.2, and the highest peak in the locus is 1000 RFU, no critical artifacts or alleles will be called for pull-up peaks below 200 RFU.
Max. Stutter threshold – the proportion of the major peak RFU below which “minus stutter” peaks will not
have an allele call. Minus stutter peaks are one repeat smaller than the major peak.
Max. plus Stutter threshold – the proportion of the major peak RFU below which “plus stutter” peaks will
not have an allele call. Plus stutter peaks are one repeat larger than the major peak. This setting can be helpful for loci that have plus stutter, or increased stutter between peaks separated by a repeat (e.g., stutter at 31 between alleles 30 and 32) because the plus stutter and the minus stutter thresholds are additive where they overlap (such as at the 31 peak between alleles 30 and 32).
Adenylation threshold – the proportion below which minus-A “adenylation peaks” or shoulders in the n-1
position will not have a critical artifact or allele called. This setting does not affect peaks that fall in an n-1 position in the ladder.
Min. homozygote threshold – the threshold below which a critical artifact will be triggered for a single peak in
a locus. Min. homozygote threshold should be set to a value that ensures that stochastic allele dropout will be detected. If the homozygote threshold is not set high enough, stochastic (random) effect may make the RFU of the second allele peak of a heterozygote fall below the detection threshold (if set, otherwise below the analysis threshold) and hence not be detected by OSIRIS. Therefore, the laboratory should determine a homozygote threshold that is appropriate for their process. Typically this would be approximately the detection (or analysis) threshold plus the laboratory’s stochastic threshold.
Locus limits for ladders/ILS limits – these settings behave in essentially the same way as the sample
settings, but apply only to the ladders and ILS. Note that the “Default” settings apply only to the ladders. Scroll to the right for the ILS settings. The default lab settings supplied in the Operating Procedures generally give robust identification of ILS and ladders provided with most kits. They can be modified if ladders or ILS are within normal RFU ranges but OSIRIS does not appropriately identify peaks.

Osiris User’s Guide Page 14 Version 2.2 Rev. 1
Sample Thresholds The figure on the right shows the available parameters for “Sample
thresholds” which can be set for samples, ladders or ILS, including the minimum RFU for peak detection, peak analysis and interlocus peaks, as well as the maximum analysis RFU threshold.
The “RFU Limits” table is where the user sets laboratory-determined RFU thresholds.
Analysis Threshold is the RFU
level below which alleles and most artifacts will not be called.
Min. Interlocus Threshold is
the analysis threshold for peaks in areas that lie between or beyond the extended locus boundaries. If not set, this defaults to the Analysis Threshold RFU. This may be set above (but not below) the Analysis Threshold RFU to prevent analysis of recurrent interlocus artifacts.
Max. RFU is the level above which
peaks will trigger an artifact notice.
Detection Threshold is the RFU
level at which peaks are analyzed. Alleles and artifacts below this threshold will not be analyzed. This threshold may impact analysis of negative controls, homozygous loci and noise if there are peaks with RFU values between the Detection and Analysis Thresholds. (See settings below.) If not set, or if set above the Analysis threshold, the Detection Threshold defaults to the Analysis Threshold RFU value
There is also a checkbox labeled “Allow User to Override Min.
RFU.” If this is not checked, the user cannot modify any of the RFU parameters with each analysis and will only be able to analyze the sample using the RFU thresholds set here. When it is checked, the user can modify RFU thresholds when performing a new analysis. Note that modification of the RFU thresholds during a new analysis triggers a notification in the analyzed data indicating that the RFU thresholds were modified.
There are two categories of Sample Limits settings. The settings highlighted in green in the figure affect the sample QC analysis and whether notifications and artifacts are triggered. The settings highlighted in pink generally trigger notifications if multiple artifacts occur in a sample or a plate. These settings can be used to judge the severity of sample quality problems or problems that affect the quality of the entire analysis batch or plate. Thus, the settings highlighted in pink can be used for DNA analysis QA. Note that these settings do not affect triggering sample artifacts and notifications. So, if the “Max. No. of pullups peaks per sample” is set to 2 and the sample has only a single pull-up peak, that peak will still trigger an artifact and notification. If the sample has three pull-up peaks, in addition to the artifact and notification triggered by each pull-up, the sample would also trigger a notification that the maximum number of pull-ups had been exceeded.

Osiris User’s Guide Page 15 Version 2.2 Rev. 1
The two sample limit parameters in the “Sample Limits” table marked with red stars directly affect the sample analysis and must be set. Values marked with green stars are also important as they affect the algorithm for the software’s rework estimation to use more, less or the same amount of sample DNA in a reamplification, however they are not mandatory. The ‘-’, ‘+’ and ‘r’ beside the stars indicate that those settings affect “reamp less”, “more” or “regular”/reinject recommendations. See the discussion in Appendix C. The other sample limits that are highlighted pink, but are not starred are quality assurance measures that may indicate the quality of the entire analysis run and can be used for process analysis. They do not affect either the analysis of the sample or the identification of sample artifacts and are therefore optional. See the discussion in Appendix D regarding QA for further information. Please contact us about additional parameters that would be useful ([email protected]). Note that any numeric parameter (as opposed to a checkbox) that is left blank will not be tested; entering a zero sets the value to zero.
Settings that affect sample analysis
Max. residual for allele (<0.5) parameter sets the maximum difference between the base pairs of the
allele peak compared to the ladder peak as a fraction of one base pair. A value of 0.25 indicates that alleles that fall within ±0.25 base pair of the comparison ladder allele center are not flagged for human review. OSIRIS typically performs well with this value and it should be a starting point for determining a laboratory’s own setting. See the discussion of excess residual for further information regarding this setting. Ignore artifacts smaller than indicates that artifacts whose computed base pairs are less than this setting
should be ignored. This value should not be changed from the kit default without consideration of the smallest allele that is known to be found. If this size is increased it can take precedence over other kit defined allele size identification parameters. See the description of kit definitions for further information. Incomplete profile threshold for Reamp More/Reamp Less is a value that OSIRIS uses to differentiate
between profiles with locus dropout due to insufficient target DNA and profiles with locus dropout due to degradation when it is estimating whether it would be better to use more or less target DNA in a reamplification. Laboratories may have to experiment to determine an appropriate value for their process. Maximum Number of Triallelic Loci in an Unmixed Sample affects how many loci OSIRIS will accept
in a sample without triggering a mixed sample message. Raised Baseline Threshold for Samples (RFU) and for Sample ILS Channels (RFU)
parameters set the threshold for raised baseline detection in the allele channels and the ILS channel respectively. Raised baseline can result in minor peaks either not being called or appearing to have a higher RFU than they should actually have. Minimum Height for Primer Dimer Peaks (RFU) sets the minimum threshold for identifying primer peaks
in the negative control. This threshold can be empirically determined by the laboratory. It should be set well above the height of any pull-up peaks caused by the internal lane standard channel, but below the maximum threshold intensity for the detection platform. Minimum Number of Peaks per Channel in Primer Dimer for Negative Control helps to
discriminate the primer peaks in the negative control. This should be set to at least two peaks. Test for Presence of Sub-Analytic Peaks in Negative Controls will cause negative controls to be
flagged if there are peaks whose RFU fall below the analysis threshold, but whose RFU is greater than the detection threshold. Peaks in the negative control that fall in the range between the detection and analysis thresholds may detect low level contamination before it becomes an issue in the laboratory. Test for Excessive Noise Above Analysis Threshold (Checked) or Below (Unchecked)
causes OSIRIS to flag samples when excessive baseline noise occurs, including below the analysis threshold (but above detection threshold), or only when it occurs above the analysis threshold. This setting is active only if the excessive noise test is activated (below). Enable Test for Excessive Noise tests for excessive noise in the baseline. Excessive noise in the baseline
can result in minor peaks not being called. See the explanation of excessive noise in the artifact handling section.

Osiris User’s Guide Page 16 Version 2.2 Rev. 1
Make Pull-up at Allele Artifact Non-Critical setting determines whether “Pull-up at Allele” will be
reported as a critical (unchecked) or non-critical artifact. Typically, the Pull-up at Allele artifact occurs when actual allele peaks in different channels comigrate. Users that wish to be notified if alleles in different channels comigrate should uncheck this setting. Flag Mixed Samples and Triallelic Loci causes OSIRIS to flag triallelic loci and loci with four or more
peaks. Samples with one or more loci with four or more alleles or that have a number of loci with trialleles that exceeds the threshold set for mixed loci will be flagged as mixed samples. Recommend Amp More on Low Homozygote causes OSIRIS to flag samples with a homozygote peak below the
acceptable homozygote threshold or with a homozygote that has a peak between analysis and detection thresholds that is not a known artifact (stutter, etc.) for reamplification with more DNA. Select Reamp Regular (Checked) vs. Reinject (Unchecked) determines whether OSIRIS will flag
samples needing rework for reinjection or reamplification. The setting of this parameter will depend on whether the laboratory process is designed with reinjection or reamplification in mind. Recommend Rework if Laser Off Scale Found will cause OSIRIS to flag samples with off-scale data for
reamplification with less DNA. Attempt to apply Embedded Color Correction Matrix causes OSIRIS to apply the color matrix to .fsa
files where it has not already been applied (some Applied Biosystems 310 Genetic Analyzer files). These files appear to have extreme pull-up, and will fail to analyze correctly without application of the matrix. Files without an embedded color matrix, where the color matrix has already been applied, such as those produced by the 3100 and higher Genetic Analyzers, will be unaffected if this parameter is set. However, if an Applied Biosystems 310 Genetic Analyzer file has had the color matrix applied and also has an embedded matrix analysis, it will be adversely affected by reapplication of the matrix with this parameter. Ignore noise analysis in smoothing when above detection threshold causes OSIRIS to detect
peaks above the detection threshold even in the presence of noise. We suggest selecting this parameter unless the user sees an excessive number of insignificant peaks detected. Checking this parameter may be beneficial when using OSIRIS with very low analysis or detection thresholds (below 75). This parameter is probably unnecessary for analysis and detection thresholds greater than or equal to 100 RFU, or if baseline normalization is specified. (See below). Test for Primer Dimer Peaks in Negative Controls causes OSIRIS to perform the test for primer
peaks in negative control samples. When unchecked the test is not performed. Apply Fractional Filter to Peaks Below Analysis Threshold causes OSIRIS to apply the fractional
filter (if set) to peaks below the analysis threshold and above the detection threshold in homozygous loci. If this is left unchecked, the fractional filter will not be applied to peaks below the analysis threshold, but will be applied (as set) to peaks above the analysis threshold. Note that this case can result in a situation in a homozygous locus where a peak between the analysis and detection threshold would trigger a notification, but a peak slightly above the analysis threshold would not, because it was filtered out by the user-defined fractional filter settings. Do Not Call OL Crater If Laser In Scale and Raised Baseline causes OSIRIS to not call a crater
as an allele if: there is no off-scale data at the artifact location; there is raised baseline in the artifact channel; and if the artifact is off-ladder. Very small crater artifacts can be called when the analysis threshold is set low enough that a raised raw data base line is above or even near the analysis threshold. Since there is no off-scale data at this artifact location, pull-up is unlikely in this situation. Selecting this parameter will reduce the number of small crater critical artifacts also called as alleles. Editing will allow the allele call to be re-applied to the peak. Do Not Call OL Allele If Pull-up causes OSIRIS to not mark with an allele call those peaks that are flagged
as both pull-up and off ladder. Selecting this parameter will reduce the number of allele calls on pull-up artifacts, but does not affect flagging the artifact and artifact notification. This may reduce the amount of editing required to remove pull-up allele calls from the graph and table. Editing will allow the allele call to be re-applied to the peak.

Osiris User’s Guide Page 17 Version 2.2 Rev. 1
Do Not Call OL Alleles If Excessive Number of OL’s causes OSIRIS to not mark with an allele those
peaks that are off ladder if the “Max. off-ladder alleles per sample” threshold is exceeded. Selecting this parameter may reduce the number of pull-up or shifted peaks that are labeled with an allele. However, if this rule is triggered, genuine off-ladder alleles will also not be labeled. Editing will allow any affected allele calls to be re-applied to their peaks. Call Peaks That Are Identified As Adenylation If On-Ladder causes OSIRIS to call peaks as
alleles if they are on-ladder or “accepted” alleles. For example, when this parameter is selected, in a mixture where there is a major contributor allele 9, a minor 8.3 peak that was below the adenylation threshold would be called as an 8.3 allele if there is an 8.3 ladder allele or if the 8.3 allele is indicated as an accepted allele in the Off-ladder
alleles list on the Assignments tab in the Lab Settings. Do not call alleles with excess residuals causes OSIRIS to not call an allele for any peak flagged as
having excess residual. Selecting this parameter can reduce the number of allele calls on artifactual peaks such as those with shifting. Editing will allow the allele call to be re-applied to the peak. Do Not Report Heterozygous Imbalance If Sample Is A Mixture causes OSIRIS to not trigger a
heterozygous imbalance notice in any locus in a sample if the sample meets the conditions to be flagged as a mixture. Test Adjusted Signal Heights Relative To Baseline (Overridden by below) causes OSIRIS to
calculate a dynamic baseline but not to normalize the raw data. Instead, OSIRIS uses the dynamic baseline to calculate a relative peak height for each peak. The relative peak heights are used to reassess three potential artifacts: below Analysis Threshold, stutter and adenylation. If a peak has any of those three artifacts before calculation of the relative heights, then the relative height is irrelevant, the peak is given a non-critical artifact, and is not called as an allele. However, if none of those three conditions holds for the absolute peak height, they are each reassessed using the peak’s relative height. If any of the three conditions hold for the relative height, the peak is not called as an allele and is given a critical artifact. Because this new artifact is critical, the peak can be edited by the user. The effect is to calculate peak heights corrected for the baseline and use those corrected peak heights in artifact determination. If the next preset below (“Normalize Raw Data…”) is selected, this preset is ignored by OSIRIS. Normalize Raw Data Relative to Baseline (Overrides above) Baseline normalization eliminates
many of the artifacts associated with raised baseline by calculating the raw data baseline and subtracting it from the raw data. Selecting this preset causes OSIRIS to calculate a dynamic baseline and normalize the raw data with respect to it. Peaks are refit with respect to the new raw data and the usual artifacts are called. The critical artifact notices triggered by the “Test Adjusted Signal Heights…” parameter are not used with this option. Selecting this
parameter causes “Test Adjusted Signal Heights…” to be ignored and the critical artifact notices not to be
triggered by that option. The effect is to subtract the calculated dynamic baseline from the raw data before detecting alleles and artifacts. Ignore Effects of Negative Relative Baseline – this preset applies to either of the options, “Test
Adjusted Signal Heights…” (1) or “Normalize Raw Data…”(2). When this is selected, a negative baseline is
treated as if it is 0. When this is unselected, the dynamic baseline is subtracted either from affected peaks (1) or the raw data (2), whether its value is positive or negative. If neither preset 1 nor preset 2 is set to “true”, then the setting of this preset is irrelevant to Osiris operations. Default = Selected (true).
Settings that indicate sample/batch severity (quality assurance metrics)
Turning these tests off does not affect the identification of sample artifacts. These tests trigger notifications that indicate multiple artifacts in a sample or batch and can be used either for judging the severity of sample artifacts of are for process QA, rather than identification of individual sample artifacts. Max. No. of pullup peaks per sample will trigger a notification if the number of pull-up peaks in a sample
exceeds the limit.

Osiris User’s Guide Page 18 Version 2.2 Rev. 1
Max. No. of stutter peaks per sample will trigger a notification if the number of stutter peaks in a sample
exceeds the limit. See the explanation of stutter in the artifact handling section. Max. No. of adenylation peaks per sample will trigger a notification if the number of minus-A peaks
lacking adenylation in a sample exceeds the limit. See the explanation of adenylation in the artifact handling section. Max. off-ladder alleles per sample will trigger a notification if the number of off-ladder alleles in a
sample exceeds the limit. Maximum No. of Peaks with Excessive Residual will trigger a notification if the number of peaks in a
sample that have excessive residual exceeds the limit. See the explanation of Excessive Residual in the artifact handling section. Total Number of Samples with Excessive Pull-up will trigger a notification with the number of
samples in the batch with excessive pull-up. Percent of Samples with Excessive Pull-up will trigger a notification if the percentage of samples in the
batch with excessive pull-up exceeds the limit. Maximum Number of Homozygous loci will trigger a notification if the number of homozygous loci in a sample
exceeds the limit. Maximum Number of Triallelic loci will trigger a notification if the number of triallelic loci in a sample
exceeds the limit. Maximum Percentage of peaks with Pull-up will trigger a notification if the percentage of peaks with pull-
up in a sample exceeds the limit. Maximum Percentage of alleles with Excessive Residuals will trigger a notification if the
percentage of alleles in a sample exceeds the limit. Maximum Number of craters in sample will trigger a notification if the number of craters in a sample
exceeds the limit. Maximum Number of Spikes in a Sample will trigger a notification if the number of spikes in a sample
exceeds the limit. Summary locus refers to events that occur in a locus in multiple samples in a batch. Summary Locus: Maximum Number of Sample Loci with Craters will trigger a notification if the
maximum number of samples in a batch that have craters at a particular locus is exceeded. For example if this is set to 10 and 12 of the samples in a batch have craters at TH01, OSIRIS will trigger a notification Summary Locus…Percent of Loci with Craters will trigger a notification if the percentage of samples in a
batch that have craters at a particular locus is exceeded.

Osiris User’s Guide Page 19 Version 2.2 Rev. 1
Assignments The “Assignments” section allows the user to override certain alleles or combination of alleles that would normally be flagged by OSIRIS for human review. When alleles or sets of alleles are entered in these sections, OSIRIS treats their appearance as “normal” unless they deviate from other threshold settings. The exceptions are specified separately for each kit and there are four types of exceptions; Off-ladder alleles, Sample trialleles, Control trialleles, and Positive controls.
For each type of exception, the specific alleles can be designated for each locus. It is not necessary to add ladder alleles in the “Off ladder allele” assignments. While OSIRIS will work properly, it may slow performance. The following is an example for off-ladder alleles for D8S1179:
For sample trialleles, three alleles are entered in each cell so that each cell contains an accepted triallele as shown below.

Osiris User’s Guide Page 20 Version 2.2 Rev. 1
The “Positive controls” Allele Assignments table in the Figure below allows the user to define laboratory-specific positive controls. OSIRIS identifies laboratory-specific positive controls first by checking the file name (or sample name, if selected) for values listed in the positive controls “File Name Search” column in the figure below. Specifying substrings for two different controls in which one substring is contained in the other, may not produce the desired results. If both Joe10 and Joe102 are in the “File Name Search” list, Joe102 in the sample name may be matched as Joe10, because the string Joe10 is contained within Joe102. Unfortunately, the order in which control names are stored within OSIRIS may not be the same as the order they are listed in the test window. Therefore, for best results, choose search strings that uniquely identify their corresponding positive controls, such as Joe10 and Joe01. The value entered in the “Control Name” column will be displayed in the “+Ctrl” column of the analysis table. When entering laboratory specific positive controls, it is probably least confusing to list the positive control search string value in both the “File Name Search” column of the “Positive control” Allele Assignments table and
the “Positive Controls” list in File Names tab. A laboratory-specific positive control can be designated as the default positive control. To do this the user must enter the same value in both the “File Name Search” column and the “Control Name” column. That value can then
be entered in the “Positive Control” “Standard Control Name” box in the File Names tab described above.
Filenames with any of the search string values in the “Positive Control” list on the File Names tab will be
validated for that user-defined control. For example, if “K562” is entered as the “Control Name” and “File Name
Search” values below (with the appropriate alleles) and the “Standard Control Name” value on the “Positive
Control” list on the File Names tab, a sample file named “pos.fsa” would be validated as a K562 positive control.
If a positive control has a triallelic locus, enter the three alleles in the “Positive controls” table. The
“Positive controls triallele” table does not associate the triallelic locus with a specific control, rather applies it in regard to all positive controls. This should only be used in specialized situations.

Osiris User’s Guide Page 21 Version 2.2 Rev. 1
Acceptance/Review The “Accept/Review” section of the Lab Settings is used to determine how many people must accept data containing notices or the number of people required to review data that has been edited. As shown below, the default is 1 person to accept data with notices and 2 people to review data that has been edited. The default applies to each of the categories listed except where a specific value is given to one of the categories. Please note that the number of people needed to review edited data includes the person who is doing the initial analysis/editing, so the example below requires one person to accept alerts and a second person to review the editing done. The “Allow User to Modify User Name” option allows the user to change his or her name in the “User ID” box when accepting, reviewing, or editing data. This can be helpful in situations where a single user is evaluating or validating the software and may want to be able to perform both editing and review as two different users. When this tick box is cleared, the “User ID” defaults to the user’s login name and if more than one user is specified for accepting alerts or reviewing editing, the users performing those tasks must have different user names. This enforces laboratory policies that do not allow self-review. If the “Allow automated export when analysis needs
attention” check box is checked, OSIRIS will run an automated export (such as data export for a LIMS) even if there are notices that require acceptance and review. If check box is cleared, automated data export will not occur when there are notices. Details about user defined file export are described in a later section.
Please note that all data for each sample must meet these thresholds before the data can be exported in the CMF format. Other export formats may need to meet these thresholds depending on how they are scripted and the parameters they require. If the checkbox labeled “Allow automated export when analysis needs attention” is not checked, then no automated user defined file export will be performed when any part of the new analysis file needs review. Also, if this is not selected, exporting to any user defined format initiated from the “File” menu on the menu bar does not require the user to accept alerts and review editing, but the user will be prompted with a warning.
Upon completion of the lab settings, the user must press the button labeled “OK” or “Apply” in order to save the settings. As mentioned before, it is important that when OSIRIS is upgraded to a new version, the folder where it is installed must be the same as the previous version in order to retain these settings.
When OSIRIS software is updated, the default kit Operating Procedures are also updated to reflect any changes in the newer version. However, customized Operating Procedures are not updated. OSIRIS retains all the Lab Settings and other parameters associated with the message book in customized Operating Procedures so that an analysis can be reproduced. The customized OPs are not erased when OSIRIS is uninstalled and reinstalled. As mentioned before, it is important that when OSIRIS is upgraded to a new version, the folder where it is installed must be the same as the previous version in order to retain these settings.
When upgrading to a new version of OSIRIS, a new version of the users’ customized Operating Procedures should be created so that they will reflect the changes to the software rules in the message book (described in Appendix A). This is explained in detail in Appendix B.

Osiris User’s Guide Page 22 Version 2.2 Rev. 1
Grid Colors There are many colors used to display the analyzed data in a table. These colors are used to indicate if the data in the table cell or the entire sample has been edited, has notices, or has been disabled. These colors can be modified as follows: First select “Edit Grid Colors” from the “Tools” pull down menu to show the “Edit Grid Colors” dialog window.
The image on the left shows the default colors and attributes for the data in the table. To modify these colors, simply click on the color that you want to modify. The buttons below each table are updated to reflect the current selection and you can make modifications. If you click on one of the “color” buttons below the top list, a color dialog will appear and allow you to change the color. The “Reverse” button adjacent to the color buttons will
swap the foreground and background colors. The “Attributes” table allows selection of attributes for table cells that need approval and table cells that have been edited. The attributes are bold, italic, and reverse. “Reverse” is used to reverse the foreground and background colors and is available only for cells that need approval because colors can be selected separately for cells that have been edited. All modifications are instantly reflected in the color and attribute tables and when the “OK” button is pressed; all analysis windows are updated to reflect these changes. Please note: The color settings are on a per-user basis and each user can set his or her preferences.

Osiris User’s Guide Page 23 Version 2.2 Rev. 1
Analysis When an analysis is performed, one or more input folders containing either .fsa or .hid files are analyzed and the
results are written to a new output folder for each input folder. File type is selected on the “General” tab of the “Lab
Settings” dialog. The output of the analysis consists of data containing alleles, artifacts, peak area, and smoothed electropherogram data. These data can be viewed in OSIRIS in the form of a table with peak information and graphical plots of the smoothed and raw electropherogram data. The tabular data can be exported to a CODIS Common Message Format (CMF) 3.2 file and the graphical data can be exported to a Portable Network Graphics (PNG) file which can then be imported into various applications including most word processing, spreadsheet, and presentation graphics programs or displayed on a web site. There is also an option to create user defined export files using the XSLT language as described in detail in Appendix E. and Export Setup Tutorial
To begin an analysis, open the “Analyze Data” dialog window by selecting “New Analysis…” from the “File” pull down menu as shown below:
Following is a description of the parameters used for analyzing data:
Input Directory. This is the directory or folder which contains either .fsa (or .hid) files or contains
subdirectories that have files to be analyzed. OSIRIS will begin looking in the specified directory and traverse all subdirectories searching for files to be analyzed. Each directory that contains one or more .fsa (or .hid) files will be analyzed. Only one file type can be analyzed per run, as specified in the Lab Settings.
Output Directory. This is the directory or folder that will contain the output files of the analysis. A subdirectory
with the same name as the input directory will be created and if more than one input directory containing .fsa (or
.hid) files is found, the output directory will contain the same hierarchy as the input directory tree. Each analysis will create several output files. OSIRIS will allow the user to view report and plot files, whose filenames have the extension of .oar and .plt, respectively. The report (.oar) file contains the tabular data for an entire directory and
there is one plot (.plt) file for each sample. There are also various text files in the output directory with either the
.txt extension for viewing in a text editor, or tab delimited (.tab) files which are better viewed with a spreadsheet
program. The plot (.plt) files have the same name as their corresponding .fsa or .hid input files except for the file
name extension. After editing, saving creates an edited report file (.oer). All other output files begin with the name of the output folder or directory, with some containing a suffix before the file name extension.

Osiris User’s Guide Page 24 Version 2.2 Rev. 1
Create time stamped subdirectory. If this checkbox is selected, OSIRIS will create a new subdirectory in the
output directory that is time and date stamped, which prevents an analysis from being overwritten on reanalysis. Operating Procedure Name. Select an Operating Procedure that contains the kit or marker set that was used to
produce the data being analyzed. To see detailed information for the Operating Procedures, select the “Browse” button where you can also choose the desired Operating Procedure in the resulting dialog window. Minimum RFU. Select the minimum RFU for samples, ILS, ladder data, and interlocus peaks. The default values are
obtained from the lab settings. If the lab settings are specified to not allow the user to override these parameters, then user input to these fields is disabled.
ILS. Select the appropriate internal lane standard for your data. This list is updated from the typing kit information
when the Operating Procedure is selected. If the selected Operating Procedure does not allow the user to override the ILS, then this pull down menu is disabled. Data. Select whether to obtain the raw or analyzed data from the .fsa files. If “Analyzed” is selected and there is no
analyzed data in the .fsa file(s), the results will indicate this condition. If the selected Operating Procedure does not allow the user to override the setting, then this selection is disabled. When the “OK” button is pressed, the analysis begins and a new window appears with the status of the analyses as shown below.
This window shows a list of each directory being analyzed; however because we selected a single directory our example shows only one item. The status column shows one of the following: pending, canceled, running, failed, or completed. If the status is pending or running, it can be canceled by selecting one or more rows and pressing the ‘Cancel Selection’ button. If the status is ‘failed’ or ‘completed’ the tabular and graphical data (.oar file) can be
viewed either by double-clicking the item or selecting one or more items and pressing the “View Selection”
button. In the lower right corner of the window is a button labeled “Details.” When pressed, the details of the selected analyses are displayed or hidden at the bottom of the window. Once the analysis is complete, the information is stored in a file in the output directory. This file is automatically named beginning with the name of the folder followed by the date and time and finally with the file extension .obr for OSIRIS Batch Report. This file can be viewed
later to show the details and/or open the tabular (.oar and .oer) files. To retrieve an .obr file, select “Open
Batch File…” or “Recent Files…” from the “File” pull down menu on the menu bar.

Osiris User’s Guide Page 25 Version 2.2 Rev. 1
OSIRIS Report Files The OSIRIS report files, also known as analysis files, contain information about the peaks found in the electropherogram data including alleles, peak area, RFU, base pairs, mean peak time, artifacts, and alerts of potential problems. The file extension for the report files created by OSIRIS is .oar for “OSIRIS Analysis Report.” The data in
these files can be edited and saved with the file extension of .oer for “OSIRIS Edited Report.” To open a report file,
select “Open” from the “File” pull down menu on the menu bar and search for the desired file. To open a recently
viewed file, select “Recent Files…” from the “File” pull down menu. This will display a dialog window with up to 1000 recently viewed OSIRIS files of all types including report files. When a report file is opened, a window appears with split panes containing a table or spreadsheet in the top pane, optionally a graph in the middle, and alert info in the bottom. The borders between the panes can be moved by clicking and dragging with the mouse.
Analysis Report Table The output of our example analysis is shown above. Each row contains data for one sample. The first column contains an “” if any part of the sample needs attention and a check mark () otherwise. The second column contains an exclamation point (!) if there are any alerts related to the Internal Lane Standard and is blank if there are no alerts.
The third column contains the numbers of all channels that have channel level alerts. All other columns except for the rightmost column are used for locus information with a column for each locus. The locus column headings consist of the locus name, a hyphen followed by the channel number, and if there are any locus level directory messages, an asterisk (*) is also displayed. The order of the columns is by channel and then location or time of peaks within the channel. The vertical lines separating each column are black where two adjacent columns represent loci in different channels and grey otherwise. The rightmost column contains the name of the kit positive or custom positive control. The default color and attribute scheme for the table cells is as follows:

Osiris User’s Guide Page 26 Version 2.2 Rev. 1
White background, black text The entire sample has no alerts.
Yellow background, red text The cell has one or more alerts.
Pale yellow background, black text The cell has no alerts, but the sample has one or more alerts. The sample may or may not have been edited elsewhere.
Black italic text or ~, blue background The data in the cell has been edited.
Black text, light blue background The selected cell has not been edited, but the sample has been edited elsewhere, and the sample has no alerts.
Red italic text, blue background The data in the cell has been edited and it has one or more alerts.
Grey text with a lighter grey background. The sample has been disabled and will therefore be excluded if a CMF file is created. Disabled samples can also be re-analyzed.
Bold Text with the foreground and The cell needs attention, either alerts need to be reviewed background colors swapped or the editing needs approval.
As mentioned in the “Grid Colors” section, this color schema can be modified on a per-user basis.
Using Table Cells to Display Information Clicking on various cells in the table displays different information in the preview graph and the two panes at the bottom. When the table has the keyboard focus, the user can use the keyboard arrow keys move quickly from cell to cell. The effect of clicking on a cell in the following columns: Locus Displays the zoomed locus in the preview graph (if activated) and the shows the sample’s notices and peak information below.

Osiris User’s Guide Page 27 Version 2.2 Rev. 1
Sample name, “”, “”, or “+Ctrl” Displays all the channels for the entire profile in the preview graph, a summary of the sample’s notices in the lower right panel, and Acceptance and Review links with the required number in parentheses in the lower left panel.
ILS Displays the ILS in the preview graph, a summary of the sample’s notices in the lower right panel, and Acceptance and Review links with the needed count in parentheses in the lower left panel. Channels Displays only the channels for which there are notices in the preview graph, unless there are none, in which case it displays all channels. It displays a summary of the sample’s notices in the right hand notices box and Acceptance and Review links with the needed count in parentheses.
Plot Preview Graph and Graph Menu The preview graph displays a wide range of sample information that is instrumental in sample review. The preview graph can be turned on and off either through the table menu or by clicking the preview button on the toolbar. As described above, clicking or selecting various table cells will show different aspects of the plot data in the preview graph, such as by clicking on a sample’s D8S1179 cell to zoom the preview graph to display that locus, as shown in the figures on the right. The preview graph can be set to display information helpful in sample review, including the raw and analyzed peak data, various peak labels, analysis and ILS thresholds (if different), artifact markers, ILS peak positions and the comparison ladder allele peaks. Hovering the cursor over peak labels and artifact markers will display a hover box with peak information.
Preview graph
Preview graph with unlabeled ladder peaks

Osiris User’s Guide Page 28 Version 2.2 Rev. 1
Plot preview graph options can be found either on the “graph” menu or on the context menu that pops up as a result of right-clicking on the preview plot. Following is a description of each option in the menu: Data. This option allows the user to display raw plot data, analyzed plot data, and/or the comparison ladder alleles.
The comparison ladder allele peaks can be helpful in evaluating migration issues, microvariants and other off-ladder peaks. Channel. Allows the user to select one or more overlaid channel plots in order to evaluate peak alignment in
different channels in the event of cross-channel artifacts such as pull-up or spikes. To see the plots as stacked plots, view the sample plot in the graph window as described in the “OSIRIS Plot Files” section. Show ILS. Display or hide the ILS marker position lines.
Show Minimum RFU. Display or hide the analysis threshold lines. If the ILS analysis threshold differs from that of
the sample, and the ILS and any other channel and displayed, both thresholds will show. OSIRIS does not display the detection threshold. Labels. Displays or hides different sample peak allele labels including: Alleles, BPS, RFU, Time and Peak Area. When
peak labels are visible, hovering the mouse cursor over the label will display detailed allele information. Artifacts. Allows the user to choose whether and which artifact labels to display. When either Critical or All are
selected, artifacts are marked with an “A”. The options are None, All and Critical. Critical artifacts should be visible during editing, because these are artifacts that trigger notices requiring human intervention. As with the allele labels, hovering the mouse cursor over an artifact label will display detailed artifact information. Hovering over artifact labels shows different information than hovering over allele labels. Show ladder labels. Allows the user to display or hide the ladder allele labels when the comparison ladder is
displayed. Max. ladder peak labels. This option allows the user to select the maximum number of ladder labels to
display when the comparison ladder is displayed. Choosing a reasonable number, such as between 20 and 30 can prevent the display from becoming visually too noisy and confusing. When the user zooms out and the number of ladder peaks exceeds the maximum, the ladder labels automatically disappear. When the user zooms in again, they reappear. If this option is left blank, all ladder labels will display.
Table Toolbar and Menu (Editing) The toolbar at the top of the Table view window along with the “Table” pull down menu on the menu bar at the top of the OSIRIS window and the context (right click) menu have the following options: Graph, Preview, Edit, History, Sort, Parameters, Display and CMF. The menu also has items for accepting alerts, reviewing editing, disabling/enabling sample, and showing/hiding the toolbar.
The text box on the right side of the toolbar displays the original location and name of the ABI .fsa or .hid file used to create the analysis data in the highlighted row or cell of the table. This cannot be modified, but if the name is too long to be displayed in its entirety, the user can select the text box and move the cursor in order to expose the beginning or end of the file name.
Following is a description of each option in the toolbar and in the “Table” menu:
Graph button or Display Graph. This option will open a plot or graphic window with the electropherogram
data of the selected sample. This is a separate window not to be confused with the plot preview below the table. If the selected cell is in a locus column, the plot(s) will be zoomed to the area of that locus; otherwise the entire plot will be shown, excluding primer peak data. The plot window will display one plot for each channel unless the Shift key is
pressed. If the Shift key is pressed only one plot will be displayed. This is discussed in further detail in the next

Osiris User’s Guide Page 29 Version 2.2 Rev. 1
section, “OSIRIS Plot Files.” Double clicking any cell will display the graph, zoomed to the area of the locus. Single clicking a cell displays the locus in the preview graph below the table.
Preview button. This option will show or hide a plot panel immediately below the table to show the peaks of the
currently selected sample and locus. This plot is automatically updated when the user selects a different table cell.
Edit button, or Edit Alleles, Notices, and Notes. This option allows the user to edit notices and
notes relevant to the selected cell. If the selected cell is in a locus column, the alleles and in some cases artifacts can also be edited. The label on the pull down menu item or context (right click) menu is “Edit Locus Name” for a locus
column where the actual locus name is shown, and “Edit Notices and Notes” for the Channel or ILS columns. If a sample, ILS or channel is selected, hyperlinks display in the lower left notification area that will also allow the user to access the Edit Alerts window. Following is an example of the window displayed when selecting this option from the ILS or channel columns.
The user can edit, enable, or disable any Directory, Sample, ILS, or Channel notices on each tab. Entering notes helps explain the action taken for the follow-on reviewer. Following is an example of editing locus or allele peaks:

Osiris User’s Guide Page 30 Version 2.2 Rev. 1
The figure above shows a column for each peak found in the selected locus, D3S1358 in this example. The first four rows, Allele, BPS, Off-ladder, and Homozygote, can be edited if the peak is an allele. The allele value can be edited to a numeric value, but not to a non-numeric value, i.e., “12.1” will work but “Artifact” and “PU” will not. The bottom three rows, Allele Peak, Artifact Peak, and Critical can be modified to determine if the peak is an Allele, an Artifact, or both and also, for artifacts whether or not they are critical. Whether or not an artifact is critical determines how it is displayed in the plot window which is covered in more detail in the Artifact Handling section. The allele notices can also be disabled or edited in the same manner as the sample, ILS, and channel notices by simply selecting the “Notices” tab at the top of the window. Also, as with the sample, ILS, and channel notices, it is encouraged to enter notes describing all changes being made to the locus peaks and notices. Edit Directory Notices. This is similar to “Edit Notices and Notes” from the channel or ILS columns, except
the tab labeled “Directory Notices” is selected when the dialog window appears.
Accept Alerts. This menu option enables the user to accept alerts or notices for the selected directory, locus,
sample level notices, ILS notices, and/or channel notices.
When accepting directory, sample, channel, or ILS level notices, a window appears which displays the alerts and the user’s login name and allows the user to accept the notices, edit the notices, or cancel. This is necessary if one or more users must accept notices as indicated in the Lab Settings. Once the required number is obtained it is reflected in the table view by the color of the cell or the removal of an asterisk (*) after the sample name for sample level notices. Following is an illustration:
Window to accept sample notices. This is the same layout for ILS notices. For channel
notices, an additional column appears with the channel number.
If the user disables or edits any of the notices for a particular level (locus, sample ILS, etc.), the sample will then require review as opposed to acceptance. This will be reflected in the sample acceptance links displayed in the lower left window (when the sample, ILS or channel is selected) which will automatically change from ‘needs acceptance” to

Osiris User’s Guide Page 31 Version 2.2 Rev. 1
“needs review” links. The user can choose to “Accept” notices at the Directory, Channel, Sample, etc. levels without disabling notices, including “Artifact” and “Critical” status Allele level notices. This will be reflected in the acceptability of the sample; however the color and font in the table will reflect that notices still exist.
Window used to accept locus notices.
When accepting locus notices, a window like the example above appears with all of the locus information. The user can accept the notices, edit the locus, or cancel. Since it is possible that many loci will need approval, accelerator keys can be used for this operation (Microsoft Windows only). Alt+A will open the window to accept the selected locus, and when the window like the one above appears, pressing Alt+A again will accept it. After this, the user can use the arrow keys to select another locus in the analysis table.
Review Editing. This allows a
subsequent user to review editing of the directory, locus, sample, channel, or ILS alerts performed by the first user. The number of reviewers needed is indicated in the Lab Settings and includes the first person to perform the editing. This can also be accessed through the sample review links displayed in the lower left window when the sample, ILS, or channel is selected. The window that appears for reviewing the locus contains the history of the alerts, notices and notes for the locus as shown on the right. When reviewing or approving editing, the user can approve, edit, or cancel. This is necessary if one or more users must review editing as indicated in the Lab Settings. Once the required number is obtained it is reflected in the color of the cell or the removal of an asterisk (*) after the sample name for sample level editing. When approving editing for the sample, channels, or ILS, only the notices and notes appear with the history. When acceptance and review is complete at all levels (Sample, Channel, Locus, ILS, etc.), the red cell containing an “X” changes to a green checkmark.

Osiris User’s Guide Page 32 Version 2.2 Rev. 1
Disable (or Enable) Sample. This allows the user do disable a sample or (re) enable a sample. The reason to
disable a sample is that the analysis was not successful and it is desired reanalyze only a few samples or if you wish to exclude it from a CMF file.
Disable/Enable Multiple. This displays a window, as shown
on the right, which allows the user to disable or (re) enable multiple samples.
History. The history button or menu item is used to display the
data as it was saved in previous versions of the file. The history button or menu item displays a menu with a list of date and times the file was saved along with “Original” and “Current.” The
“Original” selection shows the original data obtained from the
analysis before anything was edited. The “Current” selection shows the data with any editing performed since the last time it was saved. For the analysis window the first item in the history menu is one of the following depending on the selected cell or row: View Sample Notices, View ILS Notices, View Channel Notices, or Allele Edit
History. This selection is enabled only for data that have a history of being edited and it displays a dialog window containing details of the editing performed and saved on the selected cell or sample.
The buttons adjacent to the “History” button are used to display state of the file at the previous and next times the
data was saved. If any historic time other than “Current” is selected, the selected date and time is displayed in the window title.
Sort. This allows the user to sort the samples according to various criteria. “Displayed
name” sorts by either file name or sample name depending on which is displayed in the names column of the table. “File name” and “Sample name” sort by those criteria respectively, independent of what is displayed in the names column of the table. When sorting by “Severity”, the actual severity is determined by the number of notices for the sample. A sample with no alleles found may be shown at the bottom even though it may be more severe than a sample with many alleles found, but that also has many notices. “Run Time” sorts samples by the time of analysis.
In any of the sort orders, if “Controls/Ladders on Top” is selected, it causes them to sort to the top followed by the samples in the selected order. Parameters… This button or menu item displays a popup
window containing the parameters used for this analysis. The input directory and output directory are hyperlinked to enable the user to view the contents. The Operating Procedure is hyperlinked to a dialog window that shows all of the settings at the time the analysis was performed. An example is shown on the right.
Display. The first pull down or submenu allows the user to display Alleles, BPS, RFU, Time, or Peak Area in the table
cells. The second pull down allows the user to choose between displaying the file names or the sample names in the sample names column of the table.
CMF or Export CMF File… This option allows the user to export the data in a CODIS 3.2 Common Message Format
(CMF) file. In order to export to a CMF file, all of the samples that are not disabled must not need attention and the directory level notices must be accepted or reviewed. Please note that if the analysis file has been edited, it must first be saved before exporting a CMF file. If it has not been saved, a window will appear to prompt the user to decide whether to save the file or cancel. When exporting a CMF file, a dialog appears with many options for the file and each sample. Following is an example:

Osiris User’s Guide Page 33 Version 2.2 Rev. 1
The Source Lab, Destination Lab, Submit User ID, and Default Specimen Type are automatically saved and used as the default for subsequent CMF files. Please note that the Submit User ID may not be editable depending on this option in the lab settings at the time of analysis. The Batch ID is automatically created using the current date and time. The table contains a row for each sample. The exclude column allows the user to exclude one or more samples. The “Type” is a drop down list of all available types of specimens. If “[Default]” is selected, then the selection for
“Default Specimen Type” above is used. “Partial” is selected if one or more loci do not have any allele calls.
This can be modified by the user. “Missing Loci” shows a list of all loci that do not have any alleles. “Source ID”
and “Case ID” can be edited by the user. “Sample name” is by default the name of the sample taken from the name
of the original ABI .fsa or .hid file and used in the analysis file. It is also used as the row label on the left, but for
purposes of writing a CMF file, it can be edited in the “Sample name” column. The “Comments” column allows the user to enter any desired comments for any sample to be included in the CMF file.
Below the table, the user can specify the name of the output file, which by default is the name and location of the Analysis file except with the file extension changed to .cmf. To find another location or change the file name, the user
can select the “Browse…” button to choose from a file dialog window. There is a checkbox labeled “View File
Location.” If this is selected, a window with the location of the CMF file is displayed after the file is created in order to access the file from the computer’s operating or window system. The CMF file is created when the user presses the “OK” button. If the user presses the button labeled “Finish Later” then this window will close and return the user
to the Analysis window but all changes will be saved and restored if “CMF” is selected again. This is useful if the user
needs to examine the data again before exporting the CMF file. If the “Cancel” button is pressed, all changes will be discarded.
OSIRIS Plot Files The OSIRIS Plot Files have an extension of .plt and unlike the report files, they are not intended to be edited. The plot files are used to display a graph of the raw, analyzed, and ladder electrophoresis data with labels for alleles, artifacts, and loci. The curve data and locus location are always obtained from the plot file, but the peak and artifact information can be obtained from either the plot file or a corresponding analysis file. If an analysis file is used to obtain the alleles and artifacts, then any changes made by the user are also reflected in the plot window. There are several ways to open a plot file. To open a plot file as a standalone file (without its corresponding analysis file) select “Open Plot File…” or “Recent Files…” from the “File” pull down menu on the menu bar and select the desired file. A plot file can also be opened from its corresponding report file by selecting the desired sample in the table of the Analysis window and selecting “Graph” from the tool bar if visible or by selecting “Display Graph”
from the context menu (right click) or the “Table” pull down menu on the menu bar. It can also be opened by double-clicking on a cell or row label within a sample. If a graph window is opened from the analysis window, the peak data displayed in the graph window will be obtained from the report file and the names of the plot and report files will both appear in the title bar at the top of the window. When the graph is opened from the analysis window, the actual data initially displayed depends on the selected cell in the sample and whether or not the shift key is held
down. It is important to understand that opening a .plt plot file as a standalone will not show editing and history. If the plot file has not been moved out the of the folder containing its associated report files, the editing and user

Osiris User’s Guide Page 34 Version 2.2 Rev. 1
changes may be viewed by selecting the “Table” button to open the analysis file. Following is a table illustrating different ways to open a graph window from the analysis file.
Type of Cell Selected
Select “Graph” button or Double-click With
Shift key Pressed
Locus One plot for each channel. Zoomed to selected locus and scrolled to ensure visibility of channel containing locus
One plot zoomed to selected locus
ILS, Channels, +Ctrl, , , or entire sample
One plot for each channel. Zoomed out but excluding primer peak data
All channels in a single plot. Zoomed out but excluding primer peak data
Different methods of opening a graph window from the analysis window
D21S11 is selected for MIX05case1_victim, shift key is pressed while pressing the Graph button resulting in a single plot of channel 1 zoomed to D21S11.
The preceding image shows the result of selecting the D21S11 locus of sample MIX05case1_victim, holding down the Shift key and pressing the “Graph” button. The plot was zoomed to the selected locus and because the Shift key was pressed, only one plot was displayed. Note that two allele peaks displayed in the table are not shown in the plot, 22.3 (OL) and 39.1 (OL). This is because they are outside the range of the ladder for D21S11. These peaks can be shown by zooming out, a topic that will be discussed in detail later in this section.

Osiris User’s Guide Page 35 Version 2.2 Rev. 1
Graph Toolbar The toolbar at the top of each plot and the “Graph” pull down menu on the menu bar have the following options: Data, Channels, Sync, ILS, RFU, Labels, Artifacts, History, Reset Axes, Multiple, Append, Parameters, and Close Plot (X). The menu also has items for showing or hiding the toolbars and scrollbars in the plot and the last selection of these items is used as the default when opening subsequent plot files.
Following is a description of each option in the toolbar and menu: Data: Raw, Analyzed, Ladder, Baseline, Table. The toggle buttons labeled A, R, L, and B are used to
show or hide the curves for Analyzed Data, Raw Data, Ladder Data, and calculated Baseline Data. The Baseline Data button is only active if either the “Normalize Raw Data Relative to Baseline” or the “Test Adjusted Signal Heights Relative to Baseline” parameter is selected in laboratory settings at the time of analysis. The Raw Data button displays normalized raw data with the calculated baseline subtracted if the “Normalize Raw Data Relative to Baseline” parameter is selected at the time of analysis. If the shift key is pressed while selecting one of these options the
selection will immediately be used for all plots in the window. The “Table” button shows the window with the report data and selects the row for the sample in the graph window. If there is no report file opened for this graph window, the user is prompted to select a report file or cancel. If a report file is selected, it is used for labeling alleles and artifacts. The “Graph” pull down menu has a submenu for each plot and each of these submenus has a “Data”
submenu with entries for these options. In addition to this, the “Graph” pull down menu has a menu item labeled
“Show Table” which performs the same action as the “Table” button.
Channel. There is a toggle button for each channel labeled with the channel name and its background color
corresponding to the color of the channel and its plot. If the shift key is down when pressing a “Channel” button, then only that channel will be displayed with all other channels hidden.
Sync or Synchronize Axes. This toggle button or checked menu item is used to synchronize multiple plots when
domain and/or range are modified. If this is selected, every time the view is changed, the view is updated on all other plots where this option is also selected. If the shift key is down when selecting this, the setting is updated in all plots in the window.
ILS or Show ILS. This option shows or hides vertical lines to indicate where the peaks are in the ILS channel. The
color of the lines corresponds to the color of the ILS channel. If the shift key is pressed while selecting this option, the setting will be shown in all plots in the window.
RFU or Show Minimum RFU. This option shows or hides one or more horizontal lines to indicate the location of the
minimum RFU selected when the analysis was performed. The actual lines are for the minimum sample and/or ILS RFU depending on the selected channels. If the shift key is pressed while selecting this option, the setting will be set in all plots in the window.
Labels. This option determines how the alleles will be labeled. The options are None, Alleles, BPS, RFU, or Time. If
the shift key is pressed while selecting this option, the selection will be used in all plots in the window. The labels appear above the allele peaks and when the cursor is placed over a label, a box appears with detailed information about the allele. The Ladder button on the Graph toolbar and Show Ladder Labels on the menu show and hide
the ladder labels. The loci are also displayed at the top of the plot unless “None” is selected. When the user clicks on a
locus label, the plot is zoomed to the range and domain of that locus and if “Sync” is selected, all other synchronized plots are zoomed also.
Artifacts. This option determines which artifacts are labeled: All, Critical, or None. The artifacts are labeled with
an “A” and when the cursor is placed over the label a box appears with detailed information about the artifact. If the
shift key is pressed while selecting this option, the setting will be shown in all plots in the window.
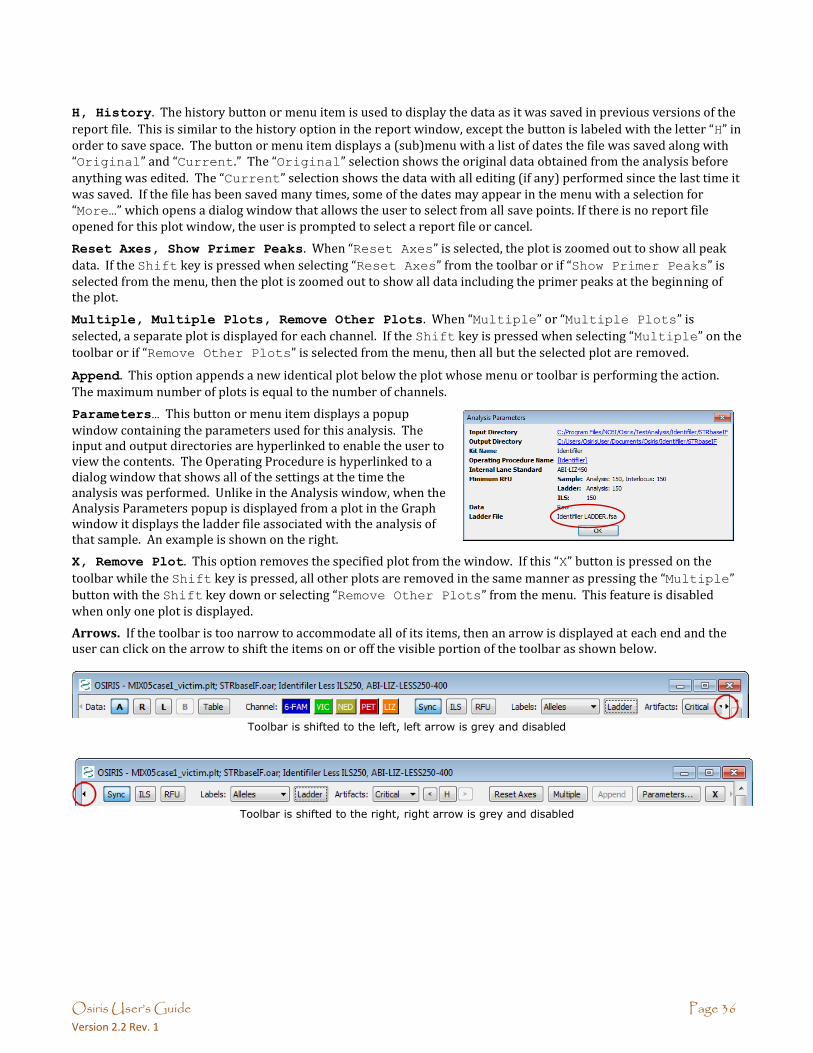
Osiris User’s Guide Page 36 Version 2.2 Rev. 1
H, History. The history button or menu item is used to display the data as it was saved in previous versions of the
report file. This is similar to the history option in the report window, except the button is labeled with the letter “H” in order to save space. The button or menu item displays a (sub)menu with a list of dates the file was saved along with “Original” and “Current.” The “Original” selection shows the original data obtained from the analysis before
anything was edited. The “Current” selection shows the data with all editing (if any) performed since the last time it was saved. If the file has been saved many times, some of the dates may appear in the menu with a selection for “More…” which opens a dialog window that allows the user to select from all save points. If there is no report file opened for this plot window, the user is prompted to select a report file or cancel.
Reset Axes, Show Primer Peaks. When “Reset Axes” is selected, the plot is zoomed out to show all peak
data. If the Shift key is pressed when selecting “Reset Axes” from the toolbar or if “Show Primer Peaks” is selected from the menu, then the plot is zoomed out to show all data including the primer peaks at the beginning of the plot.
Multiple, Multiple Plots, Remove Other Plots. When “Multiple” or “Multiple Plots” is
selected, a separate plot is displayed for each channel. If the Shift key is pressed when selecting “Multiple” on the
toolbar or if “Remove Other Plots” is selected from the menu, then all but the selected plot are removed.
Append. This option appends a new identical plot below the plot whose menu or toolbar is performing the action.
The maximum number of plots is equal to the number of channels.
Parameters… This button or menu item displays a popup
window containing the parameters used for this analysis. The input and output directories are hyperlinked to enable the user to view the contents. The Operating Procedure is hyperlinked to a dialog window that shows all of the settings at the time the analysis was performed. Unlike in the Analysis window, when the Analysis Parameters popup is displayed from a plot in the Graph window it displays the ladder file associated with the analysis of that sample. An example is shown on the right.
X, Remove Plot. This option removes the specified plot from the window. If this “X” button is pressed on the
toolbar while the Shift key is pressed, all other plots are removed in the same manner as pressing the “Multiple”
button with the Shift key down or selecting “Remove Other Plots” from the menu. This feature is disabled when only one plot is displayed.
Arrows. If the toolbar is too narrow to accommodate all of its items, then an arrow is displayed at each end and the user can click on the arrow to shift the items on or off the visible portion of the toolbar as shown below.
Toolbar is shifted to the left, left arrow is grey and disabled
Toolbar is shifted to the right, right arrow is grey and disabled

Osiris User’s Guide Page 37 Version 2.2 Rev. 1
Resizing Plots When viewing multiple graphs in a single window, the height of each graph may be too small. The height of each plot can either be fixed to fit into the window or resized to be larger with a new scrollbar added to scroll through the larger plots. This option is chosen by selecting “Resizable Plots” in the “Graph” pull down menu as shown on the right.
When this is selected, a sash or horizontal bar is displayed between each plot. The plot can then be resized by clicking and dragging this bar to the desired size as shown below. After dragging the sash, each plot is resized to the selected height and a scroll bar is shown on the right if the total height exceeds the height of the window. Once the plots have been resized, the new size becomes the default size when opening a new graph window. Please note: On the version of OSIRIS for the Macintosh, there is no black line or marker displayed when dragging to resize the plot and it does not appear to work until the mouse button is released.

Osiris User’s Guide Page 38 Version 2.2 Rev. 1
Export Graphic File The plots currently being viewed can be exported to a portable network graphics (PNG) file. A PNG file can be used with most software that will display or print graphic files including web browsers, word processing programs, spreadsheets, and presentation graphics. This is done by selecting “Export
Graphic File” from the “File” menu on the menu bar. A dialog window will appear as shown on the right. The title is text displayed above the plots. Usage is selected to create a graphics file to be used by either on a screen or printed. The resolutions are 72 and 300 dots per inch (dpi) respectively. If you plan to include the graphic in a word processing file, it is recommended that “Print” is selected and that the units are either “Inches” or “Centimeters” are chosen with the approximate size selected. For applications that are primarily viewed on a screen, for example, spreadsheets or presentation graphics, “Screen” is recommended. The
file name and “Browse” buttons are used for choosing where to save the file and the checkbox labeled “View File
Location” when checked, will open a window displaying the folder containing the graphic file after it is saved. The
“Preview” button allows the user to preview the graphic file before saving it. This is useful because it is likely that adjustments will be needed before saving a graphic file.
Viewport and Zooming When viewing the graph, it is often desirable to zoom and/or pan to a particular locus or peak and there are several ways to do this.
Reset Axes. To view all of the allele peaks, select “Reset Axes” on the toolbar or from the plot submenu on the
“Graph” pull down menu. This viewport will not include the primer peaks near the origin of the plot. To include
primer peaks, hold down the Shift key when selecting the “Reset Axes” button on the toolbar or select “Show
Primer Peaks” from the plot submenu on the “Table” pull down menu.
Zoom To Locus. To zoom to a particular locus, simply click on the locus name at the top of the plot. This will zoom the X-Axis to the range specified by the ladder and the Y-axis to accommodate all data in that range. This will not display adjacent interlocus peaks, but they can be viewed by clicking on the plot and pressing “a” on the keyboard. Keyboard options for setting the viewport are described later.
Shift Axes. To shift the X or Y axes, move the cursor over the axis labels and when the cursor changes to two arrows (up and down for the Y-axis, left and right for the X-axis) simply click and drag the mouse in the direction of the desired data to shift the range.
Keyboard Control. There are several keys that will change the viewport of the plot. Before using the keyboard it is important to first click on the plot in order to select it for receiving the keyboard input. The alphabetic keys must be lowercase. The keystrokes are as follows:
Arrow/Cursor Keys – Pan by a small amount in the direction indicated by the arrow.
Page Up/Page Down – Pan the Y-Axis up or down by a large amount.
Home – Center the plot around the origin (0,0).
a – Zoom out X-Axis (decrease peak width)
d – Zoom in X-Axis (increase peak width)
x – Zoom out Y-Axis (decrease peak size)
w – Zoom in Y-Axis (increase peak size)
e – Zoom in both axes
z – Zoom out both axes
s – Zoom out to show all data including primer peaks
q – Zoom out X-Axis, zoom in Y-Axis
c – Zoom in X-Axis, zoom out Y-Axis
Keyboard zooming centers on the middle of the plot displayed, so that it may be necessary to shift the axes as described above after keyboard zooming to center the desired data in the viewable part of the graph.

Osiris User’s Guide Page 39 Version 2.2 Rev. 1
Zoom to Rectangle. Another method of zooming is to click and drag the mouse in order to draw a rectangle around the desired region. Following is an illustration:
Click on a corner of the desired rectangular region and drag the mouse to see an outline.
After the mouse button is released, the plot is zoomed to the selected region.
If the results are not as desired, simply reset the axes as described above and try again.

Osiris User’s Guide Page 40 Version 2.2 Rev. 1
Export Setup Tutorial Following are two tutorials with instructions on implementing the two XSLT export file types supplied with OSIRIS. This section does not cover all of the details of the XSLT export feature, nor does it require any knowledge of the XSLT language. If you wish to modify these two XSLT files, it is strongly recommended that you first copy them to another location because they may otherwise be replaced if a newer version of OSIRIS is installed.
Exporting Spreadsheets This tutorial contains instructions to implement the export of a tab delimited file containing the sample allele information from an OSIRIS analysis file that can later be opened from a spreadsheet application. First select Export
File Settings from the Tools menu on the menu bar. When the popup window appears, select the button
labeled “New…” and a dialog window will appear, prompting the user to choose an XSLT file. In the Windows version,
find the “Config” folder in the OSIRIS installation and select the file: “tab.xsl.” In the Macintosh version, find the
“OsirisXSL” folder in the directory containing the OSIRIS application and choose “tab.xsl.” Under the heading “Export File Description” enter the
word “Spreadsheet” (or change to desired name). This description is used in the menu option that will be created in the File menu on the menu bar and will follow the word “Export,” i.e., there will be an option in the File menu displayed as “Export Spreadsheet.” For the file name extensions, enter
“tab, txt” (or other such as xls) to specify that the output
files will have an extension of “.tab” or “.txt.” The box labeled
“Allow user to override” is used to determine if the user can use a file extension other than that specified above when exporting a file. For the default output file location, the user can select “[Same as Analysis File], [Remember Last
Location], or enter the full path of the default folder where the
exported file should be saved. For now, select “[Remember
Last Location].” Click the “Next >” button and the following will appear.
The selected XSL file, tab.xsl, has two top-level parameters named “OL,” and “UseChannelNr.” They are configured as follows:
Select “OL” on the left, and under “Parameter description”
enter “Indicate off-ladder alleles” and select
“checkbox” for the “Parameter type.” Two text boxes will
appear. For the first one labeled “Parameter value if
checked,” enter the number 1. For the other, labeled,
“Parameter value if unchecked” enter the number 0.
Select “UseChannelNr” from the list on the left. Under
“Parameter description” enter “Indicate channel numbers
in column headings.” For parameter type, as above, select
“checkbox” and once again the two text boxes will appear. Enter 1 and 0 as described above.
Click the “Next >” button. At the top of the window is a checkbox. Make sure that it is not checked and click on the
“Finish” button. The dialog for “Export File Types” will still appear. Click on “Done.” This export type has
now been implemented. When an analysis file is open, this export option labeled “Export spreadsheet” will
appear on the “File” pull down menu on the menu bar (as indicated below) or in a sub-menu labeled “Export” if more than one export type has been implemented.

Osiris User’s Guide Page 41 Version 2.2 Rev. 1
Next, with an analysis file displayed, select “Export Spreadsheet…” from the
“File” menu. A dialog window will appear prompting you to select the name of the file to be exported. After that is entered, a new dialog window will appear with the parameters as they were configured. This is shown on the right. The first two check boxes are for the parameters and the third checkbox labeled “View file location” is used if user wishes to open displaying the folder containing the output file. Upon pressing “OK” the export file will be created.
Extracting Samples The other export type supplied with OSIRIS is the ability to export a new analysis file with only specific samples selected by the user. For example this would allow a laboratory to create an analysis file for a report or a discovery package that contains only samples that pertain to a specific case. It is assumed that the previous tutorial was implemented and therefore these instructions will be brief. First, select “Export File Settings” from the “Tools” menu on the menu bar. When the file selection dialog appears, choose the file: “extractSamples.xsl.” When the next dialog window appears, enter “selected samples” under “Export File Description” and enter
“oer” under “File Name Extensions.” Do not check the box labeled
“Allow user to override” and for “Default Output File
Location” select “[Same as Analysis File]”*
Select “names” under “External parameters” and under
“Parameter description” enter “Enter part or whole names of samples to export separated by
commas.” Selected each of the other three parameters and for
each select “checkbox” for the “Parameter type” and enter 1
and 0 for “Parameter value if checked” and “Parameter
value if not checked,” respectively. Use the following table
for the text to enter under “Parameter description” for each parameter:
External parameters Parameter Description p1IncludeControls Include positive and negative controls p2IncludeLadders Include ladder files p3IncludeDisabled Include disabled samples
Click on the “Next >” button. In the next window, make sure the
checkbox at the top this section is unchecked, and click on the “Finish” button. Then click “Done” on the “Export
File Types” dialog window. Following are instructions for exporting two samples from the analysis file
STRbaseIF.oar created from the tutorial section of this guide.
Open the file STRbaseIF.oar. The easiest way to find it is to select “Recent Files…” from the “File” menu, find
it in the list and select “OK”. Next, select “Export” then “selected samples…” from the “File” menu. A dialog window will appear prompting for a file name for the exported file. Enter a file name in the pre-selected folder and press the “Save” button. A new dialog window will appear as follows:
The first two checkboxes are selected by default because that represents the default value for the corresponding parameters in the XSLT file. In the text box at the top, enter “case1,case2” for the samples whose names contain

Osiris User’s Guide Page 42 Version 2.2 Rev. 1
“case1” or “case2.” Next, select the checkbox labeled “View file location” and click on the “OK” button. A window will appear with the folder containing the new export file. If you are using the Windows
TM version of OSIRIS, drag the new file to the OSIRIS window to view. For the Macintosh
TM version, double-click the file to open it. The new file should contain everything found in STRbaseIF.oar except for MIX05case3_victim and
MIX05case4_victim because they were not specified.
*Since the output files being exported are analysis files with the .oer extension, they are intended to be opened with OSIRIS and should be in the
same folder as the original analysis file because they will depend on the plot (.plt) files in the same folder.
OSIRIS Artifact Handling OSIRIS mathematically fits curves to the raw data and then correlates those curves to peak and artifact signatures. This is discussed in detail in the following publication: Goor RM, Forman Neall L, Hoffman D, Sherry ST., "A Mathematical Approach to the Analysis of Multiplex DNA Profiles." Bull Math Biol. 2010 Nov 20. [Epub ahead of print]. It is important to note that while OSIRIS is extremely proficient at fitting high quality DNA profiles, OSIRIS may have difficulty fitting or analyzing really poor quality data. In this case, OSIRIS will identify artifacts, but may not always be able to determine which specific artifact is occurring. The following information provides a guide to the user about how OSIRIS identifies and handles certain artifacts. Critical artifact. Critical artifacts are conditions based on user-defined and OSIRIS software parameters that
require human intervention. The user may choose to accept, edit, or rework the sample. Loci with critical artifacts are designated in the table as colored cells. Critical artifacts are visible in the preview graph and Graph view (as ‘A’ markers) if they are associated with a specific peak and either ‘Critical’ or ‘All’ Artifacts is selected. Artifact details appear when the cursor is hovered over the “A” marker. Critical artifacts that are not associated with a specific peak such as heterozygote imbalance and locus drop out display in the lower right hand notification pane of the Table view. Important: Notification of critical artifacts in a DNA profile does not necessarily indicate that data is invalid or unusable. The user must decide whether to accept, edit, or rework a sample profile based on laboratory protocols. Non-critical artifact. Artifacts that are determined to not be significant based on user-defined parameters. For example, these include peaks below various user-set thresholds such as detection, stutter, adenylation, fractional filter, etc.; or that otherwise do not have an impact on profile quality. These artifacts do not trigger artifact notices, therefore they do not require human intervention. By default, non-critical artifacts are not visible in the table and are not visible in the preview graph. To view non-critical artifacts in the preview graph or Graph view, select “All” Artifacts from the menu or toolbar to mark the non-critical artifacts with an "A". Ladder/sample matching. If more than one ladder is included in the analysis directory, OSIRIS compares the spacing of the ILS of each ladder to the ILS spacing of each sample and uses the ladder with the best match for each individual sample. Should a ladder have critical artifacts, each associated sample will have a notice to the alert the user. Click the Parameters button on the toolbar to view the ladder associated with a sample in the “Analysis
Parameters” window. Missing ILS peaks. If ILS peaks are missing, e.g. peaks below the analysis threshold, the sample analysis will fail and trigger an “ILS Contains Too Few Peaks” artifact notice. If the ILS is marginal (ILS peak spacing fit is less than 0.999), which can occur if there are artifact peaks in the ILS near the primer peaks, OSIRIS may analyze the sample but trigger a notification. Allele calls in a sample with marginal ILS may not be robust and should be evaluated with care by the user. If the ILS has artifacts that prevent its analysis, it will trigger an “ILS Could Not Be Analyzed” artifact notice. If no ladder has a usable ILS, the analysis will fail. A failed analysis can be opened to view the issues that caused the ladders to fail, which may allow reanalysis with parameters that will allow the ladders to analyze, such as lowering the ILS or ladder RFU thresholds.

Osiris User’s Guide Page 43 Version 2.2 Rev. 1
Excess residual. The “Excess residual” artifact occurs when the peak residual is greater than the “Max.
residual for allele” value set by the user in the lab settings. It is caused by sample peaks not aligning exactly
with the comparison ladder peaks. The “residual” is OSIRIS’s measure of what fraction of a base pair the calculated sample peak center is away from the ladder allele peak center. A residual of -0.098 means the peak is shifted 98/1000s base pair to the left of the ladder allele. Positive residual indicates a shift to the right. OSIRIS analysis typically produces very small residuals because OSIRIS fits the best ladder ILS for each sample as described above. We suggest that the user start with the default setting of 0.25 base pair which typically does not result in excess residual. This creates a 0.5 base pair bin centered on the ladder peak, into which the sample peak must fall. To prevent misidentification of a microvariant, it is important that this setting not approach 0.5 base pair. Spikes/Pull-up. Pull-up occurs when the color subtraction matrix is poor or when the signal intensity is outside the linear range of the matrix. Pull-up peaks are identified by OSIRIS as either “primary pull-up” – the overly high peak that OSIRIS estimates to be causing the artifact, and pull-up peaks caused by the primary peak. Pull-up can manifest in a wide variety of peak heights and analysis can be difficult, particularly in cases where a pull-up coincides with a real allele peak. The user should consider all aspects of all channels carefully if they intend to use allele calls produced from peaks that have pull-up. Since both spikes and pull-up are cross-channel artifacts, they share many characteristics that can cause OSIRIS to alternatively identify a spike as a pull-up. It will however trigger an artifact notice in either case. Some kits have markers with alleles in different channels that comigrate. In this case, OSIRIS will sometimes trigger a notice that comigrating-allele peaks may be pull-up, possibly requiring human review, depending on whether the artifact is deemed to be critical or non-critical. The priority of the “Possible Pull-up Coincides With
Allele” message can be configured by the user in the lab settings interface. There is a check box on the “Sample
Thresholds” tab of the Lab Settings window which has the description “Make Pull-up at Allele Artifact
Non-Critical.” This setting determines if comigrating-allele pull-ups are critical. If the check box is checked, comigrating-allele pull-ups are deemed non-critical, otherwise they are critical. Even if comigrating-allele pull-ups are configured to be non-critical, the occurrence of a “laser off-scale” artifact, suggesting an actual pull-up rather than coincidental allele comigration, is still critical, ensuring human review. In any case, the user always has the option to edit the peaks and their artifacts to make the best use of the data. Signal saturation. This occurs when the signal intensity saturates the CCD camera and the recorded signal intensity cannot increase further. This can cause a number of different artifacts. This will trigger a “Laser Off-Scale” artifact, which is used in calculating other artifact notices. Craters. A crater occurs when the primary peak signal is saturated and the pull-up peaks are so high that the matrix subtraction causes the center of the primary peak to pull down into a valley, as shown at right. OSIRIS tries to identify craters by finding closely spaced peaks that could be the edge of a crater, calculating the theoretical center of the possible cratered peak and comparing it to comigrating peaks in the other channels. When the data matches the crater signature, it will identify the side peaks as possible crater side peaks and will assign an estimated peak call to the calculated theoretical crater peak, which usually lies about midway between the side peaks. While this estimated peak is usually correct, this estimated allele call should be evaluated with care, as this is OSIRIS’s estimation of what the allele peak would be, not an actual allele peak. Craters trigger locus notifications and ‘A’ markers on the crater peak edges and center.

Osiris User’s Guide Page 44 Version 2.2 Rev. 1
Off-ladder alleles. Alleles that are apparent microvariants, or are higher or lower than the ladder alleles at each locus, are marked “OL” with the calculated allele call, such as OL12.1. Off-ladder alleles will trigger a critical LOCUS artifact notice. However, the peak itself will not be marked with an “A” on the sample graph unless the off-ladder allele also triggers a critical ALLELE artifact notice in addition to the off-ladder “OL”. Alleles designated as “accepted” by entry in the Assignments tab of the Lab Settings will not trigger an OL artifact. Interlocus peaks. Interlocus peaks fall between the defined locus boundaries and trigger a critical artifact. OSIRIS will discriminate between interlocus pull-up peaks and genuine off-ladder interlocus peaks and trigger appropriate notifications. Core locus peaks that also fall in an adjacent Extended locus. When a peak falls in the area covered by both the Core of one locus and an adjacent Extended locus, the peak will be flagged with an artifact. If the peak is on-ladder for one of the core alleles and does not have “excessive residual” in comparison to that matching core ladder allele, then the peak is flagged with a non-critical artifact. If the peak in question is off-ladder or has excessive residual in comparison to the core ladder alleles where it falls, it will be flagged with a critical artifact. Off-ladder alleles that have been designated as accepted in the Assignments tab of the Lab Settings will be treated the same as on-ladder alleles. The effect is to require review of alleles that are off-ladder or shifted in relation to the core allele, but not require review in the case that the allele is a good match for the core allele. OSIRIS allows the user to assign the peak to the adjacent (extended) locus on the basis of other information such as peak numbers and peak heights in either case. Adenylation. (Non-critical artifact) OSIRIS will identify and filter peaks one base pair shorter than the allele (N-1) with a peak height below the user-set adenylation threshold. Minus-A “Adenylation peaks” above that threshold will be called as an off-ladder allele and trigger a locus artifact notice. Minus-A peaks that fall above the adenylation threshold can be detected using the heterozygous peak imbalance threshold. Raised baseline. Before analysis, OSIRIS assesses the baselines at the right end of the plot of each channel and normalizes them so that they are zero. However, it is still possible for there to remain raised baselines to the left or center of the plot. If this occurs, OSIRIS may fit curves to smaller deviations in the plot data than when the baseline is at a normal level because OSIRIS fits the analyzed data to a baseline which is expected to be zero. This can result in small peaks that appear larger in the analyzed data than they are in relation to the elevated baseline in the raw data, minor peaks that are broader in the analyzed data than in the raw data, and minor analyzed data peaks that are fitted to small deviations in the raw baseline. This does not occur to a significant extent in high quality data, and rarely is significant enough to trigger the critical artifact notice “Channel Has Raised Baseline”. When raised baseline artifact notices occur, it can be informative to view the raw data (if not viewed simultaneously) to evaluate the baseline quality. When OSIRIS fits the analyzed data to the raw data, it tests each “peak” to determine whether the curve or a straight line has a better fit. If the straight line is a better fit, the fitted line is tested to determine if it lies above the “Raised Baseline Threshold”, set on the “Sample Thresholds” tab of the lab settings user interface. There are two different values that can be set, the threshold that will apply to sample data channels and the threshold that will apply to ILS data. If a fitted straight line exceeds its designated threshold, then a critical “Raised
Baseline” artifact will be triggered, requiring human attention. Baseline Normalization. Baseline normalization eliminates many of the artifacts associated with raised baseline by calculating the dynamic baseline from the raw data and subtracting that from the raw data to give normalized raw data. (See Appendix H. Dynamic Baseline Analysis) Baseline Relative messages. When the “Test Adjusted Signal Heights Relative To Baseline (Overridden by below)” parameter is selected, and, the “Normalize Raw Data Relative To Baseline (Overrides above)” parameter is deselected, a peak that is above the analysis threshold without baseline corrected RFU but below the analysis threshold with baseline corrected RFU will trigger a critical “Baseline Relative Below Minimum Analysis RFU” message to indicate that the peak would have been below threshold with the correction, but not without. Similarly, with the above parameter selections, peaks whose baseline corrected RFU falls within the stutter criteria will trigger a critical “Baseline Relative Stutter” artifact and peaks whose baseline corrected RFU falls within the adenylation criteria will trigger a critical “Baseline Relative Adenylation” artifact.
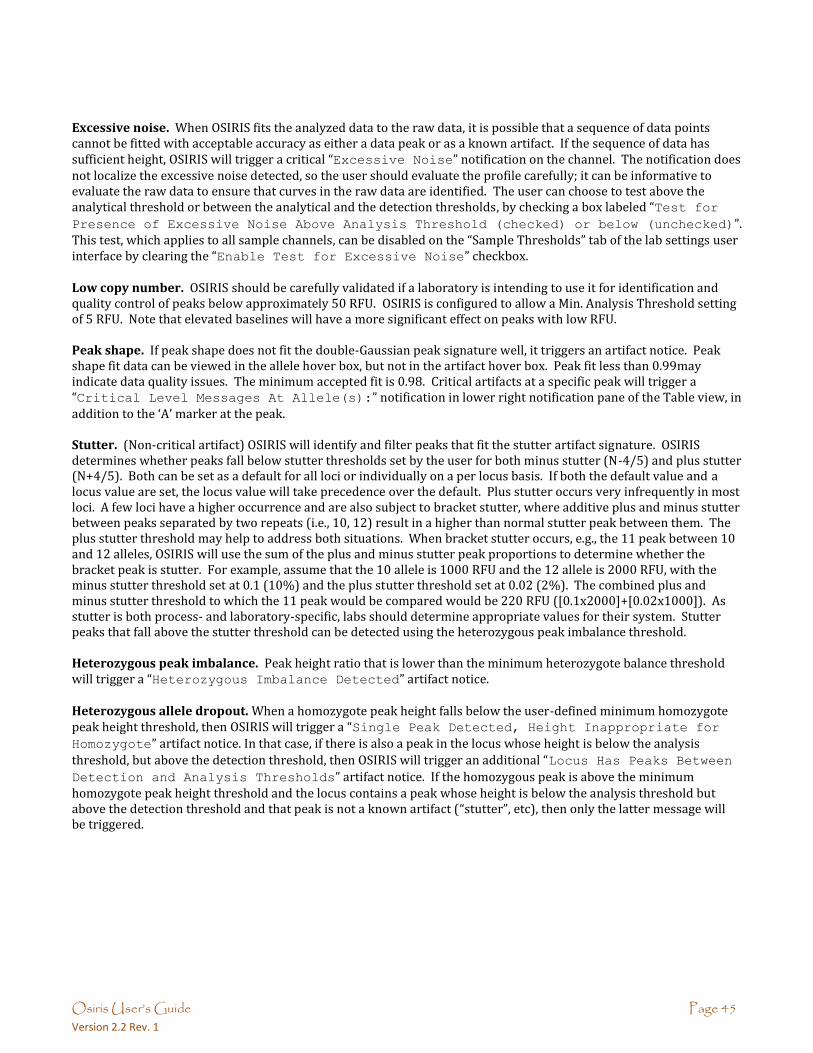
Osiris User’s Guide Page 45 Version 2.2 Rev. 1
Excessive noise. When OSIRIS fits the analyzed data to the raw data, it is possible that a sequence of data points cannot be fitted with acceptable accuracy as either a data peak or as a known artifact. If the sequence of data has sufficient height, OSIRIS will trigger a critical “Excessive Noise” notification on the channel. The notification does not localize the excessive noise detected, so the user should evaluate the profile carefully; it can be informative to evaluate the raw data to ensure that curves in the raw data are identified. The user can choose to test above the analytical threshold or between the analytical and the detection thresholds, by checking a box labeled “Test for
Presence of Excessive Noise Above Analysis Threshold (checked) or below (unchecked)”. This test, which applies to all sample channels, can be disabled on the “Sample Thresholds” tab of the lab settings user interface by clearing the “Enable Test for Excessive Noise” checkbox. Low copy number. OSIRIS should be carefully validated if a laboratory is intending to use it for identification and quality control of peaks below approximately 50 RFU. OSIRIS is configured to allow a Min. Analysis Threshold setting of 5 RFU. Note that elevated baselines will have a more significant effect on peaks with low RFU. Peak shape. If peak shape does not fit the double-Gaussian peak signature well, it triggers an artifact notice. Peak shape fit data can be viewed in the allele hover box, but not in the artifact hover box. Peak fit less than 0.99may indicate data quality issues. The minimum accepted fit is 0.98. Critical artifacts at a specific peak will trigger a “Critical Level Messages At Allele(s):” notification in lower right notification pane of the Table view, in addition to the ‘A’ marker at the peak. Stutter. (Non-critical artifact) OSIRIS will identify and filter peaks that fit the stutter artifact signature. OSIRIS determines whether peaks fall below stutter thresholds set by the user for both minus stutter (N-4/5) and plus stutter (N+4/5). Both can be set as a default for all loci or individually on a per locus basis. If both the default value and a locus value are set, the locus value will take precedence over the default. Plus stutter occurs very infrequently in most loci. A few loci have a higher occurrence and are also subject to bracket stutter, where additive plus and minus stutter between peaks separated by two repeats (i.e., 10, 12) result in a higher than normal stutter peak between them. The plus stutter threshold may help to address both situations. When bracket stutter occurs, e.g., the 11 peak between 10 and 12 alleles, OSIRIS will use the sum of the plus and minus stutter peak proportions to determine whether the bracket peak is stutter. For example, assume that the 10 allele is 1000 RFU and the 12 allele is 2000 RFU, with the minus stutter threshold set at 0.1 (10%) and the plus stutter threshold set at 0.02 (2%). The combined plus and minus stutter threshold to which the 11 peak would be compared would be 220 RFU ([0.1x2000]+[0.02x1000]). As stutter is both process- and laboratory-specific, labs should determine appropriate values for their system. Stutter peaks that fall above the stutter threshold can be detected using the heterozygous peak imbalance threshold. Heterozygous peak imbalance. Peak height ratio that is lower than the minimum heterozygote balance threshold will trigger a “Heterozygous Imbalance Detected” artifact notice. Heterozygous allele dropout. When a homozygote peak height falls below the user-defined minimum homozygote peak height threshold, then OSIRIS will trigger a “Single Peak Detected, Height Inappropriate for
Homozygote” artifact notice. In that case, if there is also a peak in the locus whose height is below the analysis
threshold, but above the detection threshold, then OSIRIS will trigger an additional “Locus Has Peaks Between
Detection and Analysis Thresholds” artifact notice. If the homozygous peak is above the minimum homozygote peak height threshold and the locus contains a peak whose height is below the analysis threshold but above the detection threshold and that peak is not a known artifact (“stutter”, etc), then only the latter message will be triggered.

Osiris User’s Guide Page 46 Version 2.2 Rev. 1
Appendices
Appendix A. Program Elements OSIRIS can be thought of as having four major elements: the compiled software that does the majority of the peak identification, curve fitting and measurements, the Message Book which applies quality assessment rules, the user interface and Operating Procedures that include the lab settings, and kit and ladder definitions.
Compiled Software Within OSIRIS, there is an important distinction between what is hard-coded and what is under user-control. Hard-coded measurements include such items as determining whether a signal height is above or below the user-specified minimum RFU. In all such threshold tests, even though hard-coded, the magnitude of the threshold itself is user-specified. The conditions for peak identification are quite complex, however they involve the following elements: raw data RFU height, raw data RFU baseline level, changes in the slope of the baseline and curve fit. If the raw data rises to within about 10% of the detection threshold, OSIRIS will look for a change in the average slope of the data. Where OSIRIS finds a change in the slope of the raw baseline, it will begin curve fitting. Curve fitting involves comparison of the data to a straight line and various other curves to determine the best fit. When OSIRIS has found a curve that has an appropriate fit (>0.98) it applies other tests, including comparison to the threshold, to determine whether to continue analysis of the peak. The result is that OSIRIS will identify quite small peaks with fairly high accuracy. However, at very low detection or analysis thresholds, OSIRIS will sometimes ignore small peaks because of poor fit, or identify as small peaks deviations in the slope of the baseline because it matches an accepted fit. When OSIRIS finds a data point above the Approximate Minimum Detection threshold (about Detection Threshold minus 10%), it checks to determine whether the baseline is falling. Under those circumstances it continues its peak identification algorithm. OSIRIS works from right to left on the dataset to identify peaks.
Message Book OSIRIS Version 2.0 introduced a MessageBook structure and software support to enable users to modify quality assessment rules and customize their own, new messages. In Version 2.xx, the major focus of user control is in this MessageBook configuration file, which is the repository for all of the new OSIRIS so-called “smart messages.” The new smart messages for the OSIRIS program transfers the rule-based analysis from hard code to user control, at least to an extent that is consistent with ease of use. Because typical users are not programmers, the means to modify the smart messages must be transparent to subject matter experts without requiring computer tools expertise. We have tried to balance user control over sample diagnostics with ease of use. In the Message Book, we have created an XML based language for expressing most of the rules to be used in analyzing multiplex DNA samples. The language is straightforward and broad in scope due to the liberal use of Boolean logic expressions for making decisions about whether a condition applies, whether to report the condition, and in what priority to apply the consequences. Smart messages are fully user-configurable. The value of being able to define new smart messages derived from the values or the data of other smart messages, is that, using these new messages, we are now able to build sophisticated interpretations of sample data, and we can customize the reporting of these interpretations.

Osiris User’s Guide Page 47 Version 2.2 Rev. 1
Operating Procedures and Kit definitions When performing an analysis an Operating Procedure must be selected. A pre-defined Operating Procedure for each supported kit or marker set is provided with OSIRIS and cannot be modified, but customized Operating Procedures are created by copying an existing Operating Procedure. Operating Procedures created by the user are placed in a new folder whose name begins with “V” followed by the date and time of creation. An Operating Procedure consists of four files whose names are prefixed with the folder name:
V-20110323-112549_access.txt
V-20110323-112549_LabSettings.xml
V-20110323-112549_MessageBookV4.0.xml
V-20110323-112549_StdSettings.xml
The _access.txt file is an administrative file that OSIRIS requires while processing. The _LabSettings.xml file contains the selected kit and customized settings and thresholds for the Operating Procedure. The _MessageBookV4.0.xml file is the message book. The _StdSettings.xml file contains the kit, ladder and ILS
definitions. The Microsoft Windows
TM version of OSIRIS stores the Operating Procedures in the site\Volumes
folder in the OSIRIS installation folder. The Macintosh version of OSIRIS stores Operating Procedures in the Osiris-
Files/Volumes folder which is either in the same folder as the OSIRIS application (parent folder of Osiris.app)
or in the /Libraries folder if OSIRIS is installed in the /Applications folder. If OSIRIS is installed in the
/Applications folder, it may be necessary to log in as administrator to set up and to change Operating Procedures.
Kit definitions The elements of the kit definition are in the StdSettings.xml file. See Appendix G for instructions on defining new kits and additional information on each element.
Elements Defined: ILS Ladder Positive Control allele values Primer peaks Minimum size setting Alleles Core locus Extended locus Interlocus
Positive Controls Defined in Default Operating Procedures Each kit has at least the kit positive control allele values defined so that the positive control profile can be validated. Most kits have additional positive control values defined. This allows the user to select a predefined default positive control, as determined by the Positive Control strings on the File Names tab in the Lab Settings, rather than having to enter it as a custom Positive Control on the Assignments tab. OSIRIS determines which samples are positive controls and which control values to use for validation by looking for one of the positive control string names from the Positive Control strings on the File Names tab, then matching the found string against an internal table of all the predefined and custom positive control strings. If none of the predefined or custom positive strings are found, then OSIRIS validates using the default positive control that is entered in the “Standard Control Name” box of the “Positive Control” on the File Names tab of the Lab Settings.

Osiris User’s Guide Page 48 Version 2.2 Rev. 1
Controls
Kit 9947A 9948 K562 2800M 007
Profiler Plus X X
Cofiler X X
Identifiler X X
Identifiler Plus X X
Identifiler Less 250 X X
Identifiler Plus Less 250 X X
Yfiler DNA007
GlobalFiler Control 007
PowerPlex 16 X X X
PowerPlex Fusion X
PowerPlex 1.2
PowerPlex Y X
PowerPlex 18D X X
SGM Plus DNA007
Core/Extended/Interlocus Boundaries The following diagram serves to illustrate the “Core locus”, “Extended locus” and the “Interlocus” concepts. It does not reflect the actual kit definition boundaries. The core locus is bounded by the top and bottom ladder alleles as can be seen in all three loci. The extended locus extends to the right and left of the core locus. It may overlap the adjacent extended locus as seen to the right of D13S317 and the core of the adjacent locus as seen to the left of D16S539. The extended locus may not extend beyond the core of an adjacent locus. The interlocus lies between the extended locus of adjacent loci (e.g., white box between D16S539 and D2S1338) and above the top and below the bottom locus extended loci (e.g., to the right of D2S1338). The interlocus area beyond the leftmost locus in the channel is bounded by the base pair value in the user-defined “Ignore artifacts smaller than” setting in the “Sample Thresholds” tab of the lab settings. The interlocus area beyond the rightmost locus in the channel is bounded by the kit-defined range of the analysis.
The interlocus area is analyzed by OSIRIS, to ensure that off-ladder alleles that fall outside of a defined locus cannot be ignored. However, alleles in the interlocus area will not be called and cannot be assigned to a locus by the user. Alleles that fall into the extended locus will be called as off-ladder alleles and can be edited. OSIRIS will call alleles that fall into overlapping extended locus as off-ladder and where possible, assign them to the locus that makes the most sense based on base pair residual (i.e., match to adjacent ladders), the number of alleles in the loci to the right and left, the presence of other ambiguous alleles in the loci to the right and left and whether the ambiguous allele is
CoreExtended Core
CoreExtendedInterlocus
Interlocus
D2S1338D16S539D13S317

Osiris User’s Guide Page 49 Version 2.2 Rev. 1
stutter or below fractional filter in one but not the other locus. Where the extended locus overlaps the core of an adjacent locus, OSIRIS will assign a peak in the core overlap to the core locus. A peak that falls on-ladder in a core locus and is overlapped by the extended locus of the locus adjacent will not be marked as off-ladder (and will receive a non-critical artifact stating it could belong to an adjacent locus). If it falls off-ladder in the core, it will be marked as off-ladder and receive a critical artifact indicating that it could belong to an adjacent locus. In any of these cases, when the ambiguous allele is reviewed, the user may assign it to either adjacent locus. Overlapping the extended locus with the extended and core locus of the neighboring locus gives the user the flexibility to assign rare off-ladder alleles to the appropriate locus. See the National Institute of Standards and Technology (NIST) STRBase website for a list of off-ladder alleles that have been reported by users (http://www.cstl.nist.gov/div831/strbase). Please contact us at [email protected] for assistance with modifying kits or adding new kits to OSIRIS.
Appendix B. Upgrading an Operating Procedure to a new version OSIRIS To ensure that the historical conditions for analysis are preserved when OSIRIS is upgraded to a new version, the message book, standard settings and lab settings files associated with the previous version remain associated with the original Operating Procedure, which is not deleted when OSIRIS is uninstalled or reinstalled. This means that when OSIRIS is upgraded, the new version’s settings and new message book rules will not be implemented in the old Operating Procedure(s). Previous version Operating Procedures (OPs) can either be re-created or can be updated one of two ways, either by copying the new message book file into all of the Operating Procedures that need to be updated or by copying the lab settings file into a newly created Operating Procedure. To re-create the customized Operating Procedure from one of the default templates in brackets (not a previous-version customized Operating Procedure), in OSIRIS select Tools>Lab Settings>”New” button and select one of the default OPs in brackets, such as [PowerPlex 16]. Give this Operating Procedure a new name so that it will be distinguishable from the previous version of the customized Operating Procedure. Then, re-enter the lab settings. This method is the simplest, however, it may be time consuming if many settings have been changed and many accepted microvariant and off-ladder alleles have been entered. The other methods are a little more complex, but avoid re-entering many values in heavily customized Operating Procedures. The Microsoft Windows
TM version of OSIRIS stores the customized Operating Procedures in the site\Volumes folder in the OSIRIS installation folder. The Macintosh version of OSIRIS stores customized Operating Procedures in the Osiris-Files/Volumes folder which is either in the same folder as the OSIRIS application (parent folder of
Osiris.app) or in the /Libraries folder if OSIRIS is installed in the /Applications folder. If OSIRIS is
installed in the /Applications folder, it may be necessary to log in as administrator to set up new Operating Procedures and to change existing ones. Note: It may be helpful to create a text file in the new OP directory that has as its file name the name of the OP, such as CofilerRev2.0.txt. This can help the user responsible for managing the OPs to identify which directory a particular OP resides in if there are several custom OPs created. Uninstalling the old version of OSIRIS (using the OSIRIS uninstall program) and reinstalling a new version will leave intact the OSIRIS directory and the site subdirectory containing the old version OPs. It is recommended that users archive a copy of OPs that they intend to modify.
To copy the new message book to the old version of the OP: This method of updating the OP maintains the original date/time in the folder and file names. This can be automated for all of the OPs through the use of a batch file (described below.), significantly reducing the amount of work and the possibility of error
1. Open the old OP directory, select the old message book file and delete it or rename it. Copy the new message book from one of the new default OP directories such as \Osiris\Config\Volumes\ID\ ID_MessageBookV4.0.xml into the old OP directory. This can be done by selecting the file, selecting Edit>Copy, then switching to the old OP directory and selecting Edit>Paste.

Osiris User’s Guide Page 50 Version 2.2 Rev. 1
2. In the old OP directory, rename the copied new message book file with the old directory’s date/time, such as: renaming ID_MessageBookV4.0.xml to V-20110328-173646_MessageBookV4.0.xml. This can be accomplished on a PC by selecting the file, choosing File>Rename, then selecting the prefix part of the name to be changed and retyping it. Alternatively, the date part of the name of one of the other files in the old OP directory can be highlighted (using ‘Rename’), copied and then pasted into the name of the new message book file, to save typing and increase accuracy. Note: When renaming files, do not add the .xml extension if the extensions are not showing in the file directory, as OSIRIS will then be unable to recognize the file if it ends in .xml.xml.
To copy the lab settings of a previous version OP to an updated version:
1. Open the newly installed version of OSIRIS. Create a new OP in OSIRIS using the updated default OP in brackets, by selecting Tools>Lab Settings>”New” button. Note: It may be helpful to create a text file that has as its file name the name of the OP in the new OP directory, such as CofilerRev2.0.txt. This can help the user responsible for managing the OPs to identify which directory the OP resides in if there are several custom OPs created.
2. Open the new updated OP directory and delete the new lab settings file, newdate-hhmmss_LabSettings.xml. 3. Open the old OP directory, select the old lab settings file and copy it to the new OP directory. This can be
done by Edit>Copy then switching to the new directory and selecting Edit>Paste. 4. In the old directory, modify the old lab settings file by adding “BAK” anywhere in the file name. If the user
wants the old OP to appear in the pick list, this can be changed back at the end of this procedure. Either archiving the directory containing the file to a new location or leaving “BAK” in the name of the old lab settings file prevents the old OP from showing in the OP pick list.
5. In the new OP directory, rename the copied old lab settings file with the new directory’s date/time, such as: V-20110323-112549_LabSettings.xml >V-20110328-173646_LabSettings.xml. This can be accomplished on a PC by selecting the name choosing File>Rename, then selecting the date/time part of the name to be changed and retyping it. Alternatively, the date part of the name of one of the other files in the new directory can be highlighted in the same fashion, copied and then pasted into the name of the old file, to save typing and increase accuracy. Note: When renaming files, do not add the .xml extension if the extensions are not showing in the file directory, as OSIRIS will then be unable to recognize the file.
6. If the user wants the new OP to have a different name to distinguish it from the old OP, it can be renamed in OSIRIS by selecting Tools>Lab Settings, picking the OP with the old name in the list, and selecting the “Rename” button then entering the new name desired. Alternatively, the name can be edited in the XML of the lab settings file by opening the file in Notepad. Finding the <VolumeName>Old OP Name</VolumeName> and changing Old OP Name to New OP Name. Do not change anything else as it may corrupt the file. Note: If both the old OP and new OP names are left the same, OSIRIS will only display one of them in the pick list, leading to confusion and possible errors.
7. If the user wants the old OP to appear in the pick list, in the old OP directory, remove the “BAK” from the old OP file name.

Osiris User’s Guide Page 51 Version 2.2 Rev. 1
Updating OPs with a batch file The batch file described below, in the \Osiris directory, will update all custom OPs (in the Windows version). The cpmsg.bat file is distributed with the Osiris installation. It updates OPs by copying the new message book from the default Identifiler OP into the custom OPs. (Note that the message book is not kit-specific.) Change the path name specified by OSTOP to point to the OSIRIS program installation directory. The default OSTOP should work in many installations. Three directory path examples are given, two of which start with “rem”. To prevent unintentional updating the batch file is disabled. Activate by removing the “GOTO USAGE” line in Notepad or similar text editor. cpmsg.bat
@echo off
rem ***** SET OSTOP to the top path containing the osiris program
rem ***** all but one of the following lines containing
rem ***** "set OSTOP" should be commented out with rem
set OSTOP=%~d0%~p0
rem set OSTOP=C:\Program Files (x86)\NCBI\Osiris
rem set OSTOP=%USERPROFILE%\Apps\Osiris
IF NOT EXIST %OSTOP%\OsirisAnalysis.exe GOTO NOTFOUND
GOTO USAGE
set MSGBOOK=MessageBookV4.0.xml
set SRC=%OSTOP%\Config\Volumes\ID\ID_%MSGBOOK%
set DEST=%OSTOP%\site\Volumes
for /d %%i in ( "%DEST%\V-*" ) do call :DOCOPY "%%i"
GOTO DONE
:DOCOPY
SET DESTDIR=%~1
SET DESTBASE=%~n1
echo ....
echo %SRC%
echo %DESTDIR%\%DESTBASE%_%MSGBOOK%
copy "%SRC%" "%DESTDIR%\%DESTBASE%_%MSGBOOK%"
if ERRORLEVEL 1 GOTO ERROR
GOTO END
:USAGE
echo This batch file copies the Message Book xml file to all user defined volumes
echo but is currently disabled. To enable this feature, edit this batch file and
echo remove the line above containing "GOTO USAGE."
GOTO DONE
:NOTFOUND
echo cannot find TOP level OSIRIS directory
GOTO DONE
:ERROR
pause
exit
:DONE
pause
:END
Osiris User’s Guide Page 52 Version 2.2 Rev. 1
Determining OP names in file folders The name of a custom OP is not obvious from the name of the folder in which it is stored, which is labeled with the date, “V-yyyymmdd-hhmmss”, like C:\Users\OsirisUser\programs\Osiris\site\Volumes\V-20111018-152317. The names.bat batch file allows Windows users to see a list of the folders and the associated OP names located within them. This file needs to be located in the \Osiris directory. The batch file can be launched from Windows explorer by double clicking, or from the command line where output can be piped to a file: >cd C:\Users\OsirisUser\programs\Osiris >names.bat > OP_names.txt The resulting file can be viewed in Wordpad or a word processor. Notepad does not display the linefeeds well. names.bat
@echo off
cd %~d0%~p0
cd site\Volumes
if ERRORLEVEL 1 GOTO ERROR
mode con cols=133 lines=40
findstr /S /C:"<VolumeName>" *LabSettings.xml
cd ..\..
GOTO DONE
:ERROR
@echo Cannot find volumes directory
:DONE
pause
Mac users may open the V-yyyymmdd-hhmmss_LabSettings.xml file with a text editor and find the <VolumeName> tag to determine the OP name.
Appendix C. Sample Rework OSIRIS predicts and recommends sample reanalysis that would improve the quality of DNA profiles that have artifacts. The user can override these recommendations during editing, allowing the user to determine which, if any, rework is preferred for any individual sample or for an entire run. The user-selectable rework options are listed in the Artifact List (See Appendix F.) in the Sample and Directory categories. All of the rework options in the Directory category are user-selected; OSIRIS does not recommend rework for entire batches. Both software-recommended and user-selected rework options can be exported to either a LIMS or to a manual list to aid in sample re-queuing. The following describes the logic underlying OSIRIS sample rework recommendations. There are a number of OSIRIS-recommended rework options for individual samples incorporated into the MessageBook (version 4.0). These are: Recommend Reamp Less, More, Regular (or Reinject) and Recommend Reamp With Human Review. The latter does not export to the LIMS. The software’s decision between reamp negative and reamp positive depends in part on whether any peak in the sample exceeds a user-specified threshold we call the overload limit. Neither the reamp negative nor the reamp positive recommendation is made for samples that are actually ladders. The reamp regular recommendation applies to ladders whose ILS fails. Reamp negative The computation that a reamp negative should be recommended is made if (except for ladders):
[The sample has had at least one locus drop out -that is, no alleles were found for at least one locus AND there
is at least one allele in the sample which exceeds the overload limit threshold]…OR

Osiris User’s Guide Page 53 Version 2.2 Rev. 1
The sample has excessive pull-up -user-specified threshold AND at least one sample allele has height above the
overload limit…OR
The sample has an excessive number of craters -user-specified threshold…OR
At least one sample peak has been measured to have laser off-scale -when preset is configured to use this
information.
Reamp positive The computation that a reamp positive should be recommended is made if (except for ladders):
[The sample has had at least one locus drop out that is, no alleles were found for at least one locus AND there
no alleles in the sample which exceed the overload limit threshold] OR At least one locus is under-amped -
see below…AND
The sample is not a ladder.
The computation of the reamp positive recommendation depends on whether or not At least one locus is under-amped. This occurs if:
[One or more loci has peaks between analysis and detection thresholds AND EITHER (no genotype was found
for that locus OR the locus is homozygous with a peak that is below an acceptable threshold) OR (locus has
peaks below the analysis threshold that are not known artifacts -e.g., stutter- AND the locus is
homozygous)]…OR
[The “amplify more on homozygote problem” preset is specified AND (no genotype was found OR there was a
problem with the height of a homozygote)]…AND
The sample is not a negative control.
Reamp ambiguous In case both recommend reamp positive and negative are true, neither are reported. Rather, a “reamp ambiguous” is reported and human review is required. Reamp regular/Reinject The computation that a reamp regular should be recommended is made if:
The sample contains “too many” excessive residuals-user-specified threshold…OR
The percent of excessive residuals is too large user-specified threshold…OR
The ILS analysis failed.
Reamp regular is only reported if neither reamp positive nor reamp negative is true. Reinjection is recommended instead of reamp regular based on the user selection in the lab settings. During edit mode, the user can override any of these recommendations by selecting from the list of alternative rework commands. OSIRIS will allow the selection of only one of the rework commands for any given sample. The user can also choose to select a single rework command to apply to the entire plate.
Appendix D. Quality Assurance and Automation Uses Custom reports from OSIRIS can be scripted by the user, giving flexibility that allows a wide variety of different quality information to be exported in a broad array of formats. (See Appendix E.) These reports can be configured to export automatically upon analysis of a folder. This makes it possible to automate OSIRIS information collection for assessment of not only sample quality, but also process quality. See the discussion of the Sample Threshold settings for descriptions of Sample QC versus Process QA parameters. Typically, the process QA parameters target batch issues or the severity of sample quality issues, rather than individual sample artifacts. Please contact the OSIRIS team with suggestions about additional parameters you feel would be useful in this program ([email protected]). OSIRIS can also export samples from one analysis file into another, allowing discovery or sorting samples into good/artifactual analysis files. The following are examples of ways that OSIRIS could be used with custom user-scripted exports (example #3 has already been accomplished):

Osiris User’s Guide Page 54 Version 2.2 Rev. 1
1 Automate real-time checking of control samples in a high throughput laboratory. Example: A laboratory running multiple plates per day wants to analyze the controls as each capillary electrophoresis run is completed, both so that process problems can be identified before too many samples are in the pipeline, and to allow early re-queue of samples needing rework, reducing turnaround of problem plates and speeding up completion of high priority samples. To address this, the lab configures OSIRIS to analyze one or more batches and automatically export a file with notifications of control sample artifacts without requiring an analyst to review all controls. The artifactual controls can then be evaluated to determine the issue so that there can be early intervention to rectify the problem.
2 Accelerate acceptance and export of high quality samples. Example: A convicted offender testing laboratory wants to speed up the acceptance and export to LIMS of high quality samples without issues. After validation of OSIRIS as an expert system, the laboratory configures OSIRIS to analyze and automatically export the controls and all high quality samples without issues for import to the LIMS system without need for analyst review. A second automatic export is configured to export all samples requiring attention to a new project file for analyst review.
3 Automate selection of the better of two injections Example: A convicted offender testing laboratory does not quantitate template DNA before amplification and wants to automate selection between the better of 5 and 10 second injections. The laboratory configures an export to select the better of the two injections and report which samples failed both injections. The laboratory analyzes with OSIRIS, runs the export to select and export the successful injections, then an analyst reviews samples without a successful injection.
4 Automate sample reanalysis. Example: A laboratory wants to automate reanalysis of samples that gave poor quality profiles, to reduce turnaround time. The laboratory configures OSIRIS to analyze and automatically export sample rework recommendations either to LIMS or to a manual list for re-queuing.
5 Monitor Color Matrix performance. Example: A laboratory wants to monitor color matrix performance to detect performance degradation before significant numbers of samples require rework. The laboratory configures OSIRIS to automatically export a QA report of samples with pull-up and saturated data (laser off scale) artifacts. The laboratory imports this report into LIMS or a control chart spreadsheet to monitor the proportion of pull-up artifacts to saturated data artifacts to determine when the matrix performance begins to degrade, before a significant change is noted by the analysts.
6 Monitor capillary/array performance. Example: A laboratory wants to monitor capillary performance in their capillary arrays to maximize array value and minimize sample reanalysis. The laboratory configures OSIRIS to analyze and automatically export a QA report giving each capillary’s peak morphology quality data (peak fit). The laboratory imports this into LIMS or a control chart spreadsheet to monitor changes in peak fit to discover impending capillary failure.
7 Monitor Sample /extraction quality. Example: A convicted offender laboratory wants to monitor the quality of submitted samples and the DNA extraction. The laboratory configures OSIRIS to analyze and automatically export a QA report of artifact data regarding samples with too little, too much, and degraded/inhibited DNA to monitor sample/extraction quality.
8 Monitor Contamination. Example: A laboratory wants to automate continuous contamination monitoring. The laboratory configures OSIRIS to analyze and automatically export a QA report of contaminated negative controls and negative controls with peaks that are above the detection threshold but below the analysis threshold, to monitor both obvious contamination and sub-analytical contamination.

Osiris User’s Guide Page 55 Version 2.2 Rev. 1
Appendix E. User Defined File Export OSIRIS provides the ability to customize exporting of data from an analysis file to any text or xml format. This allows users to create exports for their laboratory’s unique needs. Examples of customized exports include files in a format that can be imported into the laboratory’s LIMS system or into specialized spreadsheet applications, files formatted for upload into CODIS (“Export CMF file…” on the File menu), files formatted for a user-designed display, OSIRIS analysis report files which can be viewed in OSIRIS containing the samples pertaining to a particular case for discovery (included with OSIRIS), and text files or tables for inclusion in a report. Since the information that can be included in an export is only limited by the information in the analysis file itself, exports can be designed with a wide variety of user applications including automation, process control, reporting, and any other uses that may arise. Contact the OSIRIS team with questions and suggestions regarding scripting custom exports ([email protected]). OSIRIS exports data from an analysis file using the XML Style Language Transforms (XSL, XSLT) version 1.0. This is implemented with the libxslt open source library from the GNOME project and includes the exslt extensions. The actual XSLT language syntax is beyond the scope of this document but is documented in many books and web sites; however no technical expertise is required to implement the use of an existing XSL file. A tutorial for implementing two export file types supplied with OSIRIS can be found in the Export Setup Tutorial. The input XML for the XSL transform is the analysis file, whether it is an .oar or .oer file. The format of the analysis
file is described in the XML schema file, OsirisAnalysisReport-2.0.xsd. This file can be found in the
Config\xsd subdirectory in the OSIRIS installation directory in the Microsoft Windows
TM version of OSIRIS and in
the Contents/MacOS/Config/xsd subdirectory of Osiris.app on the Macintosh
TM.
The XSL file can have top level parameters (using the <xsl:param> tag) which can be configured in OSIRIS to
provide a user interface to set these parameters. Two <param> names are reserved, they are inputFile and
outputFile, which if implemented are automatically set to the full path of the analysis and exported file names, respectively.
The XSL tag, <xsl:message> can be used to notify the user when there is a problem. The output produced by these tags is displayed if there is a failure in the export or if there is no output at all. Also, whether or not the export fails, the output is also logged and can be viewed in the message log which is the last item in the “Tools” menu on the menu bar.
To create, modify, or delete an XSLT export file type, select “Export File Settings” from the “Tools” menu on the menu bar. A window will appear with a list of all configured export file types or text stating that none exist. From here, the user can select “New…” to create a new file type or select one from the list and then select “Edit…” or
“Remove…”
When creating or editing an export file type a ‘Wizard’ dialog window is used to configure an XSLT export type. The first panel is shown on the right. The needed information is as follows:
Export File Description. This is text displayed in the File menu or the Export submenu in the file menu for this export type. If there is one export type defined, it will appear after the word “Export” in the file menu. If two or more are
defined, there will be an “Export” submenu in the file menu listing all of the export types.
File Name Extensions. This is a comma separated list of file name extensions of the output files to be saved. Some examples are: txt, xml, tab, csv. The checkbox labeled
“Allow user to override” is used to allow these selections to be overridden when saving a file.
Default Output File Location. This is the folder that will serve as the default when exporting a file. This can be a specific folder which can be navigated by clicking on the browse button or one of two predefined values. One predefined value is “[Same as Analysis File]” which will use the location of the analysis file used for input as

Osiris User’s Guide Page 56 Version 2.2 Rev. 1
the default location. Another predefined value is “[Remember Last Location].” If this option is used, the location where the last exported file was saved will serve as the default next time a file is exported.
XSL File. This is the full path of the XSL file used in the transform. Once these parameters are entered, select the “Next >” button to proceed to the next panel shown below:
This panel allows configuration of all of the top-level parameters (<xsl:param> tags) in the XSL file, if any, except for the two
reserved parameters, inputFile and outputFile, which are described at the beginning of this section. Each parameter is given a description and type. The Parameter description is
the label used in a dialog when exporting a file. The Parameter
type is one of: text, integer, decimal, choice,
choice/text, or ignore and filename. If ignore is selected, then this parameter will not be set when exporting data. If text is selected, then the user will be able to enter any text
when exporting. If integer or decimal are selected, the panel then allows a valid numeric range. When the user exports data, a number can be entered which is validated and not be accepted if it is out of range. The choice type displays a multi-line text box
that allows a list strings values to be entered. When the file is exported, the user can choose one the strings from a drop down list to be passed as the parameter. The choice/text option is like the choice option except the user can optionally type a value for the parameter that is not in the drop down list. Upon exporting data, when the dialog window for the entry of parameters appears, each is set to its default value as extracted from the XSLT file. After configuring the parameters, the “Next >” button will go to the third and last panel. This panel is used for configuring an automated export after each analysis. This is illustrated on the right. If the checkbox at the top is selected, then an attempt to export the file is performed after each analysis. There is, however, one caveat. If the Operating Procedure used in the analysis does not allow automated export when the analysis results need attention due to critical messages, the export is not performed. Three other parameters are used when an automated export is used. The first one is the Location of the output file. The user can select “[Same as
Analysis File]” or the Default Output File
Location entered in the first panel if it is a directory. Otherwise the user can enter the full path of an existing directory and/or use the browse button to search for one. The “File name” is the name of the file to be saved, not including the file name extension, or can be set to “[Same as Analysis
File]” from the dropdown list. If the checkbox below is checked, the date and local time will be appended to the file
name in order to ensure that no existing file is overwritten. The File extension can be selected from the dropdown list which contains all file extensions entered in the first panel or the user can enter a new file extension. Please note that when performing an automated export with this option, all of the top level parameters are not set by OSIRIS and therefore use their default values. Once this is completed clicking on the “Finish” button will save the
export type and close the dialog window, returning the user to the “Export File Types” window, which can be
closed by clicking on the “Done” button. All changes should be immediately reflected in the “File” menu on the menu bar when viewing an analysis file.

Osiris User’s Guide Page 57 Version 2.2 Rev. 1
Appendix F. Artifact List The following is a list of messages and of artifacts that OSIRIS tests, whether or not the artifacts are Critical or Non-Critical, whether they export when performing an export to LIMS, and their priority. Critical artifacts display a user notification and require user intervention. Non-critical artifacts can be displayed in either of the graphical views and information about them is available through the hover box, but they do not produce user notifications and do not require user intervention. (Note: X = critical; * = whether critical computed at run time; ^ = whether to display computed at run time; E = LIMS export; Priority = selection level for LIMS export when there are multiple export artifact options)
Artifact Display Artifact
Conditional
Artifact Critical
LIMS Export
LIMS Priority
Signals:
Pull-up at Extraneous ILS Peak
Curve Fit Unacceptable
X
Laser Off Scale [Pull-up also called]
X
Laser Off Scale: Probably Primary Pull-up
Laser Off Scale: Peak May Be Result of Pull-up
X
Curve Fit Marginal
Spike
X
Blob
X
Pull-up ^ *
Primary Pullup
Peak Is a Possible Unreported OL Allele
X
BELOW MINIMUM ANALYSIS RFU
*
Unexpected Peak in ILS
Peak Height Above Maximum Threshold
X
Conflict Osiris Below Min RFU; Raw Data Above
X
Conflict: Raw Data Below Min RFU; Osiris Above
X
Conflict: Osiris Above Max RFU; Raw Data Below
X
Conflict: Raw Data Above Max RFU; Osiris Below
X
Stutter
Peak to Right of ILS
Adenylation
Inter-locus Ladder Peak
X
Unexpected Peak in Ladder Locus
X
Width Unexpectedly High or Low
X
Crater or Poor Morphology: Possible Critical Adenylation
X
Signal Height Below Minimum Fractional Filter Height
Signal Height Below Minimum Pullup Fractional Filter Height
Below Fractional Filter (Left)
Below Fractional Filter (Right)
Below Pullup Fractional Filter (Left)
Below Pullup Fractional Filter (Right)
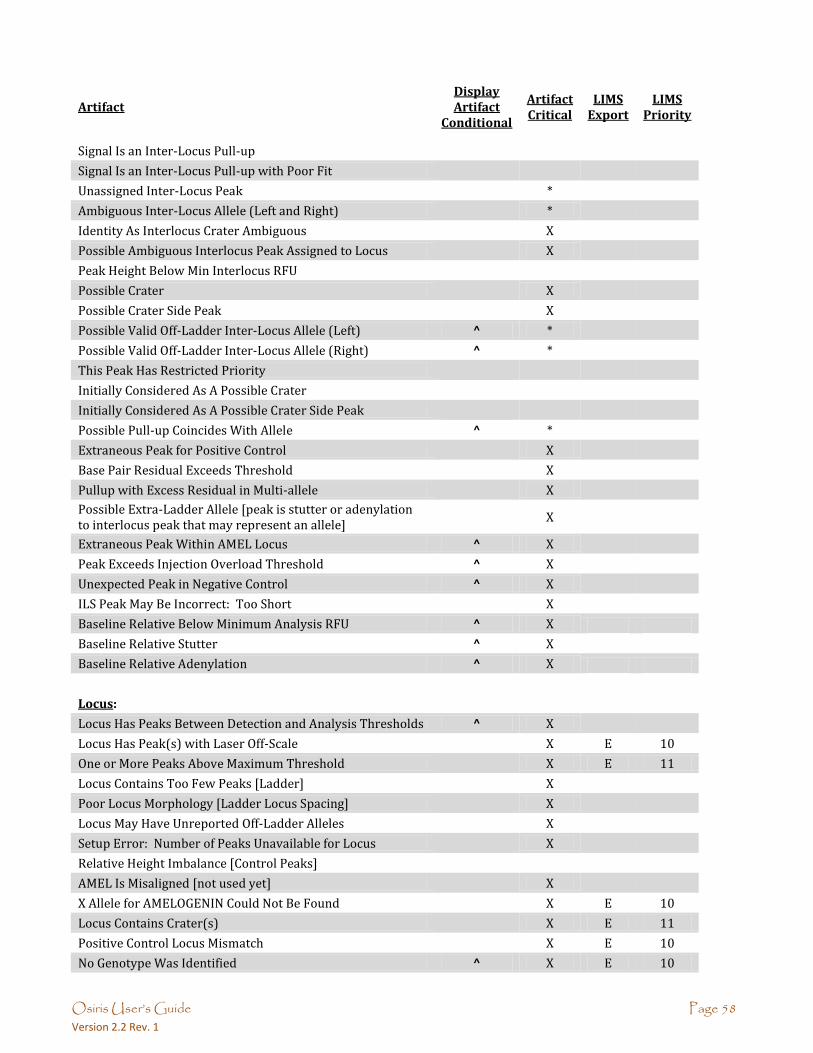
Osiris User’s Guide Page 58 Version 2.2 Rev. 1
Artifact Display Artifact
Conditional
Artifact Critical
LIMS Export
LIMS Priority
Signal Is an Inter-Locus Pull-up
Signal Is an Inter-Locus Pull-up with Poor Fit
Unassigned Inter-Locus Peak
*
Ambiguous Inter-Locus Allele (Left and Right)
*
Identity As Interlocus Crater Ambiguous
X
Possible Ambiguous Interlocus Peak Assigned to Locus
X
Peak Height Below Min Interlocus RFU
Possible Crater
X
Possible Crater Side Peak
X
Possible Valid Off-Ladder Inter-Locus Allele (Left) ^ *
Possible Valid Off-Ladder Inter-Locus Allele (Right) ^ *
This Peak Has Restricted Priority
Initially Considered As A Possible Crater
Initially Considered As A Possible Crater Side Peak
Possible Pull-up Coincides With Allele ^ *
Extraneous Peak for Positive Control
X
Base Pair Residual Exceeds Threshold
X
Pullup with Excess Residual in Multi-allele
X
Possible Extra-Ladder Allele [peak is stutter or adenylation to interlocus peak that may represent an allele]
X
Extraneous Peak Within AMEL Locus ^ X
Peak Exceeds Injection Overload Threshold ^ X
Unexpected Peak in Negative Control ^ X
ILS Peak May Be Incorrect: Too Short
X
Baseline Relative Below Minimum Analysis RFU ^ X
Baseline Relative Stutter ^ X
Baseline Relative Adenylation ^ X
Locus:
Locus Has Peaks Between Detection and Analysis Thresholds ^ X
Locus Has Peak(s) with Laser Off-Scale
X E 10
One or More Peaks Above Maximum Threshold
X E 11
Locus Contains Too Few Peaks [Ladder]
X
Poor Locus Morphology [Ladder Locus Spacing]
X
Locus May Have Unreported Off-Ladder Alleles
X
Setup Error: Number of Peaks Unavailable for Locus
X
Relative Height Imbalance [Control Peaks]
AMEL Is Misaligned [not used yet]
X
X Allele for AMELOGENIN Could Not Be Found
X E 10
Locus Contains Crater(s)
X E 11
Positive Control Locus Mismatch
X E 10
No Genotype Was Identified ^ X E 10

Osiris User’s Guide Page 59 Version 2.2 Rev. 1
Artifact Display Artifact
Conditional
Artifact Critical
LIMS Export
LIMS Priority
Unexpected Peaks in Neg Ctrl Locus
X E 13
Unexpected Number of Peaks [Ladder]
X
Heterozygous Imbalance Detected ^ X E 12
Heterozygous Imbalance May Be Result of Pullup At Allele(s)
X E 12
Single Peak Detected, Height Inappropriate for Homozygote
X E 12
Locus Contains Peaks with Excessive Residuals
X E 13
AMEL Contains One or More Extraneous Peaks
X E 11
One or More Interlocus Peaks to Right of Locus ^ X E 10
One or More Interlocus Peaks to Left of Locus ^ X E 10
Associated Ladder Locus Has Critical Artifact(s)
X
Three Alleles Were Identified ^ X E 10
More Than Three Alleles Were Identified
X E 10
Off Ladder Allele(s) Detected
X
Critical Level Messages At Allele(s)
X E 10
Unexpected Peak(s) in Sample Locus
X E 13
This Locus May Be Under-Amped
X E 15
Channel:
Lane Standard Requires Analyst Review: Spacing Is Marginal
X
Channel Has Raised Baseline
X
Channel Has Excessive Noise Above Analysis Threshold
X
Channel Has Excessive Noise Above Detection Threshold
X
Channel Has Excessive Noise: Peaks May Be Unreported
X
ILS Spacing Does Not Meet Expected Parameters
X
ILS Contains Too Few Peaks
X
Unable to Read FSA Channel
Cannot Separate ILS Primer Peaks
X
ILS Neighbor Filters Remove Too Many Peaks
X
ILS Fractional Height Filter Removes Too Many Peaks
X
ILS Relative Heights Inconsistent with Expected Heights
Unexpected Peaks in Channel [Negative Control]
Positive Control Locus Not Found in Set
X
Critical Level Messages At ILS Peak(s)
X
Negative Control Channel Contains No Primer Peaks
Channel Peaks Have Critical Artifacts
X E 16
Ambiguous Extended Locus Channel Peaks
X E 10
Sample:
ILS Could Not Be Analyzed
X E 4
Sample Requires Analyst Review: Marginal Lane Standard
X E 5
At Least One Channel in Sample Has Raised Baseline
X E 9

Osiris User’s Guide Page 60 Version 2.2 Rev. 1
Artifact Display Artifact
Conditional
Artifact Critical
LIMS Export
LIMS Priority
At Least One Channel in Sample Has Excessive Noise: Peaks May Be Unreported
X E 9
The Allelic Ladder Type Is Not Recognized
X
Unable to Read FSA File
X
Named Positive Control Not Found
X
One or More Positive Control Locus Not Found in Set
X
One or More Negative Control Channels Contain No Primer Peaks
X E 6
One or More Peaks Have Laser Off-Scale
X E 10
Sample Has At Least One Homozygote That Is Too Short
X
Associated Ladder Has Critical Artifact(s)
X
Sample May Be a Mixture
X E 6
Total Number of Homozygous Loci [Exceeds Threshold] ^ X
Total Number of Tri-allelic Loci [Exceeds Threshold]
X
Number of Pullups in Sample Exceeds Threshold ^ X
Number of Excessive Residuals in Sample Exceeds Threshold
X
Percent of Alleles with Excessive Residuals Exceeds Threshold
X
Percent of Pullups Exceeds Threshold ^ X
Number of Stutter Peaks Exceeds Threshold ^ X
Number of Adenylation Peaks Exceeds Threshold ^ X
Number of Off-Ladder Alleles Exceeds Threshold
X
Negative Control Requires Analyst Review
X E 6
Allelic Ladder Could Not Be Analyzed
X E 6
Core OL Allele: Recommend Rerun Sample
X E 7
Too Many Excessive Residuals: Recommend Rerun Sample
X
Sample Could Not Be Analyzed
X
Number of Crater Peaks Exceeds Threshold
X
Number of Spikes Exceeds Threshold
X
At Least One Allele Exceeds Amplification Overload Limit ^ X
Locus Dropout For At Least One Locus
X
Recommend Reamp Less (OSIRIS – Export) ^ X E 3
Recommend Reamp More (OSIRIS – Export) ^ X E 3
Recommend Reamp Regular (OSIRIS – Export) ^ X E 3
Recommend Reinject (OSIRIS – Export) ^ X E 3
Recommend Reamp With Human Review (No Export) ^ X
At Least One Locus May Be Under-amped ^ X
Color Correction Matrix Expected But Not Found – Using Uncorrected Data
X
Color Correction Matrix Wrong Size – Using Uncorrected Data
X
-----
Reamp Sample Regular (Analyst - Export)
E 1
Reamp Sample More (Analyst - Export)
E 1

Osiris User’s Guide Page 61 Version 2.2 Rev. 1
Artifact Display Artifact
Conditional
Artifact Critical
LIMS Export
LIMS Priority
Reamp Sample Less (Analyst - Export)
E 1
Reinject Sample (Analyst - Export)
E 1
Reextract Sample - Swab (Analyst - Export)
E 1
Reextract Sample - Blood (Analyst - Export)
E 1
Do Not Rework Sample (Analyst - Export)
E 1
Verification Sample (Analyst - Export)
E 1
Summary Locus:
Number of Sample Loci with Craters Exceeds Threshold
X
Percent of Loci with Craters Exceeds Threshold
X
Directory:
No Allelic Ladder File Identified
X
Default Protocols Are Overridden
X E 0
Reagent Kit Not Recognized
X
More Than One Reagent Kit Identified in Directory
X
Could Not Find Named Population Marker Set
X
Could Not Find Named Internal Lane Standard
X
No Positive Control Found In Directory
X
No Negative Control Found In Directory
X
Named Positive Control Not Found
X
Total Number of Samples with Excessive Pull-up Exceeds Threshold
X
Percent of Samples with Excessive Pull-up Exceeds Threshold
X
-----
Re-amp All Regular
E 2
Re-amp All Less
E 2
Re-amp All More
E 2
Re-inject All
E 2

Osiris User’s Guide Page 62 Version 2.2 Rev. 1
Appendix G. Adding a New Kit The easiest way to add a new kit to OSIRIS is to use an existing kit as a template and modify it to apply to the new kit. If you need assistance or have questions regarding adding a new kit, please contact us: [email protected]. If you add a new kit definition to OSIRIS for a commercially available kit and would be willing to share that with the community, please submit it to us. This allows us to check that the kit definition is robust and allows us to put the kit definition in a future OSIRIS release, so that users will not have to re-install the kit when upgrading to a new version of OSIRIS. A new kit that used a fragment sizing ladder as a locus would allow use of OSIRIS for fragment sizing. If you are creating a new kit or modifying an existing kit, you should review the discussion of Core/Extended/Interlocus Boundaries for important considerations in defining the ladder. A Few Notes On XML XML may be edited with Wordpad on the PC and most text editors on the Mac. There are also various free XML editors available on the internet that can automatically determine if the edited file has XML errors, such as problems with tags. Some editors can also validate the XML according to the OSIRIS XML schemas, which will identify some errors in XML file structure. To find free code editors, many of which are configured for XML, search the internet using “open source code editor” or similar terms. Osiris XML schemas are in the Osiris\Config\xsd folder. When validating against the appropriate XML schema using an XML editor, copy the schema into the same folder as the XML file to be validated. This section is not intended to give the user a detailed knowledge of XML, rather a few pointers that prevent common mistakes. More detailed XML primers are available in many locations on the internet and in many textbooks. XML data is organized using descriptive “tags” that show the beginning and the end of any piece of data. The opening tag format is: <TagName> with the tag name surrounded by “<” and “>” symbols. The closing tag format is similar, but begins with “</” like </TagName>. The data is structured hierarchically, with different levels of the hierarchy in nested opening and closing tags, like this: <Set> <KitName>Identifiler</KitName> <FileName>Identifiler_LadderInfo.xml</FileName>
</Set> It is critical to maintain the proper tag structure and hierarchy for the XML to work. So when modifying a copied kit, ensure that the opening and closing tags are copied, that the beginnings and ends of all the tags are copied faithfully, and that the nesting structure is maintained. Note: When entering kit names, file names, locus names, etc., it is important to make sure that spelling and capitalization are consistent (e.g., SEfilerPlus, SEfiler Plus, and SefilerPlus are not the same and will cause issues if different in different locations).

Osiris User’s Guide Page 63 Version 2.2 Rev. 1
New Kit 1. Find the files that must be modified: kitcolors.xml and ILSAndLadderInfo.xml (to locate them, go to the Osiris
directory; these files are in ..\Osiris\Config\LadderSpecifications)
New Internal Lane Standards (ILS’s) a. ILSAndLadderInfo.xml:
i. If needed, add the specifications for any new Internal Lane Standards (ILS’s) ii. ILS names must be unique
iii. The characteristics are the sizes of the ILS peaks, each separated by a space iv. Relative peak heights are High (H), Medium High (MH), Medium (M), Medium Low (ML) and
Low (L) – in the absence of expected relative height information, use either H or MH for all. v. The Correlation Acceptance Threshold dictates the minimum correlation of spacing between
located peaks and ideal characteristics and 0.993 has worked well (that is, accepts common spacing and rejects incorrect collections of peaks) for both ABI and Promega ILS’s
vi. Correlation Auto Acceptance Threshold dictates the minimum correlation of spacing between (quadratically) transformed located peaks and ideal characteristics (accounting for non-linear distribution of characteristics): 0.999 works well (see above) for Promega and 0.9975 works well for ABI (both with and without the “250” peak)
vii. Under the “kits” tag, near the bottom of the file, the new kit name must be specified, along with the file name for the ladder specification data. For example, for Identifiler and IdentifilerPlus:
<Set> <KitName>Identifiler</KitName> <FileName>Identifiler_LadderInfo.xml</FileName> </Set> <Set> <KitName>IdentifilerPlus</KitName> <FileName>IdentifilerPlus_LadderInfo.xml</FileName>
</Set> viii. Back up this modified file for reinstallation in case OSIRIS needs to be re-installed or
upgraded.
Kit Colors b. kitcolors.xml:
i. The new kit must be added, led by the kit name ii. Each channel must be specified with colors for the Osiris Analyzed data (analyzed), the raw
data (raw) and the associated ladder (ladder). The precedent is that color shades are increasingly lighter from Analyzed data>Raw data>Allelic ladder data.
iii. Generally, color data may be copied from already existing kit(s) iv. Back up this modified file for reinstallation in case OSIRIS needs to be re-installed or
upgraded.

Osiris User’s Guide Page 64 Version 2.2 Rev. 1
Ladder 2. The LadderInfo.xml File
a. The file name is the same as specified in 1.a.vii (above) and the path should be the same as the kitcolors.xml and ILSAndLadderInfo.xml files
b. Under the tag “LS”, list all available internal lane standard names and specify the channel number of the ILS. For example: <Set>
<Name>IdentifilerPlus</Name> <NChannels>5</NChannels> <LS> <LSName>ABI-LIZ500</LSName> <LSName>ABI-LIZ450</LSName> <LSName>ABI-LIZ400</LSName> <LSName>ABI-LIZ350</LSName> <ChannelNo>5</ChannelNo>
</LS> …
c. File name suffix, genotype suffix and directory search string are no longer used, but must be included; any values may be used
d. Optionally, a channel map, relating the channel in the .fsa or .hid file to the “reported” channel, can be specified…see the XML schema and the example below: <DirectorySearchString>PP12</DirectorySearchString>
<FsaChannelMap> <Channel> <KitChannelNumber>1</KitChannelNumber> <fsaChannelNumber>1</fsaChannelNumber> </Channel> <Channel> <KitChannelNumber>2</KitChannelNumber> <fsaChannelNumber>3</fsaChannelNumber> </Channel> <Channel> <KitChannelNumber>3</KitChannelNumber> <fsaChannelNumber>4</fsaChannelNumber> </Channel>
</FsaChannelMap>
e. For each locus, enter: i. Locus name
ii. Channel number iii. MinBP: the allelic ladder base pair that gives the low end of the range of the extended locus
(may be set to be equal or less than the allelic ladder base pair of the first ladder allele). This value must be an integer.
iv. MaxBP: the allelic ladder base pair that gives the high end of the range of the extended locus (may be set to be equal or greater than the allelic ladder base pair of the last ladder allele). This value must be an integer.
v. MinBP and MaxBP can be set to overlap neighboring loci, either core or extended, but may not exceed either neighboring core locus. See discussion in Appendix A.
vi. The lab settings parameter labeled “Ignore artifacts lower than…” must be set low enough that it does not impinge on any ladder or extended alleles. If not specified in the lab settings file, this parameter defaults to ILS-ref value of the left-most ILS peak.
vii. MinGridLSBasePair: left end of the search interval for locus ladder alleles (in ladder files), specified in ILS-ref units. This value may have digits to the right of a decimal point.
viii. MaxGridLSBasePair: right end of the search interval for locus ladder alleles (in ladder files), specified in ILS-ref units. This value may have digits to the right of a decimal point.

Osiris User’s Guide Page 65 Version 2.2 Rev. 1
ix. The two parameters above delineate the range in which the ladder locus alleles can be found and should be set conservatively large (for example, 20 – 30 ILS-ref units beyond approximate ends of ladder locus); search interval values can be integer or decimal; search intervals must encompass all the alleles from their own locus and may overlap neighboring search intervals, but may not overlap any of the alleles of neighboring loci.
x. List of ladder alleles 1. Allele name (repeat number, except X and Y for AMEL, which are designated by “1”
and “2”) 2. Curve number ; this number must increase from allele to allele within each locus. 3. BP: can be measured allelic ladder-bp, sequence-bp or approximate ILS-bp; must be
an integer and it must respect the bp spacing between alleles (i.e., 4 or 5 bp for one full repeat depending on the locus repeat size).
4. Relative Height: as for the ILS, above; should always be specified, even if always “H” or “MH”
f. Back up this modified file for reinstallation in case OSIRIS needs to be re-installed or upgraded.
Operating Procedure 3. The Operating Procedure: Standard Settings, Lab Settings, MessageBook and Access files
a. Standard settings: i. Copy an existing standard settings file
ii. Modify standard positive control(s) to reflect new kit, where BioID is the allele’s ladder-base pair size* , where BioID is the allele base pair size; for example:
<StdMarkerSetSpecifications> <StdMarkerSetCollection> <MarkerSetName>Identifiler</MarkerSetName> <PositiveControls> <PositiveControl> <Name>9947A</Name> <Loci> <Locus> <Name>D8S1179</Name> <Allele> <Name>13</Name> <BioID>147</BioID> </Allele> </Locus> <Locus> <Name>D21S11</Name> <Allele> <Name>30</Name> <BioID>210</BioID> </Allele> </Locus> <Locus> <Name>D7S820</Name> <Allele> <Name>10</Name> <BioID>273</BioID> </Allele> <Allele> <Name>11</Name> <BioID>277</BioID> </Allele> </Locus> …
*Note that OSIRIS Version 2.xx does not use the value in the BioID tag for validating positive control alleles. So for convenience, this may be set to zero or any other arbitrary value in the positive control definition, if desired: <BioID>0</BioID>.

Osiris User’s Guide Page 66 Version 2.2 Rev. 1
b. Lab Settings i. Copy an existing lab settings file
ii. Modify the name of the default standard positive control (usually the kit positive control): <NameStrings> <StandardControlName>9947a</StandardControlName>
</NameStrings>
iii. Modify the MarkerSetName and the default ILS to include the name of the new kit you are creating and to indicate the kit’s default ILS name:
<LabMarkerSetSpecifications>
<LabMarkerSetCollection>
<MarkerSetName>Identifiler</MarkerSetName>
<ILS>ABI-LIZ450</ILS>
</LabMarkerSetCollection>
</LabMarkerSetSpecifications>
iv. Modify any locus specific settings and thresholds that will differ from the kit copied (e.g., the
table on the Operating Procedure Locus/ILS Thresholds tab). This can be done through the Lab Settings (Tools>Lab Settings>Locus/ILS Thresholds tab).
v. Modify, add or remove any custom positive control(s) from the kit that was copied. This can be done through the Lab Settings (Tools>Lab Settings>Assignments tab>Positive Controls dropdown).
c. MessageBook i. Copy an existing MessageBook file
d. Access file i. Copy an existing “access.txt” file
e. Make the new kit’s default folder i. Rename the StdSettings, LabSettings, MessageBook, and Access files to incorporate new kit
name and place in a new folder with appropriate kit name (no spaces); add folder to collection of the default kit folders in ..\Osiris\Config\Volumes.
Synthesizing a custom allelic ladder OSIRIS requires an allelic ladder to perform sample analysis. Therefore, if using a custom made STR multiplex, the user will have to construct an allelic ladder to serve as a control sample. Typically allelic ladders are made by pooling individual samples to give a good representation and distribution of alleles and allele repeat sizes. Given that OSIRIS uses a cubic spline to estimate allele sizes from the allelic ladder, each locus should have at least four to five alleles at a minimum, with as wide an allele repeat range as possible. More alleles and a wider range will increase the accuracy of allele calling. Three or fewer alleles might not work well. The ladder allele peak heights do not need to be similar to one another and having gaps where an allele is not present in the ladder is not a problem. In fact, the ladder fitting algorithm is designed such that different peak height and allele gaps in the ladder actually increase the robustness of ladder fitting. OSIRIS does not require that ladder alleles flank all of the identified alleles for allele calling. If the sample alleles fall outside the ladder allele range, OSIRIS will extrapolate to call the alleles. In our somewhat limited experience of OSIRIS extrapolation (using commercially available kits), OSIRIS performance calling alleles outside the ladder range by extrapolation was excellent. To construct an allelic ladder de novo, select samples that have the alleles of interest and pool the DNA. Amplify, analyze the pool, rebalance the amounts of the inputs to the pool to achieve the desired peak balance and reamplify the rebalanced pool to make the ladder. Once a satisfactory ladder has been achieved, the amplified ladder can be stored as a frozen stock for amplifying new batches of allelic ladder for analysis. Reamplification of ladder can be done by making a 1:1000 dilution of the amplified ladder stock and amplifying 5 µl for 15 rather than 28 cycles (to avoid over-amplification of ladder peaks). Serial amplification of ladders should be avoided to prevent degradation of ladder characteristics or introduction of artifacts.

Osiris User’s Guide Page 67 Version 2.2 Rev. 1
Appendix H. Dynamic Baseline Analysis OSIRIS now features a dynamic baseline analysis that detects and approximates the true baseline and then normalizes the raw data with respect to that approximation by subtracting the approximated raw baseline from the raw data. Once the raw data has been normalized, peaks can be fit in the usual manner and the heights and areas of the fit peaks will be accurate with respect to their true values. Ladder files and sample internal lane standard channels are not analyzed for variant baselines. Without dynamic baseline analysis, OSIRIS behaves as it did in prior versions; it determines the baseline at the right hand end of the raw data for each channel, then uses that as the analytical baseline (or zero) for the entire set of data points in that channel. The usual course of sample analysis is to determine the analytical baseline from the raw data at the right of the plot, as described above, to fit mathematical curves to the peaks of each channel and then to analyze the internal lane standard (ILS). When OSIRIS fits a mathematical curve to a raw data peak, the mathematical curve extends all the way down to the analytical baseline, except in situations where two peaks are close to each other, in which case the mathematical curves intersect before reaching the analytical baseline, so never reach zero. This type of baselining works quite well for high quality data where the raw data baseline is essentially flat across the data that encompass the loci of interest. However, when the raw baseline rises significantly above the analytical baseline, typically at the left of the electropherogram, small peaks in the raw data will be fit with a mathematical curve that extends all the way to the zero analytical baseline, which can be significantly below the raw baseline the area of the peak, resulting in very small raw peaks fit with curves with artificially elevated RFU values and wide bases. Additionally, where the raw baseline is elevated above the analysis threshold, small deviations in the raw data may be fit as curves. In datasets where the raw baseline is significantly elevated, the curves that are fit and their RFU values can be improved by dynamically approximating the true baseline from the raw data and subtracting it from the raw data so that the raw data has a zero baseline.
Detecting the true baseline: Fitting mathematical curves to the peaks of each channel and analyzing the internal lane standard (ILS) produces all the information that OSIRIS needs to estimate the dynamic baseline. The internal lane standard channel is not tested for dynamic baseline. The curves fitted to peaks in the non-ILS channels are locations where the raw data is above the raw baseline. By contrast, regions in between the peaks, where the peak-fit curves extend down to zero, should correspond to raw baseline data regions. Therefore, these regions contain evidence of the raw data dynamic baseline. Since some peaks are close enough to each other that the peaks sides overlap and prevent the raw data from falling all the way back to the raw baseline, OSIRIS needs to test the areas between peaks for wide enough stretches of raw baseline to use for approximating the overall dynamic baseline shape. Where raw peaks are close to each other, the analytical peak-fit curve values may also not reach zero between peaks. To test for acceptable stretches of raw baseline between peak edges, OSIRIS uses a “zero threshold” of 0.1 times the Analysis Threshold, so if the Analysis Threshold is set to 100 RFU, the “zero threshold” will be 10 RFU. Peak edges will rapidly rise above the zero threshold. Any run of at least 51 seconds worth of raw measurements for which the analytical fitted curve is less than or equal to the zero threshold is acceptable to provide data to approximate the dynamic baseline. Starting at the time of the left-most ILS peak, such baseline-worthy intervals are collected and the raw data are sampled. These intervals are collected all the way to the end of the collected data in the run. Since the raw data is noisy, a single raw data point is of little value. Therefore, a sample at a point consists of the average of that point together with the 25 points prior and the 25 points following – an average of 51 consecutive raw data values – and the sample is associated with the time of the center point. If an interval is more than 51 seconds long, two or more samples will be taken. For longer intervals, raw data samples are taken approximately every 150 seconds. The set of times and samples calculated above are used as “knots” to define a cubic spline approximation to the raw baseline curve. Because of the smoothness of the curve, together with the distance between knots, along with the averaging technique for calculating the sample values, this dynamic baseline curve is not responsive to the high frequency noise in the raw data – minor deviations in the noise do not cause a change in the baseline curve. To help condition the endpoints of the cubic spline and maintain curve accuracy, extra knots with zero values are added beyond the ends of the collected data in the run, both to the right and the left.

Osiris User’s Guide Page 68 Version 2.2 Rev. 1
The cubic spline curve is then evaluated at each one second interval and the value is subtracted from the raw data to produce a raw data curve that has an essentially zero-average baseline. Since the original peak-fit curves no longer fit the dynamically normalized data points, all of the peak-fit curves are recalculated for the peaks in the non-ILS channels. The OSIRIS analysis now proceeds with the new peak-fit curves and the original ILS. As an option, the user can choose to subtract only the non-negative values of the cubic spline baseline from the raw data rather than both positive and negative, where the cubic spline dips below zero, but the result of that may be a normalized baseline that is less than zero in some regions, rather than a zero baseline, with the ultimate consequence that some very small peaks in the regions with negative baseline may not be analyzed because they will be below the analysis threshold.
Checking calculated dynamic baseline goodness-of-fit The goodness-of-fit of the calculated dynamic baseline can be visually evaluated by calculating the baseline but not subtracting it from the raw data, then displaying both the calculated dynamic baseline and the raw data together. To do this, select the “Test Adjusted Signal Heights Relative to Baseline” preset and deselect the “Normalize Raw Data Relative To Baseline” preset on the Sample Thresholds tab of the Lab Settings for the Operating procedure that you want to use for analysis. After analysis, open the Graph view for a sample (preferably one that has a significantly elevated raw data baseline at the left of the electropherogram), turn off the Analyzed Data display (A) and display the Raw Data (R) and the calculated dynamic Baseline Data (B) to visually evaluate how well the curve matches the raw baseline.

Osiris User’s Guide Page 69 Version 2.2 Rev. 1
Appendix I. Troubleshooting and FAQ
Troubleshooting Problem Solution My analysis failed OSIRIS must have an acceptable ladder for the analysis to succeed.
The most common cause of analysis failure is selection of the wrong kit or ILS definition in the Operating Procedure. Ensure that the correct kit and ILS combination is selected in the Operating procedure being used for the analysis. Any time your analysis fails you can select the “Details” button to find troubleshooting information. Selecting “View Selection” or double clicking the failed run will open the ladder, if it could be found and partially analyzed. Click the ladder sample name to view all the channels of the ladder in the Preview pane or double click the ladder sample name to view it in the Graph View to determine the presence of artifacts and peaks and whether the locus and ILS peaks are below the analytical threshold. No ladder sample was present, or the file name did not contain the ladder file search string. OSIRIS requires a ladder for analysis. Artifact peaks made it impossible to analyze the ladder ILS. Sometimes this can be alleviated by adjusting the ILS analysis thresholds. Otherwise re-prepare or re-inject the ladder. The ladder’s ILS peaks are below threshold. Adjust the ILS analysis thresholds. Otherwise re-prepare or re-inject the ladder. The ladder’s peaks have artifacts or are below threshold. Sometimes this can be alleviated by adjusting the Ladder analysis thresholds. Otherwise re-prepare or re-inject the ladder.
My .hid/.fsa analysis failed If the Operating Procedure is not set for the correct file type on the General tab of the Lab Settings, the analysis will fail because no files of the expected type are present. If you select the failed run and click the details button, at the bottom of the list there will be a “Project did not meet expectations...No satisfactory ladder found...Ending” error message. Make sure that the correct file type is selected and reanalyze. Analysis of a directory tree with multiple file types will succeed only in those subfolders containing the expected file type.
I can’t upgrade my version 1.33 Lab Settings
OSIRIS 2.xx should be compatible with viewing files analyzed with previous OSIRIS versions 1.xx. However, for the purpose of new analysis, version 1.xx Lab Settings must be reentered; they cannot be upgraded to 2.xx. Version 2.x Operating Procedures may be upgraded to versions up to 2.2. See Appendix B for OP upgrade instructions.
OSIRIS crashed when I used my old Operating Procedure after I upgraded
Version 2.x customized Operating Procedures are not upward compatible and must be upgraded to higher versions, because versions higher versions look for a checkbox-settings in Laboratory Settings that are not present in earlier version Operating Procedures. See Appendix B for OP upgrade instructions.
I can’t edit the Operating Procedure You cannot edit default Operating Procedures (shown in brackets) such as [PowerPlex 16]. Make a new Operating Procedure that can be edited. You cannot edit Operating Procedures opened through the “Parameters” button. These are static copies associated with the analysis file you are viewing. This is designed to preserve the conditions used for a specific analysis.

Osiris User’s Guide Page 70 Version 2.2 Rev. 1
Problem Solution I can’t edit the Operating Procedure (Cont.)
The Operating Procedure is locked while either being edited or used for analysis by any user. Check to determine whether other users are editing or analyzing with that OP. If you try to edit the Operating Procedure immediately after your own analysis, it may still be locked. If you have just performed an analysis, wait 30 to 60 seconds and try again. Locking the OP prevents change in the middle of analysis, or corrupting the Operating Procedure if two users were to make changes at the same time. If you are operating on a network or in a forensic or clinical laboratory, your OSIRIS administrator may have limited write permissions on the Operating Procedure directories to prevent unintended changes. Contact your OSIRIS administrator. You must install OSIRIS in a directory for which you have write permission. In Windows 7, for example, if you are not logged in as the administrator and you install OSIRIS in the \Program Files directory you may not be able to edit the Operating Procedures or create new OPs. In that case try installing OSIRIS in a different directory (such as \My Documents or \Downloads).
My file says that it may have been modified outside of OSIRIS
Modification of OSIRIS analysis files (.oar, .oer, .plt) with software other than OSIRIS will cause this message. This is designed to protect the integrity of the data. If the output is saved on a network drive, the time on the computer containing that drive should be in sync within one minute of the time on the computer running OSIRIS otherwise OSIRIS may give this message even if the file has not been edited. It is highly recommended to synchronize the network by using a designated computer as the time server, possibly by using Windows Time Service on Microsoft Windows or Network Time Protocol (NTP) on the Macintosh.
Some artifacts do not display on the electropherogram plot in the graph window
Check which artifact display option you have selected. “None” displays no artifacts on the graph. “Critical” will not display non-critical artifacts. Artifacts associated with the locus, channel, sample or directory do not display on the graph, only artifacts associated with peaks.
The ladder peak labels don’t always display
The Ladder button on the Graph toolbar and Show Ladder Labels on
the menu show and hide the ladder labels. To prevent clutter on graph displays, OSIRIS allows the user to set the maximum number of ladder peak labels that will display. When the number of ladder peaks on the graph exceeds the user-defined Max. ladder peak labels (Graph menu), OSIRIS dynamically turns off the ladder label display. As the user zooms in and the number of ladder peaks falls below the setting, the labels automatically reappear.
What happens when my peak falls in the core of one locus and the extended locus of the adjacent locus?
If a peak is a good match for the corresponding core locus ladder allele, it is flagged with a non-critical artifact. If it is not a good match for the core locus ladder allele, which might be an indication that it really could belong to the adjacent extended locus, then it is flagged with a critical artifact. See Core and Extended locus artifact discussion and Core and Extended locus boundary discussion.
OSIRIS doesn’t open when I double click a file (Windows)
If OSIRIS is installed by unzipping rather than installing with the .msi download file or if it is installed on the network, then you must associate the OSIRIS file types with the program. In Windows 7, double click the file you want to open in OSIRIS, select “Select a program from a list of installed programs” and click OK. Type or copy the full directory path and file name for OsirisAnalysis.exe in the “Type a description that you want to use for this file” box, make sure “Always use the selected program to open this kind of file” is selected, and click Browse. You will need to repeat this for each of the files with extensions of .oar, .oer, .plt and .obr that you want to open by double clicking.

Osiris User’s Guide Page 71 Version 2.2 Rev. 1
Problem Solution OSIRIS no longer asks if I want to exit the program
When you close OSIRIS, you get a prompt “Do you want to exit OSIRIS?”. When you check the “Don’t show this window again” box, that prompt no longer displays, rather OSIRIS immediately closes. The prompt can be reset by editing the osiris.xml file in: Win XP - C:\Documents and Settings\username\Application Data\.osiris Win 7 - C:\Users\username\AppData\Roaming\.osiris Open Osiris.xml with notepad or some other text editor and modify line 36 from <CheckBeforeExit>false</CheckBeforeExit> to <CheckBeforeExit>true</CheckBeforeExit> and save the file. The next time you close OSIRIS, you will get the prompt again.
How do I put/stop putting all the analysis files in the input directory?
To put all the files produced by the analysis into the input directory containing the .fsa or .hid files, use the same path for both input and output when starting a New Analysis. To put them into a different directory, use a different path. OSIRIS defaults to the last path used for both input and output, so it remembers the last locations. Selecting the “Create time stamped subdirectory” tick box in the New Analysis window prevents overwriting a previous analysis.
FAQ 1. Can I analyze .hid and .fsa file types?
Yes. The Operating Procedure must be set for the appropriate file type. See General – .fsa and .hid files in Lab Settings.
2. Can I enter a new kit in OSIRIS? Yes. See Appendix G for instructions. Contact us for help or advice.
3. Can I use a different ILS? Several different ILS are defined for various kits. Note that some of those are actually one ILS, but use more or fewer of the peaks, in case not all peak data gets collected. If the ILS you use is not defined for the kit you use, see Appendix G for instructions on defining a new ILS. Contact us if you need help.
4. What do I do if my multiplex has no ladder available? You can either construct a ladder, or you can use a DNA sizing ladder to add a new kit. See Appendix G or contact us for help.
5. How fast is OSIRIS? OSIRIS should process 2 to 4 samples per second, depending on the number of artifacts in the samples and the speed of your computer/network. So a plate of 98 samples with controls should take 30-60 seconds to analyze. If it runs significantly slower than that on your system, contact us for advice.
6. How many samples can OSIRIS process at once? OSIRIS will process at least 800 samples in a single batch (single directory). OSIRIS will process an essentially unlimited number of batches in a single processing run. This has been tested with approximately 10,000 samples in 110 directories (plates) in a single analysis that took approximately 1 hour 20 minutes.
7. How many users can use OSIRIS at the same time? This is limited only by the number of client computers you have and the speed of your network and server. Generally, it should be “lots.” Additionally, each user is creating a separate instance of OSIRIS running on the local client, so multiple users will not affect the speed of operation except as limited by sample data flow across the network to and from the server if the sample data and OSIRIS output is being stored on the server. A single user can run separate instances of OSIRIS on the same computer at the same time (Windows only), allowing different analyses or tasks to be performed simultaneously. Multiple analyses can also be run from a single OSIRIS process (Windows and Macintosh).

Osiris User’s Guide Page 72 Version 2.2 Rev. 1
8. Is there any fee for OSIRIS software or use? No. OSIRIS is free and open source. No license or fees are required.
9. Is OSIRIS source code available? Yes. OSIRIS source code is available. Contact us: [email protected].
10. Can I modify OSIRIS, build it into my front end or incorporate it into my own software? OSIRIS is open source. You may do anything your heart desires. In any work or product derived from this material, proper attribution to the authors as the source of the software would be appreciated.
Contact us: [email protected].
Osiris User’s Guide Revision History
Version, Revision Changes
Version 2.03 Rev. 1
Version 2.04 Rev. 1 Added detail and examples to “Appendix G. Adding a new kit”. Added detail regarding displaying and sorting by sample names versus
sample file names. Sorting samples and Display Added detail regarding searching sample names versus sample file names
for controls and other sample types. File/Sample Names Modified Sample Thresholds figure and text to indicate “Max. No. of pull-
up peaks per sample” indicates sample severity rather than affecting sample analysis and that “Incomplete profile threshold for Reamp More/Reamp Less” value is optional.
Version 2.1 Rev.1 Added detail regarding analysis of .hid file type.
Added information regarding new parameters in Sample Thresholds
tab of Lab Settings
Updated cpmsg.bat description Added names.bat description
Version 2.2 Rev. 1 Added ‘Baseline’ Signal Artifacts to Artifact List
Added information regarding new Baseline parameters in Sample
Thresholds tab of Lab Settings
Added Appendix H.-Dynamic Baseline Analysis regarding the functioning of OSIRIS dynamic baseline analysis
Added to Appendix I: Troubleshooting section Added to OSIRIS Artifact Handling Added detail regarding flagging artifacts when a peak is in Core and
Extended loci Added detail regarding Baseline Data and Ladder label display options Added description of demonstration files in the Quick Tutorial Added thresholds descriptions in Sample Thresholds section