Dynamic source modeling of the 1978 and 2005 Miyagi-oki earthquakes: Interpretation of fracture...
12
Dynamic source modeling of the 1978 and 2005 Miyagi‐oki earthquakes: Interpretation of fracture energy Takeshi Kimura, 1,2 Kazuki Koketsu, 1 Hiroe Miyake, 1 Changjiang Wu, 3,4 and Takashi Miyatake 1 Received 6 July 2009; revised 22 February 2010; accepted 16 March 2010; published 3 August 2010. [1] We constructed spontaneous dynamic rupture models of the 1978 and 2005 Miyagi‐oki, Japan, earthquakes, which occurred on the same plate boundary repeatedly with different magnitudes, to reproduce the slip and the rupture velocity predicted by kinematic source models. Comparison of the dynamic source parameters of these events enables us to consider the behavior of rupture dynamics during different source processes on the same fault. In particular, we compared the stress drop and the fracture energy, which can be evaluated stably, between two events. The maximum and average values of the stress drop over the whole fault plane and on an asperity that ruptured during both events are almost identical in the two models. On the other hand, the 1978 event, whose magnitude was larger than the 2005 event, has a fracture energy value larger than that of the 2005 event not only over the whole fault but also on the asperity that ruptured repeatedly. These results are consistent with previous studies of the scaling of fracture energy with the seismic moment. We also compared the fracture energy values with those of other inland events estimated for previous studies; our values for the Miyagi‐oki earthquakes are smaller. Differences in tectonic setting between shallow inland events and deep subduction‐zone events might cause this discrepancy. Citation: Kimura, T., K. Koketsu, H. Miyake, C. Wu, and T. Miyatake (2010), Dynamic source modeling of the 1978 and 2005 Miyagi‐oki earthquakes: Interpretation of fracture energy, J. Geophys. Res., 115, B08302, doi:10.1029/2009JB006758. 1. Introduction [2] Accumulation of information on the source parameters of real earthquakes is important for understanding the physics of the source rupture process. Using seismic waves, geodetic data, tsunamis, and other information researchers have proposed a variety of kinematic source models [e.g., Kikuchi and Kanamori, 1982; Hartzell and Heaton, 1983; Satake, 1993; Wald and Heaton, 1994; Thatcher et al. , 1997]. Based on these kinematic models, the dependencies of kinematic source parameters, such as fault size, slip, slip‐ rate, and other characteristics on the seismic moment have been discussed [e.g., Kanamori and Anderson, 1975; Somerville et al., 1999; Mai and Beroza, 2000; Murotani et al., 2008]. [3] Contrary to the findings of kinematic source models, which might contain mechanical inconsistencies, dynamic ruptures propagate according to elastodynamic equations and friction laws on the fault. Numerous dynamic rupture models have been constructed that are consistent with the rupture physics identified by laboratory studies. Dynamic rupture models based on near‐source waveform or kine- matic source models have been attempted for several real earthquakes: the 1979 Imperial Valley earthquake [Favreau and Archuleta, 2003], the 1992 Landers earthquake [Olsen et al., 1997; Peyrat et al., 2001], the 1994 Northridge earthquake [Nielsen and Olsen, 2000; Ma and Archuleta, 2006], the 2000 Tottori earthquake [Dalguer et al., 2003; Peyrat and Olsen, 2004], the 2001 Geiyo earthquake [Miyatake et al., 2004], the 2002 Denali earthquake [Dunham and Archuleta, 2004], and the 2004 Parkfield earthquake [Ma et al., 2008]. Dynamic rupture modeling enables us to consider the rupture physics more directly than kinematic source models do. Relationships among source parameters obtained from these dynamic source models have provided new insights into the physics of earthquakes [e.g., Tinti et al., 2005; Mai et al., 2006]. [4] In the Miyagi‐oki region (translated into English as the “region off the coast of Miyagi Prefecture”) of north- eastern Japan, the Pacific plate subducts beneath the conti- nental plate. Historical records reveal that large offshore earthquakes with magnitudes of about 7.5 and recurrence interval of approximately 37.1 years have occurred repeat- edly in the Miyagi ‐ oki region, as shown in Figure 1 [Earthquake Research Committee, 2005]. For the most recent two events that occurred in 1978 and 2005, several 1 Earthquake Research Institute, University of Tokyo, Tokyo, Japan. 2 Now at National Research Institute for Earth Science and Disaster Prevention, Tsukuba, Japan. 3 National Research Institute for Earth Science and Disaster Prevention, Tsukuba, Japan. 4 Now at Japan Nuclear Energy Safety Organization, Tokyo, Japan. Copyright 2010 by the American Geophysical Union. 0148‐0227/10/2009JB006758 JOURNAL OF GEOPHYSICAL RESEARCH, VOL. 115, B08302, doi:10.1029/2009JB006758, 2010 B08302 1 of 12
-
Upload
independent -
Category
Documents
-
view
3 -
download
0
Transcript of Dynamic source modeling of the 1978 and 2005 Miyagi-oki earthquakes: Interpretation of fracture...

Dynamic source modeling of the 1978 and 2005 Miyagi‐okiearthquakes: Interpretation of fracture energy
Takeshi Kimura,1,2 Kazuki Koketsu,1 Hiroe Miyake,1 Changjiang Wu,3,4
and Takashi Miyatake1
Received 6 July 2009; revised 22 February 2010; accepted 16 March 2010; published 3 August 2010.
[1] We constructed spontaneous dynamic rupture models of the 1978 and 2005Miyagi‐oki, Japan, earthquakes, which occurred on the same plate boundary repeatedlywith different magnitudes, to reproduce the slip and the rupture velocity predicted bykinematic source models. Comparison of the dynamic source parameters of theseevents enables us to consider the behavior of rupture dynamics during different sourceprocesses on the same fault. In particular, we compared the stress drop and the fractureenergy, which can be evaluated stably, between two events. The maximum andaverage values of the stress drop over the whole fault plane and on an asperity thatruptured during both events are almost identical in the two models. On the other hand, the1978 event, whose magnitude was larger than the 2005 event, has a fracture energyvalue larger than that of the 2005 event not only over the whole fault but also on theasperity that ruptured repeatedly. These results are consistent with previous studies of thescaling of fracture energy with the seismic moment. We also compared the fractureenergy values with those of other inland events estimated for previous studies; our valuesfor the Miyagi‐oki earthquakes are smaller. Differences in tectonic setting betweenshallow inland events and deep subduction‐zone events might cause this discrepancy.
Citation: Kimura, T., K. Koketsu, H. Miyake, C. Wu, and T. Miyatake (2010), Dynamic source modeling of the 1978 and 2005Miyagi‐oki earthquakes: Interpretation of fracture energy, J. Geophys. Res., 115, B08302, doi:10.1029/2009JB006758.
1. Introduction
[2] Accumulation of information on the source parametersof real earthquakes is important for understanding thephysics of the source rupture process. Using seismic waves,geodetic data, tsunamis, and other information researchershave proposed a variety of kinematic source models [e.g.,Kikuchi and Kanamori, 1982; Hartzell and Heaton, 1983;Satake, 1993; Wald and Heaton, 1994; Thatcher et al.,1997]. Based on these kinematic models, the dependenciesof kinematic source parameters, such as fault size, slip, slip‐rate, and other characteristics on the seismic moment havebeen discussed [e.g., Kanamori and Anderson, 1975;Somerville et al., 1999; Mai and Beroza, 2000; Murotaniet al., 2008].[3] Contrary to the findings of kinematic source models,
which might contain mechanical inconsistencies, dynamicruptures propagate according to elastodynamic equationsand friction laws on the fault. Numerous dynamic rupture
models have been constructed that are consistent with therupture physics identified by laboratory studies. Dynamicrupture models based on near‐source waveform or kine-matic source models have been attempted for several realearthquakes: the 1979 Imperial Valley earthquake [Favreauand Archuleta, 2003], the 1992 Landers earthquake [Olsenet al., 1997; Peyrat et al., 2001], the 1994 Northridgeearthquake [Nielsen and Olsen, 2000; Ma and Archuleta,2006], the 2000 Tottori earthquake [Dalguer et al., 2003;Peyrat and Olsen, 2004], the 2001 Geiyo earthquake[Miyatake et al., 2004], the 2002 Denali earthquake[Dunham and Archuleta, 2004], and the 2004 Parkfieldearthquake [Ma et al., 2008]. Dynamic rupture modelingenables us to consider the rupture physics more directly thankinematic source models do. Relationships among sourceparameters obtained from these dynamic source modelshave provided new insights into the physics of earthquakes[e.g., Tinti et al., 2005; Mai et al., 2006].[4] In the Miyagi‐oki region (translated into English as
the “region off the coast of Miyagi Prefecture”) of north-eastern Japan, the Pacific plate subducts beneath the conti-nental plate. Historical records reveal that large offshoreearthquakes with magnitudes of about 7.5 and recurrenceinterval of approximately 37.1 years have occurred repeat-edly in the Miyagi‐oki region, as shown in Figure 1[Earthquake Research Committee, 2005]. For the mostrecent two events that occurred in 1978 and 2005, several
1Earthquake Research Institute, University of Tokyo, Tokyo, Japan.2Now at National Research Institute for Earth Science and Disaster
Prevention, Tsukuba, Japan.3National Research Institute for Earth Science and Disaster Prevention,
Tsukuba, Japan.4Now at Japan Nuclear Energy Safety Organization, Tokyo, Japan.
Copyright 2010 by the American Geophysical Union.0148‐0227/10/2009JB006758
JOURNAL OF GEOPHYSICAL RESEARCH, VOL. 115, B08302, doi:10.1029/2009JB006758, 2010
B08302 1 of 12

kinematic source models were proposed [Yamanaka andKikuchi, 2004; Okada et al., 2005; Yaginuma et al., 2007;Wu et al., 2008]. Previous studies reported that both eventsoccurred on the plate boundary, and also that the largenorthern asperity (area exhibiting large slip) that rupturedduring the 1978 event (Mw 7.6) did not rupture during the2005 event (Mw 7.2).Wu et al. [2008] compared near‐sourcewaveforms between the two events and inverted the sourceprocesses of them using teleseismic and near‐source wave-form data. According to their results, 1) both events rupturedfrom almost the same hypocenter, 2) the 1978 event con-sisted of two southern asperities and a large northernasperity, and the 2005 event ruptured only the two southernasperities among them. Although these two events occurredon the same plate boundary in the same region, the seismicmoment of the 1978 event was approximately four timeslarger than the 2005 event, and the rupture process of themwere quite different in the northern part. Comparison of thedynamic source parameters of these two Miyagi‐oki events
will clarify whether those source parameters depend on thelocation or whether the source parameters depend on therupture process. Moreover, in order to understand the seis-mic cycle in the Miyagi‐oki region, it is important to clarifythe relationship between the dynamic rupture processes ofthese events.[5] In this study, we construct dynamic source models for
the 1978 and 2005 Miyagi‐oki earthquakes on the basis ofthe kinematic source models proposed by Wu et al. [2008,2009]. Then we compare the dynamic source parametersbetween the two models. In particular, we analyze stressdrop, Ds, and fracture energy, GC. These parameters can beevaluated more stably than other parameters, such as thestrength excess and slip‐weakening distance, DC, from low‐frequency ground‐motion data [Guatteri and Spudich,2000]. This evaluation of dynamic source parameters willoffer a key to understanding not only the physics of earth-quakes, but also the recurrence of large earthquakes in theMiyagi‐oki region. Moreover, it will provide an importantconstraint for the construction of a source model for pre-diction of strong ground motion, especially motion due toplate‐boundary events in a subduction zone.
2. Dynamic Source Modeling
[6] The kinematic source models are described by spa-tiotemporal evolution of slip and generally estimated fromobserved data such as waveforms, tsunami, and geodeticdata. However, they do not account for explicit rupturephysics. On the other hand, the dynamic source models areconstructed to satisfy the elastodynamic equations withrupture criterion on the fault plane. We modeled spontane-ous dynamic rupture processes of the 1978 and 2005Miyagi‐oki events to satisfy the slip distributions and rup-ture velocities of their kinematic source models.[7] In this study, we used kinematic source models esti-
mated by Wu et al. [2008, 2009] as reference modelsbecause they analyzed both the 1978 and 2005 events in thesame way and used near‐field ground motion data, whichenable us to estimate detailed source processes. Severalresearchers have estimated kinematic source models of thesetwo events. In the case of the 1978 event, Yamanaka andKikuchi [2004] estimated the rupture process using thenear‐field ground motion data. Wu et al. [2008] obtainedresults similar to that of Yamanaka and Kikuchi [2004]. Inthe case of the 2005 event, Wu et al. [2008] recovered twoasperities although Okada et al. [2005] and Yaginuma et al.[2007] indicated a single asperity around the hypocenter. Asmentioned by Wu et al. [2008], two distinct pulses in thestrong motion data support the existence of two asperitiesduring the 2005 event. Even the empirical Green’s functionmethod obtained two asperities [Kamae, 2006; Suzuki andIwata, 2007]. Therefore, we used the kinematic sourcemodels of Wu et al. [2008] in this analysis.[8] We assumed the linear slip‐weakening model [Ida,
1972; Andrews, 1976] applies on the faults (Figure 2).The linear slip‐weakening model is described with Ds,strength excess, and DC. According to this model, GC
depends on these three parameters (gray area in Figure 2).The slip distribution determines the stress distribution andthe rupture velocity determines the fracture energy. Wemodeled distributions of Ds, strength excess, and DC for the
Figure 1. (a) Magnitudes for a series of Miyagi‐oki earth-quakes determined by the Japan Meteorological Agency,JMA [Earthquake Research Committee, 2005]. (b) Slipdistributions of the kinematic source models of the 1978 and2005 Miyagi‐oki earthquakes [Wu et al., 2008]. The arearepresented by the black rectangle in the inset map ismagnified in the main map. Gray and black contour linesrepresent the slip distributions of the 1978 and 2005 events,respectively. The contour interval is 0.5 m. Gray and blackstars show the rupture nucleation points of the 1978 and2005 events, respectively.
KIMURA ET AL.: DYNAMIC MODELS OF MIYAGI‐OKI EARTHQUAKES B08302B08302
2 of 12

two Miyagi‐oki events to satisfy the kinematic sourcemodels.[9] Among the above source parameters, we assumed
distributions of the stress drop on the basis of the slip dis-tributions of the kinematic source models. We calculated thestress drop in a semi‐infinite homogeneous elastic mediumusing the method of Okada [1992], and then interpolated thestress drops on a finer grid (0.2 km for the 1978 event and0.1 km for the 2005 event, respectively) bilinearly for thenumerical simulations (Figures 3c and 3d). For simplicity,we considered the stress drop only for the dip‐slip compo-nent. The material properties are represented by the P‐wavevelocity VP = 6.95 km/s, the S‐wave velocity VS = 3.96 km/s,and the density r = 2960 kg/m3. These are values for a layerthat includes the rupture nucleation points on the faults inthe analyses of Wu et al. [2008]. We preserved the stressdrop distributions calculated here through all the followingdynamic simulations to reproduce the slip distributions ofkinematic source models.[10] Second, we simulated spontaneous dynamic rupture
processes with several sets of the strength excess and DC,and then selected models that satisfy the rupture velocity ofthe kinematic source models, particularly around asperitiesA, B, and C in Figures 3c and 3d. In this analysis, wedefined the rupture start time as the time when the slipvelocity exceeds the value of 0.1 m/s, not as the time whenthe stress exceeds the peak stress. Since we constructed thedynamic source models based on the kinematic sourcemodels estimated from the seismic wave data, the rupturestart time should be defined with the slip velocity that isestimated directly by the waveform inversion, rather thanthe stress.[11] For simplicity, we started to model the strength
excess and DC with assumptions that the S parameter andDC are spatially uniform over the fault plane in each event.The S parameter is the ratio of the strength excess to thestress drop introduced by Andrews [1976] and Das and Aki[1977]. Then we considered spatial variation in these para-meters as necessary tomatch the rupture velocity of kinematicmodels. For the negative stress drop areas (Ds < 0), weassumed the strength excess to be −1.2Ds (>0) to preservean even stress drop from the peak stress to the residual stressin those locations.
[12] For calculating the dynamic rupture, we used thefourth order finite difference method (FDM) with a 3‐Dstaggered grid [Virieux and Madariaga, 1982]. The faultplane was represented by the Stress Glut method [Andrews,1976]. The grid intervals and the time increments are 0.2 kmand 0.01 s for the 1978 event, and 0.1 km and 0.005 s for the2005 event, respectively. We forced the rupture to nucleateat t = 0 within a nucleation area whose size was calculatedfollowing Day [1982].[13] We assumed an infinite elastic medium with the same
properties as used in the stress drop calculation. Because thehypocentral depths of Miyagi‐oki earthquakes were 30 km[Wu et al., 2008] we did not include the free surface thatwould have little effect on our results. Miyagi‐oki earth-quakes occurred on the plate interface in subduction zone.Therefore the dynamic rupture would be affected by thebimaterial effects [Weertman, 1980; Harris and Day, 1997,2005; Ma et al., 2008; Ma and Beroza, 2008]. In this article,we did not take account of this effect because the mainrupture directions during both events were same (thedowndip direction) and the bimaterial interface would affecttwo rupture processes in the same way.[14] For the 1978 event we simulated nine dynamic source
models, shown in Table 1. In Table 1, we summarize therelationship between the constant source parameters, S andDC, and the secant rupture velocity (hypocentral distancedivided by the rupture travel time [Day, 1982]) aroundasperities A and B (see Figure 3c). The propagation velocityof the first time‐window in the inversion analysis of Wuet al. [2008] is 3.2 km/s for the 1978 event, which corre-sponds well with the rupture times for asperities of theirkinematic source model. As shown in Table 1, in all themodels, the rupture velocities around asperity A exceededthe shear wave velocity and differed from that of the kine-matic model greatly. We will consider source parametersaround this asperity later. From the comparison of the rup-ture velocity around the other asperity, asperity B, betweenthe dynamic and kinematic models, the model (S, DC) =(0.2, 0.4 m) was the best model in that the rupture velocityin asperity B stays at 3.2 km/s. Although the rupture velocityof the model (S, DC) = (0.3, 0.3 m) is also close to that of thekinematic model, 3.2 km/s, it accelerates during the ruptureof asperity B and reaches 3.7 km/s. The rupture velocitiesaround asperity B in the other models differ from that of thekinematic source model by 0.5 km/s or more. Therefore, weselected the model with S and DC of 0.2 and 0.4 m as thebest model, assuming that S and DC are constant.[15] Although the model with constant S of 0.2 and DC of
0.4 m was better than the other models with constant S andDC values, the rupture velocity around asperity A exceededthat of the kinematic source model and reached the super-shear rupture velocity temporarily. Supershear rupture pro-pagations have been reported for some large earthquakes[e.g., Archuleta, 1984; Wald and Heaton, 1994; Bouchonet al., 2000; Sekiguchi and Iwata, 2002; Bouchon andVallee, 2003; Koketsu et al., 2004; Ellsworth et al.,2004; Dunham and Archuleta, 2004]. However, in thecase of the 1978 Miyagi‐oki earthquake, any evidence ofthe supershear rupture was never reported. Moreover, notonly the local rupture velocity but also the secant rupturevelocity exceeded the rupture velocity of the kinematic
Figure 2. Shear stress as a function of slip in the linearslip‐weakening model. First the stress increases from theinitial stress, s0, to the peak stress, sp, and then drops tothe final frictional stress level, sf, over a critical slip, DC.The gray area shows the fracture energy, GC. Strengthexcess and stress drop, Ds, represent values of sp‐s0 ands0‐sf, respectively.
KIMURA ET AL.: DYNAMIC MODELS OF MIYAGI‐OKI EARTHQUAKES B08302B08302
3 of 12

Figure
3.Slip
distributio
nsof
thekinematic
modelsanddynamic
source
parametersassumed
forthedynamic
rupture
simulations.White
starsindicate
therupturenucleatio
npoints.For
Figures
3iand3j,areaswith
slipsof
DCor
less
inthe
dynamic
rupturemodels(see
Figure4)
aremasked.
KIMURA ET AL.: DYNAMIC MODELS OF MIYAGI‐OKI EARTHQUAKES B08302B08302
4 of 12

model. Therefore, we modified the best model using con-stant S and DC values by assuming larger S and DC valuesonly around asperity A (Figures 3e and 3g). In the case of(S, DC) = (1.0, 0.8 m) around asperity A, we obtained adynamic model in which the rupture propagates at subshearvelocity, almost the same as the results of the kinematicsource model (Figure 4). We will refer to this dynamicsource model for the 1978 event as model M78.[16] For the 2005 event, we simulated three dynamic
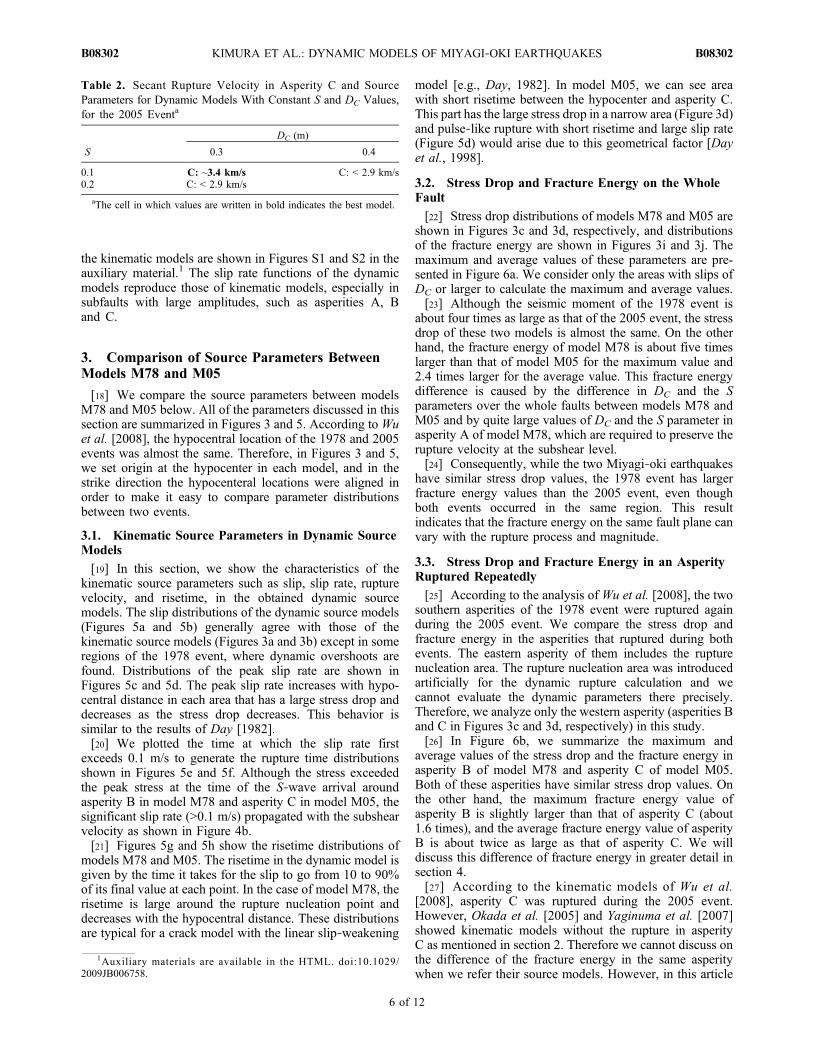
source models, shown in Table 2. The rupture velocity ofthe model with constant S and DC values of 0.1 and 0.3 m,
respectively, is most similar to that of the kinematic sourcemodels, 3.4 km/s (bold text in Table 2). If we calculate thedynamic rupture with larger S or DC values as shown inTable 2, the rupture velocity will be markedly less than thatof the kinematic source models or the rupture may terminatehalfway because the fracture energy is larger. In the case ofthe 2005 event, the spatial variation of S and DC was notnecessary. We will refer to the best model with constant S of0.1 and DC of 0.3 m as model M05.[17] Comparisons of the slip rate functions between the
dynamic and kinematic source models in each subfault of
Table 1. Secant Rupture Velocity in Asperities A and B, and the Source Parameters in Dynamic Source Models With Constant S and DC
Values, for the 1978 Eventa
S
DC (m)
0.3 0.4 0.5
0.1 A: > VS, B: > VS A: > VS, B: > VS A: 2.7–3.7 km/s, B: ~3.7 km/s0.2 A: > VS, B: > VS A: ~ VS, B: ~3.2 km/s A: 2.2–3.2 km/s, B: ~2.7 km/s0.3 A: ~ VS, B: 3.2–3.7 km/s A: ~ VS, B: 2.7–3.2 km/s A: 2.2–3.2 km/s, B: < 2.7 km/s
aThe cell in which values are written in bold indicates the best model. The rupture velocity of the kinematic model and the shear wave velocity are3.2 km/s and 3.93 km/s, respectively.
Figure 4. (a) Distributions of the fracture energy and (b) slip rate functions along the lines shown inFigure 4a. The contour interval in Figure 4b is 0.1 m/s. Gray lines in Figure 4b show the P‐ and S‐wavevelocities and rupture velocities assumed by Wu et al. [2008]. The zero on the lateral axis of Figure 4brepresents the rupture nucleation point.
KIMURA ET AL.: DYNAMIC MODELS OF MIYAGI‐OKI EARTHQUAKES B08302B08302
5 of 12
the kinematic models are shown in Figures S1 and S2 in theauxiliary material.1 The slip rate functions of the dynamicmodels reproduce those of kinematic models, especially insubfaults with large amplitudes, such as asperities A, Band C.
3. Comparison of Source Parameters BetweenModels M78 and M05
[18] We compare the source parameters between modelsM78 and M05 below. All of the parameters discussed in thissection are summarized in Figures 3 and 5. According to Wuet al. [2008], the hypocentral location of the 1978 and 2005events was almost the same. Therefore, in Figures 3 and 5,we set origin at the hypocenter in each model, and in thestrike direction the hypocenteral locations were aligned inorder to make it easy to compare parameter distributionsbetween two events.
3.1. Kinematic Source Parameters in Dynamic SourceModels
[19] In this section, we show the characteristics of thekinematic source parameters such as slip, slip rate, rupturevelocity, and risetime, in the obtained dynamic sourcemodels. The slip distributions of the dynamic source models(Figures 5a and 5b) generally agree with those of thekinematic source models (Figures 3a and 3b) except in someregions of the 1978 event, where dynamic overshoots arefound. Distributions of the peak slip rate are shown inFigures 5c and 5d. The peak slip rate increases with hypo-central distance in each area that has a large stress drop anddecreases as the stress drop decreases. This behavior issimilar to the results of Day [1982].[20] We plotted the time at which the slip rate first
exceeds 0.1 m/s to generate the rupture time distributionsshown in Figures 5e and 5f. Although the stress exceededthe peak stress at the time of the S‐wave arrival aroundasperity B in model M78 and asperity C in model M05, thesignificant slip rate (>0.1 m/s) propagated with the subshearvelocity as shown in Figure 4b.[21] Figures 5g and 5h show the risetime distributions of
models M78 and M05. The risetime in the dynamic model isgiven by the time it takes for the slip to go from 10 to 90%of its final value at each point. In the case of model M78, therisetime is large around the rupture nucleation point anddecreases with the hypocentral distance. These distributionsare typical for a crack model with the linear slip‐weakening
model [e.g., Day, 1982]. In model M05, we can see areawith short risetime between the hypocenter and asperity C.This part has the large stress drop in a narrow area (Figure 3d)and pulse‐like rupture with short risetime and large slip rate(Figure 5d) would arise due to this geometrical factor [Dayet al., 1998].
3.2. Stress Drop and Fracture Energy on the WholeFault
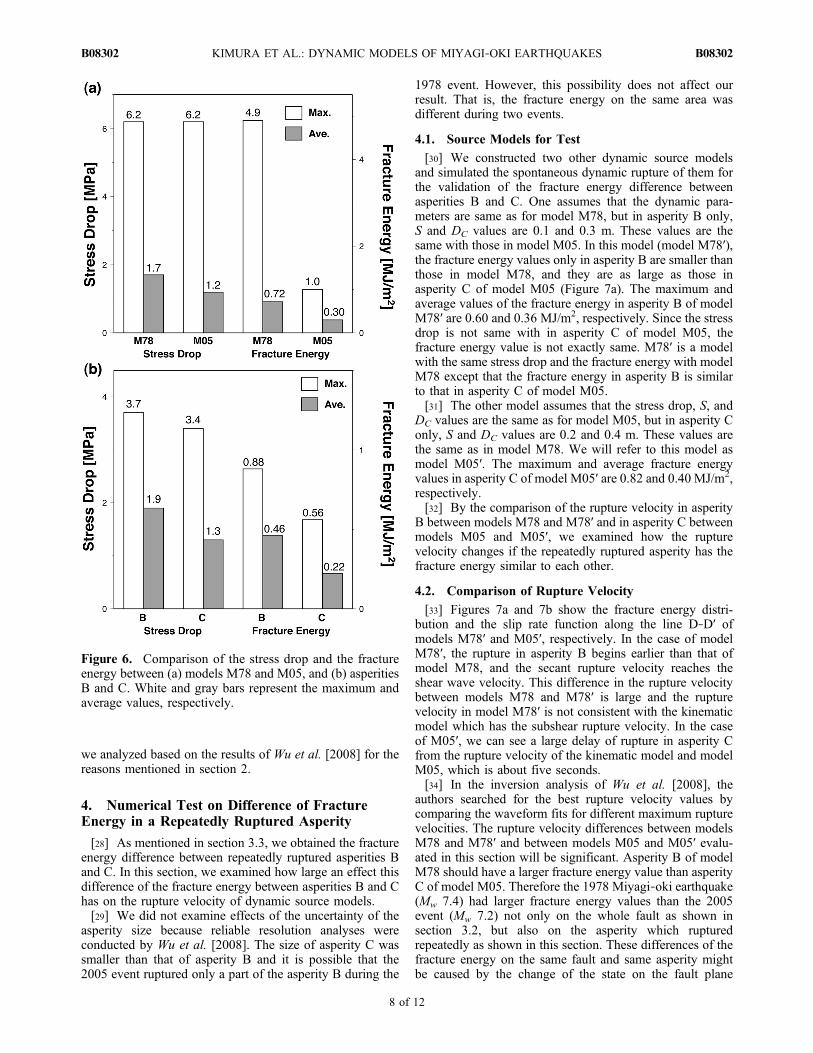
[22] Stress drop distributions of models M78 and M05 areshown in Figures 3c and 3d, respectively, and distributionsof the fracture energy are shown in Figures 3i and 3j. Themaximum and average values of these parameters are pre-sented in Figure 6a. We consider only the areas with slips ofDC or larger to calculate the maximum and average values.[23] Although the seismic moment of the 1978 event is
about four times as large as that of the 2005 event, the stressdrop of these two models is almost the same. On the otherhand, the fracture energy of model M78 is about five timeslarger than that of model M05 for the maximum value and2.4 times larger for the average value. This fracture energydifference is caused by the difference in DC and the Sparameters over the whole faults between models M78 andM05 and by quite large values of DC and the S parameter inasperity A of model M78, which are required to preserve therupture velocity at the subshear level.[24] Consequently, while the two Miyagi‐oki earthquakes
have similar stress drop values, the 1978 event has largerfracture energy values than the 2005 event, even thoughboth events occurred in the same region. This resultindicates that the fracture energy on the same fault plane canvary with the rupture process and magnitude.
3.3. Stress Drop and Fracture Energy in an AsperityRuptured Repeatedly
[25] According to the analysis of Wu et al. [2008], the twosouthern asperities of the 1978 event were ruptured againduring the 2005 event. We compare the stress drop andfracture energy in the asperities that ruptured during bothevents. The eastern asperity of them includes the rupturenucleation area. The rupture nucleation area was introducedartificially for the dynamic rupture calculation and wecannot evaluate the dynamic parameters there precisely.Therefore, we analyze only the western asperity (asperities Band C in Figures 3c and 3d, respectively) in this study.[26] In Figure 6b, we summarize the maximum and
average values of the stress drop and the fracture energy inasperity B of model M78 and asperity C of model M05.Both of these asperities have similar stress drop values. Onthe other hand, the maximum fracture energy value ofasperity B is slightly larger than that of asperity C (about1.6 times), and the average fracture energy value of asperityB is about twice as large as that of asperity C. We willdiscuss this difference of fracture energy in greater detail insection 4.[27] According to the kinematic models of Wu et al.
[2008], asperity C was ruptured during the 2005 event.However, Okada et al. [2005] and Yaginuma et al. [2007]showed kinematic models without the rupture in asperityC as mentioned in section 2. Therefore we cannot discuss onthe difference of the fracture energy in the same asperitywhen we refer their source models. However, in this article
Table 2. Secant Rupture Velocity in Asperity C and SourceParameters for Dynamic Models With Constant S and DC Values,for the 2005 Eventa
S
DC (m)
0.3 0.4
0.1 C: ~3.4 km/s C: < 2.9 km/s0.2 C: < 2.9 km/s
aThe cell in which values are written in bold indicates the best model.
1Auxiliary materials are available in the HTML. doi:10.1029/2009JB006758.
KIMURA ET AL.: DYNAMIC MODELS OF MIYAGI‐OKI EARTHQUAKES B08302B08302
6 of 12

Figure
5.Com
parisonof
thedynamic
source
modelsforthe(a,c,e,andg)
1978
(M78)and(b,d,
f,andh)
2005
(M05)
events.F
ortherupturetim
edistributio
nsandtherisetim
edistributio
ns,areas
wheretheslip
ratevaluedidnotexceed0.1m/s
aremasked.
KIMURA ET AL.: DYNAMIC MODELS OF MIYAGI‐OKI EARTHQUAKES B08302B08302
7 of 12
we analyzed based on the results of Wu et al. [2008] for thereasons mentioned in section 2.
4. Numerical Test on Difference of FractureEnergy in a Repeatedly Ruptured Asperity
[28] As mentioned in section 3.3, we obtained the fractureenergy difference between repeatedly ruptured asperities Band C. In this section, we examined how large an effect thisdifference of the fracture energy between asperities B and Chas on the rupture velocity of dynamic source models.[29] We did not examine effects of the uncertainty of the
asperity size because reliable resolution analyses wereconducted by Wu et al. [2008]. The size of asperity C wassmaller than that of asperity B and it is possible that the2005 event ruptured only a part of the asperity B during the
1978 event. However, this possibility does not affect ourresult. That is, the fracture energy on the same area wasdifferent during two events.
4.1. Source Models for Test
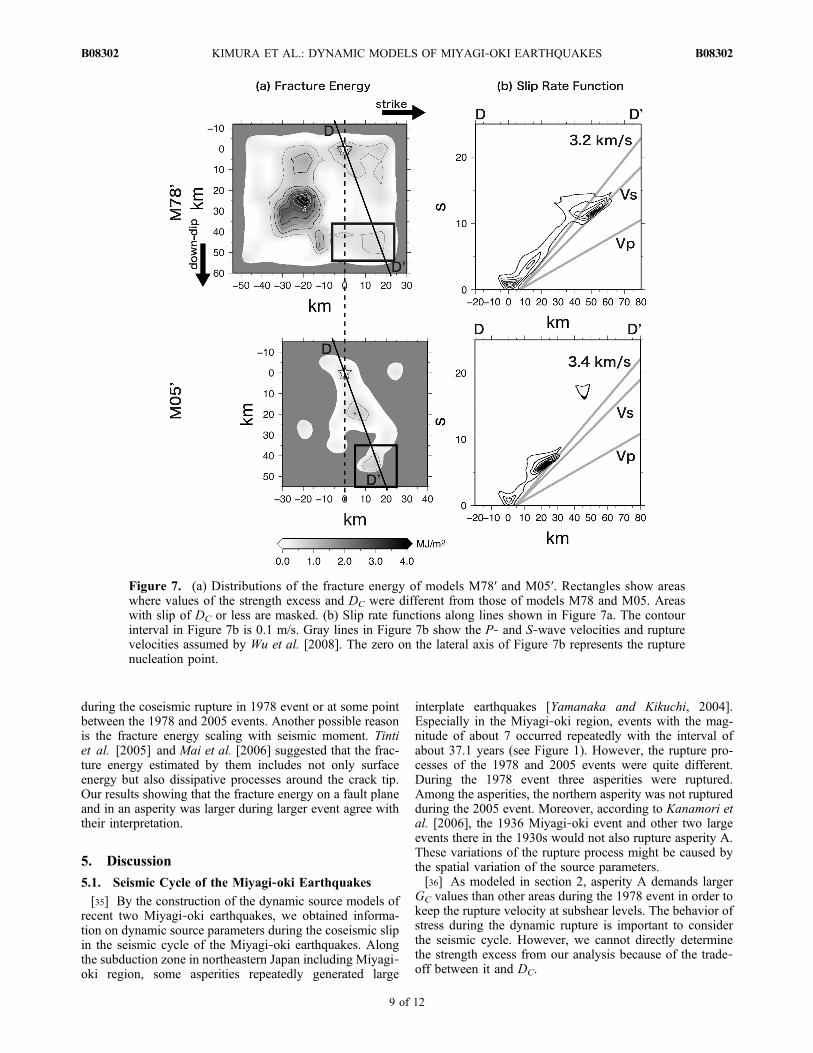
[30] We constructed two other dynamic source modelsand simulated the spontaneous dynamic rupture of them forthe validation of the fracture energy difference betweenasperities B and C. One assumes that the dynamic para-meters are same as for model M78, but in asperity B only,S and DC values are 0.1 and 0.3 m. These values are thesame with those in model M05. In this model (model M78′),the fracture energy values only in asperity B are smaller thanthose in model M78, and they are as large as those inasperity C of model M05 (Figure 7a). The maximum andaverage values of the fracture energy in asperity B of modelM78′ are 0.60 and 0.36 MJ/m2, respectively. Since the stressdrop is not same with in asperity C of model M05, thefracture energy value is not exactly same. M78′ is a modelwith the same stress drop and the fracture energy with modelM78 except that the fracture energy in asperity B is similarto that in asperity C of model M05.[31] The other model assumes that the stress drop, S, and
DC values are the same as for model M05, but in asperity Conly, S and DC values are 0.2 and 0.4 m. These values arethe same as in model M78. We will refer to this model asmodel M05′. The maximum and average fracture energyvalues in asperity C of model M05′ are 0.82 and 0.40 MJ/m2,respectively.[32] By the comparison of the rupture velocity in asperity
B between models M78 and M78′ and in asperity C betweenmodels M05 and M05′, we examined how the rupturevelocity changes if the repeatedly ruptured asperity has thefracture energy similar to each other.
4.2. Comparison of Rupture Velocity
[33] Figures 7a and 7b show the fracture energy distri-bution and the slip rate function along the line D‐D′ ofmodels M78′ and M05′, respectively. In the case of modelM78′, the rupture in asperity B begins earlier than that ofmodel M78, and the secant rupture velocity reaches theshear wave velocity. This difference in the rupture velocitybetween models M78 and M78′ is large and the rupturevelocity in model M78′ is not consistent with the kinematicmodel which has the subshear rupture velocity. In the caseof M05′, we can see a large delay of rupture in asperity Cfrom the rupture velocity of the kinematic model and modelM05, which is about five seconds.[34] In the inversion analysis of Wu et al. [2008], the
authors searched for the best rupture velocity values bycomparing the waveform fits for different maximum rupturevelocities. The rupture velocity differences between modelsM78 and M78′ and between models M05 and M05′ evalu-ated in this section will be significant. Asperity B of modelM78 should have a larger fracture energy value than asperityC of model M05. Therefore the 1978 Miyagi‐oki earthquake(Mw 7.4) had larger fracture energy values than the 2005event (Mw 7.2) not only on the whole fault as shown insection 3.2, but also on the asperity which rupturedrepeatedly as shown in this section. These differences of thefracture energy on the same fault and same asperity mightbe caused by the change of the state on the fault plane
Figure 6. Comparison of the stress drop and the fractureenergy between (a) models M78 and M05, and (b) asperitiesB and C. White and gray bars represent the maximum andaverage values, respectively.
KIMURA ET AL.: DYNAMIC MODELS OF MIYAGI‐OKI EARTHQUAKES B08302B08302
8 of 12
during the coseismic rupture in 1978 event or at some pointbetween the 1978 and 2005 events. Another possible reasonis the fracture energy scaling with seismic moment. Tintiet al. [2005] and Mai et al. [2006] suggested that the frac-ture energy estimated by them includes not only surfaceenergy but also dissipative processes around the crack tip.Our results showing that the fracture energy on a fault planeand in an asperity was larger during larger event agree withtheir interpretation.
5. Discussion
5.1. Seismic Cycle of the Miyagi‐oki Earthquakes
[35] By the construction of the dynamic source models ofrecent two Miyagi‐oki earthquakes, we obtained informa-tion on dynamic source parameters during the coseismic slipin the seismic cycle of the Miyagi‐oki earthquakes. Alongthe subduction zone in northeastern Japan including Miyagi‐oki region, some asperities repeatedly generated large
interplate earthquakes [Yamanaka and Kikuchi, 2004].Especially in the Miyagi‐oki region, events with the mag-nitude of about 7 occurred repeatedly with the interval ofabout 37.1 years (see Figure 1). However, the rupture pro-cesses of the 1978 and 2005 events were quite different.During the 1978 event three asperities were ruptured.Among the asperities, the northern asperity was not rupturedduring the 2005 event. Moreover, according to Kanamori etal. [2006], the 1936 Miyagi‐oki event and other two largeevents there in the 1930s would not also rupture asperity A.These variations of the rupture process might be caused bythe spatial variation of the source parameters.[36] As modeled in section 2, asperity A demands larger
GC values than other areas during the 1978 event in order tokeep the rupture velocity at subshear levels. The behavior ofstress during the dynamic rupture is important to considerthe seismic cycle. However, we cannot directly determinethe strength excess from our analysis because of the trade‐off between it and DC.
Figure 7. (a) Distributions of the fracture energy of models M78′ and M05′. Rectangles show areaswhere values of the strength excess and DC were different from those of models M78 and M05. Areaswith slip of DC or less are masked. (b) Slip rate functions along lines shown in Figure 7a. The contourinterval in Figure 7b is 0.1 m/s. Gray lines in Figure 7b show the P‐ and S‐wave velocities and rupturevelocities assumed by Wu et al. [2008]. The zero on the lateral axis of Figure 7b represents the rupturenucleation point.
KIMURA ET AL.: DYNAMIC MODELS OF MIYAGI‐OKI EARTHQUAKES B08302B08302
9 of 12

[37] If only the southern part of the 1978 event rupturedduring the events in the 1930s as indicated by Kanamoriet al. [2006] and the plate boundary had been 100% coupled[Mazzotti et al., 2000; Nishimura et al., 2004] from the1930s’ events to the 1978 event, asperity A would be closerto the rupture than other areas just before the 1978 event.Therefore the strength excess in asperity A would be lessthan that in other areas during the 1978 event. This suggeststhat during the 1978 event the strength excess in asperity Awould be smaller than that in model M78. And instead of thestrength excess, DC would be larger than that in model M78to preserve the fracture energy value. To verify this sug-gestion, analysis of higher frequency waveforms than thoseof Wu et al. [2008] during the coseimic rupture need to beconducted [Guatteri and Spudich, 2000].
5.2. Comparison of Fracture Energy With InlandEvents
[38] As mentioned in section 3.2, we obtained fractureenergy values of the 1978 and 2005 Miyagi‐oki earth-quakes. In this section, we compare the fracture energyvalues of our models with other studies. In previous studies,realistic dynamic source models of interplate earthquakes insubduction zones, such as the Miyagi‐oki earthquakes, hadnot been constructed. Therefore in this section, we com-pared our models, which are the first results for the inter-plate events in subduction zones, with dynamic sourcemodels of inland events constructed in previous studies[Tinti et al., 2005; Mai et al., 2006].[39] Figure 8 shows the relations between the seismic
moment and the fracture energies of models M78 and M05.We also show the values estimated by Tinti et al. [2005] andthe empirical relationship estimated by Mai et al. [2006].The regression line of Mai et al. [2006] is about ten times
larger than our values for the Miyagi‐oki earthquakes.Moreover, the values of Tinti et al. [2005] are approximately50–100 times larger than our values. This discrepancy of thefracture energy between our results and those for inlandevents suggests that the 1978 and 2005 Miyagi‐oki eventswere anomalous earthquakes or it is possible that the scalingrelationships of the fracture energy are different betweendeep interplate events in subduction zones and shallowinland events.[40] The rupture velocity and stress drop affect the frac-
ture energy estimation explicitly. However, we could notrecognize significant difference of the rupture velocities andthe average value of the stress drop between our models andmodels of M7‐class events by Mai et al. [2006]. It is pos-sible that the difference of the tectonic setting betweeninterplate events in subduction zones and inland eventscauses the fracture energy discrepancy. In paticular, the faultdepth and shapes determined by the width of the seismo-genic zone are quite different. These factors might affect thedifference of fracture energy.
6. Conclusions
[41] The 1978 and 2005 Miyagi‐oki earthquakes occurredrepeatedly on the same plate boundary in a subduction zone,and their magnitudes were different. In this study, we con-structed spontaneous dynamic source models of the 1978and 2005 Miyagi‐oki earthquakes on the basis of kinematicsource models. In the dynamic model of the 1978 event, thefracture energy in the northern asperity that did not ruptureduring the 2005 event was larger than in the other areas, andthis difference in dynamic source parameters may cause thecomplex recurrence of the interplate events in the Miyagi‐oki region. From the comparison of the dynamic sourceparameters between the 1978 and 2005 events, we obtainedsimilar values of stress drop not only for the whole fault butalso in an asperity ruptured repeatedly. On the other hand,the fracture energy of the 1978 event is significantly largerthan that of the 2005 event both on the whole plane and onthe re‐ruptured asperity. These results support the hypoth-esis that the fracture energy estimated for the real earthquakeis a mesoscopic parameter consisting of the surface energyand other dissipative processes in the volume around thecrack tip and it scales with the magnitude. We also showedthat the fracture energy of the Miyagi‐oki earthquakes isconsiderably smaller than those of other inland events. Thisdiscrepancy might be caused by the difference in the tec-tonic setting. The relationship among source parametersobtained by this study will facilitate source characterizationsfor near‐source ground motion prediction.
[42] Acknowledgments. We would like to thank the two anonymousreviewers and the associate editor for their valuable comments and kindsuggestions, which helped to improve the manuscript. We used the com-puter systems of the Earthquake Information Center of the EarthquakeResearch Institute, University of Tokyo. This research was supported bythe Integrated Research Project for the Miyagi‐oki earthquakes fromMEXT.
ReferencesAndrews, D. J. (1976), Rupture propagation with finite stress in antiplanestrain, J. Geophys. Res., 81, 3575–3582, doi:10.1029/JB081i020p03575.
Figure 8. Average fracture energy versus seismic moment.White circles and white squares show the average values ofthe fracture energy in areas with slips of DC or larger andthose evaluated according to Mai et al. [2006], respec-tively. Black circles and the gray line show values estimatedby Tinti et al. [2005] and the empirical scaling relationshipby Mai et al. [2006], respectively.
KIMURA ET AL.: DYNAMIC MODELS OF MIYAGI‐OKI EARTHQUAKES B08302B08302
10 of 12
Archuleta, R. J. (1984), A faulting model for the 1979 Imperial Valley earth-quake, J. Geophys. Res., 89, 4559–4585, doi:10.1029/JB089iB06p04559.
Bouchon, M., and M. Vallee (2003), Observation of long supershear rup-ture during the magnitude 8.1 Kunlnshan earthquake, Science, 301,824–826, doi:10.1126/science.1086832.
Bouchon, M., N. Toksöz, H. Karabulut, M. Bouin, M. Dietrich, M. Aktar,and M. Edie (2000), Seismic imaging of the 1999 Izmit (Turkey) Ruptureinferred from the near‐fault recordings, Geophys. Res. Lett., 27(18),3013–3016, doi:10.1029/2000GL011761.
Dalguer, L. A., K. Irikura, and J. D. Riera (2003), Generation of new cracksaccompanied by the dynamic shear rupture propagation of 2000 Tottori(Japan) earthquake, Bull. Seismol. Soc. Am. , 93 , 2236–2252,doi:10.1785/0120020171.
Das, S., and K. Aki (1977), A numerical study of two‐dimensional sponta-neous rupture propagation, Geophys. J. R. Astron. Soc., 50, 643–668.
Day, S. M. (1982), Three‐dimensional simulation of spontaneous rupture:The effect of nonuniform prestress, Bull. Seismol. Soc. Am., 72, 1881–1902.
Day, S. M., G. Yu, and D. J. Wald (1998), Dynamic stress changes duringearthquake rupture, Bull. Seismol. Soc. Am., 88, 512–522.
Dunham, E. M., and R. J. Archuleta (2004), Evidence for a supershear tran-sient during the 2002 Denali fault earthquake, Bull. Seismol. Soc. Am.,94, S256–S268, doi:10.1785/0120040616.
Earthquake Research Committee (2005), National seismic hazard maps forJapan, report, 158 pp., Headquarters for Earthquake Res. Promot., Tokyo,Japan. (Available at http://www.jishin.go.jp/main/chousa/06mar_yosoku‐e/NationalSeismicHazardMaps.pdf.)
Ellsworth, W. L., M. Celebi, J. R. Evans, E. G. Jensen, M. C. Metz,D. J. Nyman, J. W. Roddick, P. Spudich, and C. D. Stephens (2004),Near‐field ground motions of the M 7.9 November 3, 2002, Denalifault, Alaska, earthquake recorded at pump station 10, EarthquakeSpectra, 20, 597–615, doi:10.1193/1.1778172.
Favreau, P., and R. J. Archuleta (2003), Direct seismic energy modelingand an application to the 1979 Imperial Valley earthquake, Geophys.Res. Lett., 30(5), 1198, doi:10.1029/2002GL015968.
Guatteri, M., and P. Spudich (2000), What can strong motion data tell usabout slip‐weakening fault‐friction laws?, Bull. Seismol. Soc. Am., 90,98–116, doi:10.1785/0119990053.
Harris, R. A., and S. M. Day (1997), Effects of a low‐velocity zone on adynamic rupture, Bull. Seismol. Soc. Am., 87, 1267–1280.
Harris, R. A., and S. M. Day (2005), Material contrast does not predictearthquake rupture propagation direction, Geophys. Res. Lett., 32,L23301, doi:10.1029/2005GL023941.
Hartzell, S. H., and T. H. Heaton (1983), Inversion of strong ground motionand teleseismic waveform data for the fault rupture history of the 1979Imperial Valley, California, earthquake, Bull. Seismol. Soc. Am., 73,1553–1583.
Ida, Y. (1972), Cohesive force across the tip of a longitudinal‐shear crackand Griffith’s specific surface energy, J. Geophys. Res., 77, 3796–3805,doi:10.1029/JB077i020p03796.
Kamae, K. (2006), Source modeling of the 2005 off‐shore Miyagi prefec-ture, Japan, earthquake (MJMA = 7.2) using the empirical Green’s func-tion method, Earth Planets Space, 58, 1561–1566.
Kanamori, H., and D. L. Anderson (1975), Theoretical basis of someempirical relations in seismology, Bull. Seismol. Soc. Am., 65, 1073–1095.
Kanamori, H., M. Miyazawa, and J. Mori (2006), Investigation of the earth-quake sequence off Miyagi prefecture with historical seismograms, EarthPlanets Space, 58, 1533–1541.
Kikuchi, M., and H. Kanamori (1982), Inversion of complex body waves—III, Bull. Seismol. Soc. Am., 81, 2335–2350.
Koketsu, K., K. Hikima, S. Miyazaki, and S. Ide (2004), Joint inversion ofstrong motion and geodetic data for the source process of the 2003Tokachi‐oki, Hokkaido, earthquake, Earth Planets Space, 56, 329–334.
Ma, S., and R. J. Archuleta (2006), Radiated seismic energy based ondynamic rupture models of faulting, J. Geophys. Res., 111, B05315,doi;10.1029/2005JB004055.
Ma, S., and G. C. Beroza (2008), Rupture dynamics on a bimaterial inter-face for dipping faults, Bull. Seismol. Soc. Am., 98, 1642–1658,doi:10.1785/0120070201.
Ma, S., S. Custódio, R. J. Archuleta, and P. Liu (2008), Dynamic modelingof the 2004 MW 6.0 Parkfield, California, earthquake, J. Geophys. Res.,113, B02301, doi:10.1029/2007JB005216.
Mai, P. M., and G. C. Beroza (2000), Source scaling properties from finite‐fault rupture models, Bull. Seismol. Soc. Am., 90, 604–615, doi:10.1785/0119990126.
Mai, P. M., P. Somerville, A. Pitarka, L. Dalguer, S. Song, G. Beroza,H. Miyake, and K. Irikura (2006), On scaling of fracture energy and
stress drop in dynamic rupture models: Consequences for near‐sourceground‐motions, in Earthquakes: Radiated Energy and the Physics ofFaulting, Geophys. Monogr. Ser., vol. 170, edited by R. Abercrombieet al., pp. 283–294, AGU, Washington, D. C.
Mazzotti, S., X. Le Pichon, P. Henry, and S. Miyazaki (2000), Full inter-seismic locking of the Nankai and Japan‐west Kurile subduction zones:An analysis of uniform elastic strain accumulation in Japan constrained bypermanent GPS, J. Geophys. Res., 105, 13,159–13,177, doi:10.1029/2000JB900060.
Miyatake, T., Y. Yagi, and T. Yasuda (2004), The dynamic rupture processof the 2001 Geiyo, Japan, earthquake, Geophys. Res. Lett., 31, L12612,doi:10.1029/2004GL019721.
Murotani, S., H. Miyake, and K. Koketsu (2008), Scaling of characterizedslip models for plate‐boundary earthquake, Earth Planets Space, 60,987–991.
Nielsen, S. B., and K. B. Olsen (2000), Consraints on stress and frictionfrom dynamic rupture models of the 1994 Northridge, California, earth-quake, Pure Appl. Geophys., 157, 2029–2046, doi:10.1007/PL00001073.
Nishimura, T., T. Hirasawa, S. Miyazaki, T. Sagiya, T. Tada, S. Miura, andK. Tanaka (2004), Temporal change of interplate coupling in northeasternJapan during 1955–2002 estimated from continuous GPS observations,Geophys. J. Int., 157, 901–916, doi:10.1111/j.1365-246X.2004.02159.x.
Okada, T., T. Yaginuma, N. Umino, T. Kono, T. Matsuzawa, S. Kita, andA. Hasegawa (2005), The 2005 M7.2 Miyagi‐oki earthquake, NE Japan:Possible re‐rupturing of one of asperities that caused the previous M7.4earthquake, Geophys. Res. Let t . , 32 , L24302, doi :10.1029/2005GL024613.
Okada, Y. (1992), Internal deformation due to shear and tensile faults in ahalf‐space, Bull. Seismol. Soc. Am., 82, 1018–1040.
Olsen, K., R. Madariaga, and R. J. Archuleta (1997), Three dimensionaldynamic simulation of the 1992 Landers earthquake, Science, 278,834–838, doi:10.1126/science.278.5339.834.
Peyrat, S., and K. Olsen (2004), Nonlinear dynamic rupture inversion of the2000 Western Tottori, Japan, earthquake, Geophys. Res. Lett., 31,L05604, doi:10.1029/2003GL019058.
Peyrat, S., K. Olsen, and R. Madariaga (2001), Dynamic modeling of the1992 Landers earthquake, J. Geophys. Res., 106, 26,467–26,482,doi:10.1029/2001JB000205.
Satake, K. (1993), Depth distribution of coseismic slip along the Nankaitrough, Japan, from joint inversion of geodetic and tsunami data, J. Geo-phys. Res., 98, 4553–4565, doi:10.1029/92JB01553.
Sekiguchi, H., and T. Iwata (2002), Rupture process of the 1999 Kocaeli,Turkey, earthquake estimated from strong‐motion waveforms, Bull. Seis-mol. Soc. Am., 92, 300–311, doi:10.1785/0120000811.
Somerville, P. G., K. Irikura, R. Graves, S. Sawada, D. J. Wald,N. Abrahmson, Y. Iwasaki, T. Kagawa, N. Smith, and A. Kowada(1999), Characterizing crustal earthquake slip models for the predictionof strong ground motion, Seismol. Res. Lett., 70, 59–80.
Suzuki, W., and T. Iwata (2007), Source model of the 2005 Miyagi‐oki,Japan, earthquake estimated from broadband strong motions, EarthPlanets Space, 59, 1155–1171.
Thatcher, W., G. Marshall, and M. Lisowski (1997), Resolution of fault slipalong the 470‐km‐long rupture of the great 1906 San Francisco earth-quake, J. Geophys. Res., 102, 5353–5367, doi:10.1029/96JB03486.
Tinti, E., P. Spudich, and M. Cocco (2005), Earthquake fracture energyinferred from kinematic rupture models on extended faults, J. Geophys.Res., 110, B12303, doi:10.1029/2005JB003644.
Virieux, J., and R. Madariaga (1982), Dynamic faulting studied by a finitedifference method, Bull. Seismol. Soc. Am., 72, 345–369.
Wald, D. J., and T. H. Heaton (1994), Spatial and temporal distribution ofslip for the 1992 Landers, California, earthquake, Bull. Seismol. Soc.Am., 84, 668–691.
Weertman, J. (1980), Unstable slippage across a fault that separates elasticmedia of different elastic constraints, J. Geophys. Res., 85, 1455–1461,doi:10.1029/JB085iB03p01455.
Wu, C., K. Koketsu, and H. Miyake (2008), Source processes of the 1978and 2005 Miyagi‐oki, Japan, earthquakes: Repeated rupture of asperitiesover successive large earthquakes, J. Geophys. Res., 113, B08316,doi:10.1029/2007JB005189.
Wu, C., K. Koketsu, and H. Miyake (2009), Correction to “Source pro-cesses of the 1978 and 2005 Miyagi‐oki, Japan, earthquakes: Repeatedrupture of asperities over successive large earthquakes,” J. Geophys.Res., 114, B04302, doi:10.1029/2009JB006419.
Yaginuma, T., T. Okada, A. Hasegawa, K. Kato, M. Takemura, andY. Yagi (2007), Coseismic slip distribution of the 2005 Miyagi‐Oki(M7.2) earthquake estimated by inversion of strong‐motion and teleseis-mic waveforms –Its relation with the 1978 Miyagi‐Oki earthquake(M7.4) (in Japanese with English abstract), Jishin, 60(730), 43–53.
KIMURA ET AL.: DYNAMIC MODELS OF MIYAGI‐OKI EARTHQUAKES B08302B08302
11 of 12

Yamanaka, Y., and M. Kikuchi (2004), Asperity map along the subductionzone in northeastern Japan inferred from regional seismic data, J. Geo-phys. Res., 109, B07307, doi:10.1029/2003JB002683.
T. Kimura, National Research Institute for Earth Science and DisasterPrevention, 3‐1, Tennodai, Ibaraki, Tsukuba 305‐0006, Japan. ([email protected])
K. Koketsu, H. Miyake, and T. Miyatake, Earthquake Research Institute,University of Tokyo, 1‐1‐1, Yayoi, Bunkyo‐ku, Tokyo 113‐0032, Japan.C. Wu, Japan Nuclear Energy Safety Organization, Kamiyacho MT
Building, 4‐3‐20, Toranomon, Minato‐ku, Tokyo 105‐0001, Japan.
KIMURA ET AL.: DYNAMIC MODELS OF MIYAGI‐OKI EARTHQUAKES B08302B08302
12 of 12