Open Access proceedings Journal of Physics - ERIC
10
Journal of Physics: Conference Series PAPER • OPEN ACCESS Trends, patterns, and the relationship of computer-based national examination of high school science students To cite this article: M K Nasution and A H Surbakti 2020 J. Phys.: Conf. Ser. 1460 012052 View the article online for updates and enhancements. This content was downloaded from IP address 36.85.111.185 on 08/07/2021 at 09:24
-
Upload
khangminh22 -
Category
Documents
-
view
3 -
download
0
Transcript of Open Access proceedings Journal of Physics - ERIC
Journal of Physics Conference Series
PAPER bull OPEN ACCESS
Trends patterns and the relationship of computer-based nationalexamination of high school science studentsTo cite this article M K Nasution and A H Surbakti 2020 J Phys Conf Ser 1460 012052
View the article online for updates and enhancements
This content was downloaded from IP address 3685111185 on 08072021 at 0924
Content from this work may be used under the terms of the Creative Commons Attribution 30 licence Any further distributionof this work must maintain attribution to the author(s) and the title of the work journal citation and DOI
Published under licence by IOP Publishing Ltd
AICMSTE 2019
IOP Conf Series Journal of Physics Conf Series 1460 (2020) 012052
IOP Publishing
doi1010881742-659614601012052
1
Trends patterns and the relationship of computer-based
national examination of high school science students
M K Nasution and A H Surbakti
STAIN Gajah Putih Takengon Aceh Tengah Aceh 24519 Indonesia
E-mail kamalnasutiongmailcom
Abstract This study provides an initial statistical approach as an alternative model to detect
the fraudulent practice estimation of national examination (NE) Trends patterns and
relationships were analysed from the national examination (NE) scores and the national
examination integrity index (NEII) on pre- and post-computer-based national examination
(CBNE) of the 103273 high school science students in Aceh Province Looking at the trends
and patterns of the pre-post CBNE implementation descriptive statistics were used by
comparing the average (Mean) of the NE NEII and the standard deviation of national
examination (SDNE) in the group of regenciescities Picturing the relationship between the
NE and NEII linear regression and curve estimation was applied The result shows that there
are striking differences and gradual changes between the pre-post CBNErsquos implementation in
each regencycity In the span of three years (2015-2017) a downward trend showed in the
NErsquos scores along with the implementation of CBNE which increased the NEIIrsquos value In
the pre-CBNE period (2015) a striking pattern emerged in the form of low NEII high NE and
low SDNE which indicated the existence of fraudulent practice estimation of the national
examination
1 Introduction
The national examination (NE) is a big issue in Indonesia education The implementation involved
millions of students teaching staffs high budget [1] with the prolonged debate [2] Due to its risks
such an exam is categorized as a high-stake test Indonesia was at the 2nd place of the rank-ordered
national averages of principalsrsquo perceptions of problematic cheating across schools within each nation
[3] There were many cheating cases that had become the findings of the authorities [4] and ironically
some of them did not only involve students but also teachers even principals [5] From time to time
the cases have attracted public concern and according to the Indonesian Teachers Union Federation
[6] from 2013 to 2015 there were 1430 reports on national examination fraud throughout Indonesia
Following up on this issue since 2015 the Indonesian Ministry of Education and Culture (MoEC)
began to enact the computer-based national examination (CBNE) All NErsquos results are later published
in an open-access website annually along with the value of the national examination integrity index
(NEII)
The national examination integrity index (NEII) is the level of trust for school carried out on the
national examination It means that students are having not only the NE scores but other concerned
parties could also compare to the honesty value of NE Implementation [7] To get the NEII score the
MoEC administered questionnaires for principals teachers and students in the schools [8] The
obtained scores were then published on the MoECrsquos official website along with other statistics trends
AICMSTE 2019
IOP Conf Series Journal of Physics Conf Series 1460 (2020) 012052
IOP Publishing
doi1010881742-659614601012052
2
and other calculations The NEII scores range from 0-100 where the maximum value obtained when
schools run CBNE If a school reached 90 points of integrity index this means that there was an
indication (possibility) of 10 of fraud at the school [9] According to the MoEC [10] in a school
with a high integrity index the results are relatively the same even when been tested with both paper
or computer-based
In several publications the MoEC stated that there was a declined national exam result at almost all
levels of education (SMP SMA SMK) especially in mathematics and science subjects [11-12]
According to them [10] there are two possibilities that cause this trend the complexity of the
questions of the national examination or the increasing integrity of national examination through the
implementation of the CBNE This study is intended to answer the second guess in terms of the
relationship between the national examination (NE) and the national examination integrity index
(NEII) particularly for high school science classes in Aceh province
Based on the facts described above there is a tendency by many parties that relates the trend
between integrity index and national examinations score This research therefore attends to answer
such following questions
1 What are the trends and patterns showed from the pre-post CBNE implementation of CBNE at
high school science classes in Aceh Province
2 How are the forms of relationship between the national examination (NE) and national
examination integrity index (NEII) of high school science classes in Aceh Province
2 Methodology
This research is a descriptive analysis study with an ex-post facto design Data gathered in the form of
NErsquos and NEIIrsquos value of 103273 science classes students from 645 high schools at all
regenciescities in Aceh Province which published at the MoECrsquos official website The data were later
reduced into a group of the average value (mean) per regenciescities (23)
The data obtained is then analyzed to get patterns trends and the forms of relationship between
national examination (NE) scores and national examination integrity index (NEII) on pre and post
(2015-2017) computer-based national examination (CBNE) of high school science classes in Aceh
Province To look at the trends and patterns of the pre and post CBNE implementation descriptive
statistics were used by comparing the average (mean) of the NE and NEII the standard deviation of
national examination (SDNE) in the group of regenciescities To get the picture of the relationship
between the NEII and NE and linear regression and curve estimation were applied
3 Results of the study
31 Trends and patterns of the Pre-CBNE implementation
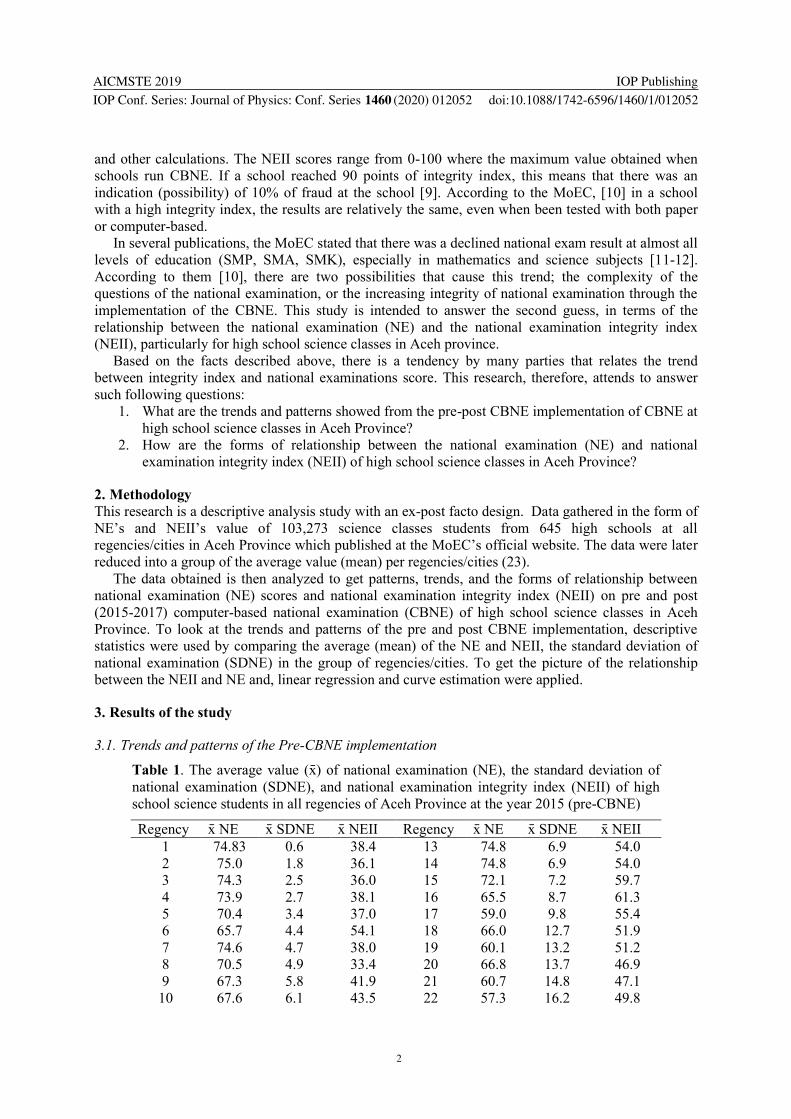
Table 1 The average value (x) of national examination (NE) the standard deviation of
national examination (SDNE) and national examination integrity index (NEII) of high
school science students in all regencies of Aceh Province at the year 2015 (pre-CBNE)
Regency x NE x SDNE x NEII Regency x NE x SDNE x NEII
1 7483 06 384 13 748 69 540
2 750 18 361 14 748 69 540
3 743 25 360 15 721 72 597
4 739 27 381 16 655 87 613
5 704 34 370 17 590 98 554
6 657 44 541 18 660 127 519
7 746 47 380 19 601 132 512
8 705 49 334 20 668 137 469
9 673 58 419 21 607 148 471
10 676 61 435 22 573 162 498
AICMSTE 2019
IOP Conf Series Journal of Physics Conf Series 1460 (2020) 012052
IOP Publishing
doi1010881742-659614601012052
3
Regency x NE x SDNE x NEII Regency x NE x SDNE x NEII
11 702 66 386 23 4753 169 649
12 635 66 446
Table 1 shows the result of national examination which estimated represent a similar value of how
national examination undertook before CBNE was initiated in the province The 23 regencies are later
automatically ranked based on the average values sorted from the lowest to highest SDNE to magnify
the direction of analysis By sorting like this the table turns out several patterns The NEII average
score ranges from 334 to 649 The number means that all science high schools were estimated to be
351-666 cheating In general two-third (69) of regencies in Aceh Province in this year have
integrity index below 50 while the rest is only 15 above Compared to the interval interpretation
below 9 out of 23 regencies are strongly estimated to conduct a fraudulent performance in the
examination
Tabel 2 The interval interpretation of national examination integrity index (NEII)1
NEII Interval
()
Cheating Estimation () Level of relationship
0-199 100-801 Very strong
20-399 80-601 Strong
40-599 60-401 Middle 1 Such interval interpretation is required to clarify the data from the result of the study
The Interval Interpretation of the national examination integrity index (NEII) has never
been revealed in other literature The reliability of this interpretation is possibly gained
further discussion
Specifically in this pre-CBNE period some regenciescities in Aceh Province revealed striking
figures Compared to all regenciescities Regency 1 and 2 reached the highest xNE scores However
they also possess the opposite integrity index which is one of the lowest One surprising fact is that of
all high school science students in Regency 1 occupied the highest NE ranks of all regenciescities in
Aceh they had only 06 of x SDNE This thin SDNE means that all science students in the regencies
had almost similar NE scores (between 742-755) When we look closer to the number of students and
schools the Regency has 1726 students of 29 number of education units There are only two reasons
behind the analysis whether all 1726 students possess almost similar competency or there was a
massive and structured fraudulent practice of national examination in the regency Inferring the
analysis the main pattern showed on the pre-CBNE period is high xNE low xNEII and low xSDNE
It leads analysis to estimate that there was a fraudulent practice of national examination in the regency
at the time
Table 3 The average value (x) of national examination (NE) standard deviation of
national examination (SDNE) and national examination integrity index (NEII) of high
school science students in all regencies of Aceh Province at the year 2016 (1st year of
CBNErsquos implementation)
Regency x NE x SDNE x NEII Regency x NE x SDNE x NEII
1 692 26 533 13 580 58 522
2 708 30 525 14 580 58 522
3 471 127 685 15 342 69 695
4 378 111 750 16 432 123 710
5 528 139 566 17 405 117 672
6 622 103 538 18 596 93 339
7 484 116 560 19 489 64 607
8 550 75 587 20 609 165 430
AICMSTE 2019
IOP Conf Series Journal of Physics Conf Series 1460 (2020) 012052
IOP Publishing
doi1010881742-659614601012052
4
Regency x NE x SDNE x NEII Regency x NE x SDNE x NEII
9 520 161 526 21 417 125 646
10 582 134 486 22 472 146 592
11 469 58 515 23 580 58 522
12 382 105 718
Compared to the previous year there was a change in the value of x NE and x NEII in the first year
of CBNE (2016) In general the value of x NE decreased from 675 to 508 while the x NEII value
increased from 467 to 618 86 of all districts have 50 or above of integrity Index yet only 3
regenciescities that have Integrity below 50 (bold Regencies No10 18 and 20) In contrast to the
previous trend the three regencies above are not too prominent in the average NE scores although still
relatively high
On the closer look Regency 1 and 2 which were highlighted in 2015 reveal slight changes The
pattern observed in the previous year is almost similar in the year after Compared to all regencies
Regency 1 and 2 still ranked as the highest NE score along with the smallest standard deviation These
changes indicate the implementation of CBNE relates to changed values
Table 4 The average value (x) of national examination (NE) the standard deviation of
national examination (SDNE) and national examination integrity index (NEII) of high
school science students in all regencies of Aceh Province at the year 2016 (2nd year of
CBNErsquos implementation)
Regency x NE x SDNE x NEII Regency x NE x SDNE x NEII
1 3439 99 8065 13 569 93 651
2 399 97 738 14 568 93 651
3 378 45 100 15 347 6 829
4 37 68 813 16 421 83 100
5 40 52 100 17 372 67 603
6 362 38 100 18 441 93 73
7 472 126 71 19 413 09 100
8 432 112 735 20 416 68 100
9 411 69 75 21 362 82 799
10 421 98 767 22 403 102 776
11 435 81 634 23 391 72 100
12 349 73 807
In 2017 there were important changes from the previous two years in terms of the average value
of NE and NEII The value of x NE decreased from 675 to 508 and became 412 in the last year
While the value of xNEII increased from 467 to 618 and 893 at last Only 2 out of 23
regenciescities which have an average NE score above 50 The rest range from 347 to 470
Furthermore Regency 1 and 2 which became the main point in 2015 and 2016 maintain the
change In 2017 the values continued to reveal a similar pattern that occurred before the Regency that
ranked the highest NE had the opposite value of integrity In addition to this there were different
patterns from the previous one In the Regency 19 has a perfect level of integrity (100 used CBNE)
but it turns out to reach average NE value with a thin standard deviation (09) almost the same as the
standard deviation of Regency 1 had in 2015
32 Relationship between the national examination integrity Index (NEII) and national examination
(NE) of high school science students in Aceh province
From the background explained above this study assumes that there have been a declined average of
national examination (NE) of science high school students in Aceh Province due to the
implementation of CBNE which appears through the national examination integrity index The second
question of this study is to picture the relationship between the two variables in two ways linear
regression and curve estimation
AICMSTE 2019
IOP Conf Series Journal of Physics Conf Series 1460 (2020) 012052
IOP Publishing
doi1010881742-659614601012052
5
The linear regression was run through several steps First a normality test was applied to determine
whether the relationship follows a normal Gaussian distribution or not The normality test of
Kolmogorov-Smirnov (the KZS value of the NEII variable) shows 0812 while the NE variable is
1173 Both are higher than 005 So it can be concluded that the two variables are assumed to be
normally distributed and parametric procedures can be applied
Second the coefficient of determination test was used to show how much the independent variable
can explain the dependent variable The higher coefficient determination value means the stronger
ability of the independent variable to explain variations in changes of the dependent variable To
analyze the influence of the NEII on the NE linear regression is used to prove that there are influences
between the two variables
Table 5 Model Summary
Model R R Square
Adjusted R
Square
Std Error of the
Estimate
1 667a 445 436 1534545
aPredictors (Constant) NE
The table explains the regression relationship between the dependent variable (NEII) and the
independent (NE) The influence relationship of NEII toward NE ranged from 0436 (smallest) to
0667 (largest) If we take the middle regression value (R2) then the value of regression (R) is equal to
0445 This means that NEII variable contributes a 445 effect on NE variables However the
number may still contain disturbing values that might cause errors of counts So the most countable
value of relationship shows on adjusted R2 value (0436) It means that the relationship between NEII
and NE is counted to be at least 436 with 847 of accuracy (due to the estimated standard error
value that is 15345) To interpret the strength of the relationship from both variables such an
interpretation of coefficient intervals shows in table 6 below
Table 6 Interval Coefficient Interpretation
Interval coefficient Level relationships
000-010 Very low (negligible)
010-039 Low
040-069 Middle
070-089 Strong
000-100 Very strong
Source Schober P Boer C and Schwarte LA [13]
Based on the Interval coefficient interpretation the determination of the national examination
integrity index on the national examination of science students in the Aceh Province ranges in the
category of middle relationship
Third the test of linearity was used to measure how much the integrity of the national examination
(NEII) influences the national examination (NE) scores Table 7 shows the coefficient as follows
Table 7 Coefficients a
Model
Unstandardized Coefficients
Standardized
Coefficients
t Sig
Collinearity Statistics
B Std Error Beta Tolerance VIF
1 (Constant) 119831 7582 15805 000
NE -1013 138 -667 -7324 000 1000 1000 aDependent Variable NEII
The coefficient table shows that the value of sig lt005 which means that the regression model is
linear The table also shows the negative direction of the regression on the Beta coefficient (both
AICMSTE 2019
IOP Conf Series Journal of Physics Conf Series 1460 (2020) 012052
IOP Publishing
doi1010881742-659614601012052
6
standard and non-standard) meaning that the higher the NEII value the lower (opposite) the NE score
would be The constant value of 119831 indicates that if there is no NEII then the NE value is
119831 The regression coefficient X is -1013 refers to every addition of 1 NEII value the NE value
increases by -1013 Referring to the regression coefficient analysis the regression equation obtained
is NEII = 119831 - (1013) (NE) Furthermore the t value = -7324 with a significance value of 0001
lt005 means that there is a significant influence between the NEII variables on the NE variable
The last linear regression stage of this method is the use of Product Moment-Pearson Correlation to
determine the degree of closeness of the relationship between two variables the Pearson correlation
was computed using SPSS at the table below
Table 8 Correlations
NEII NE
NEII Pearson Correlation 1 -667
Sig (2-tailed) 000
N 69 69
NE Pearson Correlation -667 1
Sig (2-tailed) 000
N 69 69 Correlation is significant at the 001 level (2-tailed)
The output shows the correlation analysis between NEII and NE with Pearson correlation value is
1 Such criteria lead to the relationship between both variables to be very strong Moreover the SPSS
analysis also shows a significant correlation at the level of 001 Meaning that there is a 999
influence of NEII variable on the NE variable
Besides the linear regression test curve estimation was also applied to get the second picture of the
relationship between NEII and NE variables Parameter estimation from SPSS was firstly gauged to
show the most suitable model for the relationship between NEII and NE in the form of the curve
Table 9 Model Summary and Parameter Estimates
Dependent VariableNEII
Equation
Model Summary Parameter Estimates
R Square F df1 df2 Sig Constant b1 b2 b3
Linear 445 53646 1 67 000 119831 -1013
Logarithmic 445 53659 1 67 000 276003 -53286
Inverse 434 51369 1 67 000 12786 2652796
Quadratic 447 26701 2 66 000 141293 -1850 008
Cubic 448 26788 2 66 000 136342 -1502 000 5303E-5
Compound 453 55447 1 67 000 147909 984
The independent variable is NE
Table 9 shows that each model has the least difference in the R Square value compared to others
Among the six estimated patterns the equation value of the compound model is the highest (0453)
This means that this model will give 453 an idea of the effectiveness of estimates So that the
estimation influences of NEII on NE is illustrated in the curve pattern below
AICMSTE 2019
IOP Conf Series Journal of Physics Conf Series 1460 (2020) 012052
IOP Publishing
doi1010881742-659614601012052
7
Figure 1 Curve Estimation Model of Relationship between NEII and NE
Figure 1 depicts a two-dimensional relationship between the NE and NEII This figure is an
estimation model that occurred in the relationship with an equation of NEII = 119831 - (1013) (NE)
The equation shows the inverse (negative) relationship wherein each addition of a NEIIrsquos value
contributes to a negative value of the NE However the curve also shows that the negative relationship
is not perfectly linear because the relationship line is appeared to be a slight curved shape
4 Discussion
In the span of 3 years (2015-2017) there was a downward trend in the NE along with the increased
NEII of high school science students in all districts in Aceh Province A pattern that emerged in this
period - is low integrity creates high NE scores - is seen very clearly in the pre-CBNE Period
However after the introduction of CBNE the NEII then rose gradually and consequently lowered the
NErsquos score of science students in Aceh Province What revealed as striking patter here is when schools
in a regency have a low x NEII a high x NE score with a small SDNE then it leads to a possibility of
massive and systematic fraudulent practice of the NE at the regencies (seen in Districts 1 and 2 in
2015) This pattern can be modeled as follows
Figure 2 Model of fraudulent practice estimation of national examination
The estimation model of NErsquos fraudulent practice means that an implementation of national
examination might be a fraud when in certain area possesses a low xNEII high xNE and small
xSDNE In this model the main point to indicate the fraudulence is the SDNE However one SDNE
alone in this case cannot be used as a benchmark because the situation also found in 2017 where the
Regency 19 has a low SDNE (09) yet also a high Integration index (100) Looking closer to this
later check to show that all national exams in the regency that was conducted using computer-based
examination (CBNE) So the low national examination standard deviation with a high integrity index
is reasonable due to the number of students taking the national exam which was is relatively small
(220 students)
The gradual increase of NEII value in Aceh Province is undeniably related to the implementation
of CBNE which had to apply in stages to reach the whole region The trend also occurred nationally
where the Ministry found difficulties in equipping all schools with certain facilities to implement
CBNE [14] In the first year of the CBNE nationally initiated in 2015 the province of Aceh has not
yet implemented it The examination in this province only began in the second year (2016) That is
why we found such a striking difference between those years and changed gradually afterward Until
AICMSTE 2019
IOP Conf Series Journal of Physics Conf Series 1460 (2020) 012052
IOP Publishing
doi1010881742-659614601012052
8
2017 of the 645 high schools that hold science classes 368 (57 of) schools had implemented the
CBNE while other 277 schools still carry out the examination based on paper and pencils
Comparing the national examination between the Aceh provincersquos and nationrsquos scores we can see
that the trend of change has also been happening nationally both for science high school students and
other majors as been seen at the table below
Tabel 10 Annual comparison of national examination scores between provincial and national trend
Year x NE of Aceh Province x NE Nationally
All Class Science Class All Class Science Class
20142015 6596 6913 6130 6529
20152016 4914 4972 5479 5685
20162017 4089 4196 5038 5287
Source PuspendikKemdikbud [15]
Referring to the regression analysis results the output interpretations indicate that the integrity of
the national examination has a moderate influence on national examination (with the regression value
of R2 0445) of science students in Aceh Province The relationship between them is linear with the
opposite direction (negative value) meaning that the higher the integrity index of the national
examination the lower the national examination obtained by the students Both conclusions are
consistent with other results found by Dwiatmoko et al [16] With relative similar variables their
study indicates that there was an existence of a systematic pattern to produce identical achievements
(values) in a certain educational evaluation context The unanimous results are also similar to this
result study which however later ldquoleaving crumbsrdquo for us to indicate that there was a systematic
intervention on these achievements (mainly pre-CBNE period) Back to both periods the governments
efforts to obtain the reliability of the national examination with CBNE seemed to have had a
significant impact
5 Conclusions
This research concludes that there are striking differences and gradual changes between the pre-and
post-implementation of the computer-based national examination of high school science students in
the province of Aceh In the span of three years (2015-2017) there was a downward trend of national
examination (NE) along with the implementation of CBNE which reveals through the increased value
of national examination integrity index (NEII) at all regencies in Aceh Province In the pre-CBNE
period a pattern appeared in the form of low xNEII high xNE and low xSDNE The pattern indicates
the existence of a fraudulent practice estimation of a national examination in the regenciescities In
the post-CBNE period the trend and pattern shifted backward (negative direction) wherein the
national examination score was getting smaller along with the increased NEII In addition the
implementation of CBNE - which reveals through the national examination integrity index ndash
moderately influence (with regression value R2 0445) the national examination scores of the high
school science students in Aceh Province The relationship between them is linear with the opposite
direction (negative value) meaning that the higher the Integrity Index of the national examination the
lower the national examination obtained by the student
6 References
[1] Alhadza A and Zulkifli M 2017 National examination and the quality of education in Indonesia
Advances in Social Sciences Research Journal 421 1-12
[2] Saukah A and Cahyono AE 2015 Ujian nasional di Indonesia dan implikasinya terhadap
pembelajaran bahasa inggris Jurnal Penelitian dan Evaluasi Pendidikan 192 244
[3] Miller BL Agnic LE Posick C Gould LA 2015 Cheating around the world a cross-national
analysis of principal reported cheating Journal of Criminal Justice Education 262 10
AICMSTE 2019
IOP Conf Series Journal of Physics Conf Series 1460 (2020) 012052
IOP Publishing
doi1010881742-659614601012052
9
[4] Rahman Y and Ari B 2016 FSGI masih kumpulkan data dan fakta kecurangan UN di seluruh
Indonesia [EBOL] [01-27-2019]
httpskbridnasional042016fsgi_masih_kumpulkan_data_dan_fakta_kecurangan_un_di_s
eluruh_indonesia80100html
[5] Iriani A and Manongga D 2018 Using soft systems methodology as an approach to evaluate
cheating in the national examination Journal of Theoretical and Applied Information
Technology 9611 3345
[6] Andina E 2015 Ujian kejujuran dalam pelaksanaan UN Pusat Pengkajian Pengolahan Data dan
Informasi (P3DI) Sekretariat Jenderal DPR RI Info Singkat Kesejahteraan Sosial 79 10
[7] BPS 2018 Index integritas ujian nasional [EBOL] [01-27-2019]
httpswwwbpsgoidstatictable201708181972indeks-integritas-ujian-nasionalhtml
[8] Puspendik kemdikbud 2018 Meta analisis ndash hasil ujian nasional untuk menyusun kebijakan
dan program [EBOL] [01-27-2019]
httpspuspendikkemdikbudgoidseminaruploadSeminar20Puspendik202015Paparan
_Meta20Analisis20UNpdf
[9] Setiawan Y 2015 IIUN untuk menumbuhkan sikap integritas dari sekolah [EBOL] [01-27-
2019]httpspsmkkemdikbudgoidkonten1373iiun-untuk-menumbuhkan-sikap-
integritas-dari-sekolah
[10] Uly YA 2018 Nilai rata-rata ujian nasional 2018 turun ini 2 biang keladinya [EBOL] [01-27-
2019]httpsnewsokezonecomread20180508651896034nilai-rata-rata-ujian-nasional-
2018-turun-ini-2-biang-keladinya
[11] Harususilo YE 2018 Ini 2 faktor penyebab nilai UN SMA menuruN [EBOL] [01-27-2019]
httpsedukasikompascomread2018050820070771ini-2-faktor-penyebab-nilai-un-sma-
menurun
[12] Mediani M 2018 Nilai UN siswa Jeblok Kemendikbud evaluasi topik ujian [EBOL] [01-27-
2019]httpswwwcnnindonesiacomnasional20180509124612-20-296868nilai-un-siswa-
jeblok-kemendikbud-evaluasi-topik-ujian
[13] Schober P Boer C and Schwarte LA 2018 Correlation coefficients appropriate use and
interpretation Anesthesia amp Analgesia 1265 1765
[14] Retnawati H Hadi S Nugraha AC Arlinwibowo J Sulistyaningsih E Djidu H Apino E Heni
D and Iryanti 2017 Implementing the computer-based national examination in Indonesian
schools The challenges and strategies Problems of Education in the 21st Century 756 613
[15] PuspendikKemdikbud 2019c Perbandingan hasil ujian nasional program studi IPA antar tahun
[EBOL] [01-27-2019]httpspuspendikkemdikbudgoidhasilun
[16] Dwiatmoko A Rosa PHP and Gunawan R 2015 Analisis statistis data nilai ujian nasional dan
nilai sekolah menengah atas di daerah istimewa Yogyakarta Jurnal Ilmiah Widya Teknik
142 1-7
Content from this work may be used under the terms of the Creative Commons Attribution 30 licence Any further distributionof this work must maintain attribution to the author(s) and the title of the work journal citation and DOI
Published under licence by IOP Publishing Ltd
AICMSTE 2019
IOP Conf Series Journal of Physics Conf Series 1460 (2020) 012052
IOP Publishing
doi1010881742-659614601012052
1
Trends patterns and the relationship of computer-based
national examination of high school science students
M K Nasution and A H Surbakti
STAIN Gajah Putih Takengon Aceh Tengah Aceh 24519 Indonesia
E-mail kamalnasutiongmailcom
Abstract This study provides an initial statistical approach as an alternative model to detect
the fraudulent practice estimation of national examination (NE) Trends patterns and
relationships were analysed from the national examination (NE) scores and the national
examination integrity index (NEII) on pre- and post-computer-based national examination
(CBNE) of the 103273 high school science students in Aceh Province Looking at the trends
and patterns of the pre-post CBNE implementation descriptive statistics were used by
comparing the average (Mean) of the NE NEII and the standard deviation of national
examination (SDNE) in the group of regenciescities Picturing the relationship between the
NE and NEII linear regression and curve estimation was applied The result shows that there
are striking differences and gradual changes between the pre-post CBNErsquos implementation in
each regencycity In the span of three years (2015-2017) a downward trend showed in the
NErsquos scores along with the implementation of CBNE which increased the NEIIrsquos value In
the pre-CBNE period (2015) a striking pattern emerged in the form of low NEII high NE and
low SDNE which indicated the existence of fraudulent practice estimation of the national
examination
1 Introduction
The national examination (NE) is a big issue in Indonesia education The implementation involved
millions of students teaching staffs high budget [1] with the prolonged debate [2] Due to its risks
such an exam is categorized as a high-stake test Indonesia was at the 2nd place of the rank-ordered
national averages of principalsrsquo perceptions of problematic cheating across schools within each nation
[3] There were many cheating cases that had become the findings of the authorities [4] and ironically
some of them did not only involve students but also teachers even principals [5] From time to time
the cases have attracted public concern and according to the Indonesian Teachers Union Federation
[6] from 2013 to 2015 there were 1430 reports on national examination fraud throughout Indonesia
Following up on this issue since 2015 the Indonesian Ministry of Education and Culture (MoEC)
began to enact the computer-based national examination (CBNE) All NErsquos results are later published
in an open-access website annually along with the value of the national examination integrity index
(NEII)
The national examination integrity index (NEII) is the level of trust for school carried out on the
national examination It means that students are having not only the NE scores but other concerned
parties could also compare to the honesty value of NE Implementation [7] To get the NEII score the
MoEC administered questionnaires for principals teachers and students in the schools [8] The
obtained scores were then published on the MoECrsquos official website along with other statistics trends
AICMSTE 2019
IOP Conf Series Journal of Physics Conf Series 1460 (2020) 012052
IOP Publishing
doi1010881742-659614601012052
2
and other calculations The NEII scores range from 0-100 where the maximum value obtained when
schools run CBNE If a school reached 90 points of integrity index this means that there was an
indication (possibility) of 10 of fraud at the school [9] According to the MoEC [10] in a school
with a high integrity index the results are relatively the same even when been tested with both paper
or computer-based
In several publications the MoEC stated that there was a declined national exam result at almost all
levels of education (SMP SMA SMK) especially in mathematics and science subjects [11-12]
According to them [10] there are two possibilities that cause this trend the complexity of the
questions of the national examination or the increasing integrity of national examination through the
implementation of the CBNE This study is intended to answer the second guess in terms of the
relationship between the national examination (NE) and the national examination integrity index
(NEII) particularly for high school science classes in Aceh province
Based on the facts described above there is a tendency by many parties that relates the trend
between integrity index and national examinations score This research therefore attends to answer
such following questions
1 What are the trends and patterns showed from the pre-post CBNE implementation of CBNE at
high school science classes in Aceh Province
2 How are the forms of relationship between the national examination (NE) and national
examination integrity index (NEII) of high school science classes in Aceh Province
2 Methodology
This research is a descriptive analysis study with an ex-post facto design Data gathered in the form of
NErsquos and NEIIrsquos value of 103273 science classes students from 645 high schools at all
regenciescities in Aceh Province which published at the MoECrsquos official website The data were later
reduced into a group of the average value (mean) per regenciescities (23)
The data obtained is then analyzed to get patterns trends and the forms of relationship between
national examination (NE) scores and national examination integrity index (NEII) on pre and post
(2015-2017) computer-based national examination (CBNE) of high school science classes in Aceh
Province To look at the trends and patterns of the pre and post CBNE implementation descriptive
statistics were used by comparing the average (mean) of the NE and NEII the standard deviation of
national examination (SDNE) in the group of regenciescities To get the picture of the relationship
between the NEII and NE and linear regression and curve estimation were applied
3 Results of the study
31 Trends and patterns of the Pre-CBNE implementation
Table 1 The average value (x) of national examination (NE) the standard deviation of
national examination (SDNE) and national examination integrity index (NEII) of high
school science students in all regencies of Aceh Province at the year 2015 (pre-CBNE)
Regency x NE x SDNE x NEII Regency x NE x SDNE x NEII
1 7483 06 384 13 748 69 540
2 750 18 361 14 748 69 540
3 743 25 360 15 721 72 597
4 739 27 381 16 655 87 613
5 704 34 370 17 590 98 554
6 657 44 541 18 660 127 519
7 746 47 380 19 601 132 512
8 705 49 334 20 668 137 469
9 673 58 419 21 607 148 471
10 676 61 435 22 573 162 498
AICMSTE 2019
IOP Conf Series Journal of Physics Conf Series 1460 (2020) 012052
IOP Publishing
doi1010881742-659614601012052
3
Regency x NE x SDNE x NEII Regency x NE x SDNE x NEII
11 702 66 386 23 4753 169 649
12 635 66 446
Table 1 shows the result of national examination which estimated represent a similar value of how
national examination undertook before CBNE was initiated in the province The 23 regencies are later
automatically ranked based on the average values sorted from the lowest to highest SDNE to magnify
the direction of analysis By sorting like this the table turns out several patterns The NEII average
score ranges from 334 to 649 The number means that all science high schools were estimated to be
351-666 cheating In general two-third (69) of regencies in Aceh Province in this year have
integrity index below 50 while the rest is only 15 above Compared to the interval interpretation
below 9 out of 23 regencies are strongly estimated to conduct a fraudulent performance in the
examination
Tabel 2 The interval interpretation of national examination integrity index (NEII)1
NEII Interval
()
Cheating Estimation () Level of relationship
0-199 100-801 Very strong
20-399 80-601 Strong
40-599 60-401 Middle 1 Such interval interpretation is required to clarify the data from the result of the study
The Interval Interpretation of the national examination integrity index (NEII) has never
been revealed in other literature The reliability of this interpretation is possibly gained
further discussion
Specifically in this pre-CBNE period some regenciescities in Aceh Province revealed striking
figures Compared to all regenciescities Regency 1 and 2 reached the highest xNE scores However
they also possess the opposite integrity index which is one of the lowest One surprising fact is that of
all high school science students in Regency 1 occupied the highest NE ranks of all regenciescities in
Aceh they had only 06 of x SDNE This thin SDNE means that all science students in the regencies
had almost similar NE scores (between 742-755) When we look closer to the number of students and
schools the Regency has 1726 students of 29 number of education units There are only two reasons
behind the analysis whether all 1726 students possess almost similar competency or there was a
massive and structured fraudulent practice of national examination in the regency Inferring the
analysis the main pattern showed on the pre-CBNE period is high xNE low xNEII and low xSDNE
It leads analysis to estimate that there was a fraudulent practice of national examination in the regency
at the time
Table 3 The average value (x) of national examination (NE) standard deviation of
national examination (SDNE) and national examination integrity index (NEII) of high
school science students in all regencies of Aceh Province at the year 2016 (1st year of
CBNErsquos implementation)
Regency x NE x SDNE x NEII Regency x NE x SDNE x NEII
1 692 26 533 13 580 58 522
2 708 30 525 14 580 58 522
3 471 127 685 15 342 69 695
4 378 111 750 16 432 123 710
5 528 139 566 17 405 117 672
6 622 103 538 18 596 93 339
7 484 116 560 19 489 64 607
8 550 75 587 20 609 165 430
AICMSTE 2019
IOP Conf Series Journal of Physics Conf Series 1460 (2020) 012052
IOP Publishing
doi1010881742-659614601012052
4
Regency x NE x SDNE x NEII Regency x NE x SDNE x NEII
9 520 161 526 21 417 125 646
10 582 134 486 22 472 146 592
11 469 58 515 23 580 58 522
12 382 105 718
Compared to the previous year there was a change in the value of x NE and x NEII in the first year
of CBNE (2016) In general the value of x NE decreased from 675 to 508 while the x NEII value
increased from 467 to 618 86 of all districts have 50 or above of integrity Index yet only 3
regenciescities that have Integrity below 50 (bold Regencies No10 18 and 20) In contrast to the
previous trend the three regencies above are not too prominent in the average NE scores although still
relatively high
On the closer look Regency 1 and 2 which were highlighted in 2015 reveal slight changes The
pattern observed in the previous year is almost similar in the year after Compared to all regencies
Regency 1 and 2 still ranked as the highest NE score along with the smallest standard deviation These
changes indicate the implementation of CBNE relates to changed values
Table 4 The average value (x) of national examination (NE) the standard deviation of
national examination (SDNE) and national examination integrity index (NEII) of high
school science students in all regencies of Aceh Province at the year 2016 (2nd year of
CBNErsquos implementation)
Regency x NE x SDNE x NEII Regency x NE x SDNE x NEII
1 3439 99 8065 13 569 93 651
2 399 97 738 14 568 93 651
3 378 45 100 15 347 6 829
4 37 68 813 16 421 83 100
5 40 52 100 17 372 67 603
6 362 38 100 18 441 93 73
7 472 126 71 19 413 09 100
8 432 112 735 20 416 68 100
9 411 69 75 21 362 82 799
10 421 98 767 22 403 102 776
11 435 81 634 23 391 72 100
12 349 73 807
In 2017 there were important changes from the previous two years in terms of the average value
of NE and NEII The value of x NE decreased from 675 to 508 and became 412 in the last year
While the value of xNEII increased from 467 to 618 and 893 at last Only 2 out of 23
regenciescities which have an average NE score above 50 The rest range from 347 to 470
Furthermore Regency 1 and 2 which became the main point in 2015 and 2016 maintain the
change In 2017 the values continued to reveal a similar pattern that occurred before the Regency that
ranked the highest NE had the opposite value of integrity In addition to this there were different
patterns from the previous one In the Regency 19 has a perfect level of integrity (100 used CBNE)
but it turns out to reach average NE value with a thin standard deviation (09) almost the same as the
standard deviation of Regency 1 had in 2015
32 Relationship between the national examination integrity Index (NEII) and national examination
(NE) of high school science students in Aceh province
From the background explained above this study assumes that there have been a declined average of
national examination (NE) of science high school students in Aceh Province due to the
implementation of CBNE which appears through the national examination integrity index The second
question of this study is to picture the relationship between the two variables in two ways linear
regression and curve estimation
AICMSTE 2019
IOP Conf Series Journal of Physics Conf Series 1460 (2020) 012052
IOP Publishing
doi1010881742-659614601012052
5
The linear regression was run through several steps First a normality test was applied to determine
whether the relationship follows a normal Gaussian distribution or not The normality test of
Kolmogorov-Smirnov (the KZS value of the NEII variable) shows 0812 while the NE variable is
1173 Both are higher than 005 So it can be concluded that the two variables are assumed to be
normally distributed and parametric procedures can be applied
Second the coefficient of determination test was used to show how much the independent variable
can explain the dependent variable The higher coefficient determination value means the stronger
ability of the independent variable to explain variations in changes of the dependent variable To
analyze the influence of the NEII on the NE linear regression is used to prove that there are influences
between the two variables
Table 5 Model Summary
Model R R Square
Adjusted R
Square
Std Error of the
Estimate
1 667a 445 436 1534545
aPredictors (Constant) NE
The table explains the regression relationship between the dependent variable (NEII) and the
independent (NE) The influence relationship of NEII toward NE ranged from 0436 (smallest) to
0667 (largest) If we take the middle regression value (R2) then the value of regression (R) is equal to
0445 This means that NEII variable contributes a 445 effect on NE variables However the
number may still contain disturbing values that might cause errors of counts So the most countable
value of relationship shows on adjusted R2 value (0436) It means that the relationship between NEII
and NE is counted to be at least 436 with 847 of accuracy (due to the estimated standard error
value that is 15345) To interpret the strength of the relationship from both variables such an
interpretation of coefficient intervals shows in table 6 below
Table 6 Interval Coefficient Interpretation
Interval coefficient Level relationships
000-010 Very low (negligible)
010-039 Low
040-069 Middle
070-089 Strong
000-100 Very strong
Source Schober P Boer C and Schwarte LA [13]
Based on the Interval coefficient interpretation the determination of the national examination
integrity index on the national examination of science students in the Aceh Province ranges in the
category of middle relationship
Third the test of linearity was used to measure how much the integrity of the national examination
(NEII) influences the national examination (NE) scores Table 7 shows the coefficient as follows
Table 7 Coefficients a
Model
Unstandardized Coefficients
Standardized
Coefficients
t Sig
Collinearity Statistics
B Std Error Beta Tolerance VIF
1 (Constant) 119831 7582 15805 000
NE -1013 138 -667 -7324 000 1000 1000 aDependent Variable NEII
The coefficient table shows that the value of sig lt005 which means that the regression model is
linear The table also shows the negative direction of the regression on the Beta coefficient (both
AICMSTE 2019
IOP Conf Series Journal of Physics Conf Series 1460 (2020) 012052
IOP Publishing
doi1010881742-659614601012052
6
standard and non-standard) meaning that the higher the NEII value the lower (opposite) the NE score
would be The constant value of 119831 indicates that if there is no NEII then the NE value is
119831 The regression coefficient X is -1013 refers to every addition of 1 NEII value the NE value
increases by -1013 Referring to the regression coefficient analysis the regression equation obtained
is NEII = 119831 - (1013) (NE) Furthermore the t value = -7324 with a significance value of 0001
lt005 means that there is a significant influence between the NEII variables on the NE variable
The last linear regression stage of this method is the use of Product Moment-Pearson Correlation to
determine the degree of closeness of the relationship between two variables the Pearson correlation
was computed using SPSS at the table below
Table 8 Correlations
NEII NE
NEII Pearson Correlation 1 -667
Sig (2-tailed) 000
N 69 69
NE Pearson Correlation -667 1
Sig (2-tailed) 000
N 69 69 Correlation is significant at the 001 level (2-tailed)
The output shows the correlation analysis between NEII and NE with Pearson correlation value is
1 Such criteria lead to the relationship between both variables to be very strong Moreover the SPSS
analysis also shows a significant correlation at the level of 001 Meaning that there is a 999
influence of NEII variable on the NE variable
Besides the linear regression test curve estimation was also applied to get the second picture of the
relationship between NEII and NE variables Parameter estimation from SPSS was firstly gauged to
show the most suitable model for the relationship between NEII and NE in the form of the curve
Table 9 Model Summary and Parameter Estimates
Dependent VariableNEII
Equation
Model Summary Parameter Estimates
R Square F df1 df2 Sig Constant b1 b2 b3
Linear 445 53646 1 67 000 119831 -1013
Logarithmic 445 53659 1 67 000 276003 -53286
Inverse 434 51369 1 67 000 12786 2652796
Quadratic 447 26701 2 66 000 141293 -1850 008
Cubic 448 26788 2 66 000 136342 -1502 000 5303E-5
Compound 453 55447 1 67 000 147909 984
The independent variable is NE
Table 9 shows that each model has the least difference in the R Square value compared to others
Among the six estimated patterns the equation value of the compound model is the highest (0453)
This means that this model will give 453 an idea of the effectiveness of estimates So that the
estimation influences of NEII on NE is illustrated in the curve pattern below
AICMSTE 2019
IOP Conf Series Journal of Physics Conf Series 1460 (2020) 012052
IOP Publishing
doi1010881742-659614601012052
7
Figure 1 Curve Estimation Model of Relationship between NEII and NE
Figure 1 depicts a two-dimensional relationship between the NE and NEII This figure is an
estimation model that occurred in the relationship with an equation of NEII = 119831 - (1013) (NE)
The equation shows the inverse (negative) relationship wherein each addition of a NEIIrsquos value
contributes to a negative value of the NE However the curve also shows that the negative relationship
is not perfectly linear because the relationship line is appeared to be a slight curved shape
4 Discussion
In the span of 3 years (2015-2017) there was a downward trend in the NE along with the increased
NEII of high school science students in all districts in Aceh Province A pattern that emerged in this
period - is low integrity creates high NE scores - is seen very clearly in the pre-CBNE Period
However after the introduction of CBNE the NEII then rose gradually and consequently lowered the
NErsquos score of science students in Aceh Province What revealed as striking patter here is when schools
in a regency have a low x NEII a high x NE score with a small SDNE then it leads to a possibility of
massive and systematic fraudulent practice of the NE at the regencies (seen in Districts 1 and 2 in
2015) This pattern can be modeled as follows
Figure 2 Model of fraudulent practice estimation of national examination
The estimation model of NErsquos fraudulent practice means that an implementation of national
examination might be a fraud when in certain area possesses a low xNEII high xNE and small
xSDNE In this model the main point to indicate the fraudulence is the SDNE However one SDNE
alone in this case cannot be used as a benchmark because the situation also found in 2017 where the
Regency 19 has a low SDNE (09) yet also a high Integration index (100) Looking closer to this
later check to show that all national exams in the regency that was conducted using computer-based
examination (CBNE) So the low national examination standard deviation with a high integrity index
is reasonable due to the number of students taking the national exam which was is relatively small
(220 students)
The gradual increase of NEII value in Aceh Province is undeniably related to the implementation
of CBNE which had to apply in stages to reach the whole region The trend also occurred nationally
where the Ministry found difficulties in equipping all schools with certain facilities to implement
CBNE [14] In the first year of the CBNE nationally initiated in 2015 the province of Aceh has not
yet implemented it The examination in this province only began in the second year (2016) That is
why we found such a striking difference between those years and changed gradually afterward Until
AICMSTE 2019
IOP Conf Series Journal of Physics Conf Series 1460 (2020) 012052
IOP Publishing
doi1010881742-659614601012052
8
2017 of the 645 high schools that hold science classes 368 (57 of) schools had implemented the
CBNE while other 277 schools still carry out the examination based on paper and pencils
Comparing the national examination between the Aceh provincersquos and nationrsquos scores we can see
that the trend of change has also been happening nationally both for science high school students and
other majors as been seen at the table below
Tabel 10 Annual comparison of national examination scores between provincial and national trend
Year x NE of Aceh Province x NE Nationally
All Class Science Class All Class Science Class
20142015 6596 6913 6130 6529
20152016 4914 4972 5479 5685
20162017 4089 4196 5038 5287
Source PuspendikKemdikbud [15]
Referring to the regression analysis results the output interpretations indicate that the integrity of
the national examination has a moderate influence on national examination (with the regression value
of R2 0445) of science students in Aceh Province The relationship between them is linear with the
opposite direction (negative value) meaning that the higher the integrity index of the national
examination the lower the national examination obtained by the students Both conclusions are
consistent with other results found by Dwiatmoko et al [16] With relative similar variables their
study indicates that there was an existence of a systematic pattern to produce identical achievements
(values) in a certain educational evaluation context The unanimous results are also similar to this
result study which however later ldquoleaving crumbsrdquo for us to indicate that there was a systematic
intervention on these achievements (mainly pre-CBNE period) Back to both periods the governments
efforts to obtain the reliability of the national examination with CBNE seemed to have had a
significant impact
5 Conclusions
This research concludes that there are striking differences and gradual changes between the pre-and
post-implementation of the computer-based national examination of high school science students in
the province of Aceh In the span of three years (2015-2017) there was a downward trend of national
examination (NE) along with the implementation of CBNE which reveals through the increased value
of national examination integrity index (NEII) at all regencies in Aceh Province In the pre-CBNE
period a pattern appeared in the form of low xNEII high xNE and low xSDNE The pattern indicates
the existence of a fraudulent practice estimation of a national examination in the regenciescities In
the post-CBNE period the trend and pattern shifted backward (negative direction) wherein the
national examination score was getting smaller along with the increased NEII In addition the
implementation of CBNE - which reveals through the national examination integrity index ndash
moderately influence (with regression value R2 0445) the national examination scores of the high
school science students in Aceh Province The relationship between them is linear with the opposite
direction (negative value) meaning that the higher the Integrity Index of the national examination the
lower the national examination obtained by the student
6 References
[1] Alhadza A and Zulkifli M 2017 National examination and the quality of education in Indonesia
Advances in Social Sciences Research Journal 421 1-12
[2] Saukah A and Cahyono AE 2015 Ujian nasional di Indonesia dan implikasinya terhadap
pembelajaran bahasa inggris Jurnal Penelitian dan Evaluasi Pendidikan 192 244
[3] Miller BL Agnic LE Posick C Gould LA 2015 Cheating around the world a cross-national
analysis of principal reported cheating Journal of Criminal Justice Education 262 10
AICMSTE 2019
IOP Conf Series Journal of Physics Conf Series 1460 (2020) 012052
IOP Publishing
doi1010881742-659614601012052
9
[4] Rahman Y and Ari B 2016 FSGI masih kumpulkan data dan fakta kecurangan UN di seluruh
Indonesia [EBOL] [01-27-2019]
httpskbridnasional042016fsgi_masih_kumpulkan_data_dan_fakta_kecurangan_un_di_s
eluruh_indonesia80100html
[5] Iriani A and Manongga D 2018 Using soft systems methodology as an approach to evaluate
cheating in the national examination Journal of Theoretical and Applied Information
Technology 9611 3345
[6] Andina E 2015 Ujian kejujuran dalam pelaksanaan UN Pusat Pengkajian Pengolahan Data dan
Informasi (P3DI) Sekretariat Jenderal DPR RI Info Singkat Kesejahteraan Sosial 79 10
[7] BPS 2018 Index integritas ujian nasional [EBOL] [01-27-2019]
httpswwwbpsgoidstatictable201708181972indeks-integritas-ujian-nasionalhtml
[8] Puspendik kemdikbud 2018 Meta analisis ndash hasil ujian nasional untuk menyusun kebijakan
dan program [EBOL] [01-27-2019]
httpspuspendikkemdikbudgoidseminaruploadSeminar20Puspendik202015Paparan
_Meta20Analisis20UNpdf
[9] Setiawan Y 2015 IIUN untuk menumbuhkan sikap integritas dari sekolah [EBOL] [01-27-
2019]httpspsmkkemdikbudgoidkonten1373iiun-untuk-menumbuhkan-sikap-
integritas-dari-sekolah
[10] Uly YA 2018 Nilai rata-rata ujian nasional 2018 turun ini 2 biang keladinya [EBOL] [01-27-
2019]httpsnewsokezonecomread20180508651896034nilai-rata-rata-ujian-nasional-
2018-turun-ini-2-biang-keladinya
[11] Harususilo YE 2018 Ini 2 faktor penyebab nilai UN SMA menuruN [EBOL] [01-27-2019]
httpsedukasikompascomread2018050820070771ini-2-faktor-penyebab-nilai-un-sma-
menurun
[12] Mediani M 2018 Nilai UN siswa Jeblok Kemendikbud evaluasi topik ujian [EBOL] [01-27-
2019]httpswwwcnnindonesiacomnasional20180509124612-20-296868nilai-un-siswa-
jeblok-kemendikbud-evaluasi-topik-ujian
[13] Schober P Boer C and Schwarte LA 2018 Correlation coefficients appropriate use and
interpretation Anesthesia amp Analgesia 1265 1765
[14] Retnawati H Hadi S Nugraha AC Arlinwibowo J Sulistyaningsih E Djidu H Apino E Heni
D and Iryanti 2017 Implementing the computer-based national examination in Indonesian
schools The challenges and strategies Problems of Education in the 21st Century 756 613
[15] PuspendikKemdikbud 2019c Perbandingan hasil ujian nasional program studi IPA antar tahun
[EBOL] [01-27-2019]httpspuspendikkemdikbudgoidhasilun
[16] Dwiatmoko A Rosa PHP and Gunawan R 2015 Analisis statistis data nilai ujian nasional dan
nilai sekolah menengah atas di daerah istimewa Yogyakarta Jurnal Ilmiah Widya Teknik
142 1-7
AICMSTE 2019
IOP Conf Series Journal of Physics Conf Series 1460 (2020) 012052
IOP Publishing
doi1010881742-659614601012052
2
and other calculations The NEII scores range from 0-100 where the maximum value obtained when
schools run CBNE If a school reached 90 points of integrity index this means that there was an
indication (possibility) of 10 of fraud at the school [9] According to the MoEC [10] in a school
with a high integrity index the results are relatively the same even when been tested with both paper
or computer-based
In several publications the MoEC stated that there was a declined national exam result at almost all
levels of education (SMP SMA SMK) especially in mathematics and science subjects [11-12]
According to them [10] there are two possibilities that cause this trend the complexity of the
questions of the national examination or the increasing integrity of national examination through the
implementation of the CBNE This study is intended to answer the second guess in terms of the
relationship between the national examination (NE) and the national examination integrity index
(NEII) particularly for high school science classes in Aceh province
Based on the facts described above there is a tendency by many parties that relates the trend
between integrity index and national examinations score This research therefore attends to answer
such following questions
1 What are the trends and patterns showed from the pre-post CBNE implementation of CBNE at
high school science classes in Aceh Province
2 How are the forms of relationship between the national examination (NE) and national
examination integrity index (NEII) of high school science classes in Aceh Province
2 Methodology
This research is a descriptive analysis study with an ex-post facto design Data gathered in the form of
NErsquos and NEIIrsquos value of 103273 science classes students from 645 high schools at all
regenciescities in Aceh Province which published at the MoECrsquos official website The data were later
reduced into a group of the average value (mean) per regenciescities (23)
The data obtained is then analyzed to get patterns trends and the forms of relationship between
national examination (NE) scores and national examination integrity index (NEII) on pre and post
(2015-2017) computer-based national examination (CBNE) of high school science classes in Aceh
Province To look at the trends and patterns of the pre and post CBNE implementation descriptive
statistics were used by comparing the average (mean) of the NE and NEII the standard deviation of
national examination (SDNE) in the group of regenciescities To get the picture of the relationship
between the NEII and NE and linear regression and curve estimation were applied
3 Results of the study
31 Trends and patterns of the Pre-CBNE implementation
Table 1 The average value (x) of national examination (NE) the standard deviation of
national examination (SDNE) and national examination integrity index (NEII) of high
school science students in all regencies of Aceh Province at the year 2015 (pre-CBNE)
Regency x NE x SDNE x NEII Regency x NE x SDNE x NEII
1 7483 06 384 13 748 69 540
2 750 18 361 14 748 69 540
3 743 25 360 15 721 72 597
4 739 27 381 16 655 87 613
5 704 34 370 17 590 98 554
6 657 44 541 18 660 127 519
7 746 47 380 19 601 132 512
8 705 49 334 20 668 137 469
9 673 58 419 21 607 148 471
10 676 61 435 22 573 162 498
AICMSTE 2019
IOP Conf Series Journal of Physics Conf Series 1460 (2020) 012052
IOP Publishing
doi1010881742-659614601012052
3
Regency x NE x SDNE x NEII Regency x NE x SDNE x NEII
11 702 66 386 23 4753 169 649
12 635 66 446
Table 1 shows the result of national examination which estimated represent a similar value of how
national examination undertook before CBNE was initiated in the province The 23 regencies are later
automatically ranked based on the average values sorted from the lowest to highest SDNE to magnify
the direction of analysis By sorting like this the table turns out several patterns The NEII average
score ranges from 334 to 649 The number means that all science high schools were estimated to be
351-666 cheating In general two-third (69) of regencies in Aceh Province in this year have
integrity index below 50 while the rest is only 15 above Compared to the interval interpretation
below 9 out of 23 regencies are strongly estimated to conduct a fraudulent performance in the
examination
Tabel 2 The interval interpretation of national examination integrity index (NEII)1
NEII Interval
()
Cheating Estimation () Level of relationship
0-199 100-801 Very strong
20-399 80-601 Strong
40-599 60-401 Middle 1 Such interval interpretation is required to clarify the data from the result of the study
The Interval Interpretation of the national examination integrity index (NEII) has never
been revealed in other literature The reliability of this interpretation is possibly gained
further discussion
Specifically in this pre-CBNE period some regenciescities in Aceh Province revealed striking
figures Compared to all regenciescities Regency 1 and 2 reached the highest xNE scores However
they also possess the opposite integrity index which is one of the lowest One surprising fact is that of
all high school science students in Regency 1 occupied the highest NE ranks of all regenciescities in
Aceh they had only 06 of x SDNE This thin SDNE means that all science students in the regencies
had almost similar NE scores (between 742-755) When we look closer to the number of students and
schools the Regency has 1726 students of 29 number of education units There are only two reasons
behind the analysis whether all 1726 students possess almost similar competency or there was a
massive and structured fraudulent practice of national examination in the regency Inferring the
analysis the main pattern showed on the pre-CBNE period is high xNE low xNEII and low xSDNE
It leads analysis to estimate that there was a fraudulent practice of national examination in the regency
at the time
Table 3 The average value (x) of national examination (NE) standard deviation of
national examination (SDNE) and national examination integrity index (NEII) of high
school science students in all regencies of Aceh Province at the year 2016 (1st year of
CBNErsquos implementation)
Regency x NE x SDNE x NEII Regency x NE x SDNE x NEII
1 692 26 533 13 580 58 522
2 708 30 525 14 580 58 522
3 471 127 685 15 342 69 695
4 378 111 750 16 432 123 710
5 528 139 566 17 405 117 672
6 622 103 538 18 596 93 339
7 484 116 560 19 489 64 607
8 550 75 587 20 609 165 430
AICMSTE 2019
IOP Conf Series Journal of Physics Conf Series 1460 (2020) 012052
IOP Publishing
doi1010881742-659614601012052
4
Regency x NE x SDNE x NEII Regency x NE x SDNE x NEII
9 520 161 526 21 417 125 646
10 582 134 486 22 472 146 592
11 469 58 515 23 580 58 522
12 382 105 718
Compared to the previous year there was a change in the value of x NE and x NEII in the first year
of CBNE (2016) In general the value of x NE decreased from 675 to 508 while the x NEII value
increased from 467 to 618 86 of all districts have 50 or above of integrity Index yet only 3
regenciescities that have Integrity below 50 (bold Regencies No10 18 and 20) In contrast to the
previous trend the three regencies above are not too prominent in the average NE scores although still
relatively high
On the closer look Regency 1 and 2 which were highlighted in 2015 reveal slight changes The
pattern observed in the previous year is almost similar in the year after Compared to all regencies
Regency 1 and 2 still ranked as the highest NE score along with the smallest standard deviation These
changes indicate the implementation of CBNE relates to changed values
Table 4 The average value (x) of national examination (NE) the standard deviation of
national examination (SDNE) and national examination integrity index (NEII) of high
school science students in all regencies of Aceh Province at the year 2016 (2nd year of
CBNErsquos implementation)
Regency x NE x SDNE x NEII Regency x NE x SDNE x NEII
1 3439 99 8065 13 569 93 651
2 399 97 738 14 568 93 651
3 378 45 100 15 347 6 829
4 37 68 813 16 421 83 100
5 40 52 100 17 372 67 603
6 362 38 100 18 441 93 73
7 472 126 71 19 413 09 100
8 432 112 735 20 416 68 100
9 411 69 75 21 362 82 799
10 421 98 767 22 403 102 776
11 435 81 634 23 391 72 100
12 349 73 807
In 2017 there were important changes from the previous two years in terms of the average value
of NE and NEII The value of x NE decreased from 675 to 508 and became 412 in the last year
While the value of xNEII increased from 467 to 618 and 893 at last Only 2 out of 23
regenciescities which have an average NE score above 50 The rest range from 347 to 470
Furthermore Regency 1 and 2 which became the main point in 2015 and 2016 maintain the
change In 2017 the values continued to reveal a similar pattern that occurred before the Regency that
ranked the highest NE had the opposite value of integrity In addition to this there were different
patterns from the previous one In the Regency 19 has a perfect level of integrity (100 used CBNE)
but it turns out to reach average NE value with a thin standard deviation (09) almost the same as the
standard deviation of Regency 1 had in 2015
32 Relationship between the national examination integrity Index (NEII) and national examination
(NE) of high school science students in Aceh province
From the background explained above this study assumes that there have been a declined average of
national examination (NE) of science high school students in Aceh Province due to the
implementation of CBNE which appears through the national examination integrity index The second
question of this study is to picture the relationship between the two variables in two ways linear
regression and curve estimation
AICMSTE 2019
IOP Conf Series Journal of Physics Conf Series 1460 (2020) 012052
IOP Publishing
doi1010881742-659614601012052
5
The linear regression was run through several steps First a normality test was applied to determine
whether the relationship follows a normal Gaussian distribution or not The normality test of
Kolmogorov-Smirnov (the KZS value of the NEII variable) shows 0812 while the NE variable is
1173 Both are higher than 005 So it can be concluded that the two variables are assumed to be
normally distributed and parametric procedures can be applied
Second the coefficient of determination test was used to show how much the independent variable
can explain the dependent variable The higher coefficient determination value means the stronger
ability of the independent variable to explain variations in changes of the dependent variable To
analyze the influence of the NEII on the NE linear regression is used to prove that there are influences
between the two variables
Table 5 Model Summary
Model R R Square
Adjusted R
Square
Std Error of the
Estimate
1 667a 445 436 1534545
aPredictors (Constant) NE
The table explains the regression relationship between the dependent variable (NEII) and the
independent (NE) The influence relationship of NEII toward NE ranged from 0436 (smallest) to
0667 (largest) If we take the middle regression value (R2) then the value of regression (R) is equal to
0445 This means that NEII variable contributes a 445 effect on NE variables However the
number may still contain disturbing values that might cause errors of counts So the most countable
value of relationship shows on adjusted R2 value (0436) It means that the relationship between NEII
and NE is counted to be at least 436 with 847 of accuracy (due to the estimated standard error
value that is 15345) To interpret the strength of the relationship from both variables such an
interpretation of coefficient intervals shows in table 6 below
Table 6 Interval Coefficient Interpretation
Interval coefficient Level relationships
000-010 Very low (negligible)
010-039 Low
040-069 Middle
070-089 Strong
000-100 Very strong
Source Schober P Boer C and Schwarte LA [13]
Based on the Interval coefficient interpretation the determination of the national examination
integrity index on the national examination of science students in the Aceh Province ranges in the
category of middle relationship
Third the test of linearity was used to measure how much the integrity of the national examination
(NEII) influences the national examination (NE) scores Table 7 shows the coefficient as follows
Table 7 Coefficients a
Model
Unstandardized Coefficients
Standardized
Coefficients
t Sig
Collinearity Statistics
B Std Error Beta Tolerance VIF
1 (Constant) 119831 7582 15805 000
NE -1013 138 -667 -7324 000 1000 1000 aDependent Variable NEII
The coefficient table shows that the value of sig lt005 which means that the regression model is
linear The table also shows the negative direction of the regression on the Beta coefficient (both
AICMSTE 2019
IOP Conf Series Journal of Physics Conf Series 1460 (2020) 012052
IOP Publishing
doi1010881742-659614601012052
6
standard and non-standard) meaning that the higher the NEII value the lower (opposite) the NE score
would be The constant value of 119831 indicates that if there is no NEII then the NE value is
119831 The regression coefficient X is -1013 refers to every addition of 1 NEII value the NE value
increases by -1013 Referring to the regression coefficient analysis the regression equation obtained
is NEII = 119831 - (1013) (NE) Furthermore the t value = -7324 with a significance value of 0001
lt005 means that there is a significant influence between the NEII variables on the NE variable
The last linear regression stage of this method is the use of Product Moment-Pearson Correlation to
determine the degree of closeness of the relationship between two variables the Pearson correlation
was computed using SPSS at the table below
Table 8 Correlations
NEII NE
NEII Pearson Correlation 1 -667
Sig (2-tailed) 000
N 69 69
NE Pearson Correlation -667 1
Sig (2-tailed) 000
N 69 69 Correlation is significant at the 001 level (2-tailed)
The output shows the correlation analysis between NEII and NE with Pearson correlation value is
1 Such criteria lead to the relationship between both variables to be very strong Moreover the SPSS
analysis also shows a significant correlation at the level of 001 Meaning that there is a 999
influence of NEII variable on the NE variable
Besides the linear regression test curve estimation was also applied to get the second picture of the
relationship between NEII and NE variables Parameter estimation from SPSS was firstly gauged to
show the most suitable model for the relationship between NEII and NE in the form of the curve
Table 9 Model Summary and Parameter Estimates
Dependent VariableNEII
Equation
Model Summary Parameter Estimates
R Square F df1 df2 Sig Constant b1 b2 b3
Linear 445 53646 1 67 000 119831 -1013
Logarithmic 445 53659 1 67 000 276003 -53286
Inverse 434 51369 1 67 000 12786 2652796
Quadratic 447 26701 2 66 000 141293 -1850 008
Cubic 448 26788 2 66 000 136342 -1502 000 5303E-5
Compound 453 55447 1 67 000 147909 984
The independent variable is NE
Table 9 shows that each model has the least difference in the R Square value compared to others
Among the six estimated patterns the equation value of the compound model is the highest (0453)
This means that this model will give 453 an idea of the effectiveness of estimates So that the
estimation influences of NEII on NE is illustrated in the curve pattern below
AICMSTE 2019
IOP Conf Series Journal of Physics Conf Series 1460 (2020) 012052
IOP Publishing
doi1010881742-659614601012052
7
Figure 1 Curve Estimation Model of Relationship between NEII and NE
Figure 1 depicts a two-dimensional relationship between the NE and NEII This figure is an
estimation model that occurred in the relationship with an equation of NEII = 119831 - (1013) (NE)
The equation shows the inverse (negative) relationship wherein each addition of a NEIIrsquos value
contributes to a negative value of the NE However the curve also shows that the negative relationship
is not perfectly linear because the relationship line is appeared to be a slight curved shape
4 Discussion
In the span of 3 years (2015-2017) there was a downward trend in the NE along with the increased
NEII of high school science students in all districts in Aceh Province A pattern that emerged in this
period - is low integrity creates high NE scores - is seen very clearly in the pre-CBNE Period
However after the introduction of CBNE the NEII then rose gradually and consequently lowered the
NErsquos score of science students in Aceh Province What revealed as striking patter here is when schools
in a regency have a low x NEII a high x NE score with a small SDNE then it leads to a possibility of
massive and systematic fraudulent practice of the NE at the regencies (seen in Districts 1 and 2 in
2015) This pattern can be modeled as follows
Figure 2 Model of fraudulent practice estimation of national examination
The estimation model of NErsquos fraudulent practice means that an implementation of national
examination might be a fraud when in certain area possesses a low xNEII high xNE and small
xSDNE In this model the main point to indicate the fraudulence is the SDNE However one SDNE
alone in this case cannot be used as a benchmark because the situation also found in 2017 where the
Regency 19 has a low SDNE (09) yet also a high Integration index (100) Looking closer to this
later check to show that all national exams in the regency that was conducted using computer-based
examination (CBNE) So the low national examination standard deviation with a high integrity index
is reasonable due to the number of students taking the national exam which was is relatively small
(220 students)
The gradual increase of NEII value in Aceh Province is undeniably related to the implementation
of CBNE which had to apply in stages to reach the whole region The trend also occurred nationally
where the Ministry found difficulties in equipping all schools with certain facilities to implement
CBNE [14] In the first year of the CBNE nationally initiated in 2015 the province of Aceh has not
yet implemented it The examination in this province only began in the second year (2016) That is
why we found such a striking difference between those years and changed gradually afterward Until
AICMSTE 2019
IOP Conf Series Journal of Physics Conf Series 1460 (2020) 012052
IOP Publishing
doi1010881742-659614601012052
8
2017 of the 645 high schools that hold science classes 368 (57 of) schools had implemented the
CBNE while other 277 schools still carry out the examination based on paper and pencils
Comparing the national examination between the Aceh provincersquos and nationrsquos scores we can see
that the trend of change has also been happening nationally both for science high school students and
other majors as been seen at the table below
Tabel 10 Annual comparison of national examination scores between provincial and national trend
Year x NE of Aceh Province x NE Nationally
All Class Science Class All Class Science Class
20142015 6596 6913 6130 6529
20152016 4914 4972 5479 5685
20162017 4089 4196 5038 5287
Source PuspendikKemdikbud [15]
Referring to the regression analysis results the output interpretations indicate that the integrity of
the national examination has a moderate influence on national examination (with the regression value
of R2 0445) of science students in Aceh Province The relationship between them is linear with the
opposite direction (negative value) meaning that the higher the integrity index of the national
examination the lower the national examination obtained by the students Both conclusions are
consistent with other results found by Dwiatmoko et al [16] With relative similar variables their
study indicates that there was an existence of a systematic pattern to produce identical achievements
(values) in a certain educational evaluation context The unanimous results are also similar to this
result study which however later ldquoleaving crumbsrdquo for us to indicate that there was a systematic
intervention on these achievements (mainly pre-CBNE period) Back to both periods the governments
efforts to obtain the reliability of the national examination with CBNE seemed to have had a
significant impact
5 Conclusions
This research concludes that there are striking differences and gradual changes between the pre-and
post-implementation of the computer-based national examination of high school science students in
the province of Aceh In the span of three years (2015-2017) there was a downward trend of national
examination (NE) along with the implementation of CBNE which reveals through the increased value
of national examination integrity index (NEII) at all regencies in Aceh Province In the pre-CBNE
period a pattern appeared in the form of low xNEII high xNE and low xSDNE The pattern indicates
the existence of a fraudulent practice estimation of a national examination in the regenciescities In
the post-CBNE period the trend and pattern shifted backward (negative direction) wherein the
national examination score was getting smaller along with the increased NEII In addition the
implementation of CBNE - which reveals through the national examination integrity index ndash
moderately influence (with regression value R2 0445) the national examination scores of the high
school science students in Aceh Province The relationship between them is linear with the opposite
direction (negative value) meaning that the higher the Integrity Index of the national examination the
lower the national examination obtained by the student
6 References
[1] Alhadza A and Zulkifli M 2017 National examination and the quality of education in Indonesia
Advances in Social Sciences Research Journal 421 1-12
[2] Saukah A and Cahyono AE 2015 Ujian nasional di Indonesia dan implikasinya terhadap
pembelajaran bahasa inggris Jurnal Penelitian dan Evaluasi Pendidikan 192 244
[3] Miller BL Agnic LE Posick C Gould LA 2015 Cheating around the world a cross-national
analysis of principal reported cheating Journal of Criminal Justice Education 262 10
AICMSTE 2019
IOP Conf Series Journal of Physics Conf Series 1460 (2020) 012052
IOP Publishing
doi1010881742-659614601012052
9
[4] Rahman Y and Ari B 2016 FSGI masih kumpulkan data dan fakta kecurangan UN di seluruh
Indonesia [EBOL] [01-27-2019]
httpskbridnasional042016fsgi_masih_kumpulkan_data_dan_fakta_kecurangan_un_di_s
eluruh_indonesia80100html
[5] Iriani A and Manongga D 2018 Using soft systems methodology as an approach to evaluate
cheating in the national examination Journal of Theoretical and Applied Information
Technology 9611 3345
[6] Andina E 2015 Ujian kejujuran dalam pelaksanaan UN Pusat Pengkajian Pengolahan Data dan
Informasi (P3DI) Sekretariat Jenderal DPR RI Info Singkat Kesejahteraan Sosial 79 10
[7] BPS 2018 Index integritas ujian nasional [EBOL] [01-27-2019]
httpswwwbpsgoidstatictable201708181972indeks-integritas-ujian-nasionalhtml
[8] Puspendik kemdikbud 2018 Meta analisis ndash hasil ujian nasional untuk menyusun kebijakan
dan program [EBOL] [01-27-2019]
httpspuspendikkemdikbudgoidseminaruploadSeminar20Puspendik202015Paparan
_Meta20Analisis20UNpdf
[9] Setiawan Y 2015 IIUN untuk menumbuhkan sikap integritas dari sekolah [EBOL] [01-27-
2019]httpspsmkkemdikbudgoidkonten1373iiun-untuk-menumbuhkan-sikap-
integritas-dari-sekolah
[10] Uly YA 2018 Nilai rata-rata ujian nasional 2018 turun ini 2 biang keladinya [EBOL] [01-27-
2019]httpsnewsokezonecomread20180508651896034nilai-rata-rata-ujian-nasional-
2018-turun-ini-2-biang-keladinya
[11] Harususilo YE 2018 Ini 2 faktor penyebab nilai UN SMA menuruN [EBOL] [01-27-2019]
httpsedukasikompascomread2018050820070771ini-2-faktor-penyebab-nilai-un-sma-
menurun
[12] Mediani M 2018 Nilai UN siswa Jeblok Kemendikbud evaluasi topik ujian [EBOL] [01-27-
2019]httpswwwcnnindonesiacomnasional20180509124612-20-296868nilai-un-siswa-
jeblok-kemendikbud-evaluasi-topik-ujian
[13] Schober P Boer C and Schwarte LA 2018 Correlation coefficients appropriate use and
interpretation Anesthesia amp Analgesia 1265 1765
[14] Retnawati H Hadi S Nugraha AC Arlinwibowo J Sulistyaningsih E Djidu H Apino E Heni
D and Iryanti 2017 Implementing the computer-based national examination in Indonesian
schools The challenges and strategies Problems of Education in the 21st Century 756 613
[15] PuspendikKemdikbud 2019c Perbandingan hasil ujian nasional program studi IPA antar tahun
[EBOL] [01-27-2019]httpspuspendikkemdikbudgoidhasilun
[16] Dwiatmoko A Rosa PHP and Gunawan R 2015 Analisis statistis data nilai ujian nasional dan
nilai sekolah menengah atas di daerah istimewa Yogyakarta Jurnal Ilmiah Widya Teknik
142 1-7
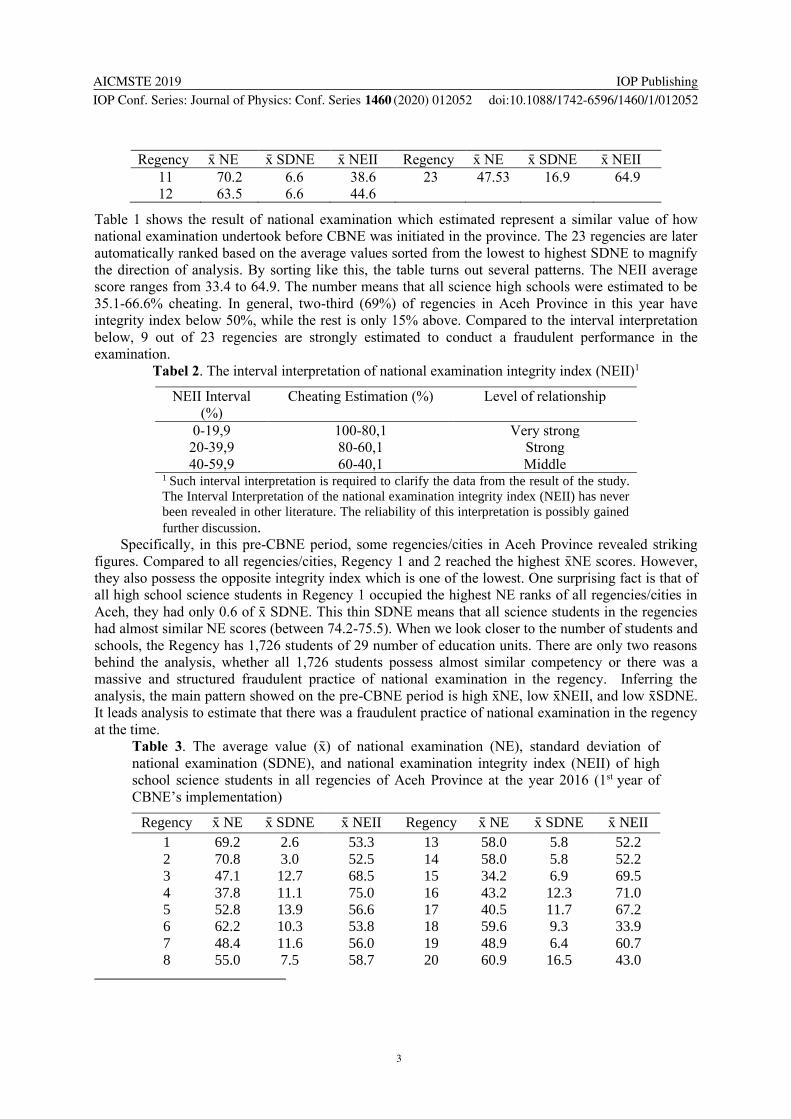
AICMSTE 2019
IOP Conf Series Journal of Physics Conf Series 1460 (2020) 012052
IOP Publishing
doi1010881742-659614601012052
3
Regency x NE x SDNE x NEII Regency x NE x SDNE x NEII
11 702 66 386 23 4753 169 649
12 635 66 446
Table 1 shows the result of national examination which estimated represent a similar value of how
national examination undertook before CBNE was initiated in the province The 23 regencies are later
automatically ranked based on the average values sorted from the lowest to highest SDNE to magnify
the direction of analysis By sorting like this the table turns out several patterns The NEII average
score ranges from 334 to 649 The number means that all science high schools were estimated to be
351-666 cheating In general two-third (69) of regencies in Aceh Province in this year have
integrity index below 50 while the rest is only 15 above Compared to the interval interpretation
below 9 out of 23 regencies are strongly estimated to conduct a fraudulent performance in the
examination
Tabel 2 The interval interpretation of national examination integrity index (NEII)1
NEII Interval
()
Cheating Estimation () Level of relationship
0-199 100-801 Very strong
20-399 80-601 Strong
40-599 60-401 Middle 1 Such interval interpretation is required to clarify the data from the result of the study
The Interval Interpretation of the national examination integrity index (NEII) has never
been revealed in other literature The reliability of this interpretation is possibly gained
further discussion
Specifically in this pre-CBNE period some regenciescities in Aceh Province revealed striking
figures Compared to all regenciescities Regency 1 and 2 reached the highest xNE scores However
they also possess the opposite integrity index which is one of the lowest One surprising fact is that of
all high school science students in Regency 1 occupied the highest NE ranks of all regenciescities in
Aceh they had only 06 of x SDNE This thin SDNE means that all science students in the regencies
had almost similar NE scores (between 742-755) When we look closer to the number of students and
schools the Regency has 1726 students of 29 number of education units There are only two reasons
behind the analysis whether all 1726 students possess almost similar competency or there was a
massive and structured fraudulent practice of national examination in the regency Inferring the
analysis the main pattern showed on the pre-CBNE period is high xNE low xNEII and low xSDNE
It leads analysis to estimate that there was a fraudulent practice of national examination in the regency
at the time
Table 3 The average value (x) of national examination (NE) standard deviation of
national examination (SDNE) and national examination integrity index (NEII) of high
school science students in all regencies of Aceh Province at the year 2016 (1st year of
CBNErsquos implementation)
Regency x NE x SDNE x NEII Regency x NE x SDNE x NEII
1 692 26 533 13 580 58 522
2 708 30 525 14 580 58 522
3 471 127 685 15 342 69 695
4 378 111 750 16 432 123 710
5 528 139 566 17 405 117 672
6 622 103 538 18 596 93 339
7 484 116 560 19 489 64 607
8 550 75 587 20 609 165 430
AICMSTE 2019
IOP Conf Series Journal of Physics Conf Series 1460 (2020) 012052
IOP Publishing
doi1010881742-659614601012052
4
Regency x NE x SDNE x NEII Regency x NE x SDNE x NEII
9 520 161 526 21 417 125 646
10 582 134 486 22 472 146 592
11 469 58 515 23 580 58 522
12 382 105 718
Compared to the previous year there was a change in the value of x NE and x NEII in the first year
of CBNE (2016) In general the value of x NE decreased from 675 to 508 while the x NEII value
increased from 467 to 618 86 of all districts have 50 or above of integrity Index yet only 3
regenciescities that have Integrity below 50 (bold Regencies No10 18 and 20) In contrast to the
previous trend the three regencies above are not too prominent in the average NE scores although still
relatively high
On the closer look Regency 1 and 2 which were highlighted in 2015 reveal slight changes The
pattern observed in the previous year is almost similar in the year after Compared to all regencies
Regency 1 and 2 still ranked as the highest NE score along with the smallest standard deviation These
changes indicate the implementation of CBNE relates to changed values
Table 4 The average value (x) of national examination (NE) the standard deviation of
national examination (SDNE) and national examination integrity index (NEII) of high
school science students in all regencies of Aceh Province at the year 2016 (2nd year of
CBNErsquos implementation)
Regency x NE x SDNE x NEII Regency x NE x SDNE x NEII
1 3439 99 8065 13 569 93 651
2 399 97 738 14 568 93 651
3 378 45 100 15 347 6 829
4 37 68 813 16 421 83 100
5 40 52 100 17 372 67 603
6 362 38 100 18 441 93 73
7 472 126 71 19 413 09 100
8 432 112 735 20 416 68 100
9 411 69 75 21 362 82 799
10 421 98 767 22 403 102 776
11 435 81 634 23 391 72 100
12 349 73 807
In 2017 there were important changes from the previous two years in terms of the average value
of NE and NEII The value of x NE decreased from 675 to 508 and became 412 in the last year
While the value of xNEII increased from 467 to 618 and 893 at last Only 2 out of 23
regenciescities which have an average NE score above 50 The rest range from 347 to 470
Furthermore Regency 1 and 2 which became the main point in 2015 and 2016 maintain the
change In 2017 the values continued to reveal a similar pattern that occurred before the Regency that
ranked the highest NE had the opposite value of integrity In addition to this there were different
patterns from the previous one In the Regency 19 has a perfect level of integrity (100 used CBNE)
but it turns out to reach average NE value with a thin standard deviation (09) almost the same as the
standard deviation of Regency 1 had in 2015
32 Relationship between the national examination integrity Index (NEII) and national examination
(NE) of high school science students in Aceh province
From the background explained above this study assumes that there have been a declined average of
national examination (NE) of science high school students in Aceh Province due to the
implementation of CBNE which appears through the national examination integrity index The second
question of this study is to picture the relationship between the two variables in two ways linear
regression and curve estimation
AICMSTE 2019
IOP Conf Series Journal of Physics Conf Series 1460 (2020) 012052
IOP Publishing
doi1010881742-659614601012052
5
The linear regression was run through several steps First a normality test was applied to determine
whether the relationship follows a normal Gaussian distribution or not The normality test of
Kolmogorov-Smirnov (the KZS value of the NEII variable) shows 0812 while the NE variable is
1173 Both are higher than 005 So it can be concluded that the two variables are assumed to be
normally distributed and parametric procedures can be applied
Second the coefficient of determination test was used to show how much the independent variable
can explain the dependent variable The higher coefficient determination value means the stronger
ability of the independent variable to explain variations in changes of the dependent variable To
analyze the influence of the NEII on the NE linear regression is used to prove that there are influences
between the two variables
Table 5 Model Summary
Model R R Square
Adjusted R
Square
Std Error of the
Estimate
1 667a 445 436 1534545
aPredictors (Constant) NE
The table explains the regression relationship between the dependent variable (NEII) and the
independent (NE) The influence relationship of NEII toward NE ranged from 0436 (smallest) to
0667 (largest) If we take the middle regression value (R2) then the value of regression (R) is equal to
0445 This means that NEII variable contributes a 445 effect on NE variables However the
number may still contain disturbing values that might cause errors of counts So the most countable
value of relationship shows on adjusted R2 value (0436) It means that the relationship between NEII
and NE is counted to be at least 436 with 847 of accuracy (due to the estimated standard error
value that is 15345) To interpret the strength of the relationship from both variables such an
interpretation of coefficient intervals shows in table 6 below
Table 6 Interval Coefficient Interpretation
Interval coefficient Level relationships
000-010 Very low (negligible)
010-039 Low
040-069 Middle
070-089 Strong
000-100 Very strong
Source Schober P Boer C and Schwarte LA [13]
Based on the Interval coefficient interpretation the determination of the national examination
integrity index on the national examination of science students in the Aceh Province ranges in the
category of middle relationship
Third the test of linearity was used to measure how much the integrity of the national examination
(NEII) influences the national examination (NE) scores Table 7 shows the coefficient as follows
Table 7 Coefficients a
Model
Unstandardized Coefficients
Standardized
Coefficients
t Sig
Collinearity Statistics
B Std Error Beta Tolerance VIF
1 (Constant) 119831 7582 15805 000
NE -1013 138 -667 -7324 000 1000 1000 aDependent Variable NEII
The coefficient table shows that the value of sig lt005 which means that the regression model is
linear The table also shows the negative direction of the regression on the Beta coefficient (both
AICMSTE 2019
IOP Conf Series Journal of Physics Conf Series 1460 (2020) 012052
IOP Publishing
doi1010881742-659614601012052
6
standard and non-standard) meaning that the higher the NEII value the lower (opposite) the NE score
would be The constant value of 119831 indicates that if there is no NEII then the NE value is
119831 The regression coefficient X is -1013 refers to every addition of 1 NEII value the NE value
increases by -1013 Referring to the regression coefficient analysis the regression equation obtained
is NEII = 119831 - (1013) (NE) Furthermore the t value = -7324 with a significance value of 0001
lt005 means that there is a significant influence between the NEII variables on the NE variable
The last linear regression stage of this method is the use of Product Moment-Pearson Correlation to
determine the degree of closeness of the relationship between two variables the Pearson correlation
was computed using SPSS at the table below
Table 8 Correlations
NEII NE
NEII Pearson Correlation 1 -667
Sig (2-tailed) 000
N 69 69
NE Pearson Correlation -667 1
Sig (2-tailed) 000
N 69 69 Correlation is significant at the 001 level (2-tailed)
The output shows the correlation analysis between NEII and NE with Pearson correlation value is
1 Such criteria lead to the relationship between both variables to be very strong Moreover the SPSS
analysis also shows a significant correlation at the level of 001 Meaning that there is a 999
influence of NEII variable on the NE variable
Besides the linear regression test curve estimation was also applied to get the second picture of the
relationship between NEII and NE variables Parameter estimation from SPSS was firstly gauged to
show the most suitable model for the relationship between NEII and NE in the form of the curve
Table 9 Model Summary and Parameter Estimates
Dependent VariableNEII
Equation
Model Summary Parameter Estimates
R Square F df1 df2 Sig Constant b1 b2 b3
Linear 445 53646 1 67 000 119831 -1013
Logarithmic 445 53659 1 67 000 276003 -53286
Inverse 434 51369 1 67 000 12786 2652796
Quadratic 447 26701 2 66 000 141293 -1850 008
Cubic 448 26788 2 66 000 136342 -1502 000 5303E-5
Compound 453 55447 1 67 000 147909 984
The independent variable is NE
Table 9 shows that each model has the least difference in the R Square value compared to others
Among the six estimated patterns the equation value of the compound model is the highest (0453)
This means that this model will give 453 an idea of the effectiveness of estimates So that the
estimation influences of NEII on NE is illustrated in the curve pattern below
AICMSTE 2019
IOP Conf Series Journal of Physics Conf Series 1460 (2020) 012052
IOP Publishing
doi1010881742-659614601012052
7
Figure 1 Curve Estimation Model of Relationship between NEII and NE
Figure 1 depicts a two-dimensional relationship between the NE and NEII This figure is an
estimation model that occurred in the relationship with an equation of NEII = 119831 - (1013) (NE)
The equation shows the inverse (negative) relationship wherein each addition of a NEIIrsquos value
contributes to a negative value of the NE However the curve also shows that the negative relationship
is not perfectly linear because the relationship line is appeared to be a slight curved shape
4 Discussion
In the span of 3 years (2015-2017) there was a downward trend in the NE along with the increased
NEII of high school science students in all districts in Aceh Province A pattern that emerged in this
period - is low integrity creates high NE scores - is seen very clearly in the pre-CBNE Period
However after the introduction of CBNE the NEII then rose gradually and consequently lowered the
NErsquos score of science students in Aceh Province What revealed as striking patter here is when schools
in a regency have a low x NEII a high x NE score with a small SDNE then it leads to a possibility of
massive and systematic fraudulent practice of the NE at the regencies (seen in Districts 1 and 2 in
2015) This pattern can be modeled as follows
Figure 2 Model of fraudulent practice estimation of national examination
The estimation model of NErsquos fraudulent practice means that an implementation of national
examination might be a fraud when in certain area possesses a low xNEII high xNE and small
xSDNE In this model the main point to indicate the fraudulence is the SDNE However one SDNE
alone in this case cannot be used as a benchmark because the situation also found in 2017 where the
Regency 19 has a low SDNE (09) yet also a high Integration index (100) Looking closer to this
later check to show that all national exams in the regency that was conducted using computer-based
examination (CBNE) So the low national examination standard deviation with a high integrity index
is reasonable due to the number of students taking the national exam which was is relatively small
(220 students)
The gradual increase of NEII value in Aceh Province is undeniably related to the implementation
of CBNE which had to apply in stages to reach the whole region The trend also occurred nationally
where the Ministry found difficulties in equipping all schools with certain facilities to implement
CBNE [14] In the first year of the CBNE nationally initiated in 2015 the province of Aceh has not
yet implemented it The examination in this province only began in the second year (2016) That is
why we found such a striking difference between those years and changed gradually afterward Until
AICMSTE 2019
IOP Conf Series Journal of Physics Conf Series 1460 (2020) 012052
IOP Publishing
doi1010881742-659614601012052
8
2017 of the 645 high schools that hold science classes 368 (57 of) schools had implemented the
CBNE while other 277 schools still carry out the examination based on paper and pencils
Comparing the national examination between the Aceh provincersquos and nationrsquos scores we can see
that the trend of change has also been happening nationally both for science high school students and
other majors as been seen at the table below
Tabel 10 Annual comparison of national examination scores between provincial and national trend
Year x NE of Aceh Province x NE Nationally
All Class Science Class All Class Science Class
20142015 6596 6913 6130 6529
20152016 4914 4972 5479 5685
20162017 4089 4196 5038 5287
Source PuspendikKemdikbud [15]
Referring to the regression analysis results the output interpretations indicate that the integrity of
the national examination has a moderate influence on national examination (with the regression value
of R2 0445) of science students in Aceh Province The relationship between them is linear with the
opposite direction (negative value) meaning that the higher the integrity index of the national
examination the lower the national examination obtained by the students Both conclusions are
consistent with other results found by Dwiatmoko et al [16] With relative similar variables their
study indicates that there was an existence of a systematic pattern to produce identical achievements
(values) in a certain educational evaluation context The unanimous results are also similar to this
result study which however later ldquoleaving crumbsrdquo for us to indicate that there was a systematic
intervention on these achievements (mainly pre-CBNE period) Back to both periods the governments
efforts to obtain the reliability of the national examination with CBNE seemed to have had a
significant impact
5 Conclusions
This research concludes that there are striking differences and gradual changes between the pre-and
post-implementation of the computer-based national examination of high school science students in
the province of Aceh In the span of three years (2015-2017) there was a downward trend of national
examination (NE) along with the implementation of CBNE which reveals through the increased value
of national examination integrity index (NEII) at all regencies in Aceh Province In the pre-CBNE
period a pattern appeared in the form of low xNEII high xNE and low xSDNE The pattern indicates
the existence of a fraudulent practice estimation of a national examination in the regenciescities In
the post-CBNE period the trend and pattern shifted backward (negative direction) wherein the
national examination score was getting smaller along with the increased NEII In addition the
implementation of CBNE - which reveals through the national examination integrity index ndash
moderately influence (with regression value R2 0445) the national examination scores of the high
school science students in Aceh Province The relationship between them is linear with the opposite
direction (negative value) meaning that the higher the Integrity Index of the national examination the
lower the national examination obtained by the student
6 References
[1] Alhadza A and Zulkifli M 2017 National examination and the quality of education in Indonesia
Advances in Social Sciences Research Journal 421 1-12
[2] Saukah A and Cahyono AE 2015 Ujian nasional di Indonesia dan implikasinya terhadap
pembelajaran bahasa inggris Jurnal Penelitian dan Evaluasi Pendidikan 192 244
[3] Miller BL Agnic LE Posick C Gould LA 2015 Cheating around the world a cross-national
analysis of principal reported cheating Journal of Criminal Justice Education 262 10
AICMSTE 2019
IOP Conf Series Journal of Physics Conf Series 1460 (2020) 012052
IOP Publishing
doi1010881742-659614601012052
9
[4] Rahman Y and Ari B 2016 FSGI masih kumpulkan data dan fakta kecurangan UN di seluruh
Indonesia [EBOL] [01-27-2019]
httpskbridnasional042016fsgi_masih_kumpulkan_data_dan_fakta_kecurangan_un_di_s
eluruh_indonesia80100html
[5] Iriani A and Manongga D 2018 Using soft systems methodology as an approach to evaluate
cheating in the national examination Journal of Theoretical and Applied Information
Technology 9611 3345
[6] Andina E 2015 Ujian kejujuran dalam pelaksanaan UN Pusat Pengkajian Pengolahan Data dan
Informasi (P3DI) Sekretariat Jenderal DPR RI Info Singkat Kesejahteraan Sosial 79 10
[7] BPS 2018 Index integritas ujian nasional [EBOL] [01-27-2019]
httpswwwbpsgoidstatictable201708181972indeks-integritas-ujian-nasionalhtml
[8] Puspendik kemdikbud 2018 Meta analisis ndash hasil ujian nasional untuk menyusun kebijakan
dan program [EBOL] [01-27-2019]
httpspuspendikkemdikbudgoidseminaruploadSeminar20Puspendik202015Paparan
_Meta20Analisis20UNpdf
[9] Setiawan Y 2015 IIUN untuk menumbuhkan sikap integritas dari sekolah [EBOL] [01-27-
2019]httpspsmkkemdikbudgoidkonten1373iiun-untuk-menumbuhkan-sikap-
integritas-dari-sekolah
[10] Uly YA 2018 Nilai rata-rata ujian nasional 2018 turun ini 2 biang keladinya [EBOL] [01-27-
2019]httpsnewsokezonecomread20180508651896034nilai-rata-rata-ujian-nasional-
2018-turun-ini-2-biang-keladinya
[11] Harususilo YE 2018 Ini 2 faktor penyebab nilai UN SMA menuruN [EBOL] [01-27-2019]
httpsedukasikompascomread2018050820070771ini-2-faktor-penyebab-nilai-un-sma-
menurun
[12] Mediani M 2018 Nilai UN siswa Jeblok Kemendikbud evaluasi topik ujian [EBOL] [01-27-
2019]httpswwwcnnindonesiacomnasional20180509124612-20-296868nilai-un-siswa-
jeblok-kemendikbud-evaluasi-topik-ujian
[13] Schober P Boer C and Schwarte LA 2018 Correlation coefficients appropriate use and
interpretation Anesthesia amp Analgesia 1265 1765
[14] Retnawati H Hadi S Nugraha AC Arlinwibowo J Sulistyaningsih E Djidu H Apino E Heni
D and Iryanti 2017 Implementing the computer-based national examination in Indonesian
schools The challenges and strategies Problems of Education in the 21st Century 756 613
[15] PuspendikKemdikbud 2019c Perbandingan hasil ujian nasional program studi IPA antar tahun
[EBOL] [01-27-2019]httpspuspendikkemdikbudgoidhasilun
[16] Dwiatmoko A Rosa PHP and Gunawan R 2015 Analisis statistis data nilai ujian nasional dan
nilai sekolah menengah atas di daerah istimewa Yogyakarta Jurnal Ilmiah Widya Teknik
142 1-7
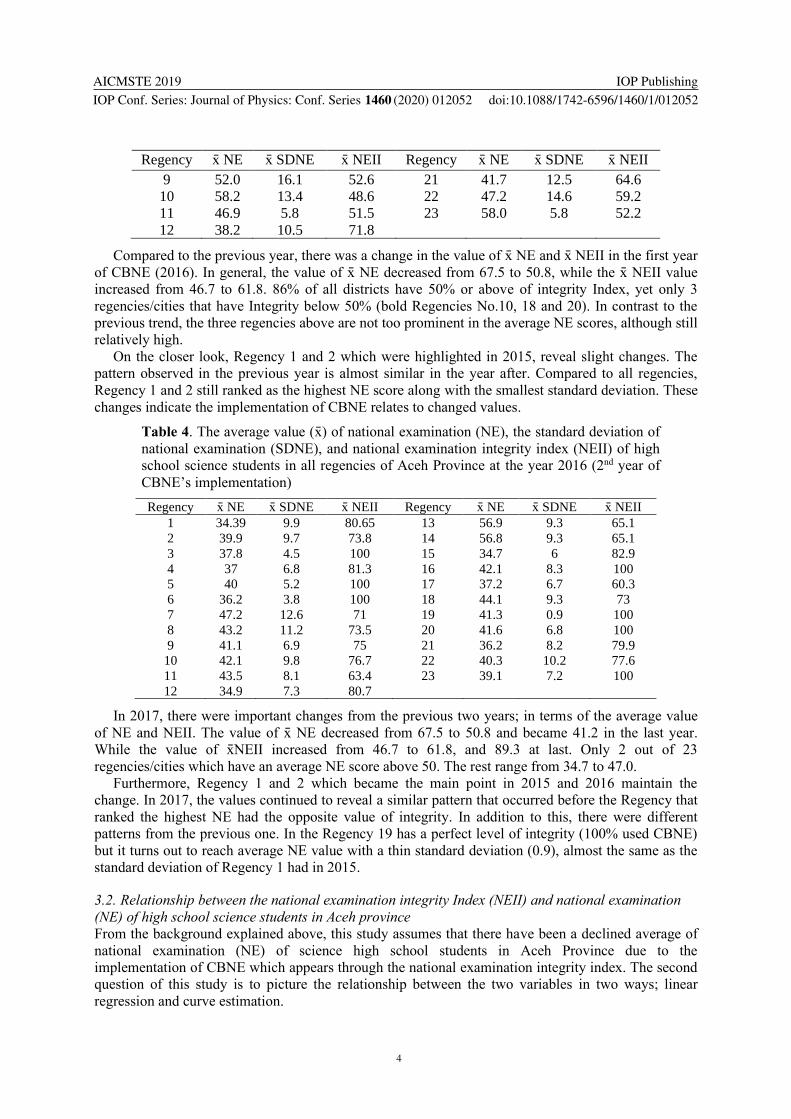
AICMSTE 2019
IOP Conf Series Journal of Physics Conf Series 1460 (2020) 012052
IOP Publishing
doi1010881742-659614601012052
4
Regency x NE x SDNE x NEII Regency x NE x SDNE x NEII
9 520 161 526 21 417 125 646
10 582 134 486 22 472 146 592
11 469 58 515 23 580 58 522
12 382 105 718
Compared to the previous year there was a change in the value of x NE and x NEII in the first year
of CBNE (2016) In general the value of x NE decreased from 675 to 508 while the x NEII value
increased from 467 to 618 86 of all districts have 50 or above of integrity Index yet only 3
regenciescities that have Integrity below 50 (bold Regencies No10 18 and 20) In contrast to the
previous trend the three regencies above are not too prominent in the average NE scores although still
relatively high
On the closer look Regency 1 and 2 which were highlighted in 2015 reveal slight changes The
pattern observed in the previous year is almost similar in the year after Compared to all regencies
Regency 1 and 2 still ranked as the highest NE score along with the smallest standard deviation These
changes indicate the implementation of CBNE relates to changed values
Table 4 The average value (x) of national examination (NE) the standard deviation of
national examination (SDNE) and national examination integrity index (NEII) of high
school science students in all regencies of Aceh Province at the year 2016 (2nd year of
CBNErsquos implementation)
Regency x NE x SDNE x NEII Regency x NE x SDNE x NEII
1 3439 99 8065 13 569 93 651
2 399 97 738 14 568 93 651
3 378 45 100 15 347 6 829
4 37 68 813 16 421 83 100
5 40 52 100 17 372 67 603
6 362 38 100 18 441 93 73
7 472 126 71 19 413 09 100
8 432 112 735 20 416 68 100
9 411 69 75 21 362 82 799
10 421 98 767 22 403 102 776
11 435 81 634 23 391 72 100
12 349 73 807
In 2017 there were important changes from the previous two years in terms of the average value
of NE and NEII The value of x NE decreased from 675 to 508 and became 412 in the last year
While the value of xNEII increased from 467 to 618 and 893 at last Only 2 out of 23
regenciescities which have an average NE score above 50 The rest range from 347 to 470
Furthermore Regency 1 and 2 which became the main point in 2015 and 2016 maintain the
change In 2017 the values continued to reveal a similar pattern that occurred before the Regency that
ranked the highest NE had the opposite value of integrity In addition to this there were different
patterns from the previous one In the Regency 19 has a perfect level of integrity (100 used CBNE)
but it turns out to reach average NE value with a thin standard deviation (09) almost the same as the
standard deviation of Regency 1 had in 2015
32 Relationship between the national examination integrity Index (NEII) and national examination
(NE) of high school science students in Aceh province
From the background explained above this study assumes that there have been a declined average of
national examination (NE) of science high school students in Aceh Province due to the
implementation of CBNE which appears through the national examination integrity index The second
question of this study is to picture the relationship between the two variables in two ways linear
regression and curve estimation
AICMSTE 2019
IOP Conf Series Journal of Physics Conf Series 1460 (2020) 012052
IOP Publishing
doi1010881742-659614601012052
5
The linear regression was run through several steps First a normality test was applied to determine
whether the relationship follows a normal Gaussian distribution or not The normality test of
Kolmogorov-Smirnov (the KZS value of the NEII variable) shows 0812 while the NE variable is
1173 Both are higher than 005 So it can be concluded that the two variables are assumed to be
normally distributed and parametric procedures can be applied
Second the coefficient of determination test was used to show how much the independent variable
can explain the dependent variable The higher coefficient determination value means the stronger
ability of the independent variable to explain variations in changes of the dependent variable To
analyze the influence of the NEII on the NE linear regression is used to prove that there are influences
between the two variables
Table 5 Model Summary
Model R R Square
Adjusted R
Square
Std Error of the
Estimate
1 667a 445 436 1534545
aPredictors (Constant) NE
The table explains the regression relationship between the dependent variable (NEII) and the
independent (NE) The influence relationship of NEII toward NE ranged from 0436 (smallest) to
0667 (largest) If we take the middle regression value (R2) then the value of regression (R) is equal to
0445 This means that NEII variable contributes a 445 effect on NE variables However the
number may still contain disturbing values that might cause errors of counts So the most countable
value of relationship shows on adjusted R2 value (0436) It means that the relationship between NEII
and NE is counted to be at least 436 with 847 of accuracy (due to the estimated standard error
value that is 15345) To interpret the strength of the relationship from both variables such an
interpretation of coefficient intervals shows in table 6 below
Table 6 Interval Coefficient Interpretation
Interval coefficient Level relationships
000-010 Very low (negligible)
010-039 Low
040-069 Middle
070-089 Strong
000-100 Very strong
Source Schober P Boer C and Schwarte LA [13]
Based on the Interval coefficient interpretation the determination of the national examination
integrity index on the national examination of science students in the Aceh Province ranges in the
category of middle relationship
Third the test of linearity was used to measure how much the integrity of the national examination
(NEII) influences the national examination (NE) scores Table 7 shows the coefficient as follows
Table 7 Coefficients a
Model
Unstandardized Coefficients
Standardized
Coefficients
t Sig
Collinearity Statistics
B Std Error Beta Tolerance VIF
1 (Constant) 119831 7582 15805 000
NE -1013 138 -667 -7324 000 1000 1000 aDependent Variable NEII
The coefficient table shows that the value of sig lt005 which means that the regression model is
linear The table also shows the negative direction of the regression on the Beta coefficient (both
AICMSTE 2019
IOP Conf Series Journal of Physics Conf Series 1460 (2020) 012052
IOP Publishing
doi1010881742-659614601012052
6
standard and non-standard) meaning that the higher the NEII value the lower (opposite) the NE score
would be The constant value of 119831 indicates that if there is no NEII then the NE value is
119831 The regression coefficient X is -1013 refers to every addition of 1 NEII value the NE value
increases by -1013 Referring to the regression coefficient analysis the regression equation obtained
is NEII = 119831 - (1013) (NE) Furthermore the t value = -7324 with a significance value of 0001
lt005 means that there is a significant influence between the NEII variables on the NE variable
The last linear regression stage of this method is the use of Product Moment-Pearson Correlation to
determine the degree of closeness of the relationship between two variables the Pearson correlation
was computed using SPSS at the table below
Table 8 Correlations
NEII NE
NEII Pearson Correlation 1 -667
Sig (2-tailed) 000
N 69 69
NE Pearson Correlation -667 1
Sig (2-tailed) 000
N 69 69 Correlation is significant at the 001 level (2-tailed)
The output shows the correlation analysis between NEII and NE with Pearson correlation value is
1 Such criteria lead to the relationship between both variables to be very strong Moreover the SPSS
analysis also shows a significant correlation at the level of 001 Meaning that there is a 999
influence of NEII variable on the NE variable
Besides the linear regression test curve estimation was also applied to get the second picture of the
relationship between NEII and NE variables Parameter estimation from SPSS was firstly gauged to
show the most suitable model for the relationship between NEII and NE in the form of the curve
Table 9 Model Summary and Parameter Estimates
Dependent VariableNEII
Equation
Model Summary Parameter Estimates
R Square F df1 df2 Sig Constant b1 b2 b3
Linear 445 53646 1 67 000 119831 -1013
Logarithmic 445 53659 1 67 000 276003 -53286
Inverse 434 51369 1 67 000 12786 2652796
Quadratic 447 26701 2 66 000 141293 -1850 008
Cubic 448 26788 2 66 000 136342 -1502 000 5303E-5
Compound 453 55447 1 67 000 147909 984
The independent variable is NE
Table 9 shows that each model has the least difference in the R Square value compared to others
Among the six estimated patterns the equation value of the compound model is the highest (0453)
This means that this model will give 453 an idea of the effectiveness of estimates So that the
estimation influences of NEII on NE is illustrated in the curve pattern below
AICMSTE 2019
IOP Conf Series Journal of Physics Conf Series 1460 (2020) 012052
IOP Publishing
doi1010881742-659614601012052
7
Figure 1 Curve Estimation Model of Relationship between NEII and NE
Figure 1 depicts a two-dimensional relationship between the NE and NEII This figure is an
estimation model that occurred in the relationship with an equation of NEII = 119831 - (1013) (NE)
The equation shows the inverse (negative) relationship wherein each addition of a NEIIrsquos value
contributes to a negative value of the NE However the curve also shows that the negative relationship
is not perfectly linear because the relationship line is appeared to be a slight curved shape
4 Discussion
In the span of 3 years (2015-2017) there was a downward trend in the NE along with the increased
NEII of high school science students in all districts in Aceh Province A pattern that emerged in this
period - is low integrity creates high NE scores - is seen very clearly in the pre-CBNE Period
However after the introduction of CBNE the NEII then rose gradually and consequently lowered the
NErsquos score of science students in Aceh Province What revealed as striking patter here is when schools
in a regency have a low x NEII a high x NE score with a small SDNE then it leads to a possibility of
massive and systematic fraudulent practice of the NE at the regencies (seen in Districts 1 and 2 in
2015) This pattern can be modeled as follows
Figure 2 Model of fraudulent practice estimation of national examination
The estimation model of NErsquos fraudulent practice means that an implementation of national
examination might be a fraud when in certain area possesses a low xNEII high xNE and small
xSDNE In this model the main point to indicate the fraudulence is the SDNE However one SDNE
alone in this case cannot be used as a benchmark because the situation also found in 2017 where the
Regency 19 has a low SDNE (09) yet also a high Integration index (100) Looking closer to this
later check to show that all national exams in the regency that was conducted using computer-based
examination (CBNE) So the low national examination standard deviation with a high integrity index
is reasonable due to the number of students taking the national exam which was is relatively small
(220 students)
The gradual increase of NEII value in Aceh Province is undeniably related to the implementation
of CBNE which had to apply in stages to reach the whole region The trend also occurred nationally
where the Ministry found difficulties in equipping all schools with certain facilities to implement
CBNE [14] In the first year of the CBNE nationally initiated in 2015 the province of Aceh has not
yet implemented it The examination in this province only began in the second year (2016) That is
why we found such a striking difference between those years and changed gradually afterward Until
AICMSTE 2019
IOP Conf Series Journal of Physics Conf Series 1460 (2020) 012052
IOP Publishing
doi1010881742-659614601012052
8
2017 of the 645 high schools that hold science classes 368 (57 of) schools had implemented the
CBNE while other 277 schools still carry out the examination based on paper and pencils
Comparing the national examination between the Aceh provincersquos and nationrsquos scores we can see
that the trend of change has also been happening nationally both for science high school students and
other majors as been seen at the table below
Tabel 10 Annual comparison of national examination scores between provincial and national trend
Year x NE of Aceh Province x NE Nationally
All Class Science Class All Class Science Class
20142015 6596 6913 6130 6529
20152016 4914 4972 5479 5685
20162017 4089 4196 5038 5287
Source PuspendikKemdikbud [15]
Referring to the regression analysis results the output interpretations indicate that the integrity of
the national examination has a moderate influence on national examination (with the regression value
of R2 0445) of science students in Aceh Province The relationship between them is linear with the
opposite direction (negative value) meaning that the higher the integrity index of the national
examination the lower the national examination obtained by the students Both conclusions are
consistent with other results found by Dwiatmoko et al [16] With relative similar variables their
study indicates that there was an existence of a systematic pattern to produce identical achievements
(values) in a certain educational evaluation context The unanimous results are also similar to this
result study which however later ldquoleaving crumbsrdquo for us to indicate that there was a systematic
intervention on these achievements (mainly pre-CBNE period) Back to both periods the governments
efforts to obtain the reliability of the national examination with CBNE seemed to have had a
significant impact
5 Conclusions
This research concludes that there are striking differences and gradual changes between the pre-and
post-implementation of the computer-based national examination of high school science students in
the province of Aceh In the span of three years (2015-2017) there was a downward trend of national
examination (NE) along with the implementation of CBNE which reveals through the increased value
of national examination integrity index (NEII) at all regencies in Aceh Province In the pre-CBNE
period a pattern appeared in the form of low xNEII high xNE and low xSDNE The pattern indicates
the existence of a fraudulent practice estimation of a national examination in the regenciescities In
the post-CBNE period the trend and pattern shifted backward (negative direction) wherein the
national examination score was getting smaller along with the increased NEII In addition the
implementation of CBNE - which reveals through the national examination integrity index ndash
moderately influence (with regression value R2 0445) the national examination scores of the high
school science students in Aceh Province The relationship between them is linear with the opposite
direction (negative value) meaning that the higher the Integrity Index of the national examination the
lower the national examination obtained by the student
6 References
[1] Alhadza A and Zulkifli M 2017 National examination and the quality of education in Indonesia
Advances in Social Sciences Research Journal 421 1-12
[2] Saukah A and Cahyono AE 2015 Ujian nasional di Indonesia dan implikasinya terhadap
pembelajaran bahasa inggris Jurnal Penelitian dan Evaluasi Pendidikan 192 244
[3] Miller BL Agnic LE Posick C Gould LA 2015 Cheating around the world a cross-national
analysis of principal reported cheating Journal of Criminal Justice Education 262 10
AICMSTE 2019
IOP Conf Series Journal of Physics Conf Series 1460 (2020) 012052
IOP Publishing
doi1010881742-659614601012052
9
[4] Rahman Y and Ari B 2016 FSGI masih kumpulkan data dan fakta kecurangan UN di seluruh
Indonesia [EBOL] [01-27-2019]
httpskbridnasional042016fsgi_masih_kumpulkan_data_dan_fakta_kecurangan_un_di_s
eluruh_indonesia80100html
[5] Iriani A and Manongga D 2018 Using soft systems methodology as an approach to evaluate
cheating in the national examination Journal of Theoretical and Applied Information
Technology 9611 3345
[6] Andina E 2015 Ujian kejujuran dalam pelaksanaan UN Pusat Pengkajian Pengolahan Data dan
Informasi (P3DI) Sekretariat Jenderal DPR RI Info Singkat Kesejahteraan Sosial 79 10
[7] BPS 2018 Index integritas ujian nasional [EBOL] [01-27-2019]
httpswwwbpsgoidstatictable201708181972indeks-integritas-ujian-nasionalhtml
[8] Puspendik kemdikbud 2018 Meta analisis ndash hasil ujian nasional untuk menyusun kebijakan
dan program [EBOL] [01-27-2019]
httpspuspendikkemdikbudgoidseminaruploadSeminar20Puspendik202015Paparan
_Meta20Analisis20UNpdf
[9] Setiawan Y 2015 IIUN untuk menumbuhkan sikap integritas dari sekolah [EBOL] [01-27-
2019]httpspsmkkemdikbudgoidkonten1373iiun-untuk-menumbuhkan-sikap-
integritas-dari-sekolah
[10] Uly YA 2018 Nilai rata-rata ujian nasional 2018 turun ini 2 biang keladinya [EBOL] [01-27-
2019]httpsnewsokezonecomread20180508651896034nilai-rata-rata-ujian-nasional-
2018-turun-ini-2-biang-keladinya
[11] Harususilo YE 2018 Ini 2 faktor penyebab nilai UN SMA menuruN [EBOL] [01-27-2019]
httpsedukasikompascomread2018050820070771ini-2-faktor-penyebab-nilai-un-sma-
menurun
[12] Mediani M 2018 Nilai UN siswa Jeblok Kemendikbud evaluasi topik ujian [EBOL] [01-27-
2019]httpswwwcnnindonesiacomnasional20180509124612-20-296868nilai-un-siswa-
jeblok-kemendikbud-evaluasi-topik-ujian
[13] Schober P Boer C and Schwarte LA 2018 Correlation coefficients appropriate use and
interpretation Anesthesia amp Analgesia 1265 1765
[14] Retnawati H Hadi S Nugraha AC Arlinwibowo J Sulistyaningsih E Djidu H Apino E Heni
D and Iryanti 2017 Implementing the computer-based national examination in Indonesian
schools The challenges and strategies Problems of Education in the 21st Century 756 613
[15] PuspendikKemdikbud 2019c Perbandingan hasil ujian nasional program studi IPA antar tahun
[EBOL] [01-27-2019]httpspuspendikkemdikbudgoidhasilun
[16] Dwiatmoko A Rosa PHP and Gunawan R 2015 Analisis statistis data nilai ujian nasional dan
nilai sekolah menengah atas di daerah istimewa Yogyakarta Jurnal Ilmiah Widya Teknik
142 1-7
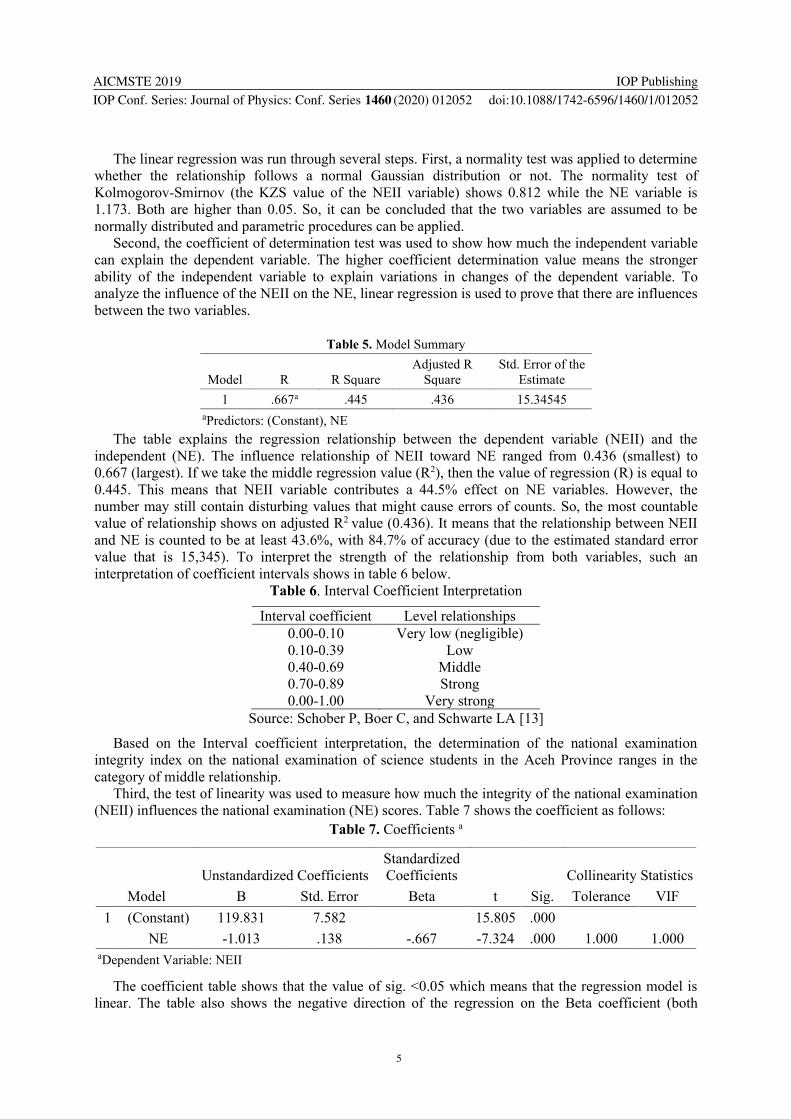
AICMSTE 2019
IOP Conf Series Journal of Physics Conf Series 1460 (2020) 012052
IOP Publishing
doi1010881742-659614601012052
5
The linear regression was run through several steps First a normality test was applied to determine
whether the relationship follows a normal Gaussian distribution or not The normality test of
Kolmogorov-Smirnov (the KZS value of the NEII variable) shows 0812 while the NE variable is
1173 Both are higher than 005 So it can be concluded that the two variables are assumed to be
normally distributed and parametric procedures can be applied
Second the coefficient of determination test was used to show how much the independent variable
can explain the dependent variable The higher coefficient determination value means the stronger
ability of the independent variable to explain variations in changes of the dependent variable To
analyze the influence of the NEII on the NE linear regression is used to prove that there are influences
between the two variables
Table 5 Model Summary
Model R R Square
Adjusted R
Square
Std Error of the
Estimate
1 667a 445 436 1534545
aPredictors (Constant) NE
The table explains the regression relationship between the dependent variable (NEII) and the
independent (NE) The influence relationship of NEII toward NE ranged from 0436 (smallest) to
0667 (largest) If we take the middle regression value (R2) then the value of regression (R) is equal to
0445 This means that NEII variable contributes a 445 effect on NE variables However the
number may still contain disturbing values that might cause errors of counts So the most countable
value of relationship shows on adjusted R2 value (0436) It means that the relationship between NEII
and NE is counted to be at least 436 with 847 of accuracy (due to the estimated standard error
value that is 15345) To interpret the strength of the relationship from both variables such an
interpretation of coefficient intervals shows in table 6 below
Table 6 Interval Coefficient Interpretation
Interval coefficient Level relationships
000-010 Very low (negligible)
010-039 Low
040-069 Middle
070-089 Strong
000-100 Very strong
Source Schober P Boer C and Schwarte LA [13]
Based on the Interval coefficient interpretation the determination of the national examination
integrity index on the national examination of science students in the Aceh Province ranges in the
category of middle relationship
Third the test of linearity was used to measure how much the integrity of the national examination
(NEII) influences the national examination (NE) scores Table 7 shows the coefficient as follows
Table 7 Coefficients a
Model
Unstandardized Coefficients
Standardized
Coefficients
t Sig
Collinearity Statistics
B Std Error Beta Tolerance VIF
1 (Constant) 119831 7582 15805 000
NE -1013 138 -667 -7324 000 1000 1000 aDependent Variable NEII
The coefficient table shows that the value of sig lt005 which means that the regression model is
linear The table also shows the negative direction of the regression on the Beta coefficient (both
AICMSTE 2019
IOP Conf Series Journal of Physics Conf Series 1460 (2020) 012052
IOP Publishing
doi1010881742-659614601012052
6
standard and non-standard) meaning that the higher the NEII value the lower (opposite) the NE score
would be The constant value of 119831 indicates that if there is no NEII then the NE value is
119831 The regression coefficient X is -1013 refers to every addition of 1 NEII value the NE value
increases by -1013 Referring to the regression coefficient analysis the regression equation obtained
is NEII = 119831 - (1013) (NE) Furthermore the t value = -7324 with a significance value of 0001
lt005 means that there is a significant influence between the NEII variables on the NE variable
The last linear regression stage of this method is the use of Product Moment-Pearson Correlation to
determine the degree of closeness of the relationship between two variables the Pearson correlation
was computed using SPSS at the table below
Table 8 Correlations
NEII NE
NEII Pearson Correlation 1 -667
Sig (2-tailed) 000
N 69 69
NE Pearson Correlation -667 1
Sig (2-tailed) 000
N 69 69 Correlation is significant at the 001 level (2-tailed)
The output shows the correlation analysis between NEII and NE with Pearson correlation value is
1 Such criteria lead to the relationship between both variables to be very strong Moreover the SPSS
analysis also shows a significant correlation at the level of 001 Meaning that there is a 999
influence of NEII variable on the NE variable
Besides the linear regression test curve estimation was also applied to get the second picture of the
relationship between NEII and NE variables Parameter estimation from SPSS was firstly gauged to
show the most suitable model for the relationship between NEII and NE in the form of the curve
Table 9 Model Summary and Parameter Estimates
Dependent VariableNEII
Equation
Model Summary Parameter Estimates
R Square F df1 df2 Sig Constant b1 b2 b3
Linear 445 53646 1 67 000 119831 -1013
Logarithmic 445 53659 1 67 000 276003 -53286
Inverse 434 51369 1 67 000 12786 2652796
Quadratic 447 26701 2 66 000 141293 -1850 008
Cubic 448 26788 2 66 000 136342 -1502 000 5303E-5
Compound 453 55447 1 67 000 147909 984
The independent variable is NE
Table 9 shows that each model has the least difference in the R Square value compared to others
Among the six estimated patterns the equation value of the compound model is the highest (0453)
This means that this model will give 453 an idea of the effectiveness of estimates So that the
estimation influences of NEII on NE is illustrated in the curve pattern below
AICMSTE 2019
IOP Conf Series Journal of Physics Conf Series 1460 (2020) 012052
IOP Publishing
doi1010881742-659614601012052
7
Figure 1 Curve Estimation Model of Relationship between NEII and NE
Figure 1 depicts a two-dimensional relationship between the NE and NEII This figure is an
estimation model that occurred in the relationship with an equation of NEII = 119831 - (1013) (NE)
The equation shows the inverse (negative) relationship wherein each addition of a NEIIrsquos value
contributes to a negative value of the NE However the curve also shows that the negative relationship
is not perfectly linear because the relationship line is appeared to be a slight curved shape
4 Discussion
In the span of 3 years (2015-2017) there was a downward trend in the NE along with the increased
NEII of high school science students in all districts in Aceh Province A pattern that emerged in this
period - is low integrity creates high NE scores - is seen very clearly in the pre-CBNE Period
However after the introduction of CBNE the NEII then rose gradually and consequently lowered the
NErsquos score of science students in Aceh Province What revealed as striking patter here is when schools
in a regency have a low x NEII a high x NE score with a small SDNE then it leads to a possibility of
massive and systematic fraudulent practice of the NE at the regencies (seen in Districts 1 and 2 in
2015) This pattern can be modeled as follows
Figure 2 Model of fraudulent practice estimation of national examination
The estimation model of NErsquos fraudulent practice means that an implementation of national
examination might be a fraud when in certain area possesses a low xNEII high xNE and small
xSDNE In this model the main point to indicate the fraudulence is the SDNE However one SDNE
alone in this case cannot be used as a benchmark because the situation also found in 2017 where the
Regency 19 has a low SDNE (09) yet also a high Integration index (100) Looking closer to this
later check to show that all national exams in the regency that was conducted using computer-based
examination (CBNE) So the low national examination standard deviation with a high integrity index
is reasonable due to the number of students taking the national exam which was is relatively small
(220 students)
The gradual increase of NEII value in Aceh Province is undeniably related to the implementation
of CBNE which had to apply in stages to reach the whole region The trend also occurred nationally
where the Ministry found difficulties in equipping all schools with certain facilities to implement
CBNE [14] In the first year of the CBNE nationally initiated in 2015 the province of Aceh has not
yet implemented it The examination in this province only began in the second year (2016) That is
why we found such a striking difference between those years and changed gradually afterward Until
AICMSTE 2019
IOP Conf Series Journal of Physics Conf Series 1460 (2020) 012052
IOP Publishing
doi1010881742-659614601012052
8
2017 of the 645 high schools that hold science classes 368 (57 of) schools had implemented the
CBNE while other 277 schools still carry out the examination based on paper and pencils
Comparing the national examination between the Aceh provincersquos and nationrsquos scores we can see
that the trend of change has also been happening nationally both for science high school students and
other majors as been seen at the table below
Tabel 10 Annual comparison of national examination scores between provincial and national trend
Year x NE of Aceh Province x NE Nationally
All Class Science Class All Class Science Class
20142015 6596 6913 6130 6529
20152016 4914 4972 5479 5685
20162017 4089 4196 5038 5287
Source PuspendikKemdikbud [15]
Referring to the regression analysis results the output interpretations indicate that the integrity of
the national examination has a moderate influence on national examination (with the regression value
of R2 0445) of science students in Aceh Province The relationship between them is linear with the
opposite direction (negative value) meaning that the higher the integrity index of the national
examination the lower the national examination obtained by the students Both conclusions are
consistent with other results found by Dwiatmoko et al [16] With relative similar variables their
study indicates that there was an existence of a systematic pattern to produce identical achievements
(values) in a certain educational evaluation context The unanimous results are also similar to this
result study which however later ldquoleaving crumbsrdquo for us to indicate that there was a systematic
intervention on these achievements (mainly pre-CBNE period) Back to both periods the governments
efforts to obtain the reliability of the national examination with CBNE seemed to have had a
significant impact
5 Conclusions
This research concludes that there are striking differences and gradual changes between the pre-and
post-implementation of the computer-based national examination of high school science students in
the province of Aceh In the span of three years (2015-2017) there was a downward trend of national
examination (NE) along with the implementation of CBNE which reveals through the increased value
of national examination integrity index (NEII) at all regencies in Aceh Province In the pre-CBNE
period a pattern appeared in the form of low xNEII high xNE and low xSDNE The pattern indicates
the existence of a fraudulent practice estimation of a national examination in the regenciescities In
the post-CBNE period the trend and pattern shifted backward (negative direction) wherein the
national examination score was getting smaller along with the increased NEII In addition the
implementation of CBNE - which reveals through the national examination integrity index ndash
moderately influence (with regression value R2 0445) the national examination scores of the high
school science students in Aceh Province The relationship between them is linear with the opposite
direction (negative value) meaning that the higher the Integrity Index of the national examination the
lower the national examination obtained by the student
6 References
[1] Alhadza A and Zulkifli M 2017 National examination and the quality of education in Indonesia
Advances in Social Sciences Research Journal 421 1-12
[2] Saukah A and Cahyono AE 2015 Ujian nasional di Indonesia dan implikasinya terhadap
pembelajaran bahasa inggris Jurnal Penelitian dan Evaluasi Pendidikan 192 244
[3] Miller BL Agnic LE Posick C Gould LA 2015 Cheating around the world a cross-national
analysis of principal reported cheating Journal of Criminal Justice Education 262 10
AICMSTE 2019
IOP Conf Series Journal of Physics Conf Series 1460 (2020) 012052
IOP Publishing
doi1010881742-659614601012052
9
[4] Rahman Y and Ari B 2016 FSGI masih kumpulkan data dan fakta kecurangan UN di seluruh
Indonesia [EBOL] [01-27-2019]
httpskbridnasional042016fsgi_masih_kumpulkan_data_dan_fakta_kecurangan_un_di_s
eluruh_indonesia80100html
[5] Iriani A and Manongga D 2018 Using soft systems methodology as an approach to evaluate
cheating in the national examination Journal of Theoretical and Applied Information
Technology 9611 3345
[6] Andina E 2015 Ujian kejujuran dalam pelaksanaan UN Pusat Pengkajian Pengolahan Data dan
Informasi (P3DI) Sekretariat Jenderal DPR RI Info Singkat Kesejahteraan Sosial 79 10
[7] BPS 2018 Index integritas ujian nasional [EBOL] [01-27-2019]
httpswwwbpsgoidstatictable201708181972indeks-integritas-ujian-nasionalhtml
[8] Puspendik kemdikbud 2018 Meta analisis ndash hasil ujian nasional untuk menyusun kebijakan
dan program [EBOL] [01-27-2019]
httpspuspendikkemdikbudgoidseminaruploadSeminar20Puspendik202015Paparan
_Meta20Analisis20UNpdf
[9] Setiawan Y 2015 IIUN untuk menumbuhkan sikap integritas dari sekolah [EBOL] [01-27-
2019]httpspsmkkemdikbudgoidkonten1373iiun-untuk-menumbuhkan-sikap-
integritas-dari-sekolah
[10] Uly YA 2018 Nilai rata-rata ujian nasional 2018 turun ini 2 biang keladinya [EBOL] [01-27-
2019]httpsnewsokezonecomread20180508651896034nilai-rata-rata-ujian-nasional-
2018-turun-ini-2-biang-keladinya
[11] Harususilo YE 2018 Ini 2 faktor penyebab nilai UN SMA menuruN [EBOL] [01-27-2019]
httpsedukasikompascomread2018050820070771ini-2-faktor-penyebab-nilai-un-sma-
menurun
[12] Mediani M 2018 Nilai UN siswa Jeblok Kemendikbud evaluasi topik ujian [EBOL] [01-27-
2019]httpswwwcnnindonesiacomnasional20180509124612-20-296868nilai-un-siswa-
jeblok-kemendikbud-evaluasi-topik-ujian
[13] Schober P Boer C and Schwarte LA 2018 Correlation coefficients appropriate use and
interpretation Anesthesia amp Analgesia 1265 1765
[14] Retnawati H Hadi S Nugraha AC Arlinwibowo J Sulistyaningsih E Djidu H Apino E Heni
D and Iryanti 2017 Implementing the computer-based national examination in Indonesian
schools The challenges and strategies Problems of Education in the 21st Century 756 613
[15] PuspendikKemdikbud 2019c Perbandingan hasil ujian nasional program studi IPA antar tahun
[EBOL] [01-27-2019]httpspuspendikkemdikbudgoidhasilun
[16] Dwiatmoko A Rosa PHP and Gunawan R 2015 Analisis statistis data nilai ujian nasional dan
nilai sekolah menengah atas di daerah istimewa Yogyakarta Jurnal Ilmiah Widya Teknik
142 1-7
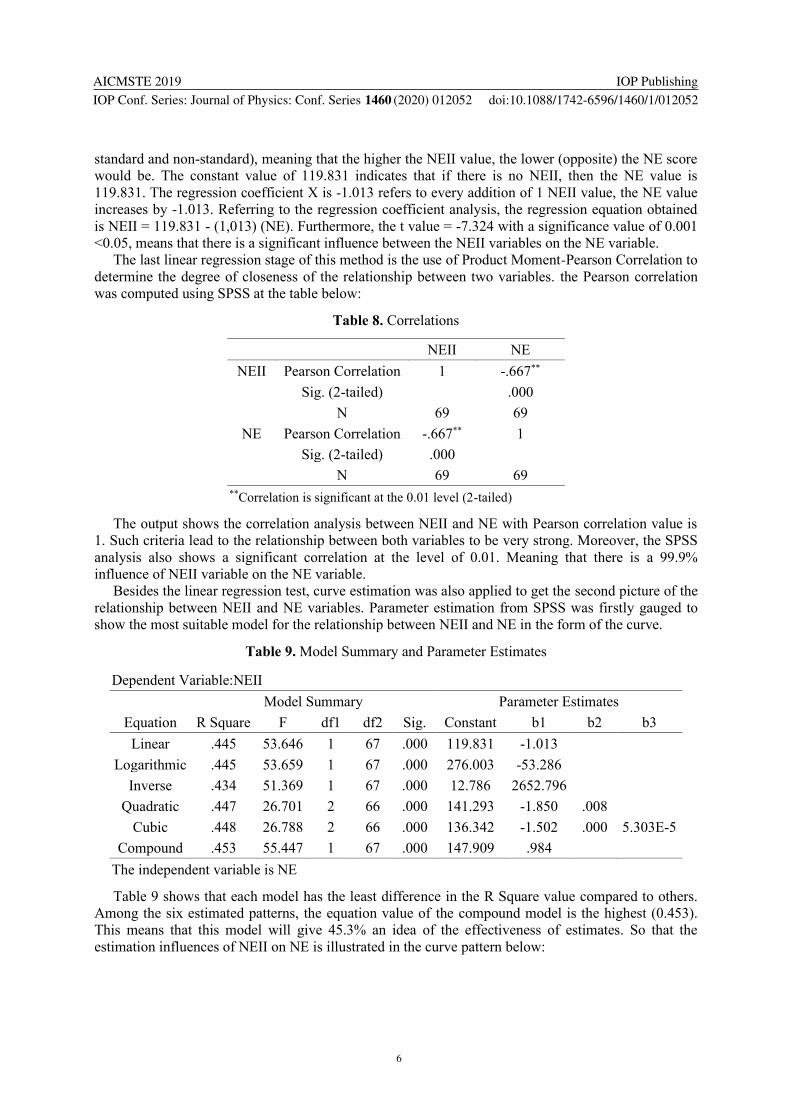
AICMSTE 2019
IOP Conf Series Journal of Physics Conf Series 1460 (2020) 012052
IOP Publishing
doi1010881742-659614601012052
6
standard and non-standard) meaning that the higher the NEII value the lower (opposite) the NE score
would be The constant value of 119831 indicates that if there is no NEII then the NE value is
119831 The regression coefficient X is -1013 refers to every addition of 1 NEII value the NE value
increases by -1013 Referring to the regression coefficient analysis the regression equation obtained
is NEII = 119831 - (1013) (NE) Furthermore the t value = -7324 with a significance value of 0001
lt005 means that there is a significant influence between the NEII variables on the NE variable
The last linear regression stage of this method is the use of Product Moment-Pearson Correlation to
determine the degree of closeness of the relationship between two variables the Pearson correlation
was computed using SPSS at the table below
Table 8 Correlations
NEII NE
NEII Pearson Correlation 1 -667
Sig (2-tailed) 000
N 69 69
NE Pearson Correlation -667 1
Sig (2-tailed) 000
N 69 69 Correlation is significant at the 001 level (2-tailed)
The output shows the correlation analysis between NEII and NE with Pearson correlation value is
1 Such criteria lead to the relationship between both variables to be very strong Moreover the SPSS
analysis also shows a significant correlation at the level of 001 Meaning that there is a 999
influence of NEII variable on the NE variable
Besides the linear regression test curve estimation was also applied to get the second picture of the
relationship between NEII and NE variables Parameter estimation from SPSS was firstly gauged to
show the most suitable model for the relationship between NEII and NE in the form of the curve
Table 9 Model Summary and Parameter Estimates
Dependent VariableNEII
Equation
Model Summary Parameter Estimates
R Square F df1 df2 Sig Constant b1 b2 b3
Linear 445 53646 1 67 000 119831 -1013
Logarithmic 445 53659 1 67 000 276003 -53286
Inverse 434 51369 1 67 000 12786 2652796
Quadratic 447 26701 2 66 000 141293 -1850 008
Cubic 448 26788 2 66 000 136342 -1502 000 5303E-5
Compound 453 55447 1 67 000 147909 984
The independent variable is NE
Table 9 shows that each model has the least difference in the R Square value compared to others
Among the six estimated patterns the equation value of the compound model is the highest (0453)
This means that this model will give 453 an idea of the effectiveness of estimates So that the
estimation influences of NEII on NE is illustrated in the curve pattern below
AICMSTE 2019
IOP Conf Series Journal of Physics Conf Series 1460 (2020) 012052
IOP Publishing
doi1010881742-659614601012052
7
Figure 1 Curve Estimation Model of Relationship between NEII and NE
Figure 1 depicts a two-dimensional relationship between the NE and NEII This figure is an
estimation model that occurred in the relationship with an equation of NEII = 119831 - (1013) (NE)
The equation shows the inverse (negative) relationship wherein each addition of a NEIIrsquos value
contributes to a negative value of the NE However the curve also shows that the negative relationship
is not perfectly linear because the relationship line is appeared to be a slight curved shape
4 Discussion
In the span of 3 years (2015-2017) there was a downward trend in the NE along with the increased
NEII of high school science students in all districts in Aceh Province A pattern that emerged in this
period - is low integrity creates high NE scores - is seen very clearly in the pre-CBNE Period
However after the introduction of CBNE the NEII then rose gradually and consequently lowered the
NErsquos score of science students in Aceh Province What revealed as striking patter here is when schools
in a regency have a low x NEII a high x NE score with a small SDNE then it leads to a possibility of
massive and systematic fraudulent practice of the NE at the regencies (seen in Districts 1 and 2 in
2015) This pattern can be modeled as follows
Figure 2 Model of fraudulent practice estimation of national examination
The estimation model of NErsquos fraudulent practice means that an implementation of national
examination might be a fraud when in certain area possesses a low xNEII high xNE and small
xSDNE In this model the main point to indicate the fraudulence is the SDNE However one SDNE
alone in this case cannot be used as a benchmark because the situation also found in 2017 where the
Regency 19 has a low SDNE (09) yet also a high Integration index (100) Looking closer to this
later check to show that all national exams in the regency that was conducted using computer-based
examination (CBNE) So the low national examination standard deviation with a high integrity index
is reasonable due to the number of students taking the national exam which was is relatively small
(220 students)
The gradual increase of NEII value in Aceh Province is undeniably related to the implementation
of CBNE which had to apply in stages to reach the whole region The trend also occurred nationally
where the Ministry found difficulties in equipping all schools with certain facilities to implement
CBNE [14] In the first year of the CBNE nationally initiated in 2015 the province of Aceh has not
yet implemented it The examination in this province only began in the second year (2016) That is
why we found such a striking difference between those years and changed gradually afterward Until
AICMSTE 2019
IOP Conf Series Journal of Physics Conf Series 1460 (2020) 012052
IOP Publishing
doi1010881742-659614601012052
8
2017 of the 645 high schools that hold science classes 368 (57 of) schools had implemented the
CBNE while other 277 schools still carry out the examination based on paper and pencils
Comparing the national examination between the Aceh provincersquos and nationrsquos scores we can see
that the trend of change has also been happening nationally both for science high school students and
other majors as been seen at the table below
Tabel 10 Annual comparison of national examination scores between provincial and national trend
Year x NE of Aceh Province x NE Nationally
All Class Science Class All Class Science Class
20142015 6596 6913 6130 6529
20152016 4914 4972 5479 5685
20162017 4089 4196 5038 5287
Source PuspendikKemdikbud [15]
Referring to the regression analysis results the output interpretations indicate that the integrity of
the national examination has a moderate influence on national examination (with the regression value
of R2 0445) of science students in Aceh Province The relationship between them is linear with the
opposite direction (negative value) meaning that the higher the integrity index of the national
examination the lower the national examination obtained by the students Both conclusions are
consistent with other results found by Dwiatmoko et al [16] With relative similar variables their
study indicates that there was an existence of a systematic pattern to produce identical achievements
(values) in a certain educational evaluation context The unanimous results are also similar to this
result study which however later ldquoleaving crumbsrdquo for us to indicate that there was a systematic
intervention on these achievements (mainly pre-CBNE period) Back to both periods the governments
efforts to obtain the reliability of the national examination with CBNE seemed to have had a
significant impact
5 Conclusions
This research concludes that there are striking differences and gradual changes between the pre-and
post-implementation of the computer-based national examination of high school science students in
the province of Aceh In the span of three years (2015-2017) there was a downward trend of national
examination (NE) along with the implementation of CBNE which reveals through the increased value
of national examination integrity index (NEII) at all regencies in Aceh Province In the pre-CBNE
period a pattern appeared in the form of low xNEII high xNE and low xSDNE The pattern indicates
the existence of a fraudulent practice estimation of a national examination in the regenciescities In
the post-CBNE period the trend and pattern shifted backward (negative direction) wherein the
national examination score was getting smaller along with the increased NEII In addition the
implementation of CBNE - which reveals through the national examination integrity index ndash
moderately influence (with regression value R2 0445) the national examination scores of the high
school science students in Aceh Province The relationship between them is linear with the opposite
direction (negative value) meaning that the higher the Integrity Index of the national examination the
lower the national examination obtained by the student
6 References
[1] Alhadza A and Zulkifli M 2017 National examination and the quality of education in Indonesia
Advances in Social Sciences Research Journal 421 1-12
[2] Saukah A and Cahyono AE 2015 Ujian nasional di Indonesia dan implikasinya terhadap
pembelajaran bahasa inggris Jurnal Penelitian dan Evaluasi Pendidikan 192 244
[3] Miller BL Agnic LE Posick C Gould LA 2015 Cheating around the world a cross-national
analysis of principal reported cheating Journal of Criminal Justice Education 262 10
AICMSTE 2019
IOP Conf Series Journal of Physics Conf Series 1460 (2020) 012052
IOP Publishing
doi1010881742-659614601012052
9
[4] Rahman Y and Ari B 2016 FSGI masih kumpulkan data dan fakta kecurangan UN di seluruh
Indonesia [EBOL] [01-27-2019]
httpskbridnasional042016fsgi_masih_kumpulkan_data_dan_fakta_kecurangan_un_di_s
eluruh_indonesia80100html
[5] Iriani A and Manongga D 2018 Using soft systems methodology as an approach to evaluate
cheating in the national examination Journal of Theoretical and Applied Information
Technology 9611 3345
[6] Andina E 2015 Ujian kejujuran dalam pelaksanaan UN Pusat Pengkajian Pengolahan Data dan
Informasi (P3DI) Sekretariat Jenderal DPR RI Info Singkat Kesejahteraan Sosial 79 10
[7] BPS 2018 Index integritas ujian nasional [EBOL] [01-27-2019]
httpswwwbpsgoidstatictable201708181972indeks-integritas-ujian-nasionalhtml
[8] Puspendik kemdikbud 2018 Meta analisis ndash hasil ujian nasional untuk menyusun kebijakan
dan program [EBOL] [01-27-2019]
httpspuspendikkemdikbudgoidseminaruploadSeminar20Puspendik202015Paparan
_Meta20Analisis20UNpdf
[9] Setiawan Y 2015 IIUN untuk menumbuhkan sikap integritas dari sekolah [EBOL] [01-27-
2019]httpspsmkkemdikbudgoidkonten1373iiun-untuk-menumbuhkan-sikap-
integritas-dari-sekolah
[10] Uly YA 2018 Nilai rata-rata ujian nasional 2018 turun ini 2 biang keladinya [EBOL] [01-27-
2019]httpsnewsokezonecomread20180508651896034nilai-rata-rata-ujian-nasional-
2018-turun-ini-2-biang-keladinya
[11] Harususilo YE 2018 Ini 2 faktor penyebab nilai UN SMA menuruN [EBOL] [01-27-2019]
httpsedukasikompascomread2018050820070771ini-2-faktor-penyebab-nilai-un-sma-
menurun
[12] Mediani M 2018 Nilai UN siswa Jeblok Kemendikbud evaluasi topik ujian [EBOL] [01-27-
2019]httpswwwcnnindonesiacomnasional20180509124612-20-296868nilai-un-siswa-
jeblok-kemendikbud-evaluasi-topik-ujian
[13] Schober P Boer C and Schwarte LA 2018 Correlation coefficients appropriate use and
interpretation Anesthesia amp Analgesia 1265 1765
[14] Retnawati H Hadi S Nugraha AC Arlinwibowo J Sulistyaningsih E Djidu H Apino E Heni
D and Iryanti 2017 Implementing the computer-based national examination in Indonesian
schools The challenges and strategies Problems of Education in the 21st Century 756 613
[15] PuspendikKemdikbud 2019c Perbandingan hasil ujian nasional program studi IPA antar tahun
[EBOL] [01-27-2019]httpspuspendikkemdikbudgoidhasilun
[16] Dwiatmoko A Rosa PHP and Gunawan R 2015 Analisis statistis data nilai ujian nasional dan
nilai sekolah menengah atas di daerah istimewa Yogyakarta Jurnal Ilmiah Widya Teknik
142 1-7
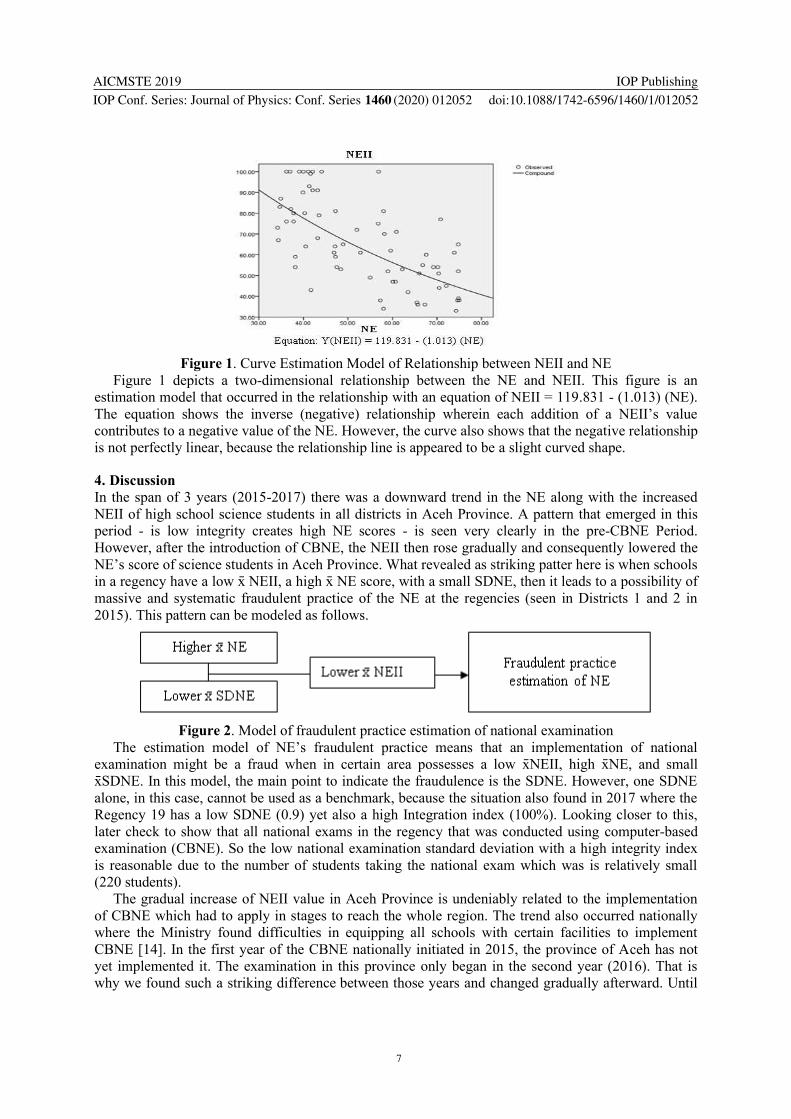
AICMSTE 2019
IOP Conf Series Journal of Physics Conf Series 1460 (2020) 012052
IOP Publishing
doi1010881742-659614601012052
7
Figure 1 Curve Estimation Model of Relationship between NEII and NE
Figure 1 depicts a two-dimensional relationship between the NE and NEII This figure is an
estimation model that occurred in the relationship with an equation of NEII = 119831 - (1013) (NE)
The equation shows the inverse (negative) relationship wherein each addition of a NEIIrsquos value
contributes to a negative value of the NE However the curve also shows that the negative relationship
is not perfectly linear because the relationship line is appeared to be a slight curved shape
4 Discussion
In the span of 3 years (2015-2017) there was a downward trend in the NE along with the increased
NEII of high school science students in all districts in Aceh Province A pattern that emerged in this
period - is low integrity creates high NE scores - is seen very clearly in the pre-CBNE Period
However after the introduction of CBNE the NEII then rose gradually and consequently lowered the
NErsquos score of science students in Aceh Province What revealed as striking patter here is when schools
in a regency have a low x NEII a high x NE score with a small SDNE then it leads to a possibility of
massive and systematic fraudulent practice of the NE at the regencies (seen in Districts 1 and 2 in
2015) This pattern can be modeled as follows
Figure 2 Model of fraudulent practice estimation of national examination
The estimation model of NErsquos fraudulent practice means that an implementation of national
examination might be a fraud when in certain area possesses a low xNEII high xNE and small
xSDNE In this model the main point to indicate the fraudulence is the SDNE However one SDNE
alone in this case cannot be used as a benchmark because the situation also found in 2017 where the
Regency 19 has a low SDNE (09) yet also a high Integration index (100) Looking closer to this
later check to show that all national exams in the regency that was conducted using computer-based
examination (CBNE) So the low national examination standard deviation with a high integrity index
is reasonable due to the number of students taking the national exam which was is relatively small
(220 students)
The gradual increase of NEII value in Aceh Province is undeniably related to the implementation
of CBNE which had to apply in stages to reach the whole region The trend also occurred nationally
where the Ministry found difficulties in equipping all schools with certain facilities to implement
CBNE [14] In the first year of the CBNE nationally initiated in 2015 the province of Aceh has not
yet implemented it The examination in this province only began in the second year (2016) That is
why we found such a striking difference between those years and changed gradually afterward Until
AICMSTE 2019
IOP Conf Series Journal of Physics Conf Series 1460 (2020) 012052
IOP Publishing
doi1010881742-659614601012052
8
2017 of the 645 high schools that hold science classes 368 (57 of) schools had implemented the
CBNE while other 277 schools still carry out the examination based on paper and pencils
Comparing the national examination between the Aceh provincersquos and nationrsquos scores we can see
that the trend of change has also been happening nationally both for science high school students and
other majors as been seen at the table below
Tabel 10 Annual comparison of national examination scores between provincial and national trend
Year x NE of Aceh Province x NE Nationally
All Class Science Class All Class Science Class
20142015 6596 6913 6130 6529
20152016 4914 4972 5479 5685
20162017 4089 4196 5038 5287
Source PuspendikKemdikbud [15]
Referring to the regression analysis results the output interpretations indicate that the integrity of
the national examination has a moderate influence on national examination (with the regression value
of R2 0445) of science students in Aceh Province The relationship between them is linear with the
opposite direction (negative value) meaning that the higher the integrity index of the national
examination the lower the national examination obtained by the students Both conclusions are
consistent with other results found by Dwiatmoko et al [16] With relative similar variables their
study indicates that there was an existence of a systematic pattern to produce identical achievements
(values) in a certain educational evaluation context The unanimous results are also similar to this
result study which however later ldquoleaving crumbsrdquo for us to indicate that there was a systematic
intervention on these achievements (mainly pre-CBNE period) Back to both periods the governments
efforts to obtain the reliability of the national examination with CBNE seemed to have had a
significant impact
5 Conclusions
This research concludes that there are striking differences and gradual changes between the pre-and
post-implementation of the computer-based national examination of high school science students in
the province of Aceh In the span of three years (2015-2017) there was a downward trend of national
examination (NE) along with the implementation of CBNE which reveals through the increased value
of national examination integrity index (NEII) at all regencies in Aceh Province In the pre-CBNE
period a pattern appeared in the form of low xNEII high xNE and low xSDNE The pattern indicates
the existence of a fraudulent practice estimation of a national examination in the regenciescities In
the post-CBNE period the trend and pattern shifted backward (negative direction) wherein the
national examination score was getting smaller along with the increased NEII In addition the
implementation of CBNE - which reveals through the national examination integrity index ndash
moderately influence (with regression value R2 0445) the national examination scores of the high
school science students in Aceh Province The relationship between them is linear with the opposite
direction (negative value) meaning that the higher the Integrity Index of the national examination the
lower the national examination obtained by the student
6 References
[1] Alhadza A and Zulkifli M 2017 National examination and the quality of education in Indonesia
Advances in Social Sciences Research Journal 421 1-12
[2] Saukah A and Cahyono AE 2015 Ujian nasional di Indonesia dan implikasinya terhadap
pembelajaran bahasa inggris Jurnal Penelitian dan Evaluasi Pendidikan 192 244
[3] Miller BL Agnic LE Posick C Gould LA 2015 Cheating around the world a cross-national
analysis of principal reported cheating Journal of Criminal Justice Education 262 10
AICMSTE 2019
IOP Conf Series Journal of Physics Conf Series 1460 (2020) 012052
IOP Publishing
doi1010881742-659614601012052
9
[4] Rahman Y and Ari B 2016 FSGI masih kumpulkan data dan fakta kecurangan UN di seluruh
Indonesia [EBOL] [01-27-2019]
httpskbridnasional042016fsgi_masih_kumpulkan_data_dan_fakta_kecurangan_un_di_s
eluruh_indonesia80100html
[5] Iriani A and Manongga D 2018 Using soft systems methodology as an approach to evaluate
cheating in the national examination Journal of Theoretical and Applied Information
Technology 9611 3345
[6] Andina E 2015 Ujian kejujuran dalam pelaksanaan UN Pusat Pengkajian Pengolahan Data dan
Informasi (P3DI) Sekretariat Jenderal DPR RI Info Singkat Kesejahteraan Sosial 79 10
[7] BPS 2018 Index integritas ujian nasional [EBOL] [01-27-2019]
httpswwwbpsgoidstatictable201708181972indeks-integritas-ujian-nasionalhtml
[8] Puspendik kemdikbud 2018 Meta analisis ndash hasil ujian nasional untuk menyusun kebijakan
dan program [EBOL] [01-27-2019]
httpspuspendikkemdikbudgoidseminaruploadSeminar20Puspendik202015Paparan
_Meta20Analisis20UNpdf
[9] Setiawan Y 2015 IIUN untuk menumbuhkan sikap integritas dari sekolah [EBOL] [01-27-
2019]httpspsmkkemdikbudgoidkonten1373iiun-untuk-menumbuhkan-sikap-
integritas-dari-sekolah
[10] Uly YA 2018 Nilai rata-rata ujian nasional 2018 turun ini 2 biang keladinya [EBOL] [01-27-
2019]httpsnewsokezonecomread20180508651896034nilai-rata-rata-ujian-nasional-
2018-turun-ini-2-biang-keladinya
[11] Harususilo YE 2018 Ini 2 faktor penyebab nilai UN SMA menuruN [EBOL] [01-27-2019]
httpsedukasikompascomread2018050820070771ini-2-faktor-penyebab-nilai-un-sma-
menurun
[12] Mediani M 2018 Nilai UN siswa Jeblok Kemendikbud evaluasi topik ujian [EBOL] [01-27-
2019]httpswwwcnnindonesiacomnasional20180509124612-20-296868nilai-un-siswa-
jeblok-kemendikbud-evaluasi-topik-ujian
[13] Schober P Boer C and Schwarte LA 2018 Correlation coefficients appropriate use and
interpretation Anesthesia amp Analgesia 1265 1765
[14] Retnawati H Hadi S Nugraha AC Arlinwibowo J Sulistyaningsih E Djidu H Apino E Heni
D and Iryanti 2017 Implementing the computer-based national examination in Indonesian
schools The challenges and strategies Problems of Education in the 21st Century 756 613
[15] PuspendikKemdikbud 2019c Perbandingan hasil ujian nasional program studi IPA antar tahun
[EBOL] [01-27-2019]httpspuspendikkemdikbudgoidhasilun
[16] Dwiatmoko A Rosa PHP and Gunawan R 2015 Analisis statistis data nilai ujian nasional dan
nilai sekolah menengah atas di daerah istimewa Yogyakarta Jurnal Ilmiah Widya Teknik
142 1-7
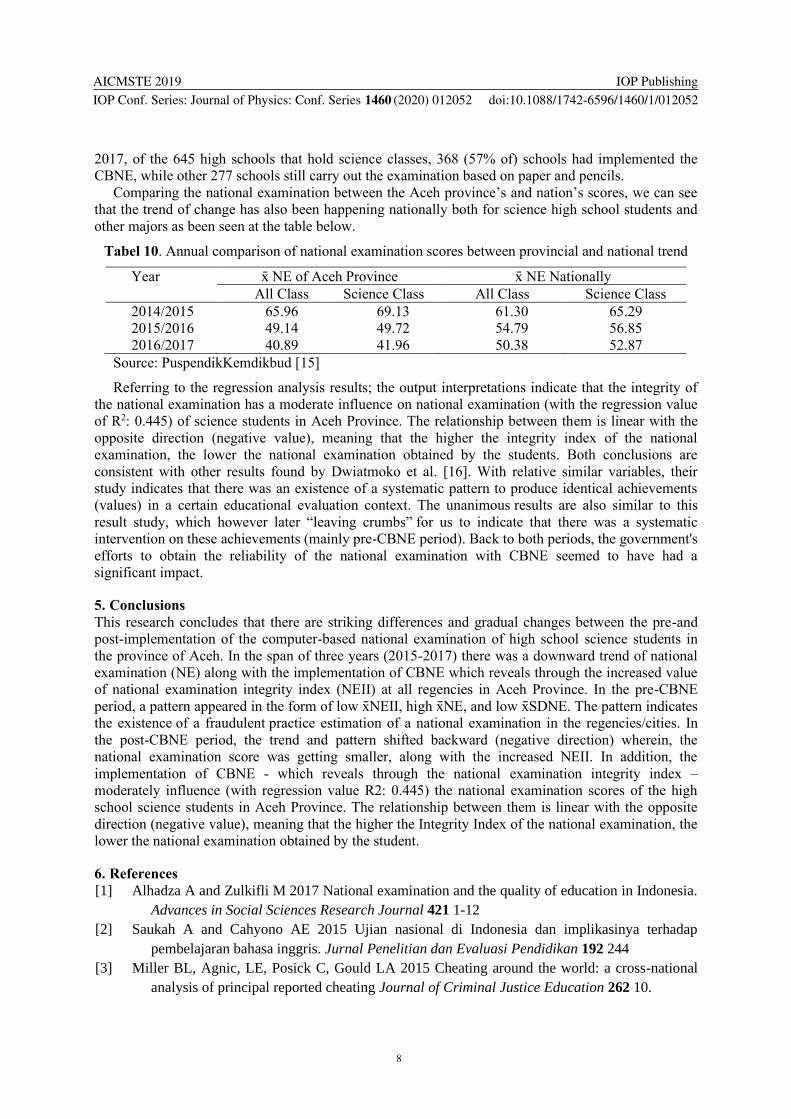
AICMSTE 2019
IOP Conf Series Journal of Physics Conf Series 1460 (2020) 012052
IOP Publishing
doi1010881742-659614601012052
8
2017 of the 645 high schools that hold science classes 368 (57 of) schools had implemented the
CBNE while other 277 schools still carry out the examination based on paper and pencils
Comparing the national examination between the Aceh provincersquos and nationrsquos scores we can see
that the trend of change has also been happening nationally both for science high school students and
other majors as been seen at the table below
Tabel 10 Annual comparison of national examination scores between provincial and national trend
Year x NE of Aceh Province x NE Nationally
All Class Science Class All Class Science Class
20142015 6596 6913 6130 6529
20152016 4914 4972 5479 5685
20162017 4089 4196 5038 5287
Source PuspendikKemdikbud [15]
Referring to the regression analysis results the output interpretations indicate that the integrity of
the national examination has a moderate influence on national examination (with the regression value
of R2 0445) of science students in Aceh Province The relationship between them is linear with the
opposite direction (negative value) meaning that the higher the integrity index of the national
examination the lower the national examination obtained by the students Both conclusions are
consistent with other results found by Dwiatmoko et al [16] With relative similar variables their
study indicates that there was an existence of a systematic pattern to produce identical achievements
(values) in a certain educational evaluation context The unanimous results are also similar to this
result study which however later ldquoleaving crumbsrdquo for us to indicate that there was a systematic
intervention on these achievements (mainly pre-CBNE period) Back to both periods the governments
efforts to obtain the reliability of the national examination with CBNE seemed to have had a
significant impact
5 Conclusions
This research concludes that there are striking differences and gradual changes between the pre-and
post-implementation of the computer-based national examination of high school science students in
the province of Aceh In the span of three years (2015-2017) there was a downward trend of national
examination (NE) along with the implementation of CBNE which reveals through the increased value
of national examination integrity index (NEII) at all regencies in Aceh Province In the pre-CBNE
period a pattern appeared in the form of low xNEII high xNE and low xSDNE The pattern indicates
the existence of a fraudulent practice estimation of a national examination in the regenciescities In
the post-CBNE period the trend and pattern shifted backward (negative direction) wherein the
national examination score was getting smaller along with the increased NEII In addition the
implementation of CBNE - which reveals through the national examination integrity index ndash
moderately influence (with regression value R2 0445) the national examination scores of the high
school science students in Aceh Province The relationship between them is linear with the opposite
direction (negative value) meaning that the higher the Integrity Index of the national examination the
lower the national examination obtained by the student
6 References
[1] Alhadza A and Zulkifli M 2017 National examination and the quality of education in Indonesia
Advances in Social Sciences Research Journal 421 1-12
[2] Saukah A and Cahyono AE 2015 Ujian nasional di Indonesia dan implikasinya terhadap
pembelajaran bahasa inggris Jurnal Penelitian dan Evaluasi Pendidikan 192 244
[3] Miller BL Agnic LE Posick C Gould LA 2015 Cheating around the world a cross-national
analysis of principal reported cheating Journal of Criminal Justice Education 262 10
AICMSTE 2019
IOP Conf Series Journal of Physics Conf Series 1460 (2020) 012052
IOP Publishing
doi1010881742-659614601012052
9
[4] Rahman Y and Ari B 2016 FSGI masih kumpulkan data dan fakta kecurangan UN di seluruh
Indonesia [EBOL] [01-27-2019]
httpskbridnasional042016fsgi_masih_kumpulkan_data_dan_fakta_kecurangan_un_di_s
eluruh_indonesia80100html
[5] Iriani A and Manongga D 2018 Using soft systems methodology as an approach to evaluate
cheating in the national examination Journal of Theoretical and Applied Information
Technology 9611 3345
[6] Andina E 2015 Ujian kejujuran dalam pelaksanaan UN Pusat Pengkajian Pengolahan Data dan
Informasi (P3DI) Sekretariat Jenderal DPR RI Info Singkat Kesejahteraan Sosial 79 10
[7] BPS 2018 Index integritas ujian nasional [EBOL] [01-27-2019]
httpswwwbpsgoidstatictable201708181972indeks-integritas-ujian-nasionalhtml
[8] Puspendik kemdikbud 2018 Meta analisis ndash hasil ujian nasional untuk menyusun kebijakan
dan program [EBOL] [01-27-2019]
httpspuspendikkemdikbudgoidseminaruploadSeminar20Puspendik202015Paparan
_Meta20Analisis20UNpdf
[9] Setiawan Y 2015 IIUN untuk menumbuhkan sikap integritas dari sekolah [EBOL] [01-27-
2019]httpspsmkkemdikbudgoidkonten1373iiun-untuk-menumbuhkan-sikap-
integritas-dari-sekolah
[10] Uly YA 2018 Nilai rata-rata ujian nasional 2018 turun ini 2 biang keladinya [EBOL] [01-27-
2019]httpsnewsokezonecomread20180508651896034nilai-rata-rata-ujian-nasional-
2018-turun-ini-2-biang-keladinya
[11] Harususilo YE 2018 Ini 2 faktor penyebab nilai UN SMA menuruN [EBOL] [01-27-2019]
httpsedukasikompascomread2018050820070771ini-2-faktor-penyebab-nilai-un-sma-
menurun
[12] Mediani M 2018 Nilai UN siswa Jeblok Kemendikbud evaluasi topik ujian [EBOL] [01-27-
2019]httpswwwcnnindonesiacomnasional20180509124612-20-296868nilai-un-siswa-
jeblok-kemendikbud-evaluasi-topik-ujian
[13] Schober P Boer C and Schwarte LA 2018 Correlation coefficients appropriate use and
interpretation Anesthesia amp Analgesia 1265 1765
[14] Retnawati H Hadi S Nugraha AC Arlinwibowo J Sulistyaningsih E Djidu H Apino E Heni
D and Iryanti 2017 Implementing the computer-based national examination in Indonesian
schools The challenges and strategies Problems of Education in the 21st Century 756 613
[15] PuspendikKemdikbud 2019c Perbandingan hasil ujian nasional program studi IPA antar tahun
[EBOL] [01-27-2019]httpspuspendikkemdikbudgoidhasilun
[16] Dwiatmoko A Rosa PHP and Gunawan R 2015 Analisis statistis data nilai ujian nasional dan
nilai sekolah menengah atas di daerah istimewa Yogyakarta Jurnal Ilmiah Widya Teknik
142 1-7