Ontogenetic Allometry and Cranial Shape Diversification Among Human Populations From South America
Upload
independentCategory
view
5download
0
International Journal of Primatology, Vol. 20, No. 1, 1999
Ontogenetic Patterning of Skeletal FluctuatingAsymmetry in Rhesus Macaques and Humans:Evolutionary and Developmental Implications
Benedikt Hallgrimsson1
Received September 29, 1997; accepted February 18, 1998
I address the question of how fluctuating asymmetry (FA)—the distribution ofrandom deviations from bilateral symmetry—varies ontogenetically in themammalian skeleton. This question is significant because of the light that suchpatterns can shed on the causes of variation in developmental stability in boneas well as other structures. Based on large ontogenetic skeletal series of Macacamulatta and Homo sapiens, / report that the FA variances of skeletal metrictraits increase ontogenetically. Coupled with the finding that FA variances alsoaccumulate to greater magnitudes in slower growing mammals, this result isconsistent with the hypotheses that FA in bone is primarily caused by (a)cumulative effects of asymmetrical mechanical factors, (b) accumulation ofvariation in the (local) regulation of growth, or (c) a tendency for bonemorphology to drift through undirected remodeling. I discuss the implicationsof these optional explanations for primate evolution and bone development.
KEY WORDS: developmental stability; bone growth; bone development; Macaca mulatta;Homo sapiens; primates; mammals.
INTRODUCTION
Waddington (1957) argued that selection acts on the regulation of de-velopmental processes to enhance their tendency to follow particular tra-jectories despite external or internal perturbation. Independently,Schmalhausen (1949) argued that increasing autonomy of developmental
1Department of Anatomy, University of Puerto Rico, Medical Sciences Campus, San Juan,Puerto Rico 00936-5067.
121
0164-0291/99/0200-0121$16.00/0 © 1999 Plenum Publishing Corporation

systems from the environment is one of the major trends in organismalevolution. This property of development, termed buffering by Van Valen(1962) can be divided into two related components, one among individu-als—canalization—and the other within the individual: developmental sta-bility (Zakharov, 1992). One method to assess the effects of thesemechanisms in natural populations is to compare the result of develop-mental replicates such as identically reared twins, identical repeated struc-tures such as bristles in Drosophila, or deviation from symmetry insymmetrical structures. The latter measure, fluctuating asymmetry (FA):Van Valen, 1962) has been used extensively to assess variation in develop-mental stability in a wide variety of contexts. While these studies confirmdevelopmental stability as a prominent component of phenotypic variation,the developmental mechanisms that underlie variation in canalization anddevelopmental noise remain largely unknown.
The patterning of FA over developmental time is an important clueto the causal basis of developmental stability and, hence, to understandingvariation in FA among natural populations and species. Elsewhere (Hall-grimsson, 1993b, 1995, 1997), I discussed models for the etiology of FA inskeletal structures. In order to test predictions derived from these models,I present an analysis of the ontogenetic patterning of FA in known-agepostnatal skeletal series of Homo sapiens and Macaca mulatta.
BACKGROUND AND THEORY
Developmental processes take place over time. The patterning of theresults of epigenetic imprecision—developmental noise—over developmen-tal time is thus an obvious place to start in trying to understand the etiologyof developmental noise. This aspect of FA variation has received surpris-ingly little attention. Work on this subject can be summarized as follows.
1. In humans, later-erupting teeth have elevated FA (Garn et al., 1967;Hershkovitz et al., 1993; Noss et al., 1983; Saunders and Mayhall,1982) and later-erupting elephant molars have increasedmorphological variation (Roth, 1989).
2. FA of standard anthropometric traits increases with age fromadulthood to advanced age in humans (Kobyliansky and Livshits,1989).
3 Parental age has no effect on FA in Drosophila (Wakefield et al.,1993). However, maternal age has a slight elevating effect on FAof anthropometric traits in human infants (Livshits and Kobyliansky,1991).
122 Hallgrimsson
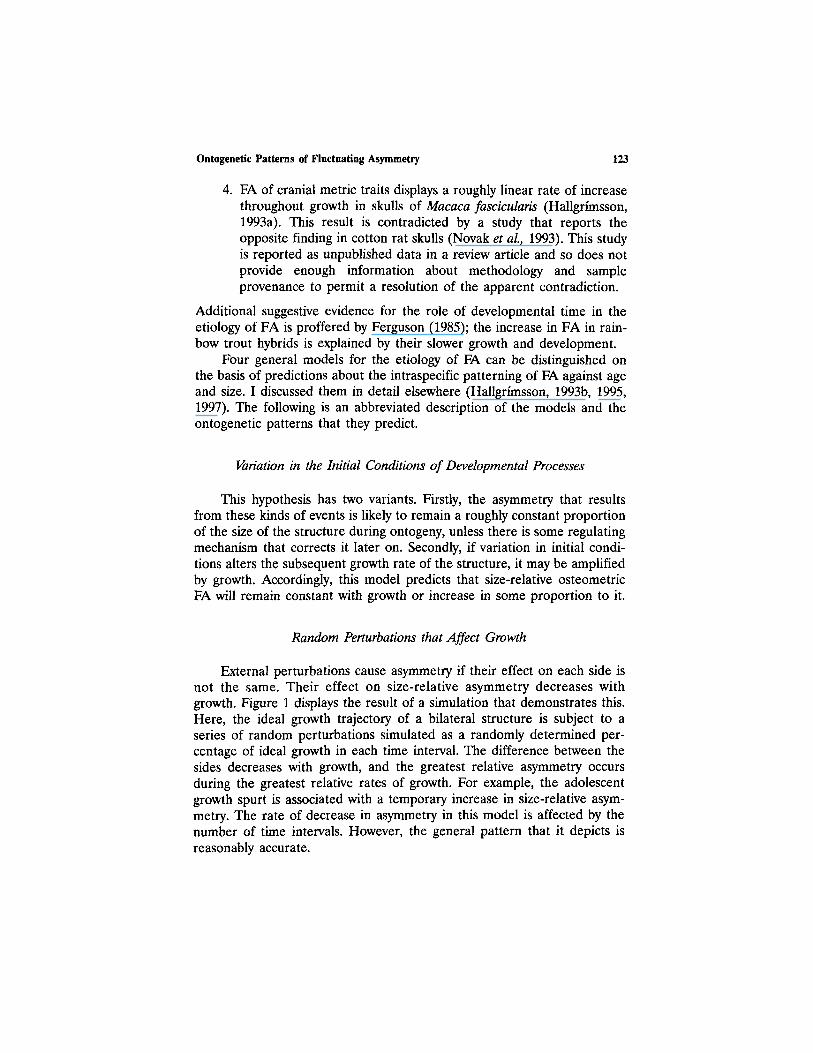
4. FA of cranial metric traits displays a roughly linear rate of increasethroughout growth in skulls of Macaca fascicularis (Hallgrimsson,1993a). This result is contradicted by a study that reports theopposite finding in cotton rat skulls (Novak et al., 1993). This studyis reported as unpublished data in a review article and so does notprovide enough information about methodology and sampleprovenance to permit a resolution of the apparent contradiction.
Additional suggestive evidence for the role of developmental time in theetiology of FA is proffered by Ferguson (1985); the increase in FA in rain-bow trout hybrids is explained by their slower growth and development.
Four general models for the etiology of FA can be distinguished onthe basis of predictions about the intraspecific patterning of FA against ageand size. I discussed them in detail elsewhere (Hallgrimsson, 1993b, 1995,1997). The following is an abbreviated description of the models and theontogenetic patterns that they predict.
Variation in the Initial Conditions of Developmental Processes
This hypothesis has two variants. Firstly, the asymmetry that resultsfrom these kinds of events is likely to remain a roughly constant proportionof the size of the structure during ontogeny, unless there is some regulatingmechanism that corrects it later on. Secondly, if variation in initial condi-tions alters the subsequent growth rate of the structure, it may be amplifiedby growth. Accordingly, this model predicts that size-relative osteometricFA will remain constant with growth or increase in some proportion to it.
Random Perturbations that Affect Growth
External perturbations cause asymmetry if their effect on each side isnot the same. Their effect on size-relative asymmetry decreases withgrowth. Figure 1 displays the result of a simulation that demonstrates this.Here, the ideal growth trajectory of a bilateral structure is subject to aseries of random perturbations simulated as a randomly determined per-centage of ideal growth in each time interval. The difference between thesides decreases with growth, and the greatest relative asymmetry occursduring the greatest relative rates of growth. For example, the adolescentgrowth spurt is associated with a temporary increase in size-relative asym-metry. The rate of decrease in asymmetry in this model is affected by thenumber of time intervals. However, the general pattern that it depicts isreasonably accurate.
Ontogenetic Patterns of Fluctuating Asymmetry 123

124 Hallgrimsson
Fig. 1. The effect of random perturbations on an ideal growth trajectory. This graph is aplot of the size-relative FA trajectory for 50 trials. Each FA value is the standard deviationof the size relative FA distribution at each time interval. The growth velocity trajectory isfor human thigh length (Gavan, 1953).
Several potential causes of FA involve acute perturbations to growth.For instance, episodes of nutritional or pathological stress may temporarilyreduce the growth rates of skeletal elements. The asymmetry generated bythe between-side variation in the magnitude of reduction produced by eachstress episode will show the pattern predicted by this model. Mechanicalperturbations such as stresses placed on bones during locomotion or mas-tication, minor injuries, or postural asymmetries will produce the patternpredicted by this model so long as their occurrences throughout growthare random with respect to side, i.e., they are not autocorrelated.
Random Variation in Growth per Unit Time
Each step in a developmental process may have a certain error vari-ance. For example, in a process involving growth by mitotic cell division,the time between successive cell divisions in individual cell lineages willvary somewhat. Therefore, the number of cells produced per unit time ina growing structure will also vary. Just as the variance of a composite struc-ture decreases as the number of independently varying components in-

creases (Lande, 1977), the effect of random variation in the results of de-velopmental steps will decrease as the number of steps increases. Asym-metry that results in this way will decrease asymptotically towards zero.
FA that results from side-to-side variation in timing would also producethis result. Suppose that both sides have identical growth trajectories but varyrandomly in their progress along those trajectories. In this case FA will de-crease ontogenetically due both to the relative slowing of growth with ageand also to the progressive averaging out of the time-specific variation.
The Accumulation of Intraindividual Variation with Developmental Time
There are two kinds of epigenetic processes that can cause osteometricFA to accumulate with time. One process is via the cumulative effect ofactivity-related factors that are not random with respect to side within in-dividuals. I refer to this as the functional-asymmetry hypothesis. The secondprocess is the accumulation of minor variations in bone remodeling andgrowth or their regulation—the morphogenetic drift hypothesis.
The Functional (or Mechanical)-Asymmetry Hypothesis. During growthand throughout life, bone shape is continually regulated by its response tomechanical stimuli. The mechanism involves the responsiveness of localbone tissue to changes in strain (Frost, 1964). Even relatively few episodesof strain change are sufficient to produce a remodeling response (Rubinand Lanyon, 1984). Habitually asymmetrical behavior, such as an asymmet-rical gait or side preference in chewing, will produce an accumulation ofdifferences between bilaterally homologous structures.
Epigenetic interactions with surrounding tissues that are mediated bypatterns of mechanical stress can be major determinants of bone shapeduring growth (Herring, 1993; Moore, 1965, 1973; Moss and Meehan, 1970;Moss, 1968, 1972b). The functional asymmetry hypothesis would includeany interaction of this kind that has a consistently asymmetric effect duringgrowth.
The Morphogenetic-Drift Model. This is the second type of model thatpredicts an increase in relative asymmetry with developmental time. It hastwo variants. First is the accumulation of variation in the regulation ofgrowth. Figure 2 shows the results of a simulation of this model. Here, thegrowth at each time interval is subject to a linearly increasing amount ofrandom (normally distributed) deviation throughout growth. The slope ofthe mean magnitude of deviation per unit time and age is arbitrary. Thesecond variant holds that there is a continuous tendency for bone form tochange independently of the amount of growth. Figure 3 shows the resultsof a simulation of this model. Here, the structure is subjected to a set of
Ontogenetic Patterns of Fluctuating Asymmetry 125

Fig. 2. The cumulative effect of a time-dependent increase in the variance of the amountof growth per unit time. The graphic is a plot of the size relative FA trajectory for 50trials. Each FA value is the standard deviation of the size relative FA distribution at eachtime interval. The growth velocity trajectory is the mean of the same 50 trials. The growthvelocity trajectory is for human thigh length (Gavan, 1953).
normally distributed deviations at each time interval. The magnitudes ofthe deviations are independent of the amount of concurrent growth. Therate of asymmetry accumulation will depend on the magnitude of the de-viation per unit of time. For this reason, the slope of the FA accumulationobtained for the simulations summarized in Fig. 3 is arbitrary. These mod-els are lumped here, not because their potential causes are similar, butbecause they are probably indistinguishable solely on the basis of mor-phometric and life-history data.
Both the morphogenetic drift model and the functional asymmetry hy-pothesis predict that the size-relative asymmetry variance will increase dur-ing ontogeny in skeletal traits. To produce FA, however, the direction andmagnitude of functional-asymmetry must be normally distributed. Handed-ness in humans and probably in other hominoids (Fischer et al., 1982) pro-vides an obvious exception to this. In fact, the tendency toward asymmetryin many behaviors may not be normally distributed. When behaviors areself-reinforcing, one would expect most individuals to develop definite sidepreferences. For example, in the case of chewing, individuals may tend todevelop a preference for one side or the other. In such cases, functional
126 Hallgrimsson

Ontogenetic Patterns of Fluctuating Asymmetry 127
Fig. 3. The cumulative effect of a tendency for form to drift by a normally distributedmagnitude with a constant variance at each time interval. The method and source of dataare the same as in Fig. 2.
asymmetry would contribute to morphological antisymmetry—the increasedtendency to deviate to one side or the other—and not FA.
MATERIALS AND METHODS
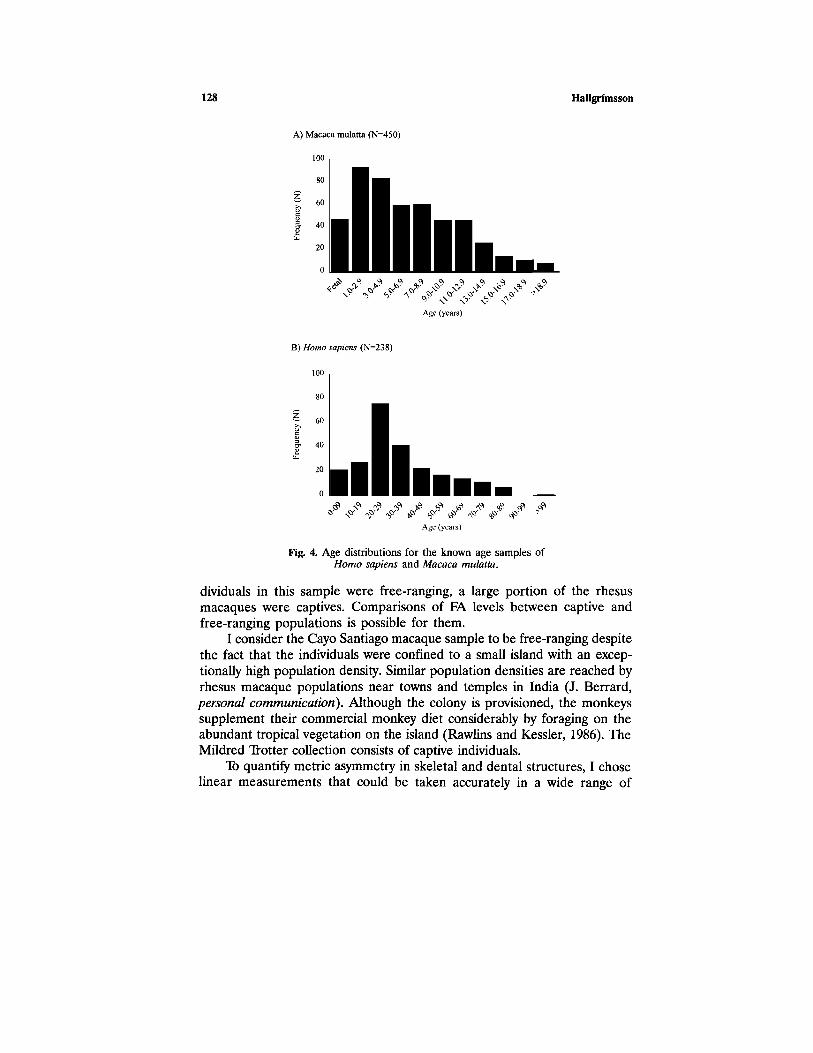
The macaque sample consists of semi-free-ranging Macaca mulattafrom Cayo Santiago (Caribbean Primate Research Center: N = 262) andindividuals from the Mildred Trotter collection of captive rhesus macaquesat NMNH (N = 246). The human sample consists of individuals from theTodd skeletal collection (N = 236), which is biased toward adults >40 years(Katz and Suchey, 1986) and was, therefore, sampled so as to obtain aneven age distribution. Figure 4 shows the absolute age distributions for thetwo known age samples that I used.
Populations within species can differ in mean heterozygosity as wellas their exposure to environmental stressors and selection intensity. Sincethese variables may affect FA, it is important to consider the magnitudeof geographic variation in FA within species, as well as differences in FAlevels between captive and free-ranging populations, when interpreting thesignificance of interspecific variation in FA. While the majority of the in-
128 Hallgrímsson
Fig. 4. Age distributions for the known age samples ofHomo sapiens and Macaco mulatta.
dividuals in this sample were free-ranging, a large portion of the rhesusmacaques were captives. Comparisons of FA levels between captive andfree-ranging populations is possible for them.
I consider the Cayo Santiago macaque sample to be free-ranging despitethe fact that the individuals were confined to a small island with an excep-tionally high population density. Similar population densities are reached byrhesus macaque populations near towns and temples in India (J. Berrard,personal communication). Although the colony is provisioned, the monkeyssupplement their commercial monkey diet considerably by foraging on theabundant tropical vegetation on the island (Rawlins and Kessler, 1986). TheMildred Trotter collection consists of captive individuals.
To quantify metric asymmetry in skeletal and dental structures, I choselinear measurements that could be taken accurately in a wide range of

mammalian species. Since I included bats in other related studies, I couldnot use measurements that rely on cranial sutures for landmark, e.g.,Lambda or Bregma). Further, many standard measurements rely on shape-dependent landmarks, e.g., glabella, vertex, inion) for which it is difficult todefine precise homologues in different species. Table I lists 22 measure-ments that I used.
I employed 12- or 6-in. digital calipers for all measurements expectlong-bone lengths in humans. The calipers outputted directly to a notebookcomputer where the reading (to 0.01 mm) was stored in a database. I meas-ured human long-bone lengths with an osteometric board.
Palmer and Strobeck (1986) discuss 9 different indices of fluctuatingasymmetry. They found that indices that use the signed asymmetry distri-bution are more effective at detecting differences in mean asymmetry be-tween groups than those that use absolute asymmetry values. Since groups
Ontogenetic Patterns of Fluctuating Asymmetry 129
Table I. Descriptions and Abbreviations of Measurements
A.
B.
C.
D.
Cranial meausrementsGlen-M1: The lateral edge of the articular eminence (glenoid tubercle) of the
mandibular fossa to the mesial margin of M1.Bas-EAM: The maximum distance from basion to the anterior margin of the external
auditory meatusEAM-IOF: The anterior margin of the external auditory meatus to the lateral margin
of the infraorbital foramen. If multiple infraorbital foramina were present, Imeasured the most lateral foramen.
C-M2: The maximum distance between the distal margin of M2 and the mesialmargin of the canine.
Orb-Ht; The maximum distance from the superior margin of the infraorbital foramento the supraorbital rim.
Orb-Wd: Maximum orbital width (or length).Dental measurementsMl-Wd: Maximum buccolingual diameter of Ml.M2-Wd: Maximum buccolingual diameter of M2.Ml-Wd; Maximum buccolingual diameter of deciduous ml.M2-Wd: Maximum buccolingual diameter of deciduous m2.Postcranial measurementsHum-length: Maximum length of humerus.Hum-APD: Anteroposterior diameter of humerus at midshaft.Rad-length: Maximum length of radius.Mcarp3: Maximum length of 3rd metacarpal.Fem-length: Biocondylar length of femur (maximum femoral length with both
condyles in contact with lower caliper arm or stationary edge of osteometric board).Fem-BCW: Maximum bicondylar diameter of femur.Fem-APD: Anteroposterior diameter of femur at midshaft.Tib-length: Maximum length of tibia.Mtars3: Maximum length of 3rd metatarsal.Measures of cranial sizeCranial-lgth: Maximum length of skull as measured from Alveolare to the most
posterior point on the occiput.BiZyg-D: The maximum bizygomatic diameter of the skull.

130 Hallgrimsson
may differ in mean character size, it is necessary to correct for size. Thefollowing index corrects for size by individual:
This index is a ratio, and ratios of this kind may produce nonnormal dis-tributions (Atchley et al., 1976). For this reason, the following index, whichalso scales for size by individual, is preferable.
A comparison of these indices reveals that they provide nearly identicalresults.
In analyzing the relationship between FA and character size or indi-vidual age, it is not possible to use Index 2 directly. In such cases, onewould have to use the absolute asymmetry values.
However, absolute asymmetry values have extremely right-skewed distribu-tions. This violates the regression analysis assumption that the data arenormally distributed about the regression line (Sokal and Rohlf, 1981). Thisproblem has largely been ignored in previous analyses of the relationshipbetween FA and character size (M011er, 1991; M011er and Hoglund, 1991;Hallgrimsson, 1993; Manning and Chamberlain, 1994).
I used the following method to deal with this problem. First, one sortsthe sample by ascending values of the independent variable (character sizeor individual age). Then one calculates the FA variance (Index 2) for everygroup of >5 individuals in ascending order by the independent variable.The group variances can then be regressed against the mean of the inde-pendent variable for each group.
I took 2 measurement trials of each individual in the Cayo Santiagocollections, as recommended by Palmer and Strobeck (1986). They foundthat repeated trials significantly increased the ability to discern differencesin similar groups. Due to time limitations, I did not take repeated trials ofthe Todd and Trotter collections. The accuracy of the estimate of a groupsmean FA can also be increased by using large samples so long as one alsoobtains an accurate estimate of the measurement error.
I estimated measurement error within groups by taking 6 repeated tri-als on 8 individuals, while varying their order, and calculated the measure-
(1)
(2)
(3)

ment error variance as the mean within-individual variance of the repeatedtrials for each species. One can correct the variances of the asymmetrydistributions for each species by subtracting the measurement error vari-ance. This is valid when the two variances are uncorrelated.
RESULTS
FA and Developmental Time in Homo sapiens
The human sample is composed of 236 individuals from the Todd col-lection (CMNH), which was compiled from unclaimed dead persons inCleveland between 1910 and 1936. The sample is of diverse geographicorigin. Indeed, most of Cleveland's residents at that time had emigratedfrom elsewhere. Unfortunately, samples from specific localities are notlarge enough to allow a systematic assessment of geographic variation inFA. Accordingly, I assume that age representation is not biased with respectto geographic origin. Individuals were classified by race at the time ofdeath. Although most individuals in the sample were probably of low socialstatus (Simmons, 1929), it is possible that individuals described as blackmay have been exposed to even higher levels of nutritional and diseasestress than those described as white. However, comparisons of FA for all17 characters using Levene's test revealed that individuals classified asblack or white do not differ significantly in asymmetry. The single margin-ally significant difference of 17 comparisons is expected by chance. I sam-pled the collection to ensure approximately equal sex representation acrossthe age distribution. Comparisons of all characters by Levene's test revealsthat the sexes do not differ significantly in FA.
A comparisons of age groups using Levene's test revealed no tendencyfor FA to increase during growth (Table II). Although adults had higherFA than juveniles in 8 of 10 comparisons, the only significant comparisoninvolves the opposite result.
To analyze further the patterning of FA throughout the lifespan in hu-mans, I divided the sample into consecutive nonoverlapping age groups of5 individuals and obtained the FA variance for each group. Figure 5 showsthe mean FA (Index 2) of postcranial and cranial measurements in eachage group plotted against mean group age for groups <20 year in age.There is a suggestive tendency for FA to increase with age in both sets ofmeasurements. Although the regressions (Model I) are not individually sig-nificant, the joint probability is [x2 = 10.36 (4 df), p < 0.05] (Sokal andRohlf, 1981). It is reasonable to calculate the joint probability in this case
Ontogenetic Patterns of Fluctuating Asymmetry 131

132 Hallgrimsson
Table II. Standard Deviations of Size-Relative FA Distributions by Age in Humansa
Measurement
Hum-lengthRad-lengthMcarp3Fern-lengthTib-lengthMtars3Glen-MiEAM-IOFOrb-HtSpn-Ht
Juveniles
0.0033 (9)0.0047 (9)0.0053 (4)0.0032 (8)0.0067 (8)0.0049 (4)0.0120 (2)0.0064 (4)0.0059 (8)0.0073 (5)
Subadults
0.0044 (15)0.0044 (16)0.0110 (13)0.0035 (18)0.0056 (19)0.0089 (14)0.0078 (18)0.0070 (19)0.0108 (23)0.0172 (22)
Adults
0.0044 (145)0.0056 (142)0.0065 (143)0.0039 (141)0.0034 (137)0.0073 (133)0.0090 (111)0.0105 (182)0.0140 (185)0.0191 (162)
Prob. (Levene'stest)
0.3350.4690.3490.7440.0020.672n.a.0.340.2480.77
aThe measurements listed were available for all age groups. The sample sizes for each agegroup are indicated in parentheses. The mean ages of the age groups are as follows: juveniles,1.5 years; subadults, 12.3 years; adults, 38 years.
because the cranial and postcranial asymmetry values (Index 3) are uncor-related within individuals (r = -0.03, p = 0.832).
A similar analysis of the relationship between FA and age over theentire lifespan in humans reveals that craniometric FA increases signifi-cantly throughout life, while postcranial FA does not. Figure 6 plots thestandard deviations of the size relative asymmetry distributions of each agegroup against mean group age for both the postcranial and cranial meas-urements. The regression coefficient for postcranial FA does not differ sig-nificantly from 0 (p = 0.41), while the regression coefficient for cranial FAagainst age is significant at the <0.01 level (p = 0.0047, r = 0.42). Althoughmuch of this increase in craniometric FA takes place before age 20, ananalysis of the remainder of the sample reveals a similar, albeit not statis-tically significant pattern (r = 0.318, p = 0.071). As one would expect,dental FA is not correlated with age in humans (r = 0.1, p = 0.376).
It is possible that the increase in the asymmetry variances duringgrowth could be attributable to antisymmetry. That finding would be con-sistent with the functional asymmetry hypothesis, but not with the two hy-potheses subsumed under the morphogenetic drift model. To test this, Iexamined the degree to kurtosis and skewness increase with age. If theincrease in asymmetry is due to antisymmetry, then one should find thatthe asymmetry distribution will deviate increasingly form normality withage. A change in kurtosis in either direction is consistent with an increasein antisymmetry. Increasingly platykurtic distributions are produced whenthe probability of deviation to each side are the same. Increasingly skewedand, more surprisingly, leptokurtic distributions are produced when theprobability of deviation toward one side is greater than the other (Palmerand Strobeck, 1986). Since accurate determination of kurtosis and skewness

Ontogenetic Patterns of Fluctuating Asymmetry 133
Fig. 5. Standard deviations of size-relative asymmetry in humans plot-ted against mean group age for groups aged <20 years. Each groupis composed of 5 individuals. Postcranial FA is the average of thestandard deviations and mean group ages for humeral, radial, meta-carpal, femoral, tibial, and metatarsal lengths. Cranial FA is the av-erage of the standard deviations of Glen-M1, EAM-IOF, Orb-Ht, andsphenoid height.
requires large samples, I divided the sample into two age groups as indi-cated in Table III. It shows the maximal antisymmetry consistent with theskewness and kurtosis obtained for each measurement within the agegroups. The calculation of this value is explained elsewhere (Hallgrimsson,1995, 1997). I assume here that skewness and kurtosis are measured accu-rately to one decimal place. For this reason, skewness (g1) and kurtosis(g2) values of 0 produce a maximal asymmetry of 22%. This is the upperconfidence limit of the antisymmetry produced in simulated distributions

134 Hallgrimsson
Fig. 6. Standard deviations of size-relative asymmetry for age groups plotted againstmean group age for the human sample. Each group is composed of 5 individuals. Post-cranial FA is the average of the standard deviations and mean group ages for humeral,radial, metacarpal, femoral, tibial, and metatarsal lengths. Cranial FA is the averageof the standard deviations of Glen-M1, EAM-IOF, Orb-Ht, and sphenoid height.
that had g1 and g2 values between -0.05 and 0.05. Assuming that g1 andg2 are estimated with equal precision in all cases is preferable to using thegreatest antisymmetry possible within the confidence intervals of gl andg2. In the latter case, sample size would be the primary determinant ofmaximal antisymmetry.

Ontogenetic Patterns of Fluctuating Asymmetry
After taking the standard error of the antisymmetry estimates into ac-count by adding the mean estimate variance to the within-group variance,a one-way ANOVA revealed no significant difference between the meanmaximal antisymmetry values for postcranial traits (F = 0.17, df = 10,1)and cranial traits (F = 0.36, df 6,1) between the two age groups. Althoughthe maximum antisymmetry estimates for each trait are high, none of thesedistributions actually deviate significantly from normality as determined bythe Lillefors test. Therefore, the antisymmetry estimates do not providepositive evidence for the existence of antisymmetry in these samples.
FA and Developmental Time in Macaca mulatta
The known age sample of Macaca mulatta consists of semifree-rangingmacaques from Cayo Santiago and captive macaques from the MildredTrotter collection (NMNH) (Table IV). This sample has a greater repre-sentation of immature individuals and thus permits a more detailed analysisof the relationship between FA and developmental time in cranial and post-cranial osteometric traits. The two collections that comprise the macaquesample represent very different environmental conditions and the popula-tions have fairly different histories. Therefore, one might expect them todiffer in FA. Since the Trotter collection is better represented among im-mature individuals, this could seriously confound an analysis based on thepooled macaque sample. Comparisons of FA for all characters by Levene'stest within the 3 age groups, however, revealed that only 4 characters showsignificantly different (p > 0.05) asymmetry variances of 40 comparisons.
135
Table III. Mean and Standard Error of the Maximal Antisymmetry Estimate for Youngand Old Humansa
Measurement
Postcranial traitsHum-lengthRad-lengthMcarpSFem-lengthTib-lengthMtars3
Cranial traitsGlen-MiEAM-IOFOrb-HtSpn-Ht
Age <30 years (%)
46 ±2649 ±2129 ± 1729 ±18
n.a.29 ± 12
32 ±1828 ± 1721 ± 743 ±22
Age >40 years (%)
31 +2271 ± 1031 + 2233 ±2029 ± 1856 ± 19
47 + 2532 ±1937 ±2345 ±23
aAntisymmetry is expressed as the maximal percentage of the variance that could be attrib-utable to antisymmetry. Distributions whose combined skewness and kurtosis values fell out-side the range produced by antisymmetric distributions are indicated by n.a.

136 Hallgrimsson
Table IV. Size-Relative FA (Index 2) by Age Groups and Geographic Provenance for Ma-caca mulattaa
ProvidenceMean age (yr)NHum-lengthRad-lengthMcarp3Fern-lengthTib-lengthMtars3Glen-MiBasFAaEAM-IOFOrb-HtSphn-HtOrb-wdCtom2FAaMl-wdM2-wd
Juveniles
Cayo0.93200.001800.002240.003950.002330.001950.006580.008250.007460.010480.009830.01140.00975n.a.n.a.n.a.
Trotter0.68570.002660.003850.004460.002220.002480.004480.01021n.a.0.011260.014080.015630.009750.00507n.a.n.a.
Subadults
Cayo3.43620.002540.003130.004090.002060.002340.003110.007320.009750.006970.011080.023260.006730.005620.005490.00588
trotter3.01750.002030.003180.005030.003330.002120.005870.007920.009170.007510.014830.025670.008850.003810.007430.00667
Adults
Cayo10.281780.002950.00350.004610.003010.002830.004090.006840.00890.007950.012060.023660.007570.005870.005330.0052
Trotter9.52580.001940.00280.004470.004890.002130.004950.005570.008420.008040.011410.024060.008910.004880.007860.00589
aThe sample sizes indicate the number of individuals in each age group. The samples forindividual measurements may be smaller due to missing values.
None of these p-values is below the Bonferroni-adjusted critical level fora = 0.05 (p = 0.00125) assuming 40 planned comparisons. Table IV showsthe FA (Index 2) by provenance and age groups for all characters analyzedhere. The standard deviations reported here for the Cayo Santiago sampleare based only on the first of the two trials.
The analysis of the effects of provenance and age on asymmetry iscomplicated by the fact that measures of individual asymmetry, e.g., Index3, are not normally distributed. Therefore, the use of an analysis of covari-ance is not valid. Instead, I compared age and provenance groups by jack-knifing the standard deviations of each group. This procedure generates asampling distribution of standard deviations (or any other sample parame-ter) via the following equation:
in which 0 is the standard deviation of the sample with one individual (i)removed and 0total is the standard deviation of the original distribution(Manly, 1991; Van Valen, 1978). The distributions of J can be comparedamong samples using an analysis of variance (Van Valen, 1978). Table Vpresents the p-values for two-way analyses of variance comparing size rela-tive FA between age and provenance groups. With the exception of femorallength, there is no significant age and provenance interaction. The reason

Table V. P- Values for Comparisons of Size-Relative FA by Jackknifinga
Mesurement
Hum-lengthRad-lengthMcarp3Fem-lengthTib-lengthMtars3Glen-MiBas-EAMb
EAM-IOFOrb-HtSpn-HtOrb-wdCtom2FAb
Ml-wdb
M2-wdb
Age * provenience
0.1050.2760.189
<0.0010.5500.0070.2160.9550.9590.2340.9640.7530.4360.5740.942
Provenience
0.7040.5790.481
<0.0010.8810.6560.4970.5310.7220.0320.3090.1140.198
<0.0010.321
Age
0.7200.9890.809
<0.0010.6400.1730.0100.3570.0140.7530.0060.1670.3950.8610.102
aThe jackknifed standard deviation distributions are compared by age group and provenienceusing a two-way analyses of variance.
bJuveniles excluded due to small sample size or absence of trait.
for the interaction in this case may be that femora were available only forvery young juveniles in the Trotter collection. Provenance does not appearto affect FA significantly for the osteometric measurements. However, the factthat the FA of first molar diameter is significantly higher in the Trotter col-lection is suggestive, since FA in dental traits has shown higher sensitivity toenvironmental stress than osteometric FA (Siegel et al., 1992). This comparisondoes not reveal any tendency for postcranial FA to increase with age. However,3 of the 5 cranial characters that are represented by sufficiently large samplesof juveniles showed significant tendencies for FA to increase.
I took two trials of each measurement on the Cayo Santiago sample.This increases the accuracy in estimating individual asymmetry and allowsage-specific correction for measurement error. I determined FA by aver-aging the individual asymmetry values as obtained using Index 2:
Ontogenetic Patterns of Fluctuating Asymmetry 137
I determined measurement error as the distribution of differences in theasymmetry estimates of each trial:

Table VI. Measurement Error for the Measurements Taken on Macaca mulattaa
Measurement
Hum-lengthRad-lengthMcarp3Fern-lengthTib-lengthMtars3Glen-MiBas-EAMEAM-IOFOrb-HtSpn-HtOrb-wdMl-wdM2-wdMl-wdM2-wd
FA
0.00270.00320.00430.00270.00260.00370.00680.00820.00780.0110.02190.00610.00480.00470.00550.0079
Error
0.000190.000170.000690.000140.000620.000960.001900.005630.001190.002990.005430.006100.004970.003990.005770.00667
% error
7.36.6
16.75.9
23.329.628.170.217.128.128.5100+100+96.2100+88.0
aFA is calculated as the mean asymmetry values obtained from two trials. Measurement erroris the standard deviation of the distribution of differences in asymmetry values between trials.% error is (error/FA)*100.
Table VI presents these two indices for all of the measurements that Iused in this analysis. Since FA is reported here as the mean of two trials,which reduces the asymmetry variances, it is possible for the error to be100% when it is expressed as a percentage of FA. Based on these results,I excluded orbital width from the analysis. I also excluded C-M2 becausethe asymmetry variance of this measurement in immature individuals isprobably confounded by asymmetry in dental eruption times and also be-cause this measurement cannot be taken on many immature individuals.Including this measurement affects the results of the analysis significantly.
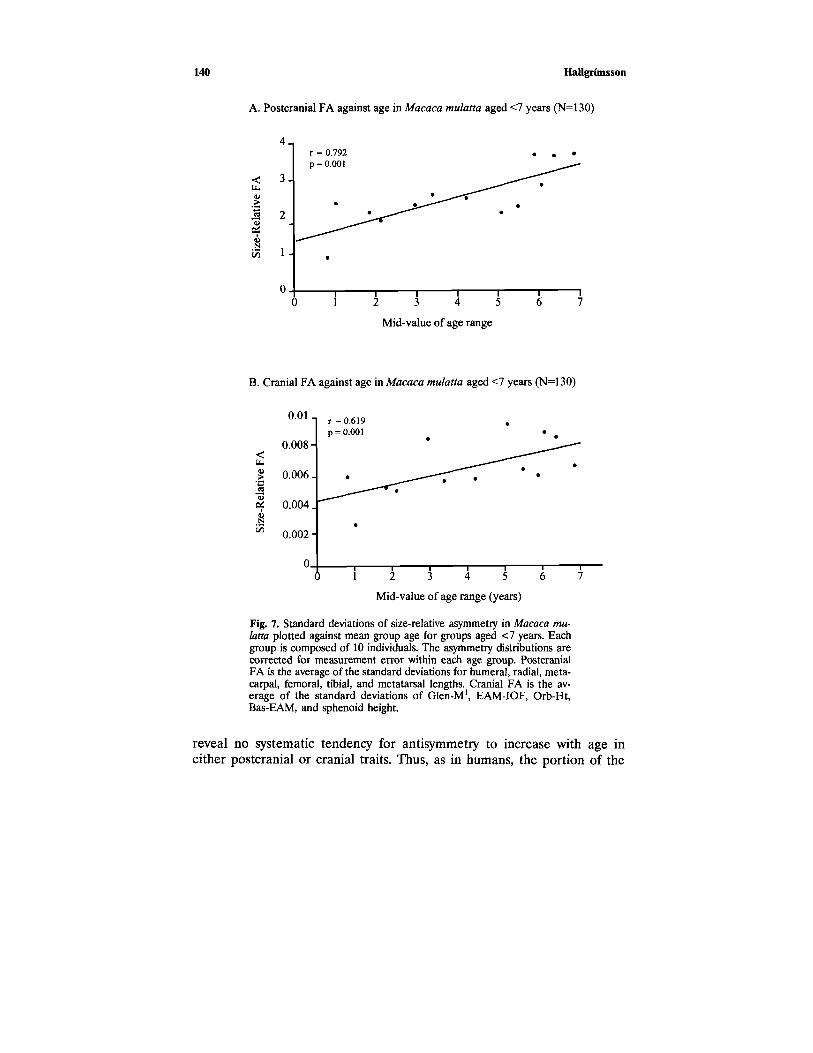
I divided the sample into age groups based on a sorting of the databy age. Since the sample size for this data set is quite large, I divided thesample into age groups of 10 individuals. This improves the estimation ofthe standard deviation in each age group considerably over the smallergroups used in the analysis of the human sample. Using Index 2 for re-peated trials, I calculated FA as the standard deviation of the size-relativeasymmetry distribution for each age group. I corrected for measurementerror by subtracting the measurement error variance from the FA variance.This improved the correlation between age and FA slightly due to a ten-dency for measurement error to decrease with age. Table VII reports linearregressions for size-relative FA against mean group age both with and with-out correction for measurement error for immature individuals, adults, andthe entire sample. Figures 7 and 8 are plots of these relationships for im-mature individuals and the whole sample.
Hallgrimsson138

As the results summarized in Table VII and Figs. 7 and 8 show, thereis a significant tendency for size-relative asymmetry to increase with ageup to 6 years of age. Analysis of older individuals did not reveal a continuedtendency for FA to increase with age, though the regression coefficientsfor the whole age range are significantly different from 0. Rhesus macaquesreach 90% of adult body mass between 6 and 7 years of age (Wagenenand Catchpole, 1956), and long bone epiphyses fuse at various times be-tween the ages of 2 and 6 (Watts, 1986). Growth in cranial size also appearsto stop between 5 and 7 years of age in both males and females. Thus, itappears that FA is increasing with age during the period of growth, broadlyconceived, with little change during the remainder of life.
Figure 9 plots the mean cranial size and cranial FA for each age groupagainst mean age for both males and females. I used the following indexas a measure of cranial size:
where L is the maximum cranial length and W is the bizygomatic width.As this graph shows, the growth in the size-relative asymmetry variancewith age appears to be roughly correlated with the increase in cranial size.
To determine whether this analysis adequately accounts for the effectsof size on FA, I assessed whether the residuals of the correlation betweenunsealed asymmetry (AS \R-L\) correlated with size. In individuals <7years, the geometric mean of absolute raw asymmetry correlates signifi-cantly with age (r = 0.54, p < 0.01). However, the residuals of this regres-sion do not correlate with the geometric mean of character size (r = 0.00,p = 0.86). This confirms that FA index 2 adequately accounts for the effectsof character size on FA.
To determine whether the increase in asymmetry with age might bedue to an increase in antisymmetry, I repeated the procedure used to cal-culate maximum antisymmetry in humans, assuming that skewness and kur-tosis are known to 1 decimal place. These results, plotted in Table VIII,
Ontogenetic Patterns of Fluctuating Asymmetry 139
Table VII. Results of Regressions of Size-Relative FA Against Age
Postcranial FACorr. Postcran. FACranial FACorr. cranial FA
Age <7
Slopee
0.0010.0020.0090.004
r
0.7340.7920.4380.619
Prob.
0.0040.0010.1350.024
Age>7
Slopee
0.0040.0030.0120.008
r
0.1710.0680.0270.106
Prob.
0.5770.8250.9290.730
Whole sample
Slope
0.0030.0020.0100.006
r
0.3590.4620.4020.551
Prob.
0.0710.0180.0420.004
140 Hallgrimsson
Fig. 7. Standard deviations of size-relative asymmetry in Macaca mu-latta plotted against mean group age for groups aged <7 years. Eachgroup is composed of 10 individuals. The asymmetry distributions arecorrected for measurement error within each age group. PostcranialFA is the average of the standard deviations for humeral, radial, meta-carpal, femoral, tibial, and metatarsal lengths. Cranial FA is the av-erage of the standard deviations of Glen-M1, EAM-IOF, Orb-Ht,Bas-EAM, and sphenoid height.
reveal no systematic tendency for antisymmetry to increase with age ineither postcranial or cranial traits. Thus, as in humans, the portion of the

141
Fig. 8. Standard deviations of size-relative asymmetry in Macaca mu-latta plotted against mean group age. Each group is composed of 10individuals. The asymmetry distributions are corrected for measure-ment error within each age group. Postcranial FA is the average ofthe standard deviations for humeral, radial, metacarpal, femoral, tib-ial, and metatarsal lengths. Cranial FA is the average of the standarddeviations of Glen-M1, EAM-IOF, Orb-Ht, Bas-EAM, and sphenoidheight. I chose the best-fit line simply to illustrate the nonlinear re-lationship between FA and age throughout the life span.
asymmetry distribution attributable to antisymmetry does not appear to in-crease with age for cranial traits in the macaque sample.
Ontogenetic Patterns of Fluctuating Asymmetry

Fig. 9. The relationship between cranial FA and cranial growth in Macaca mulatta. Thisgraphic is a plot of cross-sectional growth in cranial size for males and females separately.Females are indicated by the lower growth curve. FA values are indicated by the solid dotsand the best-fit line.
DISCUSSION
The results of the analysis of the relationship between FA and devel-opmental time in macaques and humans can be summarized as follows.
Table VIII. Mean Maximal Antisymmetry Estimates in Youngand Old Rhesus Macaquesa
Measurement
Postcranial traitsHum-lengthRad-lengthMcarp3Fern-length
Tib-lengthMtars3
Cranial traitsGlen-MiEAM-IOFOrb-HtBas-EAMSpn-HtMean
Age <6 years(%)
445922215537
502226376440
Age >7 years(%)
54>55
49233255
385755355646
aAntisymmetry is expressed as the maximal percentage of the vari-ance that could be attributable to antisymmetry.
142 Hallgrimsson
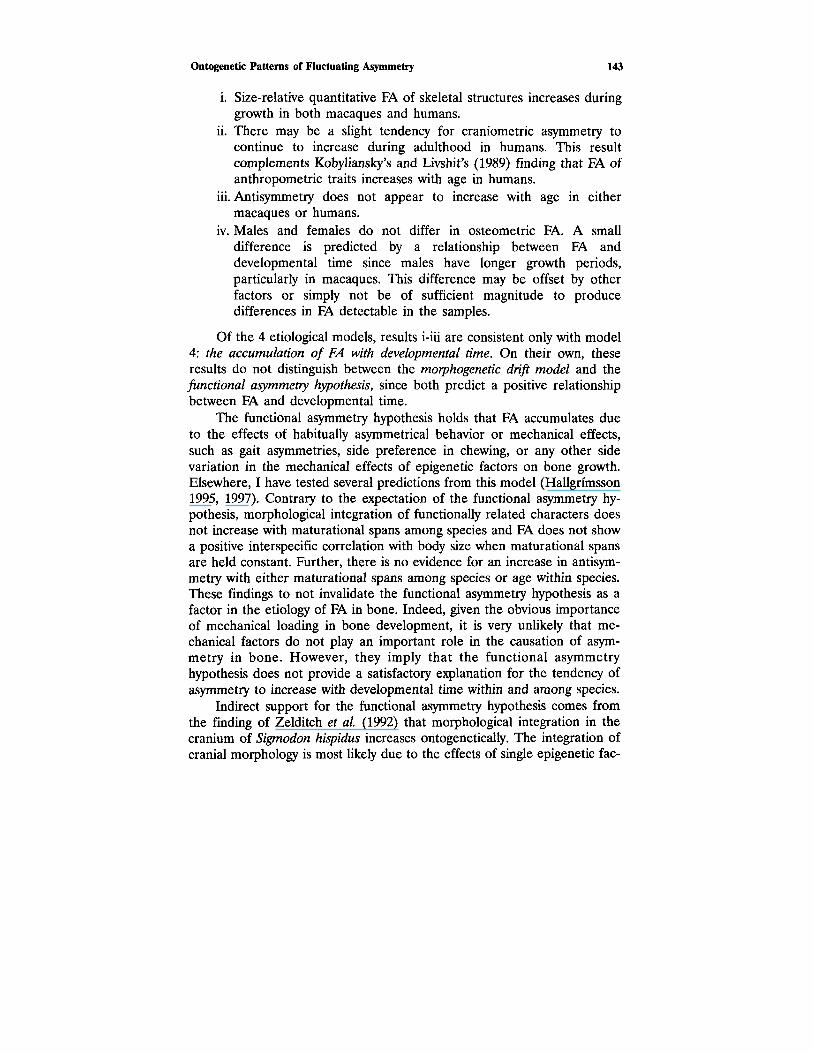
i. Size-relative quantitative FA of skeletal structures increases duringgrowth in both macaques and humans.
ii. There may be a slight tendency for craniometric asymmetry tocontinue to increase during adulthood in humans. This resultcomplements Kobyliansky's and Livshit's (1989) finding that FA ofanthropometric traits increases with age in humans.
iii. Antisymmetry does not appear to increase with age in eithermacaques or humans.
iv. Males and females do not differ in osteometric FA. A smalldifference is predicted by a relationship between FA anddevelopmental time since males have longer growth periods,particularly in macaques. This difference may be offset by otherfactors or simply not be of sufficient magnitude to producedifferences in FA detectable in the samples.
Of the 4 etiological models, results i-iii are consistent only with model4: the accumulation of FA with developmental time. On their own, theseresults do not distinguish between the morphogenetic drift model and thefunctional asymmetry hypothesis, since both predict a positive relationshipbetween FA and developmental time.
The functional asymmetry hypothesis holds that FA accumulates dueto the effects of habitually asymmetrical behavior or mechanical effects,such as gait asymmetries, side preference in chewing, or any other sidevariation in the mechanical effects of epigenetic factors on bone growth.Elsewhere, I have tested several predictions from this model (Hallgrimsson1995, 1997). Contrary to the expectation of the functional asymmetry hy-pothesis, morphological integration of functionally related characters doesnot increase with maturational spans among species and FA does not showa positive interspecific correlation with body size when maturational spansare held constant. Further, there is no evidence for an increase in antisym-metry with either maturational spans among species or age within species.These findings to not invalidate the functional asymmetry hypothesis as afactor in the etiology of FA in bone. Indeed, given the obvious importanceof mechanical loading in bone development, it is very unlikely that me-chanical factors do not play an important role in the causation of asym-metry in bone. However, they imply that the functional asymmetryhypothesis does not provide a satisfactory explanation for the tendency ofasymmetry to increase with developmental time within and among species.
Indirect support for the functional asymmetry hypothesis comes fromthe finding of Zelditch et al. (1992) that morphological integration in thecranium of Sigmodon hispidus increases ontogenetically. The integration ofcranial morphology is most likely due to the effects of single epigenetic fac-
Ontogenetic Patterns of Fluctuating Asymmetry 143
tors on specific areas of the cranium (Cheverud, 1995). The effect of thebrain on the neurocranium or of the masticatory muscles on specific areas ofthe face are the primary examples of this (Moss and Meehan, 1970; Moss,1968,1972a, b). The integrating effects of these epigenetic factors might pro-duce an increase in asymmetry as a simple statistical artifact of the reductionin the number of independently varying components (Lande, 1977). In effect,as single epigenetic factors increasingly dominate a trait complex throughoutgrowth, the effect would be to produce groups of traits with correlated signsand magnitudes of asymmetry. If these integrating factors exert a powerfulpull towards a certain sidedness, they will produce an increase in asymmetrywith growth. If they are not powerful, however, their effect might be only toaverage out opposite-signed asymmetries, producing a net decrease in asym-metry. These possibilities could be studied further by examining the relation-ship between ontogenetic patterns of integration and FA in a larger numberof cranial traits than used in this study. A relationship between the integra-tion of a set of traits affected by a common epigenetic factor with asymmetryin an ontogenetic series would provide positive evidence for the functionalsymmetry hypothesis.
The alternative to the functional asymmetry hypothesis is the morpho-genetic drift model. It holds that FA accumulates either due to a tendencyfor variation to accumulate in the mechanisms that regulate bone growthand development or via the tendency for bone shape to change throughthe passive process of bone turnover. Both of these alternatives are con-sistent with my result. While not as obvious as the functional asymmetryhypothesis, the morphogenetic drift model is a compelling explanation forthe relationship between FA and developmental time for several reasons.The development of individual organisms is a highly organized process thatproduces remarkably replicable results. Intuitively, one might expect thatthe longer such a process needs to be maintained, the less replicable theresults would be. Elsewhere, I have discussed several possible mechanismsfor time-dependent accumulation of variation in the mechanisms of bonegrowth and development (Hallgrimsson, 1995, 1997).
The observation that FA increases with maturational spans raises thepossibility that decreased stability of skeletal development could be a costin the evolution of prolonged growth periods. The accumulation of FA withdevelopmental time could create this adaptive trade-off in two ways. Firstly,FA may have the potential to accumulate to degrees that are directlymaladaptive. Estimates for the mean FA of different characters in variousspecies reported in the literature range from <1-19% (Hallgrimsson,1993b; Noss et al., 1983; Wayne et al., 1986) of character size. In manyaspects of bone morphology, in some joints, and in the developmental in-teraction with surrounding structures, such magnitudes of asymmetry may
144 Hallgrimsson

be maladaptive. For example, consider the biomechanical effects of FA inlumbar vertebral dimensions, in vertebral articular processes, or in the earossicles. A recent study shows that racehorses with lower FA in both post-cranial and cranial metric traits are more successful (Manning and Ocken-den, 1994). This may reflect an underlying relationship between FA andother factors related to racing ability, or it may reflect a direct relationshipbetween structural asymmetry and mechanical efficiency during locomotion.Moreover, one must consider that the apparently direct relationship be-tween osteometric FA and developmental time implies each of the minordisadvantages of asymmetry throughout an individual contribute to a singledevelopmental unit upon which selection can act. Although the asymmetryvalues of different structures are poorly correlated or uncorrelated withinindividuals (Hallgrimsson, 1993b; Patterson and Patton, 1990; Van Valen,1962), evolutionary changes in maturational spans should produce corre-lated responses in FA. Thus, although slight deviations from symmetry inindividual characters may not be significant in each individual case, the neteffect of deviation from symmetry throughout the skeleton may be func-tionally significant.
An objection to the argument that time-dependent accumulation ofasymmetry could be relevant to life-history evolution is that mechanicallymediated remodeling ensures biomechanical adaptation of bone throughoutmost of life. However, this may not always be true. Mechanically stimulatedremodeling responds to local changes in strain (Frost, 1964; Rubin and Lan-yon, 1984). While this allows bone to adapt to local stresses, there is nomechanism that prevents functional degradation of the structure as a whole.For example, the articular processes of lumbar vertebrae may be subjectto remodeling in response to local stresses, which may differ between thetwo sides. Differences may accumulate resulting from local adaptation thatwill then serve to accentuate eccentric stresses on the intervertebral jointsin general. Similarly, local remodeling in response to habitual asymmetryin gait may serve to adapt structures on either side to the local stressesproduced by that gait, and in so doing produce a degradation of overalllocomotory performance. Further, although biomechanical feedback usuallyprevents bone morphology from drifting in maladaptive directions, this isnot always the case. In the case of structures exposed to extremely infre-quent but intense stresses (in accidents or unusual exertions), the normalpattern of stress may not be sufficient to ensure biomechanical adaptation.Lanyon (1992) argues that the remodeling of the trabecular frameworkwithin vertebral bodies provides an example of this. In such cases, selectionwould act to preserve developmentally specified from against the tendencyfor undirected remodeling to alter it. The morphology of other skeletalstructures may well reflect the interplay of adaptive—mechanically medi-
Ontogenetic Patterns of Fluctuating Asymmetry 145

ated—remodeling and other developmental processes to various degrees.The buffering of these processes is probably subject to selection.
Alternatively, the accumulation of FA may be a symptom of varioustypes of time-dependent degenerative processes. For example, one currenthypothesis for the etiology of atherosclerosis implicates the accumulationof damage to the mechanisms of cellular repair in the tunica intima (Finch,1990). It is possible that the decoupling of local osteoblast and osteoclastactivity with age derives from an analogous process. Similarly, the accumu-lation of cross-linkage in collagen molecules which may contribute to theaccumulation of FA, is also implicated in the etiology of osteoarthritis be-cause it contributes to the age related increase in the brittleness of articularcartilage (Finch, 1990). The accumulation of cross-linkage in elastin mayalso contribute to atherosclerosis (Finch, 1990). Inactive or altered enzymesappear to accumulate in many mammals with increasing age due to slowedprotein turnover (Rothstein, 1985). This may contribute to disturbances inthe regulations of bone remodeling, as well as many other processes. Gly-cation and the nonreversible accumulation of glycated end-products affectsmany long-lived proteins and has been implicated in various processes thatcontribute to aging.
Besides collagen, an age-related increase in glycation has also beenobserved for osteocalcin (Gundberg et al., 1986). It is possible that increasesin glycation with age also occur in other bone matrix proteins, many ofwhich perform important functions in the mechanisms of bone remodeling.
Thus, FA in bone may contribute to a constraint on maturational spansand longevity directly through a decrease in the canalization of skeletaldevelopment, or it may reflect the cumulative effect of processes that affectthe regulation of development.
The finding that size-relative FA increases ontogenetically is a strikingcontrast to the fact that morphological variances for craniofacial traits ap-pear to decrease ontogenetically (Nonaka and Nakata, 1984; Zelditch etal., 1993). Variation among individuals at any specific point during ontogenyhas two components. The first is variation in the shape of ontogenetic tra-jectories and the second is variation in the location of individuals alongtheir ontogenetic trajectories: timing (Tanner, 1978).
One interpretation of the tendency for variances to decrease ontoge-netically is that as individuals progress along ontogenetic trajectories, themagnitude of the variation explained by timing decreases. The observationby Miyake et al. 1996; Hall and Miyake, 1995) that the among individualvariability in stage of craniofacial development decreases with absolute timethroughout embryonic development provides a direct example of this. Thus,given the strong possibility that the timing-related variation decreases on-togenetically among individuals, it is interesting to note that there is not
146 Hallgrimsson

an analogous pattern of decrease in FA caused by an ontogenetic decreasein the magnitude of within-individual variation in timing, i.e., as predictedby Model 3).
This observation may have clinical implications in that these resultsdo not support the commonly held view that minor asymmetries in youngchildren will tend to correct themselves later on. One should note, however,that pathological asymmetries often have very different causes that the mi-nor deviations from symmetry seen in normal individuals and they may in-crease or decrease during growth depending on their cause.
Implications for Human and Primate Evolution
The finding that the FA variance of skeletal structures is related toontogenetic time raises the possibility of an adaptive trade-off between thebenefits of prolonged maturation and the cost of increased FA in mam-malian evolution. Primates are slow growers among mammals (Wootton,1986). Accordingly, a decrease in developmental stability would be yet an-other cost that must be considered by explanations for the evolution ofprolonged development in primates.
Hominoids, and humans in particular, show elevated osteometric FAversus mammals with shorter maturational spans (Hallgrimsson, 1995).Even accounting for body size, humans are extreme outliers on the distri-butions of mammalian maturational spans and longevity (Sacher, 1959).Comparisons of the chronological age at which M1 erupts in fossil hominoidspecimens reveals a gradually lengthened maturational span from Aus-tralopithecus to archaic Homo sapiens (Smith, 1991). The adaptive value ofprolonged maturation during this period must have been sufficient to offsetthe functional cost of increased FA along with other costs such as prere-productive mortality. While it is difficult to assess the functional signifi-cance of FA, it should be possible to model the biomechanicalconsequences of asymmetry in skeletal structures such as limb elements.Comparisons of such models with the results of this study could providesome idea of how important the direct effects of asymmetry on functionhave been in primate and, especially, human evolution.
CONCLUSION
This study confirms my earlier finding that the FA variances of skeletalstructures have a tendency to increase ontogenetically. This observation isnot consistent with the hypotheses that FA in bone derives mainly from (a)
Ontogenetic Patterns of Fluctuating Asymmetry 147

variation in the initial conditions of a developmental process, (b) the effectsof random perturbations on growth, and (c) the effect of random variationin growth with time. In contrast, it is consistent with the hypotheses that FAin bone is caused primarily by cumulative effects of asymmetrical mechanicalfactors, accumulation of variation in the (local) regulation of growth, or atendency for bone form to drift through undirected remodeling.
I addressed a subset of the broader problem of how precisely devel-opmental mechanisms determine morphology. The two models that I con-sider as explanations for the relationship between FA and developmentaltime derive from rather different views of bone development. The func-tional-asymmetry hypothesis is consistent with the view that bone shape isdetermined predominantly by mechanical factors (Herring, 1993; Moss andMeehan, 1970, 1972a, b). In contrast, the morphogenetic-drift model ismore consistent with a larger role for intrinsic genetic factors in bone de-velopment. It relies on variation in regulation of the intrinsic mechanismsof bone growth. Therefore, this model assumes the existence of processesother than mechanical stimulation that direct the remodeling of growingbones towards adult morphologies.Here, bone growth involves the interplayof the deterministic effects of these processes, mechanically-stimulated re-modeling, and the accumulating effects of random variation. In this case,as argued by Reeve and Robertson (1953), developmental noise is a fun-damental property of the developmental process and not simply an unex-plained error variance.
ACKNOWLEDGMENTS
This paper is drawn from my dissertation which was supervised byRussell Tuttle and Leigh Van Valen. I am indebted to Jane Buikstra, DanMcShea, Bruce Patterson, Brian Hall, Ronald Singer, Richard Thorington,Virginia Maiorana, Sharon Swartz, Bruce Latimer, Kate Blue, Lee Blue,Charles Musiba, Jean Turnquist, John Cant, Donald Dunbar, Pat Luckett,Rex Haydon, Nene Lozada, Melissa Stoller, Hallgrimur Benediktsson, andTamara Stein for help and discussion. I thank Richard Thorington, CraigLudwig, Bruce Latimer, Lyman Jellema, Bill Stanley, Julian Kerbis, BrucePatterson, Jean Turnquist, and Nancy Hong for access to skeletal collectionsand assistance with their use. This work was supported by postgraduateScholarships from the National Science and Engineering Council of Can-ada, a Sir Frederick Haultain Fellowship, a Smithsonian Institution Gradu-ate Student Fellowship, the Josephine de Kaman Fund, the University ofChicago Hinds Fund, RCMI Grant RR 03051.
148 Hallgrimsson

REFERENCES
Atchley, W. R., Gaskins, G. T., and Anderson, D. (1976). Statistical properties of ratios. I.empirical results. Syst. Zool. 25: 137-148.
Cheverud, J. M. (1995). Morphological integration in the saddle-back tamarin (Saguinusfuscicollis) cranium. Am. Nat. 145: 63-89.
Ferguson, M. M. (1985). Developmental stability of rainbow trout hybrids: Genomiccoadaptation or heterozygosity. Evolution 40: 323-330.
Finch, J. (1990). Longevity, Senescence and the Genome, University of Chicago Press, Chicago.Fischer, R. B., Meunier, G. F., and White, P. J. (1982). Evidence of laterality in the lowland
gorilla. Perc. Motor Skills 54: 1093-1094.Frost, H. M. (1964). The Laws of Bone Structure, Charles C Thomas, Springfield, IL.Garn, S. M., Lewis, A. B., and Kerewsky, R. S. (1967). Buccolingual size asymmetry in the
permanent dentition. Angle Orthod. 37: 186-193.Gavan, J. A. (1953). Growth and development of the chimpanzee: A longitudinal and
comparative study. Hum. Biol. 25.Gundberg, C. M., Anderson, M., and Dickson, I. (1986). Glycated osteocalcin in human and
bovine bone. J. Biol. Chem. 261: 14557-14561.Hall, B. K., and Miyake, T. (1995). How do embryos measure time. In McNamara, K. J. (ed.),
Evolutionary Change and Heterochrony, John Wiley & Sons, Chichester, pp. 4-20.Hallgrimsson, B. (1993a). Fluctuating asymmetry in Macaca fascicularis: A study of the etiology
of developmental noise. Int. J. Primatol. 14: 421-443.Hallgrimsson, B. (1993b). Fluctuating asymmetry in Macaca fascicularis: Implications for the
etiology of developmental noise. Suppl. 16: 102.Hallgrimsson, B. (1995). Fluctuating Asymmetry and Maturational Spans in Mammals:
Implications for the Evolution of Prolonged Development in Primates, Ph.D. thesis,University of Chicago, Chicago.
Hallgrimsson, B. (1997). Fluctuating asymmetry in the mammalian skeleton: Evolutionary anddevelopmental implications. In Hecht, M. K., and Clegg, M. T. (eds.), EvolutionaryBiology, Vol. 30, pp. 187-251.
Herring, S. (1993). Formation of the vertebrate face: Epigenetic and functional influences.Am. Zool. 33: 472-483.
Hershkovitz, I., Livshits, G., Moskona, D., Arensburg, B., and Kobyliansky, E. (1993).Variables affecting dental fluctuating asymmetry in human isolates. Am. J. Phys.Anthropol. 91: 349-365.
Katz, D., and Suchey, J. M. (1986). Age determination of the male Os Pubis. 69: 427-435.Kobyliansky, E., and Livshits, G. (1989). Age dependent changes in morphometric and
biochemical. Ann. Hum. Biol. 16(3): 237-247.Lande, R. (1977). On comparing coefficients of variation. Syst. Zool. 26: 214-217.Lanyon, L. E. (1992). The success and failure of the adaptive response to functional
load-bearing in averting bone fracture. Bone 13: s17-s21.Livshits, G., and Kobyliansky, E. (1991). Fluctuating asymmetry as a possible measure of
developmental homeostasis in humans: A review. Hum. Biol. 63: 441-466.Manly, B. F. J. (1991). Randomization and Monte Carlo Methods in Biology, Chapman and
Hall, London.Manning, J. T., and Chamberlain, A. T. (1994). Fluctuating asymmetry in Gorilla canines: A
sensitive indicator of environmental stress. Proc. R. Soc. Lond. B. Biol. Sci. 255(1343):189-193.
Manning, J. T., and Ockenden, L. (1994). Fluctuating asymmetry in racehorses. Nature 370:185-186.
Miyake, T., Cameron, A. M., and Hall, B. K. (1996). Detailed staging of inbred C57BL/6mice between Theiler's [1972] stages 18 and 21 (11-13 days of gestation) based oncraniofacial development. J. Craniofac. Genet. Dev. Biol. 16: 1-31.
Moller, A. P. (1991). Sexual ornament size and the cost of fluctuating asymmetry. Proc. R.Soc. Lond. B 243: 59-62.
Ontogenetic Patterns of Fluctuating Asymmetry 149

Moller, A. P., and Hoglund, J. (1991). Patterns of fluctuating asymmetry in avian featherornaments—Implications for models of sexual selection. Proc R. Soc. Lond. B 245(1312):1-5.
Moore, W. J. (1965). Masticatory function and skull growth. J. Zool. 146: 123-131.Moore, W. J. (1973). An experimental study of the functional components of growth in the
rat mandible. Acta Anat. 85: 378-385.Moss, M. L. (1968). The primacy of functional components in orofacial growth. Dent. Pract.
19: 56-73.Moss, M. L. (1972a). functional cranial analysis and the functional matrix. In Schumacher,
G.-H. (ed.), Morphology of the Maxillo-Mandibular Apparatus, Veb Georg Thieme, Leipzig,pp. 160-165.
Moss, M. L. (1972b). The regulation of skeletal growth. In Goss, R. (ed.), Regulation of Organand Tissue Growth, Academic Press, New York, pp. 59-66.
Moss, M., and Meehan, M.-A. (1970). Functional cranial analysis of the coronoid process inthe rat. Acta Anat. 77: 11-24.
Nonaka, K., and Nakata, M. (1984). Genetic variation and craniofacial growth in inbred rats.J. Craniofac. Genet. Dev. Biol. 4: 271-302.
Noss, J. F, Scott, G. R., Yap Potter, R. H., and Dahlberg, A. (1983). fluctuating asymmetryin molar dimensions and discrete morphological traits in Pima Indians. Am. J. Phys.AnthropoL 61: 437-445.
Novak, J. M., Rhodes, O. E., Smith, M. H., and Chesser, R. K. (1993). Morphologicalasymmetry in mammals: Genetics and homeostasis reconsidered. Acta Theriol. 38: 7-18.
Palmer, A. R., and Strobeck, C. (1986). Fluctuating asymmetry: Measurement, analysis,patterns. 17: 391-421.
Patterson, B. D., and Patton, J. L. (1990). Fluctuating asymmetry and allozymic heterozygosityamong natural populations of pocket gophers (Thomomys bottae'). Biol. J. Linn. Soc. 40:21-36.@ref alpha = Rawlins, R. G., and Kessler, M. J. (1986). Demography of thefree-ranging Cayo Santiago macaques. In Rawlins, R. G., and Kessler, M. J. (eds.), TheCayo Santiago Macaques. State University of New York Press, Albany, pp. 47-72.
Reeve, E. C. R., and Robertson, F. W. (1953). Analysis of environmental variability inquantitative inheritance. Nature 171: 874-875.
Roth, V. L. (1989). Fabricational noise in elephant dentitions. Paleobiology 15: 165-179.Rothstein, M. (1985). The alteration of enzymes in aging. Modem Aging Res. 7: 53-67.Rubin, C. T., and Lanyon, L. E. (1984). Regulation of bone formation by applied dynamic
loads. J. Bone Joint. Surg. 66A: 397-402.Sacher, G. A. (1959). Relation of lifespan to brain weight and body weight in mammals. GIBA
Foundation Symposium on the Lifespan of Animals.Sacher, G. A. (1975). Maturation and longevity in relation to cranial capacity in hominoid
evolution. In Turtle, R. H. (ed.), Primate Functional Morphology and Evolution, Mouton,The Hague, Paris, pp. 417-442.
Saunders, S. R., and Mayhall, J. T. (1982). Fluctuating asymmetry of dental morphologicaltraits: New interpretations. Hum. Biol. 54: 789-799.
Schmalhausen, I. I. (1949). Factors of Evolution, University of Chicago Press, Chicago.Siegel, M. I., Mooney, M. P., and Taylor, A. B. (1992). Dental and skeletal reduction as a
consequence of environmental stress. Acta Zool. Fenn. 191: 145-149.Simmons, K. (1929). Cranial capacities by both plastic and water techniques with cranial linear
measurements of the Reserve collection; White and Negro. Hum. Biol. 473-498.Smith, B. H. (1991). Dental development and the evolution of life history in Hominidae. Am.
J. Phys. Anthropol. 86: 157-174.Sokal, R. R., and Rohlf, F. J. (1981). Biometry, W. H. Freeman;, New York.Tanner, J. M. (1978). Fetus into Man, Harvard University Press, Cambridge, MA.Van Valen, L. M. (1962). A study of fluctuation asymmetry. Evolution 16: 125-142.Van Valen, L. M. (1978). The statistics of variation. Evol. Theory 4: 33-43.Waddington, C. H. (1957). The Strategy of the Genes, Macmillan, New York.Wagenen, G. V., and Catchpole, H. R. (1956). Growth of the fetus and placenta of the monkey
(Macaca mulatta). Am. J. Phys. Anthropol. 23: 23-34.
150 Hallgrimsson

Wakefield, J., Harris, K., and Markow, T. A. (1993). Parental age and developmental stabilityin Drosophila melanogaster. Genetica 89: 235-244.
Watts, E. S. (1986). Skeletal development. In Dukelow, W., and Erwin, J. (eds.), ComparativePrimate Biology, Vol. 3. Reproduction and Development, Alan R. Liss, New York, 415-439.
Wayne, R. K., Modi, W. S., and O'Brien, S. J. (1986). Morphological variability and asymmetryin the cheetah (Acinonyx jubatus), A genetically uniform species. Evolution 40: 78-85.
Wootton, J. T. (1986). The effects of body mass, phylogeny, habitat, and trophic level onmammalian age at first reproduction. Evolution 41: 732-749.
Zakharov, V. M. (1992). Population phenogenetics: Analysis of developmental stability innatural populations. Acta Zool. Fennica 191: 7-30.
Zelditch, M. L., Bookstein, F. L., and Lundrigan, B. L. (1992). Ontogeny of integrated skullgrowth in the cotton rat Sigmodon fulviventer. Evolution 46: 1164-1180.
Zelditch, M. L., Bookstein, F. L., and Lundrigan, B. L. (1993). The ontogenetic complexityof developmental constraints. J. Evol. Biol. 6: 621-641.
Ontogenetic Patterns of Fluctuating Asymmetry 151
Copyright © 2022 FDOKUMEN