Craniodental variation among Macaques (Macaca), nonhuman primates
12
BioMed Central Page 1 of 12 (page number not for citation purposes) BMC Evolutionary Biology BMC Evolutionary Biology 2002, 2 x Research article Craniodental variation among Macaques (Macaca), nonhuman primates Ruliang Pan* 1,2 and Charles E Oxnard 1 Address: 1 School of Anatomy and Human Biology, The University of Western Australia, Crawley Perth, Western Australia, 6009, Australia and 2 Department of Systematic Zoology, Kunming Institute of Zoology, Kunming, Yunnan, China E-mail: Ruliang Pan* - [email protected]; Charles E Oxnard - [email protected] *Corresponding author Abstract Background: In terms of structure and function, the skull is one of the most complicated organs in the body. It is also one of the most important parts in terms of developmental and evolutionary origins. This complexity makes it difficult to obtain evolutionary assessments if, as is usually the case with fossils, only part of the skull is available. For this reason this study involves a set of comparisons whereby the smallest functional units are studied first, and these built up, through a triple-nested hierarchical design, into more complex anatomical regions and eventually into the skull-as-a-whole. This design has been applied to macaques (Macaca) in order to reveal patterns of variation at the different levels. The profiles of such variation have been obtained both within and between species. This has lead to a search for the skull parts that have undergone similar selection pressures during evolution and comparable development patterns in both ontogeny and phylogeny. Results: Morphometric analysis (Principal Components) was used to obtain these profiles of species and sex separations based on 77 cranial variables from 11 species of macaques. The results showed that 7 functional units could be aggregated into three functionally reasonable anatomical regions on the basis of similarities in profiles. These were: the masticatory apparatus containing mandible, lower teeth and upper teeth, the face as a whole combining maxilla (actually lower face) and upper face, and the cranium as a whole involving cranium and calvaria. Twenty-six variables were finally selected for analyzing the morphology of the whole skull. This last showed an overall profile similar to that revealed in the masticatory apparatus but also contained additional information pertaining to individual species and species-groups separations. Conclusions: The study provides a model for carrying out analysis of species separations and sex variation simultaneously. Through this design it seems possible to see cranio-dental elements that may result from similar developmental processes, have similar functional adaptations, and show an appropriately integrated structure morphologically. This study also implies that the biological information drawn from part of skull alone, e.g. as in studies of incomplete fossils may provide misleading information. Published: 8 May 2002 BMC Evolutionary Biology 2002, 2:10 Received: 16 August 2001 Accepted: 8 May 2002 This article is available from: http://www.biomedcentral.com/1471-2148/2/10 © 2002 Pan and Oxnard; licensee BioMed Central Ltd. Verbatim copying and redistribution of this article are permitted in any medium for any purpose, provided this notice is preserved along with the article's original URL.
-
Upload
independent -
Category
Documents
-
view
7 -
download
0
Transcript of Craniodental variation among Macaques (Macaca), nonhuman primates

BioMed CentralBMC Evolutionary Biology
BMC Evolutionary Biology 2002, 2 xResearch articleCraniodental variation among Macaques (Macaca), nonhuman primatesRuliang Pan*1,2 and Charles E Oxnard1
Address: 1School of Anatomy and Human Biology, The University of Western Australia, Crawley Perth, Western Australia, 6009, Australia and 2Department of Systematic Zoology, Kunming Institute of Zoology, Kunming, Yunnan, China
E-mail: Ruliang Pan* - [email protected]; Charles E Oxnard - [email protected]
*Corresponding author
AbstractBackground: In terms of structure and function, the skull is one of the most complicated organsin the body. It is also one of the most important parts in terms of developmental and evolutionaryorigins. This complexity makes it difficult to obtain evolutionary assessments if, as is usually the casewith fossils, only part of the skull is available. For this reason this study involves a set of comparisonswhereby the smallest functional units are studied first, and these built up, through a triple-nestedhierarchical design, into more complex anatomical regions and eventually into the skull-as-a-whole.This design has been applied to macaques (Macaca) in order to reveal patterns of variation at thedifferent levels. The profiles of such variation have been obtained both within and between species.This has lead to a search for the skull parts that have undergone similar selection pressures duringevolution and comparable development patterns in both ontogeny and phylogeny.
Results: Morphometric analysis (Principal Components) was used to obtain these profiles ofspecies and sex separations based on 77 cranial variables from 11 species of macaques. The resultsshowed that 7 functional units could be aggregated into three functionally reasonable anatomicalregions on the basis of similarities in profiles. These were: the masticatory apparatus containingmandible, lower teeth and upper teeth, the face as a whole combining maxilla (actually lower face)and upper face, and the cranium as a whole involving cranium and calvaria. Twenty-six variableswere finally selected for analyzing the morphology of the whole skull. This last showed an overallprofile similar to that revealed in the masticatory apparatus but also contained additionalinformation pertaining to individual species and species-groups separations.
Conclusions: The study provides a model for carrying out analysis of species separations and sexvariation simultaneously. Through this design it seems possible to see cranio-dental elements thatmay result from similar developmental processes, have similar functional adaptations, and show anappropriately integrated structure morphologically. This study also implies that the biologicalinformation drawn from part of skull alone, e.g. as in studies of incomplete fossils may providemisleading information.
Published: 8 May 2002
BMC Evolutionary Biology 2002, 2:10
Received: 16 August 2001Accepted: 8 May 2002
This article is available from: http://www.biomedcentral.com/1471-2148/2/10
© 2002 Pan and Oxnard; licensee BioMed Central Ltd. Verbatim copying and redistribution of this article are permitted in any medium for any purpose, provided this notice is preserved along with the article's original URL.
Page 1 of 12(page number not for citation purposes)
BMC Evolutionary Biology 2002, 2 http://www.biomedcentral.com/1471-2148/2/10
BackgroundThe skull, unlike most postcranial bones, has a number ofdifferent functional units and anatomical regions. It is themost complicated organ in the body both morphological-ly and functionally. It results from variations in growthand fusion of a number of separate and independent cent-ers of ossification and chondrification. This complexity is,in part, a problem arising from two familiar tissues, carti-lage and bone, differentiating in a rather more complexpattern than observed elsewhere in the vertebrate body. Inaddition, the factors controlling skeletal differentiationand morphogenesis in the skull are necessarily differentfrom those operating elsewhere, for example, in the for-mation of vertebral column, limb girdle or limb itself [1].Furthermore, at the level of cell differentiation, it is notsimply a matter of endochondral bone and primary hya-line cartilage, but also of other types of skeletal tissuesfound almost exclusively in the head, principally mem-brane bone and secondary cartilage [2].
The development of the skull is as complex as its function-al integration. For instance, the cranium is strongly influ-enced by the development of the face in relation to thebranchial arches, and by the development of the calvariain relation to the brain. During the whole of life thesechanges never cease, though they occur at larger andsmaller rates at different times [[3,4]: pp 423–443). Thesecomplexities and variations do not just exist between spe-cies – resulting in interspecific variation, but also withinspecies between the sexes – intraspecific variation. Theyare usually considered to accompany changes in phylog-eny between species, and growth within species. It is nowappreciated that when they are considered simultaneous-ly, these two types of variations in the skull are more com-plex than expected [5,6]. Moreover, it is likely that, eventhough the skull is the most complex region of the skele-ton, these caveats apply, if only to lesser degree, in otherregions of the body.
Interspecific morphometric craniodental variation hasbeen commonly used in order to help clarify controversiesin classification, evolution, phylogeny and functional ad-aptation. Similar analyses, but of intraspecific variation,have been used to reveal differences between the sexes notonly in morphology but also in social activities, behavior,ancestral heritage, size and sexual selection [7–9]. Thesetwo issues are normally studied separately. Studies inte-grating these two issues together are quite uncommon[5,6,10]. Yet such analyses, combining these issues, arelogical ways to approach complex problems [5,6,11].Thus profiles of animal group differences, due to differ-ences in variation between species and differences be-tween sexes within each species, can demonstrate howeach pattern of variation effects the other, and what is theoverall relationship between them.
The main purpose of this study is, thus, to set up a modelto analyze craniodental profiles referring to inter- and in-tra-specific variations with a specially designed method:"the nested procedure". This permits profiles of both ani-mal groups and anatomical variable clusters betweenfunctional units, anatomical regions and the whole skullto be compared. This study also illustrates the effects ofcombining functional units into anatomical regions, andthe effect, in turn, of aggregating anatomical regions intothe skull as a whole. Such a model has value in many an-atomical regions, far beyond the cranio-dental study towhich it is applied here.
Macaques are specifically used in this study because theyare characterized by great biodiversity and variation. Asmany as: up to 20 species have been described in this ge-nus by various authors, and they have been placed into asmany as four species groups [12–15]. In their geographicvariation and natural adaptation, except for humans, noother primate group inhabits a more diverse and extensiverange of habitats than the macaques. These range fromlowland tropical rain forest (in Indonesia) to high altitudemountains (on the top of the Qinghai-Tibetan Plateau,China), and from dry forest and grassland of northwest-ern Africa to northerly latitudes of Japan. Thus, the genusMacaca provides an ideal model for the study of inter- andintraspecific variation [5,16]. Again, this investigation hasvalue for application, and one that may be applicable tomany species that have undergone similar evolutionaryprocesses and biogeographic radiations.
ResultsBecause, in this study, the variables are all measurements,they naturally all show significant positive contributionsto the first PC axis in each analysis. In the second axis,however, only smaller numbers of variables reach signifi-cant contributions, and these are mixed positive and neg-ative.
Functional unitsMandible, lower teeth and upper teethIn the analysis of the first unit, the mandible, (Fig. 1) thefirst axis mainly arranges species according to size with thelarger species more positive (with the minor exception ofM. fuscata). It is likely therefore that overall size is a pre-dominating factor in this axis (although, of course, othercharacteristics that happen to be correlated with size willalso be included by this statistic – see later). This axis haslarge and positive eigenvectors for all variables (Table 1).
The second axis mostly arranges the groups according tosex, with males more positive. The distances between thesexes vary quite markedly. Two species (M. mulatta and M.fuscata) display a slightly different directional relationshipbetween the sexes. The contributions of variables to the
Page 2 of 12(page number not for citation purposes)

BMC Evolutionary Biology 2002, 2 http://www.biomedcentral.com/1471-2148/2/10
Figure 1Comparative profiles composed of inter- and intraspecific variations revealed in the first two axes of PCA based on the sevenfunctional units. M: Male; F: Female. Three different profiles are found: 1) mandible, lower teeth and upper teeth in which inter-specific variation is revealed along the first axis, intraspecific variation is, however, along the second axis; 2) lower and upperface whose structure is almost opposite to that illustrated in previous one, and 3) calvaria and cranium in which inter- andintraspecific variations are divided orthogonally by the two axes.
M
M
M
MM
MM
M
M
M
M
FFF
F
F
F
F
F
F
F
F
2 .01 .51 . 0. 50 . 0- . 5-1 . 0-1 . 5-2 . 0
1 . 5
1 . 0
5
0
- . 5
-1 . 0
PC1
PC2
Lower teeth
M
M
M
M
M
M
M
M
M
M
M
F
F
F
F
F
F
FF
F
F
F
2 .01 .51. 0.50 .0-.5-1 .0-1 . 5
2 . 0
1. 5
1. 0
. 5
0 . 0
-. 5
-1 . 0
PC1
PC2
Maxilla
M
M
M M
M
M
MM
M
MM
F
F F FFF
F F
F
FF
3.02.01.00 .0-1 .0-2.0-3. 0
4 .0
3.0
2.0
1.0
0.0
-1 .0
-2 .0
PC2
PC1
Upper teeth
M
M
M
M
M
M
M
M
M
M
F
FF
F
F
F
F
F
F
F
2 .01 .51 .0.50 .0-.5-1 .0-1 .5
1 .5
1 .0
.5
0 .0
-.5
-1 .0
-1 .5
PC1
PC2
Mandible
M
MM
M
M
M
M
M
M
M
M
F
F
F F
F
F
F
F
F
FF
1.51 .0.50 .0-.5-1 .0-1.5-2.0
1.5
1.0
.5
0.0
-.5
-1.0
PC1
PC2
Cranium
M
M
MM
M
M
M
M
M
M
M
F
F
F
F
F
F
F
F
F
F
F
1 . 51 . 0. 50 . 0- . 5- 1 . 0-1 . 5-2 . 0
1 . 5
1 . 0
5
0
- . 5
- 1 . 0
PC1
PC2
Calvaria
MM
M
M
M
M
M
M
M
MM
FF
FF
F
F
F
F
F
FF
3210-1-2
3
2
1
0
-1
-2
PC1
PC2
Upper face
M. fuscata
M. mulatta
M. sinica
M. arctoides
M. assamensis
M. sylvanus
M. nemestrina
M. radiata
M. thibetana
M. fascicularis
M. nigra
Page 3 of 12(page number not for citation purposes)
BMC Evolutionary Biology 2002, 2 http://www.biomedcentral.com/1471-2148/2/10
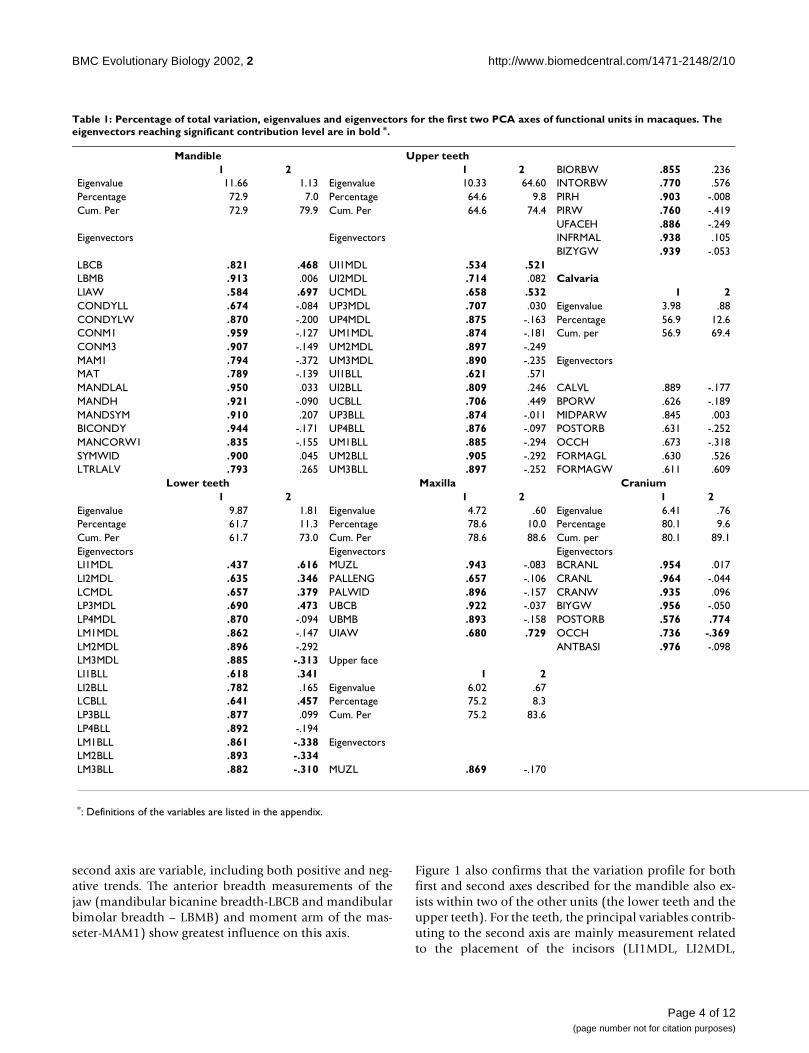
second axis are variable, including both positive and neg-ative trends. The anterior breadth measurements of thejaw (mandibular bicanine breadth-LBCB and mandibularbimolar breadth – LBMB) and moment arm of the mas-seter-MAM1) show greatest influence on this axis.
Figure 1 also confirms that the variation profile for bothfirst and second axes described for the mandible also ex-ists within two of the other units (the lower teeth and theupper teeth). For the teeth, the principal variables contrib-uting to the second axis are mainly measurement relatedto the placement of the incisors (LI1MDL, LI2MDL,
Table 1: Percentage of total variation, eigenvalues and eigenvectors for the first two PCA axes of functional units in macaques. The eigenvectors reaching significant contribution level are in bold *.
Mandible Upper teeth1 2 1 2 BIORBW .855 .236
Eigenvalue 11.66 1.13 Eigenvalue 10.33 64.60 INTORBW .770 .576Percentage 72.9 7.0 Percentage 64.6 9.8 PIRH .903 -.008Cum. Per 72.9 79.9 Cum. Per 64.6 74.4 PIRW .760 -.419
UFACEH .886 -.249Eigenvectors Eigenvectors INFRMAL .938 .105
BIZYGW .939 -.053LBCB .821 .468 UI1MDL .534 .521LBMB .913 .006 UI2MDL .714 .082 CalvariaLIAW .584 .697 UCMDL .658 .532 1 2CONDYLL .674 -.084 UP3MDL .707 .030 Eigenvalue 3.98 .88CONDYLW .870 -.200 UP4MDL .875 -.163 Percentage 56.9 12.6CONM1 .959 -.127 UM1MDL .874 -.181 Cum. per 56.9 69.4CONM3 .907 -.149 UM2MDL .897 -.249MAM1 .794 -.372 UM3MDL .890 -.235 EigenvectorsMAT .789 -.139 UI1BLL .621 .571MANDLAL .950 .033 UI2BLL .809 .246 CALVL .889 -.177MANDH .921 -.090 UCBLL .706 .449 BPORW .626 -.189MANDSYM .910 .207 UP3BLL .874 -.011 MIDPARW .845 .003BICONDY .944 -.171 UP4BLL .876 -.097 POSTORB .631 -.252MANCORW1 .835 -.155 UM1BLL .885 -.294 OCCH .673 -.318SYMWID .900 .045 UM2BLL .905 -.292 FORMAGL .630 .526LTRLALV .793 .265 UM3BLL .897 -.252 FORMAGW .611 .609
Lower teeth Maxilla Cranium1 2 1 2 1 2
Eigenvalue 9.87 1.81 Eigenvalue 4.72 .60 Eigenvalue 6.41 .76Percentage 61.7 11.3 Percentage 78.6 10.0 Percentage 80.1 9.6Cum. Per 61.7 73.0 Cum. Per 78.6 88.6 Cum. per 80.1 89.1Eigenvectors Eigenvectors EigenvectorsLI1MDL .437 .616 MUZL .943 -.083 BCRANL .954 .017LI2MDL .635 .346 PALLENG .657 -.106 CRANL .964 -.044LCMDL .657 .379 PALWID .896 -.157 CRANW .935 .096LP3MDL .690 .473 UBCB .922 -.037 BIYGW .956 -.050LP4MDL .870 -.094 UBMB .893 -.158 POSTORB .576 .774LM1MDL .862 -.147 UIAW .680 .729 OCCH .736 -.369LM2MDL .896 -.292 ANTBASI .976 -.098LM3MDL .885 -.313 Upper faceLI1BLL .618 .341 1 2LI2BLL .782 .165 Eigenvalue 6.02 .67LCBLL .641 .457 Percentage 75.2 8.3LP3BLL .877 .099 Cum. Per 75.2 83.6LP4BLL .892 -.194LM1BLL .861 -.338 EigenvectorsLM2BLL .893 -.334LM3BLL .882 -.310 MUZL .869 -.170
*: Definitions of the variables are listed in the appendix.
Page 4 of 12(page number not for citation purposes)
BMC Evolutionary Biology 2002, 2 http://www.biomedcentral.com/1471-2148/2/10
LI1BLL, UI1MDL and UI1BLL), canines (LCMDL, LCBLL,UCMDL and UCBLL) and the breadths of the lower mo-lars (LM1BL, LM2BLL and LM3BLL) (Table 1).
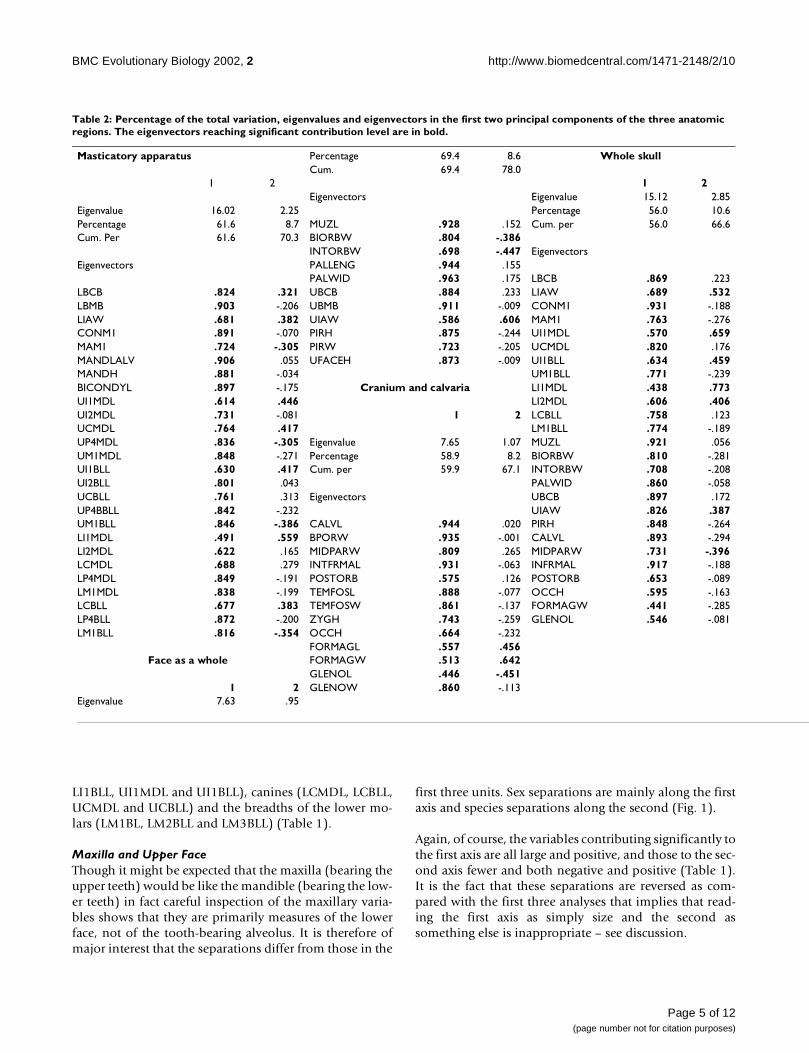
Maxilla and Upper FaceThough it might be expected that the maxilla (bearing theupper teeth) would be like the mandible (bearing the low-er teeth) in fact careful inspection of the maxillary varia-bles shows that they are primarily measures of the lowerface, not of the tooth-bearing alveolus. It is therefore ofmajor interest that the separations differ from those in the
first three units. Sex separations are mainly along the firstaxis and species separations along the second (Fig. 1).
Again, of course, the variables contributing significantly tothe first axis are all large and positive, and those to the sec-ond axis fewer and both negative and positive (Table 1).It is the fact that these separations are reversed as com-pared with the first three analyses that implies that read-ing the first axis as simply size and the second assomething else is inappropriate – see discussion.
Table 2: Percentage of the total variation, eigenvalues and eigenvectors in the first two principal components of the three anatomic regions. The eigenvectors reaching significant contribution level are in bold.
Masticatory apparatus Percentage 69.4 8.6 Whole skullCum. 69.4 78.0
1 2 1 2Eigenvectors Eigenvalue 15.12 2.85
Eigenvalue 16.02 2.25 Percentage 56.0 10.6Percentage 61.6 8.7 MUZL .928 .152 Cum. per 56.0 66.6Cum. Per 61.6 70.3 BIORBW .804 -.386
INTORBW .698 -.447 EigenvectorsEigenvectors PALLENG .944 .155
PALWID .963 .175 LBCB .869 .223LBCB .824 .321 UBCB .884 .233 LIAW .689 .532LBMB .903 -.206 UBMB .911 -.009 CONM1 .931 -.188LIAW .681 .382 UIAW .586 .606 MAM1 .763 -.276CONM1 .891 -.070 PIRH .875 -.244 UI1MDL .570 .659MAM1 .724 -.305 PIRW .723 -.205 UCMDL .820 .176MANDLALV .906 .055 UFACEH .873 -.009 UI1BLL .634 .459MANDH .881 -.034 UM1BLL .771 -.239BICONDYL .897 -.175 Cranium and calvaria LI1MDL .438 .773UI1MDL .614 .446 LI2MDL .606 .406UI2MDL .731 -.081 1 2 LCBLL .758 .123UCMDL .764 .417 LM1BLL .774 -.189UP4MDL .836 -.305 Eigenvalue 7.65 1.07 MUZL .921 .056UM1MDL .848 -.271 Percentage 58.9 8.2 BIORBW .810 -.281UI1BLL .630 .417 Cum. per 59.9 67.1 INTORBW .708 -.208UI2BLL .801 .043 PALWID .860 -.058UCBLL .761 .313 Eigenvectors UBCB .897 .172UP4BBLL .842 -.232 UIAW .826 .387UM1BLL .846 -.386 CALVL .944 .020 PIRH .848 -.264LI1MDL .491 .559 BPORW .935 -.001 CALVL .893 -.294LI2MDL .622 .165 MIDPARW .809 .265 MIDPARW .731 -.396LCMDL .688 .279 INTFRMAL .931 -.063 INFRMAL .917 -.188LP4MDL .849 -.191 POSTORB .575 .126 POSTORB .653 -.089LM1MDL .838 -.199 TEMFOSL .888 -.077 OCCH .595 -.163LCBLL .677 .383 TEMFOSW .861 -.137 FORMAGW .441 -.285LP4BLL .872 -.200 ZYGH .743 -.259 GLENOL .546 -.081LM1BLL .816 -.354 OCCH .664 -.232
FORMAGL .557 .456Face as a whole FORMAGW .513 .642
GLENOL .446 -.4511 2 GLENOW .860 -.113
Eigenvalue 7.63 .95
Page 5 of 12(page number not for citation purposes)
BMC Evolutionary Biology 2002, 2 http://www.biomedcentral.com/1471-2148/2/10
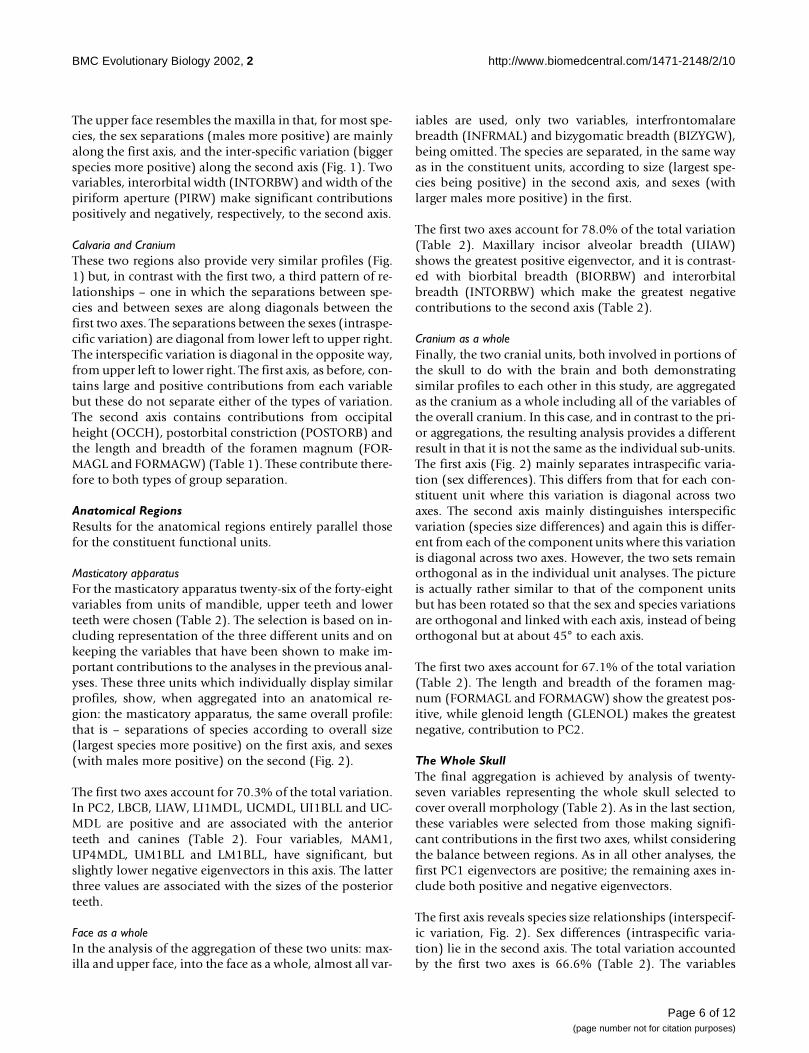
The upper face resembles the maxilla in that, for most spe-cies, the sex separations (males more positive) are mainlyalong the first axis, and the inter-specific variation (biggerspecies more positive) along the second axis (Fig. 1). Twovariables, interorbital width (INTORBW) and width of thepiriform aperture (PIRW) make significant contributionspositively and negatively, respectively, to the second axis.
Calvaria and CraniumThese two regions also provide very similar profiles (Fig.1) but, in contrast with the first two, a third pattern of re-lationships – one in which the separations between spe-cies and between sexes are along diagonals between thefirst two axes. The separations between the sexes (intraspe-cific variation) are diagonal from lower left to upper right.The interspecific variation is diagonal in the opposite way,from upper left to lower right. The first axis, as before, con-tains large and positive contributions from each variablebut these do not separate either of the types of variation.The second axis contains contributions from occipitalheight (OCCH), postorbital constriction (POSTORB) andthe length and breadth of the foramen magnum (FOR-MAGL and FORMAGW) (Table 1). These contribute there-fore to both types of group separation.
Anatomical RegionsResults for the anatomical regions entirely parallel thosefor the constituent functional units.
Masticatory apparatusFor the masticatory apparatus twenty-six of the forty-eightvariables from units of mandible, upper teeth and lowerteeth were chosen (Table 2). The selection is based on in-cluding representation of the three different units and onkeeping the variables that have been shown to make im-portant contributions to the analyses in the previous anal-yses. These three units which individually display similarprofiles, show, when aggregated into an anatomical re-gion: the masticatory apparatus, the same overall profile:that is – separations of species according to overall size(largest species more positive) on the first axis, and sexes(with males more positive) on the second (Fig. 2).
The first two axes account for 70.3% of the total variation.In PC2, LBCB, LIAW, LI1MDL, UCMDL, UI1BLL and UC-MDL are positive and are associated with the anteriorteeth and canines (Table 2). Four variables, MAM1,UP4MDL, UM1BLL and LM1BLL, have significant, butslightly lower negative eigenvectors in this axis. The latterthree values are associated with the sizes of the posteriorteeth.
Face as a wholeIn the analysis of the aggregation of these two units: max-illa and upper face, into the face as a whole, almost all var-
iables are used, only two variables, interfrontomalarebreadth (INFRMAL) and bizygomatic breadth (BIZYGW),being omitted. The species are separated, in the same wayas in the constituent units, according to size (largest spe-cies being positive) in the second axis, and sexes (withlarger males more positive) in the first.
The first two axes account for 78.0% of the total variation(Table 2). Maxillary incisor alveolar breadth (UIAW)shows the greatest positive eigenvector, and it is contrast-ed with biorbital breadth (BIORBW) and interorbitalbreadth (INTORBW) which make the greatest negativecontributions to the second axis (Table 2).
Cranium as a wholeFinally, the two cranial units, both involved in portions ofthe skull to do with the brain and both demonstratingsimilar profiles to each other in this study, are aggregatedas the cranium as a whole including all of the variables ofthe overall cranium. In this case, and in contrast to the pri-or aggregations, the resulting analysis provides a differentresult in that it is not the same as the individual sub-units.The first axis (Fig. 2) mainly separates intraspecific varia-tion (sex differences). This differs from that for each con-stituent unit where this variation is diagonal across twoaxes. The second axis mainly distinguishes interspecificvariation (species size differences) and again this is differ-ent from each of the component units where this variationis diagonal across two axes. However, the two sets remainorthogonal as in the individual unit analyses. The pictureis actually rather similar to that of the component unitsbut has been rotated so that the sex and species variationsare orthogonal and linked with each axis, instead of beingorthogonal but at about 45° to each axis.
The first two axes account for 67.1% of the total variation(Table 2). The length and breadth of the foramen mag-num (FORMAGL and FORMAGW) show the greatest pos-itive, while glenoid length (GLENOL) makes the greatestnegative, contribution to PC2.
The Whole SkullThe final aggregation is achieved by analysis of twenty-seven variables representing the whole skull selected tocover overall morphology (Table 2). As in the last section,these variables were selected from those making signifi-cant contributions in the first two axes, whilst consideringthe balance between regions. As in all other analyses, thefirst PC1 eigenvectors are positive; the remaining axes in-clude both positive and negative eigenvectors.
The first axis reveals species size relationships (interspecif-ic variation, Fig. 2). Sex differences (intraspecific varia-tion) lie in the second axis. The total variation accountedby the first two axes is 66.6% (Table 2). The variables
Page 6 of 12(page number not for citation purposes)

BMC Evolutionary Biology 2002, 2 http://www.biomedcentral.com/1471-2148/2/10
showing the highest eigenvectors in PC2 are all positive.They are incisor alveolar breadth (LIAW), UI1MDL,UI1BLL, LI1MDL, LI2MDL and UIAW, which, as foundpreviously, are associated with the anterior dental dimen-sions. However, one variable, midparietal breadth (MID-PARW), is a significant negative eigenvector.
DiscussionThe results revealed in this study indicate that cranioden-tal variation among species and sexes in these macaquesvaries in different functional units, anatomical regions,
and the whole skull. The study provides information in re-lation to: 1) detecting differences between sex separationwithin species, and species separation among species, 2)detecting the effects of aggregating variables into largerand larger anatomical parts, 3) providing informationabout the way in which the variables contribute to the sexand species groups and to the anatomical regions at eachlevel of the study and, 4) providing information aboutoverall separations of species.
Figure 2Comparative profiles based on the three anatomic regions. Three patterns of profiles are detected: 1) that expressed by themasticatory apparatus and the whole skull in which inter-and intraspecific variations are exposed along the first and secondaxes, separately; 2) that illustrated by the face as a whole. Its structure is opposite to that shown in the previous pattern, and3) that demonstrated by the cranium as a whole. Its pattern is opposite to that expressed by the first one, and also differentfrom pattern 2 in terms of separation among species and arrangement along the second axis.
MM M
M
M
M
M
M
M
M
M
F
F
F
F
F
F
F
F
F
FF
2.01.51.0.50.0-.5-1.0-1.5
3
2
1
0
-1
-2
PC1
PC2
Face as a whole
M
M
M
M
M
M
M
M
M
M
M
F
F
F
F
F
F
F
F
F
FF
2.01.51.0.50.0-.5-1.0-1.5
1.0
.5
0.0
-.5
-1.0
PC1
PC2
Cranium as a whole
M
M
M
M
MM
M
M
M
F
FF
F
F
F
F
F
F
F
2.01.51.0.50.0-.5-1.0-1.5-2.0
1.5
1.0
.5
0.0
-.5
-1.0
-1.5
PC1
PC2Masticatory apparatus
5
M
M
M
M
M
M
M
MM
M
M
F
FF F
FF
F
F
F
FF
1.1.0.50.0-.5-1.0-1.5-2.0
1.5
1.0
.5
0.0
-.5
-1.0
-1.5
PC2
PC1
Whole skull
Page 7 of 12(page number not for citation purposes)
BMC Evolutionary Biology 2002, 2 http://www.biomedcentral.com/1471-2148/2/10
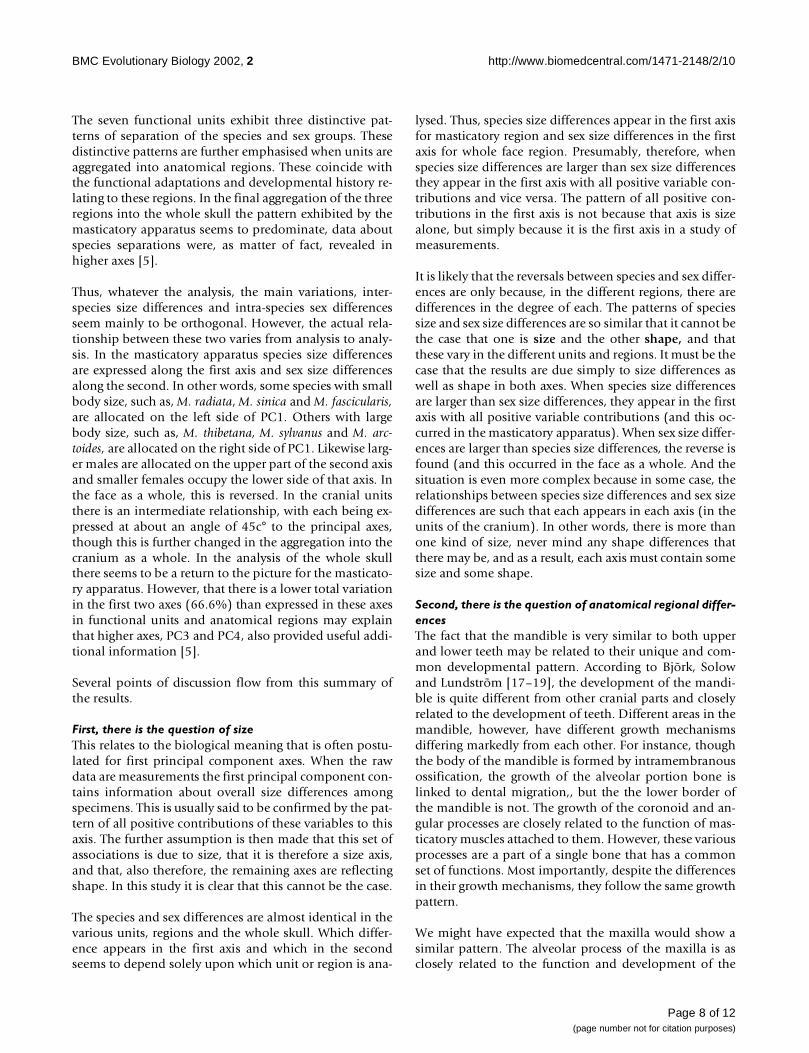
The seven functional units exhibit three distinctive pat-terns of separation of the species and sex groups. Thesedistinctive patterns are further emphasised when units areaggregated into anatomical regions. These coincide withthe functional adaptations and developmental history re-lating to these regions. In the final aggregation of the threeregions into the whole skull the pattern exhibited by themasticatory apparatus seems to predominate, data aboutspecies separations were, as matter of fact, revealed inhigher axes [5].
Thus, whatever the analysis, the main variations, inter-species size differences and intra-species sex differencesseem mainly to be orthogonal. However, the actual rela-tionship between these two varies from analysis to analy-sis. In the masticatory apparatus species size differencesare expressed along the first axis and sex size differencesalong the second. In other words, some species with smallbody size, such as, M. radiata, M. sinica and M. fascicularis,are allocated on the left side of PC1. Others with largebody size, such as, M. thibetana, M. sylvanus and M. arc-toides, are allocated on the right side of PC1. Likewise larg-er males are allocated on the upper part of the second axisand smaller females occupy the lower side of that axis. Inthe face as a whole, this is reversed. In the cranial unitsthere is an intermediate relationship, with each being ex-pressed at about an angle of 45c° to the principal axes,though this is further changed in the aggregation into thecranium as a whole. In the analysis of the whole skullthere seems to be a return to the picture for the masticato-ry apparatus. However, that there is a lower total variationin the first two axes (66.6%) than expressed in these axesin functional units and anatomical regions may explainthat higher axes, PC3 and PC4, also provided useful addi-tional information [5].
Several points of discussion flow from this summary ofthe results.
First, there is the question of sizeThis relates to the biological meaning that is often postu-lated for first principal component axes. When the rawdata are measurements the first principal component con-tains information about overall size differences amongspecimens. This is usually said to be confirmed by the pat-tern of all positive contributions of these variables to thisaxis. The further assumption is then made that this set ofassociations is due to size, that it is therefore a size axis,and that, also therefore, the remaining axes are reflectingshape. In this study it is clear that this cannot be the case.
The species and sex differences are almost identical in thevarious units, regions and the whole skull. Which differ-ence appears in the first axis and which in the secondseems to depend solely upon which unit or region is ana-
lysed. Thus, species size differences appear in the first axisfor masticatory region and sex size differences in the firstaxis for whole face region. Presumably, therefore, whenspecies size differences are larger than sex size differencesthey appear in the first axis with all positive variable con-tributions and vice versa. The pattern of all positive con-tributions in the first axis is not because that axis is sizealone, but simply because it is the first axis in a study ofmeasurements.
It is likely that the reversals between species and sex differ-ences are only because, in the different regions, there aredifferences in the degree of each. The patterns of speciessize and sex size differences are so similar that it cannot bethe case that one is size and the other shape, and thatthese vary in the different units and regions. It must be thecase that the results are due simply to size differences aswell as shape in both axes. When species size differencesare larger than sex size differences, they appear in the firstaxis with all positive variable contributions (and this oc-curred in the masticatory apparatus). When sex size differ-ences are larger than species size differences, the reverse isfound (and this occurred in the face as a whole. And thesituation is even more complex because in some case, therelationships between species size differences and sex sizedifferences are such that each appears in each axis (in theunits of the cranium). In other words, there is more thanone kind of size, never mind any shape differences thatthere may be, and as a result, each axis must contain somesize and some shape.
Second, there is the question of anatomical regional differ-encesThe fact that the mandible is very similar to both upperand lower teeth may be related to their unique and com-mon developmental pattern. According to Bjõrk, Solowand Lundstrõm [17–19], the development of the mandi-ble is quite different from other cranial parts and closelyrelated to the development of teeth. Different areas in themandible, however, have different growth mechanismsdiffering markedly from each other. For instance, thoughthe body of the mandible is formed by intramembranousossification, the growth of the alveolar portion bone islinked to dental migration,, but the the lower border ofthe mandible is not. The growth of the coronoid and an-gular processes are closely related to the function of mas-ticatory muscles attached to them. However, these variousprocesses are a part of a single bone that has a commonset of functions. Most importantly, despite the differencesin their growth mechanisms, they follow the same growthpattern.
We might have expected that the maxilla would show asimilar pattern. The alveolar process of the maxilla is asclosely related to the function and development of the
Page 8 of 12(page number not for citation purposes)

BMC Evolutionary Biology 2002, 2 http://www.biomedcentral.com/1471-2148/2/10
maxillary teeth as the alveolar portion of the mandible isto the mandibular teeth. And of course, there is a func-tional relationship between the two sets of teeth. Howev-er, the actual variables measured here, though they werelabelled as maxilla, do not, in fact, characterise the alveo-lar portion of the maxilla alone, but rather the entire max-illa, most of which is the lower face. This fits with thepreviously known information that the development ofthe entire mandible is more relevant to dental develop-ment than of the entire maxilla [20].
A different finding, though still related to developmentand function, may be operating in the face. The picture forthe facial units differ from those for both the masticatoryapparatus and the cranium, though there seems to bemore overall similarity to the cranium. Is this in part be-cause the function and development of face involve agreater disparity in range of functions and developmentalprocesses than the masticatory apparatus? Thus, in addi-tion to being part of the facial structure, the maxilla alsoplays an important role in the development and functionof mastication [5,21]. Referring to the growth of the max-illa, the only part subservient to erupting teeth is the alve-olar process that is closely related to dental development.In contrast, however, most of the maxillary bone involvesother factors. Thus, even though disturbance of toothbuds could lead to loss, malformation, or malposition ofthe teeth causing changes in the maxillary alveolus, thegeneral size and shape of the maxilla are not affected bythe changes in the teeth. The maxilla is also a large con-tributor to the nasal cavities and orbital floor, and there-fore its growth is of fundamental importance to facial,nasal and orbital growth patterns [22]. Near its upper ex-tremity, the upper face is influenced by the attached crani-um, thus influenced by cranial base growth patterns andthe growth of the brain. All this must influence its mor-phology in a more complex way than is the case for themasticatory apparatus.
In the case of the cranium, the situation may be yet morecomplex still. When the two parts of the cranium are ana-lyzed together, PC1 reflects primarily sex size differences(intra-specific variation) and PC2 species size differences(inter-specific variation). This differs from the analysis ofthe component units where all relationships are obliqueto both axes. It is also the opposite of the masticatory re-gion where PC1 separates species and PC2 sexes, but sim-ilar to the face as a whole. Such results may imply that thedevelopment of cranium and calvaria, quite differentfrom the masticatory apparatus but similar to the face, isalso complex. This may be associated with the dual originof the calvaria from both neural crest and membrane bone(e.g. Thomson [23]). Therefore, although cranium andcalvaria exhibit a similar picture referring to the two typesof separate variations, they results imply that they may in-
teract differently in terms of functional, developmentaland growth processes.
The results based upon the aggregated but selected varia-bles for the whole skull are more complex again. The over-all profile of differences is actually very similar to thatfound in the masticatory apparatus alone. However, thereis a major difference to the pattern in the masticatory ap-paratus in this ultimate study. That is, a relative lower totalvariation in the first two axes may imply that, in the anal-yses of the whole skull, the information content of themain regions must be independent of each other to a greatenough degree that information spills over into other ax-es, such as PC3 and PC4 [5]. This would not have been re-vealed without doing the studies on units and regions.And it indicates just how misleading it might be to use in-formation from only small skull regions (which is oftenall that is available for fossils) in attempting to move di-rectly from morphometric analyses to phylogenetic evalu-ation.
The analyses on the whole skull also imply that in the se-lection procedure choosing variables from the units isnecessary to understand to what extent similar parts withsimilar functions and similar developmental histories givesimilar results. The same is true in the anatomical regionsin order to see the effect of aggregation of regions intooverall skull. In this process of variable reduction, thoughattempts have been made not to bias the numbers of var-iables through over- or under-representation of specificskull regions, it is inevitable that the masticatory appara-tus is overly represented in a numeric sense. This may ac-tually be not inappropriate because information fromteeth (each tooth is its own unit notwithstanding the factthat there are also trends along the tooth row) is under adegree of independent genetic control.
The analyses of the whole skull also provide further con-firmatory information that reflects these additional com-plexities. It has provided a considerable amount of newinformation that was not easily recognized in the earlierstudies: additional information existing in axes 3 and 4[5]. That is, there are marked sex separations in differentdirections in some species along PC3: e.g., M. nigra, M.nemestrina, M. mulatta and M. fascicularis and in other spe-cies, such as M. mulatta, M. assamensis, M. arctoides and M.sylvanus along PC4. These separations are not parallel as inthe first two axes and this implies that their causation isnot due to a single common factor, but some factor or fac-tors different for each species. Likewise in these axes, thereare marked distinctions of individual species and these,too, are in various directions rather than being parallel,implying that they are not due to a similar single factorsuch as overall size. Thus, the species with small body size,such as M. fascicularis, M. radiata and M. sinica, are always
Page 9 of 12(page number not for citation purposes)
BMC Evolutionary Biology 2002, 2 http://www.biomedcentral.com/1471-2148/2/10
allocated in the negative direction of PC1. Others withlarge body size, fore instance M. sylvanus, M. thibetana andM. arctoides, are dispersed in the positive direction alongthe same axis. This type of information might be especial-ly important in understanding the phylogenetic relation-ships of the species.
A great deal of what is found here seems to relate to func-tional and developmental factors that are common tomacaques (probably common to all anthropoidea). Someparts of the result may refer however, to differences thatare restricted to macaques (and possibly other closely re-lated Old World monkeys). Thus that inter-specific varia-tion is larger than intra-specific variation in themasticatory apparatus may be related to the fact that thegreatest variation between species found in the muzzle re-gion of this genus [5]. There is mounting evidence that, atleast within some groups of primates and at lower taxo-nomic levels, the morphology in this area is not a usefulindicator of phylogeny because of its great variation[24,25]. This may especially apply to a genus like Macacathe species of which vary considerably in size. As a result,variation between sexes is expressed in the second axis(even though a large component of this variation is alsosize). The same may be also true regarding the profile ex-pressed by the whole skull which is similar to that illus-trated by the masticatory apparatus. The variation of thewhole skull can also reflect variation in species size be-cause body size is tightly related to skull size. For example,the latter is frequently used to substitute the former in thestudies in which body size needs to be considered but isnot available [6,26,27]. It is also possible, however, thatthis similarity may be related to fact that a quite numberof variables related to masticatory apparatus used in the fi-nal analysis.
Third, there is the question of species separationsThis study indicates that there are different profiles in dif-ferent species even within a group as closely related asthese species within a single genus such as Macaca. Thisadditional information resides in the interactions of infor-mation from the separate regions that is produced by theaggregation of parts into the whole skull analysis. It wouldthus be missed in studies that only include univariate dataor even multivariate data if they involved only restrictedparts of the skull. On the other hand, remarkable sex andspecies separations are also found in the higher axes (seeespecially Pan [5]). Thus, additional information besidesthat in the first two axes should be considered.
Finally, there is the question of methodologyThe methods used in this study may provide a means foridentifying primitive and shared-derived characteristicsfor use in cladistic analysis. Thus, instead of moving di-rectly to decisions as to the type and polarity of characters,
studies of this type may provide biological informationthat can indicate how a character in cladistics should becoded. For instance, most of the information here impliesthat the individual variables are so complex that each is anactually a compound of several, perhaps many, characters(resulting from different underlying genetic, developmen-tal and functional mechanisms). It may therefore be inap-propriate to make a cladistic assessment of any singlevariable for cladistics (character) as primitive or derived.This study indicates that each variable is a resultant ofmany different biological processes and inevitably will re-flect a compound of characters of different primitiveness-es and derivednesses. Indeed, these results indicate that inmaking the decision that any given variable (character) isprimitive or shared derived etc, the only thing one can becertain of is that both assessments must be wrong. Eachvariable must reflect several different "characters" each ofwhich may be primitive or shared derived. Disentanglingsuch complexity (if it can be done) will require additionalstudy including additional suites of variables characters(for instance, analysis of all breath measurements as sep-arate from all length measurements, and so on).
ConclusionsThe profiles composed of the inter- and intraspecific vari-ations of macaques revealed in this study are complicated.1) Seven functional units are aggregated into three ana-tomical regions: the masticatory apparatus, the face as awhole and the cranium as a whole. In turn, the three ana-tomical regions can be aggregated into the skull as awhole. 2) Interspecific variation is the larger than sexualdimorphism in the masticatory apparatus and the wholeskull. The opposite is true in the face as a whole and cra-nium as a whole. 3) Conclusions based on individualfunctional units or anatomical regions are limited in ex-ploring biological issues concerned with functional mor-phology, growth, development, phylogeny andclassification. It is obvious that the different parts of skullprovide different information and thus analyses of partialanatomies (as may be all that are present in fossils) mustbe interpreted cautiously. Obviously these findings needto be tested in other primates using other anatomical var-iables (and especially length and breadth combinations ofvariables and three-dimensional coordinate variables).Their application under these conditions may permit bet-ter use of cladistic analysis.
Materials and MethodsEleven species of the genus Macaca are used (Table 3). Thematerials are housed in a number of institutes, universi-ties and museums in various parts of the world (see Ac-knowledgements). All specimens are from adultmacaques, as judged by the full eruption of M3s. The sexesof the skulls are taken from available records. Sample sizeis variable between species: from 16 for M. nigra to 40 for
Page 10 of 12(page number not for citation purposes)

BMC Evolutionary Biology 2002, 2 http://www.biomedcentral.com/1471-2148/2/10
the five species (M. mulatta, M. assamensis, M. arctoides, M.nemestrina and M. fascicularis).
It is usual, in studies like this, to take equal or sub-equalsamples for each species. However, in the case ofmacaques that show great variations in distribution andsub-speciation, it may be inappropriate to take equal sam-ple sizes from one species to another without taking ac-count the amount of variation and the number of sub-species within the different species. According to Groves[28] some species, such as M. mulatta and M. fascicularisoccupying large geographic distribution ranges, have al-ready formed 6 and 10 geographic subspecies respectively.Others, such as M. sylvanus and M. nigra are found in verysmall regions and do not display any subspecies divisions.Thus, in order to keep variation proportional betweenspecies, the specimens of the species with a great geo-graphic variation should be selected from different geo-graphic populations; sample size should be larger in themthan in those with small geographic diversity. This may bea critical factor in studies of a complex genus like Macaca.
Intraspecific variation in this study relates to sexual di-morphism. There is no report at present about variationsin sexual dimorphism among population groups or sub-species within a specific species. As a result this study usessub-equal sample sizes between sexes for each species.Again, though it is likely that the natural adult sex ratio inthese species is not one-to-one, but in all probability, few-er males to more females, not enough is known about thisfactor in the field to use it in the current analyses. Again,this is a factor to which greater attention may need to bepaid when materials and appropriate information areavailable.
Seventy-seven linear dental, mandibular and cranial vari-ables are measured on each specimen using digital cali-pers accurate to 0.01 mm. Length measurements are madeparallel to the median sagittal plane, and breadth (orwidth) measurements are made in the coronal plane. Me-siodistal length of teeth is measured as the greatest lengthfrom the most mesial to the most distal points; buccolin-gual breath is the greatest breath, from the most buccal tothe most lingual points.
The complexity of the skull discussed above required thenested research strategy described above. Thus, the varia-bles are grouped into 7 units – mandible, lower teeth, up-per teeth, maxilla, upper face, calvaria and cranium [5].
Principal Components Analysis (PCA) is an importantmethod in studying inter-and intraspecific variation si-multaneously. It is especially robust in searching for dif-ferences of size, sex, function and phylogeny [16] withinand between species groups [6]. It would be interesting toknow whether this method is also useful for revealing dif-ferences between functional units and anatomical regionsof the skull. Thus, seven functional units are each first an-alyzed by PCA to derive the profile of species and sex sep-arations. The units exhibiting similar profile are thengrouped together to form composite, anatomical regionsin which sex and species profiles are again studied usingPCA. Finally a number of the variables, reduced on the ba-sis of these results, are used in PCA investigations of thewhole skull.
The division of the skull into functional units, and theirsequential aggregation into anatomical regions and thenthe skull as a whole is aimed at investigating the ways inwhich the different parts profile the animals' separations,and how the increasing aggregation of parts influences theoverall relationships. Such a design strategy allows deter-mination of how variations, between and within species,vary in different parts of the skull. In particular, they pro-vide insight into interpretations that are often made in re-lation to the first principal component.
Another purpose of this study is to discover the variablesthat are the main contributors to the components. The cri-teria for this selection are based on their influences on thefirst two axes of the respective previous PCAs, which con-tain most of the variation. Initially, the variables that ex-hibit significant contributions, with loadings of morethan 0.300, are chosen [5,29]. Because different areas mayhave different numbers of significant variables, the selec-tion of variables also involves choosing balanced propor-tions of variables from the different units or regions.
All of the statistical analyses are made using the SPSS pro-gram for Windows.
Table 3: Species and numbers (by sex) used in this study
Species Males Female Total
M. mulatta 20 20 40M. fuscata 11 11 22M. sinica 14 8 22M. assamensis 20 20 40M. radiata 12 12 24M. arctoides 20 20 40M. sylvanus 11 10 21M. nemestrina 20 20 40M. nigra 8 8 16M. fascicularis 20 20 40M. thibetana 11 8 29Totals 167 157 324
Page 11 of 12(page number not for citation purposes)
BMC Evolutionary Biology 2002, 2 http://www.biomedcentral.com/1471-2148/2/10
AcknowledgementsWe sincerely thank Dr. N. G. Jablonski who collected some of the data for this study. Thanks also are due to Dr L. Freedman for his advice and sug-gestion. We thank the following, Institutions, Universities and Museums for allowing examination and measurement of specimens: American Museum of Natural History, New York; Northwestern Institute of Biology, Xining, Qinghai, China; Beijing Institute of Zoology, Beijing, China; Field Museum of Natural History, Chicago; Guangdong Institute of Entomology, Guangzhou, Guangdong, China; Guangxi Forest Department, Nanning, Guangxi, China; Guangxi Medical College, Nanning, Guangxi, China; Muséum National d'Histoire Naturelle, Paris; National Museum of Natural History, Washing-ton, DC; Nanchong Teachers' College, Nanchong, Sichuan, China; Yunnan University, Kunming, Yunnan, China; Royal College of Surgeons, London; Department of Mammalogy, British Museum (Natural History), London; Zoological Reference Collection, National University of Singapore.
This work was supported by Australian Research Council (Two Large Grants and one Research Fellow project).
References1. Thorogood PP: Differentiation and morphogensis of cranial
skeletal tissues. In : The Skull: Development. (Edited by: Hanken J, HallBK) Chicago: The University of Chicago Press 1993, 1:112-152
2. Hall BK: Earliest evidences of cartilage and bone developmentin embryonic life. Clinical Orthopedics 1987, 225:255-272
3. Behrents RG: Growth in the aging craniofacial skeleton. Mon-ograph 17, craniofacial Growth Series. Ann Arbor: University ofMichigan 1985
4. Enlow DH, Poston WR: Facial growth. Harcourt Brace Jo-vanovich, Inc: W. B. Saunders Company 1990
5. Pan RL: A craniofacial study of the genus Macaca, with specialreference to the stump-tailed macaques, M. arctoides and M.thibetana: A functional approach. PhD Thesis. Perth, Australia: TheUniversity of Western Australia 1998
6. Pan RL, Oxnard CE: Radiation and evolution of three macaquespecies, Macaca fascicularis, M. radiata and M. sinica, as relat-ed to geographic changes in the Pleistocene of SoutheastAsia. In: Faunal aand Floral Migrations and Evolution in SE Asia-Australasia(Edited by: Metcalfe I, Smith, JMB, Morwood M, Davidso I) Swets and Zei-tlinger Publisher 2001, 345-363
7. Cheverud J, Malcolm MM, Dow M, Leutenegger W: The quantita-tive assessment of phylogenetic constraints In comparativeanalysis: sexual dimorphism in body weight among primates.Evol 1985, 38:1335-1351
8. Leutenegger W: Relationship of sexual dimorphism in caninesize and body size to social behaviour, and ecological corre-lates in anthropoid primates. Primates 1977, 18:117-136
9. Oxnard CE: Sexual dimorphism in the overall proportions ofprimates. Am J Primatol 1983, 4:1-22
10. Pan RL, Groves CP: Phylogenetic Relationship in Asian Colob-ines. In: Shaping Primate Evolutio (Edited by: Fred Anapol F) CambridgeUniversity Press
11. Pan RL, Oxnard CE: A strategy for the morphometric analysisof the skull: implication for macaques. Am J Phys Anthropol 1999,28(supl.):217
12. Fooden J: Provisional classification and key to the living spe-cies of macaques (Primates: Macaca). Folia Primatol 1976,25:225-236
13. Fooden J: Classification and distribution of living macaques(Macaca lecépède, 1799). In: The Macaques: Studies in Ecology, Be-
haviour and Evolution (Edited by: Lindburg DG) New York: Van NostrandReinhold 1980, 1-9
14. Delson E: Fossil macaques, phylogenetic relationships and ascenario of development. In: The Macaques: Studies in Ecology, Be-haviour and Evolution (Edited by: Lindburg DG) New York: Van NostrandReinhold 1980, 10-30
15. Hoelzer GA, Melnick DJ: Genetic and evolutionary relationshipsof macaques. In: Evolutionary Ecology and Behaviour of Macaques (Ed-ited by: Fa, JE, Lindburg DG) Cambridge, UK: Cambridge University Press1996, 3-19
16. Pan RL, Oxnard CE: Craniodental variation of macaques(Macaca): size, function and phylogeny. Zoological Research 2000
17. Bjõrk AA: Variations in the growth pattern of the humanmandible: longitudinal radiographic study by the implantmethod. J Dent Res 1963, 42(Suppl):400-411
18. Solow B: The dentoalveolar compensatory mechanism: back-ground and clinical implications. Brit J Orthod 1980, 7:145-161
19. Lundstrõm A, McWilliam JS: Dento-alveolar compensation forantero-posterior variations between the upper and lowerapical bases. Eur J Orthod 1984, 6:116-122
20. Sarnat BG: Postnatal growth of the nasomaxillary complex. In:Fundamentals of Craniofacial Growth Functional (Edited by: Dixon, AD,Hoyte CAN, Rõnning, O) Bocat Raton and New York: CRA Press. 1997,205-224
21. Pan RL, Jablonski NG, Oxnard CE, Freedman L: Morphometricanalysis of Macaca arctoides and M. thibetana in relation toother macaque species. Primates 1998, 39:519-543
22. Hoyte AA: Growth of the orbit. In: Fundamentals of CraniofacialGrowth Functional (Edited by: Dixon AD, Hoyte CAN, Rõnning, O) BocatRaton and New York: CRA Press 1997, 225-255
23. Thomson KS: Segmentation, the adult skull, and the problemof homology. In: The Skull: patterns of structural and systematic diversity(Edited by: Hanken J, Hall BK) Chicago: The University of Chicago Press1993, 2:36-68
24. Collard M, Wood BA: How reliable are current estimates offossil catarrhine phylogeny? An assessment using extantgreat apes and Old World monkeys. In Hominoid Evolution andClimate Change in Europe Volume 2: Phylogeny of the Neogene HominoidPrimates of Eurasia (Edited by: de Bonis L, Koufous GD, Andrews P) Cam-bridge: Cambridge University Press. 2001, 118-150
25. Collard M, Wood BA: How reliable are human phylogenetic hy-potheses Proceedings of the National Academy of Sciences 2000,97:5003-5006
26. Pilbeam D, Gould SJ: Size and scaling in human evolution. Sci-ence 1974, 1986:892-901
27. Pirie PL: Allometric scaling in the postcanine dentition withreference to primate diets. Primates 1978, 19:583-591
28. Groves CP: Primate taxonomy. Washington and London.Smithsonian Institute Press 2001
29. Hair JF Jr, Anderson RE, Black WC: Multivariate data analysiswith reading. Maxwell Macmillan, Canada. Macmillan PublishingCompany 1992, 193-264
Additional material
Additional FileAppendixClick here for file[http://www.biomedcentral.com/content/supplementary/1471-2148-2-10-S1.doc]
Publish with BioMed Central and every scientist can read your work free of charge
"BioMedcentral will be the most significant development for disseminating the results of biomedical research in our lifetime."
Paul Nurse, Director-General, Imperial Cancer Research Fund
Publish with BMC and your research papers will be:
available free of charge to the entire biomedical community
peer reviewed and published immediately upon acceptance
cited in PubMed and archived on PubMed Central
yours - you keep the copyright
[email protected] your manuscript here:http://www.biomedcentral.com/manuscript/
BioMedcentral.com
Page 12 of 12(page number not for citation purposes)