Reliability of a method to measure novelty-seeking in nonhuman primates
16
American Journal of Primatology 68:1098–1113 (2006) RESEARCH ARTICLE Reliability of a Method to Measure Novelty-Seeking in Nonhuman Primates ANA MARI ´ A SANTILLA ´ N-DOHERTY , JAIRO MUN ˜ O ´ Z-DELGADO, RITA ARENAS, ALEJANDRA MA ´ RQUEZ, AND JOSE ´ CORTE ´ S Instituto Nacional de Psiquiatrı´a ‘‘Ramo´n de la Fuente Mun˜ı´z,’’ Tlalpan, Me´xico The objective of this study was to create a reliable method to measure novelty-seeking (NS) temperament in stumptailed macaques. We correlated two behavioral indexes (risk-taking and curiosity) with the NS index. Cochran’s concordance index yielded ethogram reliability (risk: a 5 0.88; curiosity: a 5 0.79). Risk and curiosity indexes were obtained with a synthetic index obtainment approach. Intraclass correlation of the instrument yielded a value of 0.88. Temperament index was established from the average score given by each judge. The instrument presented 92% specificity and 70% sensitivity, with a 56-point score taken as the cuttoff point to classify individuals. The results of a Spearman’s analysis of the three indexes were significant (temperament-risk, n 5 32, Po0.01; temperament-curiosity, n 5 29, Po0.05; risk curiosity, n 5 29, Po0.05). We conclude that the method we developed is reliable. Am. J. Primatol. 68:1098–1113, 2006. c 2006 Wiley-Liss, Inc. Key words: temperament; primates; novelty-seeking; assessment; reliability INTRODUCTION Several authors have studied differential behavioral responses to novel stimuli and risk-seeking behavior [Siegel & Driscoll, 1996; Zuckerman, 1996], and suggested that the temperament of the subjects underlies these behavioral responses. Factorial analyses have unraveled a factor consisting of three traits: risk-seeking, impulsivity, and socialization. This factor constitutes one of the main dimensions of several taxonomic models (a psychometric concept that refers to the objective methods used to evaluate personality), such as extraversion [Costa & McCrae, 1985; Eysenck & Eysenck, 1985; Gray, 1973, 1987], impulsivity [Goldberg, 1990], novelty-seeking (NS) [Cloninger et al., 1991], and sensation- seeking [Zuckerman, 1984]. Among other things, NS is characterized by high Published online in Wiley InterScience (www.interscience.wiley.com). DOI 10.1002/ajp.20310 Received 15 February 2005; revised 20 January 2006; revision accepted 2 February 2006 Contract grant sponsor: CONACYT; Contract grant number: 25858 H/1452. Correspondence to: Ana Marı ´a Santilla ´n-Doherty, Lı ´nea de Cronoecologı ´a y Etologı ´a Humana, Departamento de Etologı ´a, Divisio ´n de Neurociencias, Instituto Nacional de Psiquiatrı ´a‘‘Ramo´nde la Fuente Mun ˜iz,’’ Calzada Me ´xico Xochimilco ]101, Col. San Lorenzo Huipulco, Tlalpan 14630, Me ´xico D.F. E-mail: [email protected] r r 2006 Wiley-Liss, Inc.
-
Upload
independent -
Category
Documents
-
view
2 -
download
0
Transcript of Reliability of a method to measure novelty-seeking in nonhuman primates

American Journal of Primatology 68:1098–1113 (2006)
RESEARCH ARTICLE
Reliability of a Method to Measure Novelty-Seekingin Nonhuman Primates
ANA MARIA SANTILLAN-DOHERTY�, JAIRO MUNOZ-DELGADO, RITA ARENAS,ALEJANDRA MARQUEZ, AND JOSE CORTESInstituto Nacional de Psiquiatrıa ‘‘Ramon de la Fuente Munız,’’ Tlalpan, Mexico
The objective of this study was to create a reliable method to measurenovelty-seeking (NS) temperament in stumptailed macaques. Wecorrelated two behavioral indexes (risk-taking and curiosity) with theNS index. Cochran’s concordance index yielded ethogram reliability (risk:a5 0.88; curiosity: a5 0.79). Risk and curiosity indexes were obtainedwith a synthetic index obtainment approach. Intraclass correlation of theinstrument yielded a value of 0.88. Temperament index was establishedfrom the average score given by each judge. The instrument presented92% specificity and 70% sensitivity, with a 56-point score taken as thecuttoff point to classify individuals. The results of a Spearman’s analysisof the three indexes were significant (temperament-risk, n 5 32, Po0.01;temperament-curiosity, n 5 29, Po0.05; risk curiosity, n 5 29, Po0.05).We conclude that the method we developed is reliable. Am. J. Primatol.68:1098–1113, 2006. �c 2006 Wiley-Liss, Inc.
Key words: temperament; primates; novelty-seeking; assessment;reliability
INTRODUCTION
Several authors have studied differential behavioral responses to novelstimuli and risk-seeking behavior [Siegel & Driscoll, 1996; Zuckerman, 1996], andsuggested that the temperament of the subjects underlies these behavioralresponses. Factorial analyses have unraveled a factor consisting of three traits:risk-seeking, impulsivity, and socialization. This factor constitutes one of themain dimensions of several taxonomic models (a psychometric concept that refersto the objective methods used to evaluate personality), such as extraversion[Costa & McCrae, 1985; Eysenck & Eysenck, 1985; Gray, 1973, 1987], impulsivity[Goldberg, 1990], novelty-seeking (NS) [Cloninger et al., 1991], and sensation-seeking [Zuckerman, 1984]. Among other things, NS is characterized by high
Published online in Wiley InterScience (www.interscience.wiley.com).DOI 10.1002/ajp.20310
Received 15 February 2005; revised 20 January 2006; revision accepted 2 February 2006
Contract grant sponsor: CONACYT; Contract grant number: 25858 H/1452.
�Correspondence to: Ana Marıa Santillan-Doherty, Lınea de Cronoecologıa y Etologıa Humana,Departamento de Etologıa, Division de Neurociencias, Instituto Nacional de Psiquiatrıa ‘‘Ramon dela Fuente Muniz,’’ Calzada Mexico Xochimilco ]101, Col. San Lorenzo Huipulco, Tlalpan 14630,Mexico D.F. E-mail: [email protected]
rr 2006 Wiley-Liss, Inc.
exploratory levels, emotion-seeking, and lack of inhibition [Cloninger et al., 1991].In some studies it also includes impulsive activity and uninhibited sexuality[Zuckerman, 1984].
This dimension of temperament in animals is usually measured by exposingthe subject to novel stimuli [Coleman et al., 2005; Piazza et al., 1990] orintroducing changes in the environment [Gouteaux et al., 1999]. In primates,taxonomic methods have been used with good results [Clarke & Boinski,1995; Gosling & John, 1999]; thus, various instruments are currently availableto assess the impulsive temperament [Fairbanks et al., 1999; Stevenson-Hindeet al., 1980; Suomi, 1991]. However, only a few studies have included bothtrait assessment and behavioral evaluations [Capitanio, 1999]. Dellu et al. [1996]and Gosling [2001] believe that in order to have a more integratedstudy in relation to a dimension of temperament, including the one mentionedabove, the research must include an ethological assessment of the activitiesrelated to the specific dimension (coding), as well as an evaluation of thepersonality traits of the subject (rating). Both terms (coding and rating)were proposed by Gosling [2001]. The purpose of this study was to generatea reliable method to measure NS in nonhuman primates by integrating bothmethods.
MATERIALS AND METHODS
General Procedure
Three measurements to assess NS were carried out: two referring tobehavioral categories, and one to personality traits. The procedure was asfollows: 1) The behavior of the subjects was coded after they were presentedwith a hazardous object (risk-taking category), 2) the subjects’ behaviortoward a series of novel objects (curiosity category) was coded, and 3)temperament traits associated with NS were rated. To avoid bias in themeasurements, different persons were employed as behavior observers (3)and trait raters (2). Thus three indexes were obtained that when correlatedindicated the reliability of the method. These indexes were 1) the risk-takingbehavior index (defined as the response rate of each individual facing ahazardous object), 2) the curiosity behavior index (the response rate of eachindividual when confronted with a novel object), and 3) the temperament index(the rating of NS traits in every subject by means of an instrument created forthat purpose).
Subjects
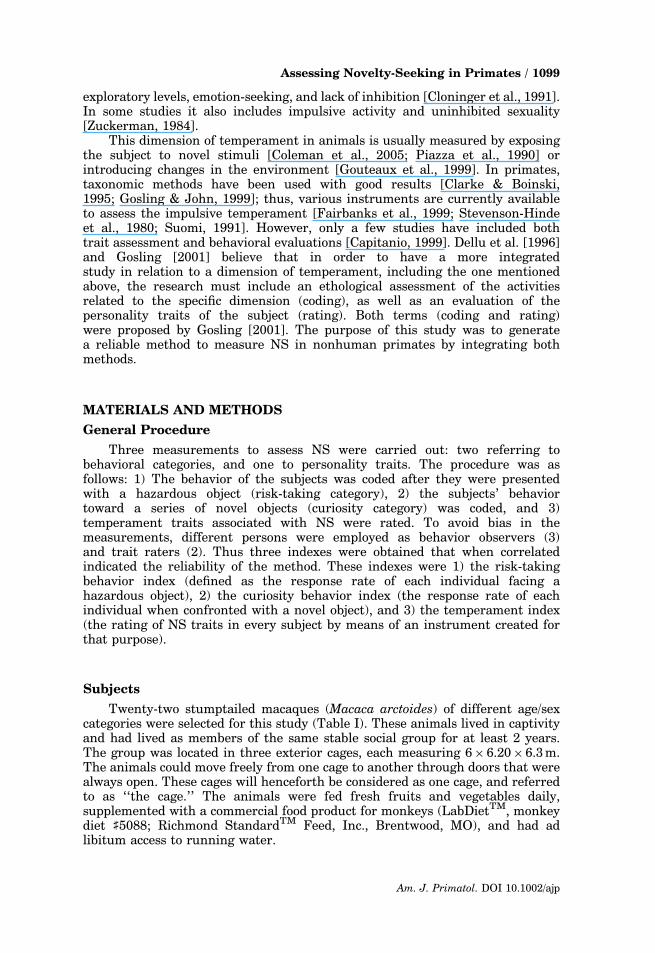
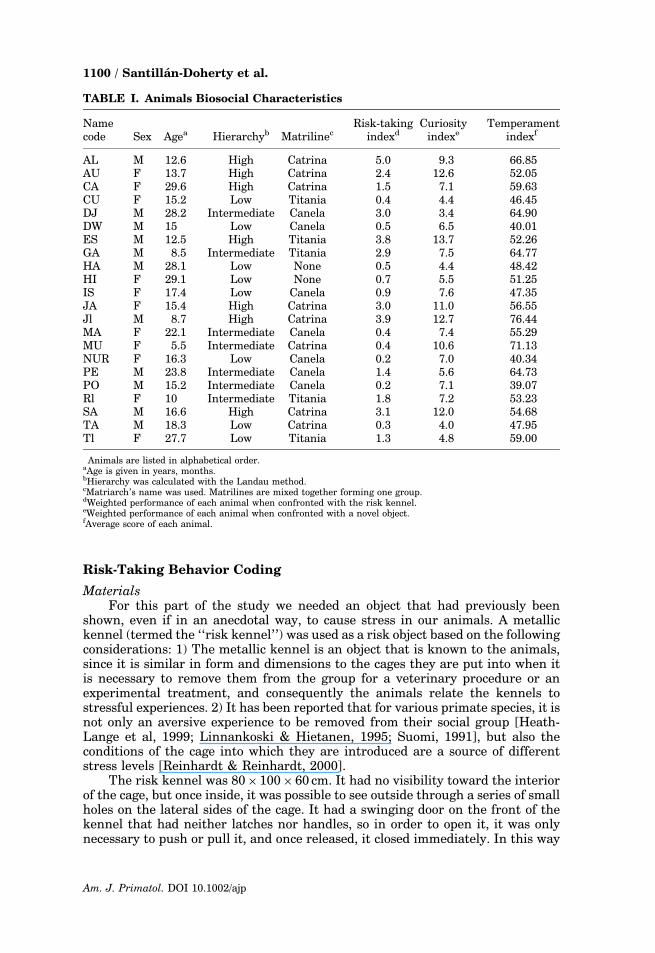
Twenty-two stumptailed macaques (Macaca arctoides) of different age/sexcategories were selected for this study (Table I). These animals lived in captivityand had lived as members of the same stable social group for at least 2 years.The group was located in three exterior cages, each measuring 6� 6.20� 6.3 m.The animals could move freely from one cage to another through doors that werealways open. These cages will henceforth be considered as one cage, and referredto as ‘‘the cage.’’ The animals were fed fresh fruits and vegetables daily,supplemented with a commercial food product for monkeys (LabDietTM, monkeydiet ]5088; Richmond StandardTM Feed, Inc., Brentwood, MO), and had adlibitum access to running water.
Assessing Novelty-Seeking in Primates / 1099
Am. J. Primatol. DOI 10.1002/ajp
Risk-Taking Behavior Coding
MaterialsFor this part of the study we needed an object that had previously been
shown, even if in an anecdotal way, to cause stress in our animals. A metallickennel (termed the ‘‘risk kennel’’) was used as a risk object based on the followingconsiderations: 1) The metallic kennel is an object that is known to the animals,since it is similar in form and dimensions to the cages they are put into when itis necessary to remove them from the group for a veterinary procedure or anexperimental treatment, and consequently the animals relate the kennels tostressful experiences. 2) It has been reported that for various primate species, it isnot only an aversive experience to be removed from their social group [Heath-Lange et al, 1999; Linnankoski & Hietanen, 1995; Suomi, 1991], but also theconditions of the cage into which they are introduced are a source of differentstress levels [Reinhardt & Reinhardt, 2000].
The risk kennel was 80� 100� 60 cm. It had no visibility toward the interiorof the cage, but once inside, it was possible to see outside through a series of smallholes on the lateral sides of the cage. It had a swinging door on the front of thekennel that had neither latches nor handles, so in order to open it, it was onlynecessary to push or pull it, and once released, it closed immediately. In this way
TABLE I. Animals Biosocial Characteristics�
Namecode Sex Agea Hierarchyb Matrilinec
Risk-takingindexd
Curiosityindexe
Temperamentindexf
AL M 12.6 High Catrina 5.0 9.3 66.85AU F 13.7 High Catrina 2.4 12.6 52.05CA F 29.6 High Catrina 1.5 7.1 59.63CU F 15.2 Low Titania 0.4 4.4 46.45DJ M 28.2 Intermediate Canela 3.0 3.4 64.90DW M 15 Low Canela 0.5 6.5 40.01ES M 12.5 High Titania 3.8 13.7 52.26GA M 8.5 Intermediate Titania 2.9 7.5 64.77HA M 28.1 Low None 0.5 4.4 48.42HI F 29.1 Low None 0.7 5.5 51.25IS F 17.4 Low Canela 0.9 7.6 47.35JA F 15.4 High Catrina 3.0 11.0 56.55Jl M 8.7 High Catrina 3.9 12.7 76.44MA F 22.1 Intermediate Canela 0.4 7.4 55.29MU F 5.5 Intermediate Catrina 0.4 10.6 71.13NUR F 16.3 Low Canela 0.2 7.0 40.34PE M 23.8 Intermediate Canela 1.4 5.6 64.73PO M 15.2 Intermediate Canela 0.2 7.1 39.07Rl F 10 Intermediate Titania 1.8 7.2 53.23SA M 16.6 High Catrina 3.1 12.0 54.68TA M 18.3 Low Catrina 0.3 4.0 47.95Tl F 27.7 Low Titania 1.3 4.8 59.00
�Animals are listed in alphabetical order.aAge is given in years, months.bHierarchy was calculated with the Landau method.cMatriarch’s name was used. Matrilines are mixed together forming one group.dWeighted performance of each animal when confronted with the risk kennel.eWeighted performance of each animal when confronted with a novel object.fAverage score of each animal.
1100 / Santillan-Doherty et al.
Am. J. Primatol. DOI 10.1002/ajp
the animals were isolated without being trapped, for they could make themselvesfree simply by pushing the door open again.
ProcedureThe risk kennel was introduced into the cage once a week at 10 A.M. It was left
there for approximately 50 min, during which time the animals had free accessto it. Feeding time, usually around 9:00 A.M., was delayed until after theexperimental treatment. Each session was videotaped continuously, for a total ofnine sessions (450 min), one session per week.
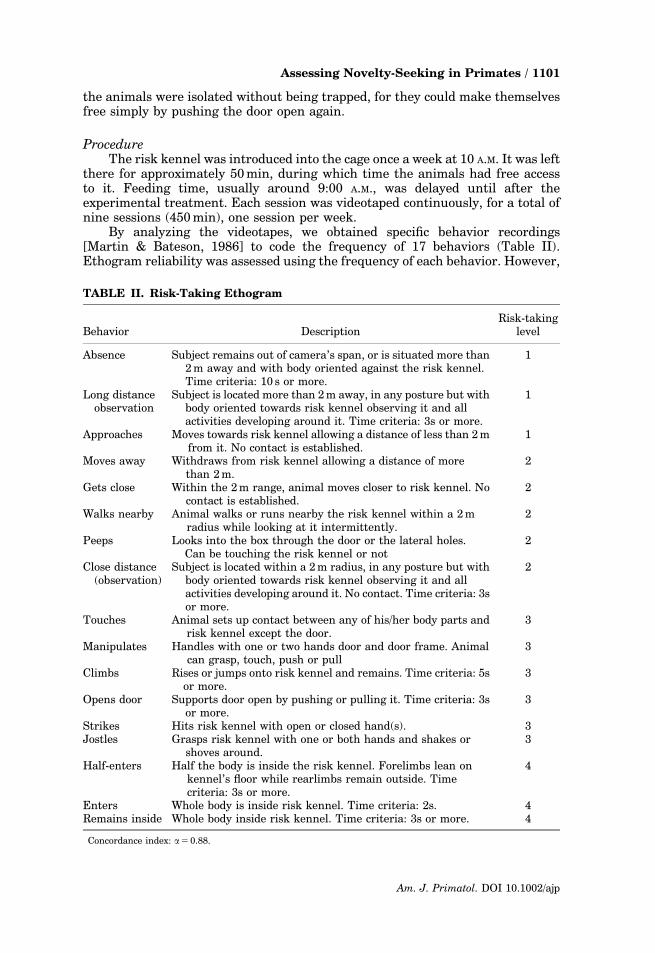
By analyzing the videotapes, we obtained specific behavior recordings[Martin & Bateson, 1986] to code the frequency of 17 behaviors (Table II).Ethogram reliability was assessed using the frequency of each behavior. However,
TABLE II. Risk-Taking Ethogram�
Behavior DescriptionRisk-taking
level
Absence Subject remains out of camera’s span, or is situated more than2 m away and with body oriented against the risk kennel.Time criteria: 10 s or more.
1
Long distanceobservation
Subject is located more than 2 m away, in any posture but withbody oriented towards risk kennel observing it and allactivities developing around it. Time criteria: 3s or more.
1
Approaches Moves towards risk kennel allowing a distance of less than 2 mfrom it. No contact is established.
1
Moves away Withdraws from risk kennel allowing a distance of morethan 2 m.
2
Gets close Within the 2 m range, animal moves closer to risk kennel. Nocontact is established.
2
Walks nearby Animal walks or runs nearby the risk kennel within a 2 mradius while looking at it intermittently.
2
Peeps Looks into the box through the door or the lateral holes.Can be touching the risk kennel or not
2
Close distance(observation)
Subject is located within a 2 m radius, in any posture but withbody oriented towards risk kennel observing it and allactivities developing around it. No contact. Time criteria: 3sor more.
2
Touches Animal sets up contact between any of his/her body parts andrisk kennel except the door.
3
Manipulates Handles with one or two hands door and door frame. Animalcan grasp, touch, push or pull
3
Climbs Rises or jumps onto risk kennel and remains. Time criteria: 5sor more.
3
Opens door Supports door open by pushing or pulling it. Time criteria: 3sor more.
3
Strikes Hits risk kennel with open or closed hand(s). 3Jostles Grasps risk kennel with one or both hands and shakes or
shoves around.3
Half-enters Half the body is inside the risk kennel. Forelimbs lean onkennel’s floor while rearlimbs remain outside. Timecriteria: 3s or more.
4
Enters Whole body is inside risk kennel. Time criteria: 2s. 4Remains inside Whole body inside risk kennel. Time criteria: 3s or more. 4
�Concordance index: a5 0.88.
Assessing Novelty-Seeking in Primates / 1101
Am. J. Primatol. DOI 10.1002/ajp

to establish the risk-taking behavior index, risk-taking behaviors were classifiedinto four categories according to the distance between subject and object,assuming that the closer to the risk kennel, the higher the risk, since the animalshad less chances of escaping. Thus, level 1 implied behaviors directed toward therisk kennel from a distance of 42 m (absence, long-distance observation, andapproaches), level 2 grouped behaviors directed toward the risk-kennel at a closerrange (o2 m) but not in contact with it (moves away, gets close, walks nearby,peeps in, and close distance observation), level 3 implied contact with the riskkennel (touches, manipulates, climbs, opens door, strikes, and jostles), and,finally, level 4 described entering the risk kennel (half enters, enters, and remainsinside). In summary, for an animal to be classified as a risk-taker, it had to exhibitlevel 4 behaviors (e.g., enter the cage) during the first sessions. An animalentering the cage during the last sessions would be considered less reckless, sinceit had gone through a habituation and social apprenticeship process. However,an alternative way to obtain high-risk scores would be to have high frequenciesin behavior levels 1–3 during the nine sessions.
Ethogram reliabilityEthogram reliability was determined according to the interobserver agree-
ment index. Briefly, a special videotape was made by extracting from the 450-mintape a 35-min segment that contained at least one sample of each of the behaviorsdescribed in the ethogram. Using specific behavior recording [Martin & Bateson,1986], three observers recorded independently the frequency of each risk-takingbehavior. In this way, their observations were drawn from the same videotapedmaterial. Subsequently, the data were analyzed using Cochran’s concordanceindex [Cochran, 1954; Ramsey & Ramsey, 1981].
Analysis to establish the risk-taking behavior index for each subjectThe data obtained from the risk behavior recordings presented two problems:
First, low-risk categories (1 and 2) were more frequent than high-risk behaviors(3 and 4). Second, low-risk behaviors were more frequent during the first sessionsand high-risk ones were predominant in later sessions. If we limited ourselves toan analysis consisting of categorical variables, our data would not reflect whichanimals were more daring, mainly because the statistical approach establisheschi-squared contrasts; however, in this case the application conditions were notfulfilled, because of the presence of low frequencies in the high-risk categories.We needed an analysis that would allow us to compare the value or weight of thenatural frequencies obtained.
Thus, to obtain the risk index we used the synthetic index obtainmentapproach. This allows the integration in one index of information coming fromvarious measurements or values [Anderberg, 1973; Cuellar & Silva, 1999]. In thiscase, to calculate the risk index from the recorded behaviors, we weighted thenatural frequency obtained for each behavior according to its risk intensity.
The weighting procedure was based on two considerations: On the one hand,our experimental design had four behavior categories (categories 1–4) withdifferent risk intensities and natural rates (i.e., riskier behavior–categories 3 and4–presented the lowest rates). Since these implicated a higher risk (touching orentering the box), the purpose of this method was to level their value so thatit would be reflected in the synthetic index in a more plausible manner. On theother hand, the risk object was the same for each session; therefore, an adaptationprocess toward the object, in which the first sessions implied a greater risk, hadto be considered. This had to be reflected in the index as well.
1102 / Santillan-Doherty et al.
Am. J. Primatol. DOI 10.1002/ajp

To determine the weighting criteria for risk intensity, taking into account thebehavior categories, a linear relation 3n was assumed, where n could be 0, 1, 2,or 3, and the weighted values for categories 1–4 were 1, 3, 9, and 27, respectively.In this manner the total natural frequency for each category was multiplied by aweighted value (1, 3, 9, and 27). Weighting the data in this manner ensured thatlow frequencies in the high-risk categories were equivalent to the intensity of thetrait we were evaluating, which in this case was the risk intensity. In other words,the values obtained after the weighting reflected a more reliable risk index. At thesame time, another weighting criterion was used to determine the risk intensity,in which an adaptation process was considered throughout the nine sessions.To calculate this, a linear inverse relation (n 5 9, 8, 7y) was used for the sessionnumber, so that more weight was given to the first sessions than to the last ones.Once this was done, the risk index was obtained simply by calculating a weightedaverage of the performance of each animal per risk intensity per sessionthroughout all the sessions.
ResultsWith respect to the risk ethogram reliability, a good interobserver agreement
was obtained (a5 0.88). Table I (column 6) shows the risk index for each animal.
Curiosity Behavior Coding
MaterialsFor this section we needed novel objects to be presented to the animals. As
noted above, the history of these animals was well known to us because we havestudied them for many years. Like many captive animals, they have been exposedto enrichment programs now and then, and are used to being presented with toysand items. We were aware of the novelty objects and enrichment appliances thatwere implemented previously, so we selected novel objects based on the followingcriteria: 1) The primates had never been in contact with the objects. The majorityof the described objects have been used in programs involving enrichedenvironments [Bloosmith et al., 1991; Chamove, 1989], and it has been reportedthat their use reduces anomalous behavior and tension [Boccia, 1989; Kessel &Brent, 1998]. 2) All of the objects were either small and easily transported, or‘‘open,’’ that is, animals could easily flee from them [Menzel et al., 1972]. Thenovelty objects used in this study were as follows:
1. Exercise wheel: a metallic spinning wheel, 2 m in diameter placed vertically onan axis (similar to the exercise wheel used for mice).
2. Foraging panel: a metallic panel placed vertically on one of the walls of thecage, with depots of different diameters randomly arranged on its surface tostow seeds. Seeds were placed in some of these depots, but not in all, so that theanimal had to search for them.
3. Jute sack with food: a sack (1� 1.5 m) containing various types of fruit.The animal had to open it and introduce its hand (or hands) and arm (or arms),or shake it upside down to obtain the food.
4. Two large containers with lids (cylindrical, 20 cm in diameter and 30 cmin height). The animals had to open them to obtain the food, which consistedof various fruits.
5. Salters: Four metallic sealed cans (10 cm wide� 15 cm tall), one end of whichwas pierced with holes. The cans were filled with seeds (rice and wheat) andsealed so that the animal had to shake them to get the seeds.
Assessing Novelty-Seeking in Primates / 1103
Am. J. Primatol. DOI 10.1002/ajp

6. More than 50 yellow mealworms (Tenebrio molitor). These harmless insectsare used as food for many species, especially reptiles; they grow in flour and are�3 cm long.
7. Organic paint (blue, black, red, and yellow) in clumps.8. Metallic rattles: cans (15 cm wide and 15 cm tall) filled with sand and sealed,
with two opposing handles.9. Roll: a metallic cylinder (15 cm at the base perimeter and 60 cm long) with
handles at both ends.
ProcedureEvery day the novel objects were randomly distributed in the cage so that
individuals were exposed to a different novel object per session, which lastedapproximately 1 hr. The session was videotaped continuously. Once the sessionwas over, the object was withdrawn from the cage. With respect to the exercisewheel and the foraging panel, which had to be affixed to the cage, the animalswere withdrawn from the cage while either of these objects was placed. Theanimals were replaced and registered only for the first hour they were exposed tothe objects. These items were introduced on the first and second sessions, with1 week allowed to elapse between each session. The seven remaining sessions alsobegan 1 week later to allow for habituation and avoid distraction by the rest of thenovel objects, which were introduced during 7 consecutive days until ninesessions were completed (540 min).
Based on the videotapes, a specific behavior recording [Martin & Bateson,1986] was carried out to code the frequency of 11 behaviors (Table III). As withthe risk-taking ethogram, the curiosity ethogram reliability was calculated using
TABLE III. Curiosity Ethogram�
Behavior DescriptionCuriosity
level
Absence Subject remains out of camera’s span, or is situated more than2 m away and with body oriented against novel object. Timecriteria: 10s or more.
1
Leaves Withdraws from novel object more than 1 meter. 1Long distance
observationSubject is located more than 1 m away, in any posture but with
body oriented toward novel object observing it and all activitiesdeveloping around it. Time criteria: 3s or more.
1
Approaches Moves toward novel object allowing a distance of less than 1 mfrom it. No contact is established.
2
Moves away Retires from novel object within a 1 m radius. 2Close distance
observationSubject is located within a 1 m radius, in any posture but with
body oriented toward novel object observing it and all activitiesdeveloping around it. No contact. Time criteria: 3s or more.
2
Walks nearby Animal walks or runs nearby the novel object within 1 m radiuswhile looking at it intermittently.
2
Pries Contacts with nose tip or tongue 3Touches Makes contact using one hand or foot. 3Manipulates Handles novel object with 2 hands. Depending on object
characteristics animal can grasp, push or pull.4
Transports Animal can haul or lift and carry novel object to take itsomewhere else.
4
�Interobserver agreement: a5 0.79.
1104 / Santillan-Doherty et al.
Am. J. Primatol. DOI 10.1002/ajp

the frequency of each behavior; However, in order to establish the curiositybehavior index, curiosity behaviors were classified into four categories thatconsidered not only the distance established between the novel object and thesubject, but also the exploration ‘‘intensity,’’ which reflected the body partsinvolved in the contact established between the novel object and the animal.Briefly, level 1 included behaviors that took place at a distance (41 m) from thenovel object (absence, leaves, long-distance observation); level 2 implied behaviorsthat occurred near the novel object; level 3 referred to behaviors in which only onebody part was in contact with novel object (pries, touches); and level 4 indicatedthat several body parts were in contact with the novel object (manipulates andtransports). For an animal to be classified as ‘‘highly curious,’’ it had to exhibit ahigh frequency of level 4 behaviors in the majority of the sessions. On the otherhand, animals that displayed mainly level 1 and 2 behaviors would be consideredless curious.
Ethogram reliabilityTo determine whether the ethogram was reliable, we obtained the
interobserver concordance index using the same procedure as described for therisk-taking behaviors. Subsequently, the data were analyzed with the concordanceindex test devised by Cochran [Cochran, 1954; Ramsey & Ramsey, 1981].
Analysis to establish the curiosity index for each subjectSimilarly to risk behaviors, the data obtained for curiosity presented the
problem that low-curiosity categories (1 and 2) were more frequent than high-curiosity ones (3 and 4). Therefore, to calculate the curiosity index from therecorded behaviors, and to give the same weight to each behavioral category, weapplied a similar procedure. Briefly, the natural frequency of each conduct wasassigned a weight expression equal to 3n, where n 5 0, 1, 2, or 3. This gave thefollowing weight values: 1, 3, 9, and 27 for categories 1–4, respectively. In this casethe session number was irrelevant because the novel object was different for eachsession, and the frequency of recorded behaviors showed a nonlinear decline.After this procedure, the performance of each animal was averaged to obtain thecuriosity index.
ResultsWith respect to the curiosity ethogram reliability, a significant agreement
was found between the observers (a5 0.79). Table I (column 7) shows thecuriosity index for each animal.
Rating of NS Traits
The aims of this part of the study were to 1) generate an instrument toevaluate NS temperament traits in nonhuman primates, 2) obtain instrumentinterobserver agreement, 3) establish a temperament index for each subject,4) classify individuals as NS or non-NS, and 5) establish instrument reliability bycorrelating NS traits with the behavioral measurements of risk-taking andcuriosity.
Assessing Novelty-Seeking in Primates / 1105
Am. J. Primatol. DOI 10.1002/ajp

MaterialsThe evaluation instrument for the NS dimension in nonhuman primates
consisted of a 53-item questionnaire that rated the traits describing the NSdimension (Table IV). This instrument utilizes the visual-analogue technique orpsychological distance approach [Nadelsticher, 1983], in which assessments arerecorded over a nonscale line that the observer uses to evaluate a certain trait.Thus, under each of the 53 items, a nonscale line of 125 mm is found.
Instrument adaptationThe procedure used in this study was similar to the one employed by King
and Figueredo [1997] to adapt the five-factor model to primates. To describe NSanimals, we used the temperament and character inventory described byCloninger et al. [1994]. To obtain a list of NS traits that was as complete aspossible, we based our instrument on the traits concerning the four subscalesforming the NS dimension in humans, shown in bold letters in Table IV. Thesesubscales were used as reference only to make a list of all the traits used by thisinstrument to describe NS; they were not used in any analysis. All traits(adjectives) that described NS were listed. Each adjective was then described intwo or three sentences, in the context of stumptailed macaque behavior, but basedon and consistent with dictionary definitions. Sentences formed the 53 itemsof the instrument. Therefore, some traits generated identical items. For example,the ‘‘impulsive’’ trait was evaluated with the item ‘‘is impulsive.’’ Other itemswere assessed indirectly. For example, the ‘‘wasteful’’ trait, which in humansis assessed through items such as ‘‘I frequently spend all my money or get intodebt so I can continue spending’’ gave rise to the following item in nonhumanprimates: ‘‘Eats only part of a food item and discards the rest.’’
Application procedureThe instrument was shown to two examiners who were well acquainted with
the subjects because they had been observing them for several years for otherpurposes. To avoid bias, different persons were employed as risk and curiosityevaluators. Each item was thoroughly discussed. Once the examiners had a clearview of the description of the items and how to score them, a formal applicationwas conducted. The judges worked independently and without commentingon their results. On average, they assessed two subjects per session. Theinstructions emphasized that ratings should be based on overall impressions, noton estimated frequencies of particular behaviors.
The instrument used to assess the NS dimension consisted of a nonscale line,125 mm long. The only two signs it contained was a minus sign (–) to the leftof the line and a plus sign (1) to the right. The examiners had to mark this line ata certain point to indicate their evaluation of a certain particular item per subject.Afterwards, the numerical value of the evaluations was obtained simply bymeasuring, in millimeters, the position of the mark on the line from left to right.
Analysis to establish the temperament indexIn this part of the study the following objectives were pursued:1. To demonstrate the reliability of the instrument, a concordance index
among interobservers was obtained by two methods. On the one hand, a Pearsoncorrelation allowed the calculation of an interobserver concordance index. On theother hand, and taking into account the joint participation of the two judges, anintraclass correlation method was used [Guilford, 1956]. The Pearson index
1106 / Santillan-Doherty et al.
Am. J. Primatol. DOI 10.1002/ajp

TA
BL
EIV
.N
ov
elt
yS
eek
ing
Tra
its
as
ad
ap
ted
for
the
Pri
ma
tes
inT
his
Stu
dy
Exp
lora
tory
Exci
tab
ilit
yvs.
Sto
icR
igid
ity
sub
scale
:cu
riou
s,st
imu
lus
seek
er,
exci
ted
by
new
act
ivit
ies,
seek
sth
rill
s,ea
sily
bore
d,
avoid
sm
on
oto
ny,
into
lera
nt
toro
uti
ne,
pro
mote
sch
an
ge,
un
trad
itio
nal
vs.
avoid
sn
ewact
ivit
ies,
con
ven
tion
al,
non
-in
qu
isit
ive,
pre
fers
rou
tin
e.
Item
sgen
erate
dfo
rp
rim
ate
inst
rum
ent
1.
See
ks
stim
ula
tion
an
dn
ovel
tyev
enw
hen
envir
on
men
tre
main
su
nch
an
ged
.9
.In
vit
esp
lay.
2.
Get
sin
volv
edin
new
act
ivit
ies.
10
.C
han
ges
act
ivit
yfr
equ
entl
y.
3.
Ch
an
ges
pla
cefr
equ
entl
y.
11
.T
ries
dif
fere
nt
ways
top
erfo
rmth
esa
me
act
ivit
y.
4.
Soci
ali
zes.
12
.E
xp
lore
su
nk
now
np
lace
san
dsi
tuati
on
s.5
.S
pon
tan
eou
sly
seek
sth
rill
s.1
3.
Ob
serv
es,
smel
ls,
tast
esan
dm
an
ipu
late
sob
ject
sre
pea
ted
ly.
6.
Pu
tsit
self
ind
an
ger
ou
ssi
tuati
on
s.1
4.
Use
ssa
me
site
san
dsc
hed
ule
s.7
.R
esp
on
ds
posi
tivel
yto
affi
liati
ve
(affi
liati
re)
soci
al
act
ivit
y.
15
.E
xp
lore
sen
vir
on
men
tim
med
iate
lyaft
erit
chan
ges
.8
.R
esp
on
ds
posi
tivel
yto
pla
y.
16
.A
void
sm
on
oto
ny.
Imp
uls
iven
ess
vs.
Refl
ecti
ve
sub
scale
:ex
cita
ble
,d
ram
ati
c,im
pre
ssio
nis
tic,
tem
per
am
enta
l,im
pu
lsiv
e,in
tole
ran
tof
stru
ctu
re,
rule
bre
ak
er,
poor
att
enti
on
vs.
refl
exiv
en
ot
imp
uls
ive,
an
aly
tica
l,ru
lefo
llow
er,
att
enti
ve.
Item
sgen
erate
dfo
rp
rim
ate
inst
rum
ent
17
.R
eact
sn
ervou
sly
tooth
ers
or
wh
enen
vir
on
men
tch
an
ges
.2
7.
Rea
cts
wit
hir
rita
tion
wh
enin
terr
up
ted
init
sact
ivit
ies.
18
.C
on
stan
tly
dem
an
ds
sexu
al
inte
rcou
rse.
28
.S
oli
cits
sexu
al
inte
rcou
rse.
19
.H
as
tan
tru
ms.
29
.S
eem
sn
ervou
s,ju
mp
y.
20
.H
as
bru
squ
ean
du
np
red
icta
ble
mood
chan
ges
.3
0.
Rec
eives
dis
turb
an
ces
wit
hou
tget
tin
gu
pse
t.2
1.
Res
pon
ds
imm
edia
tely
toso
cial
stim
ula
tion
.3
1.
See
ms
ten
se.
22
.Is
imp
uls
ive.
32
.E
xp
ress
esit
sem
oti
on
s.2
3.
Con
cen
trate
sin
its
act
ivit
ies
wit
hou
tp
ayin
gatt
enti
on
toit
ssu
rrou
nd
ings.
33
.S
how
ssh
ort
span
sof
att
enti
on
.2
4.
Wh
enin
terr
up
ted
can
pro
ceed
act
ivit
yaft
era
wh
ile
wit
hou
tre
act
ing
neg
ati
vel
y.3
4.
Noti
ces
chan
ges
inen
vir
on
men
t.2
5.
Rea
cts
inan
exagger
ate
dm
an
ner
toso
cial
or
envir
on
men
tal
even
ts.
35
.S
eem
sin
tere
sted
inw
hate
ver
hap
pen
saro
un
dit
.2
6.
Per
form
sth
esa
me
act
ivit
ies
day
aft
erd
ay.
36
.R
eact
saggre
ssiv
ely
toth
ele
ast
pro
voca
tion
.
Assessing Novelty-Seeking in Primates / 1107
Am. J. Primatol. DOI 10.1002/ajp

Extr
avagan
cevs.
Res
erved
sub
scale
:ex
travagan
t,u
nre
stra
ined
,gall
an
tvs.
rese
rved
,co
ntr
oll
ed.
Item
sgen
erate
dfo
rp
rim
ate
inst
rum
ent
37
.S
how
su
nu
sual
beh
avio
r.4
2.
See
ms
dis
tan
t.3
8.
Sh
ow
ssp
ecie
sty
pic
al
beh
avio
rin
am
ore
elab
ora
ted
man
ner
.4
3.
Get
sin
volv
edea
sily
inso
cial
beh
avio
r.3
9.
Sh
ow
soff
.4
4.
Fre
qu
entl
yget
sin
volv
edin
soci
ose
xu
al
beh
avio
r.4
0.
Att
ract
soth
ers
att
enti
on
.4
5.
Fre
qu
entl
yp
erfo
rms
self
-dir
ecte
dse
xu
al
beh
avio
rs(m
ast
urb
ati
on
,gen
ital
exp
lora
tion
).4
1.
Rem
ain
sis
ola
ted
an
dp
hysi
call
yap
art
from
the
rest
of
the
gro
up
.
Dis
ord
erli
nes
svs.
Reg
imen
tati
on
sub
scale
:te
mp
eram
enta
l,d
isord
erly
,w
ast
efu
l,vs.
org
an
ized
,m
eth
od
ical,
ord
erly
.
Item
sgen
erate
dfo
rp
rim
ate
inst
rum
ent
46
.D
isca
rds
mu
chof
wh
at
itea
ts.
50
.B
reak
sru
les.
47
.O
nly
eats
part
of
afo
od
item
an
dd
isca
rds
the
rest
.5
1.
Mu
nch
esat
dif
fere
nt
food
item
san
dfi
nis
hes
non
e.4
8.
Fre
qu
ency
of
self
-main
ten
an
ceact
ivit
ies
is:
52
.P
erfo
rms
sever
al
act
ivit
ies
at
the
sam
eti
me
(gro
om
s,w
alk
s,ru
ns,
pla
ys,
eats
).4
9.
Qu
ali
tyof
its
self
-main
ten
an
ceact
ivit
ies
is:
53
.G
ets
involv
edin
soci
al
act
ivit
ies
spon
tan
eou
sly,
even
wh
enu
nin
vit
ed.
TA
BL
EIV
.C
on
tin
ued
Exp
lora
tory
Exci
tab
ilit
yvs.
Sto
icR
igid
ity
sub
scale
:cu
riou
s,st
imu
lus
seek
er,
exci
ted
by
new
act
ivit
ies,
seek
sth
rill
s,ea
sily
bore
d,
avoid
sm
on
oto
ny,
into
lera
nt
toro
uti
ne,
pro
mote
sch
an
ge,
un
trad
itio
nal
vs.
avoid
sn
ewact
ivit
ies,
con
ven
tion
al,
non
-in
qu
isit
ive,
pre
fers
rou
tin
e.
1108 / Santillan-Doherty et al.
Am. J. Primatol. DOI 10.1002/ajp
would have sufficed if the sole objective had been to establish the reliability of theinstrument, since it shows the level of agreement between the judges. However,since the value obtained through the instrument was to be subsequentlycorrelated with two other values (risk index and curiosity index), and to avoidan arbitrary decision in the use of the data provided by either of the judges, anintraclass concordance index was obtained. This allowed the use of the scoresgiven by both judges.
2. The value of the temperament index per subject was established from theaverage score given by each judge.
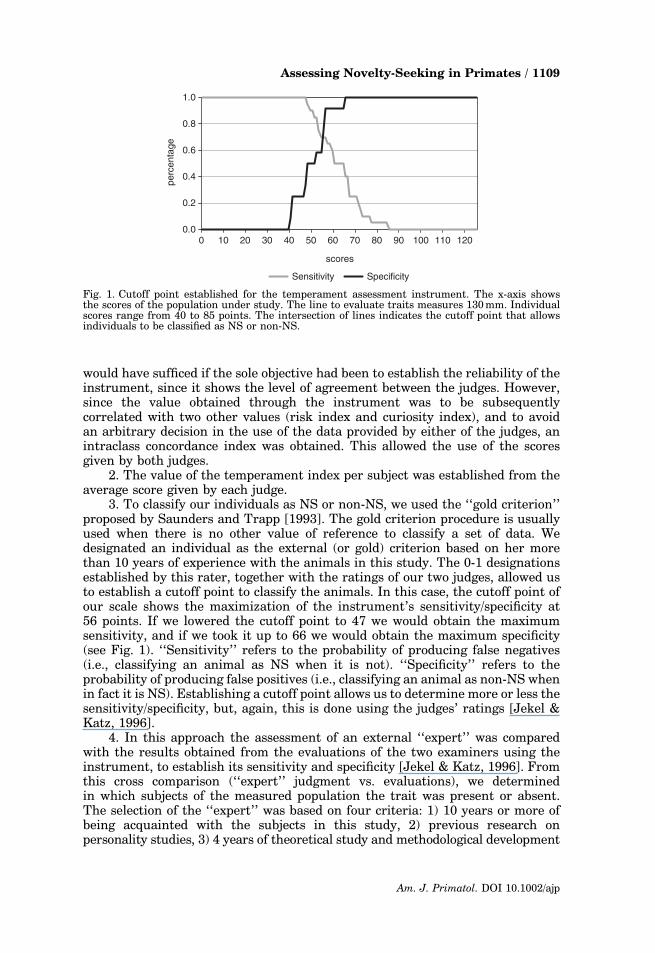
3. To classify our individuals as NS or non-NS, we used the ‘‘gold criterion’’proposed by Saunders and Trapp [1993]. The gold criterion procedure is usuallyused when there is no other value of reference to classify a set of data. Wedesignated an individual as the external (or gold) criterion based on her morethan 10 years of experience with the animals in this study. The 0-1 designationsestablished by this rater, together with the ratings of our two judges, allowed usto establish a cutoff point to classify the animals. In this case, the cutoff point ofour scale shows the maximization of the instrument’s sensitivity/specificity at56 points. If we lowered the cutoff point to 47 we would obtain the maximumsensitivity, and if we took it up to 66 we would obtain the maximum specificity(see Fig. 1). ‘‘Sensitivity’’ refers to the probability of producing false negatives(i.e., classifying an animal as NS when it is not). ‘‘Specificity’’ refers to theprobability of producing false positives (i.e., classifying an animal as non-NS whenin fact it is NS). Establishing a cutoff point allows us to determine more or less thesensitivity/specificity, but, again, this is done using the judges’ ratings [Jekel &Katz, 1996].
4. In this approach the assessment of an external ‘‘expert’’ was comparedwith the results obtained from the evaluations of the two examiners using theinstrument, to establish its sensitivity and specificity [Jekel & Katz, 1996]. Fromthis cross comparison (‘‘expert’’ judgment vs. evaluations), we determinedin which subjects of the measured population the trait was present or absent.The selection of the ‘‘expert’’ was based on four criteria: 1) 10 years or more ofbeing acquainted with the subjects in this study, 2) previous research onpersonality studies, 3) 4 years of theoretical study and methodological development
0.0
0.2
0.4
0.6
0.8
1.0
0 10 20 30 40 50 60 70 80 90 100 110 120
scores
percen
tage
Sensitivity Specificity
Fig. 1. Cutoff point established for the temperament assessment instrument. The x-axis showsthe scores of the population under study. The line to evaluate traits measures 130 mm. Individualscores range from 40 to 85 points. The intersection of lines indicates the cutoff point that allowsindividuals to be classified as NS or non-NS.
Assessing Novelty-Seeking in Primates / 1109
Am. J. Primatol. DOI 10.1002/ajp

in relation to the measurement of ns dimension, and 4) observation and previousmeasurement of the risk and curiosity behaviors in the subjects of the study.
5. The ‘‘expert’’ classified the subjects into two categories: NS and non-NS.NS individuals were coded with the number 1, and non-NS individuals wereassigned 0. Subsequently, this information was compared with the individualscore obtained from the instrument and the agreement between both assessmentswas verified. This comparison established the instrument’s sensitivity andspecificity, and thus allowed the subjects to be classified as NS or non-NS. Thesensitivity and specificity of the instrument was demonstrated item by item.
6. To assess the validity of the instrument, the three indexes (NStemperament, risk, and curiosity) were correlated by means of a Spearmananalysis.
ResultsInstrument reliability. By means of the Pearson correlation an intraobserverconcordance index was obtained (0.87). Taking into consideration the jointparticipation of the judges, the intraclass correlation approach was used, and ityielded a value of 0.88. Based on these results, the following analyses were carriedout using an average value from both judges:
Instrument sensitivity and specificity. The instrument presented 92% specificityand 70% sensitivity taking a 56-point score as the cutoff point (Fig. 1). Thusanimals that scored more than 56 were considered NS, and animals that scoredbelow that point were not.
Temperament index. Table I (column 8) shows the temperament index for eachsubject.
Instrument validity. A significant correlation was found in the three measure-ments: temperament risk, n 5 32, Po0.01; temperament-curiosity, n 5 29,Po0.05; risk curiosity, n 5 29, Po0.05. The results are listed in Table V. Also,an interscale Cronbach a was applied and a value of 0.78 was found.
DISCUSSION
Gosling [2001] proposed three criteria to be considered in personality studiesin primates. First, assessments must reflect the attributes of the subjects and notthe implicit personality theory of the observer. Personality studies that correlatedethological observations or physiological measurements with the assessment ofpersonality traits corroborate this statement. For example, Capitanio [1999]found that the traits of the sociability factor correlated well with affiliationbehaviors recorded independently (i.e., trait assessment reflects the genuine
TABLE V. Correlation Among the Three Indexes�
Indexes Temperament Risk Curiosity
Temperament – 0.55 0.61Risk – 0.45Curiosity –
�Temperament-risk (n 5 32; Po0.01); Temperament-curiosity (n 5 29; Po0.05); Risk-curiosity (n 5 29; Po0.01).Cronbach a5 0.78.
1110 / Santillan-Doherty et al.
Am. J. Primatol. DOI 10.1002/ajp
attributes of individuals). On the other hand, Weiss et al. [2000] providedevidence with regard to the inheritance of some traits (e.g., ‘‘dominant’’), whichsuggests that biological mechanisms are involved in the intrasubject variance inpersonality dimensions. In addition, correlations between CSF monoamines andimpulsivity have been observed [Fairbanks et al., 1999].
The second criterion is the concordance among independent assessments,since consensus between observers and intraobservers reflects their abilityto differentiate among the evaluated subjects. In addition, concordance is acharacteristic of accuracy and calibration of the instrument used in theevaluation. It is interesting that, as in our study, in the majority of studies onprimates the evaluators knew the study individuals well, and had for some time.This suggests that interobserver concordance may reflect this fact. There is onlyone study in the literature [Martau et al., 1985] dealing with interobservercorrelation. The authors made a comparison between ‘‘expert’’ and ‘‘non-expert’’evaluators, and found a slight increment in the concordance index for the firstgroup.
The third criterion requires that the evaluation of personality traits predictsthe behavior of the subjects. Since the study by Stevenson-Hinde et al. [1980], thepredictive capacity of personality instruments for primates has been demon-strated. In their study with green monkeys (Cercopitecus aethiops), McGuire et al.[1994] were able to predict three behavioral categories (exploration, grooming,and submission) based on the personality dimensions of the animals. Forexample, monkeys that exhibited various exploratory behaviors had high scoresin the playful/curious category.
In this study the NS dimension was measured by coding [Gosling, 2001]behaviors associated with that dimension, as well as by rating characteristictraits. The purpose of integrating both approaches was to develop a reliablemethod to measure such temperament dimensions. The high interobserverconcordance, in terms of both ethograms and the instrument used in this study,suggests that our method complies with Gosling’s [2001] second criterionassociated with reliability. The correlation found among the three measurementsshows that the method employed in this study fulfills the other two criteriarelated to the validity of the approach. We also show that the assessments reflectthe attributes of the subjects and may predict their behavior. Furthermore, thecorrelation shows a relationship among the three measurements, indicatingthat these values are consistent among themselves. For example, the judgesconsidered subject AL to have a NS temperament because it achieved a high scorein that dimension. This was corroborated when the same subject was given highscores in the risk and curiosity indexes. We therefore concluded that by using theapplied method, and in accordance with the established requirements, the NSdimension was measured adequately.
Although most animals showed consistency in their scores, several animalsdid not. For example MU and TI had a high temperament index but a low-riskindex. NS temperament has two main attributes: risk-taking behavior and highlevels of exploration and curiosity [Cloninger et al., 1994]. It is probable that theseanimals have a NS temperament mostly due to their curiosity. On the other hand,the animals were tested and evaluated in a social context, which could mean thatcertain animals, such as MU and TI, which are low-ranking animals, had lessopportunities to access the risk kennel. Future studies should address this issue.The method presented in this study does not allow us to fully analyze particularcases, because it creates individual positions from the standardized values ofall three measurements; that is, it provides only a global evaluation for each
Assessing Novelty-Seeking in Primates / 1111
Am. J. Primatol. DOI 10.1002/ajp
individual. We are aware that the instrument’s reliability may be improved byincluding more judges in the observations, and probably by introducing judgeswho have no previous experience with the animals. It might also be interestingto design a study including other species. This would allow the instrumentto be validated in other populations. Furthermore, comparative studies mustbe devised to unravel the function of the temperament dimension.
Animal research has played and continues to play a central role in manyareas of psychology. With respect to primate personality, attention to methodo-logical issues, such as assessment of interrater agreement and reliability, samplesize, and the choice of the analytic procedure used to derive personalitydimensions may lead to more consistent and rigorous research into nonhumanprimate personality.
ACKNOWLEDGMENTS
We thank M. Sanchez-Alvarez for proofreading the manuscript, and AnnDoherty for the final corrections on the English version of the text.
REFERENCES
Anderberg MR. 1973. Cluster analysisfor applications. New York: AcademicPress.
Bloosmith MA, Brent LY, Schapiro SJ. 1991.Guidelines for developing and managingan environmental enrichment program fornonhuman primates. Lab Anim Sci 41:372–377.
Boccia ML. 1989. Preliminary report on theuse of a natural foraging task to reduceaggression and stereotypes in sociallyhoused pigtailed macaques. Lab PrimateNewsl 28:3–4.
Capitanio JP. 1999. Personality dimensionsin adult male rhesus macaques: predictionof behaviors across time and situation.Am J Primatol 47:299–320.
Chamove AS. 1989. Environmental enrich-ment: a review. Anim Technol 40:155–178.
Clarke AS, Boinski S. 1995. Temperament innonhuman primates. Am J Primatol 37:103–125.
Cloninger CR, Svrakic D, Prztbeck TR. 1991.The tridimensional personality questionaireUS normative data. Psychol Rep 69:1047–1057.
Cloninger CR, Svrakic D, Prztbeck TR, WetzelRD. 1994. The temperament and characterinventory (TCI): a guide to its developmentand use. St. Louis, MO: Washington Uni-versity Center for the Psychobiology ofPersonality. p 5–26.
Cochran WG. 1954. Some methods forstrengthening the common X2 tests. Bio-metrics 10:417–451.
Coleman K, Tully LA, McMillan J. 2005.Temperament correlates with training suc-cess in adult Rhesus macaques. Am JPrimatol 65:63–71.
Costa PT, McCrae RR. 1985. The NEOpersonality inventory manual. Odessa, FL:Psychological Assessment Resources.
Cuellar I, Silva LC. 1999. Nota tecnica 1:Indice de Desarrollo Humano y Equidad.http://www.onu.org.cu/uunn/pnud/idh99/nota%201.pdf. Accessed June 2004.
Dellu F, Piazza PV, Mayo W, Le Moal M,Simon H. 1996. Novelty-seeking in rats–biobehavioral characteristics and possiblerelationship with the sensation-seekingtrait in man. Neuropsychobiology 34:136–145.
Eysenck H, Eysenck S. 1985. Personality andindividual differences: a natural scienceapproach. New York: Plenum Press.
Fairbanks LA, Fontenot MB, Phillips-ConroyJE, Jolly CJ, Kaplan JR, Mann JJ. 1999.CSF monoamines, age and impulsivity inwild grivet monkeys (Cercopithecus aethiopsaethiops). Brain Behav Evol 53:305–312.
Goldberg LR. 1990. An alternative ‘‘descrip-tion of personality’’: the big-five factorsolution. J Soc Pers Psychol 59:1216–1229.
Gosling SD, John OP. 1999. Personalitydimensions in nonhuman animals: a cross-species review. Curr Dir Psychol Sci 8:69–75.
Gosling SD. 2001. From mice to men: what canwe learn about personality from animalresearch? Psychol Bull 127:45–86.
Gouteaux S, Vauclair J, Thinus-Blanc C. 1999.Reaction to spatial novelty and exploratorystrategies in baboons. Anim Learn Behav 27:323–332.
Gray JA. 1973. Causal models of personalityand how to test them. In: Royce JR, editor.Multivariate analysis and psychologicaltheory. London: Academic Press. p 409–463.
1112 / Santillan-Doherty et al.
Am. J. Primatol. DOI 10.1002/ajp

Gray JA. 1987. Perspectives on anxiety andimpulsivity: a commentary. J Pers Res 21:493–509.
Guilford JP. 1956. Fundamental statistics inpsychology and education. New York:McGraw Hill Book Company Inc. p 55–83.
Heath-Lange S, Ha JC, Sackett GP. 1999.Behavioral measurement of temperamentin male nursery-reared infant macaquesand baboons. Am J Primatol 47:43–50.
Jekel JF, Katz DL. 1996. Epidemiology bios-tatistics and preventive medicine. Philadel-phia: W.B. Saunders. 296p.
Kessel LA, Brent L. 1998. Cage toys reduceabnormal behavior in individually housedpigtail macaques. J Appl Anim Welf Sci 1:227–234.
King JE, Figueredo AJ. 1997. The five-factormodel plus dominance in chimpanzee per-sonality. J Res Pers 31:257–271.
Linnankoski I, Hietanen JK. 1995. Observa-tions on task-related behaviour of Macacaarctoides. Folia Primatol 65:34–37.
Martau PA, Caine NG, Candland DK. 1985.Reliability of the emotions profile index,primate form, with Papio hamadryas,Macaca fuscata and two Saimiri species.Primates 26:501–505.
Martin P, Bateson P. 1986. La medicion delcomportamiento. Mexico: Alianza Editorial.p 69–91.
McGuire MT, Raleigh MJ, Pollack DB. 1994.Personality features in Vervet monkeys: theeffects of sex, age, social status, and groupcomposition. Am J Primatol 33:1–13.
Menzel EW, Davenport RK, Rogers CM. 1972.Protocultural aspects of chimpanzees’responsiveness to novel objects. FoliaPrimatol 17:161–170.
Nadelsticher AM. 1983. Tecnicas para laconstruccion de cuestionarios de actitudesy opcion multiple. Mexico: Editado por elInstituto Nacional de Ciencias Penales.p 70–79.
Piazza PV, Deminiere JM, Maccari S, Mor-mede P, LeMoal M, Simon H. 1990. Indivi-dual reactivity to novelty predictsprobability of amphetamine self-adminis-tration. Behav Pharmacol 1:339–345.
Ramsey PP, Ramsey PH. 1981. Minimumsample sizes for Cochran’s test. Surveyresearch methods, American StatisticalAssociation. http://www.amstat.org/sections/srms/Proceedings/y1981.html. AccessedJune 2004.
Reinhardt V, Reinhardt A. 2000. The lowerrow monkey cage: an overlooked variable inbiomedical research. J Appl Anim Welf Sci 3:141–149.
Saunders BD, Trapp RG. 1993. Basic andclinical biostatistics. Norwalk/San Mateo:Appleton and Lange. p 143–166.
Siegel J, Driscoll P. 1996. Recent develop-ments in an animal model of visual evokedpotential augmenting/reducing and sensa-tion seeking. Neuropsychobiology 34:130–135.
Stevenson-Hinde J, Stillwell-Barnes R, ZunzM. 1980. Individual differences in youngrhesus monkeys: consistency and change.Primates 21:498–509.
Suomi SJ. 1991. Up-tight and laid-backmonkeys: individual differences in theresponse to social challenges. In: Brauth S,Hall W, Dooling R, editors. Plasticity ofdevelopment. Cambridge, MA: MIT Press.p 27–56.
Weiss A, King JE, Figueredo AJ. 2000. Theheritability of personality traits in chim-panzees (Pan troglodytes). Behav Gen30:213–221.
Zuckerman M. 1984. Sensation seeking: acomparative approach to a human trait.Behav Brain Sci 7:413–471.
Zuckerman M. 1996. The psychobiologicalmodel for impulsive unsocialized sensationseeking: a comparative approach. Neuro-psychobiology 34:125–129.
Assessing Novelty-Seeking in Primates / 1113
Am. J. Primatol. DOI 10.1002/ajp