Online performance analysis by statistical sampling of microprocessor performance counters
10
Online Performance Analysis by Statistical Sampling of Microprocessor Performance Counters Reza Azimi Department of Electrical and Computer Engineering University of Toronto Toronto, Ontario, Canada [email protected] Michael Stumm Department of Electrical and Computer Engineering University of Toronto Toronto, Ontario, Canada [email protected] Robert W. Wisniewski IBM T. J. Watson Research Lab Yorktown Heights New York, USA [email protected] Abstract Hardware performance counters (HPCs) are increasingly being used to analyze performance and identify the causes of performance bottlenecks. However, HPCs are difficult to use for several reasons. Microprocessors do not provide enough counters to simultaneously monitor the many different types of events needed to form an over- all understanding of performance. Moreover, HPCs primarily count low–level micro–architectural events from which it is difficult to extract high–level insight required for identifying causes of perfor- mance problems. We describe two techniques that help overcome these difficulties, allowing HPCs to be used in dynamic real–time optimizers. First, statistical sampling is used to dynamically multiplex HPCs and make a larger set of logical HPCs available. Using real programs, we show experimentally that it is possible through this sampling to obtain counts of hardware events that are statistically similar (within 15%) to complete non-sampled counts, thus allowing us to provide a much larger set of logical HPCs. Second, we observe that stall cycles are a primary source of inefficiencies, and hence they should be major targets for software optimization. Based on this observation, we build a simple model in real–time that specu- latively associates each stall cycle to a processor component that likely caused the stall. The information needed to produce this model is obtained using our HPC multiplexing approach to monitor a large number of hardware components simultaneously. Our anal- ysis shows even in an out–of–order superscalar micro–processor such a speculative approach yields a fairly accurate model with run– time overhead for collection and computation of under 2%. These results demonstrate that we can effective analyze on–line per- formance of application and system code running at full speed. The stall analysis shows where performance is being lost on a given pro- cessor. Permission to make digital or hard copies of all or part of this work for personal or classroom use is granted without fee provided that copies are not made or distributed for profit or commercial advantage and that copies bear this notice and the full citation on the first page. To copy otherwise, or republish, to post on servers or to redistribute to lists, requires prior specific permission and/or a fee. ICS ´ 05, June 20-22, Boston, MA, USA. Copyright 2005, ACM 1-59593-167-8/06/2005...$5.00 1 Introduction Hardware Performance Counters (HPCs) are an integral part of modern microprocessor Performance Monitoring Units (PMUs). They can be used to monitor and analyze performance in real time. HPCs allow counting of detailed micro–architectural events in the processor [15, 24, 13, 2], enabling new ways to monitor and an- alyze performance. There has been considerable work that has used HPCs to explore the behavior of applications and identify per- formance bottlenecks resulting from excessively stressed micro– architecture components [1, 8, 25]. However, exploiting HPCs at run–time for dynamic optimization purposes has proven to be chal- lenging for a number of reasons: Limited Hardware Resources: PMUs typically have a small num- ber of HPCs (e.g. up to 8 in IBM PowerPC processors, 4 in Intel Itanium II, and 4 in AMD Athlon processors). As a result, only a limited number of low-level hardware events can be monitored at any given time. Moreover, only specific subsets of hardware events can be programmed to be counted together due to hardware– level programming constraints. This is a serious limitation con- sidering that detecting performance bottlenecks in complex super- scalar microprocessors often requires detailed and extensive per- formance knowledge of several processor components. One way to get around this limitation is to execute several runs of an applica- tion, each time with a different set of events being captured. Such an approach can become time–consuming for offline performance analysis, and is completely inappropriate for online analysis. Merg- ing the traces for offline analysis generated from several application runs is not straightforward, because there are asynchronous events (e.g. interrupts and I/O events) in each run that may cause signifi- cant timing drifts. Complex Interface: The events that can be monitored by HPCs are often low–level and specific to a micro–architecture implemen- tation and as a result, they are hard to interpret correctly without de- tailed knowledge of the micro-architecture implementation. In fact, in the processors we have considered most high–level performance metrics such as Cycles Per Instruction (CPI), cache miss ratio, and memory bus contention, can only be measured by carefully com- bining the occurrence frequencies of several hardware events. At best, this makes HPCs hard to use by average application develop- ers, but even for seasoned systems programmers, it is challenging to translate the frequency of particular hardware–level events to their actual impact on end performance due to the complexity of today’s micro–architectures. High Overhead: Because PMU resources are shared among all system processes, they can only be programmed in supervisor
-
Upload
independent -
Category
Documents
-
view
1 -
download
0
Transcript of Online performance analysis by statistical sampling of microprocessor performance counters

Online Performance Analysis by Statistical Sampling ofMicroprocessor Performance Counters
Reza AzimiDepartment of Electrical and
Computer EngineeringUniversity of Toronto
Toronto, Ontario, Canada
Michael StummDepartment of Electrical and
Computer EngineeringUniversity of Toronto
Toronto, Ontario, Canada
Robert W. WisniewskiIBM T. J. Watson Research Lab
Yorktown HeightsNew York, USA
Abstract
Hardware performance counters (HPCs) are increasingly beingused to analyze performance and identify the causes of performancebottlenecks. However, HPCs are difficult to use for several reasons.Microprocessors do not provide enough counters to simultaneouslymonitor the many different types of events needed to form an over-all understanding of performance. Moreover, HPCs primarily countlow–level micro–architectural events from which it is difficult toextract high–level insight required for identifying causes of perfor-mance problems.
We describe two techniques that help overcome these difficulties,allowing HPCs to be used in dynamic real–time optimizers. First,statistical sampling is used to dynamically multiplex HPCs andmake a larger set of logical HPCs available. Using real programs,we show experimentally that it is possible through this samplingto obtain counts of hardware events that are statistically similar(within 15%) to complete non-sampled counts, thus allowing usto provide a much larger set of logical HPCs. Second, we observethat stall cycles are a primary source of inefficiencies, and hencethey should be major targets for software optimization. Based onthis observation, we build a simple model in real–time that specu-latively associates each stall cycle to a processor component thatlikely caused the stall. The information needed to produce thismodel is obtained using our HPC multiplexing approach to monitora large number of hardware components simultaneously. Our anal-ysis shows even in an out–of–order superscalar micro–processorsuch a speculative approach yields a fairly accurate model with run–time overhead for collection and computation of under 2%.
These results demonstrate that we can effective analyze on–line per-formance of application and system code running at full speed. Thestall analysis shows where performance is being lost on a given pro-cessor.
Permission to make digital or hard copies of all or part of this work for personal orclassroom use is granted without fee provided that copies are not made or distributedfor profit or commercial advantage and that copies bear this notice and the full citationon the first page. To copy otherwise, or republish, to post on servers or to redistributeto lists, requires prior specific permission and/or a fee. ICS0́5, June 20-22, Boston,MA, USA. Copyright 2005, ACM 1-59593-167-8/06/2005...$5.00
1 Introduction
Hardware Performance Counters (HPCs) are an integral part ofmodern microprocessor Performance Monitoring Units (PMUs).They can be used to monitor and analyze performance in real time.HPCs allow counting of detailed micro–architectural events in theprocessor [15, 24, 13, 2], enabling new ways to monitor and an-alyze performance. There has been considerable work that hasused HPCs to explore the behavior of applications and identify per-formance bottlenecks resulting from excessively stressed micro–architecture components [1, 8, 25]. However, exploiting HPCs atrun–time for dynamic optimization purposes has proven to be chal-lenging for a number of reasons:
Limited Hardware Resources: PMUs typically have a small num-ber of HPCs (e.g. up to 8 in IBM PowerPC processors, 4 in IntelItanium II, and 4 in AMD Athlon processors). As a result, onlya limited number of low-level hardware events can be monitoredat any given time. Moreover, only specific subsets of hardwareevents can be programmed to be counted together due to hardware–level programming constraints. This is a serious limitation con-sidering that detecting performance bottlenecks in complex super-scalar microprocessors often requires detailed and extensive per-formance knowledge of several processor components. One way toget around this limitation is to execute several runs of an applica-tion, each time with a different set of events being captured. Suchan approach can become time–consuming for offline performanceanalysis, and is completely inappropriate for online analysis. Merg-ing the traces for offline analysis generated from several applicationruns is not straightforward, because there are asynchronous events(e.g. interrupts and I/O events) in each run that may cause signifi-cant timing drifts.
Complex Interface: The events that can be monitored by HPCsare often low–level and specific to a micro–architecture implemen-tation and as a result, they are hard to interpret correctly without de-tailed knowledge of the micro-architecture implementation. In fact,in the processors we have considered most high–level performancemetrics such as Cycles Per Instruction (CPI), cache miss ratio, andmemory bus contention, can only be measured by carefully com-bining the occurrence frequencies of several hardware events. Atbest, this makes HPCs hard to use by average application develop-ers, but even for seasoned systems programmers, it is challenging totranslate the frequency of particular hardware–level events to theiractual impact on end performance due to the complexity of today’smicro–architectures.
High Overhead: Because PMU resources are shared among allsystem processes, they can only be programmed in supervisor

mode. Thus, whenever a user process needs to change the set ofthe events being captured, it must call the operating system. Theseexpensive kernel boundary crossings can happen frequently when awide range of hardware events needs to be captured for a single runof the application.
In this paper, we describe techniques to address the above prob-lems. First, to overcome the limitation in the number of HPCs, weuse multiplexing of HPCs in a fine–grained way, instead of count-ing them fully. This method allows us to provide a much larger setof logical counters to the user, making it is possible to count the oc-currences of many micro-architectural events during a single appli-cation run. A similar technique is implemented in PAPI [7, 20], butin our approach multiplexing HPCs is done at the operating systemkernel so as to reduce run–time overhead significantly. As a result itis possible to multiplex HPCs at a much finer granularity (up to tensof thousands of HPC switches per second). Such a fine multiplex-ing granularity enables us to capture short–lived fluctuations in thehardware events occurrence rate. Moreover, we present a statisticalanalysis to show that our multiplexing approach provides sufficientaccuracy for performance tuning and optimization purposes.
Secondly, we use our multiplexing approach to interpret the impactof different hardware events on the applications end–performance.We developed an aggregate model called Statistical Stall Break-down(SSB) that provides accurate and timely information regardingwhich micro–architecture components are most stressed. SSB cat-egorizes the sources of stalls in the microprocessor pipeline, andquantifies how much each hardware component (e.g. the caches,the branch predictor, and individual functional units) contributes tooverall stall in a way that is simple and understandable to the user.SSB is built as the program runs and can be used, for example, bya dynamic optimizer to apply effective and precise optimizations.The results of our analysis show the SSB model can accuratelyidentify and quantify hardware bottlenecks. Furthermore, we showthat the run–time overhead of computing the SSB model is small.
In the next section, we describe the design of our HPC–based per-formance monitoring facility and the features it provides. We fol-low this by describing how we define the details of the SSB modeland the computations it requires at run–time. We have implementedour ideas on a real system and evaluate the implementation underrealistic workload in terms of accuracy and run–time overhead. Wepresent the platform we used for our implementation and describethe implementation issues we faced. We describe how we evaluatethe sampling accuracy, the accuracy of the SSB model, and dis-cuss the overhead of computing it at run–time. Finally, we discussrelated work and then present our conclusions and directions forfuture work.
2 System Design
We designed and implemented an HPC–based performance moni-toring facility that can be used with sampling and instrumentation.The key features of this facility are (i) it provides an easy–to–useinterface to the hardware PMU features, and (ii) it uses statisticalsampling to continuously identify microprocessor bottlenecks. Fig-ure 1 shows the block diagram of our facility. Users are providedwith a programming interface through a user–level library. Thus, anapplication can be instrumented by manually–inserted library callsor by dynamic instrumentation tools. Users’ calls are received bythe operating system component consisting of the programming in-terface module, and the sampling engine.
User Applications
OS Kernel
Hardware PMU
Configuring Control Registers
and HPCs
ContextSwitch
PMU Log PMU Library
OverflowExceptions
Sampling Engine
ProgramingInterface
Process Creation/Exit
Figure 1. The block diagram of the HPC–based performancemonitoring facility.
The sampling engine implements both HPC multiplexing and thethe SSB model which we discuss in detail later. The programminginterface module allows for both programming the PMU directlyand configuring the sampling engine. In the former case, it re-ceives the specification of a set of hardware events to be countedand automatically configures the hardware PMU. The values of theHPCs can be read directly by the user program, or logged in a per–process PMU Log by the sampling engine. To minimize the cost ofuser–kernel boundary crossings, the sampling engine operates as acomponent inside the kernel.
The sampling engine can obtain the counter values either periodi-cally or after a designated number of a hardware event occurrences.In both cases, we use the PMU overflow exceptions. For periodicsampling we use one of the HPCs as the cycle counter, allowingsampling intervals accurate down to the CPU cycle.
The sampling frequency is a critical parameter. Sampling too in-frequently may result in inaccuracies because changes in systembehavior might be missed. On the other hand, too fine-grainedsampling may result in unnecessarily high overhead. Our experi-ence shows we can afford to take samples every 200,000 cycles(100 microseconds on a 2GHz CPU) with approximately 2% over-head. This rate is our default sampling frequency, although it canbe overridden by the user.
In order to be able to isolate measurements of individual applica-tions and the operating system, the sampling engine maintains a setof HPC contexts. HPC contexts are switched whenever the operat-ing system switches processes. For this, the operating system mustnotify the sampling engine of all process creations and exits, as wellas context switches.
For each process, there are three modes of operations: kernel only,user only, and full system. In kernel–only mode, hardware eventsare only counted when the hardware is in supervisor mode. Thismode is appropriate if we are interested in monitoring operatingsystem activities incurred by a particular target process. We as-sume kernel activities that occur in a process time slice are relatedto the target process. This assumption may not be valid when sev-eral operating system intensive applications tightly share the CPU.This, kernel–only mode is best suitable when a given applicationruns in isolation for a long time (on the order of several seconds).In user–only mode logical HPCs (including the cycle counters) aresuspended when the processor switches into the kernel. Finally,in full–system mode, HPCs count all hardware events whether dueto kernel or application code. When a context switch occurs, thehardware events occurring both in the kernel and user mode will becounted by the HPCs of the new process.
We use the notion of an address space as the main indicator of acontext. Therefore, the sampling engine is capable of reporting per-formance numbers for individual processes as well as the operating

system. At this time, we do not differentiate between the user–level threads that share the same address space. One possible wayof addressing this issue is to send a performance monitoring up-call to the user process when a hardware exception occurs so that auser–defined handler can associate the recorded HPCs with the cur-rent user-level context (e.g. user-level thread ID). Such a techniqueseems to be plausible only if there is a fast (low perturbation) upcalldelivery mechanism. We are currently working on supporting this.
3 Multiplexing HPCs
Most microprocessors’ PMU offer a limited number of HPCs. Forinstance, the IBM POWER4 and PowerPC970 provide 8 HPCs, thePOWER5 6 per SMT (2 of which are hard-wired), Intel ItaniumII has 4 generic HPCs and 5 registers for holding instruction anddata address samples, and AMD Athlon has 4 generic HPCs. Inaddition to the limited number of HPCs, there are often restrictionson the combinations of hardware events that the HPCs can countdue to restrictions on how the PMU is interconnected to the CPUcomponents. For instance, although Intel P4 and Xeon have 18HPCs, but they are divided in 9 groups, each of which can countevents only from a specific subset of 48 available hardware events.
In many performance monitoring scenarios, several low–level hard-ware events must be counted simultaneously to obtain informationof interest. For instance, to obtain the L1 data cache miss rateon an IBM POWER4 processor at least 4 separate events must becounted (L1 load misses, L1 store misses, L1 loads, and L1 stores).Also, two HPCs are often reserved to count cycles and instructionsretired. The two remaining HPCs are not sufficient to count L2cahce misses, L3 cache misses, branch mispredictions, TLB misses,instruction mix (integer/floating point), ICache misses, and otherevents that are important to have a complete picture of an applica-tion’s performance.
To address this issue, we dynamically multiplex the set of hardwareevents counted by the HPCs using fine–grained time slices. Theprogramming interface component takes a large set of events to becounted as input and automatically assigns them to a number ofHPC groups in such a manner so that in each group there is noconflict due to the PMU constraints. The sampling engine assignseach group a fraction of g cycles out of a sampling round R that isthe time period that all groups are guaranteed to have been givena PMU context. At the end of each HPC group’s time slice, thesampling engine automatically assigns another HPC group to thePMU. The value that is read from an HPC after g cycles is scaledup linearly as if that group it had counted during the entire R–cycleperiod. As a result, the user program (e.g. a run–time optimizer)is presented N logical counters on top of n physical HPCs where Ncan be an order of magnitude larger than n.
The system can easily be programmed to favor certain HPC groupsby counting them for longer periods of time. This is accomplishedby allocating multiple g-cycle time slices to the group. In fact, onecan treat a period of g cycle as a unit for PMU time allocation. ThisPMU multiplexing scheme is analogous to the time–sharing of aCPU among processes. Figure 2 shows an example of four eventgroups, where each is given a time share (one or more time slices)of the sampling period. The share size of each group depends onthe desired accuracy of the hardware events that are included inthe group and on the expected rate of fluctuation of such events.Moreover, the accuracy may differ for different hardware eventswith the same share size. A default share assignment scheme mightbe overridden by explicit requests from the user that is interested in
closely monitoring a specific hardware event.
Without loss of generality, for the rest of the paper, we assume allgroups are given equal time shares, which is one time slice (g cy-cles). We call R
g the Sampling Ratio. Larger sampling ratios allow alarger number of logical HPCs. For instance, a sampling ratio of 10can provide roughly 80 logical HPCs on an 8-HPC processor. Thishas to be traded–off with the fact that sampling accuracy decreasesas the sampling ratio increases.
An issue that must be addressed is the fact that a sampling periodmay happen to coincide with loop iterations in the program. If theorder of HPC groups within a period is fixed and a sampling pe-riod happens to coincide with a loop iteration, then an HPC groupalways counts the events occurring in a fixed part of the iteration.To avoid this scenario, we randomize the order of the HPC groupsin each sampling period. As a result, each HPC will have an equalchance of being located at any given spot of the iteration.
Time
Sampling Round
(R cycles)
HPC Group 1
HPC Group 2
HPC Group 3
HPC Group 4
Allocation
Unit (g cycles)
Figure 2. Time-Based Multiplexing example: There are fourHPC groups in this example. Each HPC group is a collectionof events that are counted simultaneously. An HPC group iscounted in a number of time slices of g cycles within samplingperiod of R cycles. The order of the HPC groups is changedrandomly in different sampling periods to avoid accidental cor-relations.
With multiplexing, time is usually measured in terms of CPU cy-cles. Therefore, one counter in each HPC group is reserved to countthe CPU cycles. The use of cycle counters as timers allows us todefine arbitrary fine time–slices down to a few thousand cycles. An-other metric that can be used to define HPC group share sizes is thenumber of instructions retired. The main advantage of instruction–based multiplexing is that the HPC group share sizes are alignedmore closely with the progress of the application. Share sizes willdiffer in terms of real time depending on the available instructionlevel parallelism (ILP) and the frequency of the miss events.
A pathological case for the multiplexing engine is the existenceof a large number of short–lived bursts of a particular hardwareevent. If the burst time is shorter than R cycles, the HPC that countsthat hardware event might be inaccurate because the PMU actuallycounts the event only in a fraction of R and thus it may miss short–lived bursts. However, we expect the execution most applicationswill go through several phases, each longer than R, in which theoccurrence rate of hardware events is stable. In Section 6 we pro-vide experimental evaluation that demonstrates that the statisticaldistance between the sampled and real rates of hardware events issmall in most cases.
4 The SSB Model
Traditionally, CPI breakdown has been used to describe the perfor-mance characteristics of hardware components and program behav-ior [11]. In CPI breakdown, each hardware component h accounts

ICache
Frontend Pipeline
FPU
Issue Queue
FU Core
IU0 IU1 LSU BU
ReorderBuffer
Retirement
micro-instructionBundle
Figure 3. The basic hardware model for a super-scalar multi-dispatch out–of–order processor. FPU stands for Floating-PointUnit, IU stands for Integer Unit, LSU stands for Load/StoreUnit, BU stands for Branch prediction Unit, and FU stands forFunctional Unit.
Dispatched Issued
Finished
RetiredFlushed
FetchedDecoded
(micro-instr)
Figure 4. The state transition diagram for instruction execu-tion.
for CPIh cycles per instruction out of the real CPI on average.However, in the context of complex superscalar out–of–order mi-croprocessors with a multi–level memory hierarchy, it is extremelydifficult to obtain accurate CPI breakdown because many micro–architectural events overlap with each other.
We propose an alternative to the CPI breakdown model that we callStatistical Stall Breakdown (SSB). By stall, we mean a processorcycle in which no instruction retires. In SSB, each stall is specula-tively attributed to a particular hardware event, where if that hard-ware event had not occurred, the stall would not have occurred.The key observation is that, in most cases, the latency of hardwarecomponents in processing the instructions will result in stalls. InSection 6.3 we show that stalls are one of the primary contribu-tions to the often dramatic gap between the measured CPI and theideal CPI that is defined by (i) available ILP in the applications and(ii) the system pipeline width defined by the micro–architecture.Therefore, an accurate breakdown of stall sources can be used as anapproximation for hardware bottleneck analysis.
The basic hardware support required for computing SSB to have ameans to assign a source to each stall. While such an assignmentmay be speculative (mainly due to the fact that stalls from differentsources may overlap), our analysis in Section 6.3 shows that suchspeculation is sufficiently accurate in most cases.
To compute SSB at run–time using a simple model for a superscalar,out–of–order processor. Our model is influenced by the architectureof the IBM PowerPC processor, but it is sufficiently generic to beused for other modern microprocessors with minor modifications.
Figure 3 depicts of the hardware model. In this model instructionsare fed from the ICache to the front–end pipeline in program or-der. Figure 4 depicts the state–transition diagram for each instruc-
tion. Up to W ISA (Instruction Set Architecture) instructions canbe fetched from the ICache in each cycle. These instructions aredecoded and possibly translated into µ–instructions. As a result,the front-end pipeline, generates bundles of B µ–instructions, asso-ciated with one or more ISA instructions. µ–instructions withina bundle may depend on each other. That means the output ofone may be used as an input for another. In RISC architectures,we expect most ISA instructions to be translated into a single µ–instruction, and hence, we assume at most B ISA instructions canco–exist in a bundle.
At most one bundle can be dispatched in the cycle where the µ–instructions within the bundle are dispatched to different functionalunits (FUs). The instruction bundles are dispatched in the programorder. At most one µ–instruction is dispatched to an FU at a time.There may be several FUs of the same type. The total number ofFUs may exceed the number of µ–instructions in each bundle, sosome FUs may not receive new µ–instructions every cycle.
Before a µ–instruction bundle can be dispatched to the func-tional units, the following resources must be available for each µ–instruction in the bundle:
1. Rename Buffer Entries: Rename buffers are logical registersthat are used to eliminate Write-After-Read and Write-After-Write dependencies.
2. A Reorder Buffer Entry: The reorder buffer is a queue thatkeeps track of the status of the dispatched bundles. Instructionbundles retire from the reorder buffer in the order they weredispatched after all of their µ–instructions have finished, andall the older bundles have retired.
3. Load/Store Buffer Entries: Load/Store buffers are used tobuffer the values read by the load instructions or written bythe store instructions.
4. FUs Issue Queue Entries: Each FU has a separate issuequeue. Each µ–instruction in the bundle needs an entry inthe corresponding FU’s issue queue.
If any of these resources are not available, the instruction dispatchwill be delayed until they become available. Typically, this onlyoccurs when there are long latencies in the FUs so that one of thestructures mentioned above becomes full.
Once a µ–instruction bundle is dispatched, each µ–instruction init will be queued in the corresponding FU issue queue. The in-struction remains in the issue queue until all the data it dependson becomes available, after which it can be issued. An issued µ–instruction will be processed by the FU core to produce the result.Once the result is ready, the instruction’s state becomes finished.The FU core may reject a µ–instruction for a number of reasons, inwhich case the instruction will be put back in the FU issue queueand will be re–issued later. Instruction issue occurs out–of–orderwith respect to program order. Once the µ–instruction bundle retires(completes) all resources allocated to it, including the entries in therename buffers, the reorder buffers, and the load store buffers, willbe released. An instruction may be flushed for different reasons,including branch mispredictions.
A finished µ–instruction may retire only if (i) all older (with respectto the program order) bundles in the reorder buffer have also retired,and (ii) all other µ–instructions in the instruction’s bundle have alsofinished. Bundle retirement happens in program order. At most onebundle can retire per cycle. Therefore, the maximum number of
ISA instructions that in theory can retire in a cycle is equal to B.
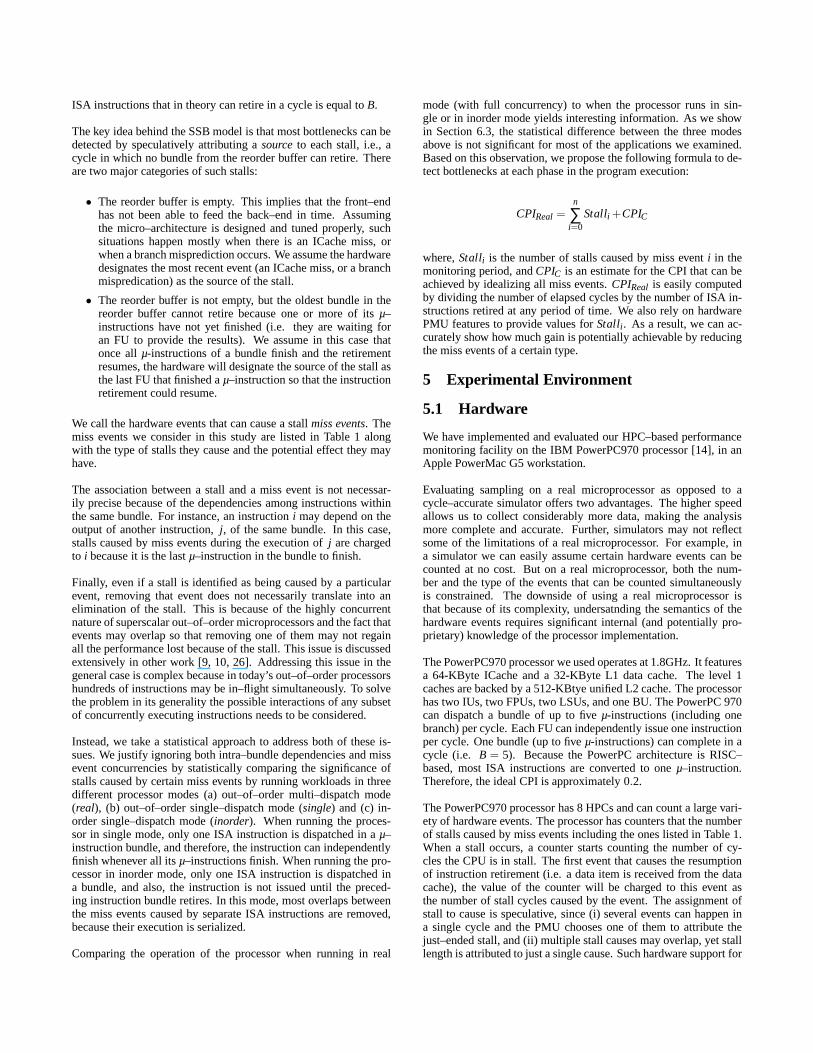
The key idea behind the SSB model is that most bottlenecks can bedetected by speculatively attributing a source to each stall, i.e., acycle in which no bundle from the reorder buffer can retire. Thereare two major categories of such stalls:
• The reorder buffer is empty. This implies that the front–endhas not been able to feed the back–end in time. Assumingthe micro–architecture is designed and tuned properly, suchsituations happen mostly when there is an ICache miss, orwhen a branch misprediction occurs. We assume the hardwaredesignates the most recent event (an ICache miss, or a branchmispredication) as the source of the stall.
• The reorder buffer is not empty, but the oldest bundle in thereorder buffer cannot retire because one or more of its µ–instructions have not yet finished (i.e. they are waiting foran FU to provide the results). We assume in this case thatonce all µ-instructions of a bundle finish and the retirementresumes, the hardware will designate the source of the stall asthe last FU that finished a µ–instruction so that the instructionretirement could resume.
We call the hardware events that can cause a stall miss events. Themiss events we consider in this study are listed in Table 1 alongwith the type of stalls they cause and the potential effect they mayhave.
The association between a stall and a miss event is not necessar-ily precise because of the dependencies among instructions withinthe same bundle. For instance, an instruction i may depend on theoutput of another instruction, j, of the same bundle. In this case,stalls caused by miss events during the execution of j are chargedto i because it is the last µ–instruction in the bundle to finish.
Finally, even if a stall is identified as being caused by a particularevent, removing that event does not necessarily translate into anelimination of the stall. This is because of the highly concurrentnature of superscalar out–of–order microprocessors and the fact thatevents may overlap so that removing one of them may not regainall the performance lost because of the stall. This issue is discussedextensively in other work [9, 10, 26]. Addressing this issue in thegeneral case is complex because in today’s out–of–order processorshundreds of instructions may be in–flight simultaneously. To solvethe problem in its generality the possible interactions of any subsetof concurrently executing instructions needs to be considered.
Instead, we take a statistical approach to address both of these is-sues. We justify ignoring both intra–bundle dependencies and missevent concurrencies by statistically comparing the significance ofstalls caused by certain miss events by running workloads in threedifferent processor modes (a) out–of–order multi–dispatch mode(real), (b) out–of–order single–dispatch mode (single) and (c) in-order single–dispatch mode (inorder). When running the proces-sor in single mode, only one ISA instruction is dispatched in a µ–instruction bundle, and therefore, the instruction can independentlyfinish whenever all its µ–instructions finish. When running the pro-cessor in inorder mode, only one ISA instruction is dispatched ina bundle, and also, the instruction is not issued until the preced-ing instruction bundle retires. In this mode, most overlaps betweenthe miss events caused by separate ISA instructions are removed,because their execution is serialized.
Comparing the operation of the processor when running in real
mode (with full concurrency) to when the processor runs in sin-gle or in inorder mode yields interesting information. As we showin Section 6.3, the statistical difference between the three modesabove is not significant for most of the applications we examined.Based on this observation, we propose the following formula to de-tect bottlenecks at each phase in the program execution:
CPIReal =n
∑i=0
Stalli +CPIC
where, Stalli is the number of stalls caused by miss event i in themonitoring period, and CPIC is an estimate for the CPI that can beachieved by idealizing all miss events. CPIReal is easily computedby dividing the number of elapsed cycles by the number of ISA in-structions retired at any period of time. We also rely on hardwarePMU features to provide values for Stalli. As a result, we can ac-curately show how much gain is potentially achievable by reducingthe miss events of a certain type.
5 Experimental Environment
5.1 Hardware
We have implemented and evaluated our HPC–based performancemonitoring facility on the IBM PowerPC970 processor [14], in anApple PowerMac G5 workstation.
Evaluating sampling on a real microprocessor as opposed to acycle–accurate simulator offers two advantages. The higher speedallows us to collect considerably more data, making the analysismore complete and accurate. Further, simulators may not reflectsome of the limitations of a real microprocessor. For example, ina simulator we can easily assume certain hardware events can becounted at no cost. But on a real microprocessor, both the num-ber and the type of the events that can be counted simultaneouslyis constrained. The downside of using a real microprocessor isthat because of its complexity, undersatnding the semantics of thehardware events requires significant internal (and potentially pro-prietary) knowledge of the processor implementation.
The PowerPC970 processor we used operates at 1.8GHz. It featuresa 64-KByte ICache and a 32-KByte L1 data cache. The level 1caches are backed by a 512-KBtye unified L2 cache. The processorhas two IUs, two FPUs, two LSUs, and one BU. The PowerPC 970can dispatch a bundle of up to five µ-instructions (including onebranch) per cycle. Each FU can independently issue one instructionper cycle. One bundle (up to five µ-instructions) can complete in acycle (i.e. B = 5). Because the PowerPC architecture is RISC–based, most ISA instructions are converted to one µ–instruction.Therefore, the ideal CPI is approximately 0.2.
The PowerPC970 processor has 8 HPCs and can count a large vari-ety of hardware events. The processor has counters that the numberof stalls caused by miss events including the ones listed in Table 1.When a stall occurs, a counter starts counting the number of cy-cles the CPU is in stall. The first event that causes the resumptionof instruction retirement (i.e. a data item is received from the datacache), the value of the counter will be charged to this event asthe number of stall cycles caused by the event. The assignment ofstall to cause is speculative, since (i) several events can happen ina single cycle and the PMU chooses one of them to attribute thejust–ended stall, and (ii) multiple stall causes may overlap, yet stalllength is attributed to just a single cause. Such hardware support for

Miss Event Effect DescriptionICache Miss Empty Reorder Buffer Instructions must be brought into the ICache either from L2 or memory.Branch Misprediction Empty Reorder Buffer All in–flight instructions older than the mispredicted branch are flushed.Data Cache Miss Retirement Stops A delay in the LSUs to finish a load or store instruction due to a data cache miss.Address Translation Misses Retirement Stops A miss occurs in the hardware accessed address translation structures (e.g. TLB).
The miss either delays processing a load/store instruction in the LSU, or resultsin the rejection of the instruction from the LSU.
Rejections Retirement Stops Any of the FUs rejects an instruction for any (e.g. hitting a resource limit). Theinstruction must be reissued after some delay or reordering.
FPU Latency Retirement Stops A delay in FPU to finish the computation for an issued instruction.IU Latency Retirement Stops A delay in IU to finish the computation for an issued instruction.
Table 1. Miss event types with their potential effect.
identifying stall sources is not specific to the selected processor; forexample, Intel Itanium II processor provides similar features [15].
5.2 Operating System
Our performance monitoring facility is implemented in the K42 op-erating system [12]. K42 is an open–source research operating sys-tem designed to scale well on large, cache–coherent, 64-bit mul-tiprocessor systems. It provides compatibility with 32 and 64–bitLinux API and ABI. The K42 kernel is designed in an object–oriented fashion, an feature that allows for easier prototyping.
The kernel module we built in K42 operates independently fromthe kernel. There are two major types of interactions with the ker-nel. First, the sampling engine must be able to dynamically installcustom exception handlers for the PMU overflow exceptions. Sec-ondly, the kernel must be modified to notify the sampling engineof all process creations, exits, and context switches. We did notmodify K42 for this purpose. Instead, we exploit the fact that inK42, all major process management events (along with other theoperating system events) are recorded in performance monitoringtrace buffers. Upon each overflow exception, the sampling enginechecks whether a context switch has recently occurred by consult-ing the trace buffer. Using this scheme, there is a delay in detectingcontext switches, but because the granularity of context switchesis usually around 10 milliseconds, which is two orders of magni-tude larger than the sampling granularity, the imprecision added bya small delay in detecting context switches to be negligible.
In order to record the gathered HPC values, we used the K42 perfor-mance monitoring infrastructure that is already in place [28]. Theinfrastructure provides for an efficient, unified and scalable tracingfacility that allows for correctness debugging, performance debug-ging and on–line performance monitoring. Variable–length eventrecords are locklessly logged on a per processor basis in the tracebuffer mentioned above. The infrastructure is uniformly accessibleto the operating system and user programs. The recorded eventsare encoded using XML, and thus, much of the implementation ofadding and processing new events is automated [29]. Both HPCand SSB values gathered by the sampling engine are added to thebuffers and thus available to any interested party.
6 Experimental Results
We developed and ran a number of experiments to evaluate our sta-tistical sampling approach. In this section we describe these exper-iments and present their results. First, we briefly describe how wevalidate the basic values we read from the HPCs for different hard-ware events. We then present the results of our statistical analysisof sampling accuracy and show how the sampling accuracy changesas a function of sampling granularity and sampling ratio. Finally,we analyze the accuracy and usefulness of computing SSB values.
We present the results of our analysis for four integer and four float-ing point applications from the SPEC2000 benchmark suite1. Theinteger benchmarks are gcc, gzip, crafty, and perlbmk. Thefloating point benchmarks are mgrid, applu, art, and mesa.
6.1 Basic Validation
Previous work [19] has shown that validating the numbers readfrom HPCs is not trivial. In today’s processors, the HPCs are oftenso low–level and specific to the micro–architecture implementationthat their semantics cannot be completely understood without detailknowledge of the micro–architecture. This information is often pro-prietary and not publicly available. For instance, the significance ofL1 cache misses may differ depending on the effectiveness of theprefetch structures. Also, a load instruction that incurs an L1 cacheload access may be rejected by the LSU a few cycles later due to aTLB miss, or some other LSU constraints, and as a result, literallyreading the number of L1 cache accesses can be misleading.
To reach a clear understanding of the semantics of the hardwareevents and we created a large set of micro–benchmarks, each care-fully designed to a produce a specific scenario in which a specificset of hardware events can be monitored in isolation. Such an ap-proach may not be feasible for some hardware events, because itrequires comprehensive knowledge of the internal implementationof the microprocessor. However, the results of our experiments (notshown here) gave us confidence that our infrastructure correctlycaptures most of the hardware events we examined.
6.2 Sampling Accuracy
In order to measure the accuracy of sampling versus fully countingthe hardware events, we use a statistical approach. When countingevents fully, we associate with each hardware event, e, a probabilitydistribution Pe(Ri) representing the probability of event e occurringin the time interval Ri. Pe(Ri) can be simply calculated by dividingthe frequency of re-occurring e in the interval Ri by the total num-ber of e events during a monitoring session. That is if Ne is the totalnumber of occurrences of event e, and Ne(Ri) is the number of oc-currences of event e in interval Ri, the probability of event e occur-
ring within Ri is calculated as Pe = Ne(Ri)Ne
so that ∑Ni=0 Pe(Ri) = 1.
With sampling on the other hand, we count how many times e oc-curs in a subinterval of Ri, and linearly scale it to the entire interval,which will give us another probability distribution P′
e(Ri). A keyquestion is how the two distributions, Pe and P′
e, corresponding tothe actual counts and sampled counts, differ. To answer this ques-tion, we use Kullback Leibler distance(KL-distance), which is oftenused to measure similarity (or distance) between two probability
1We also examined several other applications from the same suite with similar
results.

Application gzip gcc perlbmk crafty applu mgrid art mesaInstructions Retired 0.01 0.06 0 0 0 0.05 0 0.12
L1 DCache Loads 0.09 0.04 0 0 0.02 0.07 0.03 0.22L1 DCache Stores 0.13 0.08 0 0 0 0.03 0 0.10L1 DCache Misses 1.21 0.05 0 0 0.02 0.07 0.07 0.05
ICache Misses N/A 0.12 0.02 0.09 0.02 N/A 0.03 N/ATLB Misses N/A 0.11 N/A N/A 0.01 0.15 N/A N/A
ERAT Misses 0.79 0.13 0.01 0.02 0.07 0.71 0.42 0.21L2 Cache Misses (Data) 0.24 0.01 0.07 0.02 0.02 0.06 N/A 0.17
Branch Mispredicts 0.36 0.05 0.01 0 0.02 0.18 0 0.13
Table 2. KL-distance between probability distribution P, which is obtained by fully counting hardware events and P′, which isobtained by sampling. The sampling ratio is 10 and the sampling round R is 2 million cycles. The value 0 stands for any value lessthan 0.01. The N/A implies the event is less frequent than once every 10,000 cycles on average.
0 100 200 300 400 500 600 700 800 900 1000
Time (in terms of 2,000,000 cycles)
0.00.10.20.30.40.50.60.70.80.91.01.11.21.31.4
Instr
uctio
n Reti
red pe
r Cyc
le
(a) Sampled (Sampling Ratio=10)
0 100 200 300 400 500 600 700 800 900 1000
Time (in terms of 2,000,000 cycles)
0.00.10.20.30.40.50.60.70.80.91.01.11.21.31.4
Instr
uctio
n Reti
red pe
r Cyc
le (c) Fully Counted
0 100 200 300 400 500 600 700 800 900 1000
Time (in terms of 2,000,000 cycles)
0.0000.0020.0040.0060.0080.0100.0120.0140.0160.0180.0200.0220.0240.0260.028
L1 D
Cach
e Miss
Even
t per
Cycle
(b) Sampled (Sampling Ratio = 10)
0 100 200 300 400 500 600 700 800 900 1000
Time (in terms of 2,000,000 cycles)
0.0000.0020.0040.0060.0080.0100.0120.0140.0160.0180.0200.0220.0240.0260.028
L1 D
Cach
e Miss
Even
t per
Cycle
(d) Fully Counted
Figure 5. Comparing fully counted events with sampling when running gcc: Left: average instructions retired per cycle; Right:average number of L1 DCache misses per cycle.
distributions[5]. KL-distance is defined as:
K(Pe,P′e) = ∑P(x) log Pe(x)/P′
e(x)
In fact, KL-distance computes the geometric mean overPe(x)/P′
e(x). The reason we use KL-distance (as opposed to, forinstance, the mean over |Pe(x)−P′
e(x)|) is that in the context of adynamic–optimizer the absolute values of the hardware events areoften not a determining factor because there are many short tran-sient states in the hardware. What is more important is whetherthere is a significant and stable shift in the rate of occurrences ofa particular hardware event that lasts for a sufficiently long periodof time to be worth considering. Therefore, although there may besampling intervals in which the values of Pe and P′
e differ signifi-cantly, if such intervals are limited in number and isolated, they donot distort the distance measure due to the log factor in KL-distance.
In this study we consider any value of K(Pe,P′e) below 0.20 to be ac-
ceptable. Informally speaking, we consider the sampling adequateif the difference between the values of two probability distributionson average does not exceed 15%.
We measured K(Pe,P′e) for a large number of hardware events for
the selected SPEC2000 applications. Table 2 shows the results forseveral important hardware events. The 0 entries imply the ac-tual value of K(Pe,P′
e) was less than 0.01. The N/A entries implythat the hardware event was on average less frequent than once per10,000 cycles, and hence, insignificant. The samples are collectedover 6-billion cycles (after skipping over the first billion instruc-tions). The sampling interval R is 2 million cycles, and the sam-pling ratio is 10.
As it can be seen in Table 2, the KL-distance value is small for mosthardware events in a majority of applications, with a few exceptionswhich we discuss later in this section. In Figure 5 we depict graph-
ically the rate of occurrences for two hardware events, instructionretired and L1 data cache miss, using the same setup as above ex-cept for the fact that only the first two billion cycles are includedin the graphs. Note that we chose to show occurrence rate (i.e.the average number of occurrences per cycle) only for visualizationpurposes. The probability distributions Pe and P′
e can be directly de-rived from these graphs by dividing each point by Ne. It can be seenthat the sampling distribution accurately follows all significant andsteady changes in the real occurrence rate of the hardware events(even though there are differences over small periods of time).
There are a few cases in Table 2 with unacceptably high values.However, we note that these cases all correspond to fairly infre-quent events (one per 100 cycles on average). Although infrequentevents are unlikely to cause performance bottlenecks, we exploredthis issue further by varying the sampling granularity and samplingratio for them. We ran several experiments with gzip for whichat least three hardware events have a relatively large KL-distance:L1 data cache miss, ERAT (Effective to Real Address Table) miss,and branch misprediction. Figure 6 shows the results of the ex-periments. The graph on the left shows how the accuracy changesas a function of the sampling granularity. As a general rule, largergranularities have higher sampling accuracies for infrequent events.Therefore, we change the sampling granularity from 200,000 to500,000 cycles. We then wanted to know how sensitive the ac-curacy is to the sampling ratio in this sampling granularity. Thegraph on the right shows the results of our experiments. It appearsthat none of the three hardware events is highly sensitive to thesampling ratio. The general conclusion we draw from these exper-iments is that it is better to use larger granularities (with a fixedsampling ratio) for infrequent hardware events.

0 5000 10000 15000 20000 25000 30000 35000 40000 45000 50000
Time (in terms of 1,000,000 CPU cycles)
0
1
2
3
4
5
6
7
8
9
10
11
12
13
14
Cycle
s per
Instru
ction
FPU StallsIU StallsDCache MissesAddress Translation MissesICache MissesBranch MispredictionsLSU Rejections CPI Without Stalls
Figure 7. Statistical Stall Breakdown for an instance of gcc run for a 50 billion cycle period.
100 1000Sampling Granularity in 1000 Cycles.
0.0
0.2
0.4
0.6
0.8
1.0
1.2
1.4
1.6
1.8
KL
-dis
tanc
e
(a)
5 10 15 20Sampling Ratio
0.0
0.2
0.4
0.6
0.8
1.0
1.2
1.4
1.6
1.8
KL
-dis
tanc
e
(b)
L1 DCache Miss
ERAT Miss
Branch Mispredictions
Figure 6. Tuning sampling ratio and sampling granularity forgzip: (a) The KL-distance generally decreases as the samplinggranularity increases. (b) Fixing the granularity to 500,000 cy-cles, all three hardware events seem to be fairly stable whenchanging the sampling ratio within a realistic range.
6.3 Computing SSB
In Figure 7, we show the result of computing the SSB values forgcc over a period of 50 billion cycles. There are several obser-vations that can be made from the graph. First, the entire run isdivided into several fairly long phases in which either CPI is stable,or CPI changes in a regular fashion. In each phase, the SSB patternis reasonably stable, so that it is possible to pinpoint one or moremajor sources of stalls. Secondly, there is often a large gap betweenthe real, measured CPI and the ideal CPI, most of which can be ex-plained by the stalls. Thirdly, in this particular example, the datacache misses seems to be the single most important source of stalls.There are also a significant number of LSU rejections. A rejectionin the LSU usually occurs if either an address translation miss oc-curs (which is accounted for separately), or if the LSU resources areexhausted. Therefore, many of the rejections are caused indirectlyby data cache misses which keep the LSU busy with an instructionfor a long time. There are also a significant number of stalls causedby ICache misses and branch mispredictions in the early phases ofthe run which disappear later on.
The SSB computed by our sampling engine can provide accurateand timely hints to a run–time optimizer, allowing it to focus, inthis case, on techniques that reduce data cache misses for most ofthe program. That means that standard optimizations that mightattempt to reduce the amount of the computation, reduce branchmispredictions, or reduce ICache misses will not have significanteffect unless they manage to also reduce data cache misses. Also,the online availability of the SSB information allows the run–timeoptimizer to monitor the results of the applied optimizations, andmeasure their benefits and potential negative side effects in a feed-back loop.
In order to estimate the effect of intra–bundle dependencies andmiss event concurrencies, we executed all of our benchmarksin three different processor modes: multi–dispatch out–of–order(real), single–dispatch out–of–order (single), and single–dispatchin-order (inorder). We used KL-distance to measure the statisticaldistance between the distribution of stalls for each particular sourcein the different execution modes. In order to make the comparisonprecise, we used instruction–based multiplexing, instead of time–based multiplexing. In instruction-based multiplexing, periods arecalculated in terms of retirement of a certain number of ISA instruc-tions. Therefore, all sampling points in the three execution modesare aligned to each other in terms of the number of instructions re-tired between the two sampling points. Of course, both the singleand inorder modes take a significantly longer time to finish than thereal mode. Also, by monitoring user–level code only, we make surethe exact same stream of instructions are executed in the three runs.
Table 3 shows the results of our analysis. KLS is the the KL-distance between the real mode and the single mode, and KLI isthe KL-distance between real mode and inorder mode runs. Again,0 implies any value less than 0.01, and N/A implies the average oc-currence rate of the particular stall is less than once per 10,000 ISAinstructions, and hence not significant for bottleneck analysis.
For the great majority of entries, both the KLS and KLI values arevery small, suggesting that, in most cases, the distortions due tointra-bundle dependencies and overlapping miss events can be ig-nored in detecting and quantifying a particular source of stall. Thereare a few exceptions, most pronounced in mgrid. A closer inves-tigation of mgrid shows that its stalls are dominated by stalls dueto data cache misses and the FPU latencies for which both KLI andKLS are reasonably small. Other sources of stall such as branchmisprediction and rejections are in fact insignificant. We are cur-rently exploring these anomalies further.
Sampling Frequency (kHz) 1 2 5 20 100 200 1000Runtime Overhead (%) 0.2 0.5 0.8 2 12 22 63
Table 4. The runtime overhead of computing and logging SSB(Note that the x-axis is in logarithmic scale).
Table 4 shows the run–time overhead of continuously gathering theSSB values and recording them into the trace log. We measuredthe overhead for different sampling frequencies. The overhead in-creases linearly with the sampling frequency within the range weexamined. At 20,000 samples per second, the run–time overhead isaround 2%. We believe that with such a low run–time overhead oursampling engine is suitable for run–time optimization purposes.

Application gzip gcc perlbmk crafty applu mgrid art mesaStall Source KLS KLI KLS KLI KLS KLI KLS KLI KLS KLI KLS KLI KLS KLI KLS KLI
ICache Miss 0.01 0.01 0.05 0.05 0 0 0.01 0.01 0.06 0.06 N/A N/A 0.28 0.19 0.15 0.15DCache Miss 0.02 0.02 0.05 0.06 0.03 0.05 0 0.01 0.08 0.08 0.12 0.42 0.03 0.03 0.03 0.05ERAT Miss 0.36 0.36 0.28 0.30 N/A N/A 0.03 0.13 0.13 0.13 N/A N/A N/A N/A N/A N/A
FPU Latency N/A N/A N/A N/A 0.01 0.02 0.13 0.13 0 0 0.25 0.25 0 0 0.01 0.02Int. Latnecy 0.10 0.10 0.15 0.14 0 0 0 0 N/A N/A N/A N/A 0.05 0.05 0.06 0.06
Misprediction 0.02 0.02 0.06 0.06 0 0.01 0.01 0.01 0.06 0.06 1.68 1.68 0.28 0.28 0.15 0.15Rejection 0.47 0.22 0.17 0.21 0.13 0.14 0.03 0.03 0.15 0.15 0.40 1.47 0.02 0.02 0.50 0.50
Table 3. KL-distance between the stall distributions. KLS is the KL-distance between the stall distribution when executing in realmode versus the stall distribution when executing in single dispatch mode. KLI is the KL-distance between the stall distribution whenexecuting in real mode and the stall distribution when executing in inorder mode.
7 Related Work
Related work closest to our work is DCPI which uses fine–grainedsampling of the HPCs to identify system–wide hot spots at run–time [3]. It also attempts to identify pipeline stalls at the instructionlevel. There are some hints that event multiplexing is implementedin this system, but no details of the design nor statistical analysis isprovided. Moreover, we argue that with the increase in the numberof concurrent in–flight instructions, the imprecision of a software–only approach to attribute stalls to the instructions can be high.
PAPI [7] is a public domain tool that is implemented on many plat-forms. Its main emphasis is on platform–independence rather thanefficiency. The portable interface is implemented in software, andas a result, it may incur significant overhead in some scenarios.PAPI also implements HPC multiplexing at user level [20]. A fine–grained timer is used as a means for HPC group switch. The timerwill send a signal to the process that has requested a multiplexedset of hardware events. A major limitation of this approach is thatdue to the large overhead of HPC group switch (the cost of sig-nal delivery plus the cost of kernel/user context switches), the sam-pling granularity must be large and as a result, the sampling errormay become high for some applications. Another problem withswitching HPC groups in user space is that there is a potentiallylarge latency between the time when the timer expires and the timewhen the signal is actually delivered and the signal handler (wherethe current HPC group is read and stored) is called. This delayadds to the imprecision of multiplexing. Finally, to the best of ourknowledge, there is no quantitative study on the overhead and ac-curacy of PAPI’s multiplexing engine. In fact, one can build PAPI’shigh–level platform–independent interface transparently on top ofour low–level and efficient multiplexing scheme.
ProfileMe uses instruction sampling, where individual instructionsare selected randomly to be monitored by the processor hardwarewhen the instructions pass through the different stages of the systempipeline [6]. Their main goal is to gather accurate information oninstructions that cause miss events or have long latencies. Althoughthe instruction sampling can be effective, there is little analysis inthe paper that shows the actual run–time overhead of building aninstruction–level profile. We believe our approach can be comple-mented by approaches such as ProfileMe to search for bottleneck ina multi–level fashion.
Intel’s VTune [16] is one of the most widely used tools to make thefacilities of the PMU available to developers. It provides both sam-pling and binary instrumentation facilities, and outputs a graphicaldisplay of the programs hot spots as well as call graph. There areseveral other tools built for various hardware platforms with simi-lar sets of features such as Apple’s CHUD [4] and PCL [22]. Theyprovide facilities to identify program hot spots and the frequency ofimportant hardware events such as cache misses or branch mispre-
dictions. To the best of our knowledge, none of these tools allowsfor profiling more events than the number of HPCs at the same time.Also, they often only expose the hardware PMU features directly tothe user. It is up to the user to interpret the semantics of the low–level hardware events.
Wassermann et. al [27] presented an analysis of microprocessorperformance where a model similar to SSB is used to characterizethe effect of stalls caused by cache and memory latencies. Esti-mating the number of stalls caused by a source is done in softwareby multiplying the number of accesses to the source by its averageaccess latency. Our approach extends this effort in two directions.First, we exploit hardware support to measure the stalls more accu-rately. Secondly, their approach mainly focused only on cache andmemory stalls, while we include all possible sources of stall intoour analysis.
SMARTS [30] and SimPoint [23] use sampling in a different con-text as a means to accelerate detailed micro–architecture simula-tions. In both approaches, the detailed simulation of the program isdone only for small intervals during the program execution. Thereare strong evidences in both work that show their sampling tech-niques would result in accurrate estimates of important hardwaremetrics such as CPI.
Studies have been done to model the behavior of superscalar micro-processors either through analytical modeling [17] or through sta-tistical simulation [21]. In both cases, a simple and aggregate modelis constructed that can provide accurate and high–level insight ofhardware bottlenecks. These models are simple and efficient, eventhough, they often make unrealistic simplifying assumptions. OurSSB model was inspired by some of this work.
Slack [9] and Interaction Costs [10] are two models for accuratelyestimating how much performance gain can be achieved by idealiz-ing latencies of individual instructions. Although these approachesprovide accurate information about potential gain of idealizing in-dividual instructions, they require additional hardware support andextensive postmortem analysis which make them difficult to use inthe context of run–time optimization.
Lemieux [18] has extensively explored issues in designing the in-terface and implementation of processors PMU, and more in partic-ular, in shared memory multiprocessors. The main emphasis of thework is also to account for stalls (memory and non-memory) thatthat attribute to significant performance penalty.
8 Concluding Remarks
Hardware performance counters (HPCs) are useful for analyzingand understanding performance, but there are challenges in usingthem on line. There are a small number of HPCs available in most

today’s microprocessors. Moreover, the definitions of the hardwareevents that can be counted by HPCs are low–level and complex.
In this paper, we described two techniques that overcome the thelimitations we identified of microprocessor HPCs. First, we pro-vide larger set of logical HPCs by dynamically multiplexing HPCsusing statistical sampling of the hardware events. Using real pro-grams, we showed experimentally that counts of hardware eventsobtained through sampling is statistically similar (i.e. within 15%)to real counts of the events. Secondly, we proposed a technique thatspeculatively associates each stall cycle to a processor componentthat likely caused the stall, and built this technique using our HPCmultiplexing engine. Our experiments showed that identificationof the stalls is reasonably accurate for most of the applications weexamined. The run-time overhead of our sampling engine is under2% allowing it to be used online.
The facility we have implemented is useful for detailed on–line per-formance analysis of application and system code running at fullspeed with small overhead. It is also effective in reporting hard-ware bottlenecks to tools such as a dynamic optimizer that mightguide dynamic adaptation actions in a running system. A number ofoutside groups have started using our statistical sampling tool. Ourresearch group is interested in using the tool to help guide dynamicoptimizations within the operating system. Much of this work hasjust started, and it is an open question how difficult it will be to maphardware behavior to the responsible software component.
Our work and other previous work has identified the challenges ofcorrectly interpreting HPC values. Counter descriptions are pro-prietary, documented poorly, or designed for hardware architects.Our techniques and tools for extending the number of logical HPCsavailable and for providing a easy to understand characterization ofsub-optimal processor performance alleviate some of the difficul-ties faced with HPCs.
9 References
[1] D. H. Ahn and J. S. Vetter. Scalable analysis techniques for microprocessorperformance counter metrics. In Proc. of Conference on Supercomputing, Balti-more, Maryland, Nov. 2002.
[2] AMD. Athlon Processor X86 code optimization guide. http://www.amd.com/us-en/assets/ content type/white papers and tech docs/22007.pdf.
[3] J. Anderson, L. Berc, J. Dean, S. Ghemawat, M. Henzinger, S. Leung, D. Sites,M. Vandervoorde, C. Waldspurger, and W. Weihl. Continuous profiling: Wherehave all the cycles gone? In Proc. of the 16th ACM Symposium of OperatingSystems Principles (SOSP), pages 1–14, Oct. 1997.
[4] Apple Computer Inc. Computer Hardware Understanding Development (CHUD)tools. http://developer.apple.com/tools/performance/.
[5] T. M. Cover and J. A. Thomas. Elements of Information Theory. John Wiley &Sons, Inc., 2003.
[6] J. Dean, J. E. Hicks, C. A. Waldspurger, W. E. Weihl, and G. Z. Chrysos. Pro-fileMe: Hardware support for instruction-level profiling on out-of-order proces-sors. In Proc. of the 30th Intl. Symposium on Microarchitecture (MICRO), pages292–302, Dec. 1997.
[7] J. Dongarra, K. London, S. Moore, P. Mucci, D. Terpstra, H. You, and M. Zhou.Experiences and lessons learned with a portable interface to hardware perfor-mance counters. In Proc. of Workshop Parallel and Distributed Systems: Testingand Debugging (PATDAT), joint with the 19th Intl. Parallel and Distributed Pro-cessing Symposium (IPDPS), Niece, France, Apr. 2003.
[8] E. Duesterwald, C. Cascaval, and S. Dwarkadas. Characterizing and predictingprogram behavior and its variability. In Proc. of 12th Intl. Conference on ParallelArchitecture and Compiliation Techniques (PACT), Dec. 2003.
[9] B. A. Fields, R. Bodik, M. D. Hill, and C. J. Newburn. Slack: Maximizing per-formance under technological constraints. In Proc. of the 30th Intl. Symposiumon Computer Architecture (ISCA), San Diego, CA, June 2003.
[10] B. A. Fields, R. Bodik, M. D. Hill, and C. J. Newburn. Using interaction costsfor microarchitectural bottleneck analysis. In Proc. of the 36th Intl. Symposiumon Microarchitecture (MICRO), San Diego, CA, Dec. 2003.
[11] J. L. Hennessy and D. A. Patterson. Computer Architecture: A QuantitativeApproach. Morgan Kaufmann Publishers, Los Altos, CA, 2003.
[12] IBM Corporation. K42 research Operating System.http://www.research.ibm.com/k42.
[13] IBM Corporation. The POWER4 processor introduction and tuning guide.http://www.redbooks.ibm.com/pubs/pdfs/redbooks /sg247041.pdf.
[14] IBM Corporation. PowerPC970: First in a new family of 64-bit highperformance PowerPC processors. http://www-3.ibm.com/chips/techlib/ tech-lib.nsf/producs/PowerPC 970 and 970FX Microprocessors.
[15] Intel Corporation. Intel Itanium 2 reference manual for software developmentand optimization. http://www.intel.com/design/itanium2/ manuals/251110.htm.
[16] Intel Corporation. VTune performance analyzers.http://www.intel.com/software/products/vtune.
[17] T. Karkhanis and J. E. Smith. Modeling superscalar processors. In Proc. ofthe 31th Intl. Symposium on Computer Architecture (ISCA), Munchen, Germany,June 2004.
[18] G. Lemieux. Hardware performance monitoring in multiprocessors. Master’sthesis, University of Toronto, 1996.
[19] M. Maxwell, P. Teller, L. Salayandia, and S. Moore. Accuracy of performancemonitoring hardware. In Proc. of the Los Alamos Computer Science InstituteSymposium (LACSI), Santa Fe, NM, Oct. 2002.
[20] J. M. May. MPX: Software for multiplexing hardware performance counters inmultithreaded systems. In Proc. of the Intl. Parallel and Distributed ProcessingSymposium (IPDPS), San Francisco, CA, Apr. 2001.
[21] S. Nassbaum and J. E. Smith. Modeling superscalar processor via statisticalsimulation. In Proc. of the 10th Intl. Conference on Parallel Architecture andCompilation Techniques (PACT), pages 15–24, Sep. 2001.
[22] PCL. The Performance Counter Library: A common interface to access hardwareperformance counters on microprocessors. http://www.fz-juelich.de/zam/PCL/doc/pcl/pcl.html.
[23] T. Sherwood, E. Perlman, G. Hamerly, and B. Caler. Automatically characteriz-ing large scale program behavoir. In Proc. of the Intl. Conference on Architec-tural Support for Programming Languages and Operating Systems (ASPLOS),Oct. 2002.
[24] B. Sprunt. Pentium 4 performance monitoring features. IEEE Micro, 22(4):72–82, July/Aug. 2002.
[25] P. F. Sweeney, M. Hauswirth, B. Cahoon, P. Cheng, A. Diwan, D. Grove, andM. Hind. Using hardware performance monitors to understand the behavior ofJava applications. In Proc of 3rd Virtual Machine Research and TechnologySymposium (VM), May 2004.
[26] E. Tune, D. M. Tullsen, and B. Calder. Quantifying instruction criticality. InProc. of the 11th Intl. Conference on Parallel Architecture and Compilation Tech-niques (PACT), Charlottesvill, VA, Sep. 2002.
[27] H. J. Wassermann, O. M. Lubeck, Y. Luo, and F. Bassetti. Performance eval-uation of the SGI Origin2000: a memory-centric characterization of lanl asciapplications. In Proc. of ACM/IEEE Conference on Supercomputing (SC), SanJose, CA, Nov. 1997.
[28] R. W. Wisniewski and B. Rosenburg. Efficient, unified, and scalable performancemonitoring for multiprocessor operating systems. In Proc. of the SupercomputingConference (SC), Phoenix, AZ, Nov. 2003.
[29] R. W. Wisniewski, P. F. Sweeney, K. Sudeep, M. Hauswirth, E. Duesterwald,C. Cascaval, and R. Azimi. Performance and environment monitoring for wholesystem characterization and optimization. In Proc. of the 2nd IBM Watson Con-ference on Interaction between Architecture, Circuits, and Compilers (PAC),Yorktown Heights, NY, Oct. 2004.
[30] R. E. Wunderlich, T. F. Wenish, B. Falsafi, and J. C. Hoe. SMARTS: Acceleratingmicroarchitecture simulation via rigorous statistical sampling. In Proc. of the30th Intl. Symposium on Computer Architecture (ISCA), San Diego, CA, June2003.