ONLINE APPENDIX Correlation Neglect in Belief Formation
39
ONLINE APPENDIX Correlation Neglect in Belief Formation Benjamin Enke Florian Zimmermann
-
Upload
khangminh22 -
Category
Documents
-
view
2 -
download
0
Transcript of ONLINE APPENDIX Correlation Neglect in Belief Formation

ONLINE APPENDIX
Correlation Neglect in Belief Formation
Benjamin Enke Florian Zimmermann

A Overview of Treatments
Table 6: Treatment overview
Treatment # subjects Session Ave earnings Covered in Median SDlength (mins) (euros) χ of χ
Baseline correlated 47 90 10.25 Sec. 2 0.68 0.51
Baseline uncorrelated 47 90 12.92 Sec. 2 0.05 0.34
High stakes correlated 47 90 19.17 Sec. 2 0.65 0.60
High stakes uncorrelated 47 90 24.58 Sec. 2 0.02 0.18
Reading time 46 80 12.00 Sec. 2 0.24 0.91
Robustness correlated 48 80 9.96 App. D 0.39 0.45
Robustness uncorrelated 48 80 12.25 App. D 0.00 0.18
Low complexity correlated 47 80 12.52 Sec. 3.1 0.00 0.79
Low complexity uncorrelated 47 80 11.60 Sec. 3.1 0.01 0.46
Many Stimuli 47 80 11.08 Sec. 3.3.1 0.25 0.56
Alternating 47 90 13.13 Sec. 3.3.1 0.02 0.23
Math 47 90 11.40 App. E.4.2 0.00 0.54
Intermediaries 46 90 12.70 App. E.4.1 0.09 0.44
Multiply 46 90 11.70 App. E.2 0.00 0.20
Face value 45 90 8.10 App. E.2 – –
Market correlated 144 150 19.40 App. F 0.69 0.39
Market uncorrelated 144 150 19.33 App. F 0.04 0.17
B Order of Belief Formation Tasks in Main Treatments
In all individual belief elicitation treatments we implemented three different random-
ized orders of rounds. These orders (by true state) are as follows:
1. 10’000, 88, 46’422, 4’698, 250, 23’112, 1’000, 10, 7’338, 732
2. 732, 23’112, 88, 1’000, 250, 4’698, 10, 7’338, 10’000, 46’422
3. 250, 7’338, 10’000, 10, 4’698, 88, 46’422, 732, 1’000, 23’112
2

C Additional Analyses for Baseline andHigh Stakes Treat-
ments
C.1 Baseline vs. High Stakes Treatments
In the high-stakes conditions, we implemented the same procedure as in the baseline
conditions using a different incentive scheme. For all ten belief formation tasks, the
results in these treatments are virtually identical to those in the baseline conditions.
Figure 5 provides kernel density estimates of the median naïveté parameters in the
baseline and high-stakes conditions, which suggest that beliefs in these treatments are
almost indistinguishable from each other. Table 7 formally confirms this impression
using a set of OLS regressions. Here, we regress the median naïveté of subjects in the
baseline and the high stakes treatments (both Correlated and Uncorrelated on (i) a
treatment dummy, (ii) a high stakes dummy, and (iii) an interaction term equal to one
if subjects are in the high stakes correlated treatment. If the increase in stake size had
a positive effect on subjects’ stated beliefs, then this interaction term should have a
statistically significant negative coefficient. However, the point estimate is even slightly
positive, confirming that the increase in the stake size by 200% did not affect subjects’
stated beliefs.
0.5
11.
5D
ensi
ty
-1 0 1 2Median normalized belief
Correlated baseline Uncorrelated baselineCorrelated high stakes Uncorrelated high stakes
kernel = epanechnikov, bandwidth = 0.1800
Figure 5: Kernel density estimates of beliefs in the baseline and high stakes conditions
3

Table 7: Correlation neglect and stake size
Dependent variable:Median χ
(1) (2) (3)
1 if correlated 0.41∗∗∗ 0.39∗∗∗ 0.40∗∗∗
(0.07) (0.09) (0.09)
1 if high stakes -0.046 0.0100(0.07) (0.08)
1 if correlated high stakes 0.029 -0.046(0.13) (0.13)
Constant 0.20∗∗∗ 0.23∗∗∗ 0.14(0.04) (0.05) (0.23)
Additional controls No No Yes
Observations 188 188 186R2 0.17 0.17 0.27
OLS estimates, robust standard errors in parantheses.Observations include all subjects from the baseline andhigh stakes treatments, both Correlated and Uncorrelated.Additional controls include age, gender, cognitive skills,monthly income, and marital status dummies. Cognitiveskills are the first factor as constructed from subjects’high school GPA (1-5) and their Raven test score (0-10).∗ p < 0.10, ∗∗ p < 0.05, ∗∗∗ p < 0.01
C.2 Robustness of Results in Individual DecisionMaking Treatments
This section demonstrates the robustness of our results in the baseline individual treat-
ments. First, Table 8 provides the p-values of ranksum tests for each of the ten belief
formation tasks if we exclude all “outliers”, i.e., all observations which are not within
[50 %, 150 %] of the rational belief. Figures 6 and 7 provide kernel density estimates of
the beliefs in each of the ten tasks to provide a visual representation of the robustness
of our results. As the ranksum tests above, these densities exclude beliefs which are not
within [50 %, 150 %] of the rational belief. All data are pooled across the baseline and
high stakes conditions.
Table 8: P-values of ranksum tests in the individual treatments excluding outliers
True state 10 88 250 732 1’000 4’698 7’338 10’000 23’112 46’422
p-value 0.0030 0.0001 0.0006 0.0021 0.0264 0.0001 0.9299 0.0001 0.0001 0.0010
Observations include all beliefs in the baseline and high stakes treatments within a 50 % range around the rational belief. he p-values refer to a Wilcoxon ranksum test between beliefs in the Correlated and Uncorrelated conditions.
4

0.1
.2.3
Den
sity
4 6 8 10 12Belief
Correlated treatment Uncorrelated treatmentkernel = epanechnikov, bandwidth = 0.4040
True state=10, Rational=7.75, Correlation neglect=9.88
0.0
2.0
4.0
6.0
8D
ensi
ty
40 60 80 100 120Belief
Correlated treatment Uncorrelated treatmentkernel = epanechnikov, bandwidth = 4.6535
True state=88, Rational=71.25, Correlation neglect=96.63
0.0
05.0
1.0
15.0
2.0
25D
ensi
ty
150 200 250 300 350Belief
Correlated treatment Uncorrelated treatmentkernel = epanechnikov, bandwidth = 11.6823
True state=250, Rational=259.75, Correlation neglect=219.38
0.0
02.0
04.0
06.0
08D
ensi
ty
400 600 800 1000Belief
Correlated treatment Uncorrelated treatmentkernel = epanechnikov, bandwidth = 38.0618
True state=732, Rational=853.15, Correlation neglect=709.13
Figure 6: Kernel density estimates of beliefs in individual belief formation treatments (1/2)
5

0.0
02.0
04.0
06.0
08D
ensi
ty
500 1000 1500Belief
Correlated treatment Uncorrelated treatmentkernel = epanechnikov, bandwidth = 31.1258
True state=1,000, Rational=974.75, Correlation neglect=1,042.38
0.0
005
.001
.001
5.0
02D
ensi
ty
2000 3000 4000 5000 6000 7000Belief
Correlated treatment Uncorrelated treatmentkernel = epanechnikov, bandwidth = 344.8901
True state=4,698, Rational=4,810, Correlation neglect=3,209
0.0
001
.000
2.0
003
.000
4D
ensi
ty
6000 8000 10000 12000Belief
Correlated treatment Uncorrelated treatmentkernel = epanechnikov, bandwidth = 378.8432
True state=7,338, Rational=8,605.5, Correlation neglect=9,277.25
0.0
002
.000
4.0
006
.000
8D
ensi
ty
2000 4000 6000 8000 10000Belief
Correlated treatment Uncorrelated treatmentkernel = epanechnikov, bandwidth = 530.6833
True state=10,000, Rational=7,232.25, Correlation neglect=4,887.63
0.0
0005
.000
1.0
0015
Den
sity
15000 20000 25000 30000 35000 40000Belief
Correlated treatment Uncorrelated treatmentkernel = epanechnikov, bandwidth = 1.5e+03
True state=23,112, Rational=26,331, Correlation neglect=20,745.5
0.0
0005
.000
1.0
0015
.000
2D
ensi
ty
20000 30000 40000 50000 60000Belief
Correlated treatment Uncorrelated treatmentkernel = epanechnikov, bandwidth = 3.1e+03
True state=46,422, Rational=38,910.5, Correlation neglect=25,625
Figure 7: Kernel density estimates of beliefs in individual belief formation treatments (2/2)
6

C.3 Stability of (Median) Naïveté Parameters
To provide an illustration of the stability of the naïveté parameters, we conduct the fol-
lowing empirical exercise. For each subject, we set the belief to missing whose implied
naïveté parameter is closest to that subject’s median naïveté parameter. Then, we re-
compute the median naïveté parameters on the remaining (nine) beliefs and calculate
the difference between the original and the “modified” naïveté parameter. If this differ-
ence is small, this indicates that the median naïveté parameter is stable. For instance,
in the example above, if a median naïveté parameter was 0.5 because the respective
subject switched between implied naïveté parameters of 0 and 1 across the ten belief
formation tasks, throwing out one belief should move the naïveté parameter by 0.5.
The left panel of Figure 8 plots a histogram of the difference between the naïveté
parameters if we exclude one belief. The right-hand panel displays the difference be-
tween the original naïveté parameter and a modified naïveté parameter if we exclude
those two beliefs that are closest to that subject’s median naïveté parameter. The re-
sults show that the vast majority of naïveté parameters is very stable, as indicated by
the mass points around zero.
.1.3
.5Fr
actio
n
-1.5 -1 -.5 0 .5 1Difference b/w naivete parameters (1 belief excluded)
.1.3
.5Fr
actio
n
-1.5 -1 -.5 0 .5 1Difference b/w naivete parameters (2 beliefs excluded)
Figure 8: Histograms of the difference between original naïveté parameters and modified naïveté param-eters when excluding the one or two beliefs that are closest to the original (implied) naïveté parameter.The right-hand plot excludes one extreme outlier with ∆χ < −3.
C.4 Individual Treatments: (No) Learning Over Time
Table 9 provides the results of an OLS regression of all normalized beliefs in the Cor-
related treatments on a time trend. These estimations show that normalized beliefs do
not become smaller over time, i.e., they do not converge to the rational belief of zero.
7

Table 9: Time trend of beliefs in the Correlated treatments
Dependent variable:Normalized belief
(1) (2)
# of period 0.010 -0.0015(0.01) (0.02)
Constant 0.61∗∗∗ 0.43(0.08) (0.41)
Additional controls No Yes
Observations 903 887R2 0.00 0.08
OLS regressions, standard errors (clustered at indi-vidual) in parentheses. Observations include all nor-malized beliefs from all tasks in the baseline andhigh stakes Correlated treatments excluding extremeoutliers with normalized belief χ j
i > 4 or χ ji < −3.
The results are robust to including these outliers.Additional controls include age, gender, final highschool grade, the score on a Raven matrices IQ test,monthly disposable income, marital status fixed ef-fects, a high stakes dummy, and fixed effects for eachtrue state. ∗ p < 0.10, ∗∗ p < 0.05, ∗∗∗ p < 0.01
C.5 Finite Mixture Model
For the purpose of the finite mixture model, we assume that every individual belongs
to a discrete set of two-dimensional types θk = (χk,σk) with k ∈ {1, . . . , K}, wherethe population weights wk are estimated along with θk. Following the model of belief
formation outlined in Section 2, the normalized belief of subject i in round j, who is
of type k, can be expressed as b̃ ji = χk + u j
i , where u ji ∼N (0,σk) can be thought of as
individual- and task-specific random computational error. In allowing for heterogeneity
both in χ and σ, we will employ standard maximum likelihood procedures to analyze
the prevalence of particular types. The likelihood contribution of individual i is given
by
Li(χ,σ, w) =K∑
k=1
wk
10∏
j=1
P(b̃ ji |χk,σk) (1)
where the interior product term computes the likelihood of observing the collection of
(normalized) beliefs given a certain type θk = (χk,σk). This term is then weighted by
the respective population share wk. The grand likelihood is obtained by summing the
logs of the individual likelihood contributions, which is then maximized by simultane-
8

ously choosing (χk,σk, wk) ∀ k.
Table 10 presents the key results from these estimations. The table reports the esti-
mated parameters of our belief formationmodel for three different specifications, which
differ in the number of types we impose. The results show that if we restrict the model
to only one updating rule, the maximum likelihood procedure estimates a substantial
degree of naïveté along with a rather high error rate (variance). This model masks a
considerable degree of heterogeneity: If we allow for the existence of two types of sub-
jects, the model fit increases substantially. In particular, the model indicates that the
data are explained as a mixture of two clearly distinguishable groups of subjects. For
the first group, the estimation generates a naïveté parameter very close to the rational
level of χ = 0. The second group, on the other hand, is characterized by a large degree
of correlation neglect with little adjustment from full naïveté. The high variance esti-
mated for the second type motivates us to allow for the presence of further sub-groups
in the data. Accordingly, if we allow for three classes of updating rules, the model fit
further improves, but not dramatically so. While the parameter estimates for the first
(rational) group remain intact, the model now distinguishes between two types of sub-
jects with different naïveté values.¹ In sum, our individual-level analysis has shown that
the strong average tendency to ignore informational redundancies masks a considerable
heterogeneity.
¹Further extending the estimations to allow for four types of subjects does not lead to noteworthychanges of the spirit of our results.
9

Table 10: Results of finite mixture model
Model parameters Goodness of fitModel Type χ σ w (%) LL AIC BIC
K = 1 k = 10.66 1.14 100 −1423 2851 2856(0.06) (0.08)
k = 10.06 0.27 16.8(0.03) (0.07) (4.9)
K = 2 −1284 2578 2591
k = 20.79 1.21 83.2(0.06) (0.10) (4.9)
k = 10.05 0.27 14.4(0.02) (0.05) (4.9)
K = 3 k = 20.56 2.18 16.7 −1186 2388 2408(0.24) (0.28) (5.0)
k = 30.83 0.87 68.9(0.06) (0.05) (6.1)
94 subjects, standard errors (clustered at the subject level) in parentheses. All estimationsexclude a few extreme outliers, which are likely due to typing mistakes: For each task and in-dividual, an observation is set to missing if the implicit normalized belief satisfies |b̃ j
i | > 10.This resulted in the exclusion of 8 (out of 932) observations.
D Robustness Treatment
D.1 Experimental Design
Our belief elicitation design made a number of design choices, whose overarching goal
was to create a relatively simple updating environment. To illustrate that none of our
design features was critical in generating the results, we now investigate the robustness
of our treatment comparison. To this end, we conducted a robustness treatment (both
Correlated and Uncorrelated) which was identical to the baseline treatments, with the
exception of variations along four design dimensions.
First, the data-generating process was altered slightly. We induced a prior belief
by informing subjects that µ would be drawn from N (0; 250,000), while the signal
distribution was given by sh ∼ N (µ; 250,000). As a consequence, negative true states
were possible and we eliminated the truncation of the signal distribution. Both prior
and signal distributions were explained to subjects in great detail, and the instructions
included the corresponding formulas. Control questions ensured that subjects under-
stood the key features of the prior distribution as well as the equal variance of the prior
and signal distributions.
Second, we introduced a fourth intermediary which, in both the Uncorrelated and
the Correlated condition, simply transmitted the signal of computer A to the subject.
Thus, subjects only communicated with intermediaries.
10

Third, subjects’ payment was determined by the binarized scoring rule, which is
incentive-compatible regardless of subjects’ risk attitudes (Hossain and Okui, 2013).²
Fourth, instead of framing the experimental task as guessing how many items are
contained in an imaginary container, we explicitly told subjects that they would have
to estimate a hypothetical true state, which would be drawn by the computer.
96 subjects participated in these treatments and earned 11.10 euros on average.
Table 11 provides details on all ten belief formation tasks, including true states, signal
draws, and reports of the intermediaries. In addition, we again provide the benchmarks
of full correlation neglect and rational beliefs. Note that these theoretical benachmarks
are computed assuming full base rate neglect.
Table 11: Overview of the belief formation tasks in the robustness treatment
True Intermed. Intermed. Intermed. Intermed. Intermed. Intermed. Intermed. Rational CorrelationState 1 uncorr. 2 uncorr. 3 uncorr. 4 uncorr. 2 corr. 3 corr. 4 corr. Belief Neglect Belief
-563 -446 -1,374 -1,377 -1,475 -910 -911.5 -960.5 -1,168 -807
-279 44 90 -388 137 67 -172 90.5 -29.25 7.38
-241 249 -699 -139 70 -225 55 159.5 -129.75 59.63
-33 170 21 225 -128 95.5 197.5 21 72 121
-28 248 83 -110 -364 165.5 69 -58 -35.75 106.13
-23 810 -822 -99 409 -6 355.5 609.5 74.5 442.25
38 442 173 58 233 307.5 250 337.5 226.5 334.25
154 314 206 -229 711 260 42.5 512.5 250.5 282.25
548 -73 -559 181 910 -316 54 418.5 114.75 20.88
1,128 1,989 781 440 2,285 1,385 1,214.5 2,137 1,373.75 1,681.38
The reports of intermediaries 1 through 4 in the Uncorrelated condition directly reflect the draws of computers A-D. The reportof intermediary 1 in the Correlated condition equals the report of intermediary 1 in the Uncorrelated treatment. The rationalbenchmark is computed by taking the average of the signals of computers A-D, i.e., assuming full base rate neglect. The cor-relation neglect benchmark is given by the average of the reports of intermediaries 1-4 in the Correlated condition, i.e., alsoassuming full base rate neglect. Note that defining the rational belief assuming base rate neglect has no consequences for ourtreatment comparison. Also note that subjects faced the ten rounds in randomized order, which was identical across treatments.
D.2 Results
To summarize, the results of these robustness treatments are very similar to those in
the baseline treatments. Figure 9 illustrates this by plotting median naïveté parame-
ters for both conditions.³ As in the baseline treatments, the type distribution in the
²Specifically, we computed a penalty term by squaring the distance between a subject’s belief andthe true state. The subject then received 10 euros if the penalty was smaller than a randomly drawnnumber k ∼ U[0;100, 000], and nothing otherwise.
³Given that we induced a prior in these treatments, computing individual-level naïveté towards cor-relations requires an assumption on potential base rate neglect. We base this assumption on behavior inthe Uncorrelated robustness condition, where subjects uniformly essentially fully neglect the base rate.Accordingly, we assume full base rate neglect, i.e., normalized beliefs are computed as in the main text.This assumption has no bearing on our treatment comparison, but only serves to illustrate the populationdistribution of naïveté.
11

0.5
11.
52
Den
sity
-.5 0 .5 1 1.5Median naïveté parameter
Corr. robustness treatment Uncorr. robustness treatmentkernel = epanechnikov, bandwidth = 0.1500
Treatment Robustness
Figure 9: Kernel density estimates of median naïveté parameters. The left panel depicts the distributionof naïveté in the baseline treatments, and the right panel in the robustness treatments.
Correlated condition exhibits a bimodal structure, according to which some fraction of
subjects fully neglects informational redundancies, while others state the same beliefs
as subjects in the Uncorrelated condition. Accordingly, the belief distributions in the
Correlated and Uncorrelated treatments significantly differ from each other (p<0.0001,
Wilcoxon ranksum test). This is also reflected by lower earnings of subjects in the Corre-
lated condition (earnings difference=2.30 euros, p-value=0.0255, Wilcoxon ranksum
test).
Table 12 reports the results for all ten belief formation tasks separately. As can be in-
ferred by comparing columns (2) and (4), median beliefs in the Uncorrelated condition
closely follow our definition of the “rational” belief, suggesting that subjects indeed fail
to take into account base rates. Median beliefs in the Correlated condition are always
biased away in the direction of the full correlation neglect prediction. For seven out of
ten tasks, beliefs differ significantly at the 5% level (Wilcoxon ranksum test).
12

Table 12: Correlation neglect by belief formation task, robustness treatments
True Rational Correlation Median Belief Median Belief Ranksum TestState Belief Neglect Belief Uncorr. Treatment Correlated Treatment (p-value)
-563 -1,168 -807 -1,168 -912.5 0.0189
-279 -29.25 7.38 -29.25 20 0.0031
-241 -129.75 59.63 -126.25 13 0.0052
-33 72 121 72.25 78.5 0.8456
-28 -35.75 106.13 -35.35 36.25 0.0006
-23 74.5 442.25 75 208.5 0.0009
38 226.5 334.25 224.5 226.5 0.0202
154 250.5 282.25 250.5 262.5 0.2133
548 114.75 20.88 115 100 0.1074
1,128 1,373.75 1,681.38 1,373.35 1,412.1 0.0227
See Table 11 for details of the computation of the rational and the correlation neglect benchmarks.The p-values refer to a Wilcoxon ranksum test between beliefs in the Correlated and Uncorrelated con-ditions. Note that subjects faced the ten rounds in randomized order.
E Mechanisms and Debiasing
E.1 A Simple Model
Applying the framework of DellaVigna (2009) to steps 1.–2. from Section 3.2 of the
manuscript, we have⁴
χ = f (a, m) with∂ f (·)∂ a
≤ 0 and∂ f (·)∂m
≤ 0. (2)
That is, a person exhibits less correlation neglect χ if attention and understanding a
of the double-counting problem is higher and when he has higher mathematical skills m.
In line with DellaVigna (2009), we assume that the probability of noticing and thinking
through the correlation is a function of (i) the salience s of the double-counting issue
and the underlying independent signals, and (ii) the size of the information structure
n. We hence have:
a = g(s, n) with∂ g(·)∂ s
> 0 and∂ g(·)∂ n
< 0. (3)
Thus, the more salient the double-counting problem is, the more likely people are to
recognize it and hence exhibit less correlation neglect, ∂ χ/∂ s ≤ 0. Likewise, the higher
n (the number of signals andmessages), the less a decision-maker attends to the double-
⁴The weak inequalities merely reflect the fact that some attention and understanding is necessaryin order for mathematical skills to matter, and vice versa. For example, increasing focus on the double-counting problem only leads to less correlation neglect if some mathematical skills are present.
13

counting issue and is hence more likely to neglect correlations, ∂ χ/∂ n ≥ 0. Notably,
both of these comparative statics predictions hold while holding the mathematical steps
constant.
E.2 A General “Face Value” Heuristic?
Wehave shown thatmany subjects employ a simplifying heuristic and often fully neglect
the informational redundancies present in our environment. A possible, though per-
haps extreme, conjecture is that these subjects never think through the process gen-
erating their information. Instead, they may take the visible and salient messages at
“face value”, meaning that they treat each number as if it were an unmanipulated inde-
pendent signal realization, regardless of whether the signals are correlated or distorted
in other ways (see, e.g., the recent literature on the “sampling approach” towards judg-
ment biases in cognitive psychology or the “system neglect” hypotheses articulated by
Fiedler and Juslin, 2006; Massey and Wu, 2005). If true, this would imply that the
updating error documented in Section 2 of the manuscript is inherently unrelated to
correlations as such, but rather a special case of a rather simplistic heuristic. Based on
these considerations, we now investigate the limits of such neglect patterns, i.e., we
seek to understand whether people neglect signal distortions of any kind.
If a general face value bias was at work in our experimental environment, people
should also make mistakes in all other settings in which they receive distorted signals.
We hence investigate the empirical validity of the face value explanation by introducing
two further treatment variations, in which the source of the distortion is not (just) a cor-
relation. Key idea behind both designs is to introduce a simple external distortion of the
signals, i.e., a distortion which does not arise from the interplay of various signals, but
rather from the intervention of some external source. According to a simple face value
heuristic, these environments should also produce a particular pattern of biased beliefs.
First, we designed treatmentMultiply, which was identical to the baseline Uncorrelated
condition, except that each of the three intermediaries obtained one of the true signals,
and multiplied it by 1.5. Thus, subjects received messages (s1, s2×1.5, s3×1.5, s4×1.5).Note that, across tasks, the signal of computer A is well within the range of the distorted
messages, just like in the Correlated treatment. If subjects take all information they see
at face value, this treatment should produce biased beliefs, hence allowing for a first
assessment of the empirical validity of face value bias. We implemented the same true
states, signals, and procedures as in the baseline conditions. 46 subjects participated in
this treatment and earned an average of 11.70 euros.
In a second treatment variation (Face value), we created an information environ-
ment in which (i) the rational benchmark belief coincides with that in the Uncorre-
14

lated treatment, (ii) correlation neglect predicts the same beliefs as in the Correlated
condition, and (iii) the correlation neglect and face value predictions do not coincide.
Specifically, as depicted in Figure 10, we amended the baseline Correlated treatment by
introducing three further “machines” which communicated with subjects. Computers
A through D generated four unbiased iid signals, and the intermediaries 1-3 again took
the average of the respective signals of the computers. The machines M1 through M3
each observed one of these averages, and added a known constant X (“noise”). Thus,
subjects’ decision screens contained the signal of computer A as well as the messages of
the three machines. In addition, the written instructions included a table in which X was
provided, separately for each task. In the instructions, the machines were described in
a manner that was comparable to how we introduced the intermediaries, and we made
it clear that the value of X was unrelated to the solution of the task. In this treatment,
both the rational and the full correlation neglect predictions are identical to those in
the baseline conditions. By tailoring X, the face value prediction can be constructed
to take on any desired value. In five of the tasks, we chose X such that the face value
prediction is equal to the rational belief, i.e., the average of the independent signals.
Thus, in these tasks, behaving “rationally” is computationally very simple and can be
achieved by either taking messages at face value or going through the full debiasing
process. On the other hand, neglecting correlations alone requires subjects to subtract
X from the messages of the machines and then stop in further debiasing the messages.
In the other five tasks, we chose X such that – after normalizing beliefs – the face value
prediction was exactly opposite to the correlation neglect prediction, relative to the ra-
tional benchmark. For example, if the signal of computer A was relatively high, so that
correlation neglect predicts an inflated belief, X assumed a negative value such that
face value predicts a normalized belief of (−1). We implemented the same true states,
signals, and procedures as in the baseline conditions, so that this treatment allows for
SubjectComputer A
Computer B
Computer C
Computer D
Interme-diary 1
Interme-diary 2
Interme-diary 3
Machine1
Machine2
Machine3
Figure 10: Treatment Face value. The machines add X to the reports of the intermediaries.
15

a sharp separation between correlation neglect and a face value heuristic. Table 13 pro-
vides an overview of the ten estimation tasks. 45 subjects participated in Face value and
earned 8.10 euros on average.
Table 13: Overview of the belief formation tasks, Face Value treatment
TrueX
Machine Machine Machine Rational Correlation Face ValueState M1 M2 M3 Belief Neglect Belief Belief
10 -6 4.5 5 0 7.75 9.88 5.38
88 -34 72 61 30 71.25 96.63 71.13
250 54 291 288 282 259.75 219.38 259.88
732 192 898 800 1,150 853.25 709.13 853.13
1,000 -90 995 780 1,015 974.75 1,042.38 974.88
4,698 4,269 8,693 7,506 7,836 4,810.00 3,209.00 6410.75
7,338 -1,794 3,783 8,842 9,153 8,604.50 9,277.25 7,931.75
10,000 3,126 9,788 7,847 8,752 7,232.25 4,887.63 7,232.13
23,112 14,895 33,378 32,779 46,351 26,331.00 20,745.50 31,916.75
46,422 35,427 57,681 66,518 72,244 38,910.50 25,625.25 52,195.50
The rational benchmark is computed by taking the average of the signals of computers A-D. Thecorrelation neglect benchmark is given by the average of the reports of computer A and interme-diaries 1-3, i.e., by extracting X from the reports of the machines. The face value belief is given bythe average of the messages of computer A and machines M1-M3. Note that subjects faced the tenrounds in randomized order.
Result 1. Across contexts, face value bias explains a negligible fraction of beliefs.
The results from both treatments indicate that subjects do not take all information
at face value without reflecting upon the data-generating process. As illustrated by
Table 14, virtually all subjects behave fully rational in treatment Multiply, suggesting
that subjects attend to and are capable of correcting for the biased messages.
A similar picture emerges for treatment Face value. As illustrated by Table 15, the
distribution of beliefs is very similar to the baseline Correlated condition, suggesting
that subjects again fall prey to correlation neglect, but not to face value bias. Beliefs in
Face value typically closely follow beliefs in the baseline Correlated condition, suggest-
ing that subjects do not fall prey to a simple face value heuristic, but instead extract X
from the reports of the machines. In consequence, in the vast majority of tasks, beliefs
significantly differ between the Uncorrelated and the Face value treatments in the direc-
tion predicted by correlation neglect, while the comparison between Face value and the
baseline Correlated treatment is usually far from significant. This implies that subjects
again detect and correct for the external distortion introduced through the machines,
but then stop in further debiasing the (still correlated) messages. Thus, we identify
16

Table 14: Overview of belief formation tasks in the Multiply treatment
True Rational Face value Median belief Median belief Ranksum teststate belief belief Uncorrelated Multiply (p-value)
10 7.75 10.125 8 8.3 0.3755
88 71.25 91.625 71.2 71.25 0.8233
250 259.75 367.25 259.75 260 0.8085
732 853.25 1209.25 847 805 0.8747
1,000 974.75 1,323.375 999 1,000 0.3054
4,698 4,810 7,014 4,810 4,818 0.8474
7,338 8,604.5 11,663 8,975 8,750 0.3097
10,000 7,232.25 10,530.5 7,232 7,100 0.3959
23,112 26,331 37,601.5 25,000 23,000 0.2270
46,422 38,910.5 56,823.25 38,885.5 38,573.75 0.9525
The rational belief is computed by taking the average of the signals of computers A through D.The face value belief is given by (sA+ 1.5sB + 1.5sC + 1.5sD)/4. Note that subjects faced the tenrounds in randomized order. The p-values refer to a Wilcoxon ranksum test between beliefs inthe Uncorrelated and Multiply conditions.
evidence for correlation neglect even when it makes a prediction different from face
value bias.
To further illustrate the results, Figure 11 compares kernel density estimates of the
belief distributions between the Face value treatment and the two baseline treatments.
The left panel depicts median normalized beliefs (median naïveté parameters) for tasks
in which face value bias coincides with the rational prediction of zero. The right panel
displays median normalized beliefs for tasks in which face value bias and correlation
neglect make opposite predictions, i.e., after normalization the face value prediction is
(−1) and the correlation neglect prediction is 1. In both panels, the belief distribution
in the Face value treatment is closest to the belief distribution in the baseline Correlated
treatment and clearly differs both from beliefs in the Uncorrelated treatment as well
as from the face value predictions.⁵ A Wilcoxon ranksum test confirms that beliefs in
Face value significantly differ from those in the Uncorrelated condition (p = 0.0086),
but not from those in the baseline Correlated treatment (p = 0.3670).⁶ Thus, even
in a treatment in which face value bias makes a prediction different from correlation
neglect, we identify significant evidence for people’s neglect of correlations.
In sum, we have shown that - unlike a simplistic face value bias would prescribe -
⁵If anything, beliefs are slightly less rational in Face value. It is conceivable that some subjects imme-diately noticed that the messages of the machines are biased due to X and, once they understood this,stopped to reflect upon potential further problems in the data-generating process.
⁶Beliefs in Face value do not significantly differ between tasks in which face value predicts zero or(-1), providing further evidence for the low explanatory power of a simple face value bias.
17

Table 15: Correlation neglect by belief formation task, Face value treatment
True Rational Correlation Face Value Median Belief Median Belief Ranksum Tests (p-value)State Belief Neglect Belief Belief Face Value Correlated Correlated Uncorrelated
10 7.75 9.88 5.38 9 9.2 0.6455 0.0840
88 71.25 96.63 71.13 85 88 0.2197 0.0341
250 259.75 219.38 259.88 240 235.5 0.5761 0.0184
732 853.15 709.13 853.13 757.3 742 0.0978 0.2098
1,000 974.75 1,042.38 974.88 1,020 1,030 0.5013 0.1839
4,698 4,810 3,209 6410.75 3,742.7 4,556 0.5341 0.0001
7,338 8,604.5 9,277.25 7,931.75 8,800 9,044.5 0.0646 0.0473
10,000 7,232.25 4,887.63 7,232.13 5,669 6,750 0.5459 0.0001
23,112 26,331 20,745.5 31,916.75 21,229 21,000 0.3034 0.0937
46,422 38,910.5 25,625 52,195.50 29,574 32,000 0.3210 0.0012
See Table 13 for details of the computation of the rational, correlation neglect, and face value benchmarks. hep-values refer to a Wilcoxon ranksum test between beliefs in the Face value treatment on the one hand and the Cor-related or Uncorrelated condition, on the other hand. Note that subjects faced the ten rounds in randomized order.
0.4
.81.
21.
6D
ensi
ty
-2 -1 0 1 2Median normalized belief
Correlated Uncorrelated Face valuekernel = epanechnikov, bandwidth = 0.1500
Treatment Face value, face value prediction = 0
0.4
.81.
21.
6D
ensi
ty
-2 -1 0 1 2Median normalized belief
Correlated Uncorrelated Face valuekernel = epanechnikov, bandwidth = 0.1500
Treatment Face value, face value prediction = -1
Figure 11: Kernel density estimates of median normalized beliefs in the Face value treatment, comparedwith those from the baseline Correlated and Uncorrelated conditions. The left panel illustrates the fivetasks in which the face value belief equals the rational belief, while the right panel depicts the five tasksin which the face value belief makes the opposite prediction compared to correlation neglect (relative tothe rational belief). To ease readability, the densities exclude (4 / 3, respectively) subjects with mediannormalized belief of less than (-2). All statistical tests include these outliers.
people struggle considerably more with distortions that arise from the interdependence
of multiple signals than with externally biased messages. Of course, these findings do
not imply that correlations are the only type of complexity that induce people to make
systematic errors. However, they show that rather simple distortions of signals such
as adding or multiplying a constant do not suffice to lead people astray. One possible
interpretation of these results is that correlations are more complex and less intuitively
wrong than more simple signal distortions.
18

E.3 Heterogeneity in Treatment Alternating
0.4
.81.
21.
6D
ensi
ty
-1 0 1 2Median naïveté parameter
Correlated Uncorrelated Alternatingkernel = epanechnikov, bandwidth = 0.1500
Treatment Alternating
Figure 12: Kernel density estimates of median naïveté parameters. The three kernels depict the distribu-tions of naïveté in the Correlated and Uncorrelated conditions, pooled across the high stakes and baselinetreatments, as well as beliefs in Alternating.
E.4 Further Evidence for Conceptual as Opposed to Mathematical
Problems
This Appendix present the results from two further treatment variations which show
that subjects struggle more with identifying and thinking through the double-counting
problem in the first place, than with solving it mathematically.
E.4.1 Treatment Intermediaries
First, in treatment Intermediaries, we attempt to nudge subjects’ attention towards the
double-counting problem without making the comparison to the uncorrelated infor-
mation structure explicit. Instead, to shift subjects’ focus while forming beliefs, we con-
ducted a treatment variation that is identical to the baseline Correlated condition except
for one additional short paragraph which was provided both at the end of the instruc-
tions and on subjects’ decision screens along with the graphical representation of the
information structure (see corresponding panel of Figure 1 in the manuscript):
Hint for solving the task: Again consider the figure which depicts the infor-
mation you will receive. Think carefully about what the intermediaries do!
What does that imply for the estimates of the intermediaries?
Note that this constitutes a rather strong intervention in the sense that we explicitly
told subjects what to focus on when approaching the task. However, the paragraph did
19

not provide any additional information on how to solve the problem and compute ra-
tional beliefs. Subjects completed the same ten belief formation tasks as in the baseline
Correlated condition. 46 subjects took part in the Intermediaries treatment and earned
12.70 euros on average.
Columns (1) and (2) of Table 16 present the results. An OLS regression of subjects’
naïveté on a treatment dummy shows that beliefs in Intermediaries are significantly less
biased compared to the Correlated treatments. Thus, this treatment provides additional
evidence that shifting subjects’ focus towards the presence of the double-counting prob-
lem has large effects on beliefs.
E.4.2 Treatment Math
To provide further evidence that people are in principle well capable of performing the
mathematical calculations that are needed to develop rational beliefs, we introduced
treatment Math. In this treatment variation, we altered the instructions relative to the
Correlated treatment by explicitly advising subjects to back out the underlying inde-
pendent signals from the correlated messages.⁷ In essence, this treatment solves the
first step of the belief formation process outlined above. Thus, any remaining systema-
tic mistake can be attributed to either cognitive effort costs or mathematical problems
in executing the calculations. 47 subjects took part in this treatment and earned an
average of 11.40 euros.
Columns (3) and (4) of Table 16 present the results. An OLS regression of subjects’
naïveté on a treatment dummy shows that beliefs in Math are significantly less biased
compared to the Correlated treatments. Thus, again, the results show that people do
no struggle with the pure mathematical task of backing out the independent signals.
⁷For instance, the instructions stated: “Important hint: . . . You should attempt to determine the aver-age of the signals of the computers.” We also introduced a corresponding control question, see AppendixH for details.
20

Table 16: Mechanisms
Dependent variable: Naiveté χIntermediaries Math
(1) (2) (3) (4)
0 if Correlated, 1 if Intermediaries -0.37∗∗∗ -0.32∗∗∗
(0.07) (0.07)
0 if Correlated, 1 if Math -0.29∗∗∗ -0.29∗∗∗
(0.09) (0.08)
Constant 0.62∗∗∗ 0.58∗∗∗ 0.62∗∗∗ 0.38(0.05) (0.18) (0.05) (0.25)
Additional controls No Yes No Yes
Observations 1327 1313 1324 1310R2 0.04 0.12 0.03 0.11
OLS estimates, robust standard errors (clustered at subject level) in paran-theses. The dependent variable is subjects’ naïveté as implied in a given be-lief. In columns (1)-(2), observations include all beliefs of subjects in theCorrelated (both baseline and high stakes) and Intermediaries treatments. Incolumns (3)–(4), the sample includes all beliefs of subjects from the Corre-lated and Math conditions. Additional controls include age, gender, cogni-tive skills, monthly income, marital status fixed effects, and task fixed effects.All regressions exclude extreme outliers with |χ j
i | > 3, but all results arerobust to including these observations when employing median regressions.∗ p < 0.10, ∗∗ p < 0.05, ∗∗∗ p < 0.01
F Market Experiments
F.1 Experimental Design
In the market treatments, the belief formation task was embedded into a standard
double-auction setting with uncertainty over the value of the assets. In each trading
round, an asset’s value corresponded to the true state of the world from the individ-
ual belief formation treatments. Before each round, all traders received the same sets
of signals about the state as participants in the baseline design (see Table 1). In the
Correlated market treatment, all market participants received correlated, in the Uncor-
related market treatment they received uncorrelated information. Before each trading
round, subjects were given five minutes to think about an asset’s value and to provide
a non-incentivized belief. Afterwards, subjects traded the assets.
In order to keep the experiment as simple as possible and to retain subjects’ focus
on the information structure, participants were assigned to be in the role of a buyer
or a seller, so that each subject could either buy or sell assets, but not both. A market
group consisted of four buyers and four sellers. Subjects were randomly assigned to
be in either role and kept their roles throughout the experiment; they also remained
in the same market groups. Before each of the ten rounds, each seller was endowed
with four assets. Also, at the beginning of each round, each buyer received a monetary
21

endowment that was sufficient to purchase between three and six assets at fundamental
values.⁸
In a standard double-auction format, buyers could post buying prices and accept
selling offers from the sellers. Sellers could post selling prices and accept buying offers
from the buyers. Buying and selling offers were induced to converge by the standard
procedure, i.e., a new buying (selling) offer had to be higher (lower) than all previous
offers. An accepted offer implied a trade and erased all previous offers. Trading lasted
for four minutes. Profits per trading period for both buyers and sellers corresponded to
the value of the assets owned plus the amount of money held at the end of the respective
trading round minus some known fixed costs.
We used two different randomized orders of rounds. After each round, subjects
received feedback about the true state of the world and the resulting profits in that
round. At the end of the experiment, one of the ten rounds was randomly selected and
implemented, i.e., payoff-relevant for the subjects. The written instructions included
the same information on the information structure as in the individual belief formation
treatments. A summary of the instructions was read out aloud. In addition to the control
questions about the information structure, we asked several questions related to the
trading activities. After the control questions, we implemented a test round after which
participants again had the opportunity to ask questions.
288 subjects participated in the market treatments. These sessions lasted about 2.5
hours and subjects earned 19.40 euros (≈ USD 25) on average, including a 6 euros
show-up fee.
F.2 Hypothesis
In the market treatments, the standard theoretical prediction is that the competitive
market equilibrium price is given by the rational belief.⁹ Since it is well-established
that experimental double-auctions tend to converge to the theoretical competitive equi-
librium, this is also the standard experimental prediction. This prediction changes in
the presence of naïve traders. If, for instance, all traders are homogenous in their degree
of naïveté, the equilibrium price level is given by the corresponding level of distorted be-
⁸Throughout the experiment, profits, prices etc. were described in points rather than euros. Sincethe true state differed in magnitude from round to round, we had to adjust the point / euro exchangerate across rounds. This was made clear in the instructions. In principle, the exchange rate as well asthe budget was informative of the true state. The relationship between these variables was chosen to benon-constant across rounds, so that the informational content was weak (see Appendix F.9 for details).In any case, since budgets and exchange rates were identical across treatments, this procedure cannotexplain potential treatment differences.
⁹Since every subjects got the same signals about the value of the assets, under homogenous riskpreferences there should be no trade, unless market participants trade at the rational belief.
22

liefs. More generally, under heterogeneity the magnitude of a potential price distortion
will depend on the naïveté of the marginal traders.¹⁰
Hypothesis. Assuming that χ > 0, the excessive belief swings induced by correlation
neglect translate into over- and underpricing. If s1 > s̄−1, market prices in the Correlated
market treatment are too high relative to the Uncorrelated treatment, and if s1 < s̄−1 they
are too low.
On the other hand, it has been argued that the influence of cognitive biases on ag-
gregate variables is limited. In the market we implement, two channels in particular
may attenuate such effects. First, competitive forces andmarket incentives could induce
subjects to think harder and thus cause a reduction of correlation neglect. Second, mar-
kets provide ample opportunities for traders to learn. For instance, traders may learn
from realized profits in each trading round. In this respect, we gave rather extensive
feedback between rounds, providing subjects with realized profits as well as the true
asset value. Perhaps more importantly, markets also allow participants to learn from the
actions of more rational traders. For instance, an overly optimistic market participant
who observes others trading at relatively low prices may become inclined to rethink his
valuation of the assets. While all these channels could mitigate the effect of individual
biases on market outcomes, the learning arguments in particular would suggest that
correlation neglect (and its consequences) is reduced in the last trading rounds.¹¹
F.3 Results
Price Levels Across Treatments
In both market treatments, we have observations from 18 market groups that trade in
ten trading rounds each. For each market group and trading round, we define the price
of the last concluded trade to be the market price.¹² We first consider the effect of our
treatment variation on price levels.
Result 2. Market prices differ between treatments as predicted by correlation neglect. In
the Correlated market treatment, we observe frequent over- or underpricing, depending
¹⁰For instance, intuitively, suppose that a fractionα fully ignores correlations and a fraction 1−α holdsrational beliefs. Further suppose that each seller owns four assets and each buyer has a budget sufficientto buy four assets at fundamental values. Then, assuming that subjects do not learn from others’ tradingbehavior and are risk-neutral, the supply and demand curves will be step functions which overlap atthe correlation neglect belief if α→ 1. Similar arguments apply if a fraction α exhibits only partial (orheterogeneous degrees of) correlation neglect.
¹¹Camerer (1987) provides a more extensive discussion of these feedback and learning effects. Similarto our approach, he uses experimental markets to test if other updating mistakes (e.g., base-rate neglect)matter for market outcomes. See also Ganguly et al. (2000) and Kluger and Wyatt (2004) for similarstudies.
¹²All results are robust to other definitions of the market price, see Appendices F.4 and F.5.
23

Table 17: Market prices by trading round
True Rational Correlation Median Market Price Median Market Price Ranksum Test BeliefsState Belief Neglect Belief Uncorr. Treatment Correlated Treatment (p-value) Differ?
10 7.75 9.88 8.35 9.05 0.0093 Yes
88 71.25 96.63 86.5 93.45 0.0338 Yes
250 259.75 219.38 275 260 0.0113 Yes
732 853.15 709.13 820 737 0.0001 Yes
1,000 974.75 1,042.38 1,000 1,039 0.0723 Yes
4,698 4,810 3,209 5,200 4,470.5 0.0085 Yes
7,338 8,604.5 9,277.25 9,124 8,999 0.6087 No
10,000 7,232.25 4,887.63 7,575 6,250 0.0534 Yes
23,112 26,331 20,745.5 24,100 21,300 0.0007 Yes
46,422 38,910.5 25,625 41,000 35,000 0.0015 Yes
Median market prices are defined as the median of all market prices over the 18 markets in the respective round.Beliefs are said to differ between treatments in a particular round if and only if p-value < 0.05, Wilcoxon ranksumtest. Note that subjects faced the ten rounds in randomized order.
on the relative magnitude of the common source signal. Neither prices nor subjects’ beliefs
reflect learning over time.
Table 17 provides summary statistics for all ten trading rounds.We present two price
predictions (consisting of the rational benchmark and the full correlation neglect belief,
respectively), actual price levels, as well as an indicator for whether subjects’ beliefs
(as stated prior to trading) differ significantly across treatments. In all rounds but one,
prices significantly differ between treatments in the direction one would expect from
a correlation neglect perspective. While market prices in the Uncorrelated treatment
follow the rational prediction rather closely, we observe frequent instances of over- and
underpricing in the Correlated market treatment. Thus, the magnitude of the common
source signal relative to the other signals consistently predicts whether assets sell above
or below the values from the Uncorrelated market treatment.
In Appendices F.4 and F.5, we establish the robustness of the treatment difference in
price levels by excluding outliers from the analysis and by providing density estimates
of the price kernel, both at an aggregated level across periods and separately for each
period. Strikingly, the (aggregated) price kernel is centered around χ ≈ 0.5, suggesting
that rational and naïve types negotiate prices between the two extreme predictions. We
also show that the treatment difference in prices is entirely driven by subjects’ beliefs:
In an OLS regression of all prices from all market groups on a treatment dummy, the
latter vanishes after accounting for elicited beliefs. Thus, the overshooting beliefs that
are implied by neglecting informational redundancies indeed cause overshooting price
levels.
Next, we provide a visual representation of the temporal pattern of the market price
24

volatility induced by correlation neglect. To this end, we first normalize market prices
to make them comparable across rounds. This is done using a procedure akin to the
belief normalization in the individual belief formation treatments, so that, for each
market group and trading period, we essentially compute the naïveté inherent in the
market price (which, in principle, should be between zero and one). By construction,
this normalization does not allow us to distinguish the occurrence of over- from that
of underpricing. Thus, we slightly reformulate this normalization: In trading rounds in
which correlation neglect predicts overoptimism, the normalization remains the same,
so that a normalized price of one (zero) indicates full correlation neglect (rational
price levels). On the other hand, in periods in which neglecting correlations leads to
overpessimism, we normalize prices such that full correlation neglect is indicated by
(−1) and the rational benchmark by zero, respectively.¹³ For each trading round, we
then compute the difference between the median market price in the Correlated market
treatment and the median market price in the Uncorrelated condition, which gives us
an indication of the price distortion in the Correlated market treatment relative to its
appropriate benchmark.
The two panels in Figure 13 plot this difference in market prices against the the-
oretical predictions across our ten trading rounds (we used two different orderings
of rounds). First note that, by construction, the rational prediction is always given by
zero; if correlation neglect did not impact aggregate outcomes, prices would not differ
across conditions. The full correlation neglect prediction, on the other hand, alternates
between one and (-1) depending on whether correlation neglect implies overoptimism
or -pessimism. The plots show that in almost all periods the price difference follows
the correlation neglect prediction, so that prices frequently overshoot. As a result, the
excessive belief swings implied by correlation neglect directly translate into volatile
-1-.5
0.5
1
1 2 3 4 5 6 7 8 9 10Trading period
Rational Correlation neglectCorrelated minus Uncorrelated treatment
Ordering of rounds # 1
-1-.5
0.5
1
1 2 3 4 5 6 7 8 9 10Trading period
Rational Correlation neglectCorrelated minus Uncorrelated treatment
Ordering of rounds # 2
Figure 13: Difference between median normalized market prices in the Correlated and Uncorrelatedtreatments across trading rounds for the two randomized orders of rounds
¹³Formally, the new set of normalized prices p ji is given by p j
i = χji × (2×1s j
1>s̄ j−1− 1).
25

price levels. In addition, as visual inspection suggests, this pattern does not attenuate
over time. Appendix F.6 formally confirms that the bias reflected in market prices does
not become smaller over the course of the ten trading periods. Appendix F.7 analyzes
the time trend of the beliefs subjects stated prior to trading started. Again, the results
provide no indication that subjects learn to deal with correlated signals over time. Ap-
pendix F.8 discusses potential reasons why the market does not debias subjects.
Beliefs, Prices, and Individual Trading Behavior
So far, we have shown that correlated information structures have predictable conse-
quences for experimental market outcomes, i.e., price levels. Next, we demonstrate that
individual-level heterogeneity in the capability to process informational redundancies
predicts both the magnitude of price distortions across markets and individual trading
behavior.
Result 3. In the Correlated market treatment, the pervasiveness of the belief bias within
a market group predicts the degree of price distortions. Additionally, correlation neglect is
reflected in individual trading behavior. When ignoring correlations predicts an upward
(downward) biased belief, subjects with a higher propensity to overlook correlations hold
significantly more (less) assets. Consequently, these subjects earn lower profits.
The higher the degree of naïveté of themarginal traders in a market group, the more
pronounced should be the resulting price distortion. Thus, if it is indeed correlation
neglect which causes the alternating pattern of over- and underpricing, then market
groups in which people are more capable of dealing with correlations should exhibit
smaller price distortions. To investigate this issue, we normalize all market prices in
the Correlated market treatment such that they capture the size of the price distortion
in terms of naïveté χ and then, for each trading round, relate these price levels to
the naïveté which is implicit in the beliefs that subjects stated before trading started.
Specifically, we employ as explanatory variable the (average) naïveté of the marginal
traders, for each market group and trading round.¹⁴ Columns (1) and (2) of Table 18
provide corresponding OLS estimates, with standard errors clustered at the market
group level. The results show that, within the Correlated market treatment, a higher
propensity to commit correlation neglect is indeed associated with more biased price
levels.
Thus, individual-level heterogeneity in belief updating has implications for price
¹⁴To this end, we construct supply and demand curves from the beliefs subjects stated ex ante. Wethen approximate the theoretical competitive equilibrium price by identifying the buyer and seller whomarginally give rise to trade and compute the average naïveté of these two traders. The results are robustto employing the simple median naïveté across all traders in a given market group and trading round asindependent variable. See Appendix F.4.
26

levels. Correlation neglect also makes clear predictions about who should hold the as-
sets and make losses. In trading rounds in which correlation neglect leads to an over-
valuation of assets, subjects who ignore correlations should own most of the assets.
Likewise, when correlation neglect implies an undervaluation of assets, subjects who
correctly process the correlation should hold the majority of the assets. To examine
these predictions, we relate asset holdings to individual beliefs. For each individual, we
employ the median naïveté parameter as explanatory variable. The OLS regressions in
columns (3) through (6) establish that the magnitude of the belief bias predicts asset
holdings. Columns (3) and (4) show that in trading rounds in which correlation neglect
leads to an overly pessimistic belief, those subjects with a higher propensity to ignore
correlations hold significantly less assets. Likewise, when the bias implies overoptimism,
those subjects whose stated beliefs reveal a higher degree of correlation neglect hold
more assets (columns (5) and (6)). Thus, naïve subjects buy when prices are too high
and sell when they are too low. In consequence, these participants earn lower profits
(columns (7) and (8)).
Table 18: Determinants of prices, asset holdings, and profits in the Correlated market treatment
Dependent variable:
Normalized Median asset holdings Median asset holdings Medianmarket price if underpricing if overpricing profit
(1) (2) (3) (4) (5) (6) (7) (8)
Naïveté χ of marginal 0.72∗∗∗ 0.64∗∗∗
trader (0.12) (0.14)
Individual correlation -1.53∗∗∗ -1.30∗∗∗ 0.64∗∗∗ 0.26∗ -0.12∗∗ -0.11∗∗
neglect (χ) (0.17) (0.19) (0.12) (0.14) (0.05) (0.05)
Constant 0.16 0.68 2.85∗∗∗ 1.50 1.43∗∗∗ 2.48∗∗ 10.1∗∗∗ 10.3∗∗∗
(0.20) (0.44) (0.12) (0.90) (0.14) (1.12) (0.03) (0.28)
Additional controls No Yes No Yes No Yes No Yes
Observations 152 152 143 143 143 143 143 143R2 0.28 0.41 0.31 0.42 0.20 0.43 0.04 0.13
OLS estimates, standard errors clustered at the market group level. In columns (1) and (2), observations in-clude all (normalized) prices from Correlated excluding outliers for which the (absolute) normalized price orthe naïveté of the marginal trader are larger than three. The results are robust to including these outliers whenemploying median regressions. See Appendix F.4 for a definition of the marginal traders. Additional controls in(1)-(2) include fixed effects for each true state and the average age, average monthly disposable income, and av-erage final high school grade as well as the proportion of females in a given market group. In columns (3) - (8),observations include median asset holdings / profits of all subjects in the Correlated treatment. Overpricing (un-derpricing) is defined as rounds in which correlation neglect predicts overoptimism (-pessimism). Median profitsare computed as median normalized profit across all rounds, where for each trader and for each round a nor-
malized profit is defined as π= 10×Money holdings + value of assets heldMonetary value of endowment , where for sellers (buyers) the value
of the endowment consists of the value of the initially owned assets (the budget). The individual-level mediancorrelation neglect parameter in (3) and (4) [(5) and (6)] is computed as median χ of the rounds in which cor-relation neglect predicts overpessimism [overoptimism]. In (7) and (8), the median correlation neglect parame-ter equals the median χ across all rounds. Additional controls in (3) - (8) include a buyer dummy, age, gender,monthly disposable income, marital status dummies, and high school GPA. ∗ p < 0.10, ∗∗ p < 0.05, ∗∗∗ p < 0.01
27

F.4 Empirical Identification of Marginal Traders
To compute the naïveté of the marginal traders for a given market group and trading
round, we proceed as follows. First, we construct supply and demand curves from the
beliefs subjects stated before trading started by sorting the beliefs of buyers in ascend-
ing and those of sellers in descending order, which gives rise to four pairs of beliefs.
We then identify the lowest belief of a buyer which is still above the belief of the cor-
responding seller, i.e., we identify the buyer who is located on the demand curve right
above the supply curve. We then compute the average naïveté of this buyer and the
seller who is located beneath him on the supply curve, to approximate the competitive
equilibrium price, and use it for further analysis as detailed above.
Robustness of Treatment Difference in Market Prices
This section shows that the strong treatment difference in price levels is not driven by
our definition of the market price. Table 19 provides p-values of Wilcoxon ranksum
tests for the equality of market prices across treatments for two alternative definitions
of the market price. The exposition is akin to Table 17, but now additionally defines the
market price to be either the median or mean trading price (rather than the price of
the last concluded trade).
Table 19: P-values for equality of market prices by trading round for alternative price definitions
True Market Price ≡State Last trading price Median trading price Average trading price
10 0.0093 0.0053 0.0075
88 0.0338 0.0200 0.0665
250 0.0113 0.0107 0.0138
732 0.0001 0.0000 0.0000
1,000 0.0723 0.1108 0.1681
4,698 0.0085 0.0025 0.0050
7,338 0.6087 0.7042 0.5092
10,000 0.0534 0.0045 0.0014
23,112 0.0007 0.0061 0.0515
46,422 0.0015 0.0003 0.0095
This table provides p-values of Wilcoxon ranksum tests of the equality of market prices acrosstreatments. For this purpose, for each market group and trading round, the market price is de-fined as (i) last trading price, (ii) median price, or (iii) average price.
F.5 Additional Illustrations of Treatment Difference in Prices
This section provides alternative ways to describe the treatment difference in themarket
treatments. For this purpose, analogously to the belief normalization, we first normal-
28

Table 20: Beliefs drive treatment difference in market prices
Dependent variable:Normalized market price(1) (2) (3)
1 if correlated 0.32∗∗∗ -0.052 -0.051(0.08) (0.08) (0.10)
Group-level median belief (χ) 0.75∗∗∗ 0.70∗∗∗
(0.08) (0.12)
Constant 0.19∗∗∗ 0.040 0.75(0.04) (0.04) (0.63)
Additional controls No No Yes
Observations 330 330 330R2 0.05 0.33 0.39
OLS estimates, standard errors clustered at market group. Observationsinclude all normalized prices from both market treatments excluding fourextreme outliers for which the normalized price satisfies |p j
i | > 10. Allresults are robust to including these observations when employing me-dian regressions. Additional controls include fixed effects for each truestate, average age, average monthly disposable income, average final highschool grade, and the proportion of females within a given group. ∗ p <0.10, ∗∗ p < 0.05, ∗∗∗ p < 0.01
ize the market price of each round and market group such that it equals the naïveté
parameter χ. We then pool the normalized market prices from all market groups, trad-
ing rounds, and both treatments and regress these prices on a treatment dummy. Col-
umn (1) of Table 20 shows that this treatment difference is highly significant and large
in magnitude. As columns (2) and (3) demonstrate, this treatment effect operates en-
tirely through beliefs. After conditioning on the beliefs participants stated before trad-
ing started, the treatment effect collapses to zero and becomes insignificant. These
results show that it is indeed subjects’ beliefs which cause the treatment difference in
market prices.
In order to get a visualization of the aggregate treatment difference, we next aggre-
gate the normalized market prices across rounds akin to our procedure in the individual
decision making treatments. Specifically, for each market group we use the median nor-
malized market price over the ten rounds to plot the distribution of market prices across
treatments.
Figure 14 provides kernel density estimates of these aggregated data. It reveals a
pronounced and statistically significant difference between the two treatment groups
(p-value< 0.0001,Wilcoxon ranksum test). Normalized prices in theUncorrelated treat-
ment are centered close to zero, confirming the standard result that double-auctions
tend to produce price levels close to fundamentals. Prices in the Correlated treatment
are centered around 0.6, i.e., prices systematically overshoot in the direction predicted
29
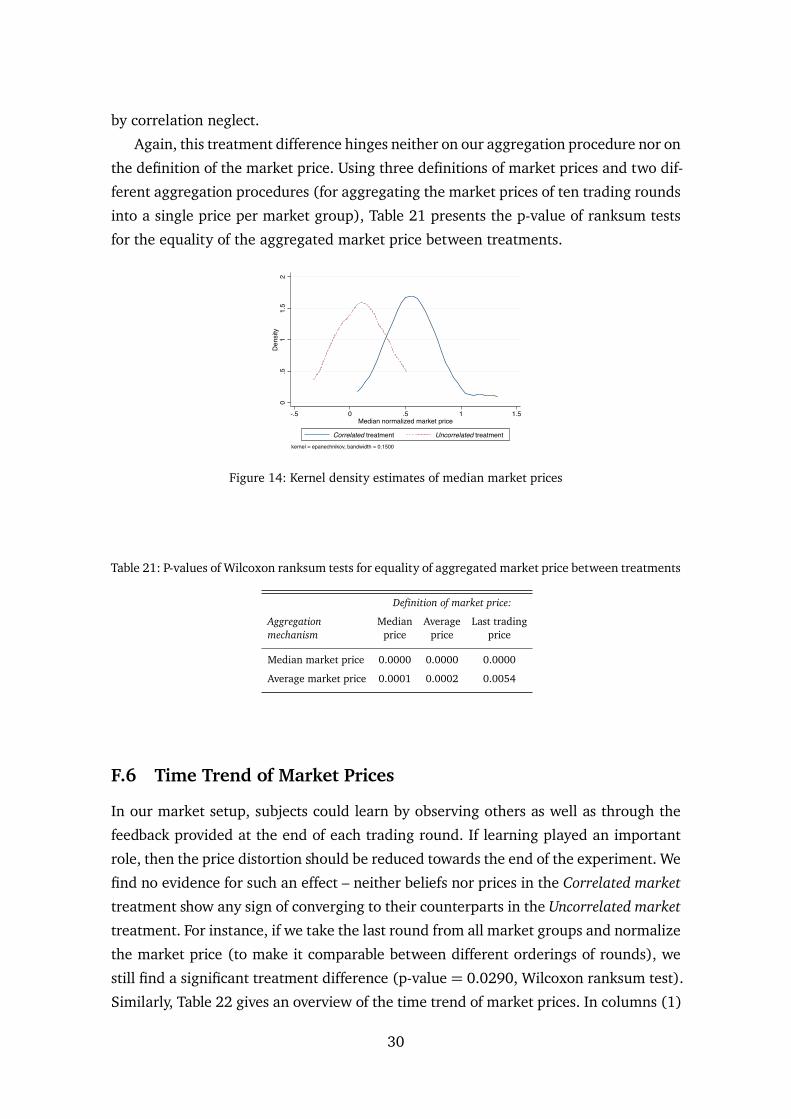
by correlation neglect.
Again, this treatment difference hinges neither on our aggregation procedure nor on
the definition of the market price. Using three definitions of market prices and two dif-
ferent aggregation procedures (for aggregating the market prices of ten trading rounds
into a single price per market group), Table 21 presents the p-value of ranksum tests
for the equality of the aggregated market price between treatments.
0.5
11.
52
Den
sity
-.5 0 .5 1 1.5Median normalized market price
Correlated treatment Uncorrelated treatmentkernel = epanechnikov, bandwidth = 0.1500
Figure 14: Kernel density estimates of median market prices
Table 21: P-values of Wilcoxon ranksum tests for equality of aggregated market price between treatments
Definition of market price:
Aggregation Median Average Last tradingmechanism price price price
Median market price 0.0000 0.0000 0.0000
Average market price 0.0001 0.0002 0.0054
F.6 Time Trend of Market Prices
In our market setup, subjects could learn by observing others as well as through the
feedback provided at the end of each trading round. If learning played an important
role, then the price distortion should be reduced towards the end of the experiment. We
find no evidence for such an effect – neither beliefs nor prices in the Correlated market
treatment show any sign of converging to their counterparts in the Uncorrelated market
treatment. For instance, if we take the last round from all market groups and normalize
the market price (to make it comparable between different orderings of rounds), we
still find a significant treatment difference (p-value = 0.0290, Wilcoxon ranksum test).
Similarly, Table 22 gives an overview of the time trend of market prices. In columns (1)
30

Table 22: Time trend of market prices in the Correlated market treatment
Dependent variable:Normalized Normalized market price minusmarket price median price in uncorrelated
(1) (2) (3) (4)
# of trading period -0.018 -0.0091 -0.024 -0.0069(0.03) (0.02) (0.03) (0.02)
Constant 0.71∗∗∗ 0.73∗∗∗ 0.57∗∗∗ 0.48∗∗
(0.19) (0.17) (0.16) (0.17)
True state FE No Yes No Yes
Observations 167 167 167 167R2 0.00 0.18 0.01 0.05
OLS regressions, standard errors (clustered at market group level) inparentheses. Observations include the market prices from all tradingrounds in the correlated market treatment excluding market prices whichsatisfy |p j
i |> 10. ∗ p < 0.10, ∗∗ p < 0.05, ∗∗∗ p < 0.01
and (2), we report the results of an OLS regression of all normalized market prices
in the Correlated market treatment on a time trend, which indicate that market prices
do not converge to rational levels.¹⁵ We also show that prices do not converge to their
counterparts in the Uncorrelated market treatment (columns (3)-(4)). To this end, we
take all normalized market prices and then subtract the normalized market price of
the median market group in that round in the Uncorrelated market treatment. Again,
there is no sign of convergence to the levels in the Uncorrelated treatment. In sum, these
results show that there is no learning across rounds.
F.7 Time Trend of Beliefs in Market Experiments
Table F.7 presents the results of OLS regressions of subjects’ (normalized) beliefs in
the Correlated market treatment on a linear time trend. If the market interaction in-
duces naïve subjects to learn, we should observe a negative coefficient. We do not find
any significant effects, regardless of the specification we employ. In column (1), we
include beliefs which satisfy |b ji | ≤ 10, i.e., we only exclude very extreme outliers. In
columns (2)-(5), we use beliefs which satisfy b ji > −1 and b j
i < 2, i.e., we focus on
beliefs in a reasonable range, which likely don’t reflect typing errors. Regardless of the
sample, the coefficient on the time trend is small and insignificant, both with and with-
out fixed effects for a particular market group, individual subjects, and particular true
states.
¹⁵Similar results obtain if we run the corresponding regressions using subjects’ beliefs as dependentvariable.
31

Table 23: Time trend of normalized beliefs in the Correlated market treatment
Dependent variable:Normalized belief
(1) (2) (3) (4) (5)
# of trading period 0.015 -0.0087 -0.0088 -0.0094 -0.0016(0.01) (0.01) (0.01) (0.01) (0.01)
Constant 0.64∗∗∗ 0.67∗∗∗ 0.80∗∗∗ 1.24∗∗∗ 1.34∗∗∗
(0.08) (0.07) (0.06) (0.06) (0.09)
Market FE No No Yes No No
Subject FE No No No Yes Yes
True state FE No No No No Yes
Observations 1404 1241 1241 1241 1241R2 0.00 0.00 0.04 0.27 0.35
OLS regressions, standard errors (clustered at market group level) inparentheses. Observations include the market prices from all tradingrounds in the correlated market treatment. In column (1), we only ex-cluce beliefs which satisfy |b j
i |> 10. In columns (2)-(5), we use beliefswhich satisfy b j
i > −1 and b ji < 2. ∗ p < 0.10, ∗∗ p < 0.05, ∗∗∗ p < 0.01
F.8 Why Does the Market not Reduce the Bias?
This section discusses potential reasons, why our double-auction market environment
did not eliminate correlation neglect. In short, three reasons in particular could play
a role. First, given that we implemented a common value environment with identical
information across subjects (but potentially heterogeneous processing thereof), a fea-
ture of our market is that it allows subjects to learn from the behavior of (potentially
more rational) others. For instance, suppose a seller in the correlated environment ne-
glects the correlation and arrives at a belief that the value of the asset is, say, 10. If
this seller observes all buyers offering to buy the asset at, say, 20, this could induce him
to reconsider his valuation of the asset. For instance, that seller might conjecture that
he misinterpreted his signals. In this sense, the existence of even one rational type in
a given market group could in principle debias all other subjects. Furthermore, even
if observing others’ trading behavior does not debias subjects, it might at least reduce
their confidence in their valuation of the good. Both of these channels should atten-
uate the impact of correlation neglect on market outcomes. The fact that we do not
find evidence for this is consistent with the idea that people might neglect that the
trading behavior of others carries informational content, perhaps akin to the idea of
“cursedness” (Eyster and Rabin, 2005; Eyster et al., 2013) with the twist that there is
no heterogeneous private information in our setup, but rather heterogeneous process-
32

ing of the same signals.¹⁶
Second, the rational types might not be able to bring prices to fundamental values
due to institutional features of our trading environment. In particular, our setup did
not allow the same subject to both buy and sell. Each subject’s influence on the market
price was hence restricted to selling four assets as a seller, and buying a small number of
assets as a buyer. In the data, an average of 3.8 subjects (out of 8) per market group had
a median naïveté parameter of χ ∈ [−.25; .25], implying that these rational subjects
would have needed to trade excessively to bring prices to fundamentals by themselves.
Third, even if some subjects hold correct beliefs and could in principle bring prices
to fundamentals, they might not be willing to do so. For instance, if the rational types
are slightly risk averse and have some subjective uncertainty over the true state (as
they should), they could attempt to diversify, i.e., hold a mix of both assets and cash.
Indeed, in the data, we see strong evidence of this. For instance, in trading periods in
which correlation neglect predicts underpricing, those subjects with a (median) naïveté
parameter of χ ∈ [−.25; .25] only held a total of 7.7 (out of a total of 16) assets on av-
erage, i.e., the rational subjects do not buy all assets when prices are too low, i.e., when
assets are a bargain. The fact that rational agents seemed to limit their trading activity
suggests that these types were cautious in fully exploiting their superior knowledge
about the true value of the asset.
¹⁶Alternatively, our empirical pattern is consistent with the idea that people are overconfident abouttheir ability to process correlations.
33

F.9 Endowments and Exchange Rates in Market Treatments
Table 24: Overview of the ten trading rounds
True state Budget buyer (points) Exchange rate points / euros Fixed costs buyer
10 40 2.67 4
88 450 30 45
250 1,500 100 150
732 3,000 200 300
1,000 5,000 333.33 500
4,698 25,000 1,666.67 2,500
7,338 25,000 1666.67 2,500
10,000 50,000 3,333.33 5,000
23,112 90,000 6,000 9,000
46,422 200,000 13,333.33 20,000
Sellers did not incur any fixed costs. Buyers’ fixed costs amounted to 10 % of the respetivebudget. The relationship between budget and true state was non-constant across rounds. Theexchange rate is computed as budget / 15.
G Correlation Neglect in Newspaper Articles
G.1 Overview
In our main experiments, we deliberately designed an abstract decision environment
which allowed tight control over (subjects’ knowledge of) the data-generating process.
To show the robustness of our findings, we nowmake use of a naturally occurring corre-
lation in an informational context with which many subjects are familiar, i.e., extracting
information from newspaper articles.
In the experiment, a new set of subjects had to estimate the growth of the German
economy in 2012. For this purpose, subjects were provided with (shortened) real news-
paper articles discussing and summarizing growth forecasts and were asked to give an
incentivized estimate. Employing the same identification strategy as in our main ex-
periment, we again study two main treatments, one in which information is correlated
and one in which it is not. In the correlated treatment, subjects received two articles.
The first article discussed a joint forecast from April 2012, which is determined in a
cooperation of several German research institutes, thus aggregating information from
the participating institutions. It predicted that the German economy would grow at a
rate of 0.9 % in 2012. The other article discussed a forecast of one particular institute
from March 2012 that predicted a growth rate of 1.3 %. Importantly for our purposes,
34

this institute also participated in the joint forecast. Consequently, the information from
that institute is already incorporated in the joint forecast, implying that the two arti-
cles are correlated. This correlation was in principle known (or easy to detect), since
the article reporting the joint forecast clearly stated all participating institutes. In the
control condition, we merely supplied the joint forecast. Since the individual forecast
is incorporated in the joint one, the joint forecast is a sufficient statistic of mean be-
liefs, implying that this treatment removes the correlation, yet keeps the informational
content identical.
The results show that even in this rather naturalistic setting subjects exhibit a sub-
stantial degree of correlation neglect. In the control condition, the median estimate
was 0.82 %, while it was 0.28 percentage points higher in the correlated treatment
(p-value < 0.0001, Wilcoxon ranksum test). This finding emphasizes the robustness of
correlation neglect with respect to the familiarity of the belief formation task and sug-
gests that people exhibit the bias even in natural informational environments - while
subjects may not frequently be required to predict GDP growth as such, the type of
information provided in these experiments is typical for everyday information process-
ing.
01
23
4D
ensi
ty
.5 1 1.5 2Belief
Correlated treatment Uncorrelated treatmentkernel = epanechnikov, bandwidth = 0.0400
Figure 15: Kernel density estimates of beliefs in the two main newspaper treatments
G.2 Procedural Details
Overall, 151 subjects participated in the baseline experiments described above. 59 sub-
jects took part in additional treatments (see below). Sessions were conducted using pa-
per and pencil in the BonnEconLab at the end of different and unrelated experiments.
Treatments were randomized within session. In the conditions involving two articles,
the order of the articles was randomized. The study took five minutes on average. At
the end of each session, one subject was randomly selected for payment. He was asked
to write his address on an envelope and was reminded that his earnings will be sent to
35

him as soon as the official growth figures are available. Earnings were 10 euros if the
estimate turned out to be correct. For every 0.1 percentage point deviation, 1 euro was
deducted. Negative earnings were not possible. The randomly selected subjects earned
7.30 euros on average.
G.3 Potential Concerns and Additional Treatments
There are five potential concerns with respect to our design. First, one could argue that
the difference between the joint forecast of 0.9 % and the forecast of 1.3 % is infor-
mative because it indicates a high variance of forecasts. This variance in turn might
allow inference about the signal precision of the participating institutes. Consequently,
subjects in the correlated condition could put lower weight on the forecasts (relative
to their own prior) when determining their estimate. Notice, however, that even if sub-
jects actually went through this kind of inference, this would not explain our treatment
difference. The estimates in our control condition reveal that subjects’ priors were on
average actually slightly below the joint forecast of 0.9 %. Thus, lower weight on the
joint forecast in the updating process would not lead to estimates that are closer to
1.3 %.
A further potential concern might be that information from the second article is
informative if subjects think that the forecast of the institute that is discussed in this ar-
ticle is not appropriately incorporated in the joint forecast. This does not seem plausible.
To further address this issue, we asked a subset of subjects (N = 56) at the end of the
experiment if they had the suspicion that this is actually the case. Only seven subjects
(12.5 %) indicated such a concern. Our findings remain unchanged if we only consider
those 23 subjects which explicitly stated that this was not a concern (p-value = 0.0209,
Wilcoxon ranksum test).¹⁷
Third, subjects could interpret the mere presentation of the article discussing the
forecast of 1.3 % as an indication that the article has to be of informational value. We
addressed this concern by introducing an additional treatment (N = 59), which is iden-
tical to the correlated treatment except that it contains a second incentivized question
which relates to labor market information provided in the article discussing the 1.3 %
forecast.¹⁸ Thus, there was a natural reason for the presence of the second article, which
was unrelated to the question about GDP growth. Results suggest that this type of effect
¹⁷The precise wording of the question is: “Do you think that one of the research institutes (e.g. theIWH) was not adequately taken into account in the preparation of the joint forecast? Yes / No / Don’tknow”
¹⁸The precise wording of this second incentivized question is: “Please also think about whether theInstitute for Economic Research Halle (IWH) predicts a positive development of the labor market. Belowyou can indicate your answer by ticking “Yes” or “No”. You get 7 euros for a correct answer and 0 eurosotherwise.”
36

does not drive our results. Estimates in this treatment are almost identical to those in
the standard correlated condition and significantly different from those in the control
condition (p-value < 0.0001, Wilcoxon ranksum test).
Fourth, the two forecasts were published one month apart from each other. This is
unproblematic since the joint forecast was released at the later date. Thus, the timing
as such provided no reason for subjects to place any weight on the 1.3 % forecast.
Fifth, it is possible that many subjects are not used to extracting information from
newspapers, thus contradicting the purpose of our study as reflecting a more natural
belief formation context. In order to ensure that this is not the case, we asked subjects
at the end of the experiment whether they regularly read the newspaper, and whether
they are interested in economics or economic questions. 57 percent of subjects stated
that they “regularly” or “very regularly” read the newspaper. Also, 53 percent stated
that they were “interested” or “very interested” in economic questions. Our treatment
difference remains unchanged when we only consider subjects who regularly read the
newspaper and who are interested in economic topics (N = 74), p-value < 0.0001,
Wilcoxon ranksum test.
G.4 Newspaper Articles and Instructions
G.4.1 Paper-Based Instructions
Please read the following newspaper article(s). Please then think about how much the
German economy will grow in 2012. Below you can indicate your estimate. Your pay-
ment will depend on how close your estimate is to the actual growth of the German
economy. Maximum earnings are 10 euros - for every 0.1 percentage deviation, 1 euro
will be deducted (negative earnings are not possible).
Your estimate: The growth of the German economy in 2012 will be (in percent): ...
G.4.2 Newspaper Articles (translated into English)
Manager-Magazin, 14.03.2012
IWH increases growth forecast
The German economy seems to be gaining speed. According to the Institute for Economic
Research Halle, the short period of economic weakness is over. Thus, the researchers increase
their growth forecast for Germany significantly.
OnWednesday, the institute in Halle announced that it expects the German economy
to grow by 1.3 % this year. According to the IWH experts, the risks relating to the debt
and trust crisis in Europe have been slightly reduced. Both the world economy and
the German economy are said to have started significantly better into 2012 than was
37

projected in autumn 2011. According to the IWH, the positive economic development
will also affect the labor market.
Welt Online, 19.04.2012
Leading economic research institutes say German economy is in upswing
According to leading economic research institutes, the German economy is in up-
swing. In their joint “Spring 2012” forecast, published on Thursday, the institutes fore-
cast a growth of the German economy of 0.9 %.
According to the researchers, the biggest “down-side risk” for the future remains
to be the debt and trust crisis in the Euro area. While the remarkable measures of the
European Central Bank relieved stress in the banking system, they are not more than
a gain of time.
The forecast is prepared by the Ifo Institute in Munich, the ETH Zurich, the ZEW
Mannheim, the Institute for Economic Research Halle, Kiel Economics, IHS Vienna, and
the RWI Institute in Essen.
38

References
Camerer, Colin F., “Do Biases in Probability Judgment Matter in Markets? Experimen-
tal Evidence,” American Economic Review, 1987, 77 (5), 981–997.
DellaVigna, Stefano, “Psychology and Economics: Evidence from the Field,” Journal of
Economic Literature, 2009, 47 (2), 315–372.
Eyster, Erik and Matthew Rabin, “Cursed Equilibrium,” Econometrica, 2005, 73 (5),
1623–1672.
, , and Dimitri Vayanos, “Financial Markets Where Traders Neglect the Informa-
tional Content of Prices,” Working Paper, 2013.
Fiedler, Klaus and Peter Juslin, Information Sampling and Adaptive Cognition, Cam-
bridge University Press, 2006.
Ganguly, Ananda R., John H. Kagel, and Donald V. Moser, “Do Asset Market Prices
Reflect Traders’ Judgment Biases?,” Journal of Risk and Uncertainty, 2000, 20 (3),
219–245.
Hossain, Tanjim and Ryo Okui, “The Binarized Scoring Rule,” Review of Economic
Studies, 2013, 80 (3), 984–1001.
Kluger, Brian D. and Steve B. Wyatt, “Are Judgment Errors Reflected in Market Prices
and Allocations? Experimental Evidence Based on the Monty Hall Problem,” Journal
of Finance, 2004, 59 (3), 969–998.
Massey, Cade and George Wu, “Detecting Regime Shifts: The Causes of Under- and
Overreaction,” Management Science, 2005, 51 (6), 932–947.
39