On uncertainty, decision values and innovation
11
On uncertainty, decision values and innovation Sebastian Thöns 1,2 , Arifian Agusta Irman 3 , Maria Pina Limongelli 4 1 Faculty of Engineering LTH, Lund University, Lund, Sweden 2 German Federal Institute for Materials Research and Testing, Berlin, Germany 3 Rambøll, Copenhagen, Denmark 4 Politechnico di Milano, Milano, Italy [email protected] Abstract. This paper contains a description, an alignment and a joint approach for technology readiness development with a three phases support of decision value analyses. The three phases are separated into the decision value forecasting, value decision value analysis and the technology value quantification supporting the technological concept formulation and experimental testing, the prototype de- velopment and the technology qualification and operation. Decision value fore- casting allows technology development guidance by technology performance re- quirements and the value creation even before the technology development is started. This approach is exemplified with load, damage and resistance infor- mation-based integrity management of a structure and the ranking of the different strategies. The results can be used to guide a technology screening matching per- formance characteristics in terms of precision, cost and employability. Moreover, the first estimate of value creation of the technology for stakeholders, business models and market evaluation is provided. Keywords: Innovation, Technology Readiness, Decision Analysis. 1 Introduction Decision theory has been introduced from economic sciences to built environment en- gineering by Benjamin and Cornell (1970) based on the works of Raiffa and Schlaifer (1961). In recent years, many studies have been published on topic of value quantifica- tion of structural health information (SHI) for built environment systems also in con- junction with the COST Action TU1402 (www.cost-tu1402.eu). The SHI value quantification in the frame of the COST Action TU1402 has resulted in the scientific evidence of a high SHI value for built environment systems and its boundaries, an enhanced accessibility of the value of information analyses and guide- lines for scientific utilisation, engineering and infrastructure owner usage. A scientific potential of guiding the technology development with a SHI value quantification has been identified. Technology readiness has been introduced by the USA National Aeronautics and Space Administration NASA (Sadin, Povinelli et al. (1989)) and has since penetrated technological management in various organisation such as e.g. military organisations
-
Upload
khangminh22 -
Category
Documents
-
view
1 -
download
0
Transcript of On uncertainty, decision values and innovation
On uncertainty, decision values and innovation
Sebastian Thöns1,2, Arifian Agusta Irman3, Maria Pina Limongelli4
1 Faculty of Engineering LTH, Lund University, Lund, Sweden 2 German Federal Institute for Materials Research and Testing, Berlin, Germany
3 Rambøll, Copenhagen, Denmark 4Politechnico di Milano, Milano, Italy
Abstract. This paper contains a description, an alignment and a joint approach
for technology readiness development with a three phases support of decision
value analyses. The three phases are separated into the decision value forecasting,
value decision value analysis and the technology value quantification supporting
the technological concept formulation and experimental testing, the prototype de-
velopment and the technology qualification and operation. Decision value fore-
casting allows technology development guidance by technology performance re-
quirements and the value creation even before the technology development is
started. This approach is exemplified with load, damage and resistance infor-
mation-based integrity management of a structure and the ranking of the different
strategies. The results can be used to guide a technology screening matching per-
formance characteristics in terms of precision, cost and employability. Moreover,
the first estimate of value creation of the technology for stakeholders, business
models and market evaluation is provided.
Keywords: Innovation, Technology Readiness, Decision Analysis.
1 Introduction
Decision theory has been introduced from economic sciences to built environment en-
gineering by Benjamin and Cornell (1970) based on the works of Raiffa and Schlaifer
(1961). In recent years, many studies have been published on topic of value quantifica-
tion of structural health information (SHI) for built environment systems also in con-
junction with the COST Action TU1402 (www.cost-tu1402.eu).
The SHI value quantification in the frame of the COST Action TU1402 has resulted
in the scientific evidence of a high SHI value for built environment systems and its
boundaries, an enhanced accessibility of the value of information analyses and guide-
lines for scientific utilisation, engineering and infrastructure owner usage. A scientific
potential of guiding the technology development with a SHI value quantification has
been identified.
Technology readiness has been introduced by the USA National Aeronautics and
Space Administration NASA (Sadin, Povinelli et al. (1989)) and has since penetrated
technological management in various organisation such as e.g. military organisations

2
and the European Space Agency ESA. Technology readiness levels have been defined
for the European research and innovation program Horizon 2020 since 2009 (see e.g.
Héder (2017)).
The technology development is subdivided in a stepwise technology readiness pro-
cess starting with the observation, concept formulation and experimental testing and
(Technology Readiness Levels - TRLs 1 to 4) followed by technology demonstration
and prototype development (TRLs 5 to 7) and the technology qualification and opera-
tion (TRL 8 and 9), see e.g. Héder (2017) and Table 1.
Table 1: European Technology Readiness Levels according to Héder (2017)
TRL 1 Basic principles observed
TRL 2 Technology concept formulated
TRL 3 Experimental proof of concept
TRL 4 Technology validated in lab
TRL 5 Technology validated in relevant environment
TRL 6 Technology demonstrated in relevant environment
TRL 7 System prototype demonstration in operational environment
TRL 8 System complete and qualified
TRL 9 Actual system proven in operational environment
A technology development has the potential for innovation and innovation scaling
when the technology performs and creates value for market stakeholders as a premise
for the development of a new market according to the Disruptive Innovation Theory
(e.g. Bower and Christensen (1995) and Christensen (1997)). However, the TRL devel-
opment accounts solely for technological steps and not for technology value quantifi-
cation.
This paper focuses on the utilisation of decision theory - originating from the field
of economic management science – along the technology development for information
acquirement system innovation guidance. The paper starts out with summarising the
decision analytical formulation for built environment systems and how a value quanti-
fication is performed (Section 2). An approach to align the technology development
with different types of decision analytical approach is developed in Section 3. The first
step of this approach namely decision value forecasting is described and exemplified in
Section 4. The paper closes with a summary and conclusions highlighting the potential
for innovation guidance and pointing to further research.
2 Decision analytical formulation
Decision analyses encompass the modelling of built environment systems, information
about the system performance and actions to modify the system states or system per-
formance.
System models are used to assess and predict the behaviour of real-world systems
subjected to exposures and disturbances, which influence the component and the sys-
tem states. Information are based on observations of the physical world from which
3
data can be extracted, indicators for evaluating the system states and performance can
be derived and information to adapt and update the system states and system perfor-
mance can be obtained. Information in turn facilitates closer to reality predictions of
the system performance and implies that the adaptation with information is solely on
the side of the models and will not affect the real-word system performance.
An action - as a physical system change - influences the physical world system per-
formance and the modelled system performance. In this sense, actions can be used for
enforcing a coherence of the modelled system performance and the physical world sys-
tem performance. For planning of actions, an enhanced system knowledge by adaption
with information maybe used (e.g. Thöns (2018a)).
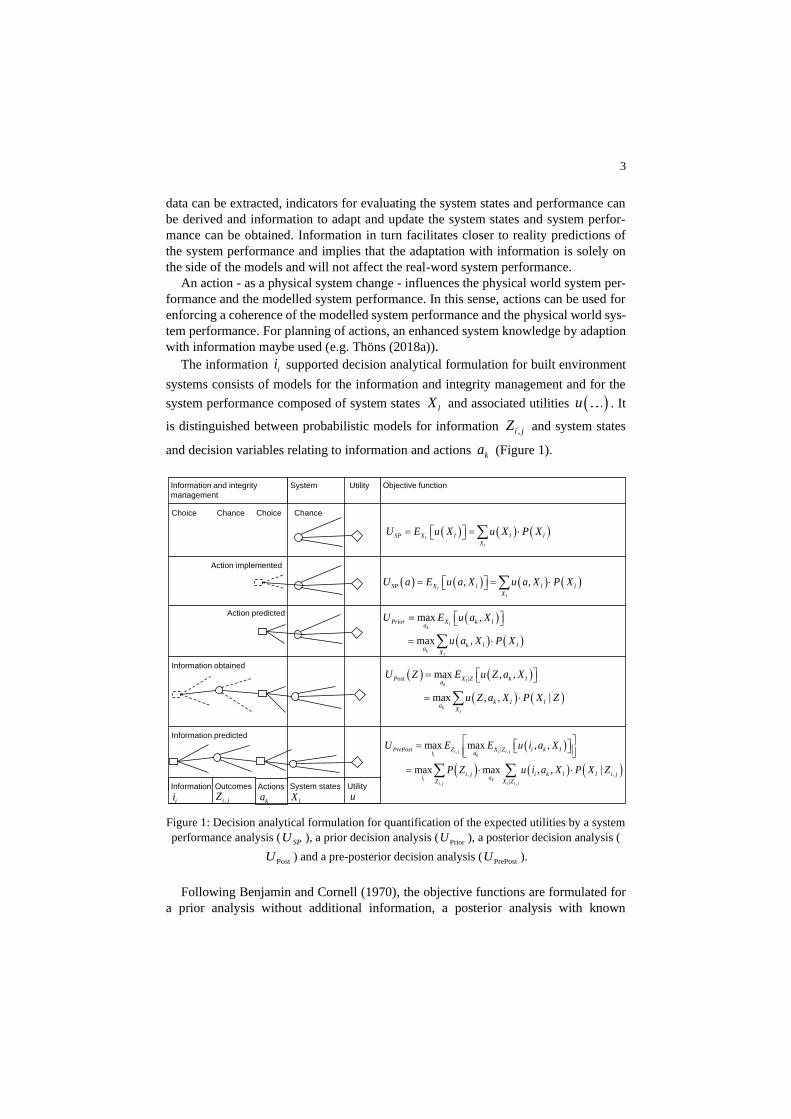
The information ii supported decision analytical formulation for built environment
systems consists of models for the information and integrity management and for the
system performance composed of system states lX and associated utilities ( )u . It
is distinguished between probabilistic models for information i , jZ and system states
and decision variables relating to information and actions ka (Figure 1).
Figure 1: Decision analytical formulation for quantification of the expected utilities by a system
performance analysis (SPU ), a prior decision analysis (
PriorU ), a posterior decision analysis (
PostU ) and a pre-posterior decision analysis (PrePostU ).
Following Benjamin and Cornell (1970), the objective functions are formulated for
a prior analysis without additional information, a posterior analysis with known
Information
Information and integrity
management
System Utility
Outcomes System statesActions
ii ,i jZka lX
Utility
u
( )
( ) ( )
max ,
max ,
lk
kl
Prior X k la
k l la
X
U E u a X
u a X P X
=
=
( ) ( )
( ) ( )
|max , ,
max , , |
lk
kl
Post X Z k la
k l la
X
U Z E u Z a X
u Z a X P X Z
=
=
( )
( ) ( ) ( )
, ,
, ,
|
, ,
|
max max , ,
max max , , |
i j l i ji k
i ki j l i j
PrePost Z X Z i k li a
i j i k l l i ji a
Z X Z
U E E u i a X
P Z u i a X P X Z
=
=
Objective function
Information obtained
Information predicted
Choice Chance ChanceChoice
( ) ( ) ( ) ( ), ,l
l
SP X l l l
X
U a E u a X u a X P X= =
( ) ( ) ( )l
l
SP X l l l
X
U E u X u X P X= =
Action implemented
Action predicted
4
additional information and a pre-posterior analysis with predicted information. In a
prior and posterior decision analysis, the actions constitute the decision variables max-
imizing the prior or posterior expected utilities ( priorU and PostU , respectively) based
on the expected utility theorem, see e.g. Von Neumann and Morgenstern (1947). A
pre-posterior decision analysis facilitates to optimise the expected value of the utility
also by the choice of the information acquirement strategy (with the index i ).
The expected value of the utility does not constitute perse a value. Only in relation
to a threshold, a value can be quantified as described in Raiffa and Schlaifer (1961) by
interrelating decision theory to economical concepts. Following the original formula-
tion, the value of information has been quantified as the difference of the expected util-
ities stemming from a decision analysis without and with information. This original
formulation is extended here with varying the base and enhancement scenarios for more
comprehensiveness (Thöns and Kapoor (2019)).
The value of a predicted action can be quantified by subtracting the expected system
performance utility without or with an implemented action, SPU and ( )SPU a , respec-
tively, from an expected system performance utility with a predicted action PriorU , see
Equ. (1). When the optimal action (sets) 1a and
2a are not identical, then the action
(set) value in relation to another action (set) can be quantified as the difference between
two prior decision analyses, ( )1Prior kU a and ( )
2Prior kU a , see Equ. (2). The value contains
the action costs and consequences.
( )Prior
PriorSP k SPV a U U= − and ( ) ( )Prior
PriorSP k SPV a ,a U U a= −
(1)
( ) ( ) ( )1
1 2 1 22
Prior,
Prior, Prior Prior
k
k
a
a k k k kV a ,a U a U a= −
(2)
The predicted value of an information can be quantified in analogy to the action
value as the expected utility difference with an enhancement scenario containing pre-
dicted, i.e. pre-posterior, information and a base scenario excluding this predicted in-
formation. The base scenario can be of the types of a prior, a posterior and a pre-poste-
rior decision analysis. For the latter the information acquirement strategy sets 1i and
2i
are exclusive. The value contains the information costs.
( )PrePost
Prior PrePost PrioriV i U U= − and ( ) ( )PrePost
PrePostPost i PostV i ,Z U U Z= −
(3)
( ) ( ) ( )1
2
PrePost,
1 2 PrePost 1 PrePost 2PrePost,
i
iV i ,i U i U i= −
(4)
The value of information and actions can be quantified by using the base scenarios
of the action value quantification and the enhancements scenarios of the information
value quantification. Both, the information costs and the action costs and consequences
are included in the value quantification.
( )PrePost
PrePostSP i k SPV i ,a U U= − and ( ) ( )PrePost
PrePostSP i SPV i ,a U U a= −
(5)
( ) ( ) ( )1 2 2 1
PrePost,1
PrePost,2 1 2 PrePost 2 Prior 1k k k kV i ,i ,a ,a U i ,a U i ,a= −
(6)
5
The decision value can be divided with the expected utility of the base scenario re-
sulting in a normalised decision value V .
3 Decision value and technology readiness
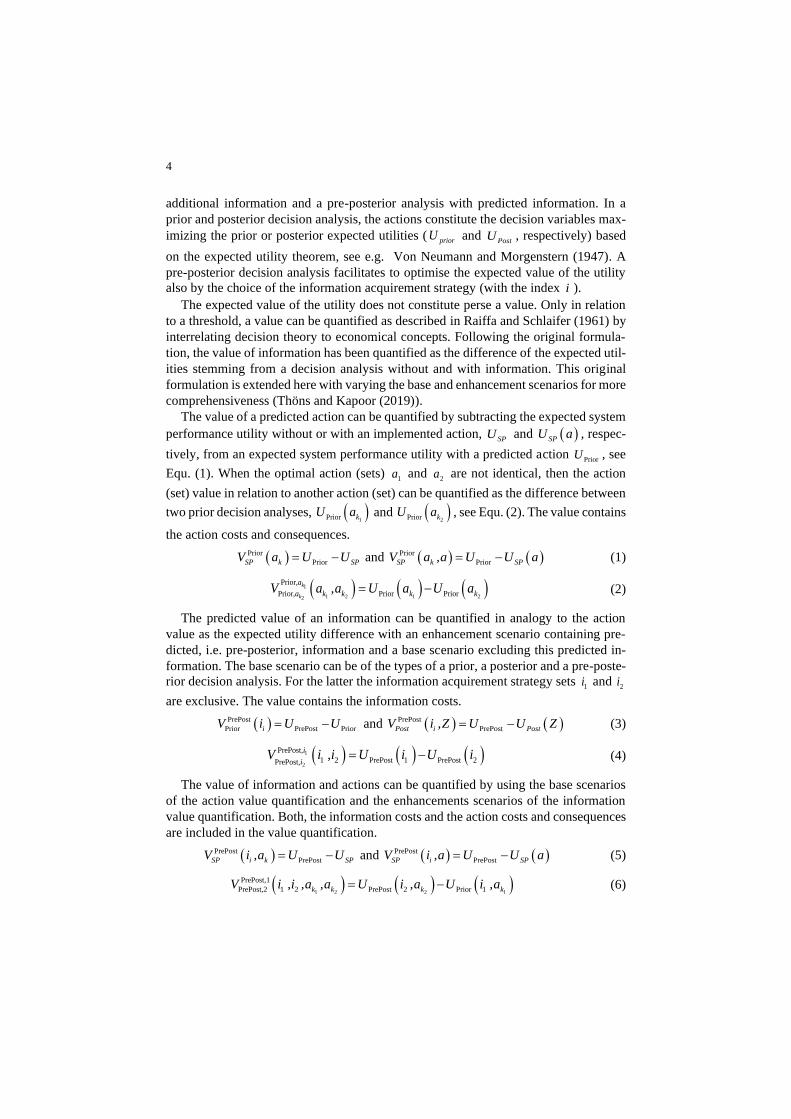
Three types of decision value analyses are distinguished namely (1) value forecasting,
(2) value analysis and (3) technology value quantification, which are temporally aligned
with the technology development phases (Figure 2). The decision value forecasting
analysis is performed solely with a probabilistic built environment system performance
analysis and the consideration of a base scenario constituting the conventional and
known technology. The information and action modelling exploits characteristics of the
built environment system performance model.
The decision value analysis is performed with a probabilistic and experimentally
verified technology performance for (a) the quantification of the current decision value
and (b) potentials for decision value optimisation and (c) boundaries for optimality such
as e.g. decision rules.
The technology value quantification constitutes a decision value analysis in the op-
erational environment and with consideration of technology production boundaries. For
the stages of a decision value analysis and the technology value quantification there are
many studies such as e.g. Thöns (2018b), Long, Döhler et al. (2020) and Thöns and
Stewart (2020).
In relation to the TRLs 1 and 2, the decision value forecasting phase is temporally
located before the technology development starts. With a base scenario and the utility
scenario modelling as well as the identification of technology performance require-
ments, a basic principle and conceptual technology screening can be performed. With
experimental proof and validation, the technology performance parameters (at TRLs 3
and 4) can be validated against the performance requirements for the desired decision
value.
Figure 2: Decision value analyses and technology readiness
DVA Type
Value forecasting▪ Utility scenario identification and modelling▪ Establishment of a base scenario incorporating
conventional technology▪ Identification of technology performance
requirements
Value analysis▪ Probabilistic technology modelling▪ Identification of boundaries and optimal
technology performance parameters
Technology value quantification▪ Optimisation for technology value in operational
environment▪ Accounting for operational boundaries
Technology and research
screening
Technology readiness development
TRL 1 – Basic principles observedTRL 2 – Technology concept formulated
TRL 3 – Experimental proof of conceptTRL 4 – Technology validated in lab
TRL 5 – Technology validated in relevant environmentTRL 6 – Technology demonstrated in relevant environment
TRL 7 – System prototype demonstration in operational environmentTRL 8 – System complete and qualifiedTRL 9 – Actual system proven in operational environment
Performance parameter
optimisation
Proof and of validation of
performance requirements
Determination of technology
performance parameters
Technology employment
optimisation

6
Further experimental testing in a relevant environment (TRLs 5 and 6) will improve
the performance parameter optimisation and development of probabilistic technology
performance models to be integrated in a decision value analysis. The decision value
analysis will reveal conditions and potentials for utility gains, which can be used as an
input for the further technology development. A technology value quantification is per-
formed to fully represent the technology performance in an operational environment.
The technology value quantification can be performed with different base scenarios
constituting different conventional technology approaches.
4 Decision value forecasting
The decision value forecasting approach described in the previous Section is now in-
troduced. For this purpose, a decision scenario is formulated consisting of a built envi-
ronment system performance model for which information acquirement technology is
to be developed facilitating an efficient information and integrity management.
The information value forecasting is built upon a built environment system perfor-
mance model distinguishing the complementary intact (1X S= ) and failure state (
2X F= ) with the limit state function (7), Fg . The resistance R , the damage D (with
its capacity transformation function Dt ) and the loading S are based on models, for
which the precision is known with the respective model uncertainties M . The limit
state equation is representative for a non-redundant built environment system subjected
to a dominating failure mode under deterioration (JCSS (2001-2015)).
( )1 1 0F R D D SX S : g M R t M D M S= = − − , 2 0FX F : g= (7)
The consequences of the intact and failure state are modelled to calculate the ex-
pected value of the utility with a system performance (SP) analysis.
Information in its fundamental meaning is about the knowledge of system states (see
Raiffa and Schlaifer (1961)). Progressing this fundamental concept, the limit state
model as introduced with Equ. (7) and the fact that information can be forecasted with
the help of realisations of the model uncertainties is applied (see e.g. Thöns (2018b)).
By introducing model uncertainty realisation thresholds , indication events can be
discretised (see Equ. (8) with one threshold and two complementary indication events
for use in conjunction with Equ. (7)). The thresholds can be defined and/or optimised
for system performance in relation to availability, failure and/or utility probabilities
(see Agusta (2020)).
( ) ( ) ( ) ( )1 1 2 2i , i , M i , i , MZ : P Z f m dm; Z : P Z f m dm
−
= = (8)
The pre-posterior and the posterior probabilities of the system states are calculated
with the truncated and normalised or just truncated model uncertainty distributions
tMM|f
−
and tM
M|f , respectively. Additionally, the random variable
UM can be multiplied
to the respective model uncertainty to account for a limited precision of the information.
7
Actions can be introduced as engineering actions and/or utility actions modifying
the system state probabilities and/or the system state utilities, respectively.
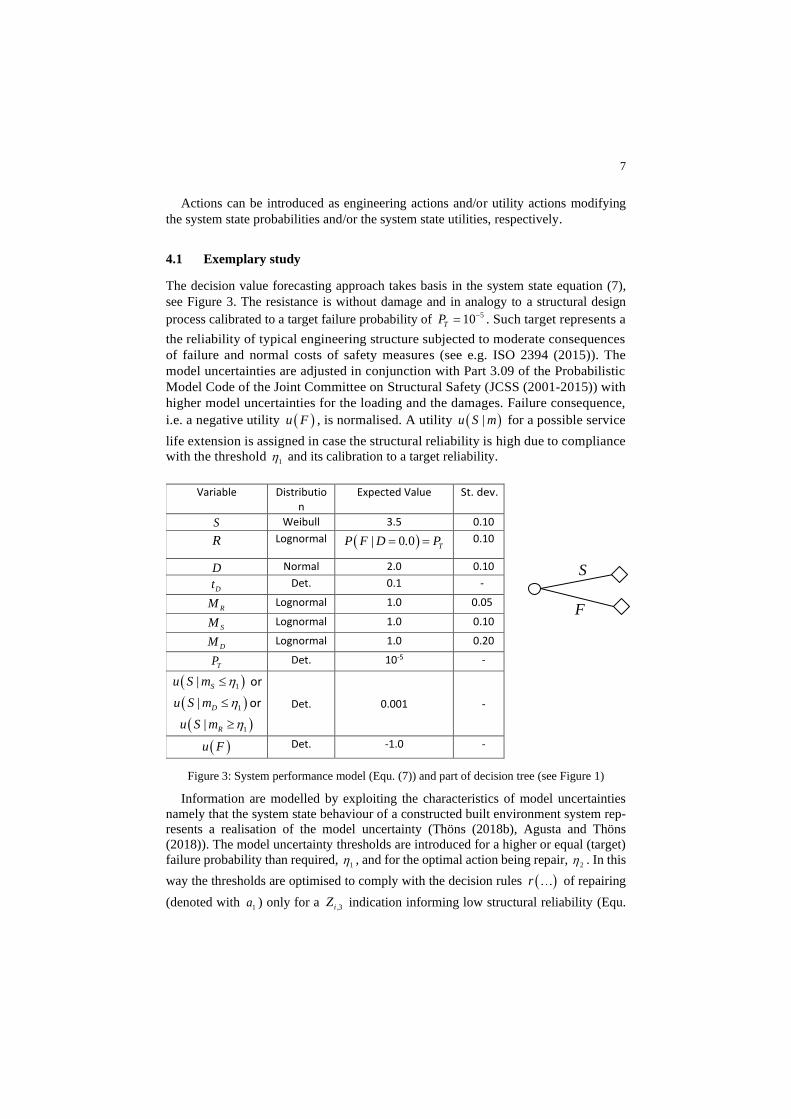
4.1 Exemplary study
The decision value forecasting approach takes basis in the system state equation (7),
see Figure 3. The resistance is without damage and in analogy to a structural design
process calibrated to a target failure probability of 510TP −= . Such target represents a
the reliability of typical engineering structure subjected to moderate consequences
of failure and normal costs of safety measures (see e.g. ISO 2394 (2015)). The
model uncertainties are adjusted in conjunction with Part 3.09 of the Probabilistic
Model Code of the Joint Committee on Structural Safety (JCSS (2001-2015)) with
higher model uncertainties for the loading and the damages. Failure consequence,
i.e. a negative utility ( )u F , is normalised. A utility ( )u S | m for a possible service
life extension is assigned in case the structural reliability is high due to compliance
with the threshold 1 and its calibration to a target reliability.
Figure 3: System performance model (Equ. (7)) and part of decision tree (see Figure 1)
Information are modelled by exploiting the characteristics of model uncertainties
namely that the system state behaviour of a constructed built environment system rep-
resents a realisation of the model uncertainty (Thöns (2018b), Agusta and Thöns
(2018)). The model uncertainty thresholds are introduced for a higher or equal (target)
failure probability than required, 1 , and for the optimal action being repair,
2 . In this
way the thresholds are optimised to comply with the decision rules ( )r of repairing
(denoted with 1a ) only for a 3i ,Z indication informing low structural reliability (Equ.
F
S
Variable Distribution
Expected Value St. dev.
S Weibull 3.5 0.10
R Lognormal ( )0 0 TP F | D . P= = 0.10
D Normal 2.0 0.10
Dt Det. 0.1 -
RM Lognormal 1.0 0.05
SM Lognormal 1.0 0.10
DM Lognormal 1.0 0.20
TP Det. 10-5 -
( )1Su S | m or
( )1Du S | m or
( )1Ru S | m
Det. 0.001 -
( )u F Det. -1.0 -
8
(9)). The indication 1i ,Z informs about a high reliability, the indication 2i ,Z of a relia-
bility as expected:
1 2 3 0 0 1i , i , i ,r Z ,Z ,Z a ,a ,a=
(9)
Equ. (10) shows the probabilities of indications calculation for the discretisation of
the load model uncertainties. Note that the discretisation for the resistance model un-
certainty requires a different order of the integration boundaries in conjunction with the
threshold determination rules in Figure 3 and Figure 4.
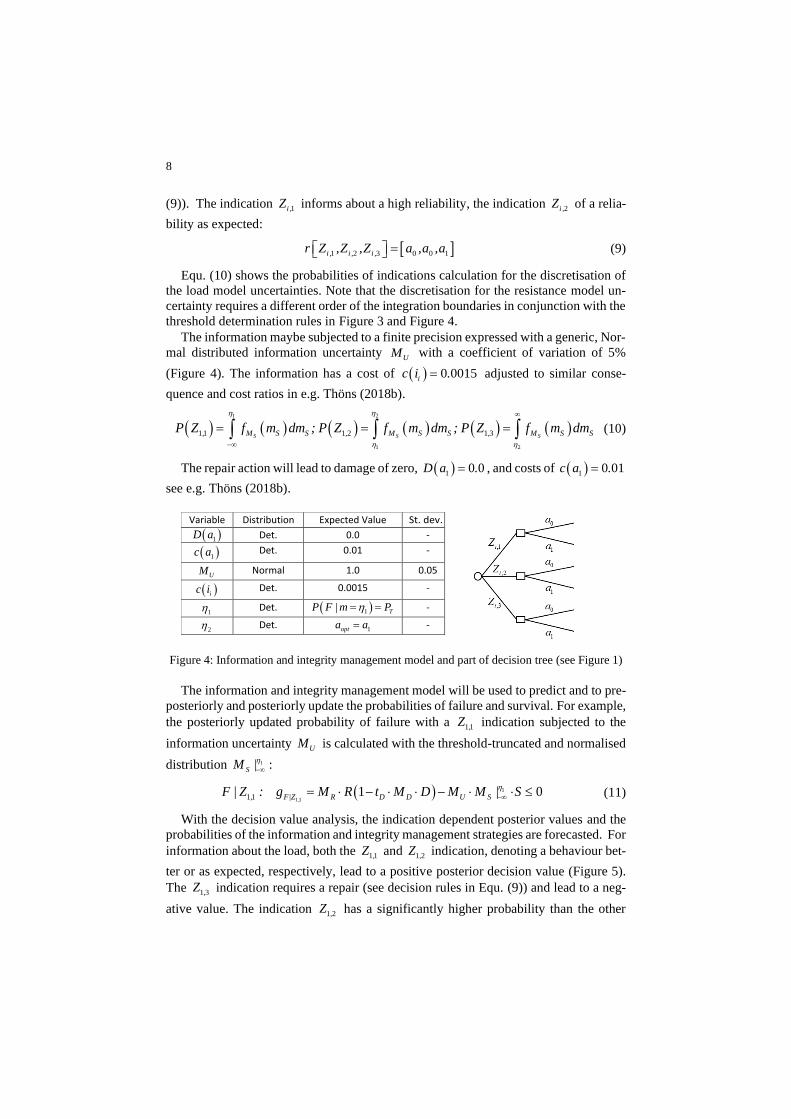
The information maybe subjected to a finite precision expressed with a generic, Nor-
mal distributed information uncertainty UM with a coefficient of variation of 5%
(Figure 4). The information has a cost of ( ) 0 0015ic i .= adjusted to similar conse-
quence and cost ratios in e.g. Thöns (2018b).
( ) ( ) ( ) ( ) ( ) ( )1 2
1 2
1 1 1 2 1 3S S S, M S S , M S S , M S SP Z f m dm ; P Z f m dm ; P Z f m dm
−
= = = (10)
The repair action will lead to damage of zero, ( )1 0 0D a .= , and costs of ( )1 0 01c a .=
see e.g. Thöns (2018b).
Figure 4: Information and integrity management model and part of decision tree (see Figure 1)
The information and integrity management model will be used to predict and to pre-
posteriorly and posteriorly update the probabilities of failure and survival. For example,
the posteriorly updated probability of failure with a 1 1,Z indication subjected to the
information uncertainty UM is calculated with the threshold-truncated and normalised
distribution 1
SM |
− :
( ) 1
1 11 1 1 0,, F|Z R D D U SF | Z : g M R t M D M M | S
−= − −
(11)
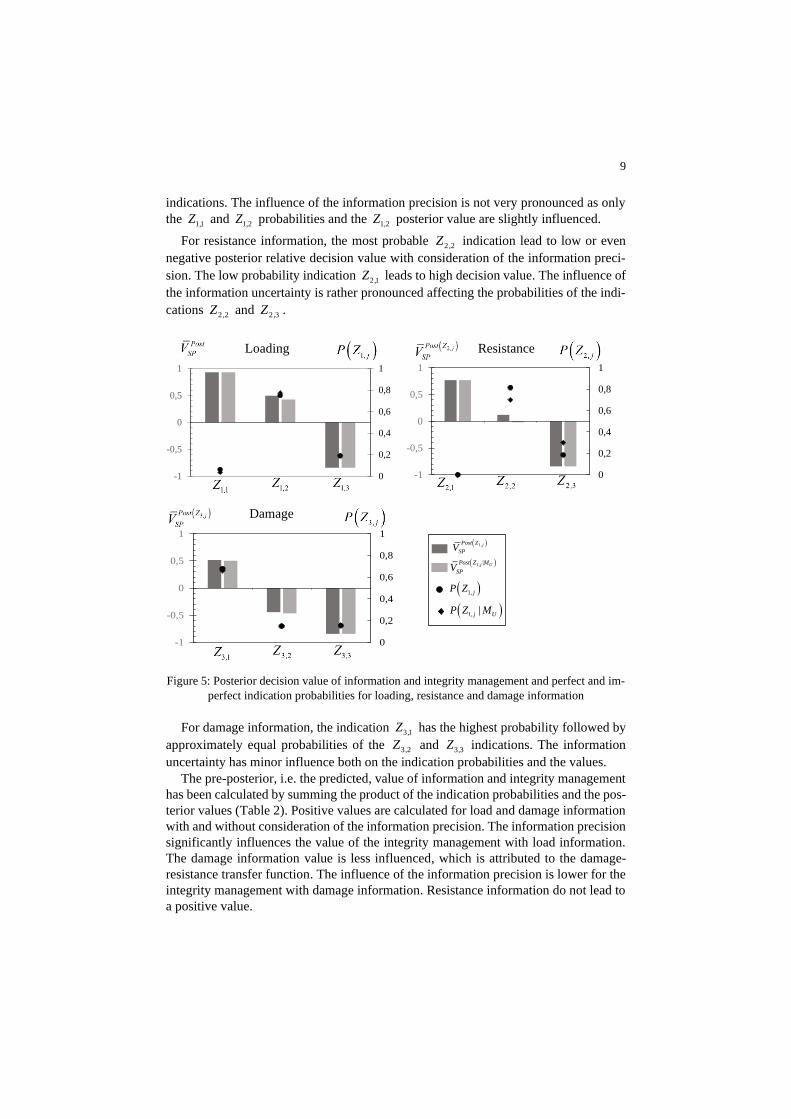
With the decision value analysis, the indication dependent posterior values and the
probabilities of the information and integrity management strategies are forecasted. For
information about the load, both the 1 1,Z and 1 2,Z indication, denoting a behaviour bet-
ter or as expected, respectively, lead to a positive posterior decision value (Figure 5).
The 1 3,Z indication requires a repair (see decision rules in Equ. (9)) and lead to a neg-
ative value. The indication 1 2,Z has a significantly higher probability than the other
Variable Distribution Expected Value St. dev.
( )1D a Det. 0.0 -
( )1c a Det. 0.01 -
UM Normal 1.0 0.05
( )ic i Det. 0.0015 -
1 Det. ( )1 TP F |m P= = -
2 Det. 1opta a= -
9
indications. The influence of the information precision is not very pronounced as only
the 1 1,Z and 1 2,Z probabilities and the 1 2,Z posterior value are slightly influenced.
For resistance information, the most probable 2 2,Z indication lead to low or even
negative posterior relative decision value with consideration of the information preci-
sion. The low probability indication 2 1,Z leads to high decision value. The influence of
the information uncertainty is rather pronounced affecting the probabilities of the indi-
cations 2 2,Z and 2 3,Z .
Figure 5: Posterior decision value of information and integrity management and perfect and im-
perfect indication probabilities for loading, resistance and damage information
For damage information, the indication 3 1,Z has the highest probability followed by
approximately equal probabilities of the 3 2,Z and 3 3,Z indications. The information
uncertainty has minor influence both on the indication probabilities and the values.
The pre-posterior, i.e. the predicted, value of information and integrity management
has been calculated by summing the product of the indication probabilities and the pos-
terior values (Table 2). Positive values are calculated for load and damage information
with and without consideration of the information precision. The information precision
significantly influences the value of the integrity management with load information.
The damage information value is less influenced, which is attributed to the damage-
resistance transfer function. The influence of the information precision is lower for the
integrity management with damage information. Resistance information do not lead to
a positive value.
0
0,2
0,4
0,6
0,8
1
-1
-0,5
0
0,5
1
1 2 3
0
0,2
0,4
0,6
0,8
1
-1
-0,5
0
0,5
1
1 2 3
0
0,2
0,4
0,6
0,8
1
-1
-0,5
0
0,5
1
1 2 3
Damage
Resistance Loading
( )1, jPost Z
SPV
( )1, j UPost Z |M
SPV
( )1, j UP Z | M
( )1, jP Z
10
The decision value between the strategies PrePost,2
PrePost,1V is quantified with the load infor-
mation strategy (Table 2) as a basis. Damage information and with consideration of its
uncertainties leads to the highest value PrePost,2
PrePost,1V explicitly quantifying the second best
alternative in the ranking of the information and integrity management strategies.
Table 2: Thresholds and pre-posterior value of information
Strategy Description Thresholds PrePost
SPV PrePost,2
PrePost,1V
1 2
Perfect Information (PI)
1 Load 0.84 1.11 0.32 -
2 Resistance 1.29 0.95 -0.05 -0.37
3 Damage 1.09 1.20 0.16 -0.16
Imperfect Information (II)
1 Load 0.83 1.09 0.18 -
2 Resistance 1.31 0.97 -0.29 -0.47
3 Damage 1.08 1.19 0.13 -0.05
5 Summary and conclusions
This paper contains a description, an alignment and a joint approach for technology
readiness development with a three phases support by decision value analyses. The
three phases are separated into the decision value forecasting, value decision value anal-
ysis and the technology value quantification supporting the technological concept for-
mulation and experimental testing, the prototype development and the technology qual-
ification and operation.
The first phase namely the decision value forecasting approach relies solely on a
built environment system performance model facilitating support for technological con-
cept formulation and experimental testing. With an exemplary decision value forecast-
ing analysis it was found that for the specific type of structural system, load or damage
information acquirement systems with a high precision should be developed. Re-
sistance information acquirement system should not be developed as the forecasted de-
cision value is negative. In the context of business model and technology markets, a
forecast of the achievable technology value including its costs has been provided in the
order of 13% to 32% in relation to the base scenario.
The alignment of technology development, innovation and decision value analyses
requires more systematic research to substantiate and detail the interrelations striving
for targeted support of innovation decisions.
The approach has been written in the context of technology development, which
may, however, be composed of a technological and algorithmic readiness level devel-
opment (see e.g. Limongelli, Orcesi et al. (2018)).
11
References
Agusta, A. (2020). Structural Integrity and Risk Management based on Value of
Information and Action Analysis. PhD thesis.
Agusta, A. and S. Thöns (2018). Structural Monitoring and Inspection Modeling for
Structural System Updating. Sixth International Symposium on Life-Cycle
Civil Engineering (IALCCE), Ghent, Belgium, October 28 - 31, 2018.
Benjamin, J. R. and C. A. Cornell (1970). Probability, Statistics and Decision for Civil
Engineers, McGraw-Hill, New York. ISBN: 070045496.
Bower, J. L. and C. M. Christensen (1995). Disruptive Technologies: Catching the
Wave. Harvard Business Review 73(1): 43-53.
Christensen, C. M. (1997). The Innovator's Dilemma: When New Technologies Cause
Great Firms to Fail., University of Illinois at Urbana-Champaign's Academy
for Entrepreneurial Leadership.
Héder, M. (2017). From NASA to EU: the evolution of the TRL scale in Public Sector
Innovation. Innovation Journal 22(2): 1-23.
ISO 2394 (2015). General Principles on Reliability for Structures ISO 2394.
JCSS (2001-2015). Probabilistic Model Code, JCSS Joint Committee on Structural
Safety. ISBN: 978-3-909386-79-6.
Limongelli, M. P., A. Orcesi and A. VIDOVIC (2018). The Indicator Readiness Level
for the classification of Research Performance Indicators for road bridges. the
Sixth International Symposium on Life-Cycle Civil Engineering, IALCCE
2018, GHENT, Belgium, Ghent University.
Long, L., M. Döhler and S. Thöns (2020). Determination of structural and damage
detection system influencing parameters on the value of information.
Structural Health Monitoring. DOI: 10.1177/1475921719900918.
Raiffa, H. and R. Schlaifer (1961). Applied statistical decision theory. New York,
Wiley (2000). ISBN: 047138349X.
Sadin, S. R., F. P. Povinelli and R. Rosen (1989). The NASA technology push towards
future space mission systems. Acta Astronautica 20(C): 73-77. DOI:
10.1016/0094-5765(89)90054-4.
Thöns, S. (2018a). On knowledge and utility management. 10th International Forum on
Engineering Decision Making (IFED), Lake Louise, Canada.
Thöns, S. (2018b). On the Value of Monitoring Information for the Structural Integrity
and Risk Management. Computer-Aided Civil and Infrastructure Engineering
33(1): 79-94. DOI: 10.1111/mice.12332.
Thöns, S. and M. Kapoor (2019). Value of information and value of decisions 13th
International Conference on Applications of Statistics and Probability in Civil
Engineering (ICASP), Seoul, Korea, May 26-30, 2019.
Thöns, S. and M. G. Stewart (2020). On the cost-efficiency, significance and
effectiveness of terrorism risk reduction strategies for buildings. Structural
Safety 85: 101957. DOI: https://doi.org/10.1016/j.strusafe.2020.101957.
Von Neumann and Morgenstern (1947). Theory of Games and Economical Behavior,
Princeton University Press, Princeton.