On the use of satellites to obtain information on the occurrence of natural and anthropogenic...
33
BGD 8, 8451–8483, 2011 On the use of satellites G. de Leeuw et al. Title Page Abstract Introduction Conclusions References Tables Figures Back Close Full Screen / Esc Printer-friendly Version Interactive Discussion Discussion Paper | Discussion Paper | Discussion Paper | Discussion Paper | Biogeosciences Discuss., 8, 8451–8483, 2011 www.biogeosciences-discuss.net/8/8451/2011/ doi:10.5194/bgd-8-8451-2011 © Author(s) 2011. CC Attribution 3.0 License. Biogeosciences Discussions This discussion paper is/has been under review for the journal Biogeosciences (BG). Please refer to the corresponding final paper in BG if available. On the use of satellites to obtain information on the occurrence of natural and anthropogenic aerosols over the boreal eurasian forest G. de Leeuw 1,2 , A. Arola 3 , L. Sogacheva 2 , N. Kivek ¨ as 2 , V.-M. Kerminen 2 , A. Arneth 4,5 , T. Christensen 4 , H. Korhonen 3 , A.-I. Partanen 3 , H. Lappalainen 2 , P. Kolmonen 2 , T. Mielonen 3 , M. Sofiev 2 , M. Kulmala 1 , and S. Pinnock 6 1 University of Helsinki, Department of Physics, Helsinki, Finland 2 Finnish Meteorological Institute, Helsinki, Finland 3 Finnish Meteorological Institute, Kuopio, Finland 4 Lund University, Lund, Sweden 5 Karlsruhe Institute of Technology, Institute for Meteorology and Climate Research/Atmospheric Environmental Research, Garmisch-Partenkirchen, Germany 6 ESA-ESRIN, Frascati, Italy Received: 22 July 2011 – Accepted: 10 August 2011 – Published: 23 August 2011 Correspondence to: G. de Leeuw (gerrit.leeuw@fmi.fi) Published by Copernicus Publications on behalf of the European Geosciences Union. 8451
-
Upload
independent -
Category
Documents
-
view
0 -
download
0
Transcript of On the use of satellites to obtain information on the occurrence of natural and anthropogenic...
BGD8, 8451–8483, 2011
On the use ofsatellites
G. de Leeuw et al.
Title Page
Abstract Introduction
Conclusions References
Tables Figures
J I
J I
Back Close
Full Screen / Esc
Printer-friendly Version
Interactive Discussion
Discussion
Paper
|D
iscussionP
aper|
Discussion
Paper
|D
iscussionP
aper|
Biogeosciences Discuss., 8, 8451–8483, 2011www.biogeosciences-discuss.net/8/8451/2011/doi:10.5194/bgd-8-8451-2011© Author(s) 2011. CC Attribution 3.0 License.
BiogeosciencesDiscussions
This discussion paper is/has been under review for the journal Biogeosciences (BG).Please refer to the corresponding final paper in BG if available.
On the use of satellites to obtaininformation on the occurrence of naturaland anthropogenic aerosols over theboreal eurasian forestG. de Leeuw1,2, A. Arola3, L. Sogacheva2, N. Kivekas2, V.-M. Kerminen2,A. Arneth4,5, T. Christensen4, H. Korhonen3, A.-I. Partanen3, H. Lappalainen2,P. Kolmonen2, T. Mielonen3, M. Sofiev2, M. Kulmala1, and S. Pinnock6
1University of Helsinki, Department of Physics, Helsinki, Finland2Finnish Meteorological Institute, Helsinki, Finland3Finnish Meteorological Institute, Kuopio, Finland4Lund University, Lund, Sweden5Karlsruhe Institute of Technology, Institute for Meteorology and ClimateResearch/Atmospheric Environmental Research, Garmisch-Partenkirchen, Germany6ESA-ESRIN, Frascati, Italy
Received: 22 July 2011 – Accepted: 10 August 2011 – Published: 23 August 2011
Correspondence to: G. de Leeuw ([email protected])
Published by Copernicus Publications on behalf of the European Geosciences Union.
8451

BGD8, 8451–8483, 2011
On the use ofsatellites
G. de Leeuw et al.
Title Page
Abstract Introduction
Conclusions References
Tables Figures
J I
J I
Back Close
Full Screen / Esc
Printer-friendly Version
Interactive Discussion
Discussion
Paper
|D
iscussionP
aper|
Discussion
Paper
|D
iscussionP
aper|
Abstract
The ALANIS-Aerosols project is a feasibility study on the use of existing satellite datafor discriminating between natural aerosols emitted by boreal Eurasian forests andlong-range transported anthropogenic aerosols. In this paper an overview is pro-vided of different satellite products which are potentially useful to obtain this kind of5
information. Approaches that have been followed in the past are briefly summarized.Secondary production of aerosols from their precursor gases, in particular biogenicvolatile organic compounds which play an important role in the formation of new parti-cles through nucleation, is briefly discussed. These newly formed particles are initiallytoo small to observe directly with optical instruments used for earth observation (EO)10
but through the use of proxies information can be obtained on global nucleation modeaerosol concentrations. Next we focus on aerosols with particle sizes in the opticallyactive size range, roughly particles with a diameter larger than 50–100 nm, dependingon wavelength. These particles can be observed with EO instruments as well as us-ing several different types of in situ observations. The satellite data used are aerosol15
properties retrieved from the Advanced Along Track Scanning Radiometer (AATSR,flying on ENVISAT since 2002) using both the forward and nadir view with the AATSRdual view algorithm (ADV). Ground-based in situ data used here are aerosol proper-ties measured in Hyytiala, Finland. These observations are complemented with modelcalculations using the global atmospheric aerosol and chemistry model GLOMAP. Ex-20
amples show the complementarity of different data sources to obtain information onthe temporal and spatial information on the nature of aerosols over the Boreal forest.
1 Introduction
Aerosols in the atmosphere are composed of particles of both natural (soil dust, seasalt, sulphates and natural primary and secondary organic aerosol) and anthropogenic25
(e.g., particles produced from energy production, traffic, industrial and other humanactivities such as households and agriculture) origin. However, since the lifetime of
8452

BGD8, 8451–8483, 2011
On the use ofsatellites
G. de Leeuw et al.
Title Page
Abstract Introduction
Conclusions References
Tables Figures
J I
J I
Back Close
Full Screen / Esc
Printer-friendly Version
Interactive Discussion
Discussion
Paper
|D
iscussionP
aper|
Discussion
Paper
|D
iscussionP
aper|
aerosol particles is comparable to the time scale of intra- and inter-continental trans-port (i.e., 3 to 10 days), aerosol particles of anthropogenic origin are ubiquitous andthe natural “background” aerosols are difficult to observe and quantify with confidence(Andreae, 2007).
Anthropogenic aerosols represent an “external” cause of climate change with respect5
to natural aerosols. Natural aerosols, in turn, may provoke variations in the climate sys-tem as part of a feedback mechanism in which climate change may induce changesin emissions of natural aerosol particles and their precursors. To further complicatematters, anthropogenic emissions interact with naturally occurring aerosols (or aerosolprecursors) and it is difficult to discriminate natural from anthropogenic particles. Yet,10
the separation of anthropogenic from natural aerosols is essential for assessing hu-man impacts. In particular, for properly assessing the effect of anthropogenic aerosolson atmospheric processes and climate, it is mandatory to effectively characterize theburden of natural aerosols as a reference level for inferring human-induced aerosolimpact. This separation is also important for understanding the cloud-mediated effects15
of aerosols on climate, since cloud properties respond to aerosols in a nonlinear wayand are most sensitive to the addition of particles when the background concentrationis low (Andreae, 2007; Andreae and Rosenfeld, 2008).
In recent years there has been a growing interest in the influence of aerosols on cli-mate. Aerosols influence climate directly through scattering and absorption of solar ra-20
diation and indirectly through their effect on cloud properties. Several extensive inves-tigations and coordinated field campaigns have been carried out to assess the impactof anthropogenic aerosols from in situ measurements (Griffits et al., 1999; Raes et al.,2000; Ramanathan et al., 2001; Huebert et al., 2003; Kulmala et al., 2009). However,due to the intrinsic complexity of the problem, very few studies have been conducted25
using remote sensing data (Liu et al., 2005). Satellite remote sensing instrumentsdo not directly measure the aerosol chemical composition needed to discriminate an-thropogenic from natural aerosol components but can be used to infer information asdescribed below.
8453

BGD8, 8451–8483, 2011
On the use ofsatellites
G. de Leeuw et al.
Title Page
Abstract Introduction
Conclusions References
Tables Figures
J I
J I
Back Close
Full Screen / Esc
Printer-friendly Version
Interactive Discussion
Discussion
Paper
|D
iscussionP
aper|
Discussion
Paper
|D
iscussionP
aper|
The general aim of the ALANIS Theme 3 – Aerosols (in short ALANIS – Aerosols)project is to investigate the feasibility of the use of existing satellite data, either alone orin combination with ground-based in situ or remote sensing data and/or with chemicaltransport models, for discriminating between natural aerosols and long-range trans-ported anthropogenic aerosols over the boreal Eurasian forest. In this context, the5
interest in investigating anthropogenic in contrast to natural aerosol dynamics overboreal Eurasia stems from two main concepts. First, boreal forests directly modifythe atmospheric aerosol content. In particular, ubiquitous features at boreal Eurasianforest sites are the regular occurrence of new particle formation events through thegeneration of secondary organic aerosols (SOA) and their subsequent growth by con-10
densation of biogenic organic compounds that are emitted from the forests (Kulmalaet al., 2001, 2004, 2008; Tunved et al., 2006, 2008; Spracklen et al., 2006). Second,due to particular wind circulation patterns the clean atmosphere over northern Eurasiais impacted periodically by long-range transported anthropogenic aerosols, such asthose formed by energy production, traffic, industrial and other human activities such15
as households and agriculture (Arola et al., 2007; Stohl et al., 2007; Shindell et al.,2008).
Atmospheric reaction products of biogenic volatile organic compounds (BVOC) emit-ted from vegetation, especially boreal forest, are the main source of SOA (Kulmala etal., 2001; Hallquist et al., 2009). The geographic and seasonal distribution of BVOC20
is highly uncertain. The direct contribution of anthropogenic emissions to SOA is quitesmall but anthropogenic aerosol may serve as nuclei for biogenic SOA formation andgrowth (Kanakidou et al., 2000). Global total monoterpene or isoprene emissions aredominated by tropical ecosystems and boreal forests contribute only around 5–10 % bymass. However, emission maxima during summer, especially for monoterpenes, can25
be as large as in tropical regions. Monoterpenes dominate the production of aerosolmass over the boreal forest (Tunved et al., 2006); sesquiterpene-oxidation productsare crucial for the initial stages of particle formation (Bonn and Moortgat, 2003). Iso-prene is known to produce additional SOA mass (Claeys et al., 2004; Paulot et al.,
8454

BGD8, 8451–8483, 2011
On the use ofsatellites
G. de Leeuw et al.
Title Page
Abstract Introduction
Conclusions References
Tables Figures
J I
J I
Back Close
Full Screen / Esc
Printer-friendly Version
Interactive Discussion
Discussion
Paper
|D
iscussionP
aper|
Discussion
Paper
|D
iscussionP
aper|
2009), but at the same time it appears to suppress new-particle formation associatedwith monoterpene emissions (Kiendler-Scharr et al., 2009; Kanawade et al., 2011).Model analysis which combines BVOC emission algorithms with dynamic vegetationmodels is the state-of-the art to address these issues (Arneth et al., 2009). BVOCemission algorithms can be evaluated against available BVOC flux measurements (Ar-5
neth et al., 2007) and provide input for estimates of natural precursor emissions for theevaluation of the contribution of natural aerosol loading over boreal forests in aerosol-cloud-climate interactions. However, to-date process-understanding on sesquiterpeneemissions is insufficient to be included in BVOC emission models, and most modelsconcentrate on isoprene and monoterpenes as precursor sources. BVOC emission10
estimates based on top-down inversion modeling of satellite formaldehyde retrievalsin combination with atmospheric chemistry models are promising; however, at presentthese estimates suffer from large uncertainties in the satellite information retrievals andassociated with the chemical reaction pathways (e.g. Palmer et al., 2003).
Biogenic secondary organic aerosol (BSOA) influences climate mainly by affecting15
cloud properties, and to a lesser extend by scattering solar radiation back to space(e.g. Kerminen et al., 2005; Lihavainen et al., 2009). Possible offsets between stim-ulation of BVOC emissions by warming and inhibition by increasing CO2 represent achief source of uncertainty for the magnitude of proposed feedback loops (Arneth et al.,2010). SOA are efficient cloud condensation nuclei, with larger number concentrations20
possibly leading to less precipitative clouds. Faster chemistry due to elevated O3 levelsalso increases the concentrations of SOA.
This paper presents an an overview of existing satellite products and methods thathave been used to discriminate between natural and anthropogenic aerosols. Theuse of satellite products, in situ data, models and their complementarity to identify the25
occurrence of anthropogenic aerosols over the Boreal forest is illustrated. The work fo-cuses on data over Finland as an example because of the availability of quality assureddata from stations which are part of recognized networks such as EUSAAR (Philippinet al., 2009), AERONET (Holben et al., 1998) and GAW-PFR (Wehrli, 2008). In earlier
8455

BGD8, 8451–8483, 2011
On the use ofsatellites
G. de Leeuw et al.
Title Page
Abstract Introduction
Conclusions References
Tables Figures
J I
J I
Back Close
Full Screen / Esc
Printer-friendly Version
Interactive Discussion
Discussion
Paper
|D
iscussionP
aper|
Discussion
Paper
|D
iscussionP
aper|
publications the aerosol optical depth over Finland (Aaltonen et al., 2011) and theaerosol optical properties measured at the Finnish supersite Hyytiala (Virkkula, 2011)have been analyzed. Global nucleation based on the use of satellite observations aloneis discussed in Kulmala et al. (2011).
2 Overview of studies on the use of satellite data to discriminate5
between natural and anthropogenic aerosols
Few studies have been published on the discrimination between different aerosol types.OMI Absorbing Aerosol Index (AAI) data have been used to distinguish between ab-sorbing (carbonaceous aerosol and dust) and non-absorbing aerosols (sulfate and seasalt) and MODIS Fine Mode Fraction (FMF) to further distinguish fine (carbonaceous10
and sulfate) and coarse mode (dust and sea salt) aerosols, resulting in one of thesefour aerosol types in each scene (Kim et al., 2007). The information derived from thesetwo data products is clearly complementary.
The synergy between GOME and ATSR-2 has been used to derive both AOD andaerosol type (Holzer-Popp et al., 2002a, b). However the determination of the aerosol15
type in this algorithm is based on the a priori aerosol model selected by the algorithm togive the best match between satellite measured and modeled top-of-the-atmosphere(TOA) reflectance, so it is not as clearly utilizing complementary information as theapproach by Kim et al. (2007).
The above mentioned approaches could be used to estimate the anthropogenic and20
natural aerosol contributions. However, further simplification is likely necessary, suchas an assumption that all fine-mode AOD originates from anthropogenic sources andcoarse mode AOD from natural sources. This assumption is not valid for secondaryorganic aerosol produced by boreal forests.
An approach to estimate the anthropogenic aerosol optical depth (AODanth) using25
fine mode fraction (FMF) and total aerosol optical depth (AOD) from MODIS over-oceanretrievals was developed by Kaufman et al. (2005). FMF for marine, anthropogenic, and
8456

BGD8, 8451–8483, 2011
On the use ofsatellites
G. de Leeuw et al.
Title Page
Abstract Introduction
Conclusions References
Tables Figures
J I
J I
Back Close
Full Screen / Esc
Printer-friendly Version
Interactive Discussion
Discussion
Paper
|D
iscussionP
aper|
Discussion
Paper
|D
iscussionP
aper|
dust aerosol were assumed to be constant, and derived from Terra MODIS measure-ments from regions dominated by these specific aerosol types.
This approach is more advanced than simply assuming that fine mode aerosols areexclusively anthropogenic and coarse mode aerosols are natural, since the contribu-tions of natural dust and marine aerosol to fine-mode AOD are empirically accounted5
for. Kaufman et al. (2005) assumed that all biomass-burning aerosols are anthro-pogenic and all dust is of natural origin, while they estimated the FMF for both, notassuming that all anthropogenic is in the fine mode and natural in the coarse mode.Yu et al. (2009) further refined and developed the method introduced by Kaufman etal. (2005) by including seasonal and spatial variations in marine FMF. The crucial pa-10
rameter in these approaches is the estimated fine mode fraction. This approach wasapplied over ocean only because the MODIS FMF over land is not considered reliable.
Another way to identify anthropogenic aerosols would be the quantification ofbiomass burning ignited by lightning (natural origin) and mineral dust due to humaninduced changes of land cover/land use and climate (anthropogenic origin). Ginoux et15
al. (2010) combined land use data and MODIS measurements to separate the naturaland anthropogenic dust sources, assuming that any grid cell with land use of 10 % ormore is anthropogenic, otherwise natural.
The methods summarized above were applied to situations with relatively highaerosol concentration as reflected by enhanced AOD. Over the EURASIAN boreal20
forests AOD is usually low. Although the number concentrations of natural aerosolsemitted by boreal Eurasian forests are very high, their initial sizes are so small thatthey do not affect aerosol properties observed by optical instruments such as scatter-ing, absorption or AOD. It takes several days before these new particles grow into asize range large enough to significantly contribute to the aerosol volume concentration25
(Tunved et al., 2006) and thus affect light scattering and AOD (e.g., Lihavainen et al.,2009). Therefore discriminating natural aerosol particles formed over the boreal forestfrom aerosols of anthropogenic origin is a challenge.
8457

BGD8, 8451–8483, 2011
On the use ofsatellites
G. de Leeuw et al.
Title Page
Abstract Introduction
Conclusions References
Tables Figures
J I
J I
Back Close
Full Screen / Esc
Printer-friendly Version
Interactive Discussion
Discussion
Paper
|D
iscussionP
aper|
Discussion
Paper
|D
iscussionP
aper|
In the ALANIS-Aerosol project the AATSR dual view algorithm ADV (Veefkind etal., 1998; Curier et al., 2009) is used to provide both regional and global informationon aerosol properties. AATSR is the Advanced Along Track Scanning Radiometerflying on ENVISAT since 2002. It provides two views, one at nadir and 2 min later a55◦ forward view. AATSR has seven wave bands in the visible and infrared regions,5
centered at 0.555, 0.659, 0.865, 1.61, 3.7, 11.0, and 12.0 µm. With a swath widthof 512 km and nadir resolution of 1×1 km2, AATSR reaches global coverage in aboutfive days. The dual view algorithm uses both views to eliminate the effects of landsurface reflection on the radiance measured at the top of the atmosphere. Hence anexternal surface model is not needed in the retrieval. The IR channels together with10
the VIS/NIR channels are used for cloud detection (Robles Gonzalez, 2003; Curieret al., 2009). The cloud detection procedure consists of three standard tests whichare applied to individual pixels. The tests are based on the evaluation of histogramsof either brightness temperature or reflectance in both viewing angles. The VIS/NIRchannels at 0.555, 0.659, 0.865 and 1.61 µm are used for aerosol retrieval.15
The current version of ADV provides not only the AOD at several wavelengths butalso the fraction of fine mode aerosol contributing to the AOD for two pre-determinedaerosol types. This principle has been demonstrated with ATSR-2 data collected overthe Indian Ocean showing that the relative contributions of sea-spray aerosol and an-thropogenic pollution vary with distance from the coast (Roblez-Gonzalez et al., 2006).20
A study on the transport of biomass burning aerosol over Africa showed the chang-ing mixing ratio of two types of aerosol with different absorption coefficients (Robles-Gonzalez and de Leeuw, 2008). Forest fires over the Iberian Peninsula were isolatedfrom the background aerosol (Sundstrom et al., 2008) and very strong pollution, ascharacterized with AOD on the order of 3, was detected over China (Sundstrom et al.,25
2011). Over Eurasia the AOD is very low with a natural background value on the orderof 0.05, which renders it difficult to obtain any additional information such as FMF orit’s contribution to total AOD.
8458

BGD8, 8451–8483, 2011
On the use ofsatellites
G. de Leeuw et al.
Title Page
Abstract Introduction
Conclusions References
Tables Figures
J I
J I
Back Close
Full Screen / Esc
Printer-friendly Version
Interactive Discussion
Discussion
Paper
|D
iscussionP
aper|
Discussion
Paper
|D
iscussionP
aper|
3 Existing satellite data products that can be explored to investigatetheir potential in discriminating natural and anthropogenic aerosols
Table 1 summarizes several satellite data products that are potentially useful in dis-criminating between natural and anthropogenic aerosols. This table is not meant tobe exhaustive, but rather listing the most suitable candidates for each type of satellite5
product available from currently flying satellites only. The potential use of the satelliteproducts in Table 1 is discussed below. An initial attempt of using satellite products toobtain information on secondary aerosol formation through nucleation has been pre-sented in Kulmala et al. (2011). This work was based on the use of proxies such assatellite-derived concentrations of SO2, AOD and UV radiation. The correlation of AOD10
with short-lived trace gases such as formaldehyde, nitrogen dioxide and sulfur dioxide,all observed by satellites, was demonstrated by Veefkind et al. (2011). The potentialextention to other satellite-observables and in particular BVOCs is discussed below.
3.1 Precursor gases and proxies
Aerosols formed within and above the natural boreal forest with diameters smaller than15
about 100 nm cannot be detected directly with optical instruments such as those usedon satellites. An alternative approach to study these particles would be to use proxiesfor different parameters that influence the formation mechanism such as sulfuric acidconcentration. Direct proxies for sulfuric acid concentration include the concentrationsof SO2, hydroxyl radical (OH) and condensational sink (CS) (e.g. Weber et al., 1997;20
Petaja et al., 2009). Of these, only SO2 concentration is directly available from satellites(e.g., SCIAMACHY, GOME-2, and OMI). However, CS can be estimated from AODwhich correlates with aerosol surface area, and OH concentrations correlate with UVintensity (Rohrer et al., 2006); both AOD and UV intensity can be obtained from satelliteobservations.25
Atmospheric volatile organic compounds (VOCs) are precursors of SOA. Formalde-hyde (HCHO) and glyoxal (CHO.CHO) are two possible intermediates which can be
8459

BGD8, 8451–8483, 2011
On the use ofsatellites
G. de Leeuw et al.
Title Page
Abstract Introduction
Conclusions References
Tables Figures
J I
J I
Back Close
Full Screen / Esc
Printer-friendly Version
Interactive Discussion
Discussion
Paper
|D
iscussionP
aper|
Discussion
Paper
|D
iscussionP
aper|
produced during the atmospheric oxidation of VOCs. They can undergo further ox-idation and thus contribute to the secondary organic aerosol formation. Therefore,information on formaldehyde and glyoxal levels and their variability could potentiallybe used to identify aerosols with biogenic origin. Column-integrated HCHO estimatesare available from satellite measurements (e.g., Shim et al., 2005; Millet et al., 2006,5
2008). Such measurements have been used to derive global constraints on surfaceemissions of BVOCs. HCHO data or glyoxal, CHOCHO, another oxidation productfrom biogenic BVOC could be potentially used to assess whether information on SOAproduction and concentrations can be obtained (Lerot et al., 2010). So far the studieshave not been very quantitative in terms of SOA formation. Schurgers et al. (2009) hy-10
pothesized that BVOC emission in the southeast US contributes to the elevated AOD(seen both from MODIS and MISR). Veefkind et al. (2011) found that high HCHO lev-els in this region correspond to the pattern of higher AOD values, inferred from MODISAOD data. Slowik et al. (2010) presented a substantial biogenic SOA event from theCanadian eastern forest with correlated increase in satellite AOD. The ratio of glyoxal15
to formaldehyde was used by Vrekoussis et al. (2010) to classify the sources of theseoxygenated volatile organic compounds according to biogenic and/or anthropogenicemissions. The results indicate that biogenic emissions would favor glyoxal formation,observed to correspond to the highest Enhanced Vegetation Index, EVI.
3.2 Anthropogenic trace gases20
As an alternative to the direct detection of aerosols the use of trace gas concentrationsas an indication of anthropogenic pollution could be explored. Trace gas column con-centrations are retrieved from satellites (SCIAMACHY, OMI) including anthropogenicpollutants such as NO2, SO2 or CO. The presence of these anthropogenically pro-duced gases could be accompanied by the presence of aerosols. This is illustrated in25
a study by Veefkind et al. (2011) who used MODIS-retrieved AOD and OMI-retrievedcolumns of NO2, SO2 and HCHO on spatial correlations between AOD and these tracegases. The results from this study show low AOD to NO2 ratios over the eastern United
8460

BGD8, 8451–8483, 2011
On the use ofsatellites
G. de Leeuw et al.
Title Page
Abstract Introduction
Conclusions References
Tables Figures
J I
J I
Back Close
Full Screen / Esc
Printer-friendly Version
Interactive Discussion
Discussion
Paper
|D
iscussionP
aper|
Discussion
Paper
|D
iscussionP
aper|
States and Europe and higher ratios over industrialized regions in eastern Europe andChina. Comparison with SO2 observations suggest that over the latter regions theaerosol content has a stronger contribution from sulphates than over regions where theSO2 emissions are regulated. In their analyses, Veefkind et al. excluded regions whereAOD is dominated by natural aerosols because no correlation with anthropogenic trace5
gases is expected.
4 Ground-based data
4.1 Ground-based in situ data
There are less than 20 stations providing continuous aerosol data from the borealforest zone in Eurasia. The measurement sites currently in operation are shown on10
the map in Fig. 1. There are only few stations in the Eurasian boreal forest that pro-vide observations on a regular basis and report to open data bases. For validation ofaerosol information retrieved form satellites some more stations are available, such asAERONET and PFR sites mentioned in Sect. 4.2.
In the analyses presented in Sect. 6 we use data from the SMEAR II station at15
Hyytiala (61◦51′ N, 24◦17′ E, 180 m a.s.l.). Hyytiala has extensive facilities for measur-ing forest-atmosphere interaction and has been doing so since 1996 (Hari and Kulmala,2005). Aerosol size distribution measurements were started with a twin-DMPS systemat the end of January 1996, and have been ongoing since then. The DMPS measuressubmicrometer particles with sizes larger than 3 nm. The sampling is done at 2 m20
above the ground inside the forest canopy. The station is surrounded by Scots Pineforest. The nearest urban pollution sites are Tampere (ca. 50 km to the southwest) andJyvaskyla (ca. 100 km to the northeast). Of further interest for the current work arethe optical aerosol measurments (scattering and absorption coefficients) described inVirkkula et al. (2011) and the CIMEL sun photometer measurements which are part of25
AERONET (Holben et al., 1998).
8461
BGD8, 8451–8483, 2011
On the use ofsatellites
G. de Leeuw et al.
Title Page
Abstract Introduction
Conclusions References
Tables Figures
J I
J I
Back Close
Full Screen / Esc
Printer-friendly Version
Interactive Discussion
Discussion
Paper
|D
iscussionP
aper|
Discussion
Paper
|D
iscussionP
aper|
4.2 Ground-based remote sensing data
Ground-based remote sensing over the boreal forest includes several sun photometerswhich are part of the AERONET network (http://aeronet.gsfc.nasa.gov/index.html) orthe WMO-GAW PFR AOD network (http://www.pmodwrc.ch/worcc/index.html). Rele-vant sites located in the ALANIS-Aerosol Eurasian boreal forest study region are mainly5
located in Finland. The sun photometers in Helsinki, Hyytiala and Kuopio are part ofAERONET and data are available on the website within a few hours after measure-ment. The sun photometers in Joikionen and Sodankyla are part of WMO-GAW net-work and the data are available at the EBAS data base (http://ebas.nilu.no/). OtherAERONET stations which could be used are located in Zvenigorod, Moscow, Yekatar-10
inburg, Tomsk, Krasnoyarsk and Irkutsk. However, all of these stations are on the edgeof the Boreal forest (57◦ N or further south) whereas the Finnish stations are all northof 60◦ N with the additional advantage of the availability of ground-based in situ data.
Ground-based remote sensing using sun photometers has similar limitations assatellite remote sensing as regards the occurrence of clouds and the availability of15
sun light. The CIMEL (AERONET) and PFR (Precision Filter Radiometer) (WMO-GAWnetwork) data in Finland presented by Aaltonen et al. (2011) show large data gaps,but because these instruments measure from sunrise to sunset with a frequency of15 min (CIMEL) and 1 min (PFR) more data are available then for AATSR with only oneoverpass every 2–3 days over Eurasia providing a snapshot around 10:00 a.m.20
Aaltonen et al. (2011) classified the sun photometer observations in Finland accord-ing to AOD (larger or smaller than 0.2) and Angstrom exponent (larger or smaller than1.1) and associated the occurrences of clean continental background aerosol (naturalaerosol in this paper) and anthropogenic aerosol with air mass origin using air masstrajectory cluster analysis. The observations are dominated by clean continental back-25
ground aerosol whereas the occurrence of anthropogenic aerosol is associated withair masses transported from the east or from the south-east to south.
8462

BGD8, 8451–8483, 2011
On the use ofsatellites
G. de Leeuw et al.
Title Page
Abstract Introduction
Conclusions References
Tables Figures
J I
J I
Back Close
Full Screen / Esc
Printer-friendly Version
Interactive Discussion
Discussion
Paper
|D
iscussionP
aper|
Discussion
Paper
|D
iscussionP
aper|
5 Chemical transport model
Any transport model can in principle make a distinction between natural and anthro-pogenic contributions to the aerosol loading through the distribution and nature ofsources and subsequent aerosol transport and transformation. The performance ofthe model depends on how well the sources, sinks and transformation (physical, chem-5
ical) processes and the meteorological fields are described. In the present study theglobal atmospheric aerosol and chemistry model GLOMAP (http://researchpages.net/glomap/) (Spracklen et al., 2005) is used. GLOMAP simulates the evolution of size andcomposition resolved aerosols, including their interaction with trace gases and clouds.The model includes sea spray and sulfate aerosol, elemental carbon, organic carbon,10
dust, and a simple scheme for secondary organic material based on monoterpene oxi-dation products. The host model for GLOMAP is the TOMCAT global Eulerian grid-pointchemical transport model that has been developed over the last 10 years. It is used ex-tensively for tropospheric chemical studies. TOMCAT is forced by meteorological anal-yses (ECMWF or UKMO) updated every 6 h. The model has a variable resolution of15
typically between 1◦ ×1◦ and 7.5◦ ×7.5◦ and 31 vertical levels between the surface andthe tropopause. GLOMAP was the first global model that demonstrated the potentialimportance of atmospheric nucleation to the global aerosol number budget (Spracklenet al., 2006) and global cloud condensation nuclei production (Spracklen et al., 2008;Merikanto et al., 2009). GLOMAP has been used in several other applications (e.g.,20
Mankletow et al., 2009; Spracklen et al., 2010). For the application of GLOMAP in theALANIS-Aerosol project the SILAM (http://silam.fmi.fi), (Sofiev et al., 2006) fire emis-sion scheme has been implemented to account for the presence of forest fires over partof Europe and Asia, and their influence on the atmospheric composition over Eurasia.
8463

BGD8, 8451–8483, 2011
On the use ofsatellites
G. de Leeuw et al.
Title Page
Abstract Introduction
Conclusions References
Tables Figures
J I
J I
Back Close
Full Screen / Esc
Printer-friendly Version
Interactive Discussion
Discussion
Paper
|D
iscussionP
aper|
Discussion
Paper
|D
iscussionP
aper|
6 Results
The AOD over Finland was retrieved using AATSR data and the ADV algorithm for so-lar zenith angles larger than about 60◦. This limits the availability of satellite AOD datato the period from mid-April until the end of September with an increasing coverageof Finland as daylight hours increase. Further limitations are that AOD can only be5
retrieved in clear sky conditions, the AATSR swath and the presence of clouds. TheAATSR swath of 500 km results in a return time of 2–3 days over Eurasia (5–6 daysnear the equator). The presence of clouds results in an often “patchy” pattern within anAATSR track. Swath and cloud occurence together hide the larger scale distribution ona single day and often there are insufficient data to show the spatial AOD pattern typi-10
cal for the transport of anthropogenic pollution over a clean area. Because the focus ofthe ALANIS-Aerosol study is the use of satellite data, and for this particular part of thestudy the use of AATSR data, the later were used as stand-alone satellite data to makea first selection of cases showing clear or polluted air. This required that AOD overa large part of Finland and / or neighbouring countries would be retrieved and cover15
one or more of the in situ stations, in this case Hyytiala. This left only few useful situa-tions, e.g., for 2006 eleven useful retrievals were selected. Four of these were for cleansituations and seven show areas with enhanced AOD indicating transport of aerosolfrom anthropogenic origin. These numbers may be biased by the occurrence of certaincirculation patterns and their associated cloudiness (Kusmiercyk et al., 2007). In two20
of the cases with anthropogenic aerosol the plume clearly originated from Central Eu-rope and in three other cases the source region would be Russia. For the other threeanthropogenic cases the origin could initially not be decided based on satellite dataalone.
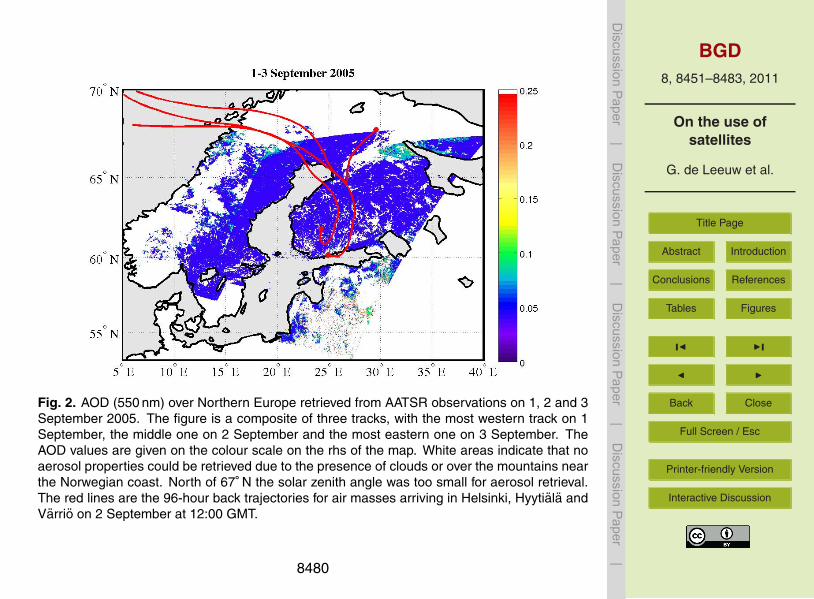
Examples illustrating clean and polluted cases are shown in Figs. 2 and 3. Figure 225
is a composite of AATSR-retrieved AOD (at a wavelength of 550 nm) over the Borealforest in Scandinavia, Finland and eastern Russia for three consecutive days on 1, 2and 3 September, 2005. These days the AOD was very low with values of around
8464
BGD8, 8451–8483, 2011
On the use ofsatellites
G. de Leeuw et al.
Title Page
Abstract Introduction
Conclusions References
Tables Figures
J I
J I
Back Close
Full Screen / Esc
Printer-friendly Version
Interactive Discussion
Discussion
Paper
|D
iscussionP
aper|
Discussion
Paper
|D
iscussionP
aper|
0.05 over the whole area with somewhat higher AOD over a few areas in northernFinland, over the Norwegian mountains and over Estonia, Latvia and Lithuania. Thesehigher AOD values are probably due to presence of clouds as indicated by the adjacentwhite areas. Undetected clouds would enhance the AOD and often the AOD is alsohigher near cloud edges. The somewhat enhanced AOD near the Norwegian coast5
may also be due to the presence of marine aerosol particles. The air mass back (96 h)trajectories (Draxler and Hess, 1998) shown in Fig. 2 were calculated for arrival atthree locations in Finland (Helsinki, Hyytiala and Varrio, see Fig. 1), on 2 Septemberat 12:00. They show that the air masses originate from the clean North Atlantic whichexplains the low AOD values over the whole study area.10
Figure 3 illustrates the effect of transport on the AOD over southern Finland during ashort period from 2–6 May 2006. This period will be further discussed below togetherwith results from ground-based in situ measurements corresponding to the cases se-lected from the satellite observations. These in situ observations were used to verifythe conclusions based on satellite data alone. In this exercise only the Hyytiala data15
were used because most of the polluted cases occurred over southern Finland whichis closest to the pollution sources. Hence the clearest signal would be expected inHyytiala. Data used were aerosol scattering and absorption coefficients and parti-cle size distributions. The latter were measured using a differential mobility analyzer(DMPS) in the dry diameter range 3–650 nm and an aerodynamic particle sizer (APS)20
in the diameter range from 650 nm–15 µm. Aerodynamic diameters were converted tomobility diameters assuming a particle density of 1.8 g cm−3 to be able to combine theDMPS and APS data to obtain the full size range; particles in the size range between0.05–0.1 and a few µm are most effective as regards their effect on the scattering oflight in the visible part of the solar spectrum which is observed by optical instruments25
such as the AATSR. The combined particle size distributions were averaged over 1 hand analyzed for the occurrence of pollutants based on total particle volume concen-tration (V ). Virkkula et al. (2011) showed that in Hyytiala the scattering coefficientcorrelates better with total particle volume concentration than with condensation sink
8465

BGD8, 8451–8483, 2011
On the use ofsatellites
G. de Leeuw et al.
Title Page
Abstract Introduction
Conclusions References
Tables Figures
J I
J I
Back Close
Full Screen / Esc
Printer-friendly Version
Interactive Discussion
Discussion
Paper
|D
iscussionP
aper|
Discussion
Paper
|D
iscussionP
aper|
(which is closer to total particle surface area concentration). The cases were classi-fied as clean when V < 10 µm3 cm3, semi-clean when 10 µm3 cm−3 < V < 20µm3 cm−3
and polluted when V > 20 µm3 cm−3. Particle size distributions and time series of totalnumber, area and volume concentrations for the cases shown in Fig. 3 are presentedin Fig. 4.5
Classification based on satellite data alone or on ground-based in situ data alonegenerally agree but in some cases they also disagree. This is ullustrated by comparisonof the satellite and particle size distribution data in Figs. 3 and 4. Figure 3a shows theAOD for 2 May 2006: an area with enhanced AOD (on the order of 0.45) occurs oversouthern Finland and Estonia while further to the north the AOD decreases gradually10
to values of 0.1 and smaller. Both the most nothern and the most southern parts ofFinland are covered by clouds (indicated by the white areas) and thus the retrievalof AOD was not possible. Hyytiala is situated in southern Finland which was cloudcovered. On either side of the cloud deck the AOD was about 0.45 but in view ofthe possible effect of clouds on the relative humidity, and thus swelling of the aerosol15
particles underneath the clouds resulting in enhanced extcinction, no assumption canbe made on the spatial variation of the AOD and thus on the AOD in Hyytiala. It is notedthat when the cloud detection routine in ADV was switched off the retrieved AOD in thecloudy area has values between about 1.5 and 3, but there is no smooth transitionfrom the area which was positively identified as aerosol (AOD 0.45). Hence we believe20
that the cloud detection algorithm correctly identified this area as cloudy rather thanmis-assigning high pollution values as clouds. The total particle volume concentrationV was around 20 µm3 cm−3 in the morning and increased to 37 µm3 cm−3 around thetime of the AATSR overpass to drop to a steady concentration of around 30 µm3 cm−3
during the rest of the day. This is clearly indicative of a polluted episode, following25
the criteria given above, and confirms the AATSR observation. It is noted that V wasdetermined from particle size distributions measured in their dry state, i.e. at low RH.
The aerosol volume concentrations measured in Hyytiala decreased substantially toreach a minimum value of about 10 µm3 cm−3 in the afternoon of 3 May to increase
8466

BGD8, 8451–8483, 2011
On the use ofsatellites
G. de Leeuw et al.
Title Page
Abstract Introduction
Conclusions References
Tables Figures
J I
J I
Back Close
Full Screen / Esc
Printer-friendly Version
Interactive Discussion
Discussion
Paper
|D
iscussionP
aper|
Discussion
Paper
|D
iscussionP
aper|
again to 35 µm3 cm−3 in the afternoon of 4 May and then steady decrease back to10 µm3 cm−3 in the morning of 5 May when we have the next AATSR overpass withreasonable area coverage over southern Finland. Figure 3b shows that the plume isoptically much thinner than on 2 May with a maximum AOD of about 0.2 but the area ofelevated AOD has a similar spatial extent as on 2 May. Around the time of the AATSR5
overpass V was about 13 µm3 cm−3 and increased to 20 µm3 cm−3 in the afternoon todrop to below 10 µm3 cm−3 later in the day. The AATSR overpass on 6 May (Fig. 3c)partly overlapped with that on 5 May and the plume has moved more to the SE butstill with a similar AOD maximum of 0.2. It is noted that the pollution had disappearedfrom Hyytiala as clearly indicated by the low volume concentration of 5 µm3 cm−3 at the10
time of the AATSR overpass. The spatial AOD pattern retrieved from the AATSR datashows the somewhat patchy behaviour with AOD varying between 0.05 and 0.1 nearthe Hyytiala area and higher AOD near the Finnish southcoast.
The conclusions from the ground-based in situ and satellite data are confirmed bythe 96-hour back trajectories arriving over Finland on 2 May 2006 (Fig. 3a). The air15
masses arriving in southern Finland (Helsinki and Hyytiala) passed over forest fire ar-eas, whereas the air mass arriving in Varrio in Northern Finland did not pass overany forest fires detected by AATSR. Figure 3a also shows the AOD measured on thesame day (2 September 2006) over Russia indicating clear air in most of that part ofthe AATSR track and elevated AOD over the most southern part where the forest fires20
occurred on the same day and the day before. On 5 May (Fig. 3b) the air mass tra-jectories over southern Finland were also arriving from the SSE and turned around thesites just prior to arrival. The AATSR data indicate that the air mass arriving in Helsinkipassed over the area in southern Finland which was still influenced by transportedaerosol with enhanced AOD, whereas the airmass arriving in Hyytiala had passed over25
areas with lower AOD (although not clean background). On 6 May (Fig. 3c) we seea different situation for the air masses arriving in Hyytiala and Varrio versus the onearriving in Helsinki, which again comfirms the conclusions from the ground-based insitu and satellite observations while on the other hand they provide complementary
8467

BGD8, 8451–8483, 2011
On the use ofsatellites
G. de Leeuw et al.
Title Page
Abstract Introduction
Conclusions References
Tables Figures
J I
J I
Back Close
Full Screen / Esc
Printer-friendly Version
Interactive Discussion
Discussion
Paper
|D
iscussionP
aper|
Discussion
Paper
|D
iscussionP
aper|
information which contributes to explanation which is not available from the observa-tions alone. First we see that all trajectories were from much closer regions than on theprevious days (note that all trajectories were calcualted for 96 h), indicating stagnantair in the presence of a high pressure area. The air mass arriving in Helsinki appearsto have resided over a relatively small area with enhanced AOD on 6 May as shown5
by the AATSR retrievals, and likely also on the previous day. In contrast, the air massarriving in Hyytiala had resided over the Baltic sea and passsed over clean areas inFinland prior to arrival. The airmass arriving in Varrio had been completely over landduring the last 4 days.
GLOMAP model results are used as a third source of information. As an exam-10
ple, Figure 5 shows the global distribution of AOD for 2 May 2006 produced usingGLOMAP. The large influence of forest fires on the AOD over Finland, Scandinavia andthe area over the North Atlantic to the N and NW is clearly observed and supportsthe AATSR and ground-based observations. The spatial distribution over the areas forwhich AATSR-retrieved AOD was presented in Fig. 3 is similar to these satellite data,15
albeit with much coarser resolution which reveals less detail than the 10◦ ×10◦ AATSRresolution.
7 Discussion and conclusion
The ALANIS-Aerosol project is a feasibility study on the use of existing satellite prod-ucts for discriminating between natural aerosols emitted by boreal Eurasian forests20
and long-range transported anthropogenic aerosols. Discrimination between naturaland anthropogenic aerosols using satellite observations only has been demonstratedbefore (see overview in Sect. 2) but usually requires high AOD (>∼0.3) and certain as-sumptions (Holzer-Popp et al., 2002a, b). Over the boreal Eurasian forests the AOD isusually low (<0.2 over 2006–2010, with a natural background on the order of 0.05–0.1).25
The case presented for 2–6 May shows that useful information can also be obtainedfor these conditions. Particles formed by nucleation are too small to be optically active
8468

BGD8, 8451–8483, 2011
On the use ofsatellites
G. de Leeuw et al.
Title Page
Abstract Introduction
Conclusions References
Tables Figures
J I
J I
Back Close
Full Screen / Esc
Printer-friendly Version
Interactive Discussion
Discussion
Paper
|D
iscussionP
aper|
Discussion
Paper
|D
iscussionP
aper|
and it takes several days before they grow into sizes which allow them to be observedwith optical instruments.
Particles larger than about 50–100 nm scatter light in the solar spectrum with anintensity that is large enough to be observed by optical instruments such as neph-elometers and, provided that their concentrations are large enough, to scatter enough5
light to attenuate incoming solar radiation and thus influence the AOD.In this paper we show how satellite and ground-based in situ data are complemen-
tary in their detection of transport of aerosol from elsewhere and affecting the AODand concentration levels over Finland. When the satellite could not observe the aerosolplume due to clouds the local measurements of enhanced aerosol concentrations were10
indicative of the presence of pollution transported form elsewhere. When the localmeasurements indicated a clean case, the satellite showed that the plume had movedaway from Hyytiala and was situated more to the SE. Conclusions derived from theground-based in situ and AATSR measurements are confirmed by air mass trajecto-ries. Initial GLOMAP model results confirm the large influence of forest fires on the15
AOD over Finland, Scandinavia and the area over the North Atlantic to the N and NW.In future studies all information from satellite and ground-based observations will beused together with the GLOMAP model results to analyze this and other cases on thetransport of pollution over Eurasia and the effects of anthropogenic aerosol on thisspecific environment.20
Acknowledgements. The work presented in this paper has been undertaken in the frame-work of the ESA project STSE-ALANIS Atmosphere-Land-Interaction Study, Theme 3 Aerosols(Contract No 4200023053/10/I-LG). Figure 1 was provided by Heikki Junninen (Dept. ofPhysics, Univ. of Helsinki).
8469

BGD8, 8451–8483, 2011
On the use ofsatellites
G. de Leeuw et al.
Title Page
Abstract Introduction
Conclusions References
Tables Figures
J I
J I
Back Close
Full Screen / Esc
Printer-friendly Version
Interactive Discussion
Discussion
Paper
|D
iscussionP
aper|
Discussion
Paper
|D
iscussionP
aper|
References
Aaltonen, V., Rodriguez, E., Kazadzis, S., Arola, A., Amiridis, V., Lihavainen, H., and de Leeuw,G.: On the variation of aerosol properties over Finland based on the optical columnar mea-surements, Atm. Res., doi:10.1016/j.atmosres.2011.07.014, in press, 2011.
Andreae, M. O.: Aerosols before pollution, Science, 315, 50–51, 2007.5
Andreae, M. O. and Rosenfeld, D.: Aerosol-cloud-precipitation interactions, Part 1. The natureand sources of cloud-active particles, Earth-Sci. Rev., 89, 13–41, 2008.
Arneth, A., Niinemets, U., Pressley, S., Back, J., Hari, P., Karl, T., Noe, S., Prentice, I. C., Serca,D., Hickler, T., Wolf, A., and Smith, B.: Process-based estimates of terrestrial ecosystemisoprene emissions: incorporating the effects of a direct CO2-isoprene interaction, Atmos.10
Chem. Phys., 7, 31–53, doi:10.5194/acp-7-31-2007, 2007.Arneth, A., Sitch, S., Bondeau, A., Butterbach-Bahl, K., Foster, P., Gedney, N., de Noblet-
Ducoudr, N., Prentice, I. C., Sanderson, M., Thonicke, K., Wania, R., and Zaehle, S.:From biota to chemistry and climate: towards a comprehensive description of trace gas ex-change between the biosphere and atmosphere, Biogeosciences Discuss., 6, 7717–7788,15
doi:10.5194/bgd-6-7717-2009, 2009.Arneth, A., Harrison, S. P., Zaehle, S., Tsigaridis, K., Menon, S., Bartlein, P. J., Feichter,
J., Korhola, A., Kulmala, M., O’Donnell, D., Schurgers, G., Sorvari, S., and Vesala, T.:Terrestrial biogeochemical feedbacks in the climate system, Nat. Geosci., 3, 525–532,doi:510.1038/ngeo1905, 2010.20
Arola, A., Lindfors, A., Natunen, A., and Lehtinen, K. E. J.: A case study on biomass burningaerosols: effects on aerosol optical properties and surface radiation levels, Atmos. Chem.Phys., 7, 4257–4266, doi:10.5194/acp-7-4257-2007, 2007.
Bonn, B. and Moortgat, G. K.: Sesquiterpene ozonolysis: Origin of atmospheric new parti-cle formation from biogenic hydrocarbons, Geophys. Res. Lett., 30(11), 1585, 39-1–39-4,25
doi:1510.1029/2003GL017000, 2003.Claeys, M., Graham, B., Vas, G., Wang, W., Vermeylen, R., Pashynska, V., Cafmeyer, J.,
Guyon, P., Andreae, M. O., Artaxo, P., and Maenhaut, W.: Formation of secondary organicaerosols through photooxidation of isoprene, Science, 303, 1173–1176, 2004.
Curier, L., de Leeuw, G., Kolmonen, P., Sundstrom, A.-M., Sogacheva, L., and Bennouna,30
Y.: Aerosol retrieval over land using the ATSR dual-view algorithm, in: Satellite AerosolRemote Sensing Over Land, edited by: Kokhanovsky, A. A. and de Leeuw, G., Springer-
8470

BGD8, 8451–8483, 2011
On the use ofsatellites
G. de Leeuw et al.
Title Page
Abstract Introduction
Conclusions References
Tables Figures
J I
J I
Back Close
Full Screen / Esc
Printer-friendly Version
Interactive Discussion
Discussion
Paper
|D
iscussionP
aper|
Discussion
Paper
|D
iscussionP
aper|
Praxis (Berlin), 2009.Draxler, R. R. and Hess, G. D.: An Overview of the HYSPLIT 4 Modeling System for Trajecto-
ries, Dispersion and Deposition, Aust. Meteorol. Mag., 47, 295–308, 1998.Ginoux, P., Garbuzov, D., and Hsu, N. C.: Identification of anthropogenic and natural dust
sources using Moderate Resolution Imaging Spectroradiometer (MODIS) Deep Blue level 25
data, J. Geophys. Res., 115, D05204, doi:10.1029/2009JD012398, 2010.Griffits, F. B., Bates, T. S., Quinn, P. K., Clementson, L. A., and Parslow, J. S.: The ocieano-
graphic context of the First Aerosol Characterization Experiment (ACE 1): A physical, chem-ical and biological overview, J. Geophys. Res., 104, 21649–21671, 1999.
Hallquist, M., Wenger, J. C., Baltensperger, U., Rudich, Y., Simpson, D., Claeys, M., Dommen,10
J., Donahue, N. M., George, C., Goldstein, A. H., Hamilton, J. F., Herrmann, H., Hoffmann,T., Iinuma, Y., Jang, M., Jenkin, M. E., Jimenez, J. L., Kiendler-Scharr, A., Maenhaut, W.,McFiggans, G., Mentel, Th. F., Monod, A., Prvt, A. S. H., Seinfeld, J. H., Surratt, J. D.,Szmigielski, R., and Wildt, J.: The formation, properties and impact of secondary organicaerosol: current and emerging issues, Atmos. Chem. Phys., 9, 5155–5236, doi:10.5194/acp-15
9-5155-2009, 2009.Hari, P. and Kulmala, M.: Station for measuring Ecosystem-Atmosphere relations (SMEAR II),
Boreal Env. Res., 10, 315–322, 2005.Holben, B. N., Eck, T. F., Slutsker, I., Tanre, D., Buis, J. P., Setzer, A., Vermote, E., Reagan,
J. A., Kaufman, Y., Nakajima, T., Lavenu, F., Jankowiak, I., and Smirnov, A.: AERONET -20
A federated instrument network and data archive for aerosol characterization, Rem. Sens.Environ., 66, 1–16, 1998.
Holzer-Popp, T., Schroedter, M., and Gesell, G.: Retrieving aerosol optical depth and type inthe boundary layer over land and ocean from simultaneous GOME spectrometer and ATSR-2 radiometer measurements, 1, Method description, J. Geophys. Res., 107(D21), 4578,25
doi:10.1029/2001JD002013, 2002a.Holzer-Popp, T., Schroedter, M., and Gesell, G.: Retrieving aerosol optical depth and type in
the boundary layer over land and ocean from simultaneous GOME spectrometer and ATSR-2 radiometer measurements, 2, Case study application and validation, J. Geophys. Res.,107(D24), 4770, doi:10.1029/2002JD002777, 2002b.30
Huebert, B. T., Bates, T., Russell, P. B., Shi, G. Y., Kim, Y. J., Kawamura, K., Carmichael,G., and Nakajima, T.: On overview of ACE-Asia: Strategies for quantifying the relation-ships between Asian aerosols and their climatic impacts, J. Geophys. Res., 108(D23), 8633,
8471

BGD8, 8451–8483, 2011
On the use ofsatellites
G. de Leeuw et al.
Title Page
Abstract Introduction
Conclusions References
Tables Figures
J I
J I
Back Close
Full Screen / Esc
Printer-friendly Version
Interactive Discussion
Discussion
Paper
|D
iscussionP
aper|
Discussion
Paper
|D
iscussionP
aper|
doi:10.1029/2003JD003550, 2003.Kanakidou, M., Tsigaridis, K., Dentener, F. J., and Crutzen, P. J.: Human-activity-enhanced
formation of organic aerosols by biogenic hydrocarbon oxidation, J. Geophys. Res., 105(D7),9243–9354, doi:10.1029/1999JD900977, 2000.
Kanawade, V. P., Jobson, B. T., Guenther, A. B., Erupe, M. E., Pressley, S. N., Tripathi, S. N.,5
and Lee, S.-H.: Isoprene suppression of new particle formation in a mixed deciduous forest,Atmos. Chem. Phys., 11, 6013–6027, doi:10.5194/acp-11-6013-2011, 2011.
Kaufman, Y. J., Boucher, O., Tanre, D., Chin, M., Remer, L. A., and Takemura, T.: Aerosolanthropogenic component estimated from satellite data, Geophys. Res. Lett., 32, L17804,doi:10.1029/2005GL023125, 2005.10
Kerminen, V.-M., Lihavainen, H., Komppula, M., Viisanen, Y., and Kulmala, M.: Direct observa-tional evidence linking atmospheric aerosol formation and cloud droplet activation, Geophys.Res. Lett., 32, L14803, doi:10.1029/2005GL023130, 2005.
Kiendler-Scharr, A., Wildt, J., Dal Maso, M., Hohaus, T., Kleist, E., Mentel, T. F., Tillmann,R., Uerlings, R., Schurr, U., and Wahner, A.: New particle formation in forests inhibited by15
isoprene emissions, Nature, 461(7262), 381–384, doi:310.1038/nature08292, 2009.Kim, J., Lee, J., Lee, H. C., Higurashi, A., Takemura, T., and Song, C. H.: Consistency
of the aerosol type classification from satellite remote sensing during the AtmosphericBrown Cloud–East Asia Regional Experiment campaign, J. Geophys. Res., 112, D22S33,doi:10.1029/2006JD008201, 2007.20
Kulmala, M., Hameri, K., Aalto, P. P., Makela, J. M., Pirjola, L., Nilsson, E. D., Buzorius, G.,Rannik, U., Dal Maso, M., Seidl, W., Hoffman, T., Janson, R., Hansson, H.-C., Viisanen, Y.,Laaksonen, A., and O’Dowd, C. D.: Overview of the international project on biogenic aerosolformation in the boreal forest (BIOFOR), Tellus, 53B, 324–343, 2001.
Kulmala, M., Suni, T., Lehtinen, K. E. J., Dal Maso, M., Boy, M., Reissell, A., Rannik, U.,25
Aalto, P., Keronen, P., Hakola, H., Back, J., Hoffmann, T., Vesala, T., and Hari, P.: A newfeedback mechanism linking forests, aerosols, and climate, Atmos. Chem. Phys., 4, 557–562, doi:10.5194/acp-4-557-2004, 2004.
Kulmala, M., Kerminen, V.-M., Laaksonen, A., Riipinen, I., Sipila, M., Ruuskanen, T. M., So-gacheva, L., Hari, P., Back, J., Lehtinen, K. E. J., Viisanen, Y., Bilde, M., Svenningsson, B.,30
Larzridis, M., Tørseth, K., Tunved, P., Nilsson, E. D., Pryor, S., Sørensen, L.-L., Horrak, U.,Winkler, P. M., Swietlicki, E., Riekkola, M.-L., Krejci, R., Hoyle, C., Hov, Ø, Myhre, G., andHansson, H.-C.: Overview of BACCI (Biosphere-Aerosol-Cloud-Climate Interactions) stud-
8472
BGD8, 8451–8483, 2011
On the use ofsatellites
G. de Leeuw et al.
Title Page
Abstract Introduction
Conclusions References
Tables Figures
J I
J I
Back Close
Full Screen / Esc
Printer-friendly Version
Interactive Discussion
Discussion
Paper
|D
iscussionP
aper|
Discussion
Paper
|D
iscussionP
aper|
ies, Tellus, 60B, 300–317, 2008.Kulmala, M., Asmi, A., Lappalainen, H. K., Carslaw, K. S., Poschl, U., Baltensperger, U., Hov,
Ø., Brenquier, J.-L., Pandis, S. N., Facchini, M. C., Hansson, H.-C., Wiedensohler, A., andO’Dowd, C. D.: Introduction: European Integrated Project on Aerosol Cloud Climate andAir Quality interactions (EUCAARI) integrating aerosol research from nano to global scales,5
Atmos. Chem. Phys., 9, 2825–2841, doi:10.5194/acp-9-2825-2009, 2009.Kulmala, M., Arola, A., Nieminen, T., Riuttanen, L., Sogacheva, L., de Leeuw, G., Kerminen,
V.-M., and Lehtinen, K. E. J.: The first estimates of global nucleation mode aerosol concen-trations based on satellite measurements, Atmos. Chem. Phys. Discuss., 11, 18823–18852,doi:10.5194/acpd-11-18823-2011, 2011.10
Kusmierczyk-Michulec, J., De Leeuw, G., and Moerman, M. M.: Physical and optical aerosolproperties at the Dutch North Sea coast based on AERONET observations, Atmos. Chem.Phys., 7, 3481–3495, doi:10.5194/acp-7-3481-2007, 2007.
Lerot, C., Stavrakou, T., De Smedt, I., Muller, J.-F., and Van Roozendael, M.: Glyoxal verticalcolumns from GOME-2 backscattered light measurements and comparisons with a global15
model, Atmos. Chem. Phys., 10, 12059–12072, doi:10.5194/acp-10-12059-2010, 2010.Lihavainen, H., Kerminen, V.-M., Tunved, P., Aaltonen, V., Arola, A., Hatakka, J., Hyvarinen,
A., and Viisanen, Y.: Observational signature of the direct radiative effect by natural borealforest aerosols and its relation to the corresponding first indirect effect, J. Geophys. Res.,114, D20206, doi:10.1029/2009JD012078, 2009.20
Liu, H., Pinker, R. T., and Holben, B. N.: A Global view of aerosols from mergedtransport models, satellite, and ground observations. J. Geophys. Res., 110, D10S15,doi:10.1029/2004JD004695, 2005.
Manktelow, P. T., Carslaw, K. S., Mann, G. W., and Spracklen, D. V.: Variable CCN formationpotential of regional sulfur emissions, Atmos. Chem. Phys., 9, 3253–3259, doi:10.5194/acp-25
9-3253-2009, 2009.Merikanto, J., Spracklen, D. V., Mann, G. W., Pickering, S. J., and Carslaw, K. S.: Impact of
nucleation on global CCN, Atmos. Chem. Phys., 9, 8601–8616, doi:10.5194/acp-9-8601-2009, 2009.
Millet, D. B., Jacob, D. J., Turquety, S., Hudman, R. C., Wu, S., Fried, A., Walega, J., Heikes,30
B. G., Blake, D. R., Singh, H. B., Anderson, B. E., and Clarke, A. D.: Formaldehyde distri-bution over North America: Implications for satellite retrievals of formaldehyde columns andisoprene emission, J. Geophys. Res., 111, D24S02, doi:10.1029/2005JD006853, 2006.
8473

BGD8, 8451–8483, 2011
On the use ofsatellites
G. de Leeuw et al.
Title Page
Abstract Introduction
Conclusions References
Tables Figures
J I
J I
Back Close
Full Screen / Esc
Printer-friendly Version
Interactive Discussion
Discussion
Paper
|D
iscussionP
aper|
Discussion
Paper
|D
iscussionP
aper|
Millet, D. B., Jacob, D. J., Boersma, K. F., Fu, T.-M., Kurosu, T. P., Chance, K., Heald, C. L., andGuenther, A.: Spatial distribution of isoprene emissions from North America derived fromformaldehyde column measurements by the OMI satellite sensor, J. Geophys. Res., 113,D02307, doi:10.1029/2007JD008950, 2008.
Palmer, P. I., Jacob, D. J., Fiore, A. M., Martin, R. V., Chance, K., and Kurosu, T. P.: Map-5
ping isoprene emissions over North America using formaldehyde column observations fromspace, J. Geophys. Res., 108(D6), 4180, doi:4110.1029/2002JD002153, 2003.
Paulot, F., Crounse, J. D., Kjaergaard, H. G., Kurten, A., St. Clair, J. M., Seinfeld, J. H., andWennberg, P. O.:, Unexpected epoxide formation in the gas-phase photooxidation of iso-prene, Science, 325(5941), 730–733, doi:710.1126/science.1172910, 2009.10
Petaja, T., Mauldin, III, R. L., Kosciuch, E., McGrath, J., Nieminen, T., Paasonen, P., Boy, M.,Adamov, A., Kotiaho, T., and Kulmala, M.: Sulfuric acid and OH concentrations in a borealforest site, Atmos. Chem. Phys., 9, 7435–7448, doi:10.5194/acp-9-7435-2009, 2009.
Philippin, S., Laj, P., Putaud, J.-P., Wiedensohler, A., de Leeuw, G., Fjaeraa, A. M., Platt,U., Baltensperger, U., and Fiebig, M.: EUSAAR – An Unprecedented Network of Aerosol15
Observation in Europe, Earozoru Kenkyu, JAAST, 24(2), 78–83, 2009.Raes, F., Bates, T. S., McGovern, F., and Vanliedekerke, M.: The second Aerosol Charac-
terization Experiment (ACE-2): General overview and main results, Tellus, 52B, 111–125,2000.
Ramanathan, V., Crutzen, P. J., Lelieveld, J., Mitra, A. P., Althausen, D., Anderson, J., Andreae,20
M. O., Cantrell, W., Cass, G. R., Chung, C. E., Clarke, A. D., Coakley, J. A., Collins, W.D., Conant, W. C., Dulac, F., Heintzenberg, J., Heymsfield, A. J., Holben, B., Howell, S.,Hudson, J., Jayaraman, A., Kiehl, J. T., Krishnamurti, T. N., Lubin, D., McFarquhar, G., No-vakov, T., Ogren, J. A., Podgorny, I. A., Prather, K., Priestley, K., Prospero, J. M., Quinn, P.K., Rajeev, K., Rasch, P., Rupert, S., Sadourny, R., Satheesh, S. K., Shaw, G. E., Sheri-25
dan, P., and Valero, F. P. J.: Indian Ocean Experiment: An integrated analysis of the cli-mate forcing and effects of the great Indo-Asian haze, J. Geophys. Res., 106, 28371–28398,doi:10.1029/2001JD900133, 2001.
Robles Gonzalez, C.: Retrieval of Aerosol Properties Using ATSR-2, Observations and TheirInterpretation, Ph.D. thesis, University of Utrecht, 2003.30
Robles-Gonzalez, C. and de Leeuw, G.,: Aerosol properties over the SAFARI-2000 area re-trieved from ATSR-2, J. Geophys. Res., 113, D05206, doi:10.1029/2007JD008636, 2008.
Robles-Gonzalez, C., de Leeuw, G., Decae, R., Kusmierczyk-Michulec, J., and Stammes, P.:
8474

BGD8, 8451–8483, 2011
On the use ofsatellites
G. de Leeuw et al.
Title Page
Abstract Introduction
Conclusions References
Tables Figures
J I
J I
Back Close
Full Screen / Esc
Printer-friendly Version
Interactive Discussion
Discussion
Paper
|D
iscussionP
aper|
Discussion
Paper
|D
iscussionP
aper|
Aerosol properties over the Indian Ocean Experiment (INDOEX) campaign area retrievedfrom ATSR-2, J. Geophys. Res., 111, D15205, doi:10.1029/2005JD006184, 2006.
Rohrer, F. and Berresheim, H.: Strong correlation between level of tropospheric hydroxyl radi-cals and solar ultraviolet radiation, Nature, 442, 184–187, 2006.
Schurgers, G., Arneth, A., Holzinger, R., and Goldstein, A. H.: Process-based modelling of5
biogenic monoterpene emissions combining production and release from storage, Atmos.Chem. Phys., 9, 3409–3423, doi:10.5194/acp-9-3409-2009, 2009.
Shim, C., Wang, Y., Choi, Y., Palmer, P. I., Abbot, D. S., and Chance, K.: Constraining globalisoprene emissions with Global Ozone Monitoring Experiment (GOME) formaldehyde col-umn measurements, J. Geophys. Res., 110, D24301, doi:10.1029/2004JD005629, 2005.10
Shindell, D. T., Chin, M., Dentener, F., Doherty, R. M., Faluvegi, G., Fiore, A. M., Hess, P.,Koch, D. M., MacKenzie, I. A., Sanderson, M. G., Schultz, M. G., Schulz, M., Stevenson, D.S., Teich, H., Textor, C., Wild, O., Bergmann, D. J., Bey, I., Bian, H., Cuvelier, C., Duncan, B.N., Folberth, G., Horowitz, L. W., Jonson, J., Kaminski, J. W., Marmer, E., Park, R., Pringle,K. J., Schroeder, S., Szopa, S., Takemura, T., Zeng, G., Keating, T. J., and Zuber, A.: A multi-15
model assessment of pollution transport to the Arctic, Atmos. Chem. Phys., 8, 5353–5372,doi:10.5194/acp-8-5353-2008, 2008.
Slowik, J. G., Stroud, C., Bottenheim, J. W., Brickell, P. C., Chang, R. Y.-W., Liggio, J., Makar,P. A., Martin, R. V., Moran, M. D., Shantz, N. C., Sjostedt, S. J., van Donkelaar, A., Vlasenko,A., Wiebe, H. A., Xia, A. G., Zhang, J., Leaitch, W. R., and Abbatt, J. P. D.: Characterization20
of a large biogenic secondary organic aerosol event from eastern Canadian forests, Atmos.Chem. Phys., 10, 2825–2845, doi:10.5194/acp-10-2825-2010, 2010.
Sofiev, M., Siljamo, P., Valkama, I., Ilvonen, M., and Kukkonen, J.: A dispersion modellingsystem SILAM and its evaluation against ETEX data, Atmosph. Environ., 40, 674–685,doi:10.1016/j.atmosenv.2005.09.069, 2006.25
Spracklen, D. V., Pringle, K. J., Carslaw, K. S., Chipperfield, M. P., and Mann, G. W.: A globaloff-line model of size-resolved aerosol microphysics: II. Identification of key uncertainties,Atmos. Chem. Phys., 5, 3233–3250, doi:10.5194/acp-5-3233-2005, 2005.
Spracklen, D. V., Carslaw, K. S., Kulmala, M., Kerminen, V.-M., Mann, G. W., Sihto, S.-L.: Thecontribution of boundary layer nucleation events to total particle concentrations on regional30
and global scales, Atmos. Chem. Phys., 6, 5631–5648, doi:10.5194/acp-6-5631-2006, 2006.Spracklen, D. V., Carslaw, K. S., Kulmala, M., Kerminen, V.-M., Sihto, S.-L., Riipinen, I.,
Merikanto, J., Mann, G. W., Chipperfield, M. P., Wiedensohler, A., Birmili, W., and Lihavainen,
8475

BGD8, 8451–8483, 2011
On the use ofsatellites
G. de Leeuw et al.
Title Page
Abstract Introduction
Conclusions References
Tables Figures
J I
J I
Back Close
Full Screen / Esc
Printer-friendly Version
Interactive Discussion
Discussion
Paper
|D
iscussionP
aper|
Discussion
Paper
|D
iscussionP
aper|
H.: Contribution of particle formation to global cloud condensation nuclei concentrations,Geophys. Res. Lett., 35, L06808, doi:10.1029/2007GL033038, 2008.
Spracklen, D. V., Carslaw, K. S., Merikanto, J., Mann, G. W., Reddington, C. L., Pickering, S.,Ogren, J. A., Andrews, E., Baltensperger, U., Weingartner, E., Boy, M., Kulmala, M., Laakso,L., Lihavainen, H., Kivekas, N., Komppula, M., Mihalopoulos, N., Kouvarakis, G., Jennings,5
S. G., O’Dowd, C., Birmili, W., Wiedensohler, A., Weller, R., Gras, J., Laj, P., Sellegri, K.,Bonn, B., Krejci, R., Laaksonen, A., Hamed, A., Minikin, A., Harrison, R. M., Talbot, R.,and Sun, J.: Explaining global surface aerosol number concentrations in terms of primaryemissions and particle formation, Atmos. Chem. Phys., 10, 4775–4793, doi:10.5194/acp-10-4775-2010, 2010.10
Stohl, A., Berg, T., Burkhart, J. F., Fjae’raa, A. M., Forster, C., Herber, A., Hov, Ø., Lunder, C.,McMillan, W. W., Oltmans, S., Shiobara, M., Simpson, D., Solberg, S., Stebel, K., Strom,J., Tørseth, K., Treffeisen, R., Virkkunen, K., and Yttri, K. E.: Arctic smoke record high airpollution levels in the European Arctic due to agricultural fires in Eastern Europe in spring2006, Atmos. Chem. Phys., 7, 511–534, doi:10.5194/acp-7-511-2007, 2007.15
Sundstrom, A.-M., de Leeuw, G., Kolmonen, P., Sogacheva, L., and Curier, L.: Smoke plumedetection with (A)ATSR over land, MERIS-AATSR, ESRIN, Frascati, September 2008.
Sundstrom, A.-M., Kolmonen, P., Sogacheva, L., and de Leeuw, G.: Aerosol retrievals overChina with the AATSR Dual-View Algorithm, Accepted for publication in Rem. Sensing of theEnv. (AATSR special issue), 2011.20
Tunved, P., Hansson, H.-C., Kerminen, V.-M., Strom, J., Dal Maso, M., Lihavainen, H., Viisanen,Y., Aalto, P. P., Komppula, M., and Kulmala, M.: High natural aerosol loading over borealforests, Science, 312, 261–263, 2006.
Tunved, P., Strom, J., Kulmala, M., Kerminen, V.-M., Dal Maso, M., Svenningson, B., Lunder,C., and Hansson, H.-C.,: The natural aerosol over Northern Europe and its relation to an-25
thropogenic emissions – implications of important climate feedbacks, Tellus, 60B, 473–484,2008.
Veefkind, J. P., de Leeuw, G., and Durkee, P. A.: Retrieval of aerosol optical depth over landusing two-angle view satellite radiometry during TARFOX, Geophys. Res. Letters., 25(16),3135–3138, 1998.30
Veefkind, J. P., Boersma, K. F., Wang, J., Kurosu, T. P., Krotkov, N., Chance, K., and Levelt,P. F.: Global satellite analysis of the relation between aerosols and short-lived trace gases,Atmos. Chem. Phys., 11, 1255–1267, doi:10.5194/acp-11-1255-2011, 2011.
8476

BGD8, 8451–8483, 2011
On the use ofsatellites
G. de Leeuw et al.
Title Page
Abstract Introduction
Conclusions References
Tables Figures
J I
J I
Back Close
Full Screen / Esc
Printer-friendly Version
Interactive Discussion
Discussion
Paper
|D
iscussionP
aper|
Discussion
Paper
|D
iscussionP
aper|
Virkkula, A., Backman, J., Aalto, P. P., Hulkkonen, M., Riuttanen, L., Nieminen, T., dal Maso,M., Sogacheva, L., de Leeuw, G., and Kulmala, M.: Seasonal cycle, size dependencies,and source analyses of aerosol optical properties at the SMEAR II measurement stationin Hyytiala, Finland, Atmos. Chem. Phys., 11, 4445–4468, doi:10.5194/acp-11-4445-2011,2011.5
Vrekoussis, M., Wittrock, F., Richter, A., and Burrows, J. P.: GOME-2 observations of oxy-genated VOCs: what can we learn from the ratio glyoxal to formaldehyde on a global scale?,Atmos. Chem. Phys. Discuss., 10, 19031–19069, doi:10.5194/acpd-10-19031-2010, 2010.
Weber, R. J., Marti, J. J., McMurry, P. H., Eisele, F. L., Tanner, D. J., and Jefferson, A.: Mea-surements of new particle formation and ultrafine particle growth rates at a clean continental10
site, J. Geophys. Res., 102(D4), 4375–4385, doi:10.1029/96JD03656, 1997.Wehrli, C.: Remote Sensing of Aerosol Optical Depth in a Global Surface Network, Swiss
Federal Institute of Technology Zurich, DISS., ETH NO. 17591, 2008.Yu, H., Chin, M., Remer, L. A., Kleidman, R. G., Bellouin, N., Bian, H., and Diehl, T.: Variability
of marine aerosol fine-mode fraction and estimates of anthropogenic aerosol component15
over cloud-free oceans from the Moderate Resolution Imaging Spectroradiometer (MODIS),J. Geophys. Res., 114, D10206, doi:10.1029/2008JD010648, 2009.
8477

BGD8, 8451–8483, 2011
On the use ofsatellites
G. de Leeuw et al.
Title Page
Abstract Introduction
Conclusions References
Tables Figures
J I
J I
Back Close
Full Screen / Esc
Printer-friendly Version
Interactive Discussion
Discussion
Paper
|D
iscussionP
aper|
Discussion
Paper
|D
iscussionP
aper|
Table 1. Satellite data products which can potentially be used to discriminate between aerosolsof natural and anthropogenic origin.
Data product Satellite/Instrument Satellite life-time
Website
SO2 ESA EN-VISAT/SCIAMACHYESA ERS-1/GOMEESA EUMETSAT MetOp-A/GOME-2NASA Aura / OMI
2002 –present1995 –present2006 –present2004 –present
http://www.gse-promote.org/services/so2/http://disc.sci.gsfc.nasa.gov/Aura/data-holdings/OMI/omso2 v003.shtml
UV at several wavelengths NASA Aura / OMI 2004 –present
http://disc.sci.gsfc.nasa.gov/Aura/data-holdings/OMI/omuvb v003.shtml
AOD ESA ENVISAT/MERISESA ENVISAT/AATSRNASA Terra/MODISNASA Agua/MODISNASA Terra/MISR
2002 –present2002 –present1999 –present2002 –present1999 –present
http://envisat.esa.int/instruments/meris/http://envisat.esa.int/instruments/aatsr/http://modis.gsfc.nasa.gov/http://www-misr.jpl.nasa.gov/
CHO.CHO ESA EN-VISAT/SCIAMACHYESA EUMETSAT MetOp-A/GOME-2NASA Aura / OMI
2002 –present2006 –present2004 –present
http://envisat.esa.int/instruments/sciamachy/http://www.doas-bremen.de/glyoxal fromscia.htmhttp://disc.sci.gsfc.nasa.gov/Aura/data-holdings/OMI/omso2 v003.shtml
HCHO ESA EN-VISAT/SCIAMACHYESA EUMETSAT MetOp-A/GOME-2NASA Aura / OMI
2002 –present2006 –present2004 –present
http://www.iup.uni-bremen.de/doas/hcho from scia.htmhttp://disc.sci.gsfc.nasa.gov/Aura/dataholdings/OMI/omhcho v003.shtml
CO EUMETSAT METOP /IASIESA ENVISAT/MIPASNASA Terra /MOPITTNASA Aura /TES
2006 –present2002 –present1999 –present2004 -present
http://www.esa.int/esaLP/SEMM36BUQPE LPmetop 0.htmlhttp://envisat.esa.int/instruments/mipas/http://terra.nasa.gov/About/MOPITT/about mopitt.htmlhttp://tes.jpl.nasa.gov/
NO2 ESA EN-VISAT/SCIAMACHYESA ERS-1/GOMEESA EUMETSAT MetOp-A/GOME-2NASA Aura / OMI
2002 –present1995 –present2006 –present2004 –present
http://www.temis.nl/airpollution/no2.htmlhttp://disc.sci.gsfc.nasa.gov/Aura/data-holdings/OMI/omno2 v003.shtml
LAI ESA / Several instrumentsin GLOBCARBONMODIS
1999 –present2002 –present
http://modis-land.gsfc.nasa.gov/lai.htm
NDVI/EVI ESA ENVISAT/MERISNASA Terra/MODISNASA Agua/MODIS
2002 –present1999 –present2002 –present
http://earth.esa.int/object/index.cfm?fobjectid=1618http://modis-land.gsfc.nasa.gov/vi.htm
8478

BGD8, 8451–8483, 2011
On the use ofsatellites
G. de Leeuw et al.
Title Page
Abstract Introduction
Conclusions References
Tables Figures
J I
J I
Back Close
Full Screen / Esc
Printer-friendly Version
Interactive Discussion
Discussion
Paper
|D
iscussionP
aper|
Discussion
Paper
|D
iscussionP
aper|
Fig. 1. Measurements sites in the boreal forest zone in Eurasia which currently are in operation.
8479
BGD8, 8451–8483, 2011
On the use ofsatellites
G. de Leeuw et al.
Title Page
Abstract Introduction
Conclusions References
Tables Figures
J I
J I
Back Close
Full Screen / Esc
Printer-friendly Version
Interactive Discussion
Discussion
Paper
|D
iscussionP
aper|
Discussion
Paper
|D
iscussionP
aper|
Fig. 2. AOD (550 nm) over Northern Europe retrieved from AATSR observations on 1, 2 and 3September 2005. The figure is a composite of three tracks, with the most western track on 1September, the middle one on 2 September and the most eastern one on 3 September. TheAOD values are given on the colour scale on the rhs of the map. White areas indicate that noaerosol properties could be retrieved due to the presence of clouds or over the mountains nearthe Norwegian coast. North of 67◦ N the solar zenith angle was too small for aerosol retrieval.The red lines are the 96-hour back trajectories for air masses arriving in Helsinki, Hyytiala andVarrio on 2 September at 12:00 GMT.
8480

BGD8, 8451–8483, 2011
On the use ofsatellites
G. de Leeuw et al.
Title Page
Abstract Introduction
Conclusions References
Tables Figures
J I
J I
Back Close
Full Screen / Esc
Printer-friendly Version
Interactive Discussion
Discussion
Paper
|D
iscussionP
aper|
Discussion
Paper
|D
iscussionP
aper|
(a)
(b) (c)
Fig. 3. AATSR-retrieved AOD at 555 nm over Finland and neighbouring countries for 2, 5 and6 May 2006, see Fig. 2 for further explanation. The symbols in Fig. 3a indicate the presence offorest fires as detected by AATSR on the same day (*), one day before (♦) and two days before(o). The red lines are the 96-hour back trajectories for air masses arriving in Helsiki, Hyytialaand Varrio at 12:00 GMT.
8481

BGD8, 8451–8483, 2011
On the use ofsatellites
G. de Leeuw et al.
Title Page
Abstract Introduction
Conclusions References
Tables Figures
J I
J I
Back Close
Full Screen / Esc
Printer-friendly Version
Interactive Discussion
Discussion
Paper
|D
iscussionP
aper|
Discussion
Paper
|D
iscussionP
aper|
Fig. 4. Particle volume distributions (left) and total number, surface area and volume concentrations (right) measuredin Hyytiala for 2 May (top, doy 122) and for 5 (doy 125) and 6 May 2006 (doy 126) (bottom). The particle sizedistributions are plotted as time series of the particle diameter with the colour (scale on the right) indicating the particlevolume concentrations dV/d logDp in µm3 cm −3.
8482
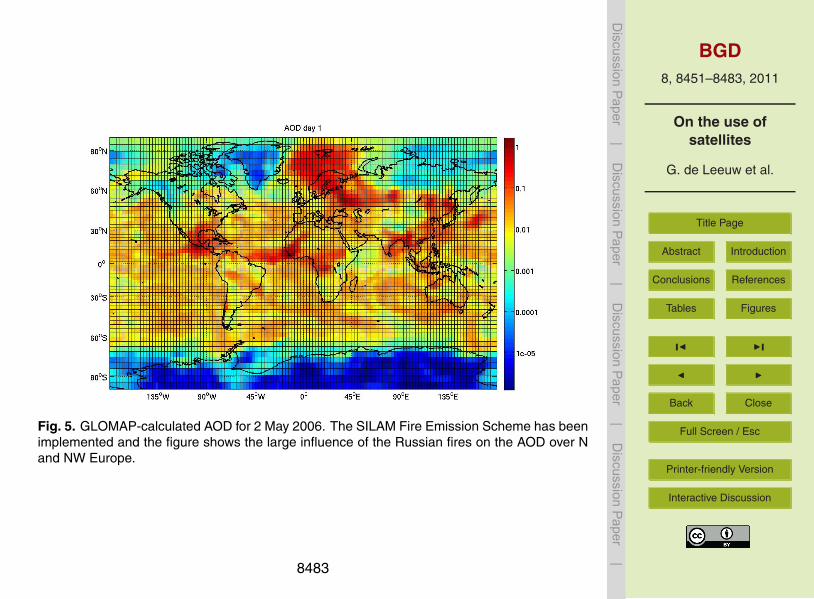
BGD8, 8451–8483, 2011
On the use ofsatellites
G. de Leeuw et al.
Title Page
Abstract Introduction
Conclusions References
Tables Figures
J I
J I
Back Close
Full Screen / Esc
Printer-friendly Version
Interactive Discussion
Discussion
Paper
|D
iscussionP
aper|
Discussion
Paper
|D
iscussionP
aper|
Fig. 5. GLOMAP-calculated AOD for 2 May 2006. The SILAM Fire Emission Scheme has beenimplemented and the figure shows the large influence of the Russian fires on the AOD over Nand NW Europe.
8483