On the use of GPS measurements for Moderate Resolution Imaging Spectrometer precipitable water vapor...
7
On the use of GPS measurements for Moderate Resolution Imaging Spectrometer precipitable water vapor evaluation over southern Tibet Ning Lu, 1 Jun Qin, 2 Kun Yang, 2 Yang Gao, 2 Xiangde Xu, 3 and Toshio Koike 4 Received 26 April 2011; revised 7 October 2011; accepted 7 October 2011; published 15 December 2011. [1] Precipitable water vapor (PWV) derived from Moderate Resolution Imaging Spectroradiometer (MODIS) near‐infrared measurements from Terra and Aqua satellites have not been evaluated over southern Tibet, which has an elevated and complex topography. This study uses ground measurements from a network of 22 GPS receivers to evaluate the accuracy of MODIS PWV over this region. The evaluation shows that both the Terra and Aqua MODIS PWV have a high correlation with GPS measurements, but they generally tend to overestimate water vapor under clear‐sky conditions, with scale factors from 1.06 to 1.19 and root mean square errors from 2.1 to 3.19 mm. The overestimation is mainly attributed to the systematic bias of MODIS PWV at sites below 3000 m, which increases with increasing water vapor, especially during the monsoon season, when the summer monsoon brings a large amount of water vapor from the tropical ocean to southern Tibet. In contrast, MODIS PWV at sites above 3000 m matches well with the GPS PWV. A linear fit model that was proposed and employed in previous studies is used to correct the errors of MODIS PWV at low sites. The performance of MODIS PWV is improved at each low site after the correction. The corrected MODIS PWV can represent the monthly variation of daily average GPS PWV within a 2% error. This evaluation study should facilitate the use of MODIS‐derived water vapor in the models that calculate radiative forcing and simulate climate change over Tibet and its surrounding areas. Citation: Lu, N., J. Qin, K. Yang, Y. Gao, X. Xu, and T. Koike (2011), On the use of GPS measurements for Moderate Resolution Imaging Spectrometer precipitable water vapor evaluation over southern Tibet, J. Geophys. Res., 116, D23117, doi:10.1029/2011JD016160. 1. Introduction [2] Atmospheric water vapor plays an important role in global atmospheric energy and water cycles. Water vapor increases in close association with surface temperature chan- ges through the radiative forcing effect and climate feed- back [Trenberth et al., 2005; Wagner et al., 2006; Solomon et al., 2010]. Precipitable water vapor (PWV), a measurable parameter that mainly comprises tropospheric and strato- spheric water, is used to study water vapor changes and their contributions to climate change. Water vapor carried by the Asian monsoon, which enters the global tropical stratosphere, is believed to be transported over the Tibetan Plateau because it provides a short circuit for cross‐tropopause transport [Fu et al., 2006]. Among the Tibetan Plateau’s regions, southern Tibet is a critical area for water vapor transport. Water vapor changes over this region have a great impact on the rainy weather along the Yangtze River and on the downstream floods/droughts [Xu et al., 2004]. Therefore, accurate PWV information is essential to understanding the hydrological cycle, energy budget, and climate change over Tibet and its surrounding areas. [3] PWV, also referred to as total column water vapor, varies greatly in both space and time across Tibet [Zhai and Eskridge, 1997; Gao et al., 2003]; however, accurate ground observations are scarce over this vast land due to difficulties in measurement and maintenance. Satellite remote sensing is a much more feasible way to derive the PWV distribution. The Moderate Resolution Imaging Spectroradiometer (MODIS) onboard the Terra and Aqua satellites provides spatial and temporal PWV measurements. These measurements have been extensively evaluated against ground observations over most land areas [Li et al., 2003; Prasad and Singh, 2009; Thomas et al., 2011]. However, the accuracy of MODIS‐ derived water vapor is not well known over Tibet due to its 1 State Key Laboratory of Resources and Environmental Information System, Institute of Geographic Sciences and Natural Resources Research, Chinese Academy of Sciences, Beijing, China. 2 Key Laboratory of Tibetan Environment Changes and Land Surface Processes, Institute of Tibetan Plateau Research, Chinese Academy of Sciences, Beijing, China. 3 State Key Laboratory of Severe Weather, Chinese Academy of Meteorological Sciences, Beijing, China. 4 Department of Civil Engineering, University of Tokyo, Tokyo, Japan. Copyright 2011 by the American Geophysical Union. 0148‐0227/11/2011JD016160 JOURNAL OF GEOPHYSICAL RESEARCH, VOL. 116, D23117, doi:10.1029/2011JD016160, 2011 D23117 1 of 7
Transcript of On the use of GPS measurements for Moderate Resolution Imaging Spectrometer precipitable water vapor...
On the use of GPS measurements for Moderate ResolutionImaging Spectrometer precipitable water vapor evaluationover southern Tibet
Ning Lu,1 Jun Qin,2 Kun Yang,2 Yang Gao,2 Xiangde Xu,3 and Toshio Koike4
Received 26 April 2011; revised 7 October 2011; accepted 7 October 2011; published 15 December 2011.
[1] Precipitable water vapor (PWV) derived from Moderate Resolution ImagingSpectroradiometer (MODIS) near‐infrared measurements from Terra and Aqua satelliteshave not been evaluated over southern Tibet, which has an elevated and complextopography. This study uses ground measurements from a network of 22 GPS receivers toevaluate the accuracy of MODIS PWV over this region. The evaluation shows thatboth the Terra and Aqua MODIS PWV have a high correlation with GPS measurements,but they generally tend to overestimate water vapor under clear‐sky conditions, withscale factors from 1.06 to 1.19 and root mean square errors from 2.1 to 3.19 mm.The overestimation is mainly attributed to the systematic bias of MODIS PWV at sitesbelow 3000 m, which increases with increasing water vapor, especially during themonsoon season, when the summer monsoon brings a large amount of water vapor fromthe tropical ocean to southern Tibet. In contrast, MODIS PWV at sites above 3000 mmatches well with the GPS PWV. A linear fit model that was proposed and employedin previous studies is used to correct the errors of MODIS PWV at low sites. Theperformance of MODIS PWV is improved at each low site after the correction. Thecorrected MODIS PWV can represent the monthly variation of daily average GPS PWVwithin a 2% error. This evaluation study should facilitate the use of MODIS‐derivedwater vapor in the models that calculate radiative forcing and simulate climate change overTibet and its surrounding areas.
Citation: Lu, N., J. Qin, K. Yang, Y. Gao, X. Xu, and T. Koike (2011), On the use of GPS measurements for ModerateResolution Imaging Spectrometer precipitable water vapor evaluation over southern Tibet, J. Geophys. Res., 116, D23117,doi:10.1029/2011JD016160.
1. Introduction
[2] Atmospheric water vapor plays an important role inglobal atmospheric energy and water cycles. Water vaporincreases in close association with surface temperature chan-ges through the radiative forcing effect and climate feed-back [Trenberth et al., 2005; Wagner et al., 2006; Solomonet al., 2010]. Precipitable water vapor (PWV), a measurableparameter that mainly comprises tropospheric and strato-spheric water, is used to study water vapor changes and theircontributions to climate change. Water vapor carried by theAsian monsoon, which enters the global tropical stratosphere,
is believed to be transported over the Tibetan Plateau becauseit provides a short circuit for cross‐tropopause transport [Fuet al., 2006]. Among the Tibetan Plateau’s regions, southernTibet is a critical area for water vapor transport. Water vaporchanges over this region have a great impact on the rainyweather along the Yangtze River and on the downstreamfloods/droughts [Xu et al., 2004]. Therefore, accurate PWVinformation is essential to understanding the hydrologicalcycle, energy budget, and climate change over Tibet and itssurrounding areas.[3] PWV, also referred to as total column water vapor,
varies greatly in both space and time across Tibet [Zhai andEskridge, 1997; Gao et al., 2003]; however, accurate groundobservations are scarce over this vast land due to difficultiesin measurement and maintenance. Satellite remote sensing isa much more feasible way to derive the PWV distribution. TheModerate Resolution Imaging Spectroradiometer (MODIS)onboard the Terra and Aqua satellites provides spatial andtemporal PWV measurements. These measurements havebeen extensively evaluated against ground observations overmost land areas [Li et al., 2003; Prasad and Singh, 2009;Thomas et al., 2011]. However, the accuracy of MODIS‐derived water vapor is not well known over Tibet due to its
1State Key Laboratory of Resources and Environmental InformationSystem, Institute of Geographic Sciences and Natural Resources Research,Chinese Academy of Sciences, Beijing, China.
2Key Laboratory of Tibetan Environment Changes and Land SurfaceProcesses, Institute of Tibetan Plateau Research, Chinese Academy ofSciences, Beijing, China.
3State Key Laboratory of Severe Weather, Chinese Academy ofMeteorological Sciences, Beijing, China.
4Department of Civil Engineering, University of Tokyo, Tokyo, Japan.
Copyright 2011 by the American Geophysical Union.0148‐0227/11/2011JD016160
JOURNAL OF GEOPHYSICAL RESEARCH, VOL. 116, D23117, doi:10.1029/2011JD016160, 2011
D23117 1 of 7
varied and elevated topography. Also, the average values ofPWV over Tibet are much smaller than those over the sur-rounding low‐elevation regions [Gao et al., 2003], meaningrelative errors associated with elevation and elevation‐relevantatmospheric environments could be magnified.[4] An observational network of 22 GPS receivers over
southern Tibet, supported by the Chinese–Japanese jointinternational cooperation program [Xu et al., 2008], was inoperation for ten months in 2008 to measure PWV. In thisstudy, these measurements are used to evaluate clear‐skyPWV products as derived from MODIS near‐infraredobservations from the Terra and Aqua satellites. This studynot only presents the errors in MODIS PWV products andtheir relation to land surface altitude, but it also demon-strates to what extent the MODIS PWV measurementsacquired at specific times of the day can represent the dailyaverage PWV of the climate.
2. Data
2.1. GPS
[5] The hourly GPS PWV data set was produced underthe observation network for a New Integrated Observational
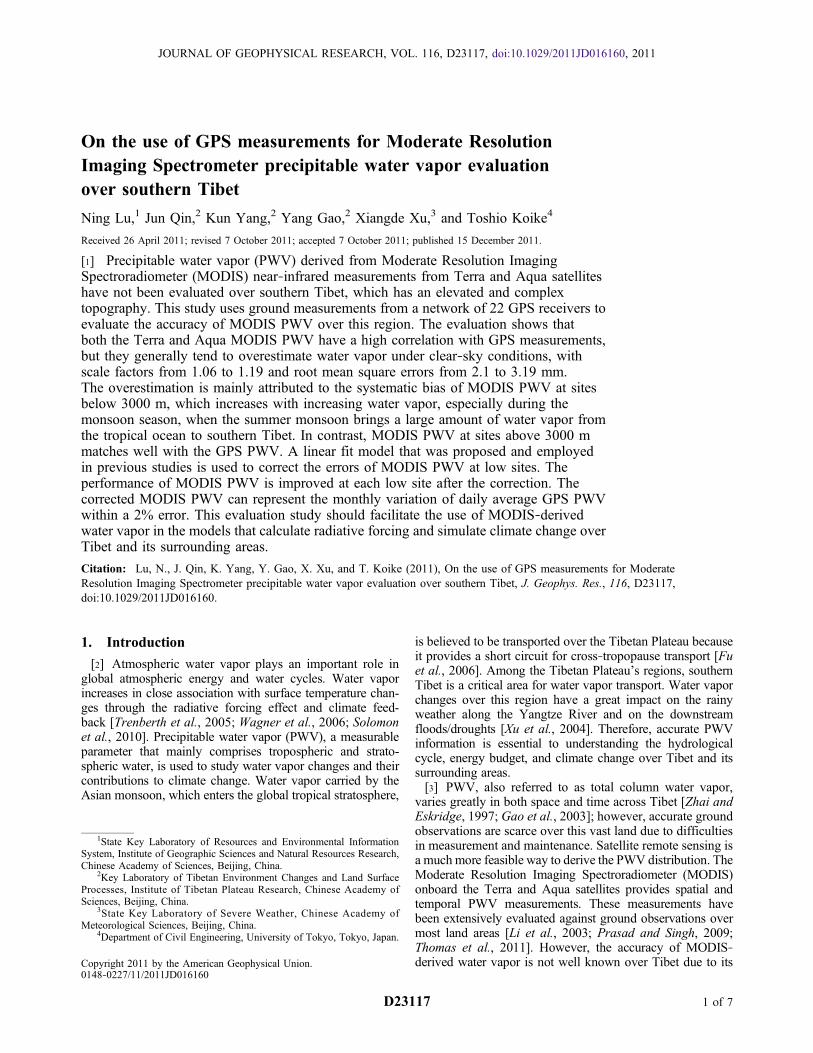
System in the Tibetan Plateau (NIOST) during an intensiveobservation period (January–October 2008) [Xu et al.,2008]. Figure 1 shows the observation network. The ele-vation of all 22 GPS locations varies from 160 m to 4600 m.Surface air temperature and pressure data are measuredsimultaneously at each GPS location. Radio signals trans-mitted from the GPS satellites are delayed by the atmo-sphere before reaching the ground GPS receiver. The zenithtotal delay (ZTD) is computed using the software packageGAMIT through the analysis of the GPS phase observations.ZTD is a sum of zenith hydrostatic delay (ZHD) and zenithwet delay (ZWD). ZHD can be calculated by using the localsurface pressure. ZHD subtracted from ZTD determinesZWD from which PWV can be inferred [Bevis et al., 1994].Once ZWD is determined, it can be converted to PWV usingthe following expression [Wang et al., 2005]:
PWV ¼ 106
�wRv k3=Tm þ k2′ð ÞZWD; ð1Þ
where rw is the density of liquid water, Rv is the specific gasconstant of water vapor, k′2 and k3 are the atmosphericrefraction constants given by Bevis et al. [1994], and Tm is
Figure 1. Locations of the GPS receivers used in the evaluation of Moderate Resolution Imaging Spec-trometer (MODIS) precipitable water vapor over the southern Tibetan Plateau. The 22 GPS locations aremarked with solid dots. Superimposed is the altitude distribution for these sites. The surface elevation isderived from the Shuttle Radar Topography Mission with a 1 km resolution.
LU ET AL.: EVALUATING WATER VAPOR D23117D23117
2 of 7

the water‐vapor‐weighted mean atmospheric temperature,defined as
Tm ¼Re=Tð Þdh
Re=T 2ð Þdh ; ð2Þ
where e denotes the water vapor pressure and T is theatmospheric temperature.
[6] The vertical profiles of atmospheric temperature andhumidity can be used to calculate Tm. However, these ver-tical profiles are usually unavailable at the GPS sites. Toobtain Tm, Bevis et al. [1992] found a strong linear rela-tionship between Tm and the surface air temperature Ts:
Tm ¼ aþ bTs: ð3Þ[7] The fitted coefficients a and b are geographically and
seasonally dependent [Ross and Rosenfeld, 1997]. Thevalues of a and b for the United States are 70.2 and 0.72,respectively, as given by Bevis et al. [1992]. The values wederived using local radiosonde data for southern Tibet are42.86 and 0.84, which are similar to those suggested by Liuet al. [2005]. The accuracy of GPS‐estimated PWV by thismethod is claimed to be better than 2 mm according toprevious comparisons [Emardson et al., 1998; Ware et al.,2000; Li et al., 2003; Prasad and Singh, 2009]. To con-firm the accuracy of our PWV data, we also compared ourhourly PWV data with an independent, 2‐hourly GPS PWVproduct developed by the National Center for AtmosphericResearch Earth Observing Laboratory (hereinafter referredto as NCAR/EOL data) [Wang et al., 2007]. There are twosites of NCAR/EOL data on the Tibetan Plateau, of whichonly one (KUNM (25.029°N, 102.797°E)) is near our datasite (BEKM (25.008°N, 102.63°E)). The linear distancebetween the two sites is approximately 15 km, and theirelevations are both approximately 2000 m. The comparisonwas performed at 2 h intervals for each day from January toOctober 2008. The two independent GPS PWV data inFigure 2 are well matched, with a mean bias close to 0 anda root mean square error of 1.47 mm. The comparisonshows that our data are qualified and the good correlationof PWV data between the two sites implies that the spatial
Figure 2. Comparisons between GPS‐estimated precipita-ble water vapor (PWV) at site BEKM of our data and siteKUNM of the National Center for Atmospheric ResearchEarth Observing Laboratory data at 2 hour intervals for eachday from January to October 2008. The two GPS PWV datawere independently developed. The linear distance betweenthe two sites is approximately 15 km.
Figure 3. Histograms of the correlation coefficients, mean biases, and root mean square errors of thecomparisons of the Terra and Aqua MODIS precipitable water vapor and ground GPS measurementsat the 22 sites.
LU ET AL.: EVALUATING WATER VAPOR D23117D23117
3 of 7
distribution of atmospheric water vapor is homogeneouswithin a certain distance.
2.2. MODIS Near‐IR Water Vapor Product
[8] The MODIS Level 2 PWV products of Collection 5from Terra (MOD05_L2) and from Aqua (MYD05_L2) aregenerated at a 1 km spatial resolution using the near‐infraredalgorithm during the day [Gao and Kaufman, 2003]. Thenear‐infrared algorithm for retrieving MODIS PWV datarelies on observations of water vapor attenuation of near‐infrared solar radiation reflected by surfaces and clouds. Theratios of water vapor absorbing channels (0.935, 0.940, and0.905 mm) with the nearby atmospheric window channels at0.865 and 1.34 mm are used [Kaufman and Gao, 1992]. Thisdifferential absorption technique largely removes the effectsof surface reflectance with wavelengths, and it can deter-mine PWV with errors typically in the range between 5%and 10% [Gao and Kaufman, 2003; King et al., 2003].[9] Because MODIS PWV is sensitive to the presence of
clouds in the field of view, only MODIS PWV values col-lected under clear‐sky conditions were used in this study.Pixels with 99% confidence clarity were extracted using theMODIS cloud mask product. To overcome the problem ofmisregistration in the comparison, the MODIS PWV valueswere averaged over boxes of 3 × 3 pixels centered on theGPS receiver location. Geometric information for eachswath image was obtained from MODIS geolocation prod-uct (MOD03). The hourly GPS PWV data closest to theMODIS acquisition time were chosen for comparison with
the box‐averaged MODIS PWV data under clear‐sky con-ditions. The time difference between each matched pair ofMODIS and GPS PWV data was limited to 30 min.
3. Results and Discussion
[10] The clear‐sky MODIS PWV data from the Terra andAqua satellites were first analyzed at each ground GPS site.The correlation coefficients, mean biases (between MODISand GPS) and root mean square errors (RMSEs) at the22 GPS sites are shown in Figure 3. Most of the correlationcoefficients are approximately 0.9 or higher, the biasesare between −1.5 to 1.5 mm, and the RMSEs are around1.5–2.5 mm. The high correlation coefficients and lowRMSEs demonstrate the good capability of the Terra andAqua MODIS PWV products to estimate the amount ofatmospheric water vapor. The Terra MODIS PWV has amean correlation coefficient of 0.94, a mean bias of 0.15 mmand a mean RMSE of 2.14 mm. For the Aqua MODIS PWV,the mean correlation coefficient is 0.95, the mean bias is0.17 mm, and the mean RMSE is 2.22 mm. The positivemean biases indicate that both Terra and Aqua MODISPWV tend to overestimate the atmospheric water vapor on theTibetan Plateau. Liu et al. [2006] found large RMSE valuesof MODIS PWV compared with GPS PWV over Gaize andNaqu in Tibet using the old version of MOD05_L2, withan RMSE of 3.48 mm and 2.93 mm, respectively. The largeRMSE for the MODIS near‐infrared PWV on the TibetanPlateau was due to an error of surface pressure in the coding of
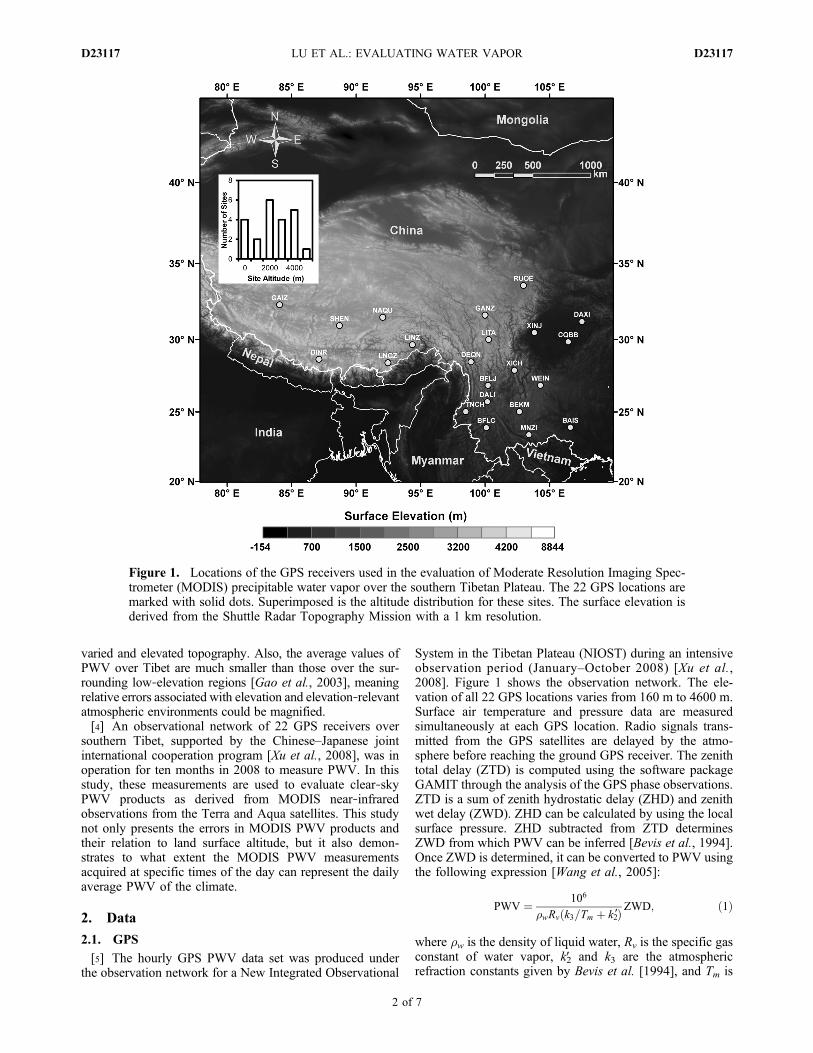
Figure 4. Evaluation of PWV derived by (top) Terra and (bottom) Aqua MODIS against ground GPSmeasurements at sites (left) above 3000 m and (right) below 3000 m, respectively. Note that the scale onthe right is different from the scale on the left.
LU ET AL.: EVALUATING WATER VAPOR D23117D23117
4 of 7

the operational near‐infrared water vapor retrievals. In thisstudy, the RMSE is 1.89 mm at Gaize (site GAIZ in Figure 1)and 1.71 mm at Naqu (site NAQU). The decrease in theRMSE indicates that the coding error has already been cor-rected in this version of MODIS products.[11] After evaluating the MODIS PWV site by site, we
found that it shows different characteristics at sites above3000 m (high sites) and below 3000 m (low sites). As shownin Figure 4, the clear‐sky MODIS PWV has a better cor-relation with the GPS PWV at low sites. The RMSE of theMODIS PWV at high sites is slightly lower than that at lowsites (with RMSE of 2.1 mm versus 3.1 mm). The relativediscrepancies in MODIS PWV, however, are slightly largerat high sites compared with the low sites (a relative RMSEof 19% versus 17%). The scale factors and intercepts inFigure 4 indicate a slight underestimation of the MODISPWV for small water vapor amounts and a slight overesti-mation for large water vapor amounts. At the low sites, thedifferences between the MODIS and GPS PWV mainlyincreased with increasing water vapor. These differencescorrelate well with the GPS PWV, with a correlation coef-ficient of 0.56 which is significant (p < 0.01) at the 99%level of confidence. The same issue was found by Li et al.[2003], who used a linear fit model to correct the errorsover Germany. They suggested that this bias is likely caused
by uncertainties in the spectroscopic database. The largebias with a large amount of water vapor here also sug-gests that the MODIS PWV procedures may have someissues with the calculation of atmospheric transmittance forwater vapor.[12] The time difference between the GPS data and the
overpassed MODIS data introduces errors into the valida-tion of the MODIS PWV because atmospheric water vapormay change within the mismatch period. Therefore, theRMSE values in this study are relatively larger than previ-ous studies using high‐resolution GPS data, such as vali-dation over Germany [Li et al., 2003], Southern California[Li et al., 2005], and Antarctica [Thomas et al., 2011]. Therelatively large differences between the MODIS and GPSPWV data are partly due to these errors. However, this kindof uncertainty is random, and it does not affect the sys-tematic errors found in the validation [Wang et al., 2007;Li et al., 2009; Prasad and Singh, 2009]. The elevationdifferences between the GPS sites, which are sometimeslocated in the valley areas, and the corresponding MODISfootprints may also increase the errors in the validation[Bock et al., 2007]. We used the elevation derived from theShuttle Radar Topography Mission with a 1 km resolutionto represent the surface elevation of the MODIS footprint.The elevation differences range from 0.23 to 69.17 m.
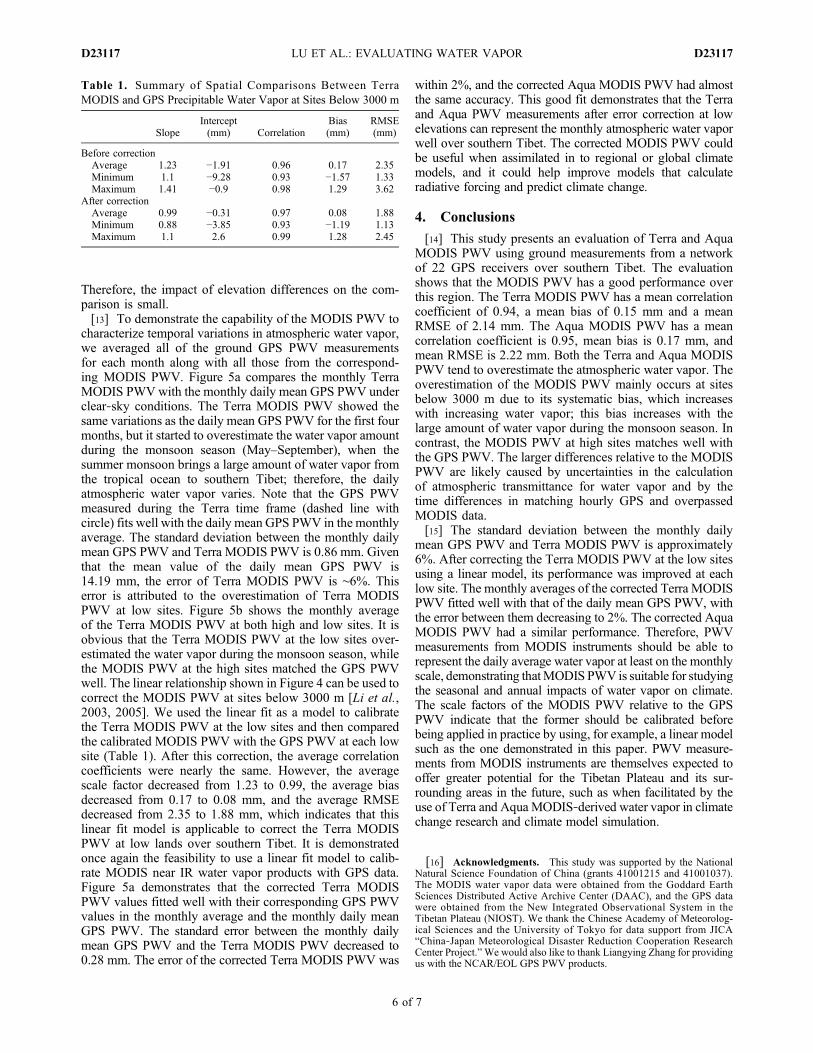
Figure 5. Monthly variation of clear‐sky PWV of the Terra MODIS and the corresponding GPS (a) atsites above and below 3000 m, respectively, and (b) at all sites, along with the corrected Terra MODISPWV. The daily mean GPS PWV is plotted as a reference. The atmospheric water vapor over the TibetanPlateau increases substantially in May–September due to large‐scale water vapor transports by the sum-mer monsoon from the tropical ocean.
LU ET AL.: EVALUATING WATER VAPOR D23117D23117
5 of 7
Therefore, the impact of elevation differences on the com-parison is small.[13] To demonstrate the capability of the MODIS PWV to
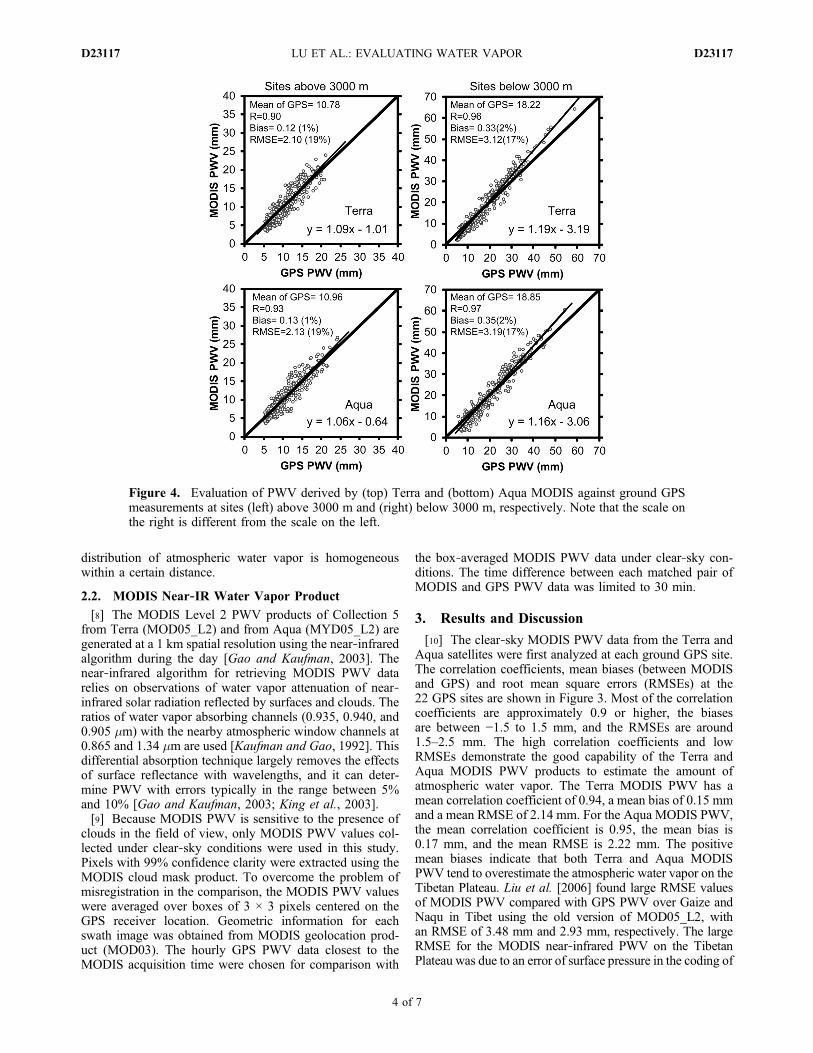
characterize temporal variations in atmospheric water vapor,we averaged all of the ground GPS PWV measurementsfor each month along with all those from the correspond-ing MODIS PWV. Figure 5a compares the monthly TerraMODIS PWVwith the monthly daily mean GPS PWV underclear‐sky conditions. The Terra MODIS PWV showed thesame variations as the daily mean GPS PWV for the first fourmonths, but it started to overestimate the water vapor amountduring the monsoon season (May–September), when thesummer monsoon brings a large amount of water vapor fromthe tropical ocean to southern Tibet; therefore, the dailyatmospheric water vapor varies. Note that the GPS PWVmeasured during the Terra time frame (dashed line withcircle) fits well with the daily mean GPS PWV in the monthlyaverage. The standard deviation between the monthly dailymean GPS PWV and Terra MODIS PWV is 0.86 mm. Giventhat the mean value of the daily mean GPS PWV is14.19 mm, the error of Terra MODIS PWV is ∼6%. Thiserror is attributed to the overestimation of Terra MODISPWV at low sites. Figure 5b shows the monthly averageof the Terra MODIS PWV at both high and low sites. It isobvious that the Terra MODIS PWV at the low sites over-estimated the water vapor during the monsoon season, whilethe MODIS PWV at the high sites matched the GPS PWVwell. The linear relationship shown in Figure 4 can be used tocorrect the MODIS PWV at sites below 3000 m [Li et al.,2003, 2005]. We used the linear fit as a model to calibratethe Terra MODIS PWV at the low sites and then comparedthe calibrated MODIS PWV with the GPS PWV at each lowsite (Table 1). After this correction, the average correlationcoefficients were nearly the same. However, the averagescale factor decreased from 1.23 to 0.99, the average biasdecreased from 0.17 to 0.08 mm, and the average RMSEdecreased from 2.35 to 1.88 mm, which indicates that thislinear fit model is applicable to correct the Terra MODISPWV at low lands over southern Tibet. It is demonstratedonce again the feasibility to use a linear fit model to calib-rate MODIS near IR water vapor products with GPS data.Figure 5a demonstrates that the corrected Terra MODISPWV values fitted well with their corresponding GPS PWVvalues in the monthly average and the monthly daily meanGPS PWV. The standard error between the monthly dailymean GPS PWV and the Terra MODIS PWV decreased to0.28 mm. The error of the corrected Terra MODIS PWV was
within 2%, and the corrected Aqua MODIS PWV had almostthe same accuracy. This good fit demonstrates that the Terraand Aqua PWV measurements after error correction at lowelevations can represent the monthly atmospheric water vaporwell over southern Tibet. The corrected MODIS PWV couldbe useful when assimilated in to regional or global climatemodels, and it could help improve models that calculateradiative forcing and predict climate change.
4. Conclusions
[14] This study presents an evaluation of Terra and AquaMODIS PWV using ground measurements from a networkof 22 GPS receivers over southern Tibet. The evaluationshows that the MODIS PWV has a good performance overthis region. The Terra MODIS PWV has a mean correlationcoefficient of 0.94, a mean bias of 0.15 mm and a meanRMSE of 2.14 mm. The Aqua MODIS PWV has a meancorrelation coefficient is 0.95, mean bias is 0.17 mm, andmean RMSE is 2.22 mm. Both the Terra and Aqua MODISPWV tend to overestimate the atmospheric water vapor. Theoverestimation of the MODIS PWV mainly occurs at sitesbelow 3000 m due to its systematic bias, which increaseswith increasing water vapor; this bias increases with thelarge amount of water vapor during the monsoon season. Incontrast, the MODIS PWV at high sites matches well withthe GPS PWV. The larger differences relative to the MODISPWV are likely caused by uncertainties in the calculationof atmospheric transmittance for water vapor and by thetime differences in matching hourly GPS and overpassedMODIS data.[15] The standard deviation between the monthly daily
mean GPS PWV and Terra MODIS PWV is approximately6%. After correcting the Terra MODIS PWV at the low sitesusing a linear model, its performance was improved at eachlow site. The monthly averages of the corrected Terra MODISPWV fitted well with that of the daily mean GPS PWV, withthe error between them decreasing to 2%. The corrected AquaMODIS PWV had a similar performance. Therefore, PWVmeasurements from MODIS instruments should be able torepresent the daily average water vapor at least on the monthlyscale, demonstrating thatMODIS PWV is suitable for studyingthe seasonal and annual impacts of water vapor on climate.The scale factors of the MODIS PWV relative to the GPSPWV indicate that the former should be calibrated beforebeing applied in practice by using, for example, a linear modelsuch as the one demonstrated in this paper. PWV measure-ments from MODIS instruments are themselves expected tooffer greater potential for the Tibetan Plateau and its sur-rounding areas in the future, such as when facilitated by theuse of Terra and Aqua MODIS‐derived water vapor in climatechange research and climate model simulation.
[16] Acknowledgments. This study was supported by the NationalNatural Science Foundation of China (grants 41001215 and 41001037).The MODIS water vapor data were obtained from the Goddard EarthSciences Distributed Active Archive Center (DAAC), and the GPS datawere obtained from the New Integrated Observational System in theTibetan Plateau (NIOST). We thank the Chinese Academy of Meteorolog-ical Sciences and the University of Tokyo for data support from JICA“China‐Japan Meteorological Disaster Reduction Cooperation ResearchCenter Project.”We would also like to thank Liangying Zhang for providingus with the NCAR/EOL GPS PWV products.
Table 1. Summary of Spatial Comparisons Between TerraMODIS and GPS Precipitable Water Vapor at Sites Below 3000 m
SlopeIntercept(mm) Correlation
Bias(mm)
RMSE(mm)
Before correctionAverage 1.23 −1.91 0.96 0.17 2.35Minimum 1.1 −9.28 0.93 −1.57 1.33Maximum 1.41 −0.9 0.98 1.29 3.62
After correctionAverage 0.99 −0.31 0.97 0.08 1.88Minimum 0.88 −3.85 0.93 −1.19 1.13Maximum 1.1 2.6 0.99 1.28 2.45
LU ET AL.: EVALUATING WATER VAPOR D23117D23117
6 of 7
ReferencesBevis, M., S. Businger, T. A. Herring, C. Rocken, R. A. Anthes, and R. H.Ware (1992), GPS meteorology: Remote sensing of atmospheric watervapor using the Global Positioning System, J. Geophys. Res., 97,15,787–15,801, doi:10.1029/92JD01517.
Bevis, M., S. Businger, S. Chiswell, T. A. Herring, R. A. Anthes, C. Rocken,and R. H. Ware (1994), GPS meteorology—Mapping zenith wet delaysonto precipitable water, J. Appl. Meteorol., 33, 379–386, doi:10.1175/1520-0450(1994)033<0379:GMMZWD>2.0.CO;2.
Bock, O., M. N. Bouin, A. Walpersdorf, J. P. Lafore, S. Janicot, F. Guichard,and A. Agusti‐Panareda (2007), Comparison of ground‐based GPS pre-cipitable water vapour to independent observations and NWP model rea-nalyses over Africa, Q. J. R. Meteorol. Soc., 133, 2011–2027,doi:10.1002/qj.185.
Emardson, T. R., G. Elgered, and J. M. Johansson (1998), Three months ofcontinuous monitoring of atmospheric water vapor with a network ofGlobal Positioning System receivers, J. Geophys. Res., 103, 1807–1820,doi:10.1029/97JD03015.
Fu, R., Y. Hu, J. S.Wright, J. H. Jiang, R. E. Dickinson, M. Chen, M. Filipiak,W. G. Read, J.W.Waters, and D. L.Wu (2006), Short circuit of water vaporand polluted air to the global stratosphere by convective transport overthe Tibetan Plateau, Proc. Natl. Acad. Sci. U. S. A., 103, 5664–5669,doi:10.1073/pnas.0601584103.
Gao, B. C., and Y. J. Kaufman (2003), Water vapor retrievals using Mod-erate Resolution Imaging Spectroradiometer (MODIS) near‐infrared chan-nels, J. Geophys. Res., 108(D13), 4389, doi:10.1029/2002JD003023.
Gao, B. C., P. Yang, G. Guo, S. K. Park, W. J. Wiscombe, and B. Chen(2003), Measurements of water vapor and high clouds over the TibetanPlateau with the Terra MODIS instrument, IEEE Trans. Geosci. RemoteSens., 41, 895–900, doi:10.1109/TGRS.2003.810704.
Kaufman, Y. J., and B. C. Gao (1992), Remote sensing of water vapor inthe near‐IR from EOS/MODIS, IEEE Trans. Geosci. Remote Sens., 30,871–884, doi:10.1109/36.175321.
King, M. D., W. P. Menzel, Y. J. Kaufman, D. Tanré, B. C. Gao, S. Platnick,S. A. Ackerman, L. A. Remer, R. Pincus, and P. A. Hubanks (2003),Cloud and aerosol properties, precipitable water, and profiles of tempera-ture and water vapor from MODIS, IEEE Trans. Geosci. Remote Sens.,41, 442–458, doi:10.1109/TGRS.2002.808226.
Li, Z., J. Muller, and P. Cross (2003), Comparison of precipitable watervapor derived from radiosonde, GPS, and Moderate‐Resolution ImagingSpectroradiometer measurements, J. Geophys. Res., 108(D20), 4651,doi:10.1029/2003JD003372.
Li, Z., J.‐P. Muller, P. Cross, and E. J. Fielding (2005), Interferometric syn-thetic aperture radar (InSAR) atmospheric correction: GPS, ModerateResolution Imaging Spectroradiometer (MODIS), and InSAR integration,J. Geophys. Res., 110, B03410, doi:10.1029/2004JB003446.
Li, Z., E. J. Fielding, P. Cross, and R. Preusker (2009), Advanced InSARatmospheric correction: MERIS/MODIS combination and stacked watervapour models, Int. J. Remote Sens., 30, 3343–3363, doi:10.1080/01431160802562172.
Liu, J., Z. Sun, H. Liang, X. Xu, and P. Wu (2005), Precipitable watervapor on the Tibetan Plateau estimated by GPS, water vapor radiometer,radiosonde, and numerical weather prediction analysis and its impact onthe radiation budget, J. Geophys. Res., 110, D17106, doi:10.1029/2004JD005715.
Liu, J., H. Liang, Z. Sun, and X. Zhou (2006), Validation of the Moderate‐Resolution Imaging Spectroradiometer precipitable water vapor productusing measurements from GPS on the Tibetan Plateau, J. Geophys.Res., 111, D14103, doi:10.1029/2005JD007028.
Prasad, A. K., and R. P. Singh (2009), Validation of MODIS Terra, AIRS,NCEP/DOE AMIP‐II Reanalysis‐2, and AERONET Sun photometerderived integrated precipitable water vapor using ground‐based GPSreceivers over India, J. Geophys. Res., 114, D05107, doi:10.1029/2008JD011230.
Ross, R., and S. Rosenfeld (1997), Estimating mean weighted tempera-ture of the atmosphere for Global Positioning System applications,J. Geophys. Res., 102, 21,719–21,730, doi:10.1029/97JD01808.
Solomon, S., K. H. Rosenlof, R. W. Portmann, J. S. Daniel, S. M. Davis,T. J. Sanford, and G.‐K. Plattner (2010), Contributions of stratosphericwater vapor to decadal changes in the rate of global warming, Science,327, 1219–1223, doi:10.1126/science.1182488.
Thomas, I. D., M. A. King, P. J. Clarke, and N. T. Penna (2011), Precip-itable water vapor estimates from homogeneously reprocessed GPS data:An intertechnique comparison in Antarctica, J. Geophys. Res., 116,D04107, doi:10.1029/2010JD013889.
Trenberth, K. E., J. Fasullo, and L. Smith (2005), Trends and variability incolumn‐integrated water vapour, Clim. Dyn., 24, 741–758, doi:10.1007/s00382-005-0017-4.
Wagner, T., S. Beirle, and M. Grzegorski (2006), Global trends (1996–2003)of total column precipitable water observed by Global Ozone MonitoringExperiment (GOME) on ERS‐2 and their relation to near‐surface temper-ature, J. Geophys. Res., 111, D12102, doi:10.1029/2005JD006523.
Wang, J., L. Zhang, and A. Dai (2005), Global estimates of water‐vapor‐weighted mean temperature of the atmosphere for GPS applications,J. Geophys. Res., 110, D21101, doi:10.1029/2005JD006215.
Wang, J., L. Zhang, A. Dai, T. Van Hove, and J. Van Baelen (2007),A near‐global, 2‐hourly data set of atmospheric precipitable water fromground‐based GPS measurements, J. Geophys. Res., 112, D11107,doi:10.1029/2006JD007529.
Ware, R. H., D. W. Fulker, S. A. Stein, D. N. Anderson, S. K. Avery,R. D. Clark, K. K. Droegemeier, J. P. Kuettner, J. B. Minster, andS. Sorooshian (2000), SuomiNet: A real‐time national GPS networkfor atmospheric research and education, Bull. Am. Meteorol. Soc., 81,677–694, doi:10.1175/1520-0477(2000)081<0677:SARNGN>2.3.CO;2.
Xu, X., L. Chen, X. Wang, Q. Miao, and S. Tao (2004), Moisture transportsource/sink structure of theMeiyu rain belt along the Yangtze River valley,Chin. Sci. Bull., 49, 181–188, doi:10.1360/03wd0047.
Xu, X., R. Zhang, T. Koike, C. Lu, X. Shi, S. Zhang, L. Bian, X. Cheng,P. Li, and G. Ding (2008), A new integrated observational system overthe Tibetan Plateau, Bull. Am. Meteorol. Soc., 89, 1492–1496,doi:10.1175/2008BAMS2557.1.
Zhai, P., and R. E. Eskridge (1997), Atmospheric water vapor over China,J. Clim., 10, 2643–2652, doi:10.1175/1520-0442(1997)010<2643:AWVOC>2.0.CO;2.
Y. Gao, J. Qin, and K. Yang, Key Laboratory of Tibetan EnvironmentChanges and Land Surface Processes, Institute of Tibetan PlateauResearch, Chinese Academy of Sciences, Beijing 100085, China.T. Koike, Department of Civil Engineering, University of Tokyo, Tokyo
113‐8656, Japan.N. Lu, State Key Laboratory of Resources and Environmental
Information System, Institute of Geographic Sciences and NaturalResources Research, Chinese Academy of Sciences, Beijing 100101,China. ([email protected])X. Xu, State Key Laboratory of Severe Weather, Chinese Academy of
Meteorological Sciences, Beijing 100081, China.
LU ET AL.: EVALUATING WATER VAPOR D23117D23117
7 of 7