OmniPeek User Guide - MyPeek Product Portal
644
-
Upload
khangminh22 -
Category
Documents
-
view
0 -
download
0
Transcript of OmniPeek User Guide - MyPeek Product Portal

ANYOP_UG.book Page i Friday, February 5, 2016 4:47 PM

ANYOP_UG.book Page ii Friday, February 5, 2016 4:47 PM
Copyright © 2016, Savvius, Inc. All rights reserved. Information in this document is subject to change without notice. No part of this document may be reproduced or transmitted in any form, or by any means, electronic or mechanical, including photocopying, for any purpose, without the express written permission of Savvius, Inc.
AiroPeek SE, AiroPeek NX, AiroPeek VX, Compass Live, EtherPeek SE, EtherPeek NX, EtherPeek VX, Gigabit Analyzer Card, GigaPeek NX, iNetTools, NAX, NetDoppler, NetSense, Network Calculator, Omni³, Omni Capture Engine, Omni Desktop Engine, Omni DNX Engine, OmniAdapter, OmniAdapter 10G, OmniAdapter 10G MX, OmniEngine Desktop, OmniEngine Enterprise, OmniEngine Manager, OmniEngine Workgroup, Omni Management Console, Omni PacketGrabber, Omni Virtual Network Service, OmniPeek, OmniPeek Basic, OmniPeek Connect, OmniPeek Enterprise, OmniPeek Enterprise Connect, OmniPeek Insight, OmniPeek Personal, OmniPeek Professional, OmniPeek Remote Assistant, OmniPeek Workgroup, OmniPeek Workgroup Pro, OmniPeek Personal, Omnipliance, Omnipliance Core, Omnipliance CX, Omnipliance Edge, Omnipliance MX, Omnipliance Portable, Omnipliance SuperCore, Omnipliance TL, Omnipliance WiFi, OmniStorage, OmniSpectrum, OmniVirtual, OmniWatch, PacketGrabber, Peek DNX, ProConvert, ProtoSpecs, RFGrabber, RMONGrabber, Savvius, Savvius Academy, Savvius Insight, Savvius Vigil, TimeLine, TimeLine Network Recorder, WAN Analyzer Card, WANPeek NX, WatchPoint, WildPackets, WildPackets Academy, WildPackets Compass, and WildPackets OmniAnalysis Platform are trademarks of Savvius, Inc. All other trademarks are the property of their respective holders.
Savvius, Inc. reserves the right to make changes in the product design without reservation and without notification to its users.
Contacting Savvius
Mailing Address
Savvius, Inc.1340 Treat Blvd., Suite 500Walnut Creek, CA 94597
Voice/Fax
8 AM - 5 PM (PST)(925) 937-3200 (800) 466-2447 (US only)Fax: (925) 937-3211
Sales
Web
https://www.savvius.com
Technical Support
https://www.savvius.com/support
Resources
See https://www.savvius.com/support/resources for white papers, tutorials, technical briefs and more.
ii

1
ANYOP_UG.book Page iii Friday, February 5, 2016 4:47 PM
Professional Services
Savvius offers a full spectrum of professional services, available onsite or remote, to help customers make the most of their network infrastructure investment. The Savvius Professional Services team stands ready to partner with you to maximize your network performance and to minimize your network downtime. Savvius technical instructors, network systems engineers, and custom software developers can help you design, build, manage, and secure a better network for your business.
See https://www.savvius.com/services for course catalog, current public course scheduling, web-delivered courses, OnDemand courses, and consulting services.
Savvius Academy(800) [email protected]
Product Support and Maintenance
Savvius Maintenance Programs ensure that you grow along with our products as new features and enhancements are added and that your usage is fully supported by our Technical Support staff.
Enhanced support services are available with remote or onsite consulting. Developer support is also available for customers adding custom enhancements to Savvius products.
All Maintenance inquiries and purchases can be accommodated by contacting [email protected].
Developer Community
To join the Savvius Developer Network and gain access to product plug-ins, plug-in wizards, and API documentation, please visit https://mypeek.savvius.com.
About Savvius, Inc.
Savvius, Inc., a leader in packet-level network analytics and security forensics, enables network and security professionals to identify, understand, and respond to challenges in network performance and security. Savvius, formerly WildPackets, has sold products in more than 60 countries and all industrial sectors. Customers include Apple, Boeing, Cisco, Deutsche Telecom, Fidelity, Microsoft, Nationwide, and a high percentage of the Fortune 1000. Savvius is a Cisco Solution Partner. For more information, visit https://www.savvius.com.
20160205-UG-OP91a
iii

ANYOP_UG.book Page iv Friday, February 5, 2016 4:47 PM

Contents
ANYOP_UG.book Page v Friday, February 5, 2016 4:47 PM
Chapter 1 Introduction . . . . . . . . . . . . . . . . . . . . . . . . . . . . . . . . . . . . . . . . . . . 1About OmniPeek. . . . . . . . . . . . . . . . . . . . . . . . . . . . . . . . . . . . . . . . . . . . . . . . . . . . . . . . . 2
OmniPeek as a portable analyzer. . . . . . . . . . . . . . . . . . . . . . . . . . . . . . . . . . . . . . . .2OmniPeek with distributed Capture Engines . . . . . . . . . . . . . . . . . . . . . . . . . . . . .2OmniPeek product family. . . . . . . . . . . . . . . . . . . . . . . . . . . . . . . . . . . . . . . . . . . . . .3Network forensics. . . . . . . . . . . . . . . . . . . . . . . . . . . . . . . . . . . . . . . . . . . . . . . . . . . . .4Voice and video over IP analysis. . . . . . . . . . . . . . . . . . . . . . . . . . . . . . . . . . . . . . . . .4Compass dashboard. . . . . . . . . . . . . . . . . . . . . . . . . . . . . . . . . . . . . . . . . . . . . . . . . . .4Multi-segment analysis . . . . . . . . . . . . . . . . . . . . . . . . . . . . . . . . . . . . . . . . . . . . . . . .4
System requirements. . . . . . . . . . . . . . . . . . . . . . . . . . . . . . . . . . . . . . . . . . . . . . . . . . . . . . 5Supported adapters . . . . . . . . . . . . . . . . . . . . . . . . . . . . . . . . . . . . . . . . . . . . . . . . . . . . . . . 6
Ethernet . . . . . . . . . . . . . . . . . . . . . . . . . . . . . . . . . . . . . . . . . . . . . . . . . . . . . . . . . . . . .6Wireless. . . . . . . . . . . . . . . . . . . . . . . . . . . . . . . . . . . . . . . . . . . . . . . . . . . . . . . . . . . . . .6
Installing OmniPeek . . . . . . . . . . . . . . . . . . . . . . . . . . . . . . . . . . . . . . . . . . . . . . . . . . . . . . 7Installing a Capture Engine . . . . . . . . . . . . . . . . . . . . . . . . . . . . . . . . . . . . . . . . . . . . . . . . 8Main program window and Start Page . . . . . . . . . . . . . . . . . . . . . . . . . . . . . . . . . . . . . . 8Commonly used terms. . . . . . . . . . . . . . . . . . . . . . . . . . . . . . . . . . . . . . . . . . . . . . . . . . . . 9
Chapter 2 Using Capture Engines with OmniPeek . . . . . . . . . . . . . . . . . . 11About Capture Engines . . . . . . . . . . . . . . . . . . . . . . . . . . . . . . . . . . . . . . . . . . . . . . . . . . 12Displaying the Capture Engines window . . . . . . . . . . . . . . . . . . . . . . . . . . . . . . . . . . . 13Connecting to a Capture Engine . . . . . . . . . . . . . . . . . . . . . . . . . . . . . . . . . . . . . . . . . . 14Organizing Capture Engines by groups . . . . . . . . . . . . . . . . . . . . . . . . . . . . . . . . . . . . 16Discovering Capture Engines . . . . . . . . . . . . . . . . . . . . . . . . . . . . . . . . . . . . . . . . . . . . . 18The Capture Engines window tabs . . . . . . . . . . . . . . . . . . . . . . . . . . . . . . . . . . . . . . . . 20
Capture Engine tabs. . . . . . . . . . . . . . . . . . . . . . . . . . . . . . . . . . . . . . . . . . . . . . . . . 21Configuring and updating Capture Engine settings. . . . . . . . . . . . . . . . . . . . . . . . . . 26
Configuring a Capture Engine. . . . . . . . . . . . . . . . . . . . . . . . . . . . . . . . . . . . . . . . 26Updating software and settings . . . . . . . . . . . . . . . . . . . . . . . . . . . . . . . . . . . . . . . 28
Chapter 3 The Capture Window . . . . . . . . . . . . . . . . . . . . . . . . . . . . . . . . . . 31About capture windows . . . . . . . . . . . . . . . . . . . . . . . . . . . . . . . . . . . . . . . . . . . . . . . . . . 32Creating an OmniPeek capture window. . . . . . . . . . . . . . . . . . . . . . . . . . . . . . . . . . . . 32Creating a Capture Engine capture window . . . . . . . . . . . . . . . . . . . . . . . . . . . . . . . . 33Navigating a capture window . . . . . . . . . . . . . . . . . . . . . . . . . . . . . . . . . . . . . . . . . . . . . 36
v

Contents
ANYOP_UG.book Page vi Friday, February 5, 2016 4:47 PM
Configuring capture options. . . . . . . . . . . . . . . . . . . . . . . . . . . . . . . . . . . . . . . . . . . . . . 38Configuring general options. . . . . . . . . . . . . . . . . . . . . . . . . . . . . . . . . . . . . . . . . . 41Configuring adapter options . . . . . . . . . . . . . . . . . . . . . . . . . . . . . . . . . . . . . . . . . 45
Capture window views . . . . . . . . . . . . . . . . . . . . . . . . . . . . . . . . . . . . . . . . . . . . . . . . . . . 59Opening saved capture files . . . . . . . . . . . . . . . . . . . . . . . . . . . . . . . . . . . . . . . . . . . . . . . 62
OmniPeek capture files . . . . . . . . . . . . . . . . . . . . . . . . . . . . . . . . . . . . . . . . . . . . . . 63Capture Engine capture files. . . . . . . . . . . . . . . . . . . . . . . . . . . . . . . . . . . . . . . . . . 64
Splitting saved packet files . . . . . . . . . . . . . . . . . . . . . . . . . . . . . . . . . . . . . . . . . . . . . . . . 64Merging saved packet files . . . . . . . . . . . . . . . . . . . . . . . . . . . . . . . . . . . . . . . . . . . . . . . . 65Using capture templates . . . . . . . . . . . . . . . . . . . . . . . . . . . . . . . . . . . . . . . . . . . . . . . . . . 65
OmniPeek capture templates . . . . . . . . . . . . . . . . . . . . . . . . . . . . . . . . . . . . . . . . . 66Capture Engine capture templates . . . . . . . . . . . . . . . . . . . . . . . . . . . . . . . . . . . . 66Multiple capture windows from a single template . . . . . . . . . . . . . . . . . . . . . . . 67
Forensics capture on a Capture Engine. . . . . . . . . . . . . . . . . . . . . . . . . . . . . . . . . . . . . 68Monitoring capture on a Capture Engine. . . . . . . . . . . . . . . . . . . . . . . . . . . . . . . . . . . 69
Chapter 4 Dashboards . . . . . . . . . . . . . . . . . . . . . . . . . . . . . . . . . . . . . . . . . . 71About dashboards . . . . . . . . . . . . . . . . . . . . . . . . . . . . . . . . . . . . . . . . . . . . . . . . . . . . . . . 72Timeline dashboard . . . . . . . . . . . . . . . . . . . . . . . . . . . . . . . . . . . . . . . . . . . . . . . . . . . . . 72Network dashboard. . . . . . . . . . . . . . . . . . . . . . . . . . . . . . . . . . . . . . . . . . . . . . . . . . . . . . 75Applications dashboard . . . . . . . . . . . . . . . . . . . . . . . . . . . . . . . . . . . . . . . . . . . . . . . . . . 77Voice & Video dashboard. . . . . . . . . . . . . . . . . . . . . . . . . . . . . . . . . . . . . . . . . . . . . . . . . 78Compass dashboard . . . . . . . . . . . . . . . . . . . . . . . . . . . . . . . . . . . . . . . . . . . . . . . . . . . . . 80
Network utilization graph. . . . . . . . . . . . . . . . . . . . . . . . . . . . . . . . . . . . . . . . . . . . 83Compass dashboard viewing tips . . . . . . . . . . . . . . . . . . . . . . . . . . . . . . . . . . . . . 90Compass dashboard limitations . . . . . . . . . . . . . . . . . . . . . . . . . . . . . . . . . . . . . . 92Protocols. . . . . . . . . . . . . . . . . . . . . . . . . . . . . . . . . . . . . . . . . . . . . . . . . . . . . . . . . . . 92Flows . . . . . . . . . . . . . . . . . . . . . . . . . . . . . . . . . . . . . . . . . . . . . . . . . . . . . . . . . . . . . . 96Nodes . . . . . . . . . . . . . . . . . . . . . . . . . . . . . . . . . . . . . . . . . . . . . . . . . . . . . . . . . . . . 100Channels. . . . . . . . . . . . . . . . . . . . . . . . . . . . . . . . . . . . . . . . . . . . . . . . . . . . . . . . . . 103WLAN. . . . . . . . . . . . . . . . . . . . . . . . . . . . . . . . . . . . . . . . . . . . . . . . . . . . . . . . . . . . 107VLAN . . . . . . . . . . . . . . . . . . . . . . . . . . . . . . . . . . . . . . . . . . . . . . . . . . . . . . . . . . . . 110Data rates . . . . . . . . . . . . . . . . . . . . . . . . . . . . . . . . . . . . . . . . . . . . . . . . . . . . . . . . . 113Applications. . . . . . . . . . . . . . . . . . . . . . . . . . . . . . . . . . . . . . . . . . . . . . . . . . . . . . . 116Expert event view . . . . . . . . . . . . . . . . . . . . . . . . . . . . . . . . . . . . . . . . . . . . . . . . . . 119Measuring latency. . . . . . . . . . . . . . . . . . . . . . . . . . . . . . . . . . . . . . . . . . . . . . . . . . 122Viewing a real-time capture Compass dashboard . . . . . . . . . . . . . . . . . . . . . . 123Viewing a single file Compass dashboard . . . . . . . . . . . . . . . . . . . . . . . . . . . . . 123Viewing multiple files in a Compass workspace. . . . . . . . . . . . . . . . . . . . . . . . 124Save Compass dashboard as a report . . . . . . . . . . . . . . . . . . . . . . . . . . . . . . . . . 132Using the Compass dashboard in monitor mode . . . . . . . . . . . . . . . . . . . . . . 134
vi

OmniPeek User Guide
ANYOP_UG.book Page vii Friday, February 5, 2016 4:47 PM
Chapter 5 Viewing and Decoding Packets . . . . . . . . . . . . . . . . . . . . . . . . 137About packets. . . . . . . . . . . . . . . . . . . . . . . . . . . . . . . . . . . . . . . . . . . . . . . . . . . . . . . . . . 138Capturing packets into a capture window . . . . . . . . . . . . . . . . . . . . . . . . . . . . . . . . . 138
Capture Engine Captures tab . . . . . . . . . . . . . . . . . . . . . . . . . . . . . . . . . . . . . . . . 141Viewing captured packets . . . . . . . . . . . . . . . . . . . . . . . . . . . . . . . . . . . . . . . . . . . . . . . 142
Navigating the Packets view . . . . . . . . . . . . . . . . . . . . . . . . . . . . . . . . . . . . . . . . . 142Customizing packet views. . . . . . . . . . . . . . . . . . . . . . . . . . . . . . . . . . . . . . . . . . . 145Adding notes to packets. . . . . . . . . . . . . . . . . . . . . . . . . . . . . . . . . . . . . . . . . . . . . 146
Applying decryption in the Packets view . . . . . . . . . . . . . . . . . . . . . . . . . . . . . . . . . . 147Applying SSL decryption to packets . . . . . . . . . . . . . . . . . . . . . . . . . . . . . . . . . . . . . . 148Saving captured packets . . . . . . . . . . . . . . . . . . . . . . . . . . . . . . . . . . . . . . . . . . . . . . . . . 149
Save file formats. . . . . . . . . . . . . . . . . . . . . . . . . . . . . . . . . . . . . . . . . . . . . . . . . . . . 150Deleting all packets. . . . . . . . . . . . . . . . . . . . . . . . . . . . . . . . . . . . . . . . . . . . . . . . . 151
Printing packet lists and packet decode windows . . . . . . . . . . . . . . . . . . . . . . . . . . . 152Decoding packets. . . . . . . . . . . . . . . . . . . . . . . . . . . . . . . . . . . . . . . . . . . . . . . . . . . . . . . 152
Window header. . . . . . . . . . . . . . . . . . . . . . . . . . . . . . . . . . . . . . . . . . . . . . . . . . . . 153Decode view. . . . . . . . . . . . . . . . . . . . . . . . . . . . . . . . . . . . . . . . . . . . . . . . . . . . . . . 154Hex and ASCII views . . . . . . . . . . . . . . . . . . . . . . . . . . . . . . . . . . . . . . . . . . . . . . . 156
Showing data offsets and mask information . . . . . . . . . . . . . . . . . . . . . . . . . . . . . . . 157Choosing a decoder. . . . . . . . . . . . . . . . . . . . . . . . . . . . . . . . . . . . . . . . . . . . . . . . . . . . . 157
Line decoders. . . . . . . . . . . . . . . . . . . . . . . . . . . . . . . . . . . . . . . . . . . . . . . . . . . . . . 158Writing your own decoders . . . . . . . . . . . . . . . . . . . . . . . . . . . . . . . . . . . . . . . . . 160
Applying decryption from the packet decode window . . . . . . . . . . . . . . . . . . . . . . 160Decode reassembled PDU . . . . . . . . . . . . . . . . . . . . . . . . . . . . . . . . . . . . . . . . . . . . . . . 160Using thread intelligence . . . . . . . . . . . . . . . . . . . . . . . . . . . . . . . . . . . . . . . . . . . . . . . . 161
Manually selecting further decode options . . . . . . . . . . . . . . . . . . . . . . . . . . . . 162
Chapter 6 Creating and Using Filters . . . . . . . . . . . . . . . . . . . . . . . . . . . . 163About filters . . . . . . . . . . . . . . . . . . . . . . . . . . . . . . . . . . . . . . . . . . . . . . . . . . . . . . . . . . . 164Viewing filters. . . . . . . . . . . . . . . . . . . . . . . . . . . . . . . . . . . . . . . . . . . . . . . . . . . . . . . . . . 164
OmniPeek filters window . . . . . . . . . . . . . . . . . . . . . . . . . . . . . . . . . . . . . . . . . . . 164Capture Engine filters tab . . . . . . . . . . . . . . . . . . . . . . . . . . . . . . . . . . . . . . . . . . . 166
Display filters . . . . . . . . . . . . . . . . . . . . . . . . . . . . . . . . . . . . . . . . . . . . . . . . . . . . . . . . . . 166Enabling a filter . . . . . . . . . . . . . . . . . . . . . . . . . . . . . . . . . . . . . . . . . . . . . . . . . . . . . . . . 168
Enabling filters from the Capture Options dialog . . . . . . . . . . . . . . . . . . . . . . 168Enabling filters from the capture window . . . . . . . . . . . . . . . . . . . . . . . . . . . . . 170
Creating filters with the Make Filter command. . . . . . . . . . . . . . . . . . . . . . . . . . . . . 172Creating a simple filter . . . . . . . . . . . . . . . . . . . . . . . . . . . . . . . . . . . . . . . . . . . . . . . . . . 173Creating an advanced filter . . . . . . . . . . . . . . . . . . . . . . . . . . . . . . . . . . . . . . . . . . . . . . 174
Logical AND, OR, and NOT operators in advanced filters. . . . . . . . . . . . . . . 175Creating a new capture window based on a filter . . . . . . . . . . . . . . . . . . . . . . . . . . . 177Filter types. . . . . . . . . . . . . . . . . . . . . . . . . . . . . . . . . . . . . . . . . . . . . . . . . . . . . . . . . . . . . 178
vii

Contents
ANYOP_UG.book Page viii Friday, February 5, 2016 4:47 PM
Creating filters with the filter bar . . . . . . . . . . . . . . . . . . . . . . . . . . . . . . . . . . . . . . . . . 179Using the filter bar . . . . . . . . . . . . . . . . . . . . . . . . . . . . . . . . . . . . . . . . . . . . . . . . . 181Filter bar syntax. . . . . . . . . . . . . . . . . . . . . . . . . . . . . . . . . . . . . . . . . . . . . . . . . . . . 181
Editing filters. . . . . . . . . . . . . . . . . . . . . . . . . . . . . . . . . . . . . . . . . . . . . . . . . . . . . . . . . . . 185Duplicating filters . . . . . . . . . . . . . . . . . . . . . . . . . . . . . . . . . . . . . . . . . . . . . . . . . . . . . . 186Saving and loading filters . . . . . . . . . . . . . . . . . . . . . . . . . . . . . . . . . . . . . . . . . . . . . . . . 186
Chapter 7 Post-capture Analysis . . . . . . . . . . . . . . . . . . . . . . . . . . . . . . . . 189About post-capture analysis . . . . . . . . . . . . . . . . . . . . . . . . . . . . . . . . . . . . . . . . . . . . . 190
Network forensics. . . . . . . . . . . . . . . . . . . . . . . . . . . . . . . . . . . . . . . . . . . . . . . . . . 190Saving packets. . . . . . . . . . . . . . . . . . . . . . . . . . . . . . . . . . . . . . . . . . . . . . . . . . . . . . . . . . 190Copying selected packets to a new window . . . . . . . . . . . . . . . . . . . . . . . . . . . . . . . . 191Hiding and unhiding packets . . . . . . . . . . . . . . . . . . . . . . . . . . . . . . . . . . . . . . . . . . . . 191
Using hide and unhide on a Capture Engine . . . . . . . . . . . . . . . . . . . . . . . . . . 192Selecting related packets. . . . . . . . . . . . . . . . . . . . . . . . . . . . . . . . . . . . . . . . . . . . . . . . . 192Label selected packets . . . . . . . . . . . . . . . . . . . . . . . . . . . . . . . . . . . . . . . . . . . . . . . . . . . 195Finding strings in packets. . . . . . . . . . . . . . . . . . . . . . . . . . . . . . . . . . . . . . . . . . . . . . . . 197Selecting packets matching user-defined criteria. . . . . . . . . . . . . . . . . . . . . . . . . . . . 198Forensic search from the Files tab. . . . . . . . . . . . . . . . . . . . . . . . . . . . . . . . . . . . . . . . . 201Forensic search from the Forensics tab . . . . . . . . . . . . . . . . . . . . . . . . . . . . . . . . . . . . 206Forensic search from the ‘Forensics Capture’ window. . . . . . . . . . . . . . . . . . . . . . . 216Using the Download Engine Packet Files wizard . . . . . . . . . . . . . . . . . . . . . . . . . . . 222
Time range & filter . . . . . . . . . . . . . . . . . . . . . . . . . . . . . . . . . . . . . . . . . . . . . . . . . 223Engines . . . . . . . . . . . . . . . . . . . . . . . . . . . . . . . . . . . . . . . . . . . . . . . . . . . . . . . . . . . 223Capture sessions . . . . . . . . . . . . . . . . . . . . . . . . . . . . . . . . . . . . . . . . . . . . . . . . . . . 224Search and Download Progress . . . . . . . . . . . . . . . . . . . . . . . . . . . . . . . . . . . . . . 226Merge . . . . . . . . . . . . . . . . . . . . . . . . . . . . . . . . . . . . . . . . . . . . . . . . . . . . . . . . . . . . 227Merge Progess . . . . . . . . . . . . . . . . . . . . . . . . . . . . . . . . . . . . . . . . . . . . . . . . . . . . . 228
Chapter 8 Expert Analysis . . . . . . . . . . . . . . . . . . . . . . . . . . . . . . . . . . . . . . 229About Expert analysis . . . . . . . . . . . . . . . . . . . . . . . . . . . . . . . . . . . . . . . . . . . . . . . . . . . 230Expert views and tabs . . . . . . . . . . . . . . . . . . . . . . . . . . . . . . . . . . . . . . . . . . . . . . . . . . . 230
Expert events . . . . . . . . . . . . . . . . . . . . . . . . . . . . . . . . . . . . . . . . . . . . . . . . . . . . . . 232Expert Clients/Servers view. . . . . . . . . . . . . . . . . . . . . . . . . . . . . . . . . . . . . . . . . . 232Expert Flows view. . . . . . . . . . . . . . . . . . . . . . . . . . . . . . . . . . . . . . . . . . . . . . . . . . 234Expert Applications view. . . . . . . . . . . . . . . . . . . . . . . . . . . . . . . . . . . . . . . . . . . . 235Expert lower pane tabs. . . . . . . . . . . . . . . . . . . . . . . . . . . . . . . . . . . . . . . . . . . . . . 237
Configuring Expert views . . . . . . . . . . . . . . . . . . . . . . . . . . . . . . . . . . . . . . . . . . . . . . . 239Configuring column display. . . . . . . . . . . . . . . . . . . . . . . . . . . . . . . . . . . . . . . . . 239Expert view options dialog . . . . . . . . . . . . . . . . . . . . . . . . . . . . . . . . . . . . . . . . . . 239Setting client/server colors. . . . . . . . . . . . . . . . . . . . . . . . . . . . . . . . . . . . . . . . . . . 240
viii

OmniPeek User Guide
ANYOP_UG.book Page ix Friday, February 5, 2016 4:47 PM
Setting units for time and throughput . . . . . . . . . . . . . . . . . . . . . . . . . . . . . . . . 241Expert view packet selection. . . . . . . . . . . . . . . . . . . . . . . . . . . . . . . . . . . . . . . . . 242Expert save functions . . . . . . . . . . . . . . . . . . . . . . . . . . . . . . . . . . . . . . . . . . . . . . . 243
Expert EventFinder . . . . . . . . . . . . . . . . . . . . . . . . . . . . . . . . . . . . . . . . . . . . . . . . . . . . . 243Expert memory usage . . . . . . . . . . . . . . . . . . . . . . . . . . . . . . . . . . . . . . . . . . . . . . 245
Visual Expert . . . . . . . . . . . . . . . . . . . . . . . . . . . . . . . . . . . . . . . . . . . . . . . . . . . . . . . . . . 246PacketVisualizer tab . . . . . . . . . . . . . . . . . . . . . . . . . . . . . . . . . . . . . . . . . . . . . . . . 247Payload tab. . . . . . . . . . . . . . . . . . . . . . . . . . . . . . . . . . . . . . . . . . . . . . . . . . . . . . . . 250Graphs tab . . . . . . . . . . . . . . . . . . . . . . . . . . . . . . . . . . . . . . . . . . . . . . . . . . . . . . . . 252What If tab . . . . . . . . . . . . . . . . . . . . . . . . . . . . . . . . . . . . . . . . . . . . . . . . . . . . . . . . 261Compare tab . . . . . . . . . . . . . . . . . . . . . . . . . . . . . . . . . . . . . . . . . . . . . . . . . . . . . . 262Summary tab. . . . . . . . . . . . . . . . . . . . . . . . . . . . . . . . . . . . . . . . . . . . . . . . . . . . . . 264
Network policy settings . . . . . . . . . . . . . . . . . . . . . . . . . . . . . . . . . . . . . . . . . . . . . . . . . 264Vendor ID policy. . . . . . . . . . . . . . . . . . . . . . . . . . . . . . . . . . . . . . . . . . . . . . . . . . . 265Channel policy. . . . . . . . . . . . . . . . . . . . . . . . . . . . . . . . . . . . . . . . . . . . . . . . . . . . . 266ESSID policy . . . . . . . . . . . . . . . . . . . . . . . . . . . . . . . . . . . . . . . . . . . . . . . . . . . . . . 267WLAN encryption policy . . . . . . . . . . . . . . . . . . . . . . . . . . . . . . . . . . . . . . . . . . . 267WLAN authentication policy. . . . . . . . . . . . . . . . . . . . . . . . . . . . . . . . . . . . . . . . 267
Chapter 9 Multi-Segment Analysis . . . . . . . . . . . . . . . . . . . . . . . . . . . . . . . 269About Multi-Segment Analysis. . . . . . . . . . . . . . . . . . . . . . . . . . . . . . . . . . . . . . . . . . . 270MSA project window . . . . . . . . . . . . . . . . . . . . . . . . . . . . . . . . . . . . . . . . . . . . . . . . . . . 271
Flow list. . . . . . . . . . . . . . . . . . . . . . . . . . . . . . . . . . . . . . . . . . . . . . . . . . . . . . . . . . . 272Flow map . . . . . . . . . . . . . . . . . . . . . . . . . . . . . . . . . . . . . . . . . . . . . . . . . . . . . . . . . 274Ladder. . . . . . . . . . . . . . . . . . . . . . . . . . . . . . . . . . . . . . . . . . . . . . . . . . . . . . . . . . . . 276
Creating an MSA project . . . . . . . . . . . . . . . . . . . . . . . . . . . . . . . . . . . . . . . . . . . . . . . . 277Using the MSA wizard . . . . . . . . . . . . . . . . . . . . . . . . . . . . . . . . . . . . . . . . . . . . . . . . . . 279
Create a new multi-segment analysis project . . . . . . . . . . . . . . . . . . . . . . . . . . 279Time range & filter . . . . . . . . . . . . . . . . . . . . . . . . . . . . . . . . . . . . . . . . . . . . . . . . . 279Engines . . . . . . . . . . . . . . . . . . . . . . . . . . . . . . . . . . . . . . . . . . . . . . . . . . . . . . . . . . . 280Capture sessions . . . . . . . . . . . . . . . . . . . . . . . . . . . . . . . . . . . . . . . . . . . . . . . . . . . 281Progress. . . . . . . . . . . . . . . . . . . . . . . . . . . . . . . . . . . . . . . . . . . . . . . . . . . . . . . . . . . 283Segments. . . . . . . . . . . . . . . . . . . . . . . . . . . . . . . . . . . . . . . . . . . . . . . . . . . . . . . . . . 284Edit segment . . . . . . . . . . . . . . . . . . . . . . . . . . . . . . . . . . . . . . . . . . . . . . . . . . . . . . 285Project file. . . . . . . . . . . . . . . . . . . . . . . . . . . . . . . . . . . . . . . . . . . . . . . . . . . . . . . . . 286
MSA project analysis options . . . . . . . . . . . . . . . . . . . . . . . . . . . . . . . . . . . . . . . . . . . . 286Creating a mapping profile . . . . . . . . . . . . . . . . . . . . . . . . . . . . . . . . . . . . . . . . . . 288
Chapter 10 Web Analysis . . . . . . . . . . . . . . . . . . . . . . . . . . . . . . . . . . . . . . . . 291About web analysis . . . . . . . . . . . . . . . . . . . . . . . . . . . . . . . . . . . . . . . . . . . . . . . . . . . . . 292Web view window . . . . . . . . . . . . . . . . . . . . . . . . . . . . . . . . . . . . . . . . . . . . . . . . . . . . . . 292Timing column . . . . . . . . . . . . . . . . . . . . . . . . . . . . . . . . . . . . . . . . . . . . . . . . . . . . . . . . 294
ix

Contents
ANYOP_UG.book Page x Friday, February 5, 2016 4:47 PM
Packet counts in web views. . . . . . . . . . . . . . . . . . . . . . . . . . . . . . . . . . . . . . . . . . 296Web upper pane views . . . . . . . . . . . . . . . . . . . . . . . . . . . . . . . . . . . . . . . . . . . . . . . . . . 297
Servers view . . . . . . . . . . . . . . . . . . . . . . . . . . . . . . . . . . . . . . . . . . . . . . . . . . . . . . . 297Clients view . . . . . . . . . . . . . . . . . . . . . . . . . . . . . . . . . . . . . . . . . . . . . . . . . . . . . . . 297Pages view. . . . . . . . . . . . . . . . . . . . . . . . . . . . . . . . . . . . . . . . . . . . . . . . . . . . . . . . . 298Requests view. . . . . . . . . . . . . . . . . . . . . . . . . . . . . . . . . . . . . . . . . . . . . . . . . . . . . . 299
Web lower pane tabs . . . . . . . . . . . . . . . . . . . . . . . . . . . . . . . . . . . . . . . . . . . . . . . . . . . . 300Details tab. . . . . . . . . . . . . . . . . . . . . . . . . . . . . . . . . . . . . . . . . . . . . . . . . . . . . . . . . 300Headers tab . . . . . . . . . . . . . . . . . . . . . . . . . . . . . . . . . . . . . . . . . . . . . . . . . . . . . . . 301Contents tab. . . . . . . . . . . . . . . . . . . . . . . . . . . . . . . . . . . . . . . . . . . . . . . . . . . . . . . 302Timing tab . . . . . . . . . . . . . . . . . . . . . . . . . . . . . . . . . . . . . . . . . . . . . . . . . . . . . . . . 304
Configuring web views. . . . . . . . . . . . . . . . . . . . . . . . . . . . . . . . . . . . . . . . . . . . . . . . . . 308Web view columns . . . . . . . . . . . . . . . . . . . . . . . . . . . . . . . . . . . . . . . . . . . . . . . . . 308Web packet selection . . . . . . . . . . . . . . . . . . . . . . . . . . . . . . . . . . . . . . . . . . . . . . . 308Web save functions. . . . . . . . . . . . . . . . . . . . . . . . . . . . . . . . . . . . . . . . . . . . . . . . . 309
Chapter 11 Voice & Video Analysis . . . . . . . . . . . . . . . . . . . . . . . . . . . . . . . 311About Voice & Video analysis . . . . . . . . . . . . . . . . . . . . . . . . . . . . . . . . . . . . . . . . . . . . 312Voice & Video view window . . . . . . . . . . . . . . . . . . . . . . . . . . . . . . . . . . . . . . . . . . . . . 312Voice & Video upper pane views . . . . . . . . . . . . . . . . . . . . . . . . . . . . . . . . . . . . . . . . . 314
Calls view . . . . . . . . . . . . . . . . . . . . . . . . . . . . . . . . . . . . . . . . . . . . . . . . . . . . . . . . . 314Media view. . . . . . . . . . . . . . . . . . . . . . . . . . . . . . . . . . . . . . . . . . . . . . . . . . . . . . . . 315
Voice & Video lower pane tabs . . . . . . . . . . . . . . . . . . . . . . . . . . . . . . . . . . . . . . . . . . . 316Voice & Video Details tab . . . . . . . . . . . . . . . . . . . . . . . . . . . . . . . . . . . . . . . . . . . 316Voice & Video Event Summary tab. . . . . . . . . . . . . . . . . . . . . . . . . . . . . . . . . . . 317Voice & Video Event Log tab . . . . . . . . . . . . . . . . . . . . . . . . . . . . . . . . . . . . . . . . 318
Calls and Media options. . . . . . . . . . . . . . . . . . . . . . . . . . . . . . . . . . . . . . . . . . . . . . . . . 319Voice & Video Visual Expert. . . . . . . . . . . . . . . . . . . . . . . . . . . . . . . . . . . . . . . . . 320Saving voice and video statistics. . . . . . . . . . . . . . . . . . . . . . . . . . . . . . . . . . . . . . 325Playing calls or media as audio. . . . . . . . . . . . . . . . . . . . . . . . . . . . . . . . . . . . . . . 325Saving calls or media as audio WAV files . . . . . . . . . . . . . . . . . . . . . . . . . . . . . . 326Selecting voice and video related packets . . . . . . . . . . . . . . . . . . . . . . . . . . . . . . 326Making a voice or video filter . . . . . . . . . . . . . . . . . . . . . . . . . . . . . . . . . . . . . . . . 326
Configuring options in Voice & Video views. . . . . . . . . . . . . . . . . . . . . . . . . . . . . . . 328Voice & Video view columns . . . . . . . . . . . . . . . . . . . . . . . . . . . . . . . . . . . . . . . . 328Setting VoIP options. . . . . . . . . . . . . . . . . . . . . . . . . . . . . . . . . . . . . . . . . . . . . . . . 328
Summary voice and video statistics . . . . . . . . . . . . . . . . . . . . . . . . . . . . . . . . . . . . . . . 329
Chapter 12 Displaying and Reporting Statistics . . . . . . . . . . . . . . . . . . . . 333About statistics . . . . . . . . . . . . . . . . . . . . . . . . . . . . . . . . . . . . . . . . . . . . . . . . . . . . . . . . . 334Monitoring network statistics . . . . . . . . . . . . . . . . . . . . . . . . . . . . . . . . . . . . . . . . . . . . 334
Configuring monitor options. . . . . . . . . . . . . . . . . . . . . . . . . . . . . . . . . . . . . . . . 335
x
OmniPeek User Guide
ANYOP_UG.book Page xi Friday, February 5, 2016 4:47 PM
Viewing capture window statistics . . . . . . . . . . . . . . . . . . . . . . . . . . . . . . . . . . . . . . . . 337Configuring statistics displays . . . . . . . . . . . . . . . . . . . . . . . . . . . . . . . . . . . . . . . . . . . . 338
View options for statistics . . . . . . . . . . . . . . . . . . . . . . . . . . . . . . . . . . . . . . . . . . . 338Controlling color in statistics lists . . . . . . . . . . . . . . . . . . . . . . . . . . . . . . . . . . . . 338
Saving statistics output . . . . . . . . . . . . . . . . . . . . . . . . . . . . . . . . . . . . . . . . . . . . . . . . . . 338Saving statistics . . . . . . . . . . . . . . . . . . . . . . . . . . . . . . . . . . . . . . . . . . . . . . . . . . . . 339Generating statistics reports . . . . . . . . . . . . . . . . . . . . . . . . . . . . . . . . . . . . . . . . . 339Printing statistics. . . . . . . . . . . . . . . . . . . . . . . . . . . . . . . . . . . . . . . . . . . . . . . . . . . 339
Nodes statistics. . . . . . . . . . . . . . . . . . . . . . . . . . . . . . . . . . . . . . . . . . . . . . . . . . . . . . . . . 339Hierarchy view of nodes . . . . . . . . . . . . . . . . . . . . . . . . . . . . . . . . . . . . . . . . . . . . 341Flat views of nodes . . . . . . . . . . . . . . . . . . . . . . . . . . . . . . . . . . . . . . . . . . . . . . . . . 341Viewing details for a network node. . . . . . . . . . . . . . . . . . . . . . . . . . . . . . . . . . . 341
Protocols statistics . . . . . . . . . . . . . . . . . . . . . . . . . . . . . . . . . . . . . . . . . . . . . . . . . . . . . . 342Hierarchy view of protocols . . . . . . . . . . . . . . . . . . . . . . . . . . . . . . . . . . . . . . . . . 344Flat view of protocols . . . . . . . . . . . . . . . . . . . . . . . . . . . . . . . . . . . . . . . . . . . . . . . 344ProtoSpecs™ . . . . . . . . . . . . . . . . . . . . . . . . . . . . . . . . . . . . . . . . . . . . . . . . . . . . . . 344Viewing details for a protocol. . . . . . . . . . . . . . . . . . . . . . . . . . . . . . . . . . . . . . . . 345
Network statistics. . . . . . . . . . . . . . . . . . . . . . . . . . . . . . . . . . . . . . . . . . . . . . . . . . . . . . . 346Size statistics . . . . . . . . . . . . . . . . . . . . . . . . . . . . . . . . . . . . . . . . . . . . . . . . . . . . . . . . . . . 348Summary statistics. . . . . . . . . . . . . . . . . . . . . . . . . . . . . . . . . . . . . . . . . . . . . . . . . . . . . . 349
Creating snapshots of summary statistics . . . . . . . . . . . . . . . . . . . . . . . . . . . . . 351History statistics. . . . . . . . . . . . . . . . . . . . . . . . . . . . . . . . . . . . . . . . . . . . . . . . . . . . . . . . 351Channel statistics . . . . . . . . . . . . . . . . . . . . . . . . . . . . . . . . . . . . . . . . . . . . . . . . . . . . . . . 353WLAN statistics . . . . . . . . . . . . . . . . . . . . . . . . . . . . . . . . . . . . . . . . . . . . . . . . . . . . . . . . 355
Hierarchy of wireless nodes. . . . . . . . . . . . . . . . . . . . . . . . . . . . . . . . . . . . . . . . . . 358Signal statistics . . . . . . . . . . . . . . . . . . . . . . . . . . . . . . . . . . . . . . . . . . . . . . . . . . . . . . . . . 358Applications statistics . . . . . . . . . . . . . . . . . . . . . . . . . . . . . . . . . . . . . . . . . . . . . . . . . . . 360Countries statistics. . . . . . . . . . . . . . . . . . . . . . . . . . . . . . . . . . . . . . . . . . . . . . . . . . . . . . 362Generating statistics output reports. . . . . . . . . . . . . . . . . . . . . . . . . . . . . . . . . . . . . . . 363
Statistics output reports from monitor statistics. . . . . . . . . . . . . . . . . . . . . . . . 363Statistics output reports from capture window statistics. . . . . . . . . . . . . . . . . 364New file set schedule. . . . . . . . . . . . . . . . . . . . . . . . . . . . . . . . . . . . . . . . . . . . . . . . 365
Viewing statistics output reports . . . . . . . . . . . . . . . . . . . . . . . . . . . . . . . . . . . . . . . . . 366
Chapter 13 Using the Peer Map . . . . . . . . . . . . . . . . . . . . . . . . . . . . . . . . . . 369About the Peer Map . . . . . . . . . . . . . . . . . . . . . . . . . . . . . . . . . . . . . . . . . . . . . . . . . . . . 370The Peer Map view . . . . . . . . . . . . . . . . . . . . . . . . . . . . . . . . . . . . . . . . . . . . . . . . . . . . . 370
Nodes and traffic in the Peer Map. . . . . . . . . . . . . . . . . . . . . . . . . . . . . . . . . . . . 371Parts of the Peer Map. . . . . . . . . . . . . . . . . . . . . . . . . . . . . . . . . . . . . . . . . . . . . . . 371Configuration tab . . . . . . . . . . . . . . . . . . . . . . . . . . . . . . . . . . . . . . . . . . . . . . . . . . 372Node Visibilities tab . . . . . . . . . . . . . . . . . . . . . . . . . . . . . . . . . . . . . . . . . . . . . . . . 374Profiles tab . . . . . . . . . . . . . . . . . . . . . . . . . . . . . . . . . . . . . . . . . . . . . . . . . . . . . . . . 376
xi

Contents
ANYOP_UG.book Page xii Friday, February 5, 2016 4:47 PM
Peer Map options. . . . . . . . . . . . . . . . . . . . . . . . . . . . . . . . . . . . . . . . . . . . . . . . . . . . . . . 377Displaying relevant nodes and traffic. . . . . . . . . . . . . . . . . . . . . . . . . . . . . . . . . . . . . . 378
Displaying node tooltips . . . . . . . . . . . . . . . . . . . . . . . . . . . . . . . . . . . . . . . . . . . . 381
Chapter 14 Creating Graphs . . . . . . . . . . . . . . . . . . . . . . . . . . . . . . . . . . . . . 383About graphs . . . . . . . . . . . . . . . . . . . . . . . . . . . . . . . . . . . . . . . . . . . . . . . . . . . . . . . . . . 384OmniPeek monitor statistics graphs . . . . . . . . . . . . . . . . . . . . . . . . . . . . . . . . . . . . . . 384OmniPeek capture statistics graphs . . . . . . . . . . . . . . . . . . . . . . . . . . . . . . . . . . . . . . . 386
OmniPeek capture window graphs. . . . . . . . . . . . . . . . . . . . . . . . . . . . . . . . . . . 388Capture Engine statistics graphs. . . . . . . . . . . . . . . . . . . . . . . . . . . . . . . . . . . . . . . . . . 390
Capture Engine graphs tab . . . . . . . . . . . . . . . . . . . . . . . . . . . . . . . . . . . . . . . . . . 391Capture Engine graphs capture options. . . . . . . . . . . . . . . . . . . . . . . . . . . . . . . 392Capture Engine capture window graphs . . . . . . . . . . . . . . . . . . . . . . . . . . . . . . 394
Capture Engine graph templates . . . . . . . . . . . . . . . . . . . . . . . . . . . . . . . . . . . . . . . . . 396Creating a new Capture Engine graph template. . . . . . . . . . . . . . . . . . . . . . . . 397Editing a Capture Engine graph template . . . . . . . . . . . . . . . . . . . . . . . . . . . . . 400
Configuring and saving graphs. . . . . . . . . . . . . . . . . . . . . . . . . . . . . . . . . . . . . . . . . . . 401Graph display options . . . . . . . . . . . . . . . . . . . . . . . . . . . . . . . . . . . . . . . . . . . . . . 401Saving OmniPeek graphs . . . . . . . . . . . . . . . . . . . . . . . . . . . . . . . . . . . . . . . . . . . 403Saving Capture Engine graphs. . . . . . . . . . . . . . . . . . . . . . . . . . . . . . . . . . . . . . . 404
Chapter 15 Setting Alarms and Triggers . . . . . . . . . . . . . . . . . . . . . . . . . . . 405About alarms and triggers . . . . . . . . . . . . . . . . . . . . . . . . . . . . . . . . . . . . . . . . . . . . . . . 406Viewing alarms. . . . . . . . . . . . . . . . . . . . . . . . . . . . . . . . . . . . . . . . . . . . . . . . . . . . . . . . . 406
Predefined alarms. . . . . . . . . . . . . . . . . . . . . . . . . . . . . . . . . . . . . . . . . . . . . . . . . . 406OmniPeek alarms . . . . . . . . . . . . . . . . . . . . . . . . . . . . . . . . . . . . . . . . . . . . . . . . . . 406Capture Engine alarm windows. . . . . . . . . . . . . . . . . . . . . . . . . . . . . . . . . . . . . . 409
Creating and editing alarms. . . . . . . . . . . . . . . . . . . . . . . . . . . . . . . . . . . . . . . . . . . . . . 413Creating and editing Capture Engine alarms . . . . . . . . . . . . . . . . . . . . . . . . . . 415
Setting triggers . . . . . . . . . . . . . . . . . . . . . . . . . . . . . . . . . . . . . . . . . . . . . . . . . . . . . . . . . 417Setting start and stop triggers on a Capture Engine. . . . . . . . . . . . . . . . . . . . . 420
Chapter 16 Sending Notifications . . . . . . . . . . . . . . . . . . . . . . . . . . . . . . . . . 425About notifications . . . . . . . . . . . . . . . . . . . . . . . . . . . . . . . . . . . . . . . . . . . . . . . . . . . . . 426Configuring notifications. . . . . . . . . . . . . . . . . . . . . . . . . . . . . . . . . . . . . . . . . . . . . . . . 426Creating a notification action . . . . . . . . . . . . . . . . . . . . . . . . . . . . . . . . . . . . . . . . . . . . 428
Sources of Capture Engine notifications . . . . . . . . . . . . . . . . . . . . . . . . . . . . . . 430
Chapter 17 Using the Name Table . . . . . . . . . . . . . . . . . . . . . . . . . . . . . . . . 433About the name table . . . . . . . . . . . . . . . . . . . . . . . . . . . . . . . . . . . . . . . . . . . . . . . . . . . 434Adding entries to the name table . . . . . . . . . . . . . . . . . . . . . . . . . . . . . . . . . . . . . . . . . 434
xii

OmniPeek User Guide
ANYOP_UG.book Page xiii Friday, February 5, 2016 4:47 PM
The name table window . . . . . . . . . . . . . . . . . . . . . . . . . . . . . . . . . . . . . . . . . . . . 434Adding and editing name table entries manually. . . . . . . . . . . . . . . . . . . . . . . 436Adding names from other windows . . . . . . . . . . . . . . . . . . . . . . . . . . . . . . . . . . 437Trusted, known, and unknown nodes . . . . . . . . . . . . . . . . . . . . . . . . . . . . . . . . 437
OmniPeek name resolution. . . . . . . . . . . . . . . . . . . . . . . . . . . . . . . . . . . . . . . . . . . . . . 438Configuring name resolution. . . . . . . . . . . . . . . . . . . . . . . . . . . . . . . . . . . . . . . . 439
Loading and saving name table data . . . . . . . . . . . . . . . . . . . . . . . . . . . . . . . . . . . . . . 440Loading a previously saved name table. . . . . . . . . . . . . . . . . . . . . . . . . . . . . . . . 440Saving the name table . . . . . . . . . . . . . . . . . . . . . . . . . . . . . . . . . . . . . . . . . . . . . . 441
Using the Capture Engine trust table. . . . . . . . . . . . . . . . . . . . . . . . . . . . . . . . . . . . . . 442Capture Engine trust table tab . . . . . . . . . . . . . . . . . . . . . . . . . . . . . . . . . . . . . . . 442Capture Engine name resolution. . . . . . . . . . . . . . . . . . . . . . . . . . . . . . . . . . . . . 443
Chapter 18 Viewing Logs . . . . . . . . . . . . . . . . . . . . . . . . . . . . . . . . . . . . . . . . 445About logs. . . . . . . . . . . . . . . . . . . . . . . . . . . . . . . . . . . . . . . . . . . . . . . . . . . . . . . . . . . . . 446OmniPeek global log. . . . . . . . . . . . . . . . . . . . . . . . . . . . . . . . . . . . . . . . . . . . . . . . . . . . 446Capture Engine global log . . . . . . . . . . . . . . . . . . . . . . . . . . . . . . . . . . . . . . . . . . . . . . . 447OmniPeek capture logs. . . . . . . . . . . . . . . . . . . . . . . . . . . . . . . . . . . . . . . . . . . . . . . . . . 449Capture Engine capture logs . . . . . . . . . . . . . . . . . . . . . . . . . . . . . . . . . . . . . . . . . . . . . 451Capture Engine audit log . . . . . . . . . . . . . . . . . . . . . . . . . . . . . . . . . . . . . . . . . . . . . . . . 453
Chapter 19 Applying Analysis Modules . . . . . . . . . . . . . . . . . . . . . . . . . . . 455About analysis modules . . . . . . . . . . . . . . . . . . . . . . . . . . . . . . . . . . . . . . . . . . . . . . . . . 456Enabling and configuring analysis modules. . . . . . . . . . . . . . . . . . . . . . . . . . . . . . . . 456
Apply analysis module command. . . . . . . . . . . . . . . . . . . . . . . . . . . . . . . . . . . . 457Using analysis modules . . . . . . . . . . . . . . . . . . . . . . . . . . . . . . . . . . . . . . . . . . . . . 458
Installed analysis modules . . . . . . . . . . . . . . . . . . . . . . . . . . . . . . . . . . . . . . . . . . . . . . . 458Capture Engine analysis modules . . . . . . . . . . . . . . . . . . . . . . . . . . . . . . . . . . . . 458
Chapter 20 Using AutoCapture . . . . . . . . . . . . . . . . . . . . . . . . . . . . . . . . . . . 461About AutoCapture. . . . . . . . . . . . . . . . . . . . . . . . . . . . . . . . . . . . . . . . . . . . . . . . . . . . . 462Creating and editing AutoCapture files. . . . . . . . . . . . . . . . . . . . . . . . . . . . . . . . . . . . 462
AutoCapture adapter search. . . . . . . . . . . . . . . . . . . . . . . . . . . . . . . . . . . . . . . . . 463AutoCapture templates . . . . . . . . . . . . . . . . . . . . . . . . . . . . . . . . . . . . . . . . . . . . . 466AutoCapture send options . . . . . . . . . . . . . . . . . . . . . . . . . . . . . . . . . . . . . . . . . . 468
Using an AutoCapture file . . . . . . . . . . . . . . . . . . . . . . . . . . . . . . . . . . . . . . . . . . . . . . . 470Using AutoCapture files as scheduled tasks . . . . . . . . . . . . . . . . . . . . . . . . . . . . 471
Chapter 21 Sending Packets . . . . . . . . . . . . . . . . . . . . . . . . . . . . . . . . . . . . . 473About sending packets . . . . . . . . . . . . . . . . . . . . . . . . . . . . . . . . . . . . . . . . . . . . . . . . . . 474Selecting the send adapter . . . . . . . . . . . . . . . . . . . . . . . . . . . . . . . . . . . . . . . . . . . . . . . 474
xiii

Contents
ANYOP_UG.book Page xiv Friday, February 5, 2016 4:47 PM
Sending the send packet . . . . . . . . . . . . . . . . . . . . . . . . . . . . . . . . . . . . . . . . . . . . . . . . . 475Editing the send packet. . . . . . . . . . . . . . . . . . . . . . . . . . . . . . . . . . . . . . . . . . . . . . . . . . 476
Chapter 22 Configuring Options . . . . . . . . . . . . . . . . . . . . . . . . . . . . . . . . . . 479Configuring the Options dialog . . . . . . . . . . . . . . . . . . . . . . . . . . . . . . . . . . . . . . . . . . 480Configuring display format options. . . . . . . . . . . . . . . . . . . . . . . . . . . . . . . . . . . . . . . 481Configuring color options . . . . . . . . . . . . . . . . . . . . . . . . . . . . . . . . . . . . . . . . . . . . . . . 482Customizing the tools menu. . . . . . . . . . . . . . . . . . . . . . . . . . . . . . . . . . . . . . . . . . . . . 483Optimizing capture performance. . . . . . . . . . . . . . . . . . . . . . . . . . . . . . . . . . . . . . . . . 483
Chapter 23 Capturing Data for Wireless Analysis . . . . . . . . . . . . . . . . . . . 487About 802.11 . . . . . . . . . . . . . . . . . . . . . . . . . . . . . . . . . . . . . . . . . . . . . . . . . . . . . . . . . . 488Configuring wireless channels and encryption . . . . . . . . . . . . . . . . . . . . . . . . . . . . . 488
Edit scanning options. . . . . . . . . . . . . . . . . . . . . . . . . . . . . . . . . . . . . . . . . . . . . . . 490Edit key sets . . . . . . . . . . . . . . . . . . . . . . . . . . . . . . . . . . . . . . . . . . . . . . . . . . . . . . . 491
Troubleshooting WLAN . . . . . . . . . . . . . . . . . . . . . . . . . . . . . . . . . . . . . . . . . . . . . . . . 494Portable analysis . . . . . . . . . . . . . . . . . . . . . . . . . . . . . . . . . . . . . . . . . . . . . . . . . . . 494Distributed analysis . . . . . . . . . . . . . . . . . . . . . . . . . . . . . . . . . . . . . . . . . . . . . . . . 494
Optimizing wireless analysis . . . . . . . . . . . . . . . . . . . . . . . . . . . . . . . . . . . . . . . . . . . . . 495Roaming latency analysis . . . . . . . . . . . . . . . . . . . . . . . . . . . . . . . . . . . . . . . . . . . . . . . . 496
Log. . . . . . . . . . . . . . . . . . . . . . . . . . . . . . . . . . . . . . . . . . . . . . . . . . . . . . . . . . . . . . . 497by Node. . . . . . . . . . . . . . . . . . . . . . . . . . . . . . . . . . . . . . . . . . . . . . . . . . . . . . . . . . . 497by AP. . . . . . . . . . . . . . . . . . . . . . . . . . . . . . . . . . . . . . . . . . . . . . . . . . . . . . . . . . . . . 498
Chapter 24 Configuring Analyzer Cards . . . . . . . . . . . . . . . . . . . . . . . . . . . 501About analyzer cards. . . . . . . . . . . . . . . . . . . . . . . . . . . . . . . . . . . . . . . . . . . . . . . . . . . . 502Configuring hardware profiles for adapters . . . . . . . . . . . . . . . . . . . . . . . . . . . . . . . . 502
Configuring hardware profiles for adapters on a Capture Engine . . . . . . . . 505
Chapter 25 OmniPeek Remote Assistant . . . . . . . . . . . . . . . . . . . . . . . . . . 507About OmniPeek Remote Assistant. . . . . . . . . . . . . . . . . . . . . . . . . . . . . . . . . . . . . . . 508Generating an ORA management file . . . . . . . . . . . . . . . . . . . . . . . . . . . . . . . . . . . . . 508Generating encrypted capture files. . . . . . . . . . . . . . . . . . . . . . . . . . . . . . . . . . . . . . . . 509Opening an encrypted capture file. . . . . . . . . . . . . . . . . . . . . . . . . . . . . . . . . . . . . . . . 511Importing an ORA management file. . . . . . . . . . . . . . . . . . . . . . . . . . . . . . . . . . . . . . 512Exporting ORA management file. . . . . . . . . . . . . . . . . . . . . . . . . . . . . . . . . . . . . . . . . 512Upgrading the number of ORA licenses. . . . . . . . . . . . . . . . . . . . . . . . . . . . . . . . . . . 512
Chapter 26 Global Positioning System . . . . . . . . . . . . . . . . . . . . . . . . . . . . 515About GPS . . . . . . . . . . . . . . . . . . . . . . . . . . . . . . . . . . . . . . . . . . . . . . . . . . . . . . . . . . . . 516Enabling GPS . . . . . . . . . . . . . . . . . . . . . . . . . . . . . . . . . . . . . . . . . . . . . . . . . . . . . . . . . . 516
xiv

OmniPeek User Guide
ANYOP_UG.book Page xv Friday, February 5, 2016 4:47 PM
Starting the Savvius GPS daemon from the system tray . . . . . . . . . . . . . . . . . . . . . 517GPS columns in the Packets view. . . . . . . . . . . . . . . . . . . . . . . . . . . . . . . . . . . . . . . . . 518
Appendix A Menus and Keyboard Shortcuts . . . . . . . . . . . . . . . . . . . 521File menu. . . . . . . . . . . . . . . . . . . . . . . . . . . . . . . . . . . . . . . . . . . . . . . . . . . . . . . . . . . . . . 522Edit menu . . . . . . . . . . . . . . . . . . . . . . . . . . . . . . . . . . . . . . . . . . . . . . . . . . . . . . . . . . . . . 523View menu . . . . . . . . . . . . . . . . . . . . . . . . . . . . . . . . . . . . . . . . . . . . . . . . . . . . . . . . . . . . 526Capture menu . . . . . . . . . . . . . . . . . . . . . . . . . . . . . . . . . . . . . . . . . . . . . . . . . . . . . . . . . 528Send menu . . . . . . . . . . . . . . . . . . . . . . . . . . . . . . . . . . . . . . . . . . . . . . . . . . . . . . . . . . . . 528Monitor menu . . . . . . . . . . . . . . . . . . . . . . . . . . . . . . . . . . . . . . . . . . . . . . . . . . . . . . . . . 529Tools menu . . . . . . . . . . . . . . . . . . . . . . . . . . . . . . . . . . . . . . . . . . . . . . . . . . . . . . . . . . . . 529Window menu. . . . . . . . . . . . . . . . . . . . . . . . . . . . . . . . . . . . . . . . . . . . . . . . . . . . . . . . . 530Help menu . . . . . . . . . . . . . . . . . . . . . . . . . . . . . . . . . . . . . . . . . . . . . . . . . . . . . . . . . . . . 531
Appendix B Reference . . . . . . . . . . . . . . . . . . . . . . . . . . . . . . . . . . . . . 533Packet list columns . . . . . . . . . . . . . . . . . . . . . . . . . . . . . . . . . . . . . . . . . . . . . . . . . . . . . 534
Special address ranges . . . . . . . . . . . . . . . . . . . . . . . . . . . . . . . . . . . . . . . . . . . . . . 539Expert view columns. . . . . . . . . . . . . . . . . . . . . . . . . . . . . . . . . . . . . . . . . . . . . . . . . . . . 539
Expert clients/servers, flows, and application view columns . . . . . . . . . . . . . 540Expert event log columns . . . . . . . . . . . . . . . . . . . . . . . . . . . . . . . . . . . . . . . . . . . 542Expert node details tab rows and columns . . . . . . . . . . . . . . . . . . . . . . . . . . . . 544Visual Expert PacketVisualizer tab columns . . . . . . . . . . . . . . . . . . . . . . . . . . . 545Visual Expert TCP Trace graph flags. . . . . . . . . . . . . . . . . . . . . . . . . . . . . . . . . . 546
Web view columns . . . . . . . . . . . . . . . . . . . . . . . . . . . . . . . . . . . . . . . . . . . . . . . . . . . . . 546Voice & Video view columns. . . . . . . . . . . . . . . . . . . . . . . . . . . . . . . . . . . . . . . . . . . . . 548Voice & Video Visual Expert columns. . . . . . . . . . . . . . . . . . . . . . . . . . . . . . . . . . . . . 552Nodes statistics columns . . . . . . . . . . . . . . . . . . . . . . . . . . . . . . . . . . . . . . . . . . . . . . . . 553Applications statistics columns. . . . . . . . . . . . . . . . . . . . . . . . . . . . . . . . . . . . . . . . . . . 555WLAN statistics columns. . . . . . . . . . . . . . . . . . . . . . . . . . . . . . . . . . . . . . . . . . . . . . . . 556Channel statistics columns. . . . . . . . . . . . . . . . . . . . . . . . . . . . . . . . . . . . . . . . . . . . . . . 560Capture Engine capture tab columns . . . . . . . . . . . . . . . . . . . . . . . . . . . . . . . . . . . . . 562Capture Engine files tab columns. . . . . . . . . . . . . . . . . . . . . . . . . . . . . . . . . . . . . . . . . 563Capture Engine details tab columns . . . . . . . . . . . . . . . . . . . . . . . . . . . . . . . . . . . . . . 564Starting OmniPeek from the command line . . . . . . . . . . . . . . . . . . . . . . . . . . . . . . . 565
Appendix C OmniPeek Installed Components . . . . . . . . . . . . . . . . . . 567Component descriptions . . . . . . . . . . . . . . . . . . . . . . . . . . . . . . . . . . . . . . . . . . . . . . . . 568
Appendix D Analysis Modules . . . . . . . . . . . . . . . . . . . . . . . . . . . . . . . 571Analysis Module Descriptions. . . . . . . . . . . . . . . . . . . . . . . . . . . . . . . . . . . . . . . . . . . . 572
802.11 Analysis . . . . . . . . . . . . . . . . . . . . . . . . . . . . . . . . . . . . . . . . . . . . . . . . . . . . 572Access Point Capture Adapter . . . . . . . . . . . . . . . . . . . . . . . . . . . . . . . . . . . . . . . 572
xv
Contents
ANYOP_UG.book Page xvi Friday, February 5, 2016 4:47 PM
Aggregator/Roaming Adapter . . . . . . . . . . . . . . . . . . . . . . . . . . . . . . . . . . . . . . . 573AppleTalk Analysis . . . . . . . . . . . . . . . . . . . . . . . . . . . . . . . . . . . . . . . . . . . . . . . . . 574Checksums Analysis. . . . . . . . . . . . . . . . . . . . . . . . . . . . . . . . . . . . . . . . . . . . . . . . 574Compass Analysis . . . . . . . . . . . . . . . . . . . . . . . . . . . . . . . . . . . . . . . . . . . . . . . . . . 575Duplicate Address. . . . . . . . . . . . . . . . . . . . . . . . . . . . . . . . . . . . . . . . . . . . . . . . . . 576Email Analysis . . . . . . . . . . . . . . . . . . . . . . . . . . . . . . . . . . . . . . . . . . . . . . . . . . . . . 577FTP Analysis . . . . . . . . . . . . . . . . . . . . . . . . . . . . . . . . . . . . . . . . . . . . . . . . . . . . . . 578ICMP Analysis. . . . . . . . . . . . . . . . . . . . . . . . . . . . . . . . . . . . . . . . . . . . . . . . . . . . . 579IP Analysis . . . . . . . . . . . . . . . . . . . . . . . . . . . . . . . . . . . . . . . . . . . . . . . . . . . . . . . . 580Modbus Analysis. . . . . . . . . . . . . . . . . . . . . . . . . . . . . . . . . . . . . . . . . . . . . . . . . . . 581MPLS/VLAN Analysis . . . . . . . . . . . . . . . . . . . . . . . . . . . . . . . . . . . . . . . . . . . . . . 581NCP Analysis. . . . . . . . . . . . . . . . . . . . . . . . . . . . . . . . . . . . . . . . . . . . . . . . . . . . . . 582NetWare Analysis . . . . . . . . . . . . . . . . . . . . . . . . . . . . . . . . . . . . . . . . . . . . . . . . . . 582Newsgroup Analysis. . . . . . . . . . . . . . . . . . . . . . . . . . . . . . . . . . . . . . . . . . . . . . . . 582PPP Analysis . . . . . . . . . . . . . . . . . . . . . . . . . . . . . . . . . . . . . . . . . . . . . . . . . . . . . . 583RADIUS Analysis . . . . . . . . . . . . . . . . . . . . . . . . . . . . . . . . . . . . . . . . . . . . . . . . . . 583SCTP Analysis . . . . . . . . . . . . . . . . . . . . . . . . . . . . . . . . . . . . . . . . . . . . . . . . . . . . . 583SMB Analysis. . . . . . . . . . . . . . . . . . . . . . . . . . . . . . . . . . . . . . . . . . . . . . . . . . . . . . 583SQL Analysis . . . . . . . . . . . . . . . . . . . . . . . . . . . . . . . . . . . . . . . . . . . . . . . . . . . . . . 584SUM Analysis . . . . . . . . . . . . . . . . . . . . . . . . . . . . . . . . . . . . . . . . . . . . . . . . . . . . . 584tcpdump Capture Adapter . . . . . . . . . . . . . . . . . . . . . . . . . . . . . . . . . . . . . . . . . . 585Telnet Analysis. . . . . . . . . . . . . . . . . . . . . . . . . . . . . . . . . . . . . . . . . . . . . . . . . . . . . 585VoIP Analysis. . . . . . . . . . . . . . . . . . . . . . . . . . . . . . . . . . . . . . . . . . . . . . . . . . . . . . 585WAN Analysis . . . . . . . . . . . . . . . . . . . . . . . . . . . . . . . . . . . . . . . . . . . . . . . . . . . . . 586Web Analysis . . . . . . . . . . . . . . . . . . . . . . . . . . . . . . . . . . . . . . . . . . . . . . . . . . . . . . 586
Appendix E Expert Events . . . . . . . . . . . . . . . . . . . . . . . . . . . . . . . . . . 587About Expert events . . . . . . . . . . . . . . . . . . . . . . . . . . . . . . . . . . . . . . . . . . . . . . . . . . . . 588VoIP . . . . . . . . . . . . . . . . . . . . . . . . . . . . . . . . . . . . . . . . . . . . . . . . . . . . . . . . . . . . . . . . . . 588WAN . . . . . . . . . . . . . . . . . . . . . . . . . . . . . . . . . . . . . . . . . . . . . . . . . . . . . . . . . . . . . . . . . 590Wireless . . . . . . . . . . . . . . . . . . . . . . . . . . . . . . . . . . . . . . . . . . . . . . . . . . . . . . . . . . . . . . . 590Network Policy. . . . . . . . . . . . . . . . . . . . . . . . . . . . . . . . . . . . . . . . . . . . . . . . . . . . . . . . . 595Client/Server. . . . . . . . . . . . . . . . . . . . . . . . . . . . . . . . . . . . . . . . . . . . . . . . . . . . . . . . . . . 595Application . . . . . . . . . . . . . . . . . . . . . . . . . . . . . . . . . . . . . . . . . . . . . . . . . . . . . . . . . . . . 596Session . . . . . . . . . . . . . . . . . . . . . . . . . . . . . . . . . . . . . . . . . . . . . . . . . . . . . . . . . . . . . . . . 599Transport. . . . . . . . . . . . . . . . . . . . . . . . . . . . . . . . . . . . . . . . . . . . . . . . . . . . . . . . . . . . . . 599Network. . . . . . . . . . . . . . . . . . . . . . . . . . . . . . . . . . . . . . . . . . . . . . . . . . . . . . . . . . . . . . . 601Data Link. . . . . . . . . . . . . . . . . . . . . . . . . . . . . . . . . . . . . . . . . . . . . . . . . . . . . . . . . . . . . . 602Physical . . . . . . . . . . . . . . . . . . . . . . . . . . . . . . . . . . . . . . . . . . . . . . . . . . . . . . . . . . . . . . . 603
Appendix F Real-World Security Investigations . . . . . . . . . . . . . . . . 605About real-world security investigations. . . . . . . . . . . . . . . . . . . . . . . . . . . . . . . . . . . 606
xvi

OmniPeek User Guide
ANYOP_UG.book Page xvii Friday, February 5, 2016 4:47 PM
Investigation #1: Tracing the course of a server attack . . . . . . . . . . . . . . . . . . . . . . . 606Summary . . . . . . . . . . . . . . . . . . . . . . . . . . . . . . . . . . . . . . . . . . . . . . . . . . . . . . . . . 608
Investigation #2: Ensuring compliance with security regulations and catching leaked data. . . . . . . . . . . . . . . . . . . . . . . . . . . . . . . . . . . . . . . . . . . . . . . . . . . . . . . . . . . 608
Summary . . . . . . . . . . . . . . . . . . . . . . . . . . . . . . . . . . . . . . . . . . . . . . . . . . . . . . . . . 610Investigation #3: Transaction verification for an online gaming company . . . . . 610
Summary . . . . . . . . . . . . . . . . . . . . . . . . . . . . . . . . . . . . . . . . . . . . . . . . . . . . . . . . . 611Investigation #4: Transaction verification for a merchant services company. . . . 611
Summary . . . . . . . . . . . . . . . . . . . . . . . . . . . . . . . . . . . . . . . . . . . . . . . . . . . . . . . . . 612Security best practices. . . . . . . . . . . . . . . . . . . . . . . . . . . . . . . . . . . . . . . . . . . . . . . . . . . 612
Best practice #1: Capture traffic at every location. . . . . . . . . . . . . . . . . . . . . . . 612Best practice #2: Capture traffic 24/7 . . . . . . . . . . . . . . . . . . . . . . . . . . . . . . . . . 612Best practice #3: Set filters to detect anomalous behavior. . . . . . . . . . . . . . . . 612Summary . . . . . . . . . . . . . . . . . . . . . . . . . . . . . . . . . . . . . . . . . . . . . . . . . . . . . . . . . 614
Index . . . . . . . . . . . . . . . . . . . . . . . . . . . . . . . . . . . . . . . . . 615
xvii

Contents
ANYOP_UG.book Page xviii Friday, February 5, 2016 4:47 PM
xviii

C H A P T E R 1
ANYOP_UG.book Page 1 Friday, February 5, 2016 4:47 PM
Introduction
In this chapter:
About OmniPeek . . . . . . . . . . . . . . . . . . . . . . . . . . . . . . . . . . . . . . . . . . . . . . . . . 2
System requirements . . . . . . . . . . . . . . . . . . . . . . . . . . . . . . . . . . . . . . . . . . . . . . 5
Supported adapters . . . . . . . . . . . . . . . . . . . . . . . . . . . . . . . . . . . . . . . . . . . . . . . 6
Installing OmniPeek . . . . . . . . . . . . . . . . . . . . . . . . . . . . . . . . . . . . . . . . . . . . . . . 7
Installing a Capture Engine . . . . . . . . . . . . . . . . . . . . . . . . . . . . . . . . . . . . . . . . . 8
Main program window and Start Page . . . . . . . . . . . . . . . . . . . . . . . . . . . . . . . . . 8
Commonly used terms . . . . . . . . . . . . . . . . . . . . . . . . . . . . . . . . . . . . . . . . . . . . . 9
1

Chapter 1: Introduction
ANYOP_UG.book Page 2 Friday, February 5, 2016 4:47 PM
About OmniPeek Welcome to OmniPeek, the network software analyzer from Savvius! OmniPeek functions both as a portable network analyzer as well as a software console for distributed Capture Engines for OmniPeek installed at strategic locations across the network.
OmniPeek as a portable analyzer
As a portable analyzer, OmniPeek offers an intuitive, easy-to-use graphical interface that engi-neers can use to rapidly analyze and troubleshoot enterprise networks. OmniPeek supports local captures from multiple interfaces and data collection from any network topology, includ-ing 1 Gigabit and 10 Gigabit networks, wireless networks, and local matrix switches.
OmniPeek with distributed Capture Engines
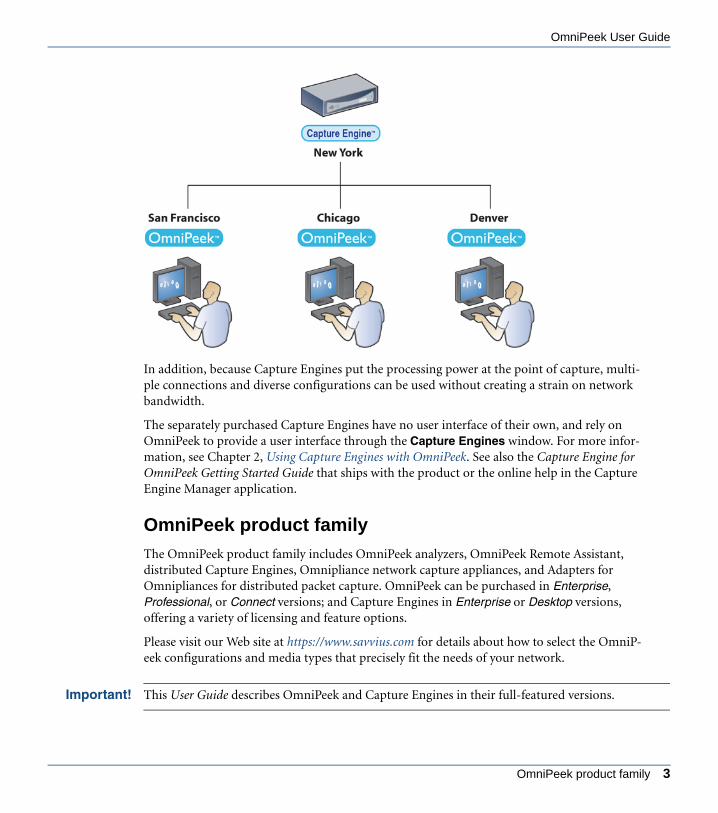
As a software console for Capture Engines, OmniPeek can also manage and interact with an unlimited number of Capture Engines performing independent capture and analysis at any location across the network. OmniPeek allows network engineers to troubleshoot problems and perform statistical analysis on remote segments from a single location, as shown in the diagram below.
A single Capture Engine can also link to multiple installations of OmniPeek, allowing simulta-neous connection and collaboration, as shown in the following diagram.
2 About OmniPeek
OmniPeek User Guide
ANYOP_UG.book Page 3 Friday, February 5, 2016 4:47 PM
In addition, because Capture Engines put the processing power at the point of capture, multi-ple connections and diverse configurations can be used without creating a strain on network bandwidth.
The separately purchased Capture Engines have no user interface of their own, and rely on OmniPeek to provide a user interface through the Capture Engines window. For more infor-mation, see Chapter 2, Using Capture Engines with OmniPeek. See also the Capture Engine for OmniPeek Getting Started Guide that ships with the product or the online help in the Capture Engine Manager application.
OmniPeek product family
The OmniPeek product family includes OmniPeek analyzers, OmniPeek Remote Assistant, distributed Capture Engines, Omnipliance network capture appliances, and Adapters for Omnipliances for distributed packet capture. OmniPeek can be purchased in Enterprise, Professional, or Connect versions; and Capture Engines in Enterprise or Desktop versions, offering a variety of licensing and feature options.
Please visit our Web site at https://www.savvius.com for details about how to select the OmniP-eek configurations and media types that precisely fit the needs of your network.
Important! This User Guide describes OmniPeek and Capture Engines in their full-featured versions.
OmniPeek product family 3

Chapter 1: Introduction
ANYOP_UG.book Page 4 Friday, February 5, 2016 4:47 PM
Network forensics
Network forensics is the retrospective analysis of network traffic for the purpose of conducting an investigation. You can use OmniPeek to capture, store, and data mine large volumes of traf-fic data in order to investigate items such as network problems, security attacks, HR policy violations, and more. See the following chapters and sections for more information on how to use OmniPeek in different ways to perform forensics on your own network.
• Forensics capture on a Capture Engine on page 68
• Forensic search from the Files tab on page 201
• Forensic search from the Forensics tab on page 206
• Forensic search from the ‘Forensics Capture’ window on page 216
• Compass dashboard on page 80
• Chapter 7, Post-capture Analysis
• Chapter 10, Web Analysis
Voice and video over IP analysis
If you have purchased OmniPeek Enterprise, voice and video over IP is available for call signal-ing and media analysis in the Voice & Video views of capture windows, providing simultane-ous analysis of voice and video data traffic with subjective and objective quality metrics. For more information, see Chapter 11, Voice & Video Analysis.
Compass dashboard
The OmniPeek Compass dashboard provides an interactive forensics view of key network sta-tistics, which can be graphed, dynamically interacted with, and reported on. The Compass dashboard provides network engineers with more visibility and insight into their networks.
The Compass dashboard offers both real-time and post-capture monitoring of high-level network statistics with drill down capability into packets for the selected time range. Using the Compass workspace, multiple files can be aggregated and analyzed simultaneously. For infor-mation, see Compass dashboard on page 80.
Multi-segment analysis
Multi-Segment Analysis (MSA) provides visibility and analysis of application flows across multiple network segments, including network delay, packet loss, and retransmissions. It can quickly pinpoint problems and their root causes across multiple segments, bring problematic flows together, and create an analysis session, report anomalies, and provide graphical visual-
4 About OmniPeek

OmniPeek User Guide
ANYOP_UG.book Page 5 Friday, February 5, 2016 4:47 PM
ization of multiple segments across the network. For information, see Chapter 9, Multi-Seg-ment Analysis.
System requirementsThe system requirements for OmniPeek are:
• Windows 10, Windows 8/8.1 64-bit, Windows 7 32/64-bit, Windows Server 2012, Windows Server 2012 R2, Windows Server 2008 R2 64-bit
• Internet Explorer 9.0 or later
• Adobe Flash Player for Internet Explorer v20.0.0.272 or later
Note For Windows 7 and Windows Server 2008 R2, SHA-2 code signing is required to run OmniPeek. Typically, for users that are updated automatically using Microsoft Update, this is installed automatically; otherwise, you will need to install the SHA-2 update manually. See Microsoft KB3033929.
OmniPeek supports most rack mount, desktop and portable computers as long as the basic system requirements to run the supported operating systems are met. Depending on traffic and the particular usage of OmniPeek, the requirements may be substantially higher.
The following system is recommended for OmniPeek:
• Intel Core i3 or higher processor
• 4 GB RAM (OmniPeek Enterprise and Connect) / 2 GB RAM (OmniPeek Professional)
• 40 GB available hard disk space (OmniPeek Enterprise and Connect) / 20 GB available hard disk space (OmniPeek Professional)
Factors that contribute towards superior performance include high speed CPU, number of CPUs, amount of RAM, high performance disk storage subsystem (RAID 0), and as much additional hard disk space as is required to save the trace files that you plan to manage.
Supported operating systems require users to have Administrator level privileges in order to load and unload device drivers, or to select a network adapter for the program’s use in captur-ing packets.
For more information, please see our Web site at https://www.savvius.com/products.
System requirements 5

Chapter 1: Introduction
ANYOP_UG.book Page 6 Friday, February 5, 2016 4:47 PM
Supported adaptersOmniPeek requires a supported network adapter installed on your network in order to capture or monitor packets. OmniPeek supports a wide variety of Ethernet and wireless network adapters.
Savvius has developed a set of driver APIs which can be used to write drivers that extend adapter capabilities. Drivers that use these APIs have been developed for some of the leading WLAN, Ethernet, and Gigabit analyzer cards. OmniPeek and the Capture Engines ship with a number of drivers that support the OmniPeek API. These drivers must be installed separately on the machine in which the card is installed. For more information, see the Readme file located in the Drivers folder in the program directory or visit https://www.savvius.com/support/omni/overview.
Ethernet
OmniPeek supports NDIS 3 or higher compatible Ethernet, Fast Ethernet, or Gigabit promis-cuous mode network adapters from 3Com, Intel, Xircom, SMC, and many others. Savvius has developed a set of driver APIs which can be used to write drivers that extend adapter capabili-ties for Ethernet cards that use particular chipsets. For more information, see the Readme file located in the Drivers folder in the program directory or visit https://www.savvius.com/support/omni/overview.
Wireless
For wireless packet capture, OmniPeek requires the installation of a special NDIS driver to capture wireless management, control, and data packets. This driver also provides complete support for network services when the application is not being used.
Savvius has tested Atheros, and Ralink chipsets for wireless capture. For more information and to download other compatible wireless drivers, please visit https://www.savvius.com/support/downloads/drivers.
The Savvius Wireless Driver supports advanced functionalities such as WPA/WPA2 decryp-tion, noise measurement and hardware time-stamping. For driver installation instructions, please refer to the Readme file included with the driver.
To configure wireless channel settings and 802.11 security settings for your WLAN adapter, see Configuring wireless channels and encryption on page 488.
6 Supported adapters

OmniPeek User Guide
ANYOP_UG.book Page 7 Friday, February 5, 2016 4:47 PM
Important! Some cards supported by OmniPeek may not be usable for network services. 802.11 WLAN cards cannot be used for network services while they are in RF Monitor mode. The Savvius adapters for Omnipliances are optimized for capture and do not send packets. They cannot be used for network services.
Installing OmniPeekTo install OmniPeek, follow these steps:
1. Uninstall any earlier versions of OmniPeek.
The recommended way to uninstall is to run the installer and choose to remove the previous version.
2. Insert the OmniPeek Installer CD into your CD or DVD drive.
3. Follow the installation instructions that appear on the screen.
During installation you are asked to enter a valid activation key. When prompted, you can select from the following:
• Automatic: The installer uses your Internet connection to send an encrypted message to an activation server, which retrieves your Activation Key. Please write down the Activation Key for future reference.
• Manual: The installer allows you to enter the Activation Key manually. You can obtain an Activation Key in the following ways: Go to a computer with an Internet connection and web browser and complete the request form, or call Savvius Technical Support.
For more information about the product activation process, please see our Web site at: https://www.savvius.com/activation.
4. When the Installer has finished installing the program files, you can choose to view the Readme or launch the program. For a description of installed components, see Appendix C, OmniPeek Installed Components.
Note The Capture Engine Manager is installed by default with OmniPeek. This application lets you configure and update settings for separately purchased Capture Engines. Please see Configuring and updating Capture Engine settings on page 26.
Installing OmniPeek 7
Chapter 1: Introduction
ANYOP_UG.book Page 8 Friday, February 5, 2016 4:47 PM
Installing a Capture Engine For complete instructions on how to install, configure, and update software and settings for Capture Engines, see the Getting Started Guide that ships with the Capture Engine.
Note Some users want to install both an OmniPeek console and a Capture Engine on the same machine. The only console that was designed to work simultaneously with a Capture Engine is the OmniPeek Connect console.
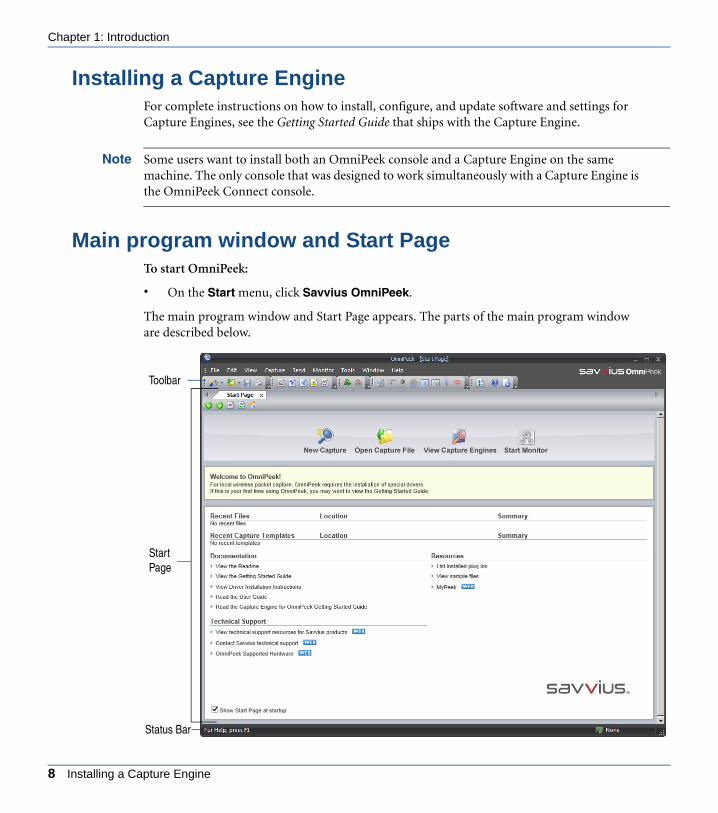
Main program window and Start PageTo start OmniPeek:
• On the Start menu, click Savvius OmniPeek.
The main program window and Start Page appears. The parts of the main program window are described below.
Toolbar
Status Bar
Start Page
8 Installing a Capture Engine
OmniPeek User Guide
ANYOP_UG.book Page 9 Friday, February 5, 2016 4:47 PM
• Toolbar: Provides buttons for frequently-used tasks in OmniPeek. To display different toolbars or to customize toolbar options, on the View menu, click Toolbars.
• Start Page: Provides buttons for creating a new capture, opening saved capture files, viewing the Capture Engines window, and starting the monitoring of the network. Additionally, the Start Page provides links to useful resources, both local and online.
• Status Bar: Shows brief context-sensitive messages on the left and the current monitor adapter on the right. To toggle the display of the status bar, on the View menu, click Status Bar.
Commonly used termsThe following table contains descriptions of frequently used terms.
Term Description
Capture window Packets are captured into configurable capture windows, each with its own selected adapter, its own dedicated capture buffer and its own settings for fil-ters, triggers, and statistics output. See Chapter 5, Viewing and Decoding Packets.
Capture file Capture windows can be saved as capture files (also called Trace files). See Opening saved capture files on page 62.
Capture Engines window
The user interface that OmniPeek provides for the Capture Engines. See Chapter 2, Using Capture Engines with OmniPeek.
Forensics Capture
A template on a Capture Engine optimized for captures used for forensic anal-ysis. See Forensics capture on a Capture Engine on page 68.
Monitoring Capture
A template on a Capture Engine optimized for captures used for Expert and statistical analysis. See Monitoring capture on a Capture Engine on page 69.
Monitor statistics
Statistics based on the network as a whole rather than on an individual cap-ture buffer. Available in the OmniPeek console. See Monitoring network statis-tics on page 334.
Capture Options dialog
The dialog used to configure settings for individual capture windows. See Configuring capture options on page 38.
Monitor Options dialog
The dialog used to configure settings for monitoring the OmniPeek console network as a whole. See Configuring monitor options on page 335.
Commonly used terms 9

Chapter 1: Introduction
ANYOP_UG.book Page 10 Friday, February 5, 2016 4:47 PM
10 Commonly used terms

C H A P T E R 2
ANYOP_UG.book Page 11 Friday, February 5, 2016 4:47 PM
Using Capture Engines with OmniPeek
In this chapter:
About Capture Engines . . . . . . . . . . . . . . . . . . . . . . . . . . . . . . . . . . . . . . . . . . . 12
Displaying the Capture Engines window . . . . . . . . . . . . . . . . . . . . . . . . . . . . . . 13
Connecting to a Capture Engine . . . . . . . . . . . . . . . . . . . . . . . . . . . . . . . . . . . . 14
Organizing Capture Engines by groups . . . . . . . . . . . . . . . . . . . . . . . . . . . . . . . 16
Discovering Capture Engines . . . . . . . . . . . . . . . . . . . . . . . . . . . . . . . . . . . . . . . 18
The Capture Engines window tabs. . . . . . . . . . . . . . . . . . . . . . . . . . . . . . . . . . . 20
Configuring and updating Capture Engine settings . . . . . . . . . . . . . . . . . . . . . . 26
11

Chapter 2: Using Capture Engines with OmniPeek
ANYOP_UG.book Page 12 Friday, February 5, 2016 4:47 PM
About Capture Engines If you are using OmniPeek as a console for distributed Capture Engines, you will need to con-nect to the Capture Engines from the Capture Engines window in OmniPeek. (If you are using OmniPeek as a network analyzer only, and not as a console for distributed Capture Engines, you do not need to review this chapter.)
Capture Engines let you capture and analyze data at any location across the network. Capture Engines perform real-time network analysis from the OmniPeek console on traffic from one or more network interfaces, including Ethernet, 802.11 a/b/g/n/ac wireless, 1 Gigabit, 10 Giga-bit, and 40 Gigabit. Capture Engine features include:
• Statistical and packet analysis, including packet flows and details about nodes, applications, protocols, and sub-protocols. See Chapter 8, Expert Analysis and Chapter 12, Displaying and Reporting Statistics.
• Application layer expert diagnoses and application response time analysis. See Expert Applications view on page 235.
• Expert systems diagnoses, including streams-based packet analysis and correlations between events and conversations. Chapter 8, Expert Analysis.
• VoIP signaling and media analysis. See Chapter 11, Voice & Video Analysis.
The Capture Engines window in OmniPeek lets you view and interact with Capture Engines, which do not have a user interface of their own. Capture Engines are configured with the Cap-ture Engine Configuration Wizard, either from the computer on which they are installed or from the OmniPeek computer using the Capture Engine Manager application. Please see Con-figuring a Capture Engine on page 26.
Note To configure Capture Engine for OmniPeek (Linux), you must configure it from the OmniPeek computer using the Capture Engine Manager for OmniPeek application.
The Capture Engines window in OmniPeek lets you:
• Connect, disconnect, or reconnect to one or more Capture Engines
• View summaries of all captures on each connected Capture Engine
• Create and manage captures on any connected Capture Engine
• Manage filters, alarms, and notifications on any connected Capture Engine
Note For information on how to install, configure, and update settings and software on one or more Capture Engines, see Configuring and updating Capture Engine settings on page 26. For
12 About Capture Engines
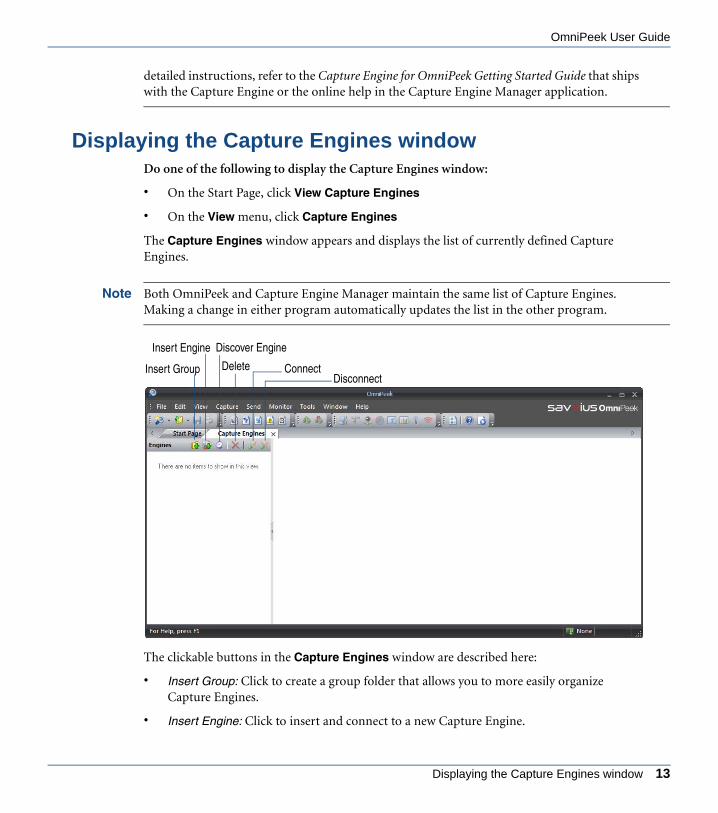
OmniPeek User Guide
ANYOP_UG.book Page 13 Friday, February 5, 2016 4:47 PM
detailed instructions, refer to the Capture Engine for OmniPeek Getting Started Guide that ships with the Capture Engine or the online help in the Capture Engine Manager application.
Displaying the Capture Engines windowDo one of the following to display the Capture Engines window:
• On the Start Page, click View Capture Engines
• On the View menu, click Capture Engines
The Capture Engines window appears and displays the list of currently defined Capture Engines.
Note Both OmniPeek and Capture Engine Manager maintain the same list of Capture Engines. Making a change in either program automatically updates the list in the other program.
The clickable buttons in the Capture Engines window are described here:
• Insert Group: Click to create a group folder that allows you to more easily organize Capture Engines.
• Insert Engine: Click to insert and connect to a new Capture Engine.
Insert Group Delete Connect
Insert Engine Discover Engine
Disconnect
Displaying the Capture Engines window 13

Chapter 2: Using Capture Engines with OmniPeek
ANYOP_UG.book Page 14 Friday, February 5, 2016 4:47 PM
• Discover Engines: Click to search for all engines installed on the local segment of your network. See Discovering Capture Engines on page 18.
• Delete: Click to remove the selected Capture Engine from the list of Capture Engines.
• Connect: Click to connect to the selected Capture Engine.
• Disconnect: Click to disconnect from the selected Capture Engine.
Note Right-click inside the list of Capture Engines to display a context-menu with additional options for displaying the list of Capture Engines; inserting and discovering Capture Engines; editing, deleting, or renaming Capture Engines; connecting and disconnecting Capture Engines; forgetting all passwords; and importing and exporting Capture Engines.
Connecting to a Capture EngineIn order to view packets and data from a Capture Engine, you must first connect to it from OmniPeek.
To connect to a Capture Engine:
1. From the Capture Engines window, click Insert Engine. The Insert Engine dialog appears.
2. Complete the dialog:
• Host: Enter the IP address or DNS name of the engine that you want to connect to.
• Port: Enter the TCP/IP Port used for communications. The default port for the Savvius WP Omni protocol is 6367.
14 Connecting to a Capture Engine

OmniPeek User Guide
ANYOP_UG.book Page 15 Friday, February 5, 2016 4:47 PM
• Authentication: Select the method used to authenticate the user. Select Default if you don’t use another third-party authentication server. Select Third Party if you are connecting using TACACS, RADIUS, Active Directory, or connecting to a Linux-based Omnipliance.
• Domain: Type the Domain for login to the engine. If the Capture Engine is not a member of any Domain, leave this field blank.
• Username: Type the Username for login to the Capture Engine.
• Password: Type the Password for login to the Capture Engine.
3. Click Connect. When the connection is established, the Capture Engine appears in the list of engines.
Note The Insert Engine dialog will attempt to resolve DNS names, using the DNS server(s) specified in the network settings of the computer from which you are trying to connect.
Connecting to a Capture Engine 15

Chapter 2: Using Capture Engines with OmniPeek
ANYOP_UG.book Page 16 Friday, February 5, 2016 4:47 PM
Note If your Capture Engine is installed on a computer that has a configured Intelligent Platform Management Interface (IPMI) port used for remotely accessing and troubleshooting the computer, the Capture Engine Home tab displays an IPMI Address entry that lists the IP address of the IPMI port on the Capture Engine. Clicking the IP address opens your browser and navigates to the IPMI login page. For more information about using IPMI, refer to the IPMI guide available at ftp://ftp.savvius.com/pub/outgoing/IPMI_Guide.pdf.
Organizing Capture Engines by groupsYou can add multiple engines to the Capture Engines window. To make it easier to manage multiple engines, you can organize them into groups.
To organize Capture Engines by groups:
1. Click Insert Group. A New Group appears in the list of engines.
16 Organizing Capture Engines by groups

OmniPeek User Guide
ANYOP_UG.book Page 17 Friday, February 5, 2016 4:47 PM
2. Rename the New Group.
3. With the New Group selected, click Insert Engine to add a Capture Engine to the group.
Note Selecting a folder in the list of engines displays a summary of each engine listed in the folder. For Capture Engines that are currently connected, a summary similar to the Home tab summary is displayed. For Capture Engines that are disconnected, a summary that lists the name, address, and last login date and time is displayed.
If you had selected the Save my password option when you had originally connected to the Capture Engine, you can connect to the Capture Engine by clicking Connect from within the summary. The Save my password option must have been selected; otherwise, the connection
Insert Group
Organizing Capture Engines by groups 17

Chapter 2: Using Capture Engines with OmniPeek
ANYOP_UG.book Page 18 Friday, February 5, 2016 4:47 PM
fails. You can also disconnect from a Capture Engine by clicking Disconnect from within the summary.
Discovering Capture EnginesClicking the Discover Engine lets you search for all engines installed on the local segment of your network. You can then insert one or more of the engines that are found into the Capture Engines window, and then connect to those engines.
To insert and connect to Capture Engines using Discover:
1. From the Capture Engines window, click Discover Engines. The Discover Engines dialog appears.
18 Discovering Capture Engines

OmniPeek User Guide
ANYOP_UG.book Page 19 Friday, February 5, 2016 4:47 PM
2. Click Discover on the dialog. All Capture Engines found on the local segment of your network are displayed in the Engines list.
Adjusting the Listen for time lets you specify how much time is spent listening for responses to the discovery request. You can enter a minimum of 2 and a maximum of 60 seconds.
3. Clear the check boxes of the Capture Engines that you do not want to add to the Engines list and click OK (by default, the check boxes are selected for all Capture Engines that are discovered). The selected Capture Engines are added to the Capture Engines window.
Tip Right-click in the Engines pane of the Discover Engines dialog and select Uncheck all to clear the check boxes of all Capture Engines.
4. From the Capture Engines window, select the engine that you want to connect to. The Home tab appears and displays the Connect to Capture Engine screen.
Discovering Capture Engines 19

Chapter 2: Using Capture Engines with OmniPeek
ANYOP_UG.book Page 20 Friday, February 5, 2016 4:47 PM
5. Complete the login information on the screen:
• Authentication: Select the method used to authenticate the user. Select Default if you don’t use another third-party authentication server. Select Third Party if you are connecting using TACACS, RADIUS, Active Directory, or connecting to a Linux-based Omnipliance.
• Domain: Type the Domain for login to the Capture Engine. If the Capture Engine is not a member of any Domain, leave this field blank.
• Username: Type the Username for login to the Capture Engine.
• Password: Type the Password for login to the Capture Engine.
6. Click Connect. When the connection is established, the engine appears in the Capture Engines window along with all of the tabs appropriate for that Capture Engine.
The Capture Engines window tabsOnce you are connected to one or more Capture Engines, the Capture Engines window dis-plays each Capture Engine (by name, IP address, and port) and the tabs that allow you to con-figure properties for the currently selected Capture Engine.
20 The Capture Engines window tabs

OmniPeek User Guide
ANYOP_UG.book Page 21 Friday, February 5, 2016 4:47 PM
Important! Opening or closing the Capture Engines window does not change the connection state for any of the Capture Engines displayed.
Capture Engine tabs
The following tabs allow you to configure properties for a connected Capture Engine:
• Home: This tab displays a summary of Capture Engine properties and network settings. Graphical links allow you to quickly access other available tabs for the Capture Engine.
Note The Capture Storage summary displayed in the Home tab displays the amount of space available for storing capture data on the Capture Engine. This amount is the free space available on the Capture Engine less a reserve of additional unused disk space. The reserve is
Capture Engine Tabs
Capture Engine tabs 21

Chapter 2: Using Capture Engines with OmniPeek
ANYOP_UG.book Page 22 Friday, February 5, 2016 4:47 PM
calculated as the sum of 11GB plus 3% of the total disk space on the Capture Engine (a minimum of 5GB, and a maximum of 1TB). See Configuring general options on page 41 to allocate the amount of disk space for a capture.
• Captures: This tab lists all defined captures, along with summary information about each capture where ‘Capture to Disk’ was enabled. See Capture Engine Captures tab on page 141.
• Forensics: This tab displays the capture sessions available on the Capture Engine. You can select one of the capture sessions, display its data in the Timeline graph, and then perform a forensic search on specific parts of the data. See Forensics capture on a Capture Engine on page 68 and Forensic search from the Forensics tab on page 206.
• Files: This tab displays all capture files saved to the Capture Engine. The data folder for saving these files is defined in the General view of the Capture Engine Wizard. See Configuring and updating Capture Engine settings on page 26.
You can select one or more of the capture files and then perform a forensic search on the files. See Forensics capture on a Capture Engine on page 68 and Forensic search from the Files tab on page 201.
• Forensic Searches: This tab displays all forensic searches, whether in progress or complete, on the Capture Engine. Forensic search listings are displayed in the Forensic Searches tab until you close a forensic search window and delete the search when prompted, or select the forensic search listing and click Delete.
When a forensic search is complete, a notification is sent using the ‘Forensic Search.’ If you have set up a notification using that source, you are notified with whatever action type you set up (email, SNMP, trap, etc.) when the search is complete.
• Log: This tab provides a log which collects messages from program processes and events, including program start and stop, notifications, etc. See Capture Engine global log on page 447.
• Adapters: This tab displays all available recognized adapters for the Capture Engine. Multiple captures can use the same adapter, or each a different adapter, as long as each capture has one valid adapter selected.
22 The Capture Engines window tabs

OmniPeek User Guide
ANYOP_UG.book Page 23 Friday, February 5, 2016 4:47 PM
To select an adapter for an individual capture, see Configuring adapter options on page 45.
• Settings: This tab displays the following sub-tabs:
• Graphs: This tab allows you to create and manage graph templates, which can be used by any Capture Engine capture window on that engine. See Capture Engine graph templates on page 396.
• Filters: This tab displays a list of all filters present on the Capture Engine and a means of managing them independent of any particular Capture Engine capture window. See Capture Engine filters tab on page 166.
• Alarms: This tab provides a list of all the alarms present on the Capture Engine and a means of managing them independent of any particular Capture Engine capture window. See Capture Engine alarms tab on page 409.
• Notifications: This tab provides a means of defining Actions (responses to a notification) and invoking these Actions when a notification of a specified severity is
Capture Engine tabs 23
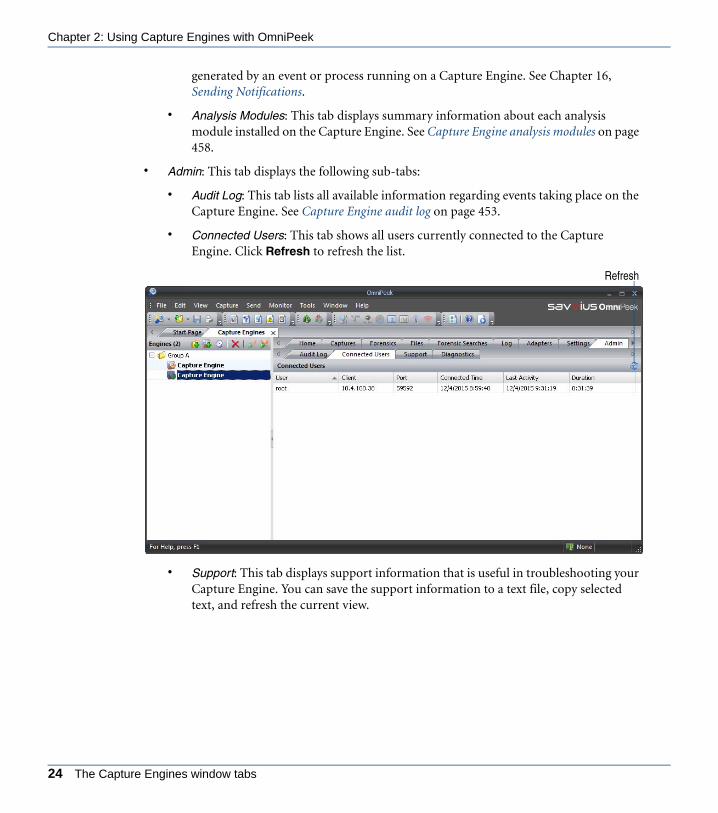
Chapter 2: Using Capture Engines with OmniPeek
ANYOP_UG.book Page 24 Friday, February 5, 2016 4:47 PM
generated by an event or process running on a Capture Engine. See Chapter 16, Sending Notifications.
• Analysis Modules: This tab displays summary information about each analysis module installed on the Capture Engine. See Capture Engine analysis modules on page 458.
• Admin: This tab displays the following sub-tabs:
• Audit Log: This tab lists all available information regarding events taking place on the Capture Engine. See Capture Engine audit log on page 453.
• Connected Users: This tab shows all users currently connected to the Capture Engine. Click Refresh to refresh the list.
• Support: This tab displays support information that is useful in troubleshooting your Capture Engine. You can save the support information to a text file, copy selected text, and refresh the current view.
Refresh
24 The Capture Engines window tabs
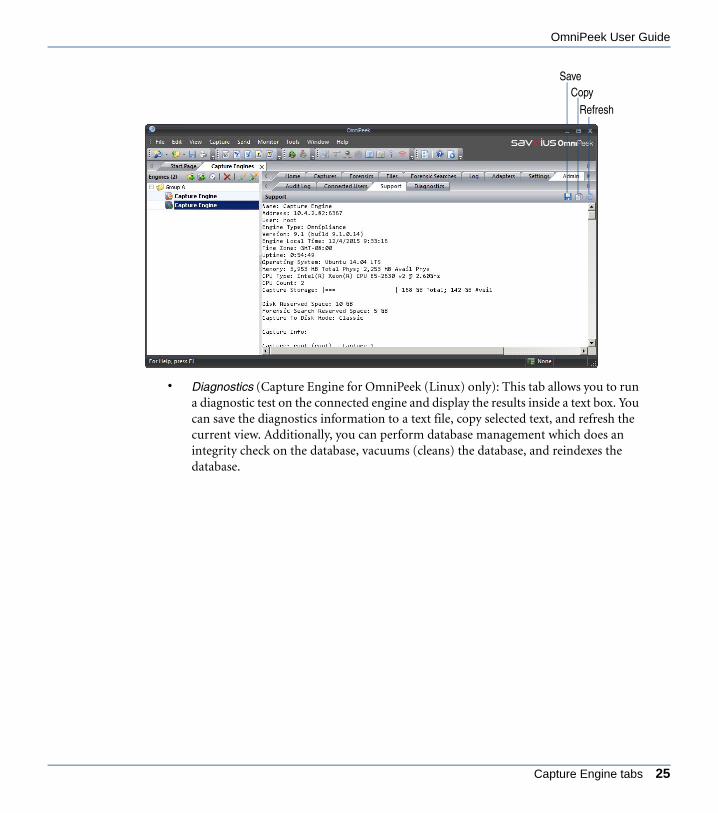
OmniPeek User Guide
ANYOP_UG.book Page 25 Friday, February 5, 2016 4:47 PM
• Diagnostics (Capture Engine for OmniPeek (Linux) only): This tab allows you to run a diagnostic test on the connected engine and display the results inside a text box. You can save the diagnostics information to a text file, copy selected text, and refresh the current view. Additionally, you can perform database management which does an integrity check on the database, vacuums (cleans) the database, and reindexes the database.
Refresh
SaveCopy
Capture Engine tabs 25
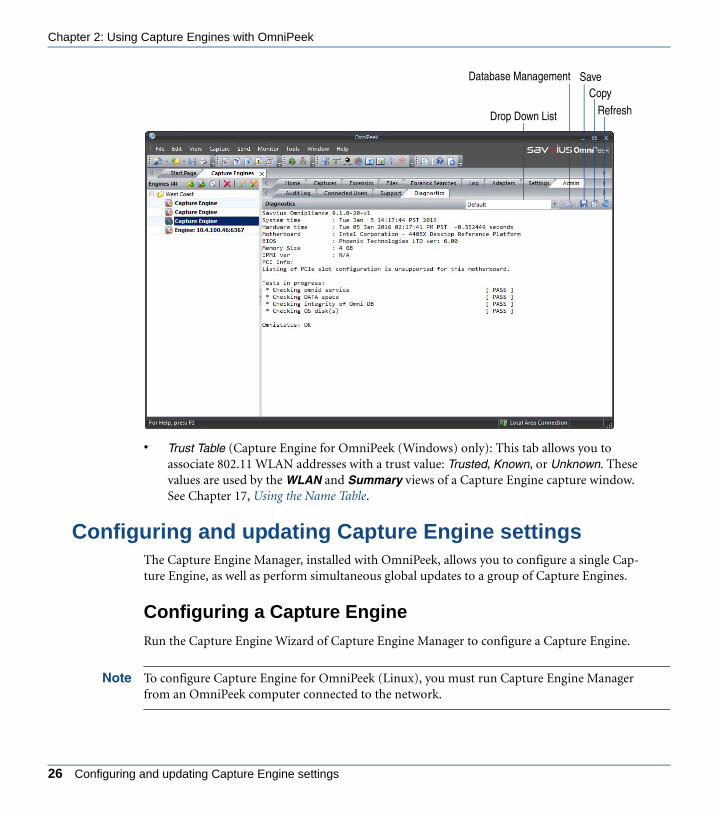
Chapter 2: Using Capture Engines with OmniPeek
ANYOP_UG.book Page 26 Friday, February 5, 2016 4:47 PM
• Trust Table (Capture Engine for OmniPeek (Windows) only): This tab allows you to associate 802.11 WLAN addresses with a trust value: Trusted, Known, or Unknown. These values are used by the WLAN and Summary views of a Capture Engine capture window. See Chapter 17, Using the Name Table.
Configuring and updating Capture Engine settingsThe Capture Engine Manager, installed with OmniPeek, allows you to configure a single Cap-ture Engine, as well as perform simultaneous global updates to a group of Capture Engines.
Configuring a Capture Engine
Run the Capture Engine Wizard of Capture Engine Manager to configure a Capture Engine.
Note To configure Capture Engine for OmniPeek (Linux), you must run Capture Engine Manager from an OmniPeek computer connected to the network.
Refresh
SaveCopy
Drop Down List
Database Management
26 Configuring and updating Capture Engine settings
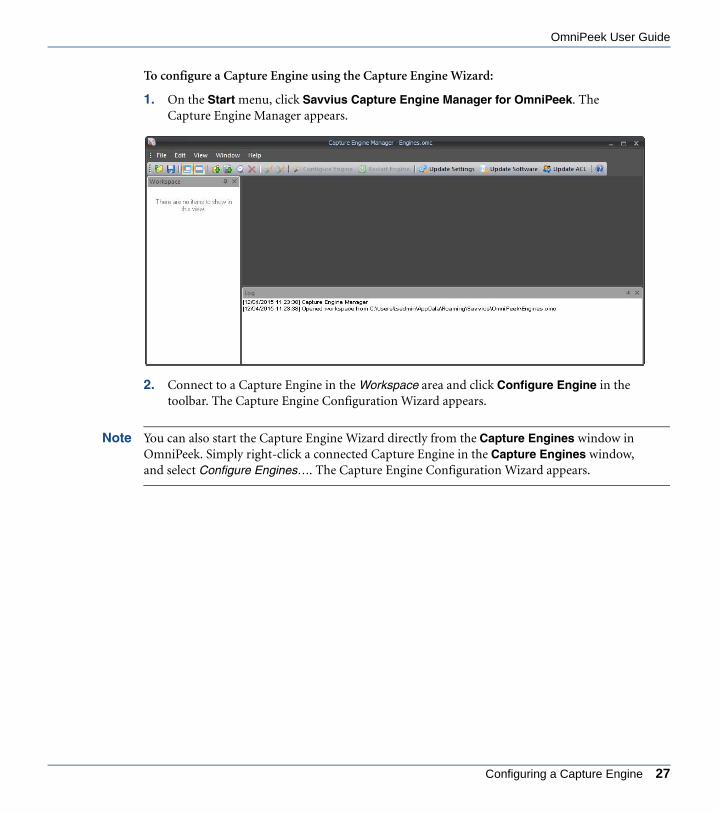
OmniPeek User Guide
ANYOP_UG.book Page 27 Friday, February 5, 2016 4:47 PM
To configure a Capture Engine using the Capture Engine Wizard:
1. On the Start menu, click Savvius Capture Engine Manager for OmniPeek. The Capture Engine Manager appears.
2. Connect to a Capture Engine in the Workspace area and click Configure Engine in the toolbar. The Capture Engine Configuration Wizard appears.
Note You can also start the Capture Engine Wizard directly from the Capture Engines window in OmniPeek. Simply right-click a connected Capture Engine in the Capture Engines window, and select Configure Engines…. The Capture Engine Configuration Wizard appears.
Configuring a Capture Engine 27
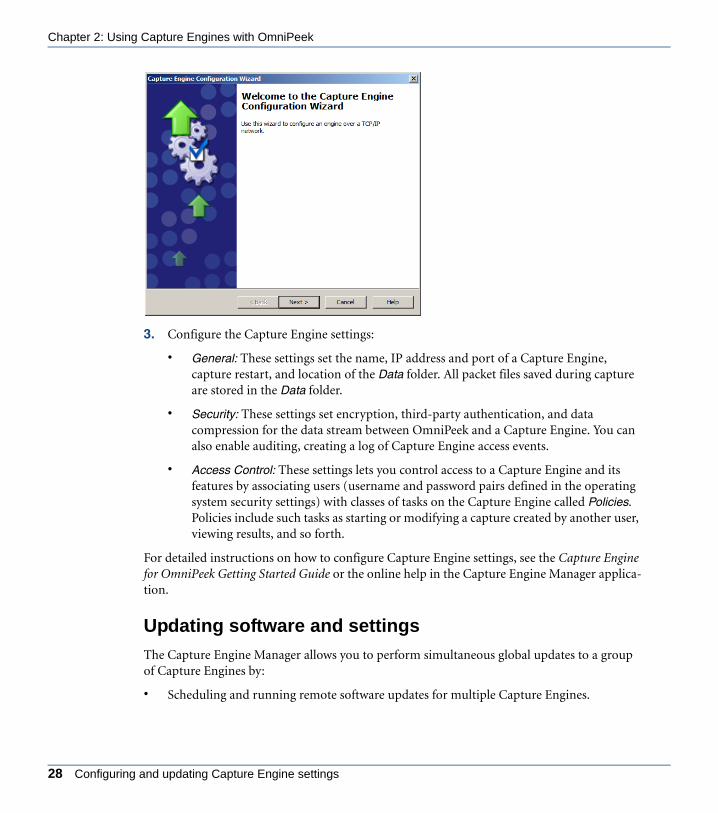
Chapter 2: Using Capture Engines with OmniPeek
ANYOP_UG.book Page 28 Friday, February 5, 2016 4:47 PM
3. Configure the Capture Engine settings:
• General: These settings set the name, IP address and port of a Capture Engine, capture restart, and location of the Data folder. All packet files saved during capture are stored in the Data folder.
• Security: These settings set encryption, third-party authentication, and data compression for the data stream between OmniPeek and a Capture Engine. You can also enable auditing, creating a log of Capture Engine access events.
• Access Control: These settings lets you control access to a Capture Engine and its features by associating users (username and password pairs defined in the operating system security settings) with classes of tasks on the Capture Engine called Policies. Policies include such tasks as starting or modifying a capture created by another user, viewing results, and so forth.
For detailed instructions on how to configure Capture Engine settings, see the Capture Engine for OmniPeek Getting Started Guide or the online help in the Capture Engine Manager applica-tion.
Updating software and settings
The Capture Engine Manager allows you to perform simultaneous global updates to a group of Capture Engines by:
• Scheduling and running remote software updates for multiple Capture Engines.
28 Configuring and updating Capture Engine settings

OmniPeek User Guide
ANYOP_UG.book Page 29 Friday, February 5, 2016 4:47 PM
• Distributing settings for filters, alarms, and graph templates across multiple Capture Engines.
• Distributing Access Control Lists (ACLs) to multiple Capture Engines in a single Domain.
To open the Capture Engine Manager:
1. On the Start menu, click Savvius Capture Engine Manager for OmniPeek. The Capture Engine Manager appears.
2. Click Update Software to update the Capture Engine software for one or more Capture Engines using the Engine Update service.
Note Updating Capture Engine software with the Capture Engine Manager is not supported in Capture Engine for OmniPeek (Linux).
Updating software and settings 29

Chapter 2: Using Capture Engines with OmniPeek
ANYOP_UG.book Page 30 Friday, February 5, 2016 4:47 PM
3. Click Update Settings to update the settings for filters, alarms, or remote graph templates for one or more Capture Engines.
4. Click Update ACL to distribute a single Access Control List (ACL) to multiple Capture Engines running on machines belonging to the same Domain.
For detailed instructions on how to update the software or settings for a group of Capture Engines, see the Capture Engine for OmniPeek Getting Started Guide or the online help in the Capture Engine Manager application.
30 Configuring and updating Capture Engine settings
C H A P T E R 3
ANYOP_UG.book Page 31 Friday, February 5, 2016 4:47 PM
The Capture Window
In this chapter:
About capture windows . . . . . . . . . . . . . . . . . . . . . . . . . . . . . . . . . . . . . . . . . . . 32
Creating an OmniPeek capture window . . . . . . . . . . . . . . . . . . . . . . . . . . . . . . . 32
Creating a Capture Engine capture window . . . . . . . . . . . . . . . . . . . . . . . . . . . . 33
Navigating a capture window . . . . . . . . . . . . . . . . . . . . . . . . . . . . . . . . . . . . . . . 36
Configuring capture options . . . . . . . . . . . . . . . . . . . . . . . . . . . . . . . . . . . . . . . . 38
Capture window views . . . . . . . . . . . . . . . . . . . . . . . . . . . . . . . . . . . . . . . . . . . . 59
Opening saved capture files . . . . . . . . . . . . . . . . . . . . . . . . . . . . . . . . . . . . . . . . 62
Splitting saved packet files . . . . . . . . . . . . . . . . . . . . . . . . . . . . . . . . . . . . . . . . . 64
Merging saved packet files . . . . . . . . . . . . . . . . . . . . . . . . . . . . . . . . . . . . . . . . . 65
Using capture templates. . . . . . . . . . . . . . . . . . . . . . . . . . . . . . . . . . . . . . . . . . . 65
Forensics capture on a Capture Engine . . . . . . . . . . . . . . . . . . . . . . . . . . . . . . . 68
Monitoring capture on a Capture Engine . . . . . . . . . . . . . . . . . . . . . . . . . . . . . . 69
31

Chapter 3: The Capture Window
ANYOP_UG.book Page 32 Friday, February 5, 2016 4:47 PM
About capture windowsCapture windows are the main interface for presenting traffic analysis information about your network. OmniPeek lets you create capture windows for local captures, as well as remotely from multiple interfaces to an unlimited number of distributed Capture Engines.
You can create multiple configurable capture windows, each with its own selected adapter and its own capture settings. The number of capture windows you can have open at one time is limited only by the amount of available system resources.
When configuring a capture window’s capture settings, keep in mind that the window’s cap-ture performance can be directly related to the number and type of capture options that you have enabled. For example, enabling more options may give you more data, but may come at the price of a greater likelihood of not capturing all the data.
The things that determine how much data (and therefore how many capture options) a cap-ture can handle is determined by the system memory and CPU power of the OmniPeek or Capture Engine computer, the amount and kind of data that is being captured, and the num-ber of capture options and analysis modules that are enabled. Enabling capture options, such as Capture to disk, Expert Analysis, and Graphs; and enabling an analysis module such as VoIP Analysis consumes much more machine resources than others.
Creating an OmniPeek capture windowCreating an OmniPeek capture window lets you capture traffic locally from a variety of adapter sources. For example, you can create a new capture window by starting a capture from a supported network adapter, by replaying an existing capture file, by aggregating traffic from multiple wired or wireless sources, and by streaming packets from Aruba and Cisco access points. See Configuring adapter options on page 45 for more information.
To create an OmniPeek capture window:
1. To start a new capture, do one of the following:
• Click New Capture on the Start Page
• On the File menu, click New Capture…
The General options of the OmniPeek Capture Options dialog appears.
2. Configure the General options. Click Help on the dialog or see Configuring general options on page 41 for more information.
3. Choose an adapter in the Adapter Options. Click Help on the dialog or see Configuring adapter options on page 45 for more information.
32 About capture windows

OmniPeek User Guide
ANYOP_UG.book Page 33 Friday, February 5, 2016 4:47 PM
Note For a description of other configuration options, see Configuring capture options on page 38.
4. Click OK. A new OmniPeek capture window appears.
See Capture window views on page 59 to learn more about the different views available from the navigation pane of every capture window.
Creating a Capture Engine capture windowCreating a Capture Engine capture window lets you capture traffic remotely from an unlim-ited number of distributed Capture Engines. Capture Engines can perform real-time network analysis on traffic from one or more network interfaces, including Ethernet, 802.11 a/b/g/n/ac wireless, 1 Gigabit, 10 Gigabit, 20 Gigabit, and 40 Gigabit. Capture Engine capture windows lets you capture and analyze data in real-time, and record data for post-capture analysis. Using Capture Engine capture windows, network engineers can record and monitor their entire
Creating a Capture Engine capture window 33

Chapter 3: The Capture Window
ANYOP_UG.book Page 34 Friday, February 5, 2016 4:47 PM
enterprise-wide network and quickly identify and remedy performance bottlenecks, even those occurring at remote locations, without leaving the office.
To create a Capture Engine capture window:
1. Do one of the following to open the Capture Engines window:
• On the Start Page, click View Capture Engines
• On the View menu, click Capture Engines
The Capture Engines window appears.
2. Connect to a Capture Engine. (To connect to a Capture Engine, see Connecting to a Capture Engine on page 14.) The Home tab for the Capture Engine appears.
3. From the Home tab, click New Capture and select the type of capture window that you would like to create:
34 Creating a Capture Engine capture window

OmniPeek User Guide
ANYOP_UG.book Page 35 Friday, February 5, 2016 4:47 PM
• New Capture…: This option lets you create a new Capture Engine capture window based on the capture settings that you define. See Configuring capture options on page 38.
• New “Forensics Capture”: This option lets you create a new Capture Engine capture window based on a forensic capture template configured for post-capture forensic analysis. See Forensics capture on a Capture Engine on page 68.
• New “Monitoring Capture”: This option lets you create a new Capture Engine capture window based on a monitoring capture template configured to view higher level expert and statistical data in a continuous real-time capture. See Monitoring capture on a Capture Engine on page 69.
• Edit Capture Templates: This option opens the Capture Templates dialog and allows you to create new or edit existing capture templates. See Capture Engine capture templates on page 66.
The General options of the Capture Engine Capture Options dialog appears.
Note You can also select the above options from the Insert drop-down list available from the Captures tab, and from the New Capture options available from the Adapters tab.
4. Configure the General options. Click Help on the dialog or see Configuring general options on page 41.
5. Choose a capture adapter in Adapter options. See Configuring adapter options on page 45.
Note For a description of the other views available from the Capture Options dialog, see Configuring capture options on page 38.
6. Click OK. A new Capture Engine capture window appears.
Creating a Capture Engine capture window 35
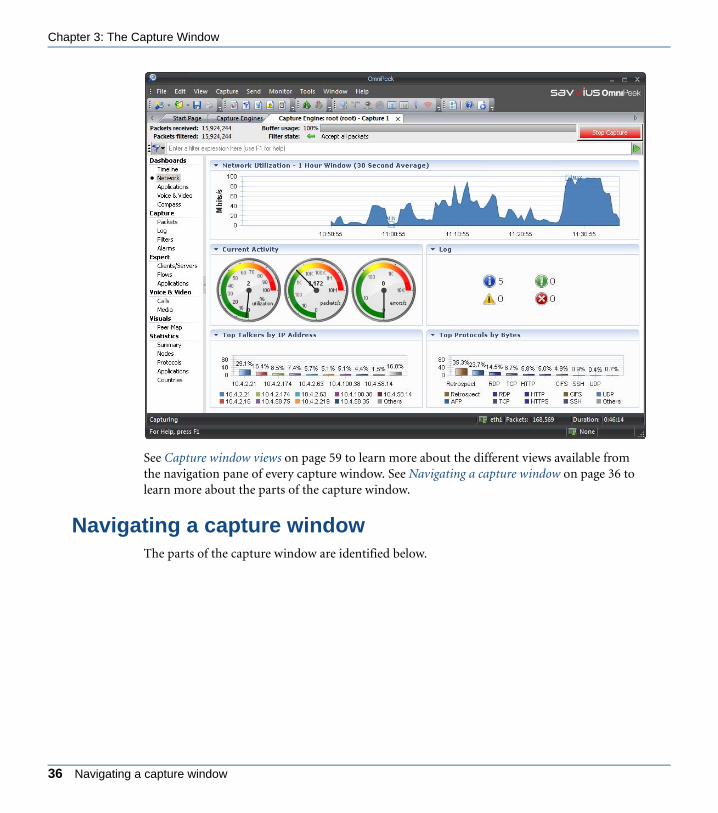
Chapter 3: The Capture Window
ANYOP_UG.book Page 36 Friday, February 5, 2016 4:47 PM
See Capture window views on page 59 to learn more about the different views available from the navigation pane of every capture window. See Navigating a capture window on page 36 to learn more about the parts of the capture window.
Navigating a capture windowThe parts of the capture window are identified below.
36 Navigating a capture window
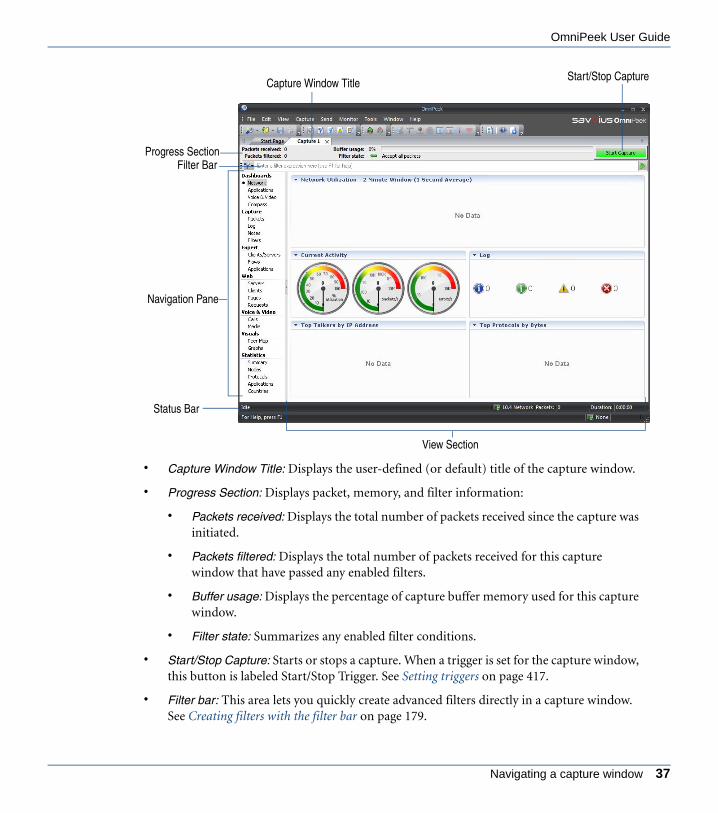
OmniPeek User Guide
ANYOP_UG.book Page 37 Friday, February 5, 2016 4:47 PM
• Capture Window Title: Displays the user-defined (or default) title of the capture window.
• Progress Section: Displays packet, memory, and filter information:
• Packets received: Displays the total number of packets received since the capture was initiated.
• Packets filtered: Displays the total number of packets received for this capture window that have passed any enabled filters.
• Buffer usage: Displays the percentage of capture buffer memory used for this capture window.
• Filter state: Summarizes any enabled filter conditions.
• Start/Stop Capture: Starts or stops a capture. When a trigger is set for the capture window, this button is labeled Start/Stop Trigger. See Setting triggers on page 417.
• Filter bar: This area lets you quickly create advanced filters directly in a capture window. See Creating filters with the filter bar on page 179.
Capture Window Title
Progress Section
Navigation Pane
View Section
Status Bar
Start/Stop Capture
Filter Bar
Navigating a capture window 37
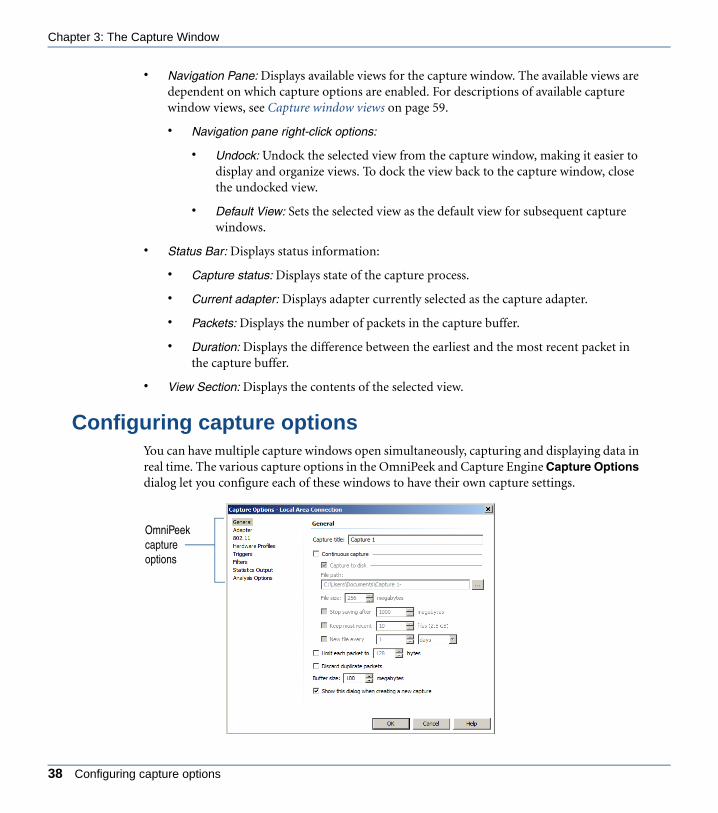
Chapter 3: The Capture Window
ANYOP_UG.book Page 38 Friday, February 5, 2016 4:47 PM
• Navigation Pane: Displays available views for the capture window. The available views are dependent on which capture options are enabled. For descriptions of available capture window views, see Capture window views on page 59.
• Navigation pane right-click options:
• Undock: Undock the selected view from the capture window, making it easier to display and organize views. To dock the view back to the capture window, close the undocked view.
• Default View: Sets the selected view as the default view for subsequent capture windows.
• Status Bar: Displays status information:
• Capture status: Displays state of the capture process.
• Current adapter: Displays adapter currently selected as the capture adapter.
• Packets: Displays the number of packets in the capture buffer.
• Duration: Displays the difference between the earliest and the most recent packet in the capture buffer.
• View Section: Displays the contents of the selected view.
Configuring capture optionsYou can have multiple capture windows open simultaneously, capturing and displaying data in real time. The various capture options in the OmniPeek and Capture Engine Capture Options dialog let you configure each of these windows to have their own capture settings.
OmniPeek capture options
38 Configuring capture options

OmniPeek User Guide
ANYOP_UG.book Page 39 Friday, February 5, 2016 4:47 PM
The Capture Options dialog lets you configure capture options for the following:
• General: General options let you name the capture and set various packet capture parameters. See Configuring general options on page 41.
• Adapter: Adapter options let you select and configure the adapter used for captures. All available recognized adapters are displayed in this view. In most cases, multiple captures can use the same adapter, or a different adapter, as long as each capture has a valid adapter selected. See Configuring adapter options on page 45.
• 802.11 (OmniPeek only): 802.11 options let you control channel selection and security for the selected wireless adapter. See Configuring wireless channels and encryption on page 488.
• Hardware Profiles (OmniPeek only): Hardware profile options let you configure hardware filters and packet slicing directly on separately purchased adapters for Omnipliances required for capture on high speed networks. See Configuring hardware profiles for adapters on page 502.
• Triggers: Trigger options let you set triggers to start and stop a capture based on a time event or a filter match. See Setting triggers on page 417.
• Filters: Filter options let you enable or disable filters used for capturing packets. See Enabling filters from the Capture Options dialog on page 168.
• Alarms (Capture Engine only): Alarm options let you enable or disable individual alarms for a particular Capture Engine capture window. See Capture Engine capture window
Capture Engine capture options
Configuring capture options 39
Chapter 3: The Capture Window
ANYOP_UG.book Page 40 Friday, February 5, 2016 4:47 PM
alarms on page 411.
• Graphs (Capture Engine only): Graph options let you manage all aspects of remote statistics graphing capabilities. See Capture Engine graphs capture options on page 392.
• Statistics Output: Statistic output options let you control the periodic output of statistics reports while the capture is running. You can choose from several groups of statistics in a variety of report and file output formats. See Generating statistics output reports on page 363.
• Analysis Options: Analysis options let you specify capture performance by selectively disabling certain functions and freeing up system resources, specific to networking areas such as VoIP, Expert, nodes, and protocols. See Optimizing capture performance on page 483.
Analysis options let you view detailed analysis of your capture data in real time. Enabling analysis options will impact the performance of any capture, as indicated by the Capture Performance bar.
• Timestamps (Capture Engine only): Timestamps options let you specify the smart tap manufacturer whose hardware timestamp formats are supported by OmniPeek and displayed in the capture. You can choose from the list of supported manufacturers, or you can select ‘Default.’ For example, if ‘Gigamon’ is selected, then Capture Engine and OmniPeek decodes the appended trailer timestamp added to the packet by the smart tap. The decoded timestamp replaces any existing OmniPeek timestamp and is displayed as the ‘Timestamp’ in the packet’s ‘Packet Info.’
If you select ‘Default,’ or if any of the selected manufacturer’s timestamp formats are not supported by the hardware, then the packet’s timestamp reverts to the local system time of the Capture Engine for when the packet was captured by the Capture Engine.
Important! If a vendor’s timestamp option is selected, then the capturing adapter must be connected to that vendor’s corresponding smart tap.
Additionally, It's important to ensure that the Capture Engine’s clock time is as close as possible to the smart tap’s clock time. For this reason we suggest using NTP with the same time zone on all smart taps and Capture Engines. If your Capture Engine is capturing aggregated data (e.g., using an adapter for Omnipliance) from multiple smart taps, it is important that the smart taps have their clock times synchronized and set to the same time zone.
40 Configuring capture options

OmniPeek User Guide
ANYOP_UG.book Page 41 Friday, February 5, 2016 4:47 PM
Configuring general options
The General options of the Capture Options dialog lets you name the capture and set various packet capture parameters for each capture window that you create. The capture options that are available when capturing locally from OmniPeek or remotely from a Capture Engine, dif-fer slightly as shown below.
OmniPeek General Options
Configuring general options 41
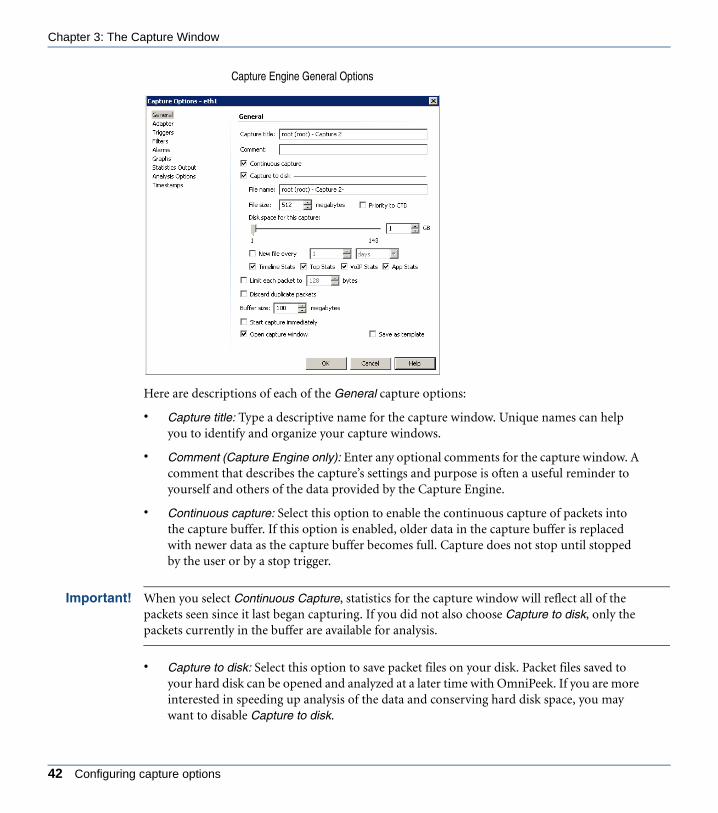
Chapter 3: The Capture Window
ANYOP_UG.book Page 42 Friday, February 5, 2016 4:47 PM
Here are descriptions of each of the General capture options:
• Capture title: Type a descriptive name for the capture window. Unique names can help you to identify and organize your capture windows.
• Comment (Capture Engine only): Enter any optional comments for the capture window. A comment that describes the capture’s settings and purpose is often a useful reminder to yourself and others of the data provided by the Capture Engine.
• Continuous capture: Select this option to enable the continuous capture of packets into the capture buffer. If this option is enabled, older data in the capture buffer is replaced with newer data as the capture buffer becomes full. Capture does not stop until stopped by the user or by a stop trigger.
Important! When you select Continuous Capture, statistics for the capture window will reflect all of the packets seen since it last began capturing. If you did not also choose Capture to disk, only the packets currently in the buffer are available for analysis.
• Capture to disk: Select this option to save packet files on your disk. Packet files saved to your hard disk can be opened and analyzed at a later time with OmniPeek. If you are more interested in speeding up analysis of the data and conserving hard disk space, you may want to disable Capture to disk.
Capture Engine General Options
42 Configuring capture options

OmniPeek User Guide
ANYOP_UG.book Page 43 Friday, February 5, 2016 4:47 PM
In a Capture Engine, the packets are saved to the data folder configured when you set up the Capture Engine. See the Capture Engine for OmniPeek Getting Started Guide that ships with your Capture Engine, or the online help in the Capture Engine Manager application.
Note Capture to disk options in the General capture options of a Capture Engine are not available if a reserve of free (unused) disk space is not available on the Capture Engine. The reserve is calculated as the sum of 11GB plus 3% of the total disk space on the Capture Engine (a minimum of 5GB, and a maximum of 1TB).'
• File path (OmniPeek only): Type, or browse to, the location for saving capture files.
• File name (Capture Engine only): Type the name used as a base file name prefix for each capture file that is created using the Capture to disk option. Additionally, each capture file is appended with a timestamp indicating the date and time the file was saved. The format of the timestamp is YYYY-MM-DD-HH.MM.SS.mmm.
Note You can save capture files directly to a Libpcap (*.pcap,*.cap, *.dmp, or *.appcap) or PcapNG (*.pcapng or *.ntar) file format by appending the file name entered in the File path or File name fields with the desired file format extension. By default, if no file format extension is specified, then the capture file is saved as a Savvius packet file (*.pkt).
Tip By default, the timestamp reflects local time and is placed immediately after the file name you entered. You can specify an alternate location of the timestamp within the file name by using the # character as a token for the timestamp. To have the timestamp written in Coordinated Universal Time (UTC) instead of local time, place the letter z immediately after the hash symbol. When UTC is in use, the letter z will appear at the end of the timestamp.
• File size: Enter or select the maximum file size before a new file is created.
• Priority to CTD (Capture Engine only): Select this option so that real-time analysis doesn't impact the capture-to-disk (CTD) performance. When this option is enabled, it is less likely that packets are dropped when they are captured to disk. If capturing all the packets to disk is desirable, enable Priority to CTD. If analysis is more important, disable Priority to CTD.
• Stop saving after (OmniPeek only): Select this option and specify a size limit, in megabytes, for the amount of disk space reserved for all capture files that are created using the Capture to disk option. Once the size limit has been reached, the capture continues, but no more capture files are saved to disk.
Configuring general options 43
Chapter 3: The Capture Window
ANYOP_UG.book Page 44 Friday, February 5, 2016 4:47 PM
• Keep most recent: Select this option and specify a limit for the number of capture files that are created using the Capture to disk option. Once the file limit has been reached, the oldest capture file is replaced with a newer capture file.
• Disk space for this capture (Capture Engine only): Move the slider control (or enter a value in the text box) to set the amount of hard disk space allocated for the capture. The minimum value of the slider is the minimum size of disk space a capture can occupy. If Continuous capture is also enabled, the capture continues forever, and the disk space set here is used as a ring buffer (similar to old Keep Most Recent option, and similar to Timeline). If Continuous capture is disabled, the capture stops when this amount of disk space has been filled.
• New file every: Select this option and specify the longest amount of time (Minutes, Hours, Days) that may elapse before the open file is closed and a new file is created.
• Timeline Stats (Capture Engine only): Select this option to populate the Capture Engine database with capture data and basic network statistics such as utilization, size, distribution, etc. These statistics are then made available through the Capture Engine Forensics tab. See Forensic search from the Forensics tab on page 206 or Forensic search from the ‘Forensics Capture’ window on page 216 for information on view types.
• Top Stats (Capture Engine only): Select this option to populate the Capture Engine database with top nodes and top protocols statistics. These statistics are then made available through the Capture Engine Forensics tab.
• VoIP Stats (Capture Engine only): Select this option to populate the Capture Engine database with VoIP call quality and call volume statistics. These statistics are then made available through the Capture Engine Forensics tab. See Forensic search from the Forensics tab on page 206 or Forensic search from the ‘Forensics Capture’ window on page 216 for information on view types.
Note Selecting the VoIP Stats option may affect capture performance, especially when there are more than 2000 simultaneous calls on the network. Selecting the Top Stats option may affect capture performance, especially when there are more than 10,000 active nodes captured on the network.
• App Stats (Capture Engine only): Select this option to populate the Capture Engine database with applications statistics which are made available through the various ‘application’ displays.
• Limit each packet to: Select this option and specify a size limit, in bytes, for capturing only a portion of each packet. This is called Packet Slicing and allows you to save space in the capture buffer and disk storage (if Capture to disk is enabled). For example, entering a
44 Configuring capture options

OmniPeek User Guide
ANYOP_UG.book Page 45 Friday, February 5, 2016 4:47 PM
value of 128 will capture only the first 128 bytes of each packet. We recommend this value of 128 to ensure that the entire packet header is captured.
• Discard duplicate packets: Select this option to discard duplicate packets from the capture buffer as the packets are captured. Duplicate packets are often encountered when capturing from a SPAN or mirrored port on a managed switch.
• Buffer size: Enter a buffer size, in megabytes, for the amount of memory dedicated for the capture buffer. The capture buffer is where packet are placed for analysis. The default is 100 megabytes. A larger buffer can reduce or eliminate packet loss due to spikes in traffic. When Capture to disk is enabled and all Analysis Options are disabled, the Buffer size option is unavailable.
• Show this dialog when creating a new capture window (OmniPeek only): Select this option to display the General options of the Capture Options dialog whenever a new capture window is created.
Tip Clear the Show this dialog when creating a new capture window check box to have subsequent capture windows created using the same settings you have just set in the Capture Options dialog. Each time you create a new capture window, it opens immediately using these settings.
• Start capture immediately (Capture Engine only): Select this option to immediately begin capturing packets once OK is clicked.
• Open capture window (Capture Engine only): Select this option to immediately display the capture window once OK is clicked.
• Save as template (Capture Engine only): Select this option to create a new Capture Engine capture template based on the current capture option settings. A saved capture template can be selected whenever you create a capture window and want that capture to have the same settings as those in the capture template.
Configuring adapter options
The Adapter options of the Capture Options dialog lets you choose an adapter for the capture.
To select an adapter for an OmniPeek capture:
1. Click the Adapter options of the OmniPeek Capture Options dialog.
Configuring adapter options 45
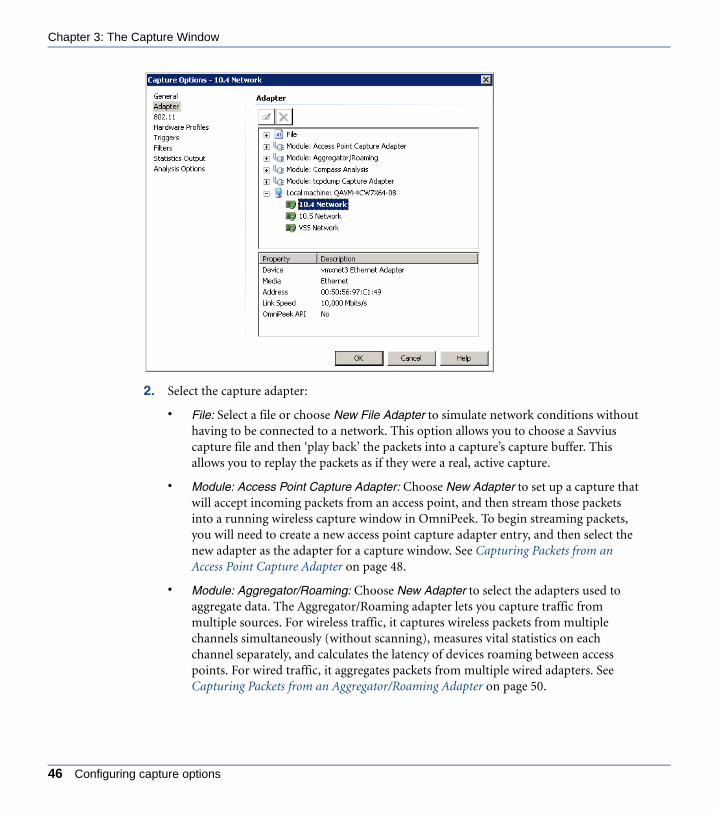
Chapter 3: The Capture Window
ANYOP_UG.book Page 46 Friday, February 5, 2016 4:47 PM
2. Select the capture adapter:
• File: Select a file or choose New File Adapter to simulate network conditions without having to be connected to a network. This option allows you to choose a Savvius capture file and then ‘play back’ the packets into a capture’s capture buffer. This allows you to replay the packets as if they were a real, active capture.
• Module: Access Point Capture Adapter: Choose New Adapter to set up a capture that will accept incoming packets from an access point, and then stream those packets into a running wireless capture window in OmniPeek. To begin streaming packets, you will need to create a new access point capture adapter entry, and then select the new adapter as the adapter for a capture window. See Capturing Packets from an Access Point Capture Adapter on page 48.
• Module: Aggregator/Roaming: Choose New Adapter to select the adapters used to aggregate data. The Aggregator/Roaming adapter lets you capture traffic from multiple sources. For wireless traffic, it captures wireless packets from multiple channels simultaneously (without scanning), measures vital statistics on each channel separately, and calculates the latency of devices roaming between access points. For wired traffic, it aggregates packets from multiple wired adapters. See Capturing Packets from an Aggregator/Roaming Adapter on page 50.
46 Configuring capture options

OmniPeek User Guide
ANYOP_UG.book Page 47 Friday, February 5, 2016 4:47 PM
Note You can also create RPCap interfaces that allow you to capture wired and 802.11 wireless traffic in OmniPeek. See Capturing Packets from an RPCap Interface on page 51.
• Module: Compass Analysis: Choose New Compass Workspace to select a Compass remote adapter. The Compass workspace lets you aggregate statistics from any number of capture files (*.pkt, *.apc, *.pcap [Libpcap format only], *.wcap [Libpcap format only], *.cap [Libpcap format only], *.wpz, and *.pcapng) over a reasonable period of time, and then display those statistics in the Compass dashboard. See Compass dashboard on page 80.
• Module: tcpdump Capture Adapter: Choose New Adapter to select an tcpdump Capture Adapter that lets you capture packets from remote computers that have the ‘tcpdump’ packet capture utility, into a running capture window in OmniPeek. To begin capturing packets, you will need to create a new tcpdump Capture Adapter entry, and then select the new adapter as the adapter for a capture window. See Capturing Packets from a tcpdump Capture Adapter on page 53.
• Local machine: Select a network adapter installed on the OmniPeek computer. All locally installed network adapters are listed; however, only a supported network adapter can be selected for a capture.
Information about the selected OmniPeek adapter is displayed below the list of adapters. For example, if you are capturing packets on a WLAN, only 802.11 wireless adapters that support the Savvius API can be used to capture packets. If the description for Savvius API is Yes, the adapter can be used; if it is No, the adapter may not be a supported 802.11 wireless adapter, or it may not have the Savvius driver installed yet. See Supported adapters on page 6.
Tip You can right-click an adapter to configure certain settings such as network speed options (the available options are dependent on the type of adapter). In certain cases you may want to override the network speed default setting (Auto sense). For example, you may wish to set a nominal network speed for a particular adapter to ensure consistent statistics reporting.
To select an adapter for a Capture Engine capture:
1. Click the Adapter options of the Capture Engine Capture Options dialog.
Configuring adapter options 47

Chapter 3: The Capture Window
ANYOP_UG.book Page 48 Friday, February 5, 2016 4:47 PM
2. Select the capture adapter.
Tip You can right-click a Capture Engine adapter to rename the adapter.
3. Click Options to open the Adapter Options dialog, where you can configure 802.11, adapter for Omnipliance, network speed, and buffer options (the available options are dependent on the type of adapter selected). For more information:
• See Configuring wireless channels and encryption on page 488
• See Configuring hardware profiles for adapters on page 502
Note Click Help on the Adapter Options dialog to learn more about the available settings.
Capturing Packets from an Access Point Capture Adapter
The Access Point Capture Adapter lets you stream packets from one or more supported access points into a running wireless capture window in OmniPeek. To begin streaming packets, you will need to create a new Access Point Capture Adapter entry, and then select the new adapter
48 Configuring capture options

OmniPeek User Guide
ANYOP_UG.book Page 49 Friday, February 5, 2016 4:47 PM
as the adapter for a capture window. You can enable, disable, and configure Access Point Cap-ture Adapter functionality in OmniPeek from the Analysis Modules view of the Options dia-log. See Access Point Capture Adapter on page 572.
Note Capturing packets from an access point and streaming those packets directly to an OmniPeek computer is not supported from a Capture Engine, except for an Omnipliance WiFi .
To capture packets from an access point:
1. Create a new capture window in OmniPeek. The Capture Options dialog appears.
2. Select the Adapter options.
3. Double-click New Adapter below the Module: Access Point Capture Adapter entry. The Access Point Capture Adapter Properties dialog appears.
4. Enter a Name and IP Address for the capture adapter. The name can be anything and the IP address should be that of the access point. Leave the IP address blank if you want to capture packets from all access points configured to send packets to the IP address of the OmniPeek computer.
5. Click OK to close the Access Point Capture Adapter Properties dialog.
6. Select the new adapter and click OK to close the Capture Options dialog. A new capture window appears that has Start / Stop AP Capture in the upper right corner.
7. Click Start AP Capture. Packets will not populate the capture window until the access point begins sending packets to the OmniPeek computer as noted below.
Important! To send packets from an access point to the IP address of the OmniPeek computer, you need to configure the access point through the user interface of the access point.
While the access point is sending packets to the OmniPeek computer, it is not operating as a true access point. When you want to stop sending packets, you must configure the access point to stop sending packets; otherwise, the OmniPeek computer will send an ICMP Destination Port Unreachable for every incoming packet received. This will impact the performance of the OmniPeek computer and possibly your network. Refer to your access point documentation for instructions.
8. Click Stop AP Capture to stop capturing packets. No additional packets are allowed into the capture buffer.
Configuring adapter options 49
Chapter 3: The Capture Window
ANYOP_UG.book Page 50 Friday, February 5, 2016 4:47 PM
Note Any Aruba and Cisco access point remote adapters created in versions of OmniPeek prior to OmniPeek 8.1, will need to be recreated as new access point adapter entries in OmniPeek 8.1 and above.
Capturing Packets from an Aggregator/Roaming Adapter
The Aggregator/Roaming Adapter lets you capture traffic from multiple wired or wireless sources. This is especially useful if you want to capture traffic from multiple 802.11 channels simultaneously, and then want to stream that data into a single capture window.
You can enable or disable the Aggregator/Roaming Adapter functionality in OmniPeek from the Analysis Modules view of the Options dialog. See Aggregator/Roaming Adapter on page 573.
Note You can also create RPCap interfaces that allow you to capture wired and 802.11 wireless traffic in OmniPeek. See Capturing Packets from an RPCap Interface on page 51.
Capturing packets from an Aggregator/Roaming Adapter is not supported from a Capture Engine.
To capture packets from an Aggregator/Roaming Adapter:
1. Create a new capture window in OmniPeek. The Capture Options dialog appears.
2. Select the Adapter options.
3. Double-click New Adapter below the Module: Aggregator/Roaming entry. The Aggregator Settings dialog appears.
4. Enter a name for the Aggregator/Roaming adapter.
5. Select either the Wired Connections or Wireless Connections option. A list of wired or wireless adapters is displayed in the window. Any wireless adapter that is not using the Savvius API will also show up under wired connections.
If a wireless network adapter is selected, the Channel drop down menu is enabled, allowing the selection of a wireless channel. You can also select Scan mode to enable Scan Options for selecting multiple wireless channels.
6. Select the check box of one or more adapters that you want to use to capture and analyze traffic.
7. Click OK to close the Aggregator Settings dialog.
50 Configuring capture options

OmniPeek User Guide
ANYOP_UG.book Page 51 Friday, February 5, 2016 4:47 PM
8. Click OK to close the Capture Options dialog. A new capture window appears that has Start / Stop Aggregator in the upper right corner.
9. Click Start Aggregator.
10. Click Stop Aggregator to stop capturing packets. No additional packets are allowed into the capture buffer.
Note An aggregator capture window using wireless adapters displays roaming latency data in the three Roaming views. See Roaming latency analysis on page 496.
Capturing Packets from an RPCap Interface
If you have WinPcap installed on a computer, or if you have an access point that supports RPCap, you can create RPCap interfaces that allow you to capture wired and 802.11 wireless traffic, and then stream the traffic back to OmniPeek where it can be displayed. In OmniPeek you create and select RPCap interfaces from within the Aggregator Settings dialog.
To capture packets from an RPCap interface:
1. Create a new capture window in OmniPeek. The Capture Options dialog appears.
2. Select the Adapter options.
3. Double-click New Adapter below the Module: Aggregator/Roaming entry. The Aggregator Settings dialog appears.
4. Enter a name for the Aggregator/Roaming adapter.
5. Click Create RPCap Interfaces. The Create New RPCap Interfaces dialog appears.
Note The Create RPCap Interfaces button is available only if the WinPcap driver and libraries are installed on your computer. You can install the driver and libraries by going to www.WinPcap.org.
Configuring adapter options 51
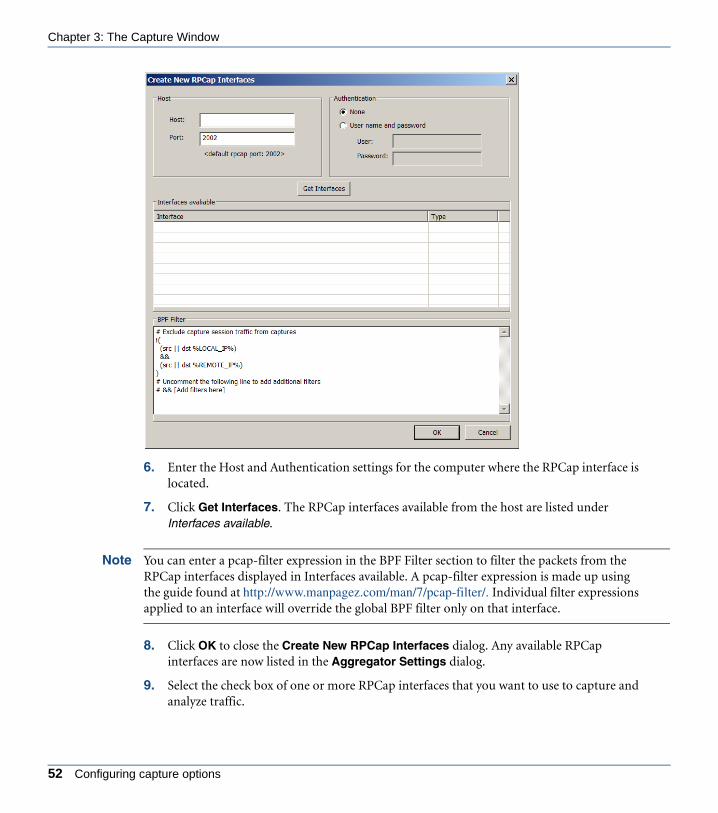
Chapter 3: The Capture Window
ANYOP_UG.book Page 52 Friday, February 5, 2016 4:47 PM
6. Enter the Host and Authentication settings for the computer where the RPCap interface is located.
7. Click Get Interfaces. The RPCap interfaces available from the host are listed under Interfaces available.
Note You can enter a pcap-filter expression in the BPF Filter section to filter the packets from the RPCap interfaces displayed in Interfaces available. A pcap-filter expression is made up using the guide found at http://www.manpagez.com/man/7/pcap-filter/. Individual filter expressions applied to an interface will override the global BPF filter only on that interface.
8. Click OK to close the Create New RPCap Interfaces dialog. Any available RPCap interfaces are now listed in the Aggregator Settings dialog.
9. Select the check box of one or more RPCap interfaces that you want to use to capture and analyze traffic.
52 Configuring capture options

OmniPeek User Guide
ANYOP_UG.book Page 53 Friday, February 5, 2016 4:47 PM
If a wireless network adapter is selected, the Channel drop down menu is enabled, allowing the selection of a wireless channel.
10. Click OK to close the Aggregator Settings dialog.
11. Click OK to close the Capture Options dialog. A new capture window appears that has Start / Stop Aggregator in the upper right corner.
12. Click Start Aggregator to begin capturing packets.
13. Click Stop Aggregator to stop capturing packets. No additional packets are allowed into the capture buffer.
Capturing Packets from a tcpdump Capture Adapter
The tcpdump Capture Adapter, lets you capture packets from remote computers that have the ‘tcpdump’ packet capture utility, into a running capture window in OmniPeek. Essentially all UNIX-family systems, including Linux and Mac OS X, have the ‘tcpdump’ packet capture util-ity.
Before capturing packets using the tcpdump Capture Adapter, make sure the prerequisites on the remote host are met, as described below.
To begin capturing packets, you will need to create a new tcpdump Capture Adapter entry, and then select the new adapter as the adapter for a capture window. The steps to create a tcpdump Capture Adapter entry are described below for both the OmniPeek console and a Capture Engine. See tcpdump Capture Adapter on an OmniPeek console on page 54 and tcpdump Cap-ture Adapter on a Capture Engine on page 56.
Note You can enable or disable the tcpdump Capture Adapter functionality in OmniPeek in the Analysis Modules view of the Options dialog.
Prerequisites on remote host
Before capturing packets, the following requirements must be met on the remote host:
• ‘sudo’ utility must be installed
• Disable terminal (tty) for ‘sudo’ to run ‘tcpdump’ command. Please refer to your remote host's operating system documentation for instructions on how to disable ‘tty’
• The remote user's default shell should point to a bourne or bourne-like shell; for example, bash, dash, tcsh, etc. (but NOT C-shell (csh))
Configuring adapter options 53
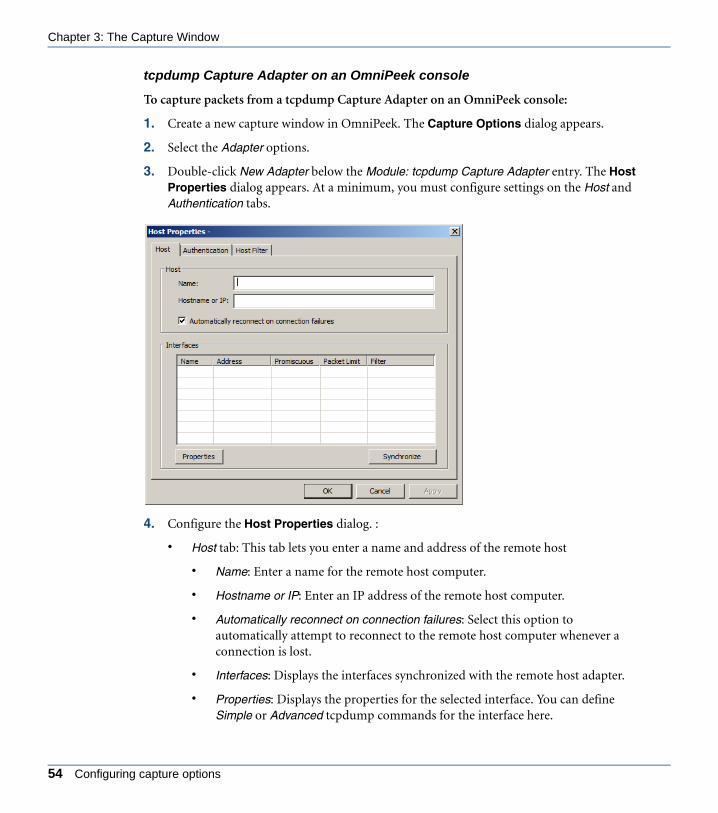
Chapter 3: The Capture Window
ANYOP_UG.book Page 54 Friday, February 5, 2016 4:47 PM
tcpdump Capture Adapter on an OmniPeek console
To capture packets from a tcpdump Capture Adapter on an OmniPeek console:
1. Create a new capture window in OmniPeek. The Capture Options dialog appears.
2. Select the Adapter options.
3. Double-click New Adapter below the Module: tcpdump Capture Adapter entry. The Host Properties dialog appears. At a minimum, you must configure settings on the Host and Authentication tabs.
4. Configure the Host Properties dialog. :
• Host tab: This tab lets you enter a name and address of the remote host
• Name: Enter a name for the remote host computer.
• Hostname or IP: Enter an IP address of the remote host computer.
• Automatically reconnect on connection failures: Select this option to automatically attempt to reconnect to the remote host computer whenever a connection is lost.
• Interfaces: Displays the interfaces synchronized with the remote host adapter.
• Properties: Displays the properties for the selected interface. You can define Simple or Advanced tcpdump commands for the interface here.
54 Configuring capture options
OmniPeek User Guide
ANYOP_UG.book Page 55 Friday, February 5, 2016 4:47 PM
Simple: Select this option if you want to define promiscuous and slice settings for the tcpdump commands.
Don’t put the interface into promiscuous mode (-p). (Required for some VM interfaces.): Select this option if you do not want the interface put into promiscuous mode (-p). This may be required for some VM interfaces.
Limit each packet to _____ bytes. (Default snaplen is 65535).: Select this option to change the slice value for each packet from the default (65535), and then enter the desired slice value in bytes. tcpdump snaplen includes the header, but OmniPeek does not consider the header in the slice.
Filter (BPF): Enter or select additional filters for the tcpdump commands.
Advanced: Select this option to add or define additional tcpdump commands in the text box below. If you add or define additional commands, you must redirect your output to Standard Output (stdout).
• Synchronize: Click to query the interface list from the remote host computer. If you did not configure the settings on the Authentication tab, you are prompted to enter username and password authentication settings for the remote host computer.
• Authentication tab: This tab lets you enter authentication settings for the remote host computer.
• Username: Enter the username for the remote host computer.
• Password: Enter the password for the remote host computer.
• Save Host Password: Select this check box if you want to save the password for the remote host computer.
• Login Script: Use this text box to run any additional setup steps (Linux commands) prior to doing a tcpdump capture.
• Host Filter tab: This tab lets you define the filter that removes unwanted SSH traffic from the remote host capture. The ‘Host Filter’ is part of the tcpdump commands in the Simple and Advanced properties for each interface.
• Host Filter (BPF): This text box defines the ‘Host Filter’ for tcpdump captures. You can modify the filter by editing the text inside the text box.
• Restore Default: Click to reset the ‘Host Filter’ to its default.
• Macros: Displays the macros used in the ‘Host Filter.’
Configuring adapter options 55

Chapter 3: The Capture Window
ANYOP_UG.book Page 56 Friday, February 5, 2016 4:47 PM
5. Click Apply to apply the settings.
6. Click OK to close the Host Properties dialog.
7. Select one of the newly created tcpdump capture adapters as the capture adapter for the new capture window.
8. Click OK to close the Capture Options dialog. A new capture window appears that has Start / Stop tcpdump in the upper right corner.
9. Click Start tcpdump.
10. Click Stop tcpdump to stop capturing packets. No additional packets are allowed into the capture buffer.
tcpdump Capture Adapter on a Capture Engine
To capture packets from a tcpdump Capture Adapter on a Capture Engine:
1. Create a new Capture Engine capture window in OmniPeek. The Capture Options dialog appears.
2. Select the Adapter options.
3. Click Insert. The Configure Adapters dialog appears.
Note You can also click Insert from the Adapters tab in the Capture Engines window.
56 Configuring capture options
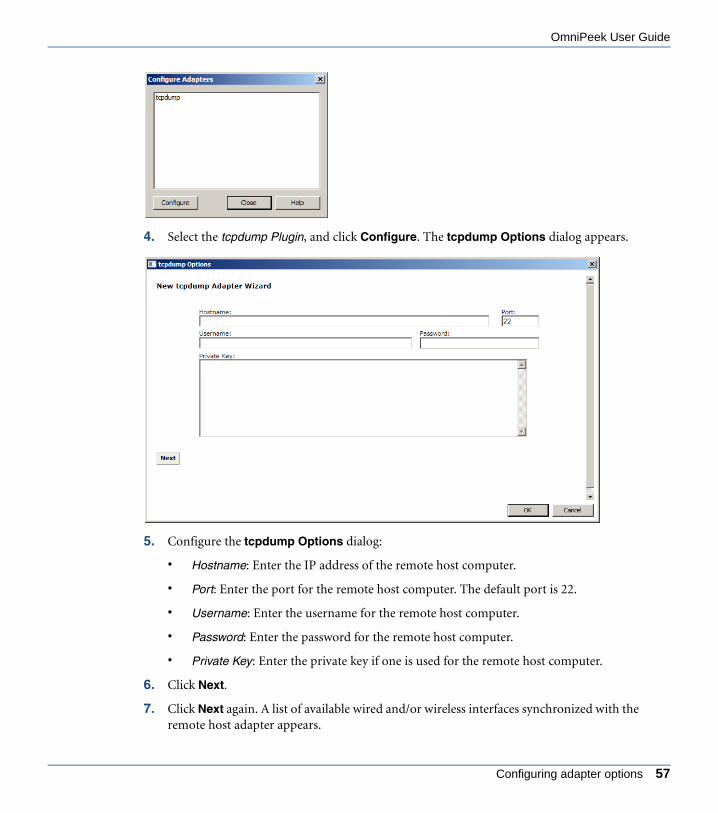
OmniPeek User Guide
ANYOP_UG.book Page 57 Friday, February 5, 2016 4:47 PM
4. Select the tcpdump Plugin, and click Configure. The tcpdump Options dialog appears.
5. Configure the tcpdump Options dialog:
• Hostname: Enter the IP address of the remote host computer.
• Port: Enter the port for the remote host computer. The default port is 22.
• Username: Enter the username for the remote host computer.
• Password: Enter the password for the remote host computer.
• Private Key: Enter the private key if one is used for the remote host computer.
6. Click Next.
7. Click Next again. A list of available wired and/or wireless interfaces synchronized with the remote host adapter appears.
Configuring adapter options 57

Chapter 3: The Capture Window
ANYOP_UG.book Page 58 Friday, February 5, 2016 4:47 PM
8. Select the interface that you want to configure, and click OK. The properties page for the selected interface appears.
9. Configure the properties page for the selected interface:
• Do not filter ssh traffic: Select this option if you do not want to filter SSH traffic from traffic captured on the interface.
58 Configuring capture options
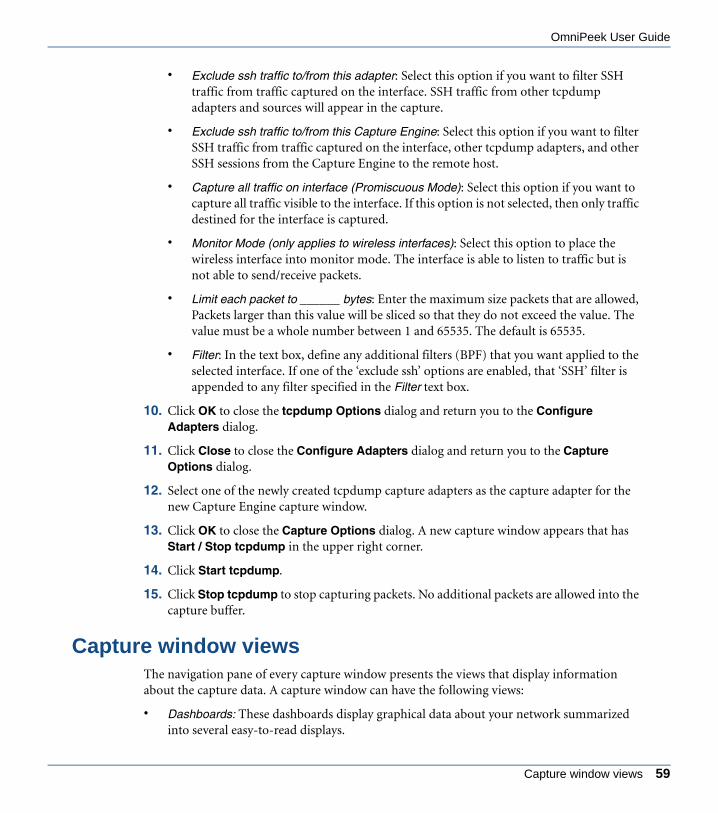
OmniPeek User Guide
ANYOP_UG.book Page 59 Friday, February 5, 2016 4:47 PM
• Exclude ssh traffic to/from this adapter: Select this option if you want to filter SSH traffic from traffic captured on the interface. SSH traffic from other tcpdump adapters and sources will appear in the capture.
• Exclude ssh traffic to/from this Capture Engine: Select this option if you want to filter SSH traffic from traffic captured on the interface, other tcpdump adapters, and other SSH sessions from the Capture Engine to the remote host.
• Capture all traffic on interface (Promiscuous Mode): Select this option if you want to capture all traffic visible to the interface. If this option is not selected, then only traffic destined for the interface is captured.
• Monitor Mode (only applies to wireless interfaces): Select this option to place the wireless interface into monitor mode. The interface is able to listen to traffic but is not able to send/receive packets.
• Limit each packet to ______ bytes: Enter the maximum size packets that are allowed, Packets larger than this value will be sliced so that they do not exceed the value. The value must be a whole number between 1 and 65535. The default is 65535.
• Filter: In the text box, define any additional filters (BPF) that you want applied to the selected interface. If one of the ‘exclude ssh’ options are enabled, that ‘SSH’ filter is appended to any filter specified in the Filter text box.
10. Click OK to close the tcpdump Options dialog and return you to the Configure Adapters dialog.
11. Click Close to close the Configure Adapters dialog and return you to the Capture Options dialog.
12. Select one of the newly created tcpdump capture adapters as the capture adapter for the new Capture Engine capture window.
13. Click OK to close the Capture Options dialog. A new capture window appears that has Start / Stop tcpdump in the upper right corner.
14. Click Start tcpdump.
15. Click Stop tcpdump to stop capturing packets. No additional packets are allowed into the capture buffer.
Capture window viewsThe navigation pane of every capture window presents the views that display information about the capture data. A capture window can have the following views:
• Dashboards: These dashboards display graphical data about your network summarized into several easy-to-read displays.
Capture window views 59

Chapter 3: The Capture Window
ANYOP_UG.book Page 60 Friday, February 5, 2016 4:47 PM
• Timeline: This dashboard provides an overview of the top talkers, top protocols, and network utilization for the Capture Engine. See Timeline dashboard on page 72.
• Applications: This dashboard provides key statistics for applications in the capture window. See Applications dashboard on page 77.
• Network: This dashboard provides an overview of network statistics for the capture. See Network dashboard on page 75.
• Voice & Video: This dashboard provides a visual display of several VoIP-related statistics for the capture window. See Voice & Video dashboard on page 78.
• Compass: This dashboard lets you view network utilization, and top statistics from a real-time capture occurring on an OmniPeek network analyzer, from a single supported capture file, or from multiple OmniPeek capture files. See Compass dashboard on page 80.
• Capture: These views display information about packets captured into the capture buffer.
• Packets: This view lists all of the packets placed in the buffer of a capture window (or capture file). The Decode and Hex panes show the contents of the selected packet decoded or in hexadecimal and ASCII. See Viewing captured packets on page 142.
• Log: This view collects messages generated by events relating to the particular capture window. These events include the results of notifications generated by the triggers or analysis modules selected for the capture window. See Chapter 18, Viewing Logs.
• Filters: This view lets you enable, disable, add, edit, and delete filters used for capturing packets into the capture window buffer. See Chapter 6, Creating and Using Filters.
• Alarms (Capture Engine only): This view lets you query a specified monitor statistics function once per second, testing for user-specified problem and resolution conditions. On matching any of these tests, the alarm function sends a notification of user-specified severity. See Chapter 15, Setting Alarms and Triggers.
• Expert: These views provide expert analysis of delay, throughput, and a wide variety of network events in a conversation-centered view of traffic in a capture window. See Chapter 8, Expert Analysis.
• Clients/Servers: This view makes it easy to track events and to see them in the context of peer-to-peer or client-server traffic patterns. See Expert Clients/Servers view on page 232.
• Flows: This view displays each flow independently in a flat view. This simplified view allows you to compare flows to one another, regardless of the node pair to which they belong. See Expert Flows view on page 234.
60 Capture window views

OmniPeek User Guide
ANYOP_UG.book Page 61 Friday, February 5, 2016 4:47 PM
• Application: This view allows you to categorize each flow by application. This view allows you to see who is using each application on your network and how each application is performing. See Expert Applications view on page 235.
• Web (OmniPeek only): These views let you display web page requests and responses, allowing you to track client/server activity within a capture. The same web data is presented in four formats.
• Servers: This view lets you focus on which servers are being used. See Servers view on page 297.
• Clients: This view lets you focus on which clients are using which servers. See Clients view on page 297.
• Pages: This view displays a list of web pages with each individual request nested underneath. See Pages view on page 298.
• Requests: This view displays a flat list of individual HTTP requests. See Requests view on page 299.
• Voice & Video: These views let you display the voice and video data in the following formats:
• Calls: This view displays one row for each call. See Calls view on page 314.
• Media: This view displays one row for each media flow. See Media view on page 315.
• Visuals: These views graphically display network traffic and statistics.
• Peer Map: This view lets you visualize network traffic by displaying nodes and the traffic between the nodes. The lines indicate traffic between two nodes. The relative thickness of the lines indicate the volume of traffic occurring. See Chapter 13, Using the Peer Map.
• Graphs: This view displays graphs of individual items from the other statistics views in real time. The data from these graphs can also be saved as tab-delimited or comma-delimited text, or as XML \ HTML. On a Capture Engine, this view must be enabled in the Graphs options of the Capture Options dialog. See OmniPeek capture window graphs on page 388.
• Statistics: These views display various statistical data about your network.
• Nodes: This view displays real-time data organized by network node. You can choose to display the nodes in a nested hierarchical view (logical addresses nested beneath their physical address), or in a variety of flat tabular views. Right-click the column header to add or remove various columns. See Nodes statistics on page 339.
• Protocols: This view displays network traffic volume as a percentage of total bytes, broken down by protocol and subprotocol. You can choose to display the protocols in
Capture window views 61
Chapter 3: The Capture Window
ANYOP_UG.book Page 62 Friday, February 5, 2016 4:47 PM
either a nested Clients/Servers view or a Flows view. See Protocols statistics on page 342.
• Summary: This views lets you monitor key network statistics in real time and save those statistics for later comparison. Summary statistics are also extremely valuable in comparing the performance of two different networks or network segments. See Summary statistics on page 349.
• Applications: This views lets you view basic statistics about applications for a capture window. See Applications statistics on page 360.
• Countries: This views lets you view a geographical breakdown of traffic based on IP address for a capture window. See Countries statistics on page 362.
• Wireless: These views display information about your wireless network.
• WLAN: This view displays an SSID (Service Set Identifier) tree view of wireless nodes. See WLAN statistics on page 355.
• Channels: This view displays a variety of statistics and counts for each wireless channel. See Channel statistics on page 353.
• Signal: This view displays continuously updated graphs of signal strength (or related measures) for traffic in the capture window. See Signal statistics on page 358.
• Roaming: These views display roaming latency—the amount of time it takes for a wireless device to move from one access point to another.
• Log: This view displays a log entry each time a wireless roaming device is detected. See Log on page 497.
• by Node: This view displays an entry for each wireless roaming device, and calculates an average latency value for that device. See by Node on page 497
• by AP: This view displays an entry for each wireless access point, and calculates an average latency value for that access point. See by AP on page 498.
Important! Your version of the software may not include all of the views listed here. Please visit our web site at https://www.savvius.com for details about how to order the features that precisely fit the needs of your network.
Opening saved capture filesCapture files, or trace files, are capture windows that were saved to a variety of supported cap-ture file formats. You can open capture files to load and process packets back into OmniPeek. See Save file formats on page 150 for a description of the supported capture file formats.
62 Opening saved capture files

OmniPeek User Guide
ANYOP_UG.book Page 63 Friday, February 5, 2016 4:47 PM
OmniPeek capture files
To open an OmniPeek capture file:
1. Do one of the following:
• On the Start Page, click Open Capture File
• On the File menu, click Open
2. Select the capture file and click Open.
Tip You can open the Analysis Options dialog (on the Capture menu, click Analysis Options) to enable or disable analysis options for the capture file. These analysis options are typically displayed in the navigation pane of a capture window. Disabling analysis options will free up system resources resulting in faster performance.
3. Click the Packets view in the navigation pane.
Display Filter listFilter bar
OmniPeek capture files 63

Chapter 3: The Capture Window
ANYOP_UG.book Page 64 Friday, February 5, 2016 4:47 PM
Note Triggers and capture filters are not available from a capture file. However, you can use “display filters” and filters created in the Filter Bar to view subsets of the traffic in the same window or copied to a new window. See Chapter 7, Post-capture Analysis. See also Display filters on page 166 and Creating filters with the filter bar on page 179.
Capture Engine capture files
Capture Engine capture files are saved to the Data folder you specified when configuring the engine. See Configuring and updating Capture Engine settings on page 26.
The Files tab in the Capture Engines window displays a listing of all the capture files saved to the Capture Engine computer. From this tab, you can perform network forensic analysis using the data from one or more selected files. See Forensics capture on a Capture Engine on page 68 and Forensic search from the Files tab on page 201.
Note You can also perform network forensic analysis from the Forensics tab. See Forensic search from the Forensics tab on page 206.
Splitting saved packet filesIf you have a large Savvius formatted packet file, you can easily split it into smaller manageable packet files. You can specify file sizes by byte size or packet count.
To split a large packet file:
1. On the Tools menu, click Split Packet File. The Split Packet File dialog appears.
2. Select the source file, destination folder, file size, and file size unit (Megabytes, Kilobytes, or Packets) and click Split.
64 Splitting saved packet files

OmniPeek User Guide
ANYOP_UG.book Page 65 Friday, February 5, 2016 4:47 PM
The file sizes of the smaller files are approximately equal to the file size you specify, with possibly the exception of the last file created. This is necessary in instances where the original file cannot be divided equally by the file size specified.
Merging saved packet filesIf you have multiple packet files, you can merge the files into a single larger packet file. The files must be of a supported Savvius packet file format (*.pkt, *.wpz, *.apc, *.wpc), and also of the same media type (Ethernet, wireless, or WAN).
To merge packet files:
1. On the Tools menu, click Merge Packet Files. The Merge Packet Files dialog appears.
2. Add the files you want to merge by clicking Insert or by dragging files into the list of files.
3. Specify the name and location of the merged file.
4. Click Merge.
Note Click Open merged file to open the merged file. If not available, a beep will sound to indicate no merged file is available.
Using capture templatesCapture templates let you use pre-defined settings for creating a new capture window. You can save any capture window as a capture template. The steps for creating and using capture tem-plates differ in OmniPeek and Capture Engine.
Merging saved packet files 65
Chapter 3: The Capture Window
ANYOP_UG.book Page 66 Friday, February 5, 2016 4:47 PM
OmniPeek capture templates
To create and use a capture template from OmniPeek:
1. Make the capture window the active window.
2. On the File menu, click Save Capture Template…. The Save As dialog appears.
3. Name the template and save it in the Capture Template format (*.ctf).
4. To use the capture template, on the File menu, click New From Template… and select the desired template.
Note Capture windows created from templates are created without first opening the Capture Options dialog, regardless of whether the check box labeled Show this dialog when creating a new capture window is checked or unchecked.
You can also create capture templates in the following ways:
• Capture templates are used when starting OmniPeek from the command line. See Starting OmniPeek from the command line on page 565.
• The OmniPeek AutoCapture feature allows you to create, import, and export settings from capture templates, and use them to programmatically open capture. See Chapter 20, Using AutoCapture.
Capture Engine capture templates
To create and use a capture template from Capture Engine:
1. For a connected Capture Engine, do one of the following:
• On the Home tab, select Edit Capture Templates under New Capture.
• On the Capture tab, click the arrow to the right of Insert and select Edit Capture Templates.
• On the Adapters tab, select Edit Capture Templates under New Capture.
The Capture Templates dialog appears. The clickable buttons are described below.
66 Using capture templates
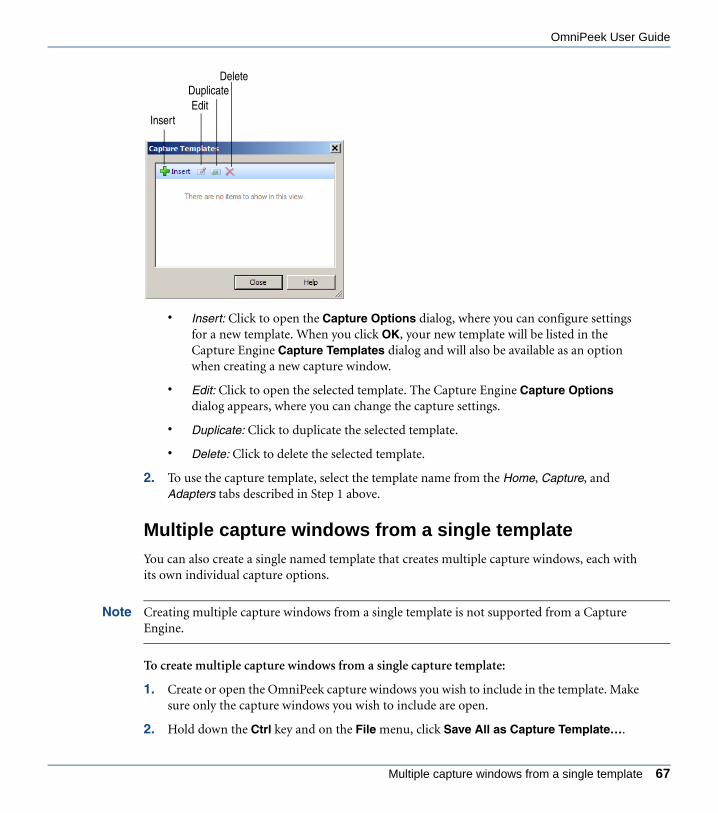
OmniPeek User Guide
ANYOP_UG.book Page 67 Friday, February 5, 2016 4:47 PM
• Insert: Click to open the Capture Options dialog, where you can configure settings for a new template. When you click OK, your new template will be listed in the Capture Engine Capture Templates dialog and will also be available as an option when creating a new capture window.
• Edit: Click to open the selected template. The Capture Engine Capture Options dialog appears, where you can change the capture settings.
• Duplicate: Click to duplicate the selected template.
• Delete: Click to delete the selected template.
2. To use the capture template, select the template name from the Home, Capture, and Adapters tabs described in Step 1 above.
Multiple capture windows from a single template
You can also create a single named template that creates multiple capture windows, each with its own individual capture options.
Note Creating multiple capture windows from a single template is not supported from a Capture Engine.
To create multiple capture windows from a single capture template:
1. Create or open the OmniPeek capture windows you wish to include in the template. Make sure only the capture windows you wish to include are open.
2. Hold down the Ctrl key and on the File menu, click Save All as Capture Template….
DuplicateEdit
Delete
Insert
Multiple capture windows from a single template 67
Chapter 3: The Capture Window
ANYOP_UG.book Page 68 Friday, February 5, 2016 4:47 PM
3. Name the template and save it in the Capture Template format (*.ctf).
The saved template will include all the open capture windows.
4. On the File menu, click New From Template… and select the desired capture template.
Forensics capture on a Capture EngineThe Forensics capture template available in OmniPeek is configured for post-capture forensic analysis. The template allows you to create and save forensic captures stored as packet files on the Capture Engine. You can then use these forensics captures to perform a more detailed investigation of the data to identify and troubleshoot items such as network problems, security attacks, HR policy violations, and more.
The Forensics Capture template is available from various tabs in the Capture Engines win-dow. The basic steps on how to perform forensic analysis using the Forensics Capture template are described below. For more detailed instructions, see Forensic search from the ‘Forensics Capture’ window on page 216.
To start a forensics capture on a Capture Engine:
1. From a connected Capture Engine in the Capture Engines window, do one of the following:
• On the Home tab, click New Capture, and then click New “Forensics Capture.”
• On the Capture tab, click the arrow to the right of Insert, and then click New “Forensics Capture.”
• On the Adapters tab, click New Capture, and then click Start “Forensics Capture.”
The General options of the Capture Options dialog appears. See Configuring general options on page 41. See also Configuring adapter options on page 45 to select a capture adapter.
Note Since a ‘Forensics Capture’ is optimized for post capture forensics analysis, click the Analysis Options view from the Capture Options dialog and notice that all options are disabled by default. This helps to ensure packets are captured at the fastest rates possible.
2. Click OK from the Capture Options dialog. A new Capture Engine capture window appears.
3. Click Start Capture to start capturing packets.
4. Click Stop Capture to stop capturing packets.
68 Forensics capture on a Capture Engine
OmniPeek User Guide
ANYOP_UG.book Page 69 Friday, February 5, 2016 4:47 PM
5. Once capture files are available on your Capture Engine, you can begin performing forensic analysis on the files by doing the following:
• On the Forensics tab, select the capture session you wish to search either from the Timeline or Details nested tab, drag to select the area of the capture session you wish to search in the Timeline graph, and then click Forensics Search. See Forensic search from the Forensics tab on page 206.
• On the Files tab, select one or more files that are from the desired time range, and then click Forensics Search. See Forensic search from the Files tab on page 201.
Note You can also perform forensic analysis directly from a ‘Forensics Capture’ window. See Forensic search from the ‘Forensics Capture’ window on page 216.
Monitoring capture on a Capture EngineOn a Capture Engine, you can create a new monitoring capture window based on pre-config-ured capture settings configured to view higher level expert and statistical data in a continuous real-time capture.
To start a monitoring capture:
1. From a connected Capture Engine, do one of the following:
• On the Home tab, select New “Monitoring Capture” under New Capture.
• On the Capture tab, click the arrow to the right of Insert and select New “Monitoring Capture”.
• On the Adapters tab, select Start “Monitoring Capture” under New Capture.
The General options of the Capture Options dialog appears. See Configuring general options on page 41. See also Configuring adapter options on page 45 to select a capture adapter.
Note Since a monitoring capture is optimized to view and analyze expert and statistical data, click the Analysis Options view from the Capture Options dialog and notice that all statistics are enabled. This helps to ensure optimum analysis of the data.
2. Click OK from the Capture Options dialog. A new Capture Engine capture window appears
3. From the new monitoring capture window, try the following:
Monitoring capture on a Capture Engine 69

Chapter 3: The Capture Window
ANYOP_UG.book Page 70 Friday, February 5, 2016 4:47 PM
• Click the Network dashboard to see network statistics for the capture. See Network dashboard on page 75.
• Click the statistics views to see various displays of the statistics data for the capture. To analyze the data obtained from a monitoring capture, see Displaying and Reporting Statistics on page 333.
70 Monitoring capture on a Capture Engine

C H A P T E R 4
ANYOP_UG.book Page 71 Friday, February 5, 2016 4:47 PM
Dashboards
In this chapter:
About dashboards . . . . . . . . . . . . . . . . . . . . . . . . . . . . . . . . . . . . . . . . . . . . . . . 72
Timeline dashboard . . . . . . . . . . . . . . . . . . . . . . . . . . . . . . . . . . . . . . . . . . . . . . 72
Network dashboard . . . . . . . . . . . . . . . . . . . . . . . . . . . . . . . . . . . . . . . . . . . . . . 75
Applications dashboard . . . . . . . . . . . . . . . . . . . . . . . . . . . . . . . . . . . . . . . . . . . 77
Voice & Video dashboard . . . . . . . . . . . . . . . . . . . . . . . . . . . . . . . . . . . . . . . . . . 78
Compass dashboard . . . . . . . . . . . . . . . . . . . . . . . . . . . . . . . . . . . . . . . . . . . . . 80
71
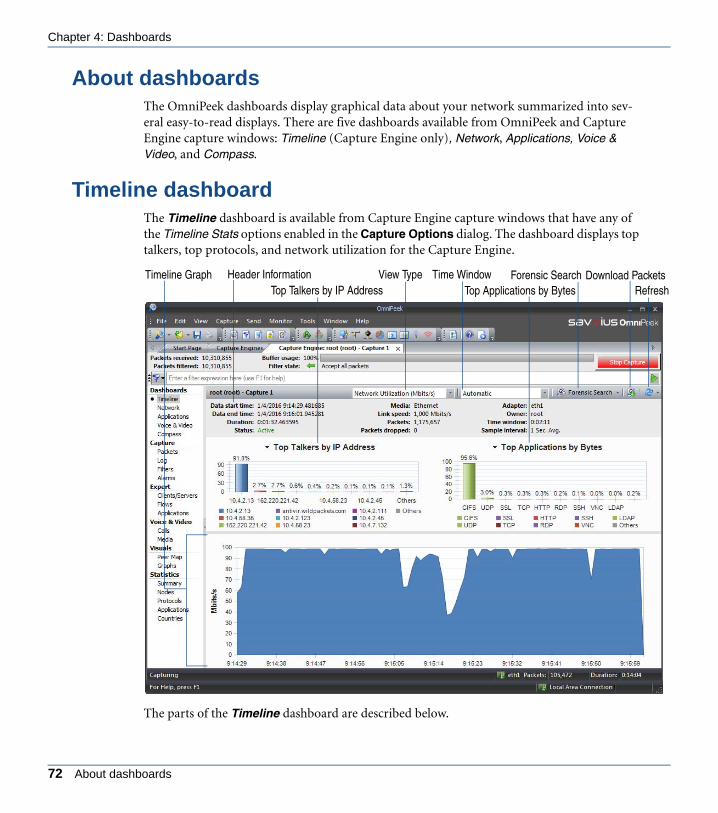
Chapter 4: Dashboards
ANYOP_UG.book Page 72 Friday, February 5, 2016 4:47 PM
About dashboardsThe OmniPeek dashboards display graphical data about your network summarized into sev-eral easy-to-read displays. There are five dashboards available from OmniPeek and Capture Engine capture windows: Timeline (Capture Engine only), Network, Applications, Voice & Video, and Compass.
Timeline dashboardThe Timeline dashboard is available from Capture Engine capture windows that have any of the Timeline Stats options enabled in the Capture Options dialog. The dashboard displays top talkers, top protocols, and network utilization for the Capture Engine.
The parts of the Timeline dashboard are described below.
Timeline Graph View Type Time Window Forensic SearchRefreshTop Talkers by IP Address Top Applications by Bytes
Header Information Download Packets
72 About dashboards

OmniPeek User Guide
ANYOP_UG.book Page 73 Friday, February 5, 2016 4:47 PM
• Header Information: The header information displays statistics for the capture session (data start time, data end time, duration, status, packets, packets dropped, adapter, etc.).
• Top Talkers by IP Address: This display shows a graph of top “talkers” on the network for the selected area in the Timeline graph, broken out by node. You can right-click inside the display to display top talkers by Physical Address, IP Address, or IPv6 Address; or to select a Bar or Pie display. Mouse over a bar (or slice) of the graph to view a tooltip with additional details for the node.
• Top Applications by Bytes: This display shows a graph of top applications on the network for the selected area in the Timeline graph. You can right-click inside the display to toggle the display with the Top Protocols display, or to select a Bar or Pie display. Mouse over a bar (or slice) of the graph to view a tooltip with additional details for the application.
• Top Protocols by Bytes: This display shows a graph of top protocols on the network for the selected area in the TimeLine graph. You can right-click inside the display to toggle the display with the Top Applications display, or to select a Bar or Pie display. Mouse over a bar (or slice) of the graph to view a tooltip with additional details for the protocol.
• Timeline graph: The Timeline graph displays the data of the selected capture session. Only one capture session at a time can be displayed inside the graph. By default, the graph shows network utilization in Mbits/s, but other statistics can be graphed as well by selecting the View type.
Here are descriptions of other parts of the Timeline graph:
• Right-click inside the graph to perform a forensic search (see Forensic search from the ‘Forensics Capture’ window on page 216), download selected packets to a capture file, refresh the window, or choose a different graph format: Bar, Stacked Bar, Skyline, Area, Stacked Area, Line, Line/Points, Linear, and Logarithmic. Additionally, you can also toggle displaying the minimum and maximum points for each series on the graph.
• Mouse over a data point in the graph to view a tooltip displaying timestamp and size information (e.g., time and rate, time and packet size, etc.).
• Any time there is more data than can be displayed on the screen, a scroll bar appears below the graph and allows you to view different points of time in the graph. (If the Time window is set to Automatic, the scroll bar will never appear.)
• If the Time window is set to anything other than Automatic, a scroll bar appears below the graph and allows you to view different points of time in the graph.
• View type: Select the type of statistics to display in the Timeline graph. You can select from:
• Network Utilization (Mbits/s)
Timeline dashboard 73

Chapter 4: Dashboards
ANYOP_UG.book Page 74 Friday, February 5, 2016 4:47 PM
• Network Utilization (Packets/s)
• Unicast/Multicast/Broadcast
• Packets sizes
• VLAN/MPLS
• Protocols (Mbits/s)
• Protocols (Packets/s)
• Applications (Mbits/s)
• Applications (Packets/s)
• Call Quality
• Call vs. Network Utilization
• Wireless Packets (Packets/s) (Capture Engine for OmniPeek (Windows) only)
• Wireless Retries (Packets/s) (Capture Engine for OmniPeek (Windows) only)
Note To display statistics for either the Call Quality or Call vs. Network Utilization view type, the VoIP Stats option must be selected when you first create the capture and configure the General options of the Capture Options dialog. See Configuring general options on page 41.
• Time window: Select the time interval to display in the Timeline graph. By default, Automatic is selected to display the optimum window based on the available data. Intervals from 5 Minutes (1 Sec. Avg.) to 24 Hours (5 Min. Avg.) are also available.
• Forensic search: Click to display the Forensic Search dialog where you can adjust the forensic search settings. Click the small down arrow next to Forensic Search to display custom or pre-configured settings for performing a forensic search. You can change any option prior to clicking OK:
• Custom: Creates a Forensic Search window based on the customized settings that you configure.
• Overview: Creates a Forensic Search window based on settings that display an overview of the selected data in the capture session.
• Packets: Creates a Forensic Search window containing a packets-only view.
• Expert: Creates a Forensic Search window based on settings that are optimized for Expert analysis.
• Voice & Video: Creates a Forensic Search window based on settings that are optimized for Voice & Video analysis.
74 Timeline dashboard

OmniPeek User Guide
ANYOP_UG.book Page 75 Friday, February 5, 2016 4:47 PM
• Download Packets: Click to download the packets from the selected capture session, in the selected time range.
• Refresh: Click to refresh the screen. For an active capture session, you can also set an automatic refresh interval by selecting an interval from the drop-down list to the right of the Refresh button.
Network dashboardThe Network dashboard displays key statistics for the capture window.
Note To have a fully functional Network dashboard that displays data in all of its displays, enable the Network Statistics, Node Statistics, Protocol Statistics, Traffic History Statistics, and Wireless Channel Statistics analysis options in the Analysis Options of the Capture Options dialog.
The parts of the Network dashboard are described below.
Network dashboard 75
Chapter 4: Dashboards
ANYOP_UG.book Page 76 Friday, February 5, 2016 4:47 PM
• Network Utilization: This display graphs network traffic in Mbits/second. You can right-click inside the display to drill-down to selected packets, or to select a Bar, Skyline, Area, Line, or Line/Points display.
• Wireless Signal: This display graphs wireless signal and/or noise strength (as a percentage) for the wireless channel you are capturing on, or all channels you have configured the capture to scan. This display is available only when a wireless adapter is selected as the capture adapter, or for a wireless capture file. You can right-click inside the display to select the parameters to display. Hovering over a channel will display a tooltip with additional channel information.
• Current Activity: This display shows three analog gauges with corresponding digital displays at their centers to show network utilization (as a percent of capacity), traffic volume (in packets per second), and error rate (total errors per second). You can right-click inside the display to select a Light, Dark, or Clean background for the display.
• Log: This display shows the number of notifications generated by level of severity. You can right-click inside the display to select a Light, Dark, or Clean background for the display. Clicking a severity icon navigates to the Log tab and displays those log events corresponding to the severity clicked.
• Top Talkers by IP Address: This display shows a graph of top “talkers” on the network, broken out by node. You can right-click inside the display to display top talkers by Physical Address, IP Address, IPv6 Address, or Country; or to select a Bar or Pie display. Clicking a bar (or slice) of the graph opens a Detail Statistics window populated with details for the node clicked.
Note This feature is automatically enabled for Capture Engine captures based on the Monitoring Capture template. Top talkers are displayed as Not Available for Capture Engine captures using the Forensic Capture template. See Forensics capture on a Capture Engine on page 68 and Monitoring capture on a Capture Engine on page 69.
• Top Applications: This display shows a graph of top applications on the network. You can right-click inside the display to toggle the display with the Top Protocols display, or to select a Bar or Pie display. Mouse over a bar (or slice) of the graph to view a tooltip with additional details for the application. Clicking a bar (or slice) of the graph opens a Detail Statistics window populated with details for the application clicked.
• Top Protocols: This display shows a graph of top protocols on the network. You can right-click inside the display to toggle the display with the Top Applications display, or to select a Bar or Pie display. Mouse over a bar (or slice) of the graph to view a tooltip with additional details for the protocol. Clicking a bar (or slice) of the graph opens a Detail Statistics window populated with details for the protocol clicked.
76 Network dashboard

OmniPeek User Guide
ANYOP_UG.book Page 77 Friday, February 5, 2016 4:47 PM
Tip Several of the displays inside the Network dashboard support tooltips. Hover over the display to view a tooltip with additional information.
You can also access additional options for viewing each display by clicking the small arrow in the upper left corner of each display, or by right-clicking inside each display.
Applications dashboardThe Applications dashboard displays key statistics for applications in the capture window. This application visibility provides insight into user behavior and traffic patterns on the net-work at certain times of day, week, month, or year. It helps the analysts to better understand who is going to what web sites and using which applications when.
• Top Applications by Flows: This display shows a graph of top applications by flow count. Clicking any application in this display lets you drill-down to that application in the
Applications dashboard 77
Chapter 4: Dashboards
ANYOP_UG.book Page 78 Friday, February 5, 2016 4:47 PM
Expert Applications view. You can right-click inside the display to select a Bar or Pie display.
• Top Applications by Bytes: This display shows a graph of top applications by bytes. You can right-click inside the display to toggle the display with the Top Protocols by Bytes display, or to select a Bar or Pie display. Mouse over a bar (or slice) of the graph to view a tooltip with additional details for the application. Clicking a bar (or slice) of the graph opens a Detail Statistics window populated with details for the application clicked.
• Top Protocols by Bytes: This display shows a graph of top protocols by bytes. You can right-click inside the display to toggle the display with the Top Applications by Bytes display, or to select a Bar or Pie display. Mouse over a bar (or slice) of the graph to view a tooltip with additional details for the protocol. Clicking a bar (or slice) of the graph opens a Detail Statistics window populated with details for the protocol clicked.
• Application Utilization: This display shows the top applications by bits per second. You can right-click inside the display to select a Stacked Bar, Skyline, Stacked Skyline, Area, Stacked Area, Line, Line/Points, Linear, and Logarithmic display. You can select an area of the graph, right-click and choose Select Packets. Only packets available in the capture buffer will be accessible for Select Packets.
• Application Response Time: This display shows response time of the top applications by largest response time. You can right-click inside the display to select a Skyline, Area, Line, Line/Points, Points, Linear, and Logarithmic display. You can select an area of the graph, right-click and choose Select Packets. Only packets available in the capture buffer will be accessible for Select Packets.
Tip Several of the displays inside the Applications dashboard support tooltips. Hover over the display to view a tooltip with additional information.
You can also access additional options for viewing each display by clicking the small arrow in the upper left corner of each display, or by right-clicking inside each display.
Voice & Video dashboardThe Voice & Video dashboard provides a visual display of voice and video call summary, as well as useful graphs and statistics to troubleshoot and analyze voice and video traffic.
78 Voice & Video dashboard
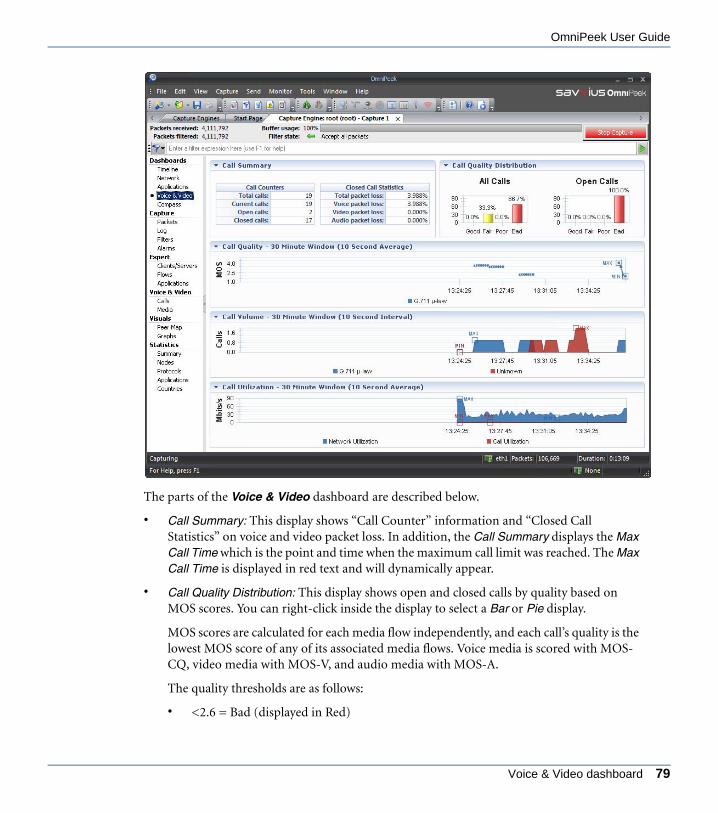
OmniPeek User Guide
ANYOP_UG.book Page 79 Friday, February 5, 2016 4:47 PM
The parts of the Voice & Video dashboard are described below.
• Call Summary: This display shows “Call Counter” information and “Closed Call Statistics” on voice and video packet loss. In addition, the Call Summary displays the Max Call Time which is the point and time when the maximum call limit was reached. The Max Call Time is displayed in red text and will dynamically appear.
• Call Quality Distribution: This display shows open and closed calls by quality based on MOS scores. You can right-click inside the display to select a Bar or Pie display.
MOS scores are calculated for each media flow independently, and each call’s quality is the lowest MOS score of any of its associated media flows. Voice media is scored with MOS-CQ, video media with MOS-V, and audio media with MOS-A.
The quality thresholds are as follows:
• <2.6 = Bad (displayed in Red)
Voice & Video dashboard 79

Chapter 4: Dashboards
ANYOP_UG.book Page 80 Friday, February 5, 2016 4:47 PM
• >=2.6 to <3.1 = Poor (displayed in Orange)
• >=3.1 to <3.6 = Fair (displayed in Yellow)
• >=3.6 = Good (displayed in Green)
Media flows with unsupported codecs are not included in the display since we cannot obtain MOS values for these calls. Additionally, the display reflects that same data present in the Calls and Media views, and therefore is affected by the 2000 call limit.
• Call Quality: This display shows a line graph of the quality for each codec in use over time. You can right-click inside the display to select a Line or Line/Points graph.
MOS scores are used for the quality measurement. Voice media shall be scored with MOS-CQ, video media with MOS-V, and audio media with MOS-A.
The quality for a time period shall be the average of the MOS scores for all open media flows for that time period. In addition, this graph will only display MOS scores for supported codecs as unsupported codecs do not provide MOS measurements.
• Call Volume: This display shows a graph of open calls (per codec) over time for voice and video calls. This graph reflects all calls from the Calls and Media view, and unlike the other graphs in the dashboard, the Call Volume graph includes data for calls using unsupported codecs. You can right-click inside the display to select an Area, Line, or Line/Points graph.
• Call Utilization: This display shows a graph of overall network utilization compared to network utilization by VoIP protocols. You can right-click inside the display to select an Area, Line, or Line/Points graph.
This graph displays two legends: Network Utilization and Call Utilization. Utilization values are displayed in Mbits/second. The VoIP utilization shall be the total utilization for all VoIP packets (i.e., signaling, media RTP/RTCP, and unsupported codecs).
Tip Several of the displays inside the Voice & Video dashboard support tooltips. Hover over the display to view a tooltip with additional information.
You can also access additional options for viewing each display by clicking the small arrow in the upper left corner of each display, or by right-clicking inside each display.
Compass dashboardThe Compass dashboard is an easy-to-use network monitoring tool for both wired and wire-less networks. It is an interactive forensics dashboard that displays network utilization over time including protocol, node, flow, channel, WLAN, VLAN, data rate, and application statis-
80 Compass dashboard

OmniPeek User Guide
ANYOP_UG.book Page 81 Friday, February 5, 2016 4:47 PM
tics. You can view these statistics from a real-time capture, from a single supported capture file, from a forensic search, or from multiple capture files (*.pkt, *.apc, *.pcap [Libpcap format only], *.wcap [Libpcap format only], *.cap [Libpcap format only], *.wpz, and *.pcapng) aggre-gated within the Compass workspace. The Compass dashboard provides network engineers with more visibility and insight into their networks.
Note For wired captures, the following statistic views will not be visible or available: Channels, WLAN, Data Rates. For wireless captures, the following statistic view will not be visible or available: VLAN.
The parts of the Compass dashboard are described below.
ChannelsProtocols
Network Utilization Graph
FlowsApplicationsWLAN
Expert Event View
Data RatesNodes
Compass dashboard 81

Chapter 4: Dashboards
ANYOP_UG.book Page 82 Friday, February 5, 2016 4:47 PM
Tip For local OmniPeek captures, you can use the vertical and horizontal splitters located between the displays to resize the displays.
• Network Utilization Graph: Displays two interactive timeline graphs that allow you to select and display a range of data. See Network utilization graph on page 83.
• Protocols: Displays a statistics chart window of protocol statistics for the selected area in the utilization graph at the top of the dashboard. See Protocols on page 92.
• Flows: Displays a statistics chart window of flow statistics for the selected area in the utilization graph at the top of the dashboard. See Flows on page 96.
• Nodes: Displays a statistics chart window of node statistics for the selected area in the utilization graph at the top of the dashboard. See Nodes on page 100.
• Channels: Displays a statistics chart window of channel statistics for the selected area in the utilization graph at the top of the dashboard. See Channels on page 103.
• WLAN: Displays a statistics chart window of WLAN statistics for the selected area in the utilization graph at the top of the dashboard. See WLAN on page 107.
• VLAN: Displays a statistics chart window of VLAN statistics for the selected area in the utilization graph at the top of the dashboard. See VLAN on page 110.
• Data Rates: Displays a statistics chart window of data rate statistics for the selected area in the utilization graph at the top of the dashboard. See Data rates on page 113.
• Applications: Displays a statistics chart window of application statistics for the selected area in the utilization graph at the top of the dashboard. See Applications on page 116.
Tip You can pin or unpin each of the statistics chart windows located below the network utilization graph in the Compass dashboard. When pinned, the statistic chart window is always displayed in the Compass dashboard. When unpinned, the statistic chart window is hidden and appears only as a small tab at the bottom of the Compass dashboard.
For local OmniPeek captures, to pin an unpinned statistic chart window, click the small tab; or hover over the small tab to display the window, and then click the pin/unpin (push-pin) icon in the upper right of the statistic chart window. To unpin a pinned statistic chart window, click the push-pin icon in the upper right of the window.
For Capture Engine captures, the small tab is used to toggle the pinned/unpinned status of the statistics chart windows. When the small tab is highlighted in orange, the statistics chart window is pinned. When the small tab is not highlighted, the statistics chart window is unpinned.
82 Compass dashboard
OmniPeek User Guide
ANYOP_UG.book Page 83 Friday, February 5, 2016 4:47 PM
Statistics chart windows are not updated when unpinned. You can increase application performance, by unpinning unnecessary statistics chart windows.
Note If you want CRC error packets included in Compass, you will need to enable the Accept CRC error packets option for Compass. See Compass Analysis on page 575.
Network utilization graph
The network utilization graph in the Compass dashboard consists of two interactive timeline graphs that allow you to view a specific area of interest. The top (larger) graph displays utiliza-tion over a selected time range, while the bottom graph displays utilization over the total time period.
You can zoom into or out of the selected time range so that granularity is in milliseconds, sec-onds, minutes, hours, or days (initially the time range adjusts accordingly depending on how large of a capture needs to be displayed) by using the Zoom In and Zoom Out buttons (not available in real-time captures).
As you change the selected time range, the statistics change accordingly to reflect the new period. See Compass dashboard viewing tips on page 90 for additional information on using your keyboard keys and mouse to navigate inside the network utilization graph.
Tip For best results, it is recommended to zoom in on a selected time range until you can see the details of the area of interest.
Network utilization graph 83
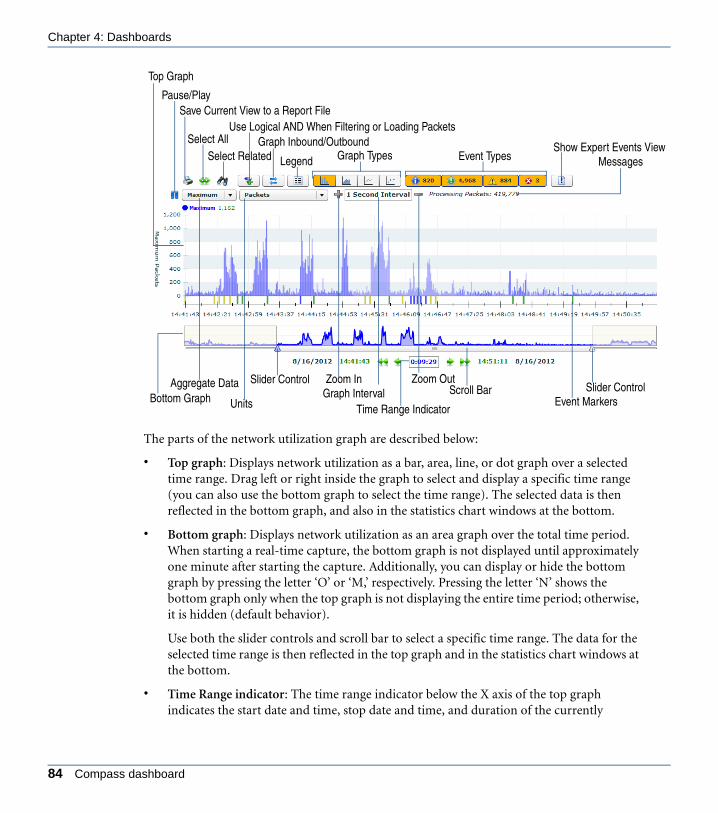
Chapter 4: Dashboards
ANYOP_UG.book Page 84 Friday, February 5, 2016 4:47 PM
The parts of the network utilization graph are described below:
• Top graph: Displays network utilization as a bar, area, line, or dot graph over a selected time range. Drag left or right inside the graph to select and display a specific time range (you can also use the bottom graph to select the time range). The selected data is then reflected in the bottom graph, and also in the statistics chart windows at the bottom.
• Bottom graph: Displays network utilization as an area graph over the total time period. When starting a real-time capture, the bottom graph is not displayed until approximately one minute after starting the capture. Additionally, you can display or hide the bottom graph by pressing the letter ‘O’ or ‘M,’ respectively. Pressing the letter ‘N’ shows the bottom graph only when the top graph is not displaying the entire time period; otherwise, it is hidden (default behavior).
Use both the slider controls and scroll bar to select a specific time range. The data for the selected time range is then reflected in the top graph and in the statistics chart windows at the bottom.
• Time Range indicator: The time range indicator below the X axis of the top graph indicates the start date and time, stop date and time, and duration of the currently
Bottom Graph
Top Graph
Scroll Bar
Select All
Zoom In Zoom Out
Select Related Graph TypesLegend
Slider ControlSlider Control
Time Range Indicator
Graph Inbound/Outbound
Save Current View to a Report FilePause/Play
Event Types
Event Markers
Aggregate Data
Units
Use Logical AND When Filtering or Loading Packets
Graph Interval
MessagesShow Expert Events View
84 Compass dashboard

OmniPeek User Guide
ANYOP_UG.book Page 85 Friday, February 5, 2016 4:47 PM
selected time range. Use the arrow controls to display the previous or next page, or to scroll left and right through the network utilization graph.
• Slider controls: The two slider controls allow you to widen and narrow the time range selected in the top and bottom graph. In a real-time capture, the slider controls work as follows:
• If the left and right sliders are pushed all the way to the left and right (respectively), new data is displayed on the right as it becomes available, and old data on the left remains. Thus, the duration of the selected time range continuously increases.
• If the left and right sliders are not pushed all the way to the left and right (respectively), new data is not displayed on the right as it becomes available, and old data on the left remains. Thus, the duration of the selected time range is maintained.
• If the left slider is pushed all the way to the left but the right slider is not pushed all the way to the right, new data is not displayed on the right as it becomes available, and old data on the left remains. Thus, the duration of the selected time range is maintained.
• If the left slider is not pushed all the way to the left but the right slider is pushed all the way to the right, new data is displayed on the right as it becomes available, and the old data is removed from the left. Thus, the duration of the selected time range is maintained.
• Scroll bar: The scroll bar allows you to scroll through the time range in the bottom graph.
• Save current view to a report file: (OmniPeek only) Saves the data currently displayed inside the Compass dashboard to an HTML report that can be viewed from inside a browser window, to multiple CSV files, or to a PDF file. See Save Compass dashboard as a report on page 132.
• Select all: Selects the entire time range. You can also press the 'A' keyboard key to select the entire time range, or double-click inside the top graph if the entire time range is not selected.
• Select related packets: Filters related packets of selected items from the statistics chart windows, and from the time range currently selected in the network utilization graph. You can also select related packets by right-clicking inside the top graph and selecting Select Related Packets. See also Select related packets in a single file or real-time capture on page 123 and Select related packets in a multiple file Compass workspace on page 131.
• Use logical AND when filtering: Toggles between AND or OR filtering logic when using either the Select related packets feature or loading packets in a Compass workspace. This feature only applies between different statistic views (multiple items selected within the statistic view will always use OR logic since AND logic will always nullify the entire expression).
Network utilization graph 85

Chapter 4: Dashboards
ANYOP_UG.book Page 86 Friday, February 5, 2016 4:47 PM
• Graph Inbound/Outbound: Enables or disables graphing of both the inbound and outbound utilization values for the selected statistics (except for flows). The outbound values appear as a slightly lighter color than the inbound values in both the graphs view and legend. Inbound and outbound values are not available for the 2-Way latency mode, Response Time mode, and Expert Events mode.
• Legend: Displays or hides a legend (which is hidden by default) of the graphed items. The values in the legend are displayed as a total, average, or maximum depending on what is selected in the Aggregate Data drop-down list. Use the check boxes to show or hide entries from the graphs. When the legend is hidden, legend entries appear above the top graph.
• Graph type: Displays the top graph as a bar, area, line, or dot graph. If a dot graph is selected, each item graphed cycles through the following shapes: circle, square, diamond, triangle, and plus sign (in this order).
Tip Pressing the Ctrl key while selecting a graph type allows you to effectively keep the graph type and data currently displayed, while changing the graph type for the next selected item. For example, if the Compass display is currently an area graph, you can display the current area graph and also a dot graph for a selected protocol. Simply press the Ctrl key while selecting the dot graph type, and then select the desired protocol from one of the protocol displays.
• Event type: Displays the total count of Expert events for each event severity. Selecting or deselecting an Event type will display or hide the associated Expert events in the Expert event view. If the Units are set to ‘Expert Events’ (Expert Event mode), the network utilization graph and the statistics chart windows will only display data that is related to the selected Event types.
Compass has a maximum amount of unique events of which it can keep track . When the number of unique events exceeds this limit, the incoming events will not be tracked until some of the tracked events are removed during a slice operation.
• Informational events: Click the blue event type to toggle the display of informational events.
• Minor events: Click the green event type to toggle the display of minor events.
• Major events: Click the yellow event type to toggle the display of major events.
• Severe events: Click the red event type to toggle the display of severe events.
Note If you deselect an Expert event type, any selected event types of that severity are deselected from the Expert event view and removed from the network utilization graph.
86 Compass dashboard
OmniPeek User Guide
ANYOP_UG.book Page 87 Friday, February 5, 2016 4:47 PM
• Show Expert event view: Displays or hides the Expert event view (hidden by default), which is a tabbed view of Expert events for the selected area in the utilization graph. Selecting an Expert event displays the event as a colored event marker (matching the severity color) above the X axis, at the graph point in which it occurred. A graph point can only have, at most, one event marker; however, the event marker may have multiple Expert events associated with it. The number of events associated with each event marker can be found by hovering the mouse over the event marker to display a tooltip listing all of the selected Expert events contained in that point along with a corresponding count. See Expert event view on page 119. See also Expert Analysis on page 229 for additional information about Expert events.
• Pause/Play (real-time capture only): Toggles between updating and not updating the graphs in real time.
• Aggregate Data drop-down list: Allows you to display the Y axis in the top and bottom graphs, statistics chart views, and legend as an aggregate of average, total, or maximum values:
• Average: In the top and bottom graphs, the average value for each time interval is graphed. In the various statistics chart views, the average value for the statistic over the selected time range is graphed. If Bits, Bytes, Mbits, Gbits, Packets, or Retransmission Rate is the selected unit type, then average calculations include non-values; otherwise, non-values are not included in the calculations. Average calculations for Bits, Bytes, Mbits, Gbits, Packets, Signal Strength %, Noise Level %, and Expert Events are rounded to the nearest whole number.
• Total: In the top and bottom graphs, the total value for each time interval is graphed. In the various statistics chart views, the total value for the statistic over the selected time range is graphed. If 2-Way Latency, Response Time, Signal Strength %, Signal Strength dBm, Noise Level %, Noise Level dBm, SNR, or Data Rate is the selected unit type, then Total values are unavailable.
• Maximum: In the top and bottom graphs, the maximum value for each time interval is graphed. In the various statistics chart views, the maximum value for the statistic over the selected time range is graphed.
• Units drop-down list: Allows you to set the unit type in the Y axis of the top and bottom graphs, statistics chart views, and legend. Depending on the packet type and how they are aggregated, the available unit types include:
• Bits. Displays byte count in bits.
• Bytes. Displays byte count in bytes.
• Mbits. Displays byte count in Mbits.
• Gbits. Displays byte count in Gbits.
Network utilization graph 87
Chapter 4: Dashboards
ANYOP_UG.book Page 88 Friday, February 5, 2016 4:47 PM
• Packets. Displays the packet count.
• 2-Way Latency. Displays 2-way latency. 2-way latency is the delta time between a request from the client, and a response from the server. For more information on 2-way latency, see Measuring latency on page 122.
• Response Time. Displays response time. Response time is the delta time between a request packet from the client, and a response packet with data from the server. For more information on response time, see Measuring latency on page 122.
• Signal Strength % (Wireless traffic only). Displays signal strength of the wireless data transmission, expressed as a percentage.
• Noise Level % (Wireless traffic only). Displays noise level reported of the wireless data transmission, expressed as a percentage.
• Signal Strength dBm (Wireless traffic only). Displays signal strength of the wireless data transmission, expressed in dBm (decibel-milliWatts).
• Noise Level dBm (Wireless traffic only). Displays noise level reported of the wireless data transmission, expressed in dBm (decibel milliWatts).
• SNR (Wireless traffic only). Displays Signal to Noise Ratio (SNR) of the wireless data transmission. Basically, it is a measure of signal strength relative to background noise.
• Data Rate (Wireless traffic only). Displays data rate of the wireless data transmission.
• Retransmission Rate (Wireless traffic only). Displays retransmission rate percentage of the wireless data transmission.
• Expert Events. Displays the total number of Expert events. Only the Expert events whose severity is enabled by the Event type buttons and are selected in the Expert event view are included in the count. If no Expert events are selected in the Expert event view, then all events whose severity is enabled by the Event type buttons are included.
Note Selecting a unit type of Mbits or Gbits, and also selecting an aggregate value of Average, displays data in the graphs, statistics chart views, and legend as a graph average, and not as the Average Utilization (bit/s). To see the Average Utilization (bit/s), click the Summary view under Statistics in the navigation pane of a capture window, and view the Network statistics.
• Zoom In: For selected time ranges of a certain length, Zoom In (+ sign) is enabled and allows you to zoom into the selected time range so that you can increase granularity in milliseconds, seconds, minutes, hours, and days. You can hover the mouse over Zoom In to display a tooltip that contains the maximum time range that can be zoomed into. Selecting a time range less than or equal to it will enable Zoom In. (See also Graph Interval
88 Compass dashboard
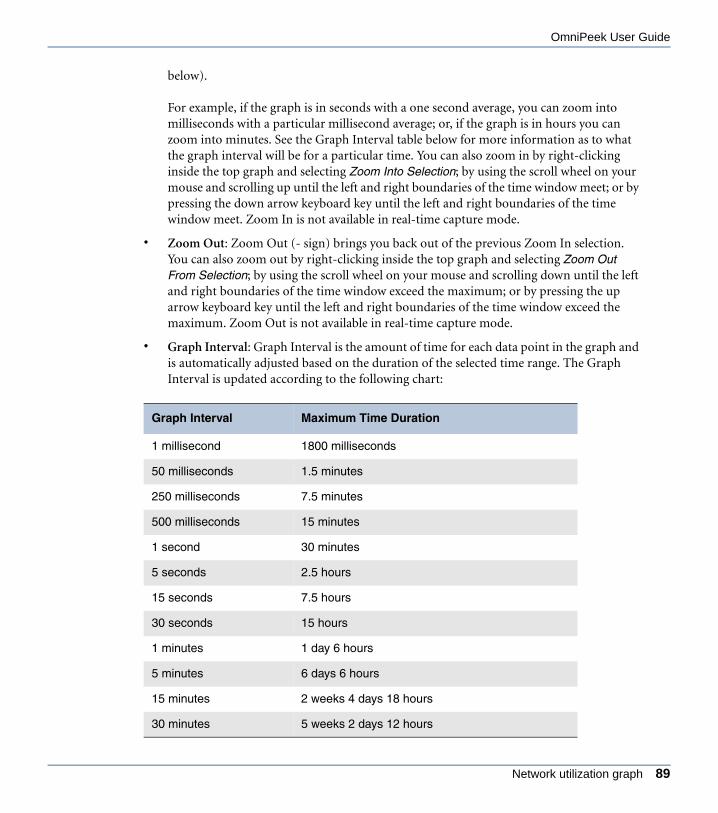
OmniPeek User Guide
ANYOP_UG.book Page 89 Friday, February 5, 2016 4:47 PM
below).
For example, if the graph is in seconds with a one second average, you can zoom into milliseconds with a particular millisecond average; or, if the graph is in hours you can zoom into minutes. See the Graph Interval table below for more information as to what the graph interval will be for a particular time. You can also zoom in by right-clicking inside the top graph and selecting Zoom Into Selection; by using the scroll wheel on your mouse and scrolling up until the left and right boundaries of the time window meet; or by pressing the down arrow keyboard key until the left and right boundaries of the time window meet. Zoom In is not available in real-time capture mode.
• Zoom Out: Zoom Out (- sign) brings you back out of the previous Zoom In selection. You can also zoom out by right-clicking inside the top graph and selecting Zoom Out From Selection; by using the scroll wheel on your mouse and scrolling down until the left and right boundaries of the time window exceed the maximum; or by pressing the up arrow keyboard key until the left and right boundaries of the time window exceed the maximum. Zoom Out is not available in real-time capture mode.
• Graph Interval: Graph Interval is the amount of time for each data point in the graph and is automatically adjusted based on the duration of the selected time range. The Graph Interval is updated according to the following chart:
Graph Interval Maximum Time Duration
1 millisecond 1800 milliseconds
50 milliseconds 1.5 minutes
250 milliseconds 7.5 minutes
500 milliseconds 15 minutes
1 second 30 minutes
5 seconds 2.5 hours
15 seconds 7.5 hours
30 seconds 15 hours
1 minutes 1 day 6 hours
5 minutes 6 days 6 hours
15 minutes 2 weeks 4 days 18 hours
30 minutes 5 weeks 2 days 12 hours
Network utilization graph 89

Chapter 4: Dashboards
ANYOP_UG.book Page 90 Friday, February 5, 2016 4:47 PM
Note The graph interval chart is also valid for determining the minimum and maximum ranges of time that can be zoomed into when viewing capture files. See also Zoom In above.
Additionally, millisecond graph intervals are not automatic and only occur during Zoom In and are not valid for live captures.
• Messages: Displays messages to the user. For example, when opening a packet file, a message is displayed to show the status of the packets as they are loading. The status only appears when loading packets, and goes away once the packets have finished loading in the Compass dashboard.
Another message that is displayed is when disk space is running low and Compass has been disabled to save disk space. Freeing up disk space causes the message to go away and re-enables Compass.
Compass dashboard viewing tips
Here are some useful tips when viewing the Compass dashboard:
• Use the following keyboard and mouse shortcuts to navigate inside the network utilization graph:
• Press the Left arrow key to move the graph one unit to the left.
• Press the Right arrow key to move the graph one unit to the right.
• Press the Ctrl+Left arrow key to move the graph one page to the left.
• Press the Ctrl+Right arrow key to move the graph one page to the right.
1 hour 10 weeks 5 days
6 hours 64 weeks 2 days
12 hours 128 weeks 4 days
1 day 357 weeks 1 day
2 days 514 weeks 2 days
4 days 1028 weeks 4 days
(doubles)... (doubles)...
Graph Interval Maximum Time Duration
90 Compass dashboard

OmniPeek User Guide
ANYOP_UG.book Page 91 Friday, February 5, 2016 4:47 PM
• Press the Home key to move the graph all the way to the left.
• Press the End key to move the graph all the way to the right.
• Press the Esc key while making a selection to cancel that selection.
• Press the ‘A’ key to select the entire graph (same as ‘Select All’).
• Press the ‘E’ key to show or hide the Expert event view.
• Press the ‘L’ key to show or hide the legend.
• Press the ‘M’ key to always hide the bottom graph.
• Press the ‘N’ key to automatically show or hide the bottom graph depending on the selection of time (the bottom graph will only appear if the entire range of time is not selected).
• Press the ‘O’ key to always show the bottom graph.
• Press the ‘R’ key to generate a Compass report based on the current view.
• Double-click an unselected area of the bottom graph to move the slider to that position.
• The mouse scroll wheel can be used to widen or narrow the time range of the graph. Pressing the CTRL key while using the mouse scroll wheel makes scrolling faster.
• Mouse over a data point to see details about that point in time.
• Double-clicking the top graph returns you to the most recent selection if the entire time range is displayed, or returns you to the entire time range if only a selection is displayed.
• Right-click inside the graph to see a list of additional commands/features
• Hovering over an Expert event marker displays the following event specifics in a tooltip:
• The date and time for the graph point where the Expert event(s) have occurred.
• A list of Expert event types with the associated count of occurrences for that point in the graph.
• Click the Expert event marker to keep the tooltip visible until the user clicks again anywhere in the graph or new data is added to the graph.
• If the unit type is set to Expert Events:
• The network utilization graph and statistics chart windows represent the Expert event severities that are enabled.
Compass dashboard viewing tips 91

Chapter 4: Dashboards
ANYOP_UG.book Page 92 Friday, February 5, 2016 4:47 PM
• If no Expert events are selected in the Expert event views, the network utilization graph represents all Expert events, and the statistics chart windows display all items that are associated with any Expert event.
• If any Expert events are selected in the Expert event views, the network utilization graph represents the selected events, and the statistics chart windows only display those items that are associated with the selected Expert events.
• You may only select a maximum combination of 10 statistical items (in the statistics chart windows) at one time.
• In the statistics list views, you can sort selected items by clicking above the check box column. This allows you to keep selected items together at either the top or bottom of the list views.
• If both the legend and the Expert event view are visible, the legend is displayed above the Expert event view (and their widths and heights can be modified via a thumb drag).
Compass dashboard limitations
Here are some limitations when viewing the Compass dashboard:
• A Compass dashboard has a limit of 1,000,000 statistic items (protocols, flows, nodes, channels, WLAN, VLAN, data rates, applications) per second.
• For real-time captures, the Compass dashboard shows only the latest four hours of data. Every 10 minutes after the four hour mark, Compass slices off the first 10 minutes of available data. To change the slicing value, see Compass Analysis on page 575.
• Compass expects to receive packets in ascending order—a packet received with a timestamp earlier than the previous packet is discarded.
• There must be at least 500MB of free disk space or Compass stops generating/saving statistic information until enough disk space is made available.
• For Capture Engine captures and forensic searches, Compass will not have access to a name table, so no features that require the name table are available.
Protocols
The protocols statistics chart window displays protocol statistics for the selected time range in the network utilization graph. You can view protocol statistics in a list view, pie chart, or bar chart by selecting the appropriate tab.
The list view, pie chart, and bar chart are always in sync. Enabling an item in one of the views will be reflected in all of the other protocol views. Right click inside the chart window to dis-play additional options for selecting protocols.
92 Compass dashboard
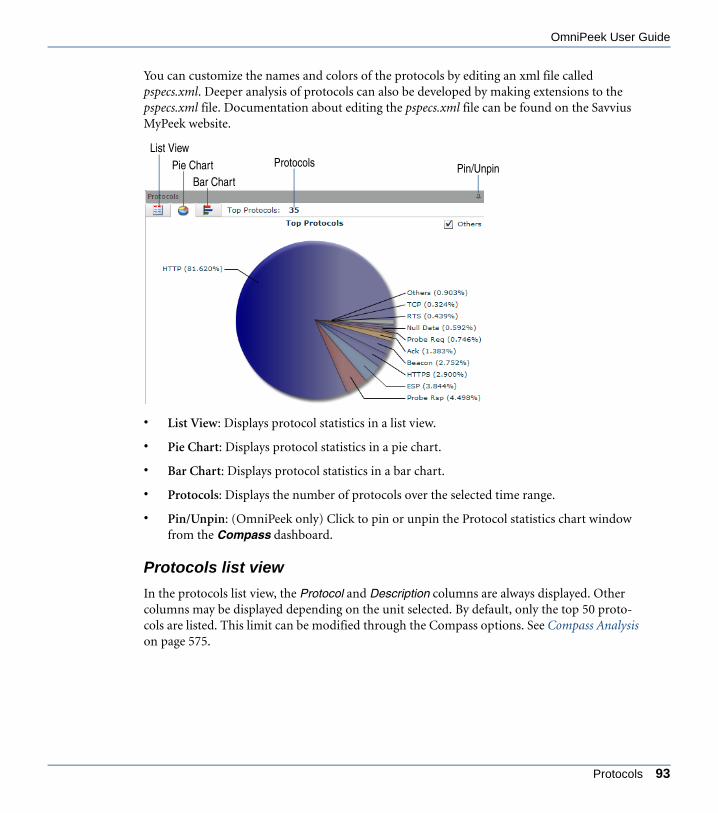
OmniPeek User Guide
ANYOP_UG.book Page 93 Friday, February 5, 2016 4:47 PM
You can customize the names and colors of the protocols by editing an xml file called pspecs.xml. Deeper analysis of protocols can also be developed by making extensions to the pspecs.xml file. Documentation about editing the pspecs.xml file can be found on the Savvius MyPeek website.
• List View: Displays protocol statistics in a list view.
• Pie Chart: Displays protocol statistics in a pie chart.
• Bar Chart: Displays protocol statistics in a bar chart.
• Protocols: Displays the number of protocols over the selected time range.
• Pin/Unpin: (OmniPeek only) Click to pin or unpin the Protocol statistics chart window from the Compass dashboard.
Protocols list view
In the protocols list view, the Protocol and Description columns are always displayed. Other columns may be displayed depending on the unit selected. By default, only the top 50 proto-cols are listed. This limit can be modified through the Compass options. See Compass Analysis on page 575.
List ViewPie Chart
Bar Chart
Protocols Pin/Unpin
Protocols 93

Chapter 4: Dashboards
ANYOP_UG.book Page 94 Friday, February 5, 2016 4:47 PM
In the protocols list view, you can:
• Click a column header to sort protocols in ascending or descending order.
• Drag a column header to a different location in the list view.
• Use the check boxes to enable or disable graphing of a specific protocol in the network utilization graph. Enabling a check box of a ‘top ten’ protocol ‘explodes’ the protocol from the top protocols pie chart, and also highlights the same protocol in the top protocols bar chart.
• Right click inside the list view to see additional options for selecting protocols.
Protocols pie chart
The protocols pie chart displays the top 10 protocols, with all other protocols grouped as ‘Oth-ers.’
94 Compass dashboard

OmniPeek User Guide
ANYOP_UG.book Page 95 Friday, February 5, 2016 4:47 PM
In the protocols pie chart, you can:
• Click a slice inside the pie chart to enable or disable graphing of a specific protocol in the network utilization graph. Additionally, clicking a slice (except for Others) ‘highlights’ the protocol in the bar chart, and also selects the check box of the same protocol in the list view.
• Mouse over a protocol to see details about the protocol.
• Select or clear the ‘Others’ check box to show or hide ‘Others’ from the pie chart.
• Right click inside the pie chart to see additional options for selecting protocols.
Protocols bar chart
The protocols bar chart displays the top 10 protocols, with all other protocols grouped as ‘Others.’
Protocols 95
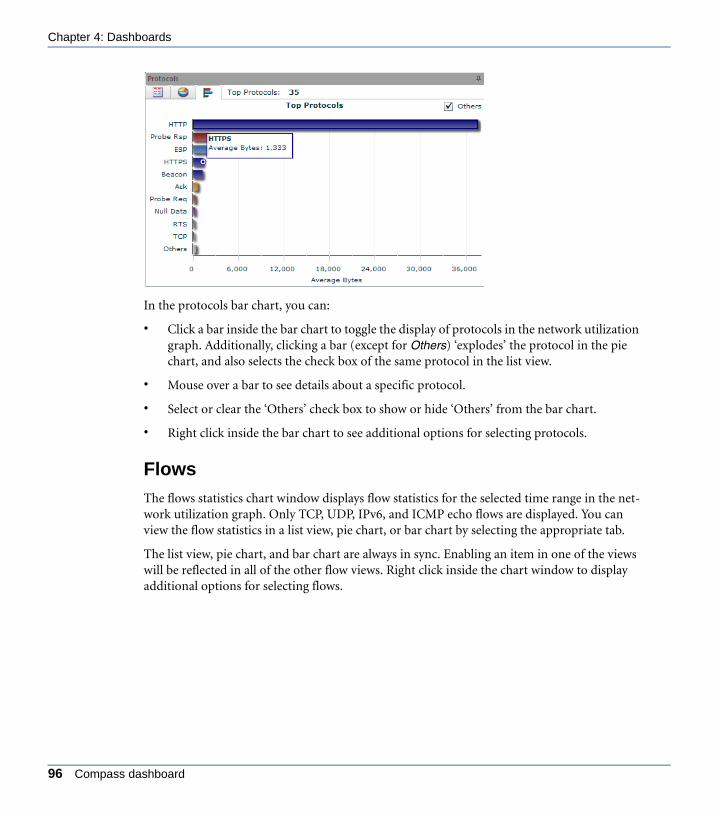
Chapter 4: Dashboards
ANYOP_UG.book Page 96 Friday, February 5, 2016 4:47 PM
In the protocols bar chart, you can:
• Click a bar inside the bar chart to toggle the display of protocols in the network utilization graph. Additionally, clicking a bar (except for Others) ‘explodes’ the protocol in the pie chart, and also selects the check box of the same protocol in the list view.
• Mouse over a bar to see details about a specific protocol.
• Select or clear the ‘Others’ check box to show or hide ‘Others’ from the bar chart.
• Right click inside the bar chart to see additional options for selecting protocols.
Flows
The flows statistics chart window displays flow statistics for the selected time range in the net-work utilization graph. Only TCP, UDP, IPv6, and ICMP echo flows are displayed. You can view the flow statistics in a list view, pie chart, or bar chart by selecting the appropriate tab.
The list view, pie chart, and bar chart are always in sync. Enabling an item in one of the views will be reflected in all of the other flow views. Right click inside the chart window to display additional options for selecting flows.
96 Compass dashboard

OmniPeek User Guide
ANYOP_UG.book Page 97 Friday, February 5, 2016 4:47 PM
• List View: Displays flow statistics in a list view.
• Pie Chart: Displays flow statistics in a pie chart.
• Bar Chart: Displays flow statistics in a bar chart.
• Flows: Displays the number of flows over the selected time range.
• Pin/Unpin: (OmniPeek only) Click to pin or unpin the Flows statistics chart window from the Compass dashboard.
Flows list view
In the flows list view, the Client Address, Client Port, Server Address, Server Port columns are always displayed. Other columns may be displayed depending on the unit selected. By default, only the top 50 flows are listed. This limit can be modified through the Compass options. See Compass Analysis on page 575.
List ViewPie Chart
Bar Chart
FlowsPin/Unpin
Flows 97

Chapter 4: Dashboards
ANYOP_UG.book Page 98 Friday, February 5, 2016 4:47 PM
In the flows list view, you can:
• Click a column header to sort flows in ascending or descending order.
• Drag a column header to a different location in the list view.
• Use the check boxes to enable or disable graphing of a specific flow in the network utilization graph. Enabling a check box of a ‘top ten’ flow ‘explodes’ the flow from the top flows pie chart, and also highlights the same flow in the top flows bar chart.
• Right click inside the list view to see additional options for selecting flows.
Flows pie chart
The flows pie chart displays the top 10 flows, with all other flows grouped as ‘Others.’
98 Compass dashboard

OmniPeek User Guide
ANYOP_UG.book Page 99 Friday, February 5, 2016 4:47 PM
In the flows pie chart, you can:
• Click a slice inside the pie chart to enable or disable graphing of a specific flow in the network utilization graph. Additionally, clicking a slice (except for Others) ‘highlights’ the flow in the bar chart, and also selects the check box of the same flow in the list view.
• Mouse over a flow to see details about the flow.
• Select or clear the ‘Others’ check box to show or hide ‘Others’ from the pie chart.
• Right click inside the pie chart to see additional options for selecting flows.
Flows bar chart
The flows bar chart displays the top 10 flows, with all other flows grouped as ‘Others.’
In the flows bar chart, you can:
• Click a bar inside the bar chart to toggle the display of flows in the network utilization graph. Additionally, clicking a bar (except for Others) ‘explodes’ the flow in the pie chart, and also selects the check box of the same flow in the list view.
• Mouse over a bar to see details about a specific flow.
• Select or clear the ‘Others’ check box to show or hide ‘Others’ from the bar chart.
• Right click inside the bar chart to see additional options for selecting flows.
Flows 99

Chapter 4: Dashboards
ANYOP_UG.book Page 100 Friday, February 5, 2016 4:47 PM
Nodes
The nodes statistics chart window displays the node statistics for the selected time range in the network utilization graph. You can view node statistics in a list view, pie chart, or bar chart by selecting the appropriate tab.
The list view, pie chart, and bar chart are always in sync. Enabling an item in one of the views will be reflected in all of the other node views. Right click inside the chart window to display additional options for selecting nodes.
The names and colors of the nodes comes from entries found in the name table. If an entry is not found for a node, then a color is chosen at random. For Capture Engine captures, the name table is not available.
• List View: Displays node statistics in a list view.
• Pie Chart: Displays node statistics in a pie chart.
• Bar Chart: Displays node statistics in a bar chart.
• Nodes: Displays the number of nodes over the selected time range.
• Pin/Unpin: (OmniPeek only) Click to pin or unpin the nodes statistics chart window from the Compass dashboard.
List View
Pie ChartBar Chart
NodesPin/Unpin
100 Compass dashboard

OmniPeek User Guide
ANYOP_UG.book Page 101 Friday, February 5, 2016 4:47 PM
Nodes list view
In the nodes list view, the Node and MAC columns are always displayed. Additional columns may be displayed depending on the unit selected. By default, only the top 50 nodes are listed. This limit can be modified through the Compass options. See Compass Analysis on page 575.
In the nodes list view, you can:
• Click a column header to sort nodes in ascending or descending order.
• Drag a column header to a different location in the list view.
• Use the check boxes to enable or disable graphing of a specific node in the network utilization graph. Enabling a check box of a ‘top ten’ node ‘explodes’ the node from the top nodes pie chart, and also highlights the same node in the top nodes bar chart.
• Right click inside the list view to see additional options for selecting nodes.
Nodes pie chart
The nodes pie chart displays the top 10 nodes, with all other nodes grouped as ‘Others.’
Nodes 101

Chapter 4: Dashboards
ANYOP_UG.book Page 102 Friday, February 5, 2016 4:47 PM
In the nodes pie chart, you can:
• Click a slice inside the pie chart to enable or disable graphing of a specific node in the network utilization graph. Additionally, clicking a slice (except for Others) ‘highlights’ the node in the bar chart, and also selects the check box of the same node in the list view.
• Mouse over a node to see details about the node.
• Select or clear the ‘Others’ check box to show or hide ‘Others’ from the pie chart.
• Right click inside the pie chart to see additional options for selecting nodes.
Nodes bar chart
The nodes bar chart displays the top 10 nodes, with all other nodes grouped as ‘Others.’
102 Compass dashboard

OmniPeek User Guide
ANYOP_UG.book Page 103 Friday, February 5, 2016 4:47 PM
In the nodes bar chart, you can:
• Click a bar inside the bar chart to toggle the display of nodes in the network utilization graph. Additionally, clicking a bar (except for Others) ‘explodes’ the node in the pie chart, and also selects the check box of the same node in the list view.
• Mouse over a bar to see details about a specific node.
• Select or clear the ‘Others’ check box to show or hide ‘Others’ from the bar chart.
• Right click inside the bar chart to see additional options for selecting nodes.
Channels
The channels statistics chart window displays channel statistics for the selected time range in the network utilization graph. You can view the channel statistics in a list view, pie chart, or bar chart by selecting the appropriate tab.
The list view, pie chart, and bar chart are always in sync. Enabling an item in one of the views will be reflected in all of the other channel views. Right click inside the chart window to display additional options for selecting channels.
Channels 103

Chapter 4: Dashboards
ANYOP_UG.book Page 104 Friday, February 5, 2016 4:47 PM
• List View: Displays the top channels as a list view.
• Pie Chart: Displays the top channels as a pie chart.
• Bar Chart: Displays the top channels as a bar chart.
• Channels: Displays the number of channels over the selected time range.
• Pin/Unpin: (OmniPeek only) Click to pin or unpin the channels statistics chart window from the Compass dashboard.
Channels list view
In the channels list view, the Channel column is always displayed. Additional columns may be displayed depending on the unit selected. By default, only the top 50 channels are listed. This limit can be modified through the Compass options. See Compass Analysis on page 575.
List ViewPie Chart
Bar Chart
ChannelsPin/Unpin
104 Compass dashboard

OmniPeek User Guide
ANYOP_UG.book Page 105 Friday, February 5, 2016 4:47 PM
In the channels list view, you can:
• Click a column header to sort channels in ascending or descending order.
• Drag a column header to a different location in the list view.
• Use the check boxes to enable or disable graphing of a specific channel in the network utilization graph. Enabling a check box of a ‘top ten’ channel ‘explodes’ the channel from the top channels pie chart, and also highlights the same channel in the top channels bar chart.
• Right click inside the list view to see additional options for selecting channels.
Channels pie chart
The channels pie chart displays the top 10 channels, with all other channels grouped as ‘Oth-ers.’
Channels 105

Chapter 4: Dashboards
ANYOP_UG.book Page 106 Friday, February 5, 2016 4:47 PM
In the channels pie chart, you can:
• Click a slice inside the pie chart to enable or disable graphing of a specific channel in the network utilization graph. Additionally, clicking a slice (except for Others) ‘highlights’ the channel in the bar chart, and also selects the check box of the same channel in the list view.
• Mouse over a channel to see details about the channel.
• Select or clear the ‘Others’ check box to show or hide ‘Others’ from the pie chart.
• Right click inside the pie chart to see additional options for selecting channels.
Channels bar chart
The channels bar chart displays the top 10 channels, with all other channels grouped as ‘Oth-ers.’
In the channels bar chart, you can:
• Click a bar inside the bar chart to toggle the display of channels in the network utilization graph. Additionally, clicking a bar (except for Others) ‘explodes’ the channel in the pie chart, and also selects the check box of the same channel in the list view.
• Mouse over a bar to see details about a specific channel.
• Select or clear the ‘Others’ check box to show or hide ‘Others’ from the bar chart.
• Right click inside the bar chart to see additional options for selecting channels.
106 Compass dashboard

OmniPeek User Guide
ANYOP_UG.book Page 107 Friday, February 5, 2016 4:47 PM
WLAN
The WLAN statistics chart window displays WLAN statistics (by network name) for the selected time range in the network utilization graph. You can view WLAN statistics in a list view, pie chart, or bar chart by selecting the appropriate tab.
The list view, pie chart, and bar chart are always in sync. Enabling an item in one of the views will be reflected in all of the other WLAN views. Right click inside the chart window to display additional options for selecting WLAN statistics.
Network names are calculated as follows:
• Network names are taken from Beacon and Probe Response packets
• Each BSSID is entirely associated with the most recently seen network name
• Network names that are all 0 are classified as ‘ESSID Unknown’ network names
• ‘ESSID Unknown’ network name will not override known network names
• List View: Displays the top WLAN statistics as a list view.
• Pie Chart: Displays the top WLAN statistics as a pie chart.
• Bar Chart: Displays the top WLAN statistics as a bar chart.
• WLAN: Displays the number of WLAN statistics over the selected time range.
• Pin/Unpin: (OmniPeek only) Click to pin or unpin the WLAN statistics chart window from the Compass dashboard.
List View
Pie ChartBar Chart
WLANPin/Unpin
WLAN 107

Chapter 4: Dashboards
ANYOP_UG.book Page 108 Friday, February 5, 2016 4:47 PM
WLAN list view
In the WLAN list view, the Network Name column is always displayed. Additional columns may be displayed depending on the unit selected. By default, only the top 50 network names are listed. This limit can be modified through the Compass options. See Compass Analysis on page 575.
In the WLAN list view, you can:
• Click a column header to sort WLANs in ascending or descending order.
• Drag a column header to a different location in the list view.
• Use the check boxes to enable or disable graphing of a specific WLAN in the network utilization graph. Enabling a check box of a ‘top ten’ WLAN ‘explodes’ the WLAN from the top WLAN pie chart, and also highlights the same WLAN in the top WLAN bar chart.
• Right click inside the list view to see additional options for selecting WLANs.
WLAN pie chart
The WLAN pie chart displays the top 10 WLANs, with all other WLANs grouped as ‘Others.’
108 Compass dashboard

OmniPeek User Guide
ANYOP_UG.book Page 109 Friday, February 5, 2016 4:47 PM
In the WLAN pie chart, you can:
• Click a slice inside the pie chart to enable or disable graphing of a specific WLAN in the network utilization graph. Additionally, clicking a slice (except for Others) ‘highlights’ the WLAN in the bar chart, and also selects the check box of the same WLAN in the list view.
• Mouse over a WLAN to see details about the WLAN.
• Select or clear the ‘Others’ check box to show or hide ‘Others’ from the pie chart.
• Right click inside the pie chart to see additional options for selecting WLANs.
WLAN bar chart
The WLAN bar chart displays the top 10 WLANs, with all other WLANs grouped as ‘Others.’
In the WLAN bar chart, you can:
WLAN 109
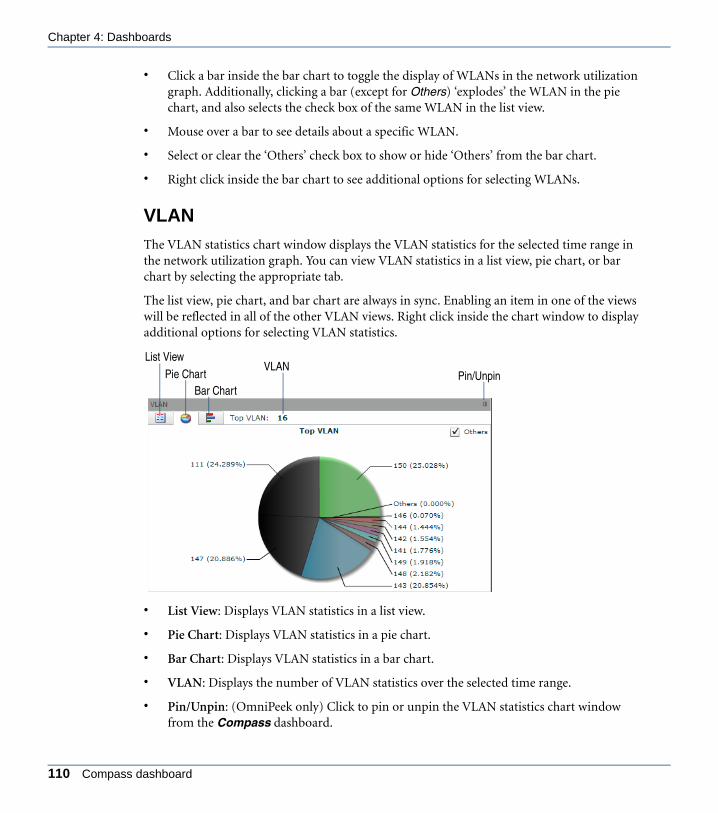
Chapter 4: Dashboards
ANYOP_UG.book Page 110 Friday, February 5, 2016 4:47 PM
• Click a bar inside the bar chart to toggle the display of WLANs in the network utilization graph. Additionally, clicking a bar (except for Others) ‘explodes’ the WLAN in the pie chart, and also selects the check box of the same WLAN in the list view.
• Mouse over a bar to see details about a specific WLAN.
• Select or clear the ‘Others’ check box to show or hide ‘Others’ from the bar chart.
• Right click inside the bar chart to see additional options for selecting WLANs.
VLAN
The VLAN statistics chart window displays the VLAN statistics for the selected time range in the network utilization graph. You can view VLAN statistics in a list view, pie chart, or bar chart by selecting the appropriate tab.
The list view, pie chart, and bar chart are always in sync. Enabling an item in one of the views will be reflected in all of the other VLAN views. Right click inside the chart window to display additional options for selecting VLAN statistics.
• List View: Displays VLAN statistics in a list view.
• Pie Chart: Displays VLAN statistics in a pie chart.
• Bar Chart: Displays VLAN statistics in a bar chart.
• VLAN: Displays the number of VLAN statistics over the selected time range.
• Pin/Unpin: (OmniPeek only) Click to pin or unpin the VLAN statistics chart window from the Compass dashboard.
List View
Pie ChartBar Chart
VLANPin/Unpin
110 Compass dashboard

OmniPeek User Guide
ANYOP_UG.book Page 111 Friday, February 5, 2016 4:47 PM
VLAN list view
In the VLAN list view, the VLANID column is always displayed. Additional columns may be displayed depending on the unit selected. By default, only the top 50 VLANs are listed. This limit can be modified through the Compass options. See Compass Analysis on page 575.
In the VLAN list view, you can:
• Click a column header to sort VLANs in ascending or descending order.
• Drag a column header to a different location in the list view.
• Use the check boxes to enable or disable graphing of a specific VLAN in the network utilization graph. Enabling a check box of a ‘top ten’ VLAN ‘explodes’ the VLAN from the top VLAN pie chart, and also highlights the same VLAN in the top channels bar chart.
• Right click inside the list view to see additional options for selecting VLANs.
VLAN pie chart
The VLAN pie chart displays the top 10 VLANs, with all other VLANs grouped as ‘Others.’
VLAN 111

Chapter 4: Dashboards
ANYOP_UG.book Page 112 Friday, February 5, 2016 4:47 PM
In the VLAN pie chart, you can:
• Click a slice inside the pie chart to enable or disable graphing of a specific VLAN in the network utilization graph. Additionally, clicking a slice (except for Others) ‘highlights’ the VLAN in the bar chart, and also selects the check box of the same VLAN in the list view.
• Mouse over a VLAN to see details about the VLAN.
• Select or clear the ‘Others’ check box to show or hide ‘Others’ from the pie chart.
• Right click inside the pie chart to see additional options for selecting VLANs.
VLAN bar chart
The VLAN bar chart displays the top 10 VLANs, with all other VLANs grouped as ‘Others.’
In the VLAN bar chart, you can:
112 Compass dashboard
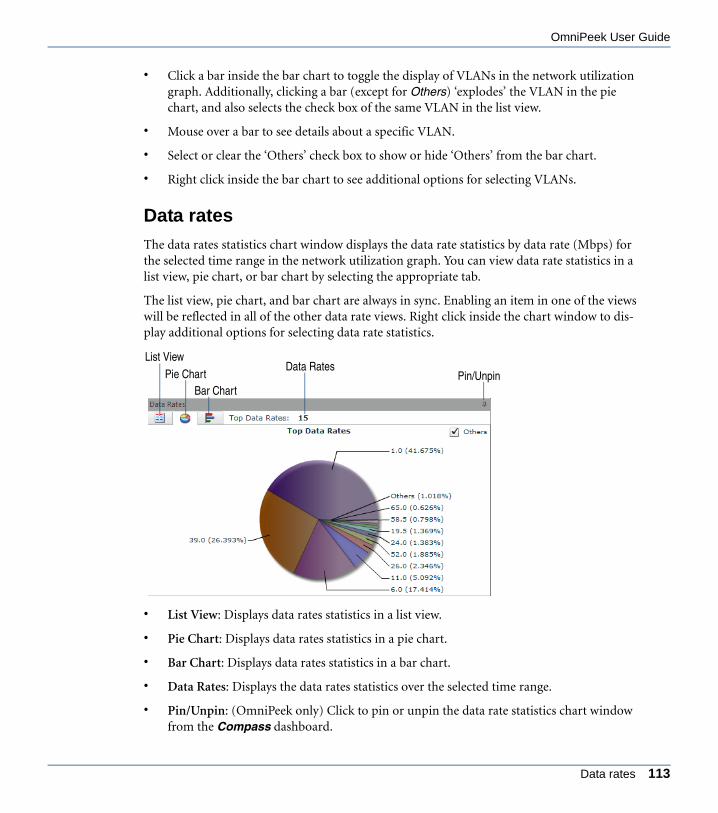
OmniPeek User Guide
ANYOP_UG.book Page 113 Friday, February 5, 2016 4:47 PM
• Click a bar inside the bar chart to toggle the display of VLANs in the network utilization graph. Additionally, clicking a bar (except for Others) ‘explodes’ the VLAN in the pie chart, and also selects the check box of the same VLAN in the list view.
• Mouse over a bar to see details about a specific VLAN.
• Select or clear the ‘Others’ check box to show or hide ‘Others’ from the bar chart.
• Right click inside the bar chart to see additional options for selecting VLANs.
Data rates
The data rates statistics chart window displays the data rate statistics by data rate (Mbps) for the selected time range in the network utilization graph. You can view data rate statistics in a list view, pie chart, or bar chart by selecting the appropriate tab.
The list view, pie chart, and bar chart are always in sync. Enabling an item in one of the views will be reflected in all of the other data rate views. Right click inside the chart window to dis-play additional options for selecting data rate statistics.
• List View: Displays data rates statistics in a list view.
• Pie Chart: Displays data rates statistics in a pie chart.
• Bar Chart: Displays data rates statistics in a bar chart.
• Data Rates: Displays the data rates statistics over the selected time range.
• Pin/Unpin: (OmniPeek only) Click to pin or unpin the data rate statistics chart window from the Compass dashboard.
List View
Pie ChartBar Chart
Data RatesPin/Unpin
Data rates 113
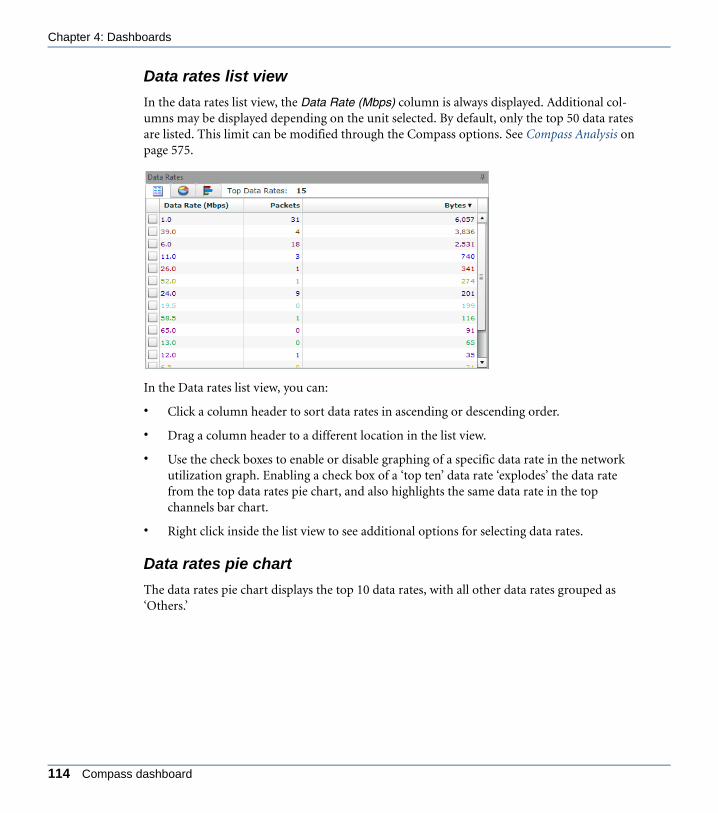
Chapter 4: Dashboards
ANYOP_UG.book Page 114 Friday, February 5, 2016 4:47 PM
Data rates list view
In the data rates list view, the Data Rate (Mbps) column is always displayed. Additional col-umns may be displayed depending on the unit selected. By default, only the top 50 data rates are listed. This limit can be modified through the Compass options. See Compass Analysis on page 575.
In the Data rates list view, you can:
• Click a column header to sort data rates in ascending or descending order.
• Drag a column header to a different location in the list view.
• Use the check boxes to enable or disable graphing of a specific data rate in the network utilization graph. Enabling a check box of a ‘top ten’ data rate ‘explodes’ the data rate from the top data rates pie chart, and also highlights the same data rate in the top channels bar chart.
• Right click inside the list view to see additional options for selecting data rates.
Data rates pie chart
The data rates pie chart displays the top 10 data rates, with all other data rates grouped as ‘Others.’
114 Compass dashboard

OmniPeek User Guide
ANYOP_UG.book Page 115 Friday, February 5, 2016 4:47 PM
In the data rates pie chart, you can:
• Click a slice inside the pie chart to enable or disable graphing of a specific data rate in the network utilization graph. Additionally, clicking a slice (except for Others) ‘highlights’ the data rate in the bar chart, and also selects the check box of the same data rate in the list view.
• Mouse over a data rate to see details about the data rate.
• Select or clear the ‘Others’ check box to show or hide ‘Others’ from the pie chart.
• Right click inside the pie chart to see additional options for selecting data rates.
Data rates bar chart
The data rates bar chart displays the top 10 data rates, with all other data rates grouped as ‘Others.’
Data rates 115
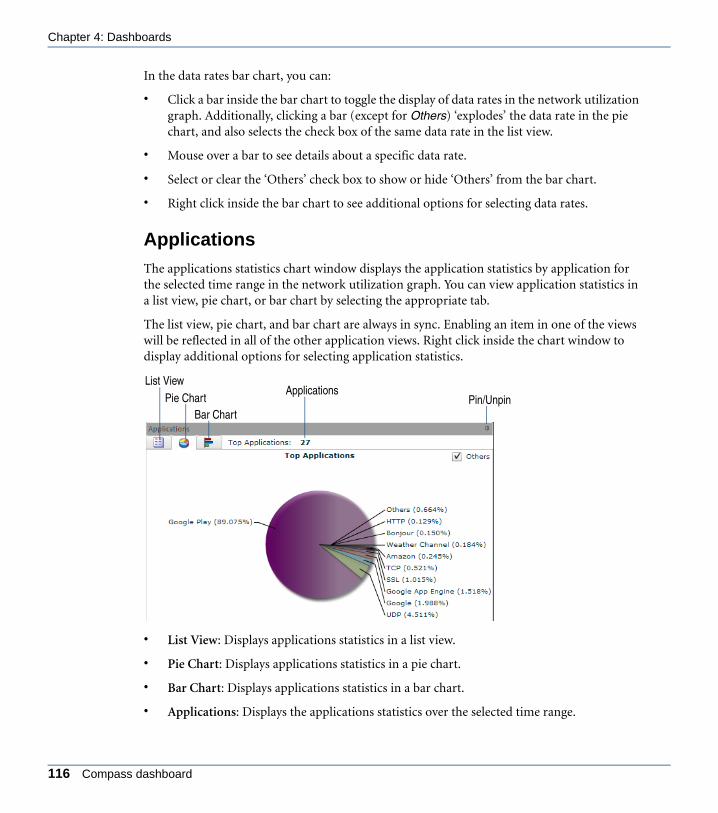
Chapter 4: Dashboards
ANYOP_UG.book Page 116 Friday, February 5, 2016 4:47 PM
In the data rates bar chart, you can:
• Click a bar inside the bar chart to toggle the display of data rates in the network utilization graph. Additionally, clicking a bar (except for Others) ‘explodes’ the data rate in the pie chart, and also selects the check box of the same data rate in the list view.
• Mouse over a bar to see details about a specific data rate.
• Select or clear the ‘Others’ check box to show or hide ‘Others’ from the bar chart.
• Right click inside the bar chart to see additional options for selecting data rates.
Applications
The applications statistics chart window displays the application statistics by application for the selected time range in the network utilization graph. You can view application statistics in a list view, pie chart, or bar chart by selecting the appropriate tab.
The list view, pie chart, and bar chart are always in sync. Enabling an item in one of the views will be reflected in all of the other application views. Right click inside the chart window to display additional options for selecting application statistics.
• List View: Displays applications statistics in a list view.
• Pie Chart: Displays applications statistics in a pie chart.
• Bar Chart: Displays applications statistics in a bar chart.
• Applications: Displays the applications statistics over the selected time range.
List View
Pie ChartBar Chart
ApplicationsPin/Unpin
116 Compass dashboard

OmniPeek User Guide
ANYOP_UG.book Page 117 Friday, February 5, 2016 4:47 PM
• Pin/Unpin: (OmniPeek only) Click to pin or unpin the application statistics chart window from the Compass dashboard.
Applications list view
In the applications list view, the Application column is always displayed. Additional columns may be displayed depending on the unit selected. By default, only the top 50 applications are listed. This limit can be modified through the Compass options. See Compass Analysis on page 575.
In the applications list view, you can:
• Click a column header to sort applications in ascending or descending order.
• Drag a column header to a different location in the list view.
• Use the check boxes to enable or disable graphing of a specific application in the network utilization graph. Enabling a check box of a ‘top ten’ application ‘explodes’ the application from the top applications pie chart, and also highlights the same application in the top channels bar chart.
• Right click inside the list view to see additional options for selecting applications.
Applications pie chart
The applications pie chart displays the top 10 applications, with all other applications grouped as ‘Others.’
Applications 117

Chapter 4: Dashboards
ANYOP_UG.book Page 118 Friday, February 5, 2016 4:47 PM
In the applications pie chart, you can:
• Click a slice inside the pie chart to enable or disable graphing of a specific application in the network utilization graph. Additionally, clicking a slice (except for Others) ‘highlights’ the application in the bar chart, and also selects the check box of the same application in the list view.
• Mouse over a application to see details about the application.
• Select or clear the ‘Others’ check box to show or hide ‘Others’ from the pie chart.
• Right click inside the pie chart to see additional options for selecting applications.
Applications bar chart
The applications bar chart displays the top 10 applications, with all other applications grouped as ‘Others.’
118 Compass dashboard
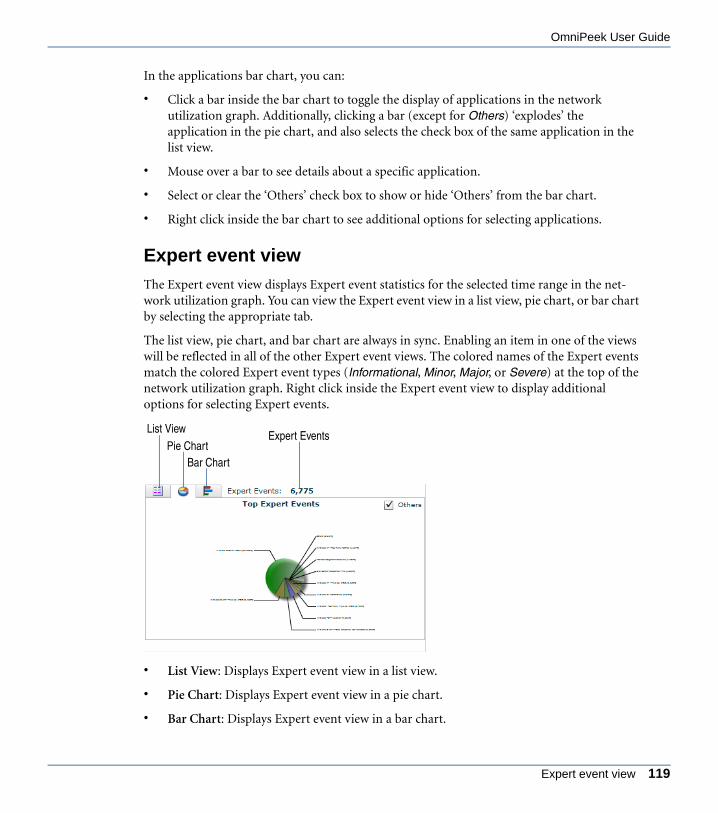
OmniPeek User Guide
ANYOP_UG.book Page 119 Friday, February 5, 2016 4:47 PM
In the applications bar chart, you can:
• Click a bar inside the bar chart to toggle the display of applications in the network utilization graph. Additionally, clicking a bar (except for Others) ‘explodes’ the application in the pie chart, and also selects the check box of the same application in the list view.
• Mouse over a bar to see details about a specific application.
• Select or clear the ‘Others’ check box to show or hide ‘Others’ from the bar chart.
• Right click inside the bar chart to see additional options for selecting applications.
Expert event view
The Expert event view displays Expert event statistics for the selected time range in the net-work utilization graph. You can view the Expert event view in a list view, pie chart, or bar chart by selecting the appropriate tab.
The list view, pie chart, and bar chart are always in sync. Enabling an item in one of the views will be reflected in all of the other Expert event views. The colored names of the Expert events match the colored Expert event types (Informational, Minor, Major, or Severe) at the top of the network utilization graph. Right click inside the Expert event view to display additional options for selecting Expert events.
• List View: Displays Expert event view in a list view.
• Pie Chart: Displays Expert event view in a pie chart.
• Bar Chart: Displays Expert event view in a bar chart.
List View
Pie ChartBar Chart
Expert Events
Expert event view 119
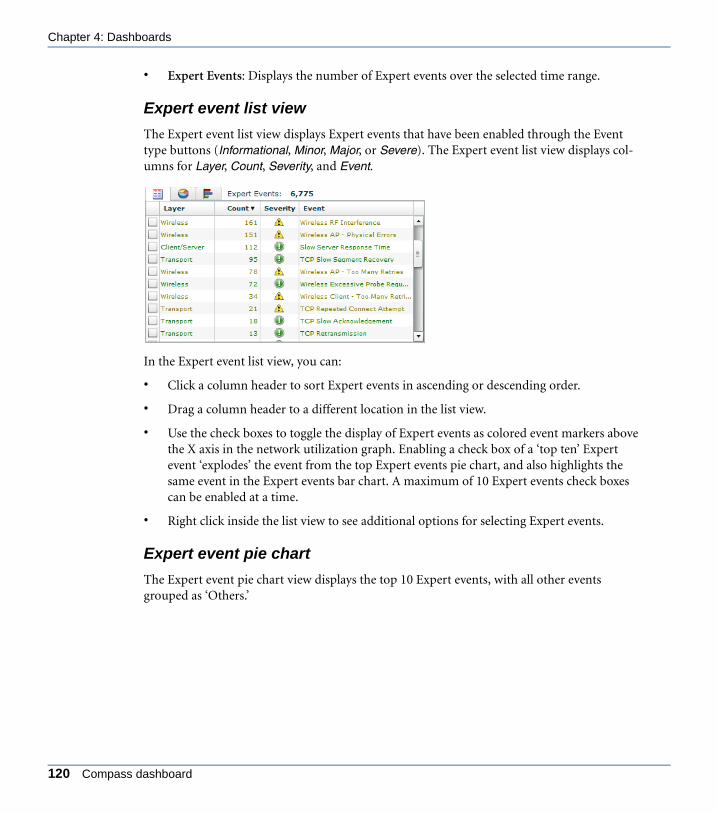
Chapter 4: Dashboards
ANYOP_UG.book Page 120 Friday, February 5, 2016 4:47 PM
• Expert Events: Displays the number of Expert events over the selected time range.
Expert event list view
The Expert event list view displays Expert events that have been enabled through the Event type buttons (Informational, Minor, Major, or Severe). The Expert event list view displays col-umns for Layer, Count, Severity, and Event.
In the Expert event list view, you can:
• Click a column header to sort Expert events in ascending or descending order.
• Drag a column header to a different location in the list view.
• Use the check boxes to toggle the display of Expert events as colored event markers above the X axis in the network utilization graph. Enabling a check box of a ‘top ten’ Expert event ‘explodes’ the event from the top Expert events pie chart, and also highlights the same event in the Expert events bar chart. A maximum of 10 Expert events check boxes can be enabled at a time.
• Right click inside the list view to see additional options for selecting Expert events.
Expert event pie chart
The Expert event pie chart view displays the top 10 Expert events, with all other events grouped as ‘Others.’
120 Compass dashboard
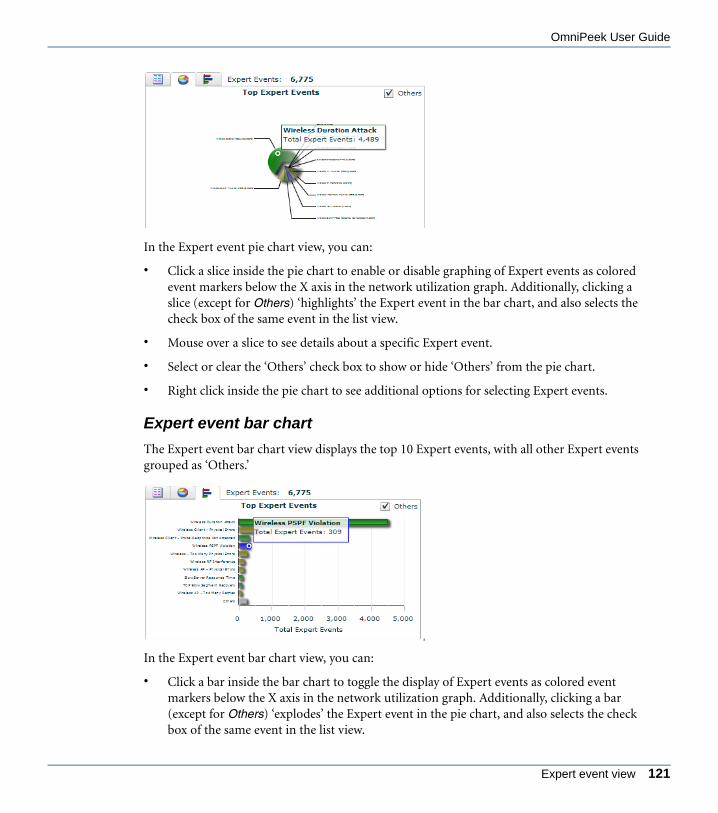
OmniPeek User Guide
ANYOP_UG.book Page 121 Friday, February 5, 2016 4:47 PM
In the Expert event pie chart view, you can:
• Click a slice inside the pie chart to enable or disable graphing of Expert events as colored event markers below the X axis in the network utilization graph. Additionally, clicking a slice (except for Others) ‘highlights’ the Expert event in the bar chart, and also selects the check box of the same event in the list view.
• Mouse over a slice to see details about a specific Expert event.
• Select or clear the ‘Others’ check box to show or hide ‘Others’ from the pie chart.
• Right click inside the pie chart to see additional options for selecting Expert events.
Expert event bar chart
The Expert event bar chart view displays the top 10 Expert events, with all other Expert events grouped as ‘Others.’
s
In the Expert event bar chart view, you can:
• Click a bar inside the bar chart to toggle the display of Expert events as colored event markers below the X axis in the network utilization graph. Additionally, clicking a bar (except for Others) ‘explodes’ the Expert event in the pie chart, and also selects the check box of the same event in the list view.
Expert event view 121

Chapter 4: Dashboards
ANYOP_UG.book Page 122 Friday, February 5, 2016 4:47 PM
• Mouse over a bar to see details about a specific Expert event.
• Select or clear the ‘Others’ check box to show or hide ‘Others’ from the bar chart.
• Right click inside the bar chart to see additional options for selecting Expert events.
Measuring latency
You can select the 2-way latency and response time settings from the Units drop-down list. Here are descriptions of how these settings work in Compass:
2-way latency
• 2-way latency is only calculated for TCP flows. All other flows will show 2-way latency as 0.
• 2-way network latency is the delta time between a request packet from the client, and a response packet from the server.
• 2-way application latency is the delta time between a client request received by the server, and a response packet with data sent from the server (in other words, how long it takes the server to respond with data to a client request).
• 2-way latency is measured for each interval of time (e.g., 1 second, 10 seconds, 20 seconds, etc.)
• Average 2-way latency is the average of latency values across an interval of time (non-values not included).
• Maximum 2-way latency is the max latency value for each interval of time.
• 2-way latency is measured in seconds. The granularity is nanoseconds.
Response time
• Response time is only calculated for TCP flows. All other flows will show response time as 0.
• Response time is the delta time between a request packet from the client, and a response packet with data from the server.
• Response time is measured for each interval of time (e.g., 1 second, 10 seconds, 20 seconds, etc.)
• Average response time is the average of response time across an interval of time (non-values not included).
• Maximum response time is the max response time for each interval of time.
• Response time is measured in seconds. The granularity is nanoseconds.
122 Compass dashboard
OmniPeek User Guide
ANYOP_UG.book Page 123 Friday, February 5, 2016 4:47 PM
Viewing a real-time capture Compass dashboard
Viewing a real-time capture Compass dashboard allows you to display network utilization and statistics chart windows real-time from any capture currently capturing data.
To view a real-time capture Compass dashboard:
1. Create and start a new capture as you normally would in OmniPeek or Capture Engine. See Creating an OmniPeek capture window on page 32 or Creating a Capture Engine capture window on page 33.
2. Click the Compass dashboard.
Note Like all analysis, viewing a real-time capture Compass dashboard will have an impact on performance, and should be considered when capturing high volumes of traffic. The exact impact on performance greatly depends on the hardware and software configuration of the OmniPeek machine or Capture Engine.
Viewing a single file Compass dashboard
Viewing a single file Compass dashboard allows you to display network utilization and statis-tic chart windows from a single capture file. Any capture file format supported in OmniPeek can be viewed in the Compass dashboard. See Save file formats on page 150 for a list of sup-ported capture file formats.
To view a single file Compass dashboard:
1. On the File menu, click Open and open a valid capture file.
2. Click the Compass dashboard. The capture file is immediately analyzed and the statistics are displayed in the dashboard.
Note You can also view a single capture file by creating a multiple file Compass workspace and adding a single file individually to a Compass project. See Viewing multiple files in a Compass workspace on page 124.
Select related packets in a single file or real-time capture
From a single file or real-time Compass dashboard, you can use the ‘Select Related Packets’ feature to filter selected items from the statistics chart windows and network utilization graph.
Viewing a real-time capture Compass dashboard 123

Chapter 4: Dashboards
ANYOP_UG.book Page 124 Friday, February 5, 2016 4:47 PM
To select related packets:
1. Select one or more statistic items from the statistics chart windows, and adjust the time range currently selected in the network utilization graph.
2. Toggle the desired AND or OR logic by clicking Use logical AND when filtering at the top of the graphs.
3. Right-click inside the network utilization graph and select Select Related Packets, or simply click Select Related Packets (binoculars) at the top of the graphs. Packets matching the selected statistic item are filtered and highlighted in the Packets view, and the Selection Results dialog appears.
4. Click Highlight selected packets, Hide selected packets, Hide unselected packets, Copy selected packets to new window, or Label selected packets. For more information, see Hiding and unhiding packets on page 191 and Selecting related packets on page 192.
Note Selecting packets based on protocols will include child protocols in the protocol hierarchy.
Viewing multiple files in a Compass workspace
Viewing a multiple file Compass workspace allows you to aggregate and display network utili-zation and statistic chart windows from any number of capture files (*.pkt, *.apc, *.pcap [Lib-pcap format only], *.wcap [Libpcap format only], *.cap [Libpcap format only], *.wpz, and *.pcapng) that have accumulated data over a reasonable period of time. To view multiple files in a Compass workspace, you must first create a ‘New Compass Workspace’ as the capture adapter.
124 Compass dashboard
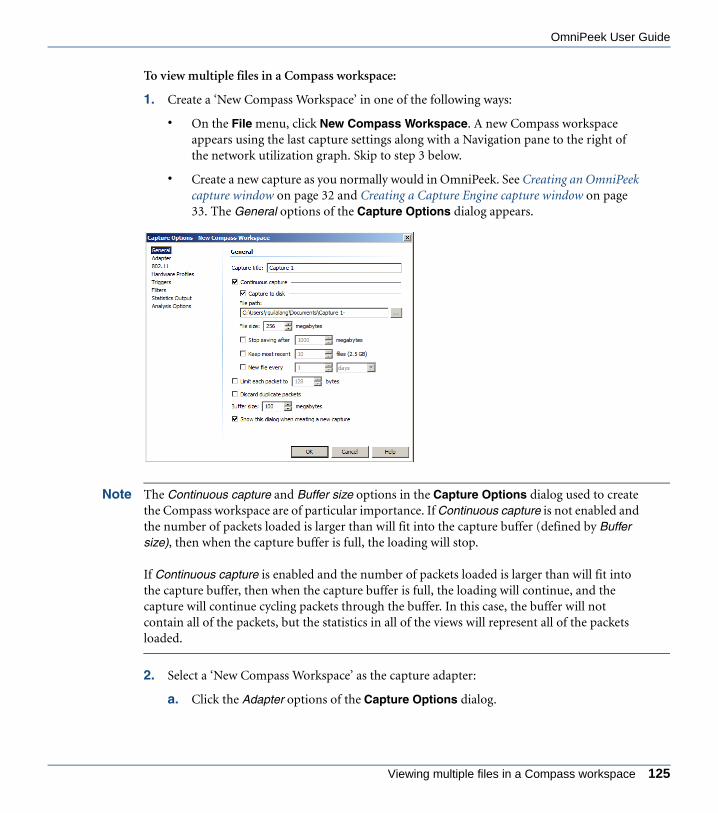
OmniPeek User Guide
ANYOP_UG.book Page 125 Friday, February 5, 2016 4:47 PM
To view multiple files in a Compass workspace:
1. Create a ‘New Compass Workspace’ in one of the following ways:
• On the File menu, click New Compass Workspace. A new Compass workspace appears using the last capture settings along with a Navigation pane to the right of the network utilization graph. Skip to step 3 below.
• Create a new capture as you normally would in OmniPeek. See Creating an OmniPeek capture window on page 32 and Creating a Capture Engine capture window on page 33. The General options of the Capture Options dialog appears.
Note The Continuous capture and Buffer size options in the Capture Options dialog used to create the Compass workspace are of particular importance. If Continuous capture is not enabled and the number of packets loaded is larger than will fit into the capture buffer (defined by Buffer size), then when the capture buffer is full, the loading will stop.
If Continuous capture is enabled and the number of packets loaded is larger than will fit into the capture buffer, then when the capture buffer is full, the loading will continue, and the capture will continue cycling packets through the buffer. In this case, the buffer will not contain all of the packets, but the statistics in all of the views will represent all of the packets loaded.
2. Select a ‘New Compass Workspace’ as the capture adapter:
a. Click the Adapter options of the Capture Options dialog.
Viewing multiple files in a Compass workspace 125

Chapter 4: Dashboards
ANYOP_UG.book Page 126 Friday, February 5, 2016 4:47 PM
b. Click New Compass Workspace below the Module: Compass Adapter entry. A Com-pass dashboard appears, and a Navigation pane appears to the right of the network utilization graph.
126 Compass dashboard
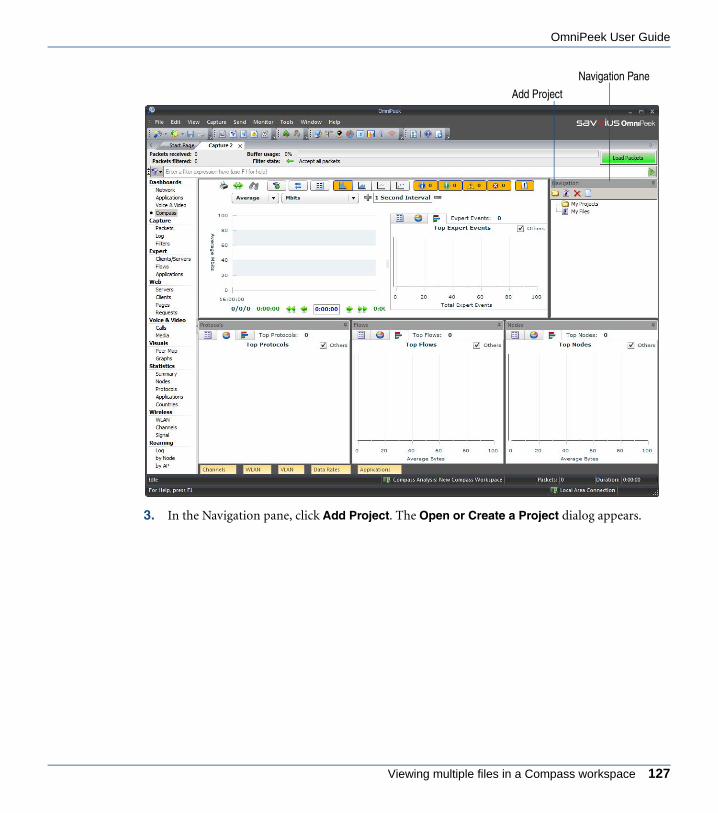
OmniPeek User Guide
ANYOP_UG.book Page 127 Friday, February 5, 2016 4:47 PM
3. In the Navigation pane, click Add Project. The Open or Create a Project dialog appears.
Navigation Pane
Add Project
Viewing multiple files in a Compass workspace 127

Chapter 4: Dashboards
ANYOP_UG.book Page 128 Friday, February 5, 2016 4:47 PM
4. Enter a name for the project and click Save. The Compass Project Settings dialog appears.
5. Configure the dialog:
• Media Type: Sets the type of network traffic to add to the project. Select either Wired or Wireless.
• Snapshot Interval: Sets the granularity of the project. Select either Seconds or Minutes. Seconds should be selected when greater levels of details are required for shorter periods of time. Seconds should not be chosen for periods of time longer than a day. Minutes should be chosen for longer periods of time. In this scenario, a minutes project can be used to visualize network traffic for longer periods of time, and from that a shorter time range can be selected, saved as packets, and opened as a single file.
6. Click OK. The Add file(s) to Compass project… dialog appears.
128 Compass dashboard

OmniPeek User Guide
ANYOP_UG.book Page 129 Friday, February 5, 2016 4:47 PM
7. Select the capture files (*.pkt, *.apc, *.pcap [Libpcap format only], *.wcap [Libpcap format only], *.cap [Libpcap format only], *.wpz, and *.pcapng) to add to the project and click Open (the files must have accumulated data over a reasonable period of time). The list of capture files are added to the Compass project folder inside the Navigation pane.
Note The files you add to the project should be from approximately the same time period. Once added to the project, the location of each file should not be changed.
The Navigation pane displays the new Compass project and the files included in the project.
Viewing multiple files in a Compass workspace 129

Chapter 4: Dashboards
ANYOP_UG.book Page 130 Friday, February 5, 2016 4:47 PM
• Add Project: Click to add projects to the Navigation pane.
• Open File or Add File to Project: Click to add files to a selected Compass project in the Navigation pane. If no Compass project is selected, the file(s) are added as individual file(s) to My Files list.
• Remove item from the list: Click to remove the selected Compass project or file from the Navigation pane.
• Clear Dashboard: Click to clear the Compass dashboard of any data and to deselect all items in the Compass Navigation pane.
• Pin/Unpin: Click to pin or unpin the Navigation pane from the Compass dashboard. When pinned, the Navigation pane is always displayed in the Compass dashboard. When unpinned, the Navigation pane is hidden and appears only as a small tab to the right of the network utilization graph. To pin an unpinned Navigation pane, click the small tab; or hover over the small tab to display the pane, and then click the push-pin icon in the upper right of the pane. To unpin a pinned Navigation pane, click the push-pin icon in the upper right of the pane.
Add Project
Open File or Add File to Project
Remove Item From List
Clear Dashboard Pin/Unpin
130 Compass dashboard

OmniPeek User Guide
ANYOP_UG.book Page 131 Friday, February 5, 2016 4:47 PM
8. Initially, there are no packets loaded in the capture buffer. Make sure the desired project or file is selected in the Navigation pane, and then select the statistics from the statistics chart windows that you wish to analyze and process, and click Load Packets.
9. Repeat step 8, to analyze other statistics. You will be prompted to save changes to your previous capture.
Select related packets in a multiple file Compass workspace
From a multiple file Compass dashboard, you can use the ‘Select Related Packets’ feature to filter selected items from the statistics chart windows.
To selected related packets in the statistics chart windows:
1. Select one or more statistic items from the statistics chart windows, and from the time range currently selected in the Graph views.
2. Toggle the desired AND or OR logic by clicking Use logical AND when filtering at the top of the graphs.
Viewing multiple files in a Compass workspace 131
Chapter 4: Dashboards
ANYOP_UG.book Page 132 Friday, February 5, 2016 4:47 PM
3. Right-click inside the network utilization graph and select Select Related Packets, or simply click Select Related Packets (binoculars) at the top of the graphs. If the packet buffer is cleared, packets matching the selected statistic item are filtered and displayed in the Compass dashboard. If the packet buffer is not empty, then packets matching the selected statistic item are filtered and highlighted in the Packets view, and the Selection Results dialog appears.
Note If the packet buffer is empty, the filter can be applied to up to two levels of selections. To undo a filter, right-click inside the network utilization graph and select Undo Last Filter.
Save Compass dashboard as a report
The data currently displayed inside a Compass dashboard can be saved as a report in the fol-lowing formats:
Note Saving the Compass dashboard as a report is not supported from a Capture Engine.
• CSV: If you are saving the dashboard as a Displays whether the application classification was determined via DPI, or simply via ports., a CSV file is created for each selected statistics chart window in the Compass dashboard. All items (not just the top 10) of selected statistic views (including Expert events) are saved to the CSV files. The CSV files are saved in a folder with the same name as the report title (i.e., <Report Folder>\<Report Title>\*.csv)
• HTML: If you are saving the dashboard as an HTML report, a report of the top 10 items of the selected statistic views is created along with a network utilization graph. The report is first saved as an HTML file (*.htm), and then the HTML file is automatically displayed inside a browser window. All files (e.g., HTML, graphics and database file) associated with the report are stored in a folder with the same name as the report title (i.e., <Report Folder>\<Report Title>\*.*)
• PDF: If you are saving the dashboard as a PDF report, a report of the top 10 items of the selected statistic views is created along with a network utilization graph. The report is first saved as a PDF file (*.pdf), and then the PDF file is automatically displayed inside an Acrobat Reader window. The name of the *.pdf file is the same name as the report title (invalid characters are replaced by an underscore ‘_’).
Note Very large numbers are displayed in scientific notation.
132 Compass dashboard

OmniPeek User Guide
ANYOP_UG.book Page 133 Friday, February 5, 2016 4:47 PM
To save the dashboard as a report:
1. Click Save current view to an HTML report (printer icon) above the network utilization graph. The Save Report dialog appears.
2. Select the report type and layout, enter a report title, select the report folder, select up to six statistic views to include in the report, and then click Save.
Note The default statistic views included in wired captures are Protocols, Flows, Nodes, Channels, VLAN, and Applications. The default statistic views included in wireless captures are Protocols, Flows, Nodes, Channels, WLAN, and Data Rates.
Save Compass dashboard as a report 133

Chapter 4: Dashboards
ANYOP_UG.book Page 134 Friday, February 5, 2016 4:47 PM
Using the Compass dashboard in monitor mode
You can also use the Compass dashboard in monitor mode to monitor statistics traffic on the network. This involves creating an advanced filter using the ‘Compass Adapter’ analysis mod-ule as the filter. Since no packets are actually being captured and saved while in monitor mode, using the Compass dashboard in this manner is an efficient way to monitor statistics traffic real-time.
To use the Compass dashboard in monitor mode:
1. Create a new capture as you normally would in OmniPeek. See Creating an OmniPeek capture window on page 32 and Creating a Capture Engine capture window on page 33.
134 Compass dashboard

OmniPeek User Guide
ANYOP_UG.book Page 135 Friday, February 5, 2016 4:47 PM
2. Click the Filters options in the Capture Options dialog.
3. Click Insert. The Insert Filter dialog appears.
4. Select Advanced in the Type list. The Advanced view of the Insert Filter dialog appears. The dialog displays a green icon representing a network adapter.
5. Enter a descriptive filter name (e.g., ‘Compass Monitor Mode’).
6. Click And> and select Analysis Module. The Analysis Module Filter dialog appears.
7. Select Compass Adapter from the list and click OK.
8. From the Capture Options dialog, select the Filters options and select the newly created filter for the Compass adapter.
9. Click OK to close the Capture Options dialog. A new capture window appears.
10. Click the Compass dashboard, and then click Start Capture to start monitoring using the Compass filter.
Advanced
Using the Compass dashboard in monitor mode 135

Chapter 4: Dashboards
ANYOP_UG.book Page 136 Friday, February 5, 2016 4:47 PM
136 Compass dashboard
C H A P T E R 5
ANYOP_UG.book Page 137 Friday, February 5, 2016 4:47 PM
Viewing and Decoding Packets
In this chapter:
About packets . . . . . . . . . . . . . . . . . . . . . . . . . . . . . . . . . . . . . . . . . . . . . . . . . . 138
Capturing packets into a capture window. . . . . . . . . . . . . . . . . . . . . . . . . . . . . 138
Viewing captured packets. . . . . . . . . . . . . . . . . . . . . . . . . . . . . . . . . . . . . . . . . 142
Applying decryption in the Packets view. . . . . . . . . . . . . . . . . . . . . . . . . . . . . . 147
Applying SSL decryption to packets . . . . . . . . . . . . . . . . . . . . . . . . . . . . . . . . . 148
Saving captured packets . . . . . . . . . . . . . . . . . . . . . . . . . . . . . . . . . . . . . . . . . 149
Printing packet lists and packet decode windows. . . . . . . . . . . . . . . . . . . . . . . 152
Decoding packets . . . . . . . . . . . . . . . . . . . . . . . . . . . . . . . . . . . . . . . . . . . . . . . 152
Showing data offsets and mask information . . . . . . . . . . . . . . . . . . . . . . . . . . . 157
Choosing a decoder . . . . . . . . . . . . . . . . . . . . . . . . . . . . . . . . . . . . . . . . . . . . . 157
Applying decryption from the packet decode window. . . . . . . . . . . . . . . . . . . . 160
Decode reassembled PDU . . . . . . . . . . . . . . . . . . . . . . . . . . . . . . . . . . . . . . . . 160
Using thread intelligence . . . . . . . . . . . . . . . . . . . . . . . . . . . . . . . . . . . . . . . . . 161
137

Chapter 5: Viewing and Decoding Packets
ANYOP_UG.book Page 138 Friday, February 5, 2016 4:47 PM
About packetsPackets, the units of data carried on the network, are the basis for all higher level network anal-ysis. When troubleshooting network problems, it is important to be able to drill down into the packets themselves by looking at their individual decodes as well as use the packets captured into the buffer as the foundation for expert and statistical analysis. The Packets view of a cap-ture window is where you can view information about the individual packets transmitted on your network.
Packets can be captured in multiple configurable capture windows, each with its own selected adapter, its own dedicated capture buffer, and its own settings for filters, triggers, and statistics output. With OmniPeek, you can have capture windows for capturing packets locally from OmniPeek, and remotely from a Capture Engine. The number of capture windows you can have open at one time is only limited by the amount of available memory.
Capturing packets into a capture windowTo capture packets:
1. Create a new capture as defined in Creating an OmniPeek capture window on page 32.
2. Select the Packets view of the capture window.
138 About packets

OmniPeek User Guide
ANYOP_UG.book Page 139 Friday, February 5, 2016 4:47 PM
3. Click Start Capture to begin capturing packets. Start Capture changes to the Stop Capture and packets begin populating the capture window.
Start/Stop Capture
Capturing packets into a capture window 139

Chapter 5: Viewing and Decoding Packets
ANYOP_UG.book Page 140 Friday, February 5, 2016 4:47 PM
Tip You can right-click a column heading to hide or display column headings. See Packet list columns on page 534 for a list of available columns.
4. Click Stop Capture when you want to stop capturing packets. You have various options for saving captured packets. See Saving captured packets on page 149.
Tip To resume capturing from where you left off, hold down the Alt key and click Start Capture. To empty the capture buffer and start a new capture, simply click Start Capture again.
140 Capturing packets into a capture window

OmniPeek User Guide
ANYOP_UG.book Page 141 Friday, February 5, 2016 4:47 PM
Capture Engine Captures tab
The Captures tab in the Capture Engines window is where you create and manage the captures taking place on a particular Capture Engine.
The Captures tab lists all the currently defined captures for a particular Capture Engine. Right-click any column header to display a list of available columns to display. See Capture Engine capture tab columns on page 562 for a description of the available columns.
The clickable buttons in the toolbar of the Capture Engines window are described below:
• Insert: Creates a new Capture Engine capture window.
Important! When you create a Capture Engine capture, that capture continues to exist on the Capture Engine until you delete it, regardless of whether its Capture Engine capture window is open. By contrast, when you close an OmniPeek console capture window, the capture is stopped.
• Delete: Deletes the selected capture.
• Start Capture: Starts capturing packets for the selected capture. Start Capture also works when the Capture Engine capture window is open. When a Capture Engine capture window is open in OmniPeek, you can also click Start Capture to start capture.
InsertDelete
Start CaptureStop Capture
CaptureOptionsRefresh
Capture Engine Captures tab 141

Chapter 5: Viewing and Decoding Packets
ANYOP_UG.book Page 142 Friday, February 5, 2016 4:47 PM
• Stop Capture: Stops capturing packets for the selected captures. Stop Capture also works when the Capture Engine capture window is open. When a Capture Engine capture window is open in OmniPeek, you can also click Stop Capture to stop capture.
• Capture Options: Displays the Capture Options dialog for the selected capture.
• Refresh: Updates the information in the Captures view, retrieving the most current information from a Capture Engine. You can also set an automatic refresh interval by selecting an interval from the drop-down list to the right of Refresh.
Important! Users that do not have permission to create or modify Capture Engine capture windows will find features grayed out, missing, or will receive an error message indicating the task is not allowed. For details, see the Capture Engine for OmniPeek Getting Started Guide or the online help in the Omni Management Console application.
Viewing captured packetsThe Packets view displays details about each packet, including information provided by the Expert function and Analysis Modules. You can show or hide the Decode and Hex panes of the packets view to see a decode, as well as the raw hexadecimal and ASCII values of the selected packet.
Navigating the Packets view
The Packets view can display any combination of the Packet List, Decode, Hex, and ASCII panes. The toolbar lets you show or hide the panes. The filter bar lets you create a wide variety of advanced filters quickly and directly from the capture window. See Creating filters with the filter bar on page 179.
142 Viewing captured packets
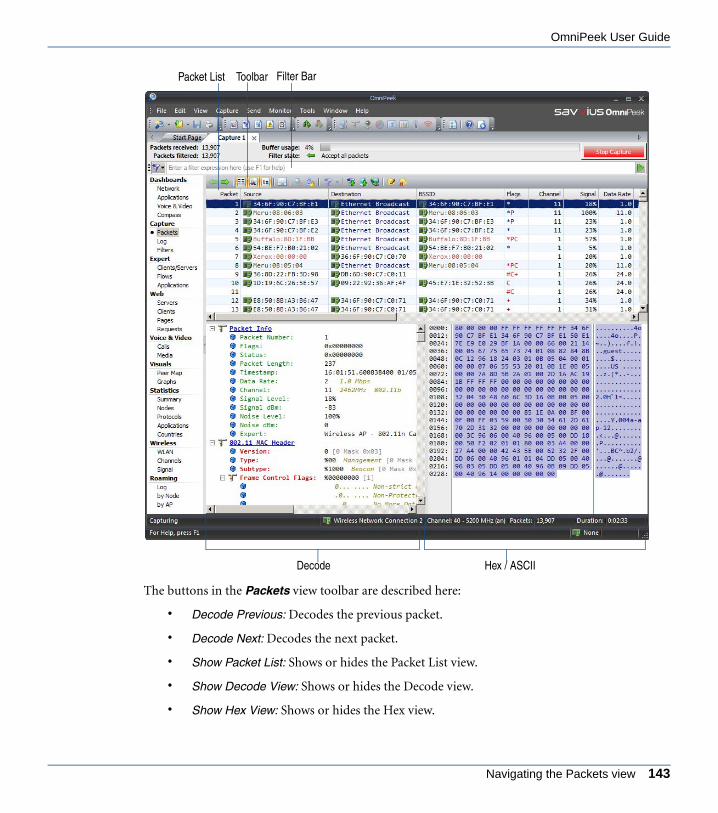
OmniPeek User Guide
ANYOP_UG.book Page 143 Friday, February 5, 2016 4:47 PM
The buttons in the Packets view toolbar are described here:
• Decode Previous: Decodes the previous packet.
• Decode Next: Decodes the next packet.
• Show Packet List: Shows or hides the Packet List view.
• Show Decode View: Shows or hides the Decode view.
• Show Hex View: Shows or hides the Hex view.
ToolbarPacket List
Hex / ASCIIDecode
Filter Bar
Navigating the Packets view 143

Chapter 5: Viewing and Decoding Packets
ANYOP_UG.book Page 144 Friday, February 5, 2016 4:47 PM
• Toggle Orientation: Changes the orientation of how the Decode and Hex views are displayed.
• Zoom Pane: Shows only the view of what is currently selected.
• Auto Scroll: Enables or disables the scrolling of packets when packets are being captured. Alternatively, you can press CTRL+K to enable or disable scrolling.
• Display Filter: Displays in the packet list only the packets that pass (match) the selected filter. Choosing All shows all packets. This functionality is available with capture windows; however, it cannot be used while capturing (you must stop the capture first). See Display filters on page 166.
Tip Hold down the Shift key to show only those packets which do NOT match the selected filter for the entire buffer. Hold down the Ctrl key to apply the filter for only those packets which are currently visible. Hold down both Shift and Ctrl together to hide any currently visible packets which do not match the selected filter.
• Make Filter: Opens the Insert Filter dialog to create a filter based on the selected packet.
• Insert Into Name Table: Opens a dialog to add the selected packet into the Name Table. From the dialog, you can also select Node type icons that will appear to the left of the selected packet. For example, Workstation, Server, Router, or Access Point.
• Resolve Names: Checks the DNS server for a name to match the supplied address.
• Edit Note: Opens the Edit Note dialog to add a note to the selected packet.
• Delete Note: Deletes any note entered for the selected packet.
The Packets view panes are described here:
• Packet List: This pane displays information about each packet in a table with user-configurable columns. Right-click a column head to show or hide other available columns. You can also drag column heads to other positions within the table. See Packet list columns on page 534. You can also right-click a packet for additional options, including Select Related Packets. See Selecting related packets on page 192.
Important! By selecting, hiding, and unhiding packets in the Packet List, you can force a recalculation of statistics in other views of the window, based only on the packets that remain visible. See also Copying selected packets to a new window on page 191.
• Decode: This pane displays detailed information about the selected packet. Click a detail and the corresponding hexadecimal values and ASCII characters are automatically
144 Viewing captured packets

OmniPeek User Guide
ANYOP_UG.book Page 145 Friday, February 5, 2016 4:47 PM
highlighted in the Hex pane. See Decoding packets on page 152 for more information.
Tip You can double-click a packet to display its Decode window.
• Hex: This pane displays the selected packet as raw hexadecimal values and ASCII characters. Click a hexadecimal value or an ASCII character and the corresponding details are automatically highlighted in the Decode pane.
Customizing packet views
You can customize the way packets are displayed in the Packets view by using the Packet List Options dialog.
To open the Packet List Options dialog:
• Click a column head in the Packet List pane. The Packet List Options dialog appears.
• Columns: This tab lets you show, hide, and rearrange columns. See Packet list columns on page 534 for descriptions.
• Flags: This tab lets you define both the flag character and the color associated with flagged packets.
• Format: This tab lets you set the timestamp format (in milliseconds, microseconds, nanoseconds), as well as configure properties for how packets are displayed.
Customizing packet views 145

Chapter 5: Viewing and Decoding Packets
ANYOP_UG.book Page 146 Friday, February 5, 2016 4:47 PM
• Labels: This tab lets you define the color labels for packets displayed in the Packets view of an OmniPeek capture window. Adding color labels to selected packets lets you visually group packets inside the Packets view so that they are easy to identify.
Note Click Help in each of these tabs to learn more about specific options and settings.
Adding notes to packets
You can add descriptive notes to individual packets. The notes are saved whenever the capture window is saved to any of the native OmniPeek capture file formats. See Save file formats on page 150.
Note Adding notes to packets is not supported in the Packets view of a Capture Engine capture window.
To add a note:
1. Select the packet in either the Packets List or in its own Packet Decode window.
2. Click Edit Note. The Edit Note dialog appears.
3. Type the text for the note and click OK.
Tip You can also make a note on the contents of a capture window by entering text in the Properties dialog. Click Properties to open the Properties dialog.
146 Viewing captured packets

OmniPeek User Guide
ANYOP_UG.book Page 147 Friday, February 5, 2016 4:47 PM
Applying decryption in the Packets viewYou can apply a particular key set to decrypt all or some of the encrypted wireless packets in a capture window. An encrypted packet appears in the Packets view with a W in the Flag col-umn and 802.11 TKIP Data, 802.11 Encrypted Data, or 802.11 WEP Data in the Protocols column.
To apply decryption in the packets tab:
1. On the Tools menu, click Decrypt WLAN Packets…. The Decrypt WLAN Packets dialog appears.
2. Select All packets, Selected packets only, or those packets in the current window which are Encrypted only. Your key set will be applied to this selection of packets.
Important! If you are using a WPA/WPA2 key set, you must select All packets to ensure the inclusion of the four-way handshake authentication that established the PTK (Pairwise transient key) and GTK (Group transient key) used to encrypt the target packets.
3. Select an existing key set under Use key set or browse to open the Key Set options to create a new key set.
4. When you have made your selections, click OK to apply the chosen key set to the chosen packets. A new capture window opens containing the results of the decryption. This new window has the name of the original target window, with the string “- Decrypted” appended to it.
Note An 802.11 key set cannot be changed while capture is under way. A new key set will not be applied until a capture is stopped and a new capture is created.
Applying decryption in the Packets view 147

Chapter 5: Viewing and Decoding Packets
ANYOP_UG.book Page 148 Friday, February 5, 2016 4:47 PM
Applying SSL decryption to packetsYou can apply a particular key set to decrypt SSL encrypted packets in a capture window. There are four pieces of information that are needed to decrypt SSL encrypted packets:
• The IP address of the server
• The port being used for SSL data
• The file path to a PEM file (*.pem) that contains the server’s SSL private key
• The password to decrypt the private key if it is encrypted
Note Ciphersuites that use ‘Diffie Hellman’ or ‘Ephemereal Diffie Hellman’ are not currently supported.
To apply or edit SSL decryption in the packets tab:
1. Make sure the capture is stopped (for example, click Stop Capture from the capture window).
2. On the Tools menu, click Decrypt SSL Packets…. The SSL Server Keys dialog appears.
3. Click Insert or Edit. The Add Server Key dialog appears.
148 Applying SSL decryption to packets
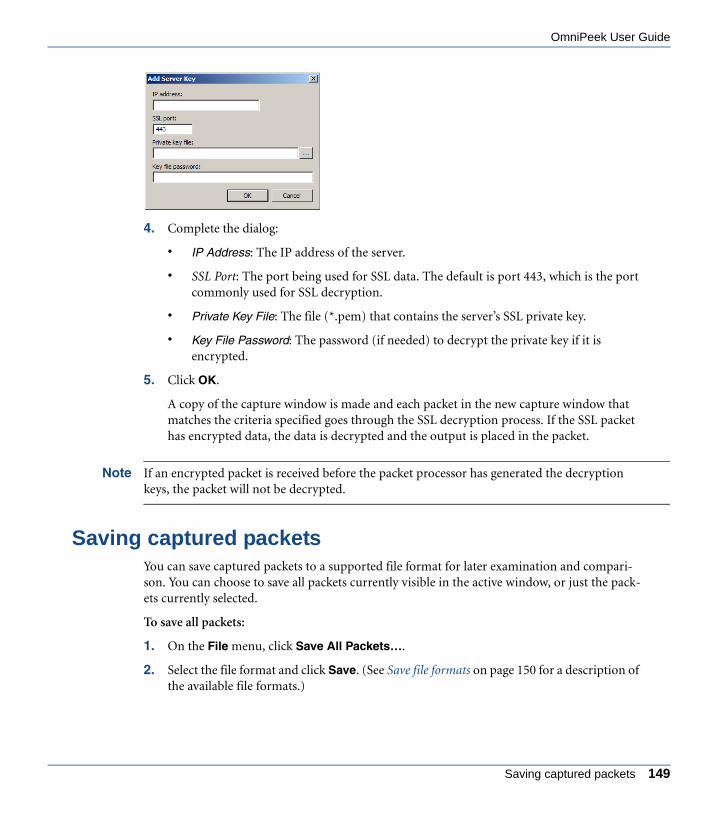
OmniPeek User Guide
ANYOP_UG.book Page 149 Friday, February 5, 2016 4:47 PM
4. Complete the dialog:
• IP Address: The IP address of the server.
• SSL Port: The port being used for SSL data. The default is port 443, which is the port commonly used for SSL decryption.
• Private Key File: The file (*.pem) that contains the server’s SSL private key.
• Key File Password: The password (if needed) to decrypt the private key if it is encrypted.
5. Click OK.
A copy of the capture window is made and each packet in the new capture window that matches the criteria specified goes through the SSL decryption process. If the SSL packet has encrypted data, the data is decrypted and the output is placed in the packet.
Note If an encrypted packet is received before the packet processor has generated the decryption keys, the packet will not be decrypted.
Saving captured packetsYou can save captured packets to a supported file format for later examination and compari-son. You can choose to save all packets currently visible in the active window, or just the pack-ets currently selected.
To save all packets:
1. On the File menu, click Save All Packets….
2. Select the file format and click Save. (See Save file formats on page 150 for a description of the available file formats.)
Saving captured packets 149

Chapter 5: Viewing and Decoding Packets
ANYOP_UG.book Page 150 Friday, February 5, 2016 4:47 PM
To save selected packets:
1. Select the desired packets.
2. On the File menu, click Save Selected Packets….
3. Select the file format and click Save. (See Save file formats on page 150 for a description of the available file formats.)
Save file formats
You can save packets to the supported file formats below.
Capture file formats
The capture file formats are:
• OmniPeek Packet File (*.pkt)—The packets are saved to a OmniPeek packet file format, with a *.pkt extension.
• OmniPeek Packet File (compressed) (*.wpz)—The packets are saved to a compressed OmniPeek packet file format used to save disk space. This file format uses a *.wpz extension.
• OmniPeek Wireless Packet File (*.apc)—The packets are saved to a OmniPeek wireless packet file format, with a *.apc extension.
• OmniPeek Classic Packet File (*.pkt)—The packets are saved to a OmniPeek packet file format compatible with older Savvius programs, such as older versions of AiroPeek, EtherPeek SE (5.0 and earlier), EtherPeek NX (2.0 and earlier). This file format uses a *.pkt extension.
Note The compressed Packet File format (*.wpz) is not supported for automatic file creation during packet capture. The compressed format can be used normally to Save All Packets… or Save Selected Packets… from any capture window.
Other file formats
In addition to the capture file formats above, you can save packets from any media type to the following formats.
• Packet List (Tab delimited, UTF-8) (*.txt)—The packets and columns displayed in the Packet List are saved to a tab-delimited text file in UTF-8 encoding.
• Packet List (Comma delimited, ASCII) (*.csv)—The packets and columns displayed in the Packet List are saved to a comma-delimited text file in ASCII encoding.
150 Saving captured packets

OmniPeek User Guide
ANYOP_UG.book Page 151 Friday, February 5, 2016 4:47 PM
• Decoded Packets (*.txt)—The packets are decoded and saved to a plain text file.
• Decoded Packets (*.rtf)—The packets are decoded and saved to an RTF file that preserves the text formatting and page layout of the same packets in the Decode view of the Packet Decode window.
• Decoded Packets (*.htm)—The packets are decoded and saved to an HTML file that preserves the text formatting and page layout of the same packets in the Decode view of the Packet Decode window.
• Libpcap (Wireshark, AirPcap, tcpdump, etc.) (*.pcap, *.pcap.gz, *.cap, *.dmp, *.appcap, *.appcapz)—The packets are saved to a binary format compatible with many free/open source programs such as tcpdump and Wireshark.
• PcapNG (Wireshark, etc.) (*.pcapng, *.pcapng.gz, *.ntar, *.ntar.gz)—The packets are saved to a binary format compatible with many free/open source programs such as tcpdump and Wireshark.
• NG Sniffer DOS file (*.enc)—The packets are saved as a Sniffer® trace file in DOS format. This file format uses a *.enc extension.
• Raw Packet Data (*.txt)—The packets are saved to a file as raw text. The file includes raw hexadecimal and ASCII data, 16 bytes per line, hex on the left, ASCII on the right.
• TCP/UDP/RTP Data File (*.*)—The part of the packet that is after the end of the TCP, UDP, or RTP header, up to and including the data at the offset specified by the Total Length field of the IP header is saved to a filename and file format that you must specify. This part of the packet typically contains the application data for file transfers. If multiple packets are selected, their contents are saved as one continuous file, in packet number order.
Deleting all packets
You can only choose to delete all packets, and not a selected group of packets.
Note There is no direct command to delete packets from a Capture Engine capture window. If you restart a capture in the Capture Engine capture window, all existing packets are deleted first. Capture files already saved to disk are not affected. Capture files saved to disk can be managed through the Files tab of the Capture Engines window.
To delete all packets, including any hidden packets:
• On the Edit menu, click Clear All Packets.
Deleting all packets 151

Chapter 5: Viewing and Decoding Packets
ANYOP_UG.book Page 152 Friday, February 5, 2016 4:47 PM
Tip You can choose Copy Selected Packets to New Window from the context menu in the Packets view to isolate a selected group of packets. See Copying selected packets to a new window on page 191.
Printing packet lists and packet decode windowsYou have several options for printing packets from a capture window.
To print the packets currently displayed in the Packets view:
• On the File menu, click Print….
Note For more on selecting, hiding, and unhiding packets, see Chapter 7, Post-capture Analysis.
To print selected packets as decoded packets:
• On the File menu, click Print Selected Packets….
The packets are decoded and saved to an RTF file that preserves the text formatting and page layout of the same packets in the Decode view of the Packet Decode window.
Tip You can also save the packets as decoded packets in an RTF or HTML format, and then print them from another application that can read and print those file types. This alternative preserves the formatting of the Packet Decode window and allows multiple packets to be printed on individual pages.
Decoding packetsWhen troubleshooting your network or tracking down a security breach, analyzing the details of a packet can be very useful. You can view the details of a packet by opening the packet in a Packet Decode window.
The Packet Decode window makes packet headers readable and understandable.
To open a packet in a Packet Decode window:
• Double-click a packet in the Packet List.
152 Printing packet lists and packet decode windows
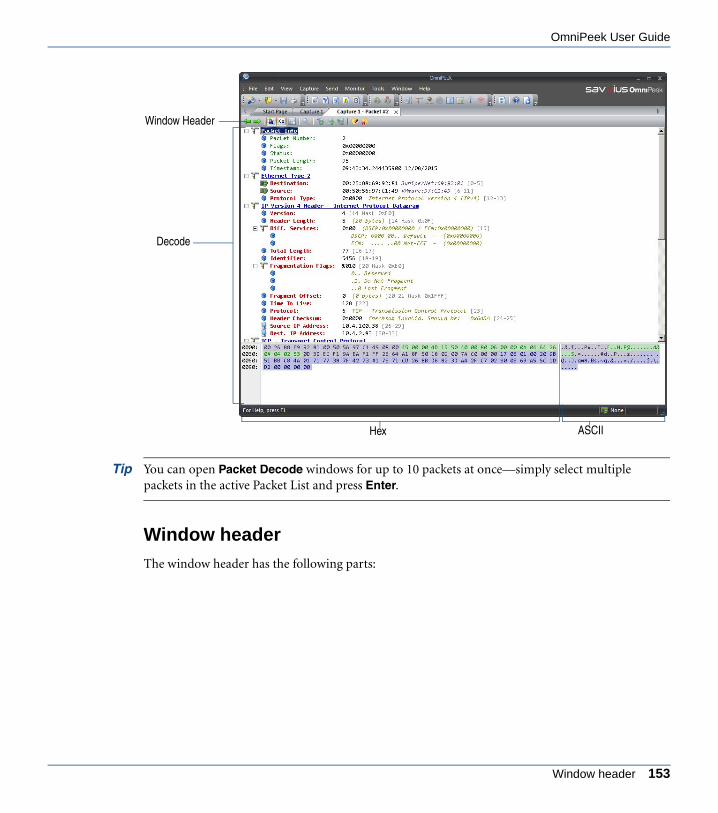
OmniPeek User Guide
ANYOP_UG.book Page 153 Friday, February 5, 2016 4:47 PM
Tip You can open Packet Decode windows for up to 10 packets at once—simply select multiple packets in the active Packet List and press Enter.
Window header
The window header has the following parts:
Window Header
Decode
ASCIIHex
Window header 153

Chapter 5: Viewing and Decoding Packets
ANYOP_UG.book Page 154 Friday, February 5, 2016 4:47 PM
• Decode Previous: Displays the previous packet (you can also press F7 to display the previous packet)
• Decode Next: Displays the next packet (you can also press F8 to display the next packet)
• Show Decode View: Shows or hides the Decode view
• Show Hex View: Shows or hides the Hex view
• Toggle Orientation: Changes the orientation of both the Decode and Hex view, when both views are displayed.
• Zoom Pane: Displays only the currently active view (the view with the current active highlight). Click Zoom Pane again to toggle back to the previous view.
• Make Filter: Makes a filter based on the selected item in the Decode view. See Creating filters with the Make Filter command on page 172.
• Insert Into Name Table: Opens the Edit Name dialog. See Adding entries to the name table on page 434.
• Resolve Names: Substitutes name for logical address. See OmniPeek name resolution on page 438.
• Title bar: Displays the capture window name and the number of the packet.
• Edit Note: Inserts a note. See Adding notes to packets on page 146.
• Delete Note: Deletes an existing note for the packet. See Adding notes to packets on page 146.
Decode view
The Decode view displays decoded packet data in byte order from top to bottom. Click the minus or plus signs to collapse or expand the view of any header section. In collapsed mode, you get a summary of the layer.
Show Hex ViewToggle Orientation
Decode Previous
Show Decode View
Decode NextZoom Pane
Make FilterInsert Into Name Table
Resolve Names
Edit NoteDelete Note
Title Bar
154 Decoding packets

OmniPeek User Guide
ANYOP_UG.book Page 155 Friday, February 5, 2016 4:47 PM
The Packet Info (in green) at the top is generated automatically by OmniPeek. The following table lists the parameters that may appear in Packet Info.
Note OmniPeek decodes hundreds of network, transport, application and device control protocols, displaying both the commands and their meaning. When the data portion of the packet is listed toward the end of the Decode view simply as data, OmniPeek has reached a layer of the
Parameter Description
Flags Denotes the flag of a packet. Packets can be flagged, based on their match with a variety of conditions. Flags vary from one network medium to another.
Status Indicates any one of several conditions, including that the packet was truncated or sliced. Shows a value of 0x00 when the packet does not have any of these other conditions.
Packet Length
The number of bytes that the card retrieved off the network for this packet, includ-ing all header information and FCS.
Slice Length
When Slice Length appears, it indicates the number of bytes of the packet which were captured. This is shown only if packet slicing was used on a packet, or if data was truncated because it was unavailable.
Timestamp The time the packet was received.
Data Rate The data rate at which the body of the 802.11 WLAN packet was transmitted.
Channel The 802.11 WLAN channel number and radio frequency at which the packet was transmitted.
Signal Level
The signal strength of the transmission in which the 802.11 WLAN packet was received, expressed as the RSSI normalized to a percentage.
Signal dBm The signal strength of the transmission in which the 802.11 WLAN packet was received, expressed in dBm (decibel-milliWatts). If the packet was captured on an adapter that does not report values for signal level in dBm, this item will not be shown.
Noise Level
The noise level reported in the receipt of this 802.11 WLAN packet, expressed as a percentage. If the packet was captured on an adapter that does not report val-ues for noise, this will show as 0%.
Noise dBm The noise level reported in the receipt of this 802.11 WLAN packet, expressed in dBm (decibel milliWatts). If the packet was captured on an adapter that does not report values for noise in dBm, this item will not be shown.
Decode view 155

Chapter 5: Viewing and Decoding Packets
ANYOP_UG.book Page 156 Friday, February 5, 2016 4:47 PM
packet that it cannot decode with the current or default decoder. For details about selecting an alternative decoder, see Choosing a decoder on page 157. If you are writing your own protocols and wish to write your own decoders, see Writing your own decoders on page 160.
Hex and ASCII views
The Hex view displays the actual packet contents as raw hexadecimal values and its ASCII (or EBCDIC) equivalent.
Color coding is used to link the Decode view with the Hex view for both Hex and its ASCII equivalent. The Hex and ASCII views are in turn linked to the color of the protocol shown in the Protocols column of the Packet List.
When you highlight a section of the Decode view, the corresponding portion of the hex data and the ASCII data in the Hex view is shown in gray. Conversely, if you highlight a section in the Hex view, the corresponding portion of the Decode view is also highlighted.
You can choose display options by right-clicking inside the Hex and ASCII views and selecting from the following options:
• Copy: Copies the selected data in the Decode, Hex, and ASCII views. If a data field is selected in the Decode view, the data field and value is copied. If a Hex value is selected in the Hex view, the data field and value is copied. If an ASCII value is selected in the ACSCII view, the ASCII value is copied.
• ASCII: Displays the text portion of the Hex view as ASCII
• EBCDIC: Displays the text portion of the Hex view as EBCDIC
• Decimal Offsets: Displays the offsets to the left of the hexadecimal values as decimal values
• Hexadecimal Offsets: Displays the offsets to the left of the hexadecimal values as hexadecimal values
• Show Offsets: Hides or displays the Offset values
• Show Hex: Hides or displays the hexadecimal values
• Show ASCII: Hides or displays the ASCII values
• Show Colors: Hides or displays color
• Bytes Per Row: Controls the width of the Hex view
156 Decoding packets
OmniPeek User Guide
ANYOP_UG.book Page 157 Friday, February 5, 2016 4:47 PM
Important! Many protocols, especially the older Internet protocols such as HTTP, POP3, FTP, Telnet, and others transmit packet data in plain ASCII text. To prevent unauthorized access to this data, controlling access to OmniPeek should be a normal part of your security routine.
Showing data offsets and mask informationOffsets are a measure of location within a packet, counted as the distance in bytes from the first byte of the packet. The offset of the first byte is “0,” that of the second byte is “1,” and so on.
The mask is a mathematical way of defining a particular bit or bits within a byte. The offset and mask information is especially useful when developing protocols, constructing filters, and in a variety of other detailed packet analysis tasks.
To hide or display offsets in the Decode view:
• Right-click inside the Decode view and select Show Offsets.
Tip You can quickly create a filter that matches the value found at a particular point in a packet, directly from the Decode view. Highlight the item you wish to match and click Make Filter, or right-click and choose Make Filter….
Choosing a decoderDecoders provide the instructions required to display packet contents, based on the type of protocols used. For certain packets, you can choose a decoder directly from the Decode view. Choosing a decoder is particularly useful in environments where new protocols are under development, or where TCP or UDP applications are using non-standard ports.
When the Choose Decoder option is available for a certain packet, the Choose Decoder option is available when you right-click inside the Decode view.
To choose a decoder for the packet:
1. Right-click inside the Decode view and select Choose Decoder. The Select Decoder dialog appears with a list of decoders available for the packet.
Showing data offsets and mask information 157

Chapter 5: Viewing and Decoding Packets
ANYOP_UG.book Page 158 Friday, February 5, 2016 4:47 PM
2. Select the desired decoder and click Use Decoder.
The decoder you choose will be used for the current packet and all subsequent packets of the same type.
Important! To restore the default, select Default Decoder from the Select Decoder window.
Note Savvius provides decoders for hundreds of protocols and subprotocols (see https://www.savvius.com/support). The modules that decode packets are installed in the Decodes folder where the program is installed.
Line decoders
The Select Decoder window shows a context-sensitive list of decoders which can be applied to the current packet. If the packet contains TCP or UDP, this list will include generic line decoders such as Display Number Of Bytes. The following table lists the available line decoders and their behavior.
Decoder Shows
Default Decoder When you select this decoder, the program returns to its default behavior when decoding packets of the current type. Use this selection to stop using any decoder previously selected in the Select Decoder window and restore the program's ability to choose its own decoder.
Display Number Of Bytes This line decoder displays only the number of bytes in the UDP or TCP payload of the packet.
158 Choosing a decoder
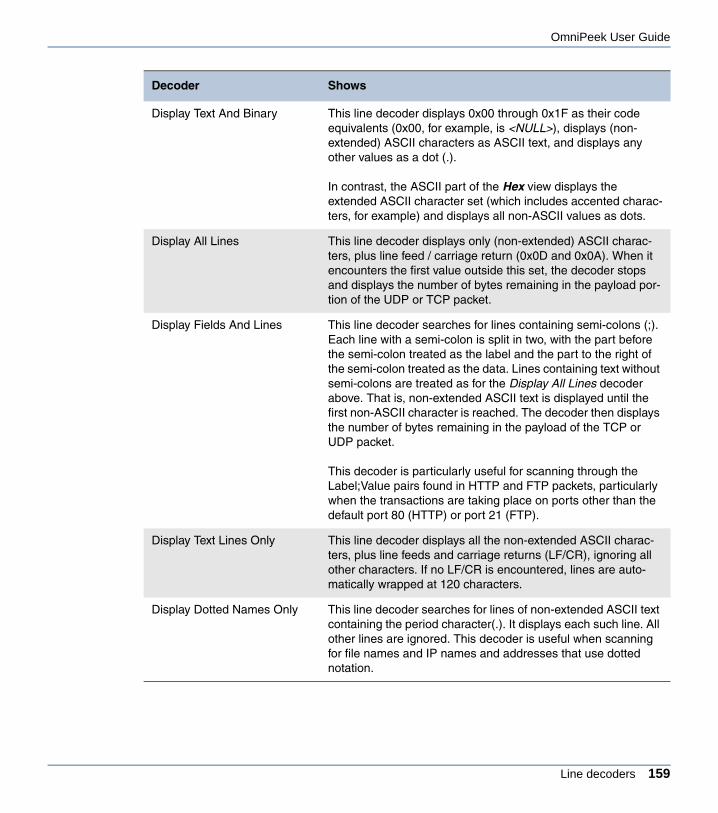
OmniPeek User Guide
ANYOP_UG.book Page 159 Friday, February 5, 2016 4:47 PM
Display Text And Binary This line decoder displays 0x00 through 0x1F as their code equivalents (0x00, for example, is <NULL>), displays (non-extended) ASCII characters as ASCII text, and displays any other values as a dot (.).
In contrast, the ASCII part of the Hex view displays the extended ASCII character set (which includes accented charac-ters, for example) and displays all non-ASCII values as dots.
Display All Lines This line decoder displays only (non-extended) ASCII charac-ters, plus line feed / carriage return (0x0D and 0x0A). When it encounters the first value outside this set, the decoder stops and displays the number of bytes remaining in the payload por-tion of the UDP or TCP packet.
Display Fields And Lines This line decoder searches for lines containing semi-colons (;). Each line with a semi-colon is split in two, with the part before the semi-colon treated as the label and the part to the right of the semi-colon treated as the data. Lines containing text without semi-colons are treated as for the Display All Lines decoder above. That is, non-extended ASCII text is displayed until the first non-ASCII character is reached. The decoder then displays the number of bytes remaining in the payload of the TCP or UDP packet.
This decoder is particularly useful for scanning through the Label;Value pairs found in HTTP and FTP packets, particularly when the transactions are taking place on ports other than the default port 80 (HTTP) or port 21 (FTP).
Display Text Lines Only This line decoder displays all the non-extended ASCII charac-ters, plus line feeds and carriage returns (LF/CR), ignoring all other characters. If no LF/CR is encountered, lines are auto-matically wrapped at 120 characters.
Display Dotted Names Only This line decoder searches for lines of non-extended ASCII text containing the period character(.). It displays each such line. All other lines are ignored. This decoder is useful when scanning for file names and IP names and addresses that use dotted notation.
Decoder Shows
Line decoders 159
Chapter 5: Viewing and Decoding Packets
ANYOP_UG.book Page 160 Friday, February 5, 2016 4:47 PM
Writing your own decoders
If you find proprietary protocols on your network for which Savvius does not supply decoders, or if you are developing your own protocols, you may want to write your own decoders. See http://mypeek.savvius.com for information on writing decoders.
Applying decryption from the packet decode windowYou can decrypt WPA or WEP-encrypted packets directly from the Packet Decode window.
To decrypt a WPA or WEP-encrypted packet:
1. Right-click inside the Packet Decode window and select Apply Decryption. The Decrypt WLAN Packets dialog appears.
2. Follow the steps in Applying decryption in the Packets view on page 147.
Decode reassembled PDUThe PDU is the Protocol Data Unit: the payload of a network application packet. When a web page, for example, is sent over the Internet, the page is broken into convenient sized pieces and transmitted in a series of packets. You can attempt to locate all of the other pieces of this page, decode them, and present the results in a single temporary Packet Decode window.
Note Decode reassembled PDU is not supported from a Capture Engine.
To decode and reassemble a PDU:
• Right-click a packet containing one of the fragments of the web page and choose Decode Reassembled PDU
An attempt is made to locate all of the other pieces of the page and decode them; the results are presented in a single temporary Packet Decode window. The title bar of the window shows a packet number, followed by (Reassembled PDU). The packet number is the packet identified as the one containing the first part of the PDU.
Tip You can choose to save or print the decode of the individual Packet Decode window containing the reassembled PDU (choose Save Packet…, or Print from the File menu).
160 Applying decryption from the packet decode window
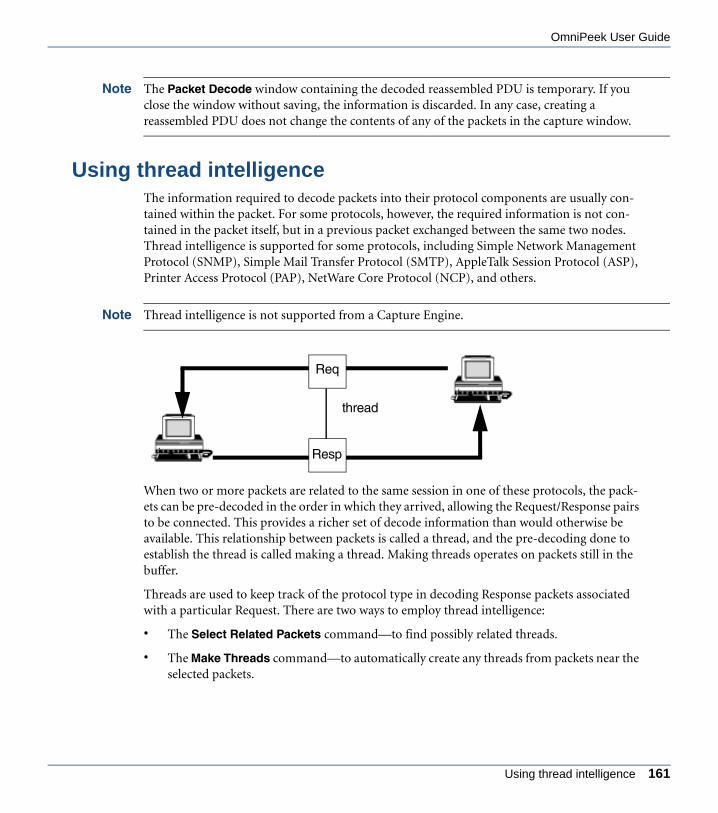
OmniPeek User Guide
ANYOP_UG.book Page 161 Friday, February 5, 2016 4:47 PM
Note The Packet Decode window containing the decoded reassembled PDU is temporary. If you close the window without saving, the information is discarded. In any case, creating a reassembled PDU does not change the contents of any of the packets in the capture window.
Using thread intelligenceThe information required to decode packets into their protocol components are usually con-tained within the packet. For some protocols, however, the required information is not con-tained in the packet itself, but in a previous packet exchanged between the same two nodes. Thread intelligence is supported for some protocols, including Simple Network Management Protocol (SNMP), Simple Mail Transfer Protocol (SMTP), AppleTalk Session Protocol (ASP), Printer Access Protocol (PAP), NetWare Core Protocol (NCP), and others.
Note Thread intelligence is not supported from a Capture Engine.
When two or more packets are related to the same session in one of these protocols, the pack-ets can be pre-decoded in the order in which they arrived, allowing the Request/Response pairs to be connected. This provides a richer set of decode information than would otherwise be available. This relationship between packets is called a thread, and the pre-decoding done to establish the thread is called making a thread. Making threads operates on packets still in the buffer.
Threads are used to keep track of the protocol type in decoding Response packets associated with a particular Request. There are two ways to employ thread intelligence:
• The Select Related Packets command—to find possibly related threads.
• The Make Threads command—to automatically create any threads from packets near the selected packets.
Req
thread
Resp
Using thread intelligence 161

Chapter 5: Viewing and Decoding Packets
ANYOP_UG.book Page 162 Friday, February 5, 2016 4:47 PM
To make threads:
1. Select the packets in the Packet List where you believe threads may exist (you can use Ctrl + A to select all packets).
2. Right-click and choose Make Threads.
Manually selecting further decode options
If you view the Request packet first, OmniPeek keeps track of the thread when you open the corresponding Response packets. However, if you view a Response packet before you have opened a preceding Request, no thread will have been started, and OmniPeek displays a ques-tion mark (?) instead of the protocol type at the top of the Packet Decode window.
You can click Choose Decoder (a question mark) if it is available for the packet to open the Select Decoder dialog, and then manually choose the decoder to use.
As an alternative to manually selecting options for further decoding packets, you can instruct OmniPeek to make threads before opening any packets. This ensures that the threads will exist even if you open a Response packet first.
To make threads in the background before you open packets, use the Select Related Packets command or Select All Packets (either from the Edit menu or from the context menu), and then choose the Make Threads command from the context menu (right-click). You can then view packets in any order.
162 Using thread intelligence

C H A P T E R 6
ANYOP_UG.book Page 163 Friday, February 5, 2016 4:47 PM
Creating and Using Filters
In this chapter:
About filters. . . . . . . . . . . . . . . . . . . . . . . . . . . . . . . . . . . . . . . . . . . . . . . . . . . . 164
Viewing filters . . . . . . . . . . . . . . . . . . . . . . . . . . . . . . . . . . . . . . . . . . . . . . . . . . 164
Display filters . . . . . . . . . . . . . . . . . . . . . . . . . . . . . . . . . . . . . . . . . . . . . . . . . . 166
Enabling a filter . . . . . . . . . . . . . . . . . . . . . . . . . . . . . . . . . . . . . . . . . . . . . . . . . 168
Creating filters with the Make Filter command . . . . . . . . . . . . . . . . . . . . . . . . . 172
Creating a simple filter . . . . . . . . . . . . . . . . . . . . . . . . . . . . . . . . . . . . . . . . . . . 173
Creating an advanced filter. . . . . . . . . . . . . . . . . . . . . . . . . . . . . . . . . . . . . . . . 174
Creating a new capture window based on a filter . . . . . . . . . . . . . . . . . . . . . . . 177
Filter types . . . . . . . . . . . . . . . . . . . . . . . . . . . . . . . . . . . . . . . . . . . . . . . . . . . . 178
Creating filters with the filter bar . . . . . . . . . . . . . . . . . . . . . . . . . . . . . . . . . . . . 179
Editing filters . . . . . . . . . . . . . . . . . . . . . . . . . . . . . . . . . . . . . . . . . . . . . . . . . . . 185
Duplicating filters . . . . . . . . . . . . . . . . . . . . . . . . . . . . . . . . . . . . . . . . . . . . . . . 186
Saving and loading filters . . . . . . . . . . . . . . . . . . . . . . . . . . . . . . . . . . . . . . . . . 186
163
Chapter 6: Creating and Using Filters
ANYOP_UG.book Page 164 Friday, February 5, 2016 4:47 PM
About filtersFilters are used to isolate particular types of traffic on the network for troubleshooting, analy-sis, and diagnostics. If you want to check a problem between two particular devices, perhaps a computer and a printer, address filters can capture just the traffic between these two devices. If you are having a problem with a particular function on your network, a protocol filter can help you locate traffic related to that particular function.
Filters work by testing packets against the criteria specified in the filter. If the contents or attri-butes of a packet match the criteria specified in a filter, the packet is said to “match” the filter. You can build filters to test for just about anything found in a packet: addresses, protocols, sub-protocols, ports, error conditions, and more.
Note Filters created from a connected Capture Engine are available to that Capture Engine only. If you are not connected to a Capture Engine and you create a filter, that filter is available for local captures only.
Viewing filtersThe Filters window in OmniPeek displays all of the filters available in the program. These include pre-defined filters as well as any that you have modified or created. The Filters tab of a connected Capture Engine displays all of the filters available for that particular Capture Engine.
OmniPeek filters window
To open the OmniPeek Filters window, do one of the following:
• Click Filters in the main program window toolbar
• On the View menu, click Filters
164 About filters
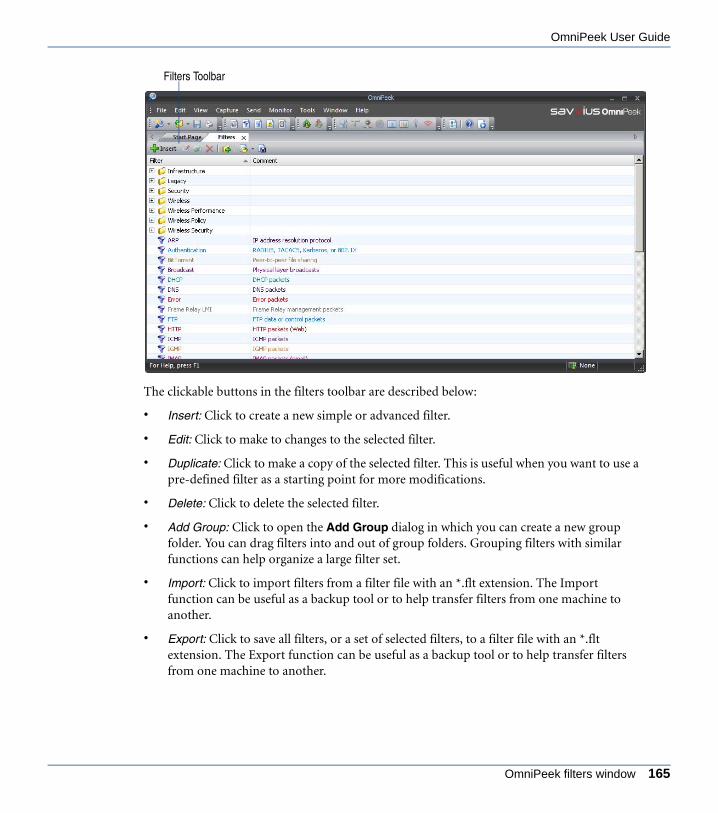
OmniPeek User Guide
ANYOP_UG.book Page 165 Friday, February 5, 2016 4:47 PM
The clickable buttons in the filters toolbar are described below:
• Insert: Click to create a new simple or advanced filter.
• Edit: Click to make to changes to the selected filter.
• Duplicate: Click to make a copy of the selected filter. This is useful when you want to use a pre-defined filter as a starting point for more modifications.
• Delete: Click to delete the selected filter.
• Add Group: Click to open the Add Group dialog in which you can create a new group folder. You can drag filters into and out of group folders. Grouping filters with similar functions can help organize a large filter set.
• Import: Click to import filters from a filter file with an *.flt extension. The Import function can be useful as a backup tool or to help transfer filters from one machine to another.
• Export: Click to save all filters, or a set of selected filters, to a filter file with an *.flt extension. The Export function can be useful as a backup tool or to help transfer filters from one machine to another.
Filters Toolbar
OmniPeek filters window 165

Chapter 6: Creating and Using Filters
ANYOP_UG.book Page 166 Friday, February 5, 2016 4:47 PM
Capture Engine filters tab
The Filters tab in the Capture Engines window displays the filters available for a particular Capture Engine.
To view filters available for a Capture Engine:
• Select the Settings tab, and then the Filters tab of a connected Capture Engine. (See Connecting to a Capture Engine on page 14.)
In addition to the same buttons available from the OmniPeek Filters window, the Capture Engine Filters tab also allows you to refresh the list of filters.
Display filtersThe capture filters described in this chapter restrict the flow of packets into the buffer of a cap-ture window. Display Filters, by contrast, are used simply to isolate and view a particular sub-set of the captured packets in a capture window or in a saved capture file for post-capture analysis.
Filters Tab Refresh
166 Display filters
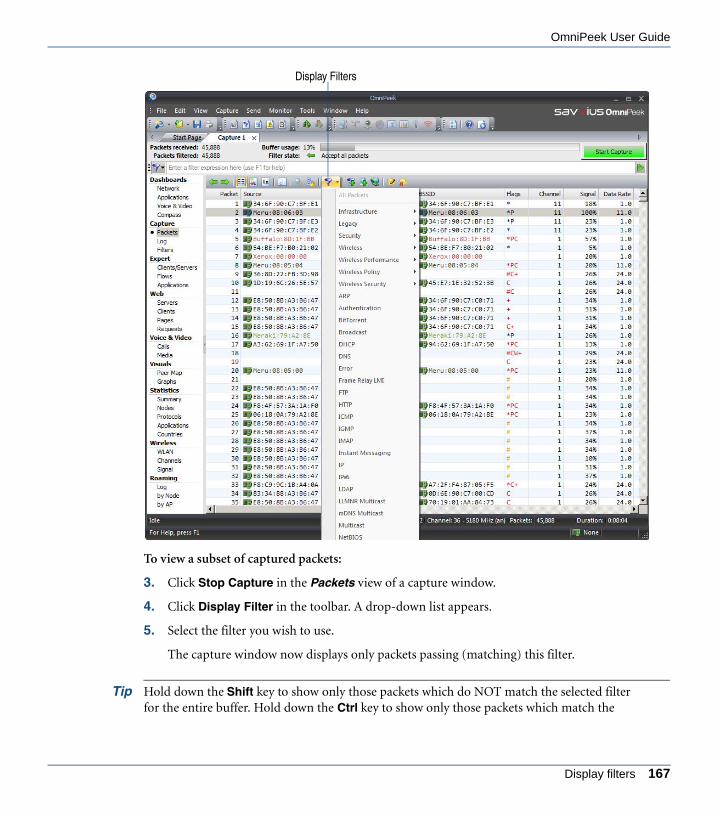
OmniPeek User Guide
ANYOP_UG.book Page 167 Friday, February 5, 2016 4:47 PM
To view a subset of captured packets:
3. Click Stop Capture in the Packets view of a capture window.
4. Click Display Filter in the toolbar. A drop-down list appears.
5. Select the filter you wish to use.
The capture window now displays only packets passing (matching) this filter.
Tip Hold down the Shift key to show only those packets which do NOT match the selected filter for the entire buffer. Hold down the Ctrl key to show only those packets which match the
Display Filters
Display filters 167

Chapter 6: Creating and Using Filters
ANYOP_UG.book Page 168 Friday, February 5, 2016 4:47 PM
selected filter for the entire buffer. Hold down both Shift and Ctrl together to hide any currently visible packets which do not match the selected filter.
Display filters are available from active capture windows only after the capture is stopped. They are always available from saved capture files. For more information, see Opening saved capture files on page 62.
Enabling a filterIn addition to the filters that you can create, numerous pre-defined filters are included with the application. You can enable one or more of these filters in the following ways:
• From the Filters options of the Capture Options dialog, allowing you to control which packets are added to the capture buffer of a new capture window
• From the Filters view of a capture window, allowing you to control which packets are added to the capture buffer of an existing capture window starting when the filter(s) is selected
Enabling filters from the Capture Options dialog
To enable filters from the OmniPeek Capture Options dialog:
1. Do one of the following to open the Capture Options dialog:
• On the Start Page, click New Capture
• On the File menu, click New Capture…
• On the Capture menu, click Capture Options from an open capture window
2. Click the Filters options.
168 Enabling a filter

OmniPeek User Guide
ANYOP_UG.book Page 169 Friday, February 5, 2016 4:47 PM
3. Select the filters that you want to enable.
4. Click OK.
5. Click Start Capture to begin capturing packets. Any packets that match the filters that are enabled are placed into the capture buffer.
Note Alternately, you can choose to place the packets that do not match the filter in the capture buffer by clicking Reject Matching.
To enable filters from the Capture Engine Capture Options dialog:
1. Do one of the following to open the Capture Options dialog:
• Click Insert in the Captures view of the Capture Engines window
• Select an existing capture in the Captures view of the Capture Engines window and click Capture Options.
2. Click the Filters options.
Enabling filters from the Capture Options dialog 169

Chapter 6: Creating and Using Filters
ANYOP_UG.book Page 170 Friday, February 5, 2016 4:47 PM
3. Select the filters that you want to enable.
4. Click OK. A capture window appears.
5. Click Start Capture to begin capturing packets. Any packets that match the filters that are enabled are placed into the capture buffer.
Note Alternately, you can choose to place the packets that do not match the filter in the capture buffer by clicking Reject Matching.
Enabling filters from the capture window
To enable filters from an OmniPeek capture window:
1. Click the Filters view of a capture window.
170 Enabling a filter

OmniPeek User Guide
ANYOP_UG.book Page 171 Friday, February 5, 2016 4:47 PM
2. Select the filters that you want to enable.
3. Click Start Capture to begin capturing packets. Any packets that match the filters that are enabled are placed into the capture buffer.
Note Alternately, you can choose to place the packets that do not match the filter in the capture buffer by clicking Reject Matching.
To enable filters from a Capture Engine capture window:
1. Click the Filters view of a capture window.
Reject Matching Start/Stop Capture
Enabling filters from the capture window 171
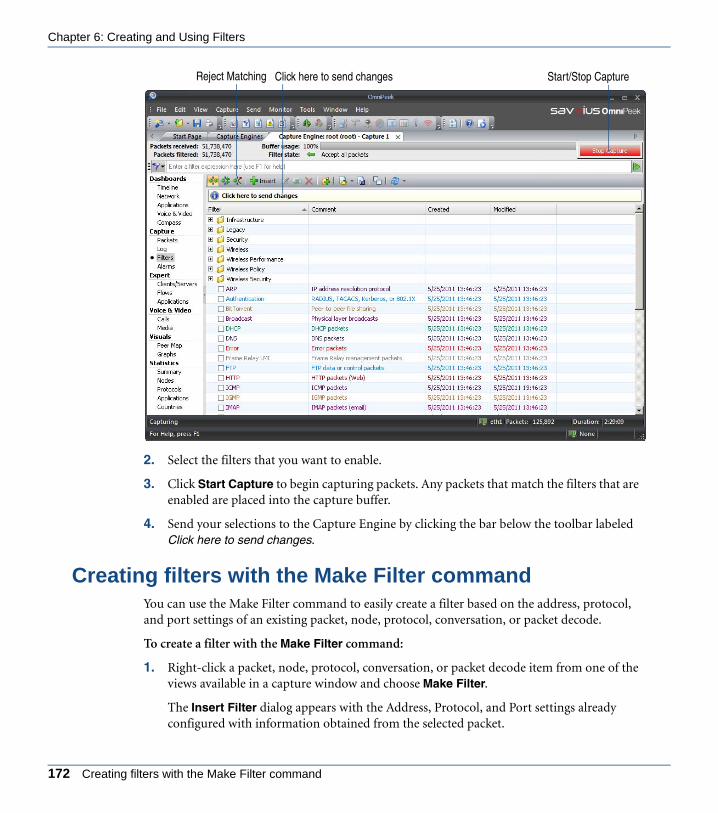
Chapter 6: Creating and Using Filters
ANYOP_UG.book Page 172 Friday, February 5, 2016 4:47 PM
2. Select the filters that you want to enable.
3. Click Start Capture to begin capturing packets. Any packets that match the filters that are enabled are placed into the capture buffer.
4. Send your selections to the Capture Engine by clicking the bar below the toolbar labeled Click here to send changes.
Creating filters with the Make Filter commandYou can use the Make Filter command to easily create a filter based on the address, protocol, and port settings of an existing packet, node, protocol, conversation, or packet decode.
To create a filter with the Make Filter command:
1. Right-click a packet, node, protocol, conversation, or packet decode item from one of the views available in a capture window and choose Make Filter.
The Insert Filter dialog appears with the Address, Protocol, and Port settings already configured with information obtained from the selected packet.
Reject Matching Start/Stop CaptureClick here to send changes
172 Creating filters with the Make Filter command

OmniPeek User Guide
ANYOP_UG.book Page 173 Friday, February 5, 2016 4:47 PM
2. Enter a new name in the Filter text box and make any additional desired changes.
Note Click Help on the dialog to learn about the available options and settings.
3. Click OK. The new filter is now available whenever a list of available filters is displayed.
4. To enable the new filter in your capture window, click the Filters view and select the check box of the new filter. The filter is applied immediately, even if a capture is already under way.
Creating a simple filterYou can create a simple filter by manually entering the parameters for the filter that you want to create. Unlike creating a filter using the Make Filter command, you will have to manually define one or more of the parameters (address, protocol, and port settings) for the filter you want to create.
To create a simple filter by defining an address and protocol:
1. Do one of the following to display the list of filters:
• On the View menu, click Filters
• Click the Filters view in an open capture window
• Click the Filters options from the Capture Engine Capture Options dialog
2. Click Insert. The Insert / Edit Filter dialog appears.
Creating a simple filter 173

Chapter 6: Creating and Using Filters
ANYOP_UG.book Page 174 Friday, February 5, 2016 4:47 PM
3. Complete the dialog and click OK. The new filter is now available whenever a list of available filters is displayed.
Note Click Help on the dialog to learn about the available options and settings.
Creating an advanced filterYou can create an advanced filter that allows you to create very precise conditions in a single filter. To create an advanced filter, you must define one or more parameters (or filter nodes) joined with logical AND, logical OR, or logical NOT statements.
To create an advanced filter:
1. Do one of the following to display the list of filters:
• On the View menu, click Filters
• Click the Filters view in an open capture window
• Click the Filters options in the Capture Engine Capture Options dialog
2. Click Insert. The Insert Filter dialog appears.
174 Creating an advanced filter

OmniPeek User Guide
ANYOP_UG.book Page 175 Friday, February 5, 2016 4:47 PM
3. Select Advanced in the Type list. The Advanced view of the Insert Filter dialog appears. The dialog displays a green icon representing a network adapter.
4. Define one or more filter nodes by And> or Or> and selecting and defining one of the available filter parameters. See also Filter types on page 178 for a description of the available filter types.
Each time you create a filter node, a dialog appears that lets you define the filter node. Each filter node added to the filter is displayed showing the relationship between the network adapter and the capture buffer (represented by a computer icon). See also Logical AND, OR, and NOT operators in advanced filters on page 175.
Note Click Help on the dialog to learn more about the available options and settings.
5. Complete the rest of the Insert Filter dialog and click OK. The new filter is now available whenever a list of available filters is displayed.
Logical AND, OR, and NOT operators in advanced filters
The Advanced view of the Edit Filter or Insert Filter dialog shows the parameters defined for the Advanced filter:
Advanced
Logical AND, OR, and NOT operators in advanced filters 175

Chapter 6: Creating and Using Filters
ANYOP_UG.book Page 176 Friday, February 5, 2016 4:47 PM
• A rectangular box represents each parameter (or filter node) that is added to the filter. If the Show details check box is selected, the details of the filter node are also displayed inside the box.
• Arrows indicate the flow of data through each filter node. A single arrow between filter nodes indicates an AND condition; any packets that match the filter node are allowed to pass through to the next stage. Multiple arrows between filter nodes indicate an OR condition (filter nodes stacked on top of each also indicates an OR condition); packets that match any of the filter nodes defined by the OR condition are allowed to pass through to the next stage.
• A red circle with an “X” inside a filter node indicates a NOT condition. All packets that do not match the filter node are allowed to pass through to the next stage.
• Right-click a filter node for the following options:
• And: Adds a new AND filter node to the currently selected node. Click the sub-menu arrow to the select the type of filter node.
• Or: Adds a new OR filter node to the currently selected node. Click the sub-menu arrow to the select the type of filter node.
• Not: Toggles the NOT condition of the currently selected node. A red circle with an “X” inside the filter node indicates a NOT condition. All packets that do not match the filter node are allowed to pass through to the next stage.
• Comment: Displays a dialog that allows you to add/edit a comment for the currently selected
• Swap And/Or: Toggles the currently selected node between an AND or OR filter node.
• Cut: Copies the currently selected node to the clipboard, and deletes the node.
• Copy: Copies the currently selected node to the clipboard.
• Copy Tree: Copies the currently selected node, and that node’s AND and OR nodes to the clipboard.
• Paste And: Pastes the nodes currently in the clipboard as an AND node to the currently selected node.
• Past Or: Pastes the nodes currently in the clipboard as an OR node to the currently selected node.
• Delete: Deletes the selected node.
• Right-click inside a blank area of the dialog for the following options:
• Show Details: Toggles displaying filter node details.
176 Creating an advanced filter

OmniPeek User Guide
ANYOP_UG.book Page 177 Friday, February 5, 2016 4:47 PM
• Show Comment in Title: Toggles displaying comments added to filter nodes.
• Zoom In: Zooms in on the display.
• Zoom Out: Zooms out on the display.
• Zoom Reset: Resets the display.
Tip You can also zoom in and out of the display by pressing the CTRL key while using your mouse’s scroll wheel.
An example of an Advanced filter is shown below:
The dialog displays a green icon representing a network adapter. Each parameter (or filter node) added to the filter is displayed showing the relationship between the network adapter and the capture buffer (represented by a computer icon).
Creating a new capture window based on a filterYou can create a new capture window that uses the filter that you are defining in the Insert / Edit Filter dialog as the only enabled filter. This allows you to quickly capture packets based solely on the new filter that you are creating.
AND NOT ORAND
Capture Buffer
Network Adapter
Creating a new capture window based on a filter 177

Chapter 6: Creating and Using Filters
ANYOP_UG.book Page 178 Friday, February 5, 2016 4:47 PM
To create a new capture window based on a filter:
1. Do one of the following to display the list of filters:
• On the View menu, click Filters
• Click the Filters view in an open capture window
• Click the Filters options from the Capture Engine Capture Options dialog
2. Click Insert. The Insert / Edit Filter dialog appears.
3. Create a simple or advanced filter. See Creating a simple filter on page 173 or Creating an advanced filter on page 174.
4. Click New Capture. The Capture Options dialog appears.
Note In the Filters options of the Capture Options dialog, the filter you created in the Insert / Edit Filter dialog, is the only filter selected.
5. Complete the Capture Options dialog as you normally would.
6. Click OK.
Filter typesThe following table contains the filter types available for creating simple and advanced filters. Not all filter types are available for creating simple filters.
Filter Type Description
802.11 Filters by channel, data rate, encryption state and more, based on information provided in the headers of 802.11 WLAN packets.
Address Filters by identity of the network node, either receiving or sending, for that packet. This can be a physical address, or a logical address under a particular protocol.
You can use the asterisk * character as a wildcard when specifying addresses. The program will replace the asterisk with its most inclusive equivalent.
Address filters support CIDR for the IP address space. You can use the /x desig-nation to define a smaller range of addresses (Subnet) on which to filter.
Analysis Module
Packets handled by the specified Analysis Module will match the filter.
178 Filter types

OmniPeek User Guide
ANYOP_UG.book Page 179 Friday, February 5, 2016 4:47 PM
Creating filters with the filter barThe Filter Bar allows you to create a variety of advanced filters quickly and directly in capture window views and in the Capture Engine Forensic Search dialog (see Navigating a capture window on page 36 and Chapter 7, Post-capture Analysis).
Application Filters by application.
Channel Filters by adapter for Omnipliance port.
Direction For WAN connections, allows you to match traffic bound in the to DTE direction (coming in from the WAN) or in the to DCE direction (going out onto the WAN).
Error Filters by one or more of four error conditions: CRC errors, Frame Alignment errors, Runt packets, and Oversize packets.
Length Filters by the length of the packet and matches those within the range you set, specified in bytes.
Pattern Filters by the presence of a particular character string (ASCII. hexadecimal, EBCDIC format, or regular expression) in each packet. Can be constrained to search within a specified location for greater efficiency.
Port Filters by port (or socket) within a particular protocol. IP, FTP, and HTTP provide services at different ports or sockets on the server. The default port for Web traf-fic under TCP, for example, is port 80. OmniPeek assumes that sub-protocols are using the standard default ports (well known ports in TCP and UDP, for exam-ple), but you can also set filters to test explicitly for traffic to and/or from particular ports, or from a range of ports (e.g., 80-100). When creating filters with multiple ports, you may use any combination of port numbers and names and a space, comma, or semi-colon as port delimiters (e.g., ‘http; ftp, 23 67’ could be used in a filter).
Protocol Filters by protocol and sub-protocols. For example, FTP is a sub-protocol of TCP, which is itself a sub-protocol of IP.
tcpdump Filters against a pcap-filter expression. A pcap-filter expression is made up using the guide found at http://www.manpagez.com/man/7/pcap-filter/.
Value Filters by numerical value of a particular part of each packet (at a particular off-set with a particular mask) for its relation (greater than, less than, equal to, and so forth) to the value you specify.
VLAN-MPLS Filters by VLAN IDs and MPLS labels.
Filter Type Description
Creating filters with the filter bar 179

Chapter 6: Creating and Using Filters
ANYOP_UG.book Page 180 Friday, February 5, 2016 4:47 PM
The parts of the Filter Bar are described below.
• Hide/Show options: Click to hide or show the Filter Bar in a capture window.
• Filter button: Click to display Filter Bar menu options.
• Recent Filters: Select a recently defined filter from this list.
• Insert Filter: Select a filter from this list.
• Insert Operator: Select an operator from this list: & (And), | (Or), ! (Not), () (Group)
• Insert Expression: Select a filter type expression from this list.
• Check Syntax: Select this option for a tooltip describing the syntax of your filter. For example, a correctly defined filter will display Filter OK in the tooltip.
• Help: Select this option to display information about how to use the filter bar.
• Filter Bar text box: The filters, operators, and expressions chosen from the Filter button menu appear in this text box as you select them.
Filter button
Apply button
Filter Bar text box
Hide/Show options
180 Creating filters with the filter bar

OmniPeek User Guide
ANYOP_UG.book Page 181 Friday, February 5, 2016 4:47 PM
• Apply Filter button: Click to apply your filter to the packets in the capture buffer of this capture window.
Using the filter bar
To create a filter with the filter bar:
1. Type the filter expression into the text box.
To automatically populate the text box, click Filter at the far left of the Filter Bar and make your choices from the menu items described above: Recent Filters, Insert Filter, Insert Operator, Insert Expression.
2. Click Apply at the far right of the Filter Bar to enable the filter in the capture window. The Selection Results dialog appears.
3. Click Hide selected packets, Hide unselected packets, Copy selected packets to new window, or Close.
For more information, see Hiding and unhiding packets on page 191 and Selecting related packets on page 192.
Filter bar syntax
This section defines and describes the Savvius operators, filter types, and argument names used in creating OmniPeek and Capture Engine filter bar filters.
• syntax: exp [op exp]*
Examples: SMB, smb | netbios, pspec(http) & (!pspec('802.3'))
where:
• op is an operator, one of: & (and) | (or)
• exp is an expression: (!exp), (exp), or keyword[(arglist)]
• keyword is either a filter type or named filter from the filter list
• arglist is a list of arguments: arg [, arg]*
• arg is an argument: [arg-name ':'] arg-value. The first part is optional for some filters where a default arg-name is assumed.
• arg-name is dependent on the filter type (see Filter expression table)
• arg-value is a value or value list (comma separated) for the arg-name, value or 'value' (see Filter expression table). If value has reserved characters (single-quote space comma) it must be quoted.
Using the filter bar 181

Chapter 6: Creating and Using Filters
ANYOP_UG.book Page 182 Friday, February 5, 2016 4:47 PM
Filter expression table
Note For filter expressions and arg-names: [] indicate optional arguments.
Filter Expression
Description ArgumentsArgument Description
Examples
addr Filter by address type: address type addr1: address [addr2: address][dir: direction])or address type: address
address type = ip, ipv6, ipx, ethernet, wireless, appletalk, decnet, wan.dlci direction = 1to2, 2to1, or both (default)
addr(ip:'10.4.3.*')addr(ethernet:'3com:*.*.*')addr(type: ip, addr1: 10.4.3.1, addr2: 10.5.1.1, dir: 1to2)
ip Filter by IP Address
ip address specifier list(no named arguments)
ip(10.4.3.6)ip('10.4.3.*')ip('10.4.3.*', '192.168.*.*')ip('www.savvius.com')
protocol Filter by protocol protocol type: protocol protocol type = protospec,Ethernet.Protocol, LSAP, SNAP, LAP, DDP, WAN.PPP, WAN.Frame.Relay
protocol(protospec: http)protocol(protospec:1418)see also pspec
app Filter by application (by name)
application name (no named arguments)
application name is case insensitive (e.g., ‘ebay’, and ‘EBAY’ will all work correctly)
app(‘eBay’)app(‘instagram’)
pspec Filter by protospec
protocol list(no named arguments)
pspec(http)pspec(HTTP)pspec(HTTP, 'NB Sess Init')pspec(1418, 6018)
port Filter by port [type: port type][port1: port][port2: port][dir: direction]
port type = tcpudp (default), netware, atalk
port = number or name table port specifier (port1 is default)
direction = 1to2, 2to1, or both (default)
port(80)port(80, 8080)port(tcpudp: 80)port(port1: 80, port2: 1523, dir:1to2)
182 Creating filters with the filter bar
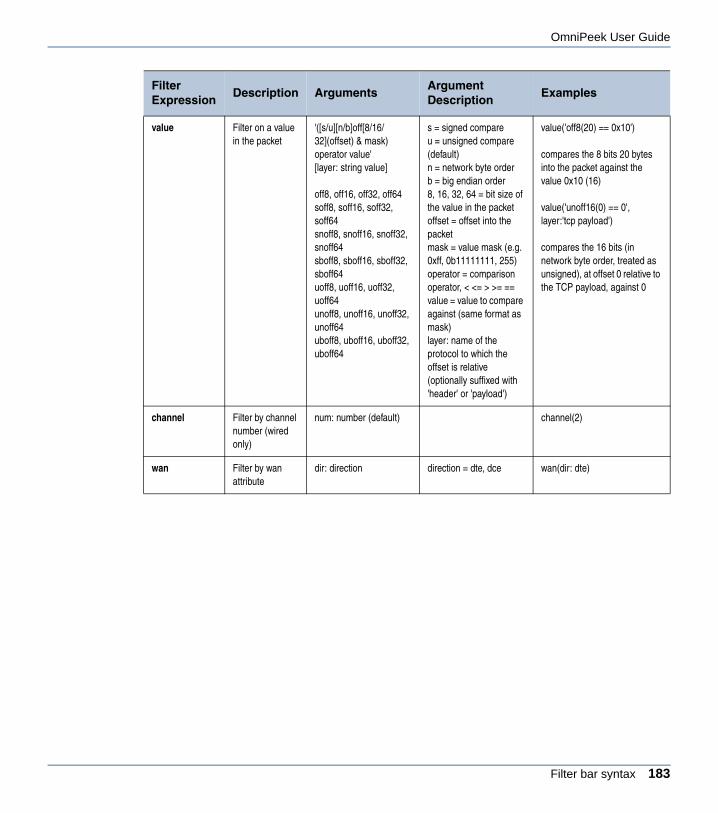
OmniPeek User Guide
ANYOP_UG.book Page 183 Friday, February 5, 2016 4:47 PM
value Filter on a value in the packet
'([s/u][n/b]off[8/16/32](offset) & mask) operator value'[layer: string value]
off8, off16, off32, off64soff8, soff16, soff32, soff64snoff8, snoff16, snoff32, snoff64sboff8, sboff16, sboff32, sboff64uoff8, uoff16, uoff32, uoff64unoff8, unoff16, unoff32, unoff64uboff8, uboff16, uboff32, uboff64
s = signed compareu = unsigned compare (default)n = network byte orderb = big endian order8, 16, 32, 64 = bit size of the value in the packetoffset = offset into the packetmask = value mask (e.g. 0xff, 0b11111111, 255)operator = comparison operator, < <= > >= ==value = value to compare against (same format as mask)layer: name of the protocol to which the offset is relative (optionally suffixed with 'header' or 'payload')
value('off8(20) == 0x10')
compares the 8 bits 20 bytes into the packet against the value 0x10 (16)
value('unoff16(0) == 0', layer:'tcp payload')
compares the 16 bits (in network byte order, treated as unsigned), at offset 0 relative to the TCP payload, against 0
channel Filter by channel number (wired only)
num: number (default) channel(2)
wan Filter by wan attribute
dir: direction direction = dte, dce wan(dir: dte)
Filter Expression
Description ArgumentsArgument Description
Examples
Filter bar syntax 183

Chapter 6: Creating and Using Filters
ANYOP_UG.book Page 184 Friday, February 5, 2016 4:47 PM
wireless Filter by wireless attribute
(only one is required)media: media type channelband: band typechannelnum: numeric valuedatarate: numeric valueminsignal: numeric valuemaxsignal: numeric valuemindbmsignal: numeric valuemaxdbmsignal: numeric valueminnoise: numeric valuemaxnoise: numeric valuemindbmnoise: numeric valuemaxdbmnoise: numeric valueencrypted: boolean valuedecrypterr: boolean valuebssid: bssid valuesourceap: ip addressflagsn: bit mask specifying 802.11n flags
media type = 802.11b, 802.11a, 802.11 (default)band type = a, b, bg, n, at (a turbo), gt (g turbo), sg (super g), s1 (licensed A 1MHz), s5 (licensed A 5MHz), s10 (licensed A 10MHz), s15 (licensed A 15MHz), s20 (licensed A 20MHz)boolean value = yes, no, true, false, on, off, 1, 0
wireless(media:'802.11b', channelnum: 1, encrypted: 1)
pattern Filter by pattern search type:'search string'[case: boolean value][start: integer value] [end: integer value] [layer: string value]
search type = ASCII (default), Unicode, Hex, RegEx, EBCDICboolean value = yes, no, true, false, on, off, 1, 0case on means to use a case sensitive matchstart, end are the offsets within the packet to start or end the search layer is the name of the protocol at which the search should start (optionally suffixed with 'header' or 'payload')
pattern(ascii: 'smb', case: off)
pattern('SMB')pattern(hex: FF464D50) pattern('GET', layer: 'tcp payload')
Filter Expression
Description ArgumentsArgument Description
Examples
184 Creating filters with the filter bar

OmniPeek User Guide
ANYOP_UG.book Page 185 Friday, February 5, 2016 4:47 PM
Editing filtersYou can edit an existing filter from any dialog that displays a list of available filters (for exam-ple, the Filters view of a capture window or Filters options in the Capture Options dialog).
To edit a filter:
1. From any dialog that displays a list of available filters, do any of the following to display the Edit Filter dialog:
• Select the filter and click Edit on the toolbar.
• Right-click the filter and select Edit.
• Double-click the filter.
Note The Edit Filter dialog is essentially identical to the Insert Filter dialog used to create a Simple or Advanced filter.
2. Make the desired edits in the Edit Filter dialog and click OK.
Note Click Help on the dialog to learn about the available options and settings.
length Filter on a size of the packet
(only one is required)min: min lengthmax: max length
Either min or max is required, or a single numeric value for exact length matches
length(64)length(min: 128)length(max: 256) length(min:128,max:256)
plugin Filter by plugin plug-in name (no named arguments)
plugin('FTP Analysis')
tcpdump Filter using tcpdump filter syntax
See tcpdump syntax online
See tcpdump syntax online
tcpdump('tcp src port 80')
VLAN Filter by VLAN Identifier
vlan(id1, [id2, ...idx]) id is a number (0-4095) or id-range
vlan(100)vlan(100, 200-210)
MPLS Filter by MPLS Label
mpls(label1, [label2, ...labelx])
label is a number (0-1048575) or label-range
mpls(10)mpls(10, 20-50)
filter Filter using existing filter
filter name (no named arguments)
filter keyword is optional filter('SMB')SMB
Filter Expression
Description ArgumentsArgument Description
Examples
Editing filters 185

Chapter 6: Creating and Using Filters
ANYOP_UG.book Page 186 Friday, February 5, 2016 4:47 PM
Duplicating filtersDuplicating a filter allows you to make a new filter based on an existing filter. Once a filter is duplicated, you can edit the duplicate with the settings required for the new filter.
To duplicate a filter:
1. From any dialog that displays a list of available filters (for example, the Filters view of a capture window or Filters options in the Capture Options dialog), do any of the following to make a copy of the desired filter:
• Select the filter and click Duplicate on the toolbar.
• Right-click the filter and choose Duplicate.
A copy of the filter is created in the list of available filters with the word “copy” appended to the end of the original filter name.
2. Edit the copy and save it under a new name. See Editing filters on page 185 for information on editing a filter.
Saving and loading filtersYou can save and load filters. This allows you to create multiple sets of filters for different requirements. You can choose to save a whole set of filters or just a group of selected filters. All saved filter files have the *.flt file extension.
To save the whole set of filters:
1. From any dialog that displays a list of available filters (for example, the Filters view of a capture window or Filters options in the Capture Options dialog), do any of the following to save all of the filters displayed in the list:
• On the File menu, click Save Filters….
• Click Export on the toolbar.
• Right-click any filter and choose Export.
The Save As dialog appears.
2. Choose a location and type a name for the filter file and click Save.
To save a one or more selected filters:
1. From any window that displays a list of available filters, right-click one or more filters and choose Export Selected.
2. From the Save As dialog, choose a location and type a name for the filter file and click Save.
186 Duplicating filters
OmniPeek User Guide
ANYOP_UG.book Page 187 Friday, February 5, 2016 4:47 PM
To load a saved filter file:
1. From any window that displays a list of available filters, do any of the following to load a saved filter file:
• Click Import on the toolbar.
• Right-click any filter and choose Import.
A dialog appears asking you to Delete all filters before importing.
2. Click Yes to delete all existing filters before importing the saved filter file; click No to keep all existing filters before importing the saved filter file.
Note Imported filters are added to the existing list of available filters. Filters with the same name and parameters are ignored. Filters with the same name but different parameters are added to the list with “copy” added to their names.
3. From the Open dialog, select the saved filter file and click Open.
The filters are added to the list of available filters.
Saving and loading filters 187

Chapter 6: Creating and Using Filters
ANYOP_UG.book Page 188 Friday, February 5, 2016 4:47 PM
188 Saving and loading filters

C H A P T E R 7
ANYOP_UG.book Page 189 Friday, February 5, 2016 4:47 PM
Post-capture Analysis
In this chapter:
About post-capture analysis . . . . . . . . . . . . . . . . . . . . . . . . . . . . . . . . . . . . . . . 190
Saving packets . . . . . . . . . . . . . . . . . . . . . . . . . . . . . . . . . . . . . . . . . . . . . . . . . 190
Copying selected packets to a new window . . . . . . . . . . . . . . . . . . . . . . . . . . . 191
Hiding and unhiding packets. . . . . . . . . . . . . . . . . . . . . . . . . . . . . . . . . . . . . . . 191
Selecting related packets . . . . . . . . . . . . . . . . . . . . . . . . . . . . . . . . . . . . . . . . . 192
Label selected packets . . . . . . . . . . . . . . . . . . . . . . . . . . . . . . . . . . . . . . . . . . . 195
Finding strings in packets . . . . . . . . . . . . . . . . . . . . . . . . . . . . . . . . . . . . . . . . . 197
Selecting packets matching user-defined criteria . . . . . . . . . . . . . . . . . . . . . . . 198
Forensic search from the Files tab . . . . . . . . . . . . . . . . . . . . . . . . . . . . . . . . . . 201
Forensic search from the Forensics tab . . . . . . . . . . . . . . . . . . . . . . . . . . . . . . 206
Forensic search from the ‘Forensics Capture’ window. . . . . . . . . . . . . . . . . . . 216
Using the Download Engine Packet Files wizard . . . . . . . . . . . . . . . . . . . . . . . 222
189
Chapter 7: Post-capture Analysis
ANYOP_UG.book Page 190 Friday, February 5, 2016 4:47 PM
About post-capture analysisMuch of the work of troubleshooting problems on a network is a process of narrowing down the possibilities, examining first one set of clues and then another. OmniPeek provides a num-ber of tools for selecting, grouping, and sorting packets by a variety of attributes to help the network engineer perform targeted analysis.
The techniques for post-capture analysis are applied to packets that have already been cap-tured and are in the buffer of a capture window. You can apply the techniques described here to select items in most views of a capture window.
Tip Standard Windows selection techniques are available throughout OmniPeek. For example, hold down the Ctrl key when you click to select multiple items.
Network forensics
Network forensics is the retrospective analysis of network traffic for the purpose of conducting an investigation. See the following sections for information on how to use OmniPeek in differ-ent ways to perform network forensics on your own network.
• Forensic search from the Files tab on page 201
• Forensic search from the Forensics tab on page 206
• Forensic search from the ‘Forensics Capture’ window on page 216
Saving packetsYou can choose to save all packets currently visible, or just the selected packets in the capture window to a capture file.
Note You can save packets in an OmniPeek capture window only when the capture is stopped. In a Capture Engine capture window, you can save packets while the capture is still capturing. When you save packets in a Capture Engine capture window, the packets are saved to a capture file on the OmniPeek computer.
To save all packets:
1. Select the desired view to make it active.
2. Make sure the capture window is not currently capturing packets (click Stop Capture).
190 About post-capture analysis

OmniPeek User Guide
ANYOP_UG.book Page 191 Friday, February 5, 2016 4:47 PM
3. On the File menu, click Save All Packets… (or right-click inside the capture window and select Save All Packets…).
4. Enter a file name and select the file type.
5. Click Save.
To save selected packets:
1. Select the desired packets in the capture window.
2. On the File menu, click Save Selected Packets… (or right-click the selected packets and select Save Selected Packets…).
3. Enter a file name and select the file type.
4. Click Save.
Copying selected packets to a new windowYou can copy selected packets into a new capture window. The packets are renumbered, but the original packet order is retained.
To copy selected packets to a new window:
1. Select the desired packets in the capture window.
2. On the Edit menu, click Copy Selected Packets to New Window (or right-click the selected packets and select Copy Selected Packets to New Window). A temporary capture window is created containing only the selected packets.
Hiding and unhiding packetsTo reduce the number of visible packets in the Packets view of a capture window, you can hide packets from the view without actually deleting them from a capture window. Hide func-tions are disabled for capture windows when the capture is still running.
Hidden packets are not processed by Analysis Modules or used when calculating the various capture window statistics. Additionally, they are not printed when the contents of the window are printed, and are not saved when you choose Save All Packets… from the File menu. They are, however, deleted when you select Clear All Packets from the Edit menu or press Ctrl + B.
Hiding or Unhiding packets causes all packets in the capture window to be reprocessed by any enabled Analysis Modules and causes statistics to be recalculated based on the changed visible contents of the capture window’s buffer.
Copying selected packets to a new window 191
Chapter 7: Post-capture Analysis
ANYOP_UG.book Page 192 Friday, February 5, 2016 4:47 PM
Note The hide and unhide functions are not supported for a Capture Engine capture window. The packets from a Capture Engine capture window must first be brought into an OmniPeek capture window in order to use the hide functions. See Using hide and unhide on a Capture Engine.
To use the hide and unhide functions:
• To hide the selected packets, on the Edit menu, click Hide Selected Packets (or press Ctrl + H).
• To hide unselected packets, on the Edit menu, click Hide Unselected Packets (or press Ctrl + Shift + H).
• To restore all hidden packets to view, on the Edit menu, click Unhide All Packets (or press Ctrl + U). You can continue to selectively hide additional packets but cannot selectively unhide packets.
Using hide and unhide on a Capture Engine
The hide functions (choosing Hide Selected Packets, Hide Unselected Packets, or Unhide All Packets from the Edit menu) are not supported directly from a Capture Engine capture window. You must first bring the packets into an OmniPeek capture window. There are several ways to do this:
• Select the relevant packets in the Capture Engine capture window, then on the File menu, click Save Selected Packets… to save the packets to an OmniPeek capture file. Saving packets on page 190.
• Select the relevant packets in the Capture Engine capture window, then on the File menu, click Copy Selected Packets to New Window to save the packets to an OmniPeek capture file. Copying selected packets to a new window on page 191.
• Make the Packets view of the Capture Engine capture window active, then on the File menu, click Save All Packets… to save the contents of the capture window buffer to an OmniPeek capture file. See Saving packets on page 190.
• From the Files tab of the Capture Engines window, transfer the remote packet file to the OmniPeek computer, then open the file in a capture window. For details, see Forensic search from the Files tab on page 201.
Selecting related packetsTo find packets that are like, or related to the packet or data item currently selected, you can use the Select Related Packets functions. The Select Related Packets functions offer a set
192 Selecting related packets
OmniPeek User Guide
ANYOP_UG.book Page 193 Friday, February 5, 2016 4:47 PM
of selection criteria based on the parameter you choose and on the values found in the cur-rently selected item. It then tests all the visible packets in the Packets view of the capture win-dow against those criteria and selects all of the packets that match the criteria.
Tip In capture windows, you can use the Filter Bar to create a wide variety of advanced filters that allow you to quickly and directly select packets similar to using the Select Related Packets functions. See Creating filters with the filter bar on page 179.
To select related packets:
1. Select the item(s) in the Packets, Expert, Nodes, Protocols, WLAN, or Peer Map views of a capture window.
2. On the Edit menu, click Select Related Packets (or right-click and select Select Related Packets).
3. Select a choice from the submenu:
Note The submenu is context-sensitive and only allows selections appropriate for the item you selected.
• By Source: Selects packets matching the source address.
• By Destination: Selects packets matching the destination address.
• By Source and Destination: Selects packets matching both the source and destination addresses.
• By VLAN: Selects packets matching the VLAN (Virtual LAN).
• By Protocol: Selects packets matching the protocol.
• By Client: Unique to the Expert view, selects all packets to or from the address shown in the Client Addr column.
• By Server: Unique to the Expert view, selects all packets to or from the address shown in the Server Addr column.
• By Client and Server: Unique to the Expert view, selects all packets between the selected Client and Server addresses.
• By Port: Selects packets matching the port address.
• By Application: Selects packets matching the application.
• By Flow: Selects packets sent between two nodes (in either direction), using the matching protocol and port.
Selecting related packets 193
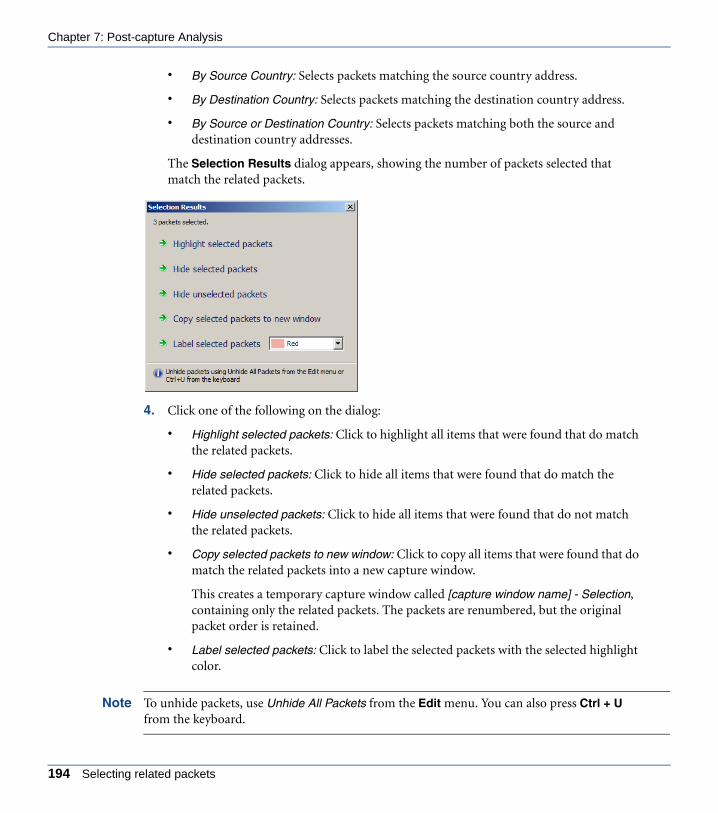
Chapter 7: Post-capture Analysis
ANYOP_UG.book Page 194 Friday, February 5, 2016 4:47 PM
• By Source Country: Selects packets matching the source country address.
• By Destination Country: Selects packets matching the destination country address.
• By Source or Destination Country: Selects packets matching both the source and destination country addresses.
The Selection Results dialog appears, showing the number of packets selected that match the related packets.
4. Click one of the following on the dialog:
• Highlight selected packets: Click to highlight all items that were found that do match the related packets.
• Hide selected packets: Click to hide all items that were found that do match the related packets.
• Hide unselected packets: Click to hide all items that were found that do not match the related packets.
• Copy selected packets to new window: Click to copy all items that were found that do match the related packets into a new capture window.
This creates a temporary capture window called [capture window name] - Selection, containing only the related packets. The packets are renumbered, but the original packet order is retained.
• Label selected packets: Click to label the selected packets with the selected highlight color.
Note To unhide packets, use Unhide All Packets from the Edit menu. You can also press Ctrl + U from the keyboard.
194 Selecting related packets
OmniPeek User Guide
ANYOP_UG.book Page 195 Friday, February 5, 2016 4:47 PM
Label selected packetsFor packets displayed in the Packets view of an OmniPeek capture window, you can right-click one or more packets and select from the context menus to add, select, or clear colored labels (Red, Orange, Yellow, Green, Blue, Purple and Gray) to or from the packets. The colored label appears as a colored highlight across the entire row of the packet. When a row has a col-ored label applied to it, and the row is currently selected, a colored globe the same color as the colored highlight appears to the left of the packet number.
Adding colored labels to packets lets you visually group those packets inside the Packets view so that they are easy to identify. For example, you can select all the TCP packets with a SYN flag and add the same colored label to them. This will let you easily identify the start of a flow since a flow always starts with a TCP packet that has the SYN flag.
Tip When used in combination with the ‘Select Related’ feature, the ‘Label’ packets feature lets you easily drill down into the packets that are of most interest to you in analyzing. See Selecting related packets on page 192.
Label selected packets 195

Chapter 7: Post-capture Analysis
ANYOP_UG.book Page 196 Friday, February 5, 2016 4:47 PM
To add a label to packets:
1. Select the Packets view of an OmniPeek capture window.
2. Right-click one or more packets you wish to label, and on the context menu, point to Label Selected Packets, and then click the desired label color to apply to the selected packets. Selecting ‘None’ from this menu removes any colored label applied to the selected packets. Selecting a color from this menu applies that color label across the entire row of the selected packets.
To select labeled packets:
1. Select the Packets view of an OmniPeek capture window.
2. Right-click one or more packets that are labeled with the color you wish to select, and on the context menu, point to Select Labeled Packets, and then click the desired label color. Selecting ‘All’ from this menu selects all packets that have a colored label applied to them. Selecting a color from this menu selects only the packets labeled with that color.
196 Label selected packets
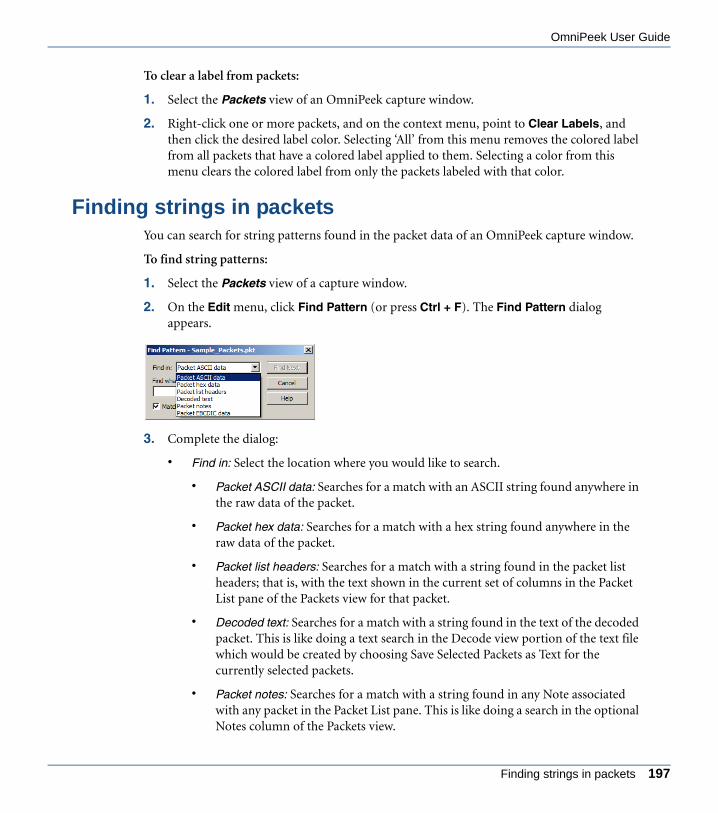
OmniPeek User Guide
ANYOP_UG.book Page 197 Friday, February 5, 2016 4:47 PM
To clear a label from packets:
1. Select the Packets view of an OmniPeek capture window.
2. Right-click one or more packets, and on the context menu, point to Clear Labels, and then click the desired label color. Selecting ‘All’ from this menu removes the colored label from all packets that have a colored label applied to them. Selecting a color from this menu clears the colored label from only the packets labeled with that color.
Finding strings in packetsYou can search for string patterns found in the packet data of an OmniPeek capture window.
To find string patterns:
1. Select the Packets view of a capture window.
2. On the Edit menu, click Find Pattern (or press Ctrl + F). The Find Pattern dialog appears.
3. Complete the dialog:
• Find in: Select the location where you would like to search.
• Packet ASCII data: Searches for a match with an ASCII string found anywhere in the raw data of the packet.
• Packet hex data: Searches for a match with a hex string found anywhere in the raw data of the packet.
• Packet list headers: Searches for a match with a string found in the packet list headers; that is, with the text shown in the current set of columns in the Packet List pane of the Packets view for that packet.
• Decoded text: Searches for a match with a string found in the text of the decoded packet. This is like doing a text search in the Decode view portion of the text file which would be created by choosing Save Selected Packets as Text for the currently selected packets.
• Packet notes: Searches for a match with a string found in any Note associated with any packet in the Packet List pane. This is like doing a search in the optional Notes column of the Packets view.
Finding strings in packets 197

Chapter 7: Post-capture Analysis
ANYOP_UG.book Page 198 Friday, February 5, 2016 4:47 PM
• Packet EBCDIC data: Searches for a match with an EBCDIC string found anywhere in the raw data of the packet.
• Find what: Type or select the string pattern you would like to find.
• Match case: Select this check box to match the string exactly as typed.
4. Click Find Next.
The first packet matching the string will be highlighted in the Packets view. To find the next matching packet in the sequence, on the Edit menu, click Find Next (or press F3).
Tip The Find Pattern and Find Next commands search the packets in packet number order, starting from, but not including, the currently selected packet.
Note The Find Pattern and Find Next commands are not supported from a Capture Engine capture window. In order to use these techniques, you must first save the packets to an OmniPeek capture file. See Using hide and unhide on a Capture Engine on page 192.
Selecting packets matching user-defined criteriaYou can use the Select… command and Select dialog to select captured packets based on var-ious selection criteria. You can choose to select either all packets matching your criteria, or all packets not matching your criteria. Only the visible packets displayed in the active capture window can be selected.
The selection criteria includes the following:
• Packets matching one or more filters
• Packets containing a certain ASCII or hex string
• Packets that are of a certain length
• Packets that match a specific Analysis Module
Note In a Capture Engine capture window, the Select dialog selects all matching packets in the capture buffer resident on the Capture Engine.
Important! Packet slicing can affect the operation of some selection tools. When used from the Select dialog, filters, Analysis Modules and other selection tools read packet contents from the captured packets to determine protocols, addresses and related information. If the packet slice
198 Selecting packets matching user-defined criteria
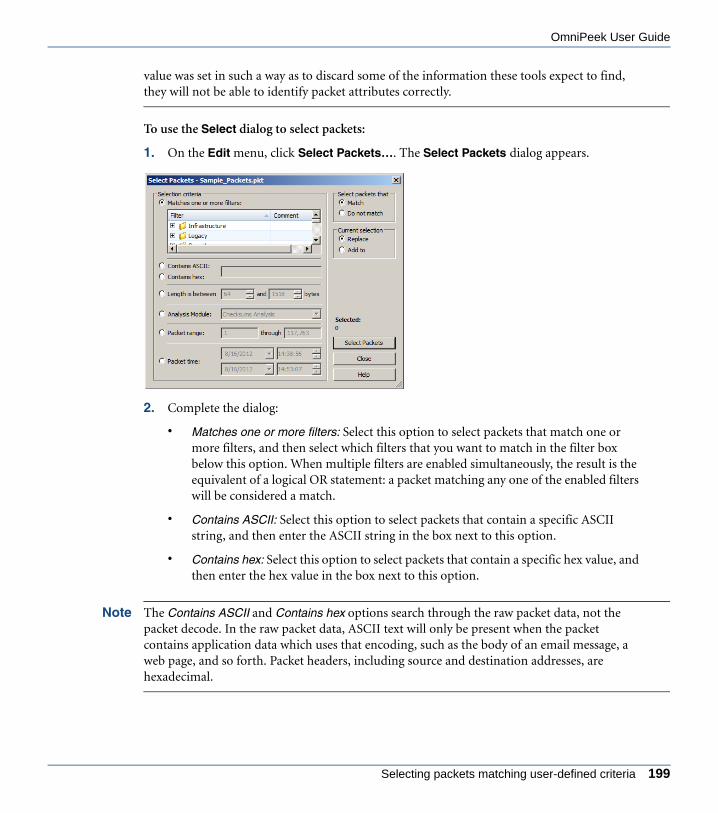
OmniPeek User Guide
ANYOP_UG.book Page 199 Friday, February 5, 2016 4:47 PM
value was set in such a way as to discard some of the information these tools expect to find, they will not be able to identify packet attributes correctly.
To use the Select dialog to select packets:
1. On the Edit menu, click Select Packets…. The Select Packets dialog appears.
2. Complete the dialog:
• Matches one or more filters: Select this option to select packets that match one or more filters, and then select which filters that you want to match in the filter box below this option. When multiple filters are enabled simultaneously, the result is the equivalent of a logical OR statement: a packet matching any one of the enabled filters will be considered a match.
• Contains ASCII: Select this option to select packets that contain a specific ASCII string, and then enter the ASCII string in the box next to this option.
• Contains hex: Select this option to select packets that contain a specific hex value, and then enter the hex value in the box next to this option.
Note The Contains ASCII and Contains hex options search through the raw packet data, not the packet decode. In the raw packet data, ASCII text will only be present when the packet contains application data which uses that encoding, such as the body of an email message, a web page, and so forth. Packet headers, including source and destination addresses, are hexadecimal.
Selecting packets matching user-defined criteria 199

Chapter 7: Post-capture Analysis
ANYOP_UG.book Page 200 Friday, February 5, 2016 4:47 PM
• Length is between ____ and _____ bytes: Select this option to select packets that are of a certain length, and then type or enter the minimum and maximum number of bytes
• Analysis Module: Select this option to select packets that match an Analysis Module, and then select which Analysis Module that you want to match from the list.
Note When you open the Select dialog for a Capture Engine capture window, only the relevant Analysis Modules available on the Capture Engine will be shown. If you disabled Analysis Modules for this Capture Engine capture window in the Analysis Options view of the remote Capture Options dialog, no packets will be selected when you choose the Analysis Modules option in the Select dialog.
• Packet range: Select this option to select packets that are within a range of packets, and then enter the desired range.
• Packet time: Select this option to select packets that are within a specific time range, and then specify the time range by selecting or entering both the starting and ending dates and times.
• Match: Select this option to select packets that match your selection criteria.
• Do not match: Select this option to select packets that do not match your selection criteria.
• Replace: Select this option to display only the newly selected packets.
• Add to: Select this option to display any packets currently selected and the newly selected packets.
• Selected: Displays the number of packets selected.
• Select Packets: Click to select packets that match your selection criteria. Once you click Select Packets, a Selection Results dialog appears noting how many packets were selected. You can then choose the option to Hide selected packets, Hide unselected packets, Copy selected packets to new window, or Close to simply close the dialog without further action.
3. Click Select Packets to perform the selection.
The Selection Results dialog appears, showing the number of packets selected that match the selection criteria.
200 Selecting packets matching user-defined criteria

OmniPeek User Guide
ANYOP_UG.book Page 201 Friday, February 5, 2016 4:47 PM
4. Click one of the following on the dialog:
• Hide selected packets: Click to hide all items that were found that do match the related packets.
• Hide unselected packets: Click to hide all items that were found that do not match the related packets.
• Copy selected packets to new window: Click to copy all items that were found that do match the related packets into a new capture window.
This creates a temporary capture window called [capture window name] - Selection, containing only the related packets. The packets are renumbered, but the original packet order is retained.
• Close: Click to close the dialog. All items that were found that do match the related packets remain highlighted in the capture window.
Note To unhide packets, use Unhide All Packets from the Edit menu. You can also press Ctrl + U from the keyboard.
Forensic search from the Files tabThe Files tab in the Capture Engines window displays a listing of all the capture files saved to the Capture Engine. Performing a forensic search from the Files tab lets you sort through hours or even days worth of network traffic, from one or more Capture Engine capture files, for specific data you wish to analyze further.
Note You can also perform a forensic search from the Forensics tab and from the Forensics Capture window. See Forensic search from the Forensics tab on page 206 and Forensic search from the ‘Forensics Capture’ window on page 216.
Forensic search from the Files tab 201

Chapter 7: Post-capture Analysis
ANYOP_UG.book Page 202 Friday, February 5, 2016 4:47 PM
Important! One or more capture files saved to the Capture Engine are required before you can perform a forensic search. See Capture Engine capture files on page 64 and Forensics capture on a Capture Engine on page 68.
To perform a forensic search from the Files tab:
1. From the Capture Engines window, select the Files tab of a connected Capture Engine.
The parts of the Files tab are described here:
• Capture files: Displays all of the Capture Engine capture files saved to the Capture Engine.
Forensic Search
Download Packets Refresh
DeleteUpload Packets
Capture Files
202 Forensic search from the Files tab
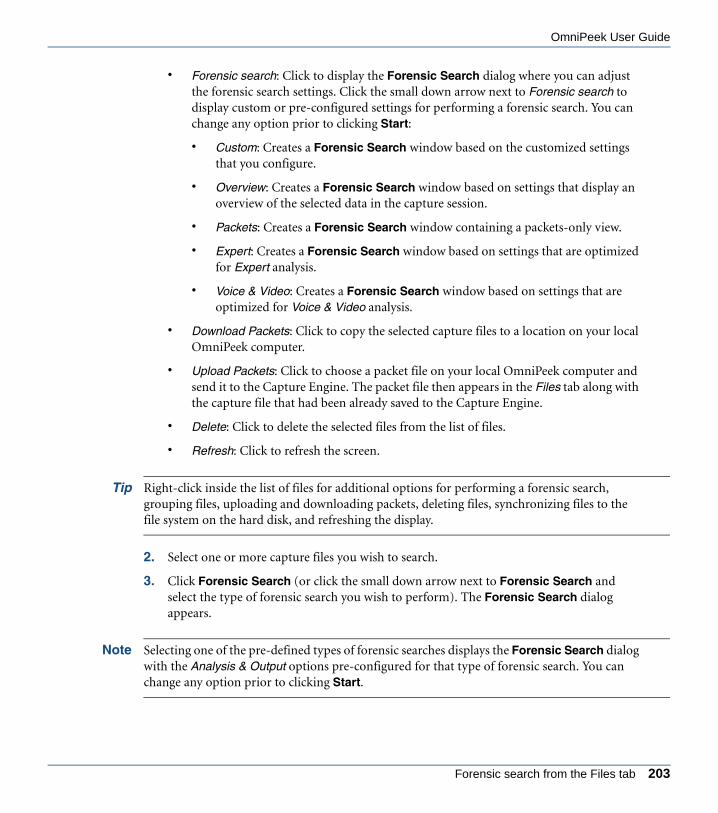
OmniPeek User Guide
ANYOP_UG.book Page 203 Friday, February 5, 2016 4:47 PM
• Forensic search: Click to display the Forensic Search dialog where you can adjust the forensic search settings. Click the small down arrow next to Forensic search to display custom or pre-configured settings for performing a forensic search. You can change any option prior to clicking Start:
• Custom: Creates a Forensic Search window based on the customized settings that you configure.
• Overview: Creates a Forensic Search window based on settings that display an overview of the selected data in the capture session.
• Packets: Creates a Forensic Search window containing a packets-only view.
• Expert: Creates a Forensic Search window based on settings that are optimized for Expert analysis.
• Voice & Video: Creates a Forensic Search window based on settings that are optimized for Voice & Video analysis.
• Download Packets: Click to copy the selected capture files to a location on your local OmniPeek computer.
• Upload Packets: Click to choose a packet file on your local OmniPeek computer and send it to the Capture Engine. The packet file then appears in the Files tab along with the capture file that had been already saved to the Capture Engine.
• Delete: Click to delete the selected files from the list of files.
• Refresh: Click to refresh the screen.
Tip Right-click inside the list of files for additional options for performing a forensic search, grouping files, uploading and downloading packets, deleting files, synchronizing files to the file system on the hard disk, and refreshing the display.
2. Select one or more capture files you wish to search.
3. Click Forensic Search (or click the small down arrow next to Forensic Search and select the type of forensic search you wish to perform). The Forensic Search dialog appears.
Note Selecting one of the pre-defined types of forensic searches displays the Forensic Search dialog with the Analysis & Output options pre-configured for that type of forensic search. You can change any option prior to clicking Start.
Forensic search from the Files tab 203
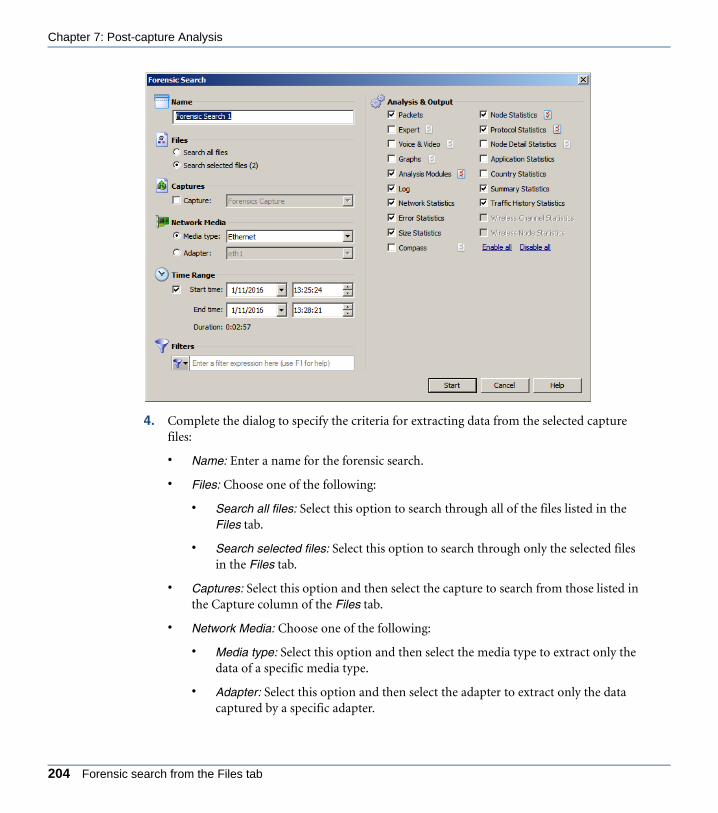
Chapter 7: Post-capture Analysis
ANYOP_UG.book Page 204 Friday, February 5, 2016 4:47 PM
4. Complete the dialog to specify the criteria for extracting data from the selected capture files:
• Name: Enter a name for the forensic search.
• Files: Choose one of the following:
• Search all files: Select this option to search through all of the files listed in the Files tab.
• Search selected files: Select this option to search through only the selected files in the Files tab.
• Captures: Select this option and then select the capture to search from those listed in the Capture column of the Files tab.
• Network Media: Choose one of the following:
• Media type: Select this option and then select the media type to extract only the data of a specific media type.
• Adapter: Select this option and then select the adapter to extract only the data captured by a specific adapter.
204 Forensic search from the Files tab

OmniPeek User Guide
ANYOP_UG.book Page 205 Friday, February 5, 2016 4:47 PM
• Time Range: Select this option and then configure the start and end times to extract the data.
• Start time: Set the start date and time for extracting data.
• End time: Set the end date and time for extracting data.
• Duration: Displays the amount of time between the specified start and end times.
• Filters: Click to select a filter from the display list. All packets will be accepted if no filters are applied to the forensic search.
To create an advanced filter, click Filters and select Insert filter, Insert Operator, or Insert Expression from the display. For detailed instructions, please see Creating filters with the filter bar on page 179.
• Analysis & Output: Select one or more of the options to enable and display that particular view in the new Forensic Search window. For various Analysis & Output options that have additional configurable settings, click submenu to the right of the option.
5. Click Start. A new Forensic Search window appears along with two progress bars at the top of the window. (Clicking Stop stops the search and then completes the processing of the packets.)
Once the processing of the packets is complete, the progress bars go away and the new Forensic Search window is populated with the data found based on the criteria you selected above.
Forensic search from the Files tab 205
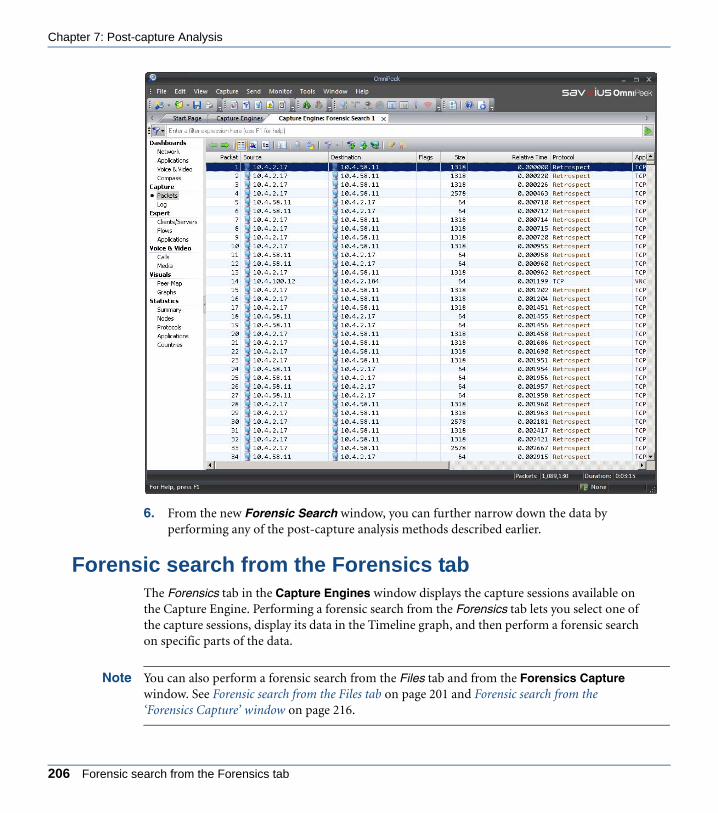
Chapter 7: Post-capture Analysis
ANYOP_UG.book Page 206 Friday, February 5, 2016 4:47 PM
6. From the new Forensic Search window, you can further narrow down the data by performing any of the post-capture analysis methods described earlier.
Forensic search from the Forensics tabThe Forensics tab in the Capture Engines window displays the capture sessions available on the Capture Engine. Performing a forensic search from the Forensics tab lets you select one of the capture sessions, display its data in the Timeline graph, and then perform a forensic search on specific parts of the data.
Note You can also perform a forensic search from the Files tab and from the Forensics Capture window. See Forensic search from the Files tab on page 201 and Forensic search from the ‘Forensics Capture’ window on page 216.
206 Forensic search from the Forensics tab

OmniPeek User Guide
ANYOP_UG.book Page 207 Friday, February 5, 2016 4:47 PM
Important! One or more capture files saved to the Capture Engine are required before you can perform a forensic search. See Capture Engine capture files on page 64 and Forensics capture on a Capture Engine on page 68.
To perform a forensic search from the Forensics tab:
1. From the Capture Engines window, select the Forensics tab of a connected Capture Engine. The Forensics tab displays the data currently available from the capture storage space of the Capture Engine.
The parts of the Forensics tab are described here:
Forensics TabTimeline Graph View Type Time Window Forensic SearchRefresh
Nested Tabs
Top Talkers by IP Address Top Applications by BytesHeader Information Download Packets
Forensic search from the Forensics tab 207

Chapter 7: Post-capture Analysis
ANYOP_UG.book Page 208 Friday, February 5, 2016 4:47 PM
• Header Information: The header information displays statistics for the capture session (data start time, data end time, duration, status, packets, packets dropped, adapter, etc.).
• Top Talkers by IP Address: This display shows a graph of top “talkers” on the network, broken out by node for the selected area in the Timeline graph below. You can right-click inside the display to display top talkers by Physical Address, IP Address, or IPv6 Address; or to select a Bar or Pie display. Mouse over a bar (or slice) of the graph to view a tooltip with additional details for the node.
• Top Applications: This display shows a graph of top applications on the network for the selected area in the Timeline graph below. You can right-click inside the display to toggle the display with the Top Protocols display, or to select a Bar or Pie display. Mouse over a bar (or slice) of the graph to view a tooltip with additional details for the application.
• Top Protocols: This display shows a graph of top protocols on the network for the selected area in the Timeline graph below. You can right-click inside the display to toggle the display with the Top Applications display, or to select a Bar or Pie display. Mouse over a bar (or slice) of the graph to view a tooltip with additional details for the protocol.
• Timeline graph: The Timeline graph displays the data of the selected capture session. Only one capture session at a time can be displayed inside the graph. By default, the graph shows network utilization in Mbits/s, but other statistics can be graphed as well by selecting the View type.
Here are descriptions of other parts of the Timeline graph:
• Right-click inside the graph to perform a forensic search (see Forensic search below), download selected packets to a capture file, refresh the window, or choose a different graph format: Bar, Stacked Bar, Skyline, Area, Stacked Area, Line, Line/Points, Linear, and Logarithmic. Additionally, you can also toggle displaying the minimum and maximum points for each series on the graph.
• Mouse over a data point in the graph to view a tooltip displaying timestamp and size information (e.g., time and rate, time and packet size, etc.).
• Any time there is more data than can be displayed on the screen, a scroll bar appears below the graph and allows you to view different points of time in the graph. (If the Time window is set to Automatic, the scroll bar will never appear.)
• If the Time window is set to anything other than Automatic, a scroll bar appears below the graph and allows you to view different points of time in the graph.
• View type: Select the type of statistics to display in the Timeline graph. You can select from:
208 Forensic search from the Forensics tab

OmniPeek User Guide
ANYOP_UG.book Page 209 Friday, February 5, 2016 4:47 PM
• Network Utilization (Mbits/s)
• Network Utilization (Packets/s)
• Unicast/Multicast/Broadcast
• Packets Sizes
• VLAN/MPLS
• Protocols (Mbits/s)
• Protocols (Packets/s)
• Applications (Mbit/s)
• Applications (Packets/s)
• Call Quality
• Call vs. Network Utilization
• Wireless Packets (Packets/s)
• Wireless Retries (Packets/s)
Note To display statistics for a Call Quality or Call vs. Network Utilization view type, the VoIP Stats option must be selected when you first create the capture and configure the General options of the Capture Options dialog. See Configuring general options on page 41.
• Time window: Select the time interval to display in the Timeline graph. By default, Automatic is selected to display the optimum window based on the available data. Intervals from 5 Minutes (1 Sec. Avg.) to 24 Hours (5 Min. Avg.) are also available.
• Forensic search: Click to display the Forensic Search dialog where you can adjust the forensic search settings. Click the small down arrow next to Forensic Search to display custom or pre-configured settings for performing a forensic search. You can change any option prior to clicking Start:
• Custom: Creates a Forensic Search window based on the customized settings that you configure.
• Overview: Creates a Forensic Search window based on settings that display an overview of the selected data in the capture session.
• Packets: Creates a Forensic Search window containing a packets-only view.
• Expert: Creates a Forensic Search window based on settings that are optimized for Expert analysis.
Forensic search from the Forensics tab 209

Chapter 7: Post-capture Analysis
ANYOP_UG.book Page 210 Friday, February 5, 2016 4:47 PM
• Voice & Video: Creates a Forensic Search window based on settings that are optimized for Voice & Video analysis.
• Download Packets: Click to download the packets from the selected capture session, in the selected time range.
• Refresh: Click to refresh the screen. For an active capture session, you can also set an automatic refresh interval by selecting an interval from the drop-down list to the right of Refresh.
• Nested tabs: There are three nested tabs available from within the Forensics tab: Timeline, Storage, and Details. Each tab allows you to view and select the capture data you wish to search in various formats. The Timeline, Storage, and Details tabs are described in detail below.
2. From any of the nested tabs, click (double-click from the Details tab) the capture session you wish to search. The selected capture session is displayed in orange to indicate it is selected, and the data for the capture session is loaded into the Timeline graph at the top.
Important! A session represents a contiguous period of time when packets are captured from a particular interface. A session is created each time you start a capture. A capture can have multiple sessions, and each session can be separated by periods of inactivity (from stopping and starting the capture). Forensic analysis can then be performed on each session. Sessions are displayed in the nested tabs available from the Forensics tab.
3. In the Timeline graph, drag to select the area of the selected capture you wish to search. If no area of the graph is selected, the entire capture is selected by default.
Note The packet count displayed above the Timeline graph is an approximation of the packets currently selected.
Tip You can adjust the exact time range from the Forensic Search dialog.
210 Forensic search from the Forensics tab
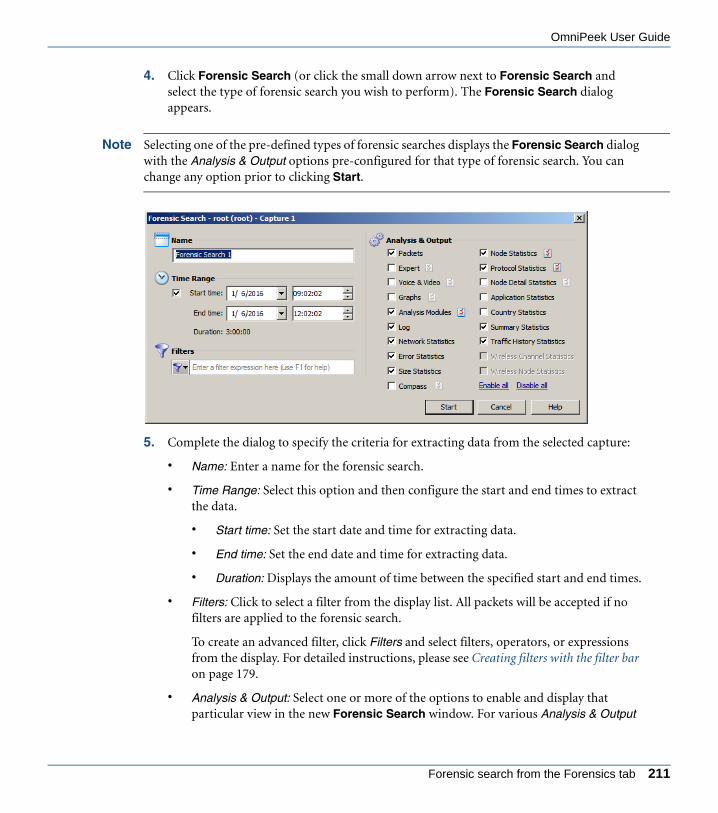
OmniPeek User Guide
ANYOP_UG.book Page 211 Friday, February 5, 2016 4:47 PM
4. Click Forensic Search (or click the small down arrow next to Forensic Search and select the type of forensic search you wish to perform). The Forensic Search dialog appears.
Note Selecting one of the pre-defined types of forensic searches displays the Forensic Search dialog with the Analysis & Output options pre-configured for that type of forensic search. You can change any option prior to clicking Start.
5. Complete the dialog to specify the criteria for extracting data from the selected capture:
• Name: Enter a name for the forensic search.
• Time Range: Select this option and then configure the start and end times to extract the data.
• Start time: Set the start date and time for extracting data.
• End time: Set the end date and time for extracting data.
• Duration: Displays the amount of time between the specified start and end times.
• Filters: Click to select a filter from the display list. All packets will be accepted if no filters are applied to the forensic search.
To create an advanced filter, click Filters and select filters, operators, or expressions from the display. For detailed instructions, please see Creating filters with the filter bar on page 179.
• Analysis & Output: Select one or more of the options to enable and display that particular view in the new Forensic Search window. For various Analysis & Output
Forensic search from the Forensics tab 211

Chapter 7: Post-capture Analysis
ANYOP_UG.book Page 212 Friday, February 5, 2016 4:47 PM
options that have additional configurable settings, click the submenu to the right of the option.
6. Click Start. A new Forensic Search window appears along with two progress bars at the top of the window. (Clicking Stop stops the search and then completes the processing of the packets.)
Once the processing of the packets is complete, the progress bars go away and the new Forensic Search window is populated with the data found based on the criteria you selected above.
7. From the new Forensic Search window, you can further narrow down the data by performing any of the post-capture analysis methods described earlier.
212 Forensic search from the Forensics tab

OmniPeek User Guide
ANYOP_UG.book Page 213 Friday, February 5, 2016 4:47 PM
Timeline nested tab
The Timeline nested tab has three bands of timelines (Day, Month, Year) that are used to dis-play the capture sessions available from the storage space on the Capture Engine. You can select a capture session from the day band to display the session in the Timeline graph above.
Here are some useful notes for using the Timeline nested tab:
• Capture sessions are represented with a horizontal green or blue bar and the name of the main parent capture. Simply click a capture session to view its data within the Timeline graph above.
• Only one capture session at a time can be selected and displayed in the Timeline graph.
• A capture session that is highlighted with an orange vertical bar indicates it is currently selected. A capture session that has green colored text indicates it is currently active and is capturing packets.
• Capture sessions may be overwritten by another session in the same capture if the capture was created as a ‘continuous capture,’ and the session ‘wraps’ after exceeding the disk space allocated for the capture. See Configuring general options on page 41.
If a capture session ‘wraps,’ the horizontal green or blue bar appears with a lighter color to indicate that capture sessions were overwritten. Any data that is overwritten is no longer available for analysis.
• Drag inside a timeline band to view different points of time within the timeline band. The other timeline bands will move accordingly.
• Right-click inside a timeline band to quickly move to various points within the timeline. You can select from:
• Go to Current: Moves all three timeline bands so that the currently selected capture session is centered inside the display.
Day Timeline
Capture Sessions
Timeline Nested Tab
Month TimelineYear Timeline
Forensic search from the Forensics tab 213

Chapter 7: Post-capture Analysis
ANYOP_UG.book Page 214 Friday, February 5, 2016 4:47 PM
• Go to Now: Moves all three timeline bands so that the current time is centered inside the display.
• Go to Earliest: Moves all three timeline bands so that the earliest available capture session is centered inside the display.
• Go to Latest: Moves all three timeline bands so that the latest available capture session is centered inside the display.
Storage nested tab
The Storage nested tab displays each capture session from the storage space on the Capture Engine as a container nested within a larger parent container.
Here are some useful notes for using the Storage nested tab:
• A capture session that is colored orange indicates it is currently selected. A capture session that is colored green indicates it is currently active and is capturing packets.
• Capture sessions may be overwritten by another session in the same capture, if the capture was created as a ‘continuous capture’ and the session ‘wraps’ after exceeding the disk space allocated for the capture. See Configuring general options on page 41. When data from a capture session is overwritten with new data, the old data is no longer available for analysis.
• Only one capture session at a time can be selected and displayed in the Timeline graph.
• Mouse-over a capture session container to view a tooltip displaying details about the capture session.
• Right-click a capture session to display the following options:
• View: Loads the selected capture session into the Timeline graph above.
Selected Capture Session (in Orange)
Storage Nested Tab
Active Capture Session (in Green)Capture Session
214 Forensic search from the Forensics tab

OmniPeek User Guide
ANYOP_UG.book Page 215 Friday, February 5, 2016 4:47 PM
• Delete: Removes the selected capture and all of its capture sessions, packet data, and statistics from the capture storage space on the Capture Engine. You will be prompted to verify any deletions. Only a parent capture, and not individual capture sessions, can be deleted from the list.
• Delete All: Removes all captures, capture sessions, packet data, and statistics from the capture storage space on the Capture Engine. You will be prompted to verify any deletions.
• Show Unreserved Space: Displays the amount of space that is not currently being used as capture storage space on the Capture Engine.
• Show Legend: Displays a color-coded legend for the capture sessions.
Details nested tab
The Details nested tab displays capture sessions available from the storage space on the Cap-ture Engine as a list in tabular format. Each capture session is displayed under its main parent capture. The main parent capture is a collapsible list that can be expanded or collapsed to show and hide its capture sessions.
Here are some useful notes for using the Details nested tab:
• The small graph below the name of a capture is a sparkline—a small version of the Timeline graph for each capture session which makes it easier to see the status of multiple capture sessions at a glance.
• A capture session that is colored orange indicates it is currently selected. A capture session that is colored green indicates it is currently active and is capturing packets.
• Capture sessions may be overwritten by another session in the same capture, if the capture was created as a ‘continuous capture’ and the session ‘wraps’ after exceeding the disk space allocated for the capture. See Configuring general options on page 41. An
Capture SessionsMain Parent Captures
Details Nested TabSparklines
Forensic search from the Forensics tab 215

Chapter 7: Post-capture Analysis
ANYOP_UG.book Page 216 Friday, February 5, 2016 4:47 PM
overwritten capture session is no longer available for analysis.
• Only one capture session at a time can be selected and displayed in the Timeline graph.
• Right-click a column heading to display or hide a specific column. Click a column heading to sort its data. See Capture Engine details tab columns on page 564 for a description of the available columns.
• Right-click a capture session or parent capture to display the following options:
• View: Loads the selected capture session into the Timeline graph above. Only a capture session, and not a parent capture, can be loaded into the Timeline graph.
• Delete: Removes the selected capture and all of its capture sessions, packet data, and statistics from the capture storage space on the Capture Engine. You will be prompted to verify any deletions. Only a parent capture, and not individual capture sessions, can be deleted from the list.
• Delete All: Removes all captures, capture sessions, packet data, and statistics from the capture storage space on the Capture Engine. You will be prompted to verify any deletions.
• Expand All: Expands the list so that all capture sessions are displayed below the parent capture.
• Collapse All: Collapses the list so that all capture sessions are hidden below the parent capture.
Forensic search from the ‘Forensics Capture’ windowIf you created a ‘Forensics Capture’ window (see Forensics capture on a Capture Engine on page 68), you can perform a forensic search directly from the capture window. Performing a foren-sic search from a ‘Forensics Capture’ window creates a new Forensic Search window.
Note You can also perform a forensic search from the Files or Forensics tab. See Forensic search from the Files tab on page 201 and Forensic search from the Forensics tab on page 206.
To perform a forensic search from the ‘Forensics Capture’ window:
1. Create a ‘Forensics Capture’ window as described in Forensics capture on a Capture Engine on page 68.
2. Click the Timeline dashboard to display the new ‘Forensics Capture’ window.
216 Forensic search from the ‘Forensics Capture’ window

OmniPeek User Guide
ANYOP_UG.book Page 217 Friday, February 5, 2016 4:47 PM
The parts of the Timeline graph are described here:
• Header Information: The header information displays statistics for the capture session (data start time, data end time, duration, status, packets, packets dropped, adapter, etc.).
• Top Talkers by IP Address: This display shows a graph of top “talkers” on the network, broken out by node for the selected area in the Timeline graph below. You can right-click inside the display to display top talkers by Physical Address, IP Address, or IPv6 Address; or to select a Bar or Pie display. Mouse over a bar (or slice) of the graph to view a tooltip with additional details for the node.
• Top Applications: This display shows a graph of top applications on the network for the selected area in the Timeline graph below. You can right-click inside the display to toggle the display with the Top Protocols display, or to select a Bar or Pie display.
Timeline Graph View Type Time Window Forensic SearchTop Talkers by IP Address Top Applications by Bytes
Header Information Download PacketsRefresh
Forensic search from the ‘Forensics Capture’ window 217

Chapter 7: Post-capture Analysis
ANYOP_UG.book Page 218 Friday, February 5, 2016 4:47 PM
Mouse over a bar (or slice) of the graph to view a tooltip with additional details for the application.
• Top Protocols: This display shows a graph of top protocols on the network for the selected area in the Timeline graph below. You can right-click inside the display to toggle the display with the Top Applications display, or select a Bar or Pie display. Mouse over a bar (or slice) of the graph to view a tooltip with additional details for the protocol.
• Timeline graph: The Timeline graph displays the data of the capture window. By default, the graph shows utilization in Mbits/s, but other statistics can be graphed as well by selecting the View type.
Here are descriptions of other parts of the Timeline graph:
• Right-click inside the graph to perform a forensic search (see Forensic search below), download selected packets to a capture file, refresh the window, or choose a different graph format: Bar, Stacked Bar, Skyline, Area, Stacked Area, Line, Line/Points, Linear, and Logarithmic. Additionally, you can also toggle displaying the minimum and maximum points for each series on the graph.
• Mouse over a data point in the graph to view a tooltip displaying timestamp and size information (e.g., time and rate, time and packet size, etc.).
• Any time there is more data than can be displayed on the screen, a scroll bar appears below the graph and allows you to view different points of time in the graph. (If the Time window is set to Automatic, the scroll bar will never appear.)
• If the Time window is set to anything other than Automatic, a scroll bar appears below the graph and allows you to view different points of time in the graph.
• View type: Select the type of statistics to display in the Timeline graph. You can select from:
• Network Utilization (Mbits/s)
• Network Utilization (Packets/s)
• Unicast/Multicast/Broadcast
• Packets Sizes
• VLAN/MPLS
• Protocols (Mbits/s)
• Protocols (Packets/s)
• Applications (Mbits/s)
218 Forensic search from the ‘Forensics Capture’ window

OmniPeek User Guide
ANYOP_UG.book Page 219 Friday, February 5, 2016 4:47 PM
• Call Quality
• Call vs. Network Utilization
• Wireless Packets (Packets/s)
• Wireless Retries (Packets/s)
Note To display statistics for a Call Quality and Call vs. Network Utilization view type, the VoIP Stats option must be selected when the capture was created and configured in the General options of the Capture Options dialog. See Configuring general options on page 41.
• Time window: Select the time interval to display in the Timeline graph. By default, Automatic is selected to display the optimum window based on the available data. Intervals from 5 Minutes (1 Sec. Avg.) to 24 Hours (5 Min. Avg.) are also available.
• Forensic search: Click to display the Forensic Search dialog where you can adjust the forensic search settings. Click the small down arrow next to Forensic search to display custom or pre-configured settings for performing a forensic search. You can change any option prior to clicking Start:
• Custom: Creates a Forensic Search window based on the customized settings that you configure.
• Overview: Creates a Forensic Search window based on settings that display an overview of the selected data in the capture session.
• Packets: Creates a Forensic Search window containing a packets-only view.
• Expert: Creates a Forensic Search window based on settings that are optimized for Expert analysis.
• Voice & Video: Creates a Forensic Search window based on settings that are optimized for Voice & Video analysis.
• Download Packets: Click to download the packets from the selected time range.
• Refresh: Click to refresh the screen. For an active capture session, you can also set an automatic refresh interval by selecting an interval from the drop-down list to the right of Refresh.
3. In the Timeline graph, drag to select the area of the capture you wish to search. If no area of the graph is selected, the entire capture is selected by default.
Forensic search from the ‘Forensics Capture’ window 219
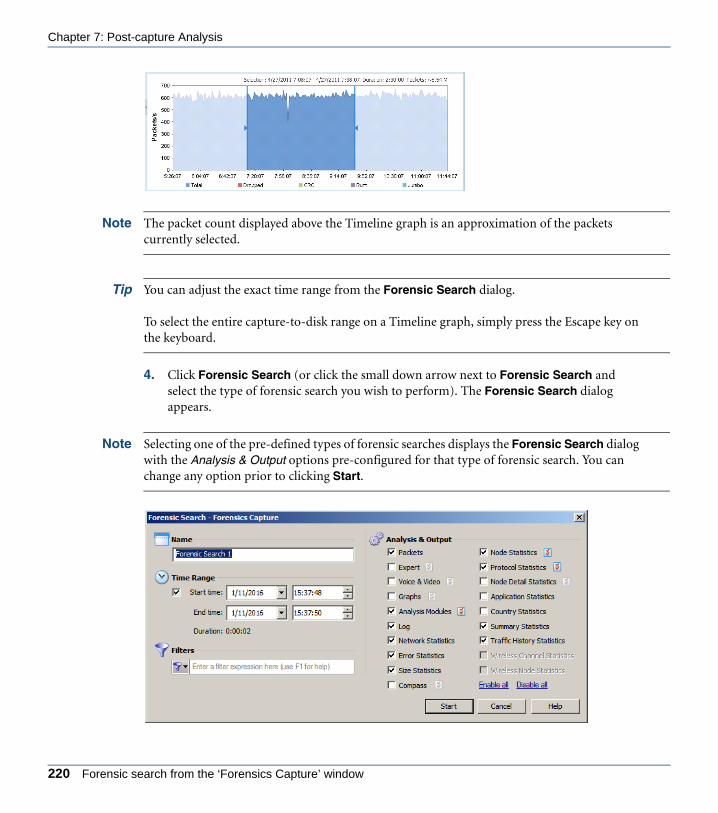
Chapter 7: Post-capture Analysis
ANYOP_UG.book Page 220 Friday, February 5, 2016 4:47 PM
Note The packet count displayed above the Timeline graph is an approximation of the packets currently selected.
Tip You can adjust the exact time range from the Forensic Search dialog.
To select the entire capture-to-disk range on a Timeline graph, simply press the Escape key on the keyboard.
4. Click Forensic Search (or click the small down arrow next to Forensic Search and select the type of forensic search you wish to perform). The Forensic Search dialog appears.
Note Selecting one of the pre-defined types of forensic searches displays the Forensic Search dialog with the Analysis & Output options pre-configured for that type of forensic search. You can change any option prior to clicking Start.
220 Forensic search from the ‘Forensics Capture’ window

OmniPeek User Guide
ANYOP_UG.book Page 221 Friday, February 5, 2016 4:47 PM
5. Complete the dialog to specify the criteria for extracting data from the selected capture:
• Name: Enter a name for the forensic search.
• Time Range: Select this option and then configure the start and end times to extract the data.
• Start time: Set the start date and time for extracting data.
• End time: Set the end date and time for extracting data.
• Duration: Displays the amount of time between the specified start and end times.
• Filters: Click to select a filter from the display list. All packets will be accepted if no filters are applied to the forensic search.
To create an advanced filter, click Filters and select filters, operators, or expressions from the display. For detailed instructions, please see Creating filters with the filter bar on page 179.
• Analysis & Output: Select one or more of the options to enable and display that particular view in the new Forensic Search window. For various Analysis & Output options that have additional configurable settings, click the submenu to the right of the option.
6. Click Start. A new Forensic Search window appears along with two progress bars at the top of the window. (Clicking Stop stops the search and then completes the processing of the packets.)
Once the processing of the packets is complete, the progress bars go away and the new Forensic Search window is populated with the data found based on the criteria you selected above. The name of the Forensic Search window is added to the list of currently active forensic searches in the Forensic Searches tab.
Forensic search from the ‘Forensics Capture’ window 221

Chapter 7: Post-capture Analysis
ANYOP_UG.book Page 222 Friday, February 5, 2016 4:47 PM
7. From the new Forensic Search window, you can further narrow down the data by performing any of the post-capture analysis methods described earlier.
Using the Download Engine Packet Files wizardThe Download Engine Packet Files wizard lets you perform a forensic search across multiple Capture Engines, download packet files from selected Capture Engines, and then combine the downloaded packet files into a single larger merged packet file.
To access the Download Engine Packet Files wizard:
• On the Tools menu, click Download Engine Packet Files…. The Time Range & Filter dialog of the Download Engine Packet Files wizard appears. See Time range & filter on page 223.
222 Using the Download Engine Packet Files wizard

OmniPeek User Guide
ANYOP_UG.book Page 223 Friday, February 5, 2016 4:47 PM
Time range & filter
The Time Range & Filter dialog of the wizard lets you choose a time range and filter to apply to your search.
• Start time: Select or enter the start date and time of the range you wish to search.
• End time: Select or enter the end date and time of the range you wish to search.
• +/- seconds: Select or enter the number of seconds to add to the search both before the start time and after the end time.
• Duration: Displays the amount of time between the start and end time specified.
• Filter: Displays any filters currently defined for the search.
• Edit: Click to display the Edit Filter dialog, where you can define simple and advanced filters based on any combination of addresses, protocols, and ports. A packet must match all of the conditions specified in order to match the filter.
• Clear: Click to remove any filters currently defined for the search.
Engines
The Engines dialog of the wizard displays the groups and Capture Engines currently listed in the OmniPeek Capture Engines window.
Time range & filter 223

Chapter 7: Post-capture Analysis
ANYOP_UG.book Page 224 Friday, February 5, 2016 4:47 PM
• Select the check box of the Capture Engines you want to include in your forensic search. If you are not already connected to the Capture Engine, you are first prompted to connect to the Capture Engine by entering domain, username, and password information.
• Enable all: Click this option to select the check box of all groups and Capture Engines displayed in the dialog.
• Disable all: Click this option to clear the check boxes of all groups and Capture Engines displayed in the dialog.
Capture sessions
The Capture Sessions dialog of the wizard displays the capture sessions which are available on the selected Capture Engines during the specified time frame.
224 Using the Download Engine Packet Files wizard

OmniPeek User Guide
ANYOP_UG.book Page 225 Friday, February 5, 2016 4:47 PM
• Column header: Displays the column headings currently selected. Right-click the column header to enable/disable columns. Here are the available columns:
• Engine/Capture Session: The capture sessions available from the Capture Engines selected earlier. Select the check box of the capture sessions you want to include in your search. Capture Engine captures that have both ‘Capture to disk’ and ‘Timeline Stats’ enabled in the capture options appear in the Capture Sessions dialog.
• Session Start Time: The start time of the capture.
• Data Start Time: The start time of the capture session data.
• Data End Time: The end time of when data last appeared in the capture session.
• Size: The size (in MB) of the capture session.
• Packets: The number of packets in the capture session.
• Packets Dropped: The number of dropped packets in the capture session.
• Media: The media type of the capture session.
Note Although you can download packet files of different media types, you can only merge packet files of the same media type (Ethernet, wireless, or WAN).
• Adapter: The name of the adapter used for the capture session.
• Adapter Address: The address of the adapter used for the capture session.
Capture sessions 225
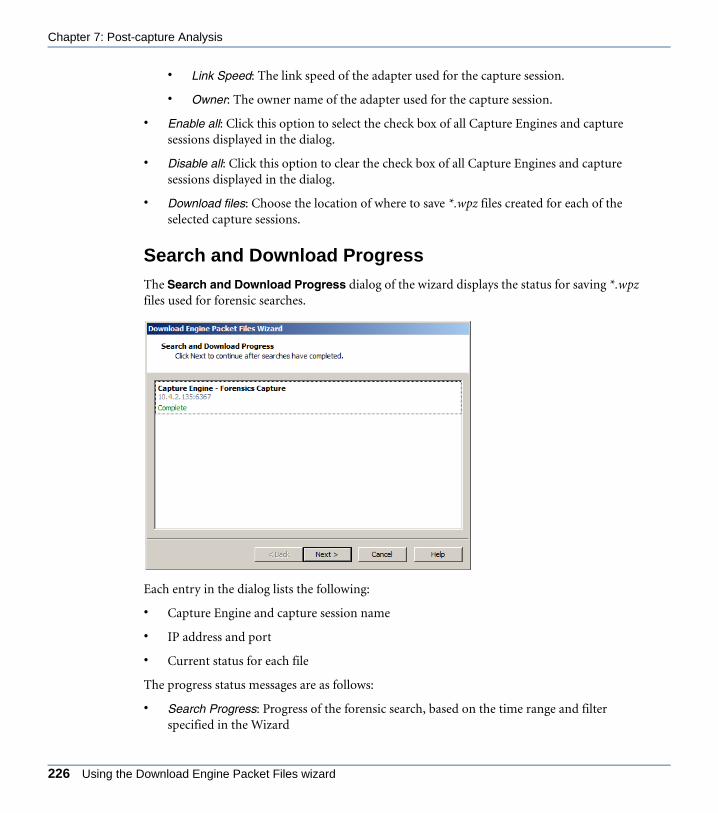
Chapter 7: Post-capture Analysis
ANYOP_UG.book Page 226 Friday, February 5, 2016 4:47 PM
• Link Speed: The link speed of the adapter used for the capture session.
• Owner: The owner name of the adapter used for the capture session.
• Enable all: Click this option to select the check box of all Capture Engines and capture sessions displayed in the dialog.
• Disable all: Click this option to clear the check box of all Capture Engines and capture sessions displayed in the dialog.
• Download files: Choose the location of where to save *.wpz files created for each of the selected capture sessions.
Search and Download Progress
The Search and Download Progress dialog of the wizard displays the status for saving *.wpz files used for forensic searches.
Each entry in the dialog lists the following:
• Capture Engine and capture session name
• IP address and port
• Current status for each file
The progress status messages are as follows:
• Search Progress: Progress of the forensic search, based on the time range and filter specified in the Wizard
226 Using the Download Engine Packet Files wizard

OmniPeek User Guide
ANYOP_UG.book Page 227 Friday, February 5, 2016 4:47 PM
• Saving: Search results are saved as a .wpz file on the engine
• Deleting Search: The forensic search is deleted on the engine
• Download Progress: The .wpz file is downloaded to the OmniPeek computer
• Deleting Remote File: The .wpz file is deleted from the engine
• Complete: The entire process is complete. Once you see Complete for all capture segments, click Next to continue
• No results were found: The forensic search did not find any packets that matched the defined forensic search parameters.
Tip You can cancel the progress of any one of the capture segments by right-clicking and selecting Cancel. You can cancel any of the above stages, except for the Saving stage.
Merge
The Merge dialog of the wizard lets you configure merge options for the downloaded packet file(s). You can choose to keep the packet files separate (one per engine), or merge them into a single larger packet file.
• Merge downloaded files: Select this check box to merge the packets in the downloaded packet files together into a single larger packet file, sorted by the times in the packets (adjusted by the time offsets, if applicable). If this option is not selected, the packet files are not merged and each downloaded packet file is opened in its own capture window.
Merge 227
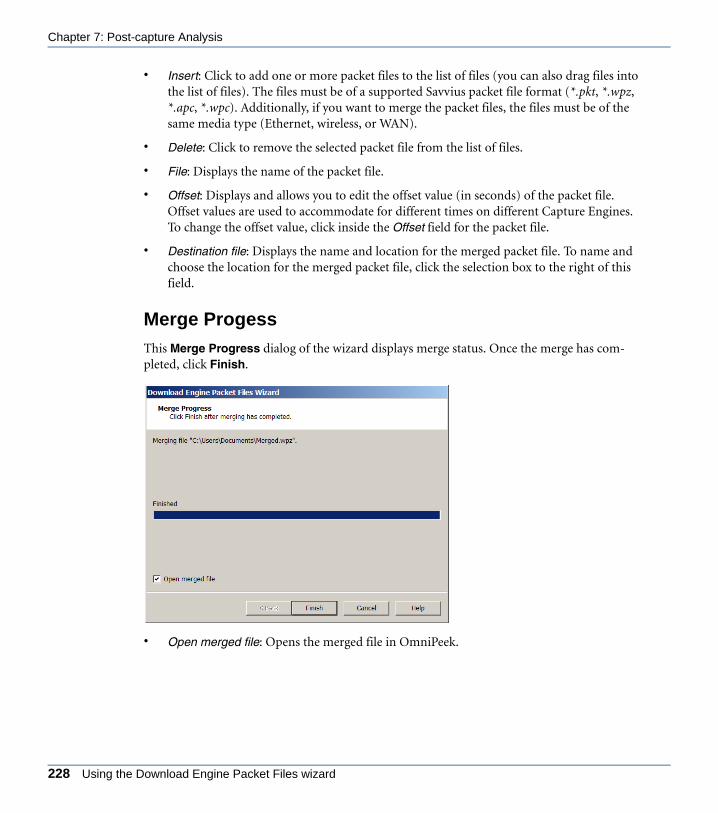
Chapter 7: Post-capture Analysis
ANYOP_UG.book Page 228 Friday, February 5, 2016 4:47 PM
• Insert: Click to add one or more packet files to the list of files (you can also drag files into the list of files). The files must be of a supported Savvius packet file format (*.pkt, *.wpz, *.apc, *.wpc). Additionally, if you want to merge the packet files, the files must be of the same media type (Ethernet, wireless, or WAN).
• Delete: Click to remove the selected packet file from the list of files.
• File: Displays the name of the packet file.
• Offset: Displays and allows you to edit the offset value (in seconds) of the packet file. Offset values are used to accommodate for different times on different Capture Engines. To change the offset value, click inside the Offset field for the packet file.
• Destination file: Displays the name and location for the merged packet file. To name and choose the location for the merged packet file, click the selection box to the right of this field.
Merge Progess
This Merge Progress dialog of the wizard displays merge status. Once the merge has com-pleted, click Finish.
• Open merged file: Opens the merged file in OmniPeek.
228 Using the Download Engine Packet Files wizard

C H A P T E R 8
ANYOP_UG.book Page 229 Friday, February 5, 2016 4:47 PM
Expert Analysis
In this chapter:
About Expert analysis. . . . . . . . . . . . . . . . . . . . . . . . . . . . . . . . . . . . . . . . . . . . 230
Expert views and tabs . . . . . . . . . . . . . . . . . . . . . . . . . . . . . . . . . . . . . . . . . . . 230
Configuring Expert views . . . . . . . . . . . . . . . . . . . . . . . . . . . . . . . . . . . . . . . . . 239
Expert EventFinder. . . . . . . . . . . . . . . . . . . . . . . . . . . . . . . . . . . . . . . . . . . . . . 243
Visual Expert. . . . . . . . . . . . . . . . . . . . . . . . . . . . . . . . . . . . . . . . . . . . . . . . . . . 246
Network policy settings. . . . . . . . . . . . . . . . . . . . . . . . . . . . . . . . . . . . . . . . . . . 264
229
Chapter 8: Expert Analysis
ANYOP_UG.book Page 230 Friday, February 5, 2016 4:47 PM
About Expert analysisThe Expert views in OmniPeek and Capture Engines provide expert analysis of response time, throughput, and network applications in a flow-centered view of captured traffic. Expert views also provide a detailed view of every transaction, noting any events encountered in each indi-vidual conversation or flow. You can drill down to select the packets associated with a particu-lar event or with any conversation in Expert views.
The Expert EventFinder scans traffic in a capture window, looking for key events. Individual network events are included in the Expert EventFinder, which displays and explains anomalies and sub-optimal performance at all layers of the network. See Expert EventFinder on page 243.
The Visual Expert presents a variety of ways to look at an individual flow, providing a snap-shot all of the packets that were in the buffer for a particular flow at the time the window was created. See Visual Expert on page 246.
The Network Policy dialog allows you to configure network policies and find violations of these policies in a capture window. Network Policy is only supported for wireless captures. See Network policy settings on page 264.
Expert views and tabsThe Expert view of a capture window has two data areas. The upper pane displays conversa-tions or flows in the following formats:
• Expert Clients/Servers view
• Expert Flows view
• Expert Applications view
The lower pane contains three tabs which present additional information about the selected rows in the upper pane:
• Details tab
• Event Summary tab
• Event Log tab
Note The terms “conversation,” “stream,” and “flow” are synonymous. For example, the end-to-end IP address and UDP or TCP ports form a unique conversation, stream, or flow for a given application.
The parts of the Expert view window are identified below.
230 About Expert analysis
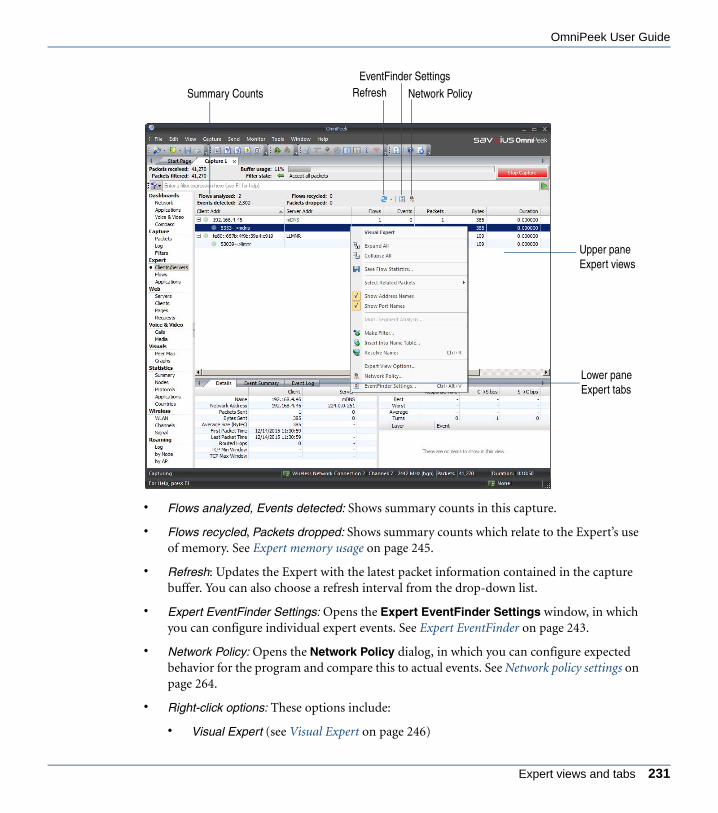
OmniPeek User Guide
ANYOP_UG.book Page 231 Friday, February 5, 2016 4:47 PM
• Flows analyzed, Events detected: Shows summary counts in this capture.
• Flows recycled, Packets dropped: Shows summary counts which relate to the Expert’s use of memory. See Expert memory usage on page 245.
• Refresh: Updates the Expert with the latest packet information contained in the capture buffer. You can also choose a refresh interval from the drop-down list.
• Expert EventFinder Settings: Opens the Expert EventFinder Settings window, in which you can configure individual expert events. See Expert EventFinder on page 243.
• Network Policy: Opens the Network Policy dialog, in which you can configure expected behavior for the program and compare this to actual events. See Network policy settings on page 264.
• Right-click options: These options include:
• Visual Expert (see Visual Expert on page 246)
EventFinder SettingsRefresh
Upper pane Expert views
Summary Counts Network Policy
Lower pane Expert tabs
Expert views and tabs 231
Chapter 8: Expert Analysis
ANYOP_UG.book Page 232 Friday, February 5, 2016 4:47 PM
• Save Flow Statistics (see Expert save functions on page 243)
• Select Related Packets (see Expert view packet selection on page 242)
• Expert View Options dialog (see Expert view options dialog on page 239)
• Column display: To sort, hide, or rearrange column display, see Configuring column display on page 239.
For a complete list and description of the columns available in Expert views, see Expert view columns on page 539.
Tip To toggle this option directly in the Expert views, on the View menu, point to Display Format, and then click Show Port Names.
Expert events
For a complete list of expert events, see Appendix E, Expert Events.
Expert Clients/Servers view
The Expert Clients/Servers view makes it easy to track events and to see them in the context of peer-to-peer or client-server traffic patterns.
To display the Clients/Servers view:
Select Clients/Servers under Expert in the navigation bar of a capture window. The hierarchy of information in this view is displayed as follows:
• Pairs of nodes (addresses)
• Individual flows between these addresses
• Individual events under specific flows.
232 Expert views and tabs
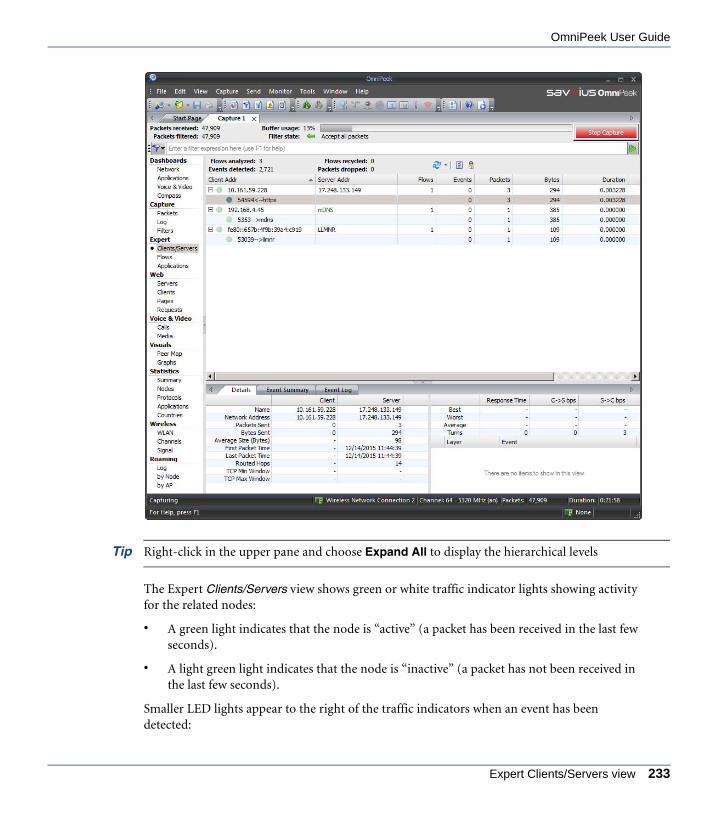
OmniPeek User Guide
ANYOP_UG.book Page 233 Friday, February 5, 2016 4:47 PM
Tip Right-click in the upper pane and choose Expand All to display the hierarchical levels
The Expert Clients/Servers view shows green or white traffic indicator lights showing activity for the related nodes:
• A green light indicates that the node is “active” (a packet has been received in the last few seconds).
• A light green light indicates that the node is “inactive” (a packet has not been received in the last few seconds).
Smaller LED lights appear to the right of the traffic indicators when an event has been detected:
Expert Clients/Servers view 233

Chapter 8: Expert Analysis
ANYOP_UG.book Page 234 Friday, February 5, 2016 4:47 PM
• A red LED indicates one or more events whose severity is Major or Severe.
• A yellow LED indicates one or more events whose severity is Informational or Minor.
Tip Place the cursor over these indicators to show a data tip with details of recent activity and the severity of the events detected.
The Events column of the Expert Clients/Servers view shows an icon for the most severe event detected.
For a complete list and description of the columns available in the Clients/Servers view, see Expert clients/servers, flows, and application view columns on page 540.
Expert Flows view
The Expert Flows view displays each flow independently in a flat table. Flows are numbered in the Flow ID column in the order in which they are identified by the expert. This simplified view allows you to compare flows to one another, regardless of the node pair to which they belong.
To display the Flows view:
• Select Flows under Expert in the navigation bar of a capture window.
234 Expert views and tabs
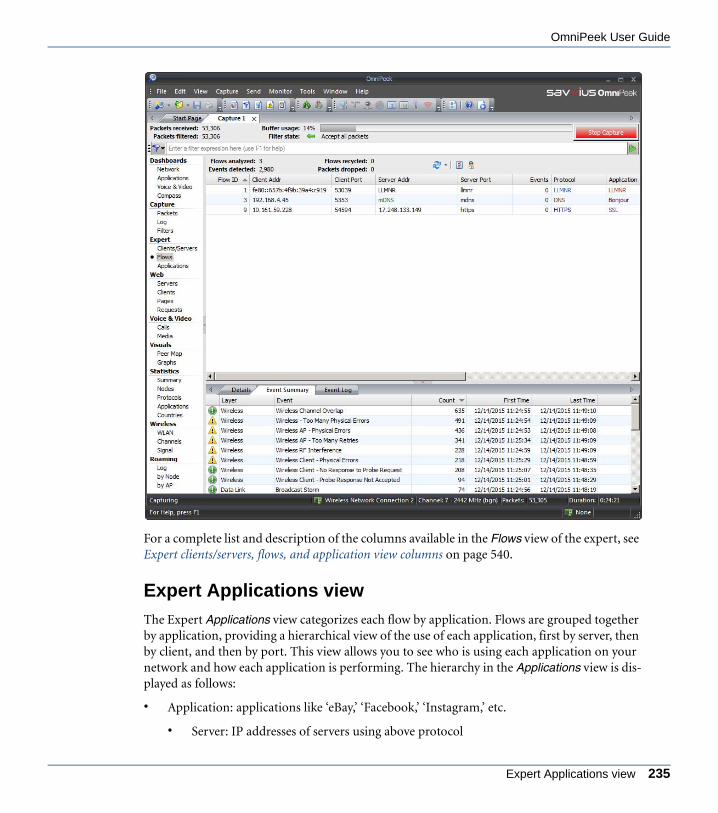
OmniPeek User Guide
ANYOP_UG.book Page 235 Friday, February 5, 2016 4:47 PM
For a complete list and description of the columns available in the Flows view of the expert, see Expert clients/servers, flows, and application view columns on page 540.
Expert Applications view
The Expert Applications view categorizes each flow by application. Flows are grouped together by application, providing a hierarchical view of the use of each application, first by server, then by client, and then by port. This view allows you to see who is using each application on your network and how each application is performing. The hierarchy in the Applications view is dis-played as follows:
• Application: applications like ‘eBay,’ ‘Facebook,’ ‘Instagram,’ etc.
• Server: IP addresses of servers using above protocol
Expert Applications view 235

Chapter 8: Expert Analysis
ANYOP_UG.book Page 236 Friday, February 5, 2016 4:47 PM
• Client: IP addresses of clients connected to above server (followed by Individual flows between IP addresses and Individual Events)
• Port: Port addresses of the client and server. The first port listed is the client port; the second port listed is the server port. The arrow between the ports shows the direction of the flow.
To display the Applications view, select Applications under Expert in the navigation bar of a capture window.
For a complete list and description of the columns available in the Applications view, see Expert clients/servers, flows, and application view columns on page 540.
236 Expert views and tabs

OmniPeek User Guide
ANYOP_UG.book Page 237 Friday, February 5, 2016 4:47 PM
Expert lower pane tabs
Additional information is provided in the nested tabs for a row selected in the upper panes of the Expert views.
Details tab
The Details tab contains additional details for a single flow or a single pair of nodes selected in the upper pane, identified as Client and Server.
For complete descriptions of the items in the Node details tab, see Expert node details tab rows and columns on page 544.
Tip Set the units for throughput in the Expert View Options dialog. See Expert view options dialog on page 239.
Event Summary tab
The Event Summary tab shows the number of times each type of event was encountered. The header shows the Total number of events identified. The Event Summary columns are described below.
• Severity Icon: The severity of the event, as set in the Expert EventFinder window.
• Layer: The network layer to which events of this type belong.
• Event: The EventFinder event definition which identified this packet as an event (for example, TCP Retransmission).
• Count: The number of events of this type observed so far.
• First Time: The date and time of the first time the event of this type was observed.
• Last Time: The date and time of the last time the event of this type was observed.
Event Log tab
The Event Log tab shows a count of total Messages in the log, and counts of events classified by their level of severity. These counts are shown beside the icon for that severity level (Infor-mational, Minor, Major, and Severe).
Click the buttons associated with each level of severity to toggle the display of events.
Expert lower pane tabs 237
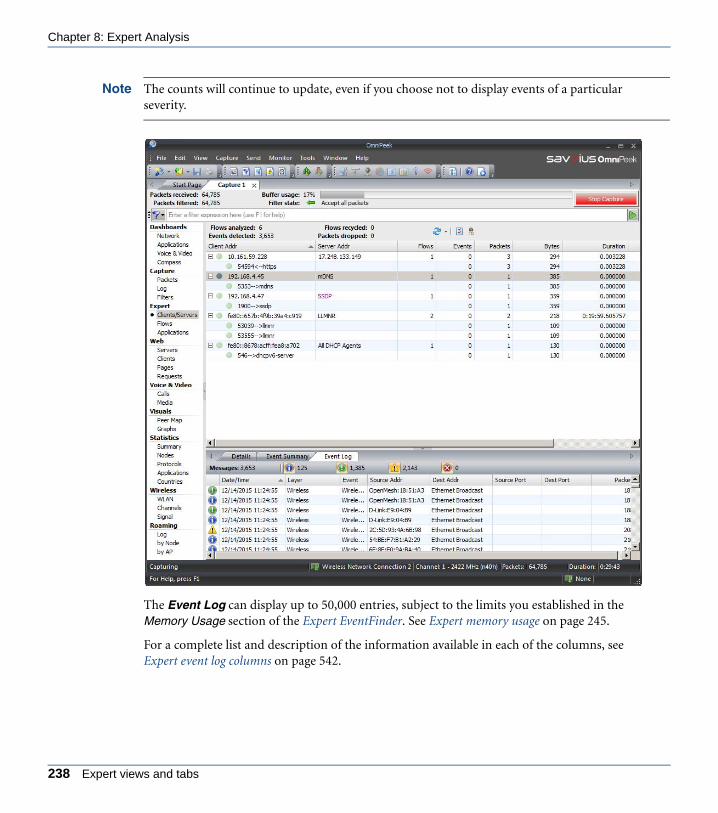
Chapter 8: Expert Analysis
ANYOP_UG.book Page 238 Friday, February 5, 2016 4:47 PM
Note The counts will continue to update, even if you choose not to display events of a particular severity.
The Event Log can display up to 50,000 entries, subject to the limits you established in the Memory Usage section of the Expert EventFinder. See Expert memory usage on page 245.
For a complete list and description of the information available in each of the columns, see Expert event log columns on page 542.
238 Expert views and tabs

OmniPeek User Guide
ANYOP_UG.book Page 239 Friday, February 5, 2016 4:47 PM
Configuring Expert viewsThe Expert Columns dialog let you show, hide, or rearrange columns in Expert views. The Expert View Options dialog and the Client/Server Colors and Units options of the OmniP-eek Options dialog allow you to control the appearance and colors of Expert view features. You can select subsets of packets for further analysis according to a variety of options and save flow statistics and summary data in several formats.
Configuring column display
To rearrange display of columns in Expert views:
• Sort the contents of any column in ascending or descending order.
• Double-click the right edge of a column header to automatically resize the column area. Hold down the Shift key and double-click the right edge of any column header to automatically resize all of the columns.
• Use drag and drop in the upper pane of the Expert view to change column order.
To show or hide columns in Expert views:
• Right-click the column headers to select the columns you wish to display. You can select Show all Columns to display all available columns.
• Alternatively, right-click the column header and choose Columns…. The Columns dialog appears.
a. Check or uncheck individual column titles to show or hide those columns. You can also:
• Drag individual columns up or down to change their order in the view.
• Right-click in the Columns dialog and choose Check All or Uncheck All to show or hide all columns.
b. Click OK to apply your changes to the Expert views.
Note For a complete list and description of available columns in Expert views, see Expert view columns on page 539.
Expert view options dialog
The Expert View Options dialog allows you to control the appearance of the upper pane of the Expert view.
Configuring Expert views 239
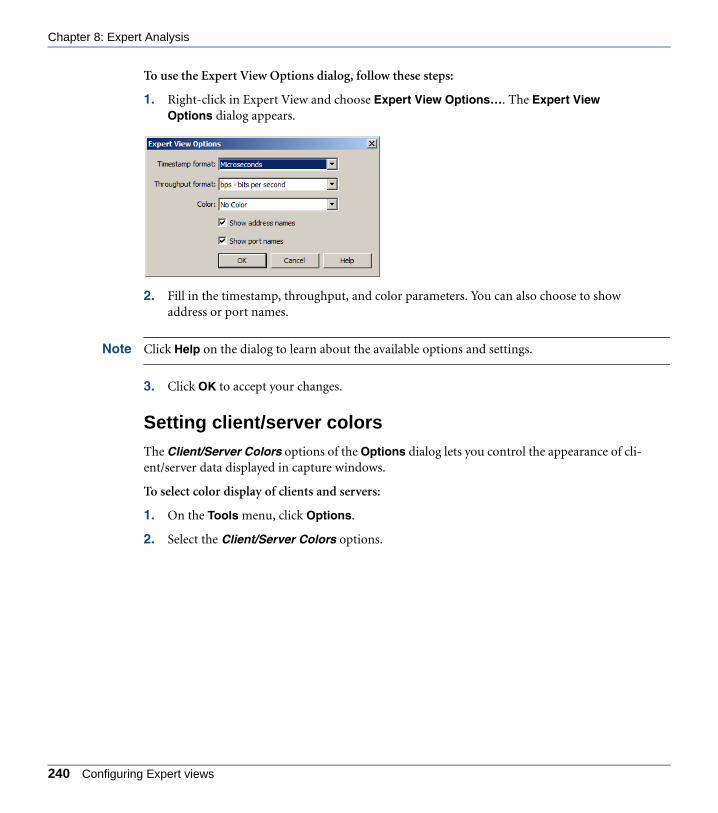
Chapter 8: Expert Analysis
ANYOP_UG.book Page 240 Friday, February 5, 2016 4:47 PM
To use the Expert View Options dialog, follow these steps:
1. Right-click in Expert View and choose Expert View Options…. The Expert View Options dialog appears.
2. Fill in the timestamp, throughput, and color parameters. You can also choose to show address or port names.
Note Click Help on the dialog to learn about the available options and settings.
3. Click OK to accept your changes.
Setting client/server colors
The Client/Server Colors options of the Options dialog lets you control the appearance of cli-ent/server data displayed in capture windows.
To select color display of clients and servers:
1. On the Tools menu, click Options.
2. Select the Client/Server Colors options.
240 Configuring Expert views

OmniPeek User Guide
ANYOP_UG.book Page 241 Friday, February 5, 2016 4:47 PM
3. Select colors for clients and servers.
These color settings appear in all Expert views and Visual Expert tabs that have client/server displays. For example, see PacketVisualizer tab on page 247. They also appear in Web views that have client/server displays. For example, see Requests view on page 299.
4. Click OK.
Note You can also configure global client/server color options in the PacketVisualizer Options and Expert View Options dialogs.
Setting units for time and throughput
The Units options of the Options dialog lets you choose the precision for all time displays in milliseconds, microseconds, or nanoseconds in capture windows.
Note Some views, such as Visual Expert graphs, ignore the time/throughput settings and automatically choose an appropriate display precision. See the Visual Expert Graphs tab on page 252.
To select units for time and throughput:
1. On the Tools menu, click Options.
2. Select the Units options.
Setting units for time and throughput 241

Chapter 8: Expert Analysis
ANYOP_UG.book Page 242 Friday, February 5, 2016 4:47 PM
3. Complete the dialog:
• Time units: Select milliseconds, microseconds, or nanoseconds.
• Select Local Time or GMT/UTC Time (or, on the View menu, point to Display Format, and then click Local Time).
• Throughput units: Choose the units for throughput displays from the drop-down list.
4. Click OK.
Note You can also configure global time unit options in the Packet List Options dialog, PacketVisualizer Options dialog, and Expert View Options dialog.
Note OmniPeek time precision settings do not affect Capture Engine data.
Expert view packet selection
Right-click and choose Select Related Packets by one of the following options:
• By Client: This option selects all packets to or from the client IP address.
• By Server: This option selects all packets to or from the server IP address.
• By Client and Server: This option selects all packets between the client and server IP addresses.
242 Configuring Expert views

OmniPeek User Guide
ANYOP_UG.book Page 243 Friday, February 5, 2016 4:47 PM
• By Port: This option selects all packets between the client and server IP address and ports. (This option will usually produce the same results as selecting By Flow, unless a node pair reuses ports for multiple TCP connections.)
• By Flow ID: This option selects all packets by Flow ID.
• By Event Type: This option selects all packets flagged with the selected event. Choosing Select Related Packets from the Event Summary tab provides the same results.
For more information on how to select related packets, see Selecting related packets on page 192.
Expert save functions
Right-click and choose Save Flow Statistics… in the Clients/Servers, Flows, or Application views of the Expert to open a Save As dialog with the following file format choices:
• Text (view delimited) *.txt
• CSV (Comma delimited) *.csv
You can also right-click and choose Save Event Summary… or Save Event Log… in the Event Summary or the Event Log tabs. The same two file format types are supported.
The content and arrangement of the saved files match the content of the pane being saved. You can hide or display optional columns or change column order to control the information that will be included in the saved file.
Note The Save As dialogs for the Capture Engine Expert view will offer to save the files on the OmniPeek console computer.
Expert EventFinderThe EventFinder scans traffic in a capture window, looking for network anomalies and sub-optimal performance at all layers of the network, from application to physical. It also shows network events associated with VoIP calls. For a complete list of expert events, see Appendix E, Expert Events.
To open the Expert EventFinder Settings window, choose one of the following:
• Click Expert EventFinder Settings in the toolbar of the Expert view.
• Right-click and choose EventFinder Settings….
The parts of the Expert EventFinder Settings window are identified below. The window is context-sensitive and displays only parts relevant to the selected event.
Expert save functions 243

Chapter 8: Expert Analysis
ANYOP_UG.book Page 244 Friday, February 5, 2016 4:47 PM
• Enable All: Select all of the events to be scanned in a capture window.
• Disable All: Deselect all of the events (none will be scanned).
• Toggle All: Reverse state of events between Enable All and Disable All.
• Restore Selected Defaults: Highlight an event or events and click to restore default values.
• Restore All User Defaults: Restore default values to all events.
• Set User Defaults: Establish the current settings as the new (user-defined) default EventFinder settings on the OmniPeek console or the Capture Engine.
• Import Settings: Restores a previously saved group of settings. Click Import Settings and navigate to the location of an *.xml settings file.
• Export Settings: Saves the current EventFinder settings as an *.xml file.
Enable All
Disable AllToggle All
Restore All User DefaultsRestore Selected Default
Import SettingsMemory Usage
Threshold AssistantSet User Defaults
Export Settings Setting
244 Expert EventFinder
OmniPeek User Guide
ANYOP_UG.book Page 245 Friday, February 5, 2016 4:47 PM
Note When you Import Settings or Export Settings on a Capture Engine, the Open and Save As dialogs will refer to the OmniPeek console computer.
• Event: This column shows the events arranged under their network layers.
• Severity: This column shows the level of severity of notification the Expert will send when it encounters a matching event. Click the entry in the Severity column to set the level of severity of these notifications. See Chapter 16, Sending Notifications.
• Enable: This column allows you to enable or disable individual events or network layers by selecting the check box(es) for that layer. When only some events within a layer are enabled, a square appears in the check box for that layer.
• Setting: Set the Value and units that mark the threshold of the condition for the selected event. For example, if the Setting Value for POP3 Slow Response Time is 150 milliseconds, then when this event is enabled, it will report any response time greater than 150 milliseconds as an event. Note that not all events require a setting value. Some, such as DHCP Request Rejected, simply check for a particular occurrence or packet type.
• Threshold Assistant: This setting helps you choose settings that can be expected to vary with network bandwidth. For example, with POP3 Slow Response Time as the selected event, moving the slider bar to the left will increase the setting value, allowing for the slower POP3 response times that you would expect over a Dial-up connection. If you move the slider bar to the right, the Value decreases, reflecting the faster POP3 response times you would expect over a LAN or Fast LAN, appropriate for POP3 connections over the Internet.
• Memory Usage: Set the maximum memory by entering the value directly in the edit box in MB (megabytes), or by using the slider bar to the right of the edit box. See Expert memory usage on page 245.
• Show Info: Click to see a more complete description of the event, including possible causes and remedies.
Tip Click Show Info to display the Description, Possible Causes, and Possible Remedies for a selected event.
Expert memory usage
You can set an upper limit on the system resources available to Expert Analysis functions in each individual capture window. For a Capture Engine, these resources are resident on the computer on which the particular Capture Engine capture window was created.
Expert memory usage 245

Chapter 8: Expert Analysis
ANYOP_UG.book Page 246 Friday, February 5, 2016 4:47 PM
The Memory Usage section of the Expert EventFinder Settings window has two ways to set the maximum memory
• Enter the value directly in MB (megabytes)
• Use the slider bar to set the value
Values for the Maximum Flows and Maximum Events that can be analyzed using the amount of memory you have selected appear below the edit box and slider bar.
The Maximum Flows and Maximum Events represent two separate limits. When the maximum number of flows is reached, older, closed flows will be dropped to make room for new ones. If there are more active flows than this limit, no new flows will be added, but the Expert will con-tinue to analyze existing flows, as well as look for non-flow events for all network traffic.
The Memory Usage feature allows the Expert to be used continuously, always presenting the most recent findings, and logging the results to the Event Log.
Visual ExpertThe Visual Expert presents a variety of ways to look at individual flows in the Expert views, providing a static snapshot all of the packets that were in the buffer for a particular flow at the time the window was created.
Note The OmniPeek Visual Expert is not supported in the Expert views of Capture Engine capture windows.
To open the Visual Expert:
1. Stop capture in a capture window.
2. Choose one of the following:
• In the Flows view, right-click any flow and choose Visual Expert (or double-click any single flow line).
• In the Clients/Servers and Application views, expand the list and select a flow. Right-click and choose Visual Expert (or double-click an event row).
There are six tabs at the bottom of the Visual Expert:
• PacketVisualizer tab
• Payload tab
• Graphs tab
• What If tab
246 Visual Expert

OmniPeek User Guide
ANYOP_UG.book Page 247 Friday, February 5, 2016 4:47 PM
• Compare tab
• Summary tab
PacketVisualizer tab
The PacketVisualizer tab displays all of the packets for both sides of a flow.
Packets are displayed as horizontal bars in client/server colors, with arrow and position cues to show in which direction each packet was sent. In the toolbar, the Ticks drop-down list lets you display time as a vertical separation between packets. Sliced packets appear with their sliced portion dimmed.
For a complete list and description of the columns available in the PacketVisualizer tab, see Visual Expert PacketVisualizer tab columns on page 545.
Time Ticks
PacketVisualizer tab 247

Chapter 8: Expert Analysis
ANYOP_UG.book Page 248 Friday, February 5, 2016 4:47 PM
Time ticks
To create a vertical time axis within the PacketVisualizer list, choose a value other than None in the Time Ticks drop-down list. In the PacketVisualizer column, the inserted tick mark rows show the delta time from the previous packet. Low-latency packets will be tightly clustered, while slow-responding, high-latency packets will be separated by a larger number of tick-mark rows.
Note After 9 tick-mark rows, the PacketVisualizer inserts a final ellipsis (…) and the actual delta time.
Relative SEQ/ACK numbers
The PacketVisualizer tab displays SEQ and ACK numbers in the Summary column. You can use the context menu to toggle between a shorter and a longer version of these numbers.
The actual sequence (SEQ) and acknowledgement (ACK) numbers are typically 9-digit num-bers from a large initial random value. For most purposes, only their sequence is significant.
Right-click and enable Relative SEQ/ACK Numbers in the context menu to shorten the num-bers while preserving their sequence (display shows SEQ and ACK numbers starting at zero, subtracting the lowest observed number from each subsequent number).
Disable Relative SEQ/ACK Numbers to display the actual SEQ/ACK number values found in the packets.
Note The Sequence, TCP Trace, and TCP Window graphs in the Graphs tab display sequence numbers as a vertical axis. You can also use the context menu to toggle between relative and absolute values for SEQ/ACK numbers in these graphs.
Highlighting SEQ/ACK relationships
As you select different rows in the PacketVisualizer list, a blue highlight appears to help you follow SEQ/ACK relationships. The packets acknowledged by the selected packet are high-lighted light blue, above the selected packet. The first packet that acknowledges the selected packet is also highlighted in light blue, below the selected packet.
You can also see this ACK relationship by showing the Acked By and Ack For columns, as in the following figure.
248 Visual Expert

OmniPeek User Guide
ANYOP_UG.book Page 249 Friday, February 5, 2016 4:47 PM
PacketVisualizer options dialog
The PacketVisualizer Options dialog lets you set display options for the PacketVisualizer tab.
To set PacketVisualizer display options, follow these steps:
1. Right-click in the PacketVisualizer tab and choose PacketVisualizer Options.
PacketVisualizer tab 249
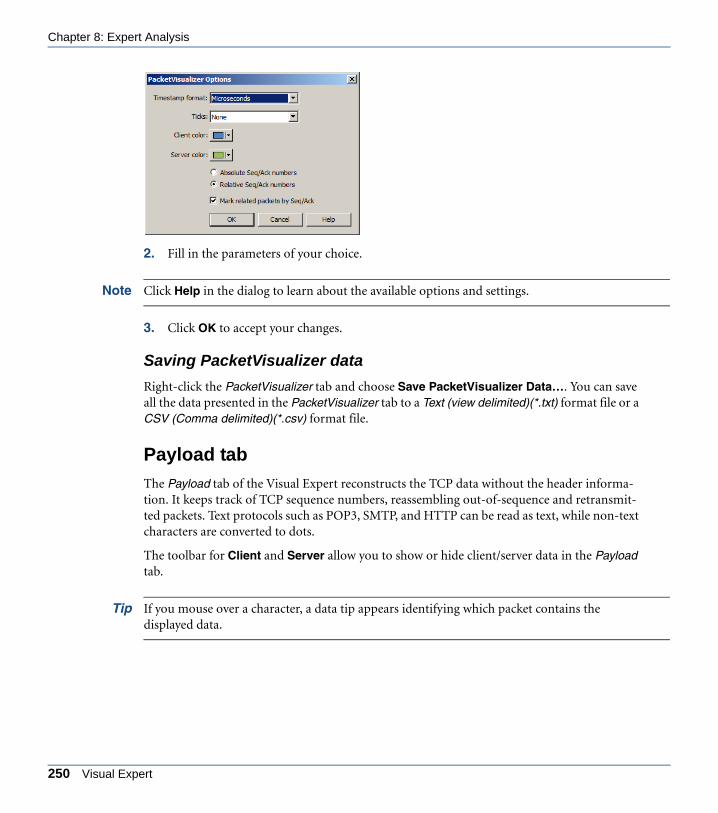
Chapter 8: Expert Analysis
ANYOP_UG.book Page 250 Friday, February 5, 2016 4:47 PM
2. Fill in the parameters of your choice.
Note Click Help in the dialog to learn about the available options and settings.
3. Click OK to accept your changes.
Saving PacketVisualizer data
Right-click the PacketVisualizer tab and choose Save PacketVisualizer Data…. You can save all the data presented in the PacketVisualizer tab to a Text (view delimited)(*.txt) format file or a CSV (Comma delimited)(*.csv) format file.
Payload tab
The Payload tab of the Visual Expert reconstructs the TCP data without the header informa-tion. It keeps track of TCP sequence numbers, reassembling out-of-sequence and retransmit-ted packets. Text protocols such as POP3, SMTP, and HTTP can be read as text, while non-text characters are converted to dots.
The toolbar for Client and Server allow you to show or hide client/server data in the Payload tab.
Tip If you mouse over a character, a data tip appears identifying which packet contains the displayed data.
250 Visual Expert
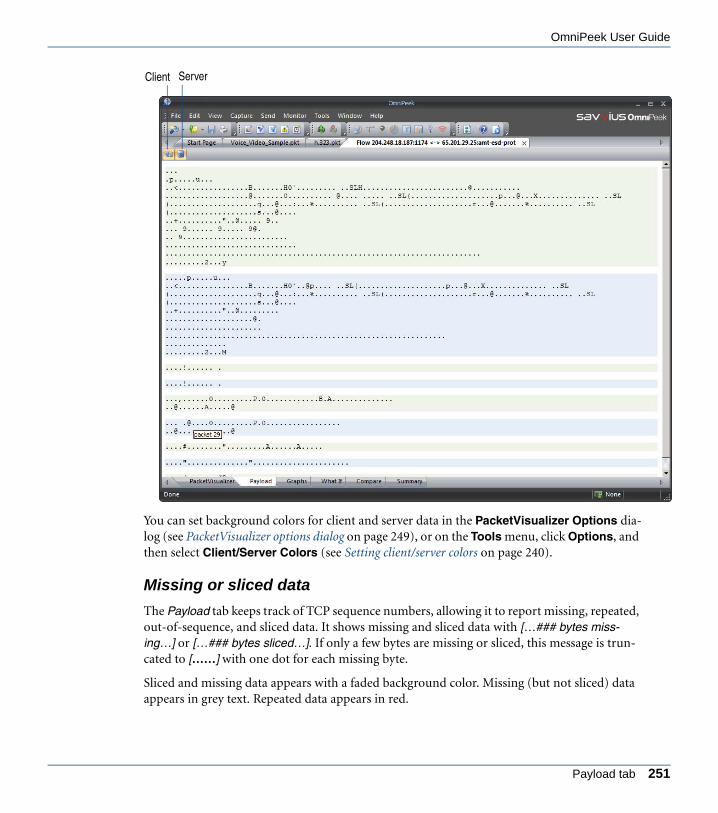
OmniPeek User Guide
ANYOP_UG.book Page 251 Friday, February 5, 2016 4:47 PM
You can set background colors for client and server data in the PacketVisualizer Options dia-log (see PacketVisualizer options dialog on page 249), or on the Tools menu, click Options, and then select Client/Server Colors (see Setting client/server colors on page 240).
Missing or sliced data
The Payload tab keeps track of TCP sequence numbers, allowing it to report missing, repeated, out-of-sequence, and sliced data. It shows missing and sliced data with […### bytes miss-ing…] or […### bytes sliced…]. If only a few bytes are missing or sliced, this message is trun-cated to [……] with one dot for each missing byte.
Sliced and missing data appears with a faded background color. Missing (but not sliced) data appears in grey text. Repeated data appears in red.
Client Server
Payload tab 251
Chapter 8: Expert Analysis
ANYOP_UG.book Page 252 Friday, February 5, 2016 4:47 PM
Saving payload data
Right-click in the Payload tab and choose Save Client Data… or Save Server Data… to cre-ate a text file with all of the binary data for that side of the conversation.
Graphs tab
The Graphs tab of the Visual Expert displays graphs of data across time.
To show a graph for display, select the graph type. Multiple graphs can be displayed simultane-ously.
There are five types of graphs:
• Throughput graph
• Latency graph
• Sequence graph
• TCP Trace graph
• TCP Window graph
252 Visual Expert

OmniPeek User Guide
ANYOP_UG.book Page 253 Friday, February 5, 2016 4:47 PM
The parts of the Graphs tab are identified below.
• Zoom In: Click and drag a rectangle across the portion you want to see to zoom into a specific portion of the graph.
• Zoom Out: Click to decrease size of graph.
• Zoom to Fit: Renders the entire graph within the available screen space.
• Client: Click to switch graph display to direction from client to server.
• Server: Click to switch graph display to direction from server to client.
• Light or Dark: Select a background for graphs from the drop-down list in the toolbar.
Zoom In
Zoom Out ClientServer
Zoom To Fit
Light or Dark background
Graphs tab 253

Chapter 8: Expert Analysis
ANYOP_UG.book Page 254 Friday, February 5, 2016 4:47 PM
Some graphs (Sequence, TCP Trace) display sequence numbers as a vertical axis. To show rel-ative values, right-click and enable Relative SEQ/ACK Numbers. See Relative SEQ/ACK num-bers on page 248.
• Right-click options:
• Relative Time: Displays a horizontal axis with time relative to the first packet in this flow.
• Absolute Time: Displays a horizontal axis with clock time.
• Data tips: Hold the mouse cursor still over a point on any graph to display a data tip for that point.
• For an axis, this shows the value of that axis at the current cursor.
• For empty graph areas or lines between graph points, this shows the vertical and horizontal values for that point.
• For graph points, this shows graph-specific data about that point.
• Magnifier lens: To magnify the graph area around the cursor, hold down the Shift key or press the Caps Lock key. A small view magnified by 4x appears in the lower right corner.
Throughput graph
The Throughput graph displays the rolling average throughput for the flow, in TCP Sequence Number order over time.
254 Visual Expert

OmniPeek User Guide
ANYOP_UG.book Page 255 Friday, February 5, 2016 4:47 PM
Note While most throughput calculations display the total number of bytes over time, the Throughput graph ignores IP/TCP headers and checksums. It includes only actual TCP payload data in its calculations.
There are two lines in the Throughput graph.
• The thin yellow line shows the rolling 1-second average value of throughput. This line tends to change frequently.
• The thicker green line shows the rolling 10-second average value of throughput. This line changes more slowly.
Graphs tab 255

Chapter 8: Expert Analysis
ANYOP_UG.book Page 256 Friday, February 5, 2016 4:47 PM
Note The Throughput graph does not display data for the first 0.5 seconds of data. There is not enough data collected during this period, and the graph tends to display incorrect values until after 0.5 seconds.
Both the 1-second and 10-second lines will display data before 1- and 10-seconds have elapsed. In this case, the graphed data is the average throughput up to that time. Both the 1- and 10-second lines show the same data up to the 1-second mark.
The Throughput graph only calculates points when there is a packet. Long spans without pack-ets create long spans with straight horizontal lines. Sawtooth waves are common for flows that have bursts of large packets interspersed with zero-data packets.
Latency graph
The Latency graph displays the time between a packet and the request packet that it acknowl-edges.
256 Visual Expert

OmniPeek User Guide
ANYOP_UG.book Page 257 Friday, February 5, 2016 4:47 PM
Note Not all flows have latency data. If a flow direction does not have an increasing SEQ number, then the other direction does not have anything to ACK, so the other direction will not have latency data.
Sequence graph
The Sequence graph displays TCP SEQ numbers across time. It displays a simple version of the information in the TCP Trace graph.
Graphs tab 257
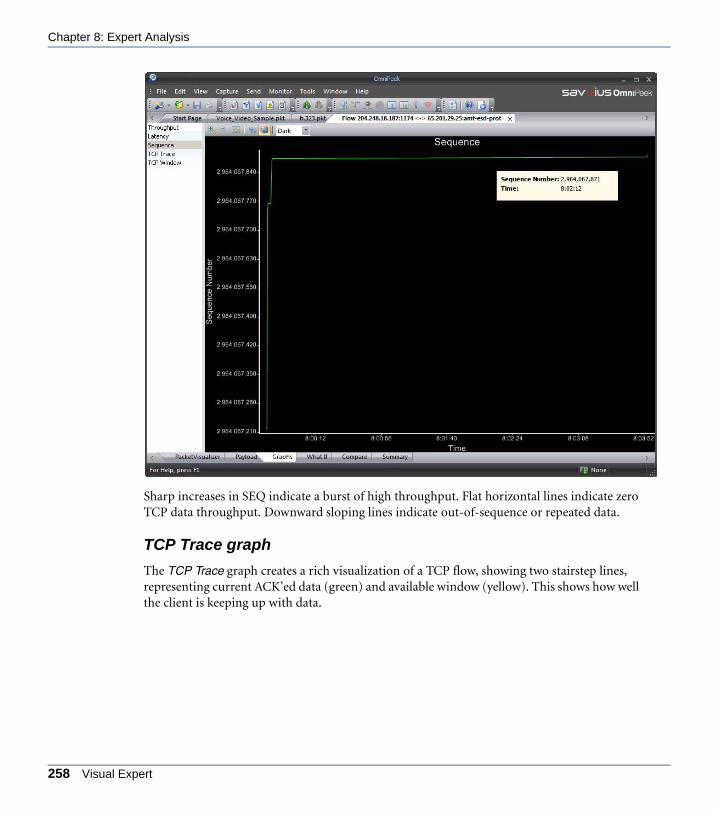
Chapter 8: Expert Analysis
ANYOP_UG.book Page 258 Friday, February 5, 2016 4:47 PM
Sharp increases in SEQ indicate a burst of high throughput. Flat horizontal lines indicate zero TCP data throughput. Downward sloping lines indicate out-of-sequence or repeated data.
TCP Trace graph
The TCP Trace graph creates a rich visualization of a TCP flow, showing two stairstep lines, representing current ACK’ed data (green) and available window (yellow). This shows how well the client is keeping up with data.
258 Visual Expert
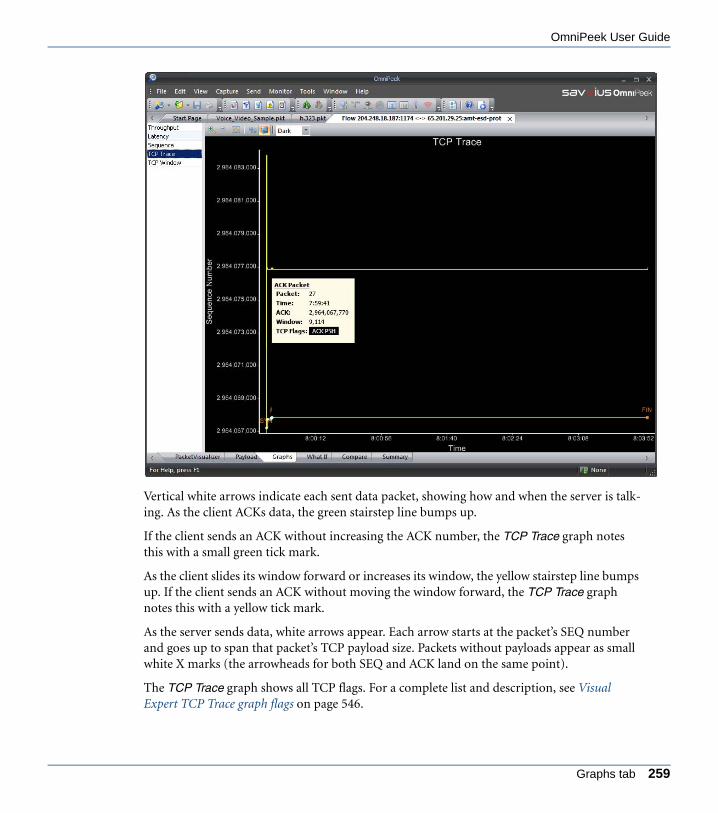
OmniPeek User Guide
ANYOP_UG.book Page 259 Friday, February 5, 2016 4:47 PM
Vertical white arrows indicate each sent data packet, showing how and when the server is talk-ing. As the client ACKs data, the green stairstep line bumps up.
If the client sends an ACK without increasing the ACK number, the TCP Trace graph notes this with a small green tick mark.
As the client slides its window forward or increases its window, the yellow stairstep line bumps up. If the client sends an ACK without moving the window forward, the TCP Trace graph notes this with a yellow tick mark.
As the server sends data, white arrows appear. Each arrow starts at the packet’s SEQ number and goes up to span that packet’s TCP payload size. Packets without payloads appear as small white X marks (the arrowheads for both SEQ and ACK land on the same point).
The TCP Trace graph shows all TCP flags. For a complete list and description, see Visual Expert TCP Trace graph flags on page 546.
Graphs tab 259

Chapter 8: Expert Analysis
ANYOP_UG.book Page 260 Friday, February 5, 2016 4:47 PM
TCP Window graph
The TCP Window graph (shown below the TCP Trace graph in the following figure) shows the size of the available TCP window as it expands and contracts through the course of the TCP session in the current flow.
The TCP window is the amount of unACK’ed data a particular TCP session will allow on the wire. When a receiver is keeping up with the sender, the available window floats near the top of its range, typically around 64K. As the receiver buffers more and more data, unable to imme-diately acknowledge its receipt, the available window shrinks. If it dips too low, the Expert will flag this event. When the available window reaches zero (the window is all used up), the sender stops and throughput suffers. Properly tuning TCP windows can have a significant effect on TCP throughput.
TCP Window graphs show data tips, using the same format and information found in TCP Trace graphs.
260 Visual Expert

OmniPeek User Guide
ANYOP_UG.book Page 261 Friday, February 5, 2016 4:47 PM
What If tab
The What If tab of the Visual Expert lets you estimate the effects of changes in various network and application parameters on throughput, utilization, and transaction times in the current flow. As you change the settings at the top of the tab, the values in these columns will change, allowing you to experiment with what if… scenarios.
The parts of the What If tab are identified below.
You can experiment with changes in three classes of settings at the top of the tab:
• Protocol/Network section lets you set Avg send packet size, Avg receive packet size, and the length of the time intervals for Latency (ms), and Contention (ms).
• Application section lets you set the number of Simultaneous users, the number of Packets per transaction, and the time required for Client processing (ms) and Server processing (ms).
What If tab 261
Chapter 8: Expert Analysis
ANYOP_UG.book Page 262 Friday, February 5, 2016 4:47 PM
• Set the Packet send … to … receive ratio.
Right-click options:
• Full Duplex: Select to display Client and Server each on separate lines of the table.
• Half Duplex: Select to display matching client and server transactions on a single line of the table (Client/Server column shows Client/Server for each line).
• Choose Client -> Server or Server -> Client to evaluate the flow in either direction.
• Set the precision of the time display to Milliseconds, Microseconds, or Nanoseconds.
• Restore Original Values: Select to return to the observed or calculated values when the What If tab was opened.
• Save What If Data…: Save the data from this tab in either a Text (view delimited)(*.txt) or CSV (Comma delimited)(*.csv) format.
Compare tab
When a flow is open in the Visual Expert, the Compare tab can find that same flow in any other open file or capture, and display the two separately captured instances of that flow side by side, noting any detailed differences between the two.
The parts of the Compare tab are identified below.
262 Visual Expert

OmniPeek User Guide
ANYOP_UG.book Page 263 Friday, February 5, 2016 4:47 PM
The Current flow is displayed on the left. Use the drop-down list in the header section to choose any other open capture window or capture file. The Compare tab will search the selected file for a matching flow by IP address and port number pairs and display it on the right.
• Packet: The packet number assigned in its capture window or capture file.
• Relative Time: Calculated from the first packet in each flow.
• IPID: IP address identification.
Packets that appear in one file but not the other are highlighted in green, with a connecting line showing where in the packet sequence the missing packets should appear.
Current flow Open capture windows
Compare tab 263

Chapter 8: Expert Analysis
ANYOP_UG.book Page 264 Friday, February 5, 2016 4:47 PM
The Compare tab can accommodate out of sequence packets, keeping the middle blue line synchronized across the two flows. Short messages above each table summarize the differences between the two.
The Compare tab scans ahead to match packets, and can easily accommodate flows in which most packets are out of sequence by tens of places. When scanning a very large file, this may take a moment to finish.
Summary tab
The Summary tab of the Visual Expert displays the data that appears in the Node Details tab of the Expert when the same flow is selected. See Details tab on page 237.
Network policy settingsThe Network Policy dialog lets you create, edit, save and reload descriptions of the partici-pants and expected behavior of a particular network for the Expert to use in detecting Net-work Policy violation events. Network policy is only supported for wireless captures.
To open the Network Policy dialog, choose one of the following:
• Click Network Policy in the Expert view toolbar
• Right-click and choose Network Policy… from the Expert, WLAN, or Channels views.
• Click Configure… in the Expert EventFinder Settings window when an individual Network Policy event is selected.
There are five network policy events:
• Vendor ID policy
• Channel policy
• ESSID policy
• WLAN encryption policy
• WLAN authentication policy
Each view describes a particular aspect of a network. When a view is enabled, the Expert notes a Network Policy violation when it sees traffic contrary to the settings in that view.
Note You can enable, disable, or set the Severity settings for each view in either the Network Policy dialog or the Expert EventFinder Settings window. Changes made in either dialog are reflected in the other. See Expert EventFinder on page 243.
264 Network policy settings

OmniPeek User Guide
ANYOP_UG.book Page 265 Friday, February 5, 2016 4:47 PM
The Network Policy settings as a whole can be saved or loaded:
• Click Export… to save the current settings in the Expert Settings File (*.exp) format.
• Click Import… to choose a previously saved *.xml file, and use it to replace the current Network Policy dialog settings.
Note The Network Policy settings form part of the settings for the Expert EventFinder. When you export or import settings from the Expert EventFinder Settings window, the Network Policy settings are also included. When you export from the Network Policy dialog, however, only the Network Policy settings are included in the created file.
Vendor ID policy
The Vendor ID policy dialog lets you set a policy based on the MAC addresses of 802.11 WLAN adapters seen by the Expert.
Use the table to create a list of MAC addresses (or blocks of MAC addresses, each defined by its vendor ID), then use the buttons at the top of the table to tell the Expert to Accept Matching, or Reject Matching MAC addresses.
You can use the asterisk character (*) as a wildcard to represent any byte of the 6-byte MAC address. The Name table ships with a current list of vendor IDs, associating each block of MAC addresses with a particular card vendor name.
Vendor ID policy 265

Chapter 8: Expert Analysis
ANYOP_UG.book Page 266 Friday, February 5, 2016 4:47 PM
Note Click Help on the dialog to learn about the available options and settings.
Channel policy
The Channel policy dialog lets you set a policy based on the 802.11 WLAN channels in use, as seen by the Expert.
Use the table to create a list of channels, then use the buttons at the top of the table to tell the Expert to Accept Matching, or Reject Matching channels.
Note When you first choose a Protocol, the table is populated with the most commonly used channels, including all channels permitted by the regulatory authorities in the United States. Other jurisdictions may permit other channels. To accommodate this, the list of channels is editable.
Enable
Accept Matching
Reject Matching Insert
EditDuplicate
Delete
Severity
266 Network policy settings

OmniPeek User Guide
ANYOP_UG.book Page 267 Friday, February 5, 2016 4:47 PM
ESSID policy
The ESSID policy dialog lets you set a policy based on the ESSIDs (Extended Service Set Iden-tifiers) in use, as seen by the Expert. The ESSID is an optional short text string used to identify all access points in a single ESS network.
Use the table to create a list of ESSIDs, then use the buttons at the top of the table to tell the Expert to Accept Matching, or Reject Matching ESSIDs.
WLAN encryption policy
The WLAN Encryption policy dialog lets you set a policy based on the encryption method in use, as seen by the Expert. The available encryption methods are: None (no encryption), WEP (Wired Equivalent Privacy), CKIP (Cisco Key Integrity Protocol), and TKIP (Temporal Key Integrity Protocol).
Use the buttons at the top of the table to tell the Expert to Accept Matching, or Reject Match-ing encryption methods.
WLAN authentication policy
The WLAN Authentication policy dialog lets you set a policy based on the authentication method in use, as seen by the Expert. The available authentication methods are:
• None (open, unrestricted authentication)
• LEAP (Lightweight EAP (Extensible Authentication Protocol))
• PEAP (Protected EAP),
• EAPTLS (EAP with Transport Layer Security)
Use the buttons at the top of the table to tell the Expert to Accept Matching, or Reject Match-ing authentication methods.
Note Click Help on each dialog to learn more about the available options and settings.
ESSID policy 267

Chapter 8: Expert Analysis
ANYOP_UG.book Page 268 Friday, February 5, 2016 4:47 PM
268 Network policy settings

C H A P T E R 9
ANYOP_UG.book Page 269 Friday, February 5, 2016 4:47 PM
Multi-Segment Analysis
In this chapter:
About Multi-Segment Analysis . . . . . . . . . . . . . . . . . . . . . . . . . . . . . . . . . . . . . 270
Flow list. . . . . . . . . . . . . . . . . . . . . . . . . . . . . . . . . . . . . . . . . . . . . . . . . . . . . . . 272
Flow map . . . . . . . . . . . . . . . . . . . . . . . . . . . . . . . . . . . . . . . . . . . . . . . . . . . . . 274
Ladder . . . . . . . . . . . . . . . . . . . . . . . . . . . . . . . . . . . . . . . . . . . . . . . . . . . . . . . 276
Creating an MSA project . . . . . . . . . . . . . . . . . . . . . . . . . . . . . . . . . . . . . . . . . 277
Using the MSA wizard . . . . . . . . . . . . . . . . . . . . . . . . . . . . . . . . . . . . . . . . . . . 279
MSA project analysis options . . . . . . . . . . . . . . . . . . . . . . . . . . . . . . . . . . . . . . 286
269
Chapter 9: Multi-Segment Analysis
ANYOP_UG.book Page 270 Friday, February 5, 2016 4:47 PM
About Multi-Segment AnalysisMulti-Segment Analysis (MSA) in OmniPeek allows you to quickly and easily locate, visualize, and analyze one or more flows as they traverse several capture points on your network from end-to-end. MSA provides visibility and analysis of application flows across multiple network segments, including network delay, packet loss, and retransmissions.
MSA can quickly pinpoint problems and their root causes across multiple segments, bring problematic flows together, and create an analysis session, report anomalies, and provide graphical visualization of multiple segments across the network.
An easy to use MSA wizard allows you to create MSA projects from either multiple Capture Engines located on your network, or from multiple existing capture packet files. Additionally, MSA projects can be created by right-clicking various views from the navigation pane of a cap-ture window.
Important! The time it takes for OmniPeek to build and display an MSA project is dependent on the number of segments, the number of flows, and the number of packets in each flow. MSA includes a limit of 100,000 packets per flow (modifiable from Multi-Segment Analysis Options), but there is no hard limit to the number of segments or flows that can be included in a project. Be selective when choosing data for your MSA projects. If you find that an MSA project is taking too long to build, you can cancel out and reduce your data set.
In order to facilitate the creation of MSA projects based on forensic searches, the following best practices are suggested:
• Each Capture Engine should have a unique name. This can be done via the Capture Engine Manager, or the Capture Engine Wizard.
• Make sure the time is accurate on all of the Capture Engines. If possible, configure the Capture Engine to use an NTP server.
• Give each capture a unique name. For instance, name the captures based on the network segments.
• Once an MSA project (.msa file) has been created, you may want to save the packet files that were used to create the MSA project for the following reasons:
• The packet files will be needed again if you want to add another segment to the MSA project.
• You may want to open a trace file related to a particular segment, to see different OmniPeek views, such as the Packets or Flows view.
• It may be necessary to rebuild MSA projects to take advantage of new MSA features in future versions of OmniPeek.
270 About Multi-Segment Analysis

OmniPeek User Guide
ANYOP_UG.book Page 271 Friday, February 5, 2016 4:47 PM
In addition, the following capture option settings must be enabled for MSA-based forensic searches:
• ‘Capture to disk’
• ‘Timeline Stats’
MSA project windowOnce configured and created using the MSA wizard, an MSA project window is displayed as shown below. The MSA project window consists of the following parts: Flow List, Flow Map, and Ladder.
Note When calculating the delay values for the flow map and ladder, MSA assumes that the client is on the left, and the server is on the right. If you create MSA projects that include multiple flows, all of the flows in the project should be initiated from the same direction. For example, flows initiated by two nodes on the private side of a firewall would be suitable to include in a single MSA project. Flows initiated by a node on the private side of a firewall, and flows initiated by a node on the public side of a firewall would not be suitable to include in a single MSA project.
MSA project window 271

Chapter 9: Multi-Segment Analysis
ANYOP_UG.book Page 272 Friday, February 5, 2016 4:47 PM
Flow list
The flow list displays a hierarchical list of flows for each capture source, including relevant information for each flow (client/server addresses and ports, protocols, packet counts, etc.) The flow list is hierarchical, with flows at the top level, and capture segments listed below the flow. Each capture segment includes statistics for that flow. Selecting the check box next to a flow displays that flow in the flow map and ladder diagram below.
Flow List
Flow Map Ladder
Analysis Options
272 MSA project window

OmniPeek User Guide
ANYOP_UG.book Page 273 Friday, February 5, 2016 4:47 PM
Note For any MSA project that has multiple flows, only one flow at a time can be selected in the flow list. The flow that is selected is displayed in the flow map and ladder diagram.
• Column header: Displays the column headings currently selected. Right-click the column header to enable/disable columns. Here are the available columns:
• Flow/Segment: The name of the flow or segment.
• Client Addr: The address of the client for the flow.
• Client Port: The port on which the Client or Client Addr was communicating in the flow.
Flow List
Flow list 273

Chapter 9: Multi-Segment Analysis
ANYOP_UG.book Page 274 Friday, February 5, 2016 4:47 PM
• Server Addr: The address of the Server or Server Addr for the flow.
• Server Port: The port on which the Server or Server Addr was communicating in the flow.
• Protocol: The protocol under which the packets in the flow were exchanged.
• Packets: The number of packets in the selected flow.
• Client Packets: The total number packets sent from the Client or Client Addr in the flow.
• Server Packets: The total number of packets sent from the Server or Server Addr in the flow.
• Packets Analyzed: The total number of packets in the flow that were analyzed by OmniPeek’s MSA component. ‘Packets Analyzed’ will be the same as ‘Packets,’ unless the number of packets in the flow exceeds the packet limit, as configured in MSA options.
• Packets Lost: The number of packets missing in the segment. Packets which are identified as ‘lost’ in a particular segment appeared in an least one other segment in the MSA project.
• Client Packets Lost: The number of packets lost in the client direction.
• Server Packets Lost: The number of packets lost in the server direction.
• Client Retransmissions: The number of TCP retransmissions sent by the client.
• Server Retransmissions: The number TCP retransmissions sent by the server.
• Start: The timestamp of the first packet in the flow.
• Finish: The timestamp of the final packet in the flow.
• Duration: The elapsed time, from the first to the last packet in the flow.
• TCP Status: Notes whether the TCP session is open or closed.
• Columns…: Displays a dialog that lets you enable/disable and organize columns.
• Show All Columns: Displays all available columns.
Flow map
The flow map displays a graphical representation of the segments of the selected flow. Each segment in the flow is displayed from end-to-end (client on the left and the server on the right), along with timing statistics (average delay, minimum delay, and maximum delay)
274 MSA project window

OmniPeek User Guide
ANYOP_UG.book Page 275 Friday, February 5, 2016 4:47 PM
between each segment. Additionally, the hop count between each segment is also displayed (the little number inside the cloud between the segments).
Flow map viewing tips
Here are some useful tips when viewing the data inside the flow map:
• Hover over segments names and clouds to view tooltips displaying more data.
• Press the Ctrl key and use your scroll wheel (Ctrl+Wheel) to change segment widths.
• Arrows show the direction in which data flows.
Flow Map
Flow map 275
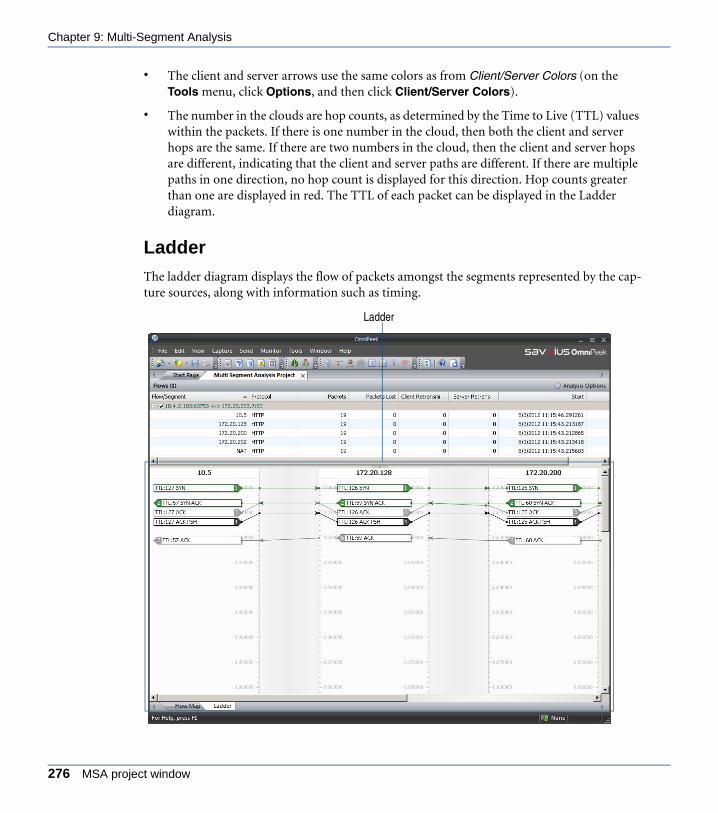
Chapter 9: Multi-Segment Analysis
ANYOP_UG.book Page 276 Friday, February 5, 2016 4:47 PM
• The client and server arrows use the same colors as from Client/Server Colors (on the Tools menu, click Options, and then click Client/Server Colors).
• The number in the clouds are hop counts, as determined by the Time to Live (TTL) values within the packets. If there is one number in the cloud, then both the client and server hops are the same. If there are two numbers in the cloud, then the client and server hops are different, indicating that the client and server paths are different. If there are multiple paths in one direction, no hop count is displayed for this direction. Hop counts greater than one are displayed in red. The TTL of each packet can be displayed in the Ladder diagram.
Ladder
The ladder diagram displays the flow of packets amongst the segments represented by the cap-ture sources, along with information such as timing.
Ladder
276 MSA project window

OmniPeek User Guide
ANYOP_UG.book Page 277 Friday, February 5, 2016 4:47 PM
Ladder viewing tips
Here are some useful tips when viewing the data inside the ladder diagram:
• Hover over packet boxes to view tooltips displaying more data.
• Arrows show the direction in which data flows.
• Green boxes are the packets that open the flow (SYN and SYN-ACK).
• Black boxes are packets with non-zero payload (packets that carry data).
• Gray boxes are packets that have zero payload (probably just ACK packets).
• Red boxes are packets that close the connection (FIN or RST).
• Right-click inside the diagram to show/hide additional statistics, or to adjust the time scale of the ladder.
• The following keyboard/scroll wheel shortcuts are available from the ladder display:
• Wheel+Ctrl: Changes the time scale.
• Wheel+Ctrl+Shift: Zoom the time scale.
• Wheel+Ctrl+Shift+Alt: Change the segment width.
• Ctrl+Alt+Shift+F9: Save ladder display to text.
Creating an MSA projectTo create an MSA project, you must use the MSA wizard. The MSA wizard guides you through the creation of an MSA project, and includes steps for setting up the project parameters and ultimately, displaying the MSA project window. There are multiple ways to start the MSA wiz-ard. Additionally, depending on which way you start the wizard, there are multiple entry points to the MSA wizard. You can start the MSA wizard in the following ways:
• From the File menu, choose New Multi-Segment Analysis Project…. The MSA wizard appears, and prompts you to create an MSA project by either searching for packets on remote engines, or using packet files:
• Searching for packets on remote engines: Select this option and the MSA wizard first guides you through choosing a time range to search, and a filter to apply (making a filter for IP/port pairs is recommended, though any filter supported by OmniPeek will work). Additional wizard screens guide you through choosing which Capture Engines and which capture sessions per Capture Engine you wish to search against.
Finally, the wizard performs the search, and the relevant packets are downloaded to OmniPeek for analysis. From there, it works the same way it does for doing multi-segment analysis from files, except that the files are already entered for you (they're
Creating an MSA project 277

Chapter 9: Multi-Segment Analysis
ANYOP_UG.book Page 278 Friday, February 5, 2016 4:47 PM
the files downloaded from the Capture Engines). You can reorder the segments, rename the segments, change the time offsets, and save the output to an .msa file.
• Use packet files: Select this option and the MSA wizard guides you through choosing which files to use (one file per segment), and the time offsets between them. You can also name each segment, and reorder them. Then you can save the resulting project to an .msa file, which can be reloaded later. The .msa file contains all the analysis, so you don't have to do any of this setup again.
• From the Packets view in the navigation pane: Right-click one or more packets and choose Multi-Segment Analysis…. The MSA wizard appears and guides you through the creation of the MSA project, beginning with choosing a time range to search, and a filter to apply.
• From any of the Expert views (Clients/Servers, Flows, and Applications) in the navigation pane: Right-click one or more flows and choose Multi-Segment Analysis…. The MSA wizard appears and guides you through the creation of the MSA project, beginning with choosing a time range to search, and a filter to apply. The Multi-Segment Analysis… option only appears for IPv4 TCP flows. MSA does not support UDP or IPv6 flows.
• From any of the Web views (Servers, Clients, Pages, and Requests) in the navigation pane: Right-click one or more servers, clients, pages, or requests and choose Multi-Segment Analysis…. The MSA wizard appears and guides you through the creation of the MSA project, beginning with choosing a time range to search, and a filter to apply.
• From the Nodes and Protocols views in the navigation pane: Right-click one or more nodes or protocols and choose Multi-Segment Analysis…. The MSA wizard appears and guides you through the creation of the MSA project, beginning with choosing a time range to search, and a filter to apply.
Important! The time it takes for OmniPeek to build and display an MSA project is dependent on the number of segments, the number of flows, and the number of packets in each flow. MSA includes a limit of 100,000 packets per flow (modifiable from Multi-Segment Analysis Options), but there is no hard limit to the number of segments or flows that can be included in a project. Be selective when choosing data for your MSA projects. If you find that an MSA project is taking too long to build, you can cancel out and reduce your data set.
278 Creating an MSA project

OmniPeek User Guide
ANYOP_UG.book Page 279 Friday, February 5, 2016 4:47 PM
Using the MSA wizardThe MSA wizard guides you through the creation of an MSA project. You can access the MSA wizard in numerous ways as described in Creating an MSA project on page 277. This section describes the various screens of the MSA wizard.
Create a new multi-segment analysis project
The Create a new Multi-Segment Analysis project dialog of the MSA wizard, on the File menu, click New Multi-Segment Analysis…. The dialog lets you create a new multi-segment analysis project from scratch.
• Search for packets on remote engines: Select this option to create an MSA project based on packets obtained from one or more Capture Engines.
• Use packet files: Select this option to create an MSA project based on one or more packet files.
Time range & filter
The Time Range & Filter dialog of the MSA wizard lets you choose a time range and filter to apply to your search.
Using the MSA wizard 279

Chapter 9: Multi-Segment Analysis
ANYOP_UG.book Page 280 Friday, February 5, 2016 4:47 PM
• Start time: Select or enter the start date and time of the range you wish to search.
• End time: Select or enter the end date and time of the range you wish to search.
• +/- seconds: Select or enter the number of seconds to add to the search both before the start time and after the end time.
• Duration: Displays the amount of time between the start and end time specified.
• Filter: Displays any filters currently defined for the search.
• Edit: Click to display the Edit Filter dialog, where you can define simple and advanced filters based on any combination of addresses, protocols, and ports. A packet must match all of the conditions specified in order to match the filter.
• Clear: Click to remove any filters currently defined for the search.
Engines
The Engines dialog displays the groups and Capture Engines currently listed in the OmniPeek Capture Engines window. If you had selected the option to Search for packets on remote engines earlier in the MSA wizard, the Engines dialog appears after clicking Next in the Time Range & Filter dialog of the MSA wizard.
280 Using the MSA wizard

OmniPeek User Guide
ANYOP_UG.book Page 281 Friday, February 5, 2016 4:47 PM
• Select the check box of the Capture Engines you want to search in your MSA project. If you are not already connected to the Capture Engine, you are first prompted to connect to the Capture Engine by entering domain, username, and password information.
• Enable all: Click this option to select the check box of all groups and Capture Engine displayed in the dialog.
• Disable all: Click this option to clear the check boxes of all groups and Capture Engines displayed in the dialog.
Capture sessions
The Capture Sessions dialog displays the capture sessions found in each of the of the selected Capture Engines. If you had selected the option to Search for packets on remote engines ear-lier in the MSA wizard, the Capture Sessions dialog appears after clicking Next in the Engines dialog of the MSA wizard. A separate *.wpz file is created for each capture session selected, and each file represents a different network segment. When performing multi-seg-ment analysis, OmniPeek uses *.wpz files to build the MSA project.
Capture sessions 281
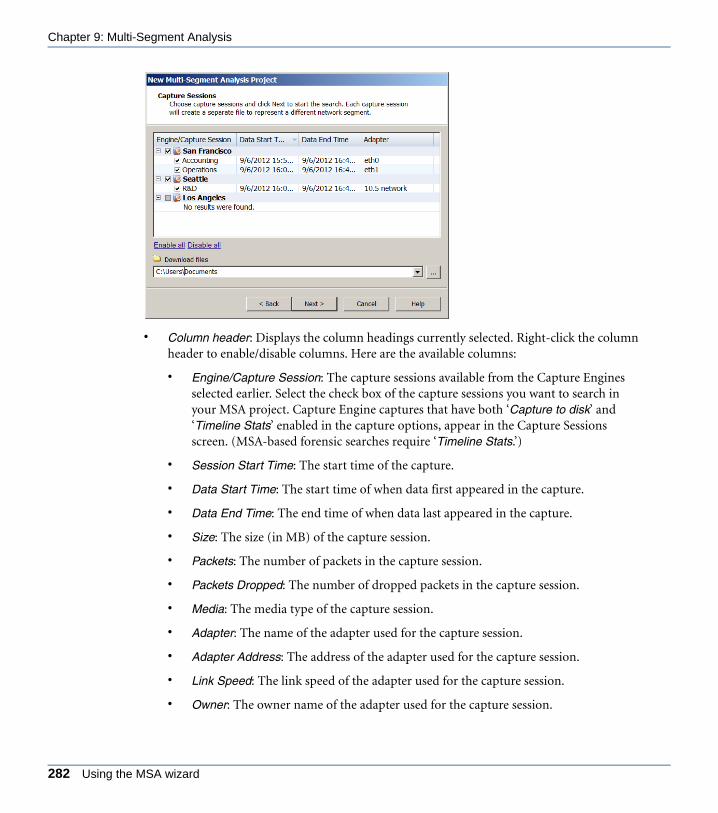
Chapter 9: Multi-Segment Analysis
ANYOP_UG.book Page 282 Friday, February 5, 2016 4:47 PM
• Column header: Displays the column headings currently selected. Right-click the column header to enable/disable columns. Here are the available columns:
• Engine/Capture Session: The capture sessions available from the Capture Engines selected earlier. Select the check box of the capture sessions you want to search in your MSA project. Capture Engine captures that have both ‘Capture to disk’ and ‘Timeline Stats’ enabled in the capture options, appear in the Capture Sessions screen. (MSA-based forensic searches require ‘Timeline Stats.’)
• Session Start Time: The start time of the capture.
• Data Start Time: The start time of when data first appeared in the capture.
• Data End Time: The end time of when data last appeared in the capture.
• Size: The size (in MB) of the capture session.
• Packets: The number of packets in the capture session.
• Packets Dropped: The number of dropped packets in the capture session.
• Media: The media type of the capture session.
• Adapter: The name of the adapter used for the capture session.
• Adapter Address: The address of the adapter used for the capture session.
• Link Speed: The link speed of the adapter used for the capture session.
• Owner: The owner name of the adapter used for the capture session.
282 Using the MSA wizard
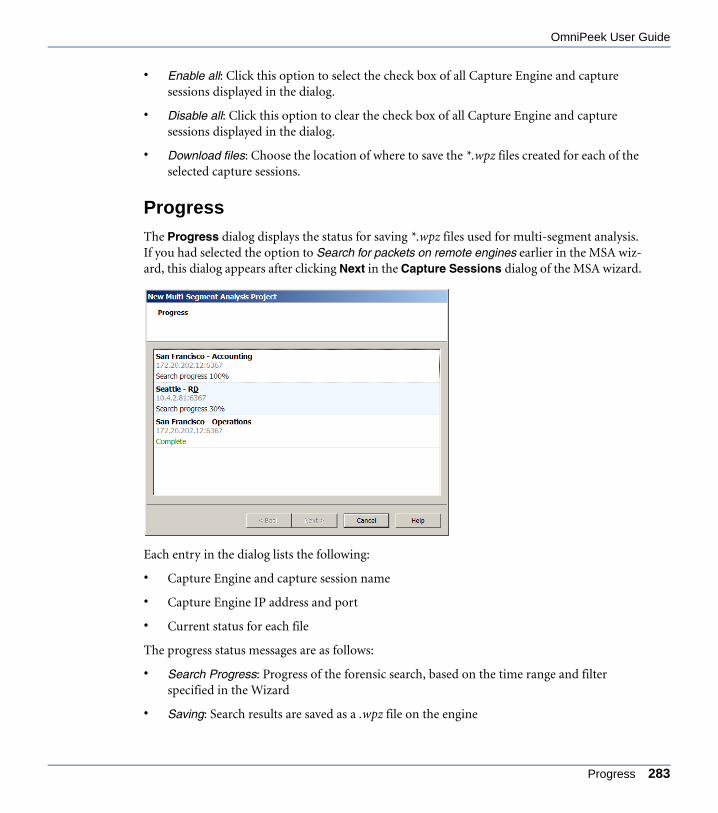
OmniPeek User Guide
ANYOP_UG.book Page 283 Friday, February 5, 2016 4:47 PM
• Enable all: Click this option to select the check box of all Capture Engine and capture sessions displayed in the dialog.
• Disable all: Click this option to clear the check box of all Capture Engine and capture sessions displayed in the dialog.
• Download files: Choose the location of where to save the *.wpz files created for each of the selected capture sessions.
Progress
The Progress dialog displays the status for saving *.wpz files used for multi-segment analysis. If you had selected the option to Search for packets on remote engines earlier in the MSA wiz-ard, this dialog appears after clicking Next in the Capture Sessions dialog of the MSA wizard.
Each entry in the dialog lists the following:
• Capture Engine and capture session name
• Capture Engine IP address and port
• Current status for each file
The progress status messages are as follows:
• Search Progress: Progress of the forensic search, based on the time range and filter specified in the Wizard
• Saving: Search results are saved as a .wpz file on the engine
Progress 283
Chapter 9: Multi-Segment Analysis
ANYOP_UG.book Page 284 Friday, February 5, 2016 4:47 PM
• Deleting Search: The forensic search is deleted on the engine
• Download Progress: The .wpz file is downloaded to the OmniPeek computer
• Deleting Remote File: The .wpz file is deleted from the engine
• Complete: The entire process is complete. Once you see Complete for all capture segments, click Next to continue building the MSA project
Tip You can cancel the progress of any one of the capture segments by right-clicking and selecting Cancel. You can cancel any of the above stages, except for the Saving stage.
Segments
This Segments dialog lets you add supported capture files captured on separate network seg-ments to your MSA project. In order for the MSA analysis to display correctly in your flow maps and ladder diagrams, each segment file must be properly ordered by the route taken from client to server (when displayed in the flow map and ladder, the client is on the left and the server is on the right). You can manually choose to arrange the files in the dialog.
Tip If you do not manually arrange the files by the route taken from client to server, you can use the auto-arrange feature available from the Analysis Options dialog. See MSA project analysis options on page 286.
Note When calculating the delay values for the flow map and ladder, MSA assumes that the client is on the left, and the server is on the right. If you create MSA projects that include multiple flows, all of the flows in the project should be initiated from the same direction. For example, flows initiated by two nodes on the private side of a firewall would be suitable to include in a single MSA project. Flows initiated by a node on the private side of a firewall, and flows initiated by a node on the public side of a firewall would not be suitable to include in a single MSA project.
284 Using the MSA wizard

OmniPeek User Guide
ANYOP_UG.book Page 285 Friday, February 5, 2016 4:47 PM
• Insert: Click to insert a new segment. You will be prompted to name the segment and select a supported capture file.
• Edit: Click to edit a selected segment. You can choose to rename the segment or choose another supported file for the segment.
• Delete: Click to remove a selected segment.
• Move Up: Click to move a selected segment up in the ordered list of segments. You can also press (Shift or Ctrl)+Up Arrow to move the segment up in the list
• Move Down: Click to move a selected segment down in the ordered list of segments. You can also press (Shift or Ctrl)+Down Arrow to move the segment down in the list.
• Column Header: Displays the column headings currently selected. Right-click the column header to enable/disable columns. Here are the available columns:
• Segment Name: The name of the segment.
• File: The location and file name of the segment.
Edit segment
This dialog lets you edit a selected segment.
Edit segment 285

Chapter 9: Multi-Segment Analysis
ANYOP_UG.book Page 286 Friday, February 5, 2016 4:47 PM
• Name: Displays the name of the segment. Type a different name to rename the segment.
• File: Displays the location and name of the segment file.
Project file
This Project File dialog lets you save the MSA project file (*.msa). Once saved, the MSA proj-ect window is displayed.
Note If your MSA project window is blank, more than likely you have either selected a flow that is not supported by MSA (for example, UDP or IPv6), or it is a flow with fragmented packets.
• Project file: Displays the location and MSA project file name (*.msa).
MSA project analysis optionsOnce you have created or opened an existing MSA project window, you can access the Multi-Segment Analysis Options dialog to edit segment, synchronization, and limit options. Addi-tionally, you can add notes for the project.
286 MSA project analysis options
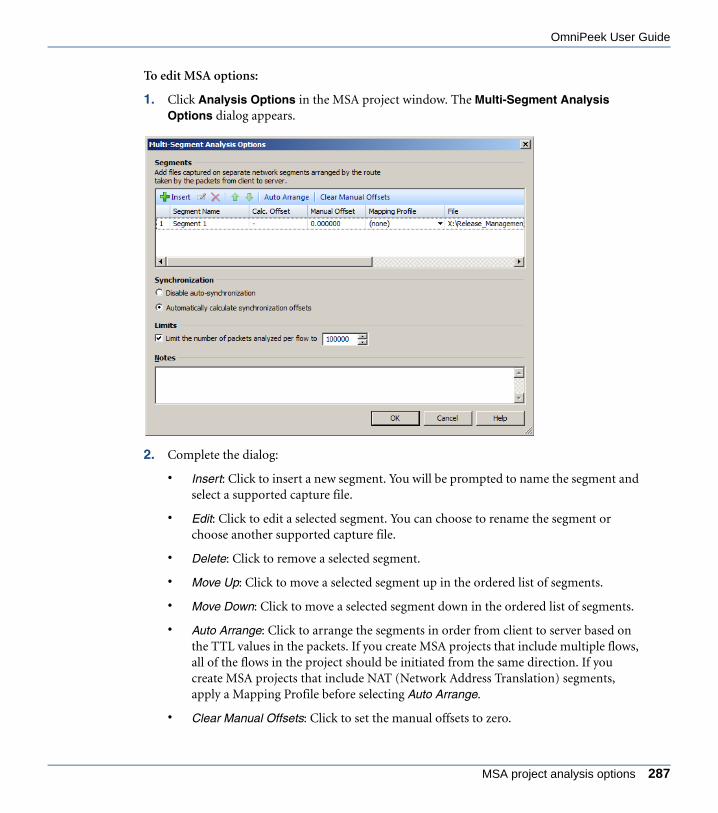
OmniPeek User Guide
ANYOP_UG.book Page 287 Friday, February 5, 2016 4:47 PM
To edit MSA options:
1. Click Analysis Options in the MSA project window. The Multi-Segment Analysis Options dialog appears.
2. Complete the dialog:
• Insert: Click to insert a new segment. You will be prompted to name the segment and select a supported capture file.
• Edit: Click to edit a selected segment. You can choose to rename the segment or choose another supported capture file.
• Delete: Click to remove a selected segment.
• Move Up: Click to move a selected segment up in the ordered list of segments.
• Move Down: Click to move a selected segment down in the ordered list of segments.
• Auto Arrange: Click to arrange the segments in order from client to server based on the TTL values in the packets. If you create MSA projects that include multiple flows, all of the flows in the project should be initiated from the same direction. If you create MSA projects that include NAT (Network Address Translation) segments, apply a Mapping Profile before selecting Auto Arrange.
• Clear Manual Offsets: Click to set the manual offsets to zero.
MSA project analysis options 287

Chapter 9: Multi-Segment Analysis
ANYOP_UG.book Page 288 Friday, February 5, 2016 4:47 PM
• Column Header: Displays the column headings currently selected. Right-click the column header to enable/disable columns. Here are the available columns:
• Segment Name: The name of the segment.
• Calc. Offset: The automatically calculated synchronization offset for the segment.
• Manual Offset: The user-specified offset. A manual offset can be used instead of, or in addition to, the automatically calculated offset.
• Total Offset: The calculated offset plus the manual offset.
• Mapping Profile: The mapping profile associated with the segment. A mapping profile can be created to map private addresses/ports to public addresses/ports. See Creating a mapping profile on page 288.
• File: The location and packet file on which the MSA segment information is based.
• Columns…: Displays a dialog that lets you enable/disable and organize columns.
• Show All Columns: Displays all available columns.
• Disable auto synchronization: Select this option to disable automatically calculating offset values.
• Automatically calculate synchronization offsets: Select this option to enable automatically calculating synchronization offset values. All Capture Engines should be set to the correct time, preferably through the use of an NTP server. But, even with the use of NTP servers, offsets may be needed to adjust for slight timing inaccuracies across Capture Engines. Automatic calculation of synchronization offsets is based on the TCP SYN and TCP SYN ACK packets. If a segment does not contain the SYN and SYN ACK packets, there will be a dash (–) in the Calc. Offset field. If the MSA project contains multiple flows, the automatic calculation of synchronization offsets is based on all flows.
• Limits: Select this check box to enable the limit on the number of packets analyzed per flow, and then enter or select the number of flows.
• Notes: Type any notes to append to the MSA project.
3. Click OK.
Creating a mapping profile
A mapping profile is used to map private addresses/ports to public addresses/ports.
288 MSA project analysis options

OmniPeek User Guide
ANYOP_UG.book Page 289 Friday, February 5, 2016 4:47 PM
Note If your project includes a Network Address Translation (NAT) segment, the auto-arrange feature should not be selected until you apply a mapping profile.
To create a mapping profile:
1. From the MSA project window, click Analysis Options to display the Multi-Segment Analysis Options dialog.
2. Click inside the box in the Mapping Profile column for the desired segment. A popup menu appears.
3. Select New. The Mapping Profile dialog appears.
4. Complete the Mapping Profile dialog:
• Name: Type a name for the profile.
• Insert: Click to display Address/Port Mapping dialog. Complete the dialog.
• Edit: Click to edit a selected mapping. The Address/Port Mapping dialog appears. Complete the dialog.
• Delete: Click to delete a selected mapping.
• Import: Click to import an MSA mapping file (*.xml).
• Export: Click to export a mapping profile to an MSA mapping file (*.xml).
• Swap: Click to swap directions of a selected mapping.
5. Click OK.
Creating a mapping profile 289

Chapter 9: Multi-Segment Analysis
ANYOP_UG.book Page 290 Friday, February 5, 2016 4:47 PM
290 MSA project analysis options

C H A P T E R 10
ANYOP_UG.book Page 291 Friday, February 5, 2016 4:47 PM
Web Analysis
In this chapter:
About web analysis. . . . . . . . . . . . . . . . . . . . . . . . . . . . . . . . . . . . . . . . . . . . . . 292
Web view window . . . . . . . . . . . . . . . . . . . . . . . . . . . . . . . . . . . . . . . . . . . . . . . 292
Timing column . . . . . . . . . . . . . . . . . . . . . . . . . . . . . . . . . . . . . . . . . . . . . . . . . 294
Web upper pane views . . . . . . . . . . . . . . . . . . . . . . . . . . . . . . . . . . . . . . . . . . . 297
Web lower pane tabs . . . . . . . . . . . . . . . . . . . . . . . . . . . . . . . . . . . . . . . . . . . . 300
Configuring web views . . . . . . . . . . . . . . . . . . . . . . . . . . . . . . . . . . . . . . . . . . . 308
291
Chapter 10: Web Analysis
ANYOP_UG.book Page 292 Friday, February 5, 2016 4:47 PM
About web analysisThe Web views of an OmniPeek capture window display packet flow reconstruction of web requests and responses, allowing you to perform forensic searches by drilling down to individ-ual images, files, and pages. Web data is arranged by server, client, page, or request, providing you with a primary focus for your investigation of the original web content.
You can select an individual HTTP request and immediately view the corresponding details, header information, a graphic representation of an image, or a packet timing graph display of the individual packets and phases of that request. For more information on web packet timing graph displays, see Timing column on page 294 and Timing tab on page 304.
Saving and opening web payloads or web statistics is immediately available through right-click options. See Web save functions on page 309.
Note Web views are not supported in Capture Engine capture windows.
Web view windowThe Web view window has two data areas. The upper pane displays the same data from four different points of view: by servers, clients, pages, and requests. Expanding the data in Serv-ers, Clients, and Pages views displays the individual requests nested underneath.
The lower pane of the Web view window contains four tabs which present additional informa-tion about selected rows in the upper panes: web details, client and server headers, the con-tents of a selected request, or a packet timing graph representing the packets and phases of an individual request.
The parts of the Web view window are identified below.
292 About web analysis

OmniPeek User Guide
ANYOP_UG.book Page 293 Friday, February 5, 2016 4:47 PM
• Summary counts: This area displays the total count of servers, clients, pages, and requests in this capture.
• Refresh: You can immediately update the currently displayed Web view with the latest information. You can also choose a refresh interval from the drop-down list.
• Web view columns: Right-click the column headers to select the columns you wish to display. For more display options, see Web view columns on page 308.
For a complete list and description of the available columns in the Web views, see Web view columns on page 546.
• Timing column: Displays duration, packets, and phases of each HTTP request. The Timing column is hidden by default. To display the column, right-click the column header and select Timing. For details, see Timing column on page 294.
• Upper pane web views: This area displays web data in four formats: by server, client, page, and request. See Web upper pane views on page 297.
Refresh
Lower pane web tabs (Contents tab)
Upper pane web views (Pages view)
Summary counts
Web views columns
Timing column
Web view window 293
Chapter 10: Web Analysis
ANYOP_UG.book Page 294 Friday, February 5, 2016 4:47 PM
• Lower pane web tabs: This area displays additional information corresponding to a selected row or rows of upper pane data in the following four formats: web details, headers, contents, and packet timing graph. See Web lower pane tabs on page 300.
• Right-click options include:
• Save Web Statistics…: Save Web statistics to a .txt or .csv file. See Web save functions on page 309.
• Save Payload…: Save payload to the local disk. See Save payload on page 309.
• Open Payload in Associated Viewer: Open payload directly from Web view. See Open payload in associated viewer on page 310.
• Select Related Packets…: Select related packets by various options. See Web packet selection on page 308.
Timing columnThe Timing column shows abbreviated versions of the full packet timing graph displayed in the Timing tab (see Timing tab on page 304). These packet timing graphs show the duration, pack-ets, and phases of each HTTP request.
To view the Timing column, right-click in the column header and select Timing.
294 Timing column

OmniPeek User Guide
ANYOP_UG.book Page 295 Friday, February 5, 2016 4:47 PM
The following key describes the colors and phases of the packet timing graph:
• Orange line: This represents the idle phase, either after SYN sets up the connection but before first data packet, or after the last data packet but before FIN packets shut down the connection. Often there is little or no idle phase before the first data packet, but a long idle phase after the last packet. This occurs because most clients will keep a connection open in case they need to fetch more data from the server.
• Blue line (default client color): This shows the request phase, when the client is sending its HTTP GET and waiting for a response. You can reset the client and server colors in the Client/Server view of the Options dialog. See Setting client/server colors on page 240.
• Green line (default server color): This shows the response phase, when the server is sending its data back to the client. You can reset the client and server colors in the Client/Server view of the Options dialog. See Setting client/server colors on page 240.
• Purple line: This shows a reset connection, which is the idle period after the last data packet and the TCP RST packet.
Timing column
Timing tab
Timing column 295

Chapter 10: Web Analysis
ANYOP_UG.book Page 296 Friday, February 5, 2016 4:47 PM
• Tick marks: Individual server packets appear as tick marks above the packet timing graph. Individual client packets appear as tick marks below the packet timing graph. Tick mark height corresponds to TCP payload length.
The following provides examples of how to read phases of the packet timing graph:
Packet counts in web views
The packet and byte counts in Web views will generally be less than those in the more packet-oriented capture window views such as Nodes or Expert because:
• Packet counters in Web views count only TCP data packets and TCP SYN/FIN/RST flags. They ignore ACK-only packets.
Example
From left to right, an initial orange SYN packet from the client appears below the packet timing graph, which is almost immediately answered with an orange SYN packet from the server above the packet timing graph. There is an idle period where the packet timing graph remains in its orange SYN phase, and then a single blue client request packet appears. The server responds almost immediately with a block of tall green packets.
Note: This request lacks a final orange FIN phase, so it is likely that this flow was reused for sub-sequent HTTP requests. The FIN phase appears after the last HTTP request on this same flow.
From left to right, a tiny orange SYN packet appears above the packet timing graph, from the server. This is directly above a tiny blue request packet below the packet timing graph, from the client. An orange SYN packet appears below the packet timing graph, from the client.
There is a blue phase where the client waits for a response, eventually followed by green tick marks showing response packets from the server. The server then pauses a moment before sending the final packet and finishing the request.
In this example, a single blue packet appears below the packet timing graph, followed by a long purple idle period, and eventually a purple TCP RST packet from the client. This shows that the client requested some data, never heard back from the server, and eventually closed the connec-tion with a TCP reset.
296 Timing column

OmniPeek User Guide
ANYOP_UG.book Page 297 Friday, February 5, 2016 4:47 PM
• Byte counters in Web views count only reassembled TCP payload bytes. They do not include MAC/IP/TCP header, FCS, or repeated data bytes. Byte counts in web views do include HTTP header bytes.
Web upper pane views
Servers view
The Servers view of a capture window lets you focus on which servers are being used. When the data is expanded, the list of servers is shown with nested information in the following hier-archy: the servers, the clients using those servers, the pages that each client requests, and the individual requests that make up each page.
Clients view
The Clients view of a capture window lets you focus on clients first, with nested information in the following hierarchy: the clients, the servers used by the clients, the pages that each client loads from each server, and the individual requests that make up each page.
Web upper pane views 297
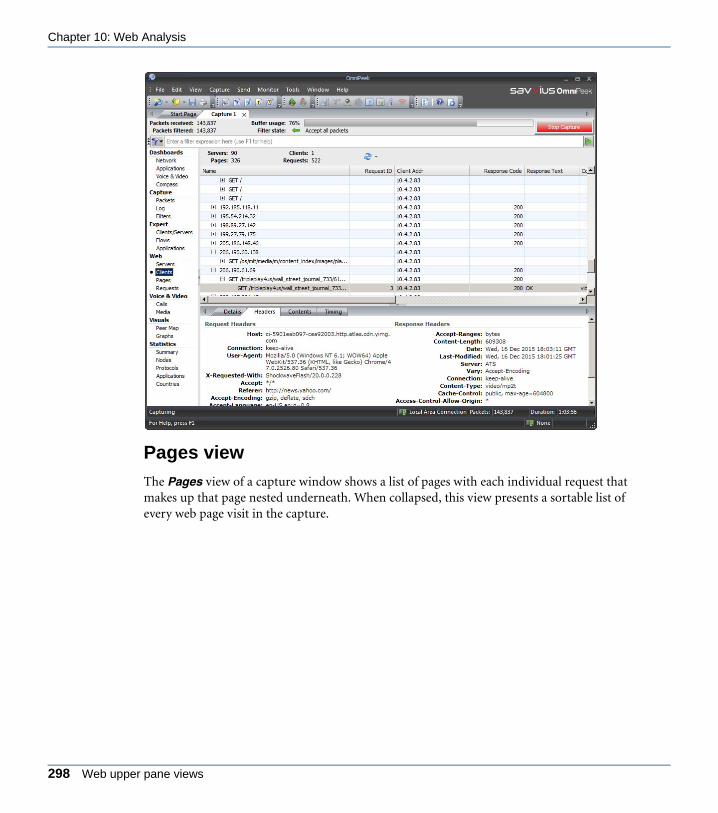
Chapter 10: Web Analysis
ANYOP_UG.book Page 298 Friday, February 5, 2016 4:47 PM
Pages view
The Pages view of a capture window shows a list of pages with each individual request that makes up that page nested underneath. When collapsed, this view presents a sortable list of every web page visit in the capture.
298 Web upper pane views

OmniPeek User Guide
ANYOP_UG.book Page 299 Friday, February 5, 2016 4:47 PM
Requests view
The Web Requests view of a capture window shows a flat list of individual HTTP requests (usually HTTP GETs and POSTs). This view shows each image, JavaScript, HTML file, and other HTTP request in the capture nested underneath.
Requests view 299

Chapter 10: Web Analysis
ANYOP_UG.book Page 300 Friday, February 5, 2016 4:47 PM
Tip Along with relevant filters, this view can provide the quickest way to drill down to the raw data for analysis.
Web lower pane tabsAdditional information is provided in the four lower pane tabs for each selected row in the upper pane of the Web view.
Details tab
The web Details tab lists information about the first selected row in the upper pane, including Host, Response Code, Referer, Content-Type, Request ID, and Flow ID. Data is displayed indi-vidually for client and server.
300 Web lower pane tabs

OmniPeek User Guide
ANYOP_UG.book Page 301 Friday, February 5, 2016 4:47 PM
Headers tab
The web Headers tab displays HTTP headers for a selected request in client colors and its response in server colors.
Headers tab 301
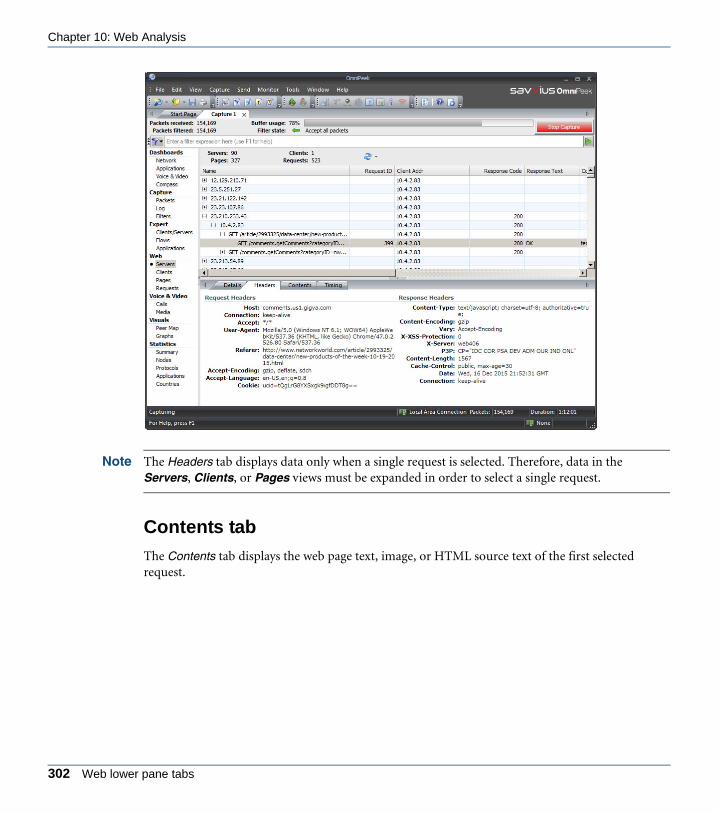
Chapter 10: Web Analysis
ANYOP_UG.book Page 302 Friday, February 5, 2016 4:47 PM
Note The Headers tab displays data only when a single request is selected. Therefore, data in the Servers, Clients, or Pages views must be expanded in order to select a single request.
Contents tab
The Contents tab displays the web page text, image, or HTML source text of the first selected request.
302 Web lower pane tabs

OmniPeek User Guide
ANYOP_UG.book Page 303 Friday, February 5, 2016 4:47 PM
Note The Contents tab displays data only when a single request is selected. Therefore, data in the Servers, Clients, or Pages views must be expanded in order to select a single request.
Contents tab options
You can right-click inside the Contents tab to enable/disable the following options for viewing the reconstructed document selected in the upper panes:
• Display HTML as Source Text: Displays the contents of a reconstructed document as HTML source text.
• Display HTML as HTML: Displays the contents of a reconstructed document as it would appear when viewed in your browser.
Tip To display a reconstructed document as a complete HTML page, search for and select reconstructed documents that display “text/html” in the Content-Type column. Please note,
Contents tab 303

Chapter 10: Web Analysis
ANYOP_UG.book Page 304 Friday, February 5, 2016 4:47 PM
however, that not every instance of “text/html” in the Content-Type column will display a complete HTML page.
• JavaScript Execution: Enables embedded or linked scripts (JavaScript, VBScript, etc.) to run in the browser.
• ActiveX: Enables ActiveX controls to run in the browser.
• Background Sounds: Enables playing background sounds contained in the reconstructed document.
• Download Images: Enables viewing of images contained in the reconstructed document. (Images are not downloaded from the Internet, but from other reconstructed flows.)
Timing tab
The Timing tab displays a packet timing graph of all the packets in the selected request row or rows. This tab lets you view all of the requests of a web page simultaneously, across multiple flows, multiple servers, and through time. You can view a complete HTML page load from start to finish, within a single graph, with packet-level precision.
For examples of how to read the information displayed in the Timing tab, see Timing example of single request on page 306 and Timing example of multiple requests on page 307.
The parts of the Timing tab display are described below.
304 Web lower pane tabs

OmniPeek User Guide
ANYOP_UG.book Page 305 Friday, February 5, 2016 4:47 PM
• Zoom In: Click and drag a rectangle across the portion you want to see to zoom into a specific portion of the graph.
• Zoom Out: Click to decrease the display of the packet timing graph.
• Zoom to Fit: Click to render the entire packet timing graph within the available screen space.
• Light/Dark: Choose a light or dark background color for the packet timing graph display.
• Data tip: Hold the cursor over a point on the packet timing graph to view a data tip displaying payload size, relative time, number of requests and responses.
• Packet display details:
• Client request packets appear below the grey packet timing graph.
• Server response packets appear above the grey packet timing graph.
Zoom Out
Zoom to FitLight/Dark
Zoom In Data tip
Packet display details
Selected requests
Timing tab 305
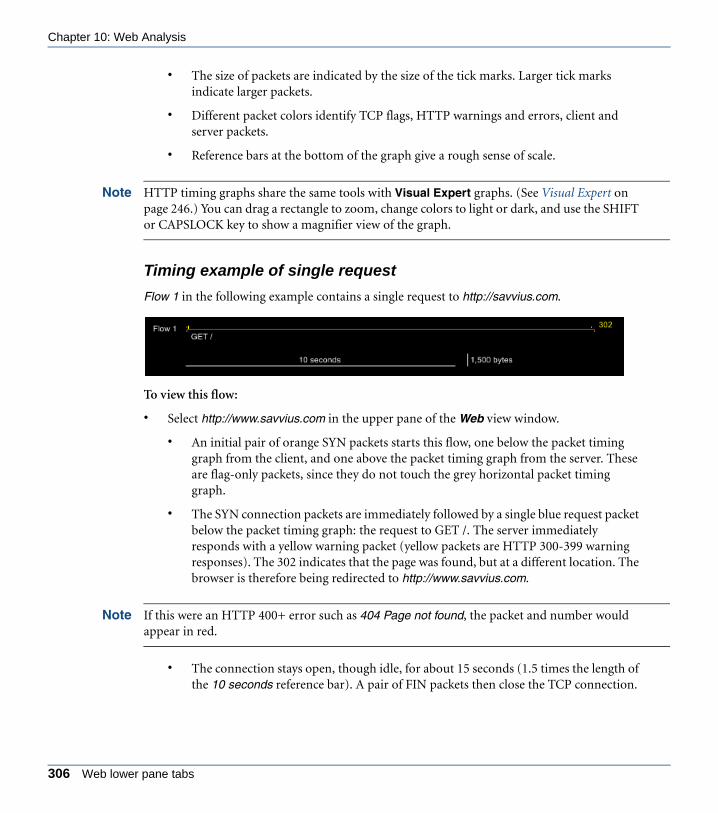
Chapter 10: Web Analysis
ANYOP_UG.book Page 306 Friday, February 5, 2016 4:47 PM
• The size of packets are indicated by the size of the tick marks. Larger tick marks indicate larger packets.
• Different packet colors identify TCP flags, HTTP warnings and errors, client and server packets.
• Reference bars at the bottom of the graph give a rough sense of scale.
Note HTTP timing graphs share the same tools with Visual Expert graphs. (See Visual Expert on page 246.) You can drag a rectangle to zoom, change colors to light or dark, and use the SHIFT or CAPSLOCK key to show a magnifier view of the graph.
Timing example of single request
Flow 1 in the following example contains a single request to http://savvius.com.
To view this flow:
• Select http://www.savvius.com in the upper pane of the Web view window.
• An initial pair of orange SYN packets starts this flow, one below the packet timing graph from the client, and one above the packet timing graph from the server. These are flag-only packets, since they do not touch the grey horizontal packet timing graph.
• The SYN connection packets are immediately followed by a single blue request packet below the packet timing graph: the request to GET /. The server immediately responds with a yellow warning packet (yellow packets are HTTP 300-399 warning responses). The 302 indicates that the page was found, but at a different location. The browser is therefore being redirected to http://www.savvius.com.
Note If this were an HTTP 400+ error such as 404 Page not found, the packet and number would appear in red.
• The connection stays open, though idle, for about 15 seconds (1.5 times the length of the 10 seconds reference bar). A pair of FIN packets then close the TCP connection.
306 Web lower pane tabs
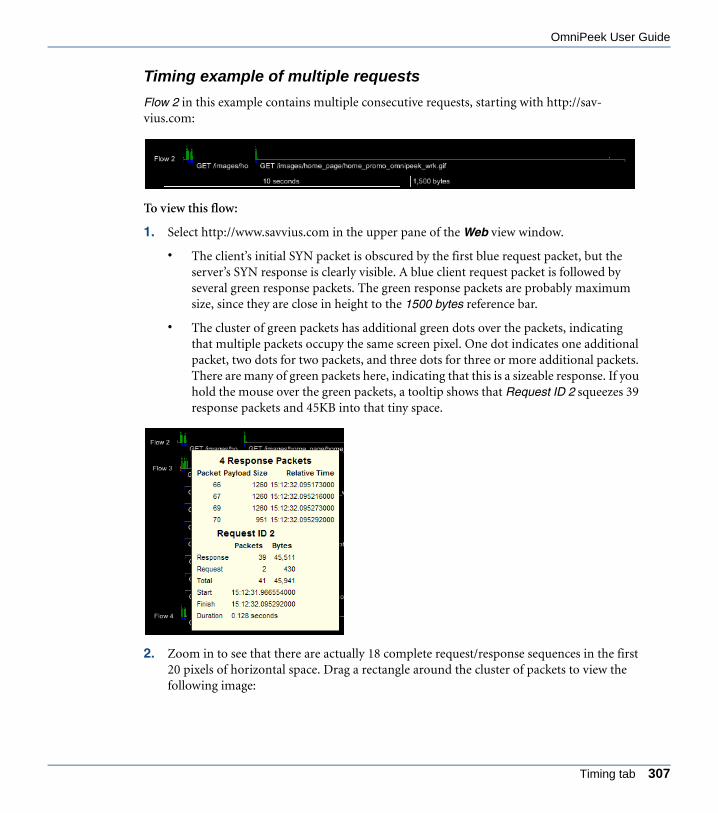
OmniPeek User Guide
ANYOP_UG.book Page 307 Friday, February 5, 2016 4:47 PM
Timing example of multiple requests
Flow 2 in this example contains multiple consecutive requests, starting with http://sav-vius.com:
To view this flow:
1. Select http://www.savvius.com in the upper pane of the Web view window.
• The client’s initial SYN packet is obscured by the first blue request packet, but the server’s SYN response is clearly visible. A blue client request packet is followed by several green response packets. The green response packets are probably maximum size, since they are close in height to the 1500 bytes reference bar.
• The cluster of green packets has additional green dots over the packets, indicating that multiple packets occupy the same screen pixel. One dot indicates one additional packet, two dots for two packets, and three dots for three or more additional packets. There are many of green packets here, indicating that this is a sizeable response. If you hold the mouse over the green packets, a tooltip shows that Request ID 2 squeezes 39 response packets and 45KB into that tiny space.
2. Zoom in to see that there are actually 18 complete request/response sequences in the first 20 pixels of horizontal space. Drag a rectangle around the cluster of packets to view the following image:
Timing tab 307

Chapter 10: Web Analysis
ANYOP_UG.book Page 308 Friday, February 5, 2016 4:47 PM
It is now possible to see the initial query and its many large response packets, then a series of six tiny requests, each with a short response that fits in a single packet. Eventually more queries fire, with different idle periods between them. You can also see that the time scale has changed, and that a 100 milliseconds reference bar shows that this entire sequence takes less than around 500 milliseconds.
Note All of these request/responses happen on a single horizontal packet timing graph. This implies that the browser never queues up the next request until the previous response completes.
Configuring web viewsYou can customize the display of columns in the Web views, select packets for further analysis using a variety of options, and save web statistics or payloads in several formats.
Web view columns
Right-click in the column headers to select the columns you wish to display. Use drag and drop in the upper pane of the Web views to change column order.
You can sort the contents of any column in ascending or descending order. Double-click the right edge of a column header to automatically resize the column area. Hold down the Shift key and double-click the right edge of any column header to automatically resize all of the col-umns.
For a complete list and description of the columns common to all the Web views of a capture window, see Web view columns on page 546.
Web packet selection
Right-click and choose Select Related Packets in Web views by one of the following eight options:
• By Client: This option selects all packets to or from the client IP address.
• By Server: This option selects all packets to or from the server IP address.
• By Client and Server: This option selects all packets between the client and server IP addresses.
308 Configuring web views

OmniPeek User Guide
ANYOP_UG.book Page 309 Friday, February 5, 2016 4:47 PM
• By Port: This option selects all packets between the client and server IP address and ports. (This option will usually produce the same results as selecting By Flow, unless a node pair reuses ports for multiple TCP connections.)
• By Flow: This option selects all packets in the flow identified in the Flow ID column.
• By Request: This option selects all client packets in the selected HTTP request.
• By Response: This option selects all server packets in the selected HTTP response.
• By Request and Response: This option selects all packets in the selected HTTP request and response.
Note Request, Response, and Request and Response packets also select TCP SYN packets for the first request on a flow, and FIN and RST packets for the last request on a flow. They do not select ACK-only packets.
For more information on how to select related packets, see Selecting related packets on page 192.
Web save functions
You can choose to save web statistics or web requests in the Web views of a capture window.
Save web statistics
To save web statistics:
1. Right-click the request file in the upper pane of the Web view window and select Save Web Statistics….
2. Save the statistics in one of the following formats:
• Text (view delimited) *.txt
• CSV (Comma delimited) *.csv
The content and arrangement of the saved files match the content of the pane being saved. You can hide or display optional columns or change column order to control the information that will be included in the saved file.
Save payload
You can save a single web request to the local disk.
Web save functions 309

Chapter 10: Web Analysis
ANYOP_UG.book Page 310 Friday, February 5, 2016 4:47 PM
To save a file:
1. Right-click the request file in the upper pane of the Web view window and select Save Payload(s) [filename].
2. Browse to the location where you want to save the file(s).
Filenames are automatically generated when multiple requests are selected and saved to the local disk.
Open payload in associated viewer
You can open a single request directly from the Web view of a capture window.
To open a file in the associated viewer:
• Right-click the request file in the upper pane of the Web view window and select Open Payload in Associated Viewer.
310 Configuring web views

C H A P T E R 11
ANYOP_UG.book Page 311 Friday, February 5, 2016 4:47 PM
Voice & Video Analysis
In this chapter:
About Voice & Video analysis. . . . . . . . . . . . . . . . . . . . . . . . . . . . . . . . . . . . . . 312
Voice & Video view window . . . . . . . . . . . . . . . . . . . . . . . . . . . . . . . . . . . . . . . 312
Voice & Video upper pane views . . . . . . . . . . . . . . . . . . . . . . . . . . . . . . . . . . . 314
Voice & Video lower pane tabs . . . . . . . . . . . . . . . . . . . . . . . . . . . . . . . . . . . . . 316
Calls and Media options . . . . . . . . . . . . . . . . . . . . . . . . . . . . . . . . . . . . . . . . . . 319
Configuring options in Voice & Video views . . . . . . . . . . . . . . . . . . . . . . . . . . . 328
Summary voice and video statistics . . . . . . . . . . . . . . . . . . . . . . . . . . . . . . . . . 329
311

Chapter 11: Voice & Video Analysis
ANYOP_UG.book Page 312 Friday, February 5, 2016 4:47 PM
About Voice & Video analysisIf you have purchased OmniPeek Enterprise, voice and video over IP signaling and media is available for capture analysis.
Voice over IP and Video over IP refer to protocol suites used to set up and maintain two way voice or video communications over the Internet. Voice and video protocol suites include those relating to SIP, SCCP, RTSP, H.323, Avaya, etc. The unit of communication is the call and an individual call may be carried in multiple channels, some dedicated to signaling and others to carrying the encoded voice data. The encoded data is referred to as media, and a call con-taining such data has media channels. Media channels contain RTP (Real-time Transport Pro-tocol) or RTCP (RTP Control Protocol) data. The conversion of voice data into digital form and back again is accomplished using a particular codec (coder/decoder), specified in the RTP header.
The Voice & Video views in capture windows provide simultaneous analysis of voice and video traffic with subjective and objective quality metrics. The Calls view displays one row for each call in a capture and the Media view displays one row for each RTP media flow in a call.
Note OmniPeek voice and video analysis derives its call quality metrics from industry-standard Telchemy technology.
Tip To do reliable analysis on VoIP calls, it is best to have the entire set of packets for the calls. For this reason, use filters to capture only VoIP traffic. See Making a voice or video filter on page 326.
The Voice & Video Visual Expert displays signal bounce diagrams of the signaling and RTP/RTCP packets of an entire call in a single window. See Voice & Video Visual Expert on page 320.
Voice & Video view window The Voice & Video views have two data areas. The upper pane contains voice and video data arranged by call or by the media streams within a call. See Voice & Video upper pane views on page 314.
The lower pane contains three tabs which present additional information for a row or rows selected in the upper pane, allowing you to view call details, a summary count of the expert events found in the capture, or a capture log of the individual VoIP expert events. See Voice & Video lower pane tabs on page 316.
The parts of the Voice & Video view window are identified below.
312 About Voice & Video analysis

OmniPeek User Guide
ANYOP_UG.book Page 313 Friday, February 5, 2016 4:47 PM
• Summary counts: This area displays the current calls, total calls, and media flows in the capture. Current Calls reflect the calls that are currently displayed within the Calls view. Total Calls reflect all calls that have ever been displayed in the Calls view.
• Refresh: You can immediately update the currently displayed Voice & Video view with the latest information. You can also choose a refresh interval from the drop-down list.
• Play Audio: Click to play the audio from a call or media flow that has a playback-supported codec. Play Audio is only available when a selected call or media flow has a playback-supported codec.
• Playback Options: Click to open the Media Playback Options dialog where you can adjust the jitter buffer settings. A jitter buffer temporarily stores arriving packets in order to minimize delay variations. If packets arrive too late then they are discarded. To make fine adjustments to the slider bar, click the slider bar and move to an approximate position, then use the arrow keys to get the exact value you want.
Lower pane tabs (Details tab)
Refresh
Upper pane views (Calls view)
Summary Counts Play AudioPlayback Options
EventFinder Settings
Voice & Video view window 313
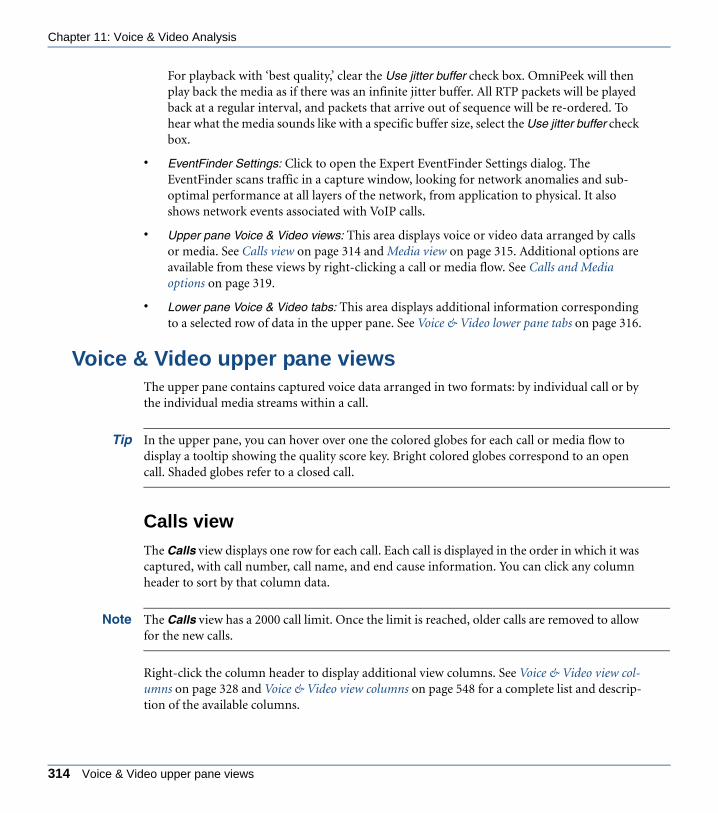
Chapter 11: Voice & Video Analysis
ANYOP_UG.book Page 314 Friday, February 5, 2016 4:47 PM
For playback with ‘best quality,’ clear the Use jitter buffer check box. OmniPeek will then play back the media as if there was an infinite jitter buffer. All RTP packets will be played back at a regular interval, and packets that arrive out of sequence will be re-ordered. To hear what the media sounds like with a specific buffer size, select the Use jitter buffer check box.
• EventFinder Settings: Click to open the Expert EventFinder Settings dialog. The EventFinder scans traffic in a capture window, looking for network anomalies and sub-optimal performance at all layers of the network, from application to physical. It also shows network events associated with VoIP calls.
• Upper pane Voice & Video views: This area displays voice or video data arranged by calls or media. See Calls view on page 314 and Media view on page 315. Additional options are available from these views by right-clicking a call or media flow. See Calls and Media options on page 319.
• Lower pane Voice & Video tabs: This area displays additional information corresponding to a selected row of data in the upper pane. See Voice & Video lower pane tabs on page 316.
Voice & Video upper pane viewsThe upper pane contains captured voice data arranged in two formats: by individual call or by the individual media streams within a call.
Tip In the upper pane, you can hover over one the colored globes for each call or media flow to display a tooltip showing the quality score key. Bright colored globes correspond to an open call. Shaded globes refer to a closed call.
Calls view
The Calls view displays one row for each call. Each call is displayed in the order in which it was captured, with call number, call name, and end cause information. You can click any column header to sort by that column data.
Note The Calls view has a 2000 call limit. Once the limit is reached, older calls are removed to allow for the new calls.
Right-click the column header to display additional view columns. See Voice & Video view col-umns on page 328 and Voice & Video view columns on page 548 for a complete list and descrip-tion of the available columns.
314 Voice & Video upper pane views

OmniPeek User Guide
ANYOP_UG.book Page 315 Friday, February 5, 2016 4:47 PM
To view a visual display of the call details, right-click a call and select Voice & Video Visual Expert (or double-click the call). See Voice & Video Visual Expert on page 320 for more infor-mation.
Media view
The Media view displays one row for each RTP media flow in a call. A voice call will usually have two media flows, one for each direction. Video calls will usually have four media flows: two voice and two video.
Media view 315
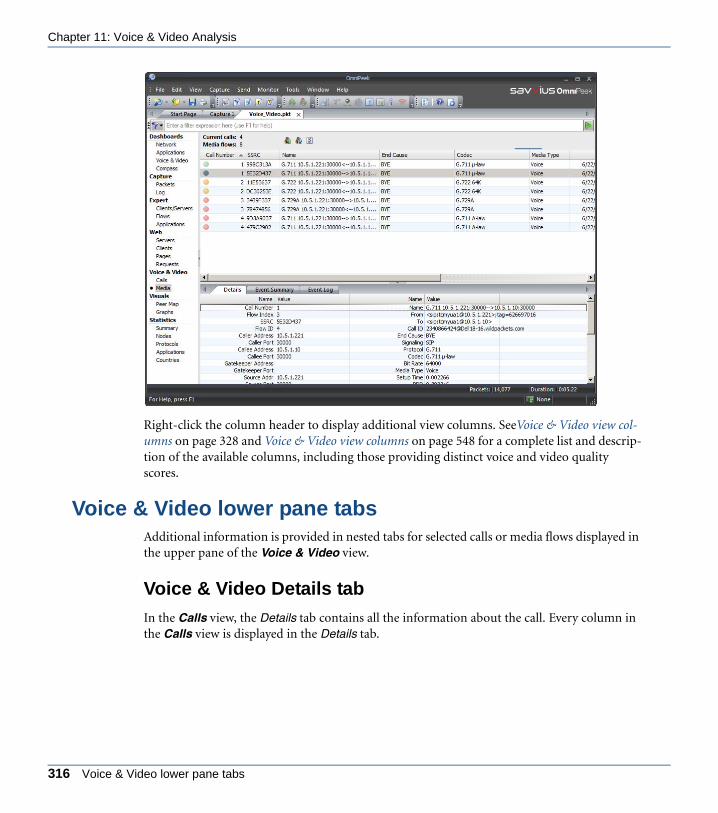
Chapter 11: Voice & Video Analysis
ANYOP_UG.book Page 316 Friday, February 5, 2016 4:47 PM
Right-click the column header to display additional view columns. SeeVoice & Video view col-umns on page 328 and Voice & Video view columns on page 548 for a complete list and descrip-tion of the available columns, including those providing distinct voice and video quality scores.
Voice & Video lower pane tabsAdditional information is provided in nested tabs for selected calls or media flows displayed in the upper pane of the Voice & Video view.
Voice & Video Details tab
In the Calls view, the Details tab contains all the information about the call. Every column in the Calls view is displayed in the Details tab.
316 Voice & Video lower pane tabs

OmniPeek User Guide
ANYOP_UG.book Page 317 Friday, February 5, 2016 4:47 PM
Note In the Media view, the Details tab displays details about the selected media flow and the call that contains it.
Voice & Video Event Summary tab
The Event Summary tab shows a count of each expert event for this capture. Severity levels configured in the EventFinder are displayed to the left of each voice and video expert event. Selecting an event in the Event Summary tab will also highlight the corresponding flow or call in the upper pane.
Note The Expert EventFinder contains many VoIP expert events, including those relating to H.225, MGCP, RTP, and SIP. For details, see Expert EventFinder on page 243.
Details tab
Voice & Video Event Summary tab 317

Chapter 11: Voice & Video Analysis
ANYOP_UG.book Page 318 Friday, February 5, 2016 4:47 PM
Voice & Video Event Log tab
The Event Log tab shows a list of all expert events found in this capture. The four toggle but-tons in the Event Log tab header let you show or hide events by levels of severity. See Expert EventFinder on page 243 for instructions on how to configure levels of severity for voice and video expert events.
Event Summary tab
318 Voice & Video lower pane tabs
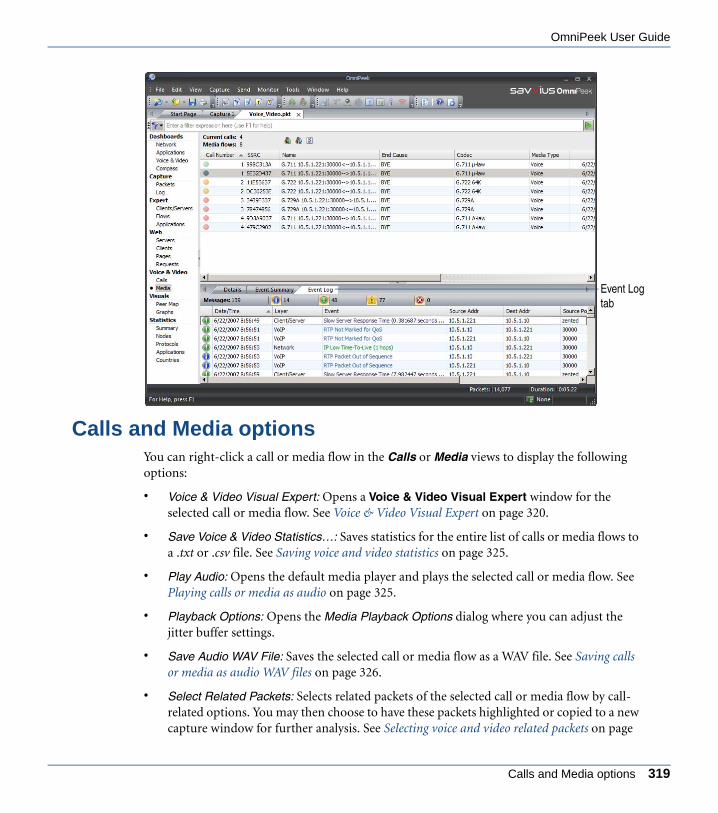
OmniPeek User Guide
ANYOP_UG.book Page 319 Friday, February 5, 2016 4:47 PM
Calls and Media optionsYou can right-click a call or media flow in the Calls or Media views to display the following options:
• Voice & Video Visual Expert: Opens a Voice & Video Visual Expert window for the selected call or media flow. See Voice & Video Visual Expert on page 320.
• Save Voice & Video Statistics…: Saves statistics for the entire list of calls or media flows to a .txt or .csv file. See Saving voice and video statistics on page 325.
• Play Audio: Opens the default media player and plays the selected call or media flow. See Playing calls or media as audio on page 325.
• Playback Options: Opens the Media Playback Options dialog where you can adjust the jitter buffer settings.
• Save Audio WAV File: Saves the selected call or media flow as a WAV file. See Saving calls or media as audio WAV files on page 326.
• Select Related Packets: Selects related packets of the selected call or media flow by call-related options. You may then choose to have these packets highlighted or copied to a new capture window for further analysis. See Selecting voice and video related packets on page
Event Logtab
Calls and Media options 319

Chapter 11: Voice & Video Analysis
ANYOP_UG.book Page 320 Friday, February 5, 2016 4:47 PM
326.
• Select Related Call (Media view only): Selects related calls of the selected media flow.
• Select Related Media (Calls view only): Selects related media of the selected call.
• Make Filter: Makes a filter based on the selected call or media flow. See Making a voice or video filter on page 326.
• Insert Into Name Table: Opens a dialog to add the selected call or media flow into the Name Table. See Adding entries to the name table on page 434.
• Resolve Names: Checks the DNS server for a name to match the supplied address. See OmniPeek name resolution on page 438.
• Show All Calls (Calls view only): Displays all calls in the Calls view.
• Show Open Calls (Calls view only): Displays only the open calls in the Calls view. An open call is a call that is in progress.
• Show Closed Calls (Calls view only): Displays only the closed calls in the Calls view. A closed call is a call that is no longer in progress.
• Show All Media Flows (Media view only): Displays all media flows in the Media view.
• Show Open Media Flows (Media view only): Displays only the media flows associated with open calls.
• Show Closed Media Flows (Media view only): Displays only the media flows associated with closed calls.
Voice & Video Visual Expert
The Voice & Video Visual Expert displays each individual packet of an entire call within a single window, as well as the RTP packet timing, jitter, and quality score over time. If there are gaps of missing or late RTP packets, these gaps are also displayed, along with their effect on call quality.
The Signaling tab of the Voice & Video Visual Expert window displays a diagram with col-umns corresponding to each node participating in the call. Signaling and media stream pack-ets are represented by horizontal lines, giving you an immediate overview of the contents of a call. The bounce diagram also includes linear representations as well as numerical measure-ments of R-Factor (alternative method of assessing call quality) and jitter values.
In addition to displaying many of the same columns available in the Calls and Media views, the Voice & Video Visual Expert contains columns that allow you to calculate the relative time lapse between individual packets, the signaling sequence method of the call, and more (see Voice & Video Visual Expert columns on page 552).
320 Calls and Media options
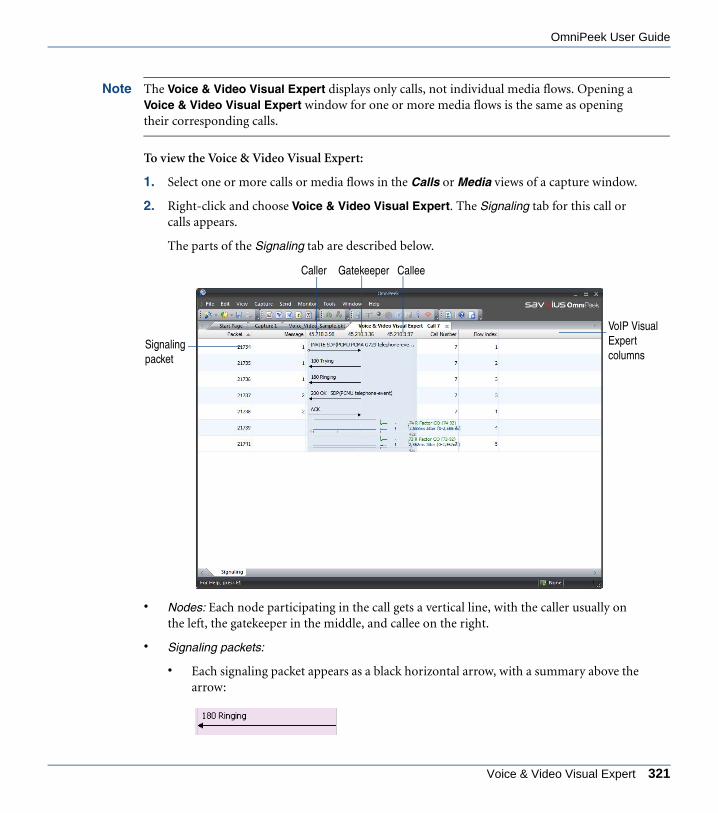
OmniPeek User Guide
ANYOP_UG.book Page 321 Friday, February 5, 2016 4:47 PM
Note The Voice & Video Visual Expert displays only calls, not individual media flows. Opening a Voice & Video Visual Expert window for one or more media flows is the same as opening their corresponding calls.
To view the Voice & Video Visual Expert:
1. Select one or more calls or media flows in the Calls or Media views of a capture window.
2. Right-click and choose Voice & Video Visual Expert. The Signaling tab for this call or calls appears.
The parts of the Signaling tab are described below.
• Nodes: Each node participating in the call gets a vertical line, with the caller usually on the left, the gatekeeper in the middle, and callee on the right.
• Signaling packets:
• Each signaling packet appears as a black horizontal arrow, with a summary above the arrow:
CalleeCaller
Signaling packet
VoIP Visual Expert columns
Gatekeeper
Voice & Video Visual Expert 321
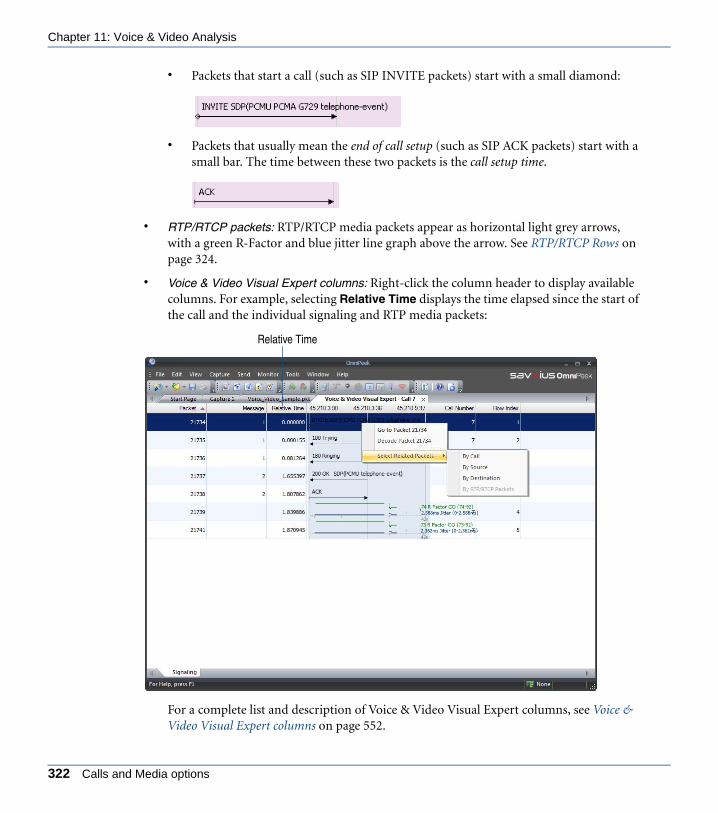
Chapter 11: Voice & Video Analysis
ANYOP_UG.book Page 322 Friday, February 5, 2016 4:47 PM
• Packets that start a call (such as SIP INVITE packets) start with a small diamond:
• Packets that usually mean the end of call setup (such as SIP ACK packets) start with a small bar. The time between these two packets is the call setup time.
• RTP/RTCP packets: RTP/RTCP media packets appear as horizontal light grey arrows, with a green R-Factor and blue jitter line graph above the arrow. See RTP/RTCP Rows on page 324.
• Voice & Video Visual Expert columns: Right-click the column header to display available columns. For example, selecting Relative Time displays the time elapsed since the start of the call and the individual signaling and RTP media packets:
For a complete list and description of Voice & Video Visual Expert columns, see Voice & Video Visual Expert columns on page 552.
Relative Time
322 Calls and Media options

OmniPeek User Guide
ANYOP_UG.book Page 323 Friday, February 5, 2016 4:47 PM
• Right-click options:
• Go To Packet: Show a selected packet in the Packets view and bring Packets view to front.
• Decode Packet: Open a decode window for the selected packet.
• Select Related Packets:
• By Call: All signaling, media, and media control packets for the selected call
• By Source: All packets to or from the source IP address.
• By Destination: All packets to or from the destination IP address.
• By RTP/RTCP Packets: All packets in the RTP/RTCP row.
See Selecting related packets on page 192 for more information about using this feature.
• Call background color: Each call gets its own background color in the bounce diagram, making it possible to follow several simultaneous calls within a single window:
Voice & Video Visual Expert 323

Chapter 11: Voice & Video Analysis
ANYOP_UG.book Page 324 Friday, February 5, 2016 4:47 PM
RTP/RTCP Rows
The media or voice streams (RTP/RTCP packets) within a call display in the Signaling tab as rows progressing through time, with the first packet in the row at the left to the last packet at the right. Since most calls are bidirectional, a pair of rows often appears with one row for each direction.
The parts of the RTP/RTCP media packets in a bidirectional call are identified below.
• Grey arrows and numbers: Grey horizontal arrows represent the RTP/RTCP media packets. The last packet in the row displays a small grey number showing the entire duration for the row. (Trivial durations are not shown for very brief rows.)
• Green lines and numbers: Green horizontal lines show R-Factor conversational values, with the row’s final value and minimum-maximum range in green to the right of the last packet in the row.
• Blue lines and numbers: Blue lines show jitter values, with the row’s final value and minimum-maximum range in blue to the right of the last packet in the row.
• Blue tick marks: Blue tick marks represent RTCP packets.
• Grey tick marks: Grey tick marks represent out-of-sequence RTP packets.
• Red tick mark: Red tick marks show gaps of one or more missing packets.
Note Gaps where no packets appear are readily visible, as well as their immediate effects of lowering R-Factor and raising jitter values.
As you widen the bounce diagram column, the Voice & Video Visual Expert can break an RTP line into its individual packets, as shown below:
324 Calls and Media options
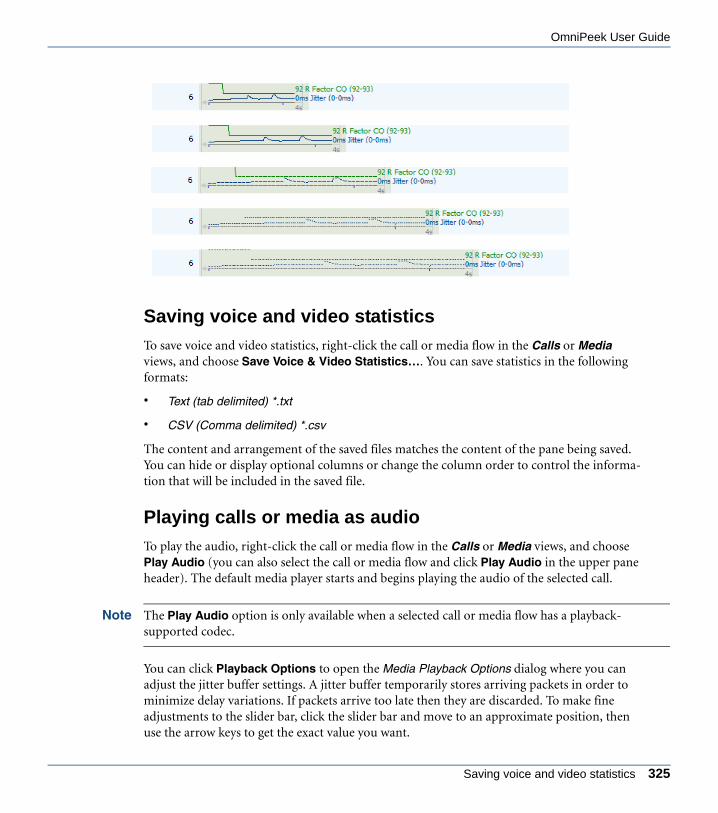
OmniPeek User Guide
ANYOP_UG.book Page 325 Friday, February 5, 2016 4:47 PM
Saving voice and video statistics
To save voice and video statistics, right-click the call or media flow in the Calls or Media views, and choose Save Voice & Video Statistics…. You can save statistics in the following formats:
• Text (tab delimited) *.txt
• CSV (Comma delimited) *.csv
The content and arrangement of the saved files matches the content of the pane being saved. You can hide or display optional columns or change the column order to control the informa-tion that will be included in the saved file.
Playing calls or media as audio
To play the audio, right-click the call or media flow in the Calls or Media views, and choose Play Audio (you can also select the call or media flow and click Play Audio in the upper pane header). The default media player starts and begins playing the audio of the selected call.
Note The Play Audio option is only available when a selected call or media flow has a playback-supported codec.
You can click Playback Options to open the Media Playback Options dialog where you can adjust the jitter buffer settings. A jitter buffer temporarily stores arriving packets in order to minimize delay variations. If packets arrive too late then they are discarded. To make fine adjustments to the slider bar, click the slider bar and move to an approximate position, then use the arrow keys to get the exact value you want.
Saving voice and video statistics 325

Chapter 11: Voice & Video Analysis
ANYOP_UG.book Page 326 Friday, February 5, 2016 4:47 PM
For playback with ‘best quality,’ clear the Use jitter buffer check box. OmniPeek will then play back the media as if there was an infinite jitter buffer. All RTP packets will be played back at a regular interval, and packets that arrive out of sequence will be re-ordered. To hear what the media sounds like with a specific buffer size, select the Use jitter buffer check box.
Saving calls or media as audio WAV files
To save as an audio WAV file, right-click the call or media flow in the Calls or Media views, and choose Save Audio WAV File.
Note The Save Audio WAV File option is only available when a selected call or media flow has a playback-supported codec.
Selecting voice and video related packets
To select related packets, right-click the call or media flow in the Calls or Media views, and choose Select Related Packets. You can select packets using one of the following options:
• By Call: All packets in this call. Includes all signaling, media, and media control packets.
• By Caller: All packets to or from the caller’s IP address
• By Callee: All packets to or from the callee’s IP address
• By Port: All packets between the client and server IP address and ports (usually the same as Flow, but not always if a node pair reuses ports for multiple TCP or UDP connections)
• By Flow ID: All packets in the flow identified in the Flow ID column
• By Media Flow: All packets in the media flow
For more information on how to select related packets, see Selecting related packets on page 192.
Making a voice or video filter
Filters are easy to create for calls and media flows.
For calls, you can create an address filter between caller and callee, caller and gateway, and gateway and callee. If these are three separate nodes, an advanced filter with three bidirectional address filters will be created, as shown in the example below.
To make a filter for a selected call:
1. Select a call in the Calls view of a capture window.
326 Calls and Media options
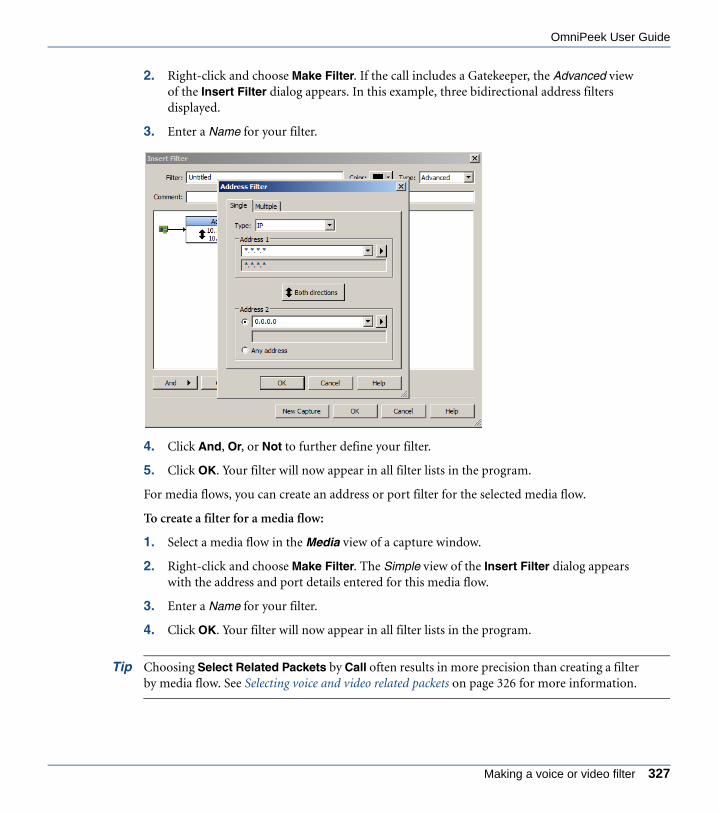
OmniPeek User Guide
ANYOP_UG.book Page 327 Friday, February 5, 2016 4:47 PM
2. Right-click and choose Make Filter. If the call includes a Gatekeeper, the Advanced view of the Insert Filter dialog appears. In this example, three bidirectional address filters displayed.
3. Enter a Name for your filter.
4. Click And, Or, or Not to further define your filter.
5. Click OK. Your filter will now appear in all filter lists in the program.
For media flows, you can create an address or port filter for the selected media flow.
To create a filter for a media flow:
1. Select a media flow in the Media view of a capture window.
2. Right-click and choose Make Filter. The Simple view of the Insert Filter dialog appears with the address and port details entered for this media flow.
3. Enter a Name for your filter.
4. Click OK. Your filter will now appear in all filter lists in the program.
Tip Choosing Select Related Packets by Call often results in more precision than creating a filter by media flow. See Selecting voice and video related packets on page 326 for more information.
Making a voice or video filter 327
Chapter 11: Voice & Video Analysis
ANYOP_UG.book Page 328 Friday, February 5, 2016 4:47 PM
Configuring options in Voice & Video viewsYou can customize the display of columns in the Voice & Video views, select packets for fur-ther analysis using a variety of options, and save voice and video statistics in several formats.
Voice & Video view columns
To change the display of columns in the Calls, Media, and Voice & Video Visual Expert views:
• Right-click in the column headers to select the columns you wish to display. You can also select Show All Columns to have all columns appear in the Voice & Video view.
• Use drag and drop in the upper pane of the Voice & Video views to change column order.
• Sort the contents of any column in ascending or descending order.
• Double-click the right edge of a column header to automatically resize the column area.
• Hold down the Shift key and double-click the right edge of any column header to automatically resize all of the columns.
• Right-click in the column headers and select Columns…. The Columns dialog appears. Check the columns you wish to display in the Voice & Video views and click OK.
Tip Right-click to Check All or Uncheck All columns in the Columns dialog.
For a complete list and description of the columns common to the Voice & Video views of a capture window, see Voice & Video view columns on page 548. For additional columns available only in the Voice & Video Visual Expert, see Voice & Video Visual Expert columns on page 552.
Note Some calls lack values for all columns. This is especially true for calls where the RTP media flows are detected, but the signaling protocol associated with the call is not detected or not supported in the Voice & Video views.
Setting VoIP options
You can select a geographical region and VoIP emulation model to use when calculating VoIP quality scores.
To select a geographical region for Voice & Video views:
1. On the Tools menu, click Options. The Options dialog appears.
328 Configuring options in Voice & Video views

OmniPeek User Guide
ANYOP_UG.book Page 329 Friday, February 5, 2016 4:47 PM
2. Select the VoIP options.
3. Select a geographical region from the drop-down list and click OK.
4. Restart OmniPeek to enable the new geographical region setting.
Summary voice and video statisticsSummary voice and video statistics are displayed in the Summary view of capture windows and saved capture files. A Voice & Video summary statistics group displays values collected and aggregated across all calls within the capture or file.
Note If you want statistics for just one call, you must filter the data accordingly.
To view summary Voice & Video statistics:
1. Select the Summary view in a capture window.
2. Scroll to Voice & Video to see summary voice and video statistics for this capture.
Summary voice and video statistics 329

Chapter 11: Voice & Video Analysis
ANYOP_UG.book Page 330 Friday, February 5, 2016 4:47 PM
The following table describes each voice and video statistic displayed in the Summary view:
Voice and Video Statistic
Description
Total Calls All calls for the capture. Includes opened and closed calls, as well as recycled calls.
Current Calls Calls currently displayed in the Calls view. Calls (Current) = Calls (Total) – Calls (Recycled).
Open Calls Open calls currently displayed in the Calls view.
Closed Calls Closed calls currently displayed in the Calls view.
Recycled Calls Calls that are no longer in the Calls view. The call limit is 2000. After 2000 calls, calls are recycled. Calls (Recycled) = Calls (Total) – Calls (Current).
Max Calls Time Max Calls Time references the point in time when OmniPeek’s maximum call limit was reached. Once the maximum call limit has been reached, closed calls (and their respective media flows) drop out of the Calls/Media views as new calls come in.
Total Packet Loss %
Expected but never received packets as a percentage of expected packets (expected - captured) / (expected). Calculated using all media flows (sup-ported codecs only) for all closed calls.
Voice Score Elements
Total number of voice media flows (supported codecs only) for all closed calls.
Voice Packet Loss %
Expected but never received packets as a percentage of expected packets (expected - captured) / (expected). Calculated using all voice score elements.
MOS-LQ MOS score calculated under the assumption that this is a one-way “listen only” media flow.
MOS-CQ MOS score calculated under the assumption that this is an interactive “conver-sation” media flow.
MOS-PQ MOS score calculated using a model that permits apples-to-apples compari-sons with other MOS-PQ measurements.
R Factor Lis-tening
R-Factor calculated under the assumption that this is a one-way “listen only” media flow.
R Factor Con-versational
R-Factor calculated under the assumption that this is an interactive “conversa-tion” media flow.
330 Summary voice and video statistics

OmniPeek User Guide
ANYOP_UG.book Page 331 Friday, February 5, 2016 4:47 PM
R Factor G.107 R-Factor calculated using an ITU G.107 model that permits apples-to-apples comparisons with other G.107 measurements.
Audio Score Elements
Total number of audio media flows (supported codecs only) for all closed calls.
Audio Packet Loss %
Expected but never received packets as a percentage of expected packets (expected - captured) / (expected). Calculated using all audio score elements.
VS-AQ Video Service Audio Quality expressed as a score in the range of 0 to 50. This is an audio codec dependent measure related to the subjective quality of the decoded audio stream.
MOS-A(MOS-Audio)
The video service audio quality expressed as a score in the range 1.0 to 5.0. This is an audio codec dependant measure related to the subjective quality of the decoded audio stream(s).
Video Score Elements
Total number of video media flows (supported codecs only) for all closed calls.
Video Packet Loss %
Expected but never received packets as a percentage of expected packets (expected - captured) / (expected). Calculated using all video score elements.
VS-PQ Video Service Picture Quality expressed in the range 0 to 50. This is a codec dependent measure of the subjective quality of the decoded video stream.
VS-MQ Video Service Multimedia Quality expressed as a score in range 0 to 50. This is a composite audio/video measure related to the overall subjective user experience and considers picture quality, audio quality and audio/video syn-chronization.
VS-TQ Video Service Transmission Quality expressed as a score in the range 0 to 50. This is a codec independent measure related to the ability of the bearer chan-nel to support reliable video.
MOS-AV(MOS-Audio Video)
The multimedia quality expressed as a score in the range 1.0 to 5.0. This is a composite audio/video measure that is related to the overall subjective user experience and considers picture quality, audio quality and audio/video syn-chronization.
MOS-V(MOS-Video)
The absolute picture quality expressed as a score in the range 1.0 to 5.0. This is a codec dependant measure that is related to the subjective quality of the decoded video stream and considers the effects of codec, loss, bit rate/quanti-zation level, image resolution and frame loss concealment.
Voice and Video Statistic
Description
Summary voice and video statistics 331

Chapter 11: Voice & Video Analysis
ANYOP_UG.book Page 332 Friday, February 5, 2016 4:47 PM
For more information on voice and video statistics in the Summary view of capture windows, see Summary statistics on page 349.
332 Summary voice and video statistics
C H A P T E R 12
ANYOP_UG.book Page 333 Friday, February 5, 2016 4:47 PM
Displaying and Reporting Statistics
In this chapter:
About statistics . . . . . . . . . . . . . . . . . . . . . . . . . . . . . . . . . . . . . . . . . . . . . . . . . 334
Monitoring network statistics. . . . . . . . . . . . . . . . . . . . . . . . . . . . . . . . . . . . . . . 334
Viewing capture window statistics . . . . . . . . . . . . . . . . . . . . . . . . . . . . . . . . . . 337
Configuring statistics displays. . . . . . . . . . . . . . . . . . . . . . . . . . . . . . . . . . . . . . 338
Saving statistics output . . . . . . . . . . . . . . . . . . . . . . . . . . . . . . . . . . . . . . . . . . . 338
Nodes statistics . . . . . . . . . . . . . . . . . . . . . . . . . . . . . . . . . . . . . . . . . . . . . . . . 339
Protocols statistics . . . . . . . . . . . . . . . . . . . . . . . . . . . . . . . . . . . . . . . . . . . . . . 342
Network statistics . . . . . . . . . . . . . . . . . . . . . . . . . . . . . . . . . . . . . . . . . . . . . . . 346
Size statistics . . . . . . . . . . . . . . . . . . . . . . . . . . . . . . . . . . . . . . . . . . . . . . . . . . 348
Summary statistics . . . . . . . . . . . . . . . . . . . . . . . . . . . . . . . . . . . . . . . . . . . . . . 349
History statistics . . . . . . . . . . . . . . . . . . . . . . . . . . . . . . . . . . . . . . . . . . . . . . . . 351
Channel statistics . . . . . . . . . . . . . . . . . . . . . . . . . . . . . . . . . . . . . . . . . . . . . . . 353
WLAN statistics . . . . . . . . . . . . . . . . . . . . . . . . . . . . . . . . . . . . . . . . . . . . . . . . 355
Signal statistics . . . . . . . . . . . . . . . . . . . . . . . . . . . . . . . . . . . . . . . . . . . . . . . . . 358
Applications statistics . . . . . . . . . . . . . . . . . . . . . . . . . . . . . . . . . . . . . . . . . . . . 360
Countries statistics . . . . . . . . . . . . . . . . . . . . . . . . . . . . . . . . . . . . . . . . . . . . . . 362
Generating statistics output reports . . . . . . . . . . . . . . . . . . . . . . . . . . . . . . . . . 363
Viewing statistics output reports . . . . . . . . . . . . . . . . . . . . . . . . . . . . . . . . . . . . 366
333

Chapter 12: Displaying and Reporting Statistics
ANYOP_UG.book Page 334 Friday, February 5, 2016 4:47 PM
About statisticsA variety of key statistics can be calculated in real time and presented in intuitive graphical dis-plays. Monitor statistics are available from the Monitor menu that provide data about the overall health of your network and can also be used to isolate potential problems and describe trends before they impact the end-user community. Additionally, statistics are available from each capture window that allow you to monitor just the packets captured into the buffer of that particular capture window.
Tip You can save, copy, print, or automatically generate periodic reports on these statistics in a variety of formats. See Saving statistics output on page 338.
Monitoring network statisticsThe monitor statistics available from the Monitor menu allow you to monitor the overall health of your network. Monitor statistics continuously accumulate data while the program is running and are not affected by any sort of filters configured for individual capture windows.
Note For a Capture Engine, you can use a Monitoring Capture template that lets you create a capture window optimized for providing statistics, based on traffic seen on the adapter selected for that remote capture. For details, see Monitoring capture on a Capture Engine on page 69.
To view monitor statistics:
1. Make sure a supported adapter is selected as the monitor adapter. See Configuring monitor options on page 335.
2. Make sure Monitor Statistics is enabled in the Monitor menu.
3. Choose the monitor statistic to view from the Monitor menu:
• Nodes: Nodes statistics display real-time data organized by network node. See Nodes statistics on page 339.
• Protocols: Protocols statistics show network traffic volume, in packets and in bytes, broken down by protocol and subprotocol. See Protocols statistics on page 342.
• Network: Network statistics show network utilization, traffic volume, and error rate as analog dials and as data in tables. See Network statistics on page 346.
• Size: Size statistics displays a Packet Size Distribution graph that shows the percentage of packets grouped by packet size. See Size statistics on page 348.
334 About statistics

OmniPeek User Guide
ANYOP_UG.book Page 335 Friday, February 5, 2016 4:47 PM
• Summary: Summary statistics allows you to monitor key network statistics in real time and save those statistics for later comparison. See Summary statistics on page 349.
• History: History statistics displays a graph of network performance at selected intervals over time. See History statistics on page 351.
• Channel: When a supported wireless adapter is selected as the monitor adapter, Channel statistics show a variety of statistics and counts for each channel of the WLAN band. See Channel statistics on page 353.
• WLAN: When a supported wireless adapter is selected as the monitor adapter, WLAN statistics displays an SSID (Service Set Identifier) tree view of wireless nodes. See WLAN statistics on page 355.
Note You can display all of the monitor statistics windows at the same time; however, if they are all displaying information in real time during capture and the network is busy, the program might not have enough time to process captured packets. This can cause statistics to lag behind actual network activity or cause packets to be dropped.
For information about customizing the display of Monitor statistics windows, see Configuring statistics displays on page 338.
Configuring monitor options
The Monitor Options dialog allows you to select and configure the monitor adapter, set up how statistics output is generated, and optimize performance by enabling or disabling specific program functions.
To configure monitor options:
1. On the Monitor menu, click Monitor Options…. The Monitor Options dialog opens to the Adapter options.
Configuring monitor options 335
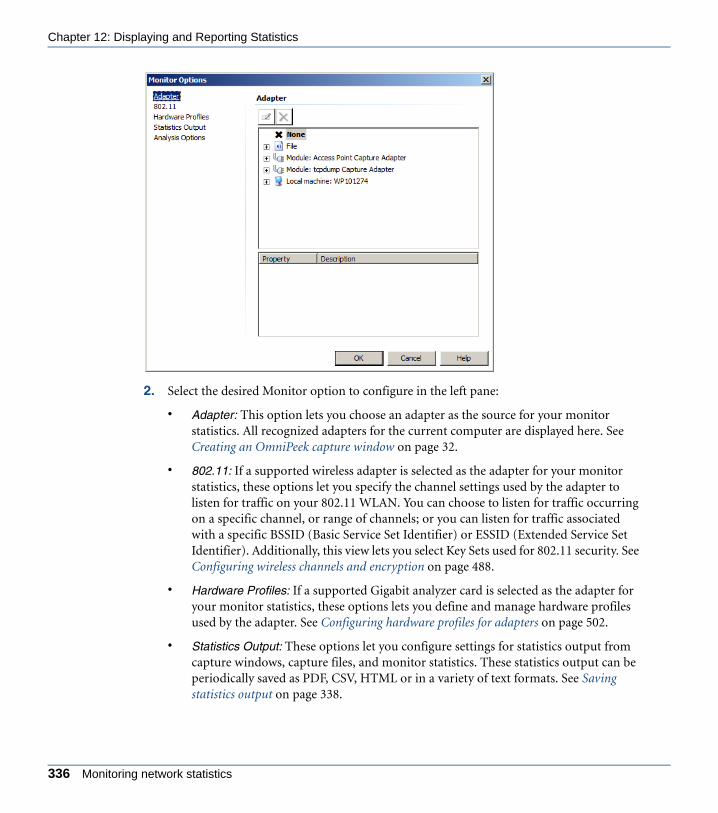
Chapter 12: Displaying and Reporting Statistics
ANYOP_UG.book Page 336 Friday, February 5, 2016 4:47 PM
2. Select the desired Monitor option to configure in the left pane:
• Adapter: This option lets you choose an adapter as the source for your monitor statistics. All recognized adapters for the current computer are displayed here. See Creating an OmniPeek capture window on page 32.
• 802.11: If a supported wireless adapter is selected as the adapter for your monitor statistics, these options let you specify the channel settings used by the adapter to listen for traffic on your 802.11 WLAN. You can choose to listen for traffic occurring on a specific channel, or range of channels; or you can listen for traffic associated with a specific BSSID (Basic Service Set Identifier) or ESSID (Extended Service Set Identifier). Additionally, this view lets you select Key Sets used for 802.11 security. See Configuring wireless channels and encryption on page 488.
• Hardware Profiles: If a supported Gigabit analyzer card is selected as the adapter for your monitor statistics, these options lets you define and manage hardware profiles used by the adapter. See Configuring hardware profiles for adapters on page 502.
• Statistics Output: These options let you configure settings for statistics output from capture windows, capture files, and monitor statistics. These statistics output can be periodically saved as PDF, CSV, HTML or in a variety of text formats. See Saving statistics output on page 338.
336 Monitoring network statistics

OmniPeek User Guide
ANYOP_UG.book Page 337 Friday, February 5, 2016 4:47 PM
• Analysis Options: These options let you enable or disable individual program functions for the selected adapter. Disabling program functions will free up system resources resulting in faster performance. See Optimizing capture performance on page 483.
3. Click OK to accept your changes.
Viewing capture window statisticsUnlike monitor statistics, which are based on all of the packets continuously going across the network, capture window statistics are based on the actual packets accepted into the buffer of that particular capture window since the capture began, even if some of the packets may have been dumped, overwritten, or saved to a separate file (depending on the options you set in the General view of the Capture Options dialog).
Note For a Capture Engine, you can use a Monitoring Capture template that lets you create a capture optimized for providing statistics, based on traffic seen on the adapter selected for that remote capture. For details, see Monitoring capture on a Capture Engine on page 69.
To view capture window statistics:
1. Start a capture to open a capture window. See Chapter 3, The Capture Window.
2. From the navigation pane of a capture window, choose the statistic to view:
• Summary: Summary statistics allows you to monitor key network statistics in real time and save those statistics for later comparison. See Summary statistics on page 349.
• Nodes: Node statistics display real-time data organized by network node. See Nodes statistics on page 339.
• Protocols: Protocols statistics show network traffic volume, in packets and in bytes, broken down by protocol and subprotocol. See Protocols statistics on page 342.
• Applications: Applications statistics show basic statistics on applications for the entire capture/file duration, in packets and in bytes. See Applications statistics on page 360.
• WLAN: When a supported wireless adapter is selected as the monitor adapter, WLAN statistics displays an SSID (Service Set Identifier) tree view of wireless nodes. See WLAN statistics on page 355.
• Channels: When a supported wireless adapter is selected as the monitor adapter, Channel statistics show a variety of statistics and counts for each channel of the WLAN band. See Channel statistics on page 353.
Viewing capture window statistics 337

Chapter 12: Displaying and Reporting Statistics
ANYOP_UG.book Page 338 Friday, February 5, 2016 4:47 PM
• Signal: When a supported wireless adapter is selected as the monitor adapter, Signal statistics displays continuously updated graphs of wireless traffic signal strength. Signal statistics on page 358.
Note WLAN, Channels, and Signal statistics are available only when a supported wireless adapter is selected as the monitor adapter in OmniPeek.
Configuring statistics displaysVarious options are available to customize how text and color appear in the different statistics views. Configuring these options allow you to more easily visualize and recognize the data being reported.
View options for statistics
To customize the display of statistics views, on the Tools menu, click Options to open the Options dialog, and then configure the following options:
• List Views: Let you customize background color and the style of vertical and horizontal lines in all list displays.
• Fonts: Specifies the font and style of the data text in all views of the program.
Controlling color in statistics lists
The Color submenu of the View menu uses the color information from the following sources and applies it to the display of nodes and protocols in statistics lists:
• The Insert or Edit Name dialog in the Name Table can set the color for packets associated with a particular address (node), port, or protocol.
• ProtoSpecs assigns colors to all the protocols it knows how to identify. (See ProtoSpecs™ on page 344.)
For more about how colors are assigned to packet lists and statistics displays, see Configuring color options on page 482.
Saving statistics outputMonitor statistics or capture window statistics can be saved to text files, generated as reports at periodic intervals, or printed out.
338 Configuring statistics displays
OmniPeek User Guide
ANYOP_UG.book Page 339 Friday, February 5, 2016 4:47 PM
Saving statistics
To save a statistics window as a text file:
1. Make the desired statistics window the active window, and do any of the following:
• Right-click the statistics window and choose Save X Statistics…, where X is the name of the statistics window.
• On the File menu, click Save X Statistics…, where X is the name of the statistics window.
2. Save the file as a tab delimited (*.txt) or comma delimited (*.csv) text file.
Generating statistics reports
Statistics reports can be generated and saved at periodic intervals by using the Statistics Out-put view of the Capture Options dialog. You can save these statistics reports as PDF, CSV, or HTML files that can be viewed with a browser, or as text files that you can import into a spreadsheet or database program for further processing. In addition, you can save these statis-tics reports as a PDF file. See Generating statistics output reports on page 363.
Printing statistics
You can print any statistics window or details windows except the Network Statistics window.
To print a monitor statistics window or capture window statistics view:
1. Make the desired statistics window the active window.
2. On the File menu, click Print.
Nodes statisticsNodes statistics display real-time data organized by network node. You can view nodes statis-tics in a hierarchy view or in a variety of flat views. Nodes statistics are available for the entire network and for a capture window.
To view nodes statistics for the entire network, do one of the following:
• On the Monitor menu, click Nodes
• Click Node Statistics in the main program window toolbar
To view nodes statistics for a capture window:
• Select Nodes in the navigation pane of a capture window.
Saving statistics 339

Chapter 12: Displaying and Reporting Statistics
ANYOP_UG.book Page 340 Friday, February 5, 2016 4:47 PM
The parts of the Nodes Statistics window are described below.
• Nodes: Shows total count of nodes seen.
• View Type: Choose a Hierarchy, or flat type (Physical, IP, IPv6, AppleTalk, DECnet, IPX) of display.
• Refresh: Sets display refresh interval. If interval is set to Manual, display will update only when Refresh is clicked.
• Display Top: Limits display to top 5, 10, 20, 50, or 100 nodes seen, as measured by traffic volume.
• Display Sent/Received/Both: Limits display to packets Sent, Received, or both.
• Node Details: Opens Detail Statistics window. See Viewing details for a network node on page 341.
NodesView Type
Refresh
Display TopSent, Received, Both
Make Filter
Insert Into Name Table
Resolve Names
Make AlarmGraph
Node Details
340 Nodes statistics

OmniPeek User Guide
ANYOP_UG.book Page 341 Friday, February 5, 2016 4:47 PM
• Make Filter: Opens Insert Filter dialog. See Creating filters with the Make Filter command on page 172.
• Insert Into Name Table: Opens Node Address dialog. See Adding entries to the name table on page 434.
• Resolve Names: Click to resolve name, if one exists in the Name Table for this address.
• Graph: Opens the Graph Data Options dialog. See Graph display options on page 401.
• Make Alarm: Opens the Make Alarm dialog. See Creating and editing alarms on page 413.
Hierarchy view of nodes
To view Node statistics in a hierarchy view, choose the Hierarchy display type in the header of the Node statistics window. The Hierarchy view lists network nodes or devices by their physical address, the associated logical addresses communicating with them, and the statistics associ-ated with those nodes.
See Nodes statistics columns on page 553 for a complete list and description of the column headings found in the Hierarchy view of Network statistics.
Flat views of nodes
To view Node statistics in a variety of flat views, choose the Physical, IP, IPv6, AppleTalk, DEC-net, or IPX display type in the header of the Node statistics window. These flat views list the nodes of the selected type and the statistics associated with those nodes.
See Nodes statistics columns on page 553 for a complete list and description of the column headings found in the flat views of the Network statistics.
Viewing details for a network node
Double-click a node to see more detail about the activity for the selected node and the proto-cols it is using (or right-click the node and choose Node Details).
Hierarchy view of nodes 341

Chapter 12: Displaying and Reporting Statistics
ANYOP_UG.book Page 342 Friday, February 5, 2016 4:47 PM
The additional detail includes:
• Details of communications partners for this node.
• A hierarchical list of protocols used by this node and its communications partners. For details on display conventions, see Protocol utilization statistics on page 344.
• The Total packets and Total bytes for this node.
• Network Load (kbits/s) attributed to this node.
• Largest packet, Smallest packet and Average packet size for the specific node or protocol.
Protocols statisticsProtocols statistics show network traffic volume in packets and in bytes, broken down by pro-tocol and subprotocol. You can view Protocol statistics in a hierarchical or flat view. Protocol statistics are available for the entire network and for a capture window.
To view Protocol statistics for the entire network, do one of the following:
• On the Monitor menu, click Protocols
342 Protocols statistics

OmniPeek User Guide
ANYOP_UG.book Page 343 Friday, February 5, 2016 4:47 PM
• Click Protocols Statistics in the main program window toolbar
To view Protocol statistics for a capture window:
• Select Protocols in the navigation pane of a capture window.
The parts of the Protocols Statistics window are described below.
• Protocols: Shows total count of protocols seen.
• View Type: Choose a Hierarchy or Flat type of display.
• Refresh: Sets display refresh interval. If interval is set to Manual, display will update only when Refresh is clicked.
• Display Top: Limits display to top 5, 10, 20, 50, or 100 protocols seen, as measured by traffic volume.
ProtocolsView Type
Refresh
Display TopProtocol Details
Make Filter
Insert Into Name Table
Graph
Make Alarm
Protocols statistics 343

Chapter 12: Displaying and Reporting Statistics
ANYOP_UG.book Page 344 Friday, February 5, 2016 4:47 PM
• Protocol Details: Opens Detail Statistics window.
• Make Filter: Opens Insert Filter dialog. See Creating filters with the Make Filter command on page 172.
• Insert Into Name Table: Adds the selected protocol to the Name Table.
• Graph: Opens the Graph Data Options dialog. See Chapter 14, Creating Graphs.
• Make Alarm: (OmniPeek console only) Opens the Make Alarm dialog. See Chapter 15, Setting Alarms and Triggers.
Tip For a description of a particular protocol or subprotocol, right-click the protocol in any window where it is shown, and choose Protocol Description.
Hierarchy view of protocols
To view Protocols statistics in a hierarchy view, choose the Hierarchical display type in the header of the Protocol statistics window. In the Hierarchy view, subprotocols are nested under more fundamental protocols such as TCP or UDP and IP. The root of each hierarchy is the base protocol (the one closest to the physical layer).
Protocol utilization statistics
When the Hierarchy view is collapsed, the utilization statistics show the sum of all subproto-cols within that protocol. When the Hierarchy view is expanded, utilization statistics are bro-ken out by individual subprotocol. The top-level protocol then shows statistics only for itself and for any subprotocols that seem to be a part of the top-level protocol, but that are not uniquely defined by ProtoSpecs™. Statistics that do not belong to any of the recognized sub-protocols are added to the totals for the parent protocol. This allows statistics for unrecognized subprotocols to be included in the totals with as much precision as possible.
Flat view of protocols
To view Protocol statistics in a flat view, choose the Flat display type in the header of the Proto-col statistics window. The Flat view of Protocol statistics recognizes the same protocols as in the Hierarchy view, but displays all protocol information as a flat list.
ProtoSpecs™
ProtoSpecs is a feature of OmniPeek that quickly and accurately identifies the protocols nested within packets. ProtoSpecs uses multiple identifiers within a packet to create a tree-structure
344 Protocols statistics

OmniPeek User Guide
ANYOP_UG.book Page 345 Friday, February 5, 2016 4:47 PM
that specifies a top-level protocol (such as IP) and subprotocols that it contains (such as FTP or SNMP). You can see this structure in the Hierarchy view of the Protocols tab.
The protocol hierarchy is rooted in the network medium of the selected adapter (or the adapter used to capture the file). When the program cannot identify a subprotocol, it lists the protocol with other unidentified types at the highest known protocol level.
You can add new protocol discrimination definitions to the ProtoSpecs hierarchy. Please visit http://mypeek.savvius.com for SDK information.
Viewing details for a protocol
You can double-click a protocol to see more detail about the traffic in a particular protocol (or right-click the protocol and choose Protocol Details). This opens a Detail Statistics window.
This window displays more detail about the nodes and the selected protocol. The additional detail includes:
• Details for nodes communicating in this protocol (and its subprotocols, if any).
• The relative percentage of traffic represented by any subprotocols.
Viewing details for a protocol 345
Chapter 12: Displaying and Reporting Statistics
ANYOP_UG.book Page 346 Friday, February 5, 2016 4:47 PM
• The Total packets and Total bytes of traffic for this protocol.
• Network Load (kbits/s) used by the protocol (and its subprotocols, if any).
• Largest packet, Smallest packet and Average packet size for the protocol.
Note The bar graph in this detail window lists all nodes receiving or sending packets of the selected protocol type, their respective percentage share of the protocol traffic, and the number of packets that percentage represents.
Network statisticsNetwork statistics show key statistics for the network as analog gauges (Gauge tab), or as raw data (Value tab). Network statistics are available for the entire network only.
Note The Network dashboard of a capture window displays statistics similar to Network statistics. See Network dashboard on page 75.
To view Network statistics for the network:
• On the Monitor menu, click Network
• Click Network Statistics in the main program window toolbar
A Network statistics window appears at the bottom of the main program window.
The parts of a Network Statistics window are described below.
346 Network statistics

OmniPeek User Guide
ANYOP_UG.book Page 347 Friday, February 5, 2016 4:47 PM
The Gauge tab of the Network Statistics window displays three analog dials with corre-sponding digital displays at their centers. A history graph under the gauges displays maximum (red line) and average (yellow line) values. The three analog dials include the following:
• Network utilization (percent of capacity)
• Traffic volume (packets per second)
• Error rate (total errors per second)
The Value tab displays tables with the following information:
• Duration: This parameter shows elapsed time in “hours:minutes:seconds:” format since you started collecting Monitor statistics.
• Packets received: This parameter shows packets received since you started collecting Monitor statistics.
• Bytes received: This parameter shows bytes received since you started collecting Monitor statistics.
• Multicast: This parameter shows packets addressed to multicast addresses since you started collecting Monitor statistics.
Network statistics 347
Chapter 12: Displaying and Reporting Statistics
ANYOP_UG.book Page 348 Friday, February 5, 2016 4:47 PM
• Broadcast: This parameter shows packets addressed to broadcast addresses since you started collecting Monitor statistics.
• Error Type: This table shows counts of error packets.
Note If a Capture Engine adapter is selected as the monitor adapter, network statistics are collected directly by the card and are not affected by filters and packet slicing set on the card. Network Statistics, including error counts, and the Channel groups in Summary Statistics are updated by polling the statistics collected by the card.
Size statisticsSize statistics display a Packet Size Distribution graph that shows the percentage of packets grouped by packet size. Size statistics are available for the entire network only.
Note You can create Graphs in a capture window that show data similar to the data in Size statistics. See Chapter 14, Creating Graphs.
To view Size statistics for the Network:
• On the Monitor menu, click > Size
• Click Size Statistics in the main program window toolbar
The parts of the Size Statistics window are identified below.
348 Size statistics

OmniPeek User Guide
ANYOP_UG.book Page 349 Friday, February 5, 2016 4:47 PM
• Pie: Click to choose a pie chart display.
• Bar: Click to choose a bar chart display.
• Options: Click to open the Size Statistics Display Options dialog to configure Type and Color options.
• Pause: Click to temporarily suspend chart updates.
Summary statisticsSummary statistics allow you to monitor key network statistics in real time and save those sta-tistics for later comparison. Summary statistics are available for the entire network and for a capture window.
To view Summary statistics for the network:
• On the Monitor menu, click Summary
• Click Summary Statistics in the toolbar of the main program window
Pause
OptionsBar
Pie
Summary statistics 349
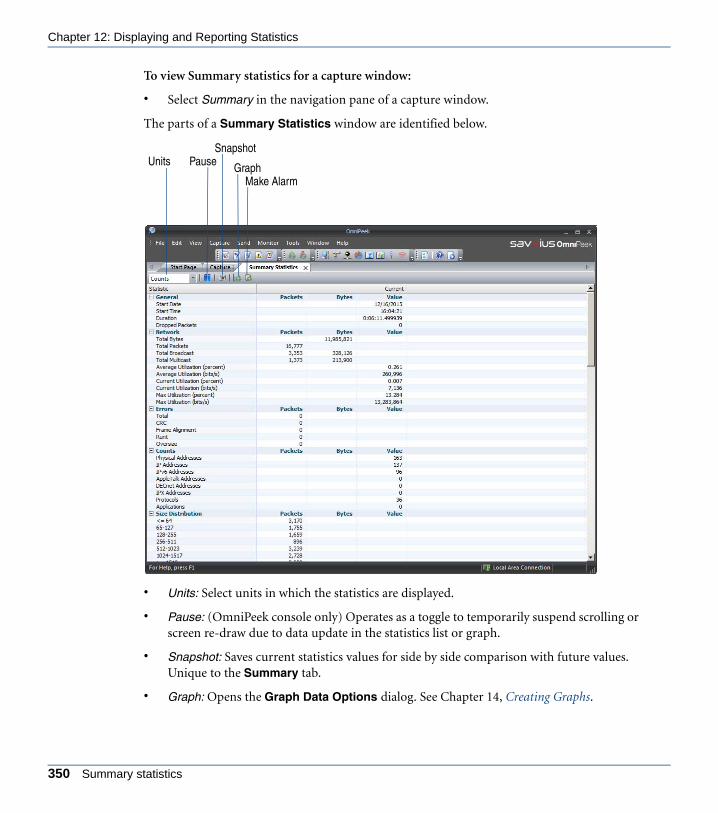
Chapter 12: Displaying and Reporting Statistics
ANYOP_UG.book Page 350 Friday, February 5, 2016 4:47 PM
To view Summary statistics for a capture window:
• Select Summary in the navigation pane of a capture window.
The parts of a Summary Statistics window are identified below.
• Units: Select units in which the statistics are displayed.
• Pause: (OmniPeek console only) Operates as a toggle to temporarily suspend scrolling or screen re-draw due to data update in the statistics list or graph.
• Snapshot: Saves current statistics values for side by side comparison with future values. Unique to the Summary tab.
• Graph: Opens the Graph Data Options dialog. See Chapter 14, Creating Graphs.
SnapshotUnits Pause Graph
Make Alarm
350 Summary statistics
OmniPeek User Guide
ANYOP_UG.book Page 351 Friday, February 5, 2016 4:47 PM
• Make Alarm: Opens the Make Alarm dialog to define the parameters for establishing and resolving alarm conditions based on the selected Summary statistics item. See Chapter 15, Setting Alarms and Triggers.
Reported statistics will vary depending on the adapter and driver in use.
Note Statistics provided by Analysis Modules and by the Expert must be enabled in the Analysis Modules view of the Options dialog in order to contribute to the Summary view. These functions can be enabled or disabled in the Analysis Options view of the Capture Options dialog when the individual capture window is created. See Optimizing capture performance on page 483.
Creating snapshots of summary statistics
Use the snapshot feature to baseline normal network activity, save the data as a snapshot, and then compare these saved statistics with those observed during periods of erratic network behavior.
To create a new Summary Statistics Snapshot:
• Click Snapshot. A new column labeled Snapshot 1 will appear to the right of the column labeled Current. (Click Snapshot again to create subsequent snapshots.)
To delete a Summary Statistics Snapshot:
• Right-click the row you wish to delete and choose Delete (choose Delete All Snapshots to clear all).
History statisticsHistory statistics display a graph of network performance at selected intervals over time. The scale can be fixed, or it can be dynamically adjusted to cover only the range of values encoun-tered so far. History statistics are available for the network only and not individual capture windows.
Note You can create graphs in a capture window that show data similar to the data in History statistics. See Chapter 14, Creating Graphs.
To view History statistics for the network:
• On the Monitor menu, click History
• Click History Statistics in the main program window toolbar
Creating snapshots of summary statistics 351
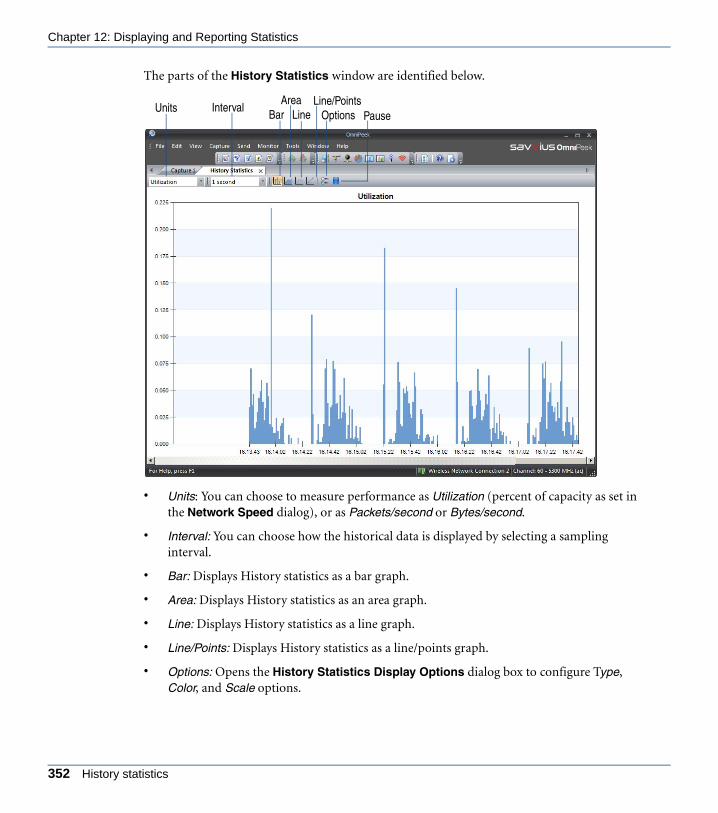
Chapter 12: Displaying and Reporting Statistics
ANYOP_UG.book Page 352 Friday, February 5, 2016 4:47 PM
The parts of the History Statistics window are identified below.
• Units: You can choose to measure performance as Utilization (percent of capacity as set in the Network Speed dialog), or as Packets/second or Bytes/second.
• Interval: You can choose how the historical data is displayed by selecting a sampling interval.
• Bar: Displays History statistics as a bar graph.
• Area: Displays History statistics as an area graph.
• Line: Displays History statistics as a line graph.
• Line/Points: Displays History statistics as a line/points graph.
• Options: Opens the History Statistics Display Options dialog box to configure Type, Color, and Scale options.
Pause Options Interval
BarUnits
AreaLine
Line/Points
352 History statistics

OmniPeek User Guide
ANYOP_UG.book Page 353 Friday, February 5, 2016 4:47 PM
• Pause: Temporarily stops the otherwise continuous scrolling of the display. Calculations will continue uninterrupted in the background. Scrolling will resume when you click Pause again, or when you close and re-open the History Statistics window.
Channel statisticsChannel statistics show a variety of statistics and counts for each channel of the WLAN band. When a supported wireless adapter is selected as the monitor adapter, Channel statistics are available for the entire network. When a supported wireless adapter is selected as the capture adapter, Channel statistics are available for a capture window.
To view Channel statistics for the network:
• On the Monitor menu, click Channel, and then select the Channels tab.
• Click Channel Statistics in the toolbar of the main program window, and then select the Channels tab.
To view Channel statistics for a capture window:
• Select Channels in the navigation pane of a capture window.
The parts of the Channel statistics window are identified below.
Note See Channel statistics columns on page 560 for a complete list and description of the columns available in the Channels view.
Channel statistics 353

Chapter 12: Displaying and Reporting Statistics
ANYOP_UG.book Page 354 Friday, February 5, 2016 4:47 PM
• View: Display information by All, Packets, or Bytes.
• Refresh: (OmniPeek console only) Set display refresh interval. If interval is set to Manual, the display is updated only when you click Refresh.
• Make Filter: Opens Insert Filter dialog. See Creating filters with the Make Filter command on page 172.
• Graph: (OmniPeek console only) Opens the Graph Data Options dialog. See Chapter 14, Creating Graphs.
• Make Alarm: (OmniPeek console only) Opens the Make Alarm dialog. See Chapter 15, Setting Alarms and Triggers.
Make AlarmGraph
Make Filter
RefreshView
354 Channel statistics

OmniPeek User Guide
ANYOP_UG.book Page 355 Friday, February 5, 2016 4:47 PM
Tip To save the channels statistics table to a tab-delimited text file, on the File menu, click Save Channels Statistics, or right-click inside the Channel Statistics window and select Save Channels Statistics.
WLAN statisticsWLAN statistics display an SSID (Service Set Identifier) tree view of wireless nodes. When a supported wireless adapter is selected as the monitor adapter, WLAN statistics are available for the entire network. When a supported wireless adapter is selected as the capture adapter, WLAN statistics are available for a capture window.
To view WLAN statistics for the network:
• Choose WLAN > Protocols.
• Click WLAN Statistics in the main program window toolbar.
To view WLAN statistics for a capture window:
• Select WLAN in the navigation pane of a capture window.
The parts of the WLAN statistics window are identified below.
Note See WLAN statistics columns on page 556 for a description of the columns available in WLAN statistics.
WLAN statistics 355

Chapter 12: Displaying and Reporting Statistics
ANYOP_UG.book Page 356 Friday, February 5, 2016 4:47 PM
• Wireless Networks: Displays count of wireless networks found.
• Ad Hoc Networks: Displays count of Ad Hoc networks found.
• Access Points: Displays count of access points found.
• Clients: Displays count of clients found.
• Node Type: (OmniPeek console only) Lets you limit the display to selected nodes (All Nodes, Stations, Access Points, ESSID, Ad Hoc, Admin, Unknown, and Channels).
When the WLAN hierarchy view is broken out by channels, the root branches of the tree are channels numbers, with individual WLAN hierarchy views underneath it (ESSID, BSSID, nodes, etc).
Node Type
Channel View Selection
Make Alarm
Graph
Make Filter
RefreshDisplay Top
Node Details
Insert Into Name TableColor Globe
356 WLAN statistics

OmniPeek User Guide
ANYOP_UG.book Page 357 Friday, February 5, 2016 4:47 PM
• Channel View Selection: Opens the WLAN Channels dialog that allows you to select which channels to display.
• Refresh: (OmniPeek console only) Set display refresh interval. If interval set to Manual, display will update only when Refresh is clicked.
• Display Top: (OmniPeek console only) Limit display to top 5, 10, 20, 50, or100 nodes seen, as measured by traffic volume.
• Node Details: Opens the Detail Statistics window. See Viewing details for a network node on page 341.
• Make Filter: Opens the Insert Filter dialog. See Creating filters with the Make Filter command on page 172.
• Insert Into Name Table: Opens the Node Address dialog. See Adding entries to the name table on page 434.
• Graph: (OmniPeek console only) Opens the Graph Data Options dialog. See Chapter 14, Creating Graphs.
• Make Alarm: (OmniPeek console only) Opens the Make Alarm dialog. See Chapter 15, Setting Alarms and Triggers.
• Color globes: Identifies the type of node by color:
• Blue: ESSID
• Pink: AP (access point) or Ad Hoc equivalent
• Orange: STA or client
• Gray: Admin or otherwise unknown
• Gray with (?): Indications for a particular node are contradictory or unexpected.
• Right-click options: These options include
• Locate Node: (OmniPeek console only) Select the source (STA or AP) and choose Locate Node. If you are using OmniPeek on a laptop, you can use signal strength to find a radio source. OmniPeek will create a live signal strength graph for this node in the Graphs view, then switch your display to that new graph automatically. The higher the signal strength, the closer you have moved to the source node.
• Display Weak Associations: (OmniPeek console only) Right-click to toggle the display of stations having only a weak association to any AP or Ad Hoc group.
• When enabled, STAs with weak associations are shown under the AP to which they last sent a packet.
WLAN statistics 357
Chapter 12: Displaying and Reporting Statistics
ANYOP_UG.book Page 358 Friday, February 5, 2016 4:47 PM
• When disabled, STAs with weak associations are added to the ESSID Unknown/BSSID Unknown group.
Tip To save WLAN statistics to a tab-delimited text file, on the File menu, click Save WLAN Statistics, or right-click inside the WLAN statistics window and select Save WLAN Statistics.
Hierarchy of wireless nodes
The hierarchy of wireless nodes is displayed as follows:
• ESSID (Extended Service Set Identifier): the name of a logical group of access points
• BSSID (Basic Service Set Identifier): a single access point
• STA (Station): a client associated to the particular access point
Each individual station (STA) is arranged under the BSSID of the access point (or equivalent) to which it most recently sent a packet.
Stations which have never sent a packet cannot be assigned to an actual BSSID. Until they send a packet to an access point or to a member of an ad hoc group, these nodes are displayed under BSSID Unknown. Three classes of addresses show up in the ESSID Unknown/BSSID Unknown category:
• Broadcast and multicast addresses, tagged as Admin in the Type column.
• Stations which have sent a Probe Request to a particular ESSID, but which have not associated with any known BSSID.
• Nodes which cannot be assigned to any BSSID or ESSID because of the hidden node problem (you can detect only one participant in a conversation, because the other is beyond your range).
Signal statisticsSignal statistics display continuously updated graphs of wireless traffic signal strength. When a supported wireless adapter is selected as the monitor adapter, Signal statistics are available for the entire network. When a supported wireless adapter is selected as the capture adapter, Sig-nal statistics are available for a capture window.
To view Signal statistics for the network:
• On the Monitor menu, click Channel, and then select the Signal tab.
358 Signal statistics

OmniPeek User Guide
ANYOP_UG.book Page 359 Friday, February 5, 2016 4:47 PM
• Click Channel Statistics in the toolbar of the main program window, and then select the Signal tab.
To view Signal statistics for a capture window:
• Select Signal in the navigation pane of a capture window.
The parts of the Signal statistics window are identified below.
• Channels: Choose to show signals on all channels or show only the signals of access points detected on the channels advertised in AP beacon and probe response packets.
• All: Shows the minimum, maximum, average, and most recent values for each channel in the scan.
• AP only: Shows the most recent value for each AP.
Channels Node Type UnitsPause
Geiger CounterOptions
Signal statistics 359

Chapter 12: Displaying and Reporting Statistics
ANYOP_UG.book Page 360 Friday, February 5, 2016 4:47 PM
• Node Type: Limits the display to traffic between certain types of nodes (All Nodes, Client to AP, AP to Client, or AP to AP).
• Units: Choose the units of display. The % (percent) units show the RSSI (Receive Signal Strength Indicator), normalized to a percentage. The dBm units are expressed in decibel milliWatts.
Note If the current adapter does not support dBm reporting, the Signal view will show readings of zero when any choice including (dBm) is selected for the Units. Change the Units to percentage (%) for these adapters.
• Options: Opens the Signal Statistics Options dialog, where you can choose to Reset graph occasionally or to toggle the Legend in the Signal view on or off.
• Pause: Temporarily suspends the update of the display.
• Geiger Counter: Acts as toggle. When enabled, makes an audible click each time the user-specified number of packets is processed on the selected adapter. You can specify a click for each 1, 10, 100, or 1000 Packets.
Applications statisticsApplications statistics show basic statistics about applications for a capture window.
To view application statistics for a capture window:
• Select Applications in the navigation pane of a capture window.
The parts of the Applications Statistics window are described below.
360 Applications statistics

OmniPeek User Guide
ANYOP_UG.book Page 361 Friday, February 5, 2016 4:47 PM
• Applications: Shows total count of applications observed.
• Refresh: Sets display refresh interval. If interval is set to Manual, display will update only when Refresh is clicked.
• Application Details: Opens a Detail Statistics tab for the selected application.
• Make Filter: Opens Insert Filter dialog. See Creating filters with the Make Filter command on page 172.
• Graph: Opens the Graph Data Options dialog. See Chapter 14, Creating Graphs.
• Make Alarm: (OmniPeek console only) Opens the Make Alarm dialog. See Chapter 15, Setting Alarms and Triggers.
Applications Refresh
Make FilterGraph
Make Alarm
Application Details
Applications statistics 361
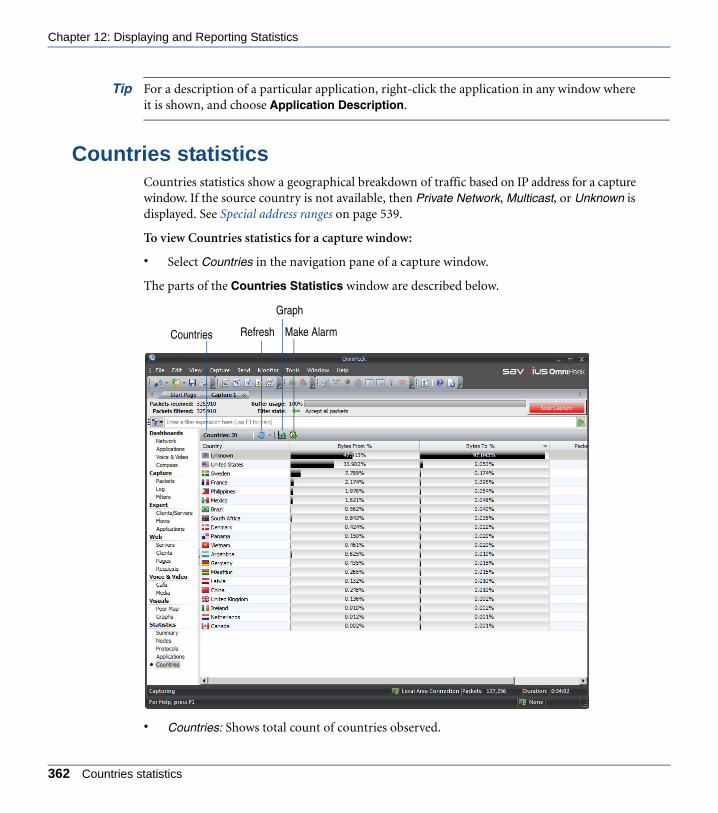
Chapter 12: Displaying and Reporting Statistics
ANYOP_UG.book Page 362 Friday, February 5, 2016 4:47 PM
Tip For a description of a particular application, right-click the application in any window where it is shown, and choose Application Description.
Countries statisticsCountries statistics show a geographical breakdown of traffic based on IP address for a capture window. If the source country is not available, then Private Network, Multicast, or Unknown is displayed. See Special address ranges on page 539.
To view Countries statistics for a capture window:
• Select Countries in the navigation pane of a capture window.
The parts of the Countries Statistics window are described below.
• Countries: Shows total count of countries observed.
Countries Refresh
Graph
Make Alarm
362 Countries statistics

OmniPeek User Guide
ANYOP_UG.book Page 363 Friday, February 5, 2016 4:47 PM
• Refresh: (OmniPeek only) Sets display refresh interval. If interval is set to Manual, display will update only when Refresh is clicked.
• Graph: (OmniPeek only) Opens the Graph Data Options dialog. See Chapter 14, Creating Graphs.
• Make Alarm: Opens the Make Alarm dialog. See Chapter 15, Setting Alarms and Triggers.
Note You can save the country statistics to a tab-delimited text or CSV file by right-clicking inside the Countries view and selecting Save Country Statistics (or on the File menu, click Save Country Statistics).
Generating statistics output reportsA variety of statistics output reports can be generated from monitor statistics obtained for the entire network, or capture window statistics obtained for a specific capture window. Statistics output reports can be generated at periodic intervals, and saved as XML \ HTML files that can be viewed with a browser, or as text files that you can import into a spreadsheet or database program for further processing.
Statistics output reports from monitor statistics
To generate statistics output reports from monitor statistics:
1. On the Monitor menu, click Monitor Options. The Monitor Options dialog appears.
2. Select the adapter you wish to monitor.
3. Select the Statistics Output options in the navigation pane.
4. Configure the Statistics Output options:
• Save statistics report every: Select this check box to enable saving statistics. Type or select the frequency interval with which you want to update the statistics files, and then the units of time by selecting Minutes, Hours, or Days from the list.
• Report type: Select the report type (a description of the selected report is displayed in the Report description box at the bottom of the dialog):
• Report folder: Type or browse to the folder where statistics output files are saved.
• Reset statistics after output: Select this option to reset the counts to zero after each statistics report is saved.
• Align save to time interval: Select this option to output a file at the nearest whole unit of time by the clock. For example, if your interval is set to some number of hours, the
Generating statistics output reports 363

Chapter 12: Displaying and Reporting Statistics
ANYOP_UG.book Page 364 Friday, February 5, 2016 4:47 PM
output will occur on the hour. When this option is cleared, the count begins as soon as you click OK, and output occurs when the first interval is reached.
• New file set: Select this option to write reports to new file folders, created at an intervals you specify in Set Schedule.
• Set Schedule: Click to open the New File Set Schedule dialog to specify intervals for your new file sets.
• Report description: Displays a description of the report type selected in Report Type above.
• Log output: Select this option to generate a message in the global log file each time statistics output are generated. Log entries include the path name of the output folder.
• Set Preferences: Click to open the Report Templates dialog. The Report Templates dialog lets you select the statistics that you want to include in your report.
5. Click OK.
6. Click Yes when prompted to open certain statistics window so the statistics output can be generated correctly.
The statistics output reports are generated at the frequency intervals specified in Save statistics report every above.
Statistics output reports from capture window statistics
To generate statistics output reports from capture window statistics:
1. Start a capture to open a capture window. See Chapter 3, The Capture Window.
2. On the Capture menu, click Capture Options. The Capture Options dialog appears.
3. Select the Statistics Output options in the navigation pane.
4. Configure the Statistics Output options:
• Save statistics report every: Select this check box to enable saving statistics. Type or select the frequency interval with which you want to update the statistics files, and then the units of time by selecting Minutes, Hours, or Days from the list.
• Report type: Select the report type (a description of the selected report is displayed in the Report description box at the bottom of the dialog):
• Report folder (OmniPeek captures only): Type or browse to the folder where statistics output files are saved.
364 Generating statistics output reports
OmniPeek User Guide
ANYOP_UG.book Page 365 Friday, February 5, 2016 4:47 PM
• Reset statistics after output: Select this option to reset the counts to zero after each statistics report is saved.
• Align save to time interval: Select this option to output a file at the nearest whole unit of time by the clock. For example, if your interval is set to some number of hours, the output will occur on the hour. When this option is cleared, the count begins as soon as you click OK, and output occurs when the first interval is reached.
• Create new file set: Select this option to write reports to new file folders, created at an intervals you specify in Set Schedule. See New file set schedule on page 365.
• Set Schedule: Click to open the New File Set Schedule dialog to specify intervals for your new file sets.
• Report description: Displays a description of the report type selected in Report type above.
• Log output: Select this option to generate a message in the global log file each time statistics output are generated. Log entries include the path name of the output folder.
5. Click OK.
The statistics output reports are generated at the frequency intervals specified in Save statistics report every above.
New file set schedule
When Create new file set is selected in the Statistics Output options, a series of new file folders, one at a time, at the intervals you specify are created. Folder names have the form: Folder-NameYYYY-MM-DD hh.mm.ss, where FolderName is the name you specified in Report folder.
To create a schedule for a new file set:
1. Select New file set in the Statistics Output options.
2. Click Set Schedule. The New File Set Schedule dialog appears.
New file set schedule 365

Chapter 12: Displaying and Reporting Statistics
ANYOP_UG.book Page 366 Friday, February 5, 2016 4:47 PM
3. Configure the dialog:
• Every time: Select this option to create a new folder each time a new statistics report is generated. The timestamp of each folder will show the time at which each statistics report was created.
• On a schedule: Select this option to establish a schedule for the creation of new folders. Select a number and units of time. The timestamp on each file folder will show the time at which the folder itself was created. Statistics reports continue to overwrite one another in this folder until a new folder is created.
• Align to time interval: Select this option to have the creation of new folders occur on the nearest whole unit of clock time.
• Output and reset statistics before new file set: Select this option to output the next scheduled statistics report, then reset statistics before each new folder is created.
• Keep most recent _____ file sets: Select this option to keep only the specified number of files, discarding older files and folders to make room for newer ones. Type or enter the number of file sets.
4. Click OK.
The current setting for the New File Set Schedule dialog appears in the box immediately below Set Schedule.
Viewing statistics output reportsStatistics output reports are generated in the frequency interval specified in Statistics Output options. If you selected XML\HTML Report as your Report type, you can view the generated reports in an XSLT supported browser.
Note Selecting XML\HTML Report as your Report type may affect capture performance. Selecting a PDF (default) report type is recommended for best performance.
366 Viewing statistics output reports

OmniPeek User Guide
ANYOP_UG.book Page 367 Friday, February 5, 2016 4:47 PM
To view a statistics output report:
1. Navigate to the Report Folder location specified in Statistics Output options.
Note On a Capture Engine, the Data folder configured in the General view of the Capture Engine Wizard is the Report folder location. See the Capture Engine documentation or Capture Engine Manager online help for details.
2. Double-click the report.htm file to open it in a browser. The report looks similar to the following:
3. Click a tab and subheading to view the various statistics output reports.
Viewing statistics output reports 367

Chapter 12: Displaying and Reporting Statistics
ANYOP_UG.book Page 368 Friday, February 5, 2016 4:47 PM
368 Viewing statistics output reports

C H A P T E R 13
ANYOP_UG.book Page 369 Friday, February 5, 2016 4:47 PM
Using the Peer Map
In this chapter:
About the Peer Map . . . . . . . . . . . . . . . . . . . . . . . . . . . . . . . . . . . . . . . . . . . . . 370
The Peer Map view. . . . . . . . . . . . . . . . . . . . . . . . . . . . . . . . . . . . . . . . . . . . . . 370
Peer Map options . . . . . . . . . . . . . . . . . . . . . . . . . . . . . . . . . . . . . . . . . . . . . . . 377
Displaying relevant nodes and traffic . . . . . . . . . . . . . . . . . . . . . . . . . . . . . . . . 378
369

Chapter 13: Using the Peer Map
ANYOP_UG.book Page 370 Friday, February 5, 2016 4:47 PM
About the Peer MapThe Peer Map view of a capture window lets you visualize network traffic, displaying the nodes around an elongated ellipse. Line weight shows the relative volume of traffic between nodes and line color the protocol in use between nodes. The nodes themselves can be color-coded and displayed as icons, based on node type and Name Table data.
The Peer Map tabs contain options to control the display of nodes and types of network traf-fic. This lets you quickly create a picture of all the traffic that is using a particular protocol. For example, you can show only the nodes sending or receiving multicast traffic.
The Peer Map viewTo display a Peer Map:
• From an open capture window, click the Peer Map view.
Peer Map Header
Peer Map Tabs
370 About the Peer Map

OmniPeek User Guide
ANYOP_UG.book Page 371 Friday, February 5, 2016 4:47 PM
Nodes and traffic in the Peer Map
Nodes and the traffic occurring between them are represented in the following ways in the Peer Map:
• Each dot represents a particular node. When you hold the cursor over a node, the node is highlighted, and a graphical tooltip appears with more information about the node. See Displaying node tooltips on page 381. If you click on one or more nodes, the node is highlighted in orange and becomes the focused object in the Peer Map. Subsequent toolbar button or context menu key presses will apply to the focused node.
• The size of the dot represents the number of packets sent from that node, as a percentage of total packets in the window.
• The lines between nodes represent the traffic (or conversation) between them. When you hold the cursor over a line, the line is highlighted in yellow, and a graphical tooltip appears with more information about the traffic occurring between the two nodes. See Displaying node tooltips on page 381. If you click on a line, the line is highlighted in orange and becomes the focused object in the Peer Map. Subsequent toolbar button or context menu key presses will apply to the focused conversation line.
• The color of the line represents the protocol. This matches the protocol colors displayed for each protocol in the Protocols task pane of the Configuration tab.
• The thickness of the line represents the volume of the traffic. Specifically, the thickness of the line represents the volume in bytes of the traffic between two nodes, expressed as a percent of all the traffic in the buffer.
Tip You can drag one or more nodes and lines to other positions within the Peer Map to make it easier to view network traffic occurring with those nodes and lines. To move a node back to within the ellipse, right-click the node and select Arrange. To move all nodes back to within the ellipse, right-click an empty area of the Peer Map and select Arrange All Nodes.
Parts of the Peer Map
Peer Map header
• Nodes: Displays the number of unique nodes in the Peer Map.
• Convs. (Conversations): Displays the number of conversations in the Peer Map.
• Protocols: Displays the number of unique protocols in the Peer Map.
Nodes and traffic in the Peer Map 371

Chapter 13: Using the Peer Map
ANYOP_UG.book Page 372 Friday, February 5, 2016 4:47 PM
• Map Type: Lets you choose whether to display nodes as a Physical, IP, IPv6, Apple Talk, DECnet, or an IPX Peer Map.
• Peer Map toolbar:
• Options: Displays the Peer Map Options dialog that lets you control how various items are displayed in the Peer Map. See Peer Map options on page 377.
• Node Details: Displays the Detail Statistics dialog for the selected node.
• Conversation Details: Displays the Detail Statistics dialog for the selected conversation.
• Make Filter: Displays the Insert Filter dialog to create a filter based on the selected node or conversation.
• Insert Into Name Table: Displays the Edit Name dialog to create an entry into the name table based on the selected node.
• Resolve Names: Resolves the name of the node from the name table.
Peer Map tabs
• Configuration: This tab sets the basic parameters of the Peer Map. See Configuration tab on page 372.
• Node Visibilities: This tab displays node counts, and nodes that are both shown and hidden in the Peer Map. See Node Visibilities tab on page 374.
• Profiles: This tab lets you create profiles and add a background image to the Peer Map. See Profiles tab on page 376.
Configuration tab
The Configuration tab sets the basic parameters of the Peer Map. The Configuration tab task panes are described below.
372 The Peer Map view
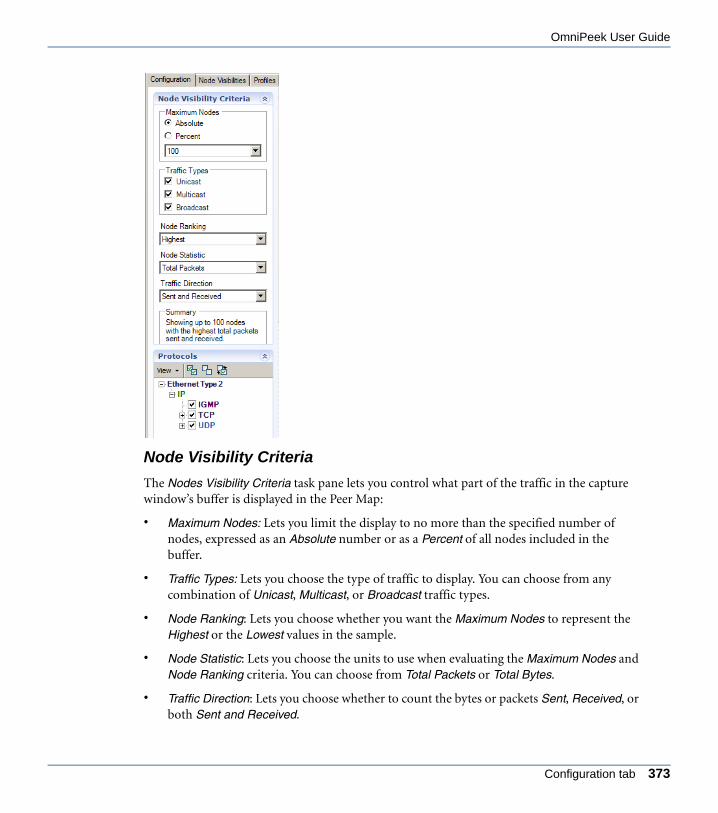
OmniPeek User Guide
ANYOP_UG.book Page 373 Friday, February 5, 2016 4:47 PM
Node Visibility Criteria
The Nodes Visibility Criteria task pane lets you control what part of the traffic in the capture window’s buffer is displayed in the Peer Map:
• Maximum Nodes: Lets you limit the display to no more than the specified number of nodes, expressed as an Absolute number or as a Percent of all nodes included in the buffer.
• Traffic Types: Lets you choose the type of traffic to display. You can choose from any combination of Unicast, Multicast, or Broadcast traffic types.
• Node Ranking: Lets you choose whether you want the Maximum Nodes to represent the Highest or the Lowest values in the sample.
• Node Statistic: Lets you choose the units to use when evaluating the Maximum Nodes and Node Ranking criteria. You can choose from Total Packets or Total Bytes.
• Traffic Direction: Lets you choose whether to count the bytes or packets Sent, Received, or both Sent and Received.
Configuration tab 373

Chapter 13: Using the Peer Map
ANYOP_UG.book Page 374 Friday, February 5, 2016 4:47 PM
• Summary: Displays a description of the current view.
Note The nodes that do not meet your criteria are removed from the Peer Map and are listed in the Auto Hidden Nodes pane under the Node Visibilities tab.
Protocols
The Protocols task pane displays a list of protocols currently found in the Peer Map and allows you to control the display of the line segments between the various peers. The line segments represent traffic for a particular protocol.
The toolbar lets you control what is displayed:
• View: Select how you want the protocols displayed in the Protocols task pane (Flat, Hierarchical, or Condense).
• Enable All: Click to enable the display of all protocols.
• Disable All: Click to disable the display of all protocols.
• Toggle All: Click to toggle between Enable All and Disable All.
Each protocol has a color associated with it in ProtoSpecs. Both the entry in the Protocols pane and the traffic lines in the Peer Map use the same ProtoSpecs-assigned color to display each particular protocol. See ProtoSpecs™ on page 344.
Node Visibilities tab
The Node Visibilities tab displays node counts, and nodes that are both shown and hidden in the Peer Map. The Node Visibilities task panes are described below.
374 The Peer Map view
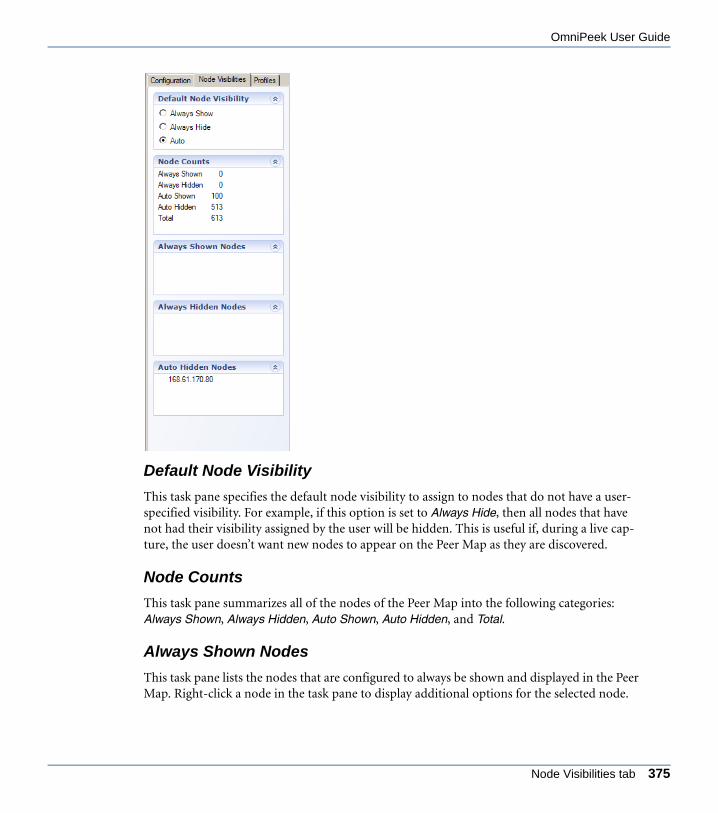
OmniPeek User Guide
ANYOP_UG.book Page 375 Friday, February 5, 2016 4:47 PM
Default Node Visibility
This task pane specifies the default node visibility to assign to nodes that do not have a user-specified visibility. For example, if this option is set to Always Hide, then all nodes that have not had their visibility assigned by the user will be hidden. This is useful if, during a live cap-ture, the user doesn’t want new nodes to appear on the Peer Map as they are discovered.
Node Counts
This task pane summarizes all of the nodes of the Peer Map into the following categories: Always Shown, Always Hidden, Auto Shown, Auto Hidden, and Total.
Always Shown Nodes
This task pane lists the nodes that are configured to always be shown and displayed in the Peer Map. Right-click a node in the task pane to display additional options for the selected node.
Node Visibilities tab 375

Chapter 13: Using the Peer Map
ANYOP_UG.book Page 376 Friday, February 5, 2016 4:47 PM
Always Hidden Nodes
This task pane lists the nodes that are configured to always be hidden and not displayed in the Peer Map. Right-click a node in the task pane to display additional options for the selected node.
Auto Hidden Nodes
This task pane lists the nodes that are currently hidden from the Peer Map. The settings in the Configuration tab determine which nodes appear in this task pane. Right-click a node in the task pane to display additional options for the selected node.
Profiles tab
The Profiles tab lets you create profiles and add a background image to the Peer Map.
376 The Peer Map view
OmniPeek User Guide
ANYOP_UG.book Page 377 Friday, February 5, 2016 4:47 PM
Profiles
The Profiles task pane lets you save Peer Map configuration settings into a single profile that controls the appearance and layout of the Peer Map. The toolbar in the task pane allows you to save, edit, duplicate, delete, import, and export profiles. The settings that make up the profile include:
Note Changes to a Peer Map profile are applied globally to all capture windows using that profile.
• User-applied node visibilities (always shown, always hidden)
• Default node visibility
• User-arranged node locations
• Background image
To enable a profile:
• Select the check box of the desired profile
Background Image
The Background Image task pane lets you apply a background image to the Peer Map. This is useful if you want a more visual representation of the nodes in your Peer Map and your actual network. For example, if you have a graphic image of your network, you can add that image as a background image, and then arrange several key nodes that are experiencing the network problems over the background image to represent their real-world locations. Additionally, you can then hide all uninteresting nodes so that they don’t clutter the arrangement.
To add a background image:
1. Click Open in the task pane. The Open Image dialog appears.
2. Select the background image, and then click Open. The image is added to the Peer Map.
Peer Map optionsThe Peer Map Options dialog lets you control how various items are displayed in the Peer Map. You can choose to show or hide displayable icons, node visibilities, and protocol line seg-ment gaps.
To view the Peer Map options dialog:
• Click Options in the Peer Map toolbar. The following options are available:
Peer Map options 377

Chapter 13: Using the Peer Map
ANYOP_UG.book Page 378 Friday, February 5, 2016 4:47 PM
• Show type icons (server, workstation, etc.): Select this option to display the icon appropriate to that node type (such as Workstation, Router).
• Show visibility icons (thumbtack): Select this option to display a node visibility icon (a thumbtack) to indicate that a node visibility (Always Shown or Always Hidden) is assigned to a node.
• Show node tooltips: Select this option to display a tooltip when hovering over a node.
• Show gaps between protocol segments: Select this option to display gaps in line segments to help distinguish that more than one protocol is in use between nodes.
• Show ghost lines when all protocol segments are disabled: Select this option to display light gray, dashed lines in place of conversation lines when all of their protocol segments have been disabled.
• Show conversation tool tips: Select this option to display a tooltip when hovering over a line.
• Improve rendering speed by turning off anti-aliasing when displaying _______ or more conversations: Select this option to improve how fast the Peer Map is rendered.
Displaying relevant nodes and trafficThe packets currently in the buffer of the capture window are the source of what is displayed in the Peer Map. You have various right-click options to display only the most relevant nodes and traffic in the Peer Map.
If you right-click a node in the Peer Map and Node Visibilities tab, the following options are available:
• Arrange (Peer Map tab only): This option arranges the node back to within the ellipse of the Peer Map.
• Node Details: This option opens the Detailed Statistics dialog and shows details of the selected node.
Tip You can mouse over a node to display details of the node in a tooltip. See Displaying node tooltips on page 381.
• Visibility: Displays options for showing and hiding nodes within the Peer Map. Showing and hiding nodes in the Peer Map do not affect how nodes are displayed in other views of a capture window.
• Always Show: This option will always display the node in the Peer Map. When you select this option, a thumbtack icon is displayed with the node in the Peer Map to
378 Displaying relevant nodes and traffic
OmniPeek User Guide
ANYOP_UG.book Page 379 Friday, February 5, 2016 4:47 PM
indicate a node visibility setting has been assigned, and the node is listed in the Always Shown Nodes task pane of the Node Visibilities tab.
• Always Hide: This option will always hide the node in the Peer Map. When you select this option, the node is removed from the Peer Map and listed in the Always Hidden Nodes task pane of the Node Visibilities tab.
• Auto: This option reverts any Always Shown or Always Hidden nodes back to their original status.
• Peers: Displays options for showing or hiding nodes that are peers to the selected nodes.
• Always Show: This option will always display nodes that are peers in the Peer Map. When you select this option, a thumbtack icon is displayed with the node in the Peer Map to indicate a node visibility setting has been assigned, and the node is listed in the Always Shown Nodes task pane of the Node Visibilities tab.
• Always Hide: This option will always hide nodes that are peers in the Peer Map. When you select this option, the node is added is removed from the Peer Map and the node is listed in the Always Hidden Nodes task pane of the Node Visibilities tab.
• Auto: This option reverts any Always Shown or Always Hidden nodes back to their original status.
• Non-Peers: Displays options for showing or hiding nodes that are not peers to the selected nodes.
• Always Show: This option will always display nodes that are not peers in the Peer Map. When you select this option, a thumbtack icon is displayed with the node in the Peer Map to indicate a node visibility setting has been assigned, and the node is listed in the Always Shown Nodes task pane of the Node Visibilities tab.
• Always Hide: This option will always hide nodes that are not peers in the Peer Map. When you select this option, the node is added is removed from the Peer Map and the node is listed in the Always Hidden Nodes task pane of the Node Visibilities tab.
• Auto: This option reverts any Always Shown or Always Hidden nodes back to their original status.
• Select Related Packets: Displays options for showing or hiding nodes that are related to the selected packets by the source or destination IP address.
• By Source: This option displays nodes that are related to the selected node by source IP address. You will have the option to Hide selected packets, Hide unselected packets, or Copy selected packets to new window.
Displaying relevant nodes and traffic 379
Chapter 13: Using the Peer Map
ANYOP_UG.book Page 380 Friday, February 5, 2016 4:47 PM
• By Destination: This option displays nodes that are related to the selected node by destination IP address. You will have the option to Hide selected packets, Hide unselected packets, or Copy selected packets to new window.
• By Source or Destination: This option displays nodes that are related to the selected node by both source and destination IP address. You will have the option to Hide selected packets, Hide unselected packets, or Copy selected packets to new window.
Important! Unlike the tools for hiding and unhiding nodes in the Peer Map, selection results are shown in the Packets view, as with any other Select Related Packets operation.
• Make Filter: This option opens the Insert Filter dialog and lets you create a filter based on the selected node.
• Insert into Name Table: This option opens the Insert Name or Edit Name dialog with the characteristics of the selected node already entered.
• Resolve Names: Select this option if name resolution services are available. For more about names, see Chapter 17, Using the Name Table.
If you right-click a conversation in the Peer Map, the following options are available:
• Conversation Details: This option opens the Detailed Statistics dialog and shows details of the selected conversation.
• Select Related Packets: Displays the option for showing or hiding nodes that are related to the selected conversation by the source and destination IP address.
• By Source or Destination: This option displays nodes that are related to the selected conversation by both source and destination IP address. You will have the option to Hide selected packets, Hide unselected packets, or Copy selected packets to new window.
Important! Unlike the tools for hiding and unhiding nodes in the Peer Map, selection results are shown in the Packets view, as with any other Select Related Packets operation.
• Make Filter: This option opens the Insert Filter dialog and lets you create a filter based on the selected conversation.
If you right-click anything other than a node or conversation, the following options are avail-able:
• Arrange All Nodes: This option arranges nodes back to within the ellipse of the Peer Map.
• Resolve All Names: This option renames nodes according to the name table.
380 Displaying relevant nodes and traffic

OmniPeek User Guide
ANYOP_UG.book Page 381 Friday, February 5, 2016 4:47 PM
• Copy to Clipboard: This option copies the Peer Map image to the clipboard.
Tip You can drag one or more nodes to other positions within the Peer Map to make it easier to view network traffic occurring with those nodes. To move a node back to within the ellipse, right-click the node and select Arrange. To move all nodes back to within the ellipse, right-click an empty area of the Peer Map and select Arrange All Nodes.
Displaying node tooltips
When you move your cursor over a node or line in the Peer Map, or node in the Node Visibili-ties tab, a tooltip appears displaying tabular and graphical information about the node or line:
Line Tooltip Node Tooltip
Displaying node tooltips 381

Chapter 13: Using the Peer Map
ANYOP_UG.book Page 382 Friday, February 5, 2016 4:47 PM
382 Displaying relevant nodes and traffic

C H A P T E R 14
ANYOP_UG.book Page 383 Friday, February 5, 2016 4:47 PM
Creating Graphs
In this chapter:
About graphs . . . . . . . . . . . . . . . . . . . . . . . . . . . . . . . . . . . . . . . . . . . . . . . . . . 384
OmniPeek monitor statistics graphs . . . . . . . . . . . . . . . . . . . . . . . . . . . . . . . . . 384
OmniPeek capture statistics graphs . . . . . . . . . . . . . . . . . . . . . . . . . . . . . . . . . 386
Capture Engine statistics graphs . . . . . . . . . . . . . . . . . . . . . . . . . . . . . . . . . . . 390
Capture Engine graph templates . . . . . . . . . . . . . . . . . . . . . . . . . . . . . . . . . . . 396
Configuring and saving graphs. . . . . . . . . . . . . . . . . . . . . . . . . . . . . . . . . . . . . 401
383
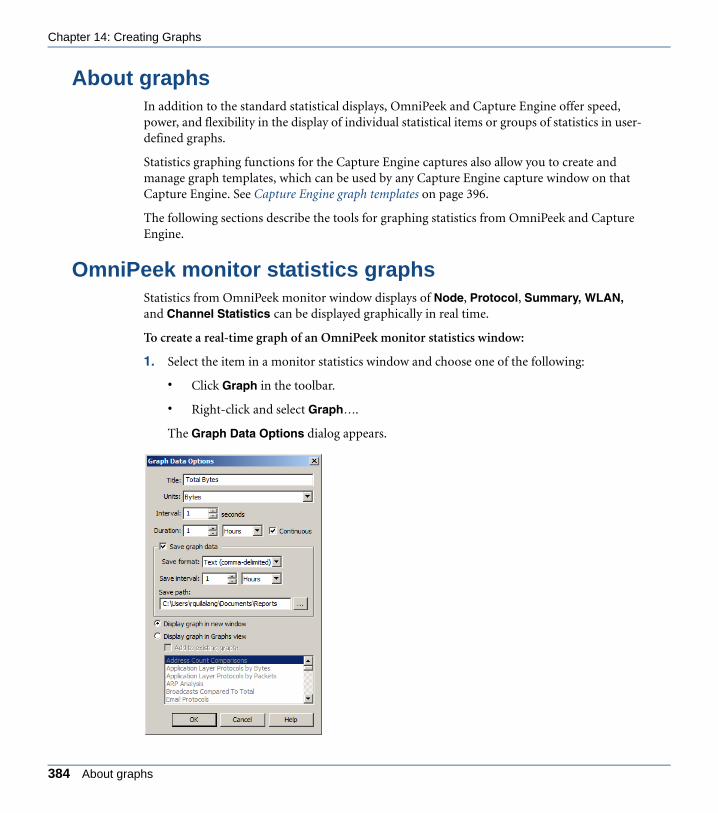
Chapter 14: Creating Graphs
ANYOP_UG.book Page 384 Friday, February 5, 2016 4:47 PM
About graphsIn addition to the standard statistical displays, OmniPeek and Capture Engine offer speed, power, and flexibility in the display of individual statistical items or groups of statistics in user-defined graphs.
Statistics graphing functions for the Capture Engine captures also allow you to create and manage graph templates, which can be used by any Capture Engine capture window on that Capture Engine. See Capture Engine graph templates on page 396.
The following sections describe the tools for graphing statistics from OmniPeek and Capture Engine.
OmniPeek monitor statistics graphsStatistics from OmniPeek monitor window displays of Node, Protocol, Summary, WLAN, and Channel Statistics can be displayed graphically in real time.
To create a real-time graph of an OmniPeek monitor statistics window:
1. Select the item in a monitor statistics window and choose one of the following:
• Click Graph in the toolbar.
• Right-click and select Graph….
The Graph Data Options dialog appears.
384 About graphs

OmniPeek User Guide
ANYOP_UG.book Page 385 Friday, February 5, 2016 4:47 PM
2. Fill in the Graph Data Options dialog.
Note Click Help to learn about the available options and settings.
3. Click OK to create the new graph and to begin displaying data.
The parts of a monitor statistics graph are identified below.
• Bar: Click to change the display to a bar graph.
• Area: Click to change the display to an area graph.
• Line: Click to change the display to a line graph.
BarArea
LineOptions
Pause
Line/Points
OmniPeek monitor statistics graphs 385

Chapter 14: Creating Graphs
ANYOP_UG.book Page 386 Friday, February 5, 2016 4:47 PM
• Line/Points: Click to change the display to a line graph with points.
• Options: Click to open the Graph Display Options dialog, where you can set more configuration options. See Graph display options on page 401.
• Pause: Click to temporarily suspend scrolling and view data which has scrolled off-screen to the left. monitor statistics graphs scroll each time data is refreshed so the most recent data appears at the far right of the screen.
Note The scroll bar represents the position within a window of the size you set in the Duration parameter. For example, if you set a duration of one hour and have been graphing statistics for only ten minutes, only the right-most portion of the scroll bar will show any graphed data.
OmniPeek capture statistics graphsYou can graph any statistics item calculated in the Nodes, Protocols, Applications, Sum-mary, WLAN, or Channels views of a capture window in either of two ways:
• Create a new statistics Graph window showing just the selected statistic.
• Create or add a statistic to a graph already displayed in the Graphs view of a capture window or file.
The main distinction between the two types of graphs is in their formatting options and the ability to save and retrieve these formats.
To create a graph of a statistics item in a capture window, follow these steps:
1. Highlight the item and choose one of the following:
• Click Graph in the toolbar.
• Right-click and choose Graph….
The Graph Data Options dialog appears.
386 OmniPeek capture statistics graphs

OmniPeek User Guide
ANYOP_UG.book Page 387 Friday, February 5, 2016 4:47 PM
2. Fill in the Graph Data Options dialog.
Note Click Help to learn about the available options and settings.
3. Choose one of the following:
• Display graph in new window: This option offers the same formatting and data saving options as a graph created for a single monitor statistics item. See OmniPeek monitor statistics graphs on page 384.
• Display graph in Graphs view: This option lets you add the new graph to those already listed in the Graphs view of the capture window. See OmniPeek capture window graphs on page 388.
• Add to existing graph: This option lets you add the selected statistics item to one of the graphs that already exists in the Graphs view. See OmniPeek capture window graphs on page 388.
4. Click OK to accept your changes.
5. Select the name of the graph from the list at left. The graph will be displayed on the right.
Note When you choose to Display graph in Graphs view, the Save graph data section of the Graph Data Options dialog becomes grayed out. This is because the graphs in the Graphs view are part of the capture window and this data is saved using File > Save Report…. You can also use the Statistics Output view of the Capture Options dialog to configure the periodic output of
Options unique to capture statistics graphs
OmniPeek capture statistics graphs 387
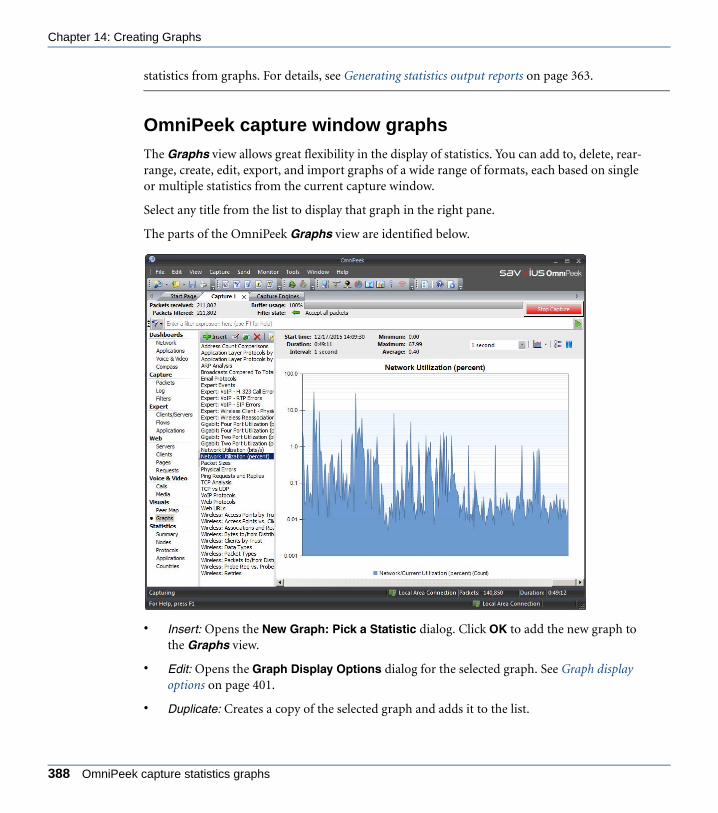
Chapter 14: Creating Graphs
ANYOP_UG.book Page 388 Friday, February 5, 2016 4:47 PM
statistics from graphs. For details, see Generating statistics output reports on page 363.
OmniPeek capture window graphs
The Graphs view allows great flexibility in the display of statistics. You can add to, delete, rear-range, create, edit, export, and import graphs of a wide range of formats, each based on single or multiple statistics from the current capture window.
Select any title from the list to display that graph in the right pane.
The parts of the OmniPeek Graphs view are identified below.
• Insert: Opens the New Graph: Pick a Statistic dialog. Click OK to add the new graph to the Graphs view.
• Edit: Opens the Graph Display Options dialog for the selected graph. See Graph display options on page 401.
• Duplicate: Creates a copy of the selected graph and adds it to the list.
388 OmniPeek capture statistics graphs

OmniPeek User Guide
ANYOP_UG.book Page 389 Friday, February 5, 2016 4:47 PM
• Delete: Deletes the selected graph.
• Import: When you click Import, the program first asks if you would like to delete all graphs before importing? If you choose Yes, all the graphs currently shown in the Graphs view will be deleted and replaced by the contents of the imported *.gph file. If you choose No, the graphs you import will be added to the current list. Use the file Open dialog to navigate to the location of the *.gph file you wish to import, and click OK.
• Export: You can export the entire contents of the Graphs view to a *.gph file, which is a set of parameters for defining all the graphs currently in the Graphs view. This allows you to create and maintain groups of graphs for particular troubleshooting tasks, or for particular environments.
• Bar: Click to change the display to a bar graph.
• Stacked Bar: Click to change the display to a stacked bar graph.
• Skyline: Click to change the display to a skyline graph.
• Stacked Skyline: Click to change the display to a stacked skyline graph.
• Area: Click to change the display to an area graph.
• Stacked Area: Click to change the display to a stacked area graph.
• Line: Click to change the display to a line graph.
• Line/Points: Click to change the display to a line graph with points.
• Points: Click to change the display to a points graph.
• Pie: Click to change the display to a pie graph.
• Bar Pie: Click to change the display to a bar pie graph.
• Options: Click to open the Graph Display Options dialog, where you can set more configuration options. See Graph display options on page 401.
• Pause: Click to temporarily suspend scrolling and view data which has scrolled off-screen to the left. Statistics graphs scroll each time data is refreshed so the most recent data appears at the far right of the screen.
The scroll bar represents the position within a window of the size you set in the Duration parameter. For example, if you set a duration of one hour and have been graphing statistics for only ten minutes, only the right-most portion of the scroll bar will show any graphed data.
Tip You can restore the default Graphs view by importing the Default Graph.gph file, located in the 1033\Graphs directory.
OmniPeek capture window graphs 389

Chapter 14: Creating Graphs
ANYOP_UG.book Page 390 Friday, February 5, 2016 4:47 PM
Capture Engine statistics graphsThe graphs function on a Capture Engine lets you create customized graphs of user-defined statistics from the Nodes, Protocols, Applications, WLAN, and Summary statistics views of Capture Engine capture windows.
The Graphs tab of the Capture Engines window also allows you to create and manage graph templates, which can be used by any Capture Engine capture on that particular Capture Engine. See Capture Engine graph templates on page 396.
To view graphs in a Capture Engine capture window:
1. Start a capture from the Home tab or Capture tab of a connected Capture Engine. See Creating a Capture Engine capture window on page 33.
2. Select Enable graphs in the Graphs options of the Capture Engine Capture Options dialog. See Capture Engine graphs capture options on page 392.
3. Click OK. A new Capture Engine capture window appears.
4. Click Start Capture and then the Graphs view of the Capture Engine capture window. See Capture Engine capture window graphs on page 394.
5. Select the graphs you wish to display in the Capture Engine capture window. The example below displays the graphs for ARP analysis and Expert events.
390 Capture Engine statistics graphs

OmniPeek User Guide
ANYOP_UG.book Page 391 Friday, February 5, 2016 4:47 PM
Tip Right-click in the graph area to choose from a Gallery of graph displays.
Capture Engine graphs tab
Select the Settings tab, and then point to the Graphs tab for a connected Capture Engine in the Capture Engines window. (See Connecting to a Capture Engine on page 14.) A list of pre-defined and created graphs is displayed.
The parts of the Capture Engine Graphs tab are identified below.
Capture Engine graphs tab 391

Chapter 14: Creating Graphs
ANYOP_UG.book Page 392 Friday, February 5, 2016 4:47 PM
• Insert: Opens the Create Graph Template dialog. See Creating a new Capture Engine graph template on page 397.
• Edit: Opens the Edit Graph Template dialog. See Editing a Capture Engine graph template on page 400.
• Delete: Deletes selected graph.
• Refresh: Refreshes list of graphs at user-defined intervals.
Capture Engine graphs capture options
The Graphs options of the Capture Engine Capture Options dialog lets you manage the graphing capabilities for individual Capture Engine captures.
The parts of the Graphs options of the Capture Engine Capture Options dialog are identified below.
RefreshDelete
Insert EditPre-defined graphs
392 Capture Engine statistics graphs

OmniPeek User Guide
ANYOP_UG.book Page 393 Friday, February 5, 2016 4:47 PM
• Enable Graphs: Select this check box in order to have the Graphs view appear in the Capture Engine capture window.
• Interval: Choose the sampling interval for all statistics used for graph creation in the current Capture Engine capture window. Enter a value and choose the units.
For any statistics item normally expressed per unit of time, the graphing function creates an average value over the sampling interval you choose.
• Keep most recent…hours: Choose number of hours for statistics collection.
Files are created on the hour. One folder per capture is created, with one *.sts file per hour of preserved graph data. There is an added *.sts file for the data from the current hour. For example, if your Keep most recent setting is eight hours, then there will be nine *.sts files.
• Select Graph Templates: This section shows all currently defined graph templates and provides tools for creating and managing them. (See Capture Engine graphs tab on page 391 for details on creating graph templates.)
Select one or more graph template(s) to add them to the Graphs view of the new Capture Engine capture window.
Capture Engine graphs capture options 393

Chapter 14: Creating Graphs
ANYOP_UG.book Page 394 Friday, February 5, 2016 4:47 PM
Capture Engine capture window graphs
The Graphs view of a Capture Engine capture window can show multiple graphs, each one of which can show one or more statistics items from any combination of the following views: Nodes, Protocols, Applications, WLAN, and Summary statistics.
A graph enabled in the Graphs list is shown in the right pane. When multiple graphs are enabled, they are stacked vertically. All graphs share the same horizontal time axis.
The parts of the Capture Engine Graphs view are identified below.
• Insert: Click to add an existing graph template to the Graphs list by opening the Graph Templates dialog.
InsertDelete Pause
Zoom out
Display duration
Graph list
First
Zoom in Next
Previous
LastGraph list
394 Capture Engine statistics graphs

OmniPeek User Guide
ANYOP_UG.book Page 395 Friday, February 5, 2016 4:47 PM
• Delete: Click to remove selected graph template(s) from the Graphs list. (The deleted graph template will be restored to the list in the Graph Templates dialog.)
• Graph list: Click to toggle the display of the Graphs list.
• Pause: Click to toggle the update of all graphs, preventing them from automatically scrolling to the right at each new sampling interval.
• Zoom in: Click to enlarge the size of the display.
• Zoom out: Click to reduce the size of the display.
• Display duration: Use the drop-down list beside to select the time window (left-right expanse) displayed for all graphs. A shorter interval has the effect of zooming in, a longer interval, of zooming out.
• First, Previous, Next, Last: Use these buttons to scroll through the graphs when Pause is clicked (active).
• Right-click options:
• Gallery: Select alternative graph displays
• Options…: Opens the Graphs Display Options dialog. See Graph display options on page 401.
• Legend: Toggles display of the graph legend.
• Copy: Copies the graph image to the clipboard.
• Print: Opens the Print dialog for printing the graph.
To add an existing graph template to the Graphs list:
1. Click Insert. The Graph Templates dialog appears.
Capture Engine capture window graphs 395

Chapter 14: Creating Graphs
ANYOP_UG.book Page 396 Friday, February 5, 2016 4:47 PM
2. Select the check box beside any graph template you wish to add to the Graphs list of the Capture Engine capture window.
3. Click OK.
To create a new graph template, choose one of the following:
• Click Insert in the Graph Templates dialog.
• Select statistics items directly in the Nodes, Protocols, or Summary views of Capture Engine capture windows and click Graph in the toolbar.
The Create Graph Template dialog appears. For a details, see Capture Engine graph templates on page 396.
Tip To open a window that shows only the Graphs view of a Capture Engine capture window, right-click its listing in the Captures view of the Capture Engines window and choose Graphs. This allows you to monitor and manage the Graphs view of the Capture Engine capture window using minimal bandwidth and processing power.
Capture Engine graph templatesYou can create, edit, and manage graph templates in the Graphs tabs of the Capture Engines window, the Capture Engine Capture Options dialog, and any Capture Engine capture win-dow.
InsertEdit
DeleteRefresh
396 Capture Engine graph templates
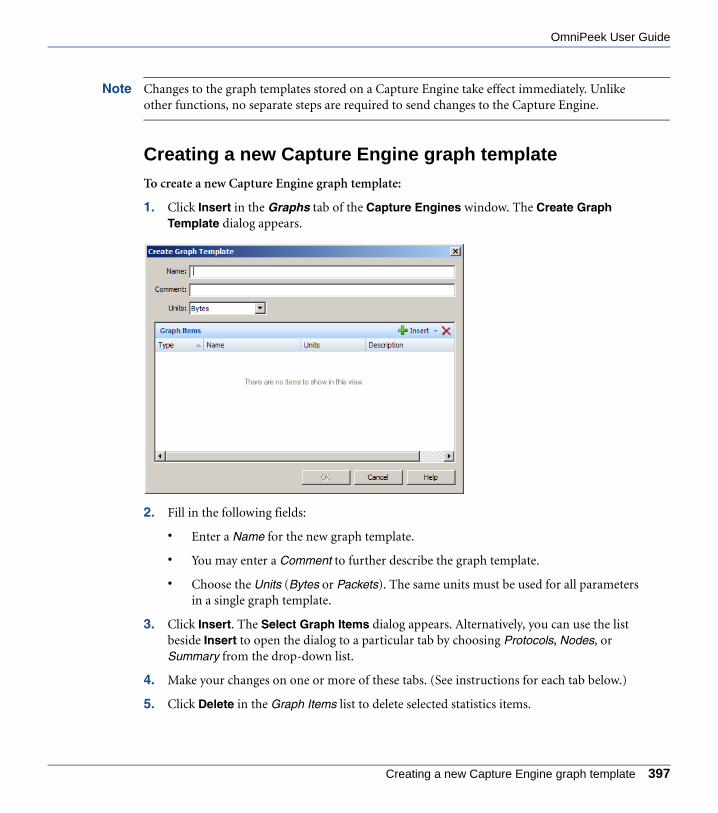
OmniPeek User Guide
ANYOP_UG.book Page 397 Friday, February 5, 2016 4:47 PM
Note Changes to the graph templates stored on a Capture Engine take effect immediately. Unlike other functions, no separate steps are required to send changes to the Capture Engine.
Creating a new Capture Engine graph template
To create a new Capture Engine graph template:
1. Click Insert in the Graphs tab of the Capture Engines window. The Create Graph Template dialog appears.
2. Fill in the following fields:
• Enter a Name for the new graph template.
• You may enter a Comment to further describe the graph template.
• Choose the Units (Bytes or Packets). The same units must be used for all parameters in a single graph template.
3. Click Insert. The Select Graph Items dialog appears. Alternatively, you can use the list beside Insert to open the dialog to a particular tab by choosing Protocols, Nodes, or Summary from the drop-down list.
4. Make your changes on one or more of these tabs. (See instructions for each tab below.)
5. Click Delete in the Graph Items list to delete selected statistics items.
Creating a new Capture Engine graph template 397

Chapter 14: Creating Graphs
ANYOP_UG.book Page 398 Friday, February 5, 2016 4:47 PM
6. Click OK to create the new remote graph template and add it to the list in the Graphs tab of the Capture Engines window.
To add a protocol statistics item to the graph template:
1. Open the Protocols tab of the Select Graph Items dialog.
2. Click Insert… to open the Protocol Filter window.
3. Select one of the following methods of defining the protocol by choosing from the drop-down list:
• Generic ProtoSpec is a flat tab of all available ProtoSpec definitions.
• Specific ProtoSpec shows all protocols nested under their physical layer. For more information on these methods of defining protocols, see ProtoSpecs™ on page 344.
Tip Click Description… to present a brief description of any protocol selected in either type of ProtoSpec listing.
4. Select a protocol under your preferred method.
5. Click OK to add it to the list and close the Protocol Filter window.
The protocol item you selected will appear in the list in the Protocols tab of the Select Graph Items dialog.
398 Capture Engine graph templates
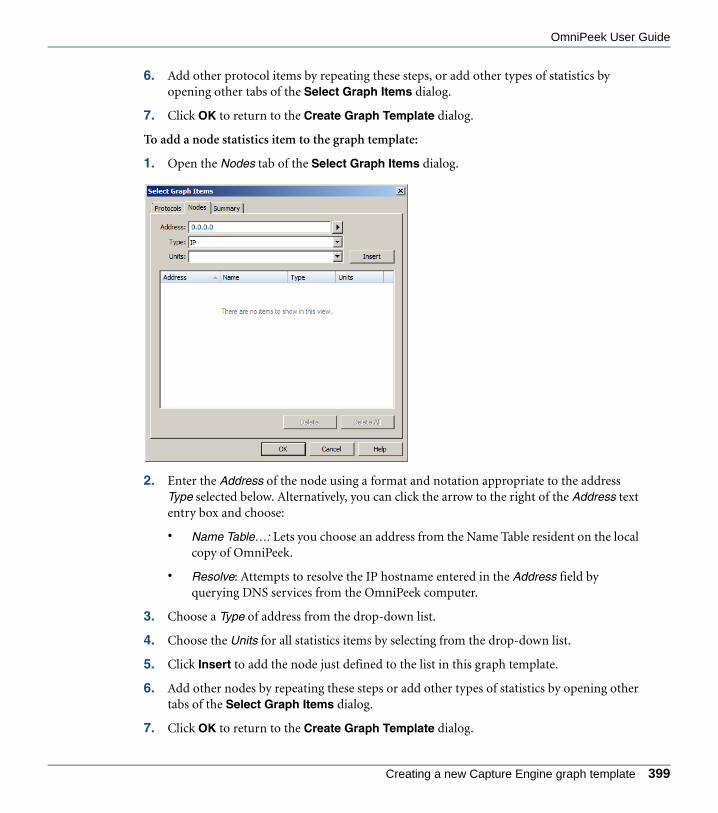
OmniPeek User Guide
ANYOP_UG.book Page 399 Friday, February 5, 2016 4:47 PM
6. Add other protocol items by repeating these steps, or add other types of statistics by opening other tabs of the Select Graph Items dialog.
7. Click OK to return to the Create Graph Template dialog.
To add a node statistics item to the graph template:
1. Open the Nodes tab of the Select Graph Items dialog.
2. Enter the Address of the node using a format and notation appropriate to the address Type selected below. Alternatively, you can click the arrow to the right of the Address text entry box and choose:
• Name Table…: Lets you choose an address from the Name Table resident on the local copy of OmniPeek.
• Resolve: Attempts to resolve the IP hostname entered in the Address field by querying DNS services from the OmniPeek computer.
3. Choose a Type of address from the drop-down list.
4. Choose the Units for all statistics items by selecting from the drop-down list.
5. Click Insert to add the node just defined to the list in this graph template.
6. Add other nodes by repeating these steps or add other types of statistics by opening other tabs of the Select Graph Items dialog.
7. Click OK to return to the Create Graph Template dialog.
Creating a new Capture Engine graph template 399
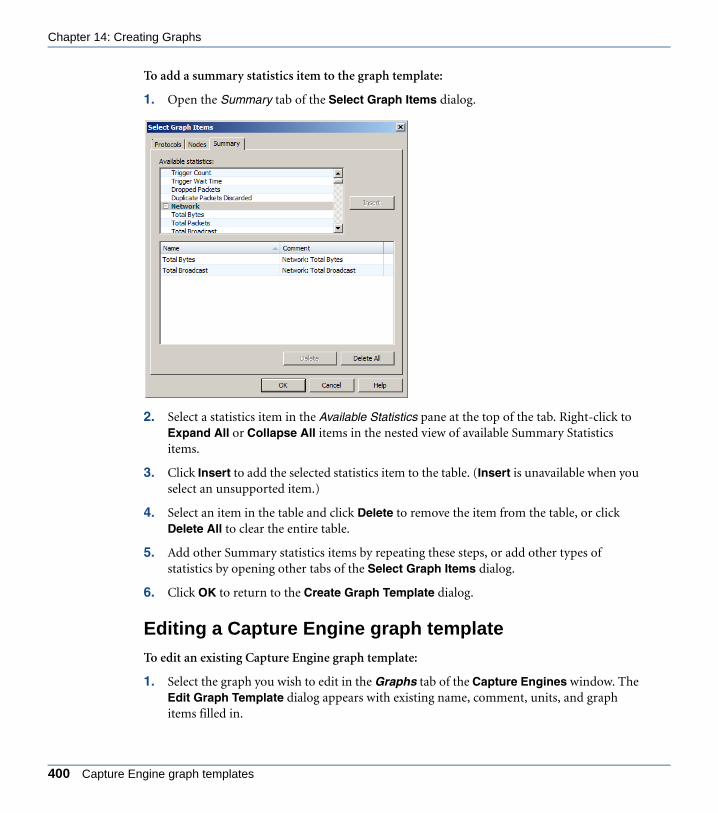
Chapter 14: Creating Graphs
ANYOP_UG.book Page 400 Friday, February 5, 2016 4:47 PM
To add a summary statistics item to the graph template:
1. Open the Summary tab of the Select Graph Items dialog.
2. Select a statistics item in the Available Statistics pane at the top of the tab. Right-click to Expand All or Collapse All items in the nested view of available Summary Statistics items.
3. Click Insert to add the selected statistics item to the table. (Insert is unavailable when you select an unsupported item.)
4. Select an item in the table and click Delete to remove the item from the table, or click Delete All to clear the entire table.
5. Add other Summary statistics items by repeating these steps, or add other types of statistics by opening other tabs of the Select Graph Items dialog.
6. Click OK to return to the Create Graph Template dialog.
Editing a Capture Engine graph template
To edit an existing Capture Engine graph template:
1. Select the graph you wish to edit in the Graphs tab of the Capture Engines window. The Edit Graph Template dialog appears with existing name, comment, units, and graph items filled in.
400 Capture Engine graph templates
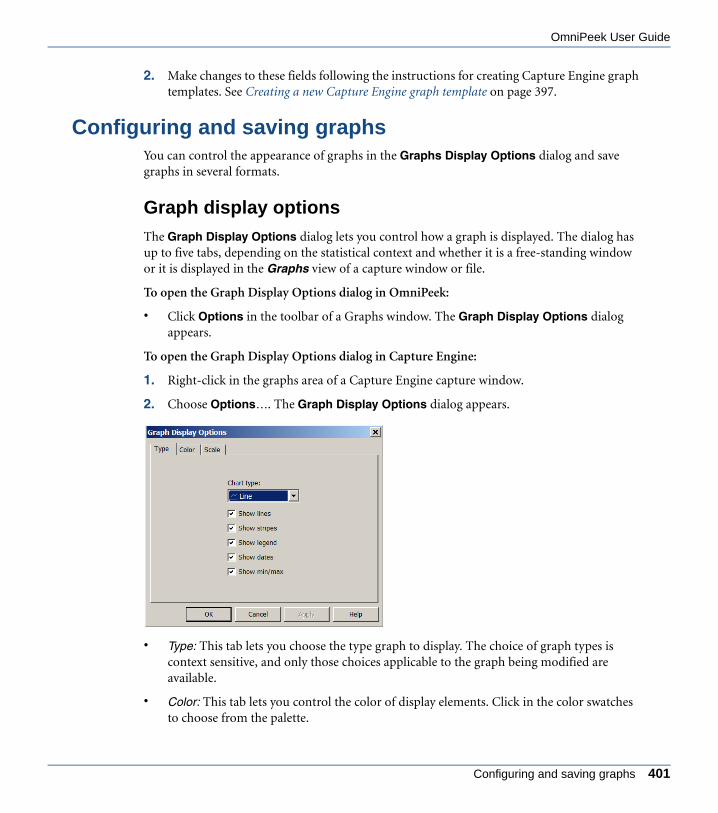
OmniPeek User Guide
ANYOP_UG.book Page 401 Friday, February 5, 2016 4:47 PM
2. Make changes to these fields following the instructions for creating Capture Engine graph templates. See Creating a new Capture Engine graph template on page 397.
Configuring and saving graphsYou can control the appearance of graphs in the Graphs Display Options dialog and save graphs in several formats.
Graph display options
The Graph Display Options dialog lets you control how a graph is displayed. The dialog has up to five tabs, depending on the statistical context and whether it is a free-standing window or it is displayed in the Graphs view of a capture window or file.
To open the Graph Display Options dialog in OmniPeek:
• Click Options in the toolbar of a Graphs window. The Graph Display Options dialog appears.
To open the Graph Display Options dialog in Capture Engine:
1. Right-click in the graphs area of a Capture Engine capture window.
2. Choose Options…. The Graph Display Options dialog appears.
• Type: This tab lets you choose the type graph to display. The choice of graph types is context sensitive, and only those choices applicable to the graph being modified are available.
• Color: This tab lets you control the color of display elements. Click in the color swatches to choose from the palette.
Configuring and saving graphs 401

Chapter 14: Creating Graphs
ANYOP_UG.book Page 402 Friday, February 5, 2016 4:47 PM
• Scale: This tab controls the scale used for the Y-axis (vertical scale) of the graph.
• Misc.: This tab allows you to configure additional settings for your graph.
• Statistics: This tab presents a list of each statistics item displayed in the current graph. The drop-down list at the bottom of the tab presents alternative choices for the Units used to measure the selected statistics item.
Note Click Help on the dialog to learn more about the available options and settings.
To add or delete items from the Statistics tab:
1. Click Insert or Delete a insert or delete a statistics item. Click Move Up or Move Down to move the selected item up or down in the display.
2. Click Insert to open the Add Statistic dialog.
402 Configuring and saving graphs
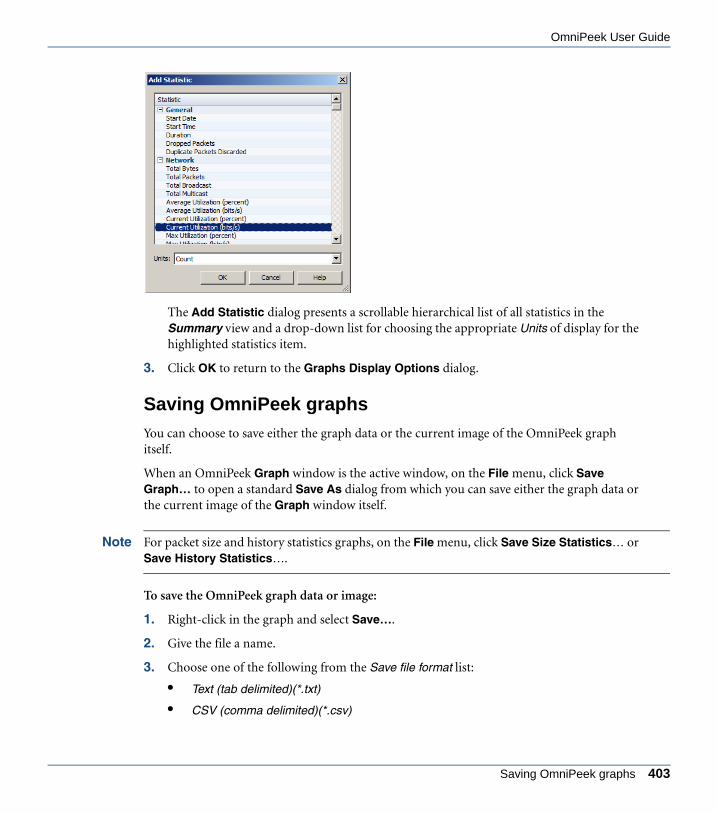
OmniPeek User Guide
ANYOP_UG.book Page 403 Friday, February 5, 2016 4:47 PM
The Add Statistic dialog presents a scrollable hierarchical list of all statistics in the Summary view and a drop-down list for choosing the appropriate Units of display for the highlighted statistics item.
3. Click OK to return to the Graphs Display Options dialog.
Saving OmniPeek graphs
You can choose to save either the graph data or the current image of the OmniPeek graph itself.
When an OmniPeek Graph window is the active window, on the File menu, click Save Graph… to open a standard Save As dialog from which you can save either the graph data or the current image of the Graph window itself.
Note For packet size and history statistics graphs, on the File menu, click Save Size Statistics… or Save History Statistics….
To save the OmniPeek graph data or image:
1. Right-click in the graph and select Save….
2. Give the file a name.
3. Choose one of the following from the Save file format list:
• Text (tab delimited)(*.txt)
• CSV (comma delimited)(*.csv)
Saving OmniPeek graphs 403

Chapter 14: Creating Graphs
ANYOP_UG.book Page 404 Friday, February 5, 2016 4:47 PM
• XML (*.xml)
• Bitmap image (*.bmp)
• PNG image (*.png)
• PDF document (*.pdf)
Saving Capture Engine graphs
To save graph images in Capture Engine, right-click in the graph display and choose Copy. Navigate to a program in which you can paste the graph image.
404 Configuring and saving graphs

C H A P T E R 15
ANYOP_UG.book Page 405 Friday, February 5, 2016 4:47 PM
Setting Alarms and Triggers
In this chapter:
About alarms and triggers . . . . . . . . . . . . . . . . . . . . . . . . . . . . . . . . . . . . . . . . 406
Viewing alarms . . . . . . . . . . . . . . . . . . . . . . . . . . . . . . . . . . . . . . . . . . . . . . . . . 406
Creating and editing alarms . . . . . . . . . . . . . . . . . . . . . . . . . . . . . . . . . . . . . . . 413
Setting triggers . . . . . . . . . . . . . . . . . . . . . . . . . . . . . . . . . . . . . . . . . . . . . . . . . 417
405

Chapter 15: Setting Alarms and Triggers
ANYOP_UG.book Page 406 Friday, February 5, 2016 4:47 PM
About alarms and triggersSetting alarms and triggers can help you uncover many hard-to-find network problems.
OmniPeek alarms query a specified monitor statistics function once per second, testing for user-specified problem and resolution conditions. On matching any of these tests, the alarm function sends a notification of user-specified severity.
Note Capture Engine alarms query a specified parameter in the Summary statistics view of a Capture Engine capture window. See Creating and editing Capture Engine alarms on page 415 and Capture Engine alarm windows on page 409.
Triggers are used to start or stop capture at a specified time or network event. They are very useful for pinpointing the origins of intermittent network problems. For example, you can set a start trigger so that capture begins when a problem occurs. Conversely, you can stop captur-ing when the problem occurs so that you can see exactly what happened just prior to the observed symptom. Alternatively, if you know that problems occur at a particular time, you can set a time event to begin capturing packets during that time. See Setting triggers on page 417.
Viewing alarmsOmniPeek ships with predefined alarms. These are listed along with alarms that have been cre-ated or modified.
Predefined alarms
Two sets of ready-made alarms are included with the program for your convenience, located in the 1033\Alarms directory (default alarms.alm and additional alarms.alm). These alarms cover the frequently encountered network problem conditions. You can load these or any other saved set of alarms using Import in the Alarms window.
OmniPeek alarms
OmniPeek console alarms can be created for items in the Node, Protocol, Summary, Chan-nel, and WLAN monitor statistics windows. You can also create an alarm from the analogous views of a capture window, or from any open statistics Graph window.
Unlike triggers, filters and Analysis Modules, alarms do not query all incoming packets directly. Instead, alarms query statistics functions, looking for the occurrence of the statistical values and their persistence over a specified length of time. This allows multiple alarms to be set without adding packet processing overhead, thus speeding program performance.
406 About alarms and triggers

OmniPeek User Guide
ANYOP_UG.book Page 407 Friday, February 5, 2016 4:47 PM
Important! The Monitor statistics option under the Monitor menu must be enabled in order for alarms to work. Additionally, the monitor adapter must be selected for Monitor statistics to be enabled.
The Alarms window contains all the alarms available in the program. This includes pre-defined alarms as well as any you have created or modified. You can enable, disable, duplicate, modify or delete them, or create a real-time graph of the Monitor statistics parameters they are monitoring.
To view all the Alarms window:
• On the View menu, click Alarms. The Alarms window appears.
The parts of the Alarms window are identified below.
• Notification column: Displays an icon representing the severity of any notification sent by an alarm that is in a triggered state.
Graph
Disable All
Enable AllExport
ImportDelete
DuplicateEdit
Triggered conditions in red
Notifications sent
OmniPeek alarms 407
Chapter 15: Setting Alarms and Triggers
ANYOP_UG.book Page 408 Friday, February 5, 2016 4:47 PM
• Enabled: Shows a check mark if the alarm is enabled. Select the check box to enable or uncheck to disable individual alarms. When an alarm is disabled it is shown in grey.
• Suspect Condition: Shows a shorthand version of the statistics measurements required to trigger this part of the alarm. This value is set in the Make Alarm or Edit Alarm dialogs. Alarm conditions which have been triggered are shown in red.
• Problem Condition: Like the Suspect Condition column, shows a shorthand version of the statistics measurements required to trigger this part of the alarm. This value is set in the Make Alarm or Edit Alarm dialogs. Alarm conditions which have been triggered are shown in red.
• Alarm: Shows the name of the alarm, which by default is the name of the statistic to be monitored. This value is set in the Make Alarm or Edit Alarm dialogs.
Tip Double-click an alarm to open the Edit Alarm dialog with that alarm’s properties ready to edit.
• Edit: Opens the Edit Alarm dialog with the selected alarm’s properties ready to edit.
• Duplicate: Click to make a copy of the highlighted alarm. This is useful for creating a similar alarm.
• Delete: Click to delete the highlighted alarm. This may be useful when you want to delete alarms that are not used in order to make room for new alarms that you create.
• Import: Click to reload an .alm file to the Alarms window. When you load an alarms file, you can choose whether to add to the existing list or replace it with the contents of the new file. The import function can be useful as a backup tool or to help transfer alarms from one machine to another.
• Export: Click to save the whole contents of the Alarms window to an .alm file. The export function can be useful as a backup tool or to help transfer alarms from one machine to another.
• Enable All: Click to select all alarms in window.
• Disable All: Click to disable all alarms at once in window. This may be useful when you want to turn off all the alarms because the alarms are not providing useful information and you do not want this alarm information reported in your data.
• Graph: Click to create a graph showing the current values for the statistics being monitored by any alarm. Graphs created from an alarm will show a red line indicating the value set as the alarm’s Problem Condition and an orange line for its Suspect Condition.
Tip Button functions are also available from a context menu by right-clicking on any alarm.
408 Viewing alarms

OmniPeek User Guide
ANYOP_UG.book Page 409 Friday, February 5, 2016 4:47 PM
Capture Engine alarm windows
Capture Engine alarms can be created, edited, and managed in the following windows:
• Capture Engine alarms tab
• Capture Engine capture options
• Capture Engine capture window alarms
Capture Engine alarms tab
Select the Settings tab, and then point to the Alarms tab for a connected Capture Engine in the Capture Engines window. (See Connecting to a Capture Engine on page 14.) A list of all the alarms available on that Capture Engine is displayed.
The parts of the Capture Engines window Alarms tab are identified below.
• Edit: Click to open the Edit Alarm dialog with the selected alarm’s properties ready to edit.
• Duplicate: Click to make a copy of a selected alarm.
EditDuplicate
RefreshDelete
Capture Engine alarm windows 409
Chapter 15: Setting Alarms and Triggers
ANYOP_UG.book Page 410 Friday, February 5, 2016 4:47 PM
• Delete: Click to delete a selected alarm. This may be useful when you want to delete alarms that are not used in order to make room for new alarms that you create.
• Refresh: Click to update the current view with the latest information stored on a Capture Engine. A refresh may be necessary in instances where other users may be accessing the Capture Engine at the same time, and you want to ensure that the most up-to-date information is being displayed.
• Alarm: Shows the name of the alarm, which by default is the name of the statistic to be monitored. This value is set in the Make Alarm dialog.
• Suspect Condition: Shows a shorthand version of the statistics measurements required to trigger this part of the alarm. This value is set in the Make Alarm dialog. Alarm conditions which have been triggered are shown in red.
• Problem Condition: Like the Suspect Condition column, shows a shorthand version of the statistics measurements required to trigger this part of the alarm. This value is set in the Make Alarm. Alarm conditions which have been triggered are shown in red.
• Created: Lists the date and time alarm was created.
• Modified: Lists the date and time alarm was modified.
Capture Engine capture options
The Alarms options of the Capture Engine Capture Options dialog allows you to selectively enable or disable individual alarms for a particular Capture Engine capture window. From these options, you can also manage existing alarms (Edit, Duplicate, or Delete the selected alarm).
410 Viewing alarms

OmniPeek User Guide
ANYOP_UG.book Page 411 Friday, February 5, 2016 4:47 PM
Check the check box at the left of any listed alarm to enable it. Clear the check box of any alarm you want to disable. This may be useful when you no longer wish to have that particular alarm information included in your data. You can click Disable All in the header to uncheck all alarms.
Note Click Help to learn about the available options and settings.
Capture Engine capture window alarms
The Alarms view of a Capture Engine capture window allows you to see the current state of the alarms enabled for this capture window. You can also enable or disable individual alarms for this capture window.
The parts of the Alarms view are identified below.
Capture Engine alarm windows 411

Chapter 15: Setting Alarms and Triggers
ANYOP_UG.book Page 412 Friday, February 5, 2016 4:47 PM
• Edit: Click to open the Edit Alarm dialog with the selected alarm’s properties ready to edit. You can also double-click an alarm to open the Edit Alarm dialog with that alarm’s properties ready to edit.
• Duplicate: Click to make a copy of a selected alarm.
• Delete: Click to delete a selected alarm.
• Disable All: Click to disable all alarms at once in window.
• Refresh: Click to update the current view with the latest information stored on a Capture Engine.
• Click here to send changes: Click to send changes to the Capture Engine. Changes to the Make Alarm dialog will not take effect on the Capture Engine until this is clicked.
• Notification column: Displays an icon representing the severity of any notification sent by an alarm that is in a triggered state.
RefreshDisable All
Duplicate
Edit
Triggered conditions shown in redNotification column
Click here to send changes
Delete
412 Viewing alarms

OmniPeek User Guide
ANYOP_UG.book Page 413 Friday, February 5, 2016 4:47 PM
• Enabled: Shows a check mark if the alarm is enabled. Select the check box to enable or uncheck to disable individual alarms. When an alarm is disabled it is shown in grey.
• Suspect Condition: Shows a shorthand version of the statistics measurements required to trigger this part of the alarm. This value is set in the Make Alarm dialog. Alarm conditions which have been triggered are shown in red.
• Problem Condition: Like the Suspect Condition column, shows a shorthand version of the statistics measurements required to trigger this part of the alarm. This value is set in the Make Alarm. Alarm conditions which have been triggered are shown in red.
• Alarm: Shows the name of the alarm, which by default is the name of the statistic to be monitored. This value is set in the Make Alarm dialog.
• Created: Lists the date and time alarm was created.
• Modified: Lists the date and time alarm was modified.
Tip You can change alarm settings while a remote capture is under way. Select the remote capture in the Capture Engine Capture tab and open the Capture Options dialog. You must click Click here to send changes to the Capture Engine to set the alarm in the Capture Engine capture window.
Creating and editing alarmsTo create a new alarm:
1. Open one of the statistics windows, statistics views, or statistics graphs offering the Make Alarm function.
2. Select the item to be monitored.
3. Click Make Alarm in the header, or right-click the item and choose Make Alarm…. The Make Alarm dialog appears.
Creating and editing alarms 413
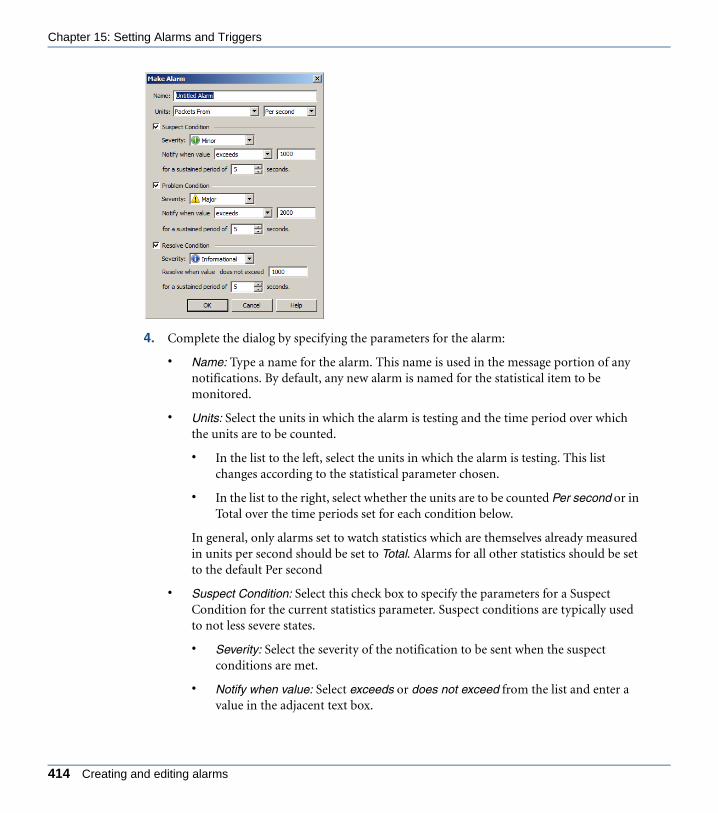
Chapter 15: Setting Alarms and Triggers
ANYOP_UG.book Page 414 Friday, February 5, 2016 4:47 PM
4. Complete the dialog by specifying the parameters for the alarm:
• Name: Type a name for the alarm. This name is used in the message portion of any notifications. By default, any new alarm is named for the statistical item to be monitored.
• Units: Select the units in which the alarm is testing and the time period over which the units are to be counted.
• In the list to the left, select the units in which the alarm is testing. This list changes according to the statistical parameter chosen.
• In the list to the right, select whether the units are to be counted Per second or in Total over the time periods set for each condition below.
In general, only alarms set to watch statistics which are themselves already measured in units per second should be set to Total. Alarms for all other statistics should be set to the default Per second
• Suspect Condition: Select this check box to specify the parameters for a Suspect Condition for the current statistics parameter. Suspect conditions are typically used to not less severe states.
• Severity: Select the severity of the notification to be sent when the suspect conditions are met.
• Notify when value: Select exceeds or does not exceed from the list and enter a value in the adjacent text box.
414 Creating and editing alarms

OmniPeek User Guide
ANYOP_UG.book Page 415 Friday, February 5, 2016 4:47 PM
• For a sustained period of ____ seconds: Type or enter the number of seconds the suspect condition has to be detected before an alarm is sent.
• Problem Condition: Select this check box to specify the parameters for a Problem Condition for the current statistics item. Problem conditions are typically used to note more severe states.
• Severity: Select the severity of the notification to be sent when the problem conditions are met.
• Notify when value: Select exceeds or does not exceed from the list and enter a value in the adjacent text box.
• For a sustained period of ____ seconds: Type or enter the number of seconds the problem condition has to be detected before an alarm is sent.
• Resolve Condition: Select this check box to specify the parameters for when either the Suspect Condition or Problem Condition has been “stood down” or resolved.
• Severity: Select the severity of the notification to be sent when the resolve conditions are met.
• Resolve when value does not exceed: Enter a value.
• For a sustained period of _____ seconds: Type or enter the number of seconds the resolve condition has to be detected before an alarm is sent.
Tip A single alarm can test for two distinct levels: Suspect Condition and Problem Condition. Both sets of conditions share the same Resolve Condition. This allows you to create a yellow alert / red alert / stand down for the same statistics parameter in a single alarm. Alternatively, you can specify only the Suspect Condition or only the Problem Condition for an alarm.
5. Click OK to create and enable the alarm.
Creating and editing Capture Engine alarms
Remote alarms watch a value in the Summary statistics view of an individual Capture Engine capture window.
To create a new remote alarm:
1. Open the Summary, Nodes, or Protocols view of a Capture Engine capture window.
2. Select the item to be monitored.
3. Click Make Alarm in the header, or right-click the item and click Make Alarm…. The Make Alarm dialog appears.
Creating and editing Capture Engine alarms 415
Chapter 15: Setting Alarms and Triggers
ANYOP_UG.book Page 416 Friday, February 5, 2016 4:47 PM
4. Complete the dialog by specifying the parameters for the alarm:
• Name: Type a name for the alarm. This name is used in the message portion of any notifications. By default, any new alarm is named for the statistical item to be monitored.
• Units: Select the units in which the alarm is testing and the time period over which the units are to be counted.
• In the list to the left, select the units in which the alarm is testing. This list changes according to the statistical parameter chosen.
• In the list to the right, select whether the units are to be counted Per second or in Total over the time periods set for each condition below.
In general, only alarms set to watch statistics which are themselves already measured in units per second should be set to Total. Alarms for all other statistics should be set to the default Per second
• Suspect Condition: Select this check box to specify the parameters for a Suspect Condition for the current statistics parameter. Suspect conditions are typically used to not less severe states.
• Severity: Select the severity of the notification to be sent when the suspect conditions are met.
• Notify when value: Select exceeds or does not exceed from the list and enter a value in the adjacent text box.
• For a sustained period of ____ seconds: Type or enter the number of seconds the suspect condition has to be detected before an alarm is sent.
• Problem Condition: Select this check box to specify the parameters for a Problem Condition for the current statistics item. Problem conditions are typically used to note more severe states.
• Severity: Select the severity of the notification to be sent when the problem conditions are met.
• Notify when value: Select exceeds or does not exceed from the list and enter a value in the adjacent text box.
• For a sustained period of ____ seconds: Type or enter the number of seconds the problem condition has to be detected before an alarm is sent.
• Resolve Condition: Select this check box to specify the parameters for when either the Suspect Condition or Problem Condition has been “stood down” or resolved.
416 Creating and editing alarms

OmniPeek User Guide
ANYOP_UG.book Page 417 Friday, February 5, 2016 4:47 PM
• Severity: Select the severity of the notification to be sent when the resolve conditions are met.
• Resolve when value does not exceed: Enter a value.
• For a sustained period of _____ seconds: Type or enter the number of seconds the resolve condition has to be detected before an alarm is sent.
Tip A single alarm can test for two distinct levels: Suspect Condition and Problem Condition. Both sets of conditions share the same Resolve Condition. This allows you to create a yellow alert / red alert / stand down for the same statistics parameter in a single alarm. Alternatively, you can specify only the Suspect Condition or only the Problem Condition for an alarm.
5. Click OK to create the alarm. The alarm is automatically added to all lists of that Capture Engine.
Tip A tripped alarm is displayed as an icon in the Captures tab of the Capture Engines window. The icon matches the severity of the alarm state (i.e., Suspect, Problem, Resolve).
Setting triggersTriggers are used to start or stop captures at a specified time or network event. They are very useful for pinpointing the origins of intermittent network problems. For example, you can set a start trigger so that the capture begins when a problem occurs. Conversely, you can stop cap-turing when the problem occurs so that you can see exactly what happened just prior to the observed symptom. Alternatively, if you know that problems occur at a particular time, you can set a time event to begin capturing packets during that time. Start and stop triggers can help you uncover many hard-to-find network problems.
You can create a start trigger, a stop trigger, or both a start and stop trigger for each capture window that you have open.
Note To set triggers on a Capture Engine capture window, see Setting start and stop triggers on a Capture Engine on page 420.
To set start and stop triggers:
1. On the Capture menu, click Capture Options…. The Capture Options dialog appears.
2. Select the Triggers options.
Setting triggers 417
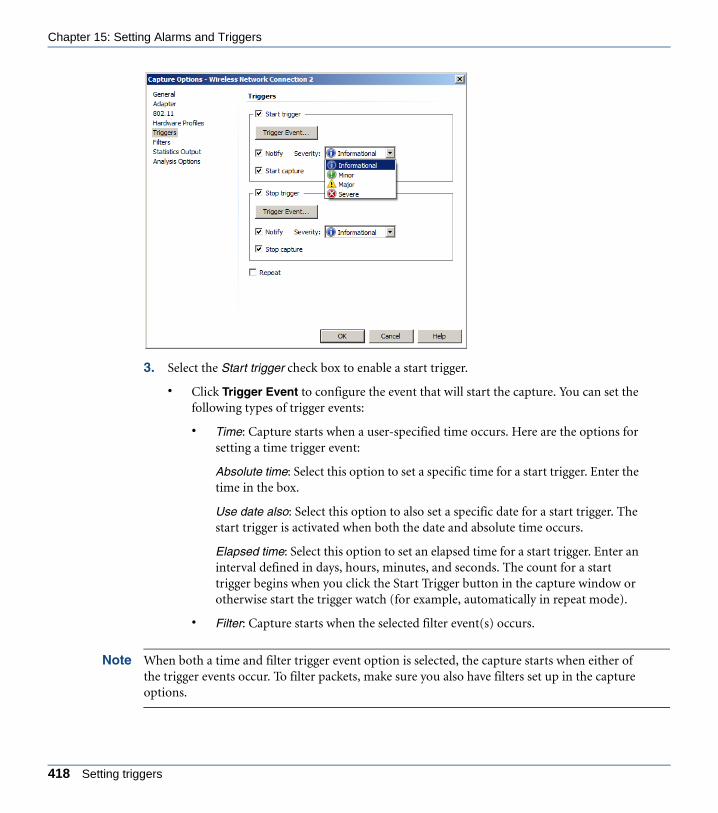
Chapter 15: Setting Alarms and Triggers
ANYOP_UG.book Page 418 Friday, February 5, 2016 4:47 PM
3. Select the Start trigger check box to enable a start trigger.
• Click Trigger Event to configure the event that will start the capture. You can set the following types of trigger events:
• Time: Capture starts when a user-specified time occurs. Here are the options for setting a time trigger event:
Absolute time: Select this option to set a specific time for a start trigger. Enter the time in the box.
Use date also: Select this option to also set a specific date for a start trigger. The start trigger is activated when both the date and absolute time occurs.
Elapsed time: Select this option to set an elapsed time for a start trigger. Enter an interval defined in days, hours, minutes, and seconds. The count for a start trigger begins when you click the Start Trigger button in the capture window or otherwise start the trigger watch (for example, automatically in repeat mode).
• Filter: Capture starts when the selected filter event(s) occurs.
Note When both a time and filter trigger event option is selected, the capture starts when either of the trigger events occur. To filter packets, make sure you also have filters set up in the capture options.
418 Setting triggers

OmniPeek User Guide
ANYOP_UG.book Page 419 Friday, February 5, 2016 4:47 PM
• Bytes captured: Capture starts when the specified number of bytes are allowed to pass through the capture buffer.
• Notify: Select this option to send a notification of the selected severity when the start trigger is activated. A notification is a message sent to announce and describe the occurrence of specified events on the network.
• Start capture: Select this option to start a capture when the start trigger is activated.
4. Select the Stop trigger check box to enable a stop trigger.
Note If you do not select the Stop trigger check box, packet capturing started by a start trigger continues indefinitely until it is aborted manually by the user.
• Click Trigger Event to configure the event that will stop (or abort) the capture. You can set any combination of the following types of trigger events:
• Time: Capture stops when a user-specified time occurs. Here are the options for setting a time trigger event:
Absolute: Select this option to set a specific time for a stop trigger. Enter the time in the box.
Use date also: Select this option to also set a specific date for a stop trigger. The stop trigger is activated when both the date and absolute time occurs.
Elapsed time: Select this option to set an elapsed time for a stop trigger. Enter an interval defined in days, hours, minutes, and seconds. The count for a stop trigger begins when capture commences.
• Filter: Capture stops when the selected filter event(s) occurs.
• Bytes captured: Capture stops when the specified number of bytes are allowed to pass through the capture buffer.
• Notify: Select this option to send a notification of the selected severity when the stop trigger is activated. A notification is a message sent to announce and describe the occurrence of specified events on the network.
• Stop capture: Select this option to stop a capture when the stop trigger is activated.
5. Select the Repeat mode check box if you want to reset the start trigger each time the stop trigger is activated. This option is only available when both the Start trigger and Stop trigger check boxes are selected.
Setting triggers 419

Chapter 15: Setting Alarms and Triggers
ANYOP_UG.book Page 420 Friday, February 5, 2016 4:47 PM
Note Repeat mode allows you to capture multiple occurrences of the same event(s) with a single capture window.
6. Click OK to close the Capture Options dialog and return to the capture window.
If a start trigger was defined, Start Capture in the capture window turns into Start Trigger (if no start trigger was defined, Start Capture does not change).
Tip The status bar at the bottom left of the capture window provides information about the current state of the capture window.
7. Click Start Trigger to turn on the triggers. Start Trigger turns into the Abort Trigger.
Important! The actual capturing of packets does not begin until the start trigger event defined above occurs. Once packet capture begins, Abort Trigger turns into Stop Capture.
Setting start and stop triggers on a Capture Engine
You can create a start trigger, a stop trigger, or both a start and stop trigger for each new Cap-ture Engine capture window that you create.
Note You cannot set start and stop triggers on an existing Capture Engine capture that was not created with either a start or stop trigger.
To set start and stop triggers:
1. Open the Capture Engines window and connect to a Capture Engine.
2. Click the Captures tab of the Capture Engine.
3. Click Insert in the right pane to create a new capture window. The Capture Options dialog appears.
4. Select the Triggers options.
420 Setting triggers
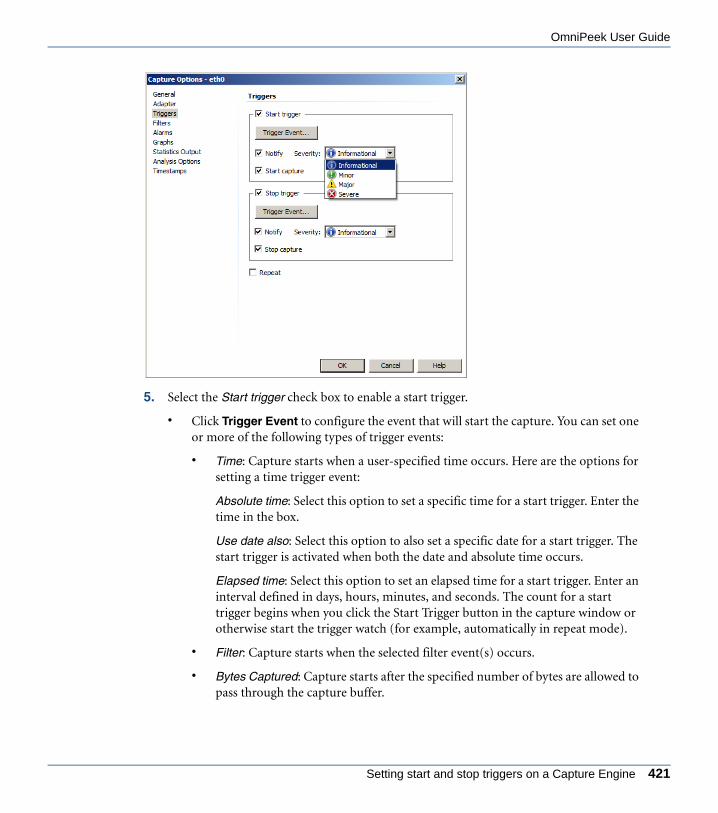
OmniPeek User Guide
ANYOP_UG.book Page 421 Friday, February 5, 2016 4:47 PM
5. Select the Start trigger check box to enable a start trigger.
• Click Trigger Event to configure the event that will start the capture. You can set one or more of the following types of trigger events:
• Time: Capture starts when a user-specified time occurs. Here are the options for setting a time trigger event:
Absolute time: Select this option to set a specific time for a start trigger. Enter the time in the box.
Use date also: Select this option to also set a specific date for a start trigger. The start trigger is activated when both the date and absolute time occurs.
Elapsed time: Select this option to set an elapsed time for a start trigger. Enter an interval defined in days, hours, minutes, and seconds. The count for a start trigger begins when you click the Start Trigger button in the capture window or otherwise start the trigger watch (for example, automatically in repeat mode).
• Filter: Capture starts when the selected filter event(s) occurs.
• Bytes Captured: Capture starts after the specified number of bytes are allowed to pass through the capture buffer.
Setting start and stop triggers on a Capture Engine 421

Chapter 15: Setting Alarms and Triggers
ANYOP_UG.book Page 422 Friday, February 5, 2016 4:47 PM
Note When one or more start trigger event options are selected, capture starts when any of the trigger events occur.
• Select the Notify check box to send a notification of the selected severity when the start trigger event occurs. A notification is a message sent to announce and describe the occurrence of specified events on the network.
• Select the Start capture check box to start a capture when the start trigger event occurs.
6. Select the Stop trigger check box to enable a stop trigger.
Note If you do not select the Stop trigger check box, packet capturing started by a start trigger continues indefinitely until it is aborted manually by the user.
• Click Trigger Event to configure the event that will stop (or abort) the capture. You can set one or more of the following types of trigger events:
• Time: Capture stops when a user-specified time occurs. Here are the options for setting a time trigger event:
Absolute time: Select this option to set a specific time for a stop trigger. Enter the time in the box.
Use date also: Select this option to also set a specific date for a stop trigger. The stop trigger is activated when both the date and absolute time occurs.
Elapsed time: Select this option to set an elapsed time for a stop trigger. Enter an interval defined in days, hours, minutes, and seconds. The count for a stop trigger begins when capture commences.
• Filter: Capture stops when the selected filter event(s) occurs.
• Bytes Captured: Capture stops after the specified number of bytes are captured into the capture buffer.
• Select the Notify check box to send a notification of the selected severity when the stop trigger event occurs. A notification is a message sent to announce and describe the occurrence of specified events on the network.
• Select the Stop capture check box to stop a capture when the stop trigger event occurs.
422 Setting triggers

OmniPeek User Guide
ANYOP_UG.book Page 423 Friday, February 5, 2016 4:47 PM
7. Select the Repeat mode check box if you want to reset the start trigger each time the stop trigger is activated. This option is only available when both the Start trigger and Stop trigger check boxes are selected.
Note Repeat mode allows you to capture multiple occurrences of the same event(s) with a single capture window.
8. Click OK to close the Capture Options dialog.
If a start trigger was defined, Start Capture in the capture window turns into Start Trigger (if no start trigger was defined, Start Capture does not change).
Tip The status bar at the bottom left of the capture window provides information about the current state of the capture window.
9. Click Start Trigger to turn on the triggers. Start Trigger turns into the Abort Trigger.
Important! If a start trigger was defined, packet capture does not begin until the start trigger event defined above occurs. Once packet capture begins, Abort Trigger turns into Stop Capture.
Setting start and stop triggers on a Capture Engine 423

Chapter 15: Setting Alarms and Triggers
ANYOP_UG.book Page 424 Friday, February 5, 2016 4:47 PM
424 Setting triggers

C H A P T E R 16
ANYOP_UG.book Page 425 Friday, February 5, 2016 4:47 PM
Sending Notifications
In this chapter:
About notifications . . . . . . . . . . . . . . . . . . . . . . . . . . . . . . . . . . . . . . . . . . . . . . 426
Configuring notifications . . . . . . . . . . . . . . . . . . . . . . . . . . . . . . . . . . . . . . . . . . 426
Creating a notification action . . . . . . . . . . . . . . . . . . . . . . . . . . . . . . . . . . . . . . 428
425

Chapter 16: Sending Notifications
ANYOP_UG.book Page 426 Friday, February 5, 2016 4:47 PM
About notificationsNotifications are messages sent from triggers, alarms, Analysis Modules, and other parts of the program to announce and describe the occurrence of specified events on the network.
Each notification is assigned a level of severity that indicates the importance of the notifica-tion. Whenever a notification is sent, the assigned level of severity will trigger any actions that are configured to start when the level of severity is generated by the program.
There are four levels of severity:
• Informational
• Minor
• Major
• Severe
The level of severity is set by the function generating the notification. For triggers, alarms and some Analysis Modules, the user can set the level of severity directly. Other Analysis Modules are coded to always assign a certain severity to notifications of a particular event. Analysis Modules can also be limited to a capped range of severities, overriding their internal coding.
For information about how functions generate notifications, see Setting triggers on page 417 and Chapter 19, Applying Analysis Modules.
Configuring notificationsTo configure notifications:
1. On the Tools menu, click Options…. The Options dialog appears.
Note To configure notifications from a Capture Engine, open the Capture Engines window and connect to a Capture Engine.
2. Click the Notifications options. (For a Capture Engine, select the Notifications tab.)
426 About notifications

OmniPeek User Guide
ANYOP_UG.book Page 427 Friday, February 5, 2016 4:47 PM
Any actions currently defined are displayed. By default, the Log action is the only action defined when no other actions have been created.
The buttons in the Notification views are as follows:
• Insert: Click to create a new action.
• Edit: Click to edit the selected action. (Double-clicking an Action also lets you edit the selected action.)
• Duplicate: Click to duplicate the selected action.
Configuring notifications 427

Chapter 16: Sending Notifications
ANYOP_UG.book Page 428 Friday, February 5, 2016 4:47 PM
• Delete: Click to delete the selected action.
• Test (OmniPeek console only): Click to edit the long and short messages of a sample notification, set the severity of the test notification, then test the notification settings for that severity level.
• Refresh (Capture Engine only): Click to refresh the view.
Note Click Insert to define a new action. See Creating a notification action on page 428.
3. For each action, select the level of severity check box that will start the action whenever the level of severity is generated by the program.
The four levels of severity are:
• Informational
• Minor
• Major
• Severe
4. Click OK.
Creating a notification actionTo create a notification action in OmniPeek:
1. On the Tools menu, click Options…. The Options dialog appears.
Note To create notifications from a Capture Engine, open the Capture Engines window and connect to a Capture Engine.
2. Click the Notifications options. (For a Capture Engine, select the Notifications tab.)
3. Click Insert. The Insert Action dialog appears.
428 Creating a notification action

OmniPeek User Guide
ANYOP_UG.book Page 429 Friday, February 5, 2016 4:47 PM
4. In the Action box, type a name for the new action.
5. In the Type list, select the type of action. You can select from the following:
• Log: This action sends the notification to the log file.
• Email: This action sends notifications as email messages. The text of the notification is included in the body of the message. When selected, you will need to configure the following:
• Recipient: Type the email address of the recipient.
• Sender: Type the email address of the sender.
• SMTP Server: Type the SMTP server for the sender email.
• Port: Type the port for the sender email.
• Send Test Email: Click to send a test email.
• Execute: This action lets you run a program that you specify. When selected, you will need to configure the following:
• Command: Type or browse to the location of the executable file.
• Argument: Enter any arguments for the command.
• Initial dir.: Type or browse to the location of the initial directory.
• Text Log: (Capture Engine only) This action lets you write the notification to a text file stored in the Capture Engine data folder. The data folder is configured in the General view of the Capture Engine Configuration Wizard. (See the Capture Engine for OmniPeek Getting Started Guide for details.)
• Sound: (OmniPeek only) This action lets you play an audio *.wav file. When selected, you will need to configure the following:
Creating a notification action 429

Chapter 16: Sending Notifications
ANYOP_UG.book Page 430 Friday, February 5, 2016 4:47 PM
• Play Sound: Type or browse to the *.wav file.
• Test Sound: Click to play the *.wav file.
• Syslog: This action sends a syslog message. The text of the notification is included in the body of the message. When selected, you will need to configure the following:
• Recipient: Type the IP address of the syslog server.
• SNMP Trap: This action sends notifications as SNMP trap messages. The text of the notification is included in the body of the message. When selected, you will need to configure the following:
• Recipient: Type the e-mail address of the SNMP server.
• Community: Type the community for the recipient.
Note The MIBs directory contains the MIB file that supports the SNMP Trap action in notifications. In a typical default installation, this directory is at C:\Program Files\Savvius\OmniPeek\MIBs.
Note For Capture Engines, the source for a notification must also be specified. See Sources of Capture Engine notifications on page 430.
6. Click OK. The new action is added to the Notifications view.
Note For Capture Engines, you must also click the yellow bar above the list of actions in order to send the changes to the Capture Engine.
7. For the new action, select the level of severity check box that will start the action whenever the level of severity is generated by the program. See Configuring notifications on page 426.
8. Click OK.
Sources of Capture Engine notifications
In a Capture Engine, you must specify the source of notifications to which an action will respond. The Edit Action dialog lets you select the source for an action.
When a Source is selected, the action will be used to send (or respond to) notifications from that source, but only when the notification also has a level of severity that matches one of the levels of severity enabled for the Action in the Notifications view of the Capture Engines window. For example, you can create an Action that responds only to notifications that have Alarms as their source. If you then enable this Action only for notifications with a severity level
430 Creating a notification action
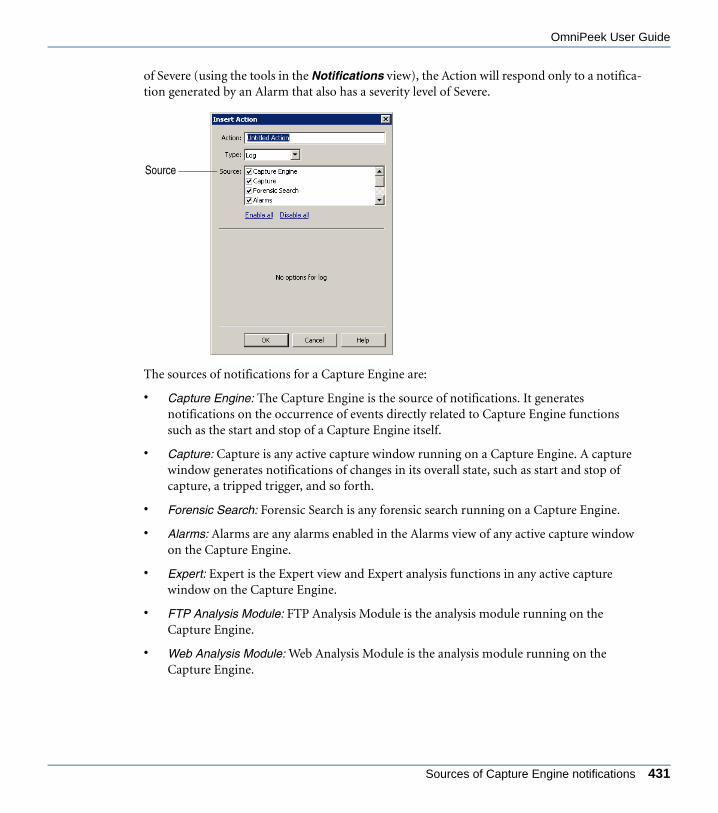
OmniPeek User Guide
ANYOP_UG.book Page 431 Friday, February 5, 2016 4:47 PM
of Severe (using the tools in the Notifications view), the Action will respond only to a notifica-tion generated by an Alarm that also has a severity level of Severe.
The sources of notifications for a Capture Engine are:
• Capture Engine: The Capture Engine is the source of notifications. It generates notifications on the occurrence of events directly related to Capture Engine functions such as the start and stop of a Capture Engine itself.
• Capture: Capture is any active capture window running on a Capture Engine. A capture window generates notifications of changes in its overall state, such as start and stop of capture, a tripped trigger, and so forth.
• Forensic Search: Forensic Search is any forensic search running on a Capture Engine.
• Alarms: Alarms are any alarms enabled in the Alarms view of any active capture window on the Capture Engine.
• Expert: Expert is the Expert view and Expert analysis functions in any active capture window on the Capture Engine.
• FTP Analysis Module: FTP Analysis Module is the analysis module running on the Capture Engine.
• Web Analysis Module: Web Analysis Module is the analysis module running on the Capture Engine.
Source
Sources of Capture Engine notifications 431

Chapter 16: Sending Notifications
ANYOP_UG.book Page 432 Friday, February 5, 2016 4:47 PM
432 Creating a notification action

C H A P T E R 17
ANYOP_UG.book Page 433 Friday, February 5, 2016 4:47 PM
Using the Name Table
In this chapter:
About the name table . . . . . . . . . . . . . . . . . . . . . . . . . . . . . . . . . . . . . . . . . . . . 434
Adding entries to the name table . . . . . . . . . . . . . . . . . . . . . . . . . . . . . . . . . . . 434
OmniPeek name resolution . . . . . . . . . . . . . . . . . . . . . . . . . . . . . . . . . . . . . . . 438
Loading and saving name table data . . . . . . . . . . . . . . . . . . . . . . . . . . . . . . . . 440
Using the Capture Engine trust table . . . . . . . . . . . . . . . . . . . . . . . . . . . . . . . . 442
433
Chapter 17: Using the Name Table
ANYOP_UG.book Page 434 Friday, February 5, 2016 4:47 PM
About the name table The OmniPeek Name Table is used for constructing and maintaining symbolic names for net-work devices and processes.
When you first start capturing packets, devices on your network will typically be identified by their logical or physical addresses. The Name Table lets you assign symbolic names to addresses, ports and protocols. When you are collecting monitor statistics, OmniPeek scans all traffic for logical and symbolic names in the contents of passing packets. You can control how and whether these passively discovered names are added to the Name Table.
The Name Table interacts with open Capture Engine capture windows in order to perform name resolution functions. See OmniPeek name resolution on page 438.
You can also use the Name Table and the Capture Engine Trust Table to set a trust value for any physical address in the Name Table. See Using the Capture Engine trust table on page 442.
Adding entries to the name tableOmniPeek ships with a default Name Table. There are several ways to create new Name Table entries for your network devices. You can:
• Add names manually with the Insert dialog.
• Highlight items in other views and click Insert Into Name Table.
• Highlight one or more items in other views and click Resolve Names.
• Select Enable passive name resolution in the Name Resolution view of the Options dialog.
• Use Import in the Name Table window to load previously saved versions of the Name Table.
Note To display packets and statistics in the program, on the View menu, point to Display Format, and then click Name Table Entry.
The name table window
To open the Name Table, on the View menu, click Name Table.
434 About the name table

OmniPeek User Guide
ANYOP_UG.book Page 435 Friday, February 5, 2016 4:47 PM
• Name: The symbolic name you assigned.
• Type: Type of address, port, or protocol.
• Address, Protocol, Port: The value that allows OmniPeek to identify the address, port, or protocol. For example, an address of the Type IP will show a dotted decimal number in the Address column and a protocol of the Type LSAP will show the one-byte hexadecimal discriminator in the Protocol column.
The Address tab also has columns for Node Type and Trust, which are configured in the Edit Name dialog. See Adding and editing name table entries manually on page 436.
Tip Click the column headings to sort entries in the table.
• Insert: Click to open the Insert Name dialog.
• Edit: Click to open the Edit Name dialog with the details of the selected entry filled in and ready to edit. When a Group is highlighted, it brings up the Edit Group dialog with the name of the highlighted Group ready to edit.
• Delete: Click to delete the selected entry.
Insert
Edit
Delete
Add Group
ImportExport
Make Filter
The name table window 435

Chapter 17: Using the Name Table
ANYOP_UG.book Page 436 Friday, February 5, 2016 4:47 PM
• Add Group: Click to open the Add Group dialog in which you can create a new group folder. You can drag entries into and out of group folders.
• Import: Click to open a dialog in which you can specify the Names file to load into the Name Table.
• Export: Click to open a Save dialog to save the contents of the Name Table.
• Make Filter: Click to open the Insert Filter dialog with an untitled filter matching the information in the selected Name Table entry.
Adding and editing name table entries manually
To enter the name table entry manually:
1. On the View menu, click Name Table.
2. Do one of the following:
• Click Insert. The Insert Name dialog appears.
• Select the entry you wish to edit and click Edit. The Edit Name dialog appears.
3. Complete the dialog. The Node type options let you choose an icon representing this entry, including Workstation, Server, Router, Switch, Repeater, Printer, or Access Point.
Note Click Help on this dialog to learn more about available options and settings.
4. Choose a Trust value for this entry. See Trusted, known, and unknown nodes on page 437.
5. Click OK to add the entry to the Name Table.
Note Symbolic names assigned to protocols in the Name Table will not override names provided by ProtoSpecs. See ProtoSpecs™ on page 344.
436 Adding entries to the name table

OmniPeek User Guide
ANYOP_UG.book Page 437 Friday, February 5, 2016 4:47 PM
Adding names from other windows
You can add to the Name Table or change name assignments for addresses by choosing device and protocol entries from other displays in the program. Any window that can show individ-ual devices can be used as a source of names for the Name Table. This includes the following windows and views:
• Node Statistics window for monitor statistics
• Packets, Expert, Nodes, WLAN, and Peer Map views in capture windows
• Packet Decode windows
To add information from selected items to the Name Table:
1. Select an item in one of the appropriate views to be entered into the Name Table.
2. Right-click and choose Insert Into Name Table…. This opens a dialog (titled to match the appropriate view) with edit fields already filled in to match your selection.
3. Follow the instructions for making manual entries and edits to the Name Table. See Adding and editing name table entries manually on page 436.
Note You can only apply the Insert Into Name Table command to one entry at a time. If multiple entries are selected, each one will be brought up in a separate dialog.
Trusted, known, and unknown nodes
You can use the Name Table to set Trust attributes for any physical address in the Name Table. This is particularly useful for monitoring security in 802.11 WLAN environments.
• Unknown: This is the default value, assigned to any node that is automatically added to the Name Table.
• Known: This is an intermediate value, letting you identify familiar sources that are beyond your own control, such as an access point in a neighboring office.
• Trusted: This is the value you can assign to the devices on your own network.
There are two ways to set Trust values:
• You can set these values in the same way as any other Name Table attributes. See Adding and editing name table entries manually on page 436.
• You can right-click any node in the WLAN Statistics window or the WLAN view of a capture window and choose a Trust value.
Adding names from other windows 437

Chapter 17: Using the Name Table
ANYOP_UG.book Page 438 Friday, February 5, 2016 4:47 PM
If the node is already in the Name Table, its Trust value will be updated. If the node is not yet in the Name Table, the program will silently add the node, using its physical address as the Name for the new entry. If the node is identified in the WLAN view as an access point, the Node type of the new Name Table entry will also be set to Access Point.
Tip You can set alarms and send notifications based on Trust. The Expert view can also use Trust information. Setting the Trust attributes for your network makes intrusion detection fast, accurate, and easy.
OmniPeek name resolutionOmniPeek can actively resolve IP device or host names on your network if DNS is reachable. Once names are resolved, they can be added automatically to your Name Table, where the names will be available to replace logical address entries for devices in any displays.
To resolve names manually:
1. Select the nodes or packets whose addresses you wish to resolve. You can do this directly in any window that shows the individual nodes.
2. Click Resolve Names in the header of the window in which you’ve selected the items, or right-click and click Resolve Names….
OmniPeek will use your network to find the names of the IP addresses of the selected packets. You must have an adapter available for network services, and DNS must be reachable over the network. Once names have been resolved, you will see name entries substituted for logical addresses in all displays.
Tip You can also look up the address of an IP name by clicking Resolve Name in the Edit Name dialog.
Important! Name resolution requires an active network connection. 802.11 WLAN adapters cannot be used for network services when they are in use for monitoring or capture. The Savvius Gigabit cards can never be used for network services. For more information, see Supported adapters on page 6.
438 OmniPeek name resolution

OmniPeek User Guide
ANYOP_UG.book Page 439 Friday, February 5, 2016 4:47 PM
Configuring name resolution
Name and address resolution is controlled through the Name Resolution options of the Options dialog. To open the dialog, on the Tools menu, click Options…, and then click Name Resolution.
The Name Resolution options are identified below.
• Name replacement options: Use the radio buttons in this section to determine how the program will use new information about names and addresses to automatically update the Name Table.
Note Click Help to learn more about the available options and settings.
• Assign names to physical addresses: Select this check box to automatically add names for the physical addresses found in the same packet as the logical addresses being resolved. You may choose to add a short text string to the end of all names assigned by this function.
Before resolving names and automatically assigning names to physical addresses, it is recommended that you manually add names for the physical address of intermediate link devices such as routers.
• Append text: Select this option and enter any text to append to the end of all names assigned by this function.
Configuring name resolution 439

Chapter 17: Using the Name Table
ANYOP_UG.book Page 440 Friday, February 5, 2016 4:47 PM
• Enable passive name resolution: When this check box is selected and Monitor Statistics are enabled, the program examines all incoming packets found on the active monitor adapter for symbolic names it can add to the Name Table. It adds these names according to the rules you set down in the Name replacement options section. You can:
• Accept the default group Passively Resolved Names.
• Choose another Name Table group as the location in which to put all name and address pairs discovered by passive name resolution. This is particularly useful when much of the traffic from outside the local network uses symbolic names, as Web traffic does.
• Remove unused names after…days: Select this option to keep the Name Table from becoming overgrown with unnecessary data.
Tip In some environments, large numbers of new names may be discovered each day through passive name resolution. If a name is encountered before its time is up, the clock for this item is restarted. In this way, you can ensure that all passively added names in the Name Table have been seen in network traffic at some time during, for example, the past two days.
Loading and saving name table dataYou can load and save the contents of the Name Table, allowing you to keep descriptions of different segments, or to simply store and retrieve different ways of looking at the same seg-ment.
Loading a previously saved name table
You can load the contents of previously built and saved Name Tables, including any Name Table files you may have created manually or exported using other Savvius analyzers.
The program recognizes the following files as Name Tables: *.nam, *.txt (tab delimited), and *.csv (comma delimited) files.
To load the names from another Name Table into the current Name Table:
1. On the View menu, click Name Table. The Name Table window appears.
2. Click Import or choose a previously used Name Table from the list beside Import.
3. Choose one of the following:
• Click Yes in the dialog asking Delete all entries before importing? if you would like to replace the existing Name Table with the imported names.
440 Loading and saving name table data

OmniPeek User Guide
ANYOP_UG.book Page 441 Friday, February 5, 2016 4:47 PM
• Click No to add the imported names to the current Name Table.
4. Navigate to the location of the file you wish to load.
5. Choose this file and click OK.
Tip You can also use drag and drop to add the contents of a saved Name Table file to the existing Name Table. Simply drag the Name Table file onto the open Name Table window.
Saving the name table
You can save all or a selected subset of the OmniPeek Name Table to a new file. If you are man-aging several networks, it may be useful to build and store Name Tables for each of the net-works you support.
To save the entire contents of the current Name Table under a new name:
1. On the View menu, click Name Table. The Name Table window appears.
2. Click Export.
3. Choose a location in which to save the file.
4. Click OK.
Tip You can also save selected names from the Name Table. Group folder information is preserved when exporting either individual entries or the entire Name Table.
To save selected names from the current Name Table into a new Name Table file:
1. On the View menu, click Name Table. The Name Table window appears.
2. Select the entries you wish to export.
Tip You can use Ctrl + click and Shift + click to highlight multiple entries.
3. Right-click and choose Export Selected….
4. Choose a location in which to save the file.
5. Click OK.
Saving the name table 441

Chapter 17: Using the Name Table
ANYOP_UG.book Page 442 Friday, February 5, 2016 4:47 PM
Using the Capture Engine trust table In the Capture Engines window, the Trust Table tab of a Capture Engine allows you to asso-ciate physical addresses with a trust value. See Trusted, known, and unknown nodes on page 437.
Note The Trust Table tab is not supported on Capture Engine for OmniPeek (Linux).
Capture Engine uses the Trust information from the Trust Table in the Expert, WLAN, and Summary statistics views. You can also set alarms and send notifications based on Trust.
Capture Engine trust table tab
Select the Trust Table tab for a connected Capture Engine in the Capture Engines window.
The Trust Table tab allows you to associate 802.11 WLAN addresses with a trust value: Trusted, Known, or Unknown. These values are used by the WLAN and Summary views of a Capture Engine capture window.
The parts of the Trust Table tab are identified below.
• Insert: Click to open the Insert dialog, where you can enter the physical address (MAC address) of the entry and choose one of the three Trust values for this node.
• Trusted: Can be assigned to the devices on your own network.
Click here to send changesDelete
Edit
RefreshInsert
442 Using the Capture Engine trust table

OmniPeek User Guide
ANYOP_UG.book Page 443 Friday, February 5, 2016 4:47 PM
• Known: Lets you identify familiar sources that are beyond your own control, such as an access point in a neighboring office.
• Unknown: The default value, assumed for any node not listed in the Trust Table.
• Edit: Click to edit the selected entry.
• Delete: Click to delete the selected entry.
• Refresh: Click to update your view of the remote Trust Table with the most recent changes.
• Click here to send changes: Click to send your changes to the Capture Engine.
Note Making changes to the trust values of entries on a Capture Engine is a two step process: first make the changes in the Insert dialog, then send the changes to the Capture Engine.
Capture Engine name resolution
When a Capture Engine capture window is open, entries in the OmniPeek Name Table can be applied to the display of information in that window. You can also use the name resolution features in OmniPeek for logical and physical addresses in Capture Engine. SeeOmniPeek name resolution on page 438.
Important! The Expert, WLAN, and Summary views of a Capture Engine capture window use the values found in the Trust Table of the Capture Engine on which they are running, not the trust values displayed in the OmniPeek Name Table.
Capture Engine name resolution 443

Chapter 17: Using the Name Table
ANYOP_UG.book Page 444 Friday, February 5, 2016 4:47 PM
444 Using the Capture Engine trust table

C H A P T E R 18
ANYOP_UG.book Page 445 Friday, February 5, 2016 4:47 PM
Viewing Logs
In this chapter:
About logs. . . . . . . . . . . . . . . . . . . . . . . . . . . . . . . . . . . . . . . . . . . . . . . . . . . . . 446
OmniPeek global log . . . . . . . . . . . . . . . . . . . . . . . . . . . . . . . . . . . . . . . . . . . . 446
Capture Engine global log . . . . . . . . . . . . . . . . . . . . . . . . . . . . . . . . . . . . . . . . 447
OmniPeek capture logs . . . . . . . . . . . . . . . . . . . . . . . . . . . . . . . . . . . . . . . . . . 449
Capture Engine capture logs . . . . . . . . . . . . . . . . . . . . . . . . . . . . . . . . . . . . . . 451
Capture Engine audit log . . . . . . . . . . . . . . . . . . . . . . . . . . . . . . . . . . . . . . . . . 453
445

Chapter 18: Viewing Logs
ANYOP_UG.book Page 446 Friday, February 5, 2016 4:47 PM
About logsLogs record program processes and events, including program start and stop, notifications, severity levels of notifications, etc.
OmniPeek has a global log for the program as a whole, as well as individual logs for each OmniPeek capture. See OmniPeek global log on page 446 and OmniPeek capture logs on page 449.
Capture Engines have a global and audit log for each Capture Engine, as well as individual logs for each Capture Engine capture. See Capture Engine global log on page 447, Capture Engine audit log on page 453, and Capture Engine capture logs on page 451.
OmniPeek global logTo view the OmniPeek global log, on the View menu, click Log Window. The OmniPeek Log window appears at the bottom of the main window.
The parts of the OmniPeek Log window are identified below:
• Messages: Shows the total number of messages in the log.
• Messages by level of Severity: Shows total number of messages by each level of severity. You can toggle between hiding and showing the notifications of any level of severity by clicking the severity icon.
• Log entries: Each log entry displays a severity of notification icon and the Date, Time, and Message.
• Right-click the log for the following options:
• Save Log…: Saves the log as a text file (tab-delimited or comma separated values).
• Print Log…: Prints the log to a printer. To alter default print settings, choose Print Setup… from the File menu.
Log entries Messages Messages by level of Severity
446 About logs

OmniPeek User Guide
ANYOP_UG.book Page 447 Friday, February 5, 2016 4:47 PM
• Copy: Copies selected lines from the log to the clipboard as tab-delimited text.
• Copy Hyperlink: Copies selected hyperlinks from the log to the clipboard.
• Open Hyperlink: Opens selected hyperlinks from the log into your browser.
• Clear Log: Clears or empties the log.
• Maximum Log File Size…: Opens a dialog in which you can change the maximum size for the Log file, in kilobytes (the default is 4MB). When the limit is reached, the log will delete older entries to make room for newer entries.
• Auto Scroll: Toggles the Auto Scroll feature of the log.
Tip The Web Analysis Module writes URLs it discovers in network traffic to the log. You can access that Internet resource by double-clicking on the URL directly in the Log window. This launches your default Internet browser and opens the selected URL.
You can float the Log window inside of the main window by dragging the OmniPeek Log title to the main window. Double-click the OmniPeek Log title to dock the log back to the bottom of the main window.
Capture Engine global logTo view the Capture Engine global log, select the Log tab for a connected Capture Engine in the Capture Engines window.
Capture Engine global log 447

Chapter 18: Viewing Logs
ANYOP_UG.book Page 448 Friday, February 5, 2016 4:47 PM
The parts of the Capture Engines Log tab are identified below:
• Messages: Shows the total number of messages in the log.
• First Page/Last Page: Allows you to quickly go to the first or last page of the log.
• Messages by level of Severity: Shows total number of messages by each level of severity.
Tip You can toggle between hiding and showing the notifications of any level of severity by clicking the severity icon at the top of the window.
• Search: Allows you to search text displayed in the Message column of the log. Separate multiple search terms with a white space, or the ‘AND,’ ‘OR,’ or ‘NOT’ (capitalized) operators. A white space is treated like the ‘AND’ operator.
• Select Date & Time Range: Allows you to search the log by date and time. You can specify both the start and end date and time. The clock icon is highlighted when a date and time range filter is in use. Click the clock icon again to remove the filter. When in use, mouse over the clock icon to display a tooltip of the date/time range filter.
• Log entries: Each log entry displays a severity of notification icon and the Date, Time, and Message.
• Right-click the log for the following options:
SearchMessages Messages by level of SeverityLog Entries
First Page/Last Page Select Date & TIme Range
448 Capture Engine global log

OmniPeek User Guide
ANYOP_UG.book Page 449 Friday, February 5, 2016 4:47 PM
• Copy: Copies selected lines from the log to the clipboard as tab-delimited text.
• Copy Hyperlink: Copies selected hyperlinks from the log to the clipboard.
• Open Hyperlink: Opens selected hyperlinks from the log into tabs in your browser.
• Clear Log: Clears the contents of the log.
• Global Messages Only: Toggles between showing global messages only or all messages. The global messages are those relating solely to a Capture Engine itself, such as start and stop events.
• Highlight Search Terms: Highlights the search terms found in the log.
Note The Expert Event log for each Capture Engine capture window is a separate entity. All other log entries on a single Capture Engine are stored in a single database. When the database becomes full, old entries are deleted to make room for newer entries.
OmniPeek capture logsThere are several differences between the global log and the Log views of OmniPeek capture windows:
• The Log view of an OmniPeek capture window contains only the items that are relevant to that particular capture. The OmniPeek global log contains the results from all packets used to calculate monitor statistics on OmniPeek. See Monitoring network statistics on page 334.
• The entries in the Log view of an OmniPeek capture window are temporary. The log is created when the window is opened and is not saved when the window is closed.
• The Log view of a capture window has a log limit defined in terms of number of log messages allowed in the log. You can select or enter the maximum (Max) number of log messages allowed in the log, and then select or enter the number (Adjust) of log messages to delete once the number of log messages reaches the maximum. The oldest messages are deleted first.
Note To change the default log size in new capture windows, on the Tools menu, click Options…. The Options dialog appears. See Configuring the Options dialog on page 480.
To view the OmniPeek capture window log, select the Log view in the capture window.
OmniPeek capture logs 449

Chapter 18: Viewing Logs
ANYOP_UG.book Page 450 Friday, February 5, 2016 4:47 PM
The parts of the Log view of an OmniPeek capture window are identified below:
• Messages: Shows the total number of messages in the log.
• First Page/Last Page: Allows you to quickly go to the first or last page of the log.
• Messages by level of Severity: Shows total number of messages by each level of severity.
• Search: Allows you to search text displayed in the Message column of the log. Separate multiple search terms with a white space, or the ‘AND,’ ‘OR,’ or ‘NOT’ (capitalized) operators. A white space is treated like the ‘AND’ operator.
• Select Date & Time Range: Allows you to search the log by date and time. You can specify both the start and end date and time. The clock icon is highlighted when a date and time range filter is in use. Click the clock icon again to remove the filter. When in use, mouse over the clock icon to display a tooltip of the date/time range filter.
• Log entries: Each log entry displays a severity of notification icon and the Date, Time, and Message.
SearchMessages Messages by level of SeverityLog entriesSelect Date & TIme RangeFirst Page/Last Page
450 OmniPeek capture logs

OmniPeek User Guide
ANYOP_UG.book Page 451 Friday, February 5, 2016 4:47 PM
• Right-click the log for the following options:
• Save Log…: Saves the log as a text file (tab-delimited or comma separated values).
• Print Log…: Prints the log to a printer. To alter default print settings, choose Print Setup… from the File menu.
• Select Related Packets: Displays the Selection Results dialog. Click Highlight selected packets, Hide selected packets, Hide unselected packets, Copy selected packets to new window, or Label selected packets. For more information, see Hiding and unhiding packets on page 191 and Selecting related packets on page 192.
• Copy: Copies selected lines from the log to the clipboard as tab-delimited text.
• Copy Hyperlink: Copies selected hyperlinks from the log to the clipboard.
• Open Hyperlink: Opens selected hyperlinks from the log into tabs in your browser.
• Clear Log: Lets you clear the contents of the log.
• Auto Scroll: Toggles the Auto Scroll feature of the log.
• Highlight Search Terms: Lets you highlight search terms found in the log.
Capture Engine capture logsTo view the Capture Engine capture window log, select the Log view in the Capture Engine capture window.
Capture Engine capture logs 451
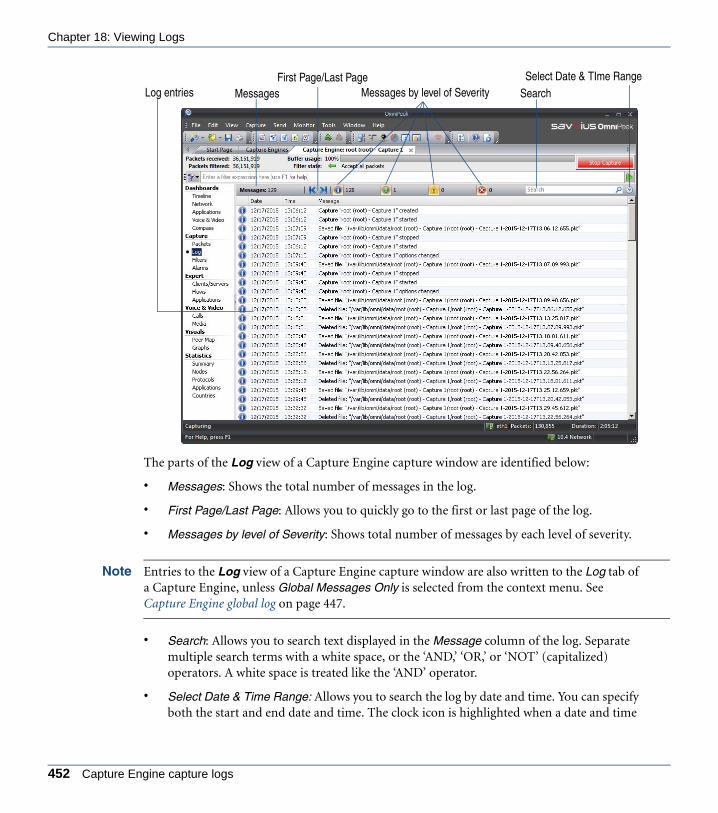
Chapter 18: Viewing Logs
ANYOP_UG.book Page 452 Friday, February 5, 2016 4:47 PM
The parts of the Log view of a Capture Engine capture window are identified below:
• Messages: Shows the total number of messages in the log.
• First Page/Last Page: Allows you to quickly go to the first or last page of the log.
• Messages by level of Severity: Shows total number of messages by each level of severity.
Note Entries to the Log view of a Capture Engine capture window are also written to the Log tab of a Capture Engine, unless Global Messages Only is selected from the context menu. See Capture Engine global log on page 447.
• Search: Allows you to search text displayed in the Message column of the log. Separate multiple search terms with a white space, or the ‘AND,’ ‘OR,’ or ‘NOT’ (capitalized) operators. A white space is treated like the ‘AND’ operator.
• Select Date & Time Range: Allows you to search the log by date and time. You can specify both the start and end date and time. The clock icon is highlighted when a date and time
SearchMessages Messages by level of SeverityLog entriesSelect Date & TIme RangeFirst Page/Last Page
452 Capture Engine capture logs

OmniPeek User Guide
ANYOP_UG.book Page 453 Friday, February 5, 2016 4:47 PM
range filter is in use. Click the clock icon again to remove the filter. When in use, mouse over the clock icon to display a tooltip of the date/time range filter.
• Log entries: Each log entry displays a severity of notification icon and the Date, Time, and Message.
• Right-click the log for the following options:
• Select Related Packets: Displays the Selection Results dialog. Click Highlight selected packets, Hide selected packets, Hide unselected packets, Copy selected packets to new window, or Label selected packets. For more information, see Hiding and unhiding packets on page 191 and Selecting related packets on page 192.
• Copy: Copies selected lines from the log to the clipboard as tab-delimited text.
• Copy Hyperlink: Copies selected hyperlinks from the log to the clipboard.
• Open Hyperlink: Opens selected hyperlinks from the log into your browser.
• Clear Log: Clears the contents of the log.
• Global Messages Only: Lets you toggle between showing global only or all messages. The global messages are those relating solely to a Capture Engine, such as start and stop events.
• Highlight Search Terms: Lets you highlight search terms found in the log.
Capture Engine audit logThe Capture Engine audit log lists available information regarding events taking place on the Capture Engine. You can search the log, clear the log, and refresh the log.
To view the Capture Engine audit log, select the Admin tab for a connected Capture Engine in the Capture Engines window, and then select the Audit Log tab.
Capture Engine audit log 453
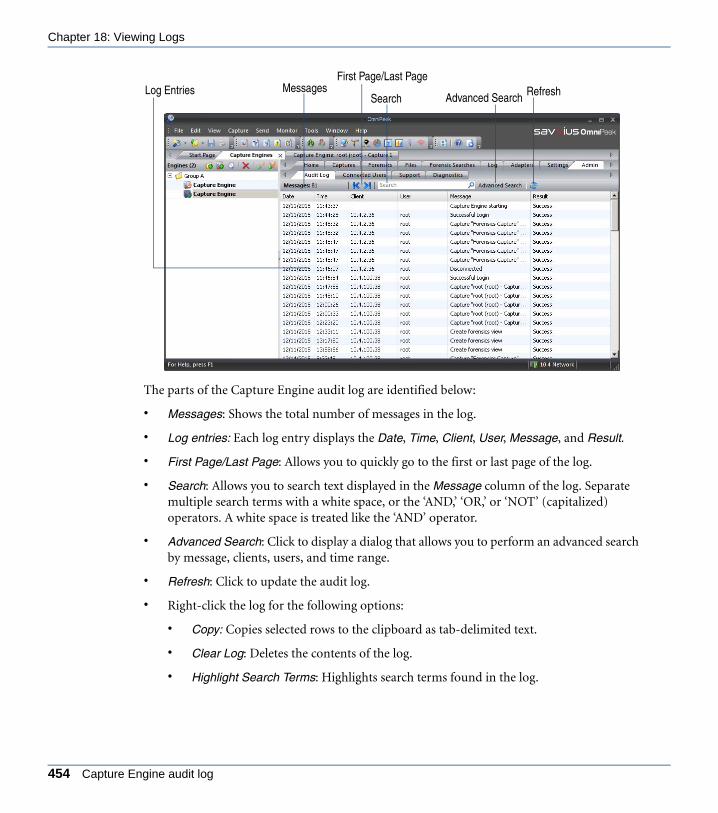
Chapter 18: Viewing Logs
ANYOP_UG.book Page 454 Friday, February 5, 2016 4:47 PM
The parts of the Capture Engine audit log are identified below:
• Messages: Shows the total number of messages in the log.
• Log entries: Each log entry displays the Date, Time, Client, User, Message, and Result.
• First Page/Last Page: Allows you to quickly go to the first or last page of the log.
• Search: Allows you to search text displayed in the Message column of the log. Separate multiple search terms with a white space, or the ‘AND,’ ‘OR,’ or ‘NOT’ (capitalized) operators. A white space is treated like the ‘AND’ operator.
• Advanced Search: Click to display a dialog that allows you to perform an advanced search by message, clients, users, and time range.
• Refresh: Click to update the audit log.
• Right-click the log for the following options:
• Copy: Copies selected rows to the clipboard as tab-delimited text.
• Clear Log: Deletes the contents of the log.
• Highlight Search Terms: Highlights search terms found in the log.
Log Entries RefreshSearch
MessagesFirst Page/Last Page
Advanced Search
454 Capture Engine audit log

C H A P T E R 19
ANYOP_UG.book Page 455 Friday, February 5, 2016 4:47 PM
Applying Analysis Modules
In this chapter:
About analysis modules . . . . . . . . . . . . . . . . . . . . . . . . . . . . . . . . . . . . . . . . . . 456
Enabling and configuring analysis modules . . . . . . . . . . . . . . . . . . . . . . . . . . . 456
Installed analysis modules . . . . . . . . . . . . . . . . . . . . . . . . . . . . . . . . . . . . . . . . 458
455
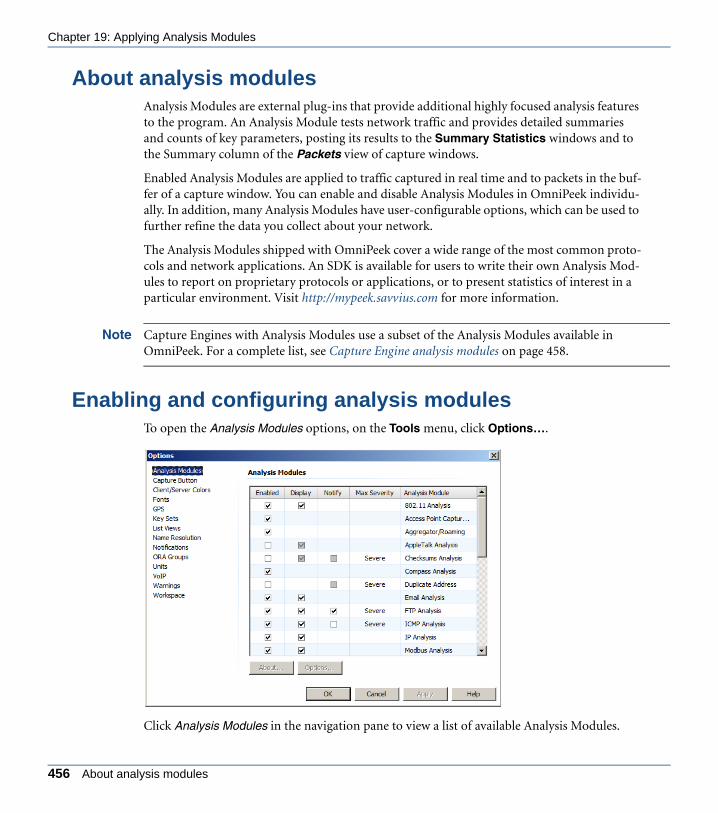
Chapter 19: Applying Analysis Modules
ANYOP_UG.book Page 456 Friday, February 5, 2016 4:47 PM
About analysis modulesAnalysis Modules are external plug-ins that provide additional highly focused analysis features to the program. An Analysis Module tests network traffic and provides detailed summaries and counts of key parameters, posting its results to the Summary Statistics windows and to the Summary column of the Packets view of capture windows.
Enabled Analysis Modules are applied to traffic captured in real time and to packets in the buf-fer of a capture window. You can enable and disable Analysis Modules in OmniPeek individu-ally. In addition, many Analysis Modules have user-configurable options, which can be used to further refine the data you collect about your network.
The Analysis Modules shipped with OmniPeek cover a wide range of the most common proto-cols and network applications. An SDK is available for users to write their own Analysis Mod-ules to report on proprietary protocols or applications, or to present statistics of interest in a particular environment. Visit http://mypeek.savvius.com for more information.
Note Capture Engines with Analysis Modules use a subset of the Analysis Modules available in OmniPeek. For a complete list, see Capture Engine analysis modules on page 458.
Enabling and configuring analysis modulesTo open the Analysis Modules options, on the Tools menu, click Options….
Click Analysis Modules in the navigation pane to view a list of available Analysis Modules.
456 About analysis modules
OmniPeek User Guide
ANYOP_UG.book Page 457 Friday, February 5, 2016 4:47 PM
The parts of the Analysis Modules options are identified below.
• Enabled: Select or clear the check box beside its name to enable or disable the Analysis Module.
• Display: Select the check box beside its name to allow the Analysis Module to write details about the packet to the Summary column in the Packets view of any capture window.
• Notify: Select the check box beside its name to tell the Analysis Module to send notifications when it detects certain events. For more on associating notifications with actions, see Chapter 16, Sending Notifications.
• Max severity: This column allows you to set an upper limit for the severity of the notifications coming from each particular Analysis Module. Each Analysis Module assigns its own level of severity to each type of event it is able to detect. It tries to assign that pre-determined severity to any notification of that event. For example, if you enable notification for an Analysis Module and set the maximum severity to Minor and the Analysis Module then tries to send notifications of Severe, Major, or Minor severity; they will all be treated as Minor.
• Options…: Click to open an Options dialog for the selected Analysis Module. Options is unavailable if the selected Analysis Module does not have user-configurable options.
Alternatively, double-click the Analysis Module to open its corresponding Options dialog.
• About…: Click to display an About Box for the selected Analysis Module.
Apply analysis module command
Analysis Modules are usually applied to packets as they arrive in the buffer from the network, or as they are loaded from a file. Analysis Modules are also re-applied each time the contents of the buffer is changed by hiding or unhiding packets.
To apply the IP Analysis Module to selected packets in a Packet List:
1. Select the packet(s) to which you would like to apply the IP Analysis Module.
2. Right-click, choose the Apply Analysis Module command and select IP Analysis from the submenu.
This applies the IP Analysis Module to the selected packet(s) and allows the Analysis Module to write to the Summary column.
A message dialog appears showing the number of your selected packets which were processed by the Analysis Module you applied. If the dialog shows less than the total number (for example 2 of 3 packets applied), it means that the Analysis Module you applied did not find the relevant information.
Apply analysis module command 457

Chapter 19: Applying Analysis Modules
ANYOP_UG.book Page 458 Friday, February 5, 2016 4:47 PM
3. Click OK to close the message dialog.
Using analysis modules
Analysis Modules process packets each time the packets are loaded into a buffer. This means the same Analysis Module may process the same packet several times, but with the results posted to different places in OmniPeek, depending on which buffer is involved.
OmniPeek maintains one buffer for monitor statistics and separate buffers for individual cap-ture windows or files.
Important! Analysis Modules that are enabled in the Analysis Modules view of the Options dialog can be disabled in the Analysis Options view of the Monitor Options or Capture Options dialog for optimizing performance in individual cases. However, an Analysis Module cannot be enabled in the Analysis Options view that has been disabled in the Analysis Modules view of the Options dialog.
Installed analysis modules For full descriptions and instructions for applying each Analysis Module, see Appendix D, Analysis Modules.
Capture Engine analysis modules
Analysis Modules operating on Capture Engine captures are enabled and disabled in the Analysis Options view of the Capture Engine Capture Options dialog. The following Analy-sis Modules are available in Capture Engines:
• 802.11 Analysis
• AppleTalk Analysis
• Email Analysis
• FTP Analysis
• ICMP Analysis
• IP Analysis
• MPLS/VLAN Analysis
• NCP Analysis
• NetWare Analysis
458 Installed analysis modules

OmniPeek User Guide
ANYOP_UG.book Page 459 Friday, February 5, 2016 4:47 PM
• Newsgroup Analysis
• RADIUS Analysis
• SCTP Analysis
• SMB Analysis
• SQL Analysis
• SUM Analysis
• Telnet Analysis
• VoIP Analysis
• WAN Analysis
• Web Analysis
Capture Engine analysis modules 459

Chapter 19: Applying Analysis Modules
ANYOP_UG.book Page 460 Friday, February 5, 2016 4:47 PM
460 Installed analysis modules
C H A P T E R 20
ANYOP_UG.book Page 461 Friday, February 5, 2016 4:47 PM
Using AutoCapture
In this chapter:
About AutoCapture . . . . . . . . . . . . . . . . . . . . . . . . . . . . . . . . . . . . . . . . . . . . . . 462
Creating and editing AutoCapture files. . . . . . . . . . . . . . . . . . . . . . . . . . . . . . . 462
Using an AutoCapture file. . . . . . . . . . . . . . . . . . . . . . . . . . . . . . . . . . . . . . . . . 470
461
Chapter 20: Using AutoCapture
ANYOP_UG.book Page 462 Friday, February 5, 2016 4:47 PM
About AutoCaptureThe OmniPeek AutoCapture feature allows the user to automatically start multiple capture windows, each with its own buffer size, adapter selection settings, save options, triggers, filters, and performance settings. When capture in all windows is completed, the AutoCapture func-tion sends the resulting capture files by a user-specified method, and checks for any capture windows having triggers set for Repeat mode. If any capture windows have triggers set for Repeat mode, the AutoCapture file resets the start trigger for these windows. If no capture window has Repeat mode enabled, the AutoCapture file exits the application when the actions specified in the Send options are completed.
AutoCapture settings are saved in a file which can be sent to a remote user. Remote users can double-click the file to run it immediately, or schedule the file to run using the Windows Scheduler.
Note The AutoCapture function is not supported in Capture Engines.
Creating and editing AutoCapture filesCreating and editing AutoCapture files involves selecting an adapter, defining an AutoCapture template, and selecting Send options.
To create or edit AutoCapture (*.wac) files, choose one of the following:
• On the File menu, point to AutoCapture, and then click Create New…. The AutoCapture File Options dialog appears, with New AutoCapture File Options in the title bar.
• On the File menu, point to AutoCapture, and then click Edit Existing. The AutoCapture File Options dialog appears, with the name of the *.wac file in the title bar.
The parts of the AutoCapture File Options dialog are identified below.
462 About AutoCapture

OmniPeek User Guide
ANYOP_UG.book Page 463 Friday, February 5, 2016 4:47 PM
• Log file: You can specify the name and location of a text Log file for the AutoCapture file, or accept the default location (where the new AutoCapture (*.wac) File resides). Each of the actions taken by the AutoCapture file will be appended to the end of the specified log file in text format.
• Monitor Adapter: Use the program’s default adapter, or click Edit to specify one or more search methods for locating an adapter. See AutoCapture adapter search on page 463.
The program’s default adapter is the valid adapter (an actual NIC, not File or None) most recently selected as the Monitor Adapter in the Monitor Options dialog.
• Capture templates: Click Insert, Edit, Delete, Import, or Export to create new or modify existing AutoCapture templates. See AutoCapture templates on page 466.
• Send options: Click Insert, Edit, or Delete to create new or modify existing Send AutoCapture file options, or change their list order by clicking Move Up or Move Down. See AutoCapture send options on page 468.
AutoCapture adapter search
To search for an adapter, follow these steps:
1. Click Edit to the right of the Monitor Adapter section in the AutoCapture File Options dialog. The AutoCapture version of the Capture Options dialog appears.
Insert Edit ImportDelete Export
Move UpMove Down
AutoCapture adapter search 463
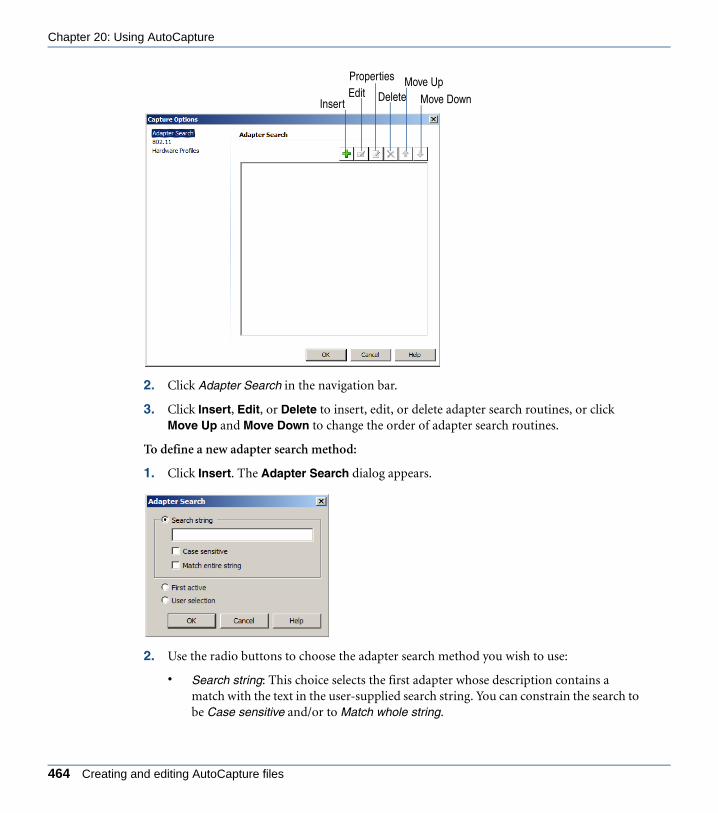
Chapter 20: Using AutoCapture
ANYOP_UG.book Page 464 Friday, February 5, 2016 4:47 PM
2. Click Adapter Search in the navigation bar.
3. Click Insert, Edit, or Delete to insert, edit, or delete adapter search routines, or click Move Up and Move Down to change the order of adapter search routines.
To define a new adapter search method:
1. Click Insert. The Adapter Search dialog appears.
2. Use the radio buttons to choose the adapter search method you wish to use:
• Search string: This choice selects the first adapter whose description contains a match with the text in the user-supplied search string. You can constrain the search to be Case sensitive and/or to Match whole string.
EditInsert
Properties Move UpDelete Move Down
464 Creating and editing AutoCapture files
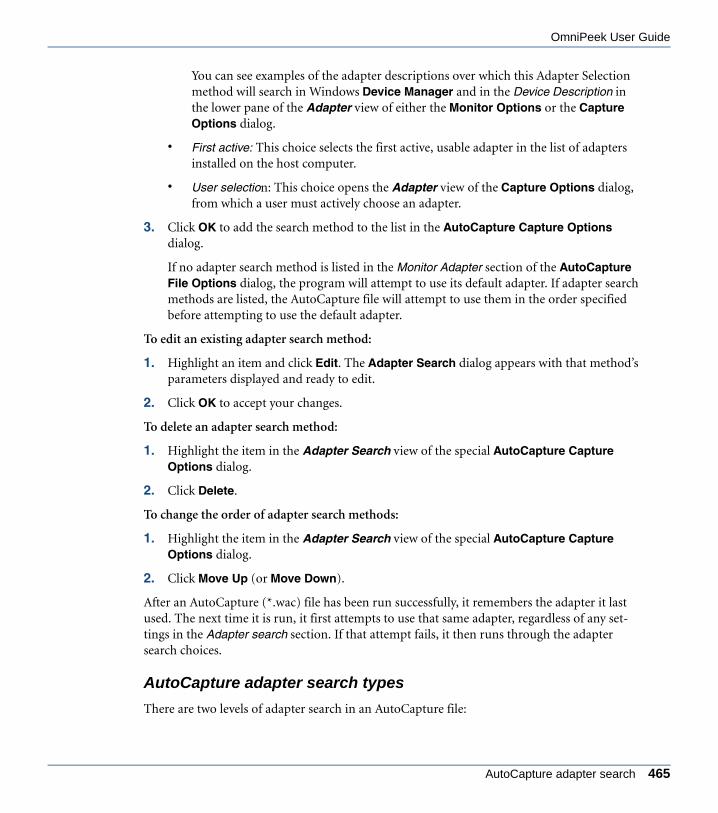
OmniPeek User Guide
ANYOP_UG.book Page 465 Friday, February 5, 2016 4:47 PM
You can see examples of the adapter descriptions over which this Adapter Selection method will search in Windows Device Manager and in the Device Description in the lower pane of the Adapter view of either the Monitor Options or the Capture Options dialog.
• First active: This choice selects the first active, usable adapter in the list of adapters installed on the host computer.
• User selection: This choice opens the Adapter view of the Capture Options dialog, from which a user must actively choose an adapter.
3. Click OK to add the search method to the list in the AutoCapture Capture Options dialog.
If no adapter search method is listed in the Monitor Adapter section of the AutoCapture File Options dialog, the program will attempt to use its default adapter. If adapter search methods are listed, the AutoCapture file will attempt to use them in the order specified before attempting to use the default adapter.
To edit an existing adapter search method:
1. Highlight an item and click Edit. The Adapter Search dialog appears with that method’s parameters displayed and ready to edit.
2. Click OK to accept your changes.
To delete an adapter search method:
1. Highlight the item in the Adapter Search view of the special AutoCapture Capture Options dialog.
2. Click Delete.
To change the order of adapter search methods:
1. Highlight the item in the Adapter Search view of the special AutoCapture Capture Options dialog.
2. Click Move Up (or Move Down).
After an AutoCapture (*.wac) file has been run successfully, it remembers the adapter it last used. The next time it is run, it first attempts to use that same adapter, regardless of any set-tings in the Adapter search section. If that attempt fails, it then runs through the adapter search choices.
AutoCapture adapter search types
There are two levels of adapter search in an AutoCapture file:
AutoCapture adapter search 465
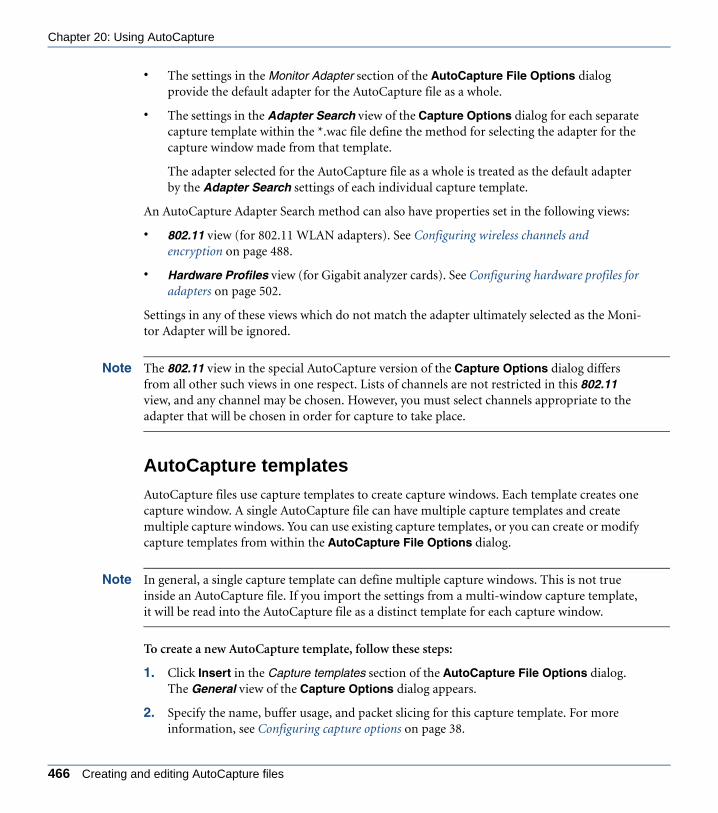
Chapter 20: Using AutoCapture
ANYOP_UG.book Page 466 Friday, February 5, 2016 4:47 PM
• The settings in the Monitor Adapter section of the AutoCapture File Options dialog provide the default adapter for the AutoCapture file as a whole.
• The settings in the Adapter Search view of the Capture Options dialog for each separate capture template within the *.wac file define the method for selecting the adapter for the capture window made from that template.
The adapter selected for the AutoCapture file as a whole is treated as the default adapter by the Adapter Search settings of each individual capture template.
An AutoCapture Adapter Search method can also have properties set in the following views:
• 802.11 view (for 802.11 WLAN adapters). See Configuring wireless channels and encryption on page 488.
• Hardware Profiles view (for Gigabit analyzer cards). See Configuring hardware profiles for adapters on page 502.
Settings in any of these views which do not match the adapter ultimately selected as the Moni-tor Adapter will be ignored.
Note The 802.11 view in the special AutoCapture version of the Capture Options dialog differs from all other such views in one respect. Lists of channels are not restricted in this 802.11 view, and any channel may be chosen. However, you must select channels appropriate to the adapter that will be chosen in order for capture to take place.
AutoCapture templates
AutoCapture files use capture templates to create capture windows. Each template creates one capture window. A single AutoCapture file can have multiple capture templates and create multiple capture windows. You can use existing capture templates, or you can create or modify capture templates from within the AutoCapture File Options dialog.
Note In general, a single capture template can define multiple capture windows. This is not true inside an AutoCapture file. If you import the settings from a multi-window capture template, it will be read into the AutoCapture file as a distinct template for each capture window.
To create a new AutoCapture template, follow these steps:
1. Click Insert in the Capture templates section of the AutoCapture File Options dialog. The General view of the Capture Options dialog appears.
2. Specify the name, buffer usage, and packet slicing for this capture template. For more information, see Configuring capture options on page 38.
466 Creating and editing AutoCapture files

OmniPeek User Guide
ANYOP_UG.book Page 467 Friday, February 5, 2016 4:47 PM
3. Select Continuous capture and Save to disk in order to use AutoCapture Send options. See AutoCapture send options on page 468.
4. Select Triggers in the Capture Options navigation bar.
5. Set a stop trigger for the capture template. See Setting triggers on page 417.
Important! A stop trigger must be set for each capture template, or the capture will never terminate and no files will be sent. Capture must stop in all the capture windows created by a given AutoCapture file before any files will be sent. Automatic saving of captured packets is only supported under the Continuous capture setting in the General view of the Capture Options dialog. Under the Continuous capture setting, only active user intervention or a stop trigger will stop capture.
6. Click OK to add this template to the list of AutoCapture templates in the AutoCapture File Options dialog.
Tip You can use the Analysis Options view of the Capture Options dialog to selectively disable program functionality to reduce overhead and speed operation. Because the primary purpose of AutoCapture is to collect packets for later analysis, you can typically disable all functions except capture itself. See Optimizing capture performance on page 483.
To add a previously saved capture template to the list:
1. Click Import.
2. Use the file Open dialog to navigate to the location of the capture template (*.ctf) file you wish to add.
3. Choose the file and click OK to add it to the list.
To save a capture template from the list:
1. Highlight its entry in the list.
2. Click Export.
3. Use the Save As dialog to name the template and navigate to the location where you would like to save the capture template (*.ctf) file.
To edit the Capture Options for a particular capture template:
1. Highlight the template in the Capture templates section of the AutoCapture File Options dialog.
AutoCapture templates 467

Chapter 20: Using AutoCapture
ANYOP_UG.book Page 468 Friday, February 5, 2016 4:47 PM
2. Click Edit. The Capture Options dialog with that template’s parameters displayed and ready to edit.
3. Click OK to close the dialog and accept your changes.
Tip A similarly named filter file will automatically be imported from the same location as the AutoCapture (.wac) file when starting an AutoCapture session. The filter will be added to the existing list.
To delete a capture template from the list:
1. Highlight the listing for that template in the Capture templates section of the AutoCapture File Options dialog.
2. Click Delete.
AutoCapture send options
When capture is stopped in all capture windows, the program attempts to send a single cap-ture file using the first send option listed in the Send options section of the AutoCapture File Options dialog. If the first send option fails, the program tries any remaining send options in the order in which they are listed. All capture files are sent using the first send option that suc-ceeds, and any remaining send options are ignored. If no send option succeeds, no capture files are sent.
Important! You must save captured packets before they can be sent using the Send options. This means you must enable the Continuous capture and Save to disk options in the General view of the Capture Options dialog for each template.
There are three types of send option: Email, FTP, and Command line. You can create multiple instances of the same type (for example, multiple Email send options, each using a different server), but only the first successful send option will actually be used by the program.
To create a new send option, follow these steps:
1. Click Insert in the Send options section of the AutoCapture File Options dialog. The Send Options dialog appears.
468 Creating and editing AutoCapture files
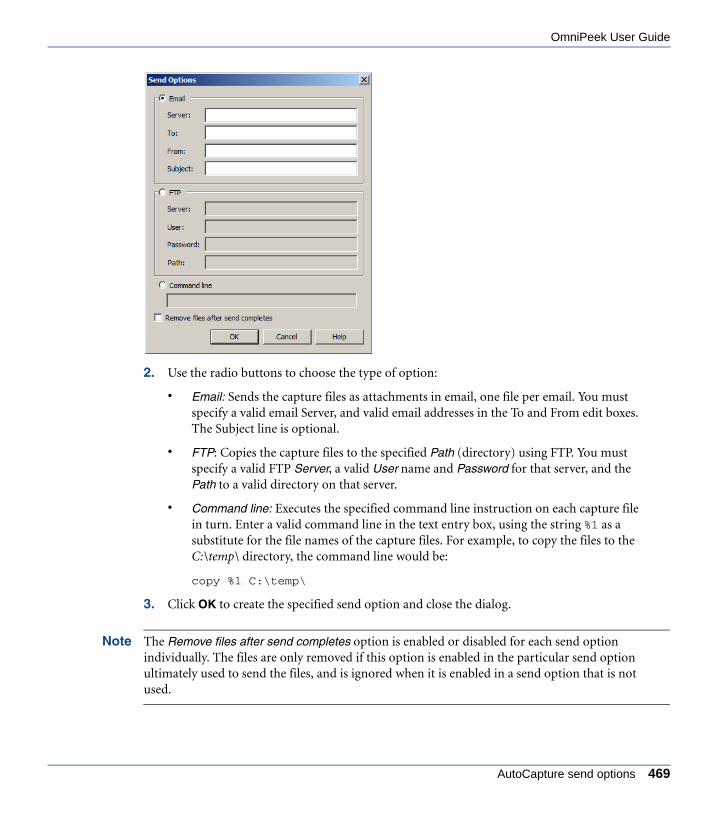
OmniPeek User Guide
ANYOP_UG.book Page 469 Friday, February 5, 2016 4:47 PM
2. Use the radio buttons to choose the type of option:
• Email: Sends the capture files as attachments in email, one file per email. You must specify a valid email Server, and valid email addresses in the To and From edit boxes. The Subject line is optional.
• FTP: Copies the capture files to the specified Path (directory) using FTP. You must specify a valid FTP Server, a valid User name and Password for that server, and the Path to a valid directory on that server.
• Command line: Executes the specified command line instruction on each capture file in turn. Enter a valid command line in the text entry box, using the string %1 as a substitute for the file names of the capture files. For example, to copy the files to the C:\temp\ directory, the command line would be:
copy %1 C:\temp\
3. Click OK to create the specified send option and close the dialog.
Note The Remove files after send completes option is enabled or disabled for each send option individually. The files are only removed if this option is enabled in the particular send option ultimately used to send the files, and is ignored when it is enabled in a send option that is not used.
AutoCapture send options 469

Chapter 20: Using AutoCapture
ANYOP_UG.book Page 470 Friday, February 5, 2016 4:47 PM
To edit a send option:
1. Highlight its entry in the Send options section of the AutoCapture File Options dialog.
2. Click Edit to bring up the Send Options dialog with that option’s parameters displayed and ready to edit.
3. Click OK to accept your changes.
To delete a send option from the list:
1. Highlight its entry in the Send options section of the AutoCapture File Options dialog.
2. Click Delete.
The program will try the send options in order from top to bottom as they appear in the Send options section of the AutoCapture File Options dialog.
To change the list order:
1. Highlight a list item.
2. Click Move Up or Move Down to move the item.
Using an AutoCapture fileTo execute an AutoCapture, double-click an AutoCapture (*.wac) file or specify the file on the command line. For example:
omnipeek.exe c:\temp\Poitiers.wac
When launched with an AutoCapture file as its object, the program will:
1. Establish a log file, if one is specified for the AutoCapture file.
2. Search the directory where the AutoCapture (*.wac) file is located, looking for a file of the same name but with the filter (*.flt) file extension. If it finds such a filter file in that directory, it will import it into the Filters window.
3. Run through the adapter search methods in the Monitor Adapter section of the AutoCapture file to select a valid adapter. If multiple methods are enabled, they will be tried in the order specified, and the first successful selection will set the Monitor Adapter.
4. Create the capture window(s) specified by the capture template(s), executing the Adapter search methods (if any) specified by each individual capture template. The adapter found by the methods specified in the Monitor Adapter section of the AutoCapture file will become the fall-back or default adapter for each of these individual adapter searches.
5. Start capture or set the start/stop triggers for each capture window.
6. Wait for all capture windows to stop capturing.
470 Using an AutoCapture file

OmniPeek User Guide
ANYOP_UG.book Page 471 Friday, February 5, 2016 4:47 PM
Important! Be sure to enable the Continuous capture and Save to disk options and set a Stop Trigger for every capture template in the AutoCapture file. No files will be sent until capture is stopped in all capture windows. Packets must be saved before they can be sent.
7. Run through the Send options to send or save any capture files. The first successful send option will be used to send all of the files.
8. Remove the sent or saved files if Remove files after send completes is selected for the Send Option used.
9. Check to see if any of the created capture windows has triggers set to repeat mode. For any capture window for which Repeat mode is enabled, the AutoCapture file will clear the capture buffer and return to step 5.
10. If no capture window has triggers set to Repeat mode, the AutoCapture file will exit the program when the send options are completed.
Using AutoCapture files as scheduled tasks
The program can also be scheduled with the Windows Task Scheduler, available from the Win-dows Control Panel. The easiest way to use an AutoCapture file as a scheduled task is to create a batch file (*.bat) with the desired command line, then schedule the batch file to run at a specified time in the Task Scheduler. See Starting OmniPeek from the command line on page 565.
Using AutoCapture files as scheduled tasks 471

Chapter 20: Using AutoCapture
ANYOP_UG.book Page 472 Friday, February 5, 2016 4:47 PM
472 Using an AutoCapture file
C H A P T E R 21
ANYOP_UG.book Page 473 Friday, February 5, 2016 4:47 PM
Sending Packets
In this chapter:
About sending packets . . . . . . . . . . . . . . . . . . . . . . . . . . . . . . . . . . . . . . . . . . . 474
Selecting the send adapter. . . . . . . . . . . . . . . . . . . . . . . . . . . . . . . . . . . . . . . . 474
Sending the send packet . . . . . . . . . . . . . . . . . . . . . . . . . . . . . . . . . . . . . . . . . 475
Editing the send packet . . . . . . . . . . . . . . . . . . . . . . . . . . . . . . . . . . . . . . . . . . 476
473
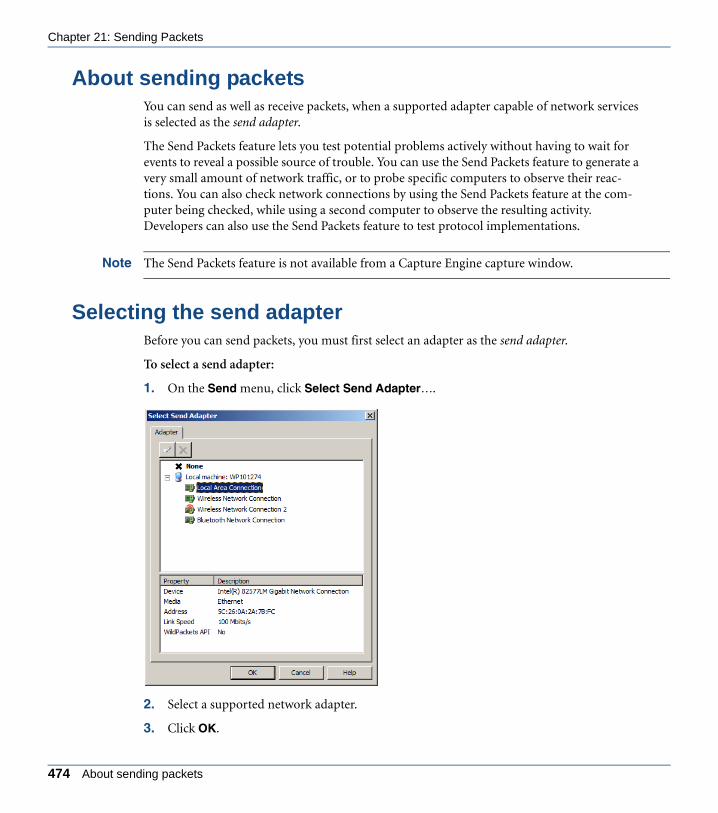
Chapter 21: Sending Packets
ANYOP_UG.book Page 474 Friday, February 5, 2016 4:47 PM
About sending packetsYou can send as well as receive packets, when a supported adapter capable of network services is selected as the send adapter.
The Send Packets feature lets you test potential problems actively without having to wait for events to reveal a possible source of trouble. You can use the Send Packets feature to generate a very small amount of network traffic, or to probe specific computers to observe their reac-tions. You can also check network connections by using the Send Packets feature at the com-puter being checked, while using a second computer to observe the resulting activity. Developers can also use the Send Packets feature to test protocol implementations.
Note The Send Packets feature is not available from a Capture Engine capture window.
Selecting the send adapterBefore you can send packets, you must first select an adapter as the send adapter.
To select a send adapter:
1. On the Send menu, click Select Send Adapter….
2. Select a supported network adapter.
3. Click OK.
474 About sending packets

OmniPeek User Guide
ANYOP_UG.book Page 475 Friday, February 5, 2016 4:47 PM
Important! If you are using a wireless adapter and the adapter you select as the send adapter is also currently selected as the monitor adapter or a capture adapter, you will not be able to send packets with this wireless adapter. Please select another wireless adapter or stop capture before using the Send Packets feature. In addition, the send adapter feature is not supported on Capture Engines.
Sending the send packetA generic packet is available to use as the default send packet. You can also select any packet from the Packets view of an active window and use that packet as the send packet. There are three ways to send packets:
• Send a single copy of the send packet out on the network.
• Send bursts of multiple copies of the send packet at specified intervals.
• Send a selected packet or group of packets in a single burst.
CAUTION! Setting a Broadcast or a Multicast packet as the send packet will cause all nodes to process this packet and force switches to forward the packet onto all segments.
To set the parameters for send events:
1. On the Send menu, click Send Window. The Send window appears.
The settings in the dialog are described below:
• Packets per burst: Type or select the number of packets in a single burst.
• Delay between bursts: Type or select the interval between bursts.
Sending the send packet 475

Chapter 21: Sending Packets
ANYOP_UG.book Page 476 Friday, February 5, 2016 4:47 PM
• Transmit One: Click to send exactly one of the specified send packet.
• Initiate Send: Click to send packets
• % Utilization / Packets/s: These digital readout dials show the % utilization (percent of utilization of maximum network bandwidth) and packets/s (packets per second) represented by the packets being sent in the current send event.
• Packets sent: Displays the total number of packets sent in the current send event.
• Reset: Click to reset the dialog to its default values.
2. Configure the dialog for one of the send options described below.
a. To send a single copy of the send packet onto the network:
• Click Transmit One in the Send Window dialog.
b. To send bursts of multiple copies of a packet onto the network:
• On the Send menu, click Set Send Packet.
• Configure the Packets per burst and Delay between bursts in the Send Window dialog.
• Click Initiate Send in the Send Window dialog.
c. To send selected packets onto the network in a single burst:
• On the Send menu, click Send Selected Packets.
• Click Initiate Send in the Send Window dialog.
CAUTION! Sending large volumes of traffic onto the network can slow down service for other users. Also, if you set the Send window to send a large number of packets with too small an interval, you may prevent your computer from doing any of the other tasks that it does normally.
Editing the send packetYou can edit the contents of the send packet to customize the data sent across the network.
To edit the contents of the send packet:
1. On the Send menu, click Edit Send Packet. The Edit Send Packet window appears.
The layout of the Edit Send Packet window is similar to that of the Packet Decode window, with a Decode view above and Hex pane (containing hexadecimal and ASCII data) below.
476 Editing the send packet

OmniPeek User Guide
ANYOP_UG.book Page 477 Friday, February 5, 2016 4:47 PM
2. Make your edits to either the hexadecimal or ASCII data. As you make your edits, the Decode view is updated.
3. Click OK when you have finished making your edits.
Editing the send packet 477

Chapter 21: Sending Packets
ANYOP_UG.book Page 478 Friday, February 5, 2016 4:47 PM
478 Editing the send packet

C H A P T E R 22
ANYOP_UG.book Page 479 Friday, February 5, 2016 4:47 PM
Configuring Options
In this chapter:
Configuring the Options dialog . . . . . . . . . . . . . . . . . . . . . . . . . . . . . . . . . . . . . 480
Configuring display format options . . . . . . . . . . . . . . . . . . . . . . . . . . . . . . . . . . 481
Configuring color options . . . . . . . . . . . . . . . . . . . . . . . . . . . . . . . . . . . . . . . . . 482
Customizing the tools menu . . . . . . . . . . . . . . . . . . . . . . . . . . . . . . . . . . . . . . . 483
Optimizing capture performance . . . . . . . . . . . . . . . . . . . . . . . . . . . . . . . . . . . 483
479

Chapter 22: Configuring Options
ANYOP_UG.book Page 480 Friday, February 5, 2016 4:47 PM
Configuring the Options dialogMany features in OmniPeek are configured in the Options dialog.
Note Click Help in each of these views to learn more about specific options and settings.
To open the Options dialog:
• On the Tools menu, click Options….
You can configure the following from the Options dialog:
• Analysis Modules: These options let you configure the Analysis Modules. Analysis Modules process packets each time they are loaded into a buffer for monitor statistics and capture windows. See Enabling and configuring analysis modules on page 456.
• Capture Button: These options let you configure color and flash settings for the Start Capture, Stop Capture, and Start/Stop/Abort Trigger buttons in a capture window.
• Client/Server Colors: These options let you control the color display of clients and servers in Expert and Web views. See Setting client/server colors on page 240.
• Fonts: These options let you set the font, style, and size of the text used throughout the application.
480 Configuring the Options dialog

OmniPeek User Guide
ANYOP_UG.book Page 481 Friday, February 5, 2016 4:47 PM
• GPS: These options let you enable and configure the GPS (Global Positioning System) feature. GPS allows you to analyze data provided by a separately purchased GPS receiver. See Chapter 26, Global Positioning System.
• Key Sets: These options let you create and edit Key Sets used for 802.11 security. See Configuring wireless channels and encryption on page 488.
• List Views: These options let you set the background color and how vertical and horizontal lines appear whenever a list view is displayed.
• Matrix Switches: These options let you control Datacom and/or Net Optics matrix switches that are installed and connected. See Chapter 27, Using Matrix Switches.
• Name Resolution: These options let you control how name and address substitutions are handled in the Name Table. See OmniPeek name resolution on page 438.
• Notifications: These options let you configure Notifications. Notifications are messages sent from triggers, alarms, Analysis Modules and other parts of the program to announce and describe the occurrence of specified events. See Configuring notifications on page 426.
• ORA Groups: These options let you manage OmniPeek Remote Assistant files between computers. See Chapter 25, OmniPeek Remote Assistant.
• Units: These options let you set the units for time and throughput in Expert and Visual Expert views. See Setting units for time and throughput on page 241.
• VoIP: These options let you specify a geographical region and VoIP emulation model to use when calculating VoIP quality scores. See Setting VoIP options on page 328.
• Warnings: These options let you control the behavior of automatic warning dialogs that appear in the application.
• Workspace: These options let you set the default behavior for scrolling, saving, and restoring windows.
Configuring display format optionsYou can configure how certain information is displayed in various lists, such as the Nodes view, Packet List pane, and the Node Statistics window.
The Display Format submenu (on the View menu, click Display Format) has the following options:
• Show Address Names: Enable this option to display a node’s name from the Name Table (if any) instead of its address whenever packets are encountered to or from the node.
Configuring display format options 481

Chapter 22: Configuring Options
ANYOP_UG.book Page 482 Friday, February 5, 2016 4:47 PM
• Show Port Names: Enable this option to display a port’s name from the Name Table (if any) instead of its address whenever packets are encountered to or from the port.
• Logical Address: Enable this option to display logical addresses instead of physical addresses, wherever logical addresses are available.
• Physical Address: Enable this option to display physical addresses instead of logical addresses, wherever physical addresses are available.
• Local Time: Enable this option to show all timestamps adjusted for local time settings (such as time zone and Daylight Savings Time) on the local computer. When disabled, all timestamps are displayed in UTC (Coordinated Universal Time).
Configuring color optionsYou can configure how colors already assigned in other dialogs will be used in displaying pack-ets. There are four sources of color assignments for elements of network traffic:
• The Flags view of the Packet List Options dialog (available by left-clicking anywhere in the Packet List pane headers) determines the color associated with error or trigger packets. You can also assign a color to 802.11 WLAN management packets and control packets, as well as to encrypted packets and/or to packets with decryption errors.
• The Edit Name dialog in the Name Table can set the color for packets associated with a particular address (node), port, or protocol.
• ProtoSpecs assigns colors to all the protocols it can identify. ProtoSpecs color choices cannot be overridden.
• The Insert Filter or Edit Filter dialog can set the color for any filter you create or edit.
The Color submenu (on the View menu, click Color) has the following options:
• Source: Shows packets destined for a particular node in the color assigned to that node in the Name Table.
• Destination: Shows packets destined for a particular node in the color assigned to that node in the Name Table.
• Protocol: Shows packets in the color assigned to protocols by ProtoSpecs. If ProtoSpecs can identify the protocol and the protocol is listed in the Name Table and has a color assigned there, then the color assigned in the Name Table will be used.
• Filter: Shows packets that are captured through a filter in the color assigned to that filter in the Edit Filter dialog.
• Flag: Shows packets that have been flagged in the color assigned to trigger, error, and other flagged packet types in the Packet List Options dialog.
482 Configuring color options

OmniPeek User Guide
ANYOP_UG.book Page 483 Friday, February 5, 2016 4:47 PM
• Independent: Shows each of the above items in its own assigned color.
• No Color: Turns off all color coding.
Customizing the tools menuYou can add other Savvius programs to the Tools menu, allowing you to start these programs from within OmniPeek.
To add a program to the Tools menu:
1. On the Tools menu, click Customize…. The Customize Tools Menu dialog appears.
2. Click Insert.
3. Type the Menu text to set the name of the tool as it will appear in the Tools menu.
4. Type or browse to the location of the tool in the Command field.
Tip You can also enter any Arguments for the program and set its initial directory by typing the path or clicking the … (ellipsis) to navigate to its location.
5. Click OK to accept your changes.
Optimizing capture performanceYou can increase capture or monitor performance by selectively disabling certain analysis options and subsequently freeing up system resources. The Analysis Options of either the Capture Options or Monitor Options dialog lets you enable or disable various options for the currently selected capture.
Customizing the tools menu 483

Chapter 22: Configuring Options
ANYOP_UG.book Page 484 Friday, February 5, 2016 4:47 PM
To enhance capture performance:
1. Do any of the following to open the Capture Options or Monitor Options dialog:
• On the Capture menu, click Start Capture
• On the Start page, click New Capture
• On the Monitor menu, click Monitor Options
Note For a Capture Engine, open the Capture Engines window, click the Captures tab, and then either create a new capture window or click Capture Options for an existing capture to open the Capture Options dialog.
2. Click the Analysis Options view.
3. Select the various options that you want enabled.
The colored bar at the bottom displays the relative capture performance achieved as you enable or disable options. Disabling options will move the indicator to the right (maximum performance), while enabling functions will move the indicator to the left (minimum performance).
4. Click OK.
484 Optimizing capture performance

OmniPeek User Guide
ANYOP_UG.book Page 485 Friday, February 5, 2016 4:47 PM
Note You can highlight the Analysis Modules (OmniPeek console only), Node Statistics, Node/Protocol Detail Statistics, Protocol Statistics, and Voice & Video Analysis options and then click Details to display additional options for controlling the use of resources by these options. Click Help on the dialogs that appear for information on the available options and settings.
Optimizing capture performance 485

Chapter 22: Configuring Options
ANYOP_UG.book Page 486 Friday, February 5, 2016 4:47 PM
486 Optimizing capture performance

C H A P T E R 23
ANYOP_UG.book Page 487 Friday, February 5, 2016 4:47 PM
Capturing Data for Wireless Analysis
In this chapter:
About 802.11 . . . . . . . . . . . . . . . . . . . . . . . . . . . . . . . . . . . . . . . . . . . . . . . . . . 488
Configuring wireless channels and encryption . . . . . . . . . . . . . . . . . . . . . . . . . 488
Troubleshooting WLAN. . . . . . . . . . . . . . . . . . . . . . . . . . . . . . . . . . . . . . . . . . . 494
Optimizing wireless analysis. . . . . . . . . . . . . . . . . . . . . . . . . . . . . . . . . . . . . . . 495
Roaming latency analysis. . . . . . . . . . . . . . . . . . . . . . . . . . . . . . . . . . . . . . . . . 496
487

Chapter 23: Capturing Data for Wireless Analysis
ANYOP_UG.book Page 488 Friday, February 5, 2016 4:47 PM
About 802.11You can use OmniPeek to capture and monitor 802.11 WLAN traffic on your network. A sup-ported wireless adapter must be selected as the capture or monitor adapter, and the adapter must have the appropriate Savvius wireless driver installed. Check the Readme in the driver folder (for example, C:\Program Files\Savvius\OmniPeek\Driver) for installation instructions. You can also download the appropriate drivers from http://www.savvius.com/support/down-loads/drivers. See also System requirements on page 5 and Supported adapters on page 6 for additional information on wireless adapters and driver requirements.
Important! Changes made to the settings of a particular adapter are applied whenever that adapter is selected as the capture or monitor adapter. Changes made to the channel value for an adapter being used in multiple captures are globally applied to all captures.
Configuring wireless channels and encryptionWhen a wireless adapter is selected as the capture or monitor adapter, you can specify the channel settings used by the adapter to listen for traffic on your 802.11 WLAN. You can choose to listen for traffic occurring on a specific channel, or scan a range of channels. Additionally, if WEP, WPA (using a pre-shared key), or WPA2 (using a pre-shared key) encryption is enabled on your network, you can define or select key sets used to decrypt the WEP, WPA, or WPA2 encryption.
To configure wireless channels and encryption:
1. Open the Capture Options or Monitor Options dialog.
Note For a Capture Engine, you will need to open the 802.11 tab of the Adapter Options dialog. To open the Adapter Options dialog, click the Adapters tab in the Capture Engines window and then click Options for the selected wireless adapter.
2. Select the 802.11 options (or 802.11 tab).
488 About 802.11

OmniPeek User Guide
ANYOP_UG.book Page 489 Friday, February 5, 2016 4:47 PM
3. Select the option for selecting channels:
• Number: Select this option to specify a specific channel, and then select the channel from the list.
Configuring wireless channels and encryption 489

Chapter 23: Capturing Data for Wireless Analysis
ANYOP_UG.book Page 490 Friday, February 5, 2016 4:47 PM
• Scan: Select this option to scan for traffic on multiple channels. You will need to click Edit Scanning Options to select the channels. See Edit scanning options below.
4. If WEP, WPA, or WPA2 encryption is enabled on your network, select the key set used to decrypt the WEP, WPA, or WPA2 encryption. See Edit key sets on page 491 to define or edit key sets.
Edit scanning options
From the 802.11 options in the Capture Options or Monitor Options dialog, you can specify and configure channels to scan. Scanning multiple channels can be invaluable when trouble-shooting interference or optimizing the location and channel choice for new access points. Channel scanning is often used in conjunction with the WLAN, Channel, and Signal statistics.
Note If WPA/WPA2 decryption using a pre-shared key is enabled on your network, we recommend not enabling the Edit Scanning option in order to make sure that all packets required for decryption are captured. A four-way (WPA2) or six-way (WPA) handshake authentication establishes the PTK (Pairwise Transient Key) and GTK (Group Transient Key) used for decryption. All of the EAPOL key exchanges must be captured to derive the PTK and GTK.
To select channels to scan:
1. Open the Capture Options or Monitor Options dialog.
2. Select the 802.11 options.
3. Select the Scan option and then click Edit Scanning Options. The Channel Scanning Options dialog appears, listing the channels appropriate to the current adapter.
490 Configuring wireless channels and encryption

OmniPeek User Guide
ANYOP_UG.book Page 491 Friday, February 5, 2016 4:47 PM
4. Select the check box of the channels you want to include in the scan. (Right-click inside the dialog to display options for enabling and disabling channels.)
Tip Click a value in the Duration column to configure the amount of time you want OmniPeek to listen for traffic on the channel.
5. Click OK.
Edit key sets
From the 802.11 options in the Capture Options or Monitor Options dialog, you can define or edit key sets used to decrypt WEP, WPA, or WPA2 encryption. You must first display the Key Sets dialog in order to define or edit a key set.
To display the Key Sets dialog:
1. Open the Capture Options or Monitor Options dialog.
2. Select the 802.11 options.
3. Click Edit Key Sets. The Key Sets dialog appears.
Edit key sets 491

Chapter 23: Capturing Data for Wireless Analysis
ANYOP_UG.book Page 492 Friday, February 5, 2016 4:47 PM
4. Click Insert, Edit, Duplicate, or Delete to insert, edit, duplicate, or delete a key set.
Defining a new key set
To define (insert) a new key set:
1. From the Key Sets dialog, click Insert. The Edit Key Set dialog appears.
2. Enter the Name for the key set.
3. Select the key type from the list:
492 Configuring wireless channels and encryption
OmniPeek User Guide
ANYOP_UG.book Page 493 Friday, February 5, 2016 4:47 PM
• WEP: 64-bit Shared Key: The key that you enter must consist of 10 hexadecimal digits (0-9, A-F). You can define up to four keys.
• WEP: 128-bit Shared Key: The key that you enter must consist of 26 hexadecimal digits (0-9, A-F). You can define up to four keys.
• WEP: 152-bit Shared Key: The key that you enter must consist of 32 hexadecimal digits (0-9, A-F). You can define up to four keys.
• WEP: User defined length Shared Key: The key that you enter can consist of an arbitrary length (0-9, A-F; up to 506 hex characters, or 253 bytes). You can define up to four keys.
• WPA/WPA2: 256-bit Pre-Shared Key: The key that you enter must consist of 64 hexadecimal digits (0-9, A-F). Only one key can be defined.
• WPA/WPA2: Passphrase: You must enter both the Phrase (the same passphrase used in configuring the access point for WPA/WPA2) and SSID (the name of the wireless network) to use in creating the pre-shared Key (which appears as the Key).
Note In all of these cases, the encryption algorithm adds an additional three bytes to the keys.
Tip You can clear the Hide typing check box to show the actual characters of the hex number used for the key set and passphrase contents. Selecting the Hide typing check box adds another level of security by replacing the actual characters on the screen with dots.
4. Enter the key set(s) or Passphrase for the key type you have selected.
5. Click OK.
For information on applying a key set to decrypt all or some of the WEP or WPA-encrypted packets directly from either the Packets view or packet decode window, see Applying decryp-tion in the Packets view on page 147 or Decoding packets on page 152.
Editing a key set
To edit an existing key set:
• From the Key Sets dialog, select a key set and click Edit. The Edit Key Set dialog appears. The steps to edit the key set are essentially the same as when you define the key set, as explained above.
Edit key sets 493

Chapter 23: Capturing Data for Wireless Analysis
ANYOP_UG.book Page 494 Friday, February 5, 2016 4:47 PM
Duplicating a key set
To duplicate an existing key set:
1. From the Key Sets dialog, select a key set and click Duplicate. A copy of the key set is immediately added to the existing list.
2. You can edit the copy of the key set as explained above.
Deleting a key set
To delete an existing key set:
1. From the Key Sets dialog, select a key set and click Delete.
2. Click Yes to delete the key set.
Troubleshooting WLANTo troubleshoot a WLAN, you must first capture the wireless data carrying the WLAN infor-mation. Capturing data for wireless analysis can be broken down into two main categories: portable and distributed. The type of data captured and retained varies depending on the intended use of the data.
Portable analysis
Portable analysis requires that the analyst be present at the source of data collection with the appropriate hardware and software to perform the analysis. Portable analysis using OmniPeek is typically done with a laptop computer running OmniPeek, using one or more supported wireless adapters.
Distributed analysis
Distributed analysis allows the analyst to collect data from remote locations and analyze the data locally. This eliminates costly visits to remote locations for portable analysis. OmniPeek supports two primary methods for distributed analysis.
Remote Adapters
If you have an Aruba or Cisco access point, you can stream packets from one or more of those access points into a wireless capture window in OmniPeek. See Capturing Packets from an Access Point Capture Adapter on page 48.
494 Troubleshooting WLAN
OmniPeek User Guide
ANYOP_UG.book Page 495 Friday, February 5, 2016 4:47 PM
Note Capturing packets from an access point and streaming those packets directly to an OmniPeek computer is not supported from a Capture Engine, except for an Omnipliance WiFi.
Capture Engines
Capture Engines provide data capture and analysis 24 hours a day without requiring ongoing monitoring by the analyst. Capture Engines are Windows software or Linux appliances (Omnipliances) that are designed for continuous, remote operation. For wireless analysis, supported wireless adapters need to be added to enable wireless capture. Capture Engines are controlled using OmniPeek as a console. See Chapter 2, Using Capture Engines with OmniPeek.
Optimizing wireless analysisOmniPeek is designed for a wide range of analysis tasks, but very often only a limited set of analysis options are pertinent to the task at hand. Here are some guidelines for configuring various analysis options to optimize performance for wireless analysis:
• Analysis Options: The analysis capabilities of OmniPeek are broken down into functional options. It is often the case that not all functional analysis options will be needed for the work being done. Turning off unnecessary analysis options will improve OmniPeek performance. To view and turn off unneeded analysis options when starting a new capture, see Optimizing capture performance on page 483.
Note If you later find that you need a certain analysis option that you disabled, and you saved the packet capture files, just enable the analysis option and open the packet file to see the newly enabled analysis results.
• Expert Event Analysis: In addition to functional analysis options, OmniPeek continually monitors the network for Expert events, network anomalies, and suboptimal performance at all layers of the network, from application to physical. It also shows network events associated with wireless-specific anomalies and VoIP calls. Each individual Expert event can be enabled or disabled separately. It is important to review the Expert events to ensure that events you want to analyze are enabled. Once a capture is started, choose any one of the Expert Views from the left-hand navigation of the main Capture Window, and then click Expert EventFinder Settings. The Expert EventFinder Settings dialog box appears, allowing each individual Expert event to be configured and enabled or disabled. Pay special attention to the VoIP and Wireless Expert Events, as these can be extremely useful in identifying VoWLAN issues before they become serious problems.
Optimizing wireless analysis 495
Chapter 23: Capturing Data for Wireless Analysis
ANYOP_UG.book Page 496 Friday, February 5, 2016 4:47 PM
• Multichannel Analysis: Multichannel analysis allows multiple, simultaneous captures on unique wireless channels with all captured packets analyzed as if it is a single capture. This is extremely useful for analyzing situations where users are roaming from channel to channel, or when it is known where a problem is but not what channel the wireless client is using. See Capturing Packets from an Aggregator/Roaming Adapter on page 50.
• Roaming: Roaming latency analysis provides detailed information every time a wireless client moves from one AP to another. Roaming latency analysis requires multichannel analysis since roaming typically involves a change in channel. See Roaming latency analysis on page 496.
Note Roaming assumes wireless clients are moving from one channel to another channel. This can be on the same AP, or across different APs. If the capture is scanning, roaming will be detected and reported but the latency measurements may not be accurate. For best results, roaming should be used along with the Wireless Channel Aggregator, or aggregation using an AP remote adapter. See Capturing Packets from an Aggregator/Roaming Adapter on page 50.
• The VoIP Dashboard: The Voice & Video dashboard provides a visual summary of voice and video calls, including VoWLAN calls, as well as useful graphs and statistics to troubleshoot and analyze voice and video traffic. See Voice & Video dashboard on page 78.
• Voice & Video Views: The Voice & Video views in capture windows provide simultaneous analysis of voice and video traffic, including VoWLAN calls, with subjective and objective quality metrics. The Calls view displays one row for each call in a capture. and the Media view displays one row for each RTP media flow in a call. See Voice & Video view window on page 312.
Roaming latency analysisRoaming latency is the amount of time it takes for a wireless client to move from one access point to another. You can use OmniPeek to perform roaming latency analysis by measuring the amount of time between the last known data packet for a device on one access point, and the first data packet seen for that device on another access point. This is extremely useful in determining whether latency is caused by devices on the network, applications on the net-work, or the network itself.
Roaming latency analysis requires multichannel analysis since roaming typically involves a change in one or more channels. See Capturing Packets from an Aggregator/Roaming Adapter on page 50. Once you have started capturing from one or more of the wireless adapters, you can see the roaming latency data displayed in the three Roaming views: Log, by Node, and by AP.
496 Roaming latency analysis

OmniPeek User Guide
ANYOP_UG.book Page 497 Friday, February 5, 2016 4:47 PM
Tip Double-click an entry inside each of the Roaming views to filter and view the packets associated with that entry.
Log
The Log view displays a log entry each time a roaming device is detected.
by Node
The by Node view displays an entry for each device, and maintains an average latency value for that device.
Log 497
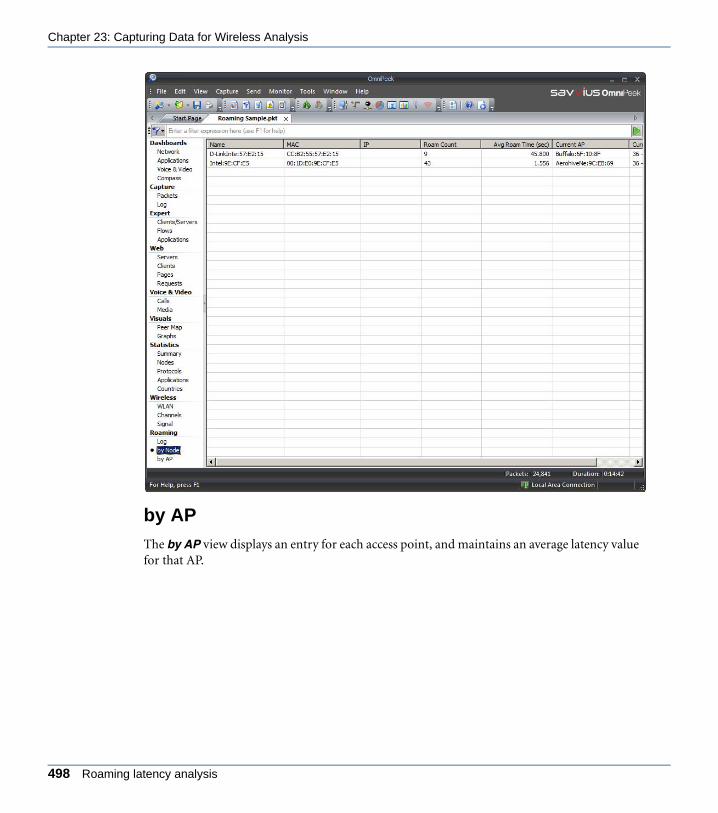
Chapter 23: Capturing Data for Wireless Analysis
ANYOP_UG.book Page 498 Friday, February 5, 2016 4:47 PM
by AP
The by AP view displays an entry for each access point, and maintains an average latency value for that AP.
498 Roaming latency analysis

OmniPeek User Guide
ANYOP_UG.book Page 499 Friday, February 5, 2016 4:47 PM
by AP 499

Chapter 23: Capturing Data for Wireless Analysis
ANYOP_UG.book Page 500 Friday, February 5, 2016 4:47 PM
500 Roaming latency analysis

C H A P T E R 24
ANYOP_UG.book Page 501 Friday, February 5, 2016 4:47 PM
Configuring Analyzer Cards
In this chapter:
About analyzer cards . . . . . . . . . . . . . . . . . . . . . . . . . . . . . . . . . . . . . . . . . . . . 502
Configuring hardware profiles for adapters . . . . . . . . . . . . . . . . . . . . . . . . . . . 502
501
Chapter 24: Configuring Analyzer Cards
ANYOP_UG.book Page 502 Friday, February 5, 2016 4:47 PM
About analyzer cardsThe Savvius analyzer cards (Adapter for Omnipliances) are separately purchased cards used exclusively with Savvius Omnipliances. Adapters for Omnipliances are optimized for full-duplex, 10 Gigabit, or 40 Gigabit Ethernet capture.
For card installation instructions, hardware setup, technical specifications, and related infor-mation, please see the documentation that ships with the card.
If you have an Adapter for Omnipliance already installed, you can define one hardware profile for the adapter from within OmniPeek. See Configuring hardware profiles for adapters.
Important! Changes made to the settings of a particular adapter are applied whenever that adapter is selected as the capture or monitor adapter.
Configuring hardware profiles for adaptersThe Hardware Profiles view of the Capture Options or Monitor Options dialog allows you to define and manage hardware profiles that are used with adapters for Omnipliances. Packet slicing, error packet capture, and filters based on address or port are implemented on the card in hardware.
Note Only one hardware profile can be implemented on an adapter at one time.
502 About analyzer cards

OmniPeek User Guide
ANYOP_UG.book Page 503 Friday, February 5, 2016 4:47 PM
All currently defined hardware profiles are listed in the Hardware Profiles view of the Cap-ture Options or Monitor Options dialog.
Note Click Help on the dialog to learn about the available options and settings.
To create a new hardware profile:
1. Open the Capture Options or Monitor Options dialog.
2. Click the Hardware Profiles view.
3. Click Insert. The Insert Hardware Profile dialog appears.
InsertEditDuplicate Import
Delete Export
Configuring hardware profiles for adapters 503
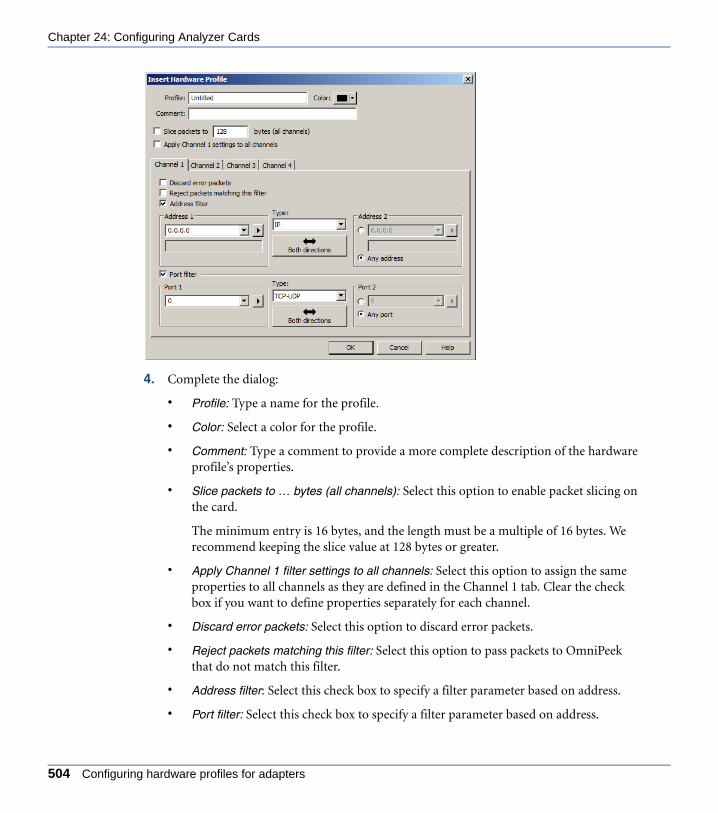
Chapter 24: Configuring Analyzer Cards
ANYOP_UG.book Page 504 Friday, February 5, 2016 4:47 PM
4. Complete the dialog:
• Profile: Type a name for the profile.
• Color: Select a color for the profile.
• Comment: Type a comment to provide a more complete description of the hardware profile’s properties.
• Slice packets to … bytes (all channels): Select this option to enable packet slicing on the card.
The minimum entry is 16 bytes, and the length must be a multiple of 16 bytes. We recommend keeping the slice value at 128 bytes or greater.
• Apply Channel 1 filter settings to all channels: Select this option to assign the same properties to all channels as they are defined in the Channel 1 tab. Clear the check box if you want to define properties separately for each channel.
• Discard error packets: Select this option to discard error packets.
• Reject packets matching this filter: Select this option to pass packets to OmniPeek that do not match this filter.
• Address filter: Select this check box to specify a filter parameter based on address.
• Port filter: Select this check box to specify a filter parameter based on address.
504 Configuring hardware profiles for adapters
OmniPeek User Guide
ANYOP_UG.book Page 505 Friday, February 5, 2016 4:47 PM
5. Click OK to accept your changes. The new hardware profile is listed in the Hardware Profiles view.
Note Hardware profiles on the adapters automatically compensate for packets with Cisco ISL tags and 802.1Q VLAN tags, correctly identifying ports and addresses regardless of the presence of these tags.
To export selected hardware profiles:
1. Select the hardware profiles in the Hardware Profiles view, right-click, and choose Export Selected…. A Save As dialog appears.
2. Specify the location and name under for the hardware profiles (*.flt) file.
Note Hardware profiles and the software filter files used in OmniPeek share the same *.flt file extension. OmniPeek can distinguish between hardware and software filters. For information on software filters, see Chapter 6, Creating and Using Filters.
Configuring hardware profiles for adapters on a Capture Engine
When an adapter for Omnipliance is the selected adapter on a Capture Engine, the Hardware Profiles tab appears in the Adapter Options dialog.
Configuring hardware profiles for adapters on a Capture Engine 505

Chapter 24: Configuring Analyzer Cards
ANYOP_UG.book Page 506 Friday, February 5, 2016 4:47 PM
To create a new hardware profile on a Capture Engine:
1. Select an adapter for Omnipliance from the Adapters tab of the Capture Engines window.
2. Click Options for the adapter. The Adapter Options dialog appears.
3. Click the Hardware Profiles tab.
4. Click Insert. The Insert Hardware Profile dialog appears.
5. Complete the Insert Hardware Profile dialog.
Note Click Help on the dialog to learn about the available options and settings.
6. Click OK to add the new hardware profile to the list of profiles.
7. Click the Click here to send changes message to send your changes to the Capture Engine.
Important! Because the hardware profile definitions reside on a Capture Engine, you must send all changes to a Capture Engine when you use the Insert, Edit, Duplicate, or Delete functions.
InsertEdit
DuplicateDelete Import
ExportUncheck All
RefreshClick here to send changes
506 Configuring hardware profiles for adapters
C H A P T E R 25
ANYOP_UG.book Page 507 Friday, February 5, 2016 4:47 PM
OmniPeek Remote Assistant
In this chapter:
About OmniPeek Remote Assistant . . . . . . . . . . . . . . . . . . . . . . . . . . . . . . . . . 508
Generating an ORA management file . . . . . . . . . . . . . . . . . . . . . . . . . . . . . . . 508
Generating encrypted capture files. . . . . . . . . . . . . . . . . . . . . . . . . . . . . . . . . . 509
Opening an encrypted capture file . . . . . . . . . . . . . . . . . . . . . . . . . . . . . . . . . . 511
Importing an ORA management file . . . . . . . . . . . . . . . . . . . . . . . . . . . . . . . . . 512
Exporting ORA management file . . . . . . . . . . . . . . . . . . . . . . . . . . . . . . . . . . . 512
Upgrading the number of ORA licenses . . . . . . . . . . . . . . . . . . . . . . . . . . . . . . 512
507

Chapter 25: OmniPeek Remote Assistant
ANYOP_UG.book Page 508 Friday, February 5, 2016 4:47 PM
About OmniPeek Remote AssistantOmniPeek Remote Assistant (ORA) is an easy to use, fully secure tool for troubleshooting wired and wireless networks. ORA allows remote users to easily collect critical network data needed for troubleshooting network problems. The network data (also known as “captures”) is fully encrypted and can only be accessed by the analyst requesting the data. Once the data has been collected and stored locally on the computer running ORA, the files can be trans-ferred to the analyst for further investigation using OmniPeek Enterprise.
There are three steps when using ORA:
• First, the network analyst generates an ORA session to be sent to the remote user. This session is packaged in an ORA management file (a ZIP file containing an executable file and supporting files). Each ORA session can be based on an existing ORA group (using the same security key) or a new ORA group with new encryption key. See Generating an ORA management file on page 508.
• The second step is for the remote user to extract the files from the ORA management file, and then run the ORA executable. See Generating encrypted capture files on page 509.
• The third step is for the network analyst to open and analyze the files generated from the remote user. See Opening an encrypted capture file on page 511.
You can also import and export ORA management files. Importing ORA management files allows another OmniPeek–ORA user to analyze files that they did not generate themselves. See Importing an ORA management file on page 512. Exporting ORA management files allows a user to authorize another OmniPeek–ORA user to open and analyze files generated by the original user. See Exporting ORA management file on page 512.
OmniPeek Enterprise includes five ORA licenses by default. Each license allows for unlimited analysis from one remote computer. To obtain additional ORA licenses, contact Savvius sales. See Upgrading the number of ORA licenses on page 512.
Generating an ORA management fileTo begin using ORA, an ORA session must be created and packaged in an ORA management file. The ORA management file is then sent to the remote user.
To generate an ORA management file:
1. On the Tools menu, click Options. The Options dialog appears.
2. Click ORA Groups. The ORA Groups dialog appears.
508 About OmniPeek Remote Assistant
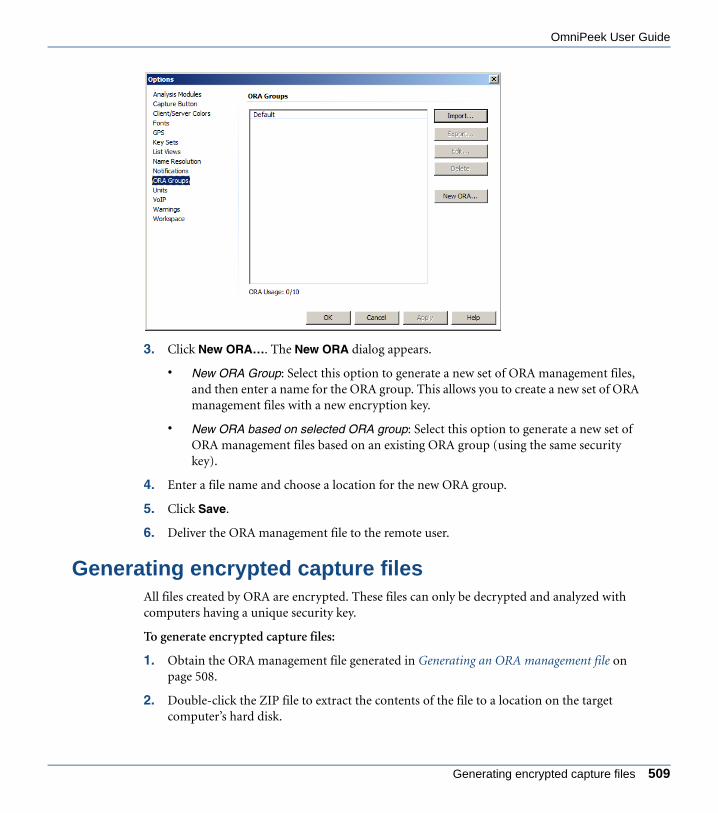
OmniPeek User Guide
ANYOP_UG.book Page 509 Friday, February 5, 2016 4:47 PM
3. Click New ORA…. The New ORA dialog appears.
• New ORA Group: Select this option to generate a new set of ORA management files, and then enter a name for the ORA group. This allows you to create a new set of ORA management files with a new encryption key.
• New ORA based on selected ORA group: Select this option to generate a new set of ORA management files based on an existing ORA group (using the same security key).
4. Enter a file name and choose a location for the new ORA group.
5. Click Save.
6. Deliver the ORA management file to the remote user.
Generating encrypted capture filesAll files created by ORA are encrypted. These files can only be decrypted and analyzed with computers having a unique security key.
To generate encrypted capture files:
1. Obtain the ORA management file generated in Generating an ORA management file on page 508.
2. Double-click the ZIP file to extract the contents of the file to a location on the target computer’s hard disk.
Generating encrypted capture files 509

Chapter 25: OmniPeek Remote Assistant
ANYOP_UG.book Page 510 Friday, February 5, 2016 4:47 PM
3. Double-click the ORA application file (OmniPeekRemoteAssistant.exe). The main program window appears. The parts of the main program window are described below.
• Wired Adapters: Select this option to choose from a list of available wired network adapters installed on the ORA computer. You cannot select a combination of both wired and wireless adapters.
• Wireless Adapters: Select this option to choose from a list of available wireless network adapters installed on the ORA computer. You cannot select a combination of both wired and wireless adapters. The wireless adapter must be a supported adapter with the appropriate driver installed. Please visit https://www.savvius.com/support/downloads/drivers for information on obtaining and installing the driver for your wireless adapter.
• Adapter List: The adapter list displays and allows you to select from the available wired or wireless network adapters installed on the ORA computer. You cannot select a combination of both wired and wireless adapters.
If a wireless network adapter is selected, the Channel drop down menu is enabled, allowing the selection of a wireless channel.
510 Generating encrypted capture files
OmniPeek User Guide
ANYOP_UG.book Page 511 Friday, February 5, 2016 4:47 PM
Note If you are using a supported wireless network adapter, check with your network analyst to ensure you have the appropriate Savvius supported wireless driver installed. You must have a supported wireless adapter and driver to capture 802.11 traffic.
• File Properties: The File Properties let you choose a folder path and specify the maximum rollover file size of a file before a new file is created. The folder path can be entered directly into the folder path edit box, or selected by clicking Browse. All files created by ORA are saved as encrypted Savvius capture files (*.pke), and are appended with a timestamp so that each new file created with the same folder path and file name is unique.
• Capture Control: The Capture Controls let you start and stop captures. Start and Stop are enabled only when the configuration is correct. Start is disabled until a valid adapter has been selected. Once the capture has been started, the main program window, except for Stop, is disabled. While the capture is running, the Total Packets, Total Bytes, and Capture Duration are displayed in real-time. When Stop is clicked, the main program window is reenabled.
4. In the Adapter List, select one or more wired adapters, or one or more wireless adapters. You cannot select a combination of both wired and wireless adapters.
5. In the File Properties, enter or select a folder path for your encrypted capture files.
Each file that is created includes a prefix (default prefix is ‘Packet’) and timestamp in its filename. The file is saved as a Savvius encrypted capture file (*.pke).
6. In the File Properties, specify a rollover file size (in MBs) for each capture file before a new capture file is created.
7. Click Start to begin generating capture files.
8. Click Stop when you want to stop generating capture files.
9. Deliver your encrypted capture files to your network analyst per their instructions.
Opening an encrypted capture fileEncrypted ORA capture files (*.pke) can be opened in OmniPeek in the following ways:
• Double-click the file from Windows Explorer
• On the File menu, click Open
Opening an encrypted capture file 511

Chapter 25: OmniPeek Remote Assistant
ANYOP_UG.book Page 512 Friday, February 5, 2016 4:47 PM
Importing an ORA management fileImporting an ORA management file allows another OmniPeek–ORA user to analyze files that they did not generate themselves. The user simply imports the ORA management file from the original computer that generated the ORA session. Once imported, any *.pke files generated with that ORA/encryption key combination can be opened and analyzed.
To import an ORA management file:
1. On the Tools menu, click Options. The Options dialog appears.
2. Click ORA Groups. The ORA Groups dialog appears.
3. Click Import.
4. Select the ORA management file (*.zip). The ORA management file must have been previously exported by the original user using the ORA Groups dialog in OmniPeek.
5. Click Open.
Exporting ORA management fileExporting an ORA management file allows a user to authorize another OmniPeek–ORA user to open and analyze files generated by the original user. The original user must export the ORA management file and make it available to the new user, who must then import the file.
To export an ORA management file:
1. On the Tools menu, click Options. The Options dialog appears.
2. Click ORA Groups.
3. Click Export.
4. Name the ORA management file (*.zip).
5. Click Save.
Upgrading the number of ORA licensesOmniPeek Enterprise includes five ORA licenses by default. Each license allows for unlimited analysis from one remote computer. The number of used and available licenses are displayed in the ORA Groups dialog. To obtain additional ORA licenses, contact Savvius sales. You will need to either update an existing serial number, or obtain a new one and enter the number in the OmniPeek Serial Number dialog available from the Support Information dialog under About OmniPeek.
512 Importing an ORA management file
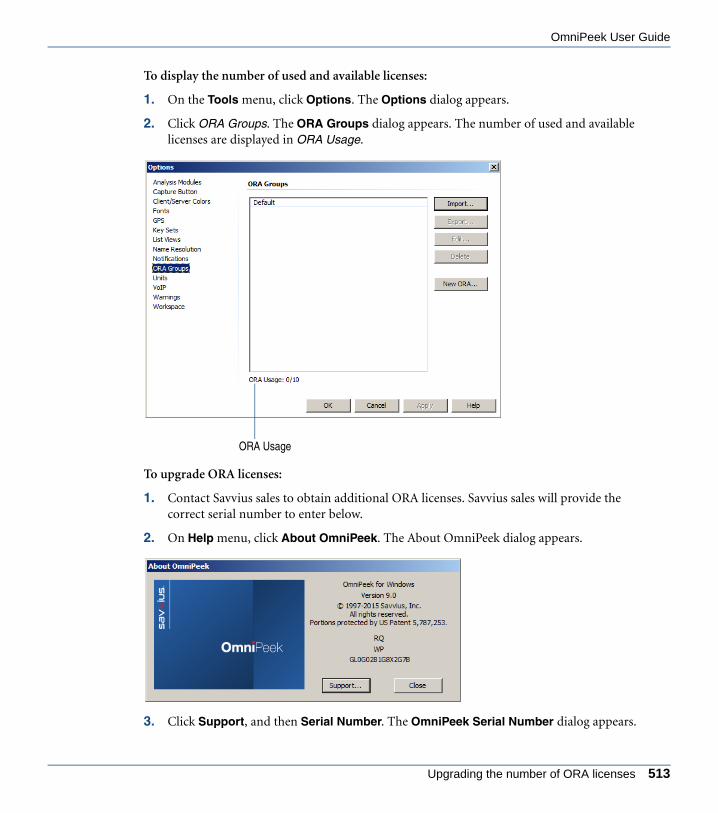
OmniPeek User Guide
ANYOP_UG.book Page 513 Friday, February 5, 2016 4:47 PM
To display the number of used and available licenses:
1. On the Tools menu, click Options. The Options dialog appears.
2. Click ORA Groups. The ORA Groups dialog appears. The number of used and available licenses are displayed in ORA Usage.
To upgrade ORA licenses:
1. Contact Savvius sales to obtain additional ORA licenses. Savvius sales will provide the correct serial number to enter below.
2. On Help menu, click About OmniPeek. The About OmniPeek dialog appears.
3. Click Support, and then Serial Number. The OmniPeek Serial Number dialog appears.
ORA Usage
Upgrading the number of ORA licenses 513
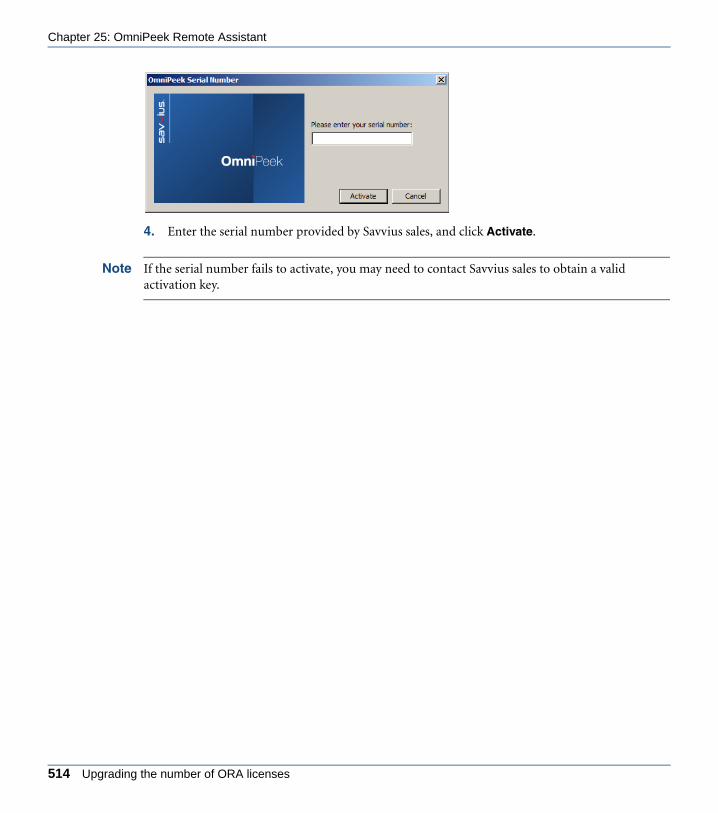
Chapter 25: OmniPeek Remote Assistant
ANYOP_UG.book Page 514 Friday, February 5, 2016 4:47 PM
4. Enter the serial number provided by Savvius sales, and click Activate.
Note If the serial number fails to activate, you may need to contact Savvius sales to obtain a valid activation key.
514 Upgrading the number of ORA licenses

C H A P T E R 26
ANYOP_UG.book Page 515 Friday, February 5, 2016 4:47 PM
Global Positioning System
In this chapter:
About GPS . . . . . . . . . . . . . . . . . . . . . . . . . . . . . . . . . . . . . . . . . . . . . . . . . . . . 516
Enabling GPS . . . . . . . . . . . . . . . . . . . . . . . . . . . . . . . . . . . . . . . . . . . . . . . . . . 516
Starting the Savvius GPS daemon from the system tray . . . . . . . . . . . . . . . . . 517
GPS columns in the Packets view . . . . . . . . . . . . . . . . . . . . . . . . . . . . . . . . . . 518
515
Chapter 26: Global Positioning System
ANYOP_UG.book Page 516 Friday, February 5, 2016 4:47 PM
About GPSGPS (Global Positioning System) is a system of navigational satellites. Commercially available GPS receivers can calculate and report their geographical position and other navigational data (called a fix) based on signals transmitted by these satellites.
Note The GPS feature is not supported in the 64-bit version of OmniPeek.
OmniPeek can display data provided by a separately purchased GPS receiver. For each packet, optional columns in the Packets view can show the GPS Time, Latitude, Longitude, Altitude, and Speed currently reported by the connected GPS receiver. This is especially useful if you needed to identify where you were when you received a set of packets.
Note The GPS receiver requires clear access to the GPS satellites in order to display data in OmniPeek.
For example, if you worked on a large military base, you might need to identify the reach of your wireless network. Using OmniPeek and the GPS receiver, you could drive around the base capturing wireless packets with the GPS device providing you with coordinates. The resulting captures would provide a set of packets with their signal strengths from your network and a set of coordinates for your location.
OmniPeek uses a separate utility, the Savvius GPS Daemon, as the interface between itself and your GPS receiver. The daemon supports GPS receivers that follow the NMEA (National Marine Equipment Association) 0183 standard which provides data in recognized GPS sen-tences (comma-separated ASCII data strings) in the GPRMC and GPGGA formats.
Refer to the manufacturer’s instructions for your particular GPS receiver for information on how to use features of your GPS receiver.
Enabling GPSTo enable GPS in OmniPeek:
1. Connect a supported GPS receiver to the USB port on the computer running OmniPeek.
2. Turn on the GPS receiver.
3. In OmniPeek, on the Tools menu, click Options. The Options dialog appears.
4. Click the GPS view.
516 About GPS

OmniPeek User Guide
ANYOP_UG.book Page 517 Friday, February 5, 2016 4:47 PM
Configure the GPS options:
• Select the Enable GPS check box to start the Savvius GPS Daemon whenever OmniPeek is started (or when you click OK or Apply of the dialog). See Starting the Savvius GPS daemon from the system tray to learn more about using the Savvius GPS Daemon.
• In the GPS communication port list, select the communications port (USB) to which the GPS receiver is connected.
• Select the Synchronize system clock to GPS time check box to update the system clock of the host computer to the time reported by the GPS receiver any time the system clock is more than 59 seconds out of sync with the GPS receiver time.
5. Click OK.
Starting the Savvius GPS daemon from the system trayThe Savvius GPS daemon provides another way (in addition to the Options dialog) to select the USB port used for GPS communication. GPS messages formatted in the NMEA standard are also displayed when you start the Savvius GPS daemon from the system tray.
To start the GPS Daemon from the system tray:
1. Double-click the Savvius GPS Daemon icon in the Windows system tray.
Starting the Savvius GPS daemon from the system tray 517
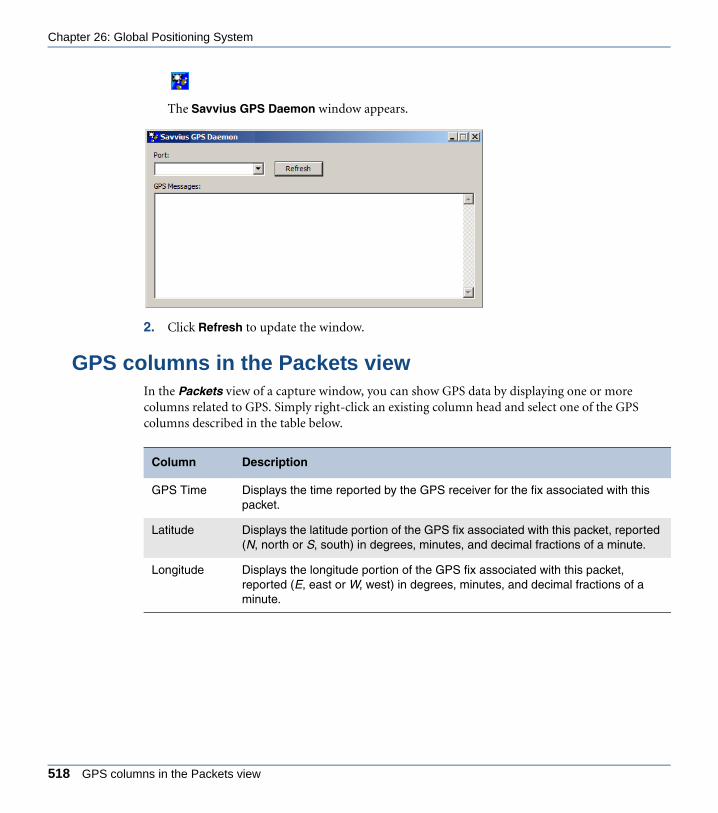
Chapter 26: Global Positioning System
ANYOP_UG.book Page 518 Friday, February 5, 2016 4:47 PM
The Savvius GPS Daemon window appears.
2. Click Refresh to update the window.
GPS columns in the Packets viewIn the Packets view of a capture window, you can show GPS data by displaying one or more columns related to GPS. Simply right-click an existing column head and select one of the GPS columns described in the table below.
Column Description
GPS Time Displays the time reported by the GPS receiver for the fix associated with this packet.
Latitude Displays the latitude portion of the GPS fix associated with this packet, reported (N, north or S, south) in degrees, minutes, and decimal fractions of a minute.
Longitude Displays the longitude portion of the GPS fix associated with this packet, reported (E, east or W, west) in degrees, minutes, and decimal fractions of a minute.
518 GPS columns in the Packets view

OmniPeek User Guide
ANYOP_UG.book Page 519 Friday, February 5, 2016 4:47 PM
The following figure shows an example of the latitude and longitude columns in a capture window:
Altitude Displays the altitude portion of the GPS fix associated with this packet. Reported in the measurement system appropriate to the local settings associ-ated with the user in the operating system. (US users in feet, all others in meters.)
Speed Displays the speed portion of the GPS fix associated with this packet. Reported in the measurement system appropriate to the local settings associated with the user in the operating system. (US and UK users in miles per hour, all others in kilometers per hour.)
Column Description
GPS columns in the Packets view 519

Chapter 26: Global Positioning System
ANYOP_UG.book Page 520 Friday, February 5, 2016 4:47 PM
The GPS columns remain blank until GPS data is available. Once GPS data becomes available, the columns will show either GPS data or N/A. During capture, data is posted to these columns as it is passed from the GPS receiver by the Savvius GPS Daemon.
GPS receivers typically send a new fix every one or two seconds. The capture window will con-tinue to use the last valid fix for a short interval. When the next fix is posted, the capture win-dow will begin using this new fix for all captured packets. If the new fix is based on NMEA sentences flagged as invalid by the GPS receiver, the capture window will show N/A in the GPS columns.
If a new fix is not presented within the time-out (a few seconds), the capture window will also begin to show N/A for all GPS columns. This can happen for any number of reasons. One of the most common causes is that the GPS receiver has temporarily lost contact with the satel-lites.
Tip GPS receivers usually have their own integrated display. Each time they get a new fix, they typically send the data to the attached computer first, then update their display. If you are moving fast enough, you may notice some slight lag between the updates of the GPS display and the computer screen.
The native format of GPS data for distance, speed, and altitude is expressed in metric or SI units (based on the meter). OmniPeek checks the operating system settings for the current user to determine which system of measurement is appropriate. If the local settings for the user indicate that the U.S. system of measurement should be used, then Altitude is displayed in feet and Speed is displayed in miles per hour. For a user in the UK, Altitude is in meters and Speed is in miles per hour. For all other users, Altitude is in meters and Speed is in kilometers per hour.
Note Conversion to another measurement system is performed before data is posted to the capture window. When you save packets to a capture file, GPS data is saved in whichever measurement system is in use by the capture window. OmniPeek does not convert between measurement systems when opening a capture file.
520 GPS columns in the Packets view

A P P E N D I X A
ANYOP_UG.book Page 521 Friday, February 5, 2016 4:47 PM
Menus and Keyboard Shortcuts
In this appendix:
File menu . . . . . . . . . . . . . . . . . . . . . . . . . . . . . . . . . . . . . . . . . . . . . . . . . . . . . 522
Edit menu . . . . . . . . . . . . . . . . . . . . . . . . . . . . . . . . . . . . . . . . . . . . . . . . . . . . . 523
View menu . . . . . . . . . . . . . . . . . . . . . . . . . . . . . . . . . . . . . . . . . . . . . . . . . . . . 526
Capture menu. . . . . . . . . . . . . . . . . . . . . . . . . . . . . . . . . . . . . . . . . . . . . . . . . . 528
Send menu . . . . . . . . . . . . . . . . . . . . . . . . . . . . . . . . . . . . . . . . . . . . . . . . . . . . 528
Monitor menu . . . . . . . . . . . . . . . . . . . . . . . . . . . . . . . . . . . . . . . . . . . . . . . . . . 529
Tools menu . . . . . . . . . . . . . . . . . . . . . . . . . . . . . . . . . . . . . . . . . . . . . . . . . . . . 529
Window menu. . . . . . . . . . . . . . . . . . . . . . . . . . . . . . . . . . . . . . . . . . . . . . . . . . 530
Help menu . . . . . . . . . . . . . . . . . . . . . . . . . . . . . . . . . . . . . . . . . . . . . . . . . . . . 531
521
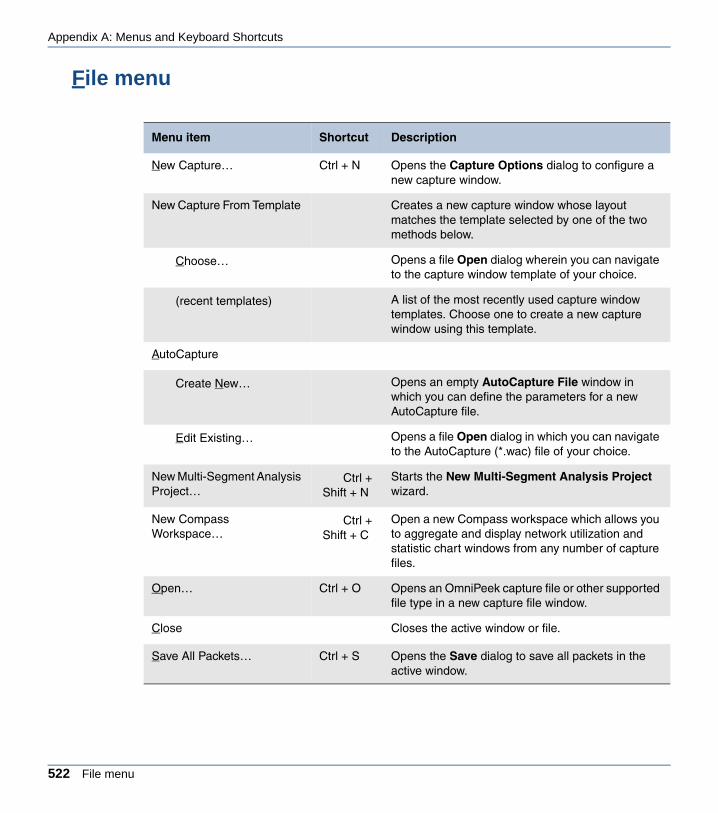
Appendix A: Menus and Keyboard Shortcuts
ANYOP_UG.book Page 522 Friday, February 5, 2016 4:47 PM
File menu
Menu item Shortcut Description
New Capture… Ctrl + N Opens the Capture Options dialog to configure a new capture window.
New Capture From Template Creates a new capture window whose layout matches the template selected by one of the two methods below.
Choose… Opens a file Open dialog wherein you can navigate to the capture window template of your choice.
(recent templates) A list of the most recently used capture window templates. Choose one to create a new capture window using this template.
AutoCapture
Create New… Opens an empty AutoCapture File window in which you can define the parameters for a new AutoCapture file.
Edit Existing… Opens a file Open dialog in which you can navigate to the AutoCapture (*.wac) file of your choice.
New Multi-Segment Analysis Project…
Ctrl +Shift + N
Starts the New Multi-Segment Analysis Project wizard.
New Compass Workspace…
Ctrl +Shift + C
Open a new Compass workspace which allows you to aggregate and display network utilization and statistic chart windows from any number of capture files.
Open… Ctrl + O Opens an OmniPeek capture file or other supported file type in a new capture file window.
Close Closes the active window or file.
Save All Packets… Ctrl + S Opens the Save dialog to save all packets in the active window.
522 File menu

OmniPeek User Guide
ANYOP_UG.book Page 523 Friday, February 5, 2016 4:47 PM
Edit menu
Save Selected Packets… Opens the Save dialog to save selected packets in the active window. This item is displayed as Save Filters…, Save Graph…, Save Names…, or as Save Log…, Save Node Statistics, and so forth, when the relevant window is active.
Save Report… Opens the Save Report dialog to choose the file format and location in which to save a report on any of several collections of statistics for the current capture window or capture file. Formats include text (*.txt, *.csv), HTML, or XML.
Save Capture Template… Opens the Save dialog to save the Capture Options of the current capture window as a capture tem-plate (*.ctf), so it can be used to format subsequent new capture windows.
Print Setup… Opens the Print Setup… dialog for configuring printer functions.
Print… Ctrl + P Prints the active window in a format appropriate to its type.
Print Selected Packets… Opens the Print dialog to allow you to print the Decode view of the selected packets as a single document.
Properties Displays various properties for the capture window.
Recent File Following the Properties command is a numbered list of recently opened capture files.
Exit Alt + F4 Quit OmniPeek.
Menu item Shortcut Description
Undo Ctrl + Z Undoes the last edit.
Redo Ctrl + Shift+ Z
Redoes the last edit.
Menu item Shortcut Description
Edit menu 523
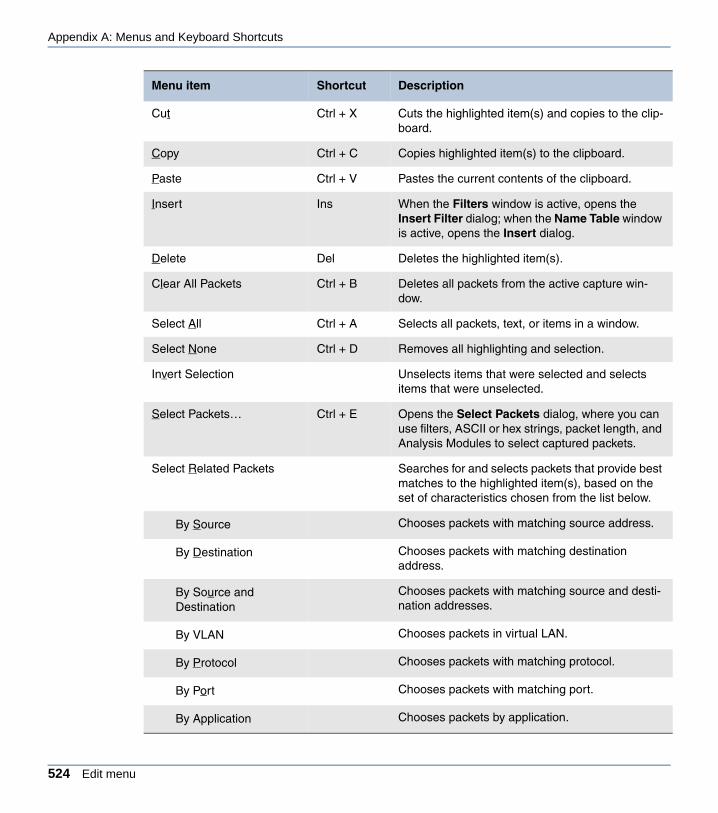
Appendix A: Menus and Keyboard Shortcuts
ANYOP_UG.book Page 524 Friday, February 5, 2016 4:47 PM
Cut Ctrl + X Cuts the highlighted item(s) and copies to the clip-board.
Copy Ctrl + C Copies highlighted item(s) to the clipboard.
Paste Ctrl + V Pastes the current contents of the clipboard.
Insert Ins When the Filters window is active, opens the Insert Filter dialog; when the Name Table window is active, opens the Insert dialog.
Delete Del Deletes the highlighted item(s).
Clear All Packets Ctrl + B Deletes all packets from the active capture win-dow.
Select All Ctrl + A Selects all packets, text, or items in a window.
Select None Ctrl + D Removes all highlighting and selection.
Invert Selection Unselects items that were selected and selects items that were unselected.
Select Packets… Ctrl + E Opens the Select Packets dialog, where you can use filters, ASCII or hex strings, packet length, and Analysis Modules to select captured packets.
Select Related Packets Searches for and selects packets that provide best matches to the highlighted item(s), based on the set of characteristics chosen from the list below.
By Source Chooses packets with matching source address.
By Destination Chooses packets with matching destination address.
By Source and Destination
Chooses packets with matching source and desti-nation addresses.
By VLAN Chooses packets in virtual LAN.
By Protocol Chooses packets with matching protocol.
By Port Chooses packets with matching port.
By Application Chooses packets by application.
Menu item Shortcut Description
524 Edit menu

OmniPeek User Guide
ANYOP_UG.book Page 525 Friday, February 5, 2016 4:47 PM
By Flow Chooses packets sent between two nodes, using the matching protocol.
Hide Selected Packets Ctrl + H Removes selected packets from the display with-out deleting them. Hidden packets are not pro-cessed further.
Hide Unselected Packets Ctrl + Shift+ H
Removes unselected packets from the display without deleting them. Hidden packets are not pro-cessed further.
Unhide All Packets Ctrl + U Restores all previously hidden packets to normal status.
Copy Selected Packets to New Window
Creates a temporary capture file window contain-ing only the selected packets.
Reprocess All Packets Forces the same recalculation of all views without hiding or unhiding any packets. Changes to Reprocess VoIP Info when you hold down the Ctrl key before selecting the Edit menu. This reprocesses only the information in the VoIP tab.
Go To… Ctrl + G Opens the Go To dialog where you can choose a packet number to jump to. If packets are selected, the number of the first selected packet is shown.
Go To Next Selected Ctrl + J Jumps to the next selected packet.
Go To Previous Selected Ctrl + Shift+J
Jumps to the previously selected packet.
Find Pattern Ctrl + F Opens the Find Pattern dialog to search for a user-defined string in specified parts of packets.
Find Next F3 Finds the next match in sequence to the previous Find Pattern search.
Menu item Shortcut Description
Edit menu 525
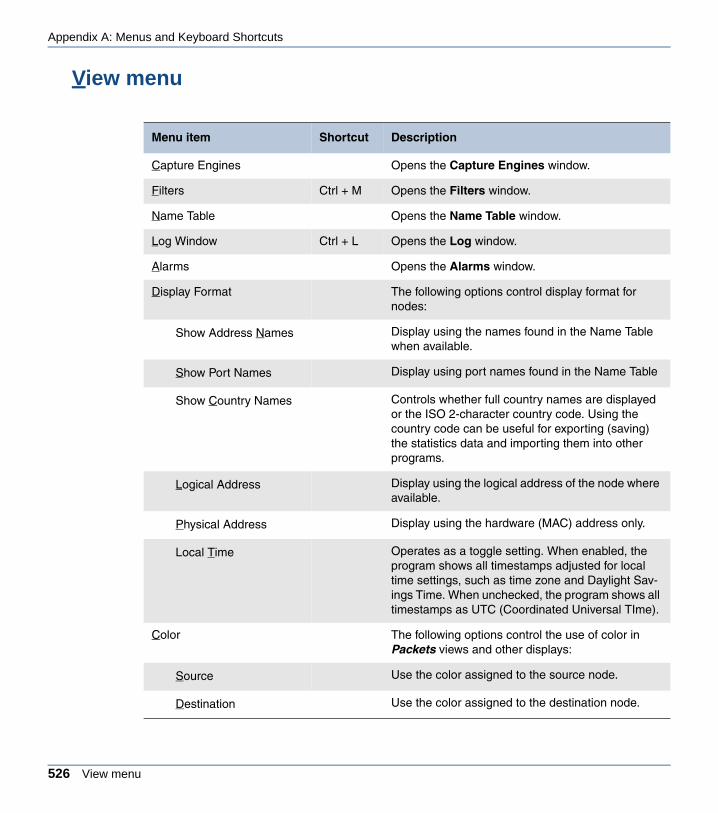
Appendix A: Menus and Keyboard Shortcuts
ANYOP_UG.book Page 526 Friday, February 5, 2016 4:47 PM
View menu
Menu item Shortcut Description
Capture Engines Opens the Capture Engines window.
Filters Ctrl + M Opens the Filters window.
Name Table Opens the Name Table window.
Log Window Ctrl + L Opens the Log window.
Alarms Opens the Alarms window.
Display Format The following options control display format for nodes:
Show Address Names Display using the names found in the Name Table when available.
Show Port Names Display using port names found in the Name Table
Show Country Names Controls whether full country names are displayed or the ISO 2-character country code. Using the country code can be useful for exporting (saving) the statistics data and importing them into other programs.
Logical Address Display using the logical address of the node where available.
Physical Address Display using the hardware (MAC) address only.
Local Time Operates as a toggle setting. When enabled, the program shows all timestamps adjusted for local time settings, such as time zone and Daylight Sav-ings Time. When unchecked, the program shows all timestamps as UTC (Coordinated Universal TIme).
Color The following options control the use of color in Packets views and other displays:
Source Use the color assigned to the source node.
Destination Use the color assigned to the destination node.
526 View menu

OmniPeek User Guide
ANYOP_UG.book Page 527 Friday, February 5, 2016 4:47 PM
Protocol Use the color assigned to the protocol.
Filter Use the color assigned to the filter that allowed the packet to be captured.
Flag Use the color assigned to flagged packets.
Independent Each item uses its own color.
No Color Use no color coding in Packets view and other dis-plays.
Toolbars The following options control the buttons that are displayed in the main window toolbar.
File Show/hide File on the toolbar.
View Show/hide View on the toolbar.
Capture/Send Show/hide Capture/Send on the toolbar.
Monitor Show/hide Monitor on the toolbar.
Options/Help Show/hide Options/Help on the toolbar.
Customize… Opens the Customize dialog for customizing Com-mands, Toolbar, Keyboard, Menu, and Options.
Status Bar Operates as a toggle setting. When enabled, dis-plays status alerts and the current adapter in a bar at the bottom of the main program window.
Full Screen F11 Displays main window as full screen. Press Esc to return to main window.
Application Look Displays application user interface in the selected theme.
Blue Displays the user interface with a blue theme.
Black Displays the user interface with a black theme.
Silver Displays the user interface with a silver theme.
Menu item Shortcut Description
View menu 527
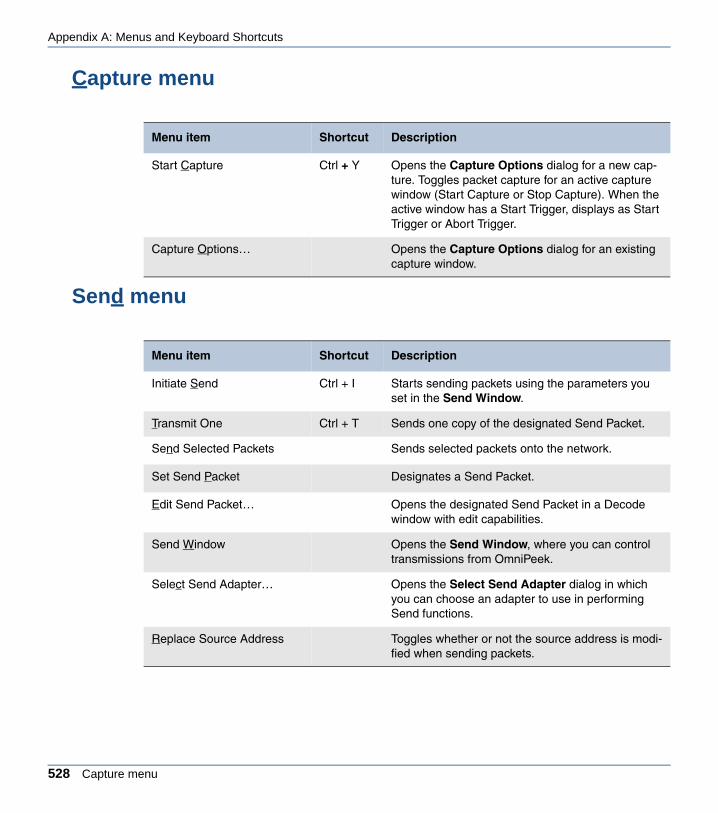
Appendix A: Menus and Keyboard Shortcuts
ANYOP_UG.book Page 528 Friday, February 5, 2016 4:47 PM
Capture menu
Send menu
Menu item Shortcut Description
Start Capture Ctrl + Y Opens the Capture Options dialog for a new cap-ture. Toggles packet capture for an active capture window (Start Capture or Stop Capture). When the active window has a Start Trigger, displays as Start Trigger or Abort Trigger.
Capture Options… Opens the Capture Options dialog for an existing capture window.
Menu item Shortcut Description
Initiate Send Ctrl + I Starts sending packets using the parameters you set in the Send Window.
Transmit One Ctrl + T Sends one copy of the designated Send Packet.
Send Selected Packets Sends selected packets onto the network.
Set Send Packet Designates a Send Packet.
Edit Send Packet… Opens the designated Send Packet in a Decode window with edit capabilities.
Send Window Opens the Send Window, where you can control transmissions from OmniPeek.
Select Send Adapter… Opens the Select Send Adapter dialog in which you can choose an adapter to use in performing Send functions.
Replace Source Address Toggles whether or not the source address is modi-fied when sending packets.
528 Capture menu

OmniPeek User Guide
ANYOP_UG.book Page 529 Friday, February 5, 2016 4:47 PM
Monitor menu
Tools menu
Menu item Shortcut Description
Nodes Ctrl + 1 Opens the monitor Node Statistics window.
Protocols Ctrl + 2 Opens the monitor Protocol Statistics window.
Network Ctrl + 3 Opens the monitor Network Statistics window.
Size Ctrl + 4 Opens the monitor packet Size Statistics window.
Summary Ctrl + 5 Opens the monitor Summary Statistics window.
History Ctrl + 6 Opens the monitor History Statistics window.
Channel Ctrl + 7 Opens the monitor Channel Statistics window.
WLAN Ctrl + 8 Opens the monitor WLAN Statistics window.
Monitor statistics Operates as a toggle setting. When enabled, col-lects all network statistics, independent of any cap-ture window.
Reset Statistics This action clears all accumulated monitor statistics information and resets all values to zero.
Monitor Options… Opens the Monitor Options dialog, where you can configure settings for monitor statistics.
Menu item Shortcut Description
Download Engine Packet File…
Opens the Download Engine Packet Files Wizard Time Range & Filter dialog where you choose the time range and filter for the search.
Split Packet File… Opens the Split Packet File dialog where you can split a large packet file into smaller packet files.
Merge Packet Files… Opens the Merge Packet Files dialog where you can merge smaller packet files into a large packet file.
Monitor menu 529
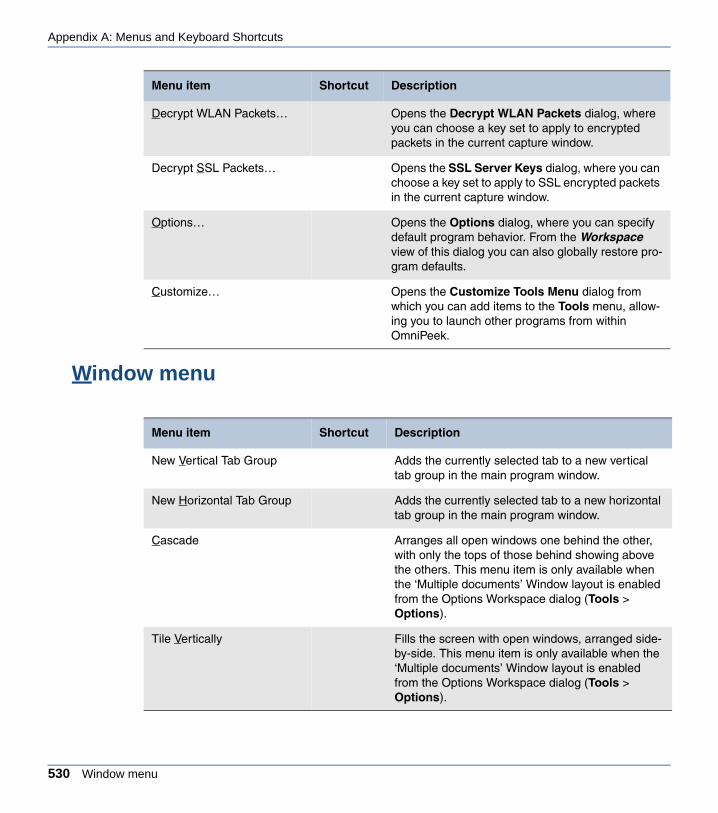
Appendix A: Menus and Keyboard Shortcuts
ANYOP_UG.book Page 530 Friday, February 5, 2016 4:47 PM
Window menu
Decrypt WLAN Packets… Opens the Decrypt WLAN Packets dialog, where you can choose a key set to apply to encrypted packets in the current capture window.
Decrypt SSL Packets… Opens the SSL Server Keys dialog, where you can choose a key set to apply to SSL encrypted packets in the current capture window.
Options… Opens the Options dialog, where you can specify default program behavior. From the Workspace view of this dialog you can also globally restore pro-gram defaults.
Customize… Opens the Customize Tools Menu dialog from which you can add items to the Tools menu, allow-ing you to launch other programs from within OmniPeek.
Menu item Shortcut Description
New Vertical Tab Group Adds the currently selected tab to a new vertical tab group in the main program window.
New Horizontal Tab Group Adds the currently selected tab to a new horizontal tab group in the main program window.
Cascade Arranges all open windows one behind the other, with only the tops of those behind showing above the others. This menu item is only available when the ‘Multiple documents’ Window layout is enabled from the Options Workspace dialog (Tools > Options).
Tile Vertically Fills the screen with open windows, arranged side-by-side. This menu item is only available when the ‘Multiple documents’ Window layout is enabled from the Options Workspace dialog (Tools > Options).
Menu item Shortcut Description
530 Window menu
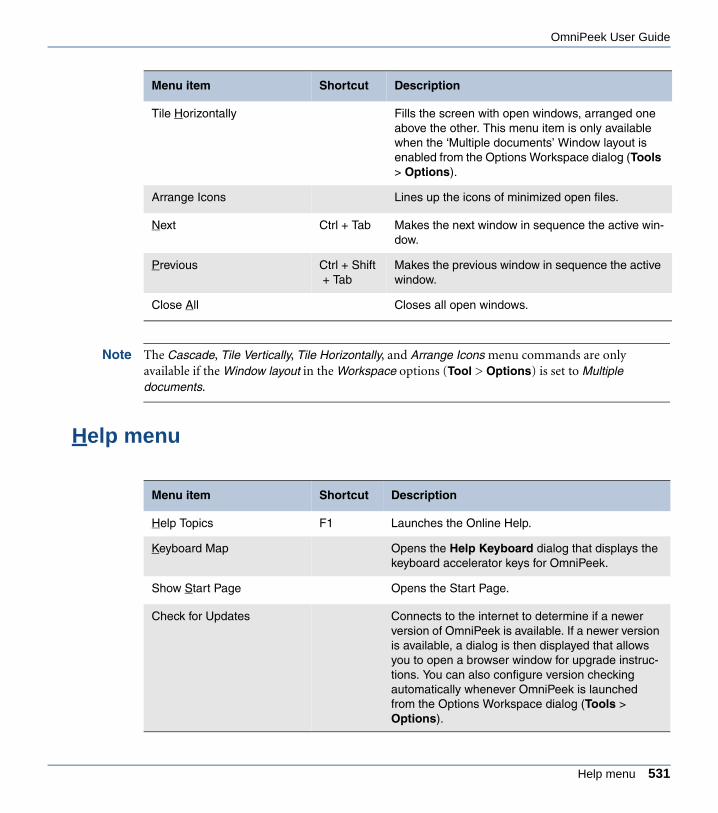
OmniPeek User Guide
ANYOP_UG.book Page 531 Friday, February 5, 2016 4:47 PM
Note The Cascade, Tile Vertically, Tile Horizontally, and Arrange Icons menu commands are only available if the Window layout in the Workspace options (Tool > Options) is set to Multiple documents.
Help menu
Tile Horizontally Fills the screen with open windows, arranged one above the other. This menu item is only available when the ‘Multiple documents’ Window layout is enabled from the Options Workspace dialog (Tools > Options).
Arrange Icons Lines up the icons of minimized open files.
Next Ctrl + Tab Makes the next window in sequence the active win-dow.
Previous Ctrl + Shift+ Tab
Makes the previous window in sequence the active window.
Close All Closes all open windows.
Menu item Shortcut Description
Help Topics F1 Launches the Online Help.
Keyboard Map Opens the Help Keyboard dialog that displays the keyboard accelerator keys for OmniPeek.
Show Start Page Opens the Start Page.
Check for Updates Connects to the internet to determine if a newer version of OmniPeek is available. If a newer version is available, a dialog is then displayed that allows you to open a browser window for upgrade instruc-tions. You can also configure version checking automatically whenever OmniPeek is launched from the Options Workspace dialog (Tools > Options).
Menu item Shortcut Description
Help menu 531
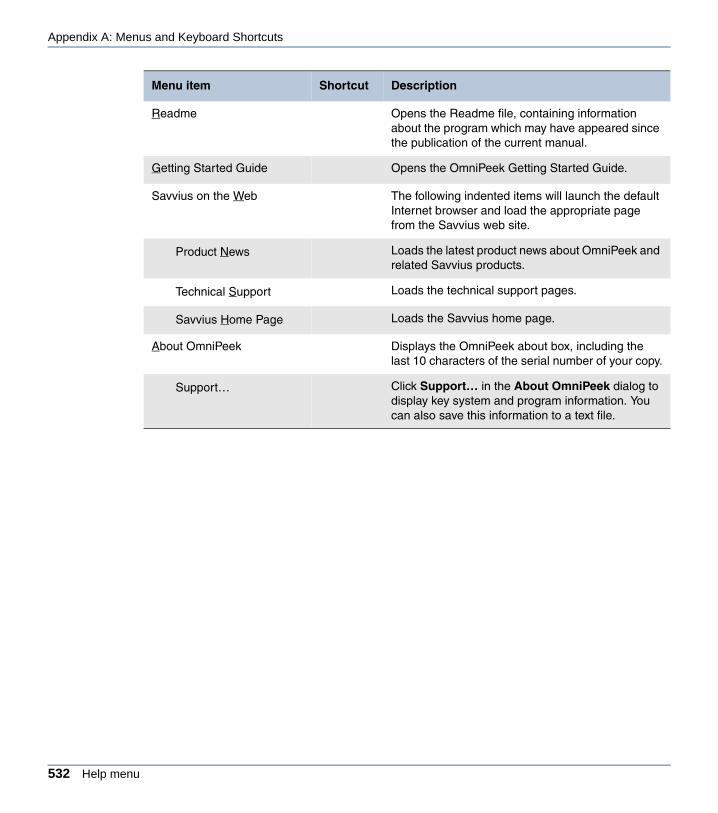
Appendix A: Menus and Keyboard Shortcuts
ANYOP_UG.book Page 532 Friday, February 5, 2016 4:47 PM
Readme Opens the Readme file, containing information about the program which may have appeared since the publication of the current manual.
Getting Started Guide Opens the OmniPeek Getting Started Guide.
Savvius on the Web The following indented items will launch the default Internet browser and load the appropriate page from the Savvius web site.
Product News Loads the latest product news about OmniPeek and related Savvius products.
Technical Support Loads the technical support pages.
Savvius Home Page Loads the Savvius home page.
About OmniPeek Displays the OmniPeek about box, including the last 10 characters of the serial number of your copy.
Support… Click Support… in the About OmniPeek dialog to display key system and program information. You can also save this information to a text file.
Menu item Shortcut Description
532 Help menu

A P P E N D I X B
ANYOP_UG.book Page 533 Friday, February 5, 2016 4:47 PM
Reference
In this appendix:
Packet list columns. . . . . . . . . . . . . . . . . . . . . . . . . . . . . . . . . . . . . . . . . . . . . . 534
Expert view columns. . . . . . . . . . . . . . . . . . . . . . . . . . . . . . . . . . . . . . . . . . . . . 539
Web view columns . . . . . . . . . . . . . . . . . . . . . . . . . . . . . . . . . . . . . . . . . . . . . . 546
Voice & Video view columns. . . . . . . . . . . . . . . . . . . . . . . . . . . . . . . . . . . . . . . 548
Voice & Video Visual Expert columns. . . . . . . . . . . . . . . . . . . . . . . . . . . . . . . . 552
Nodes statistics columns . . . . . . . . . . . . . . . . . . . . . . . . . . . . . . . . . . . . . . . . . 553
Applications statistics columns . . . . . . . . . . . . . . . . . . . . . . . . . . . . . . . . . . . . . 555
WLAN statistics columns . . . . . . . . . . . . . . . . . . . . . . . . . . . . . . . . . . . . . . . . . 556
Channel statistics columns . . . . . . . . . . . . . . . . . . . . . . . . . . . . . . . . . . . . . . . . 560
Capture Engine capture tab columns . . . . . . . . . . . . . . . . . . . . . . . . . . . . . . . . 562
Capture Engine files tab columns. . . . . . . . . . . . . . . . . . . . . . . . . . . . . . . . . . . 563
Capture Engine details tab columns . . . . . . . . . . . . . . . . . . . . . . . . . . . . . . . . . 564
Starting OmniPeek from the command line . . . . . . . . . . . . . . . . . . . . . . . . . . . 565
533

Appendix B: Reference
ANYOP_UG.book Page 534 Friday, February 5, 2016 4:47 PM
Packet list columnsThe available columns in the Packet List of the Packets view of a capture window are described below.
Column Description
Packet Displays a packet number as determined by the time-sequential order in which the packets were captured.
Source Displays the source address. Depending upon the choice under Display Format in the View menu, this address may be a physical address, a higher-level, logical address such as IP or AppleTalk, or a symbolic name. Will appear italicized if Cal-culate implied transmitter is enabled in the Format tab of the Packet List Options dialog.
SourceLogical
Shows the logical address of the packet’s source. Unlike the default Source col-umn, this column’s display is unaffected by any choice you make in Display For-mat under the View menu. This allows you to show different formats for a packet’s source on a single line.
Source Physical
Shows the physical address of the packet’s source. Unlike the default Source col-umn, this column’s display is unaffected by any choice you make in Display For-mat under the View menu. This allows you to show different formats for a packet’s source on a single line. Will appear italicized if Calculate implied transmitter is enabled in the Format tab of the Packet List Options dialog.
Source Port Displays the source port or socket, if any, in the notation appropriate for that proto-col.
Source Country
Displays the source country. If the source country is not available, then Private Network, Multicast, or Unknown is displayed. See Special address ranges on page 539.
Source City Displays the source city. If the source city is not available, then Private Network, Multicast, or Unknown is displayed. See Special address ranges on page 539.
Source Latitude
Displays the latitude of the source city.
Source Longitude
Displays the longitude of the source city.
Destination Displays the destination address. Depending upon the choice under Display For-mat in the View menu, this address may be a physical address, a higher-level, log-ical address such as IP or AppleTalk, or a symbolic name.
534 Packet list columns

OmniPeek User Guide
ANYOP_UG.book Page 535 Friday, February 5, 2016 4:47 PM
Destination Logical
Shows the logical address of the packet’s destination. Unlike the default Destina-tion column, this column’s display is unaffected by any choice you make in Display Format under the View menu. This allows you to show different formats for a packet’s destination on a single line.
Destination Physical
Shows the physical address of the packet’s destination. Unlike the default Destina-tion column, this column’s display is unaffected by any choice you make in Display Format under the View menu. This allows you to show different formats for a packet’s destination on a single line.
Destination Port
Displays the destination port or socket, if any, in the notation appropriate for that protocol.
Dest. Country
Displays the destination country. If the destination country is not available, then Private Network, Multicast, or Unknown is displayed. See Special address ranges on page 539.
Dest. City Displays the destination city. If the destination city is not available, then Private Network, Multicast, or Unknown is displayed. See Special address ranges on page 539.
Dest. Latitude
Displays the latitude of the destination city.
Dest.Longitude
Displays the longitude of the destination city.
BSSID Displays the ID number of the access point or base station to whose traffic this packet belongs.This six byte hexadecimal number is typically formed from the sta-tion’s MAC address.
Transmitter Displays the physical address of the station identified in the packet header as the Transmitter, regardless of which address field may contain that information. A transmitter is typically the last hop on a relay through the DS (distribution system) and is distinguished from the original Source address. Will appear italicized if Cal-culate implied transmitter is enabled in the Format tab of the Packet List Options dialog.
Receiver Displays the physical address of the station identified in the packet header as the Receiver, regardless of which address field may contain that information. A receiver is typically the first hop on a relay through the DS (distribution system) and is distinct from the ultimate Destination address.
Address 1 Displays the physical address found in the first address field of the 802.11 WLAN MAC header, without reference to its type: destination, receiver, or BSSID.
Column Description
Packet list columns 535

Appendix B: Reference
ANYOP_UG.book Page 536 Friday, February 5, 2016 4:47 PM
Address 2 Displays the physical address found in the second address field of the 802.11 WLAN MAC header, without reference to its type: source, BSSID or transmitter.
Address 3 Displays the physical address found in the third address field of the 802.11 WLAN MAC header, without reference to its type: source, destination, or BSSID.
Address 4 Displays the physical address found in the fourth address field of the 802.11 WLAN MAC header, without reference to its type. This address field is empty, except in packets relayed through the DS, in which it holds the source address.
GPS Time Displays the time reported by the GPS receiver for the fix associated with this packet.
Latitude Displays the latitude portion of the GPS fix associated with the packet, reported (N, north or S, south) in degrees, minutes, and decimal fractions of a minute.
Longitude Displays the longitude portion of the GPS fix associated with the packet, reported (E, east or W, west) in degrees, minutes, and decimal fractions of a minute.
Altitude Displays the altitude portion of the GPS fix associated with the packet. Reported in the measurement system appropriate to the local settings associated with the user in the operating system. (US users in feet, all others in meters.)
Speed Displays the speed portion of the GPS fix associated with this packet. Reported in the measurement system appropriate to the local settings associated with the user in the operating system. (US and UK users in miles per hour, all others in kilome-ters per hour.)
VLAN Displays the VLAN tags present in the packet.
Flags Contains flag characters indicating that a packet matches some particular condi-tion, such as an error condition or type of protocol data. The characters used for flags are assignable in the Flags tab of the Packet List Options dialog.
Adapter Displays the IP address or name of the adapter, or the access point or access point controller, from which each packet originated.
Channel When an 802.11 adapter is selected as the capture adapter, this column displays the wireless channel for 802.11 captures.
When a Capture Engine adapter is selected as the capture adapter, this column displays the channel on which the packet was captured.
Frequency The center frequency of the 802.11 WLAN channel on which the packet was captured.
Column Description
536 Packet list columns

OmniPeek User Guide
ANYOP_UG.book Page 537 Friday, February 5, 2016 4:47 PM
Band The 802.11 WLAN standard(s) governing the use of the channel on which the packet was captured.
Signal Displays the RSSI (Received Signal Strength Indicator) reported in the receipt of this packet, with RSSI normalized to a percentage value.
Signal dBm Displays the received signal strength reported in the receipt of this packet, in dBm (decibel milliWatts).
Data Rate Displays the data rate at which the body of this packet was transmitted.
Noise Displays the noise detected on receipt of this packet, expressed as a percentage.
Noise dBm Displays the noise detected on receipt of this packet, expressed in dBm (decibel milliWatts).
802.11 Flags
Displays the 802.11 frame control flags. The flags and their codes are as follows:- Order (O)- Protected Frame (W)- More Data (D)- Power Management (P)- Retransmission (R)- More Fragments (M)- From DS (F)- To DS (T)
MCS Displays the Modulation Coding Scheme (MCS) index for various 802.11 packets.,
Spatial Streams
Displays the number of spatial streams for various 802.11 packets.
Size Displays the length of the packet in bytes, including the packet header, FCS bytes, and any padding.
Size Bar Contains a graphic representation of the relative size of each packet, color-coded to indicate the relative size of basic protocol elements within the packet.
IP Length Displays the total length of the IP datagram, in bytes. It includes the length of the IP header and data.
IP ID Displays the IP ID (Identifier) of the packet. The IP ID uniquely identifies each IP datagram sent by a host. It normally increments by one each time a datagram is sent.
IP TTL Displays the IP TTL (Time To Live) for IP packets, or Hop Count for IPv6 packets.
Column Description
Packet list columns 537

Appendix B: Reference
ANYOP_UG.book Page 538 Friday, February 5, 2016 4:47 PM
Date Shows the date the packet was received.
Absolute Time
Displays the timestamp assigned to each packet as the actual time of capture, according to the system clock of the computer on which the program is running. Use the Format tab of the Packet List Options dialog to set the display units for all timestamps to milliseconds, microseconds, or nanoseconds.
Delta Time Shows the timestamp of each packet as the elapsed time since the capture of the previous visible packet. When packets are hidden, the time shown is relative only to the previous visible packet. Use the Format tab of the Packet List Options dia-log to set the display units for all timestamps to milliseconds, microseconds, or nanoseconds.
Relative Time
Displays the timestamp of each packet as the elapsed time since the start of the current session. You can set a particular packet as the “zero” time for all items in the Relative Time column. Packets captured before will show negative values, those after, positive values, all relative to the new zero time. To set a packet as the zero time by setting it as the Relative Packet, right-click the packet’s line and choose Set Relative Packet. Use the Format tab of the Packet List Options dia-log to set the display units for all timestamps to milliseconds, microseconds, or nanoseconds.
Cumulative Bytes
If no Relative Packet is set, this column shows the total bytes represented by all the visible packets from the first packet in the list to the current packet, inclusive. If you have set a Relative Packet, this column shows the total bytes from the Rela-tive Packet to the current packet, inclusive. To set a packet as the Relative Packet, right-click the packet’s line and choose Set Relative Packet.
Protocol Displays the protocol type of the packet. This may be shown as an LSAP value, a SNAP value, or a ProtoSpec. If you have established a symbolic name for a proto-col otherwise unknown to ProtoSpecs, that name may be taken from the Name Table and displayed here.
Application Displays the application associated with the packet.
Filter Displays the name of the filter that allowed the packet to be entered into the cap-ture buffer.
Summary Lists any information provided about the packet by enabled Analysis Modules.
Analysis Module Name
Displays the name of the Analysis Module that supplied the information on that packet that is displayed in the Summary column.
Note Shows the full text of any user-entered note associated with the packet.
Column Description
538 Packet list columns

OmniPeek User Guide
ANYOP_UG.book Page 539 Friday, February 5, 2016 4:47 PM
Special address ranges
There are several special cases where country information will not be available for certain IP ranges:
• Private Network: IPv4 addresses in the ranges 10.0.0.0/8, 172.16.0.0/12, 192.168.0.0/16, and 169.254.0.0/16 are private networks, and their location cannot be determined. They classified as ‘Private Network.’ This also applies to IPv6, with ranges fd00::/8 and fe80::/10.
• Multicast: IP multicast addresses shall be classified as ‘Multicast.’ These are IPv4 range 224.0.0.0/4 and IPv6 range ff00://8.
• Unknown: Any addresses not in the ranges above, but not in the Geo IP database are classified as ‘Unknown.’
Expert view columnsThe following sections describe the column headings available in the Expert views.
Note For descriptions of columns available in the Expert VoIP Media view, see Voice & Video view columns on page 548.
Expert Presents data collected about the packet by the Expert Analysis tools. Typically, this is a short description of the type of problem found in the packet or a descrip-tion of the event, and may include a measurement (such as response time since another named packet) which caused this packet to be identified as an event.
Decode Displays a portion of the information present in the Decode view of the packet, when that information matches the most recently highlighted part of any decode of any packet in the capture window. It shows the same part of the decode for every packet that contains the selected type of information.
Column Description
Special address ranges 539

Appendix B: Reference
ANYOP_UG.book Page 540 Friday, February 5, 2016 4:47 PM
Expert clients/servers, flows, and application view columns
The following table describes the columns available in the Expert Clients/Servers, Flows, and Applications views.
Column Description
Flow ID A sequence number assigned to each unique flow identified by the Expert.
Name The name of the application for the current flow
Client Addr The address of the Client for the current flow.
Client Port The port on which the Client or Client Addr was communicating in the cur-rent flow.
Client Country Displays the client country. If the client country is not available, then Pri-vate Network, Multicast, or Unknown is displayed. See Special address ranges on page 539.
Client City Displays the client city. If the client city is not available, then Private Net-work, Multicast, or Unknown is displayed. See Special address ranges on page 539.
Client Latitude Displays the latitude of the client city.
Client Longitude Displays the longitude of the client city.
Server Addr The address of the Server or Server Addr for the current flow.
Server Port The port on which the Server or Server Addr was communicating in the current flow.
Server Country Displays the server country. If the server country is not available, then Pri-vate Network, Multicast, or Unknown is displayed. See Special address ranges on page 539.
Server City Displays the server city. If the server city is not available, then Private Net-work, Multicast, or Unknown is displayed. See Special address ranges on page 539.
Server Latitude Displays the latitude of the server city.
Server Longitude Displays the longitude of the server city.
Flows For a pair of nodes, shows the number of flows detected. (Hierarchical view only)
540 Expert view columns

OmniPeek User Guide
ANYOP_UG.book Page 541 Friday, February 5, 2016 4:47 PM
Events Total number of events identified by the Expert EventFinder.
Protocol The protocol under which the packets in this flow were exchanged.
Application Displays the application associated with the flow.
Hops Number of router hops between the server and the capture adapter.
Packets The number of packets in the selected exchange. Note that packet totals are rolled up, such that higher levels of aggregations show totals for all sub-elements.
Client Pkts The total number of packets sent from the Client or Client Addr in the cur-rent flow.
Server Pkts The total number of packets sent from the Server or Server Addr in the current flow.
Bytes The total bytes represented by the packets which were a part of the selected flow.
Client Bytes The total bytes sent from the Client or Client Addr in the current flow.
Server Bytes The total bytes sent from the Server or Server Addr in the current flow.
Start The timestamp of the first packet in the current flow.
Finish The timestamp of the final packet in the current flow.
Duration The elapsed time, from the first to the last packet of the selected exchange, represented in the form Hours:Minutes:Seconds.decimal sec-onds. The precision is set in the Expert view options dialog.
% Wireless Retries The number of 802.11 retry packets, as a percentage of all packets for this row.
Response Time Turn Count
The number of pairs of packets used to calculate the value for average response time.
Best Response Time
The lowest observed response time in the current flow or stream.
Avg Response Time
For exchanges in which this parameter is relevant, shows the arithmetic average of all client/server response times or of latencies for the selected pair of nodes.
Column Description
Expert clients/servers, flows, and application view columns 541
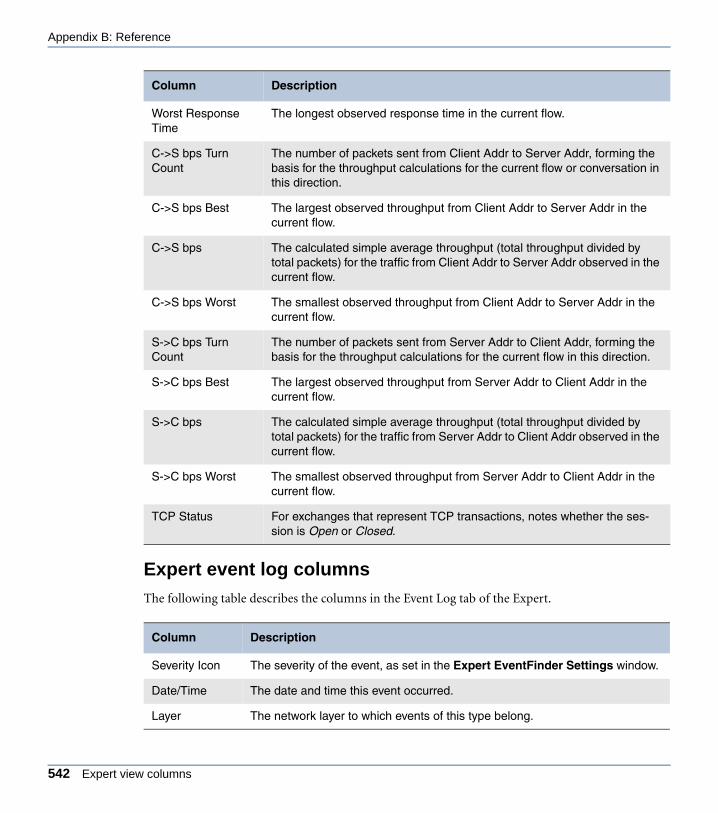
Appendix B: Reference
ANYOP_UG.book Page 542 Friday, February 5, 2016 4:47 PM
Expert event log columns
The following table describes the columns in the Event Log tab of the Expert.
Worst Response Time
The longest observed response time in the current flow.
C->S bps Turn Count
The number of packets sent from Client Addr to Server Addr, forming the basis for the throughput calculations for the current flow or conversation in this direction.
C->S bps Best The largest observed throughput from Client Addr to Server Addr in the current flow.
C->S bps The calculated simple average throughput (total throughput divided by total packets) for the traffic from Client Addr to Server Addr observed in the current flow.
C->S bps Worst The smallest observed throughput from Client Addr to Server Addr in the current flow.
S->C bps Turn Count
The number of packets sent from Server Addr to Client Addr, forming the basis for the throughput calculations for the current flow in this direction.
S->C bps Best The largest observed throughput from Server Addr to Client Addr in the current flow.
S->C bps The calculated simple average throughput (total throughput divided by total packets) for the traffic from Server Addr to Client Addr observed in the current flow.
S->C bps Worst The smallest observed throughput from Server Addr to Client Addr in the current flow.
TCP Status For exchanges that represent TCP transactions, notes whether the ses-sion is Open or Closed.
Column Description
Severity Icon The severity of the event, as set in the Expert EventFinder Settings window.
Date/Time The date and time this event occurred.
Layer The network layer to which events of this type belong.
Column Description
542 Expert view columns

OmniPeek User Guide
ANYOP_UG.book Page 543 Friday, February 5, 2016 4:47 PM
Event The EventFinder definition which identified this packet as an event. The description may be modified to show additional information.
Source Addr The source address for this packet. The node is identified by its logical address or by the symbolic name for that address if one exists in the Name Table.
Dest Addr The destination address for this packet. The node is identified by its logical address or by the symbolic name for that address if one exists in the Name Table.
Source Port The source port for this packet. If the port is a well known port, the protocol or application name will be shown instead of the port number.
Dest Port The destination port for this packet. If the port is a well known port, the proto-col or application name will be shown instead of the port number.
Packet The packet number, as assigned in the Packets view of the capture window or capture file.
Flow ID The ID (or call number, or flow index) of the flow (or call) to which the event pertains.
Request ID Unique ID assigned to this individual HTTP request.
Call Number Internally generated call ID. First captured call is call 1, second is call 2, and so on. Note: Do not confuse this with the “phone number” string that often appears in the gateway-assigned “Call ID” column.
Flow Index Internally generated index for a single flow within a call. The first flow is index 1, second is 2, and so on. Signaling and control flows also consume index numbers, so it is rare that a call's media flows will occupy indices 1 and 2.
Column Description
Expert event log columns 543

Appendix B: Reference
ANYOP_UG.book Page 544 Friday, February 5, 2016 4:47 PM
Expert node details tab rows and columns
The following table describes the rows and columns in the Details tab of the Expert.
Column Description
Name The name (or address) of each node. The node is identified by its logical address or by the symbolic name for that address if one exists in the Name table.
Network Address The logical address, in a format appropriate to the protocol of the conversation.
Packets Sent The total number of packets sent by this node as a part of this conversation.
Bytes Sent The total number of bytes sent by this node as a part of this conversation.
Average Size (Bytes) The average size of the packets sent by this node as a part of this conversation, in bytes.
First Packet Time The date and time of capture (to the nearest second) of the first packet for this node in the current conversation.
Last Packet Time The date and time of capture (to the nearest second) of the last packet for this node in the current conversation.
Routed Hops The number of intervening router hops between the node and the capture adapter.
TCP Min Window The minimum size of the TCP window during the course of this conversation.
TCP Max Window The maximum size of the TCP window during the course of this conversation.
Best, Worst, Average, and Turn
Shows measures of response time and throughput.
C-> S (units) Shows throughput for client to server.
S-> C (units) Shows throughput for server to client.
Layer OSI layer of detected Expert Event for the selected flow.
544 Expert view columns

OmniPeek User Guide
ANYOP_UG.book Page 545 Friday, February 5, 2016 4:47 PM
Visual Expert PacketVisualizer tab columns
The following table describes the columns available in the PacketVisualizer tab of the Visual Expert.
Event Name of Expert Event (see Expert EventFinder on page 243).
Count Number of instances of this event for the selected node pair.
Column Description
Packet Packet number.
Cumulative Bytes (Client) Running byte count of all bytes from the client.
Cumulative Bytes (Server) Running byte count of all bytes from the server.
Cumulative Bytes (Both) Running byte count of all bytes, total.
Absolute Time Packet Time.
Relative Time Packet Time, relative to first packet in this flow.
Delta Time Packet Time, relative to previous packet.
Size Packet's byte count.
PacketVisualizer Graphic display of size and direction of the packet. Client arrows point right; server arrows point left. This column can also display tick marks between packets.
Acked By The packet number of the first packet that ACKs this packet.
Ack For The packet number of the last packet that this packet ACKs.
Summary A display of IP and TCP data for this packet. Similar to the Sum-mary column in the Packets view, with unique spacing of client and server information.
Expert If there is an expert event for this packet, this column displays that event's message. Right-click to open Expert EventFinder dialog.
Column Description
Visual Expert PacketVisualizer tab columns 545

Appendix B: Reference
ANYOP_UG.book Page 546 Friday, February 5, 2016 4:47 PM
Visual Expert TCP Trace graph flags
The following table describes each of the flags in the TCP Trace graph of the Visual Expert.
Web view columnsThe following table describes the columns common to all of the Web views of a capture win-dow.
Client Server Flag Description
yes TCP PUSH flag set (appear as a diamond, rather than an arrowhead, and do not have a text label)
yes yes FIN TCP FIN flag set (shows a square, rather than an arrow-head)
yes yes SYN TCP SYN flag set (shows a diamond, rather than an arrow-head)
yes yes U TCP Urgent flag set
yes RST_IN TCP RST flag set in ACK packet from client
yes RST_OUT TCP RST flag set in packet from server
yes R Retransmitted data (at least one byte of SEQ overlaps)
yes O Out of sequence data
yes Z ACK packet with a zero window
yes P Zero window probe
yes yes ! The Expert identified an event for this packet
yes yes HD Hardware Duplicate (also called IP Local Routing)
yes S Selective ACK (also shows a purple line, spanning the acknowledged sequence numbers)
Column Description
Name Name of the server, client, page, or individual HTTP request.
Timing Graphical timeline of this individual HTTP request.
546 Web view columns
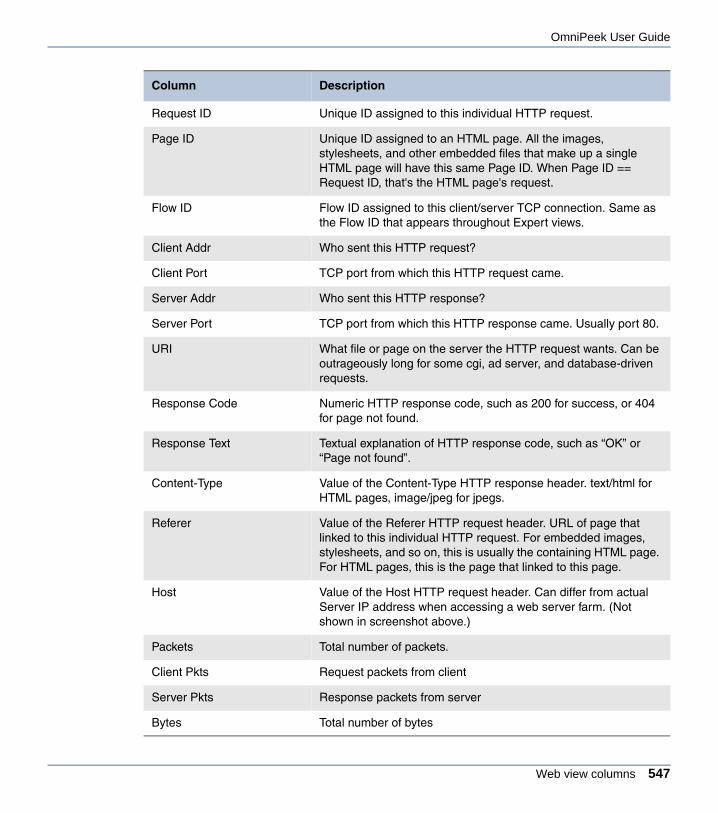
OmniPeek User Guide
ANYOP_UG.book Page 547 Friday, February 5, 2016 4:47 PM
Request ID Unique ID assigned to this individual HTTP request.
Page ID Unique ID assigned to an HTML page. All the images, stylesheets, and other embedded files that make up a single HTML page will have this same Page ID. When Page ID == Request ID, that's the HTML page's request.
Flow ID Flow ID assigned to this client/server TCP connection. Same as the Flow ID that appears throughout Expert views.
Client Addr Who sent this HTTP request?
Client Port TCP port from which this HTTP request came.
Server Addr Who sent this HTTP response?
Server Port TCP port from which this HTTP response came. Usually port 80.
URI What file or page on the server the HTTP request wants. Can be outrageously long for some cgi, ad server, and database-driven requests.
Response Code Numeric HTTP response code, such as 200 for success, or 404 for page not found.
Response Text Textual explanation of HTTP response code, such as “OK” or “Page not found”.
Content-Type Value of the Content-Type HTTP response header. text/html for HTML pages, image/jpeg for jpegs.
Referer Value of the Referer HTTP request header. URL of page that linked to this individual HTTP request. For embedded images, stylesheets, and so on, this is usually the containing HTML page. For HTML pages, this is the page that linked to this page.
Host Value of the Host HTTP request header. Can differ from actual Server IP address when accessing a web server farm. (Not shown in screenshot above.)
Packets Total number of packets.
Client Pkts Request packets from client
Server Pkts Response packets from server
Bytes Total number of bytes
Column Description
Web view columns 547
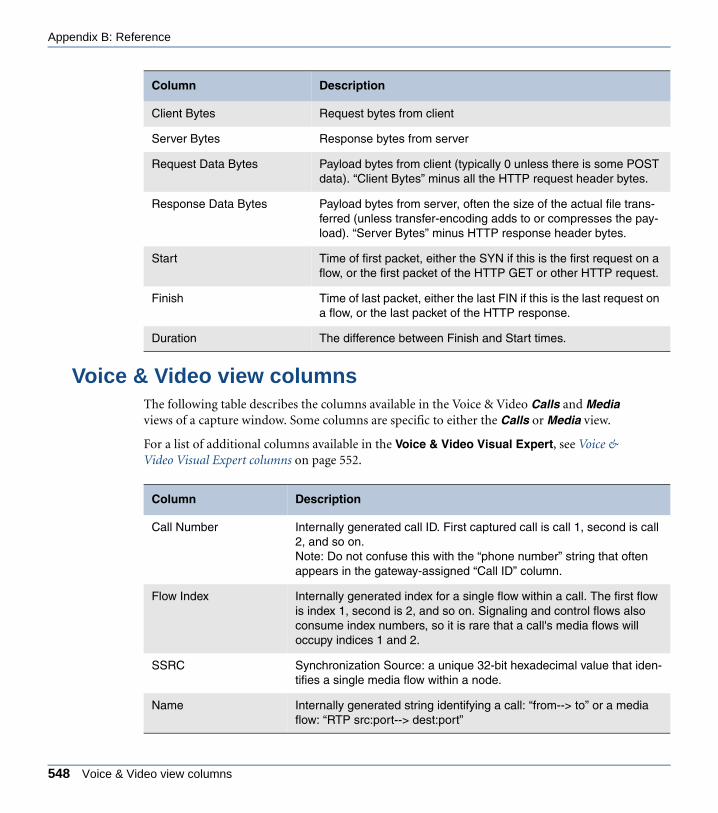
Appendix B: Reference
ANYOP_UG.book Page 548 Friday, February 5, 2016 4:47 PM
Voice & Video view columnsThe following table describes the columns available in the Voice & Video Calls and Media views of a capture window. Some columns are specific to either the Calls or Media view.
For a list of additional columns available in the Voice & Video Visual Expert, see Voice & Video Visual Expert columns on page 552.
Client Bytes Request bytes from client
Server Bytes Response bytes from server
Request Data Bytes Payload bytes from client (typically 0 unless there is some POST data). “Client Bytes” minus all the HTTP request header bytes.
Response Data Bytes Payload bytes from server, often the size of the actual file trans-ferred (unless transfer-encoding adds to or compresses the pay-load). “Server Bytes” minus HTTP response header bytes.
Start Time of first packet, either the SYN if this is the first request on a flow, or the first packet of the HTTP GET or other HTTP request.
Finish Time of last packet, either the last FIN if this is the last request on a flow, or the last packet of the HTTP response.
Duration The difference between Finish and Start times.
Column Description
Call Number Internally generated call ID. First captured call is call 1, second is call 2, and so on. Note: Do not confuse this with the “phone number” string that often appears in the gateway-assigned “Call ID” column.
Flow Index Internally generated index for a single flow within a call. The first flow is index 1, second is 2, and so on. Signaling and control flows also consume index numbers, so it is rare that a call's media flows will occupy indices 1 and 2.
SSRC Synchronization Source: a unique 32-bit hexadecimal value that iden-tifies a single media flow within a node.
Name Internally generated string identifying a call: “from--> to” or a media flow: “RTP src:port--> dest:port”
Column Description
548 Voice & Video view columns
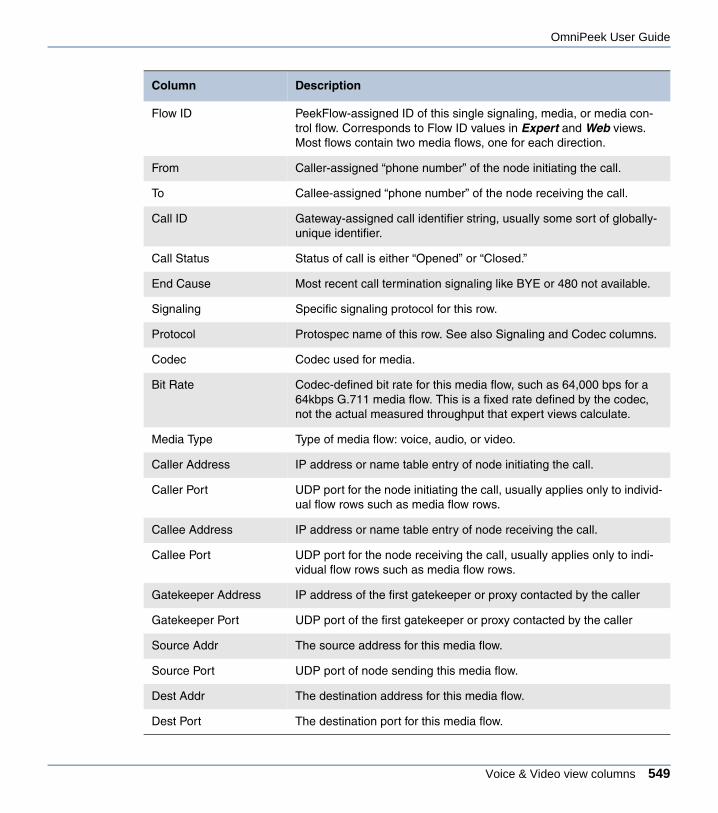
OmniPeek User Guide
ANYOP_UG.book Page 549 Friday, February 5, 2016 4:47 PM
Flow ID PeekFlow-assigned ID of this single signaling, media, or media con-trol flow. Corresponds to Flow ID values in Expert and Web views. Most flows contain two media flows, one for each direction.
From Caller-assigned “phone number” of the node initiating the call.
To Callee-assigned “phone number” of the node receiving the call.
Call ID Gateway-assigned call identifier string, usually some sort of globally-unique identifier.
Call Status Status of call is either “Opened” or “Closed.”
End Cause Most recent call termination signaling like BYE or 480 not available.
Signaling Specific signaling protocol for this row.
Protocol Protospec name of this row. See also Signaling and Codec columns.
Codec Codec used for media.
Bit Rate Codec-defined bit rate for this media flow, such as 64,000 bps for a 64kbps G.711 media flow. This is a fixed rate defined by the codec, not the actual measured throughput that expert views calculate.
Media Type Type of media flow: voice, audio, or video.
Caller Address IP address or name table entry of node initiating the call.
Caller Port UDP port for the node initiating the call, usually applies only to individ-ual flow rows such as media flow rows.
Callee Address IP address or name table entry of node receiving the call.
Callee Port UDP port for the node receiving the call, usually applies only to indi-vidual flow rows such as media flow rows.
Gatekeeper Address IP address of the first gatekeeper or proxy contacted by the caller
Gatekeeper Port UDP port of the first gatekeeper or proxy contacted by the caller
Source Addr The source address for this media flow.
Source Port UDP port of node sending this media flow.
Dest Addr The destination address for this media flow.
Dest Port The destination port for this media flow.
Column Description
Voice & Video view columns 549
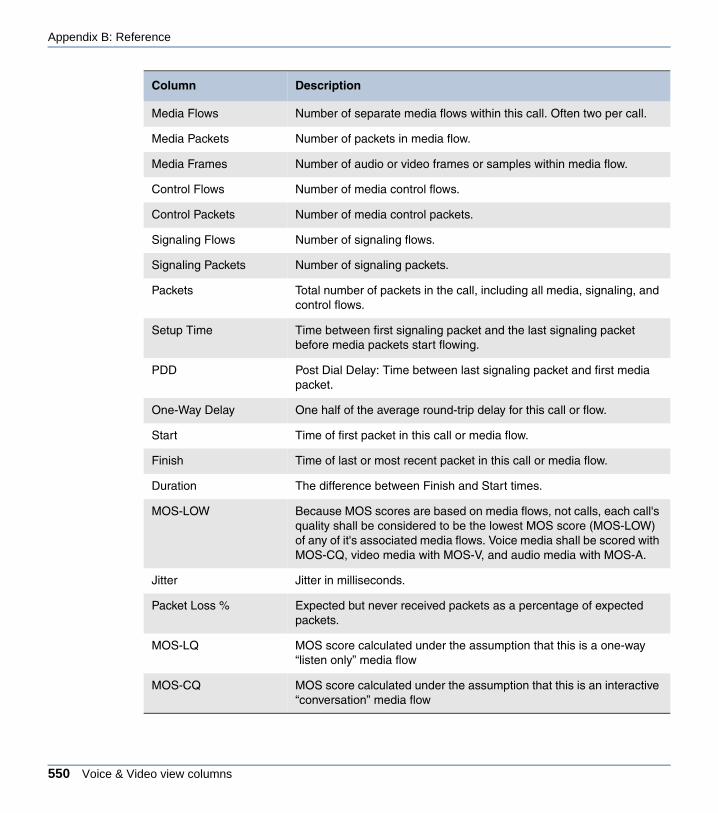
Appendix B: Reference
ANYOP_UG.book Page 550 Friday, February 5, 2016 4:47 PM
Media Flows Number of separate media flows within this call. Often two per call.
Media Packets Number of packets in media flow.
Media Frames Number of audio or video frames or samples within media flow.
Control Flows Number of media control flows.
Control Packets Number of media control packets.
Signaling Flows Number of signaling flows.
Signaling Packets Number of signaling packets.
Packets Total number of packets in the call, including all media, signaling, and control flows.
Setup Time Time between first signaling packet and the last signaling packet before media packets start flowing.
PDD Post Dial Delay: Time between last signaling packet and first media packet.
One-Way Delay One half of the average round-trip delay for this call or flow.
Start Time of first packet in this call or media flow.
Finish Time of last or most recent packet in this call or media flow.
Duration The difference between Finish and Start times.
MOS-LOW Because MOS scores are based on media flows, not calls, each call's quality shall be considered to be the lowest MOS score (MOS-LOW) of any of it's associated media flows. Voice media shall be scored with MOS-CQ, video media with MOS-V, and audio media with MOS-A.
Jitter Jitter in milliseconds.
Packet Loss % Expected but never received packets as a percentage of expected packets.
MOS-LQ MOS score calculated under the assumption that this is a one-way “listen only” media flow
MOS-CQ MOS score calculated under the assumption that this is an interactive “conversation” media flow
Column Description
550 Voice & Video view columns

OmniPeek User Guide
ANYOP_UG.book Page 551 Friday, February 5, 2016 4:47 PM
MOS-PQ MOS score calculated using a model that permits apples-to-apples comparisons with other MOS-PQ measurements
MOS-Nom Theoretical maximum possible MOS score given the codec and bit rate.
MOS-A The audio quality MOS score calculated for the audio stream. Range [0.00-5.00]. Only for audio flows. See VS-AQ.
MOS-AV The multimedia quality MOS score calculated for the video stream. Range [0.00-5.00]. Only for video flows. See VS-MQ.
MOS-V The picture quality MOS score calculated for the video stream. Range [0.00-5.00]. Only for video flows. See VS-PQ.
R Factor Listening R-Factor calculated under the assumption that this is a one-way “lis-ten only” media flow
R Factor Conversational R-Factor calculated under the assumption that this is an interactive “conversation” media flow
R Factor G.107 R-Factor calculated using an ITU G.107 model that permits apples-to-apples comparisons with other G.107 measurements
R Factor Nominal Theoretical maximum possible MOS score given the codec and bit rate.
VS-AQ The VQmon Video Service Audio Quality calculated for the audio stream. Range [0-50]. Only for audio flows. See MOS-AV.
VS-MQ The VQmon video service multimedia quality. Range [0-50]. Only for video flows. See MOS-AV.
VS-PQ The VQmon video service picture quality. Range [0-50]. Only for video flows. See MOS-V.
VS-TQ The VQmon video service transmission quality. Range [0-50]. Only for video flows. No corresponding MOS score.
Column Description
Voice & Video view columns 551

Appendix B: Reference
ANYOP_UG.book Page 552 Friday, February 5, 2016 4:47 PM
Voice & Video Visual Expert columnsIn addition to many of the columns available in the Voice & Video views, (see Voice & Video view columns on page 548), the following table describes columns also available in the Voice & Video Visual Expert.
Column Description
Packet Packet number. For RTP/RTCP rows, this is the first packet in that row.
Message There is one set of messages per signaling flow. If a call has multiple sig-naling flows (i.e. H.225/Q.931, and H.245), there will be multiple sets of messages. Each new message in the signaling flow increments the mes-sage index.
You can use the Message index and the Flow Index together to get an understanding of the sequence of events on multiple signaling channels for a single call.
Time Packet time.
Relative Time Time relative to the first row in the Voice & Video Visual Expert.
Finish Time of last packet in the RTP/RTCP row.
Duration Finish - Time
Bounce Diagram The “visual” part of Voice & Video Visual Expert.
Response Code Response code number, such as 100 or 200 for SIP responses Trying or OK.
Response Text Response message, such as SIP responses Trying or OK.
Sequence Signaling sequence number
Sequence Method Signaling sequence method
Media Packets Number of RTP packets in this RTP/RTCP row.
552 Voice & Video Visual Expert columns

OmniPeek User Guide
ANYOP_UG.book Page 553 Friday, February 5, 2016 4:47 PM
Nodes statistics columnsThe following table describes the columns common to all of the flat views in the Nodes view of a capture window and in the Nodes Statistics window of OmniPeek monitor statistics.
Control Packets Number of RTCP packets in this RTP/RTCP row.
RTP/RTCP
Values for last RTP packet in this RTP/RTCP row:
Jitter MOS-LQ MOS-CQ MOS-PQ MOS-NomMOS-AMOS-AVMOS-VR Factor Listening R Factor Conversational R Factor G.107 R Factor Nominal VS-AQVS-MQVS-PQVS-TQ
Column Description
Node The address or name of the node, in the format appropriate to the view type.
Country The name and flag of the country where each node is physically located.
City The name of the city where each node is physically located
Latitude Displays the latitude of the city where each node is physically located.
Longitude Displays the longitude of the city where each node is physically located.
Utilization % The amount of bandwidth used by this node expressed as a percent-age of the total possible bandwidth of the adapter from which you are capturing. It is an average over the duration of the capture.
Column Description
Nodes statistics columns 553

Appendix B: Reference
ANYOP_UG.book Page 554 Friday, February 5, 2016 4:47 PM
Total Bytes % Percentage of total bytes sent and received by this node.
Total Packets % Percentage of total packets sent and received by this node.
Total Bytes Total bytes sent and received by this node.
Total Packets Total packets sent and received by this node.
Bytes Sent Total bytes sent by this node.
Bytes Received Total bytes received by (or addressed to) this node.
Packets Sent Total packets sent by this node.
Packets Received Total packets received by (or addressed to) this node.
Broadcast Packets Total broadcast packets sent by this node.
Broadcast Bytes Total broadcast bytes sent by this node.
Multicast Packets Total multicast packets sent by this node.
Multicast Bytes Total broadcast and multicast packets sent by this node.
Broadcast/Multicast Packets
Total broadcast and multicast packets sent by this node.
Broadcast/Multicast Bytes
Total broadcast and multicast packets sent by this node.
Min. Size Sent The size of the smallest packet sent by this node.
Max. Size Sent The size of the largest packet sent by this node.
Avg. Size Sent The average size of the packets sent by this node.
Min. Size Received The size of the smallest packet received by this node.
Max. Size Received The size of the largest packet received by this node.
Avg. Size Received The average size of the packets received by this node.
First Time Sent Time stamp of the first packet sent by this node.
Last Time Sent Time stamp of the most recent packet sent by this node.
First Time Received Time stamp of the first packet received by this node.
Last Time Received Time stamp of the most recent packet received by this node.
Column Description
554 Nodes statistics columns
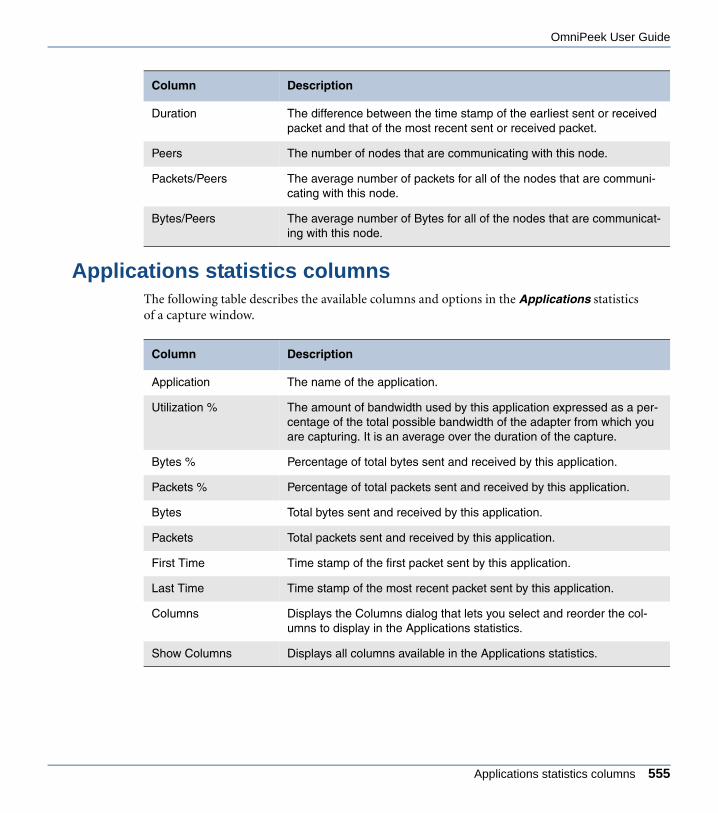
OmniPeek User Guide
ANYOP_UG.book Page 555 Friday, February 5, 2016 4:47 PM
Applications statistics columnsThe following table describes the available columns and options in the Applications statistics of a capture window.
Duration The difference between the time stamp of the earliest sent or received packet and that of the most recent sent or received packet.
Peers The number of nodes that are communicating with this node.
Packets/Peers The average number of packets for all of the nodes that are communi-cating with this node.
Bytes/Peers The average number of Bytes for all of the nodes that are communicat-ing with this node.
Column Description
Application The name of the application.
Utilization % The amount of bandwidth used by this application expressed as a per-centage of the total possible bandwidth of the adapter from which you are capturing. It is an average over the duration of the capture.
Bytes % Percentage of total bytes sent and received by this application.
Packets % Percentage of total packets sent and received by this application.
Bytes Total bytes sent and received by this application.
Packets Total packets sent and received by this application.
First Time Time stamp of the first packet sent by this application.
Last Time Time stamp of the most recent packet sent by this application.
Columns Displays the Columns dialog that lets you select and reorder the col-umns to display in the Applications statistics.
Show Columns Displays all columns available in the Applications statistics.
Column Description
Applications statistics columns 555

Appendix B: Reference
ANYOP_UG.book Page 556 Friday, February 5, 2016 4:47 PM
WLAN statistics columnsThe following table describes all of the columns available in the WLAN view of capture win-dows and in the WLAN Statistics window of OmniPeek monitor statistics.
Data rates are dependent on physical layer implementations, and different data rate columns are available, depending on the standards supported by the selected adapter.
In 802.11 WLANs, every packet begins with a preamble and PLCP header sent at the lowest common data rate. The body of the packet can then be sent at any of the supported data rates. It is the data rate at which the body of the packet is sent that is reported in data rate columns.
Column Description
Node The Node column in the WLAN view displays detected nodes in a nested hier-archy of stations (STA) under BSSIDs, under ESSIDs.
ESSID The ESSID for this node. When ESSIDs are in use, access points (or equiva-lents) will announce their ESSID in Beacon packets and/or Probe Response packets.
Type The type of node. This is either the identifying string of an extended service set (ESSID), an access point (AP), an ordinary station temporarily acting as the base station for an ad hoc group (Ad Hoc), or a Station (STA). Broadcast and multicast destination addresses which cannot be identified as belonging to a particular node are identified by the Admin label. Unknown node types will show a blank in this field.
Channel The channel on which OmniPeek was listening when the most recent packet for this node was captured. During a channel scan, this value may appear anomalous, as the same node may be detected on multiple channels but only the most recent will show in this column.
Important: The channel shown for Nodes identified as an access point (AP) will be the channel on which that AP is broadcasting, as identified in the AP’s Beacon packets and Probe Responses.
Frequency The frequency in MHz of the traffic captured on a specific channel.
Band The identifying band of the traffic captured on a specific channel such as a/b/g/n.
556 WLAN statistics columns

OmniPeek User Guide
ANYOP_UG.book Page 557 Friday, February 5, 2016 4:47 PM
Association Strength
The WLAN view ranges each STA under the AP (or equivalent) with which it most recently communicated. The Association Strength parameter allows you to distinguish between nodes that are simply probing (searching for an AP with which to associate) and those that are truly associated (those that have completed the association process with a particular AP). Nodes that are truly associated with their AP show an Association Strength of Strong. Those that are not associated, but have merely communicated (typically with a probe packet) show an Association Strength of Weak.
Authentication Shows the most recently seen form of authentication used by this node to connect with its BSSID. Example values include EAPTLS, LEAP, and PEAP. Note that OmniPeek does not monitor the authentication state of all nodes, but only registers the most recent authentication. Also, some authentication methods are encrypted in a way that prevents identification of the authentica-tion method.
Encryption Shows the most recently seen form of encryption used by this node to com-municate with its BSSID. Example values include CKIP, TKIP, WEP and CCMP. Note that OmniPeek does not monitor the encryption state of all con-nections, but only registers the most recent method seen from each node.
Trust Shows the user-assigned trust setting from the Name Table for this BSSID or STA. Right-click any node to change this property. See Trusted, known, and unknown nodes on page 437.
Signal Strength columns
Columns showing statistics related to signal strength reported with each packet, expressed either as a percentage or in decibel milliWatts (dBm).
Cur. = Most recently reported signal strength on the channel.
Min. = Minimum signal strength reported on this channel from the time the statistics count was created until the most recent update.
Max. = Maximum signal strength reported on this channel from the time the statistics count was created until the most recent update.
Column Description
WLAN statistics columns 557

Appendix B: Reference
ANYOP_UG.book Page 558 Friday, February 5, 2016 4:47 PM
Noise columns Columns showing statistics related to noise reported with each packet, expressed either as a percentage or in decibel milliWatts (dBm).
Cur. = Most recently reported noise reading on the channel.
Min. = Minimum noise reading reported on this channel from the time the sta-tistics count was created until the most recent update.
Max. = Maximum noise reading reported on this channel from the time the statistics count was created until the most recent update.
Bytes Sent Bytes sent by this node.
Bytes Received Bytes received by this node.
Total Bytes Total bytes, both sent and received, for this node.
Packets Sent Packets sent by this node.
Packets Received
Packets received by this node.
Total Packets Total packets, both sent and received, for this node.
Retry Packets Retry packets sent by this node.
Protected Pack-ets
Number of encrypted packets sent by this node (Protected Frame bit set to 1).
WEP ICV Errors
Number of WEP ICV errors encountered in attempting to apply WEP keys to packets from this node.
WEP Key Name of the user-defined WEP key currently in use to decrypt traffic from this node.
Beacon Pack-ets
Number of beacon packets sent by this node.
Broadcast ESSID
Number of broadcast ESSID packets sent by this node.
Power Save The power save state most recently reported by this node. Values are awake or sleep.
Column Description
558 WLAN statistics columns
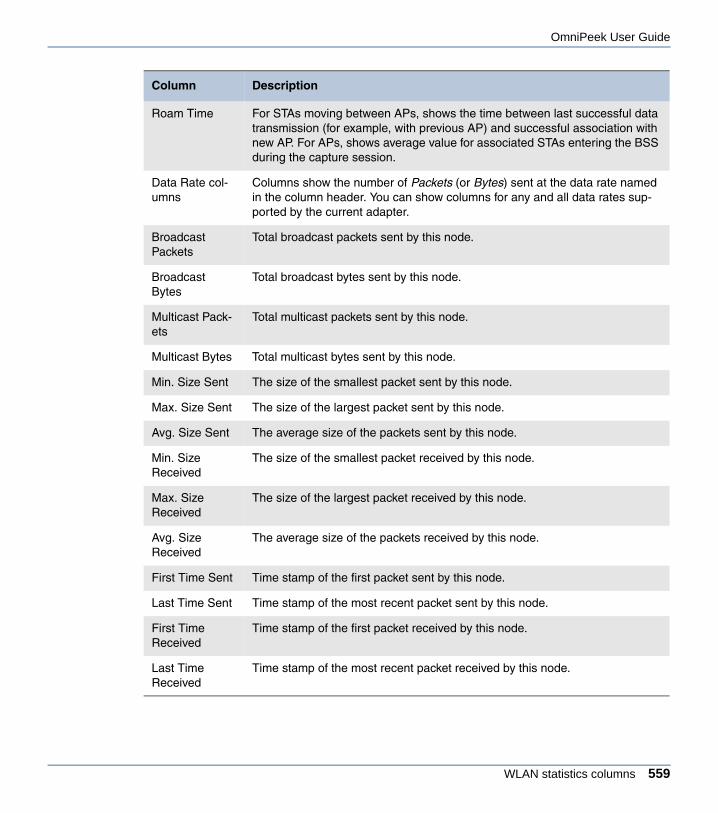
OmniPeek User Guide
ANYOP_UG.book Page 559 Friday, February 5, 2016 4:47 PM
Roam Time For STAs moving between APs, shows the time between last successful data transmission (for example, with previous AP) and successful association with new AP. For APs, shows average value for associated STAs entering the BSS during the capture session.
Data Rate col-umns
Columns show the number of Packets (or Bytes) sent at the data rate named in the column header. You can show columns for any and all data rates sup-ported by the current adapter.
Broadcast Packets
Total broadcast packets sent by this node.
Broadcast Bytes
Total broadcast bytes sent by this node.
Multicast Pack-ets
Total multicast packets sent by this node.
Multicast Bytes Total multicast bytes sent by this node.
Min. Size Sent The size of the smallest packet sent by this node.
Max. Size Sent The size of the largest packet sent by this node.
Avg. Size Sent The average size of the packets sent by this node.
Min. Size Received
The size of the smallest packet received by this node.
Max. Size Received
The size of the largest packet received by this node.
Avg. Size Received
The average size of the packets received by this node.
First Time Sent Time stamp of the first packet sent by this node.
Last Time Sent Time stamp of the most recent packet sent by this node.
First Time Received
Time stamp of the first packet received by this node.
Last Time Received
Time stamp of the most recent packet received by this node.
Column Description
WLAN statistics columns 559

Appendix B: Reference
ANYOP_UG.book Page 560 Friday, February 5, 2016 4:47 PM
Channel statistics columnsThe following table describes all of the columns available in the Channels view of capture windows and in the Channels tab of the Channel Statistics window of OmniPeek monitor statistics.
Duration The difference between the time stamp of the earliest sent or received packet and that of the most recent sent or received packet.
Privacy Shows True or False, and indicates whether the Privacy bit in the capabilities sections of Management packets (Beacon, Probe, and so forth) recently sent by this node was set to 1 (True) or 0 (False). This tells potential peers that the sending node will use encryption (True) or will not (False).
Column Description
Channel The number of the channel, indicating its center frequency.
Frequency Shows frequency of channel in MHz (for example, 5180MHz for Channel 36).
Band Shows wireless band of channel (for example, 802.11a, 802.11b, and 802.11n).
APs Number of access points seen on the channel.
Total Total of all traffic on the channel.
Data Data packets.
Mgmt Management packets.
Ctrl Control packets.
Local Local traffic, not associated with any Distribution System (DS). Includes Station to Station plus management and control packets. The TO DS and FROM DS bits are both set to 0.
From DS The number of packets on that channel which were marked as “From DS,” meaning they were tagged as being directed toward a Distribution System. This generally means packets from an access point to a client.
Column Description
560 Channel statistics columns
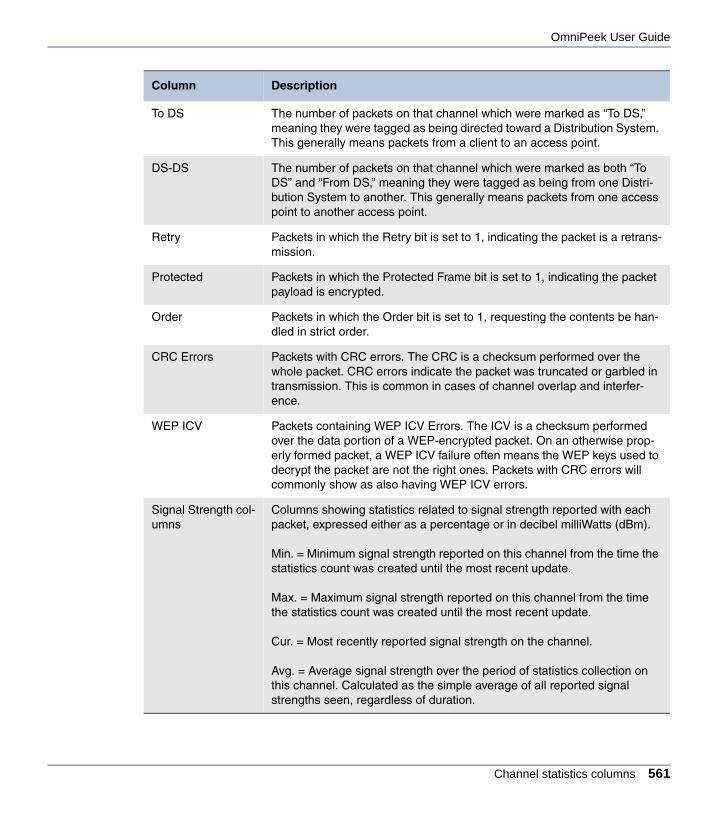
OmniPeek User Guide
ANYOP_UG.book Page 561 Friday, February 5, 2016 4:47 PM
To DS The number of packets on that channel which were marked as “To DS,” meaning they were tagged as being directed toward a Distribution System. This generally means packets from a client to an access point.
DS-DS The number of packets on that channel which were marked as both “To DS” and “From DS,” meaning they were tagged as being from one Distri-bution System to another. This generally means packets from one access point to another access point.
Retry Packets in which the Retry bit is set to 1, indicating the packet is a retrans-mission.
Protected Packets in which the Protected Frame bit is set to 1, indicating the packet payload is encrypted.
Order Packets in which the Order bit is set to 1, requesting the contents be han-dled in strict order.
CRC Errors Packets with CRC errors. The CRC is a checksum performed over the whole packet. CRC errors indicate the packet was truncated or garbled in transmission. This is common in cases of channel overlap and interfer-ence.
WEP ICV Packets containing WEP ICV Errors. The ICV is a checksum performed over the data portion of a WEP-encrypted packet. On an otherwise prop-erly formed packet, a WEP ICV failure often means the WEP keys used to decrypt the packet are not the right ones. Packets with CRC errors will commonly show as also having WEP ICV errors.
Signal Strength col-umns
Columns showing statistics related to signal strength reported with each packet, expressed either as a percentage or in decibel milliWatts (dBm).
Min. = Minimum signal strength reported on this channel from the time the statistics count was created until the most recent update.
Max. = Maximum signal strength reported on this channel from the time the statistics count was created until the most recent update.
Cur. = Most recently reported signal strength on the channel.
Avg. = Average signal strength over the period of statistics collection on this channel. Calculated as the simple average of all reported signal strengths seen, regardless of duration.
Column Description
Channel statistics columns 561

Appendix B: Reference
ANYOP_UG.book Page 562 Friday, February 5, 2016 4:47 PM
Capture Engine capture tab columnsThe following table lists the columns and their descriptions available from the Captures tab of a Capture Engine window.
Noise columns Columns showing statistics related to noise reported with each packet, expressed either as a percentage or in decibel milliWatts (dBm).
Min. = Minimum noise reading reported on this channel from the time the statistics count was created until the most recent update.
Max. = Maximum noise reading reported on this channel from the time the statistics count was created until the most recent update.
Cur. = Most recently reported noise reading on the channel.
Avg. = Average noise reading over the period of statistics collection on this channel. Calculated as the simple average of all reported noise readings seen, regardless of duration.
Created Date and time at which this channel was first scanned for a signal, in the current session.
Updated Date and time of the most recent scan of this channel, in the current ses-sion.
Data Rate columns A variety of columns showing the number of packets/bytes in which the data portion of the packet was transmitted at the specified data rate.
Column Description
Capture Name of the capture window.
Comment Displays any comments added to the capture window when the capture was first created.
Status For example, Capturing or Idle.
Adapter Adapter used by Capture Engine.
Link Speed Reported automatically by the adapter in Mbits per second
Media For example, Ethernet.
Column Description
562 Capture Engine capture tab columns

OmniPeek User Guide
ANYOP_UG.book Page 563 Friday, February 5, 2016 4:47 PM
Capture Engine files tab columnsThe following table lists the columns and their descriptions available from the Files tab of a Capture Engine window.
Buffer size Total size of capture buffer set for current capture.
Packets Received Total packets presented on the adapter used by this capture window.
Packets Filtered Total packets accepted into the buffer.
Packets Analyzed Total packets analyzed when analysis is enabled on a given capture.
Analysis Dropped Packets
Total packets dropped between the adapter and user space.
Packets Dropped Total packets dropped from the buffer.
Start Time Time at which capture was begun.
Stop Time Time at which capture was stopped.
Duration Elapsed time since start of current capture.
Alarms Shows a separate icon (indicating severity of notification) for each alarm enabled in the capture window that is indicating a Suspect Condition or Problem Condition.
Owner Username of the person who created the capture window.
Modified by Username from the login of the person that most recently made any change to the capture window.
Action Most recent action (for example, Start Capture).
Column Description
Name Name of the file saved to the Data Folder on the Capture Engine. See Configuring and updating Capture Engine set-tings on page 26.
Path The location of the saved file.
Capture Name entered in the General view of the remote capture Options dialog.
Column Description
Capture Engine files tab columns 563
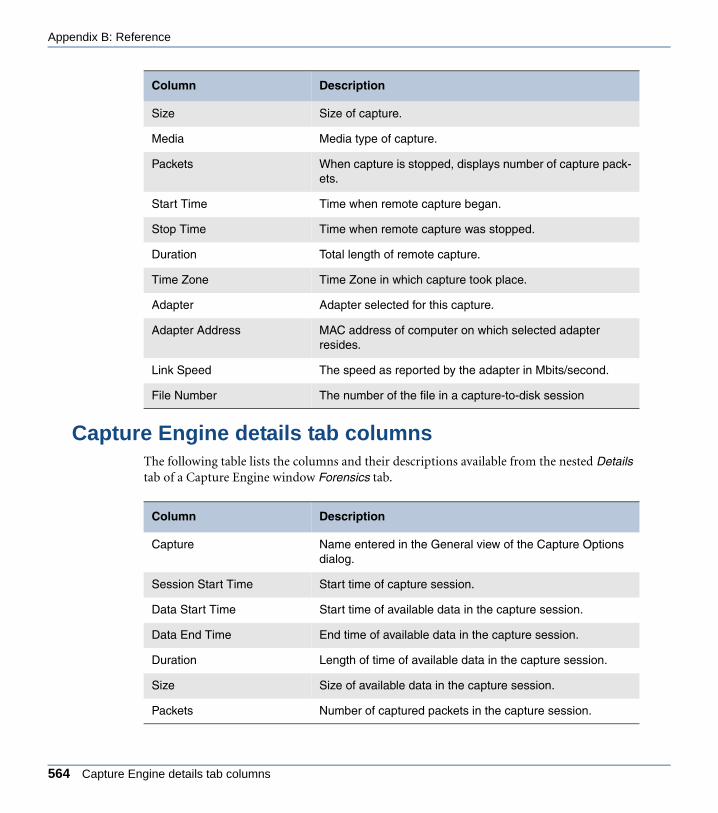
Appendix B: Reference
ANYOP_UG.book Page 564 Friday, February 5, 2016 4:47 PM
Capture Engine details tab columnsThe following table lists the columns and their descriptions available from the nested Details tab of a Capture Engine window Forensics tab.
Size Size of capture.
Media Media type of capture.
Packets When capture is stopped, displays number of capture pack-ets.
Start Time Time when remote capture began.
Stop Time Time when remote capture was stopped.
Duration Total length of remote capture.
Time Zone Time Zone in which capture took place.
Adapter Adapter selected for this capture.
Adapter Address MAC address of computer on which selected adapter resides.
Link Speed The speed as reported by the adapter in Mbits/second.
File Number The number of the file in a capture-to-disk session
Column Description
Capture Name entered in the General view of the Capture Options dialog.
Session Start Time Start time of capture session.
Data Start Time Start time of available data in the capture session.
Data End Time End time of available data in the capture session.
Duration Length of time of available data in the capture session.
Size Size of available data in the capture session.
Packets Number of captured packets in the capture session.
Column Description
564 Capture Engine details tab columns
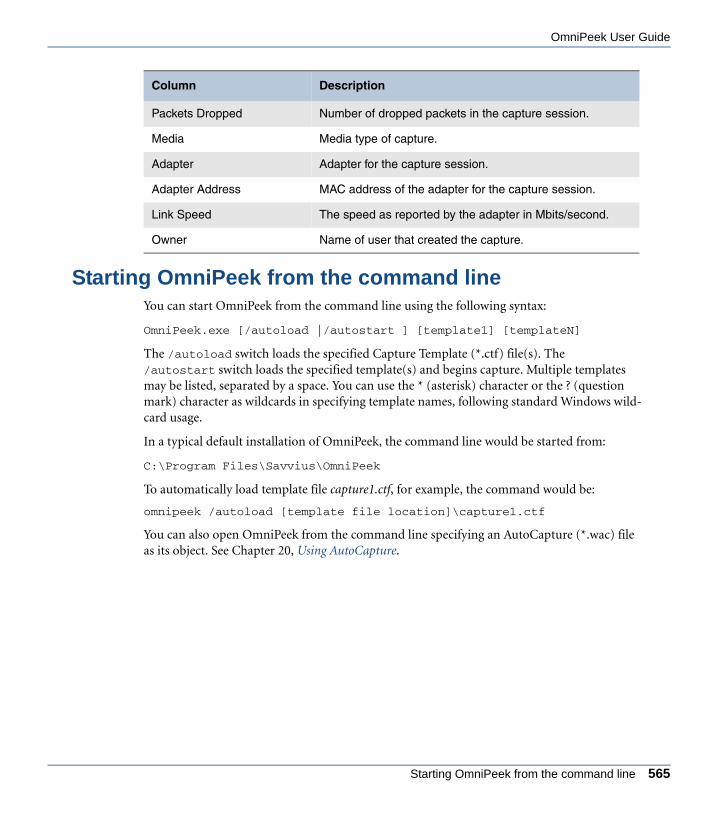
OmniPeek User Guide
ANYOP_UG.book Page 565 Friday, February 5, 2016 4:47 PM
Starting OmniPeek from the command lineYou can start OmniPeek from the command line using the following syntax:
OmniPeek.exe [/autoload |/autostart ] [template1] [templateN]
The /autoload switch loads the specified Capture Template (*.ctf) file(s). The /autostart switch loads the specified template(s) and begins capture. Multiple templates may be listed, separated by a space. You can use the * (asterisk) character or the ? (question mark) character as wildcards in specifying template names, following standard Windows wild-card usage.
In a typical default installation of OmniPeek, the command line would be started from:
C:\Program Files\Savvius\OmniPeek
To automatically load template file capture1.ctf, for example, the command would be:
omnipeek /autoload [template file location]\capture1.ctf
You can also open OmniPeek from the command line specifying an AutoCapture (*.wac) file as its object. See Chapter 20, Using AutoCapture.
Packets Dropped Number of dropped packets in the capture session.
Media Media type of capture.
Adapter Adapter for the capture session.
Adapter Address MAC address of the adapter for the capture session.
Link Speed The speed as reported by the adapter in Mbits/second.
Owner Name of user that created the capture.
Column Description
Starting OmniPeek from the command line 565

Appendix B: Reference
ANYOP_UG.book Page 566 Friday, February 5, 2016 4:47 PM
566 Starting OmniPeek from the command line

A P P E N D I X C
ANYOP_UG.book Page 567 Friday, February 5, 2016 4:47 PM
OmniPeek Installed Components
In this appendix:
Component descriptions. . . . . . . . . . . . . . . . . . . . . . . . . . . . . . . . . . . . . . . . . . 568
567
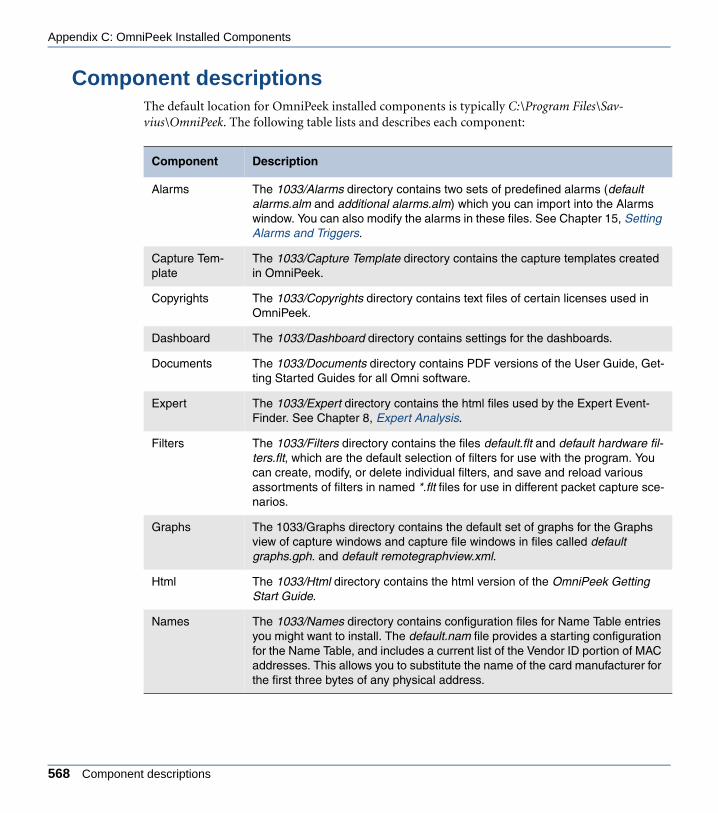
Appendix C: OmniPeek Installed Components
ANYOP_UG.book Page 568 Friday, February 5, 2016 4:47 PM
Component descriptionsThe default location for OmniPeek installed components is typically C:\Program Files\Sav-vius\OmniPeek. The following table lists and describes each component:
Component Description
Alarms The 1033/Alarms directory contains two sets of predefined alarms (default alarms.alm and additional alarms.alm) which you can import into the Alarms window. You can also modify the alarms in these files. See Chapter 15, Setting Alarms and Triggers.
Capture Tem-plate
The 1033/Capture Template directory contains the capture templates created in OmniPeek.
Copyrights The 1033/Copyrights directory contains text files of certain licenses used in OmniPeek.
Dashboard The 1033/Dashboard directory contains settings for the dashboards.
Documents The 1033/Documents directory contains PDF versions of the User Guide, Get-ting Started Guides for all Omni software.
Expert The 1033/Expert directory contains the html files used by the Expert Event-Finder. See Chapter 8, Expert Analysis.
Filters The 1033/Filters directory contains the files default.flt and default hardware fil-ters.flt, which are the default selection of filters for use with the program. You can create, modify, or delete individual filters, and save and reload various assortments of filters in named *.flt files for use in different packet capture sce-narios.
Graphs The 1033/Graphs directory contains the default set of graphs for the Graphs view of capture windows and capture file windows in files called default graphs.gph. and default remotegraphview.xml.
Html The 1033/Html directory contains the html version of the OmniPeek Getting Start Guide.
Names The 1033/Names directory contains configuration files for Name Table entries you might want to install. The default.nam file provides a starting configuration for the Name Table, and includes a current list of the Vendor ID portion of MAC addresses. This allows you to substitute the name of the card manufacturer for the first three bytes of any physical address.
568 Component descriptions
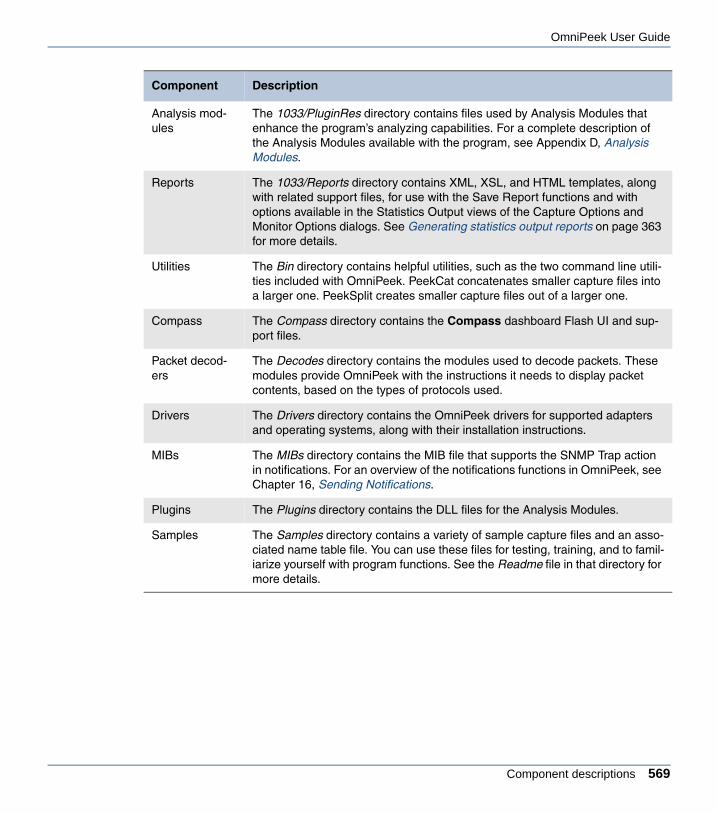
OmniPeek User Guide
ANYOP_UG.book Page 569 Friday, February 5, 2016 4:47 PM
Analysis mod-ules
The 1033/PluginRes directory contains files used by Analysis Modules that enhance the program’s analyzing capabilities. For a complete description of the Analysis Modules available with the program, see Appendix D, Analysis Modules.
Reports The 1033/Reports directory contains XML, XSL, and HTML templates, along with related support files, for use with the Save Report functions and with options available in the Statistics Output views of the Capture Options and Monitor Options dialogs. See Generating statistics output reports on page 363 for more details.
Utilities The Bin directory contains helpful utilities, such as the two command line utili-ties included with OmniPeek. PeekCat concatenates smaller capture files into a larger one. PeekSplit creates smaller capture files out of a larger one.
Compass The Compass directory contains the Compass dashboard Flash UI and sup-port files.
Packet decod-ers
The Decodes directory contains the modules used to decode packets. These modules provide OmniPeek with the instructions it needs to display packet contents, based on the types of protocols used.
Drivers The Drivers directory contains the OmniPeek drivers for supported adapters and operating systems, along with their installation instructions.
MIBs The MIBs directory contains the MIB file that supports the SNMP Trap action in notifications. For an overview of the notifications functions in OmniPeek, see Chapter 16, Sending Notifications.
Plugins The Plugins directory contains the DLL files for the Analysis Modules.
Samples The Samples directory contains a variety of sample capture files and an asso-ciated name table file. You can use these files for testing, training, and to famil-iarize yourself with program functions. See the Readme file in that directory for more details.
Component Description
Component descriptions 569

Appendix C: OmniPeek Installed Components
ANYOP_UG.book Page 570 Friday, February 5, 2016 4:47 PM
Application Data
Application data, such as names, filters, log files, and so forth, is cached in the Application Data folder. The default location of the Application Data folder is in a directory in the root drive where the operating system is installed (typically C:\) with the path name: Documents and Settings\(user name)\Application Data.
OmniPeek creates a subdirectory structure within these locations to cache application data. That subdirectory structure is: Savvius\OmniPeek. For exam-ple, the application data for the Administrator of a Windows 7 64-bit system would be cached in: C:\Users\tsadmin\AppData\Roaming\Savvius\Omnipeek.
GPS The Savvius GPS Daemon is the interface between itself and your GPS receiver and is typically installed by default at C:\Program Files\Common Files\Savvius\GPS\gpsdaemon.exe.
Component Description
570 Component descriptions

A P P E N D I X D
ANYOP_UG.book Page 571 Friday, February 5, 2016 4:47 PM
Analysis Modules
In this appendix:
Analysis Module Descriptions. . . . . . . . . . . . . . . . . . . . . . . . . . . . . . . . . . . . . . 572
571

Appendix D: Analysis Modules
ANYOP_UG.book Page 572 Friday, February 5, 2016 4:47 PM
Analysis Module DescriptionsThis appendix describes each of the Analysis Modules options found in the Options dialog. To view the Options dialog, on the Tools menu, click Options (or on the Start Page, click List installed plug-ins).
802.11 Analysis
The 802.11 analysis module displays and logs the values found in the one-bit frame control fields of the 802.11 WLAN MAC headers.
To open the 802.11 Analysis Module Options dialog:
1. On the Tools menu, click Options, and then click Analysis Modules.
2. Select 802.11 Analysis Module and click Options. The 802.11 Analysis Module Options dialog appears.
3. Select Display frame control flags to have flags displayed in the Summary column of the Packets view of capture windows.
4. Assign (or accept defaults for) the character OmniPeek will use for each of the frame control flags monitored by the analysis module.
• To change the character, type a new value beside the flag.
• Indicate null values for any of the frame control flags by entering the character in the Flag not present text box.
5. Click OK to accept your changes.
Access Point Capture Adapter
The Access Point Capture Adapter, lets you stream packets from one or more access points into a running wireless capture window in OmniPeek. To begin streaming packets, you will
572 Analysis Module Descriptions

OmniPeek User Guide
ANYOP_UG.book Page 573 Friday, February 5, 2016 4:47 PM
need to create a new Access Point Capture Adapter entry, and then select the new adapter as the adapter for a capture window. See Capturing Packets from an Access Point Capture Adapter on page 48.
To configure the port on OmniPeek should listen on for the access point data:
1. On the Tools menu, click Options, and then click Analysis Modules.
2. Select Access Point Capture Adapter and click Options. The Access Point Capture Adapter Options dialog appears.
3. Enter a Listen port value. The default is 5000.
4. Click OK to accept your changes.
Aggregator/Roaming Adapter
The Aggregator/Roaming Adapter, which appears in the Analysis Modules view of the Options dialog in OmniPeek, lets you capture and analyze traffic from multiple sources. For wired traffic, it aggregates packets from multiple wired adapters. For wireless traffic, it cap-tures wireless packets from multiple channels simultaneously, measures vital statistics on each channel separately, and calculates the latency of devices roaming between access points. See Configuring adapter options on page 45. You can enable or disable the Aggregator/Roaming Adapter functionality in OmniPeek in the Analysis Modules view of the Options dialog.
To change options in the Wireless Aggregator and Roaming Analysis Options dialog:
1. On the Tools menu, click Options, and then click Analysis Modules.
2. Select Aggregator/Roaming and click Options. The Wireless Aggregator and Roaming Analysis Options dialog appears.
Aggregator/Roaming Adapter 573

Appendix D: Analysis Modules
ANYOP_UG.book Page 574 Friday, February 5, 2016 4:47 PM
3. Configure the dialog:
• Accept CRC packets: Select this option to show CRC packets for AirPcap adapters in the Packets view.
• Filter out roams with missing Association packets: Select this option to hide missing association packets in the Roaming views. This option is enabled by default.
• Calculate Latency Between Ack to Ack: Select this option to calculate the latency between the last data packet with a corresponding ACK from the old access point, and the first data packet with a corresponding ACK from the new access point. Also by default, this option filters out all the roams with missing association.
4. Click OK to accept your changes.
AppleTalk Analysis
The AppleTalk analysis module keeps track of and displays information about AppleTalk Address Resolution Protocol (AARP) requests, AARP responses, AARP probes, unanswered AARP requests, and the number of AppleTalk multicasts on your network. In addition, the AppleTalk analysis module shows details for NBP, ATP, and ASP.
The results of the AppleTalk analysis module are displayed in the Summary column of the Packets view of any capture window, and its counts are also used as some of the key baseline traffic elements provided in Summary Statistics.
Checksums Analysis
Many network error detection and correction techniques are based on checksums. The sender performs a computation on the data to be sent and the result, the checksum, is included with the transmission. The receiver performs the same computation on the data it receives and compares its results to the sender’s checksum. If a difference exists, the data is most likely cor-rupted and the sender is asked to retransmit the data.
574 Analysis Module Descriptions
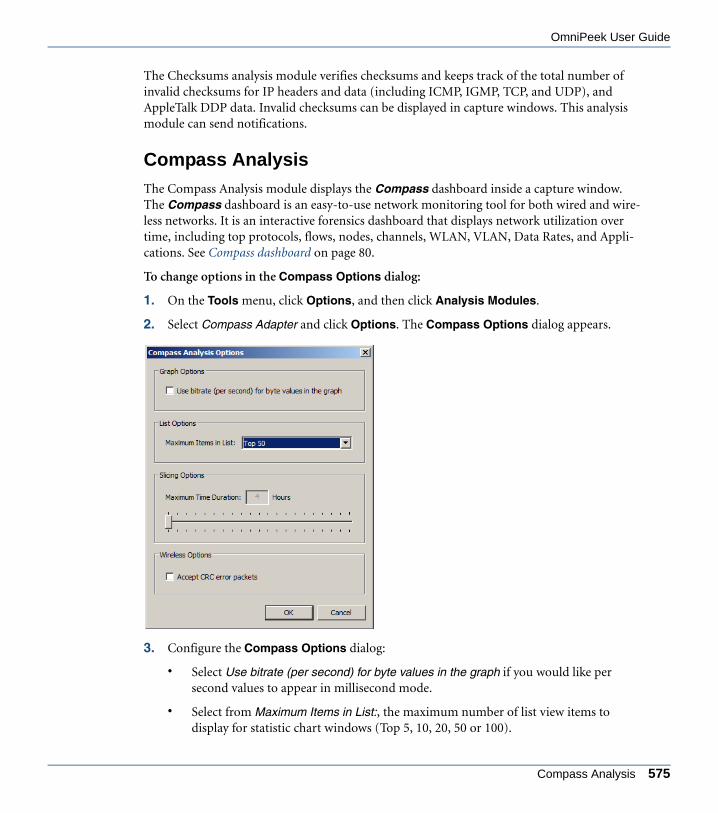
OmniPeek User Guide
ANYOP_UG.book Page 575 Friday, February 5, 2016 4:47 PM
The Checksums analysis module verifies checksums and keeps track of the total number of invalid checksums for IP headers and data (including ICMP, IGMP, TCP, and UDP), and AppleTalk DDP data. Invalid checksums can be displayed in capture windows. This analysis module can send notifications.
Compass Analysis
The Compass Analysis module displays the Compass dashboard inside a capture window. The Compass dashboard is an easy-to-use network monitoring tool for both wired and wire-less networks. It is an interactive forensics dashboard that displays network utilization over time, including top protocols, flows, nodes, channels, WLAN, VLAN, Data Rates, and Appli-cations. See Compass dashboard on page 80.
To change options in the Compass Options dialog:
1. On the Tools menu, click Options, and then click Analysis Modules.
2. Select Compass Adapter and click Options. The Compass Options dialog appears.
3. Configure the Compass Options dialog:
• Select Use bitrate (per second) for byte values in the graph if you would like per second values to appear in millisecond mode.
• Select from Maximum Items in List:, the maximum number of list view items to display for statistic chart windows (Top 5, 10, 20, 50 or 100).
Compass Analysis 575

Appendix D: Analysis Modules
ANYOP_UG.book Page 576 Friday, February 5, 2016 4:47 PM
• Use the Maximum Time Duration slider bar to set the ‘Slicing’ value. ‘Slicing’ refers to removing a portion of time from the beginning of the statistics database, thereby leaving the most recent data restricted to a maximum time duration. ‘Slicing’ only occurs during real-time captures.
Note When the statistics database reaches a time duration equal to the maximum time duration + 10 minutes, Compass removes the first 10 minutes of statistics data from the database.
• Select Accept CRC error packets if you would like to also capture CRC error packets when capturing wireless packets.
4. Click OK to accept your changes.
Duplicate Address
The Duplicate Address analysis module displays and logs instances of two or more network devices using the same IP address. When two separate physical addresses are noted by the Duplicate Address analysis module to be using the same logical IP address, the analysis mod-ule produces a Notification. The Duplicate Address analysis module also adds a count of duplicate IP addresses detected to Summary Statistics and the Summary view of any capture window.
To change options in the Duplicate Address analysis module Options dialog:
1. On the Tools menu, click Options, and then click Analysis Modules.
2. Select Duplicate Address Analysis Module and click Options. The Duplicate Address Analysis Module Options dialog appears.
576 Analysis Module Descriptions

OmniPeek User Guide
ANYOP_UG.book Page 577 Friday, February 5, 2016 4:47 PM
3. Select Suppress redundant reports and enter the physical addresses of devices that should be ignored. (By default, duplicate reports for the physical hardware broadcast address are suppressed.)
4. Click OK to accept your changes.
Tip For the most accurate results, you should use the Name Table to identify routers on the local segment before enabling the Duplicate Address analysis module.
Duplicate IP address notifications are usually caused by multiple routers. Because routers for-ward traffic from other networks at OSI Layer 3, the logical address (IP) is forwarded unchanged but the physical address (MAC) is changed to that of the router doing the forward-ing. When there is more than one router on the local segment, multiple physical addresses may be associated with a single logical address and send a Duplicate Address notification.
Email Analysis
The Email analysis module displays SMTP and POP3 commands that can be helpful in debug-ging Internet mail problems. The Email analysis module reports on client/server connections by counting the number of mail transfers initiated, the number of successful transfers, and the number of failed transfers. It then delivers this information to Summary Statistics and to the Summary column in the Packets view of any capture window,.
SMTP specifies the exact format of messages a client on one machine uses to transfer mail to a server on another. Communication between a client and a server consists of readable ASCII text.
First, the client establishes a reliable stream connection to the server and then waits for the server to send a 220 READY FOR MAIL message. If the server is overloaded, it may delay send-ing the 220 message temporarily. Once the 220 message is received by the client, the client sends a HELO command.
The server responds by identifying itself. Once communication has been established, the sender can transmit one or more mail messages, terminate the connection, or request the server to reverse the roles of sender and receiver so messages can flow in the opposite direc-tion. The receiver must acknowledge each message. It can also suspend the entire connection or the current message transfer.
Mail transactions begin with the MAIL command which provides the sender identification as well as a FROM: field that contains the address to which errors should be reported. A recipient prepares its data structures to receive a new mail message and replies to a MAIL command by sending the response 250, which means all is well. The full response consists of the text 250 OK. As with other application protocols, programs read the abbreviated commands and 3-
Email Analysis 577

Appendix D: Analysis Modules
ANYOP_UG.book Page 578 Friday, February 5, 2016 4:47 PM
digit numbers at the beginning of lines. The remaining text is intended to help debug mail software.
After a successful MAIL command, the sender issues a series of RCPT commands that identify recipients of the mail message. The receiver must acknowledge each RCPT command by send-ing 250 OK or by sending the error message 550 No Such User Here.
After all RCPT commands have been acknowledged, the sender issues a DATA command. In essence, a DATA command informs the receiver that the sender is ready to transfer a complete mail message. The receiver responds with message 354 Start Mail Input and specifies the sequence of characters used to terminate the mail message. The termination sequence consists of 5 characters: carriage return, line feed, period, carriage return, and line feed.
Although clients can suspend the delivery completely if an error occurs, most clients do not. Instead, they continue delivery to all valid recipients and then report problems to the sender.
Usually, the client reports errors using email. The error message contains a summary of the error as well as the header of the mail message that caused the problem.
Once the client has finished sending all the mail messages to a particular destination, the client may issue the TURN command to turn the connection around. If it does, the server responds 250 OK and assumes control of the connection. With the roles reversed, the side that was orig-inally the server sends back any waiting mail messages. Whichever side controls the interaction can choose to terminate the session by issuing a QUIT command. The other side responds with command 221, which means it agrees to terminate. Both sides then close the TCP con-nection.
FTP Analysis
The FTP analysis module provides the ability to:
• Report the number of successful file transfer initiations, completions, and failures.
• Report and display the names of files that are being uploaded or downloaded.
• Report and display ftp commands (for example, ls, cd, and so forth).
The FTP analysis module also watches FTP control traffic for status messages that signal the successful start and end of a file transfer. A count is then added to Summary Statistics for these values. The FTP analysis module can also write these control messages to the Summary column of the Packets view of capture windows.
FTP can send an unsuccessful termination message. This condition is rare, but can be of inter-est to a network manager, especially if there is a high incidence of terminated sessions. Nor-mally, failed FTP transactions are due to unexpected network delays or disruptions. Because a status packet does not usually accompany termination, the only way for a network manager to be aware of this condition is by monitoring the difference between the successful start and end
578 Analysis Module Descriptions

OmniPeek User Guide
ANYOP_UG.book Page 579 Friday, February 5, 2016 4:47 PM
of file transfers. A high discrepancy can signal not only potential network problems, but also additional loss of bandwidth due to unsuccessful transfers.
ICMP Analysis
ICMP (Internet Control Message Protocol) is a maintenance protocol that handles error mes-sages to be sent when packets are discarded or when systems experience congestion. For exam-ple, the classic TCP/IP test command is PING. It sends an ICMP Echo Request to a remote system. If the system responds, the link is operational. If it fails to respond to repeated pings, something is wrong.
Another important function of ICMP is to provide a dynamic means to ensure that your sys-tem has an up-to-date routing table. ICMP is part of any TCP/IP implementation and is enabled automatically. ICMP messages provide many functions, including route redirection. If your workstation forwards a packet to a router, for example, and that router is aware of a shorter path to your destination, the router sends your workstation a redirection message informing it of a shorter route.
The ICMP analysis module displays information about ICMP destination unreachables, ICMP redirects, ICMP address mask replies, ICMP source quenches, and more. The analysis module can display ICMP type and code in Summary Statistics and in the Summary column of the Packets view of capture windows. This analysis module can also send notifications.
To change options in the ICMP analysis module Options dialog:
1. On the Tools menu, click Options, and then click Analysis Modules.
2. Select ICMP Analysis Module and click Options. The ICMP Analysis Module Options dialog appears.
3. Select Report ping (echo) packets to log or deselect to ignore ping (echo) packets. The default is to ignore these packets since they are quite common.
4. Click OK to accept your changes.
ICMP Analysis 579

Appendix D: Analysis Modules
ANYOP_UG.book Page 580 Friday, February 5, 2016 4:47 PM
IP Analysis
The IP analysis module keeps track of and displays information about requests and responses from ARP, RARP, DHCP, and DNS; and TCP sequence numbers, acknowledgement numbers, windows, and flags, as well as TCP and UDP port numbers.
Address Resolution Protocol (ARP) dynamically discovers the physical address of a device, given its IP address. Reverse Address Resolution Protocol (RARP) enables a device to discover its IP address by broadcasting a request on the network. Dynamic Host Configuration Proto-col (DHCP) provides clients with a dynamically assigned IP address and other network config-uration setting parameters. Domain Name System (DNS) is a set of distributed databases providing information such as the IP addresses corresponding to network device names, and the location of mail servers.
A Sequence number is a 32-bit field of a TCP header. If the segment contains data, the Sequence number is associated with the first octet of the data. TCP requires that data is acknowledged (given an Acknowledgement number) before it is considered to have been transmitted safely. TCP maintains its connections within a series of TCP windows established by the protocol. TCP packets may contain flags to denote a variety of conditions or protocol functions.
Results of the IP analysis module are displayed in the Summary column in the Packets view of any capture window, and its counts are used as some of the key baseline traffic elements pro-vided in Summary Statistics.
To change the options for the IP analysis module:
1. On the Tools menu, click Options, and then click Analysis Modules.
2. Select IP Analysis Module and click Options. The IP Analysis Module Options dialog appears.
580 Analysis Module Descriptions

OmniPeek User Guide
ANYOP_UG.book Page 581 Friday, February 5, 2016 4:47 PM
3. Options for this analysis module, all of which are enabled by default, are to show: ports, TCP flags, sequence number, length, ack number, window, and next expected sequence number. Also enabled by default are the display options of Right justify, which makes the numbers line up correctly when seen in the Packets view, and Override default color, which shows information from this analysis module in gray in the Summary column of the Packets view.
Modbus Analysis
The Modbus analysis module collects information carried in the Modbus/TCP automation control protocol. The Modbus analysis module collects the type (query or response), transac-tion number, and function command found in Modbus over TCP packets, and posts this information to the Summary column of the Packets view of capture windows. Modbus is a standard for device control and reporting in industrial computing.
MPLS/VLAN Analysis
The MPLS/VLAN analysis module provides statistics for MPLS and VLAN networks. The MPLS/VLAN analysis module is supported on both OmniPeek and Capture Engine. This combined plug-in provides basic statistics (i.e., total packets/bytes and packets/bytes per IP-Node) and is displayed in the Summary view.
Unlike other plug-ins, MPLS and VLAN are dynamically created, and therefore each 802.1Q VLAN ID observed in the capture, a new VLAN group will be created in the Summary view, named VLAN Network <id>, where <id> is the VLAN ID as specified in the 802.1Q header. Within this group, there is one statistic for each IP addressed observed using that VLAN ID. In addition, there is a Total statistic representing the total number of packets and bytes observed using that VLAN ID.
For each MPLS label observed in the capture, a new group will be created in the Summary view, named MPLS Network <label>, where <label> is the MPLS label observed as specified in the MPLS header. Within this group, there is one statistic for each IP address observed using that MPLS label. In addition, there will be a Total statistic representing the total number of packets and bytes observed using that MPLS label.
These statistics can be used to make or Alarms, as with most other summary statistics, subject to the current limitations of graphs and alarms (e.g., there are no alarms on local captures).
To change the options for the MPLS/VLAN analysis module:
1. On the Tools menu, click Options, and then click Analysis Modules.
2. Select MPLS/VLAN Analysis and click Options. The MPLS/VLAN Analysis Module Options dialog appears.
Modbus Analysis 581
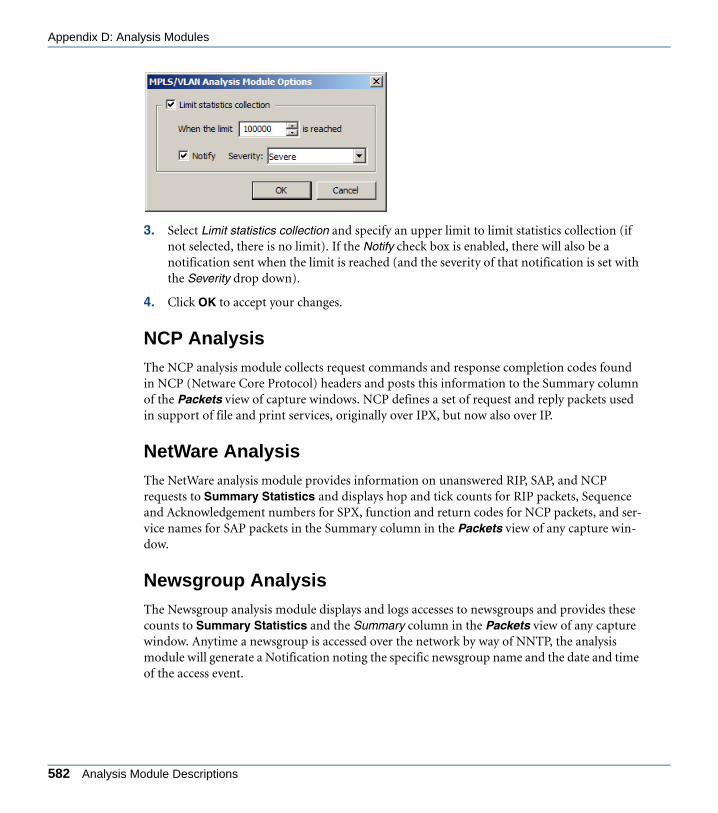
Appendix D: Analysis Modules
ANYOP_UG.book Page 582 Friday, February 5, 2016 4:47 PM
3. Select Limit statistics collection and specify an upper limit to limit statistics collection (if not selected, there is no limit). If the Notify check box is enabled, there will also be a notification sent when the limit is reached (and the severity of that notification is set with the Severity drop down).
4. Click OK to accept your changes.
NCP Analysis
The NCP analysis module collects request commands and response completion codes found in NCP (Netware Core Protocol) headers and posts this information to the Summary column of the Packets view of capture windows. NCP defines a set of request and reply packets used in support of file and print services, originally over IPX, but now also over IP.
NetWare Analysis
The NetWare analysis module provides information on unanswered RIP, SAP, and NCP requests to Summary Statistics and displays hop and tick counts for RIP packets, Sequence and Acknowledgement numbers for SPX, function and return codes for NCP packets, and ser-vice names for SAP packets in the Summary column in the Packets view of any capture win-dow.
Newsgroup Analysis
The Newsgroup analysis module displays and logs accesses to newsgroups and provides these counts to Summary Statistics and the Summary column in the Packets view of any capture window. Anytime a newsgroup is accessed over the network by way of NNTP, the analysis module will generate a Notification noting the specific newsgroup name and the date and time of the access event.
582 Analysis Module Descriptions
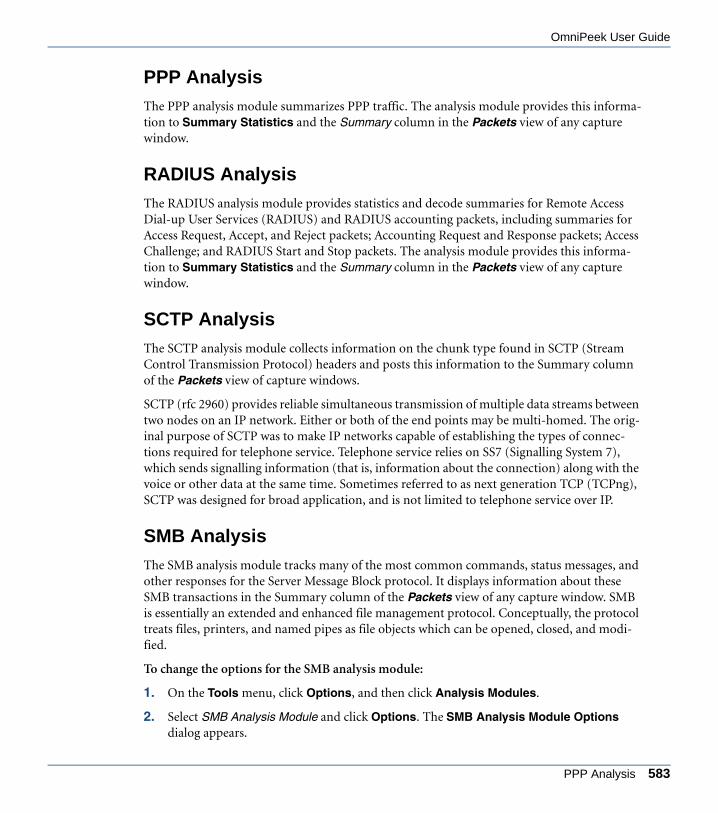
OmniPeek User Guide
ANYOP_UG.book Page 583 Friday, February 5, 2016 4:47 PM
PPP Analysis
The PPP analysis module summarizes PPP traffic. The analysis module provides this informa-tion to Summary Statistics and the Summary column in the Packets view of any capture window.
RADIUS Analysis
The RADIUS analysis module provides statistics and decode summaries for Remote Access Dial-up User Services (RADIUS) and RADIUS accounting packets, including summaries for Access Request, Accept, and Reject packets; Accounting Request and Response packets; Access Challenge; and RADIUS Start and Stop packets. The analysis module provides this informa-tion to Summary Statistics and the Summary column in the Packets view of any capture window.
SCTP Analysis
The SCTP analysis module collects information on the chunk type found in SCTP (Stream Control Transmission Protocol) headers and posts this information to the Summary column of the Packets view of capture windows.
SCTP (rfc 2960) provides reliable simultaneous transmission of multiple data streams between two nodes on an IP network. Either or both of the end points may be multi-homed. The orig-inal purpose of SCTP was to make IP networks capable of establishing the types of connec-tions required for telephone service. Telephone service relies on SS7 (Signalling System 7), which sends signalling information (that is, information about the connection) along with the voice or other data at the same time. Sometimes referred to as next generation TCP (TCPng), SCTP was designed for broad application, and is not limited to telephone service over IP.
SMB Analysis
The SMB analysis module tracks many of the most common commands, status messages, and other responses for the Server Message Block protocol. It displays information about these SMB transactions in the Summary column of the Packets view of any capture window. SMB is essentially an extended and enhanced file management protocol. Conceptually, the protocol treats files, printers, and named pipes as file objects which can be opened, closed, and modi-fied.
To change the options for the SMB analysis module:
1. On the Tools menu, click Options, and then click Analysis Modules.
2. Select SMB Analysis Module and click Options. The SMB Analysis Module Options dialog appears.
PPP Analysis 583
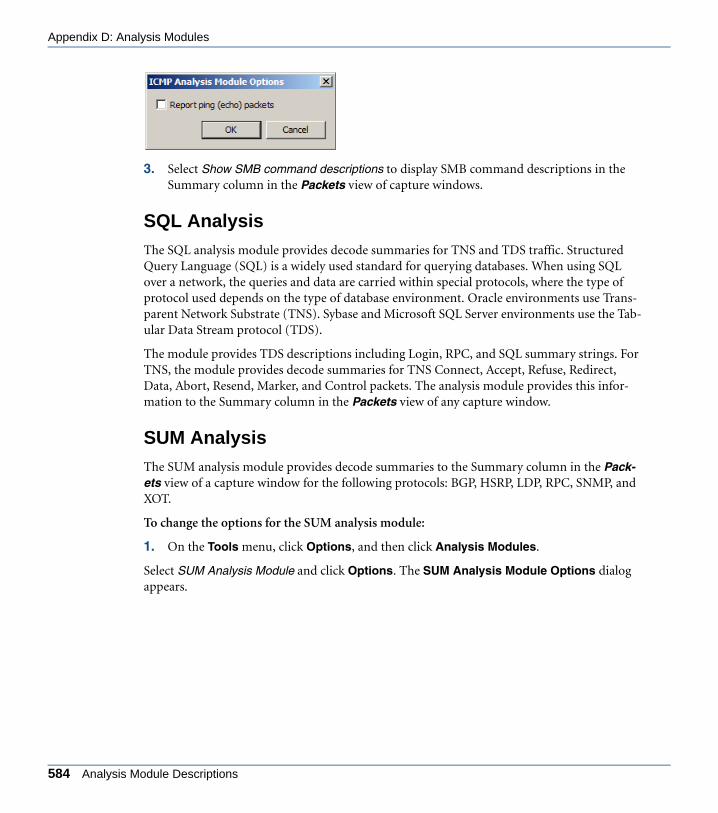
Appendix D: Analysis Modules
ANYOP_UG.book Page 584 Friday, February 5, 2016 4:47 PM
3. Select Show SMB command descriptions to display SMB command descriptions in the Summary column in the Packets view of capture windows.
SQL Analysis
The SQL analysis module provides decode summaries for TNS and TDS traffic. Structured Query Language (SQL) is a widely used standard for querying databases. When using SQL over a network, the queries and data are carried within special protocols, where the type of protocol used depends on the type of database environment. Oracle environments use Trans-parent Network Substrate (TNS). Sybase and Microsoft SQL Server environments use the Tab-ular Data Stream protocol (TDS).
The module provides TDS descriptions including Login, RPC, and SQL summary strings. For TNS, the module provides decode summaries for TNS Connect, Accept, Refuse, Redirect, Data, Abort, Resend, Marker, and Control packets. The analysis module provides this infor-mation to the Summary column in the Packets view of any capture window.
SUM Analysis
The SUM analysis module provides decode summaries to the Summary column in the Pack-ets view of a capture window for the following protocols: BGP, HSRP, LDP, RPC, SNMP, and XOT.
To change the options for the SUM analysis module:
1. On the Tools menu, click Options, and then click Analysis Modules.
Select SUM Analysis Module and click Options. The SUM Analysis Module Options dialog appears.
584 Analysis Module Descriptions
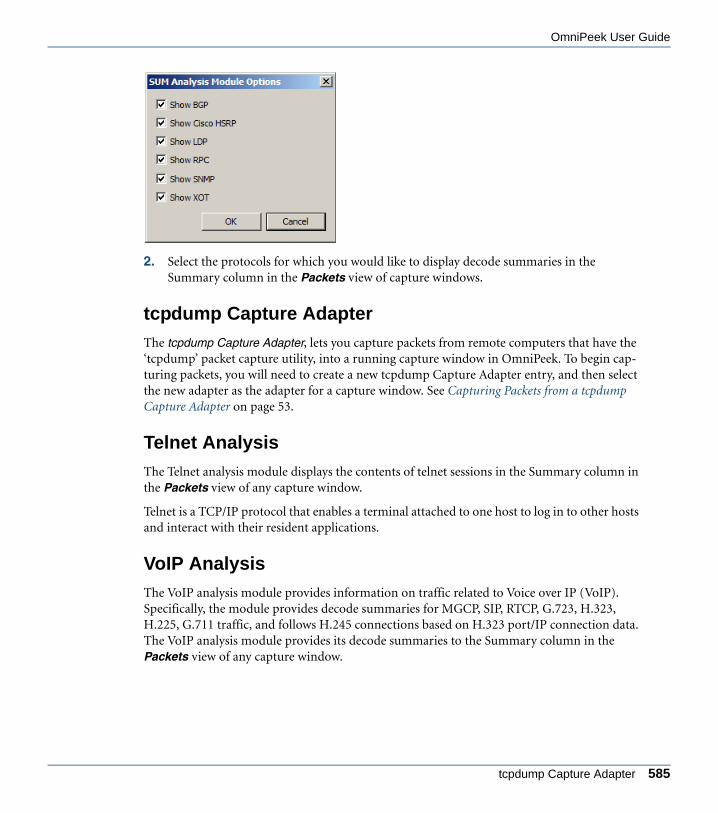
OmniPeek User Guide
ANYOP_UG.book Page 585 Friday, February 5, 2016 4:47 PM
2. Select the protocols for which you would like to display decode summaries in the Summary column in the Packets view of capture windows.
tcpdump Capture Adapter
The tcpdump Capture Adapter, lets you capture packets from remote computers that have the ‘tcpdump’ packet capture utility, into a running capture window in OmniPeek. To begin cap-turing packets, you will need to create a new tcpdump Capture Adapter entry, and then select the new adapter as the adapter for a capture window. See Capturing Packets from a tcpdump Capture Adapter on page 53.
Telnet Analysis
The Telnet analysis module displays the contents of telnet sessions in the Summary column in the Packets view of any capture window.
Telnet is a TCP/IP protocol that enables a terminal attached to one host to log in to other hosts and interact with their resident applications.
VoIP Analysis
The VoIP analysis module provides information on traffic related to Voice over IP (VoIP). Specifically, the module provides decode summaries for MGCP, SIP, RTCP, G.723, H.323, H.225, G.711 traffic, and follows H.245 connections based on H.323 port/IP connection data. The VoIP analysis module provides its decode summaries to the Summary column in the Packets view of any capture window.
tcpdump Capture Adapter 585

Appendix D: Analysis Modules
ANYOP_UG.book Page 586 Friday, February 5, 2016 4:47 PM
WAN Analysis
The WAN analysis module provides statistics and decode summaries for Frame Relay, PPP, X.25, Q.921, and Q.931. The analysis module provides this information to Summary Statis-tics and the Summary column in the Packets view of any capture window.
Web Analysis
The Web analysis module displays and logs access to World Wide Web resources. When a Web URL is accessed over the network, the URL is added to the log file, noting the date and time of the access. The information is also written to the Summary column in the Packets view of any capture window. The Web analysis module adds a count of URLs accessed in Summary Sta-tistics.
Tip Double-click any URL posted to the Log file by the Web analysis module to open that resource in your default browser.
Note In environments with significant Web traffic, the Web analysis module can write substantial amounts of information to the global log. You may want to disable the Web analysis module in such cases to prevent the Log file from growing too large, too quickly.
586 Analysis Module Descriptions

A P P E N D I X E
ANYOP_UG.book Page 587 Friday, February 5, 2016 4:47 PM
Expert Events
In this appendix:
About Expert events . . . . . . . . . . . . . . . . . . . . . . . . . . . . . . . . . . . . . . . . . . . . . 588
VoIP . . . . . . . . . . . . . . . . . . . . . . . . . . . . . . . . . . . . . . . . . . . . . . . . . . . . . . . . . 588
WAN . . . . . . . . . . . . . . . . . . . . . . . . . . . . . . . . . . . . . . . . . . . . . . . . . . . . . . . . . 590
Wireless . . . . . . . . . . . . . . . . . . . . . . . . . . . . . . . . . . . . . . . . . . . . . . . . . . . . . . 590
Network Policy . . . . . . . . . . . . . . . . . . . . . . . . . . . . . . . . . . . . . . . . . . . . . . . . . 595
Client/Server. . . . . . . . . . . . . . . . . . . . . . . . . . . . . . . . . . . . . . . . . . . . . . . . . . . 595
Application . . . . . . . . . . . . . . . . . . . . . . . . . . . . . . . . . . . . . . . . . . . . . . . . . . . . 596
Session. . . . . . . . . . . . . . . . . . . . . . . . . . . . . . . . . . . . . . . . . . . . . . . . . . . . . . . 599
Transport. . . . . . . . . . . . . . . . . . . . . . . . . . . . . . . . . . . . . . . . . . . . . . . . . . . . . . 599
Network . . . . . . . . . . . . . . . . . . . . . . . . . . . . . . . . . . . . . . . . . . . . . . . . . . . . . . 601
Data Link . . . . . . . . . . . . . . . . . . . . . . . . . . . . . . . . . . . . . . . . . . . . . . . . . . . . . 602
Physical . . . . . . . . . . . . . . . . . . . . . . . . . . . . . . . . . . . . . . . . . . . . . . . . . . . . . . 603
587

Appendix E: Expert Events
ANYOP_UG.book Page 588 Friday, February 5, 2016 4:47 PM
About Expert eventsThis appendix lists all of the Expert Events found in the program. For a complete list of the descriptions, possible causes, and remedies of each Expert Event, please see the Expert Event-Finder or the OmniPeek online help.
VoIP• H.225 RAS Reject: An H.225 Registration, Admission and Status (RAS) request has been
rejected by a Gatekeeper.
• H.225 Call Signaling (Q.931) - Call Dropped: An H.225/Q.931 Signaling Protocol RELEASE COMPLETE message with a cause other than most “normal” causes is observed on a previously established call.
• H.225 Call Signaling (Q.931) - Call Rejected: An H.225/Q.931 Signaling Protocol RELEASE COMPLETE message with a cause other than most “normal” causes is observed on a previously established call.
• H.245 Control Reject: An H.245 Control Protocol Request has been rejected.
• Low MOS-CQ: The PMOS-CQ score for a VoIP flow has dropped below the threshold specified in the EventFinder settings.
• Low R Factor Conversational: The R-Conversational factor for a VoIP flow has dropped below the threshold specified in the EventFinder settings.
• MGCP - Transient Error: Resource not available error has occurred, causing the current operation to fail, but with the expectation that the same operation can be fulfilled in a future request.
• MGCP - Permanent Error: A permanent error has occurred that can not be fulfilled in future requests and will not disappear with time.
• MGCP - Connection Deleted or Restart in Progress: The gateway is deleting or restarting a connection to a Call Agent.
• RTP Excessive Jitter Detected: By checking the timestamps of arriving RTP packets, the Expert has detected excessive interarrival jitter (packets which are not arriving at constant intervals). Ideally, jitter should be near zero. To report events based on the jitter values contained within RTCP packets, see the RTP Excessive Jitter Reported event.
• RTP Excessive Jitter Reported: RTP interarrival jitter (packets which are not arriving at constant intervals) is reported by the recipient in its Real-time Transport Control Protocol (RTCP) report (usually sent at 5 second or shorter intervals). Ideally, jitter should be near zero. To report events based on the RTP packet timestamps, see the RTP Excessive Jitter Detected event.
588 About Expert events

OmniPeek User Guide
ANYOP_UG.book Page 589 Friday, February 5, 2016 4:47 PM
• RTP Excessive Packet Loss Detected: Analysis of captured RTP packets shows a packet loss level above the threshold specified in the EventFinder settings.
• RTP Excessive Packet Loss Reported: An RTCP packet has reported that a receiver has seen a packet loss level above the threshold specified in the EventFinder settings.
• RTP Not Marked for QoS: IP QoS is not enabled on the device that forwarded the received packet.
• RTP Late Packet Arrival: An RTP packet arrived later than expected.
• RTP Packet Out of Sequence: An RTP packet has arrived ahead of a previously sent RTP packet.
• SCCP Station Alarm - Advisory: The Cisco Skinny Client Control Protocol (SCCP) defines eight levels of station alarms. The expert groups the lower four station alarms in this category. This includes Debug, Informational, Notice, and Warning. The upper four are grouped into the “SCCP Station Alarm – Critical” group.
• SCCP Station Alarm - Critical Alert: The Cisco Skinny Client Control Protocol (SCCP) defines eight levels of station alarms. The expert groups the top four most severe station alarms in this category. This includes Emergency, Alert, Critical, and Error. The lower four are grouped into the “SCCP Station Alarm – Advisory” group.
• SCCP Station QoS Error: A Cisco SkinnyEP (RSVP Agent) is reporting an error to Call Manager.
• SCCP Station Register Reject: The Call Manager is rejecting a station’s attempt to register.
• SIP Post-Dial Delay Exceeded: The delay between a client’s first Session Initialization Protocol (SIP) INVITE request and the resulting 180-Ringing response from a server exceeded the threshold.
• SIP Redirection: A client's Session Initialization Protocol (SIP) request resulted in a 3xx-Redirection response from a server.
• SIP Client Authentication Required: A client's Session Initialization Protocol (SIP) request resulted in a 401-Unauthorized or 407-Proxy Authentication Required response from a server.
• SIP Client Error: A client’s Session Initialization Protocol (SIP) request resulted in a 4xx-Request Failure response from a server.
• SIP Server Error: A client’s Session Initialization Protocol (SIP) request resulted in a 5xx-Server Failure response from a server.
• SIP Global Error: A client’s Session Initialization Protocol (SIP) request resulted in a 6xx-Global Failure response from a server.
VoIP 589

Appendix E: Expert Events
ANYOP_UG.book Page 590 Friday, February 5, 2016 4:47 PM
WAN• Frame Relay Excessive FECN: Forward Explicit Congestion Notification. A frame relay
switch that is relaying frame relay traffic between DLCIs has recognized congestion in the forwarding DLCI and is setting the FECN bit in a frame that is being forwarded. Also see BECN.
• Frame Relay Excessive BECN: Backward Explicit Congestion Notification. A frame relay switch that is relaying frame relay traffic between DLCIs has recognized congestion in the forwarding DLCI and is setting the BECN bit in a frame that is heading the opposite direction back to the originating DLCI. Also see FECN.
• Frame Relay DLCI Status Change: A DLCI has gone down, has become inactive, a new DLCI has been activated, or there is a complete reconfiguration of DLCIs.
• PPP Configure NAK: During PPP setup, all configuration options are recognizable by the peer, but one or more of the values are not acceptable.
• PPP Reject: During PPP setup, there has been a Configure-Reject, Code-Reject, or Protocol-Reject from the peer.
• PPP Terminate-Request: A sustained level of “all stations broadcast” packets (the destination physical address consists of all 1s) has met or exceeded the threshold.
Wireless
Performance
• Wireless - Too Many Physical Errors: There are frames captured at this location containing a CRC error. The threshold is in number of CRC errors per second.
• Wireless AP - QBSS Client Too Many: A QoS Basic Service Set (QBSS) capable access point has more users than the specified default.
• Wireless AP - Mixed Mode: An 802.11 b/g access point is communicating with both b and g clients.
• Wireless AP - 802.11n Capable: An access point is capable of using 802.11n.
• Wireless AP - 802.11n Dual Channel Capable: An access point is advertising that it is capable of using dual channel mode for increased throughput.
• Wireless AP - Physical Errors: There are frames from a wireless client captured at this location containing a CRC error. The threshold is in number of CRC errors per second
590 WAN

OmniPeek User Guide
ANYOP_UG.book Page 591 Friday, February 5, 2016 4:47 PM
• Wireless AP - QoS Not Enabled: An access point is not advertising that it is capable of QoS or WMM.
• Wireless AP - Repeater Mode Detected: Reported once per access point, this condition implies that an access point is functioning as a relaying device, cutting effective throughput in half.
• Wireless AP - Too Many: The number of access points observed on a given channel is at or greater than the threshold, decreasing the efficiency of utilization (contention) of that channel.
• Wireless AP - Too Many Clients: The number of active clients connected to an access point has exceeded the threshold.
• Wireless AP - Too Many Retries: The access point has previously attempted to send packets over the wireless medium without receiving an ACK from the receiver.
• Wireless AP - Weak Signal: The signal strength of a frame transmitted by an access point and captured at this location is at or below the threshold.
• Wireless Channel Overlap: The Expert has detected a management frame from a channel other than the capture channel, indicating channel overlap or “bleed.”
• Wireless Client - Excessive Roam Time: A roaming client has been observed to take an unacceptably long time to rejoin another access point the wireless network. This can cause performance effects on time-sensitive applications such as VoIP over WLAN
• Wireless Client - High Fragmentation Rate: Based on the threshold, there are too many packets being fragmented into smaller packets. This impacts performance on your WLAN by increasing traffic and decreasing effective throughput.
• Wireless Client - No Response to Probe Request: The access point failed to send out a probe response frame for outstanding probe request from clients for its ESSID.
• Wireless Client - Physical Errors: There are frames from a wireless client captured at this location containing a CRC error. The threshold is in number of CRC errors per second.
• Wireless Client - Power Save Interval Exceeded: Association requests specify the number of beacon intervals a station will wait before waking up to receive buffered traffic from the access point. A wireless client has failed to “wake up” within this time to receive buffered traffic.
• Wireless Client - Power Save Listen Interval Too Long: The wireless client has been observed to have a power save interval longer than the specified value in the threshold.
Wireless 591
Appendix E: Expert Events
ANYOP_UG.book Page 592 Friday, February 5, 2016 4:47 PM
• Wireless Client - Power Save Missed Packet: An access point has dropped buffered data that was being held for a client in the “sleep” state.
• Wireless Client - Probe Response Not Accepted: The reported wireless client has not continued the normal process of associating with the responding access point after receiving a matching probe response frame.
• Wireless Client - Too Many Retries: The client has previously attempted to send packets over the wireless medium without receiving an ACK from the receiver.
• Wireless Client - Weak Signal: The signal strength of a frame transmitted by a client and captured at this location is at or below the threshold. The minimum sample period is how often this event is reported.
• Wireless Data Rate Change: The data rate of this packet is lower than the previous packet.
• Wireless Excessive Data Rate Change: The data rate of this packet is changing at an excessive rate.
• Wireless Excessive Probe Requests: A client is sending excessive probe requests. If this problem persists, it could lead to lowered available bandwidth and a delay in the client getting on the network.
• Wireless Excessive RTS: A wireless network has seen more RTS (Request to Send) packets than specified by the threshold. This overhead can slow down the overall throughput of the network if used excessively.
• Wireless Fragmentation Packet Size Too Small: The wireless fragmentation size of a packet is lower than the threshold. This can cause a decrease in throughput, but increase the ability of the sender to deal with interference.
• Wireless g Device Short Time Slot: A wireless 802.11g device has re-transmitted a frame using the short time slot. This may be an indication of a collision problem in a mixed b/g network as 802.11b does not support short slots.
• Wireless High Beacon Rate: An access point or ad hoc station is sending beacon frames at a faster rate than the threshold.
• Wireless Low Signal-to-Noise Ratio: The analyzer is receiving packets with a low signal-to-noise ratio below the value specified in the settings.
• Wireless RF Interference: Unwanted RF signals disrupt normal operation, causing lower data rates and a high percentage of wireless retries. This event is triggered when noise is detected above the configured threshold in the EventFinder settings.
• Wireless RTS/CTS Data Packets Too Small: RTS/CTS mechanism is using packets size smaller than the threshold, potentially impacting throughput.
592 Wireless

OmniPeek User Guide
ANYOP_UG.book Page 593 Friday, February 5, 2016 4:47 PM
• Wireless Transmission Retry: The transmitter has previously attempted to send this packet over the wireless medium.
Security
• Wireless AP - Broadcasting ESSID: The access point is sending its ESSID in beacon broadcasts, allowing all stations (including tools that snoop broadcast packets) to see the ESSID.
• Wireless AP - Inconsistent Configuration: Multiple access points (BSSIDs) in your WLAN, with the same ESSID, have conflicting configuration elements such as different data rates, compatibility configurations or more.
• Wireless AP - Missing: An access point, active in the past, has recently stopped transmitting packets. This event is only reported once per access point unless the device reappears and disappears again.
• Wireless AP - Not Configured: The access point is broadcasting an ESSID that is one of several known default ESSIDs. The ESSID table is contained in an XML file which can be updated.
• Wireless AP - Possible Spoof: Multiple access points are seen beaconing for a short period of time and then disappearing.
• Wireless AP - Restarted: An access point has been restarted within the past number of minutes as determined by the threshold.
• Wireless AP - Rogue: An unrecognized access point has been detected, since it does not exist in the name table and it is not designated as an access point.
• Wireless AP - WEP Not Required: The access point does not require WEP for stations to associate to it.
• Wireless Ad Hoc Detected: Two or more wireless nodes are communicating directly to each other without using an access point. If communicating on the same or nearby channel as a wireless infrastructure using access points, available bandwidth can be severely impacted.
• Wireless Association Attack: The number of association requests is at or has exceeded the threshold, measured in number of associations in so many seconds.
• Wireless Association Denied: An authenticated client's association request was denied by the access point resulting in any of the following status codes in the association response frame: 12,17,18,19,20,21,22,23,24,25,26.
• Wireless Authentication Attack: The number of authentication requests is at or has exceeded the threshold, measured in number of authentications in so many seconds.
Wireless 593

Appendix E: Expert Events
ANYOP_UG.book Page 594 Friday, February 5, 2016 4:47 PM
• Wireless Authentication Denied: An access point is rejecting a client’s authentication request. A “normal insertion” by a client into a wireless network is a probe request followed by authentication, then association.
• Wireless Client - Associated with Rogue Access Point: A client has associated with an unknown or untrusted access point. This event is monitored and reported for each recorded association.
• Wireless Client - Acting as DHCP Server: A wireless client is acting as a DHCP server indicating a potential rogue DHCP server and security risk.
• Wireless Client - Rogue: An unrecognized client has been detected, since it does not exist in the name table.
• Wireless Client - Using Access Point Address: A station is transmitting frames using the same source address as an access point.
• Wireless Client - Using Access Point ESSID: A wireless client in ad hoc mode has been detected using the same ESSID that is being used by valid access point(s) in the infrastructure network. This leads some clients to connect to an undesired network.
• Wireless Data Sent But Not Associated: A data frame has been received by the access point from a non-authenticated station. The access point will reject the frame and send a deauthenticate frame back to the station with the error status.
• Wireless Deauthentication Attack: There are a large number of deauthentication frames which may be from a client spoofing an access point. These frames are usually sent to the “all stations broadcast” address causing all stations associated with that access point to disassociate
• Wireless Duration Attack: The duration field in the client's data frame is set to a value higher than the above threshold. The duration field reserves the wireless medium by updating the Network Allocation Vector (NAV) for the time it will take to complete a WLAN transaction including acknowledgements.
• Wireless PSPF Violation: Public Secure Packet Forwarding (PSPF). Two clients are communicating to each other via an access point. In some hotspots this is undesirable as a possible security and/or performance risk.
• Wireless Reassociation Denied: An access point is rejecting a client's association request. A “normal insertion” by a client into a wireless network is a probe request followed by authentication, then association.
• Wireless RF Jamming: RF Jamming is a step above innocent interference. Jamming can be defined as malicious attacks on your RF domain in order to cause service disruptions. This event is triggered when noise is detected above the configured threshold in the EventFinder settings.
594 Wireless
OmniPeek User Guide
ANYOP_UG.book Page 595 Friday, February 5, 2016 4:47 PM
• Wireless Same Send & Receive Address: The source address and destination address are identical.
• Wireless Security Error: A wireless (802.11i or WPA2) security error has occurred during a wireless transaction.
• Wireless Source Address is Broadcast: A station has assigned an all stations broadcast address (all 1s or FF:FF:FF:FF:FF:FF in hex) as its source address.
• Wireless Source Address is Multicast: A station has assigned a multicast address (the lower bit of the first byte of an address is set to “1”) as its source address.
Network Policy• Network Policy Violation - Vendor ID: A device with a prohibited MAC address is
transmitting on the network.
• Network Policy Violation - Channel: A wireless device is transmitting on a prohibited channel.
• Network Policy Violation - ESSID: An access point is broadcasting a prohibited ESSID.
• Network Policy Violation - WLAN Encryption: A device is transmitting on the network with a prohibited form of WLAN encryption.
• Network Policy Violation - WLAN Authentication: A device is transmitting on the network with a prohibited form of WLAN authentication.
Client/Server• Busy Network or Server: There is a moderate to high fluctuation in response time. The
higher the sensitivity, the higher the likelihood that this problem will be flagged.
• Inefficient Client: “Chatty” conversations in which data packets from a server have small average packet sizes. The higher the sensitivity, the higher the likelihood that this problem will be flagged.
• Low Server-to-Client Throughput: The throughput from the server to the client is at or lower than the threshold.
• Low Client-to-Server Throughput: The throughput from the client to the server is at or lower than the threshold.
• Non-Responsive Client: Often indicates that a client or peer (for which a connection has already been established) is not acknowledging data received from server or peer.
Network Policy 595

Appendix E: Expert Events
ANYOP_UG.book Page 596 Friday, February 5, 2016 4:47 PM
• Non-Responsive Server: Often indicates that a server or peer (for which a connection has already been established) is no longer responding to repeated packet retransmissions from a client or peer.
• One-Way Traffic: No packets have been seen in the reverse direction for a user-definable length of time. This diagnosis is flagged only once for a given “conversation.”
• Slow Server Response Time: The average response time from the server is equal to or higher than the threshold.
Application
Apdex
• Apdex Score - Client Too Low: An application client’s Apdex score has dropped below the event threshold score.
• Apdex Task Ended - Tolerating User: A single task has ended. Its duration exceeded the Apdex threshold duration.
• Apdex Task Ended - Frustrated User: A single task has ended. Its duration exceeded 4 times the Apdex threshold duration.
DHCP
• DHCP Low Lease Time: The client has been offered an IP address lease in which the lease time is at or below the threshold.
• DHCP Multiple Server Response: A client requesting an IP address has had multiple DHCP servers respond to its request.
• DHCP Request Rejected: A DHCP Request has been rejected by a DHCP server.
• DHCP Request Storm: A high count of DHCP addresses are being requested.
DNS
• DNS Slow Response Time: The average response time from the DNS server is equal to or higher than the threshold.
• DNS Error: An error response from a DNS server that is usually more serious than an invalid name.
• DNS Non-Existent Host or Domain: The host or domain name requested in a DNS name query cannot be found or the name for a given IP address cannot be found (reverse lookup).
596 Application

OmniPeek User Guide
ANYOP_UG.book Page 597 Friday, February 5, 2016 4:47 PM
HTTP
• HTTP Request Not Found: Also known as “Client Error 404,” the HTTP server has nothing matching the client’s request.
• HTTP Client Error: Returned from the server as a result of an invalid HTTP client request and usually more serious than an invalid URL (see “HTTP Request Not Found”).
• HTTP Server Error: A client's request is usually valid, but the server has erred. Also known as “Server Error 5xx.”
• HTTP Slow Response Time: The average response time from the server is equal to or higher than the threshold.
Oracle
• Oracle Logon Denied: The Oracle client’s logon data was rejected by the remote server.
• Oracle Slow Response Time: The average response time from the Oracle server is equal to or higher than the threshold.
• Oracle TNS Connection Refused: The client’s connect request was denied by the remote server.
POP3
• POP3 Login Failed: A POP3 server has rejected a client's attempt to authenticate.
• POP3 Server Returned Error: A POP3 connection or request has been rejected by a POP3 server after a TCP connection has already been established.
• POP3 Slow Response Time: The average response time from the server is equal to or higher than the threshold.
SMB/CIFS
• SMB Logon or Access Denied: A Server Message Block (SMB) attempt to logon or share a remote resource has failed.
• SMB Command Rejected: A Server Message Block (SMB) command has been rejected.
• SMB Invalid Network Resource: A Server Message Block (SMB) command to connect to a network resource name has been rejected.
Application 597
Appendix E: Expert Events
ANYOP_UG.book Page 598 Friday, February 5, 2016 4:47 PM
• SMB Repeated or Looped Transaction: A SMB application or OS redirector has sent the same transaction command back-to-back within the threshold time setting.
• SMB Excessive Transaction Loops: A SMB application or OS redirector has sent too many SMB Repeated or Looped Transaction commands within the threshold percentage of packets.
SMTP
• SMTP Server Returned Error: A SMTP request has been rejected by an SMTP server.
• SMTP Slow Response Time: The average response time from the server is equal to or higher than the threshold.
SQL
• SQL Server Failed Login: The SQL Server client's login was rejected by the remote server.
• SQL Server Client Error: The SQL Server has encountered errors that can be corrected by the client.
• SQL Server Fatal Error: The SQL Server has encountered a non-recoverable system problem in which the program code that carries out a particular SQL statement is no longer running.
• SQL Server Resource Error: The SQL Server has run out of resources.
• SQL Server Slow Response Time: The average response time from the SQL Server is equal to or higher than the threshold.
• FTP Slow Response Time: The average response time from the server is equal to or higher than the threshold.
• Kerberos Request Rejected: A Kerberos Request has been rejected by a Kerberos server.
• LDAP Slow Response Time: The average response time from the LDAP server is equal to or higher than the threshold.
• NFS Retransmission: One or more packets of an NFS transaction using UDP has not reached its destination.
• Windows Master Browser Election: A windows node has broadcast an election datagram to force a master browser election. The Browser protocol is used to maintain the Network Neighborhood.
598 Application
OmniPeek User Guide
ANYOP_UG.book Page 599 Friday, February 5, 2016 4:47 PM
Session• NetBIOS (over IP) Session Refused: The host is rejecting a clients NetBIOS connection
attempt.
Transport
TCP
• TCP Connection Refused: The host is rejecting a clients initial TCP connection attempt.
• TCP Connection Lost: TCP data is repeatedly being sent with no acknowledgement until the sender gives up and resets the connection.
• TCP Inactive Connection Reset: The sender has set the RST flag in a TCP packet.
• TCP Connection Reset: One end of a TCP connection has set the RST flag in a TCP packet, which sometimes indicates an abrupt disconnect. The normal TCP disconnect is to FIN although some applications will terminate with a reset or a FIN followed by a reset.
• TCP Too Many Retransmissions: The source IP node is sending another TCP packet with a sequence number that matches a previously sent TCP packet to the same destination IP address and TCP port numbers. “Too many” is when the percentage threshold meets or exceeds that of total transmitted (non-ACK) packets.
• TCP Fast Retransmission (by ACK): The source IP node is resending a TCP packet because the receiver has indicated a missing packet with a triple duplicate ACK (four identical ACK packets in a row).
• TCP Fast Retransmission (by time): The source IP node is sending another TCP packet with a sequence number that matches a previously sent TCP packet to the same destination IP address and TCP port numbers. Retransmits are flagged as “fast” if they occur before the TCP Fast Retransmission threshold.
• TCP Slow First Retransmission: The first retransmission is taking longer than the threshold which may indicate slow recovery time and throughput.
• TCP Retransmission: The source IP node is sending another TCP packet with a sequence number that matches a previously sent TCP packet to the same destination IP address and TCP port numbers.
• TCP Invalid Checksum: The TCP header and/or data is in error. One or more bits has erroneously changed since the TCP segment was transmitted by the source IP host
• TCP Idle Too Long: The TCP connection hasn’t been used since the threshold was set.
Session 599
Appendix E: Expert Events
ANYOP_UG.book Page 600 Friday, February 5, 2016 4:47 PM
• TCP Low Starting MSS: The TCP Maximum Segment Size (MSS) is at or below the threshold setting.
• TCP Repeated Connect Attempt: A client is attempting multiple times to establish a TCP connection.
• TCP Slow Acknowledgement: The recipient appears to be slow in acknowledging TCP data segments based on the threshold added to the average ACK time.
• TCP Slow Segment Recovery: A TCP segment is taking longer than the threshold to complete, which may indicate slow recovery time and throughput.
• TCP Triple Duplicate ACK: A receiving TCP node has noticed one or more missing packets and is requesting that the sender retransmit them by sending 4 identical ACK packets.
• TCP Low Window: The application is not keeping up with the incoming TCP segments. The threshold is based on the percentage of the maximum observed window for this conversation.
• TCP Stuck Window: The TCP window size has not changed for three or more consecutive packets and has dropped below a percentage of the maximum window. The application may be one or more packets behind in processing incoming TCP segments.
• TCP Zero Window: The recipients TCP receive buffer is filling up (low window) or full (zero window).
• TCP Segment Out of Sequence: A TCP data packet’s TCP sequence number is less than the previous data packet’s ending TCP sequence number.
• TCP Segment Outside Window: The flagged TCP packet carries data before or after the available TCP window most recently advertised in an acknowledgement packet from the destination.
• TCP Segment Acked but Missing: A TCP ACK packet that acknowledges data has not yet appeared within the capture.
• RSVP Error: RSVP error occurred in an RSVP path message or RSVP reservation message.
• UDP Invalid Checksum: The UDP header and/or data is in error. One or more bits has erroneously changed since the UDP datagram was transmitted by the source IP host.
600 Transport

OmniPeek User Guide
ANYOP_UG.book Page 601 Friday, February 5, 2016 4:47 PM
Network
IP
• IP Invalid Header Checksum: The header portion of the IP datagram is in error. One or more bits has erroneously changed (with the exception of the TTL) since the IP datagram was transmitted by the source IP host.
• IP Local Routing: Two identical IP packets except for the TTL have been detected.
• IP Network Duplicated Packet: A single packet has appeared multiple times on your network. This could be a waste of network resources.
• IP Low Time-To-Live: The IP Time-To-Live (TTL) has fallen to or below a pre-determined threshold indicating that the packet can only traverse that many more routers before it is discarded
• IP Missing Fragment: An IP datagram has been fragmented by the host application or a router, and one of the fragments is missing.
• IP Packet with CRC Frame Error: The CRC re-computed by the analyzer when the frame was received did not match the CRC at the end of the frame, indicating one or more corrupted bits in the frame. If the IP Header Checksum is okay, then the problem is most likely elsewhere in the frame.
• IP Zero Address in Broadcast: An IP UDP packet is being broadcast using the old IP broadcast address of 0.0.0.0.
ICMP
• ICMP Network Unreachable: A router is reporting back to the source host that it cannot forward a packet on to a network along the path to the destination host.
• ICMP Host Unreachable: A router is reporting back to the source host that it cannot forward the packet to the destination host.
• ICMP Protocol Unreachable: The destination host is reporting back to the source host that the indicated next layer protocol (usually TCP or UDP) is not available.ICMP Port Unreachable
• ICMP Port Unreachable: The destination host is reporting back to the source that the application layer protocol as specified by the UDP port is not supported.
• ICMP Fragmentation Needed: A router is reporting back to the destination host that fragmentation is required to forward the packet, but the Don't Fragment bit was set in the IP header.
Network 601

Appendix E: Expert Events
ANYOP_UG.book Page 602 Friday, February 5, 2016 4:47 PM
• ICMP Source Route Failed: A router is reporting back to the source host that the path specified by the source cannot be followed.
• ICMP Host Unknown: A router is reporting back to the source host that the destination host does not exist.
• ICMP Net Unreachable TOS: A router is reporting back to the source host that a network is unavailable for the Type of Service (TOS) specified in the original IP datagram's header.
• ICMP Host Unreachable TOS: A router is reporting back to the source host that the destination host is unavailable for the Type of Service (TOS) specified in the original IP datagram’s header.
• ICMP Comm Admin Prohibited: A router is reporting back to the source host that it cannot forward the original datagram due to administrative filtering settings.
• ICMP Host Precedence Violation: The first hop router is reporting back to the source host that a requested precedence is not permitted.
• ICMP Precedence Cutoff: A router is reporting back to the source host that a network has a minimum precedence level that is not satisfied by the original datagram.
• ICMP Host Redirect: A router is reporting back to the source host that it should use an alternate route for the destination host.
• ICMP Host TOS Redirect: A router is reporting back to the source host that it should use an alternate route for the destination network and Type of Service (TOS).
• ICMP TTL Exceeded: A router is reporting back to the source host that a datagram has expired before being delivered to the destination host.
• ICMP Fragmentation Time Exceeded: The destination host is reporting back to the source host that not all fragments of a datagram have been received.
• ICMP Parameter Problem: The reporting host is reporting back to the source host that it found a problem with the header parameters in the original data gram such that it could not complete processing of the datagram and must discard it.
• ICMP Obsolete Message: The reporting host is using an ICMP message type that has been obsoleted or deprecated. Recipient hosts may not understand the error message as a result.
Data Link• 802.1X Dictionary Attack: A node is generating multiple login attempts by using common
words found in a dictionary.
602 Data Link

OmniPeek User Guide
ANYOP_UG.book Page 603 Friday, February 5, 2016 4:47 PM
• ARP Request Storm: A high count of ARP requests are flooding the network.
• Broadcast Storm: A sustained level of all stations broadcast packets (the destination physical address consists of all 1s) has met or exceeded the threshold.
• Multicast Storm: A sustained level of multicast (the broadcast bit in the destination physical address is set to 1) packets has met or exceeded the threshold.
• Severe Broadcast Storm: A sustained level of all stations broadcast packets (the destination physical address consists of all 1s) has met or exceeded the threshold. Severe Multicast Storm
• Severe Multicast Storm: A sustained level of multicast packets has met or exceeded the threshold (the broadcast bit in the destination physical address is set to 1).
• Spanning Tree Topology Change: The actively forwarding bridge (or switch) port for this segment has changed.
• EAP Authentication Failure: Using the 802.1x framework to carry EAP requests and responses (such as Cisco LEAP), an authenticator cannot authenticate the client.
Physical
LAN
• Too Many Physical Errors: The CRC re-computed by the analyzer when the frame was received did not match the CRC at the end of the frame, indicating one or more corrupted bits in the frame. The threshold applies to a window of consecutive CRC frames from any source.
• MAC Flooding: There is a high rate of new MAC Addresses flooding the network. This is often done to fill up switch node tables to cause a Denial of Service attack.
Physical 603

Appendix E: Expert Events
ANYOP_UG.book Page 604 Friday, February 5, 2016 4:47 PM
604 Physical

A P P E N D I X F
ANYOP_UG.book Page 605 Friday, February 5, 2016 4:47 PM
Real-World Security Investigations
In this appendix:
About real-world security investigations . . . . . . . . . . . . . . . . . . . . . . . . . . . . . . 606
Investigation #1: Tracing the course of a server attack . . . . . . . . . . . . . . . . . . 606
Investigation #2: Ensuring compliance with security regulations and catching leaked data . . . . . . . . . . . . . . . . . . . . . . . . . . . . . . . . . . . . . . . . . . . . . . . . . . . 608
Investigation #3: Transaction verification for an online gaming company. . . . . 610
Investigation #4: Transaction verification for a merchant services company . . 611
Security best practices . . . . . . . . . . . . . . . . . . . . . . . . . . . . . . . . . . . . . . . . . . . 612
605
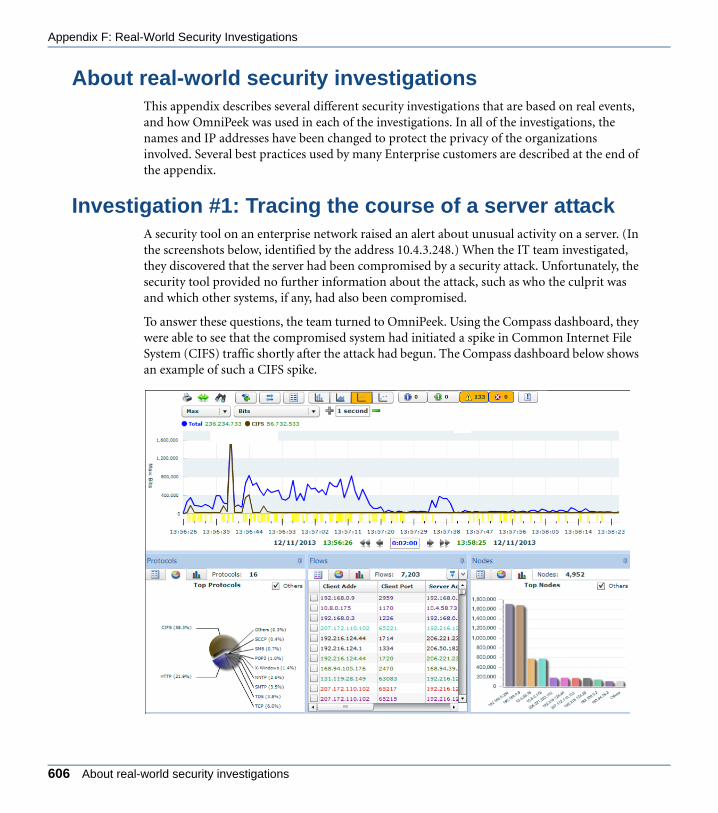
Appendix F: Real-World Security Investigations
ANYOP_UG.book Page 606 Friday, February 5, 2016 4:47 PM
About real-world security investigationsThis appendix describes several different security investigations that are based on real events, and how OmniPeek was used in each of the investigations. In all of the investigations, the names and IP addresses have been changed to protect the privacy of the organizations involved. Several best practices used by many Enterprise customers are described at the end of the appendix.
Investigation #1: Tracing the course of a server attackA security tool on an enterprise network raised an alert about unusual activity on a server. (In the screenshots below, identified by the address 10.4.3.248.) When the IT team investigated, they discovered that the server had been compromised by a security attack. Unfortunately, the security tool provided no further information about the attack, such as who the culprit was and which other systems, if any, had also been compromised.
To answer these questions, the team turned to OmniPeek. Using the Compass dashboard, they were able to see that the compromised system had initiated a spike in Common Internet File System (CIFS) traffic shortly after the attack had begun. The Compass dashboard below shows an example of such a CIFS spike.
606 About real-world security investigations
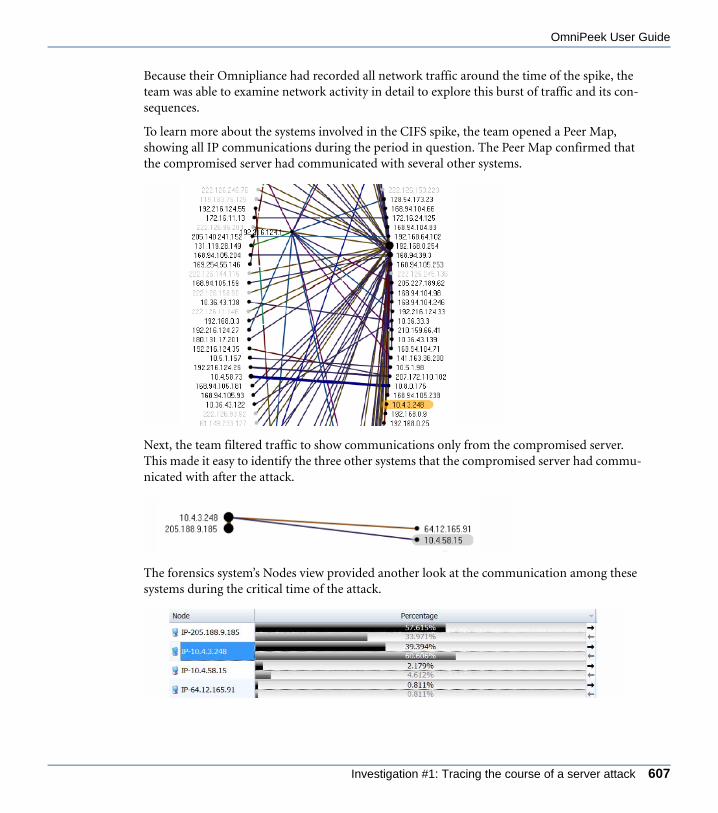
OmniPeek User Guide
ANYOP_UG.book Page 607 Friday, February 5, 2016 4:47 PM
Because their Omnipliance had recorded all network traffic around the time of the spike, the team was able to examine network activity in detail to explore this burst of traffic and its con-sequences.
To learn more about the systems involved in the CIFS spike, the team opened a Peer Map, showing all IP communications during the period in question. The Peer Map confirmed that the compromised server had communicated with several other systems.
Next, the team filtered traffic to show communications only from the compromised server. This made it easy to identify the three other systems that the compromised server had commu-nicated with after the attack.
The forensics system’s Nodes view provided another look at the communication among these systems during the critical time of the attack.
Investigation #1: Tracing the course of a server attack 607
Appendix F: Real-World Security Investigations
ANYOP_UG.book Page 608 Friday, February 5, 2016 4:47 PM
Now the IT team knew which servers to focus their attention on in their efforts to contain the attack and reverse its effects. In addition to quarantining and repairing 10.4.3.248, the IT team would also focus on 10.4.58.15, 64.12.165.91, and 205.188.9.185.
Summary
Working from a vague security alert, the team was able to use network forensics to identify specific systems to quarantine and where to focus attention on cleaning up the attack. Net-work forensics enabled the team to find proof of the attack and trace its effects.
Investigation #2: Ensuring compliance with security regula-tions and catching leaked data
In an audit, examiners look for evidence of compliance with security regulations. Many enter-prise IT teams now use network forensics to ensure that traffic complies with regulations and to demonstrate that compliance to auditors.
Using tools like the Peer Map shown in the previous section, IT engineers can monitor and record traffic patterns, demonstrating to auditors which users have access to which resources, and which devices are talking to which other devices.
They can also configure filters based on regular expressions (Regex expressions) to look for traffic that may include personal information. The filters they use look for any packet that appears to include any number that seems like an SSID, a phone number, credit card numbers (strings of 16 digits), etc., that are sent in clear text. Since these filters only look for the specific packets with the personal data, they expect to never capture a packet. If the filters do find matches, the network forensics solution alerts the IT team through syslog and SNMP traps, so IT engineers can review the data immediately to prevent additional loss of data. An example of an advanced pattern filter in OmniPeek that filters the POST operation for specific traffic is shown below.
608 Investigation #2: Ensuring compliance with security regulations and catching leaked data
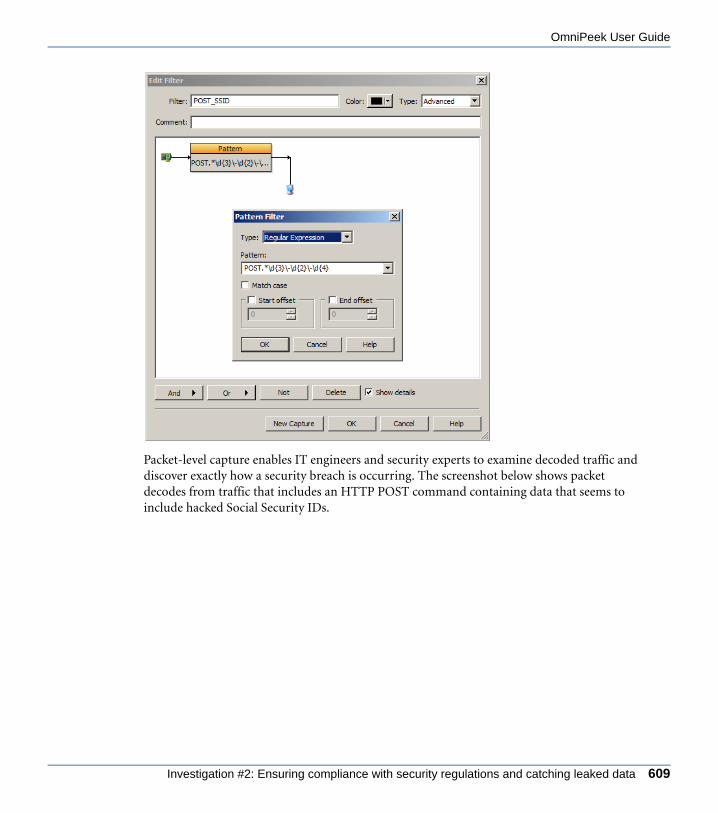
OmniPeek User Guide
ANYOP_UG.book Page 609 Friday, February 5, 2016 4:47 PM
Packet-level capture enables IT engineers and security experts to examine decoded traffic and discover exactly how a security breach is occurring. The screenshot below shows packet decodes from traffic that includes an HTTP POST command containing data that seems to include hacked Social Security IDs.
Investigation #2: Ensuring compliance with security regulations and catching leaked data 609

Appendix F: Real-World Security Investigations
ANYOP_UG.book Page 610 Friday, February 5, 2016 4:47 PM
The hex decode below shows another view of this problematic traffic, including the suspicious POST operation.
Summary
Network forensics provides IT teams and security experts with evidence of data breaches and details that are invaluable for tracking down the particulars of specific security attacks.
Investigation #3: Transaction verification for an online gaming company
One of the world’s leading online gambling companies with over ten million customers in 200 different countries uses Savvius OmniPeek network forensics solution when it needs to verify business transactions, such as bets, that have been called into question. Because network forensics captures all aspects of network traffic, including the IP addresses of senders and receivers and all data transmitted between them, it provides a comprehensive record of orders,
610 Investigation #3: Transaction verification for an online gaming company

OmniPeek User Guide
ANYOP_UG.book Page 611 Friday, February 5, 2016 4:47 PM
payments, and other financial transactions. In the case of the online gaming company, these transactions include online bets.
A customer who had lost quite a bit of money after a late night of gambling called the online gaming company and complained that he was not the person who had placed the losing bets. He claimed that someone else must have used his account from another location and run up the losses.
Using network forensics, the IT team at the gaming company was able to verify that the IP address and other characteristics of the traffic on the night in question matched his other activity with the gaming company, including previous sessions in which he had gambled and never complained. By verifying that the same address had been used for all his transactions, they were able to refute his claim that the losses were someone else’s responsibility. An example of a forensic search in OmniPeek that is set up to search for a specific IP address over a specific time range is shown below.
Summary
Network forensics enables e-commerce and service organizations to verify transactions, including source, recipients, and data transmitted. This analysis can be used not only for trou-bleshooting, but also for customer service.
Investigation #4: Transaction verification for a merchant services company
Here’s another example of using network forensics to verify online transactions.
The merchant services division of a major bank is using a Savvius Omnipliance network anal-ysis and recorder to capture and store traffic containing credit card authorizations. When a bank customer, such as an online retailer, contacts the bank with questions about a specific
Summary 611
Appendix F: Real-World Security Investigations
ANYOP_UG.book Page 612 Friday, February 5, 2016 4:47 PM
transaction, the bank’s data center team can use the Savvius network recorder to find and ana-lyze the relevant transaction. The bank can then easily determine whether the authorization or denial was transmitted correctly.
For example, a consumer ordered a product from a major online retailer, charging the pur-chase to her credit card. To the consumer’s surprise, the charge was declined. The consumer called the retailer to complain. As part of investigating the decision to decline the charge, the bank reviewed the network traffic that contained the authorization request and the bank’s subsequent decline of that request. Having verified that the transaction complied with the bank’s credit guidelines and that its servers had handled the request and response correctly, the bank was able to close the service ticket with the retailer.
Summary
Network forensics enables financial services organizations to verify transactions, including source, recipients, and data transmitted. Because it captures all the packets that constitute a transaction, network forensics provides comprehensive evidence of what has been transacted between two or more parties.
Security best practices
Best practice #1: Capture traffic at every location
As a best practice for network security, IT organizations should capture traffic at every loca-tion, not just at the network core.
Consider the case of a large enterprise that suffered a security attack at a branch office. The breach spread from the branch office to headquarters. Without a detailed analysis of the traffic in the branch, the IT organization would have been unable to identify the source of the attack and apply the appropriate controls to prevent its spread.
Best practice #2: Capture traffic 24/7
In addition to capturing traffic at every location, IT organizations should ensure that they cap-ture traffic around the clock, so that even anomalies that occur outside of business hours can be investigated.
Best practice #3: Set filters to detect anomalous behavior
In addition to maintaining a continuous, week-long capture of all network traffic, it’s often helpful to define a secondary capture consisting only of network anomalies that may signal a security violation. If no anomalies occur, then no secondary capture is initiated and no alerts
612 Security best practices

OmniPeek User Guide
ANYOP_UG.book Page 613 Friday, February 5, 2016 4:47 PM
are raised. But if anomalies occur, IT engineers and security experts can take advantage of the evidence in a small capture file containing just the relevant data.
To configure a capture like this, IT engineers simply capture a file that starts recording data when any of the following conditions occur:
• Mail traffic (SMTP traffic) is not going to mail servers, possibly indicating the presence of a worm on the network.
• DHCP offers are coming from a source other than the DHCP servers, possibly indicating the presence of a rogue DHCP server.
• Offnet traffic is not destined for the MAC address of a router, possibly indicating the presence of a Man-in-the-Middle attack.
• Any user other than a member of the Finance team tries to connect to the Finance department’s servers, possibly indicating a hacker and a probably Sarbanes-Oxley violation, as well.
• Any server in the DMZ tries to initiate an outbound connect other than to known backend servers, possibly indicating that a server has been compromised.
Each organization can identify its own list of anomalies relevant for the infrastructure and ser-vices being maintained.
If a secondary capture begins, IT engineers can open the capture files (which will be small) and know immediately where to begin their investigation.
The graphic below shows a series of NOT conditions that define a filter to capture anomalies on the network, such as SMTP traffic that does not involve the organization’s mail server and DNS traffic that does not include the organization’s DNS server.
Best practice #3: Set filters to detect anomalous behavior 613

Appendix F: Real-World Security Investigations
ANYOP_UG.book Page 614 Friday, February 5, 2016 4:47 PM
Summary
IT teams can accelerate troubleshooting by configuring network forensics solutions to auto-matically capture evidence of anomalous behavior. Then, instead of poring through terabytes of live traffic, they can simply examine small data recordings that include suspicious traffic associated with a specific anomaly.
614 Security best practices

G
Index
ANYOP_UG.book Page 615 Friday, February 5, 2016 4:47 PM
Numerics2-way latency 122802.11 analysis module 572802.11 options 336802.11 view 39, 490, 491802.11 WLAN 488
Aabort trigger 420, 423absolute time
packets view 538PacketVisualizer tab 545visual expert graphs tab 254
access control 28Ack for 545Acked by 545ActiveX 304ad hoc mode 556adapter option 336adapter view 39, 45, 47, 125, 335adapters tab 22add statistic dialog 402advanced filter 174aggregate data 87aggregator adapter 46, 50, 573alarms 406
alarms tab 23alarms view 39, 410, 411capture engine 406, 409, 410, 415default 406installed components 568make 341, 344, 357, 361, 363make alarm 413
alarms view 60altitude 519, 536
analysis modules 24, 456, 480file location 569notifications 457options dialog 456packets view column 457
analysis options 40, 286, 337anti-aliasing 378API 6AppleTalk analysis module 574application data 570application description 362application view 61, 235applications 73, 76, 78, 82, 208, 217applications dashboard 77applications statistics 337, 360applications view 62apply analysis module command 457Aruba remote adapter 572ASCII view 156association strength 557audio 319, 326audio playing 313, 319, 325audit log 24authentication 15, 20, 557auto scroll 447, 451AutoCapture file 467
capture templates 466create and edit 462log file 463scheduled task 471
Bbackground image 377background sounds 304
615
Index
ANYOP_UG.book Page 616 Friday, February 5, 2016 4:47 PM
beacon packets 558BSSID 358, 535buffer size 45, 125byte count 296bytes captured 419, 421
Ccall background color 323call quality 74, 80, 209, 219call quality distribution 79call summary 79call utilization 80call volume 80call vs. network utilization 74, 209, 219calls view 314capture buffer 42capture button view 480capture engine
access control settings 28adapters tab 22alarms tab 23authentication 15, 20capture window 138captures tab 22configuring 26discovering 18DNS name 15domain 15, 20files tab 22, 64, 201filters tab 23filters view 166forensics tab 22, 206general settings 28graphs tab 23home tab 21host 14installation 8log tab 22notifications tab 23password 15, 20port 14
security settings 28tabs 20, 21template 45trust table tab 26updating 26username 15, 20
Capture Engine Manager 26capture engines window 12, 13, 14, 18
captures view columns 562graphs tab 391
capture file 43, 62, 569capture file formats 146, 150capture menu 528capture options dialog 32
802.11 view 39, 490, 491adapter view 39, 45, 47, 125alarms view 39, 410analysis options 40configuring settings 38filters view 39general view 32, 39, 41, 68, 69, 74, 209, 219graphs 392graphs view 40, 392hardware profiles view 39statistics output view 40timestamps 40triggers view 39
capture sessions 224, 281capture status 38capture templates 35, 65, 67, 467
AutoCapture file 466import 467
capture to disk 42capture window 9, 32, 138, 139
alarms view 60application view 61applications view 62capture engine 138channels view 62clients/servers view 60countries view 62
616
GOmniPeek User Guide
ANYOP_UG.book Page 617 Friday, February 5, 2016 4:47 PM
creating 32docking views 38filters view 60flows view 60forensics capture 68graphs 386graphs view 61, 394log view 60monitoring capture 69navigating 36new capture 35new forensics capture 35new monitor capture 35nodes view 61packets view 60, 142, 145peer map view 61progress section 37protocols view 61signal view 62statistics 337, 338, 386summary view 62title 37, 42WLAN tab 335, 337, 355WLAN view 62
captures tab 22captures view columns 562channel
column in packets view 536network policy 266radio frequency 155scanning options dialog 490top 82
channel statistics 335, 337, 353channel view selection 357channels view 62checksums analysis module 574CKIP 557clear log 447client/server colors 480clients view 297clients/servers view 60, 232
colorclient/server 480color tab 401globes 357packets view 482peer map 374statistics views 338
command line, starting OmniPeek 565compare tab 262Compass adapter 47, 575Compass dashboard 4, 47, 60, 80, 82, 85, 90, 92, 93, 97,
100, 104, 107, 110, 113, 117, 123, 124, 130, 131, 132, 134, 575
Compass report 132configuration tab 372configuring capture engine settings 26connected users 24contents tab 302, 303continuous capture 42, 125continuous expert analysis 246conversation 172conversation details 380conversation tooltips 378conversations in peer map 371Coordinated Universal Time (UTC) 43copying packets 152, 191countries statistics 362countries view 62CRC error 561create graph template dialog 392, 397creating a simple filter 173creating an advanced filter 174cumulative bytes 538, 545current activity, dashboard 76current adapter 38
Ddashboard
applications 77Compass 80
617

Index
ANYOP_UG.book Page 618 Friday, February 5, 2016 4:47 PM
network 75timeline 72voice & video 78
data rates 82decode
channel info 155decode pane 142, 144decode view 154file location 569line decoders 158packet length 155request/response threads 161status info 155threads 161timestamp 155
decrypt WLAN packets dialog 147decryption 147, 148, 160deleting packets 151delta time 538, 545detail statistics 345details tab 210, 215, 300, 316discover engines dialog 18discovering engines 18display filter 64, 144, 166display format 481display HTML as HTML 303display HTML as source text 303display weak associations 357DNS name 14, 15DNS server 144docking views 38domain 15, 20download images 304drivers 569duplicate a filter 186duplicate address analysis module 576duration status 38
EEAPOL key 490
EAPTLS 557edit a filter 185edit graph template dialog 392, 400edit menu 523edit name dialog 436edit note 144, 146edit scanning 490email analysis module 577enable a filter 168encrypted packets 147encryption 488, 490, 491ESSID 267, 558event log tab 237, 318event summary tab 237, 317event type 86Expert 119expert 69
clients/servers view 232column headings 540event bar chart 121event list 120event pie chart 120event statistics 119event view 119EventFinder 243, 314EventFinder settings window 243events 86expert tab 234expert view options dialog 239installed components 568memory usage 245save functions 243threshold assistant 245
export filters 186
Ffake filter 354file formats 150file menu 522file path 43file splitting 64
618

GOmniPeek User Guide
ANYOP_UG.book Page 619 Friday, February 5, 2016 4:47 PM
files tab 22, 64, 201filter bar 64, 179, 193filters 326
about filters 164adding groups 165duplicate 186edit 185enable 168filter file 568filters tab 23filters view 39, 60, 166installed components 568load 186new capture 178reject matching 171, 172save 186trigger events 418, 419, 421view 173, 174, 178window 164
flags 536flat view 341, 344
expert tab 234node statistics tab 341protocol statistics 344
flow list 272flow map 271, 274flows 82, 96flows bar chart 99flows list view 97flows pie chart 98flows statistics 96flows view 60fonts view 338, 480forensic analysis 4, 64, 190forensic search 22, 74, 201, 203, 206, 209, 216forensics capture 35, 68forensics tab 22, 206, 215FTP analysis module 578
Ggauge tab 347
geiger counter 360general view 32, 39, 41, 68, 69, 74, 209, 219global log 446global messages only 449, 453globes 357GPS 570
altitude 519display update lag 520fix, defined 516GPS view 481latitude 518local measurement systems in 520longitude 518receivers supported 516recognized NMEA sentences 516speed 519time 518, 536
graph data options dialog 384, 385graph display options dialog 389, 401, 402graph inbound/outbound 86graph interval 89graph templates 396graph type 86graphs
capture options dialog 392capture window statistics 386directory 568graphs tab 23, 252, 391, 402graphs view 40, 61, 391, 392, 394, 409save 403visual expert 252
grouping files 203GTK (Group Transient Key) 147, 490
Hhardware profiles options 336hardware profiles view 39headers tab 301Hex pane 142, 145Hex view 156hidden packets 191
619

Index
ANYOP_UG.book Page 620 Friday, February 5, 2016 4:47 PM
hide and unhide 191hiding packets 191, 192hierarchical view 344hierarchy of wireless nodes 358hierarchy view 341, 344history statistics 335, 351home tab 21host 14HTML 303HTML report 85
IICMP analysis module 579images 304import capture templates 467import filters 186inbound 86insert engine 14insert filter dialog 135, 173, 174, 178insert into name table 341, 344, 357, 380, 437insert name dialog 436installing capture engine 8installing OmniPeek 7Intelligent Platform Management Interface 16IP address 14, 73, 76, 78, 208, 217IP analysis module 580IPMI port 16IPv6 address 73, 76, 208, 217
JJavaScript execution 304jitter buffer 313, 319, 325
Kkey set 147key set dialog 491, 494key set view 481
Lladder 271, 276latency 122, 496latency graph 256
latitude 518, 536LEAP 557legend 86limitations 92list views 338, 481listen time 19load filters 186loading name table 440local machine 47locate node 357log file 463
AutoCapture file 463print 446, 451save 446, 451
log tab 22log view 60log, dashboard 76logical AND 85longitude 518, 536
Mmain program window 8make alarm 341, 344, 354, 357, 361, 363make filter 344, 357, 361, 380
command 144, 172node 172, 341packet 172packet decode 172protocol 172
map type 372mapping profile 288matrix switches 481maximum conversations slider bar 245, 246media view 315memory usage 245, 246merge progress 228messages 90MIB file 430MIBs directory 569misc. tab 402
620

GOmniPeek User Guide
ANYOP_UG.book Page 621 Friday, February 5, 2016 4:47 PM
Modbus analysis module 581monitor capture 35monitor menu 529monitor mode 134monitor options 335
802.11 336adapter 336analysis options 337dialog 9hardware profiles 336statistics output 336
monitor statistics 334, 338, 384monitoring capture 69, 334, 337MPLS 74, 179, 209, 218MPLS/VLAN analysis module 581MSA 270
analysis options 286capture sessions 224, 281creating project 277engines 223, 280flow list 272flow map 271, 274ladder 271, 276mapping profile 288progress 283project 279project file 286project window 271segments 284time range & filter 223, 279wizard 277, 279
multi-segment analysis 270
Nname resolution view 438, 439, 481name table 144
adding groups 436building 434insert 341, 437installed components 568loading 440
NIC vendor ID file 568resolving names 434saving 441
navigating a capture window 36navigation pane 38, 59NCP analysis module 582NetWare analysis module 582network dashboard 75, 346network forensics 4, 64, 190network policy dialog 264network speed 47network statistics 334, 346, 347network utilization graph 82, 83new capture button 178new file set schedule 365new forensics capture 35new monitor capture 35newsgroup analysis module 582NIC vendor ID file 568node detail statistics window 341node details 340, 341, 357node details tab 237node statistics 334, 337, 339, 341
chart window 100flat views 341hierarchy view 341
node visibilities 374, 375nodes 82, 100nodes bar chart 102nodes in peer map 371nodes list view 101nodes pie chart 101nodes view 61nodes visibility criteria 373noise 558, 562notes 144, 146notifications 419, 422, 426
actions 428analysis modules 457
621
Index
ANYOP_UG.book Page 622 Friday, February 5, 2016 4:47 PM
configuring 426email 429execute 429log 429notifications tab 23notifications view 481SNMP trap 430sound 429syslog 430text log 429
Ooffsets 157OmniPeek Remote Assistant 508, 509, 512open payload 310opening a capture file 62options dialog
analysis modules view 456, 480capture button view 480client/server colors 480fonts view 480GPS view 481key set view 481list views 481matrix switches view 481name resolution view 439, 481notifications view 481ORA group 481units 481VoIP 481warnings view 481workspace view 481
ORA 508, 509, 512ORA group 481outbound 86
Ppacket count 296packet decode window 152packet decoders 569packet file formats 150packet list options dialog 145
packet list pane 142, 144packet size distribution 334, 348packet slicing 44packets in buffer 38packets tab 536
latitude 536longitude 536
packets view 60, 142, 145, 191altitude 519flags 536latitude 518longitude 518speed 519
PacketVisualizer tabAck for 545Acked by 545cumulative bytes 545SEQ/ACK 248time ticks 248visual expert 247
pages view 298passphrase 493password 15, 20pause/play 87payload 309, 310payload tab 250PEAP 557PeekCat 569PeekSplit 569peer map 370
color 374configuration tab 372conversation details 380conversations 371map type parameters 372node visibilities 375node visibilities tab 374nodes 371nodes visibility criteria 373options 377
622

GOmniPeek User Guide
ANYOP_UG.book Page 623 Friday, February 5, 2016 4:47 PM
peer map tab 381peer map view 61profiles task pane 377protocol segments 378protocols 371select related packets 380tooltips 378, 381view 370
physical address 73, 76, 208, 217play audio 313, 319, 325port 14post-capture analysis 190power save 558PPP analysis module 583predefined alarms 406print 339print log file 446, 451print reassembled PDU 160print statistics 339printing packets 152privacy 560profiles task pane 377project file 286properties dialog 146protected packets 558, 561protocol details 345protocol information 344protocol segments 378protocol statistics 334, 337, 342, 344protocol utilization statistics 344protocols 82, 92, 208, 218protocols bar chart 95protocols in peer map 371, 374protocols list view 93protocols pie chart 94protocols view 61ProtoSpecs 338, 344, 374PTK (Pairwise Transient Key) 147, 490
Rradio frequency 155RADIUS analysis module 583reject matching 171, 172relative time
compare tab 263packets view 538PacketVisualizer tab 545visual expert graphs tab 254
report templates 569reprocess all packets 525reprocess VoIP info 525request/response threads 161requests view 299resolve names 144, 380response time 122roam time 559roaming 496roaming adapter 573roaming latency 496RPCap 50, 51RTP/RTCP packets 324
Ssave
audio WAV file 319, 326capture template 467captured packets 149file formats 150filters 186log 446, 451name table 441packet list (tab-delimited) 150packets 190payload 309reassembled PDU 160statistics 339web statistics 309
Savvius API 6, 47scale tab 402scroll 447, 451
623

Index
ANYOP_UG.book Page 624 Friday, February 5, 2016 4:47 PM
SCTP analysis module 583Search and download progress 226select command 198select graph items dialog 397select related packets 85, 123, 131, 192, 379, 380selection results dialog 124, 181send menu 528sending
edit send packet 476select send adapter 474
SEQ/ACK 248sequence graph 257servers view 297session 210show offsets 157signal statistics 338, 358signal statistics options dialog 360signal strength 557, 561signal view 62signaling tab 320simple filter 173size bar 537size statistics 334, 348slider controls 85SMB analysis module 583snapshots of summary statistics 350, 351sources of remote notifications 430speed 519, 536splitting files 64SQL analysis module 584SSID 335, 493SSL decryption 148STA 358start capture 139start page 8start trigger 417, 420, 423start/stop capture 37statistics
applications 337, 360capture window 337, 338channel 335, 337, 353color 338countries 362detail 345display 338history 335, 351history statistics sampling interval 352history statistics scale options 352monitor 334network 334, 346node 334, 337, 339, 341nodes 341output 336output options 336output view 40printing 339protocols 334, 337, 342, 344report templates 569saving 339signal 338, 358size 334, 348statistics tab 402summary 335, 337, 349summary statistics 351voice & video 319, 325, 329WLAN 335, 337, 355
status bar 38stop capture 139stop trigger 417storage tab 210, 214SUM analysis module 584summary call 79summary snapshot 350summary statistics 335, 337, 349summary tab 264summary view 62support tab 24synchronizing files 203
624
GOmniPeek User Guide
ANYOP_UG.book Page 625 Friday, February 5, 2016 4:47 PM
Ttabs, capture engines window 20, 21TCP Trace 258, 546TCP Trace graph 258TCP window graph 260TCP/IP port 14tcpdump 179tcpdump capture adapter 53, 585TDS traffic 584Telnet analysis module 585template 45text log notification 429threshold assistant 245time range & filter 223, 279time range indicator 84time ticks 248time trigger events 418, 419, 421timeline dashboard 72timeline graph 73, 208timeline tab 210, 213timestamp 43, 155timestamps 40timing column 294timing example 306, 307timing tab 304TKIP 557tooltips 378, 381top applications 73, 76, 78, 208, 217top channels 82top flows 82, 96top nodes 82, 100top protocols 82, 92, 208, 218top protocols by IP address 73, 76, 78top talkers 208, 217top talkers by IP address 73, 76top VLAN 82top WLAN 82transmitter 535trigger 64, 406, 417
bytes captured 421capture engine 420event 418, 419, 421filter trigger events 418start trigger 417stop trigger 417time trigger events 418triggers view 39
troubleshooting capture engine 24trust 557trust table tab 26trust, assigning trust levels to nodes 437trusted, known and unknown nodes 437
Uundocking views 38unhiding packets 191, 192units 87, 481updating capture engine settings 26upload packets 203username 15, 20UTC 43
Vvalue tab 347vendor ID 265view menu 526view section 38view type 73, 208, 218visual expert 312
compare tab 262defined 246graphs tab 252, 256PacketVisualizer tab 247payload tab 250summary tab 264what if tab 261
VLAN 74, 82, 179, 209, 218, 536voice & video 312, 314, 315, 326voice & video dashboard 78voice & video statistics 319, 325, 329
625
Index
ANYOP_UG.book Page 626 Friday, February 5, 2016 4:47 PM
voice & video view 312voice & video visual expert 312, 319, 320VoIP 481VoIP analysis module 585VoIP options 328VoIP stats 44volume, call 80VoWLAN 496
WWAN analysis module 586warnings view 481WAV file 319, 326web analysis 292web analysis module 586web statistics 309web view 292, 308, 309WEP 160, 488, 491WEP ICV 558, 561WEP key 558
what if tab 261WinPcap 51wireless adapters 47wireless channels 488, 490wireless encryption 488, 490, 491wireless signal 76WLAN 82WLAN authentication 267WLAN encryption 267WLAN statistics 335, 337, 355WLAN tab 335, 337, 355WLAN view 62workspace view 481WPA 160, 488, 491, 493WPA key set 147WPA2 488, 491
Zzoom in 88zoom out 89
626