Ethnologia Europaea Revisited: Launching Future Ethnologies. An Introduction.
Upload
khangminh22Category
view
2download
0
Olive (Olea europaea L.) leaf
biophenols as nutraceuticals
A thesis submitted to
In fulfilment of requirements for the degree of
Doctor of Philosophy
By
Muhammad Kamran
March, 2016
©Muhammad Kamran, 2016
II
Certificate of Authorship
I hereby declare that this submission is my own work and to the best of my
knowledge and belief, understand that it contains no material previously published
or written by another person, nor material which to a substantial extent has been
accepted for the award of any other degree or diploma at Charles Sturt University
or any other educational institution, except where due acknowledgement is made in
the thesis. Any contribution made to the research by colleagues with whom I have
worked at Charles Sturt University or elsewhere during my candidature is fully
acknowledged.
I agree that this thesis be accessible for the purpose of study and research in
accordance with normal conditions established by the Executive Director, Library
Services, Charles Sturt University or nominee, for the care, loan and reproduction
of thesis.*
------------------------- --------------------
Muhammad Kamran Date
* Subject to confidentiality provisions as approved by the University.

III
Dedication
I dedicate my work to my beloved Father, Mother and my
Family for their Love, Support, Encouragement and Prayers.

IV
Acknowledgements
All praises to ALLAH Almighty, most gracious and merciful, who blessed me with
physical and mental health and gave me strength to complete this work. I am
thankful to ALLAH Almighty for sending Prophet Muhammad (May the peace and
blessings of ALLAH be upon him), who practically told us the way of spending life
and provided guidance to mankind.
I would like to convey my gratitude to those people, without whom this study would
be very difficult to complete and it is my pleasure to mention their names.
Firstly, I would like to express my sincere gratitude to Charles Sturt University for
providing me the Postgraduate Research Scholarship for this study. Special thanks
to Graham Centre for Agricultural Innovation for providing some funds towards the
end of the study. I owe my thanks to Comvita, Olive Leaf Australia, for providing
olive leaf extract capsules for the clinical trial.
I wish to express my deepest gratitude to my supervisor Dr Hassan Kamal Obied
and Co supervisors Dr Christopher James Scott and Dr Adam Scott Hamlin for the
continuous support of my PhD study, for their motivation, immense knowledge and
positive criticism. Their invaluable help of constructive comments and suggestions
throughout the research and thesis works have contributed to the success of this
research.
I would like to express my sincere gratitude to Assoc. Prof. Gaye Krebs, for her
valuable advice and guidance, for being very supportive to me during my
candidature. Special thanks also goes to Dr. S. M. Saqlan Naqvi for invaluable
support towards the end of the study in the absence of my principal supervisor. I
would also like to thank Dr Mahmoud Ahmed (University of Alexandria, Egypt)
for running non-parametric statistical analysis.
V
I am thankful to Technical laboratory staff especially, Mr. Michael Loughlin, Mr
Paul Burton, Therese Moon and Lyn Mathews for providing access to the laboratory
and research facilities, technical support for handling delicate hi-tech instruments.
Without their precious support it would be very challenging to successfully
complete this research.
I would like to thank Mrs Karen MacKney for always being there for any library
related issues and for her support in endnote referencing. I thank my fellow
colleagues Mrs Nusrat Subhan, Mr Arthur Robin, Dr Kah Yaw Ee, Dr Randy
Adjonu, Dr. Adeola Alashi, Dr K M Shamsul Haque, Dr. Saira Hussain and Mr.
Shoaib Tufail for the stimulating discussions, encouragement and support.
Most importantly I would like to extend my warmest thanks to my gorgeous mother
and lovely family, my brothers, my sisters and my wife for their unconditional love,
prayers, support, encouragement and confidence in me not only during the course
of this study but throughout my life. Special feeling of gratitude to my Father Hafiz
Ata Elahi Late, who was my role model, though he is not here now but he left the
fingerprints of grace on my life. Finally, my dearest thanks to my sons Muhammad
Soban Kamran and Muhammad Hammad Kamran for their love, support and for
realizing the importance of quietness and peace I need for writing this thesis.

VI
Table of Contents
CERTIFICATE OF AUTHORSHIP .................................................................. II
DEDICATION ..................................................................................................... III
ACKNOWLEDGEMENTS................................................................................ IV
TABLE OF CONTENTS.................................................................................... VI
LIST OF TABLES ........................................................................................... XIII
LIST OF FIGURES ......................................................................................... XIV
LIST OF SYMBOLS AND ABBREVIATIONS .......................................... XVII
LIST OF PUBLICATIONS ......................................................................... XXIV
ABSTRACT ..................................................................................................... XXV
INTRODUCTION .................................................................................................. 1
CHAPTER 1. LITERATURE REVIEW.......................................................... 4
OLIVE LEAF BIOPHENOLS, CHEMISTRY AND BIOLOGICAL
ACTIVITY .............................................................................................................. 4
1.1. INTRODUCTION ....................................................................................................... 4
1.2. THE OLIVE TREE .................................................................................................... 6
1.3. OLIVE AND HEALTH: THE ROLE OF BIOPHENOLS ............................................... 7
1.4. THE CHEMISTRY OF OLIVE BIOPHENOLS ............................................................. 8
1.4.1. Classification of Olive Biophenols ................................................................... 9
1.4.1.1. Simple phenols (C6-C0-3) ....................................................................................... 9
1.4.1.2. Phenolic acids (C6-C1-3) ......................................................................................... 9
1.4.1.3. Flavonoids (C6-C3-C6) ......................................................................................... 10
1.4.1.4. Secoiridoids ......................................................................................................... 10
1.4.1.5. Lignans ................................................................................................................ 11
VII
1.4.1.6. Isochromans ......................................................................................................... 11
1.5. OLIVE LEAVES ....................................................................................................... 12
1.5.1. Nutritive Value ................................................................................................ 12
1.5.2. Bioactive Phytomolecules of Olive Leaf ........................................................ 13
1.6. OLIVE LEAF BIOPHENOLS .................................................................................... 14
1.6.1. Oleuropein ....................................................................................................... 15
1.6.2. Olive leaf flavonoids ....................................................................................... 17
1.6.3 Factors affecting the biophenol content of olive leaves ................................... 26
1.7. OLIVE LEAVES: NUTRACEUTICAL AND DIETARY APPLICATIONS ..................... 28
1.7.1. Olive leaf extract ............................................................................................. 28
1.7.2. Fortification of olive oil /edible oils/ other food products with olive leaves .. 29
1.7.3. Encapsulation of olive leaf extracts ................................................................ 29
1.7.4. Antimicrobial food packaging ........................................................................ 30
1.8. OLIVE LEAVES: TRADITIONAL AND FOLK MEDICINE ........................................ 30
1.9. PHARMACOLOGICAL ACTIVITIES OF OLIVE LEAVES......................................... 35
1.9.1. Antimicrobial activity ..................................................................................... 35
1.9.1.1. Antibacterial and antifungal activity .................................................................... 35
1.9.1.2. Antiviral activity .................................................................................................. 36
1.9.2. Immunoregulatory effects ............................................................................... 38
1.9.3. Cardiovascular protective activities ................................................................ 38
1.9.4. Antiplatelet activity ......................................................................................... 39
1.9.5. Hypocholesterolaemic effects ......................................................................... 40
1.9.6. Blood pressure regulation ............................................................................... 40
1.9.7. Anticancer and chemopreventive activities .................................................... 41
1.9.8. Renal health promotion ................................................................................... 42
1.9.9. Gastro-protective effects ................................................................................. 43
1.9.10. Antioxidant and free radical scavenging effects ........................................... 43
1.9.11. Anti-inflammatory effects ............................................................................. 45
1.9.12. Anti-diabetic activities .................................................................................. 47
VIII
1.9.13. Anti-Alzheimer’s Disease ............................................................................. 50
1.9.14. Miscellaneous activities ................................................................................ 52
1.10. PHARMACOKINETICS OF OLIVE LEAF BIOPHENOLS ........................................ 53
1.11. TOXICITY AND ADVERSE EFFECTS OF OLIVE LEAF BIOPHENOLS ..................... 53
1.12. POSOLOGY OF OLIVE LEAF/ OLE ...................................................................... 54
1.13. CONCLUSION ....................................................................................................... 56
1.14. AIM AND OBJECTIVES OF THE PROJECT ............................................................ 58
CHAPTER 2. DRYING AT HIGH TEMPERATURE FOR A SHORT
TIME MAXIMIZES THE RECOVERY OF OLIVE LEAF
BIOPHENOLS 59
2.1. INTRODUCTION ..................................................................................................... 59
2.2. MATERIALS AND METHODS .................................................................................. 62
2.2.1. Chemicals and reagents .................................................................................. 62
2.2.2. Collection of olive leaves ............................................................................... 63
2.2.3. Sample treatments ........................................................................................... 63
2.2.4. Moisture content ............................................................................................. 64
2.2.5. Extraction of biophenols ................................................................................. 65
2.2.6. Spectrophotometric measurements ................................................................. 65
2.2.6.1. Total phenols ....................................................................................................... 66
2.2.6.2. Total flavonoids ................................................................................................... 66
2.2.6.3. o-diphenols .......................................................................................................... 66
2.2.6.4. ABTS radical scavenging assay .......................................................................... 67
2.2.6.5. DPPH radical scavenging assay .......................................................................... 68
2.2.7. High performance liquid chromatography (HPLC) ........................................ 68
2.2.7.1. HPLC-DAD-online ABTS .................................................................................. 68
2.2.7.2. HPLC-DAD-MS/MS ........................................................................................... 69
2.2.8. Statistical analysis ........................................................................................... 70
2.3. RESULTS AND DISCUSSION .................................................................................... 70
IX
2.3.1. Moisture content ............................................................................................. 71
2.3.2. Extractable matter (EM) .................................................................................. 71
2.3.3. Total biophenol composition and total antioxidant capacity .......................... 72
2.3.4. Biophenol-antioxidant profile and recovery of individual biophenols ........... 78
2.3.5. Cultivar and seasonal impact on biophenols and oleuropein recovery ........... 82
2.3.6. Sample pre-treatment and biophenol recovery ............................................... 84
2.4. CONCLUSIONS ........................................................................................................ 86
CHAPTER 3. THE IMPACT OF CLIMATIC CONDITIONS, SEASON
AND CULTIVAR ON BIOPHENOL CONTENT OF OLIVE LEAVES ..... 88
3.1. INTRODUCTION ...................................................................................................... 88
3.2. MATERIALS AND METHODS .................................................................................. 91
3.2.1. Chemicals and Reagents ................................................................................. 91
3.2.2. Collection of olive leaves ................................................................................ 91
3.2.3. Drying of olive leaves ..................................................................................... 92
3.2.4. Moisture content ............................................................................................. 92
3.2.5. Extraction of biophenols ................................................................................. 92
3.2.6. Spectrophotometric measurements ................................................................. 92
3.2.6.1. Determination of total phenols............................................................................. 93
3.2.6.2. Determination of total flavonoids ........................................................................ 93
3.2.6.3. Determination of o-diphenols .............................................................................. 93
3.2.6.4. Determination of phenolic classes ....................................................................... 93
3.2.6.5. Antioxidant activity ............................................................................................. 94
3.2.7. High Performance Liquid Chromatography (HPLC) ...................................... 94
3.2.8. Climatic data ................................................................................................... 95
3.2.9. Statistical analysis ........................................................................................... 95
3.3. RESULTS AND DISCUSSION .................................................................................... 96
3.3.1. Dry matter content .......................................................................................... 97
3.3.2. Total phenols (Folin-Ciocalteu) ...................................................................... 98
X
3.3.3. Total flavonoids ............................................................................................ 104
3.3.4. o-Diphenols ................................................................................................... 105
3.3.5. Total Phenolic Compounds (280 nm) ........................................................... 109
3.3.6. Hydroxycinnamic acid derivatives ............................................................... 111
3.3.7. Flavonols ....................................................................................................... 113
3.3.8. Antioxidant activity ...................................................................................... 115
3.3.8.1. ABTS ................................................................................................................. 115
3.3.8.2. DPPH ................................................................................................................. 116
3.3.9. High Performance Liquid Chromatography (HPLC) analysis ...................... 120
3.3.9.1. Oleuropein ......................................................................................................... 121
3.3.10. Correlation analysis .................................................................................... 124
3.4. CONCLUSION ....................................................................................................... 133
CHAPTER 4. COMPARATIVE STUDY OF IN-VITRO ANTIOXIDANT
AND ANTIDIABETIC ACTIVITIES OF AUSTRALIAN OLIVE LEAF
EXTRACTS 136
4.1. INTRODUCTION ................................................................................................... 136
4.2. MATERIALS AND METHODS ................................................................................ 139
4.2.1. Chemicals and reagents ................................................................................ 139
4.2.2. Collection of olive leaves ............................................................................. 140
4.2.3. Drying of olive leaves ................................................................................... 140
4.2.4. Dry matter ..................................................................................................... 141
4.2.5. Extraction of biophenols ............................................................................... 141
4.2.6. Enriched biophenol extract ........................................................................... 141
4.2.7. Extractable matter ......................................................................................... 141
4.2.8. High performance liquid chromatography (HPLC) ...................................... 142
4.2.9. Spectrophotometric measurements ............................................................... 142
4.2.9.1. Total phenols ..................................................................................................... 142
4.2.9.2. ABTS radical scavenging assay ........................................................................ 143

XI
4.2.9.3. Hydrogen peroxide scavenging assay ................................................................ 143
4.2.9.4. Superoxide radical (SOR) scavenging assay ..................................................... 144
4.2.9.5. Copper chelation activity ................................................................................... 145
4.2.9.6. Ferric reducing antioxidant power assay ........................................................... 145
4.2.9.7. Alpha-amylase inhibition assay ......................................................................... 146
4.2.10. Statistical analysis ....................................................................................... 147
4.3. RESULTS AND DISCUSSION .................................................................................. 147
4.3.1. Dry matter ..................................................................................................... 148
4.3.2. Extractable matter ......................................................................................... 148
4.3.3. High performance liquid chromatography (HPLC) ...................................... 149
4.3.4. Total phenols ................................................................................................. 158
4.3.5. Antioxidant activity....................................................................................... 160
4.3.5.1. ABTS radical scavenging .................................................................................. 162
4.3.5.2. Hydrogen peroxide scavenging.......................................................................... 163
3.5.3. Superoxide radical (SOR) scavenging .................................................................. 166
4.3.5.4. Copper chelation activity ................................................................................... 168
4.3.5.5. Ferric reducing antioxidant power (FRAP) ....................................................... 171
4.3.6. Alpha-amylase inhibition .............................................................................. 174
4.4. CONCLUSION ....................................................................................................... 177
CHAPTER 5. AN INVESTIGATION INTO OLIVE LEAF EXTRACT AS
A THERAPEUTIC ANTIOXIDANT TREATMENT OF PREDIABETES 178
5.1. INTRODUCTION .................................................................................................... 178
5.2. MATERIALS AND METHODS ................................................................................ 182
5.2.1. Ethics approval .............................................................................................. 182
5.2.2. Subject recruitment ....................................................................................... 182
5.2.3. Study protocol ............................................................................................... 183
5.2.4. Dietary collection .......................................................................................... 184
5.2.5. Test material (supplement) ............................................................................ 184
5.2.6. Compliance ................................................................................................... 185
XII
5.2.7. Blood and urine samples ............................................................................... 185
5.2.8. Reagents and standards ................................................................................. 185
5.2.9. High performance liquid chromatography (HPLC) of olive leaf extract
capsules ................................................................................................................... 186
5.2.10. Spectrophotometric measurements ............................................................. 186
5.2.10.1. Total phenols assay .......................................................................................... 186
5.2.10.2. Isoprostanes assay ........................................................................................... 187
5.2.10.3. 8-Hydroxy-2-deoxyguanosine (8-OHdG) assay .............................................. 188
5.2.11. Statistical analysis ....................................................................................... 189
5.3. RESULTS AND DISCUSSION .................................................................................. 189
5.3.1. Nonparametric analysis of clinical data ........................................................ 190
5.3.2. Parametric analysis of clinical data ............................................................... 191
5.3.2. 1. Total phenols .................................................................................................... 195
5.3.2.2. Isoprostanes ....................................................................................................... 196
5.3.2.3. Hydroxy-2-deoxyguanosine (8-OHdG) ............................................................. 197
5.3.3. High performance liquid chromatography (HPLC) analysis of the capsules 200
5.4. CONCLUSION ....................................................................................................... 203
CHAPTER 6. GENERAL DISCUSSION, CONCLUSION AND FUTURE
DIRECTIONS 204
REFERENCES ................................................................................................... 212
APPENDICES .................................................................................................... 246
APPENDIX 1. OLIVE TREES USED FOR LEAVES COLLECTION .................................. 246
APPENDIX 2. LEAFLET INFORMATION OF COMMERCIAL OLIVE LEAF EXTRACTS. 249
APPENDIX 3. ETHICS APPROVAL .............................................................................. 250
APPENDIX 4. INFORMATION STATEMENT FOR CLINICAL TRIAL PARTICIPANTS 252
APPENDIX 5. PRE-STUDY SURVEY .......................................................................... 255
APPENDIX 6. POST-STUDY SURVEY ........................................................................... 260
XIII
List of Tables
Table 1.1: Biophenols reported in olive leaves..................................................... 18
Table 1.2: Worldwide traditional and folk medicinal uses of olive leaves. ......... 31
Table 2.1: Biophenol content and antioxidant activity of Frantoio olive leaves. . 75
Table 2.2: Quantity of major biophenols identified in Frantoio olive leaf. .......... 83
Table 4.1: EC50 and IC50 values of olive leaf extracts for in vitro bioactivity assays.
............................................................................................................................. 161
XIV
List of Figures
Figure 2.1: HPLC chromatograms of olive leaf extracts at 280nm showing the
effect of different drying methods on the phenolic compounds of olive leaves. ...80
Figure 2.2: HPLC chromatograms of olive leaf extracts of oven dried leaves at 105
°C, comparing 280nm and 325nm wavelength and the corresponding ABTS
activity. ...................................................................................................................81
Figure 2.3: Effect of different drying treatments on oleuropein recovery from olive
leaves. .....................................................................................................................84
Figure 3.1: Dry matter of olive leaves 2012 to 2014. .........................................100
Figure 3.2: Climate variation over the experimental timeframe. ........................101
Figure 3.3: Total phenols of olive leaves 2012 to 2014. .....................................102
Figure 3.4: Total flavonoids of olive leaves 2012 to 2014. ................................107
Figure 3.5: o -diphenols of olive leaves 2012 to 2014. .......................................108
Figure 3.6: Phenolic compounds (280 nm) of olive leaves 2012 to 2014. .........110
Figure 3.7: Hydroxycinnamic acid derivatives of olive leaves 2012 to 2014. ...112
Figure 3.8: Flavonols content of olive leaves 2012 to 2014. ..............................114
Figure 3.9: ABTS radical scavenging activity of olive leaves 2012 to 2014. ....117
Figure 3.10: DPPH radical scavenging activity of olive leaves 2012 to 2014. ..118
Figure 3.11: Oleuropein content of olive leaves 2012 to 2014. ..........................122
Figure 3.12: Correlation between total flavonoids and a) ABTS, b) DPPH. ......125
Figure 3.13: Correlation between oleuropein and a) total flavonoids, b) ABTS.
..............................................................................................................................126
Figure 3.14: Correlation between oleuropein and a) total phenols, b) DPPH. ...127
Figure 3.15: Correlation between oleuropein and a) phenolic compounds, b) o-
diphenols. .............................................................................................................128
Figure 3.16: Correlation between total phenols and a) ABTS, b) DPPH. ..........129

XV
Figure 3.17: Correlation between oleuropein and a) hydroxycinnamic acid
derivatives, b) flavonols....................................................................................... 130
Figure 3.18: Trend of antioxidant activity and oleuropein content of olive leaves
2012 to 2014. ....................................................................................................... 132
Figure 4.1: Extractable matter of olive leaf extracts. ......................................... 149
Figure 4.2: Solvent effect on oleuropein content of olive leaf extract. .............. 151
Figure 4.3: Oleuropein content of olive leaf extracts with 50% methanol as the
dilution solvent. ................................................................................................... 152
Figure 4.4: HPLC chromatograms of Hardy’s Mammoth crude olive leaf extract,
comparing 280nm and 325nm wavelength and the corresponding ABTS activity.
............................................................................................................................. 153
Figure 4.5: HPLC chromatograms of Hardy’s Mammoth enriched olive leaf
extract, comparing 280nm and 325nm wavelength and the corresponding ABTS
activity. ................................................................................................................ 154
Figure 4.6: HPLC chromatograms of Comvita olive leaf extract, comparing 280
nm and 325 nm wavelength and the corresponding ABTS activity. ................... 155
Figure 4.7: HPLC chromatograms of Blackmores olive leaf extract, comparing 280
nm and 325 nm wavelength and the corresponding ABTS activity. ................... 156
Figure 4.8: HPLC chromatograms of Swisse olive leaf extract, comparing 280 nm
and 325 nm wavelength and the corresponding ABTS activity. ......................... 157
Figure 4.9: Total phenols of olive leaf extracts as gallic acid equivalents (GAE).
............................................................................................................................. 159
Figure 4.10: Total phenols of olive leaf extracts as oleuropein equivalents (OLPE).
............................................................................................................................. 159
Figure 4.11: ABTS radical scavenging activity of oleuropein and olive leaf
extracts. ................................................................................................................ 164
XVI
Figure 4.12: Hydrogen peroxide (H2O2) scavenging activity of oleuropein and
olive leaf extracts. ................................................................................................165
Figure 4.13: Superoxide radical (SOR) scavenging activity of oleuropein and olive
leaf extracts. .........................................................................................................167
Figure 4.14: Copper chelation activity of luteolin and olive leaf extracts. .........170
Figure 4.15: FRAP values of olive leaf extracts as trolox equivalent. ...............172
Figure 4.16: α-Amylase inhibition activity of oleuropein and olive leaf extracts.
..............................................................................................................................176
Figure 5.1: Fasting blood glucose levels.............................................................193
Figure 5.2: Glycated haemoglobin (HbA1c). .....................................................193
Figure 5.3: Lipid profile. .....................................................................................194
Figure 5.4: Total phenols in urine. ......................................................................195
Figure 5.5: Stat-8- Isoprostane in urine. .............................................................196
Figure 5.6: 8-Hydroxy-2-deoxyguanosine (8-OHdG) in urine. ..........................197
Figure 5.7: Oleuropein content of the capsule with different solvents (mg/capsule).
..............................................................................................................................201
Figure 5.8: HPLC chromatograms of Comvita olive leaf capsule, comparing 280
nm and 325 nm wavelength and the corresponding ABTS activity. ...................202

XVII
List of Symbols and Abbreviations
Abbreviation Definition
8-OHdG 8-hydroxy 2'-deoxy-guanosine
ABTS 2,2′ azinobis (3-ethylbenzothiazoline-6-sulfonic acid) diammonium
salt
AD Alzheimers’s disease
AGE Apigenin-7-O-glucoside equivalent
ANOVA Analysis of variance
AP Alkaline pohsphatase
AP-1 Activator protein-1
ATP Adenosine triphosphate
Aβ β-amyloid
B0 Maximum binding
BME Blackmores extract
C Carbon
CAE Caffeic acid equivalents
CC Column chromatography
Cho:HDL Cholesterol to high density lipoprotein ratio
cm Centimetre
CNPG3 2-Chloro-4-Nitrophenyl-α-maltotrioside
COX-2 Cyclooxygenase-2
Cu Copper
Cu2+ Cupric ion
CYPs Cytochrome P450 enzymes
DAD Diode array detector
XVIII
dL Decilitre
DM Dry matter
DNA Deoxyribonucleic acid
DPPH 2,2′-diphenyl-1-picrylhydrazyl
DSS Dahl salt-sensitive
DTNB 5,5'-dithio-bis-(2-nitrobenzoic acid)
DW Dry weight
EC50 Half maximal effective concentration
ELISA Enzyme-linked immunosorbent assay
EM Extractable matter
ES Electrospray
ESI Electrospray ionization
Fe Iron
Fe2+ ferrous ion
Fe3+ Ferric ion
FRAP Ferric reducing antioxidant power
g Grams
GAE Gallic acid equivalent
GC Gas chromatography
GF/F Glass microfiber filters
GP General health practioner
gp41 Glycoprotein 41
GSH Reduced glutathione
GSSG Oxidized glutathione
GST Glutathione S-transferases
h Hours

XIX
H2O2 Hydrogen peroxide
HbA1c Glycated haemoglobin
HDL High-density lipoprotein
HIV Human immunodeficiency virus
HMCE Hardy’s Mammoth crude extract
HMEE Hardy’s Mammoth enriched extract
HPLC High performance liquid chromatography
HPLC-DAD High performance liquid chromatography with diode array detection
HRP Horseradish peroxidase
HSD Honest significant difference
HSV Herpes simplex virus
i.d. Internal diameter
IC25 Quarter maximal inhibitory concentration
IC50 Half maximal inhibitory concentration
IFG Impaired fasting glycaemia/glucose
IgG Immunoglobulin G
IGT Impaired glucose tolerance
IL Interleukin
IL-1β Interleukin-1 beta
kg Kilograms
kV Kilovolts
L Litre
LC-MS Liquid chromatography–mass spectrometry
LDL Low-density lipoprotein
L–NAME NG-nitro-L-arginine methyl ester
LSD Least significant difference
XX
M Molar
m Metre
mmol Millimole
m/z Mass/charge ratio
m2 Square metre
mAU Milli absorbance unit
mg Milligrams
min Minutes
MJ Mega joule
mL Millilitre
mM Millimole
mm Millimetre
MS Mass spectrometry
MS/MS Tandem mass spectrometry
mVolts Millivolts
MW Molecular weight
n Sample size
NADH Reduced -nicotinamide adenine dinucleotide
NBT Nitrotetrazolium blue
ND Not determined
NF-κB Nuclear factor kappa (B cells)
nm Nanometre
nM Nanomole
NSB Non-specific binding
o ortho
º Degree

XXI
O2- Superoxide anion
ºC Degree Celsius
ODP o-diphenol content
OGTT Oral glucose tolerance test
•OH Hydroxyl radical
OLAE Comvita (Olive Leaf Australia) extract
OLE Olive leaf extract
OLEs Olive leaf extracts
OLPE Oleuropein equivalent
p para
p24 Viral protein
PB Phosphate buffer
PBS Phosphate buffered saline
pg Picograms
pNPP para-Nitrophenyl Phosphate
PPO Polyphenol oxidase
Psi pounds per square inch
PV Pyrocatechol violet
QE Quercetin equivalents
RBL-2H3 Basophilic leukemia cells
RNS Reactive nitrogen species
ROS Reactive oxygen species
Rpm Revolutions per minute
sec Seconds
SGLT Sodium-glucose linked transporter
SOLE Swisse extract
XXII
SOR Superoxide radical
t/ha Tons/hectare
T3 Triiodothyronine
TA Total activity
TC Total cholesterol
TE Trolox equivalent
TEAC Trolox equivalent antioxidant capacity
TFC Total flavonoid content
TGR5 G-protein coupled receptor
TLC Thin layer chromatography
TNB 5-thio-2-nitrobenzoic acid
TNF-α Tumor necrosis factor alpha
TPC Total phenol content
TPTZ 2,4,6-tripyridyl-s-triazine
Trig Triglycerides
Trolox (±)-6-hydroxy-2,5,7,8-tetramethylchromane-2-carboxylic acid
µg Microgram
µL Microliter
µMol Micromole
US$ United States dollars
UV Ultraviolet
UVD Ultraviolet detector
V Volts
v/v Volume per unit volume
VHSV Viral haemorrhagic septicaemia virus
VLDL Very low density lipoprotein

XXIII
w/v Weight per unit volume
w/w Weight per unit weight
α Alpha
β Beta
μm Micrometre
Є Molar extinction coefficient
XXIV
List of publications
Kamran, M., Hamlin, A. S., Scott, C. J., and Obied, H. K. (2015). Drying at high
temperature for a short time maximizes the recovery of olive leaf biophenols.
Industrial Crops and Products, 78, 29-38.
XXV
Abstract
The use of nutraceuticals is increasing at rapid rate around the globe as, they are
convenient and cheaper than expensive medical and surgical procedures. Moreover,
nutraceuticals are surrounded by a halo of propaganda claiming a safer profile only
due to their preparation from natural products. The way forward for giving these
phytomolecules a legal ground to be applied in disease prevention and treatment
will be through proper scientific research. Thus, there is a great need for
comprehensive investigation to evaluate the efficacy of various nutraceuticals and
to optimize their recovery from natural sources.
Olive leaves were selected for this study as olive (Olea europaea L.) leaves are a
significant source of biophenols all over the year. Though in the past olive leaves
were mainly used for animal feeding, during the last two decades their health
promoting properties have been recognized and many studies examined their
potential applications. The superior health benefits of olive leaves are attributed to
biophenols. These health promoting effects are further augmented because of high
bioavailability of these biophenols. The biological activities of olive leaf biophenols
have created a high demand for extensive research to develop the most effective
method for the extraction and separation of olive biophenols, to identify these
biophenols, and to determine their suitability as a nutraceutical or functional food.
The first study investigated the best method for drying olive leaves so as to optimize
the recovery of olive leaf biophenols especially oleuropein. The recovery of
biophenolic compounds was compared between fresh, air-dried, freeze-dried and
oven-dried (at 60 °C and 105 °C) olive leaves. The biophenol content and
antioxidant activity were assessed by gross quantitative methods such as total

XXVI
phenol content (Folin-Ciocalteu’s method), total flavonoid content, total o-diphenol
content and total antioxidant capacity using ABTS+◦ and DPPH◦ scavenging assays.
In addition, the biophenolic composition of extracts was determined by high
performance liquid chromatography (HPLC) equipped with diode array detection
(DAD) with tandem mass spectrometery (MS/MS). The contribution of individual
biophenols to the antioxidant activity of extracts was evaluted by an online ABTS
scavenging assay. Extracts obtained from leaves oven-dried at 105 °C showed the
highest phenol recoveries and antioxidant activities, whereas extracts obtained from
oven-dried leaves at 60 °C had the lowest values. Oven drying of olive leaves at
105 °C for three hours increased oleuropein recovery up to 38 fold as compared
with fresh olive leaves. Results of the study stress the paramount importance of
sample pre-treatment in the preparation and analysis of herbal medicines.
Futhermore, the limitations of sole dependence on gross assessment of total
biophenolic composition and total antioxidant activity in studying plant samples
were highlighted.
Second study was a unique study that covered the complete olive tree cycle. This
study was conducted to investigate the effect of climate, season and cultivar on the
composition of olive leaf biophenols and antioxidant activity in order to determine
the best harvest time for optimal recovery of biophenols from a particular cultivar.
The biophenol content of an Australian cultivar was compared with cultivars of
Italian origin, grown in Wagga Wagga. The correlation between biophenol content
and the antioxidant activity was also determined. A new HPLC method developed
for this study, resulted in rapid and clear separation of olive leaf biophenols without
minimal co-elution. Olive leaf biophenols vary quantitatively during different
stages of the biological cycle of the olive tree, however no qualitative differences
were detected. Significant effects of cultivar/ variety as well as month of collection

XXVII
and season were observed for biophenol composition and antioxidant activity of
olive leaves. Total flavonoids showed moderately positive correlation with
oleuropein and antioxidant activity measured by ABTS and DPPH radical
scavenging assays. Oleuropein showed a moderately positive correlation with
ABTS activity, but a weak correlation with DPPH activity and total phenols. Total
phenol content displayed a weak correlation with ABTS, but no correlation with
DPPH activity. The time of collection is the most influential parameter with regards
to olive leaves suitability for commercialization. None of the cultivars followed a
specific pattern for accumulation of biophenols throughout the collection period.
The summer season, was the best for the optimal antioxidant activity and for
maximum recovery of biophenols, including oleuropein. For the better recoveries
of total phenols, phenolic compunds, o-diphenols, hydrocinnamic acid derivatives
and higher antioxidant activity the Leccino cultivar was most appropriate, whereas
in order to get higher oleuropein and total flavonoid content, the Hardy’s Mammoth
was the best cultivar.
In the third study, in vitro antioxidant and antidiabetic activities of commercial olive
leaf extracts were compared with laboratory prepared extract of Hardy’s Mammoth
olive leaves. An array of antioxidant activity assays involving different mechanism
such as ABTS and superoxide radical scavenging, hydrogen peroxide scavenging,
copper chelation and ferric reducing antioxidant power assay were investigated.
Crude and enriched extracts were prepared from leaves of the Hardy’s Mammoth
cultivar and these extracts were compared with commercially available olive leaf
extracts (OLEs). The oleuropein content of all extracts was determined by HPLC.
Total phenols were also measured, as gallic acid and oleuropein equivalents, to find
the contribution of total phenols towards antioxidant activity. Antidiabetic activity
of OLEs, via α-amylase enzyme inhibition activity, was also investigated. OLEs

XXVIII
demonstrated high potency as a source of antioxidant in all tested assays. They also
confirmed their antidiabetic activity through inhibition of α-amylase in in vitro
assay. Olive leaf biophenols as individual compounds and in a combined form of
extract were excellent antioxidants. These results indicate that olive leaf biophenols
are multi efficient bioactive molecules and have a great potential as nutraceuticals.
Since olive leaf biophenols strongly inhibited the α-amylase enzyme, they could be
beneficial in lowering blood glucose level and might prove to be an effective
antidiabetic agent.
In the fourth study, the potential of olive leaf extract as an antidiabetic agent was
examined in a pilot clinical trial on pre-diabetic subjects. One in three people with
prediabetes will develop type 2 diabetes but it is possible that prediabetics can
return to normal with early pharmacological and intensive diet interventions.
Therefore this study was planned to find out the suitability of OLE as a blood
glucose lowering agent. Eighteen prediabetic adults were recruited, and randomly
allocated to take either OLE or placebo capsules three times per day for 12 weeks.
Reference blood and urine samples were taken at baseline and after 12 weeks to
measure the levels of blood glucose, glycated haemoglobin (HbA1c) and lipid
profile. Total phenols as well as the oxidative biomarkers STAT-8-isoprostane and
8-hydroxy-2'-deoxyguanosine were also measured. For all the studied parameters
no significant differences were observed between the groups (p ˃ 0.05) and neither
supplementation with the olive leaf extract or placebo produced any significant
change compared to their baseline samples (p ˃ 0.05). Some individuals appeared
to respond to the supplement but as a whole group there was no significant response,
which indicated a highly individual response to the supplement. Though it was a
pilot study and the number of participants too small enough to produce any
significant effect but still it gives some valuable information about the baseline

XXIX
levels of blood parameters and effect of olive leaf extract on Australian
prediabeteics.
Olive leaf biophenols have a great potential as a nutraceutical. They demonstrated
good antioxidant and antidiabetic activity in in vitro assays. However, in the pilot
clinical study on prediabetic subjects, supplementation with olive leaf extract did
not produce any significant change. It is suggested that the potential antidiabetic
effect of olive leaf biophenols should be thoroughly investigated in controlled
clinical trials with a larger sample size for the efficient utilization of these valuable
nutraceuticals.


1
Introduction
“Prevention is better than cure”, according to an old proverb. Since ancient times,
it has been known that the purpose of food is much more than to satisfy the
requirements of energy and other essential nutrients for maintenance and
production. If we look at the history of humanity, it has been well documented that
people were aware of the importance of food for the maintenance of health and
disease prevention, as indicated by a quote of Hippocrates (460-370 BC) "Let food
be thy medicine and medicine be thy food". With the advancement in science, many
healthy compounds, at present known as bioactive compounds, have been isolated
form plants and food products, and then used for the prevention and/or treatment of
diseases. Although consumption of these natural compounds has generally involved
no risk and had long lasting effects, they often had a slow action and hence they
have frequently been replaced by synthetic chemicals. Due to advancements in
modern medicine, the disease prevention function of food was largely diminished,
but in the last two decades, focus is again shifting towards natural products. This is
apparent from an increased volume of research on bioactive plant compounds.
People are probably again looking for functional foods and nutraceuticals because
of the adverse effects observed with synthetic medicines. In some instances the
adverse effects of synthetic medicines may be greater than their benefit.
At present, a major focus of nutrition and human health research is an exploration
of the health promoting properties of bioactive compounds from food and non-food
plants, as can be seen from a plethora of research in this area in recent years. Health
promoting foods and extracted bioactive compounds from them are commonly
referred as functional foods and nutraceuticals. Functional foods are those which
possess natural bioactive compounds, while, nutraceuticals are those with added
2
bioactives after extraction from a natural source. Generally functional foods are
those foods that provide supplementary physiological benefit to the consumer, in
addition to simple nutrition, whereas a nutraceutical is a product extracted, isolated
or purified from foods, commonly sold in medicinal forms and usually not
associated with foods (Jones, 2002). A nutraceutical is a part of food that offers
health or medicinal function. The health function may range from prevention to
treatment. It can be explained with the concept that when a functional food offers
prevention, treatment of disease(s) and/or disorder(s) except anaemia, it is called a
nutraceutical (DeFelice, 2002). Being an isolated or purified ingredient a
nutraceutical can have a quicker action than conventionally healthy foods.
Currently nutraceuticals are a point of interest for researchers, industry and the
community. The nutraceutical industry is growing rapidly as demand is increasing,
mainly due to consumers’ awareness and desire for healthy life based on nutrition
rather than treatment with synthetic drugs. Europe has evolved into a nutraceutical
ingredient hub. According to a study in 2015, the global nutraceuticals market was
worth US$182.60 billion and it has been estimated that in 2021 it will have
increased to US$278.96 billion, at the annual growth rate of 7.3%. In that study
global nutraceuticals market is divided into four regions; Europe, North America,
Asia Pacific, and rest of the World. North America was the largest and Asia Pacific
the second largest regional market for nutraceuticals in 2014 (Transparency Market
Research, 2015).
Olive leaves are a highly prized commodity due to its superior value in human
nutrition and their potential in human nutrition should be exploited. Olive leaves
are a valuable nutraceutical resource due to their biophenols, which endow an array
of health promoting properties. A large body of evidence suggests the role of olive

3
leaf biophenols in health promotion (discussed in Chapter 1). The Health promoting
and/or disease prevention and/or therapeutic properties of olive leaf biophenols are
indicative of their potential as a high quality nutraceutical. They can be utilized in
the form of extract or they can be added in daily food via the fortification of food
products with olive leaf biophenols. Increasing demand and interest in olive
biophenols has raised the need for investigation in this area. Moreover, research in
this field would provide more updated information and offer opportunities for
industrial applications of olive leaf biophenols. This research project was designed
to evaluate the best conditions for Australian olive leaves to provide a nutraceutical
source of bioactives such as olive biophenols and to investigate their antidiabetic
effects.
4
Chapter 1. Literature Review
Olive leaf biophenols, chemistry and biological activity
1.1. Introduction
The human-plant relationship and interaction is as old as the creation of human
beings. Plants not only provide food macromolecules such as carbohydrates,
proteins and lipids, they also provide a variety of other compounds which play
diverse roles in health promotion. The function of plants have been beautifully
explained by Janzen (1978) “The plant world is not coloured green; it is coloured
morphine, caffeine, tannin, phenol, terpene, canavanine, latex, phytohaem-
agglutinin, oxalic acid, saponin, L-dopa”. Plants provide us with numerous
bioactive compounds that maintain health or prevent diseases. Among those
bioactive compounds, biophenols have received an enormous amount of interest
due to their multipurpose actions. Their nutraceutical effects have been extensively
investigated over the last three decades and a large number of peer-reviewed papers
have been published on their biological activities. Experimental and clinical
evidence suggests that biophenols may play a role in maintaining health or
preventing disease.
Biophenols are naturally occurring phenolic compounds present in plants. They
mainly act as a (plant) defense mechanism against pathogens (bacteria, fungi,
viruses), competing plants, insect attack, and herbivores due to their bitter taste.
They also act as phytoalexins (Wink, 2003), as well as a protective shield against
UV light (Naczk and Shahidi, 2006). Some are straight phytoalexins, i.e.
hydroxytyrosol, others are phytoanticipins, i.e. secoiridoids. Thus of the olive
biophenol secoiridoids, oleuropein is the most relevant one (Gentile and Uccella,
2014). Furthermore, they are involved in reproduction as signal compounds to
5
attract pollinating animals (Wink, 2003) and are important for communication with
other organisms (Schäfer and Wink, 2009). Biophenols are plant secondary
metabolites, produced during the course of secondary metabolism. They have no
role in the basic physiological processes of plants but nutritionally they may be very
important as they possess a wide range of pharmacological activities including
antimicrobial, antiviral, antioxidant, anti-Alzheimer’s disease, cardioprotective,
gastroprotective, hepatoprotective, anticancer and anti-inflammatory (Korkina,
2007). Some can be assigned to the olive biophenol moiety and others to the
secoiridoid one.
The olive tree (Olea europaea L.) has been cultivated since ancient times for oil
and table olives and is considered as a sign of peace, friendship and happiness. The
olive tree has been regarded as a blessed tree in the holy books including the Old
Testament and the Quran. Olive leaves and leaf extracts have been used for
centuries, as complementary medicine for treatment of disease conditions including
malaria fever, alopecia, colic, hypertension, rheumatic pain, sciatica, paralysis,
arrhythmia and cancer (Benavente-Garcıa et al., 2000; Visioli and Galli, 2002;
Pereira et al., 2007; E. Waterman and Lockwood, 2007; Obied et al., 2012).
More than 100 biophenols have been reported in olive products (fruits, oil, leaves
and processing by-products). The concentrations of these biophenols vary in
different products and specific biophenols are not necessarily present in all olive
products. Olive leaves are a richer source of biophenols than olive oil, and can
contain up to 2% of total phenols on a fresh weight basis (Obied et al., 2012).
To make the maximum use of olive biophenols for health and wellbeing it is
imperative to understand their chemistry and pharmacological properties. In this
chapter, the literature on chemical composition and pharmacological activities of
6
olive leaf biophenols is reviewed. The state-of-the-art research is portrayed and the
challenges and gaps of knowledge are highlighted so as to allow more rational use
of olive biophenols as nutraceutical products.
1.2. The Olive Tree
Evergreen trees belonging to the family Oleaceae, olive trees can grow up to 9 m
tall. They have a lifespan of up to 2,000 years and can produce fruit for over a
thousand years with minimum care (Olive Australia, 2014). There are about 2500
known varieties of olives, but only 250 cultivars have been classified as commercial
cultivars by the International Olive Oil Council. Olives are grown between the
latitudes of 30° and 45° from the equator. Although it is native to Mediterranean
region, southern European countries, Iran and beyond the Caucasus, it can also be
cultivated in similar climate zones. In Australia the main olive producing areas are
between latitudes 31°S and 38°S. Australia’s climatic conditions favour the growth
and processing of olives (Taylor and Burt, 2007). Olive cultivation is better in
neutral to alkaline soils but it can tolerate a wide range of soil conditions. Due to its
excellent drought resistant properties, olive groves can be brought back to
production even after years of neglect (Olive Australia, 2014).
Olives can be grown in cold as well as in warmer climates but for most varieties
some winter frost is preferred. For most of the olive growing regions of the world,
the average maximum temperature in the hottest month is about 30°C; however,
very high temperatures of up to 45°C have very little effect on mature olives. Olive
trees can tolerate temperatures of minus 10°C without any damage, provided there
is sufficient moisture in the soil. Some varieties in good health can survive
temperatures as low as minus 15°C but minus 20°C can be fatal to olive trees. The
optimum temperatures for olive growth are from 15°C to 34°C, with an average

7
monthly minimum winter temperature of less than 10°C required for good fruit
production, although this chilling requirement varies between varieties (Taylor and
Burt, 2007). The use of any particular olive cultivar is determined by its fruit size
and oil content. Those cultivars which have a fruit weight of greater than 4 g and
an oil content of less than 12% are used for table olives, whereas cultivars having
more than 12% oil are used for oil production. In Australia, olive production has
increased significantly in the last two decades and 90% of olives are grown for oil
and 10% for table olives (Taylor and Burt, 2007).
Olive trees have an alternate bearing cycle, also termed as biennial bearing or
periodicity, which means they do not bear a regular and similar fruit year after year.
The tree produces a high-yield crop one year ("on-year"), followed by no fruit or
low-yield the following year ("off-year"). The difference between on and off-year
yields varies between 5 to 30 t/ha (Yanik et al., 2013). The alternate bearing is
beneficial to the tree as it enables it to reserve nutrients not only for vegetative
growth but also for protection against biotic and abiotic stresses that may result in
macronutrient or micronutrient deficiencies (Turktas et al., 2013).
1.3. Olive and Health: The Role of Biophenols
Consumption of olive fruits, oil and leaves has never been restricted to dietary and
culinary applications. The blessings of the holy olive tree have been always
proclaimed as beautifying and healing. Olive oil and leaf extract have been
continuously incorporated in cosmetic and traditional medicine recipes since
antiquity. The active ingredients responsible for the observed biological activities
have been identified as phenolic in nature (Obied, 2013). Olive phenolic
compounds, olive biophenols, are very well prized for their antioxidant properties
(Uccella, 2000). With the introduction of oxidative theory of aging and the role of

8
oxidative stress in disease pathology, biophenols are discovered anew for potential
disease prevention and health promotion (Saija and Uccella, 2000; Obied et al.,
2012).
1.4. The Chemistry of Olive Biophenols
“Polyphenols” is the term used most commonly in literature to describe plant
phenolic compounds. In olive related literature, the term “biophenol” has been
proposed as a more chemically accurate alternative (Uccella, 2000). A chemical
compound having an aromatic ring substituted with one or more hydroxyl groups
is termed a phenol. Recently, the term “biophenols” has been redefined to offer a
more precise and comprehensive description of plant phenols so as to replace the
term “polyphenols” (Obied, et al., 2005a) . Biophenols can be defined as “phenolic
compounds, their derivatives, conjugates, degradation products and metabolites
isolated from plant tissues or products that are derived from shikimate-
phenylpropanoid and/or polyketide pathway(s)” (Obied, 2013). Biophenols
possess at least one aromatic ring with one or more hydroxyl groups. They vary
from simple monohydroxy aromatic, e.g. tyrosol to very complex polymeric
compounds such as tannins. Phenolic compounds are chemically reactive due to the
direct attachment of the hydroxyl group(s) to the electron-rich aromatic benzene
ring. In general, the increase in the number of hydroxyl groups increases phenols’
reactivity, acidity and reducing power (Hemingway and Karchesy, 2012).
Olive biophenols are characterised by multifunctional moieties. They possess a
phenolic structure with alkene, alcoholic or carboxylic functional groups in simple
biophenols; however, when glycoside and monoterpene moieties are attached they
represent more complex phytomolecules such as olive biophenol-secoiridoids
(Uccella, 2000). Olive biophenols can also form supramolecular molecules via

9
complexation with proteins and carbohydrates which affect the function and
reactivity of biophenols (Bianco and Uccella, 2000). Biophenols are present in all
plant parts (root, stem, twigs, leaf, bark, wood, fruit, seed and flower). However,
the nature and the quantity of biophenols present varies significantly.
1.4.1. Classification of Olive Biophenols
There is no standard classification of olive biophenols; however, they can be
divided into several classes/groups. The main groups of biophenols are simple
phenols, phenolic acids, flavonoids, isochromans (not reported in olive leaves),
lignans (also not reported in olive leaves) and secoiridoids (Obied et al., 2012).
1.4.1.1. Simple phenols (C6-C0-3)
Simple substituted phenols have a phenol ring without side chain or with a short
chain of up to three carbon atoms. They can have more than one side chain to form
different combinations and may be conjugated as glycosides or acetates. Examples
of these biophenols are phenyl alcohols (hydroxytyrosol & tyrosol, see Table 1.1)
and catechol, pyrogallol.
1.4.1.2. Phenolic acids (C6-C1-3)
The phenolic acids in olives are mostly hydroxycinnamic acids (e.g. caffeic (Table
1.1), o-coumaric, p-coumaric, ferulic, sinapic acids), hydroxybenzoic acids (gallic,
p-hydroxybenzoic, syringic, vanillic and protocatechuic acids) and phenylacetic
acids (4-hydroxypheylacetic acid and 3,4-dihydroxyphenylacetic acid).

10
1.4.1.3. Flavonoids (C6-C3-C6)
Flavonoids are C15 structures having a flavones skeleton with three rings, of which
two (rings) are phenolic. Variation in the third carbon central unit gives rise to a
variety of different compounds which are either glycosylated, hydroxylated or
methoxylated derivatives. They are mostly found as glycosidic compounds.
Flavonoids can be further divided into many groups. The three most commonly
reported in olives are:
Flavones: the basic flavonoid structures, having no substituents at the C3
central unit. Examples are apigenin, luteolin and their derivatives (Table
1.1).
Flavonols: they have a hydroxyl group at the C3 central unit. Examples are
kaempferol, quercetin and their glycosides (Table 1.1).
Anthocyanidins: They have a flavylium cation and commonly possess
hydroxyl substituents at positions 3 and position 5. They are mostly found
as sugar derivatives (anthocyanins). The B-ring has one or more hydroxy or
methoxy substituents (Quina et al., 2009). Examples are cyanidin (Table
1.1) and delphinidin.
1.4.1.4. Secoiridoids
They constitute a very specific and complex group that are produced as precursors
of various indole alkaloids from the secondary metabolism of terpenes. They are
usually derived from oleoside-11-methyl ester. Oleosides are not biophenols but
they can bond (link) to simple biophenols such as tyrosol or hydroxytyrosol. These
compounds proceed from the acetate/mevalonate pathway. Oleoside-11-methyl
ester combines to biophenols to give olive biophenol secoiridoids (Alagna et al.,
2016). They are abundant in the Oleacea family, with concentrations being
11
significantly higher in olives compared to other plants. Examples are oleuropein,
ligstroside, demethyloleuropein (Table 1.1) and nüzhenide.
1.4.1.5. Lignans
Lignans are formed by a combination of two C6C3 units joined together by a bond
between positions 8 and 8′. Examples are acetoxypinoresinol and pinoresinol,
which have been reported in olive fruit and oil (Ghanbari et al., 2012; Obied et al.,
2012) and hydroxypinoresinol which has been reported in the olive stone (Obied et
al., 2012).
1.4.1.6. Isochromans
They are biomolecules derived from technological reactions in virgin oil, i.e. the
mixing during milling and malaxation. The reaction between aromatic aldehydes
and hydroxytyrosol results in the formation of isochroman derivatives. It has been
suggested that this also can occur in the natural matrix, with oleic acid acting as a
catalyst (Bianco et al., 2002).

12
1.5. Olive Leaves
The olive leaf is thick, coriaceous lanceolate to obovate in shape, having entire
margins and acute tips. The upper surface is greyish-green, shiny and smooth while
the lower surface is paler and has fine white, scale-like hairs. Its length is about 3-
7.5 cm and width is about 1-1.5 cm. The olive leaf is a remarkable source of
bioactive phenolic compounds (olive biophenols), containing a minimum of 5%
oleuropein on a dry matter (DM) basis (Chinou, 2012).
1.5.1. Nutritive Value
The nutritional properties of olive leaves as a food for humans has not been explored
yet; however, a limited number of studies have been performed on small ruminants
to investigate the nutritive value of olive leaves as an animal feed (Molina-Alcaide
and Nefzaoui, 1996; Delgado-Pertıñez et al., 2000; Molina-Alcaide et al., 2003;
Martín-García and Molina-Alcaide, 2008; Molina-Alcaide and Yáñez-Ruiz, 2008).
In humans, only medicinal or pharmacological effects of olive leaves have been
investigated. In order to optimise the use of olive leaves, their nutritive value for
humans should also be evaluated. The nutritive value of olive leaves varies and
depends upon a number of factors including origin, leaf age, climatic conditions,
moisture content, degree of contamination with soil and oils, and storage conditions
(Martín-García and Molina-Alcaide (2008)
The phenolic content as tannins of olive leaves is 8.30 g/kg DM, while the essential
amino acids value is 543 g amino acid-N/kg total N (Martın-Garcıa et al., 2003).
The leaves have a gross energy content of 16.8 MJ/kg DM. Olive leaves are rich in
arginine, leucine, proline, glycine, valine and alanine but low in tyrosine, cysteine,
methionine and lysine (Martın-Garcıa et al., 2003; Martín-García and Molina-

13
Alcaide, 2008; Molina-Alcaide and Yáñez-Ruiz, 2008). The oleuropein content of
fresh leaves is 69.9 g/kg, but this decreases with storage (Delgado-Pertíñez et al.,
1998). Fernández-Escobar et al. (1999) studied seasonal changes of mineral
concentrations in olive leaves during the alternate-bearing cycle and developed
seasonal mineral fluctuations curves for the different leaf minerals. They found that
leaf age affected nutrient content per leaf, observing higher concentrations of
nitrogen, phosphorus, potassium, zinc and boron in younger leaves as compared to
older leaves while in older leaves concentrations of calcium, magnesium,
manganese, copper and iron were higher. In addition, the method of drying impacts
on the nutritive value of olive leaves. Martín-García and Molina-Alcaide (2008)
found that all drying procedures, with the exception of air drying in the shade,
affected all the nutritive parameters of olive leaves.
1.5.2. Bioactive Phytomolecules of Olive Leaf
Various groups of secondary (plant) metabolites, phytomolecules, have been
reported in olive leaves:
Iridoid monoterpenes: including oleuropein, oleuroside, ligstroside,
methyloleuropein, 11-demethyloleuropein, and 7,11-dimethyl ester oleoside
(Gariboldi et al., 1986; Bouaziz and Sayadi, 2005; DerMarderosian and Beutler,
2005) (Table 1.1).
Triterpenes: including oleanolic acid, maslinic acid, and β-amyrin (Dean and
Janićijević-Hudomal, 2007; Chinou, 2012).
Flavonoids: including kaempferol, chrysoeriol, luteolin and apigenin derivatives
(Benavente-Garcıa et al., 2000; Bouaziz and Sayadi, 2005; Dean and Janićijević-
Hudomal, 2007; Dekanski et al., 2009) (Table 1.1).

14
Chalcones: including olivine and olivine-4′-O-diglucoside (Dean and Janićijević-
Hudomal, 2007).
Phenolic acids: including cumaric acid, caffeic acid, ferulic acid, and vanillic acid
(Benavente-Garcıa et al., 2000; Dean and Janićijević-Hudomal, 2007).
Coumarins: including aesculetin, scopoletin, and aesculins (Chinou, 2012).
Alkaloids: Cinchonine and cinchonidine derivatives have been reported earlier
(Ross, 2005).
1.6. Olive Leaf Biophenols
Olive leaves normally possess more complex biophenols such as flavonoids and
secoiridoids glycosides, while the amount of simple phenols is very small. Table
1.1. shows the biophenols commonly reported in olive leaves: oleuropein, rutin,
verbascoside, apigenin-7-glucoside and luteolin-7-glucoside (Benavente-Garcıa et
al., 2000; Japón-Luján and Luque de Castro, 2006), luteolin 4-O-glucoside (Pereira
et al., 2007), luteolin 7, 4-O-diglucoside, apigenin 7-O-rutinoside (Meirinhos et al.,
2005), luteolin 7-O-rutinoside (Bouaziz and Sayadi, 2005), hydroxytyrosol, tyrosol,
caffeic acid, p-coumaric acid, vanillic acid, vanillin, luteolin, (Benavente-Garcıa et
al., 2000; Bianco and Uccella, 2000; Tasioula-Margari and Okogeri, 2001). Olive
leaf extract also contains catechin (Benavente-Garcıa et al., 2000), quercetin, and
chryseriol (Dekanski et al., 2009). The main bioactive compounds of olive leaves
are oleuropein and its hydrolysis products like oleuropein aglycone, Oleoside-11-
methyl ester, hydroxytyrosol and methyl-O-methyl elenolate (Durlu-Özkaya and
Özkaya, 2011). Oleuropein, hydroxytyrosol, tyrosol, rutin, luteolin, catechin and
apigenin, are believed to be responsible for the pharmacological activities of olive
leaf extract (Bowden, 2009).

15
Olive leaves are very rich in biophenols (see Table 1.1); however, the composition
and amount of phenolic compounds in olive leaves varies to some extent between
studies (sources of variation discussed under section 1.6.3.). Pereira et al. (2007)
found oleuropein to be the major compound (about 73%) of the total identified
compounds and caffeic acid as minor compound (about 1% of total phenols with
water extract) whereas Meirinhos et al. (2005) reported flavonoids as the major
compounds (luteolin 4-O-glucoside as the most abundant) with water-methanol
extract.
1.6.1. Oleuropein
Oleuropein, a secoiridoid (monoterpene), is an ester of hydroxytyrosol with the
oleoside skeleton (Table 1.1). It is the chief biophenol in olive leaves (Le Tutour
and Guedon, 1992; Benavente-Garcıa et al., 2000; Soler-Rivas et al., 2000; Bouaziz
and Sayadi, 2005; Japón-Luján and Luque de Castro, 2006; Ranalli et al., 2006;
Pereira et al., 2007; Altıok et al., 2008; Malik and Bradford, 2008; Lee et al., 2009;
Ansari et al., 2011; Durlu-Özkaya and Özkaya, 2011; Hayes et al., 2011; Tayoub et
al., 2012). The pharmacological properties of oleuropein have been extensively
studied and it is considered responsible for most of the health promoting properties
of olive leaves. Initially, oleuropein was detected in olive fruit by Bourquelot and
Ventilesco in 1908 and its structure and the empirical formula C25H32O13 was
proposed in 1960 by Panizzi and co-workers, as a heterosidic ester of
hydroxytyrosol with β-glucosylated Oleoside-11-methyl ester (MacKellar et al.,
1973; Ranalli et al., 2006). Oleuropein gives rise to many compounds found in
olive fruit and leaves via aglycon through opening of the elenolic acid ring (Ansari
et al., 2011). Its quantity is almost negligible in olive oil as compared to olive
16
leaves, because of its extensive enzymatic degradation during oil extraction and low
partitioning in oil (Paiva-Martins and Pinto, 2008).
Oleuropein accounts for about 25% of the total biophenols of olive leaf (Benavente-
Garcıa et al., 2000). In fresh olive leaves, the concentration of oleuropein is 60–90
mg/g DM (Le Tutour and Guedon, 1992; Ryan et al., 2002b; Durlu-Özkaya and
Özkaya, 2011). The concentration of oleuropein is lower in ripe olives due to
hydrolysis and/or conversion to other compounds. During virgin oil extraction,
oleuropein is hydrolysed to a number of compounds including hydroxytyrosol,
elenolic acid, oleuropein aglycone, and glucose based on the hydrolysis conditions.
In addition to oleuropein, olive leaves also contain demethyloleuropein and
oleoside methyl ester (also known elenolic acid glucoside) (see Table 1.1). As the
plant matures, the concentrations of these two compounds increase and the
concentration of oleuropein decreases. This is possibly due to increased activity of
the hydrolytic enzymes during the maturation process, particularly esterases which
are responsible for the hydrolysis of the two ester bonds of oleuropein.
Demethyloleuropein has a free carboxylic group on the secoiridoid ring which
distinguishes it from oleuropein, whereas in the glucoside of the elenolic acid, the
carboxyl that esterifies the dihydroxy-phenyl-ethanol in the oleuropein has the free
functionality which differentiates it from oleuropein. Other compounds present in
olive leaves are ligstroside which has tyrosol residue rather than hydroxytyrosol
(Chinou, 2012); dimethylester of the oleoside in which two acidic functions of the
oleuropein esterified with the residue of methanol also known as glucoside of the
methylester of the elenolic acid (Gariboldi et al., 1986); and oleuropein isomer
known as oleuroside which is different from oleuropein in the exocyclic double
bond position (Kuwajima et al., 1988).
17
1.6.2. Olive leaf flavonoids
Olive leaf is a rich source of flavonoids (Table 1.1). Luteolin 4′-O-glucoside is the
major flavonoid present in olive leaf, ranging from 24–54% of total flavonoids
(Meirinhos et al., 2005). Other abundant flavonoids include apigenin, apigenin-7-
O-glucoside, apigenin-4′-O-rhamnosylglucoside, apigenin 7-O-rutinoside,
diosmetin, luteolin, luteolin 7,4-O-diglucoside, luteolin-7-O-glucoside,
chrysoeriol, chrysoeriol-7-O-glucoside, quercetin, quercitrin, quercetin-3-O-
rhamnoside, and rutin (Heimler et al., 1992; Pieroni et al., 1996; Meirinhos et al.,
2005). Flavonoids act as aldose reductase inhibitors thereby blocking the sorbitol
pathway that is involved in many problems associated with diabetes and they inhibit
cyclooxygenase and lipooxygenase enzymes which offer protection against cancer,
inflammation and cardiovascular diseases (Plazonić et al., 2009).

18
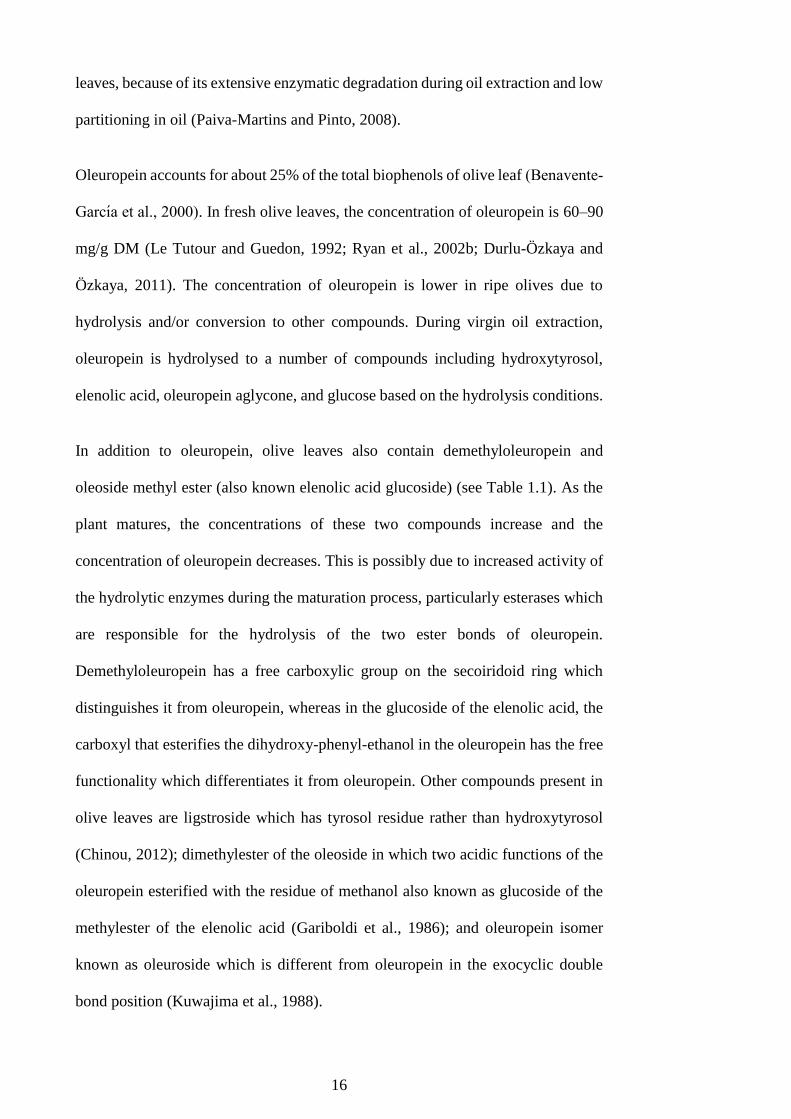
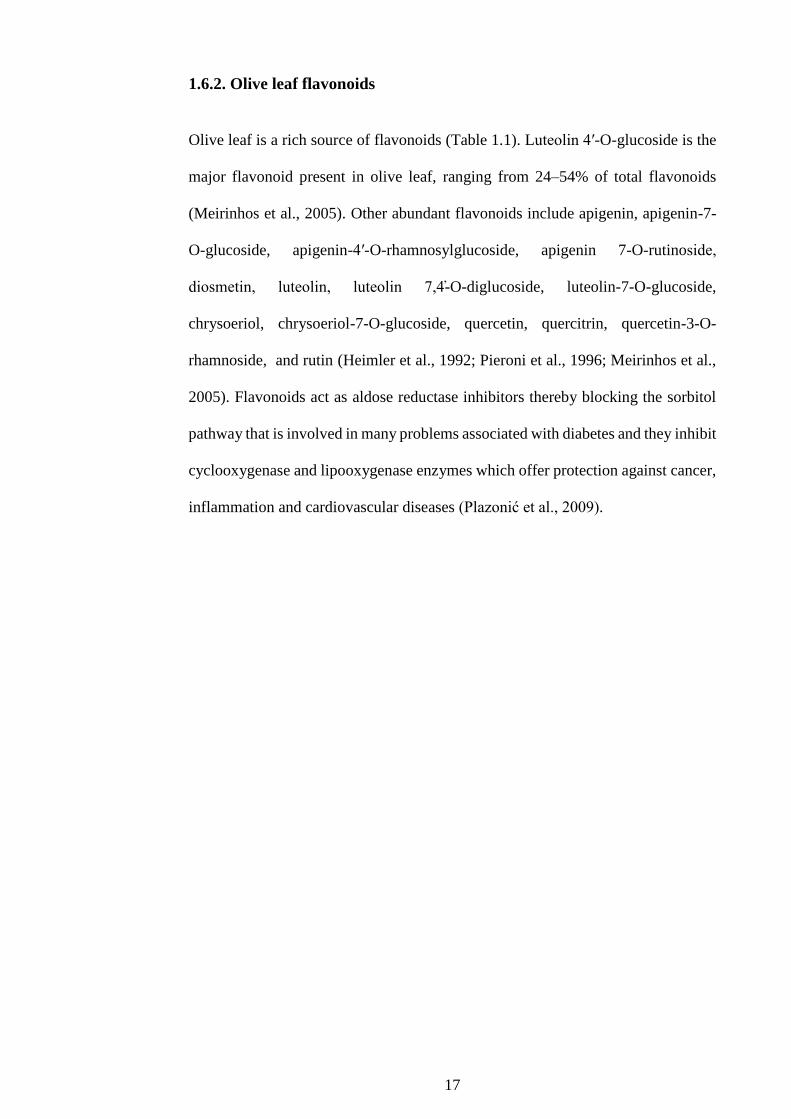
Table 1.1: Biophenols reported in olive leaves
Biophenol MW Structure UV spectrum (nm) Chromatography Reference
Apigenin 270
267,337 HPLC-DAD
LC-MS
Bouaziz and Sayadi (2005)
Apigenin-glucoside 266, 337 HPLC-UVD Rovellini, Azzolini, et al. (1997)
Apigenin-7-O-glucoside 432
266, 337 HPLC-DAD
LC-MS
Le Tutour and Guedon (1992); Bouaziz and
Sayadi (2005); Pereira et al. (2007); Altıok et
al. (2008); Dekanski et al. (2009)
Apigenin-7-glycosides HPLC Baldi et al. (1995)
Apigenin-7- rutinoside 578
267, 339 HPLC-DAD Le Tutour and Guedon (1992)
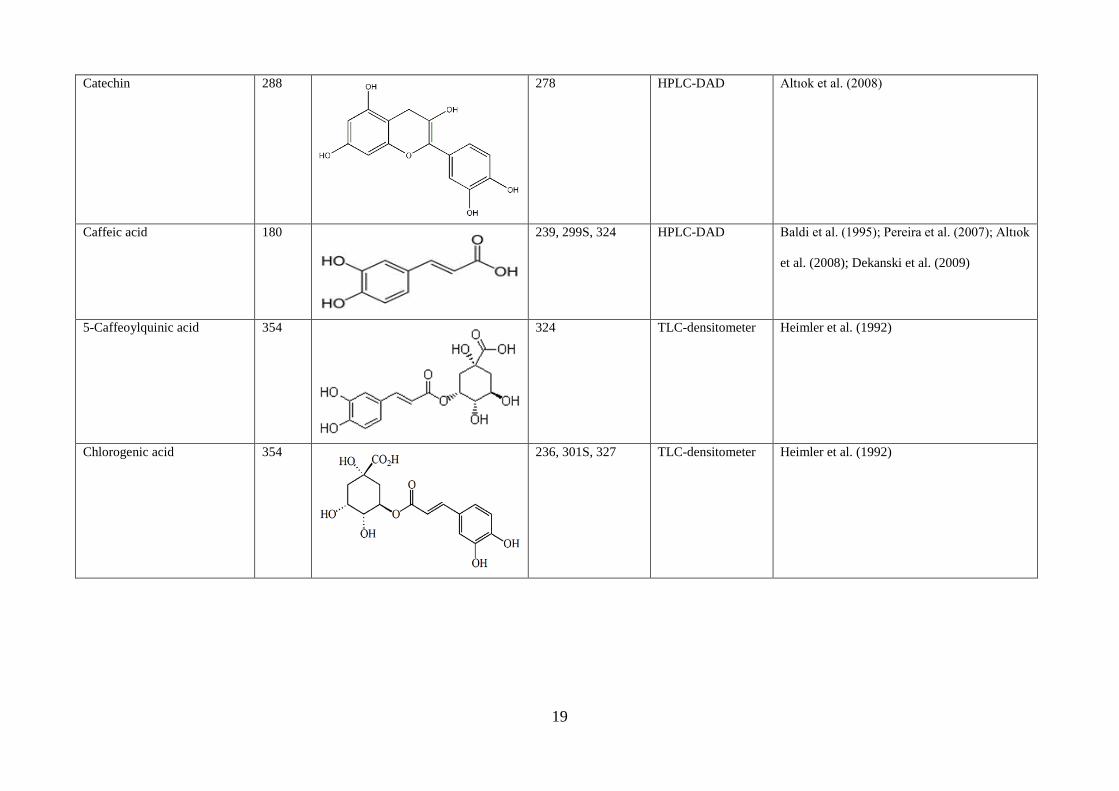
19
Catechin 288
278 HPLC-DAD Altıok et al. (2008)
Caffeic acid 180
239, 299S, 324 HPLC-DAD Baldi et al. (1995); Pereira et al. (2007); Altıok
et al. (2008); Dekanski et al. (2009)
5-Caffeoylquinic acid 354
324 TLC-densitometer Heimler et al. (1992)
Chlorogenic acid 354
236, 301S, 327 TLC-densitometer Heimler et al. (1992)
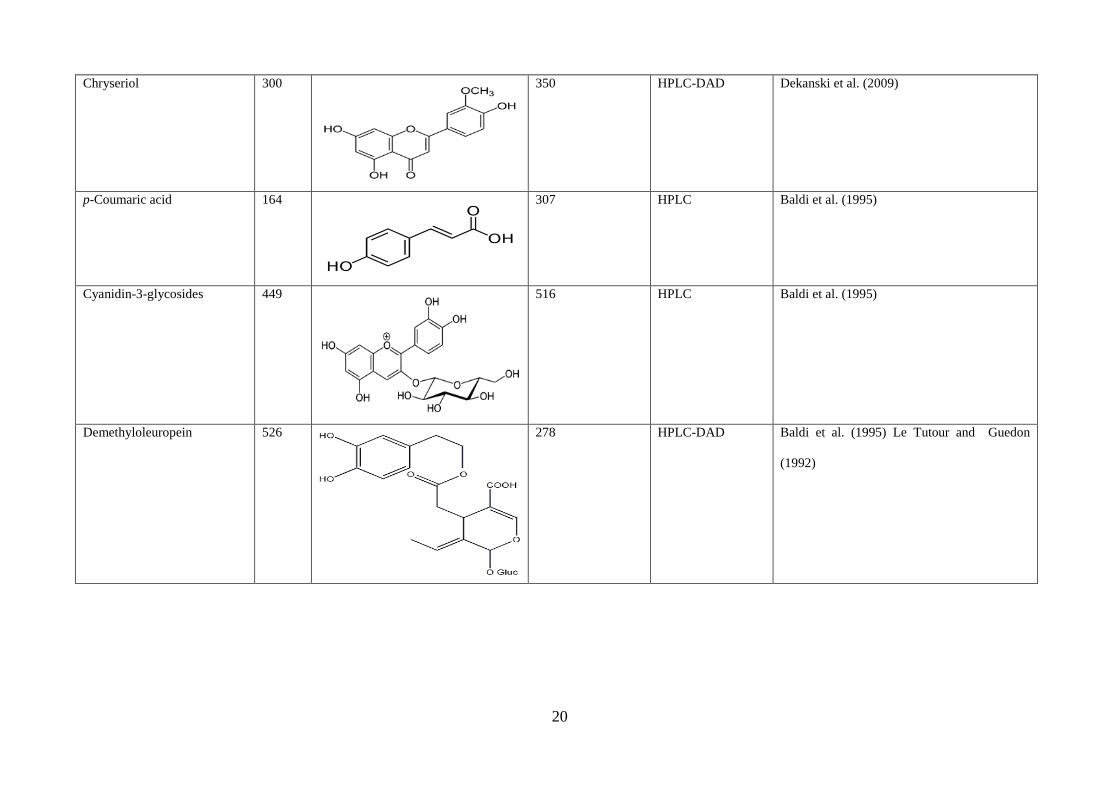
20
Chryseriol 300
350 HPLC-DAD Dekanski et al. (2009)
p-Coumaric acid 164
307 HPLC Baldi et al. (1995)
Cyanidin-3-glycosides 449
516 HPLC Baldi et al. (1995)
Demethyloleuropein 526
278 HPLC-DAD Baldi et al. (1995) Le Tutour and Guedon
(1992)

21
Elenolic acid 242
240 HPLC-DAD
LC-MS
Baldi et al. (1995); Agalias et al. (2005)
Hesperidin 610
287, 327 HPLC Baldi et al. (1995)
Hydroxytyrosol 154
280,349 HPLC-DAD
LC-MS
Gariboldi et al. (1986); Baldi et al. (1995);
Agalias et al. (2005); Altıok et al. (2008);
Papoti and Tsimidou (2009)
Ligstroside 524
240, 278 HPLC-DAD
CC
TLC
Gariboldi et al. (1986); Kuwajima et al. (1988);
Le Tutour and Guedon (1992); Limiroli et al.
(1996)
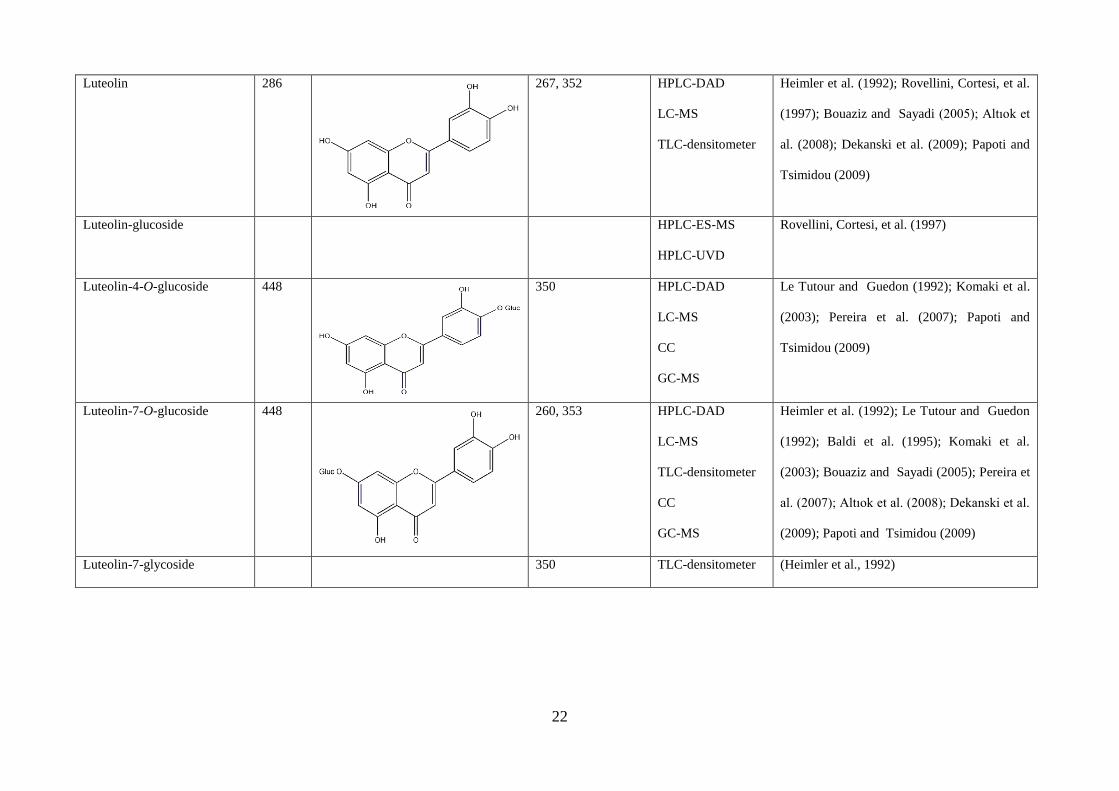
22
Luteolin 286
267, 352 HPLC-DAD
LC-MS
TLC-densitometer
Heimler et al. (1992); Rovellini, Cortesi, et al.
(1997); Bouaziz and Sayadi (2005); Altıok et
al. (2008); Dekanski et al. (2009); Papoti and
Tsimidou (2009)
Luteolin-glucoside HPLC-ES-MS
HPLC-UVD
Rovellini, Cortesi, et al. (1997)
Luteolin-4-O-glucoside 448
350 HPLC-DAD
LC-MS
CC
GC-MS
Le Tutour and Guedon (1992); Komaki et al.
(2003); Pereira et al. (2007); Papoti and
Tsimidou (2009)
Luteolin-7-O-glucoside 448
260, 353 HPLC-DAD
LC-MS
TLC-densitometer
CC
GC-MS
Heimler et al. (1992); Le Tutour and Guedon
(1992); Baldi et al. (1995); Komaki et al.
(2003); Bouaziz and Sayadi (2005); Pereira et
al. (2007); Altıok et al. (2008); Dekanski et al.
(2009); Papoti and Tsimidou (2009)
Luteolin-7-glycoside 350 TLC-densitometer (Heimler et al., 1992)

23
Luteolin-rutinoside 256,343 HPLC-ES-MS
HPLC-UVD
(Rovellini, Azzolini, et al., 1997)
Luteolin-7-O-rutinoside 594
256,343 HPLC-DAD
LC-MS
Le Tutour and Guedon (1992); Bouaziz and
Sayadi (2005)
Oleoside 390
220, 266 HPLC
CC
Gariboldi et al. (1986); Kuwajima et al. (1988)
Oleuropein 540
280 HPLC-DAD
LC-MS
CC
Gariboldi et al. (1986); Kuwajima et al. (1988);
Le Tutour and Guedon (1992); Baldi et al.
(1995); Agalias et al. (2005); Bouaziz and
Sayadi (2005); Pereira et al. (2007); Altıok et
al. (2008); Dekanski et al. (2009); Papoti and
Tsimidou (2009)

24
Oleuroside 540
280 HPLC-DAD
CC
Kuwajima et al. (1988); Le Tutour and Guedon
(1992)
Quercetin 302
255, 305S, 373 HPLC-DAD Dekanski et al. (2009)
Quercitin-3-rhamnoside 448
350 TLC-densitometer Heimler et al. (1992)
Quercitin-3-rutinoside (rutin) 610
233, 256, 300S, 356 HPLC-DAD
LC-MS
TLC-densitometer
Heimler et al. (1992); Le Tutour and Guedon
(1992); Bouaziz and Sayadi (2005); Pereira et
al. (2007); Altıok et al. (2008)

25
Tyrosol 138
275,349 HPLC-DAD
LC-MS
Agalias et al. (2005); Altıok et al. (2008)
Vanillic acid 168
260, 290 HPLC-DAD Altıok et al. (2008)
Vanillin 152
310 HPLC-DAD Altıok et al. (2008)
Verbascoside 624
300S, 334 HPLC-DAD
LC-MS
Gariboldi et al. (1986); Le Tutour and Guedon
(1992); Pereira et al. (2007); Altıok et al.
(2008); Papoti and Tsimidou (2009)
MW: molecular weight; HPLC-DAD: high performance liquid chromatography-diode array detection; LC-MS: liquid chromatography-mass
spectrometry UVD: ultraviolet detector; ES: electrospray; TLC: thin layer chromatography; CC: column chromatography; GC: gas chromatography.
26
1.6.3 Factors affecting the biophenol content of olive leaves
Like other natural products, the biophenol composition of leaves can vary due to
geographical location, plant nutrition, cultivar, physiology, environment, age or
stage of maturity, season, position on the tree, rootstock, agricultural practices and
pathological factors (Ryan and Robards, 1998; Obied et al., 2012), as well as the
extraction solvent and extraction method used. In addition, the biological cycle of
the olive tree, organ/tissue, variety and harvesting time have a significant
quantitative and qualitative impact on the phenolic composition of olive leaves.
Brahmi et al. (2013) found that total phenols, ortho-diphenols and total flavonoids
content were higher in mature leaves and unripe fruit than in growing leaves and
ripe fruit.
Sample preparation as well as sample preservation are very important factors for
accurate estimation of phenolic compounds. In many studies, samples have not been
analysed immediately after collection and this may result in the loss of some
valuable compounds (P. G. Waterman and Mole, 1994). According to Majors
(1999), approximately 30% of analytical error comes from sample preparation and
this step consumes about 60% of analysis time. Therefore, care must be taken in all
steps of extraction such as sample collection, sample preservation, sample
preparation, separation and detection of biophenols in order to achieve optimum
recovery of biophenols. For maximum recovery of biophenols from olive leaves
using the most appropriate extraction method and solvent is critical. The extract
should be uniform, having all components of interest and free from interfering
components.

27
The extraction solvent plays a fundamental role in the recovery process. Different
extraction solvents and extraction techniques were used for the recovery of
biophenols from olive leaves; in most studies extraction of fresh foliage or freeze-
dried material was done either with methanol or ethanol (Le Tutour and Guedon,
1992; Paiva-Martins and Gordon, 2001; Savournin et al., 2001; Briante et al., 2002;
Bouaziz and Sayadi, 2005; Malik and Bradford, 2008; Poudyal et al., 2010; Ahmad-
Qasem et al., 2013). Ethanol is the preferred solvent for food products; however,
80% methanol is considered the most effective solvent for olive leaf biophenols
(Malik and Bradford, 2008). In a few studies boiling water was also used for
extraction of biophenols (Pereira et al., 2007; Malik and Bradford, 2008). It is
believed that most of the phenolic compounds are mainly located in free form and
are easily extracted by alcoholic solvents (Hung and Duy, 2012). Phenolic acids are
mostly bound to cell wall through ester or glycosidic linkages (Ignat et al., 2011).
Thus, organic solvents will not be able to extract them; acid or base hydrolysis is
necessary to liberate these compounds. Lee et al., (2009) extracted olive leaves with
several solvents and evaluated phenolic content and composition of the extracts.
They obtained significant amounts of oleuropein and significantly higher phenolic
contents and total flavonoids in the olive leaves with 80% ethanol, butanol, and
ethyl acetate fractions as compared to hexane, chloroform and water fractions.
Solid–liquid extraction was the most commonly used technique but recently some
advanced techniques such as microwave-assisted extraction, supercritical fluid
extraction and pressurised liquid extraction have been used for the extraction of
biophenols from the olive leaves (Taamalli et al., 2012; Xynos et al., 2012). Brahmi,
et al. (2012a) used hydro-distillation for the extraction of volatile fractions from
fresh and dried olive leaves. Each method has resulted in different composition of
biophenols and even sometimes different compounds. When extracting biophenols

28
from olive leaves by solid-liquid extraction, many factors can contribute towards
the composition of biophenols in the extract including temperature at which
extraction is carried out, liquid–solid ratio, flow rate, time and particle size of the
sample material (Ignat et al., 2011).
Using different extraction solvents and different extraction methods can result in
extracts with different composition, quite variable yield of the biophenols and
subsequently different biological activities. There is no standard procedure
available for the extraction of biophenols that one can use, as phenolic compounds
are not uniformly distributed in plant tissues. They may be associated with
carbohydrates, proteins or structural components, moreover they may be heat stable
or volatile. Polarities of different phenolic compounds vary significantly, so
practically it is impossible to develop an ideal method for extraction of all phenolic
compounds with a single solvent system. Therefore, we should aim for an optimized
method of extraction that provide an optimum recovery that is suitable for the
purpose of the study.
1.7. Olive Leaves: Nutraceutical and Dietary Applications
Olive Leaves possess a myriad of claimed medicinal properties. They have been
consumed as fresh or dry powder, decoction, herbal tea, and liquid or dried extract
(Chinou, 2012) Olive leaves are also used as a food additive in the form of extract
or herbal tea to fortify functional food and to increase the antioxidant
content/functionality of food products (Ghanbari et al., 2012).
1.7.1. Olive leaf extract
Olive leaf extract (OLE) is usually a dark brown liquid prepared from the leaves
after drying and powdering. The use of OLE has increased in recent years, with
29
people consuming it for general wellbeing. It is marketed as a natural/herbal
supplement with wide ranging health benefits. It is rich in functional biophenols
that show some synergistic behaviour (Braun, 2005).
1.7.2. Fortification of olive oil /edible oils/ other food products with olive
leaves
Enrichment/fortification of edible oils with phenolic compounds derived from olive
leaves resulted in increased product overall quality, augmented its antioxidant
capacity, extended its shelf life and improved its sensory properties (Ranalli et al.,
2006; Paiva-Martins et al., 2007; Salta et al., 2007; Bouaziz et al., 2008; Japón-
Luján and Luque de Castro, 2008). Results from earlier studies are promising for
the use of olive leaves as an additive to enrich food products with biophenols. Food
or food products having low or no biophenol content can be enriched with
biophenols from olive leaves, which may result in improved stability and health
attributes.
1.7.3. Encapsulation of olive leaf extracts
Some people do not like to directly consume OLE due to the pungency of
biophenols, particularly oleuropein. Encapsulation increases the palatability and
stability of OLE. Encapsulation of OLE with chitosan microspheres or β-
cyclodextrin has been investigated. Interactions of biophenols with the chitosan
matrix were observed but the activity of phenolic compounds of OLE encapsulated
in the chitosan matrix was found to be retained even after spray-drying (Kosaraju
et al., 2006). When β-cyclodextrin is used, it forms a complex with OLE
components upon mixing in aqueous medium and enhances oxidative stability
30
during subsequent freeze-drying and under oxidative conditions (Mourtzinos et al.,
2007).
1.7.4. Antimicrobial food packaging
Antimicrobial packaging applications of OLE were reviewed by Erdohan and
Turhan (2011). Although usage of OLE as an antimicrobial substance for food
packaging is relatively new, great potential exists as this type of packaging results
in a more protected and safe food. Antimicrobial food packaging prevents the food
from spoilage by reducing the growth and number of food pathogens; it increases
the shelf life and maintains quality and safety of food products by extending the lag
phase. It has been demonstrated that methylcellulose, polylactic acid and
methylcellulose-polylactic acid films prepared with OLE as an antimicrobial food
packaging have a great potential to reduce post-process growth of Staphylococcus
aureus (Erdohan and Turhan, 2011).
1.8. Olive Leaves: Traditional and Folk Medicine
Olive leaves have been widely used in folk medicine in many different countries
(see Table 1.2). Conventionally, the boiling water extract of olive leaves which is
referred to as decoction has been used. Olive leaves first gained medical importance
in the 1800s, when Etienne Pallas, a French colonel reported the beneficial effects
of olive leaf tea. He isolated a crystallisable compound “vauqueline” and suggested
the fever lowering properties of olive leaf were due to this bitter substance (M.
Hansen and Verity, 2002). Spanish physicians prescribed olive leaves as a
“febrifuge” in the early 19th century and during the Spanish war of 1808-1813, the
French officer de Santé used them to treat cases of “intermittent fever”. In 1854,
Daniel Hanbury reported successful use of olive leaves tincture for fever in the
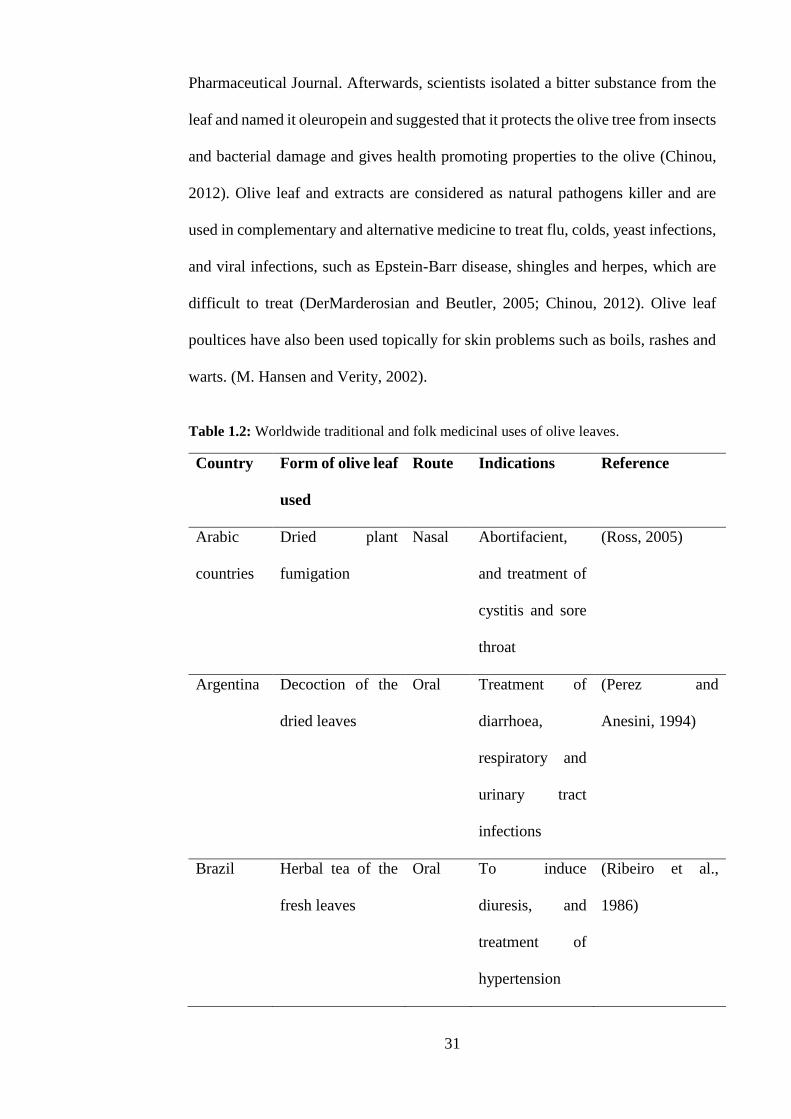
31
Pharmaceutical Journal. Afterwards, scientists isolated a bitter substance from the
leaf and named it oleuropein and suggested that it protects the olive tree from insects
and bacterial damage and gives health promoting properties to the olive (Chinou,
2012). Olive leaf and extracts are considered as natural pathogens killer and are
used in complementary and alternative medicine to treat flu, colds, yeast infections,
and viral infections, such as Epstein-Barr disease, shingles and herpes, which are
difficult to treat (DerMarderosian and Beutler, 2005; Chinou, 2012). Olive leaf
poultices have also been used topically for skin problems such as boils, rashes and
warts. (M. Hansen and Verity, 2002).
Table 1.2: Worldwide traditional and folk medicinal uses of olive leaves.
Country Form of olive leaf
used
Route Indications Reference
Arabic
countries
Dried plant
fumigation
Nasal Abortifacient,
and treatment of
cystitis and sore
throat
(Ross, 2005)
Argentina Decoction of the
dried leaves
Oral Treatment of
diarrhoea,
respiratory and
urinary tract
infections
(Perez and
Anesini, 1994)
Brazil Herbal tea of the
fresh leaves
Oral To induce
diuresis, and
treatment of
hypertension
(Ribeiro et al.,
1986)
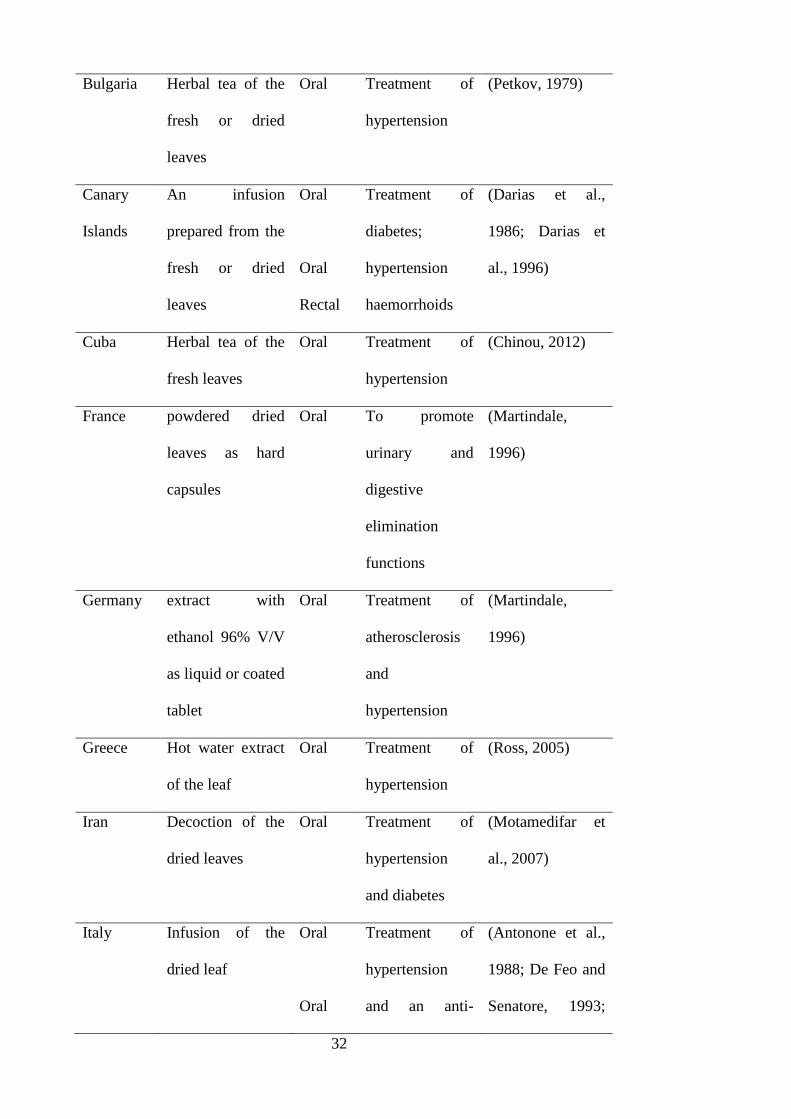
32
Bulgaria Herbal tea of the
fresh or dried
leaves
Oral Treatment of
hypertension
(Petkov, 1979)
Canary
Islands
An infusion
prepared from the
fresh or dried
leaves
Oral
Oral
Rectal
Treatment of
diabetes;
hypertension
haemorrhoids
(Darias et al.,
1986; Darias et
al., 1996)
Cuba Herbal tea of the
fresh leaves
Oral
Treatment of
hypertension
(Chinou, 2012)
France powdered dried
leaves as hard
capsules
Oral To promote
urinary and
digestive
elimination
functions
(Martindale,
1996)
Germany extract with
ethanol 96% V/V
as liquid or coated
tablet
Oral Treatment of
atherosclerosis
and
hypertension
(Martindale,
1996)
Greece Hot water extract
of the leaf
Oral Treatment of
hypertension
(Ross, 2005)
Iran Decoction of the
dried leaves
Oral Treatment of
hypertension
and diabetes
(Motamedifar et
al., 2007)
Italy Infusion of the
dried leaf
Oral
Oral
Treatment of
hypertension
and an anti-
(Antonone et al.,
1988; De Feo and
Senatore, 1993;

33
Infusion of the
fresh leaf
Topical
inflammatory;
treatment for
hypertension;
for wound
healing,
emollient for
ingrown nails
and to restore
epithelium
Pieroni et al.,
1996)
Madeira Infusion of leaves Oral Treatment of
hypertension
(Rivera and Obon,
1995)
Mexico Decoction of dried
leaves
Oral Treatment of
diabetes
(Alarcon-
Aguilara et al.,
1998)
Morocco Leaves and
essential oil from
the leaves
Oral
Topical
Treatment of
stomach and
intestinal disease
and as a mouth
cleanser. Also
for treatment of
constipation and
liver pain
As a tonic for
hairs
(Bellakhdar et al.,
1991)
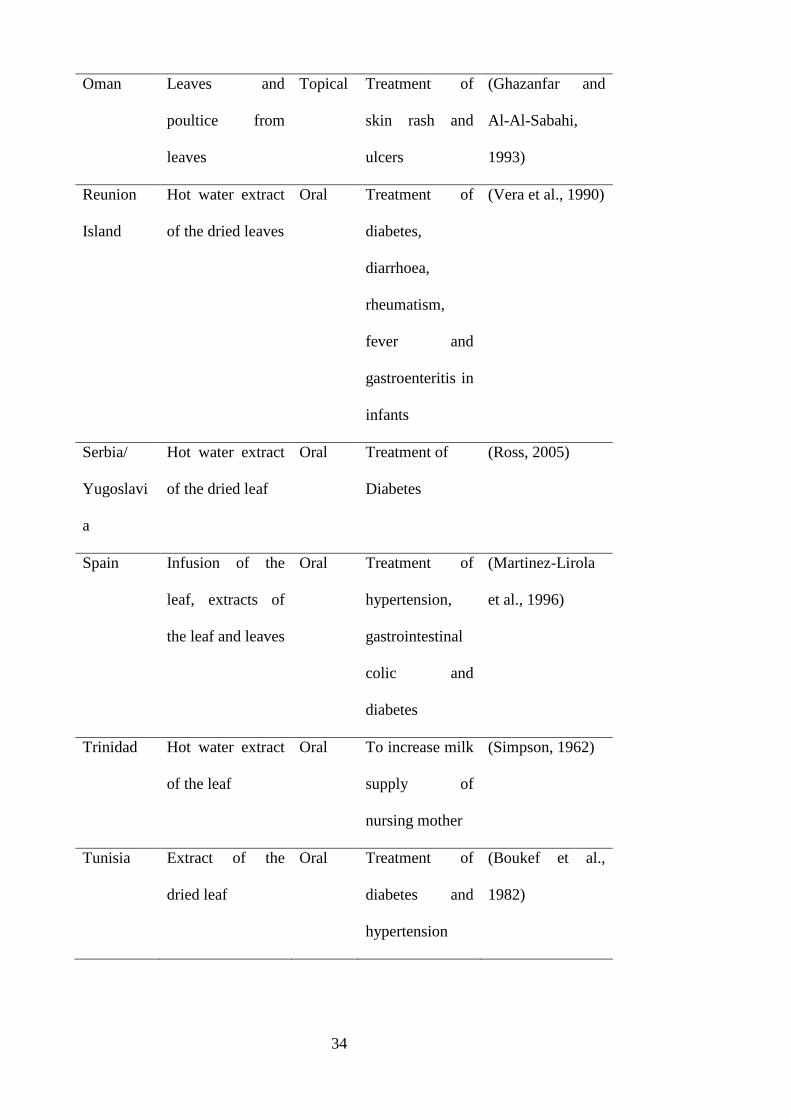
34
Oman Leaves and
poultice from
leaves
Topical Treatment of
skin rash and
ulcers
(Ghazanfar and
Al-Al-Sabahi,
1993)
Reunion
Island
Hot water extract
of the dried leaves
Oral Treatment of
diabetes,
diarrhoea,
rheumatism,
fever and
gastroenteritis in
infants
(Vera et al., 1990)
Serbia/
Yugoslavi
a
Hot water extract
of the dried leaf
Oral Treatment of
Diabetes
(Ross, 2005)
Spain Infusion of the
leaf, extracts of
the leaf and leaves
Oral
Treatment of
hypertension,
gastrointestinal
colic and
diabetes
(Martinez-Lirola
et al., 1996)
Trinidad Hot water extract
of the leaf
Oral To increase milk
supply of
nursing mother
(Simpson, 1962)
Tunisia Extract of the
dried leaf
Oral Treatment of
diabetes and
hypertension
(Boukef et al.,
1982)
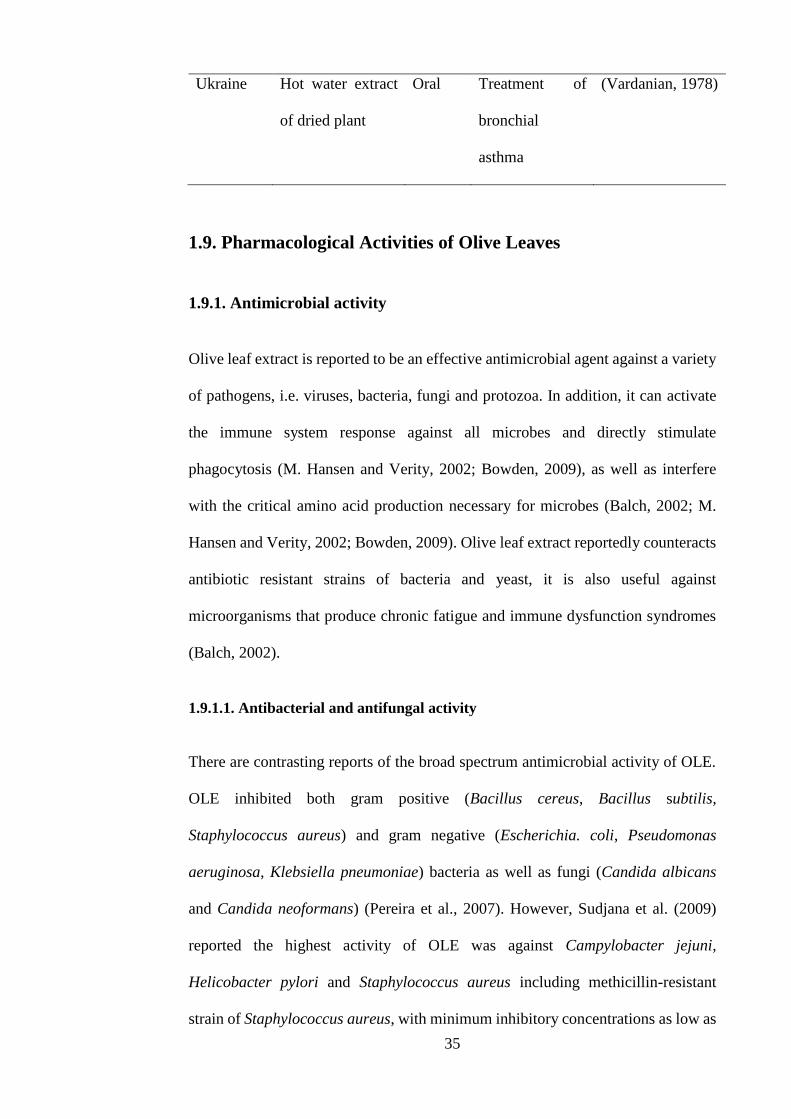
35
Ukraine Hot water extract
of dried plant
Oral Treatment of
bronchial
asthma
(Vardanian, 1978)
1.9. Pharmacological Activities of Olive Leaves
1.9.1. Antimicrobial activity
Olive leaf extract is reported to be an effective antimicrobial agent against a variety
of pathogens, i.e. viruses, bacteria, fungi and protozoa. In addition, it can activate
the immune system response against all microbes and directly stimulate
phagocytosis (M. Hansen and Verity, 2002; Bowden, 2009), as well as interfere
with the critical amino acid production necessary for microbes (Balch, 2002; M.
Hansen and Verity, 2002; Bowden, 2009). Olive leaf extract reportedly counteracts
antibiotic resistant strains of bacteria and yeast, it is also useful against
microorganisms that produce chronic fatigue and immune dysfunction syndromes
(Balch, 2002).
1.9.1.1. Antibacterial and antifungal activity
There are contrasting reports of the broad spectrum antimicrobial activity of OLE.
OLE inhibited both gram positive (Bacillus cereus, Bacillus subtilis,
Staphylococcus aureus) and gram negative (Escherichia. coli, Pseudomonas
aeruginosa, Klebsiella pneumoniae) bacteria as well as fungi (Candida albicans
and Candida neoformans) (Pereira et al., 2007). However, Sudjana et al. (2009)
reported the highest activity of OLE was against Campylobacter jejuni,
Helicobacter pylori and Staphylococcus aureus including methicillin-resistant
strain of Staphylococcus aureus, with minimum inhibitory concentrations as low as

36
0.31–0.78% (v/v); least activity was observed against Bacillus subtilis, Candida
spp., Escherichia coli, Klebsiella pneumoniae, Pseudomonas aeruginosa and
Serratia marcescens, with minimum inhibitory concentrations more than 50%.
When individual biophenols were studied for antimicrobial activity, (Lee and Lee,
2010) found that oleuropein demonstrated strong growth inhibition against
Staphylococcus enteritidis but had no activity against Staphylococcus aureus.
Caffeic acid had moderate growth inhibition against Bacillus cereus, Escherichia
coli, and Staphylococcus enteritidis, but no activity against Staphylococcus aureus.
Rutin and vanillin showed no antimicrobial activity against Bacillus cereus,
Escherichia coli, Staphylococcus enteritidis, or Staphylococcus aureus. Elenolic
acid has also been proposed to possess antimicrobial properties; however, while it
can kill many kinds of viruses, protozoa and bacteria in vitro, after ingestion this
compound immediately binds to proteins in blood serum, making it ineffective in
vivo (Balch, 2002). (Lee and Lee, 2010) found that the combined phenolics mixture
of OLE had greater inhibitory effects against Bacillus cereus and Staphylococcus
enteritidis than the individual phenols, suggesting some synergistic effects between
OLE phytomolecules.
1.9.1.2. Antiviral activity
The exact mechanism of OLE’s antiviral activity is still not clear but several
mechanisms are thought to be involved in either blocking the entry of virus to the
cells by preventing their attachment and absorption or interference with certain
amino acids production, preventing virus budding, shedding or penetration into the
infected cells or preventing the replication process (Lee-Huang et al., 2003; Micol
et al., 2005; Bao et al., 2007; Lee-Huang et al., 2007; Motamedifar et al., 2007).
Olive leaf extract inhibits viruses at the early stages of replication, probably via

37
blocking of viral envelope fusion (Micol et al., 2005). It is effective against
retroviruses and has shown antiviral activities against HIV-1 virus in cell culture
and inhibited HIV-1 replication and cell-to-cell transmission of HIV in a dose
dependent manner (Lee-Huang et al., 2003). Olive leaf extract has been found to be
effective against herpes virus, clearing the lesions and blisters (Privitera et al., 2009)
in 36 to 48 h in three out of six participants in a clinical study, with the remaining
three participants responded better when given a higher dose (Fredrickson, 2000;
Balch, 2002). The time at which OLE is administered impacts on its effectiveness;
OLE showed no antiviral activities when applied to cell culture infected with
Herpes simplex virus-1 (HSV-1) 1 h before challenge whereas it showed anti HSV-
1 activities at concentrations >1 mg/mL when applied to cells 1 h after the virus
infection (Motamedifar et al., 2007). When OLE was added to cell monolayers 36
h post-infection with haemorrhagic septicaemia virus (VHSV), virus titres and viral
protein accumulation was decreased in a dose dependent manner (Micol et al.,
2005).
When individual biophenols were studied for antiviral activity, oleuropein showed
significant antiviral activity against respiratory syncytial virus and parainfluenza
type 3 virus (Ma et al., 2001) and in a U.S. patent it has been claimed to have potent
antiviral activities against herpes virus, hepatitis virus, rotavirus, bovine rhinovirus,
canine parvovirus, and feline leukaemia virus (Fredrickson, 2000). Oleuropein and
hydroxytyrosol are HIV-1 inhibitors, effective against viral fusion and integration.
They act both extra- and intra-cellularly. Both oleuropein and hydroxytyrosol bind
to the conserved hydrophobic pocket on the surface of the central trimeric coiled-
coil of the HIV-gp41 fusion complex domain. Both compounds are active against
multiple stages of the HIV-1 life cycle, inhibiting cell-to-cell HIV-1 transmission
and viral core antigen p24 production (Lee-Huang et al., 2007). Oleuropein has also

38
inhibited in vitro infectivity of the VHSV (Micol et al., 2005). It has been suggested
that the virucidal activity of olive leaves is more likely due to its ability to prevent
the entry of virus into the cells (Motamedifar et al., 2007) and interaction of OLE
and oleuropein with the viral envelope (Micol et al., 2005).
1.9.2. Immunoregulatory effects
There are many claims that OLE boosts the immune system (Walker, 1997; Balch,
2002; M. Hansen and Verity, 2002; Bowden, 2009). TNF-α production reversibly
stimulates the immune cells to produce more mediators, therefore the suppression
of TNF-α production may have a beneficial effect on the anti-allergic reaction
(Nishibe et al., 2001). Oleuropein has been shown to inhibit TNF-α production,
while luteolin 4-O-glucoside has not shown any inhibitory effects on the production
of tumor necrosis factor when rat basophilic leukaemia cells were studied, yet it
showed a strong inhibitory effect on β-hexosaminidase release (Nishibe et al.,
2001). Since both TNF-α production and β-hexosaminidase release are linked to
allergic reactions, there is potential that OLE can be used in the treatment of allergic
reactions and have beneficial effects on the immune system (Nishibe et al., 2001).
1.9.3. Cardiovascular protective activities
It has been established that consuming the “Mediterranean” diet which is rich in
biophenols is associated with a reduced incidence of cardiovascular diseases
(Visioli and Galli, 2002; Visioli et al., 2002; Singh et al., 2008). It has been
proposed that polyphenols impede with biochemical events that are associated in
atherosclerotic disease (Visioli et al., 1994). Biophenols may protect the
cardiovascular system from free radical damage by scavenging reactive oxygen
species (ROS). They are believed to inhibit the oxidation process of low-density

39
lipoprotein (LDL) cholesterol (Diaz et al., 1997) which is responsible for
atherosclerosis. In this way, olive leaf biophenols can play a vital role in decreasing
the risk of cardiovascular diseases. Other cardioprotective effects of OLE are due
to its effects on adrenaline (Somova et al., 2004).
Oleuropein has been shown to increase coronary flow and left intraventricular
pressure in rabbit myocardium (Bruneton, 1995). It has a direct cardioprotective
effect in the acute events that follow coronary occlusion probably because of its
antioxidant properties (Manna et al., 2004). Oleuropein is involved in inhibition of
5-lipooxygenase and 12-lipooxygenase and eicosanoid production (Visioli and
Galli, 2002) and it prevents the membrane lipid peroxidation and protects against
oxidative myocardial injury induced by ischemia and reperfusion. A significant
reduction of oxidised glutathione was observed in ischemic hearts pre-treated with
oleuropein, when the protective effect of oleuropein against the post-ischemic
oxidative burst was investigated by measuring the release of oxidised glutathione
which is a sensitive marker of heart's exposure to oxidative stress in the coronary
effluent (Manna et al., 2004). Hydroxytyrosol has also been found to be effective
in reducing cardiovascular diseases (Fki et al., 2007).
1.9.4. Antiplatelet activity
As a consequence of the antiplatelet effects of olive leaves, blood becomes less
viscous, and thus circulation may be improved, which may offer a degree of
protection from thrombosis and other cardiovascular diseases (Singh et al., 2008).
Oleuropein is involved in inhibition of platelet aggregation by producing
thromboxane A2 (Petroni et al., 1995). When the platelet aggregation and ATP
release function was investigated in healthy fasting, non-smoking, male subjects,
inhibition of platelet aggregation was noticed with olive leaf biophenols possibly
40
via their H2O2 scavenging properties as platelet aggregation is associated with a
burst of H2O2. It was also observed that the platelet inhibition with OLE was greater
than that of oleuropein alone due to the synergistic effect of the other biophenols
found in OLE; catechin can also inhibit platelet function and hydroxytyrosol,
caffeic acid, luteolin and rutin have been noted for their antioxidant activity and
H2O2 scavenging ability (Singh et al., 2008). Hydroxytyrosol has also been reported
to possess antithrombotic activities (Benavente-Garcıa et al., 2000).
1.9.5. Hypocholesterolaemic effects
Olive leaves are believed to possess cholesterol lowering properties. In a Dahl salt-
sensitive (DSS), insulin-resistant rat, OLE prevented the development of
atherosclerosis (Somova et al., 2003). It has been suggested that oleuropein,
oleuropein aglycone and hydroxytyrosol-rich extracts might be responsible for the
hypocholesterolaemic effect of olive leaves (Fki et al., 2007; Jemai et al., 2008). In
rats fed a cholesterol-rich diet for 16 weeks, an increase in the level of high-density
lipoprotein cholesterol and significant reduction in the levels of total cholesterol,
triglycerides and low-density lipoprotein (LDL) cholesterol was observed after the
administration of biophenol-rich olive leaf extracts. (Jemai et al., 2008). In an in-
vitro experiment oleuropein and hydroxytyrosol effectively inhibited CuSO4-
induced LDL oxidation (Visioli et al., 1994).
1.9.6. Blood pressure regulation
The hypotensive effect of olive leaves is said to be because of its vasodilator activity
(Zarzuelo et al., 1991). Olive leaf extract has been shown to lower blood pressure
and increase blood flow in the coronary arteries (Chevallier, 1996; Khayyal et al.,
2002). It also prevented the development of severe hypertension in a DSS, insulin-
41
resistant rat (Somova et al., 2003) whereas in L–NAME (NG-nitro-L-arginine
methyl ester) induced hypotensive rats OLE resulted in normalisation of the blood
pressure (Khayyal et al., 2002). In voltage clamp experiments with cultured
neonatal rat cardiomyocytes, OLE suppressed the L-type calcium channel directly
and reversibly, with an increase in relative coronary flow and a decrease in systolic
left ventricular pressure and heart rate observed (Scheffler et al., 2008). Olive leaves
decoction produced relaxation of the aorta in rats, while oleuropein and
verbascoside reduced blood pressure (Zarzuelo et al., 1991). Oleanolic acid and
ursolic acid isolated from wild African olive leaves have also been reported to have
hypotensive effects (Somova et al., 2004). There is; however, little if any clinical
data on olive leaves as a blood pressure regulatory agent.
1.9.7. Anticancer and chemopreventive activities
Olive leaf extract has an inductive effect on glutathione S-transferases and therefore
may have beneficial effects on cancer. Glutathione S-transferases are a group of
phase II metabolising enzymes that can play a vital role in the detoxification of
chemical carcinogens. They catalyse the conjugation reaction of electrophilic
hydrophobic compounds with reduced glutathione, as reactive forms of chemical
carcinogens are electrophiles (Han et al., 2001). It has been suggested that that
enhancement of the activity of glutathione S-transferases could increase the
capacity of the organism to withstand the neoplastic effects of chemical
carcinogens. In a study on mice, OLE produced an inductive effect on liver
glutathione S-transferases. Oleuropein also produced the same effect in a non-dose
dependent manner but the effect produced by OLE was stronger than isolated
oleuropein, possibly due to synergistic effects (Han et al., 2001). Oleuropein has
demonstrated anti-tumour and cytoskeleton disruptor activities (Babich and Visioli,
42
2003; Hamdi and Castellon, 2005). It also acts as mechanism-based inhibitors of
various cytochrome P450 enzymes (CYPs) (Zhou et al., 2007), which play an
important role in procarcinogen activation. The inhibition of CYPs may decrease
the formation of toxic metabolites (Zhou et al., 2007). The proposed therapeutic
effects of OLE on cancer cells are not only apoptosis but also the induction of
differentiation. It has been shown to have leukaemia protective effects on the human
chronic myeloid leukaemia cells and inhibited the proliferation of K562 cells by
inducing cell cycle arrest, apoptosis, and differentiation toward the monocyte
lineage (Samet et al., 2014).
1.9.8. Renal health promotion
In Europe, olive leaves have been traditionally used as mild diuretic and to treat
cystitis (Chevallier, 1996). Dried as well as fresh olive leaves have been used as
diuretic (Somova et al., 2003), with demonstrated diuretic activity in rats (Ribeiro
et al., 1986; Somova et al., 2003) and humans (Capretti and Bonaconza, 1949). In
a DSS insulin-resistant rat, OLE, oleanolic acid, and ursolic acid all showed potent
diuretic activity and comparable natriuretic and saluretic activity to that of
hydrochlorothiazide. However, no carbonic anhydrase inhibition was detected
(Somova et al., 2003). In a very early study, intake of an olive leaf infusion or
decoction increased urinary output in humans without any effect on blood Na, K or
chloride concentrations (Capretti and Bonaconza, 1949). Although OLE is used as
diuretic in folk medicine and thought to have role in renal health promotion there is
little if any clinical data available.

43
1.9.9. Gastro-protective effects
Gastro-protection is the protection of gastric mucosa from various irritants; it is not
the inhibition of gastric acid secretion. Dekanski et al. (2009) found that gastric
lesions induced by absolute ethanol were significantly attenuated due to pre-
treatment with OLE at all doses tested (40, 80 and 120 mg/kg) and suggested that
the gastro-protective potential of OLE was most probably due to the ability of its
biophenols to scavenge ROS which are produced in ethanol induced gastric injury.
They also suggested the positive response to OLE was possibly related to its ability
to maintain the integrity of the cell membrane through its anti-lipid peroxidative
activity, as well as its ability to strengthen the mucosal barrier.
1.9.10. Antioxidant and free radical scavenging effects
Oxidative stress occurs when there is an imbalance between the production of free
radicals and the biological system’s ability to detoxify these noxious species or
easily repair the resulting damage (Federico et al., 2007; Obied, 2013). By
definition, free radicals are reactive molecular species which have single electron
in an outer orbit in an energy excited state. This is thenreleased upon their reactions
with other molecules like proteins, lipids, carbohydrates and nucleic acids (K.
Rahman, 2007). As a consequence of oxidative stress, cellular proteins, lipids and
nucleic acids are damaged which results in vascular dysfunction (Johansen et al.,
2005). In aerobic organisms, ROS are produced as by-products and can initiate a
chain of damage through autocatalytic reactions and converting the substrate
molecules into free radicals as well. Various stimulants are involved that favour
free radicals production in the human body. These include physical stress, toxic
chemical wastes, occupational exposure to chemically and structurally diverse
environmental pollutants, pesticides, air pollutants and radiation. ROS can be
44
generated through different mechanisms exogenously as well as endogenously. The
major reported mechanisms are from atmosphere as pollutants, UV light irradiation
and by X-rays and gamma rays, metal catalysed reactions, during inflammation by
neutrophils and macrophages and mitochondrial catalysed electron transport
reactions (K. Rahman, 2007). Accumulating evidence suggests a pivotal role for
oxidative stress in aging and age-related degenerative disorders (Baynes and
Thorpe, 1999; Federico et al., 2007; K. Rahman, 2007; Khansari et al., 2009). Free
radicals, mainly ROS and reactive nitrogen species (RNS) are thought to play an
important role in the development of certain forms of cancers, cardiovascular
diseases, diabetes, rheumatoid arthritis, and neurodegenerative diseases like
Alzheimer’s disease, Huntington’s disease and Parkinson’s disease (Baynes and
Thorpe, 1999; K. Rahman, 2007).
Antioxidants can be endogenous (produced in the body) or exogenous (taken as a
dietary supplement). Consuming antioxidant-rich diets may inhibit oxidation and
can delay atherosclerosis by scavenging H2O2. Hydrogen peroxide activates the
enzyme phospholipase C which brings about arachidonic acid metabolism and can
lead to platelet aggregation (Singh et al., 2008). There is a growing interest in the
use of natural antioxidants as bioactive components in food, and such foods have
been termed as functional foods. Many researchers have reviewed and
demonstrated the ability of olive biophenols to modulate oxidative stress through
different mechanisms including free radical scavenging, metal chelating or
stimulating antioxidant enzymes (Visioli et al., 2002; Obied et al., 2009; Servili et
al., 2009; Leopoldini et al., 2011).
The active phenolic compounds in OLE which are known for their capacity to
scavenge H2O2 are part of the secoiridoid family (Singh et al., 2008). The
antioxidant capacity of OLE is higher than that of vitamin C, vitamin E or

45
hydroxytyrosol. Although hydroxytyrosol is a strong antioxidant, the probable
reason for its lower antioxidant activity as compare to OLE may be the synergistic
effects of flavonoids, simple phenols and the high oleuropein content in OLE. The
antioxidant activity of flavonoids such as rutin, catechin and luteolin has been
shown, in vitro, to be almost 2.5 times higher than vitamins C and E (Benavente-
Garcıa et al., 2000). In another study, Le Tutour and Guedon (1992) found OLE,
oleuropein and hydroxytyrosol are more effective than vitamin E in extending the
induction period for oxidation. They concluded that OLE and related ortho-
diphenolic compounds can display a high degree of antioxidant activity and react
with more than two peroxy radicals per molecule, and the higher antioxidat
properties of OLE are due to their high oleuropein content and also to a lesser
amount of flavonoids. However, oleuropein has lower antioxidant activity than
OLE (Benavente-Garcıa et al., 2000; Benavente-Garcia et al., 2002; M. Hansen and
Verity, 2002; Singh et al., 2008). In a study using rats, scientists found that
oleuropein-rich extracts from olive leaves and their enzymatic and acid
hydrolysates, rich in oleuropein aglycone and hydroxytyrosol, significantly
decreased thiobarbituric acid reactive substances content of liver, heart, kidneys
and aorta, increased the activities of superoxide dismutase and liver catalase, as well
as improved the serum antioxidant potential (Jemai et al., 2008). It was suggested
that oleuropein, oleuropein aglycone and hydroxytyrosol-rich extracts can delay the
lipid peroxidation process and increase the activity of antioxidant enzymes.
1.9.11. Anti-inflammatory effects
Oxidative stress plays a vital role in inflammatory processes as it activates nuclear
factor kappa B (NF-κB), activator protein-1 (AP-1) transcription factors and nuclear
histone acetylation and deacetylation in inflammatory diseases (I. Rahman et al.,

46
2006; Obied et al., 2012). In an inflammatory response, cyclooxygenase and
lipooxygenase convert arachidonic acid to compounds such as prostaglandins,
thromboxanes, prostacyclin and leukotrienes that produce inflammatory symptoms
and pain (Obied et al., 2012). Biophenols possess anti-inflammatory activity and
act as modifiers of signal transduction pathways, modulate pro-inflammatory gene
expression and important cellular signalling processes (I. Rahman et al., 2006;
Santangelo et al., 2007). It has been proposed that these anti-inflammatory effects
are due to various mechanisms including: (i) scavenging effect of ROS directly or
via glutathione peroxidase activity and modulation of nuclear redox factor
activation; (ii) inhibition of pro-inflammatory enzymes, such as COX-2,
lipooxygenase and inducible nitric oxide synthase (iNOS); (iii) down regulation of
various pro-inflammatory cytokines such as tumour necrosis factor alpha (TNF-α),
chemokines and interleukins (IL-1β, IL-6, IL-8); (iv) inhibition of NF-κB, AP-1,
phosphoinositide 3-kinase and tyrosine kinases and (v) monocyte chemotactic
protein-1 (I. Rahman et al., 2006; Santangelo et al., 2007; Obied et al., 2012).
Hydroxytyrosol has been shown to lower the production of pro-inflammatory and
prothrombotic mediators and improves plasma antioxidant capacity in laboratory
animals (Fki et al., 2007). In diet-induced obese and diabetic rats, oleuropein and
hydroxytyrosol were found to reverse chronic inflammation and oxidative stress
without changing blood pressure (Poudyal et al., 2010). In rats, OLE showed
protective effects against carrageenan-induced paw oedema (Fehri et al., 1996).
Zaslaver et al. (2005) evaluated the modulator effect of olive leaves on nitric oxide
production and oxidative status in epithelial lung and suggested that olive leaves
may have a therapeutic potential in the treatment of inflammatory diseases.

47
1.9.12. Anti-diabetic activities
Diabetes mellitus is a chronic condition characterised by high level of blood
glucose. It is a metabolic disorder with disturbances in carbohydrate, fat, and
protein metabolism due to relative and/or absolute deficiency in insulin (Rydén et
al., 2007). Insulin is a hormone that is required for the uptake of glucose into tissues
but in diabetic patients glucose is not taken up properly and remains in circulation,
hyperglycaemia (International Diabetes Federation, 2015). Although it does not
have serious acute effects, hyperglycemia has deleterious effects on the long run. It
promotes the production of advanced glycation end products and uncontrollable
free radicals. This in turn creates chronic oxidative stress which leads to all the
serious complications of diabetes e.g. cardiovascular problems, kidney damage,
retinal damage, nerve damage, and blood vessel damage (Nwose et al., 2007).
Prediabetes occurs when blood glucose concentrations are higher than normal but
not high enough to be diagnosed as diabetes. It is also known as impaired glucose
tolerance (IGT) and impaired fasting glucose (IFG) (Twigg et al., 2007; Tabák et
al., 2012). Impaired glucose tolerance is defined as high blood glucose
concentrations after eating; whereas IFG is defined as high blood glucose
concentrations after a period of fasting. Prediabetes is associated with obesity, aging
and shares many characteristics with type 2 diabetes. In prediabetes, insulin is also
not working or not used effectively as in type 2 diabetes (Twigg et al., 2007; Tabák
et al., 2012). Prediabetes is diagnosed from the results of an oral glucose tolerance
test (OGTT) or glycated haemoglobin (HbA1c). It is not true that all people with
IGT will develop diabetes but they are at high risk of developing type 2 diabetes;
they can return to normal blood glucose concentrations. However, about 40–50%
of IGT subjects do develop type 2 diabetes (DeFronzo and Abdul-Ghani, 2011).
Shaw et al. (1999) reported that for more than one-third of people with IGT, their
48
blood glucose concentrations will return to normal over a period of several years.
Prediabetes is not only a risk factor for type 2 diabetes but it is also risk factor for
developing cardiovascular diseases (Tominaga et al., 1999).
The development of type 2 diabetes from prediabetes can be prevented through
lifestyle and pharmacological interventions. Progression from IGT to Type 2
diabetes can be prevented through early pharmacological intervention with oral
antidiabetic agents that improve insulin sensitivity and preserve β-cell function
(DeFronzo and Abdul-Ghani, 2011). There is also evidence that a healthy diet and
physical exercise prevent the progression to diabetes; an intensive diet intervention
soon after diagnosis can improve glycaemic control (Andrews et al., 2011).
Olive leaves have been used as a medicinal herb to treat diabetic hyperglycaemia
for a long time (Komaki et al., 2003; El and Karakaya, 2009; Boaz et al., 2011;
Cumaoğlu et al., 2011; Ghanbari et al., 2012), and the antidiabetic and
hypoglycaemic activities of olive leaves have been investigated in many studies
(Gonzalez et al., 1992; Komaki et al., 2003; Al-Azzawie and Alhamdani, 2006;
Sato et al., 2007; Eidi et al., 2009; Cumaoğlu et al., 2011; Kaeidi et al., 2011;
Wainstein et al., 2012; de Bock et al., 2013; El Amin et al., 2013). In an in-vitro
study, (Cumaoğlu et al., 2011) found that OLE improved the β-cell viability and
offered a degree of protection against cell death after cytokine exposure possibly
through suppression of caspase 3/7 activity. Furthermore, OLE almost completely
restored insulin secretion function whereas oleuropein only partially protected
insulin secretion. It was proposed that the inhibition of cytokine-mediated β-cell
toxicity was through maintenance of redox homeostasis by olive leaf biophenols.
Kaeidi et al. (2011) reported that OLE protected cells against neural damage
associated with high glucose concentrations, inhibited caspase 3 activation.
49
Diabetes-induced thermal hyperalgesia was also suppressed, probably by reduction
in neuronal apoptosis.
After oral loading of starch, olive leaves were found to suppress the elevation of
blood glucose concentrations of the group for borderline diabetes, having fasting
blood glucose concentrations level ranging from 110 to 140 mg/dL (Komaki et al.,
2003). They have also been found to improve insulin sensitivity and pancreatic β-
cell secretory capacity, possibly by reduction in the glucose and insulin excursion
(de Bock et al., 2013) and reduce HbA1c and fasting plasma insulin concentrations
but with no effect on postprandial plasma insulin concentrations (Wainstein et al.,
2012). An ethanol-OLE was shown to inhibit the activities α-amylase from human
saliva; luteolin-7-O-β- glucoside, luteolin-4′-O-β-glucoside and oleanolic acid
purified from OLE possess anti α-amylase activity. (Komaki et al., 2003).
In animal studies, OLE showed hypoglycaemic activity and significantly decreased
the serum glucose concentrations in alloxan induced diabetes (Gonzalez et al.,
1992; Al-Azzawie and Alhamdani, 2006; Jemai et al., 2009), streptozotocin-
induced diabetes (Eidi et al., 2009; Kaeidi et al., 2011; Wainstein et al., 2012; El
Amin et al., 2013), whereas in a DSS, insulin-resistant rat, OLE improved the
insulin resistance (Somova et al., 2003). The serum insulin and antidiabetic effect
of OLE was found to be more effective than antidiabetic drug (glibenclamide) (Eidi
et al., 2009). (Wainstein et al., 2012) found that OLE significantly reduced digestion
and absorption of starch in mucosal as well as serosal side of the intestine in
streptozotocin-induced diabetic rats, and suggested the hypoglycaemic effect of
OLE might be due to reduced digestion and absorption of starch. Biophenols from
OLE, including luteolin-7-O-β- glucoside, luteolin-4′-O-β-glucoside and oleanolic
acid were found to have inhibitory effects on α-glucosidases prepared from rat

50
intestine, and on the postprandial blood glucose increase in diabetic rats (Komaki
et al., 2003).
Oleanolic acid is a highly specific and potent TGR5 (a member of G-protein
coupled receptors) agonist and is suggested to be a potent anti-hyperglycaemic
agent. In mice fed with a high fat diet, oleanolic acid reduced serum glucose and
insulin concentrations and increased glucose tolerance. Oleuropein is also a TGR5
antagonist, and both compounds are considered to be involved in the antidiabetic
effect of olive leaves (Sato et al., 2007).
Olive leaf extract and oleuropein act on diabetes by at least two mechanisms: firstly:
by increasing peripheral glucose utilisation and secondly by improving glucose
stimulated insulin release (Gonzalez et al., 1992). Oleuropein is reported to be
beneficial in inhibiting oxidative stress induced by diabetes and diabetic
complications associated with oxidative stress. The concentrations of blood
glucose, malondialdehyde and antioxidants were restored in diabetic rabbits when
20 mg of oleuropein /kg body weight was given for 16 weeks (Al-Azzawie and
Alhamdani, 2006).
1.9.13. Anti-Alzheimer’s Disease
Alzheimer’s disease is the most common form of dementia in humans with typical
symptoms such as progressive loss of memory, deterioration of intellectual
functions, increased unresponsiveness, reduced speech function, disorientation, and
abnormal gait (Alzheimer's-Association, 2013). It occurs due to changes in the
cerebral cortex, basal forebrain, and other areas of the brain. The most affected
nerve cells are those that produce acetylcholine. Alzheimer’s patient’s brain show
characteristic senile plaques and neurofibrillary tangles (Steele et al., 2007). These
plaques and tangles are like scars and are formed due to protein and cellular
51
deposits. It is believed that accumulation of the protein β-amyloid outside of the
neurons in the brain and the accumulation of the protein tau inside of the neurons
results in the development of Alzheimer’s disease. Alzheimer’s disease appears to
develop to a large extent due to oxidative damage (Praticò and Delanty, 2000), as
β-amyloid increases the level of hydrogen peroxide and free radicals (Yamada et
al., 1999; Nunomura et al., 2006; Ramassamy et al., 2010; Pimentel et al., 2012;
Zhao and Zhao, 2013). Pro-oxidants elevate the β-amyloid concentration, and
antioxidants offer some degree of protection from β-amyloid-induced toxicity
(Yamada et al., 1999; Nunomura et al., 2006; Ramassamy et al., 2010; Pimentel et
al., 2012). Inflammation can cause oxidative damage in Alzheimer’s disease
through microglia which results in excessive production of RNS and ROS which in
turn damage lipid, proteins, and DNA. The role of oxidative stress in Alzheimer’s
disease is also highlighted by mitochondrial dysfunction and damage, with a higher
percentage of damaged mitochondria being observed in neurons (Nunomura et al.,
2006; Butterfield, 2011; Pimentel et al., 2012; Madeo and Elsayad, 2013; Zhao and
Zhao, 2013). The presence of the protein oxidation markers, protein carbonyls and
3-nitrotyrosine, in the brain as well as decreased level of cytochrome c oxidase and
advanced glycosylation end products also support the role of oxidative stress in
Alzheimer’s disease (Butterfield, 2011; Madeo and Elsayad, 2013; Zhao and Zhao,
2013). Therefore, olive leaf biophenols or OLE could potentially be used for the
prevention or at least delaying the onset of Alzheimer’s disease AD.
In a rat model, OLE improved the neurologic deficit scores after transient middle
cerebral artery occlusion and cerebroprotection from ischemic reperfusion as well
as reduced blood-brain barrier permeability, brain oedema and LDL/HDL ratio
(Mohagheghi et al., 2011). Bazoti et al. (2006) reported oleuropein to be a potential
anti-amyloidogenic agent as it forms a noncovalent highly stable complex with β-

52
amyloid and prevents its aggregation. In another study, administering 100 mg of
hydroxytyrosol/kg body weight for 12 days enhanced resistance of dissociated brain
cells to oxidative stress in mice as shown by reduced basal and stress induced lipid
peroxidation (Schaffer et al., 2007). Hydroxytyrosol may be beneficial in
neurodegenerative diseases as it significantly attenuated the cytotoxic effect of both
Fe2+ as well as nitric oxide, when murine-dissociated brain cells were pre-incubated
with hydroxytyrosol (Schaffer et al., 2007).
1.9.14. Miscellaneous activities
An increase in triiodothyronine (T3) concentrations and reduction in circulating
thyroid-stimulating hormone concentrations has been reported in the male rat when
given OLE intra-gastrically. However, no increase in thyroxine concentrations were
found, which may have been due to feedback mechanism (Al-Qarawi et al., 2002).
The smooth muscle relaxant effects of OLE was demonstrated when ileal tissue and
tracheal segments from rats were tested in the presence of calcium channel blockers
including verapamil and nifedipine. It was proposed that OLE modifies calcium
transport possibly though an increase in the intracellular concentration of cyclic
adenomonophosphate (Fehri et al., 1995). In ovariectomised rats, oleuropein
offered protection against inflammation-induced bone loss (Puel et al., 2004).
Oleuropein has been proposed to be a metabolism modulator via pepsin activation
and trypsin inhibition (Polzonetti et al., 2004). Apigenin, apigenin-7-O-glucoside,
apigenin-4′-O-rhamnosylglucoside, chrysoeriol, chrysoeriol-7-O-glucoside,
luteolin, luteolin-4′-O-glucoside, luteolin-7-O-glucoside and quercetin-3-O-
rhamnoside have shown strong inhibition of the classical pathway of the
complement system (Pieroni et al., 1996; PDR for Herbal Medicines, 2007).
53
Oleuropein may also increase life span of human embryonic fibroblasts as in vitro
it showed proteasome stimulatory properties (Katsiki et al., 2007).
1.10. Pharmacokinetics of Olive Leaf Biophenols
Data on the bioavailability of olive leaf biophenols is scarce as very few clinical
studies have been performed; however, it is known that olive leaf biophenols are
readily absorbed through the gastrointestinal tract and their level remains high in
circulation (Dean and Janićijević-Hudomal, 2007). Oleuropein is rapidly absorbed
and plasma concentrations reach a maximum, 2 hours after oral administration (Del
Boccio et al., 2003; Tan et al., 2003; Vissers et al., 2004). Oleuropein is metabolised
and its main metabolite is hydroxytyrosol. Both oleuropein and hydroxytyrosol are
rapidly distributed and excreted in urine, mainly as glucuronides or in very low
concentrations as free forms (Del Boccio et al., 2003). Vissers et al. (2004) reported
that about 15% of an oleuropein-glycoside supplement was excreted in urine as
hydroxytyrosol and tyrosol in healthy human subjects and about 55–60% of
administered ligstroside-aglycone, hydroxytyrosol, tyrosol and oleuropein-
aglycone were absorbed. In contrast, Singh et al. (2008) reported that oleuropein is
poorly absorbed. Given it is a glucoside, it could probably access a glucose
transporter in a similar way as quercetin glycoside which is absorbed through active
sugar transporters.
1.11. Toxicity and adverse effects of olive leaf biophenols
Olive leaves have been used with a great safety profile for centuries in
complementary and alternative medicine. However, when OLE is formulated as a
nutraceutical, food additive or pharmaceutical product, it is a new product that
requires careful examination of its toxicity profile and potential interaction with
54
other co-administered drugs or food. Also, the use of OLE in children, pregnant
women, during lactation, in frail patients and in case of liver and kidney
insufficiency has not been studied. Only a limited number of clinical and animal
studies have been performed on OLE. No long term study on the use of OLE or
biophenol enriched extract or individual compounds has been performed. There is
a small body of experimental evidence to indicate that OLE and olive leaf products
are safe for human and there are no major adverse effects, drug interaction or
toxicity associated with their usage (Perrinjaquet-Moccetti et al., 2008; Wainstein
et al., 2012; de Bock et al., 2013). Orally, it is well tolerated by most patients and
no serious adverse events have been reported. However, intra-ocular use of olive
leaf may irritate the surface of the eye (PDR for Herbal Medicines, 2007). There is
a risk of causing biliary colic through promoting the secretion of bile when OLE is
administered to patients with biliary tract stones (Chinou, 2012). Pollinosis, in the
form of rhinitis or bronchial asthma has also been reported (Rodríguez et al., 2001;
Florido Lopez et al., 2002; Quiralte et al., 2007). Some adverse effects with the use
of OLE in stage-1 hypertension patients were also reported by Susalit et al. (2011).
The most commonly reported effects were coughing (4.6%) and vertigo (5.9%),
while the less common were headache and muscle discomfort. OLE is not
recommended for patients with known hypersensitivity against the herbal
substances, in children and in pregnant or lactating women (Chinou, 2012) due to
the lack of safety studies.
1.12. Posology of olive leaf/ OLE
Standard recommended dose of olive leaves or OLE reported in literature is variable
and for different symptoms the recommended quantity of OLE or leaves is different.
Data on toxic dose of OLE or oleuropein is not available and the researchers still

55
have to answer the question of lethal/toxic dose of OLE/olive leaves in animals and
humans. As a dried powder it has been recommended to use 200-275 mg of leaves
3-5 times a day but not more than 1375 mg (Chinou, 2012). As a herbal tea, Duke
(2010) suggested 2 teaspoons of leaf or 7-8 g dried leaves steeped for 30 minutes
in 150 mL water and taken 3-4 times a day, while as a decoction it is recommended
that 20 g of fresh or 10 g of dried olive leaves should boiled in 300 mL of water and
when the volume reduces to 200 ml, it can be consumed hot after filtration, twice a
day (Van Hellemont, 1986).
In the case of OLE, normally the dose is calculated and recommended on the basis
of its oleuropein content. In commercially available OLE supplements in Australia,
the oleuropein content is standardised to 4.4 to 7.758 mg/mL for liquid OLE with a
recommend dose is 5 mL three times a day, while in capsule form oleuropein is
standardised to 2.4 g and the recommended dose is 2-3 capsules per day for adults
and half of the adult dose in children aged 6 to 12 years.
Hedgcock (2016), recommended daily dose of oleuropein in different age groups
as follows; For Adults, 25 mg in 1-2 doses for health maintenance, 75 mg in 3 doses
for disease prevention and 180 mg in 4-5 doses for acute illness and for children
above 12 years, half of this dose. For children aged 6-12 years the recommended
daily dose of oleuropein is 7 mg in 1-2 doses for health maintenance, 18 mg in 3
doses for disease prevention and 40 mg in 4-5 doses for acute illness. Whereas the
recommended daily dose of oleuropein for children aged form 2-6 years is 5 mg in
1-2 doses for health maintenance, 12 mg in 3 doses for disease prevention and 25
mg in 5 doses for acute illness.

56
1.13. Conclusion
Superior health benefits of olive leaves are attributed to their biophenol content.
Although beneficial effects of OLE in many disease symptoms or disorders have
been demonstrated through in vitro, in vivo and a small number of clinical studies,
there is still no strong enough clinical evidence to support their use in humans as
pharmaceuticals or nutraceuticals to achieve certain clinical outcomes.
Furthermore, their exact mechanism(s) of action is still vague. Although many
studies have shown that olive leaves and OLE possess various capabilities, ranging
from antimicrobial, antioxidant, anti-cancer, antihypertensive, cardioprotective,
neuroprotective, gastroprotective and anti-diabetic, it is still ambiguous whether
they can really perform all of these activities in vivo and what is more intriguing is
how they can exert all of these activities in vivo. In fact, being multi-potent is a
double dagger .i.e. compounds that possess many pharmacological actions will have
high potential to produce some undesirable side effects.
Many researchers propose the various health promoting effects are due to
antioxidant properties of the biophenols. On the other hand, there is a big camp of
researchers who completely reject this idea and consider biophenols as pro-
oxidants. Further research is essential to determine the mechanism(s) of action of
olive biophenols and to understand the fate of these biophenols in the body and their
role in the prevention and treatment of different diseases. More clinical studies are
strongly recommended so as to portray the efficacy and safety of olive biophenols.
Based on the current empirical evidence, especial interest should be given to anti-
diabetic, cardioprotective and neuroprotective potential.

57
An area of primary interest towards commercialization of olive leaf biophenols is
recovery maximization. Careful study of the natural variation of olive biophenol
concentrations in olive leaves and optimization of their recovery is mandatory for
any industrial mass production. Furthermore, it is highly recommended that there
should be some standardisation in procedures for collection, preservation,
extraction and analysis of olive leaves so as to cope with the strict quality control
measures of legal nutraceuticals and food supplements.
After examining relevant literature, the gaps of our current knowledge about olive
leaf supplements have been identified. This research project is designed to address
those gaps with the following aim and objectives.

58
1.14. Aim and objectives of the project
The overall aim of this research project was to evaluate Australian olive leaves as
a nutraceutical resource of bioactive biophenols and to study the antidiabetic effects
of olive leaf biophenols.
To address this overall aim, experiments were designed to address four objectives.
1. To determine the best method for drying olive leaves that allows the
optimum recovery of olive leaf biophenols, especially oleuropein.
2. To determine the effect of season and cultivar on the composition of olive
leaf biophenols.
3. To determine the in vitro antioxidant and antidiabetic activities of olive leaf
biophenols.
4. To gain preliminary evidence of the potential of olive leaf extract as an
antidiabetic agent for pre-diabetic subjects.
59
Chapter 2. Drying at high temperature for a short time
maximizes the recovery of olive leaf
biophenols
2.1. Introduction
Olive leaf extract (OLE) is gaining popularity in the global nutraceutical
market due to a plethora of claimed health attributes. OLE was traditionally
consumed for the treatment of a wide spectrum of ailments such as fever,
malaria, colic, alopecia, paralysis, rheumatism, gout, sciatica, hypertension,
arrhythmia, diabetes and cancer (E. Waterman and Lockwood, 2007;
Flemmig et al., 2011). The functional properties of OLE are essentially due
to its biophenol content (Obied et al., 2012). Biophenols are reactive
phytomolecules that can undergo a myriad of chemical reactions (Obied, et
al., 2005a). Olive biophenols can attenuate oxidative stress and prevent
oxidative damage through diverse mechanisms, including free radical
scavenging, chain reaction breaking, metal chelation and induction of
endogenous antioxidant enzymes (Visioli et al., 2002; Obied et al., 2009;
Servili et al., 2009; Obied et al., 2012).
The literature shows large qualitative and quantitative variation in the
biophenolic composition of OLE (Bouaziz and Sayadi, 2005; Paiva-Martins
and Pinto, 2008; Hashemi et al., 2010; Hayes et al., 2011; Ahmad-Qasem et
al., 2013). Geography, environmental factors, genetics, harvesting time,
agronomic practices, infestation and post-harvest processing can affect the
phenolic composition of olives (Vinha et al., 2005; Gomez-Caravaca et al.,
2008; Obied, , et al., 2008c; Obied, , et al., 2008b). Furthermore, recovery of
olive biophenols is influenced by experimental parameters such as extraction
60
technique, solvent, pH, time and temperature (Obied, et al., 2005b). Sample
handling, processing, clean-up and storage conditions, extract stability,
analytical technique sensitivity and the purity of standards used for
preparation of calibration curves are commonly overlooked factors that can
account for the wide variation in values in the literature. Oleuropein is the
major biophenol found in virtually all studied OLE, with rare exceptions
(Ryan et al., 2002a). Published values for oleuropein recovery from olive
leaves varied massively, from 5.6 to 108.6 mg/g dry weight (Ansari et al.,
2011; Tayoub et al., 2012). In one study, there was a marked variation, with
up to a 10-fold change in oleuropein content based on genetics, season, and
the colour/age of the leaves (Ranalli et al., 2006). Furthermore, it is difficult
to compare results from different studies, as there is no consensus on how to
express the recovery data .i.e. fresh weight, dry weight (DW) or extractable
matter (EM).
Analysis of fresh plant materials is considered an ideal situation, to avoid
artefacts resulting from sample degradation or extensive clean-up procedures.
As it is not always possible and sometimes impossible to analyse fresh plant
samples, several drying techniques have been proposed. Drying has been
always considered a sub-optimal procedure to preserve plant materials and
hence subtle drying techniques are always recommended, such as freeze-
drying (P. G. Waterman and Mole, 1994). Cheaper alternatives such as air-
drying or oven-drying at low temperatures (40-60 °C) have been typically
recommended when cost is an issue. Nonetheless, these conventional
hypotheses and practices have been challenged by sporadic experimental
reports (Vinson et al., 2005; Ahmad-Qasem et al., 2013).
61
As a drug of botanical origin, olive leaves are pharmacopoeially prepared by
air-drying. At the same time, some commercial neutraceutical products
proclaim superiority based on the extraction of fresh olive leaves. Currently,
there are no widely accepted guidelines for the drying of olive leaves. Data
from the literature are insufficient or contradictory. The impact of drying on
the nutritive value of olive leaves as animal feed has been investigated
(Martín-García and Molina-Alcaide, 2008). Though no attention was given
to the phenolic content and antioxidant activity, air-drying was recommended
as a simple and cheap technique that preserved the nutritive value of olive
leaves. Various drying techniques, such as air-drying, freeze-drying, and
oven-drying at low and high temperatures have been used to compare the
effect of drying method on biophenol content (Keinänen and Julkunen-Tiitto,
1996; Julkunen-Tiitto and Sorsa, 2001; Hung and Duy, 2012; Ahmad-Qasem
et al., 2013). Malik and Bradford reported air drying at ambient temperature
(25 °C) as the most suitable method for processing olive leaves for
commercial purposes due to its convenience, economic viability and good
recoveries of biophenols, particularly oleuropein and verbascoside (Malik
and Bradford, 2008). On the contrary, a more recent study identified drying
at 120 °C as the best preserving method for recovery of olive leaf biophenols,
particularly oleuropein (Ahmad-Qasem et al., 2013). Infra-red drying of olive
leaves seemed promising with a three-fold increase in total phenol recovery
at 70 °C, yet the impact of drying on individual biophenols was not
investigated (Boudhrioua et al., 2009). Therefore, we systematically
investigated the impact of different drying conditions on the recovery of
different biophenols from olive leaves, so as to resolve the current
62
controversy and provide a basis for optimizing commercial production of
OLE.
2.2. Materials and methods
2.2.1. Chemicals and reagents
Chemicals and reagents were used without further purification: Folin-
Ciocalteu reagent, 2,2′-diphenyl-1-picrylhydrazyl radical (DPPH•), (±)-6-
hydroxy-2,5,7,8-tetramethylchromane-2-carboxylic acid (Trolox), 2,2′
azinobis (3-ethylbenzothiazoline-6-sulfonic acid) diammonium salt (ABTS),
formic acid, aluminium chloride, sodium nitrate (Sigma-Aldrich, Sydney,
Australia), anhydrous sodium sulphate, sodium hydroxide, sodium carbonate
(Univar, Sydney, Australia); HPLC-grade methanol (Fisher Scientific. New
Jersey, USA); n-hexane, glacial acetic acid, ethanol, hydrochloric acid,
ammonium acetate (Merck, Melbourne, Australia), ethyl acetate and
anhydrous acetonitrile, (UNICHROME, Sydney, Australia).
Gallic acid, chlorogenic acid, caffeic acid, rutin, quercetin, 4-
hydroxymandelic acid, 3,4-dihydroxymandelic acid, luteolin, luteolin-7-O-
glucoside, catechin hydrate, 4-hydroxyphenylacetic acid, syringic acid, 3,4-
dihydroxyphenyl acetic acid, homovanillyl alcohol, 4- hydroxybenzoic acid,
trans-cinnamic acid, catechin, ferulic acid, o-coumaric acid, homovanillic
acid, p-coumaric acid, sinapic acid, hesperetin, neohesperidin and tyrosol
were purchased from Sigma-Aldrich (Sydney, Australia). Apigenin,
apigenin-7-O-glucoside, diosmin, oleuropein and verbascoside were
purchased from Extrasynthese (Genay, France). Hydroxytyrosol was bought
from Cayman Chemical Company (Ann Arbor, MI).
63
Standards were dissolved in 80% aqueous methanol to prepare stock
solutions of 1 mg/mL. Quercetin and luteolin had to be dissolved in absolute
methanol and rutin was dissolved in warm 80% aqueous methanol, as
described previously (Obied, et al., 2005b). Water used in all analytical work
was purified by a Modulab Analytical water system (Continental Water
Systems Corp., Melbourne, Australia).
2.2.2. Collection of olive leaves
Olive leaves were collected from the Charles Sturt University Olive Grove at
Wagga Wagga, NSW, Australia. The mature green leaves were handpicked
at the operator height around the whole perimeter of three trees of the same
cultivar, from summer through to autumn. Leaves of the Frantoio cultivar
were collected in February, 2012. Leaves of the Leccino cultivar were
collected in March, 2012 while leaves of Frantoio and Leccino cultivars were
again collected in April, 2012, in addition to two other cultivars; Hardy’s
Mammoth and Arbequina. Leaves were collected in plastic bags and brought
to the laboratory without any delay. Fresh leaves were analysed or subjected
to various drying conditions within 1 hour of collection.
2.2.3. Sample treatments
A pilot study was conducted for optimizing drying time and moisture content
for different treatments. In oven-drying at 105 °C, measurements were
recorded on an hourly basis for 5 hours. For air-drying, leaves were dried at
room temperature for ten days and the weight was recorded daily. Weight
was recorded after 18 and 24 hours for the freeze drying treatment, while
measurements were taken every 6 hours for 48 hours for oven drying at 60

64
°C. Optimum drying time is the minimum time required to achieve the lowest
moisture content with minimal degradation. Our data showed that optimum
drying time was 24 hour for freeze drying; 48 hours for air drying; 6 hours
for oven drying at 60 °C; and 3 hours for oven drying at 105 °C.
One portion of fresh leaves was ground in a coffee grinder and extracted to
determine the biophenol composition of fresh samples within one hour after
collection. Equal aliquots of fresh leaves were immediately subjected to one
of the following drying treatments.
a) Air drying: leaves were air-dried at room temperature (21 ± 2 °C) for
48 hours.
b) Oven drying at 60 °C: leaves were dried in a forced-air oven at 60 °C
for 6 hours.
c) Oven drying at 105 °C: leaves were dried in a forced-air oven at 105
°C for 3 hours.
d) Freeze drying: leaves were freeze dried in a Christ-Alpha 2–4 LD plus
freeze dryer (Biotech International, Germany) for 24 hours.
Dried leaves were ground in a coffee grinder and stored at –20 °C in air-tight
containers until extracted.
2.2.4. Moisture content
Moisture content was determined using the procedures described by the
United States Pharmacopeia (2002) using the gravimetric method for “articles
of botanical origin” as described previously (Obied, et al., 2005b). Five grams
of fresh leaves were dried in an evaporating dish in a convection oven at 105

65
°C. The leaves were weighed after every hour until the difference between
two successive readings was less than 0.25%.
2.2.5. Extraction of biophenols
Biophenols were extracted according to the method described previously
(Obied, et al., 2005b), with slight modification. Two grams of fresh/dried leaf
powder was extracted with 10 mL of 80% aqueous methanol for 30 min with
continuous stirring using a magnetic stirrer. The extract was filtered through
an Advantech no. 1 filter paper. The filtrate was kept and residues were re-
extracted with additional 10 mL of 80% aqueous methanol for 15 min and
filtered over the first filtrate. The combined extract was defatted thrice with
15 mL of n-hexane. The defatted extract was filtered through GF/F filter
paper and then re-filtered through 0.45 μm nylon syringe filters
(Phenomenex, Australia). All extractions were performed at room
temperature (21 ± 2 °C). The extracts were stored at –20 °C until analysed.
Extraction was performed in triplicate for each treatment.
2.2.6. Spectrophotometric measurements
Colorimetric analyses were performed on a Cary 50 UV/visible
spectrophotometer, using Cary WinUV “version 3” software (Varian,
Australia). Extracts were diluted using an extraction solvent to produce
concentrations within the range of the constructed calibration curves. Crude
extracts of freeze dried and oven dried at 105 °C olive leaves were diluted
(1:100) with 80% aqueous methanol, whereas crude extracts of fresh, air
dried and oven dried at 60 °C were diluted (1:20) with 80% aqueous
methanol. Three extracts of each treatment were analysed in triplicate.

66
2.2.6.1. Total phenols
For the determination of total phenols, 6 mL of water, 100 µL of diluted
extract and 500 µL of Folin-Ciocalteu reagent were added to a 10 mL
volumetric flask (Obied, et al., 2005b). After 1 min, 1.5 mL of aqueous
sodium carbonate solution (20% w/v) was added and mixed. The volume was
made up to 10 mL with water and contents were mixed thoroughly. The flask
was kept for 60 min at room temperature. The absorbance was then recorded
at 760 nm. A seven point (50-600 µg/mL) calibration curve was prepared
using gallic acid. Results were expressed as milligrams gallic acid equivalent
per gram dry weight (mg GAE/g DW).
2.2.6.2. Total flavonoids
Total flavonoid content was analysed by using an AlCl3 colorimetric assay,
as described earlier (Obied et al., 2013). Diluted extract (500 µL) and 150 µL
of NaNO2 (5% w/v) were mixed in a 5 mL volumetric flask. After 5 minutes,
150 µL of AlCl3 solution (10% w/v) was added, mixed for 1 min, and 1 mL
of 1M NaOH was then added. The volume was made up to 5 mL with water,
mixed well and absorbance was recorded at 510 nm. A calibration curve of
eight points (80-1600 µg/mL) was prepared using quercetin. Total flavonoid
contents were expressed as mg quercetin equivalents per gram dry weight of
leaves (mg QE/g DW).
2.2.6.3. o-diphenols
Determination of o-diphenols was performed according to the method
described previously (Qawasmeh et al., 2012), with minor modification.
Diluted extract (250 µL) and 250 µL of sodium molybdate dihydrate solution
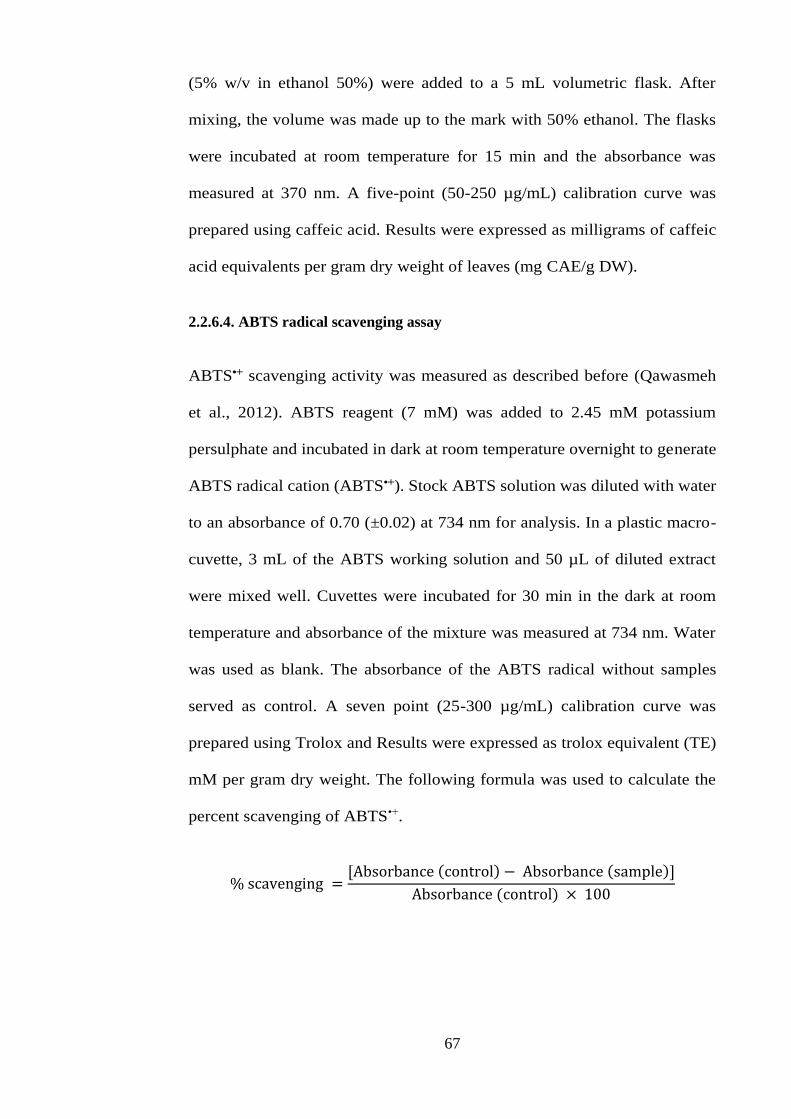
67
(5% w/v in ethanol 50%) were added to a 5 mL volumetric flask. After
mixing, the volume was made up to the mark with 50% ethanol. The flasks
were incubated at room temperature for 15 min and the absorbance was
measured at 370 nm. A five-point (50-250 µg/mL) calibration curve was
prepared using caffeic acid. Results were expressed as milligrams of caffeic
acid equivalents per gram dry weight of leaves (mg CAE/g DW).
2.2.6.4. ABTS radical scavenging assay
ABTS•+ scavenging activity was measured as described before (Qawasmeh
et al., 2012). ABTS reagent (7 mM) was added to 2.45 mM potassium
persulphate and incubated in dark at room temperature overnight to generate
ABTS radical cation (ABTS•+). Stock ABTS solution was diluted with water
to an absorbance of 0.70 (±0.02) at 734 nm for analysis. In a plastic macro-
cuvette, 3 mL of the ABTS working solution and 50 µL of diluted extract
were mixed well. Cuvettes were incubated for 30 min in the dark at room
temperature and absorbance of the mixture was measured at 734 nm. Water
was used as blank. The absorbance of the ABTS radical without samples
served as control. A seven point (25-300 µg/mL) calibration curve was
prepared using Trolox and Results were expressed as trolox equivalent (TE)
mM per gram dry weight. The following formula was used to calculate the
percent scavenging of ABTS•+.
% scavenging =[Absorbance (control) − Absorbance (sample)]
Absorbance (control) × 100

68
2.2.6.5. DPPH radical scavenging assay
The stable radical 2,2′-diphenyl-1-picrylhydrazyl (DPPH) was used to
measure the radical scavenging ability of olive leaves, as described earlier
(Obied, et al., 2008a), with minor modification. In macro plastic cuvettes, 3
mL of DPPH working solution in 80% aqueous methanol and 50 µL of diluted
extract were mixed well. Cuvettes were kept in the dark for 60 min at room
temperature and absorbance of the mixture was measured at 517 nm. Aqueous
methanol (80%) was used as blank. The absorbance of the DPPH radical
without sample served as control. A ten point (50-500 µg/mL) calibration
curve was prepared using Trolox and Results were expressed as mM of trolox
equivalent per gram dry weight (mM TE/g). The following formula was used
to calculate the percent scavenging of DPPH radical activity.
% scavenging =[Absorbance (control) − Absorbance (sample)]
Absorbance (control) × 100
2.2.7. High performance liquid chromatography (HPLC)
2.2.7.1. HPLC-DAD-online ABTS
Varian Prostar 240 solvent delivery system, Varian Prostar 335 diode array
detector (DAD) and Varian Prostar Autosampler were used to perform HPLC
analysis. The HPLC system was controlled by a Star Chromatography work
station, version 6.41 (Varian, Australia). The samples were analyzed by
gradient elution on a Gemini C-18 column [150 mm × 4.6 mm i.d., 3 µm,
(Phenomenex, Sydney, Australia)]. Through a T-intersection, the outflow
from the DAD was connected to a reaction coil (3.4 m× 0.178 mm i.d.), which
was maintained at 37°C in a Varian HPLC column temperature controller. A
69
Varian Polaris 210 HPLC pump was used to pump ABTS•+ working solution
to the reaction coil through the T-intersection. A Varian 9050 UV-Vis
detector was used for the detection of ABTS•+ absorbance at 414 nm. The
detector generated positive peaks by reversing the polarity of the analogue
signal. The mobile phases were prepared fresh, degassed under vacuum using
Phenomenex nylon 0.45 µm membranes and sonicated in a Sanophon
ultrasonic bath (Ultrasonic Industries Pty. Ltd, Sydney, Australia) for 10 min
prior to HPLC analysis. Solvent A was a mixture of water/methanol/ acetic
acid (90 + 10 + 1, v/v/v), whereas solvent B was methanol/acetonitrile/acetic
acid (90 + 10 + 1, v/v/v), as previously used (Obied, et al., 2008a). A flow
rate of 0.8 mL/min, injection volume of 5 µL and gradient elution for total
run time of 45 min was used as follows: initial conditions 90% solvent A;
isocratic for 2 min, solvent B was increased to 30% over 3 min; isocratic for
5 min, then solvent B increased to 40% over 5 min; isocratic for 5 min, then
solvent B increased to 50% over 5 min; isocratic for 5 min, then solvent B
increased to 100% over 5 min; and remain isocratic for 10 min. The system
was allowed to equilibrate for 10 min between runs.
2.2.7.2. HPLC-DAD-MS/MS
Analyses were conducted on an Agilent 1200 series liquid chromatographic
equipment (Agilent Technologies, Waldbronn, Germany) by gradient elution
on a Gemini C-18 column [150 mm × 4.6 mm i.d., 3 µm, (Phenomenex,
Sydney, Australia)]. The mobile phase was a gradient of solvent A (0.3%
formic acid in 10 mM ammonium acetate) and solvent B (0.3% formic acid
in acetonitrile/water 50:50, v/v). A flow rate of 0.9 mL/min and an injection
volume of 5 µL were used and gradient elution for total run time of 30 min

70
was used as follows: initial conditions 25% solvent B; isocratic for 2 min,
solvent B was increased to 50% over 3 min; isocratic for 3 min, then solvent
B increased to 80% over 7 min; isocratic for 5 min, then solvent B increased
to 100% over 3 min; isocratic for 4 min, then solvent B decreased to initial
condition (25%) over 3 min. The system was allowed to equilibrate for 5 min
between runs. The DAD was set to record chromatograms at 240, 280, 325
and 510 nm. Through a T-intersection, the outflow from the DAD was
connected to a 6410 triple-quadrupole mass analyzer (Agilent Technologies,
Santa Clara, CA, USA) equipped with an electrospray ionization (ESI)
interface. MS analysis was performed in the negative ion mode (m/z
100−1500) under the following conditions: nitrogen gas; gas temperature,
300 °C; gas flow rate, 12 L/min; nebulizer pressure, 45 psi; capillary voltage,
4 kV; cone voltage, 100 V. Data were analyzed using Agilent MassHunter
workstation version B.01.04 2008 (Agilent Technologies, Waldbronn,
Germany).
2.2.8. Statistical analysis
All assays were performed in triplicate and averaged. Data analysis was
performed by Microsoft Excel and IBM SPSS Statistics package version 20.0
(IBM Corporation, NY). Statistical comparisons were made using one-way
ANOVA and post-hoc LSD test. Results were considered statistically
significant at p ≤0.05.
2.3. Results and discussion
Four cultivars and three collection times were investigated for the effect of
sample pre-treatment. The data from various cultivars and collection times

71
showed a similar pattern. Furthermore, collected cultivars showed similar
phenolic profile and differences among cultivars were mainly quantitative.
We selected the data from the Frantoio cultivar collected during the summer
season (early February) to avoid redundancy and unnecessary details.
2.3.1. Moisture content
The average moisture content of fresh olive leaves was 50.7 ± 0.8 %. The
moisture content of our sample comes in accord with literature values 50-56
% (Cabrera-Gomez et al., 1992; Boudhrioua et al., 2009). Freeze-drying of
olive leaves required 24 h to reach to a constant weight. Meanwhile, it took 6
h at 60 °C and 3 h at 105 °C to achieve complete dryness (constant weight).
On the other hand, air-drying did not result in complete dryness even after ten
days. Hence, we decided to stop air-drying after 48 h as a compromise to
achieve reasonable drying with minimal decomposition of biophenols. After
48 h, the moisture content of air-dried leaves did not exceed 24.8 ± 2.4 %.
2.3.2. Extractable matter (EM)
The highest recovery of extractable matter was 6.6% for oven-drying at 105
°C, followed by 4.5% for freeze-drying, which represents approximately
triple and double of the fresh sample recovery, respectively (Table 2.1). Both
air-drying and oven-drying at 60 °C produced a 50% increase in the recovery
of extractable matter, compared with fresh olive leaves. Overall, drying
enhanced the recovery of extractable matter significantly. Drying of plant
tissues damages cellular structures and produces a loose porous material that
allows facile solvent penetration and solute extrusion (Lewicki, 1998).
Furthermore, heat is able to breakdown cellular structures containing

72
biophenols, like cell wall and vacuoles. Therefore, bound biophenols can be
liberated and recovered (Dewanto et al., 2002). The efficacy of extraction
procedures or extraction solvent can be measured by the amount of residual
solid substance after evaporation of the extraction solvent, referred to as
extractable matter. In food chemistry and nutrition research, recovery of
bioactive compounds is usually expressed as quantity per unit of dry weight
for solid samples, whereas it is common in phytochemistry to represent the
recovery of bioactive constituents as percentage quantity of extractable
matter.
2.3.3. Total biophenol composition and total antioxidant capacity
The need for rapid, sensitive and robust methods to determine the total
phenolic content of plant samples is vital for research and industry. There are
a number of colorimetric assays based on various chemical properties of the
phenolic moiety. Plant phenols are the largest group of plant secondary
metabolites with more than 9,000 identified structures of very widely varying
chemical nature. Therefore, any attempt to measure their total content is a
mere gross approximation that should be only used to compare samples with
similar phenolic composition. Hitherto, no single method is deemed
completely satisfactory and researchers need to acknowledge these
shortcomings when discussing their results. The use of more than one method
for the estimation of total phenols can provide more insight into the
composition of the plant samples and should alert researchers of the
limitations of each method.
Overall, total phenol, total flavonoid and o-diphenol content all varied with
drying method; in descending order (when data are expressed as dry weight):
73
oven-dried leaves at 105 °C > freeze-dried leaves > air-dried leaves > fresh
leaves > oven-dried leaves at 60 °C (Table 2.1). A statistically significant
increase in total phenol composition compared with fresh sample could be
observed for all treatments except for oven-drying at 60 °C where recoveries
dropped well below the fresh sample values (Table 2.1). Total flavonoid
content was the most sensitive parameter; showing up to 230% change, o-
diphenol content was the least affected parameter, where change did not
exceed 50%.
Despite its limitations and lack of selectivity, Folin-Ciocalteu’s reagent is still
the best technique for gross estimation of total phenol content. Folin-
Ciocalteu’s reagent depends on measuring the ability of the sample to reduce
phosphomolybdic/phosphotungstic acid mixture at high pH to form an
intense blue colour. According to Table 2.1, the total phenol content of fresh
olive leaf extract was 51.0 ± 0.7 mg GAE/g DW. A 110% increase was
observed upon oven-drying at 105 °C, while a 90% and 40% increases were
recorded for freeze-drying and air drying, respectively. Oven-drying at 60 °C
produced an almost 57% reduction in total phenol recovery. These results are
consistent with earlier findings, where drying olive leaves at 120 °C produced
higher phenol content compared with drying at 70 °C (Ahmad-Qasem et al.,
2013).
Olive leaf is rich in flavonoids, mainly found as glycosides (Obied et al.,
2012). A number of methods have been proposed to estimate the total
flavonoid content of plant samples, yet none is deemed completely
satisfactory. Flavonoids are the largest group of plant phenols with significant
variation in their molecular structures. In addition, methods based on ortho-
74
diphenol moiety will suffer from considerable interference of non-flavonoid
phenols. We determined the total flavonoid content via measuring the red
colour complex with aluminium (III) after nitrosation with sodium nitrite.
The method is expected to suffer from significant interference from olive
biophenols such as hydroxytyrosol, oleuropein and verbascoside (Papoti et
al., 2011). The total flavonoid content of fresh olive leaves showed an average
value of 263.1 ±10.7 mg QE/g DW. While oven drying at 105 °C resulted in
a 231% increase, freeze-dried and air-dried leaves showed a 158% and 65%
increase, respectively. On the other hand, an 81% reduction in recovery was
recorded for oven-drying at 60 °C (Table 2.1).
Our earlier work demonstrated that o-diphenol content, measured by
complexation with molybdenum (VI), correlated better with antioxidant
activity for olive biophenols (Obied, et al., 2008c). Oven drying at 105°C and
freeze-drying produced an average rise of 50% and 36%, correspondingly.
Air-drying did not significantly affect the recovery of o-diphenols. Consistent
with total phenol results, oven-drying at 60 °C resulted in a 55% decrease in
o-diphenol recovery.

75
Table 2.1: Biophenol content and antioxidant activity of Frantoio olive leaves.
Treatments
Parameters Fresh Air-dried Freeze-dried Oven-dried 60 °C Oven-dried 105 °C
Extractable matter % w/w 2.1 ± 0.2a 3.4 ± 0.1b 4.5 ± 0.2c 3.2 ± 0.3b 6.6 ± 0.1d
TPC (mg GAE/g DW)
(mg GAE/g EM)
51.0 ± 0.7a
118.3 ± 1.6a
71.1 ± 3.2b
134.6 ± 6.0b
91.2 ± 3.7c
201.1 ± 8.2c
21.6 ± 1.4d
67.3 ± 4.3d
106.9 ± 5.9e
161.3 ± 8.9e
TFC (mg QE/g DW)
(mg QE/g EM)
263.1 ±10.7a
610.2 ± 24.8a
435.9 ± 9.9b
826.0 ±18.8b
679.6 ± 40.8c
1497.7 ± 89.8c
49.4 ± 2.4d
153.8 ± 8.2d
871.5 ± 84.1e
1314.3 ± 126.8c
ODP (mg CAE/g DW)
(mg CAE/g EM)
50.8 ± 1.6a
117.8 ± 3.8a
51.7 ± 2.1a
98.1 ± 4.0a
69.0 ± 3.6b
152.1 ± 8.0b
23.0±1.6c
71.7 ± 1.0c
76.2 ± 5.1d
115.0 ± 7.7a
ABTS (mmol TE/g DW)
(mmol TE/g EM)
0.25 ± 0.01a
0.57 ± 0.02a
0.34 ± 0.01b
0.64 ± 0.01b
0.41 ± 0.02c
0.91 ± 0.05c
0.10 ± 0.00d
0.31 ± 0.01d
0.55 ± 0.04e
0.83 ± 0.05e
DPPH (mmol TE/g DW)
(mmol TE/g EM)
0.23 ± 0.01a
0.54 ± 0.02a
0.39 ± 0.02b
0.74 ± 0.09b
0.47 ± 0.02c
1.04 ± 0.04c
0.07 ± 0.00d
0.21 ± 0.08d
0.62 ± 0.04e
0.93 ± 0.06e
Results are presented as mean ± standard deviation. Different superscripts in the same row indicate significant difference at p<0.05. DW: dry weight; EM: extractable
matter; TPC: total phenol content; TFC: total flavonoid content; ODP: o-diphenol content; GAE: gallic acid equivalent; QE: quercitin equivalent; CAE: caffeic acid
equivalent; TE: trolox equivalent; mmol: millimole.
76
Olive biophenols are well prized for their antioxidant properties. Amongst
the different antioxidant mechanisms of action, free radical scavenging
activity is of paramount importance due to the large number of pathological
conditions linked to high level of free radicals (Obied, 2013). Total
antioxidant capacities of extracts, as measured by ABTS•+ and DPPH radical
scavenging assays, were parallel to changes in total phenol composition. All
changes of total antioxidant capacity were statistically significant (Table 2.1).
Samples showed the same ranking in both antioxidant assays and results were
similar to those reported for phenol composition: oven-dried leaves at 105 °C
> freeze-dried leaves > air-dried leaves > fresh leaves > oven-dried leaves at
60 °C. It is important to study antioxidant activity of olive samples along with
their total phenol content as our earlier findings have demonstrated that the
correlation between total phenol content and antioxidant activity is not always
linear (Obied, et al., 2008c).
When the results were expressed as mg equivalents per gram extractable
matter, freeze-drying was superior to oven drying at 105 °C in all assays. This
is most likely due to the higher recovery of extractable matter in 105 °C
(Table 2.1). Apparently, oven-drying at 105 °C increased the recovery of
biophenols as well as non-phenolic matrix components. Thus, freeze-drying
in preparation of olive leaf samples did not only improve the recovery of
biophenols, it had also resulted in significant sample clean-up and improved
the subsequent extraction selectivity.
The present study shows that drying at high temperature such as 105 °C for a
short time or, alternatively, freeze-drying significantly improved the recovery
of antioxidant biophenols from olive leaves. Paradoxically, phytochemistry
77
textbooks and drug compendia frequently recommend drying at temperatures
lower than 60 °C to avoid thermal decomposition (Harborne, 1998; Evans,
2009). Drying at temperatures higher than 50 °C led to significant reduction
in phenolic recovery and total antioxidant capacity in other plants (Julkunen-
Tiitto and Sorsa, 2001; Lim and Murtijaya, 2007; Chan et al., 2009). Drying
of American olive leaves at 60 °C resulted in a considerable loss of most
biophenols, up to 50% (Malik and Bradford, 2008). Similarly, oven-drying at
70 °C resulted in a plunge in total phenol content of Spanish olive leaves (var.
Serrana) (Ahmad-Qasem et al., 2013). On the other hand, the optimum drying
conditions of olive leaves in a tray drier was found to be 51 °C for 5 hours
(Erbay and Icier, 2009).
Freeze-drying produced higher total phenol content and antioxidant activity
than oven-drying at 105 °C for olive mill waste, while, unlike olive leaves,
oven-drying at 60 °C surpassed air-drying (Obied, et al., 2008b). We argue
that the changes in total phenol content and antioxidant activity are both plant
and tissue specific and hence the assumption that one drying method suits all
plants or all tissues from the same plant should be renounced. Air-drying,
moreover, resulted in higher total phenol recovery than oven-drying at 60 °C.
This can be explained by initial enzyme induction via slow drying at medium
temperatures (Evans, 2009). We also found that oven drying at 60 °C resulted
in brown colouring of leaves, while leaves dried at 105 °C were light green.
This browning reaction at lower temperature may be due to the thermal
activation of polyphenol oxidase (PPO) enzymes. Though we could not
retrieve specific data from the literature on the thermal stability of olive PPO,
the optimum temperature for PPO varies widely among different plants and
can reach up to 50 °C. PPO can be thermally inactivated by exposure to
78
temperatures between 70 to 90 °C for varying time periods from 5-60 min
(Queiroz et al., 2008). In the current study, it seems likely that olive leaves
had enough residual catalytic PPO activity to produce considerable
decomposition of biophenols at 60 °C.
2.3.4. Biophenol-antioxidant profile and recovery of individual biophenols
Measuring total phenol content cannot detect degradation of biophenols,
especially when the degradation products are more reactive than their starting
material (aglycones versus glycosides). Thus, analysis of biophenols by
HPLC offers a great advantage to examine the impact of drying on individual
components. Most of the earlier studies did not study the impact of drying on
individual biophenols (Cabrera-Gomez et al., 1992; Boudhrioua et al., 2009;
Erbay and Icier, 2009). In the current study, chromatograms of different
drying treatments are compared at 280 nm in Figure 2.1. The 280 nm, 325
nm and online ABTS scavenging activity chromatograms for leaves oven-
dried at 105 °C are shown in Figure 2.2. A large number of peaks were
detected in the chromatograms at 280 and 325 nm (Figure 2.2). Nine
compounds constituted the major peaks in the chromatograms (Figure 2.1).
The identification of biophenols was based on separation by HPLC equipped
with a DAD, comparison of the chromatographic retention time and UV
absorbance spectra of a compound with those of a reference standard. The
identities of compounds were confirmed by LC-MS/MS. The most abundant
biophenols in olive leaves were: oleuropein (peak 5), verbascoside (peak 2),
luteolin-7-O-glucoside (peak 3), and apigenin-7-O-rutinoside (peak 8). These
results are consistent with earlier findings on olive leaves from the
Mediterranean basin (Bouaziz and Sayadi, 2005). The online ABTS

79
scavenging profile (Figure 2.2) clearly shows that for leaves dried at 105 °C
the main contributors to the radical scavenging activity of olive leaf extracts
are oleuropein (peak 5) > verbascoside (peak 2) > oleuroside (peak 9) >
unknown compound (peak 1) > luteolin 7-O-glucoside (peak 3) > apigenin 7-
O-rutinoside (peak 8).
To study the impact of drying method on the recovery of individual
biophenols, the six identified biophenols were quantified by recording their
peak areas in HPLC chromatogram at 280 nm using calibration curves of
reference standards (Table 2.2). Although different drying treatments had
variable effects on various biophenols, oven-drying at 105 °C generally
produced the highest recoveries of biophenols. Whilst apigenin 7-O-
rutinoside was not significantly changed, luteolin 7-O-glucoside recovery
was nearly doubled in comparison to fresh olive leaves and an almost 40%
increase in rutin recovery was observed. Enhanced recovery of oleuroside (7-
fold) and verbascoside (17-fold) was also observed. The increase in
oleuropein recovery was phenomenal, with a 38-fold increase (Table 2.2)
(Figure 2.3). In a recent study on Spanish olive leaves, (Ahmad-Qasem et al.,
2013) reported that drying olive leaves at 120 °C resulted in the best
processing conditions, particularly for oleuropein. Our results are in
agreement with their findings. Earlier reports also showed good thermal
stability of oleuropein at temperatures up to 130 °C (Malik and Bradford,
2008). Afaneh et al. found that drying olive leaves at ambient temperature
(25 °C) increased oleuropein recovery, while drying at 50 °C decreased its
recovery compared to fresh leaves (Afaneh et al., 2015). Freeze-drying did
not significantly increase the recovery of flavonoid glycosides viz. rutin,
luteolin 7-O-glucoside, and apigenin 7-O-rutinoside.

80
Figure 2.1: HPLC chromatograms of olive leaf extracts at 280nm showing the effect of
different drying methods on the phenolic compounds of olive leaves.
(1) unknown (2) verbascoside (3) luteolin-7-O-glucoside (4) rutin (5) oleuropein (6)
flavonoid derivative (7) flavonoid glycoside derivative (8) apigenin-7-O-rutinoside (9)
oleuroside.

81
Figure 2.2: HPLC chromatograms of olive leaf extracts of oven dried leaves at 105 °C,
comparing 280nm and 325nm wavelength and the corresponding ABTS activity.
(1) unknown (2) verbascoside (3) luteolin-7-O-glucoside (4) rutin (5) oleuropein (6)
flavonoid derivative (7) flavonoid glycoside derivative (8) apigenin-7-O-rutinoside (9)
oleuroside.

82
Meanwhile, a considerable increase in the recovery of secoiridoids upon
freeze-drying was observed, with oleuroside increasing three-fold, and
oleuropein, ten-fold compared to fresh leaves. The enhanced recovery of
verbascoside, a 15-fold increase, was the most eminent effect of freeze-drying
(Table 2.2). The effects of air-drying were more incongruous; where rutin
recovery was not significantly affected, verbascoside recovery was dropped
by more than 85% compared to fresh leaves. Luteolin 7-O-glucoside,
apigenin 7-O-rutinoside and oleuroside showed 30-40% increase in recovery
(Table 2.2). On the other hand, oleuropein recovery increased 8-9 fold. Oven-
drying at 60 °C consistently had detrimental effects on the recovery of all
studied biophenols, with losses between 30 and 85%. Apigenin-7-O-
rutinoside and oleuropein were the least affected biophenols by drying at 60
°C, while other compounds were more vulnerable (Table 2.2).
2.3.5. Cultivar and seasonal impact on biophenols and oleuropein
recovery
To confirm reproducibility of our findings, olive leaves from Leccino,
Arbequina and Hardy’s Mammoth cultivars were collected. Furthermore,
Frantoio olive leaves were re-collected in autumn. Samples were treated and
analysed as described above. Results were similar to the findings of the main
study on Frantoio cultivar collected during the summer season. Again the
extracts of oven dried leaves at 105 °C resulted in the highest oleuropein and
other biophenol recoveries and antioxidant activities. This indicates that our
findings are reproducible irrespective of the cultivar used or the season in
which the leaves were collected.

83
Table 2.2: Quantity of major biophenols identified in Frantoio olive leaf.
Peak Biophenol Fresh Air-dried Freeze-dried Oven-dried 60 °C Oven-dried 105 °C
2 Verbascoside (mg/g DW)
(mg/g EM)
0.90 ± 0.07a
2.10 ± 0.15a
0.11 ± 0.01b
0.21 ± 0.02b
14.65 ± 0.80c
32.27 ± 1.77c
0.20 ± 0.01d
0.63 ± 0.03d
16.74 ± 1.16c
25.24 ± 1.75c
3 Luteolin-7-O-glucoside (mg/g DW)
(mg/g EM)
2.86 ± 0.07a
6.64 ± 0.16a
3.67 ± 0.03b
6.96 ± 0.05b
3.43 ± 0.14ab
7.56 ± 0.3ab
0.90 ± 0.05c
2.79 ± 0.17c
5.44 ± 0.37d
8.20 ± 0.55d
4 Rutin (mg/g DW)
(mg/g EM)
1.91 ± 0.01a
4.43 ± 0.02a
1.95 ± 0.14a
3.69 ± 0.26a
2.11 ± 0.20ac
4.64 ± 0.45ac
0.50 ± 0.03b
1.55 ± 0.10b
2.66 ± 0.25c
4.01 ± 0.38c
5 Oleuropein (mg/g DW)
(mg/g EM)
3.56 ± 0.02a
8.27 ± 0.05a
32.75 ± 1.47b
62.06 ± 2.79b
37.47 ± 8.43b
82.54 ± 18.56b
2.13 ± 0.34a
6.62 ± 1.06a
139.48 ± 9.49c
210.34 ± 9.48c
8 Apigenin-7-O-rutinoside (mg AGE/g DW)
(mg AGE/g EM)
2.64 ± 0.03a
6.13 ± 0.06a
3.37 ± 0.01b
6.39 ± 0.02b
2.26 ± 0.15ac
4.98 ± 0.33ac
1.85 ± 0.13c
5.76 ± 0.41c
2.79 ± 0.19a
4.20 ± 0.28a
9 Oleuroside (mg OLPE/g DW)
(mg OLPE/g EM)
0.68 ± 0.02a
1.57 ± 0.04a
0.98 ± 0.11a
1.85 ± 0.21a
2.54 ± 0.19b
5.60 ± 0.42b
0.10 ± 0.00a
0.31 ± 0.00a
5.75 ± 0.48c
8.67 ± 0.73c
Results are presented as mean ± standard deviation. Different superscripts in the same row indicate significant difference at p < 0.05. P: peak; DW: dry
weight; EM: extractable matter; AGE: Apigenin-7-O-glucoside equivalent; OLPE: oleuropein equivalent.
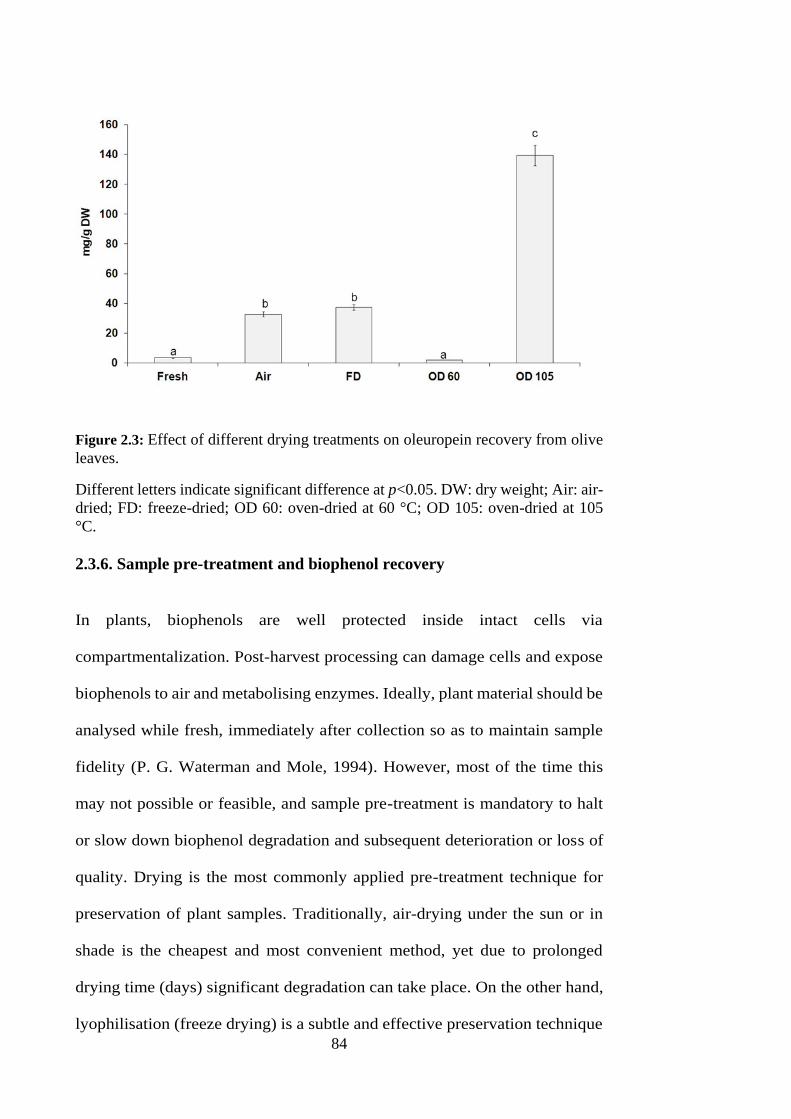
84
Figure 2.3: Effect of different drying treatments on oleuropein recovery from olive
leaves.
Different letters indicate significant difference at p<0.05. DW: dry weight; Air: air-
dried; FD: freeze-dried; OD 60: oven-dried at 60 °C; OD 105: oven-dried at 105
°C.
2.3.6. Sample pre-treatment and biophenol recovery
In plants, biophenols are well protected inside intact cells via
compartmentalization. Post-harvest processing can damage cells and expose
biophenols to air and metabolising enzymes. Ideally, plant material should be
analysed while fresh, immediately after collection so as to maintain sample
fidelity (P. G. Waterman and Mole, 1994). However, most of the time this
may not possible or feasible, and sample pre-treatment is mandatory to halt
or slow down biophenol degradation and subsequent deterioration or loss of
quality. Drying is the most commonly applied pre-treatment technique for
preservation of plant samples. Traditionally, air-drying under the sun or in
shade is the cheapest and most convenient method, yet due to prolonged
drying time (days) significant degradation can take place. On the other hand,
lyophilisation (freeze drying) is a subtle and effective preservation technique

85
that is quicker and more effective than air drying for biophenols in plant
samples (Obied, et al., 2008b). However, freeze-drying is an expensive
technique and requires initial freezing of samples. Abascal et al. claimed that
freeze-drying can cause pronounced changes in the composition of medicinal
plants (Abascal et al., 2005). Alternatively, oven drying is faster than the
aforementioned drying techniques. Drying could increase the biophenol
content by releasing bound phenolic compounds. Hot air drying degrades cell
walls and breaks down cellular constituents, while in freeze drying, cells are
damaged by ice crystals. Both drying techniques facilitate the extraction and
result in release of intra-cellular compounds, and increase biophenol recovery
and antioxidant activity (Ahmad-Qasem et al., 2013). Oven drying at
temperatures ≤ 60°C is considered conventionally suitable for medicinal
plants (Youngken, 2012) yet these temperatures may not be high enough to
deactivate metabolising enzymes. Furthermore, some enzymatic activities
can be augmented by heating (Mizobutsi et al., 2010). Oven drying at higher
temperatures rapidly denatures enzymes and shortens the drying time,
however, loss of volatile compounds, thermal degradation, and/or
polymerization are usually expected (Keinänen and Julkunen-Tiitto, 1996).
OLE was an official drug in the French pharmacopeia long before it made its
way to the European and the British Pharmacopoeias. The French
Pharmacopeia states that fresh olive leaves should be used for extraction, but,
shade-dried olive leaves are recommended according to the British and
European pharmacopoeias. The British and European pharmacopoeias
standardize olive leaves based on a minimum of 5% oleuropein. In the French
pharmacopeia (2008), olive leaves are standardized to contain a minimum of
0.015% luteolin-7-glucoside. Moreover, many commercial OLE are
86
advertised as extracts of fresh olive leaves. Based on our results a review of
the pharmacopeial and commercial procedures for preparation of OLE is
highly recommended.
2.4. Conclusions
Sample processing appears to have a paramount effect on the qualitative and
quantitative recovery of biophenols that widely vary based not only on the
plant but also on the tissue involved. Hence, the impact of drying conditions
on recovery of biophenols should not be considered a matter of convenience.
On the basis of above findings, the recommendation can be made that olive
leaves should be dehydrated at 105 °C for 3 h before extraction, in order to
achieve maximum recovery of oleuropein and other biophenols.
Further systematic research is required for the preparation of olive leaf
extract, as most of the commercial olive leaf extracts available in market are
prepared using fresh or air-dried leaves. Our work is of paramount importance
to nutraceutical, pharmaceutical and cosmetic industries utilising olive leaf
extract for its functional properties. As a minor investment in proper drying
of olive leaves can lead to up to 30 fold increase in biophenol recovery and
hence a parallel increase in profitability.
There is not a single method that is completely satisfactory for the accurate
determination of the total phenol content or total phenolic class content in plants.
Lack of specificity of the chemical methods for determination of “total” content has
been undervalued and misused in literature. The use of different methods is
complementary in understanding the phenolic composition of the sample but it
should be always emphasized that these methods do not have simple additive

87
function and cannot directly correlated with each other. Therefore, chromatographic
determination of the phenolic composition and antioxidant activity is becoming
essential for accurate estimation of the phenolic composition.
88
Chapter 3. The Impact of climatic conditions, season and
cultivar on biophenol content of olive leaves
3.1. Introduction
The leaf is a primary site of plant metabolism and a rich source of biophenols.
Biophenols are bioactive phenolic compounds that not only play a vital role in plant
defence mechanisms, but also possess nutritional and biological value for animals
and humans (Pometto et al., 2014). Olive leaves (Olea europaea L.) are a significant
source of biophenols and are available year round, while the life span of an olive
leaf on an adult tree is up to three years (Papoti and Tsimidou, 2009). Moreover,
olive leaves are relatively stable to enzymatic degradation as compared to olive
fruit/drupes, olive oil and olive mill waste (Paiva-Martins and Pinto, 2008). Olive
leaves are mainly used for animal feeding (Ranalli et al., 2005; Molina-Alcaide and
Yáñez-Ruiz, 2008; Boudhrioua et al., 2009), although their higher biophenol
content suggests that they could be a good nutraceutical and can be effectively used
in the preventative medicine, food and cosmetic industries (Bouaziz and Sayadi,
2005; Boudhrioua et al., 2009; Brahmi, et al., 2012b). Olive leaves have been used
as folk medicine since antiquity, and the first medicinal use of olive leaf dates back
to ancient Egypt (Durlu-Özkaya and Özkaya, 2011). However, during the last two
decades olive leaf biophenols have attracted considerable attention and a number
of studies have been performed investigating the health promoting properties of
these biophenols (Obied et al., 2012).
Since it is proposed that oxidative stress is a major cause of aging and age related
diseases, a number of studies have been performed on natural antioxidants to
counteract the adverse effects of oxidative stress. Natural antioxidant sources and
their potential applications as functional food or nutraceutical have been

89
extensively explored. Vegetables, fruits, wine, tea, seeds, onion bulbs, aromatic
plants and olive oil are widely touted for their natural antioxidant capacity
(Dimitrios, 2006), but olive leaves, which could have great potential as a
nutraceutical by preventing/attenuating the adverse effects of oxidative damage or
free radicals have not been explored comprehensively. Biophenols are thought to
be a natural and good source of antioxidants. A linear relationship has been
proposed between the biophenol content and antioxidant activity (Brahmi, et al.,
2012b). Olive leaves are a better source of antioxidants than olive fruits (Brahmi et
al., 2013). The higher antioxidant capacity of olive leaf biophenols is thought to be
central to the health promoting properties of olive leaves. Antioxidant activity of
olive leaves depends upon various factors like variety, age, harvesting time,
tissue/organ, as well as the solvent system used. When the olive leaves at two
different harvesting stages were compared for antioxidant activity, the mature
leaves surpassed the growing leaves and accumulation of biophenols was found to
be highest towards the end of leaf maturity (Brahmi, et al., 2012b; Brahmi et al.,
2013). Contrary to that, another study found no effect of leaf age on biophenol
content (Ryan et al., 2002a).
The biophenolic profile of olive leaf is more complex than those of pulp, seed, or
stone (Ryan et al., 2002a) and olive leaf biophenols vary both qualitatively and
quantitatively during different developmental stages of the biological cycle of olive
trees (Amiot et al., 1989). The biophenol composition of olive leaves can be
affected by several factors such as the cultivar/variety, tissue involved and the stage
of biological cycle (Brahmi et al., 2013), as well as environmental factors like
geographical origin (Papoti and Tsimidou, 2009), UV light, temperature, and
nutrition (Mert et al., 2013) . Furthermore, not only leaves of different cultivars
grown in same orchard under same set of environmental and cultural conditions

90
show variation but also leaves of the same cultivar collected at different time or
season show variation in biophenol contents (Papoti and Tsimidou, 2009; Brahmi
et al., 2013; Talhaoui et al., 2015). Climatic, pathological conditions and
agricultural practices also result in seasonal variations (Obied, et al., 2008c). In
addition to that, moisture content, sampling procedures and conditions and
extraction method may also influence biophenol content (Şahin et al., 2012). It has
been reported that the biophenol content of the plant increased in defence against a
microorganism attack during fruit ripening (Brahmi et al., 2013).
The olive tree has tendency of alternate bearing, which means it produces a high-
yield crop one year ("on-year") and no fruit or a low-yield the following year ("off-
year"). It is thought that the leaves are the ones which receive the initial signal for
alternate bearing, produced by the developing embryo. The leaves then induce
chemical changes in phenolic compounds. An inhibitor is produced by the leaves,
depending upon the intensity of the signal and the environmental conditions. The
changes in phenolic compounds of leaves, seize the flower bud formation during
the physiological initiation period (Ryan et al., 2003; Mert et al., 2013).
Seasonal variation in olive leaf biophenol content is an area which has not been
extensively explored. Although in the three years of my candidature some work has
been published in this area, there is no study which has covered the whole olive
fruit cycle. Moreover, most of the previous studies on seasonal and cultivar
differences were limited to the Mediterranean basin or the United States. To our
knowledge there has been no comprehensive study on cultivars grown in Australia.
This information is vital for any industrial application of olive leaves so that
optimum harvesting times can be chosen and the variability in biophenol recovery
due to cultivar and season is taken into consideration.

91
This study was designed to (1) investigate differences in biophenol content of an
Australian cultivar, Hardy’s Mammoth, and from two Italian origin cultivars,
Frantoio and Leccino, grown in Wagga Wagga, Australia; (2) reveal the effect of
season and cultivar on biophenol content and antioxidant activity of olive leaves, in
order to determine the best harvest time for optimal recovery of biophenols from a
particular cultivar; and (3) determine correlation between biophenol content and
antioxidant activity.
3.2. Materials and methods
3.2.1. Chemicals and Reagents
Most of the reagents and standards and other consumables were obtained from the
same sources as described in Chapter 2, with a few exceptions. HPLC-grade
methanol was obtained from Merck, Melbourne, Australia and oleuropein was
obtained from Sigma-Aldrich (Sydney, Australia). All reagents and standards were
prepared in the same way as described in Chapter 2.
3.2.2. Collection of olive leaves
Olive leaves of three different varieties/cultivars (Frantoio, Hardy’s Mammoth and
Leccino) were collected from the CSU Olive Grove, Wagga Wagga, every second
month as well as monthly during the fruit season for, 28 months. The collection was
started in April 2012 and finished in July 2104. The mature green leaves were
handpicked at the operator height around the whole perimeter of three trees of the
same cultivar. Approximately 75 grams of leaves from each cultivar were collected
in each collection. Leaves were collected in plastic bags and brought to the
laboratory without any delay.
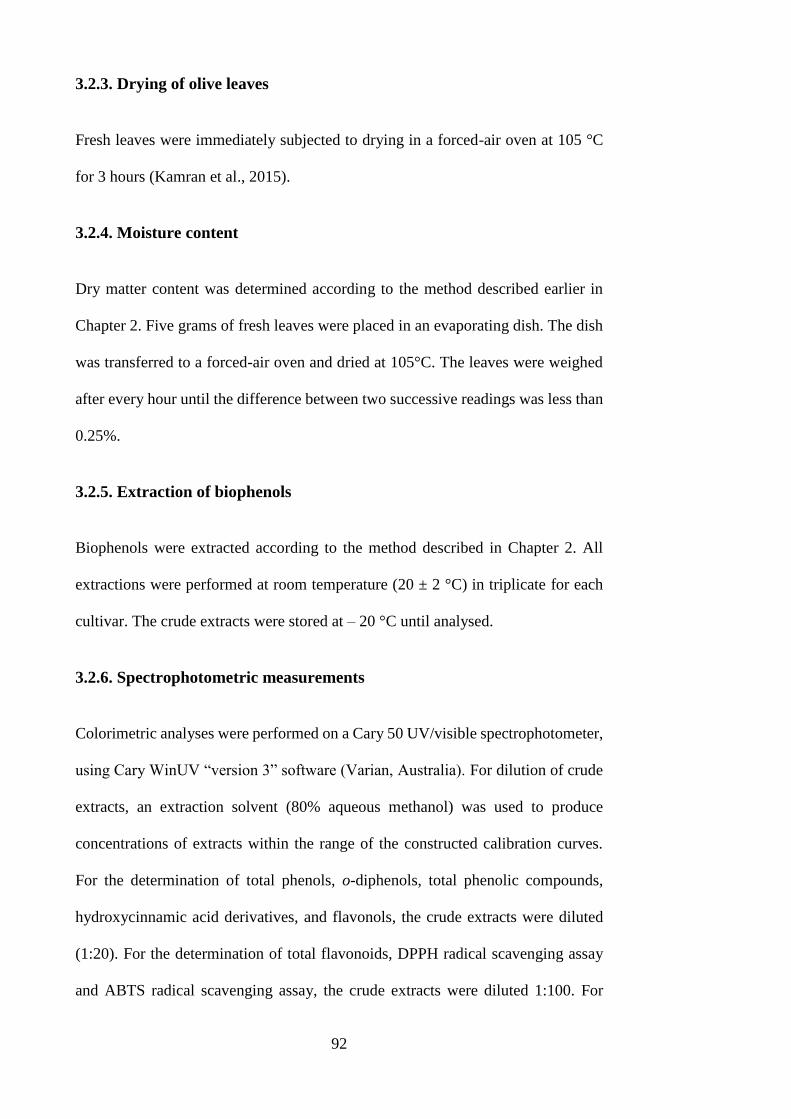
92
3.2.3. Drying of olive leaves
Fresh leaves were immediately subjected to drying in a forced-air oven at 105 °C
for 3 hours (Kamran et al., 2015).
3.2.4. Moisture content
Dry matter content was determined according to the method described earlier in
Chapter 2. Five grams of fresh leaves were placed in an evaporating dish. The dish
was transferred to a forced-air oven and dried at 105°C. The leaves were weighed
after every hour until the difference between two successive readings was less than
0.25%.
3.2.5. Extraction of biophenols
Biophenols were extracted according to the method described in Chapter 2. All
extractions were performed at room temperature (20 ± 2 °C) in triplicate for each
cultivar. The crude extracts were stored at – 20 °C until analysed.
3.2.6. Spectrophotometric measurements
Colorimetric analyses were performed on a Cary 50 UV/visible spectrophotometer,
using Cary WinUV “version 3” software (Varian, Australia). For dilution of crude
extracts, an extraction solvent (80% aqueous methanol) was used to produce
concentrations of extracts within the range of the constructed calibration curves.
For the determination of total phenols, o-diphenols, total phenolic compounds,
hydroxycinnamic acid derivatives, and flavonols, the crude extracts were diluted
(1:20). For the determination of total flavonoids, DPPH radical scavenging assay
and ABTS radical scavenging assay, the crude extracts were diluted 1:100. For
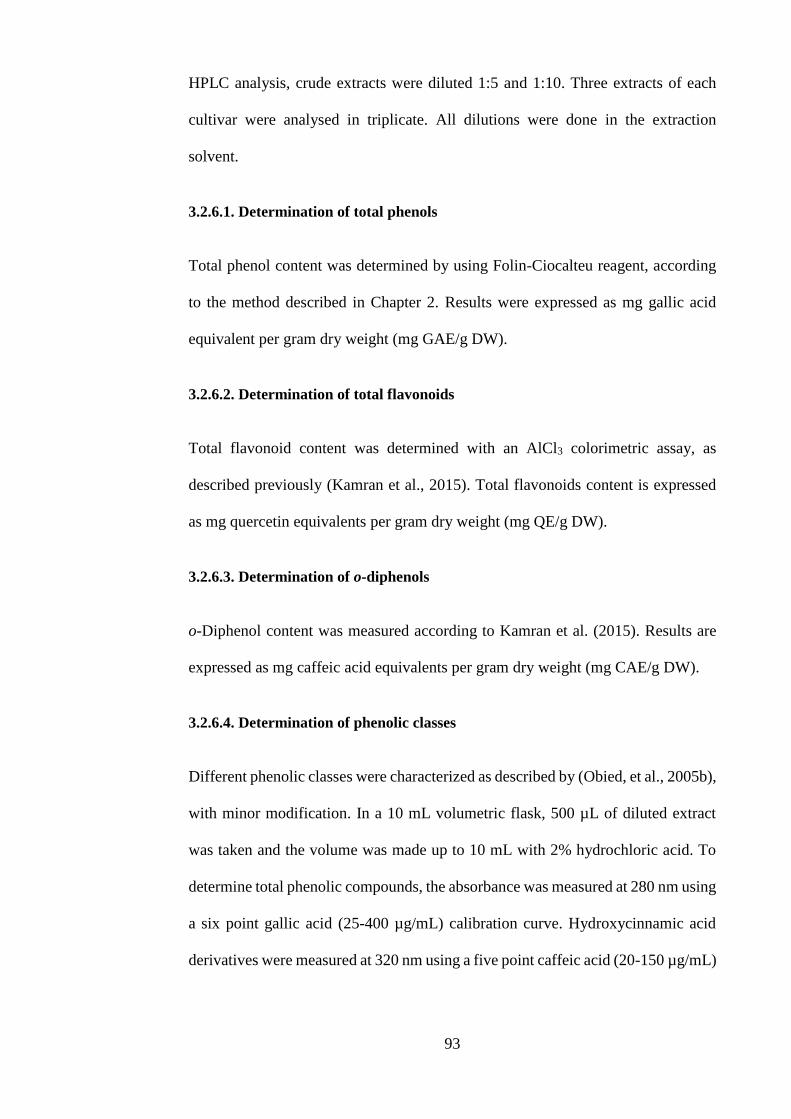
93
HPLC analysis, crude extracts were diluted 1:5 and 1:10. Three extracts of each
cultivar were analysed in triplicate. All dilutions were done in the extraction
solvent.
3.2.6.1. Determination of total phenols
Total phenol content was determined by using Folin-Ciocalteu reagent, according
to the method described in Chapter 2. Results were expressed as mg gallic acid
equivalent per gram dry weight (mg GAE/g DW).
3.2.6.2. Determination of total flavonoids
Total flavonoid content was determined with an AlCl3 colorimetric assay, as
described previously (Kamran et al., 2015). Total flavonoids content is expressed
as mg quercetin equivalents per gram dry weight (mg QE/g DW).
3.2.6.3. Determination of o-diphenols
o-Diphenol content was measured according to Kamran et al. (2015). Results are
expressed as mg caffeic acid equivalents per gram dry weight (mg CAE/g DW).
3.2.6.4. Determination of phenolic classes
Different phenolic classes were characterized as described by (Obied, et al., 2005b),
with minor modification. In a 10 mL volumetric flask, 500 µL of diluted extract
was taken and the volume was made up to 10 mL with 2% hydrochloric acid. To
determine total phenolic compounds, the absorbance was measured at 280 nm using
a six point gallic acid (25-400 µg/mL) calibration curve. Hydroxycinnamic acid
derivatives were measured at 320 nm using a five point caffeic acid (20-150 µg/mL)

94
calibration curve as standard, whereas flavonols were measured at 360 nm using a
five point (30-250 µg/mL) calibration curve with quercetin as standard.
3.2.6.5. Antioxidant activity
The antioxidant activity of olive leaf extracts was determined by measuring the
ABTS+ and DPPH radicals scavenging ability. Trolox was used as the standard for
antioxidant capacity. Trolox equivalent antioxidant capacity (TEAC) was defined
as the amount of trolox equivalent to the amount of crude extract that resulted in
equal scavenging of DPPH or ABTS. For DPPH a ten point (50-500 µg/mL)
calibration curve was prepared, whereas for ABTS seven point (25-300 µg/mL)
calibration curve was prepared using Trolox. The following formula was used to
calculate the percent scavenging
% scavenging =[Absorbance (control) − Absorbance (sample)]
Absorbance (control) × 100
ABTS•+ scavenging activity was measured according to a previously described
method (Kamran et al., 2015). Results are expressed as micromoles trolox
equivalent per gram dry weight (µM TE /g DW). The stable DPPH radical was used
to measure the radical scavenging ability of olive leaves as described earlier
(Kamran et al., 2015). Results are expressed as micromoles trolox equivalent per
gram dry weight (µM TE /g DW).
3.2.7. High Performance Liquid Chromatography (HPLC)
HPLC-DAD-online ABTS: For HPLC analysis, the same instruments and column
were used as described in a Chapter 2, but the solvents used for gradient elution
were different. Solvent A was a mixture of water/acetonitrile/ formic acid (50 + 50
+ 0.3, v/v/v), whereas solvent B was 10 mM ammonium acetate with 0.3% formic

95
acid. A flow rate of 0.8 mL/min and injection volume of 5 µL were used with a
gradient elution for total run time of 30 min. The run was as follows: initial
conditions 10% solvent A; solvent A was increased to 25% over 2 min; then solvent
A increased to 45% over 3 min; isocratic for 2 min, then solvent A increased to
80% over 13 min; then solvent A increased to 100% over 2 min; isocratic for 4 min,
solvent gradient was returned to initial conditions over 4 min. The system was
allowed to equilibrate for 5 min between runs.
3.2.8. Climatic data
Monthly rainfall and monthly mean daily global solar exposure data for the Wagga
Wagga Agricultural Institute station and monthly mean maximum temperature for
Wagga Wagga Aeronautical Meteorological Office station were retrieved from the
Australian Bureau of Metrology website(Australian Bureau of Meterology, 2016).
Data were used to find some explanation for observed changes in olive leaves’
composition.
3.2.9. Statistical analysis
All assays were performed in triplicate and averaged. Data analysis was performed
by Microsoft Excel and IBM SPSS Statistics package version 20.0 (IBM
Corporation, NY). Statistical comparisons were made using one-way ANOVA and
post-hoc Tukey HSD test. Results were considered statistically significant at p <
0.05. GraphPad Prism version 5.04 (GraphPad Software, San Diego, USA) was
used for the correlation analysis. Results in the text and Figures are expressed as
mean ± standard error of the mean.

96
3.3. Results and discussion
Sampling from the same cultivars was conducted throughout 28 months, covering
the full production cycle of olive trees, to determine the possible seasonal effects
on biophenol contents. The sampling started in 2012. In the previous year (2011),
a heavy crop load was received. The crop load was very low in 2012 as was
expected because of the alternate bearing nature of olive tree, but surprisingly, in
2013 again the crop load was very low, although a heavy crop load was obtained in
the 2014 season. The causes for low production during year 2013 may be due to
agricultural and environmental factors, though no significant environmental
changes could be observed.
In Australia, there are four seasons and the seasons are defined by grouping the
calendar months. The summer season consists of the three hottest months:
December, January and February. March, April and May represent the autumn
season. The three coldest months; June, July and August comprise the winter
season, and September, October and November are characterized as the spring
season. In Australia, olive trees produce flowers late in spring, while in the orchard
from where leaves were collected, olive trees produced flowers in December, which
is considered early summer. The fruit development and maturation occurred from
summer to autumn and the harvesting was done in early winter. In order to make
our data more meaningful, we divided the entire collection period season-wise and
statistically analysed the data for each parameter studied. The drying treatment was
selected for olive leaves on the basis of previous work (Kamran et al., 2015) and all
extracts analysed were obtained from leaves dried at 105 °C for three hours.

97
3.3.1. Dry matter content
Samples were dried at 105 °C to determine the moisture content and hence the dry
matter (DM). The average DM of olive leaves of studied cultivars is shown in
Figure 3.1. There was no significant difference (p ˃ 0.05) in average DM values of
the different cultivars studied over the total period of collection. However,
significant differences (p < 0.05) were observed due to the month of collection and
also in the interaction between the collection time and cultivar. When the studied
cultivars were compared for seasonal variation, no specific pattern was observed
for any season throughout the collection period. Significant differences were
observed for dry matter content due to season (p < 0.05) but no differences were
observed due to cultivars as well as no interaction was observed between season
and cultivar (p ˃ 0.05).
The DM content was lowest in November 2012 in all cultivars, which resulted in
relatively lower DM content in spring. The highest DM content was in April 2013
(56.40 ± 0.13 %) in Hardy’s Mammoth cultivar, whereas lowest DM content was
also obtained in Hardy’s Mammoth in November 2012 (42.2 ± 0.18 %). The values
are consistent with those previously published for other olive cultivars of
Mediterranean and African origins; 44-50% (Gómez-Cabrera et al., 1992; Martín-
García and Molina-Alcaide, 2008; Nourhène et al., 2008; Lafka et al., 2013), apart
from November 2012 samples, where all studied cultivars produced dry matter
within the range of 42 to 43%.
Analysing climatic data in Figure 3.2, some reasonable explanations for seasonal
variation in DM can be deduced. The most significant change in DM was the major
drop in November 2012. Between September and October 2012 (Figure 3.2), there
was an exceptionally low rainfall period followed by a large increase in rainfall in

98
November 2012 (the second highest rainfall value for the whole year). Dry weather
conditions are stressful to the olive plantation, thus nutrients (the major part of the
DM composition) are kept in leaves and are not directed to growth of flowering or
aerial parts. Once the heavy rain started in November 2012, the favourable climatic
conditions stimulated olive leaves to move their nutrients to the delayed flowering
process. On the other hand, the drop in DM in November 2013 (Figure 3.1) is not
prominent. This is because November 2013 was the second lowest month in rainfall
for 2013 (Figure 3.2). Similarly, the peak in DM in April 2013 and less prominent
peaking in April 2014 can be explained by a combination of physiological
maturation stage (fruiting) and climatic conditions. Before fruiting, leaves
accumulate nutrients to prepare the plant for the coming stage of increased energy
demand. In 2013, April had the lowest rainfall (climatic stress) so that accumulation
of nutrients in the survival parts of the plant (leaves) is vital. While in April 2014,
the peak is less prominent (Figure 3.1) due to the high rainfall during April 2014
(figure 3.2).
3.3.2. Total phenols (Folin-Ciocalteu)
Total phenol contents of olive leaves are presented in Figure 3.3. The total phenol
content changed significantly over time of collection (p < 0.05) but did not follow
a specific pattern for any month or season throughout the collection period, except
a drop in September each year. Significant differences were observed for total
phenol content among cultivars (p < 0.05), and an interaction between the
collection month and cultivar (p < 0.05) indicating that the cultivars differed in how
they changed over time. This is primarily due to the differences in the Hardy’s
Mammoth cultivar, which showed larger variation than other two cultivars. When
the samples were grouped into seasons, significant differences were observed for

99
season and for interaction between season and cultivar (p < 0.05). In summer,
significant differences were seen between all cultivars. Total phenol content of
Frantoio was significantly higher (p < 0.05) than both Leccino and Hardy’s
Mammoth, while Leccino had a higher (p < 0.05) content than Hardy’s Mammoth.
However in autumn, winter and spring seasons no differences (p ˃ 0.05) were
observed among all cultivars. Meanwhile, in a Tunisian olive cultivar, higher total
phenol content in leaves was reported in winter as compared to autumn (Brahmi, et
al., 2012b). The highest quantity of total phenols was in April 2014 for Frantoio
(150.2 ± 2.43 mg GAE/g DW), while Hardy’s Mammoth produced the lowest total
phenols, in June 2012 (59.6 ± 0.80 mg GAE/g DW). The level of total phenols
remained low in all cultivars in 2012, compared to 2013 and 2014. Total phenol
levels increased in late spring and early summer 2013, during flowering, then
decreased again during fruit initiation. The levels increased in autumn 2014, during
fruit growth in all cultivars with the highest levels seen in April 2014. The levels
then again decreased in May 2014, during fruit maturation. Overall the Leccino
cultivar accumulated the highest total phenols (p < 0.05).
Our results are in agreement with the findings of Franco et al. (2014) who reported
a decrease in total phenol content during fruit maturation although this has not
observed in all studied varieties. Our results fall within the reported literature values
59-144 mg/g DW (Orak et al., 2012; Ahmad-Qasem et al., 2013; Salah et al., 2013).
The total phenol contents of our study are relatively high compared to reported
literature values for European, Middle East and African varieties (Abaza et al.,
2011; Brahmi et al., 2013; Lafka et al., 2013; Al-Rimawi et al., 2014).
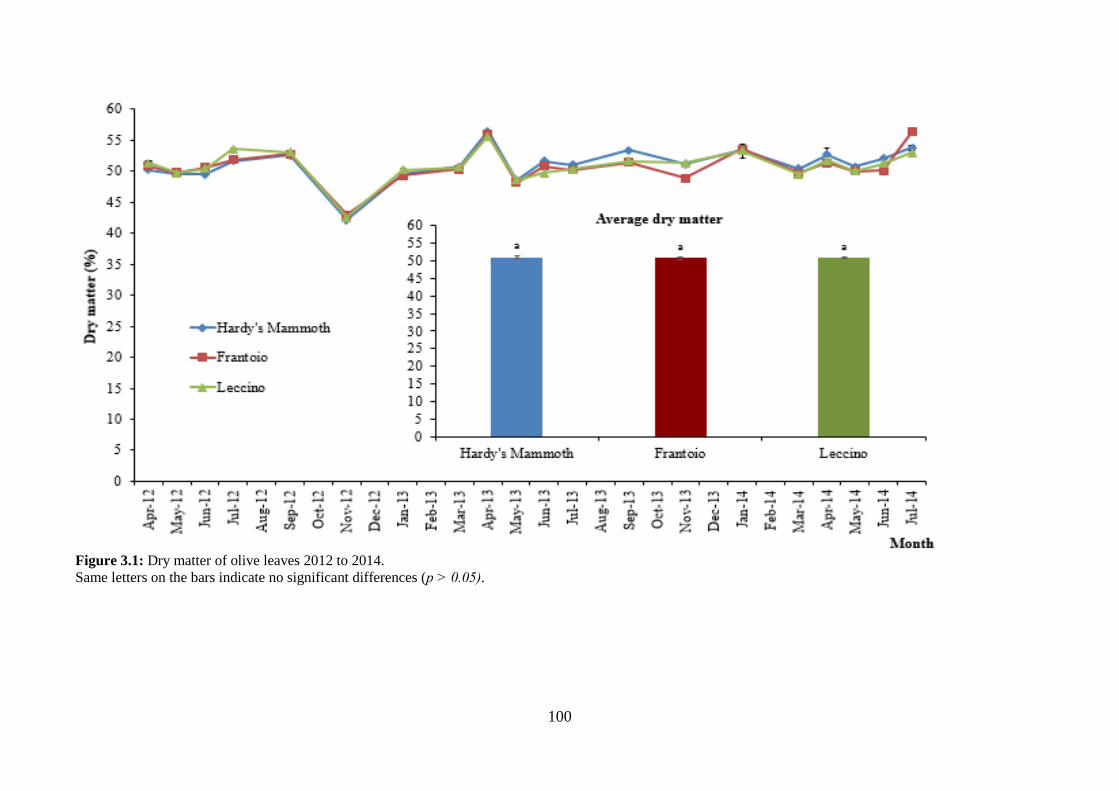
100
Figure 3.1: Dry matter of olive leaves 2012 to 2014.
Same letters on the bars indicate no significant differences (p ˃ 0.05).

101
Figure 3.2: Climate variation over the experimental timeframe.
Avr max Temp: average maximum temperature; Solar Exp: solar exposure
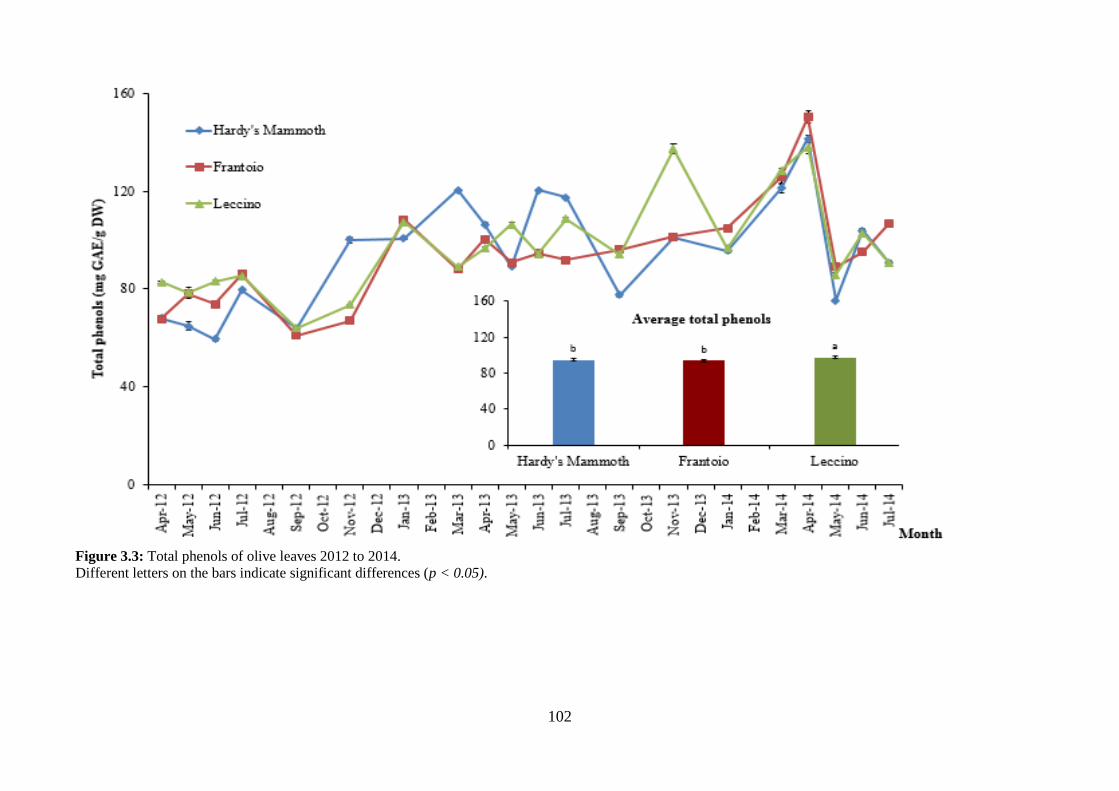
102
Figure 3.3: Total phenols of olive leaves 2012 to 2014.
Different letters on the bars indicate significant differences (p < 0.05).
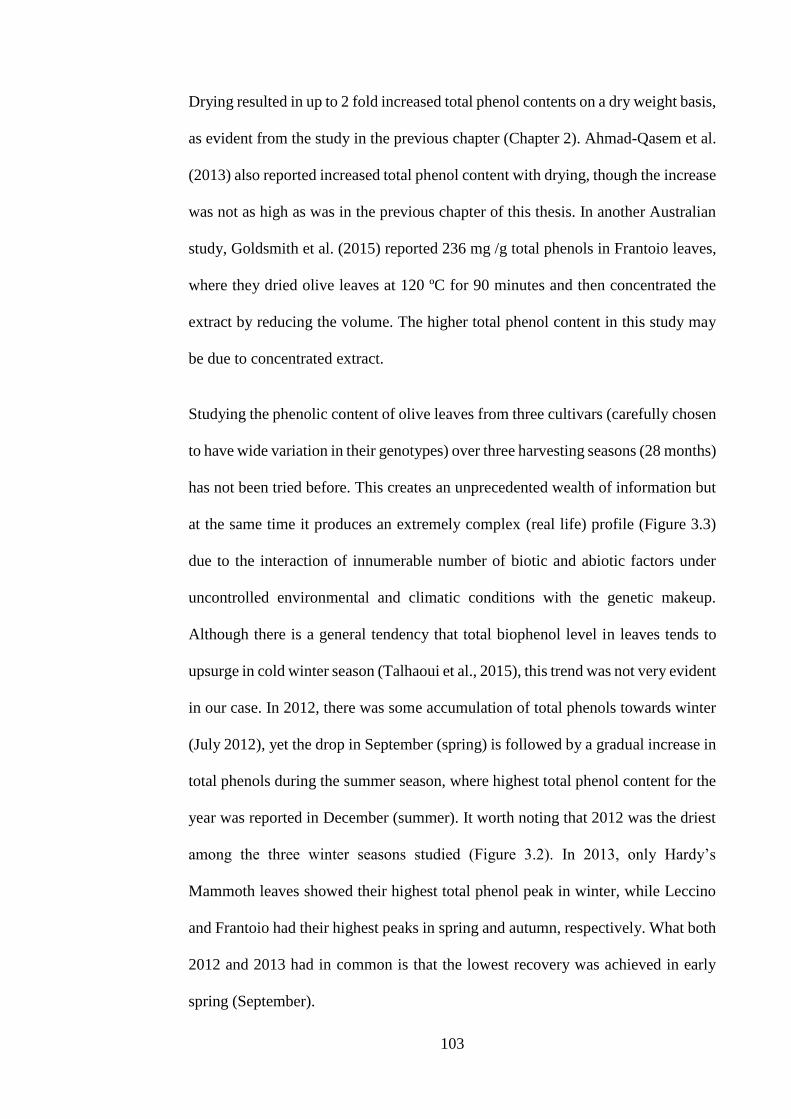
103
Drying resulted in up to 2 fold increased total phenol contents on a dry weight basis,
as evident from the study in the previous chapter (Chapter 2). Ahmad-Qasem et al.
(2013) also reported increased total phenol content with drying, though the increase
was not as high as was in the previous chapter of this thesis. In another Australian
study, Goldsmith et al. (2015) reported 236 mg /g total phenols in Frantoio leaves,
where they dried olive leaves at 120 ºC for 90 minutes and then concentrated the
extract by reducing the volume. The higher total phenol content in this study may
be due to concentrated extract.
Studying the phenolic content of olive leaves from three cultivars (carefully chosen
to have wide variation in their genotypes) over three harvesting seasons (28 months)
has not been tried before. This creates an unprecedented wealth of information but
at the same time it produces an extremely complex (real life) profile (Figure 3.3)
due to the interaction of innumerable number of biotic and abiotic factors under
uncontrolled environmental and climatic conditions with the genetic makeup.
Although there is a general tendency that total biophenol level in leaves tends to
upsurge in cold winter season (Talhaoui et al., 2015), this trend was not very evident
in our case. In 2012, there was some accumulation of total phenols towards winter
(July 2012), yet the drop in September (spring) is followed by a gradual increase in
total phenols during the summer season, where highest total phenol content for the
year was reported in December (summer). It worth noting that 2012 was the driest
among the three winter seasons studied (Figure 3.2). In 2013, only Hardy’s
Mammoth leaves showed their highest total phenol peak in winter, while Leccino
and Frantoio had their highest peaks in spring and autumn, respectively. What both
2012 and 2013 had in common is that the lowest recovery was achieved in early
spring (September).

104
3.3.3. Total flavonoids
Figure 3.4 represents the total flavonoid content of olive leaves. The level of total
flavonoids varied significantly among cultivars, over time (p < 0.05) and there was
an interaction between cultivar and time (p < 0.05). An interaction between the
collection month and cultivar indicates that the cultivars varied in how the total
flavonoid levels changed over time. This is mainly due to the cultivar Hardy’s
Mammoth, which showed larger changes than the other cultivars. Leccino and
Frantoio cultivars showed almost same behaviour in terms of accumulation of total
flavonoids. No obvious annual rhythms were observed for seasons throughout the
collection period apart from a decrease in September each year that coincides with
our earlier observation about total phenols. When the months were grouped into
seasons, significant differences were observed for season (p < 0.05) and for an
interaction between season and cultivar (p < 0.05). In winter, Hardy’s Mammoth
produced higher (p < 0.05) levels of total flavonoids than Frantoio and Leccino,
with Frantoio and Leccino not different (p ˃ 0.05) from each other. On the other
hand, in summer Frantoio produced significantly higher (p < 0.05) total flavonoids
than Hardy’s Mammoth and Leccino but Hardy’s Mammoth and Leccino were not
different from each other (p ˃ 0.05). No differences were observed among all
cultivars in autumn and spring season (p ˃ 0.05). Leaves of a Tunisian cultivar
collected in winter resulted in higher total flavonoid contents as compared to
autumn leaves (Brahmi, et al., 2012b). In the present study, the summer season
showed the highest and spring the lowest total flavonoids. The level of total
flavonoids in leaves increased during flowering but remained variable during fruit
growth and maturation. Hardy’s Mammoth produced the highest quantity (810.1 ±
8.06 mg QE/g DW) of total flavonoids, in April 2013, whereas the lowest quantity
was produced by Leccino (158.9 ± 4.03 mg QE/g DW), in November 2012. Overall
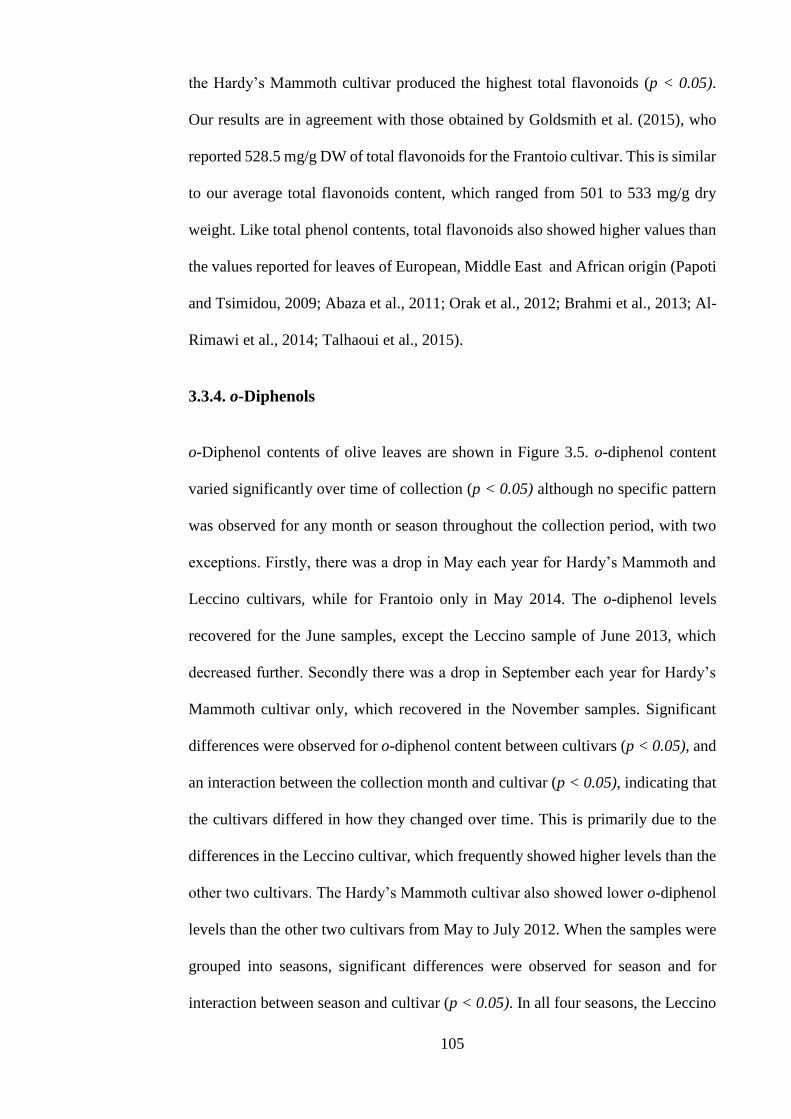
105
the Hardy’s Mammoth cultivar produced the highest total flavonoids (p < 0.05).
Our results are in agreement with those obtained by Goldsmith et al. (2015), who
reported 528.5 mg/g DW of total flavonoids for the Frantoio cultivar. This is similar
to our average total flavonoids content, which ranged from 501 to 533 mg/g dry
weight. Like total phenol contents, total flavonoids also showed higher values than
the values reported for leaves of European, Middle East and African origin (Papoti
and Tsimidou, 2009; Abaza et al., 2011; Orak et al., 2012; Brahmi et al., 2013; Al-
Rimawi et al., 2014; Talhaoui et al., 2015).
3.3.4. o-Diphenols
o-Diphenol contents of olive leaves are shown in Figure 3.5. o-diphenol content
varied significantly over time of collection (p < 0.05) although no specific pattern
was observed for any month or season throughout the collection period, with two
exceptions. Firstly, there was a drop in May each year for Hardy’s Mammoth and
Leccino cultivars, while for Frantoio only in May 2014. The o-diphenol levels
recovered for the June samples, except the Leccino sample of June 2013, which
decreased further. Secondly there was a drop in September each year for Hardy’s
Mammoth cultivar only, which recovered in the November samples. Significant
differences were observed for o-diphenol content between cultivars (p < 0.05), and
an interaction between the collection month and cultivar (p < 0.05), indicating that
the cultivars differed in how they changed over time. This is primarily due to the
differences in the Leccino cultivar, which frequently showed higher levels than the
other two cultivars. The Hardy’s Mammoth cultivar also showed lower o-diphenol
levels than the other two cultivars from May to July 2012. When the samples were
grouped into seasons, significant differences were observed for season and for
interaction between season and cultivar (p < 0.05). In all four seasons, the Leccino

106
cultivar produced significantly higher o-diphenols (p < 0.05) than Frantoio and
Hardy’s Mammoth. In the autumn, winter and summer seasons, the Frantoio
cultivar produced significantly higher o-diphenols than Hardy’s Mammoth cultivar
(p < 0.05), while in spring, Frantoio and Hardy’s Mammoth were not different from
each other (p ˃ 0.05).
The level of o-diphenols in leaves increased during flowering then decreased during
fruit initiation, but remained variable during fruit growth and maturation. The
maximum o-diphenol content was obtained in November 2013 with Leccino (97.7
± 0.40 mg CAE/g DW) and Hardy’s Mammoth produced the lowest content, in
January 2013 (34.6 ± 0.27 mg CAE/g DW). Overall, the Leccino cultivar
accumulated the highest o-diphenols (p < 0.05). In the present study, the winter and
spring seasons showed almost similar level of o-diphenols, which were better than
autumn and summer. Furthermore autumn was better than summer with regards to
o-diphenol contents. Similar findings were observed in leaves of a Tunisian cultivar
(Brahmi, et al., 2012b).
Our results for o-diphenols contents are in agreement with our previous study
(Kamran et al., 2015) but were considerably higher than reported literature values
0.88 to 2.42 mg/g DW (Brahmi, et al., 2012b; Brahmi et al., 2013). Drying resulted
in only a 50 % increase in o-diphenols contents as evident from previous work
(Chapter 2). Our data, however indicate a much higher o-diphenol content than
reported values. Limited data was available on o-diphenol content of Tunisian olive
leaves and we were not able to retrieve much data from other geographical
locations.

107
Figure 3.4: Total flavonoids of olive leaves 2012 to 2014.
Different letters on the bars indicate significant differences (p < 0.05).

108
Figure 3.5: o -diphenols of olive leaves 2012 to 2014.
Different letters on the bars indicate significant differences (p < 0.05).
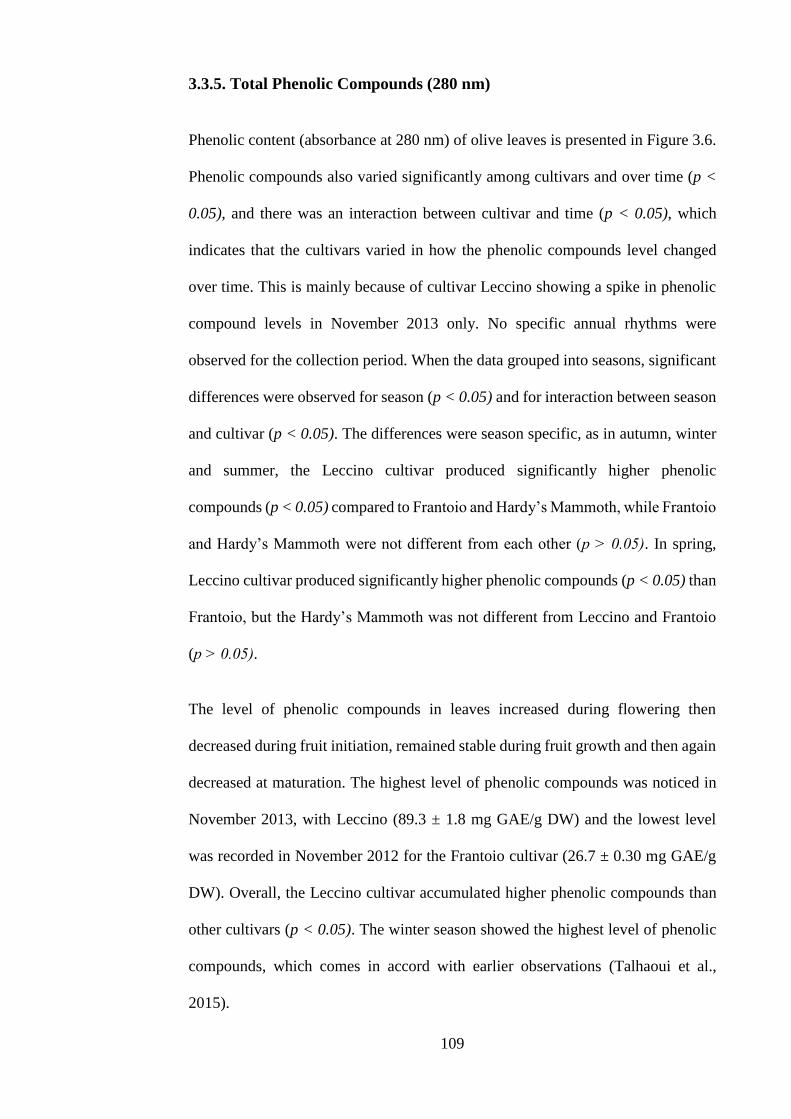
109
3.3.5. Total Phenolic Compounds (280 nm)
Phenolic content (absorbance at 280 nm) of olive leaves is presented in Figure 3.6.
Phenolic compounds also varied significantly among cultivars and over time (p <
0.05), and there was an interaction between cultivar and time (p < 0.05), which
indicates that the cultivars varied in how the phenolic compounds level changed
over time. This is mainly because of cultivar Leccino showing a spike in phenolic
compound levels in November 2013 only. No specific annual rhythms were
observed for the collection period. When the data grouped into seasons, significant
differences were observed for season (p < 0.05) and for interaction between season
and cultivar (p < 0.05). The differences were season specific, as in autumn, winter
and summer, the Leccino cultivar produced significantly higher phenolic
compounds (p < 0.05) compared to Frantoio and Hardy’s Mammoth, while Frantoio
and Hardy’s Mammoth were not different from each other (p ˃ 0.05). In spring,
Leccino cultivar produced significantly higher phenolic compounds (p < 0.05) than
Frantoio, but the Hardy’s Mammoth was not different from Leccino and Frantoio
(p ˃ 0.05).
The level of phenolic compounds in leaves increased during flowering then
decreased during fruit initiation, remained stable during fruit growth and then again
decreased at maturation. The highest level of phenolic compounds was noticed in
November 2013, with Leccino (89.3 ± 1.8 mg GAE/g DW) and the lowest level
was recorded in November 2012 for the Frantoio cultivar (26.7 ± 0.30 mg GAE/g
DW). Overall, the Leccino cultivar accumulated higher phenolic compounds than
other cultivars (p < 0.05). The winter season showed the highest level of phenolic
compounds, which comes in accord with earlier observations (Talhaoui et al.,
2015).

110
Figure 3.6: Phenolic compounds (280 nm) of olive leaves 2012 to 2014.
Different letters on the bars indicate significant differences (p < 0.05).

111
3.3.6. Hydroxycinnamic acid derivatives
Figure 3.7 represents the hydroxycinnamic acid derivatives of olive leaves.
Hydroxycinnamic acid derivatives also varied significantly among cultivars, over
time (p < 0.05) and there was an interaction between cultivar and time (p < 0.05),
which indicate that the cultivars varied in how the level of hydroxycinnamic acid
derivatives changed over time. There were no obvious annual rhythms observed
throughout the collection period. When the data were grouped into seasons,
significant differences were observed for season (p < 0.05) and for the interaction
between season and cultivar (p < 0.05). In all four seasons, Leccino cultivar
produced significantly higher hydroxycinnamic acid derivatives (p < 0.05) as
compared to Frantoio and Hardy’s Mammoth. The Frantoio cultivar produced
significantly higher hydroxycinnamic acid derivatives than Hardy’s Mammoth
cultivar in autumn and winter (p < 0.05), but produced the same levels in spring
and summer (p ˃ 0.05).
The level of hydroxycinnamic acid derivatives in leaves increased during flowering
then decreased during fruit initiation, and remained variable during fruit growth and
maturation. The highest level of hydroxycinnamic acid derivatives was recorded in
November 2013 (30.2 ± 0.60 mg CAE/g DW) for Leccino, while the lowest level
was noticed in November 2012 (8.3 ± 0.10 mg CAE/g DW) for Frantoio. Our results
are in accord with the findings of (Mert et al., 2013), who reported from 5 to 32.7
mg/g of 3-hydrocinnamic acid. Our results are also close to the value reported in a
previous study (Obied, et al., 2005b), where levels were reported up to 8.22 mg/g
in olive mill waste. Overall, the Leccino cultivar accumulated more
hydroxycinnamic acid derivatives than the other cultivars (p < 0.05). Generally, the
winter and spring seasons showed almost similar levels, which

112
Figure 3.7: Hydroxycinnamic acid derivatives of olive leaves 2012 to 2014.
Different letters on the bars indicate significant differences (p < 0.05).
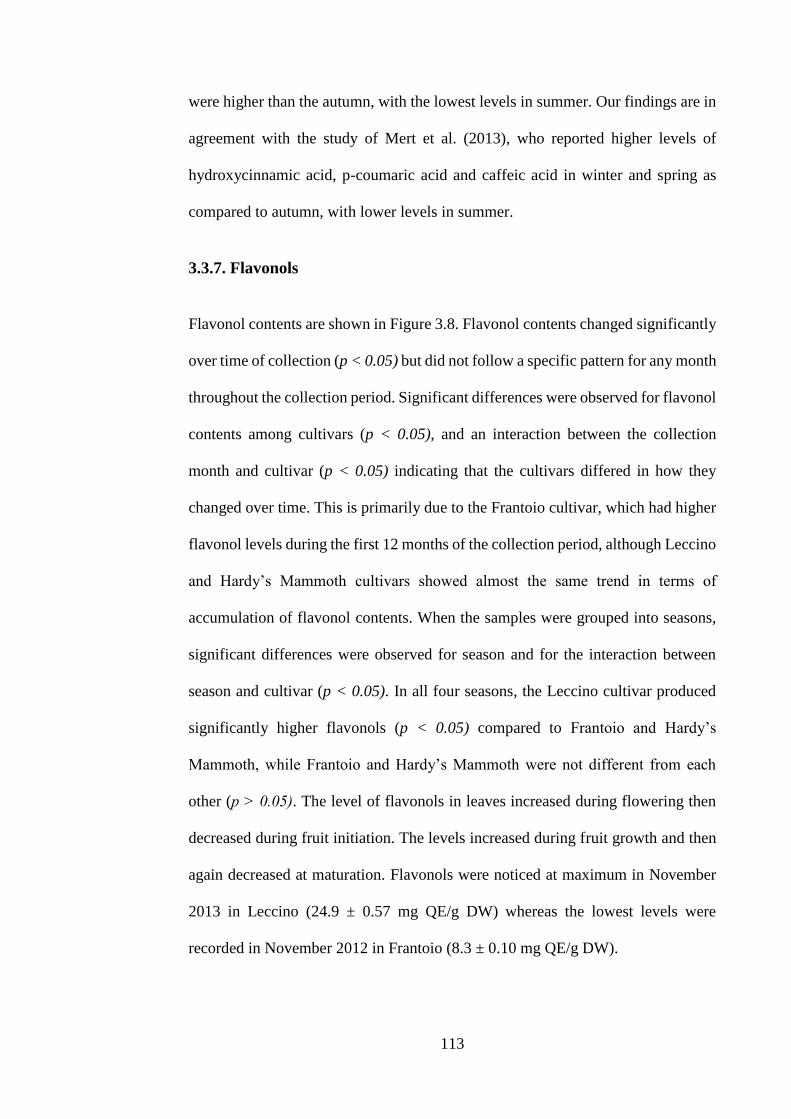
113
were higher than the autumn, with the lowest levels in summer. Our findings are in
agreement with the study of Mert et al. (2013), who reported higher levels of
hydroxycinnamic acid, p-coumaric acid and caffeic acid in winter and spring as
compared to autumn, with lower levels in summer.
3.3.7. Flavonols
Flavonol contents are shown in Figure 3.8. Flavonol contents changed significantly
over time of collection (p < 0.05) but did not follow a specific pattern for any month
throughout the collection period. Significant differences were observed for flavonol
contents among cultivars (p < 0.05), and an interaction between the collection
month and cultivar (p < 0.05) indicating that the cultivars differed in how they
changed over time. This is primarily due to the Frantoio cultivar, which had higher
flavonol levels during the first 12 months of the collection period, although Leccino
and Hardy’s Mammoth cultivars showed almost the same trend in terms of
accumulation of flavonol contents. When the samples were grouped into seasons,
significant differences were observed for season and for the interaction between
season and cultivar (p < 0.05). In all four seasons, the Leccino cultivar produced
significantly higher flavonols (p < 0.05) compared to Frantoio and Hardy’s
Mammoth, while Frantoio and Hardy’s Mammoth were not different from each
other (p ˃ 0.05). The level of flavonols in leaves increased during flowering then
decreased during fruit initiation. The levels increased during fruit growth and then
again decreased at maturation. Flavonols were noticed at maximum in November
2013 in Leccino (24.9 ± 0.57 mg QE/g DW) whereas the lowest levels were
recorded in November 2012 in Frantoio (8.3 ± 0.10 mg QE/g DW).
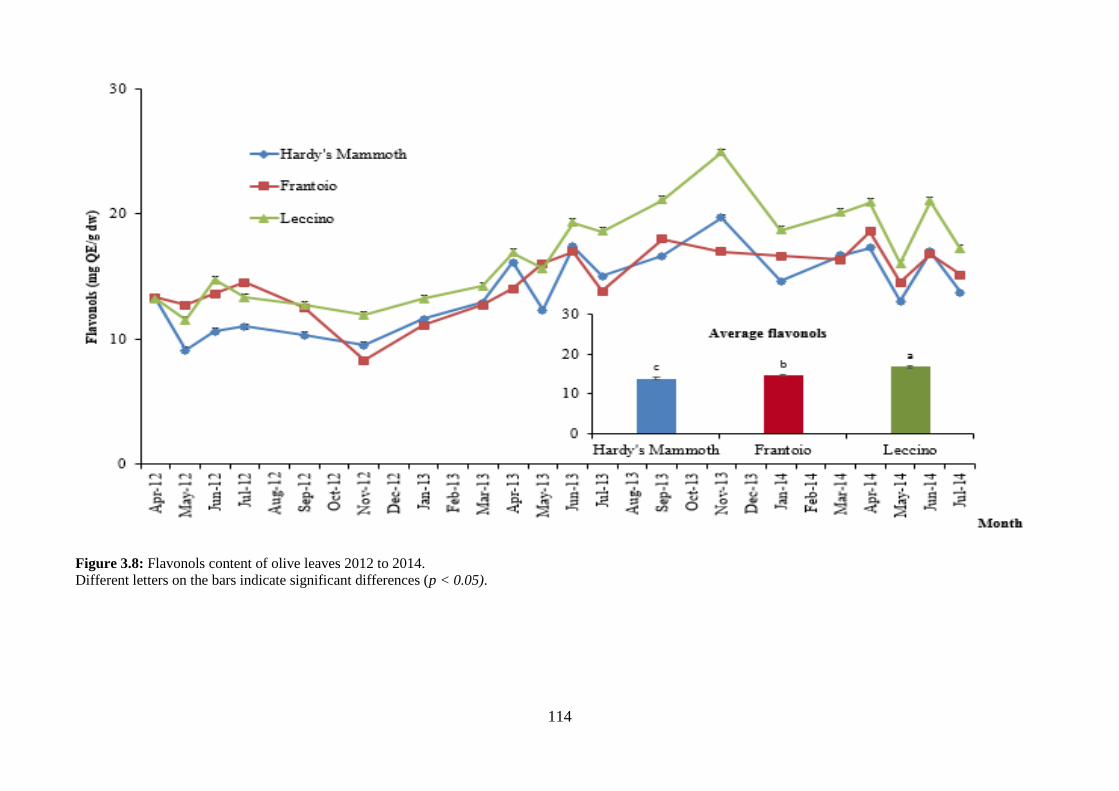
114
Figure 3.8: Flavonols content of olive leaves 2012 to 2014.
Different letters on the bars indicate significant differences (p < 0.05).

115
Overall the Leccino cultivar produced higher flavonols than other cultivars (p <
0.05). The winter and spring seasons showed similar levels, which were higher than
autumn, which had slightly more flavonols than summer. Our results for flavonol
contents are similar to the findings of Obied, et al., (2005b), who reported 8.85 mg/g
in olive mill waste. Other than this, data on the flavonol contents of olive leaves is
scarce and we were not able to compare our results with other studies.
3.3.8. Antioxidant activity
3.3.8.1. ABTS
The ABTS radical scavenging activity of olive leaves is displayed in Figure 3.9.
ABTS radical scavenging capacity of olive leaves varied significantly among
cultivars (p < 0.05) and over time of collection (p < 0.05) and there was an
interaction between cultivar and time of collection (p < 0.05). An interaction
between the collection month and cultivar indicates that the cultivars varied in how
the ABTS radical scavenging activity changed over time. No noticeable annual
rhythms observed throughout the collection period apart from a decrease in
September each year. When the data grouped into seasons, significant differences
were observed for season (p < 0.05) and for the interaction between season and
cultivar (p < 0.05). In summer, Hardy’s Mammoth cultivar showed significantly
less ABTS radical scavenging activity (p < 0.05) than Frantoio and Leccino
cultivars, which were not different from each other (p ˃ 0.05). In the spring, autumn
and winter seasons, all the three cultivars were not different from each other (p ˃
0.05).
The ABTS•+ radical scavenging activity of olive leaves increased during flowering
then decreased during fruit initiation, remained variable during fruit growth and

116
maturation. The highest ABTS•+ radical scavenging activity was noticed in
November 2013 in Leccino (786 ± 6.63 µ Mol TEAC/g DW) while the lowest
activity was in November 2012, in the Frantoio cultivar (331 ± 5.83 µ Mol TEAC/g
DW). Overall, Leccino cultivar showed higher ABTS radical scavenging activity
than other cultivars (p < 0.05). Our results are in agreement with the findings of
Abaza et al. (2011) who reported ABTS activity values of olive leaves up to 1064.25
µMol TEAC/g DW. In conclusion, winter and summer seasons showed the same
capacity, which was higher than the autumn and spring seasons, whereas autumn
was better than spring season in terms of ABTS radical scavenging activity.
3.3.8.2. DPPH
The DPPH radical scavenging activity of olive leaves is presented in Figure 3.10.
The DPPH radical scavenging capacity of olive leaves varied significantly among
cultivars (p < 0.05) and over time of collection (p < 0.05), and there was an
interaction between cultivar and time of collection (p < 0.05).This is mainly due to
great variation in the last 10 months of collection, although all cultivars followed
almost the same general trends. There were no clear annual rhythms observed
throughout the collection period apart from a decrease in September each year.
When the data was grouped into seasons, significant differences were observed for
season (p < 0.05) and for interaction between season and cultivar (p < 0.05). In the
summer season, the Leccino cultivar showed significantly higher DPPH radical
scavenging activity (p < 0.05) than Hardy’s Mammoth cultivar, however Frantoio
and Leccino were not different from each other (p ˃ 0.05).

117
Figure 3.9: ABTS radical scavenging activity of olive leaves 2012 to 2014.
Different letters on the bars indicate significant differences (p < 0.05).

118
Figure 3.10: DPPH radical scavenging activity of olive leaves 2012 to 2014.
Different letters on the bars indicate significant differences (p < 0.05).

119
In the spring, autumn and winter seasons none of the cultivars were significantly
different from each other (p ˃ 0.05). The DPPH radical scavenging activity of olive
leaves increased during flowering then decreased during fruit initiation and growth,
then again increased during maturation. DPPH radical scavenging activity was
recorded highest in November 2013 for Leccino (913 ± 8.17 µMol TEAC/g DW),
while the lowest activity was also noticed for Leccino in March 2014 (159 ± 4.40
µMol TEAC/g DW). Overall, the Leccino cultivar showed higher DPPH radical
scavenging activity than other cultivars (p < 0.05), though a cultivar effect on
antioxidant potential of olive leaves has been reported to be partial (Papoti and
Tsimidou, 2009). DPPH radical scavenging activity of olive leaves for seasons
decreased in the following order: summer ˃ winter ˃ spring ˃ autumn.
The results of ABTS and DPPH radical scavenging activity for the same extract
were not the same, as these two assays are different. Differences in the results of
the two assays have also been reported previously (Abaza et al., 2011; Brahmi et
al., 2013). Olive leaves are a good source of antioxidants year-round as indicated
by the results. Papoti and Tsimidou (2009) also reported similar findings and
suggested their suitability for commercialization throughout the year. A good
antioxidant activity has been noticed for all cultivars throughout the collection
period.
OLEs prepared in the study were high in oleuropein content and it has been
proposed previously that the structures of secoiridoids are closely correlated to
antioxidant activity (Goulas et al., 2012). The antioxidant potency of the biophenol
depends on its structure. Goulas et al. (2012) proposed that the number and position
of hydroxyl groups on the aromatic ring as well as the structure of elenolic acid
(open; dialdehydic form or closed; aldehydic form) are important factors for

120
determining the antioxidant activity of olive biophenols. Biophenols that have two
hydroxyl groups linked to an aromatic ring on the ortho position displayed higher
antioxidant activities compared to monohydroxy-substituted ring biophenols and
when the ortho-dihydroxyl groups from aromatic ring are absent, the antioxidant
activity reduced, which is evident in case of tyrosol, which has a 3-fold lower
antioxidant activity as compared to hydroxytyrosol (Goulas et al., 2012).
3.3.9. High Performance Liquid Chromatography (HPLC) analysis
Though a different HPLC method was developed for this study, and different
solvents were used from that of the previous work (Chapter 2), the same biophenolic
compounds were observed for all cultivars as were observed in that work. . The
method developed for this study resulted in rapid and clear separation of olive leaf
biophenols. The HPLC results for the olive leaf extracts revealed only quantitative
differences but no qualitative differences among all studied cultivars throughout the
collection period. Talhaoui et al. (2015) reported similar findings with olive leaves
of six Spanish cultivars at different growth stages. Our results are also in agreement
with the study of Salah et al. (2013) who reported no qualitative differences among
eight cultivars of different origins grown in the same place under same
geographical, geological, climatic and agricultural conditions. On the contrary,
Brahmi et al. (2013) determined the variation in phenolic contents in two Tunisian
cultivars in two seasons and reported significant quantitative and qualitative
differences in phenolic compounds. Furthermore they proposed that these
differences were due to modulation of biosynthetic pathways which are involved in
important ecological and biological functions, like the plant’s defence mechanism
against pathogens. The authors emphasized that the reason for variation was the
plant needs. Geographical differences, in addition to different cultivars, might come
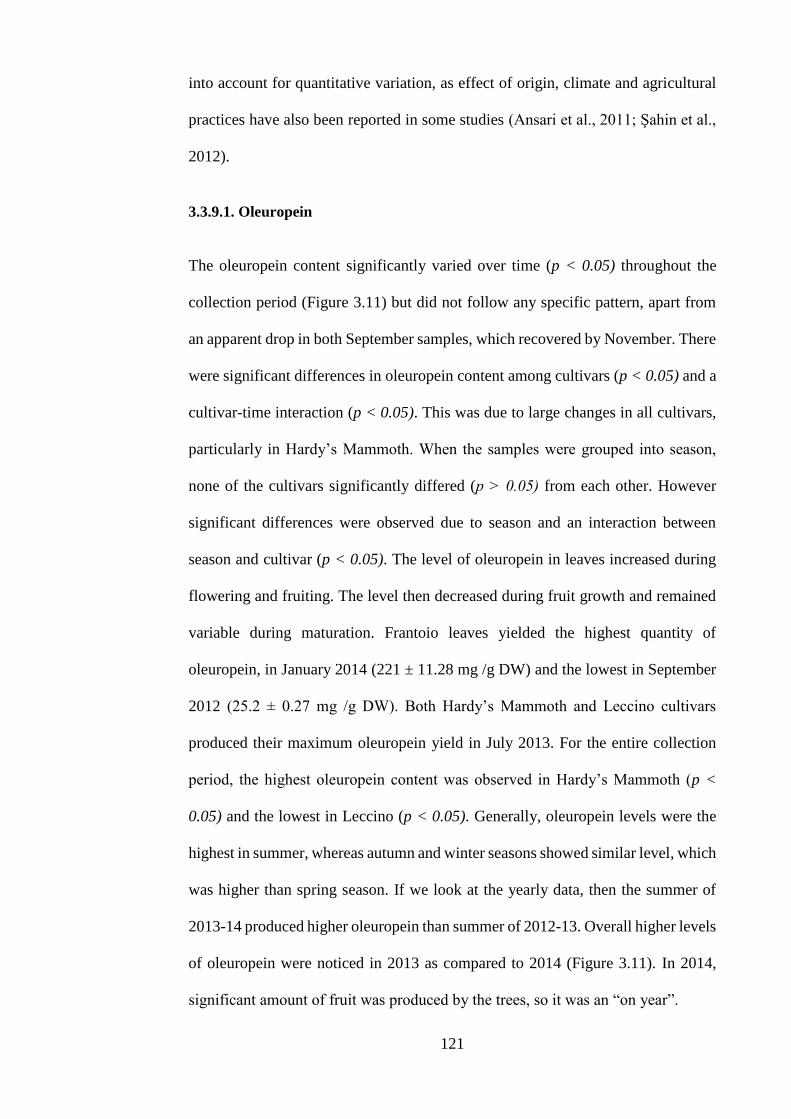
121
into account for quantitative variation, as effect of origin, climate and agricultural
practices have also been reported in some studies (Ansari et al., 2011; Şahin et al.,
2012).
3.3.9.1. Oleuropein
The oleuropein content significantly varied over time (p < 0.05) throughout the
collection period (Figure 3.11) but did not follow any specific pattern, apart from
an apparent drop in both September samples, which recovered by November. There
were significant differences in oleuropein content among cultivars (p < 0.05) and a
cultivar-time interaction (p < 0.05). This was due to large changes in all cultivars,
particularly in Hardy’s Mammoth. When the samples were grouped into season,
none of the cultivars significantly differed (p ˃ 0.05) from each other. However
significant differences were observed due to season and an interaction between
season and cultivar (p < 0.05). The level of oleuropein in leaves increased during
flowering and fruiting. The level then decreased during fruit growth and remained
variable during maturation. Frantoio leaves yielded the highest quantity of
oleuropein, in January 2014 (221 ± 11.28 mg /g DW) and the lowest in September
2012 (25.2 ± 0.27 mg /g DW). Both Hardy’s Mammoth and Leccino cultivars
produced their maximum oleuropein yield in July 2013. For the entire collection
period, the highest oleuropein content was observed in Hardy’s Mammoth (p <
0.05) and the lowest in Leccino (p < 0.05). Generally, oleuropein levels were the
highest in summer, whereas autumn and winter seasons showed similar level, which
was higher than spring season. If we look at the yearly data, then the summer of
2013-14 produced higher oleuropein than summer of 2012-13. Overall higher levels
of oleuropein were noticed in 2013 as compared to 2014 (Figure 3.11). In 2014,
significant amount of fruit was produced by the trees, so it was an “on year”.

122
Figure 3.11: Oleuropein content of olive leaves 2012 to 2014.
Different letters on the bars indicate significant differences (p < 0.05).

123
Our findings are in agreement with Mert et al. (2013), who reported lower levels of
oleuropein in an “on year” as compared to an “off year” and the lowest level was
found during embryo development and the pit-hardening stage, whereas the highest
level was reported in a dormant period. Furthermore, (Malik and Bradford, 2006)
reported an increasing trend of oleuropein from the flowering to fruiting stage, after
floral bud differentiation and then a decreasing trend during fruit maturation. In this
study, oleuropein levels from the flowering to fruiting were high, while lower levels
of oleuropein during fruit maturation was observed. In a study in the USA, the
Leccino cultivar produced the highest level (148.32 mg/g fresh weight) of
oleuropein (Şahin et al., 2012). The authors reported that the same cultivar showed
significantly lower oleuropein content at different collection times. These findings
coincide with our findings that the time of collection had significant effect on
oleuropein content. Similar findings were observed by Papoti and Tsimidou (2009)
who reported that two Greek cultivars showed higher oleuropein content one year,
but the same cultivars did not show the same trend the next year, and the cultivars
which showed low levels in the first year, accumulated moderate levels the next
year. Şahin et al. (2012) reported that both cultivar and season of collection affected
the oleuropein content, whereas Papoti and Tsimidou (2009) have the opinion that
oleuropein recovery depends on time of collection, irrespective of cultivar.
Caffeic acid and chlorogenic acid are said to play a central role in alternate bearing
(Mert et al., 2013). It has been reported that concentrations of chlorogenic acid are
usually 3 to 4 times higher in the mature leaves of the previous season of fruit-
bearing trees as compared to the leaves of trees without fruit (Ryan et al., 2003).
The changes in the levels of chlorogenic acid occurring during the flowering and
fruit set is involved in alternate bearing (Ryan et al., 2003).

124
The changes in the levels of chlorogenic acid occurring during the flowering and
fruit set is involved in alternate bearing (Ryan et al., 2003). However, relatively low
hydroxycinnamic acid derivatives were noted in summer 2012-13, which was
flowering to fruit set period. The lower production might also be linked with
cinnamic acid, which is thought to play a role in crop load (Lavee et al., 1986; Mert
et al., 2013). However, this could not be verified in the current study due to the
absence of these compounds in our sample.
3.3.10. Correlation analysis
Correlation analysis of data revealed moderately positive (r2 = 0.51) correlation
between total flavonoid content and antioxidant activity, measured by ABTS and
DPPH radical scavenging assays (Figure 3.12 a and b). Oleuropein showed
moderately positive correlation (r2 = 0.57) with total flavonoids (Figure 3.13 a) and
ABTS activity (r2 = 0.51, Figure 3.13 b). However oleuropein showed a weak
correlation with total phenols (r2 = 0.25, Figure 3.14 a) DPPH activity (r2 = 0.29,
Figure 3.14 b), and phenolic compounds (r2 = 0.26, Figure 3.15 a). Total phenol
content also displayed a weak correlation (r2 = 0.32) with ABTS activity (Figure
3.16 a) but surprisingly, total phenol content showed no correlation (r2 = 0.004)
with DPPH activity (Figure 3.16 b). On the other hand, oleuropein also
demonstrated no correlation with o-diphenol contents (r2 = 0.0014, Figure 3.15 b),
hydroxycinnamic acid derivatives (r2 = 0.0014, Figure 3.17 a) and flavonols (r2 =
0.053, Figure 3.17b). The trend of oleuropein content and antioxidant activity
throughout the collection period is presented in Figure 3.18. Oleuropein displayed
almost the same trend as the ABTS and DPPH scavenging activity for most of the
months, with only a few exceptions. This trend is consistent with the correlation of
oleuropein content and antioxidant activity (Figure 3.13b and 3.14b).
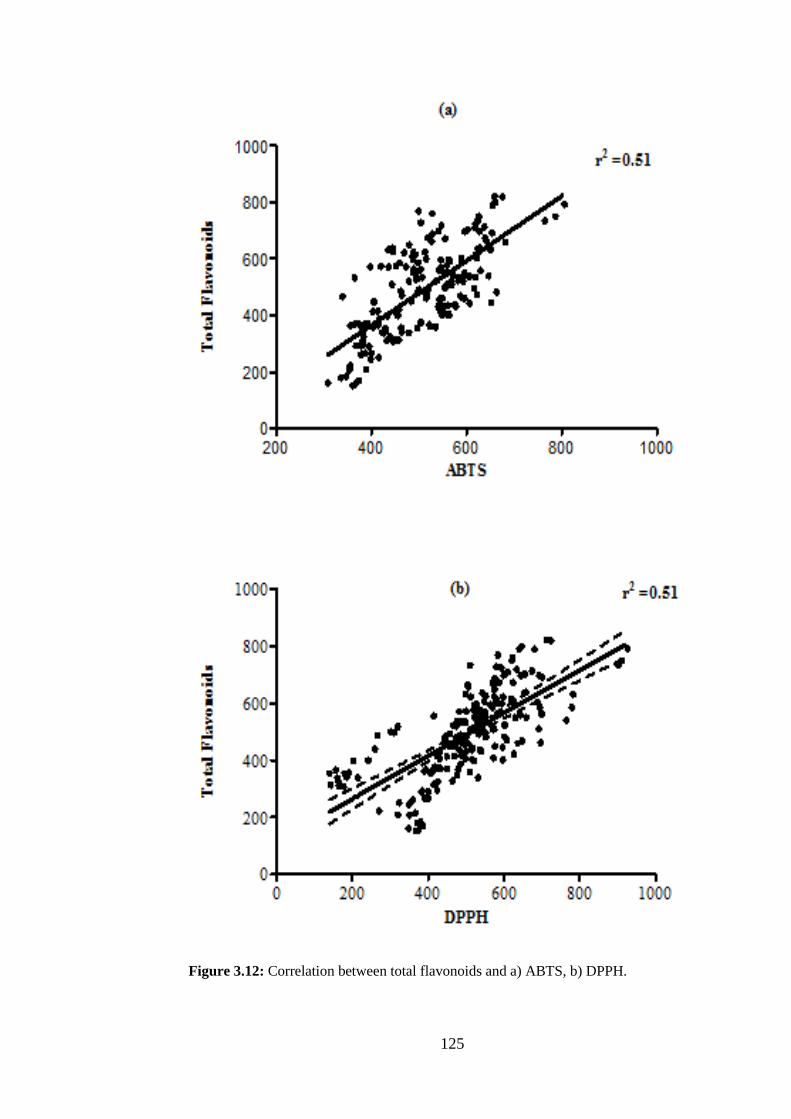
125
Figure 3.12: Correlation between total flavonoids and a) ABTS, b) DPPH.
126
Figure 3.13: Correlation between oleuropein and a) total flavonoids, b) ABTS.
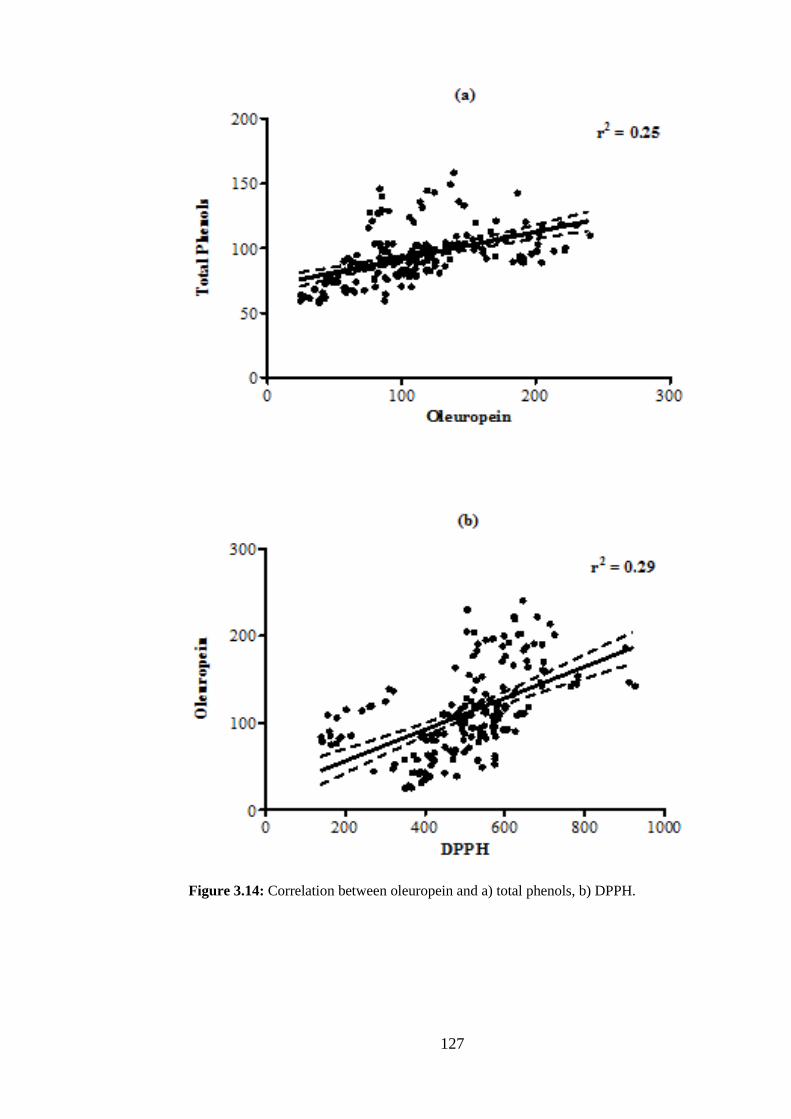
127
Figure 3.14: Correlation between oleuropein and a) total phenols, b) DPPH.
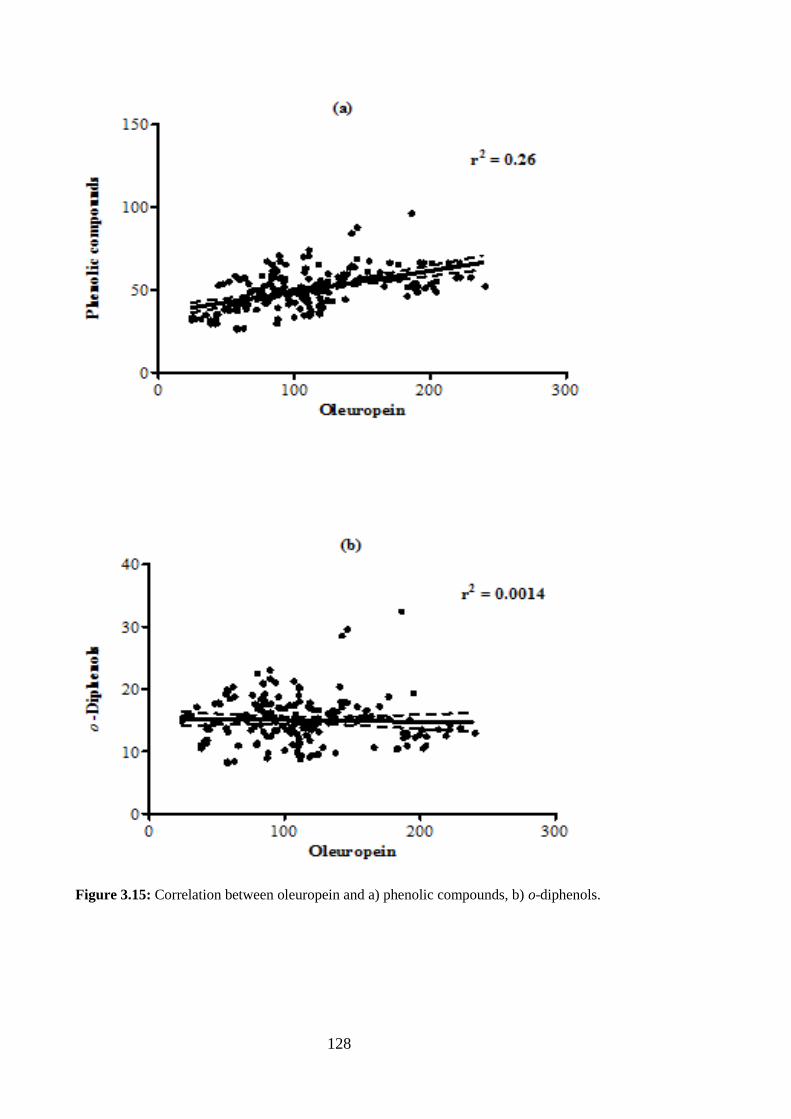
128
Figure 3.15: Correlation between oleuropein and a) phenolic compounds, b) o-diphenols.

129
Figure 3.16: Correlation between total phenols and a) ABTS, b) DPPH.
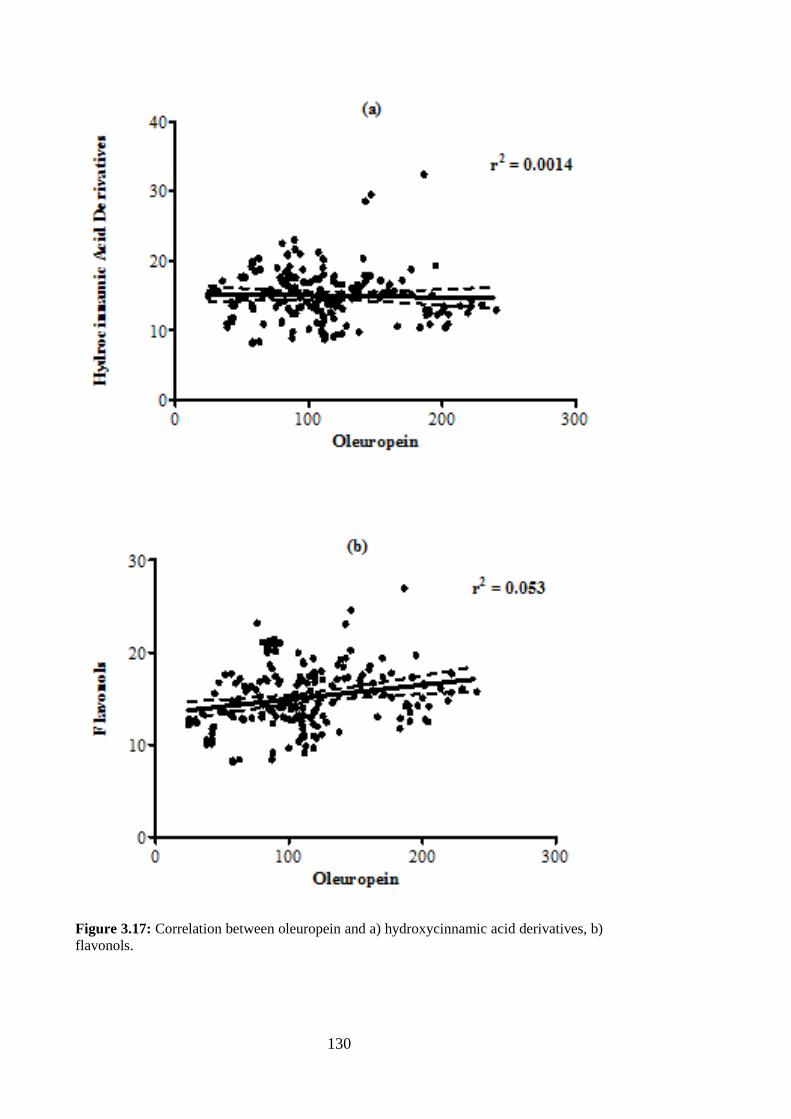
130
Figure 3.17: Correlation between oleuropein and a) hydroxycinnamic acid derivatives, b)
flavonols.
131
Usually it has been commented that higher antioxidant capacity of olive leaves is
credited to high oleuropein content (Salah et al., 2013). Correlation analysis of our
data displayed weak to moderate correlation of oleuropein and flavonoids with
ABTS and DPPH radical scavenging activity. Though Salah et al. (2013) reported
no correlation between oleuropein and anti-radical activity, they still suggested that
high anti-radical activity of some varieties relates to high oleuropein content. Our
extracts also exhibited high antioxidant activities and oleuropein content but still
we found only moderate correlation between them. Almost no correlation was
found between total phenols and DPPH activity, whereas a weak correlation was
found between total phenols and ABTS. Though the antioxidant activity of olive
leaves was correlated with biophenols, both phenolic and flavonoid compounds are
responsible for the high antioxidant activity of olive leaves (Lee et al., 2009;
Brahmi, et al., 2012b; Salah et al., 2013). Abaza et al. (2011) suggested that the
trolox equivalent antioxidant activity depends more on flavonoids than on total
phenols. Nevertheless, it has been suggested that in addition to oleuropein, other
secoiridoids and flavonoids also contribute to the antioxidant potential of olive leaf.
On the same level of total phenols, variation in antioxidant activity has also been
reported and the synergistic behaviour of olive leaf biophenols is also a very well
documented phenomenon (Benavente-Garcıa et al., 2000; Singh et al., 2008; Papoti
and Tsimidou, 2009).
The results of this study present relatively high biophenol contents compared to
reported values. The probable reason for that is the drying treatment, as reported in
the Chapter 2. The drying resulted in higher biophenol recoveries and antioxidant
activities from oven-dried leaves at 105 °C as compared with fresh olive leaf
extracts. Moreover, the quantitative differences in biophenol contents reported in
the literature depend on genetic and environmental factors, as outlined before.
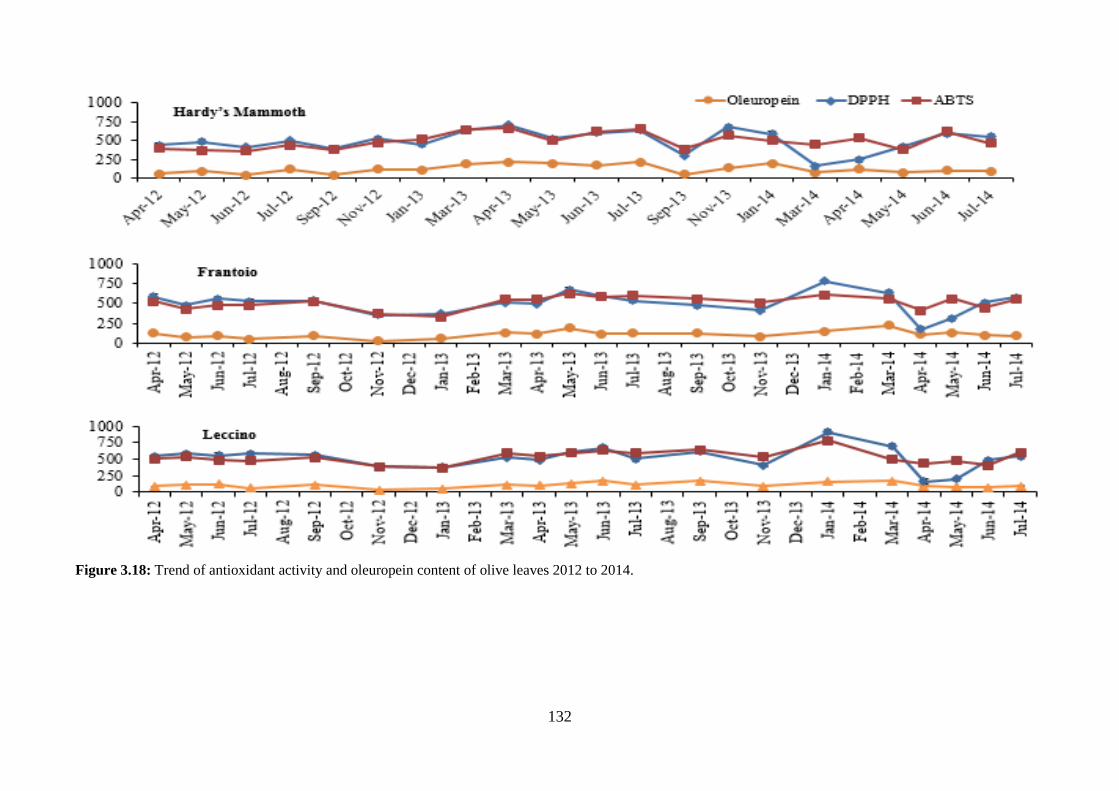
132
Figure 3.18: Trend of antioxidant activity and oleuropein content of olive leaves 2012 to 2014.
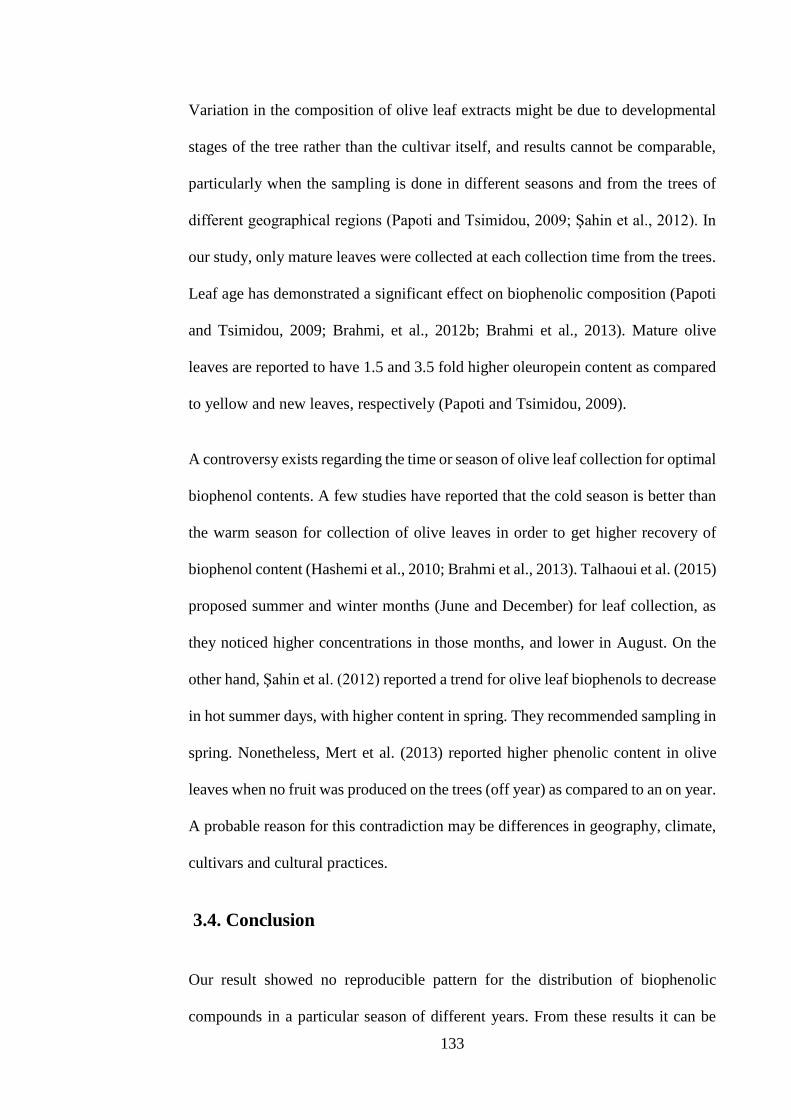
133
Variation in the composition of olive leaf extracts might be due to developmental
stages of the tree rather than the cultivar itself, and results cannot be comparable,
particularly when the sampling is done in different seasons and from the trees of
different geographical regions (Papoti and Tsimidou, 2009; Şahin et al., 2012). In
our study, only mature leaves were collected at each collection time from the trees.
Leaf age has demonstrated a significant effect on biophenolic composition (Papoti
and Tsimidou, 2009; Brahmi, et al., 2012b; Brahmi et al., 2013). Mature olive
leaves are reported to have 1.5 and 3.5 fold higher oleuropein content as compared
to yellow and new leaves, respectively (Papoti and Tsimidou, 2009).
A controversy exists regarding the time or season of olive leaf collection for optimal
biophenol contents. A few studies have reported that the cold season is better than
the warm season for collection of olive leaves in order to get higher recovery of
biophenol content (Hashemi et al., 2010; Brahmi et al., 2013). Talhaoui et al. (2015)
proposed summer and winter months (June and December) for leaf collection, as
they noticed higher concentrations in those months, and lower in August. On the
other hand, Şahin et al. (2012) reported a trend for olive leaf biophenols to decrease
in hot summer days, with higher content in spring. They recommended sampling in
spring. Nonetheless, Mert et al. (2013) reported higher phenolic content in olive
leaves when no fruit was produced on the trees (off year) as compared to an on year.
A probable reason for this contradiction may be differences in geography, climate,
cultivars and cultural practices.
3.4. Conclusion
Our result showed no reproducible pattern for the distribution of biophenolic
compounds in a particular season of different years. From these results it can be

134
assumed that accumulation of biophenols in olive leaves under uncontrolled
conditions is a very complex process, where a suite of factors interact with each
other to determine the final outcome. Shorter term studies where one or two seasons
are examined can lead to oversimplification. Brahmi, et al. (2012b) reported a
seasonal pattern of increasing total phenols, o-diphenols and flavonoid contents
between the leaves harvested at two different stages (autumn and winter). Their
findings cannot be compared with the results of our study due to the fact that they
only used two harvesting times and sampling was done once, not in the following
year.
Harvesting time has a very significant effect on the phenol content and antioxidant
activity of olive leaves. We support the earlier conclusion (Papoti and Tsimidou,
2009) that the level of individual biophenols depends more upon the sampling
period than on cultivar or age of leaves. We also confirm that individual compounds
peak at different times(Heimler et al., 1996). Season and cultivar had an impact on
biophenol content, as can be seen from the results, and similar observations have
been reported previously by other authors (Hashemi et al., 2010; Şahin et al., 2012;
Brahmi et al., 2013; Talhaoui et al., 2015).
The present study pointed out that the time of collection is the most influential
parameter with regards to olive leaves suitability for commercialization. This study
demonstrated that for maximum recoveries of total phenolic compounds and higher
antioxidant activity, Leccino cultivar was the most appropriate of the cultivars
tested, whereas in order to get higher total flavonoids and oleuropein content,
Hardy’s Mammoth was the best cultivar. As far as season is concerned, the results
indicate that the summer season was better for optimal antioxidant activity and for
maximum recovery of biophenols including oleuropein. Oleuropein is the major

135
contributor to antioxidant activity of olive leaves, yet there is a significant
synergism between oleuropein and other antioxidant biophenols.
136
Chapter 4. Comparative study of in-vitro
antioxidant and antidiabetic activities of
Australian olive leaf extracts
4.1. Introduction
Metabolic syndrome is a condition where risk factors for developing cardiovascular
disease and type 2 diabetes cluster together. Although in scientific publications, the
definition of metabolic syndrome may differ to some extent, its characteristic
features or components are the same. These include obesity, insulin resistance,
impaired glucose tolerance, hypertension, and dyslipidemia as major changes. In
addition, a prothrombotic state, increased fibrinogen, increased blood viscosity,
elevated microalbuminuria, increased uric acid, decreased plasminogen activator
and elevated plasminogen activator inhibitor-1 are minor changes ( Hansen, 1999).
Metabolic syndrome is thought to be related with oxidative stress, and high
oxidative damage has been noticed in patients with metabolic syndrome
(Panagiotakos and Polychronopoulos, 2005; Roberts and Sindhu, 2009). Obesity is
the major risk factor or contributor to metabolic syndrome and it has been reported
that oxidative stress is involved in the pathogenic mechanism of obesity, while fat
accumulation is correlated with oxidative stress in humans and mice (Furukawa et
al., 2004). Oxidative stress thought to be responsible for DNA damage, lipid
peroxidation, protein modification and may also result in the development of
cancer, cardio-vascular diseases, atherosclerosis, Alzheimer's disease, and
Parkinson's disease (Jomova and Valko, 2011). Oxidative stress is also thought to
be the one of the main culprits in the pathogenesis of diabetes mellitus and many
age related diseases.

137
Free radicals initiate or take part in oxidative reactions and a single radical can start
a sequence of electron transfer reactions. A free radical has a single electron in its
outer orbit and it gets electrons from surrounding molecules to produce an electron
pair, as a result of which the donor molecule becomes free radical, the process can
be ongoing until a free radical reacts with antioxidant. Antioxidants donate an
electron to the free radicals, to prevent oxidation. When the antioxidants donate an
electron to the free radicals, the chain reaction is broken because the antioxidant
forms a stable product (Nwose et al., 2007). According to Ou et al. (2002) the
antioxidants could be classified into two systematic categories; (1) preventive
antioxidants, which inhibit formation of reactive oxygen species and (2) chain-
breaking antioxidants, which break radical chain sequences by scavenging oxygen
radicals. The second type of antioxidants donate hydrogen or electron to radical as
a result stable antioxidant radical is produced.
Synthetic antioxidants like butylated hydroxyanisole and butylated hydroxytoluene
are available in the market, but studies in a rat model showed carcinogenic activity
and reported them to be toxic (Jayalakshmi and Sharma, 1986). Exploitation of
plants as a source of natural antioxidants has been a major focus of nutritional and
biomedical research in the last decade. Various plants of different species and
genera have been explored for this reason. Diets high in fruits and vegetables are
thought to be good for health due to their protective effects. The Mediterranean diet
seems to be effective in reducing the prevalence of the conditions associated with
oxidative stress as evidenced by lower cardiovascular disease cases(Esposito et al.,
2004). Olives and olive oil are the main components of the Mediterranean diet. It is
suggested that antioxidant activity of olive biophenols is involved in prevention of
diabetes mellitus, cancer and coronary heart diseases either directly or indirectly

138
(Gonzalez et al., 1992; Komaki et al., 2003; Sato et al., 2007; Obied et al., 2009).
Biophenols are chain breaking antioxidants and they break radical chain sequences
by acting as free radical scavengers or metal chelators (Ou et al., 2002). The ability
of biophenols to modulate oxidative stress through different mechanisms, including
radical scavenging, metal chelating or increasing antioxidant enzymes, has been
demonstrated and reviewed using different bioassays in many studies (Visioli et al.,
2002; Obied et al., 2009; Servili et al., 2009; Leopoldini et al., 2011).
Olive leaf extract has attracted a lot of attention, not only in the research community
but also in the nutraceutical industry, where it has emerged as a valuable
nutraceutical due to its acclaimed bioactivities. Olive leaf is a rich source of
numerous potentially bioactive compounds. Among those compounds, biophenols
are the most abundant physiologically active compounds. Studies on olive leaves
have demonstrated their activities as antioxidant (Benavente-Garcıa et al., 2000;
Somova et al., 2003; Bouaziz and Sayadi, 2005) and hypoglycaemic agent (Komaki
et al., 2003; Sato et al., 2007; Wainstein et al., 2012). Olive leaf extract is reported
to have inhibitory activity against α-amylase from human saliva (Komaki et al.,
2003).
The purpose of this study was to investigate the biological activities of Australian
olive leaves and extracts as natural antioxidants. Australian olive leaves have been
studied for their pharmacological activities. In addition, there are many commercial
preparation of olive leaf extract with varying potencies and patented pharmaceutical
preparation procedures. In this chapter, I will compare the composition and relative
potencies of Hardy’s Mammoth olive leaf extracts versus some commercially
available extracts in a set of in vitro antioxidant and anti-diabetic assays.
139
4.2. Materials and methods
The study was conducted to ascertain the bioactivities of experimental as well as
commercial olive leaf extracts. Three commercially available olive leaf extracts;
Comvita olive leaf extract, Blackmores olive leaf extract and Swisse olive leaf
extract were purchased from local pharmacies. In addition, crude extract as well as
phenolic enriched extracts of locally grown olive leaves were also used. On the
basis of the results of the study reported in chapter 3 (Effect of season and cultivar
on biophenol content of olive leaves), Hardy’s Mammoth cultivar was selected for
this experiment.
4.2.1. Chemicals and reagents
Reagents and chemicals were used without further purification. Folin-Ciocalteu
reagent, (±)-6-hydroxy-2,5,7,8-tetramethylchromane-2-carboxylic acid (Trolox),
2,2′ azinobis(3-ethylbenzothiazoline-6-sulfonic acid) diammonium salt (ABTS),
2,4,6-tripyridyl-s-triazine (TPTZ), ferric chloride, pyrocatechol violet (PV), sodium
acetate trihydrate, copper sulphate, anhydrous sodium sulphate, formic acid,
nitrotetrazolium blue chloride (NBT), potassium phosphate monobasic, phenol red
(ACS reagent), reduced -nicotinamide adenine dinucleotide disodium salt (NADH),
phenazine methosulfate, horseradish peroxidase (HRP) (type IV), α-amylase (EC
3.2.1.1), 2-Chloro-4-Nitrophenyl-α-maltotrioside (CNPG3) and 3-(4,5-
dimethylthiazol-2-yl)-2,5-diphenyltetrazolium bromide were purchased from
Sigma-Aldrich (Sydney, Australia). Sodium carbonate (Univar, Sydney, Australia);
HPLC-grade methanol (Fisher Scientific. New Jersey, USA); n-hexane, ammonium
acetate, hydrochloric acid, sodium chloride, (Merck, Melbourne, Australia), and
anhydrous acetonitrile, ethyl acetate UNICHROME (Sydney, Australia). Ferrous

140
sulfate (FeSO4) and hydrogen peroxide (H2O2) were obtained from Biolab (Sydney,
Australia).
Phenolic standards were oleuropein, caffeic acid, rutin, luteolin, (Sigma-Aldrich).
Most standards were dissolved in 50% methanol to prepare stock solutions of 1
mg/mL. The exceptions were luteolin, which was dissolved in absolute methanol
and then diluted with water to achieve 50% methanol, and rutin, which was
dissolved in warm 50% aqueous methanol as described earlier (Obied, et al.,
2005b). Syringe filters (0.45 µm and 0.22 µm) were purchased from Millex GP
(Sydney, Australia) and membrane nylon filters (0.22 µm) were purchased from
Sigma-Aldrich. Water used in all analytical work was purified (0.22 µm) by
GenPure water purification system (Thermofisher Scientific, Melbourne,
Australia).
4.2.2. Collection of olive leaves
Olive leaves of Hardy’s Mammoth cultivar were collected from the CSU Olive
Grove, Wagga Wagga, in May 2013. Mature green leaves were hand picked at
operator height around the whole perimeter of three trees. Approximately 500 gram
of leaves was collected in plastic bags and brought to the laboratory without any
delay.
4.2.3. Drying of olive leaves
One portion of fresh leaves was immediately dried in a forced-air oven at 105 °C
for 3 hours, as described in Chapter 2.
141
4.2.4. Dry matter
Dry matter content of olive leaves was determined according to the method
described in Chapter 2.
4.2.5. Extraction of biophenols
Biophenols were extracted according to the method of Chapter2.
4.2.6. Enriched biophenol extract
In a 250ml separatory funnel, 50 mL of crude extract, 2g of sodium chloride and
5ml of formic acid were extracted with 50 mL of ethyl acetate. To separate the
organic layer, water was added in such a way that after adding 10 mL of water, the
contents of the flask was swirled. Fifty mL of water was found to be enough to
separate the liquid into two layers. The supernatant was dried over anhydrous
Na2SO4 and the lower portion was again extracted with 50 mL of ethyl acetate. The
process was repeated again twice, but in the 2nd and 3rd extraction step only ethyl
acetate was used for separation. Three ethyl acetate extracts (supernatants) were
dried over anhydrous Na2SO4. The combined extract was transferred to a round
bottom flask and ethyl acetate was evaporated under vacuum at 50°C in a rotary
evaporator. The residues were dissolved in 80% aqueous methanol to make the
volume up to 50 mL, filtered through 0.45 μm nylon nonsterile syringe filters
(Phenomenex) and stored in amber coloured glass vials at −20°C in aliquots of 10
mL until used for analysis.
4.2.7. Extractable matter
For determination of the extractable matter of crude, enriched and commercial
extracts, 2 mL of extract was added to an evaporating dish, which was placed in a

142
boiling water bath for evaporation. Then the evaporating dish was transferred to a
hot air oven and the contents were dried at 105°C for 3 hours. The dried residues
were weighed and extractable matter was calculated as mg/mL.
4.2.8. High performance liquid chromatography (HPLC)
For HPLC analysis, the same instruments and column were used as used in Chapter
2. The solvents and method used for gradient elution were same as described in
chapter 3. For HPLC analysis, the commercial extracts were diluted 1:10, whereas
the crude and enriched extracts were diluted 1:20. The identification and
quantification of oleuropein was done according to previously reported method in
chapter 2.
4.2.9. Spectrophotometric measurements
Colorimetric analyses were performed on Cary 50 UV/visible spectrophotometer,
using Cary WinUV “version 3” software (Varian, Australia) and a microplate
reader (FLUOstar Omega UV-Vis plate reader; BMG, GmbH, Offenburg,
Germany). Aqueous methanol (50% v/v) or working buffer were used for dilution
of extracts and as a blank. Extracts were diluted to produce concentrations within
the range of the constructed calibration curves. All the extracts and oleuropein
(luteolin in copper chelation) were analysed in triplicate on three different times.
4.2.9.1. Total phenols
Total phenols were determined using Folin-Ciocalteu reagent as described in
Chapter 2. A six point (200-2200 µg/mL) calibration curve was prepared using
oleuropein, and results were expressed as milligrams oleuropein equivalent per mL
of extract (mg OLPE/mL). Results were also expressed as milligrams gallic acid

143
equivalent per mL of extract (mg GAE/mL) and a seven point (50-600 µg/mL)
calibration curve was prepared using gallic acid.
4.2.9.2. ABTS radical scavenging assay
ABTS Radical Scavenging activity was measured according to the method of
chapter 2, with modifications. The assay was performed in 96-well flat bottom
microtiter plates instead of macro cuvettes. A stock solution of ABTS reagent (7
mM) was prepared in water. Into the ABTS reagent, 2.45 mM potassium persulfate
was added to produce ABTS radical cation (ABTS•+). The mixture was kept at
room temperature for 16 hours. For analysis, stock ABTS solution was diluted with
water to an absorbance of 0.70 (±0.02) at 734 nm. In each well, 275 µL of ABTS
working solution and 5 µL of diluted extract were added. The plate was covered
with aluminium foil and placed on a plate shaker, incubated and shaken at speed 1
for 30 minutes at room temperature. The absorbance was measured at 734 nm.
Water was used as blank. The absorbance of the ABTS radical without diluted crude
extracts served as control. The absorbance of all extracts without ABTS radical was
also measured and extract colour values were subtracted from the readings to get
colour corrected values. All extracts were analysed in triplicate at three different
times. The following formula was used to calculate the percent scavenging of
ABTS•+.
% scavenging =[Absorbance (control) − Absorbance (sample)]
Absorbance (control) × 100
4.2.9.3. Hydrogen peroxide scavenging assay
The previously described method of Obied et al. (2009) was used to determine the
H2O2 scavenging capacity of olive leaf extracts. Hydrogen peroxide solution was
144
prepared in 100 mM phosphate buffer (pH 7.4), fresh for each set of experiments.
As the hydrogen peroxide was liquid, its concentration was determined by
measuring its absorbance at 230 nm using єH2O2, 230 nm= 81/ M .cm. All reagents
and commercial extract dilutions were made with assay buffer while crude extract
and phenolic enriched extracts were diluted in 50% methanol. Horseradish
peroxidase (0.3 mg/mL) was mixed with 4.5 mM phenol red to prepare the enzyme
mixture. The reaction was carried out in a 96-well flat bottom microplate, with 50
μL of extract/ buffer and 50 μL of 2 mM H2O2 solution. The microplate was
incubated at room temperature (20 ± 2 °C) for 20 minutes. Then 100 μL of enzyme
mixture was added to the reaction mixture, mixed for 1 minute on plate shaker at
speed 1 and incubated for 10 minutes at room temperature. The absorbance was
measured at 610 nm. The % H2O2 scavenging activity was calculated with the
following formula:
% Scavenging =[Absorbance (control) − Absorbance (sample)]
Absorbance (control) × 100
4.2.9.4. Superoxide radical (SOR) scavenging assay
The SOR scavenging activity of olive leaf extracts was measured by the method of
(Obied et al., 2009) with some modifications. Flat bottom 96 well microplates were
used for the assay and all reagents and extract dilutions were made with 100 mM
phosphate buffer (pH 7.4). In each well, 50 μL of extract/buffer, 50 μL of NBT (200
μM), 50 μL of NADH (624 μM), and 50 μL of phenazine methosulfate (80 μM)
were sequentially added. The plate shaker was set at speed 1 for 1minute and after
that the plate was incubated at room temperature for 5 minutes. The absorbance was
measured at 560 nm. Assay buffer was used as a negative control. Due to the
sensitivity of the phenazine methosulfate solution to light, it was prepared fresh in

145
an amber coloured vial for every set of experiment. The SOR scavenging activity
was calculated as follows:
% Scavenging =[Absorbance (control) − Absorbance (sample)]
Absorbance (control) × 100
4.2.9.5. Copper chelation activity
Metal ion chelating activity of olive leaf extracts was evaluated by a cupric ions
chelation assay using pyrocatechol violet (PV), according to (Sánchez-Vioque et
al., 2013), with modifications. In a 96-well flat bottom microplate, 20 µL of
sample, 75µL of 50 mM sodium acetate buffer (pH 6.0), and 50 µL of 0.5 mM
CuSO4 in acetate buffer were added and mixed on a plate shaker for 2 minutes.
After 10 minutes of incubation at room temperature, 50 µL of 0.4 mM PV in acetate
buffer was added to all control, sample and standard wells. The plate was again
shaken for 1 minute and after 10 minutes of incubation at room temperature the
change in colour of the solution was measured at 632 nm. Luteolin was used as the
standard in this assay, as oleuropein did not show metal chelation activity. Luteolin
was dissolved and diluted in 80% methanol, while all other extracts were diluted in
50% methanol. The percentage of inhibition of PV–Cu2+complex formation was
calculated as
% Chelation =[Absorbance (control) − Absorbance (sample)]
Absorbance (control) × 100
4.2.9.6. Ferric reducing antioxidant power assay
The ferric reducing antioxidant power (FRAP) assay was conducted to determine
the reducing capacity of olive leaf extract. A previously reported method (Benzie
and Strain, 1996) was used with modifications. The assay buffer was 300mM
146
sodium acetate buffer (pH 3.6) and all extracts were diluted in this buffer. The
FRAP reagent was prepared by mixing 2.5 mL of 5 mM 2,4,6-tripyridyl-s-triazine
(TPTZ), 2.5mL of 5mM ferric chloride (FeCl3) and 25mL of assay buffer. TPTZ
was dissolved in 40 mM HCl solution at 50 ºC. The FRAP reagent was prepared
fresh and placed at 37 ºC for at least 15 minutes before use. In a 96-well flat bottom
microplate, 10 µL of diluted extract, 200 µL FRAP reagent and 90 µL of water were
added and mixed on a plate shaker for 1 minute. The microplate was incubated at
room temperature (20±2 ºC) for 4 minutes, then the absorbance was measured at
593 nm. The antioxidant capacity of each extract was determined based on
increasing in Fe2+-TPTZ absorbance. The difference in absorbance was used to
measure the reducing capacity of olive leaf extracts. A standard curve was made
using six concentrations (10 to 1000 µmol/mL) of Trolox. Results were expressed
as millimoles of Fe2+ as TE per mL of olive leaf extract.
4.2.9.7. Alpha-amylase inhibition assay
The α-amylase inhibitory activity was determined by the previously described
spectrophotometric method of Ashok Kumar et al. (2011), with modifications. The
commercial extracts were diluted in assay buffer, while crude extract and phenolic
enriched extracts were diluted in 50% methanol. Acarbose was used as reference
compound; a five point calibration curve (10 µg to 2000 µg/ mL) was prepared. In
a macro plastic cuvette, 1000 µL of 40 mM phosphate buffer (pH 6.9), 60 µL of
extract and 20 µL of α-amylase (EC 3.2.1.1) dissolved in the above buffer (0.5
U/ml), were added. The cuvettes were incubated at 37 ºC for 10 minutes then 100
µL of CNPG3 (2.25mM) was added, mixed and again incubated at 37 ºC for 10
minutes. After incubation, 1820 µL of absolute ethanol was added to the cuvettes
to stop the reaction, and absorbance was measured at 405 nm. In the control buffer
147
or 50% methanol was used in place of extract. The enzyme and substrates were
prepared fresh for each set of experiment. The percentage inhibition was calculated
by the following equation:
% Inhibition =[Absorbance (control) − Absorbance (sample)]
Absorbance (control) × 100
4.2.10. Statistical analysis
All assays were performed in triplicate at three different times and averaged. Seven
concentrations of the samples and standards were used in triplicate at three different
times in all assays. A blank, having the extract and assay buffer, was added for all
tested concentrations in all assays, to avoid the effect of extract colour on the assay
results. All the readings were corrected for extract colour absorbance, if there was
any. Results in the text, Tables and in Figures are expressed as mean ± standard
error. Data analysis was performed by Microsoft Excel and IBM SPSS Statistics
package version 20.0 (SPSS, IBM Corporation, New York). Statistical comparisons
were made using one-way ANOVA and post-hoc Tukey test. Results were
considered statistically significant at p < 0.05. GraphPad Prism version 5.04
(GraphPad Software, San Diego, USA) was used to calculate IC50 values of the
extracts.
4.3. Results and discussion
Hardy’s Mammoth cultivar was used for the preparation of crude and enriched
extracts. This cultivar was selected because of three main reasons. Firstly, it is an
Australian cultivar. Secondly, it produced higher levels of oleuropein and total
flavonoids compared to the other cultivars studied in Chapter 3. Moreover, its other
biophenol contents were also comparable to other cultivars. Thirdly, it has not been

148
investigated before for its biological activities. Ethyl acetate was used for the
preparation of the enriched extract as it has previously been reported to increase
biophenol content of the crude extract by removing not only highly polar
nonphenolics but also large molecular weight hydrophilic polymers (Obied, et al., ,
2005b; Obied, et al., 2008a; Obied et al., 2009).
4.3.1. Dry matter
The dry matter content of olive leaves collected for the preparation of crude and
enriched extract was 48.60 ± 0.15%. This was in accord with reported literature
values (Gómez-Cabrera et al., 1992; Martín-García and Molina-Alcaide, 2008;
Nourhène et al., 2008; Lafka et al., 2013).
4.3.2. Extractable matter
The extractable matter of the prepared and commercial olive leaf extracts is
presented in Figure 4.1. The extractable matter of Comvita and Blackmores olive
leaf extracts were significantly higher (p < 0.05) than other extracts; both showed
similar recovery of extractable matter (p ˃ 0.05), crude and enriched extracts had
the same recovery of extractable matter (p ˃ 0.05), which was significantly lower
than the Swisse extract (p < 0.05). The results indicate that commercial extracts
contain lot of biomass, which may have more non-phenolic matrix components as
compared to crude and enriched extracts. These results are in fact most probably
due to the added pharmaceutical excipients required to prepare and stabilize the
nutraceutical product.
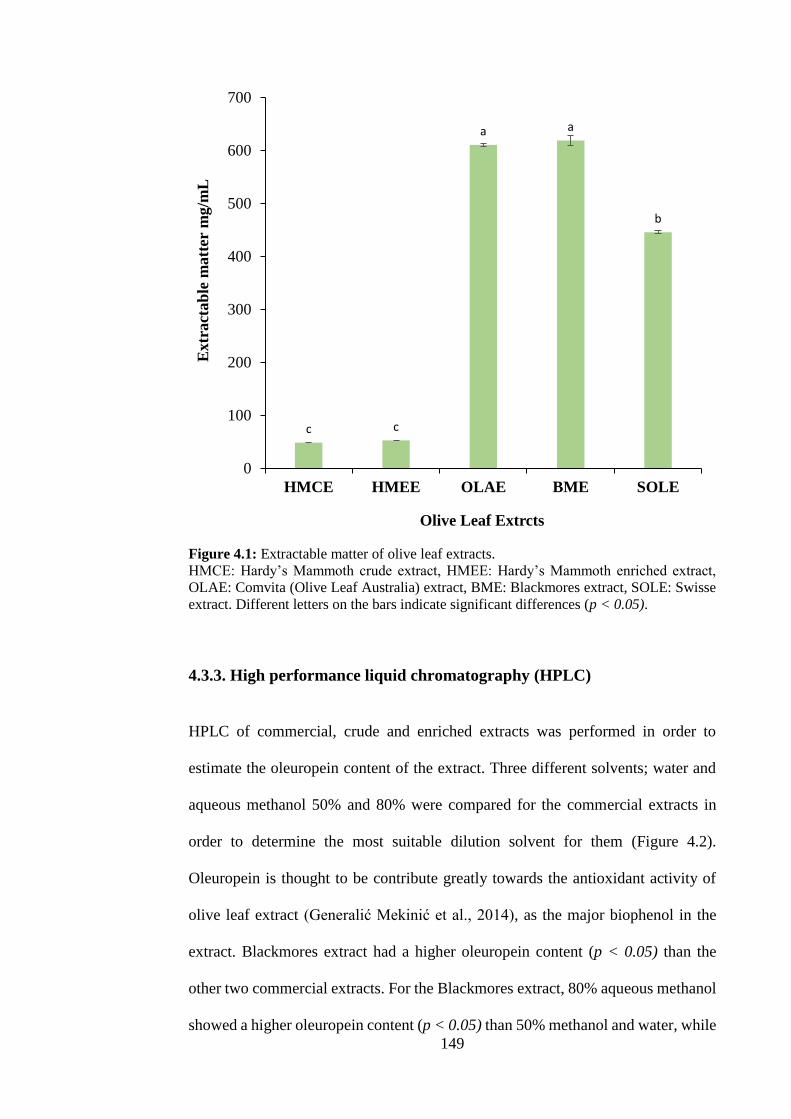
149
Figure 4.1: Extractable matter of olive leaf extracts.
HMCE: Hardy’s Mammoth crude extract, HMEE: Hardy’s Mammoth enriched extract,
OLAE: Comvita (Olive Leaf Australia) extract, BME: Blackmores extract, SOLE: Swisse
extract. Different letters on the bars indicate significant differences (p < 0.05).
4.3.3. High performance liquid chromatography (HPLC)
HPLC of commercial, crude and enriched extracts was performed in order to
estimate the oleuropein content of the extract. Three different solvents; water and
aqueous methanol 50% and 80% were compared for the commercial extracts in
order to determine the most suitable dilution solvent for them (Figure 4.2).
Oleuropein is thought to be contribute greatly towards the antioxidant activity of
olive leaf extract (Generalić Mekinić et al., 2014), as the major biophenol in the
extract. Blackmores extract had a higher oleuropein content (p < 0.05) than the
other two commercial extracts. For the Blackmores extract, 80% aqueous methanol
showed a higher oleuropein content (p < 0.05) than 50% methanol and water, while
c c
a a
b
0
100
200
300
400
500
600
700
HMCE HMEE OLAE BME SOLE
Extr
act
ab
le m
att
er m
g/m
L
Olive Leaf Extrcts
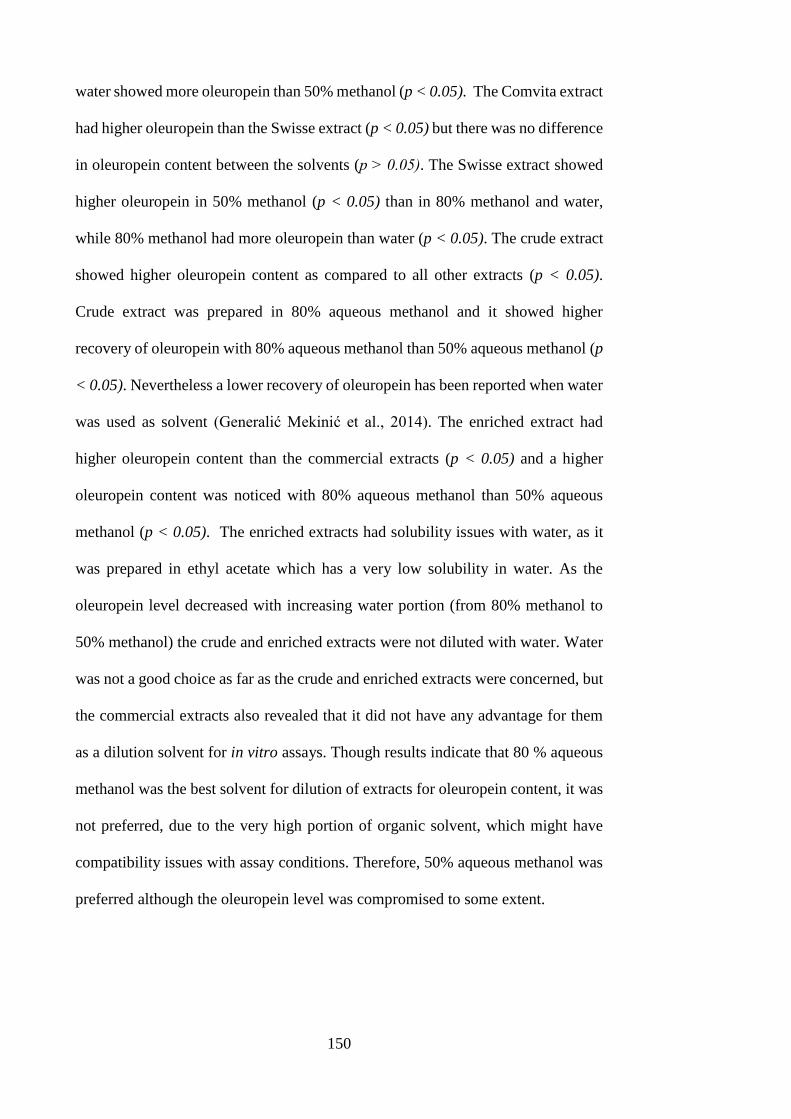
150
water showed more oleuropein than 50% methanol (p < 0.05). The Comvita extract
had higher oleuropein than the Swisse extract (p < 0.05) but there was no difference
in oleuropein content between the solvents (p ˃ 0.05). The Swisse extract showed
higher oleuropein in 50% methanol (p < 0.05) than in 80% methanol and water,
while 80% methanol had more oleuropein than water (p < 0.05). The crude extract
showed higher oleuropein content as compared to all other extracts (p < 0.05).
Crude extract was prepared in 80% aqueous methanol and it showed higher
recovery of oleuropein with 80% aqueous methanol than 50% aqueous methanol (p
< 0.05). Nevertheless a lower recovery of oleuropein has been reported when water
was used as solvent (Generalić Mekinić et al., 2014). The enriched extract had
higher oleuropein content than the commercial extracts (p < 0.05) and a higher
oleuropein content was noticed with 80% aqueous methanol than 50% aqueous
methanol (p < 0.05). The enriched extracts had solubility issues with water, as it
was prepared in ethyl acetate which has a very low solubility in water. As the
oleuropein level decreased with increasing water portion (from 80% methanol to
50% methanol) the crude and enriched extracts were not diluted with water. Water
was not a good choice as far as the crude and enriched extracts were concerned, but
the commercial extracts also revealed that it did not have any advantage for them
as a dilution solvent for in vitro assays. Though results indicate that 80 % aqueous
methanol was the best solvent for dilution of extracts for oleuropein content, it was
not preferred, due to the very high portion of organic solvent, which might have
compatibility issues with assay conditions. Therefore, 50% aqueous methanol was
preferred although the oleuropein level was compromised to some extent.

151
Figure 4.2: Solvent effect on oleuropein content of olive leaf extract.
HMCE: Hardy’s Mammoth crude extract, HMEE: Hardy’s Mammoth enriched extract,
OLAE: Comvita (Olive Leaf Australia) extract, BME: Blackmores extract, SOLE: Swisse
extract. Different letters on the bars within each extract indicate significant differences (p
< 0.05).
The oleuropein content of extracts in 50% aqueous methanol is presented in Figure
4.3. All extracts were significantly different from each other in terms of oleuropein
content (p < 0.05). The level of oleuropein decreased in the following order: crude
extract ˃ enriched extract ˃ Blackmores ˃ Comvita ˃ Swisse. The enriched extract
showed lower content of oleuropein than crude extract. Removal of some phenolic
compounds particularly hydrooxytyrosol glucoside in ethyl acetate extract is also
reported in literature (Obied et al., 2009).
ac
c
b
b
ab
b
a
a
aa
a
0
5
10
15
20
25
HMCE HMEE OLAE BME SOLE
Ole
uro
pei
n m
g/m
L
Olive Leaf Extracts
Water 50% Methanol 80% Methanol

152
Figure 4.3: Oleuropein content of olive leaf extracts with 50% methanol as the dilution
solvent.
HMCE: Hardy’s Mammoth crude extract, HMEE: Hardy’s Mammoth enriched extract,
OLAE: Comvita (Olive Leaf Australia) extract, BME: Blackmores extract, SOLE: Swisse
extract. Different letters on the bars indicate significant differences (p < 0.05).
The chromatograms of crude, enriched, Comvita, Blackmores and Swisse olive
leaf extracts in 50% aqueous methanol, at 280 nm, 325 nm and their corresponding
ABTS activity are shown in Figure 4.4, 4.5, 4.6, 4.7, and 4.8, respectively. In all
extracts, oleuropein was eluted at 15.5 minutes. Though commercial extracts were
low in oleuropein content, they had a greater number of compounds, as indicated
by the number of peaks (Figures 4.4-4.8).
a
b
dc
e
0
2
4
6
8
10
12
14
16
HMCE HMEE OLAE BME SOLE
Ole
uro
pei
n m
g/m
L
Olive Leaf Extrcts
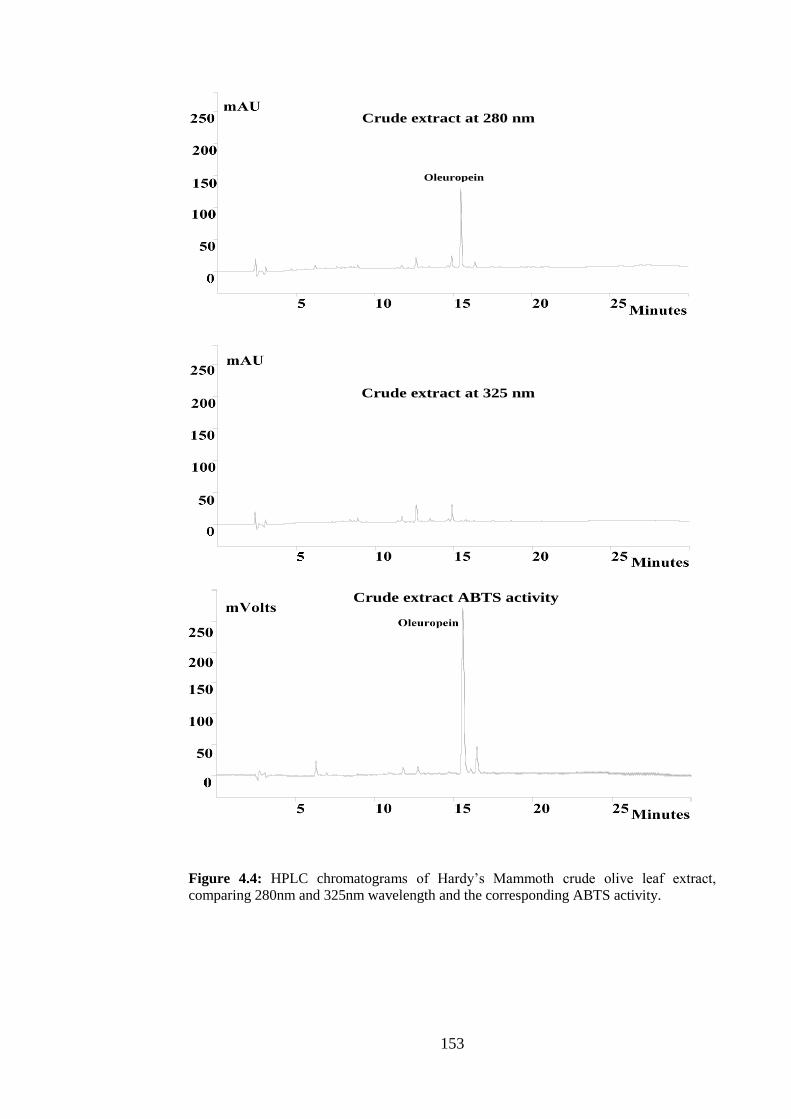
153
Figure 4.4: HPLC chromatograms of Hardy’s Mammoth crude olive leaf extract,
comparing 280nm and 325nm wavelength and the corresponding ABTS activity.
Crude extract at 280 nm
Oleuropein
Crude extract at 325 nm
Crude extract ABTS activity

154
Figure 4.5: HPLC chromatograms of Hardy’s Mammoth enriched olive leaf extract,
comparing 280nm and 325nm wavelength and the corresponding ABTS activity.
Enriched extract at 280 nm
Oleuropein
Enriched extract at 325 nm
Enriched extract ABTS activity
Oleuropein

155
Figure 4.6: HPLC chromatograms of Comvita olive leaf extract, comparing 280 nm and
325 nm wavelength and the corresponding ABTS activity.
Comvita extract at 280 nm
Oleuropein
Comvita extract at 325 nm
Comvita extract ABTS activity Oleuropein
156
Figure 4.7: HPLC chromatograms of Blackmores olive leaf extract, comparing 280 nm
and 325 nm wavelength and the corresponding ABTS activity.
Blackmores extract at 280 nm
Oleuropein
Blackmores extract at 325 nm
Blackmores extract ABTS activity Oleuropein
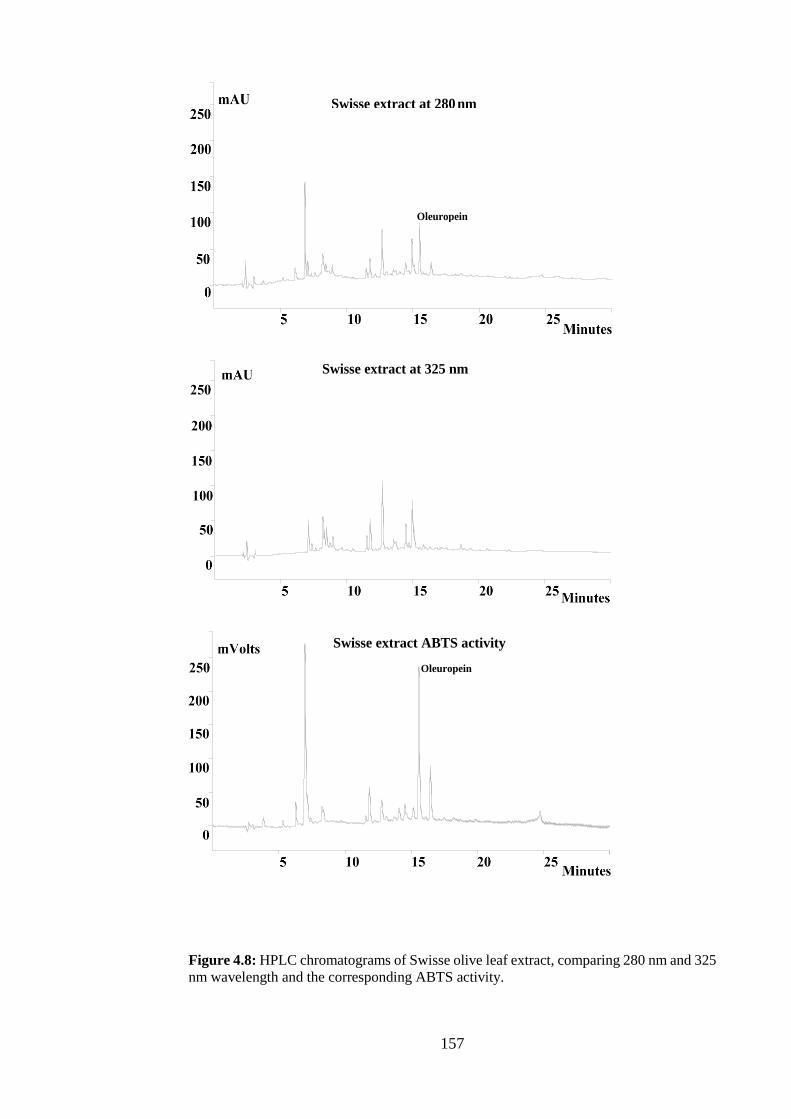
157
Figure 4.8: HPLC chromatograms of Swisse olive leaf extract, comparing 280 nm and 325
nm wavelength and the corresponding ABTS activity.
Swisse extract at 280 nm
Oleuropein
Swisse extract at 325 nm
Swisse extract ABTS activity
Oleuropein
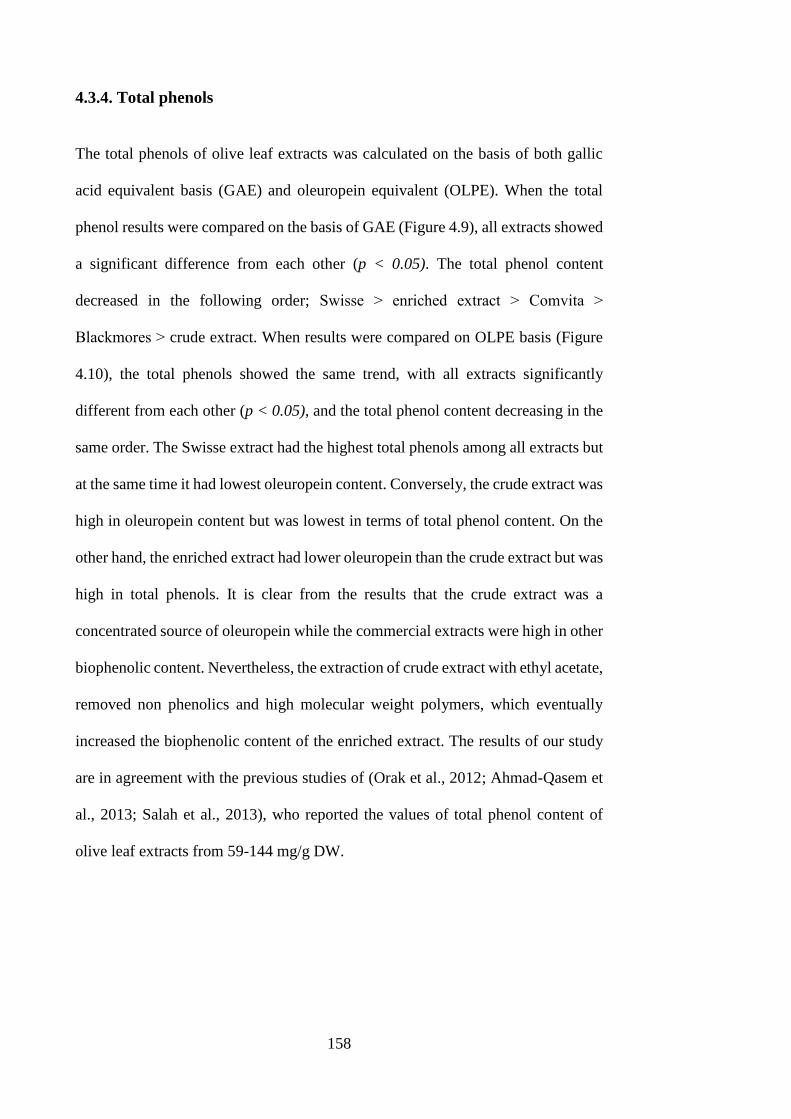
158
4.3.4. Total phenols
The total phenols of olive leaf extracts was calculated on the basis of both gallic
acid equivalent basis (GAE) and oleuropein equivalent (OLPE). When the total
phenol results were compared on the basis of GAE (Figure 4.9), all extracts showed
a significant difference from each other (p < 0.05). The total phenol content
decreased in the following order; Swisse ˃ enriched extract ˃ Comvita ˃
Blackmores ˃ crude extract. When results were compared on OLPE basis (Figure
4.10), the total phenols showed the same trend, with all extracts significantly
different from each other (p < 0.05), and the total phenol content decreasing in the
same order. The Swisse extract had the highest total phenols among all extracts but
at the same time it had lowest oleuropein content. Conversely, the crude extract was
high in oleuropein content but was lowest in terms of total phenol content. On the
other hand, the enriched extract had lower oleuropein than the crude extract but was
high in total phenols. It is clear from the results that the crude extract was a
concentrated source of oleuropein while the commercial extracts were high in other
biophenolic content. Nevertheless, the extraction of crude extract with ethyl acetate,
removed non phenolics and high molecular weight polymers, which eventually
increased the biophenolic content of the enriched extract. The results of our study
are in agreement with the previous studies of (Orak et al., 2012; Ahmad-Qasem et
al., 2013; Salah et al., 2013), who reported the values of total phenol content of
olive leaf extracts from 59-144 mg/g DW.
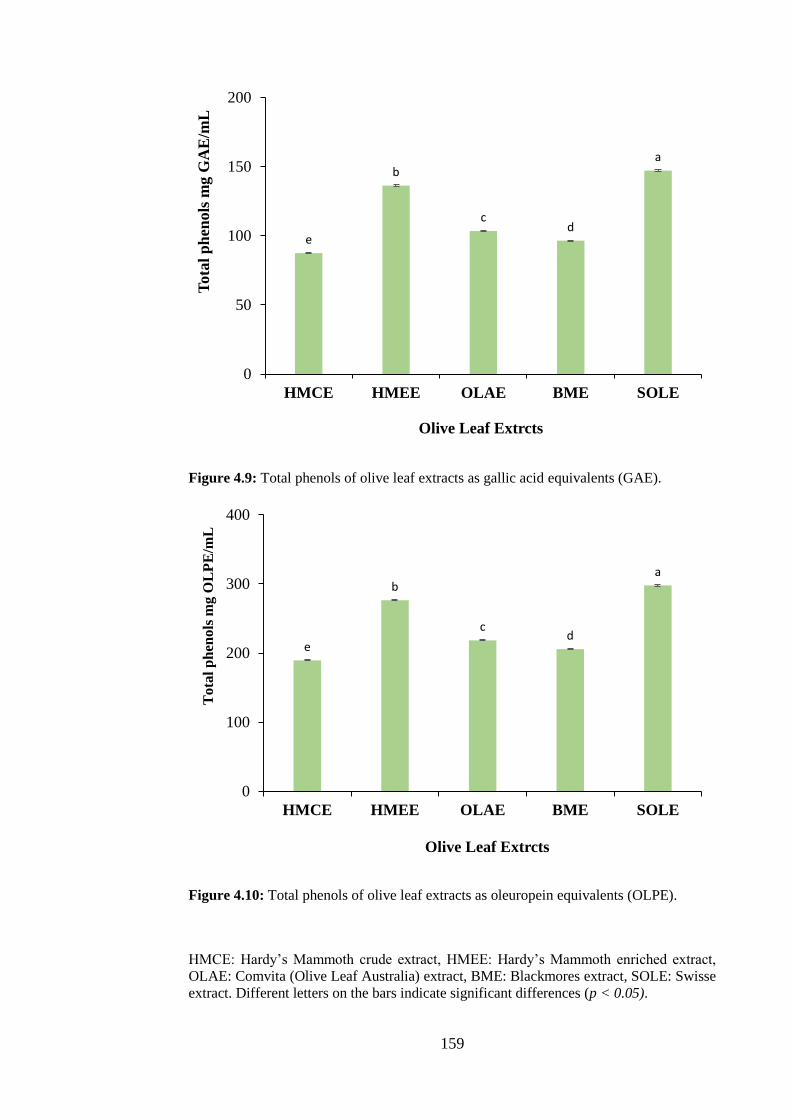
159
Figure 4.9: Total phenols of olive leaf extracts as gallic acid equivalents (GAE).
Figure 4.10: Total phenols of olive leaf extracts as oleuropein equivalents (OLPE).
HMCE: Hardy’s Mammoth crude extract, HMEE: Hardy’s Mammoth enriched extract,
OLAE: Comvita (Olive Leaf Australia) extract, BME: Blackmores extract, SOLE: Swisse
extract. Different letters on the bars indicate significant differences (p < 0.05).
e
b
cd
a
0
50
100
150
200
HMCE HMEE OLAE BME SOLE
Tota
l p
hen
ols
mg G
AE
/mL
Olive Leaf Extrcts
e
b
cd
a
0
100
200
300
400
HMCE HMEE OLAE BME SOLE
Tota
l p
hen
ols
mg O
LP
E/m
L
Olive Leaf Extrcts
160
4.3.5. Antioxidant activity
There is no standard method with which to measure the therapeutic activity of
antioxidants, especially plant/natural antioxidants. Therefore, the results obtained
by one type of in vitro antioxidants assay cannot be considered as total antioxidant
activity. The results of the antioxidant activity measured by a single assay cannot
be generalized, as these results reflect the chemical reactivity under the specific
conditions suitable for that assay (Huang et al., 2005). The same antioxidant can
have different activities with other types of assay, as every assay works at its
specific conditions. This may also occur due to the interfering compounds present
in plant extracts which interfere with the assay method. Moreover, the results of an
in vitro assay may not be true in vivo, as the in vivo environment is much more
complex and variable, where dietary interactions may also come into account. In
the literature it is recommended that antioxidant activity should be measured by a
number of methods, or at least two independent assays, as no single method
measures all possible antioxidant mechanisms (Wong et al., 2006; Obied et al.,
2009). Huang et al. (2005) divided antioxidant capacity assays into two categories
on the basis of the chemical reactions involved. One type of assays are hydrogen
atom transfer reactions, which mostly involve monitoring of competitive reaction
kinetics. The other type of assays are single electron transfer reactions, which
involve a redox reaction with the oxidant as an indicator of the reaction endpoint
(Huang et al., 2005).
The half maximal effective concentration (EC50) values were used to determine
antioxidant capacity of olive leaf extracts, except for the FRAP assay. The half
maximal inhibitory concentration (IC50) values were used to determine α-amylase
inhibition. The EC50 values measure the potency of a drug/substance, and IC50
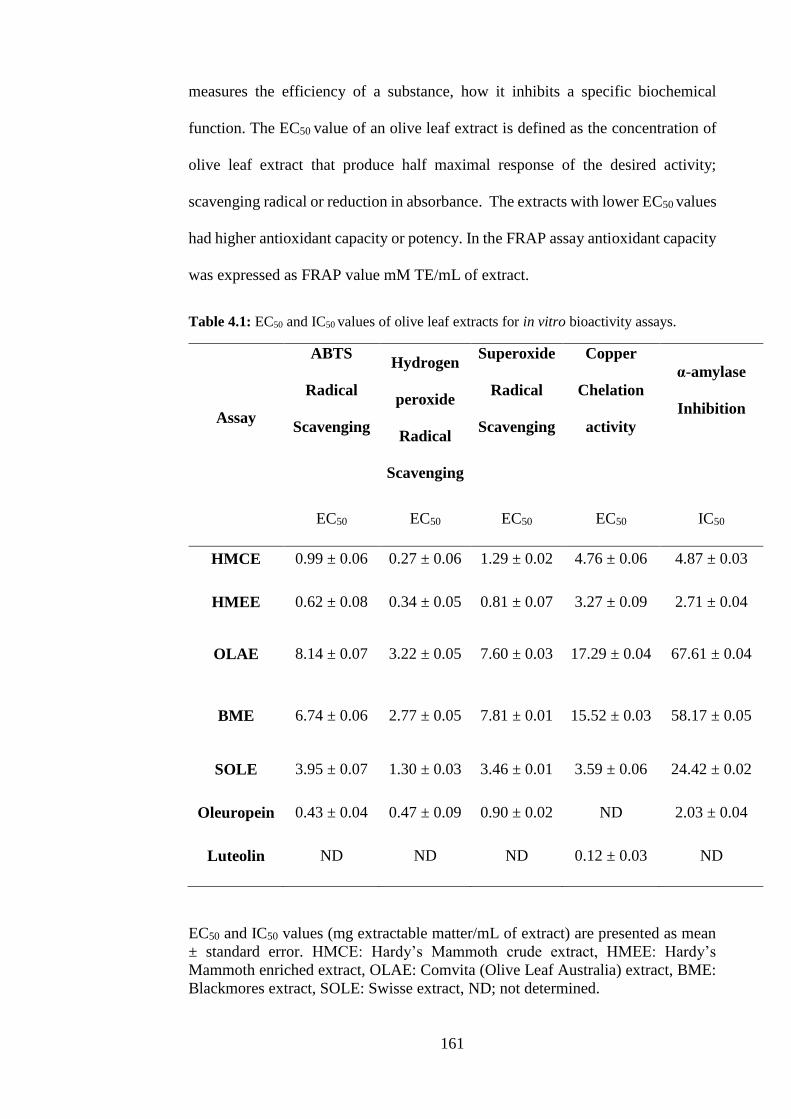
161
measures the efficiency of a substance, how it inhibits a specific biochemical
function. The EC50 value of an olive leaf extract is defined as the concentration of
olive leaf extract that produce half maximal response of the desired activity;
scavenging radical or reduction in absorbance. The extracts with lower EC50 values
had higher antioxidant capacity or potency. In the FRAP assay antioxidant capacity
was expressed as FRAP value mM TE/mL of extract.
Table 4.1: EC50 and IC50 values of olive leaf extracts for in vitro bioactivity assays.
Assay
ABTS
Radical
Scavenging
Hydrogen
peroxide
Radical
Scavenging
Superoxide
Radical
Scavenging
Copper
Chelation
activity
α-amylase
Inhibition
EC50 EC50 EC50 EC50 IC50
HMCE 0.99 ± 0.06 0.27 ± 0.06 1.29 ± 0.02 4.76 ± 0.06 4.87 ± 0.03
HMEE 0.62 ± 0.08 0.34 ± 0.05 0.81 ± 0.07 3.27 ± 0.09 2.71 ± 0.04
OLAE 8.14 ± 0.07 3.22 ± 0.05 7.60 ± 0.03 17.29 ± 0.04 67.61 ± 0.04
BME 6.74 ± 0.06 2.77 ± 0.05 7.81 ± 0.01 15.52 ± 0.03 58.17 ± 0.05
SOLE 3.95 ± 0.07 1.30 ± 0.03 3.46 ± 0.01 3.59 ± 0.06 24.42 ± 0.02
Oleuropein 0.43 ± 0.04 0.47 ± 0.09 0.90 ± 0.02 ND 2.03 ± 0.04
Luteolin ND ND ND 0.12 ± 0.03 ND
EC50 and IC50 values (mg extractable matter/mL of extract) are presented as mean
± standard error. HMCE: Hardy’s Mammoth crude extract, HMEE: Hardy’s
Mammoth enriched extract, OLAE: Comvita (Olive Leaf Australia) extract, BME:
Blackmores extract, SOLE: Swisse extract, ND; not determined.
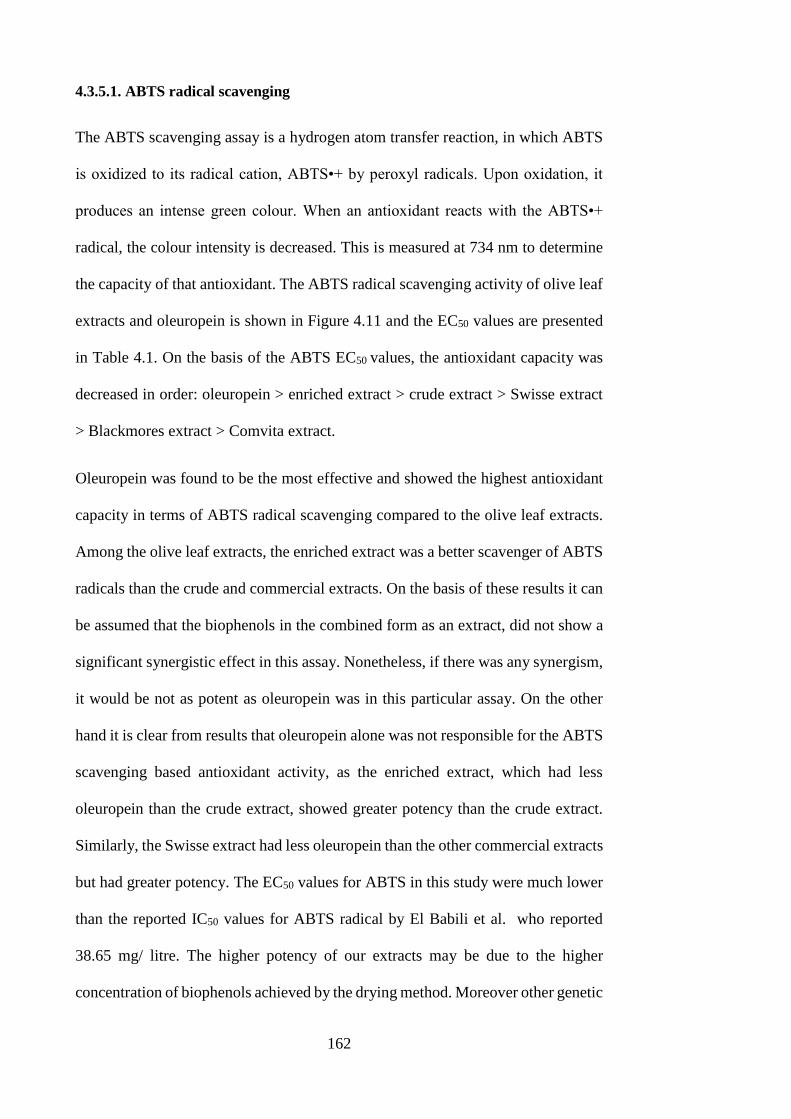
162
4.3.5.1. ABTS radical scavenging
The ABTS scavenging assay is a hydrogen atom transfer reaction, in which ABTS
is oxidized to its radical cation, ABTS•+ by peroxyl radicals. Upon oxidation, it
produces an intense green colour. When an antioxidant reacts with the ABTS•+
radical, the colour intensity is decreased. This is measured at 734 nm to determine
the capacity of that antioxidant. The ABTS radical scavenging activity of olive leaf
extracts and oleuropein is shown in Figure 4.11 and the EC50 values are presented
in Table 4.1. On the basis of the ABTS EC50 values, the antioxidant capacity was
decreased in order: oleuropein > enriched extract > crude extract > Swisse extract
> Blackmores extract > Comvita extract.
Oleuropein was found to be the most effective and showed the highest antioxidant
capacity in terms of ABTS radical scavenging compared to the olive leaf extracts.
Among the olive leaf extracts, the enriched extract was a better scavenger of ABTS
radicals than the crude and commercial extracts. On the basis of these results it can
be assumed that the biophenols in the combined form as an extract, did not show a
significant synergistic effect in this assay. Nonetheless, if there was any synergism,
it would be not as potent as oleuropein was in this particular assay. On the other
hand it is clear from results that oleuropein alone was not responsible for the ABTS
scavenging based antioxidant activity, as the enriched extract, which had less
oleuropein than the crude extract, showed greater potency than the crude extract.
Similarly, the Swisse extract had less oleuropein than the other commercial extracts
but had greater potency. The EC50 values for ABTS in this study were much lower
than the reported IC50 values for ABTS radical by El Babili et al. who reported
38.65 mg/ litre. The higher potency of our extracts may be due to the higher
concentration of biophenols achieved by the drying method. Moreover other genetic

163
and environmental factors may also be involved, in addition to extraction solvent
and extraction method.
4.3.5.2. Hydrogen peroxide scavenging
For the measurement of hydrogen peroxide scavenging activity, a peroxidase based
system was used, as very high interfering absorbance was reported for olive
biophenols with direct measurement at 230 nm (Obied et al., 2009). Hydrogen
peroxide radical scavenging activity of olive leaf extracts and oleuropein is
presented in Figure 4.12, and Table 4.1 displays the EC50 values. The antioxidant
capacity on the basis of the EC50 values for H2O2 scavenging was decreased in
following order: crude extract > enriched extract > oleuropein > Swisse >
Blackmores > Comvita extract.
In the H2O2 scavenging assay, the crude extract showed greater potency than
oleuropein and other extracts. The results suggest an additive and/or a synergistic
effect of biophenols for H2O2 scavenging activity. In this particular assay
oleuropein was not the most active antioxidant. The results are in accord with the
findings of Obied et al. (2009), who reported a decrease in H2O2 scavenging activity
with esterification of hydroxytyrosol to secoiridoid residues.
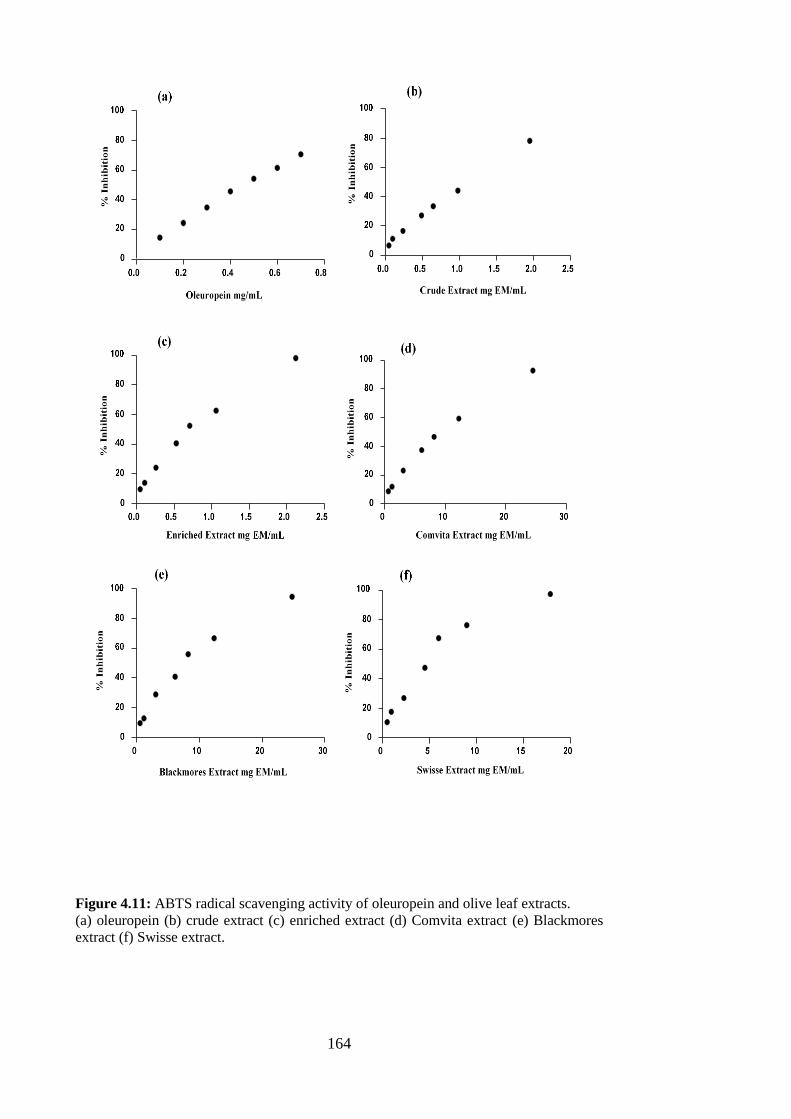
164
Figure 4.11: ABTS radical scavenging activity of oleuropein and olive leaf extracts.
(a) oleuropein (b) crude extract (c) enriched extract (d) Comvita extract (e) Blackmores
extract (f) Swisse extract.
165
.
Figure 4.12: Hydrogen peroxide (H2O2) scavenging activity of oleuropein and olive leaf
extracts.
(a) oleuropein (b) crude extract (c) enriched extract (d) Comvita extract (e) Blackmores
extract (f) Swisse extract.

166
3.5.3. Superoxide radical (SOR) scavenging
Phenazine methosulfate acts as an electron transfer catalyst between NADH and O2
to produce superoxide radical in non-enzymatic phenazine methosulfate/NADH/O2
system. In the reaction, free SOR reduces water soluble yellow coloured
nitrotetrazolium blue (NBT2+) radicals to water insoluble blue coloured
diformazan. Biophenols, or their phenoxide ions produce H2O2 by reducing SOR
in aqueous solutions at physiological pH. Higher absorbance readings for the
yellow NBT2+ indicates higher SOR scavenging activity (Obied et al., 2009; Liang
and Kitts, 2014)
SOR scavenging activity of olive leaf extracts and oleuropein can be seen in Figure
4.13, with the EC50 values in Table 4.1. The antioxidant capacity as depicted by
SOR EC50 values was decreased in the following order: enriched extract >
oleuropein > crude extract > Swisse extract > Comvita extract > Blackmores
extract. The order of SOR scavenging activity was different from that of H2O2
scavenging activity. The enriched extract was more potent than oleuropein and
other extracts in terms of SOR scavenging. The crude extract, which showed greater
potency in the H2O2 scavenging assay, showed less SOR scavenging activity. These
findings are in agreement with the study of Obied et al. (2009), who reported that
good H2O2 scavengers showed less SOR scavenging activity. They also reported
good SOR scavenging activity of ethyl acetate extract, comparable to that of pure
compounds. Furthermore an additive and a synergistic effect of biophenols was also
suggested for the SOR assay. Obied et al. (2009) suggested a major role of the
nonphenolic component in determining the SOR scavenging activity.

167
Figure 4.13: Superoxide radical (SOR) scavenging activity of oleuropein and olive leaf
extracts.
(a) oleuropein (b) crude extract (c) enriched extract (d) Comvita extract (e) Blackmores
extract (f) Swisse extract.
168
4.3.5.4. Copper chelation activity
The chelating activity of the olive leaf extracts was measured by using PV. Upon
reaction of Cu2+ with PV, a Cu2+–PV complex is formed which shows a blue colour.
With the addition of an equivalent amount of sample or standard, the complex
dissociates and the blue colour turns to yellow. The chelating activity is then
calculated by measuring the rate of colour reduction at 632 nm. Figure 4.14 and
Table 4.1 display the copper chelation activity of olive leaf extracts and luteolin and
EC50 values, respectively. For this assay luteolin was used instead of oleuropein,
for reasons discussed below. The copper chelation activity on the basis of EC50
values was decreased in order: luteolin > enriched extract > Swisse extract > crude
extract > Blackmores extract > Comvita extract. Among the extracts the enriched
extract showed higher potency as a metal chelator, but the Swisse extract
surprisingly was found to be a better chelating agent than the crude extract, although
the crude extract was better than the other two commercial extracts. Though the
Swisse extract was the highest in total phenol content, it did not show any activity
higher than the crude extract for any other assay. Moreover, it has been suggested
that copper chelating activities depend upon the structure of the molecules and on
specific biophenols or other compounds of the extract. These may be
polysaccharides or peptides, rather than total phenolic content (Saiga et al., 2003;
Wong et al., 2006; Sánchez-Vioque et al., 2013). It has been also reported that
chemical groups in the molecule can effect metal chelating activity, and chelating
activity depends on the presence of catechol groups. The presence of a catechol
structure in the B benzene ring or 4-keto group with a 3- and/or 5-hydroxyl group
are considered strong chelating sites for metal ions (Megías et al., 2009; Sánchez-
Vioque et al., 2013).
169
Chelation of metal ions is one of the antioxidant mechanisms. Transition metals like
iron and copper are redox active. They catalyze redox cycling reactions and
generate reactive radicals in biological systems, such as hydroxyl radical (•OH),
superoxide anion (O2-) and nitric oxide. Both iron and copper are important
catalysts but they generate highly reactive hydroxyl radicals (•OH) by the Fenton
reaction, which in turn augments lipid peroxidation (Saiga et al., 2003; Wong et al.,
2006; Sánchez-Vioque et al., 2013). Metal chelators prevents the metals from
taking part in these redox reactions. Chelating agents change redox potentials of
metal ions and make metal ions inactive by binding with them and halt further
oxidative damage (Sánchez-Vioque et al., 2013). Biophenols can prevent oxidative
damage by chelating the transition metals iron and copper (Megías et al., 2009).
The results of this study are in complete agreement with the above studies, as olive
leaf biophenols effectively chelated metal ions.
Luteolin was used instead of oleuropein for copper chelation activity because when
oleuropein was mixed with assay reagents it did not produce results. The crude and
enriched extracts which were high in oleuropein showed relatively high IC50 values for
copper chelation in comparison to other antioxidant capacity assays. Even the crude extract
showed a higher IC50 value than the Swisse extract in this assay. A similar finding was
observed by Generalić Mekinić et al. (2014) who reported the lowest chelating activity for
those extracts which had higher total phenols and oleuropein content, and the best activities
for the extracts that had lower contents of total phenols and oleuropein. Some earlier reports
suggests chelating action of oleuropein and it was indicated that it effectively inhibited
copper sulfate-induced-oxidation of LDL in a dose-dependent manner (Visioli et al., 1994;
Andrikopoulos et al., 2002). In our study however we did not find significant copper
chelation activity for oleuropein. This might be due to poor miscibility or low activity of
oleuropein for copper chelation. A possible reason for this may be some complex
intermolecular interactions or interference of oleuropein with an assay reagent, since those
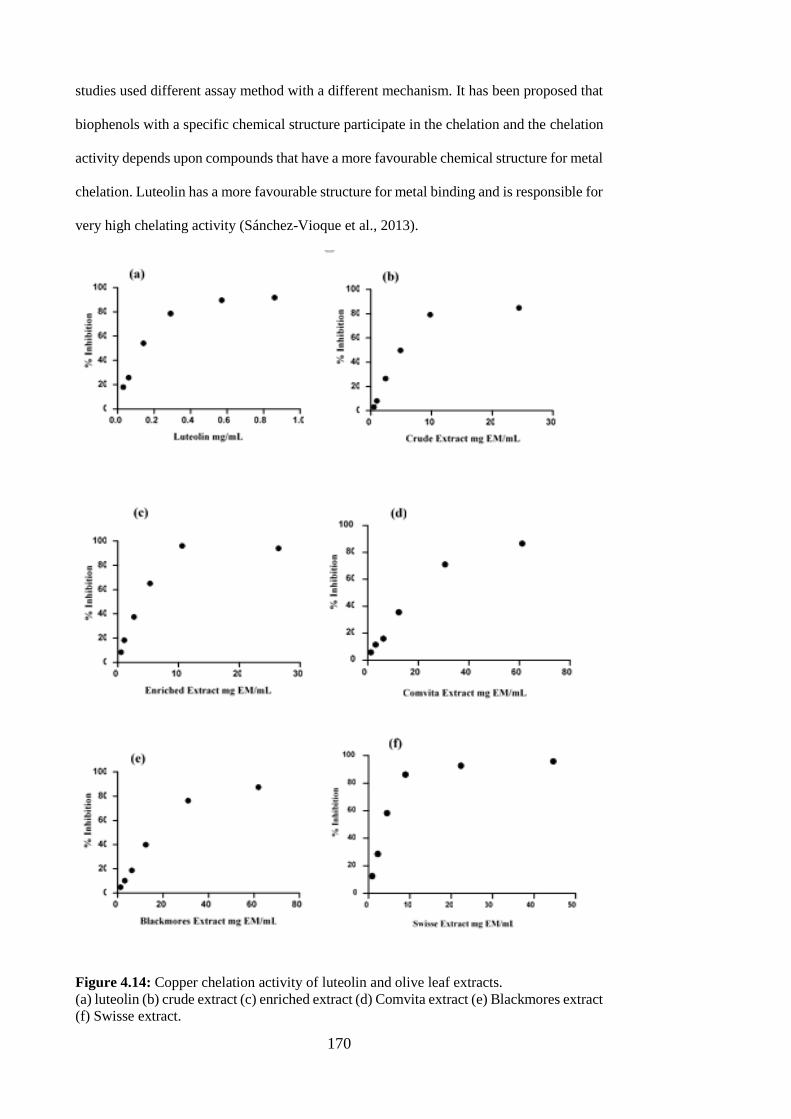
170
studies used different assay method with a different mechanism. It has been proposed that
biophenols with a specific chemical structure participate in the chelation and the chelation
activity depends upon compounds that have a more favourable chemical structure for metal
chelation. Luteolin has a more favourable structure for metal binding and is responsible for
very high chelating activity (Sánchez-Vioque et al., 2013).
Figure 4.14: Copper chelation activity of luteolin and olive leaf extracts.
(a) luteolin (b) crude extract (c) enriched extract (d) Comvita extract (e) Blackmores extract
(f) Swisse extract.

171
4.3.5.5. Ferric reducing antioxidant power (FRAP)
FRAP is a redox assay. Its mechanism is a single electron transfer and it is a
reasonable tool for the determination of redox status in cells or tissues. (Prior et al.,
2005). In the FRAP assay FeCl3 reacts with TPTZ, and Fe3+ is reduced to Fe2+,
when an antioxidant donates a single electron. A blue colour is produced as a result
of the Fe2+–TPTZ complex, which absorbs strongly at wavelength 593 nm. The
more Fe3+ is reduced to Fe2+ greater the intensity of colour. Different concentrations
of oleuropein, crude, enriched and commercial extracts were investigated for
antioxidant activity measured as FRAP value. Figure 4.15 represents the FRAP
value of oleuropein and olive leaf extracts at a concentration of 100 µg of
oleuropein/ mL or extractable matter per mL of extracts. At the same concentration
of oleuropein and all extracts, oleuropein showed a significantly higher FRAP value
than all extracts (p < 0.05). Among the extracts, the enriched extract was
significantly higher than all other extracts (p < 0.05) in terms of FRAP values,
followed by crude extract and then the commercial extracts. All the commercial
extracts were not different from each other (p ˃ 0.05) in terms of FRAP values.
The results of the FRAP assay showed same trend of antioxidant capacity for
oleuropein and extracts as was observed for the ABTS scavenging activity. Though
different mechanisms were involved, the results were the same. Oleuropein found
to be more potent as an antioxidant than the extracts in the FRAP assay too. Like
the other antioxidant activity assays, the FRAP assay also revealed that the enriched
and crude extracts prepared from dried olive leaves showed significantly higher
values compared to the commercial extracts.

172
Figure 4.15: FRAP values of olive leaf extracts as trolox equivalent.
TE: trolox equivalent, HMCE: Hardy’s Mammoth crude extract, HMEE: Hardy’s
Mammoth enriched extract, OLAE: Comvita (Olive Leaf Australia) extract, BME:
Blackmores extract, SOLE: Swisse extract. Different letters on the bars indicate significant
differences (p < 0.05).
The FRAP assay is widely used for assessing the antioxidant capacity. The
antioxidant activity of a compound would be totally dependent on its ability to
reduce iron (Ou et al., 2002). However the accuracy of FRAP value as an
antioxidant is questioned in the literature for a number of reasons. Firstly it has been
commented that all reducing agents are not antioxidants, as any compound which
has a redox potential lower than the redox potential of Fe3+/Fe2+ (0.77) can
contribute to the FRAP value. Secondly, not all antioxidants reduce Fe3+ to Fe2+ at
a fast rate (4-8 minutes), as some biophenols may require a longer time for reaction.
Thirdly, the FRAP assay is carried out at an acidic pH (3.6) to maintain iron
solubility, but low pH may prevent electron transfer (Ou et al., 2002; Prior et al.,
2005; Wong et al., 2006; Konczak et al., 2010). However, in the present study it
c
b
d d d
a
0
5
10
15
20
25F
RA
P V
alu
e m
illi
mole
s T
E/
mL
Olive Leaf Extracts

173
seems to be a good representative of antioxidant capacity, as it showed the same
trend as was seen by ABTS radical scavenging assay. Prior et al. (2005) reported
that redox potential of Fe3+-TPTZ (0.77) is comparable with that of ABTS•+ (0.68)
and the compounds which react with FRAP also react with ABTS, even though both
assays were performed at different reaction conditions, as the ABTS is performed
on neutral pH while FRAP is performed at acidic pH.
Biophenols perform an antioxidant function by a number of potential pathways.
Free radical scavenging is one of the most important, where biophenols most likely
break the free radical chain reaction. The backbone structure of biophenols may
have different substituents which endow them with antioxidant properties,
especially their hydrogen-donating capacity (Carrasco-Pancorbo et al., 2005). In the
antioxidant capacity assays, the crude and enriched extracts showed higher
antioxidant capacities, clearly indicating they were more potent than the
commercial extracts. The enriched extract was more potent than the crude extract
for all assays except the H2O2 scavenging assay, where the crude extract was more
potent. The results of the present study are in accord with the findings of Obied et
al. (2009). They also reported a higher potency for ethyl acetate extract in
comparison to crude extract. Furthermore, individual biophenols; oleuropein and
luteolin in case of copper chelation, showed greater potency than extracts. The only
exceptions were the SOR and H2O2 scavenging assays. It is evident from the results
that sample treatment and extraction solvent play a vital role in the recovery of
biophenols and thereby in the antioxidant activity. The antioxidant potency of the
extract can be increased with sample treatment and by selecting most suitable
solvent for extraction.
174
On the other hand, it is clear from the results that oleuropein was not the only
biophenol responsible for the antioxidant activity, as the enriched extract, which
had lower oleuropein levels than the crude extract, showed greater potency than the
crude extract, except for H2O2 radical scavenging activity. Moreover, the
antioxidant capacity of the extracts was not very well correlated with total phenol
content, as the Swisse extract was the highest in total phenol content but it did not
show the highest activities. The lower activities of commercial extracts in contrast
to crude and enriched extracts may be due to more non phenolic matter in the
commercial extracts, as they showed higher recoveries of dry and extractable
matter. Although the commercial extracts contained a greater biomass in the same
volume, their lower potency indicates that in addition to biophenols, other non-
active compounds were also present.
4.3.6. Alpha-amylase inhibition
The α-amylase inhibition of olive leaf extracts and oleuropein can be seen in Figure
4.16 and the IC50 values in Table 4.1. The enzyme inhibition, as denoted by IC50
values, was decreased in following order: oleuropein > enriched extract > crude
extract > Swisse extract > Blackmores extract > Comvita extract.
Oleuropein was found to be a more potent α-amylase inhibitor than the extracts,
which indicates a poor or no synergistic effect of biophenols in extracts. The
enriched and crude extracts, which had a higher oleuropein content, also showed
greater potency than the commercial extracts for enzyme inhibition. These findings
suggest that oleuropein is the main biophenol responsible for the antidiabetic effect,
but other biophenols may also involved. Our findings are in agreement with the
findings of (Gonzalez et al., 1992; Al-Azzawie and Alhamdani, 2006; Sato et al.,
175
2007; Jemai et al., 2009). They all reported that oleuropein is responsible for the
antidiabetic effect of olive leaves. A reduction in post-prandial hyperglycaemia is
considered one of the therapeutic approaches for diabetes mellitus. The decrease in
post-prandial hyperglycaemia can be achieved by inhibition of enzymes like α-
amylase, which hydrolyse carbohydrates (Haveles, 2014). α-amylase is involved in
the hydrolysis of long chain carbohydrates to oligosaccharides. Inhibitors of this
enzyme can interfere with carbohydrate digestion and absorption, thereby reducing
the post-prandial hyperglycaemia. Acarbose is an α-amylase inhibitor and is
considered as effective drug for treating diabetes mellitus. Inhibition of α-amylase
enzyme by olive leaf extracts suggests that olive biophenols can interfere with
carbohydrate metabolism/digestion and absorption. Hence they can play a positive
role in controlling glucose absorption and managing type 2 diabetes mellitus. On
the basis of the results it can be suggested that olive biophenols may be able to halt
the progression of prediabetes to type 2 diabetes by reducing postprandial
hyperglycaemia. Our results are in agreement with the findings of (Komaki et al.,
2003), who reported a good inhibition of human salivary and pancreatic α –
amylases with olive leaf extract, showing IC50 values of 4.0 and 0.02 mg/ml,
respectively in an in vitro assay. An inhibitory effect of olive leaf biophenols on the
postprandial increase in blood glucose in diabetic rats was also reported in that
study. The findings are also in accord with (Bechiri et al., 2015), who also reported
an inhibition of α-amylase with an aqueous extract of olive leaves, in an in vitro
assay.

176
Figure 4.16: α-Amylase inhibition activity of oleuropein and olive leaf extracts.
(a) oleuropein (b) crude extract (c) enriched extract (d) Comvita extract (e)
Blackmores extract (f) Swisse extract.

177
4.4. Conclusion
The present study made a multidimensional evaluation of antioxidant activity and
α-amylase enzyme inhibition activity of olive leaf extracts in comparison to
standards. The antioxidant activities of olive leaf extracts and biophenols were
demonstrated in array of diverse bioassays.
It is evident from the results that olive leaf biophenols as individual compounds,
and in a combined form of extract, are excellent antioxidants. Hence the role of
olive leaf biophenols can be elucidated as potential nutraceuticals, being a multi
efficient bioactive molecules.
The results clearly indicate that olive leaf biophenols strongly inhibited the α-
amylase enzyme, so it could be beneficial in lowering blood glucose levels and can
be utilized as an antidiabetic agent. The scope of olive leaves is promising, as the
side effects of synthetic drugs necessitate the need for natural inhibitors of
carbohydrate hydrolysing enzymes from plant sources.
It is suggested that the interference of test substances with assay or assay reagents
as well as the limitations of the assay should be taken into consideration before
selecting an assay for antioxidant activity, in order to increase the accuracy and
credibility of the assay.
It can be concluded that olive leaves are an excellent source of natural antioxidants
and their biophenols are capable of inhibiting metabolic enzymes, especially α-
amylase, which suggests their potential as nutraceuticals.
178
Chapter 5. An investigation into olive leaf extract
as a therapeutic antioxidant treatment
of prediabetes
5.1. Introduction
Diabetes mellitus is a massive challenge to the world, with high mortality rates. In
2015, on average one person died every six seconds from diabetes (International
Diabetes Federation, 2015). According to International Diabetes Federation (2015),
five million people died due to diabetes, and the annual expenditure on health care
of diabetic patients has reached to US$ 673 billion. It has been estimated that about
415 million people, were living with diabetes in 2015 worldwide. This number is
expected to rise to 642 million by 2040. In 2015, about 20.9 million cases of
gestational diabetes were reported (International Diabetes Federation, 2015). The
International Diabetes Federation (2015) also estimates that about 193 million
people are unaware that they have diabetes. In Australia, 1.7 million people have
diabetes and diabetes is increasing at a faster rate than other chronic diseases such
as cancer and heart disease, with about 280 cases of diabetes recorded every day
(Diabetes Australia, 2015). The total annual cost impact of diabetes in Australia
estimated at $14.6 billion (Diabetes Australia, 2015) and Australia had the highest
diabetes related spending on healthcare per person (US$ 7652 to US$ 14,498)
worldwide (International Diabetes Federation, 2015).
The commonly used terms for prediabetes are impaired glucose tolerance (IGT) and
impaired fasting glycaemia (IFG) (Twigg et al., 2007; Tabák et al., 2012). A person
is said to be prediabetic with IFG when the fasting blood glucose level is between
6.1 to 6.9 mM/L. IGT is diagnosed following an oral glucose tolerance test when
blood glucose level 2 hours after glucose intake is from 7.8- 11 mM/L, with the

179
Australian definition (Diabetes Australia, 2015). It is possible that one can have
both IFG and IGT. Worldwide 318 million people (6.7%) are living with
prediabetes, meaning one in 15 adults (International Diabetes Federation, 2015). In
Australia, 2 million people have prediabetes and one in three people with
prediabetes will develop type 2 diabetes. Obesity, lack of exercise, high blood
pressure, high cholesterol and family history of type 2 diabetes and heart disease
are risk factors for prediabetes (Diabetes Australia, 2015).
Imbalance in glycaemic control occurs when β-cells fail to compensate for the
insulin resistance and β-cell failure leads to type 2 diabetes from prediabetes/IGT
(DeFronzo and Abdul-Ghani, 2011). From a medical and economic point of view
it is imperative to treat the individuals with prediabetes to prevent the progression
towards the type 2 diabetes. Recent research from the studies on people with IGT
suggested that early intervention in type 2 diabetes is beneficial and can cure it
(Andrews et al., 2011; DeFronzo and Abdul-Ghani, 2011). Weight loss, exercise,
nutritional management and pharmacological intervention are the common
strategies used to prevent the progression of prediabetes to type 2 diabetes. An
intensive diet intervention soon after the diagnosis is effective in managing blood
glucose levels, however exercise in this particular study did not result in additional
benefits (Andrews et al., 2011).
Oxidative stress can affect biological macromolecules such as DNA, lipids and
proteins. The oxidation of those macromolecules by oxidative stress is considered
to be a critical step in the pathophysiology of many degenerative and age related
diseases such as atherosclerosis and cardiovascular disease (Favier, 2003). There is
accumulating evidence that oxidative stress plays a significant role in the aetiology
and pathology of diabetes mellitus. The cardiovascular complications in diabetes
180
are reported to begin at the prediabetes stage and involve hyperglycaemia-induced
oxidative stress (Nwose et al., 2007). This gives a broader aspect for the effect of
oxidative stress on the diabetic patient. Oxidative stress plays a crucial role in the
pathogenesis of type 2 diabetes mellitus and its complications, as it plays an
important role in the development of insulin resistance (Eriksson, 2007; Nwose et
al., 2007; Al-Aubaidy and Jelinek, 2010). Hyperglycaemia results in the generation
of ROS, which then cause oxidative damage to the erythrocytes (Nwose et al., 2007)
and free radical production increased in individuals suffering from prediabetes due
to high blood glucose. This in turn modulates most of the tissue damage that results
in the progression to type 2 diabetes and complications associated with diabetes
(Nwose et al., 2008), as reactive oxygen species (ROS) and reactive nitrogen
species (RNS) can damage macro molecules such as proteins, lipids, and nucleic
acids (Al-Aubaidy and Jelinek, 2011a). Type 2 diabetic patients had significantly
higher oxidative DNA damage as evidenced by elevated levels of 8-hydroxy 2'-
deoxy-guanosine (8-OHdG), which is a common biomarker for the measurement
of oxidative DNA damage, total systemic oxidative stress and for the diagnosis of
diabetes (Al-Aubaidy and Jelinek, 2011a, 2011b). It is proposed that 8-OHdG is a
product of oxidative DNA damage produced by specific enzymatic cleavage after
ROS-induced 8-hydroxylation of the guanine base in mitochondrial and nuclear
DNA (Al-Aubaidy and Jelinek, 2011b).
The major antioxidant defence system in the body is reduced glutathione (GSH),
superoxide dismutase, thioredoxins, catalase and antioxidant nutrients (Powers and
Jackson, 2008). GSH, a cellular antioxidant found in erythrocytes, acts as a
substrate for GSH peroxidase-1 (Al-Aubaidy and Jelinek, 2011b). It has been
noticed that diabetic patients have more of the oxidized form of glutathione rather

181
than reduced form, which may result in poor defence against oxidative stress (Al-
Aubaidy and Jelinek, 2010).
This has lead to the hypothesis that administration of botanical antioxidant
supplements may correct this oxidative stress and consequently treat diabetes
mellitus. Olive leaves have also been known for improving metabolic disorders,
possessing anti-diabetic properties and are widely recognized as a traditional
remedy for diabetes and hypertension in the Mediterranean basin (Komaki et al.,
2003). The hypoglycaemic activity of OLE has been demonstrated in animal studies
and oleuropein is known to act on diabetes, as discussed in Chapter 1 (Gonzalez et
al., 1992). Multiple studies in animals and humans have shown a range of disease
ameliorating activities of OLE, which can be very useful in treating diabetes
mellitus, such as glucose lowering, cholesterol lowering, sensitising tissues to
insulin, reduction of high blood pressure, cell and neuron protection and anti-
obesity properties. Most of these studies are preclinical (in vitro, ex vivo, and animal
models), so more randomized controlled clinical trials are needed to confirm these
findings.
The effect of olive leaf biophenols on glucose metabolism, particularly by
attenuating the oxidative stress, has not been thoroughly investigated, with only a
few studies conducted and very limited data existing. The current study was a pilot
study undertaken in people who are diagnosed as pre-diabetic, to develop
preliminary evidence on whether early intervention with dietary supplementation
of OLE can produce a measurable effect on plasma oxidative stress and slow or
revert the progression of the disease in pre-diabetic patients.

182
5.2. Materials and methods
This was a single-centre, randomised, double blinded, prospective pilot study on
the effect of dietary supplementation with olive leaf extract capsules. Prediabetic
male and female subjects (n=18) were randomized into two groups and received
daily doses of placebo, or olive leaf extract capsules. Their blood glucose level,
lipid profile (total cholesterol, triglycerides, LDL-cholesterol, VLDL-cholesterol,
HDL-cholesterol and cholesterol/HDL) and glycated haemoglobin (HbA1c) were
measured by the pathology lab that collected the blood and urine. In addition to that
total phenol contents and oxidation markers; STAT-8-isoprostane and 8-hydroxy-
2'-deoxyguanosine were also measured to assess the impact of supplementation.
5.2.1. Ethics approval
The study protocol was approved by the Charles Sturt University Ethics in Human
Research Committee (Approval number: 2012/049) (see APPENDIX 3). An
information statement (see APPENDIX 4) was provided to all subjects. The study
was verbally explained to them and written consent was obtained from all
participants.
5.2.2. Subject recruitment
Prediabetic subjects were recruited from the community through announcements in
the local newspaper, television and on Charles Sturt University’s newsle between
February 2014 and March 2014. Complete details, email addresses and postal
addresses were collected from those who wished to participate. Emails were sent,
providing a thorough explanation of the study and expectations of the participants.

183
The inclusion criteria for subjects were as follows: (1) diagnosed with impaired
glucose tolerance, based on an oral glucose tolerance test; (2) aged from 20 to 67
years; (3) not taking any medication for diabetes; (4) not taking any medication that
may have effect on blood glucose level directly or indirectly; (5) not taking
corticosteroids and beta blockers; (6) not having any chronic disease like
cardiovascular diseases or Alzheimer’s disease; (7) female participants should not
be pregnant or lactating.
5.2.3. Study protocol
After recruitment, 18 participants (8 male and 10 female) were randomised into two
groups; control and treatment group with 9 subjects in each (Group A and B). To
avoid any researcher bias in assigning participants to supplement protocols, the
randomisation was prepared and assigned using computer random number
generation and both researchers and subjects were ‘blinded’ to the contents of
capsules being taken. The code was released after statistical analysis.
Although adverse effects of olive leaf extract were not documented, subjects were
made aware that it may produce symptoms like headache and fatigue. Subjects were
advised to discontinue the supplementation protocol immediately if symptoms
occurred and report to research team and general health practioner (GP).
Before treatment, reference blood and urine samples of each subject were taken by
a pathology lab collection service. The blood glucose level, lipid profile (total
cholesterol, triglycerides, LDL-cholesterol, VLDL-cholesterol, HDL-cholesterol
and cholesterol/HDL) and glycated haemoglobin (HbA1c) were measured by the
pathology laboratory. The oxidative biomarkers; STAT-8-isoprostane and 8-
hydroxy-2'-deoxyguanosine and total phenols were measured by the researcher in

184
the research laboratory. At the end of the study (after 12 weeks), again blood and
urine samples were taken to assess the same parameters. Values at the start and at
the end of experiment were compared, to determine the effect of olive leaf extract
and placebo on blood glucose levels and oxidative stress.
5.2.4. Dietary collection
Participants were asked to fill in pre-study and post-study surveys (see APPENDIX
5 and 6) about their food intake, feeding habits, life style and health status that may
influence the results. Participants recorded their consumption of the foods high in
biophenol content like tea, green tea, red wine, fruits and vegetables as serves per
week. In order to minimize error in the study results, the participants were advised
to maintain their current dietary intake and not to make changes to their diet and
physical activity levels for the duration of the study.
5.2.5. Test material (supplement)
Olive leaf extract capsules and empty bottles for the placebo were obtained from
Comvita, Olive Leaf Australia. The placebo was prepared by The Melbourne
Compounding Centre, Seddon, Victoria. The placebo was matched with the
capsules as closely as possible in look, feel and taste, and consisted of a 1:9.5:15
mix of vinegar, water and glycerol, with yellow, red and green food colour in a
3:1:1.5 mix. As preservatives can have an antioxidant effect, it was necessary to
avoid preservative(s) in the placebo formula. Therefore glycerol was used to
stabilise the placebo. The treatment group was provided with olive leaf extract
capsules (2400 mg) and asked to take three capsules per day for 12 weeks, while
the control group was provided with placebo capsules and asked to take three
capsules per day for 12 weeks. Taking capsules was not restricted to meals.

185
5.2.6. Compliance
All participants were required to return the remaining capsules and empty capsule
bottles at the end of the 12 weeks period. Compliance was measured by the allotted
number of daily doses dispensed minus the number of daily doses returned.
5.2.7. Blood and urine samples
About 6 mL of blood sample was collected in a fasting state from each subject from
the median cubital vein in the morning. A urine sample from each subject was also
collected by the pathology collection service. The blood sample was separated as
serum by the pathology laboratory. Both serum and urine samples of the subjects
were provided by the pathology laboratory at baseline and follow-up. The urine
samples then were centrifuged at 4500 rpm for 10 minutes at 4 ºC in a Beckman
Coulter (Allegra X-30R) centrifuge and the supernatant was collected in aliquots.
Aliquots of serum and urine samples were stored at -80° C until analysed for
oxidation markers.
5.2.8. Reagents and standards
Here only those chemicals are listed which were used by the researcher to perform
total phenols and oxidative biomarkers assays. Reagents, chemicals and standards
were used without further purification: Folin-Ciocalteu reagent, gallic acid,
metaphosphoric acid, triethanolamine and phosphate-buffered saline were from
Sigma-Aldrich (Steinheim, Germany). The STAT-8-isoprostane Kit (500431) was
purchased from Cayman Chemical Company, Ann Arbor, MI, USA, The 8-
hydroxy-2-deoxyguanosine (8-OHdG) kit (KOG-200S/E) from the Japan Institute
for the Control of Aging (JaICA, Fukuroi, Shizuoka, Japan) was purchased from
186
Life Sciences Research, Australia. Water used in all analytical work was purified
(0.22 µm) by a GenPure water purification system (Thermofisher Scientific,
Melbourne, Australia).
5.2.9. High performance liquid chromatography (HPLC) of olive leaf
extract capsules
For HPLC analysis, the same instruments and column were used as in Chapter 2.
The solvents and method used for gradient elution were same as described in
chapter 3. All the contents of the capsule were transferred to a beaker and 10 mL of
water or 50% aqueous methanol or 80% aqueous methanol was added. The mixture
was sonicated for 20 minutes and then centrifuged at 4000 rpm for 10 minutes. The
supernatant was collected and filtered through a 0.45 µm syringe filter. The
prepared extracts were diluted 1:10 for HPLC analysis. The identification and
quantification of oleuropein was done according to the method of chapter 2.
5.2.10. Spectrophotometric measurements
Colorimetric analyses were performed on a microplate reader (FLUOstar Omega
UV-Vis plate reader; BMG, GmbH, Offenburg, Germany).
5.2.10.1. Total phenols assay
Total phenol content of urine samples was measured by a modified version of the
method described in Chapter 2. The assay was performed in a 96 well flat bottom
microtiter plates instead of macro cuvettes. Urine samples were centrifuged at
10,000 rpm for 10 minutes and diluted (1:10) with water. To each well of the
microplate, 100 μL of water, 20 μL of sample or standard or 50% aqueous methanol
and 50 μL of Folin-Ciocalteu reagent was added. The plate was shaken for 1min
187
and then 90 μL of aqueous sodium carbonate solution (20% w/v) was added. The
microplate was shaken for 1 hour at room temperature. The absorbance was read at
760 nm in a plate reader. A seven point calibration curve (10-120 µg/mL) was
prepared using gallic acid. Results were expressed as milligrams gallic acid
equivalent per ml of urine (mg GAE/g).
5.2.10.2. Isoprostanes assay
A competitive enzyme-linked immunosorbent assay (ELISA) STAT-8-Isoprostane
kit was used to measure isoprostanes. All reagents were prepared and used as
recommended by the manufacturer. Urine samples were centrifuged at 10,000 rpm
for 10 min and diluted 1:2 and 1:10 with tris buffer supplied with kit. A stock
standard solution was diluted to eight different concentrations (23.4-3000 pg/mL)
for standard curve preparation. In a 96-well flat bottom microplate which was pre-
coated with mouse anti-rabbit IgG, 50 μL of sample or standard was added. In
maximum binding wells (B0), 50 μL, and in non-specific binding (NSB) wells, 100
μL of Tris buffer was added. Then 50 μL of STAT-8-isoprostane AP (alkaline
pohsphatase) tracer was added to each well except total activity (TA) and the blank
wells. After mixing, 50 μL of STAT-8-isoprostane EIA antiserum was added,
except to TA, NSB and the blank wells. After side by side mixing, the plate was
covered and incubated at room temperature for one hour on a plate shaker. After
incubation, the contents of the plate were discarded and the plate was washed with
washing buffer. The plate was then inverted on lint free paper towel to remove
residual washing buffer. The washing was repeated four times more with washing
buffer. Then 200 μL of freshly prepared para-Nitrophenyl Phosphate (pNPP) was
added to all wells and 5 μL of tracer was added only to TA wells. The plate was
covered and incubated on a plate shaker in the dark for 90 minutes and the

188
absorbance was read at 420 nm. The concentration of 8-isoprostane in samples was
measured with reference to an eight point standard curve (23.4-3000 pg/mL).
5.2.10.3. 8-Hydroxy-2-deoxyguanosine (8-OHdG) assay
For the measurement of oxidative DNA damage, a competitive ELISA kit was used
for 8-OHdG (JaICA, Fukuroi, Shizuoka, Japan). All reagents and samples except
the chromatic solution were brought to room temperature (20-22 ºC) before use.
Urine samples were centrifuged at 10,000 rpm for 10 min and diluted 1:2 with
phosphate buffered saline (pH= 7.4). All reagents were prepared and used according
to manufacturer instructions. The primary antibody (Anti 8OHdG monoclonal
antibody (clone N45.1)) was reconstituted with phosphate buffered saline. In a pre-
coated 96- well plate 50 μL of samples or standard 8-OHdG solution (0.5, 2, 8, 20,
80, 200 ng/mL) and 50 μL of reconstituted primary antibody was added to each
well. The outermost wells of the plate were not used, to avoid edge effects, and
were filled with water to maintain a uniform volume and temperature. The plate
was sealed with an adhesive strip and placed on a plate shaker, and the contents
were thoroughly mixed for 30 sec. Then the plate was incubated at 37°C for 1 hour
in a water bath. After removing the contents of the well, 250 μL of washing solution
(5x phosphate buffered saline, diluted with water) was added to each well. The plate
was thoroughly agitated, and the washing solution disposed of. The plate was then
inverted on lint free paper towel to remove residual washing buffer. The washing
was repeated twice more. Then 100 μL of the secondary antibody (HRP conjugated
anti mouse IgG) was added in each well. The plate was sealed with an adhesive
strip and contents were thoroughly mixed for 30 seconds on a plate shaker. Then
the plate was incubated at 37°C for 1 hour in a water bath and the washing procedure
was repeated in the same manner as before. Enzyme substrate solution was prepared
189
freshly by diluting one part of chromatic solution (3,3',5,5' tetramethyl benzidine)
to 100 with diluting solution (hydrogen peroxide/citrate phosphate buffered saline).
Then 100μL of substrate solution was added in each well. The plate was then
incubated at room temperature in the dark for 15 min after 30 sec shaking on a plate
shaker. The reaction was stopped by adding 100μL of 1M phosphoric acid. After
30 sec shaking on a plate shaker, the plate was read at 450 nm. The concentration
of oxidative DNA in samples was measured with reference to a six point standard
curve (0.5-200 ng/mL).
5.2.11. Statistical analysis
All assays were performed in at least triplicate and averaged. Results are expressed
as mean ± standard error. Data analysis was performed by Microsoft Excel and IBM
SPSS Statistics package version 20.0 (SPSS, IBM Corporation, New York).
Statistical comparisons were made using repeated measures one-way ANOVA and
post-hoc Tukey test. Non-parametric statistical analysis was performed with the
Statistical Package for Social Sciences (SPSS) version 23 software program (IBM
Corporation, New York). The Wilcoxon signed-rank test was performed to compare
the clinical values of pre- and post-intervention in both treatment and control
groups. The mean value was used to complete the missing data. Results were
considered statistically significant at p < 0.05.
5.3. Results and discussion
Eighteen subjects (eight males and ten females) started the study. Twelve of them
completed the study (six male and six female participants, out of them five were on
placebo and seven were on olive leaf extract capsules supplementation).While four
of them did not given the final blood and urine samples for oxidation markers. Two

190
of the subjects withdrew at the beginning of study without providing baseline blood
and urine samples due to personal commitments. Two other subjects started taking
the supplements and provided baseline samples but quit the trial for personal
reasons. A further two subjects left within two weeks after start, due to adverse
reactions; one reported some skin rashes and the other reported gastric reflux. The
data of pre- and post-study surveys, regarding the dietary intake, feeding habits, life
style and health status was not analysed, as sample size was eventually too small
and data were not different. There was no value to subdivide this small data, as it
would lose its statistical power.
The levels of blood glucose, glycated haemoglobin (HbA1c) and lipid profile
including total cholesterol, triglycerides, LDL-cholesterol, VLDL-cholesterol
HDL-cholesterol and cholesterol/ HDL ratio were measured at baseline and at the
end of the study.
5.3.1. Nonparametric analysis of clinical data
Due to the limitations of the sample size, non-parametric statistics should be applied
to these data. However, non-parametric data will not allow comparison between the
control and treatment group. Hence, we will report both parametric and non-
parametric data analysis to maximize the benefit from our data. Although we have
seen a drop and increase in base values, non-parametric data analysis using
Wilcoxon signed-rank test revealed that these change are not statistically
significant. The only two changes which were close to be statistically significant
are total blood cholesterol decrease in the treatment group (p-value = 0.059) and
the increase in the glycated haemoglobin in the control group (p-value= 0.066).
Therefore, there is a high chance of getting more promising data upon increasing

191
the sample size. Logistic ordinal regression was performed to predict the effect of
confounding factors, age and gender, but none showed statistical significance.
5.3.2. Parametric analysis of clinical data
The average fasting blood glucose levels of both the control and treatment groups
at baseline and at the end of study are shown in Figure 5.1. Blood glucose levels
were not significantly different between the groups (p ˃ 0.05) and no significant
reduction in the glucose level was achieved with the supplementation of olive leaf
extract or placebo (p ˃ 0.05). Glycated haemoglobin (HbA1c) levels are presented
in Figure 5.2. Both groups showed the same levels of HbA1c (p ˃ 0.05) at the start
of the study and again no significant reduction of HbA1c was achieved with the
supplementation of olive leaf extract or placebo (p ˃ 0.05).
The lipid profile (total cholesterol, triglycerides, LDL-cholesterol, VLDL-
cholesterol HDL-cholesterol and cholesterol/ high density lipoprotein ratio) of the
participants at the baseline and at the end of the study can be seen in Figure 5.3.
The results of the lipid profile also showed no difference between groups (p ˃ 0.05)
and no significant advantage of olive leaf extract supplementation or placebo (p ˃
0.05).
Our results are in agreement with the study of de Bock et al. (2013), who also
reported no significant effect on lipid profile with olive leaf biophenol
supplementation in overweight, middle-aged men at risk of developing the
metabolic syndrome. However in other studies, supplementation with olive leaf
extract resulted in a significant reduction of triglyceride level in patients with stage-
1 hypertension (Susalit et al., 2011) and decreased cholesterol level in borderline
hypertensive monozygotic twins (Perrinjaquet-Moccetti et al., 2008). Though in
some subjects apparently reduced values were noticed, statistically there were no
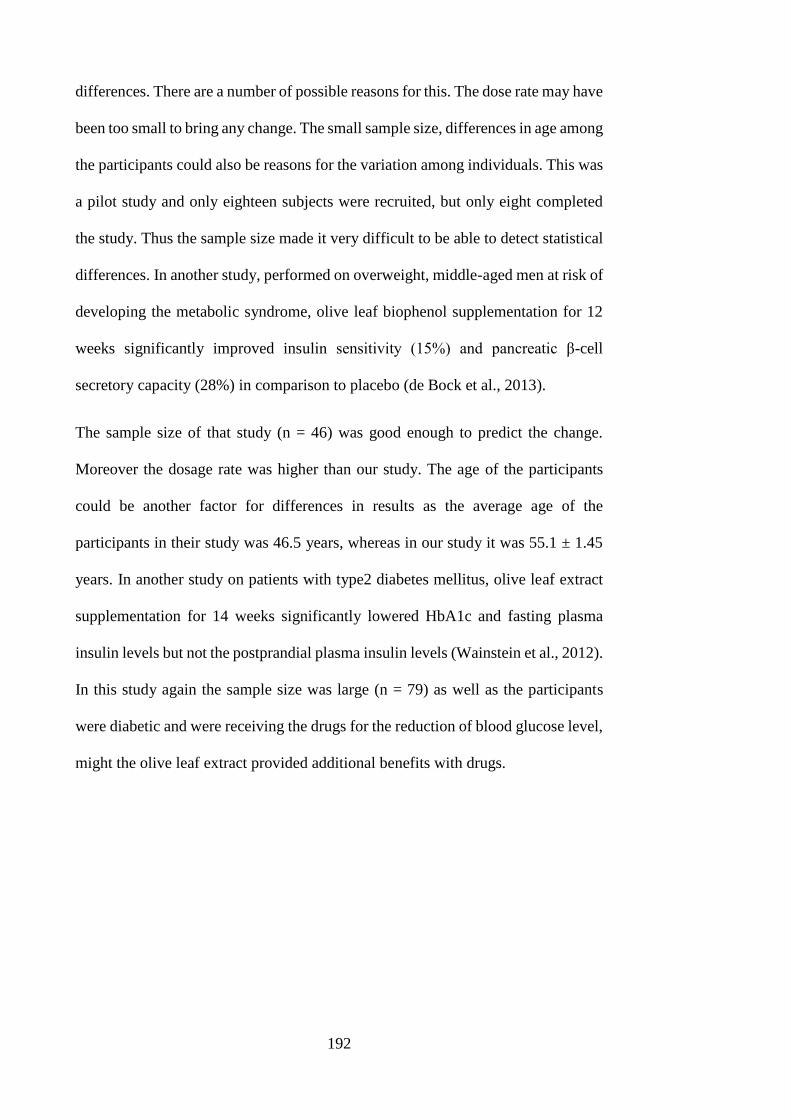
192
differences. There are a number of possible reasons for this. The dose rate may have
been too small to bring any change. The small sample size, differences in age among
the participants could also be reasons for the variation among individuals. This was
a pilot study and only eighteen subjects were recruited, but only eight completed
the study. Thus the sample size made it very difficult to be able to detect statistical
differences. In another study, performed on overweight, middle-aged men at risk of
developing the metabolic syndrome, olive leaf biophenol supplementation for 12
weeks significantly improved insulin sensitivity (15%) and pancreatic β-cell
secretory capacity (28%) in comparison to placebo (de Bock et al., 2013).
The sample size of that study (n = 46) was good enough to predict the change.
Moreover the dosage rate was higher than our study. The age of the participants
could be another factor for differences in results as the average age of the
participants in their study was 46.5 years, whereas in our study it was 55.1 ± 1.45
years. In another study on patients with type2 diabetes mellitus, olive leaf extract
supplementation for 14 weeks significantly lowered HbA1c and fasting plasma
insulin levels but not the postprandial plasma insulin levels (Wainstein et al., 2012).
In this study again the sample size was large (n = 79) as well as the participants
were diabetic and were receiving the drugs for the reduction of blood glucose level,
might the olive leaf extract provided additional benefits with drugs.
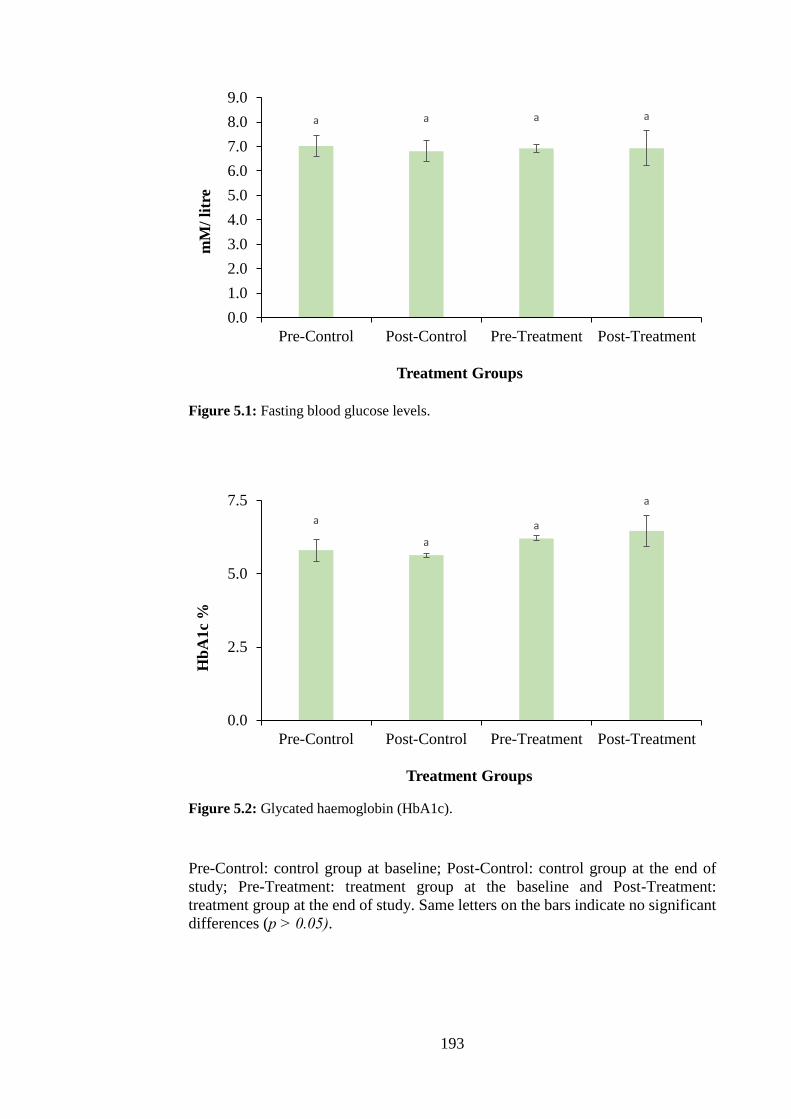
193
Figure 5.1: Fasting blood glucose levels.
Figure 5.2: Glycated haemoglobin (HbA1c).
Pre-Control: control group at baseline; Post-Control: control group at the end of
study; Pre-Treatment: treatment group at the baseline and Post-Treatment:
treatment group at the end of study. Same letters on the bars indicate no significant
differences (p ˃ 0.05).
a a a a
0.0
1.0
2.0
3.0
4.0
5.0
6.0
7.0
8.0
9.0
Pre-Control Post-Control Pre-Treatment Post-Treatment
mM
/ li
tre
Treatment Groups
a
a
a
a
0.0
2.5
5.0
7.5
Pre-Control Post-Control Pre-Treatment Post-Treatment
Hb
A1c
%
Treatment Groups

194
Figure 5.3: Lipid profile.
Pre-Control: control group at baseline; Post-Control: control group at the end of
study; Pre-Treatment: treatment group at the baseline and Post-Treatment:
treatment group at the end of study. TC: total cholesterol; Trig: triglycerides; HDL:
high density lipoprotein; VLDL: very low density lipoprotein; LDL: low density
lipoprotein; Cho/HDL: cholesterol to high density lipoprotein ratio. Within each
lipid, there was no significant difference (p ˃ 0.05) between groups.
0.0
1.0
2.0
3.0
4.0
5.0
6.0
TC Trig HDL VLDL LDL Cho/HDL
Valu
es m
M/
lite
r
Lipid Profile
Pre-Control
Post-Control
Pre-Treatment
Post-Treatment

195
5.3.2. 1. Total phenols
The antioxidant status of participants was also measured by determining total
phenols in urine using the Folin-Ciocalteu reagent. Total phenols of urine samples
at baseline and 12 weeks later are presented in Figure 5.4. The results of total
phenols showed no difference between groups (p ˃ 0.05) and no significant
advantage of olive leaf extract supplementation or placebo (p ˃ 0.05). Total phenols
gave us an estimate of the change in phenolic levels. Although total phenols are
generally used as an estimate for phenolic content, these values are also an estimate
of antioxidant status, as this method measures total reducing capacity of the samples
(Huang et al., 2005; Prior et al., 2005).
Figure 5.4: Total phenols in urine.
Pre-Control: control group at baseline; Post-Control: control group at the end of
study; Pre-Treatment: treatment group at the baseline and Post-Treatment:
treatment group at the end of study. Same letters on the bars indicate no significant
differences (p ˃ 0.05).
a
a
a
a
0
5
10
15
20
25
30
Pre-Control Post-Control Pre-Treatment Post-Treatment
mg/
mL
of
uri
ne
Treatment Groups
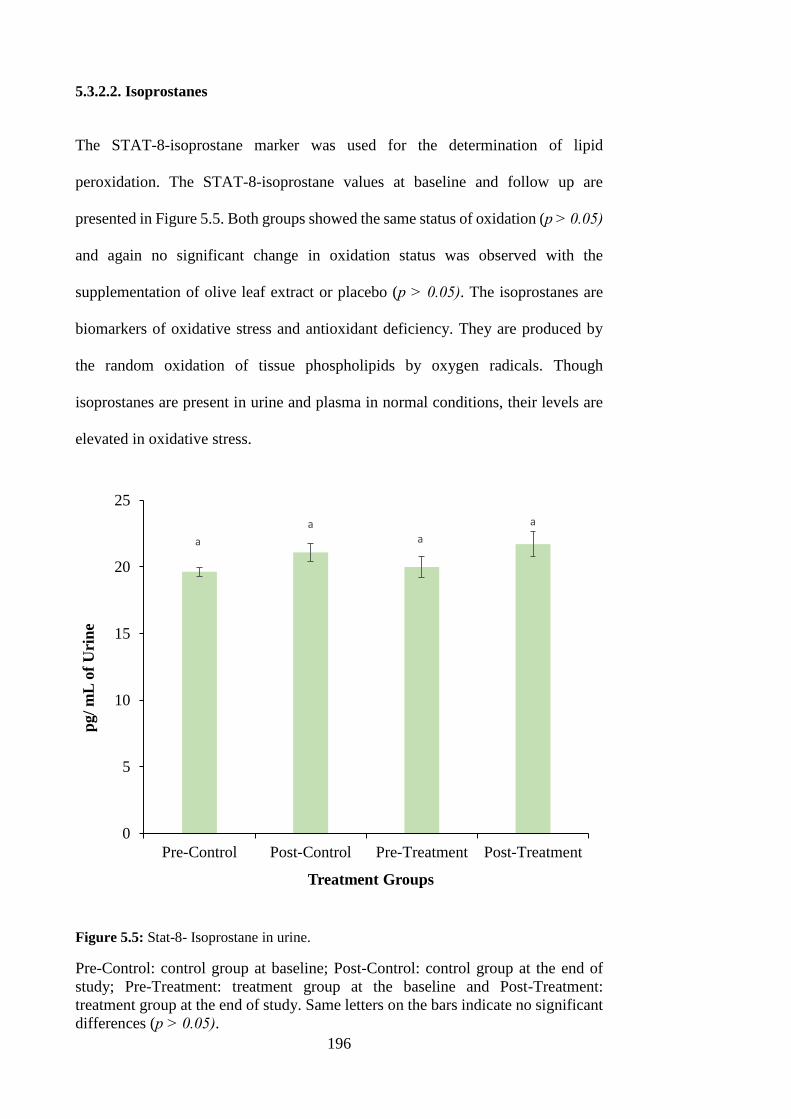
196
5.3.2.2. Isoprostanes
The STAT-8-isoprostane marker was used for the determination of lipid
peroxidation. The STAT-8-isoprostane values at baseline and follow up are
presented in Figure 5.5. Both groups showed the same status of oxidation (p ˃ 0.05)
and again no significant change in oxidation status was observed with the
supplementation of olive leaf extract or placebo (p ˃ 0.05). The isoprostanes are
biomarkers of oxidative stress and antioxidant deficiency. They are produced by
the random oxidation of tissue phospholipids by oxygen radicals. Though
isoprostanes are present in urine and plasma in normal conditions, their levels are
elevated in oxidative stress.
Figure 5.5: Stat-8- Isoprostane in urine.
Pre-Control: control group at baseline; Post-Control: control group at the end of
study; Pre-Treatment: treatment group at the baseline and Post-Treatment:
treatment group at the end of study. Same letters on the bars indicate no significant
differences (p ˃ 0.05).
a
aa
a
0
5
10
15
20
25
Pre-Control Post-Control Pre-Treatment Post-Treatment
pg/
mL
of
Uri
ne
Treatment Groups

197
5.3.2.3. Hydroxy-2-deoxyguanosine (8-OHdG)
The 8-OHdG marker was used for the measurement of DNA oxidation. The 8-
OHdG values at the baseline and follow up are presented in Figure 5.6. Again both
groups showed the same status of oxidation (p ˃ 0.05) and again no significant
change in oxidation status was observed with the supplementation of olive leaf
extract or placebo (p ˃ 0.05). 8-OHdG is a biomarker used for the quantitative
detection of the oxidative DNA adduct. It has been reported that diabetic patients
with hyperglycaemia show elevated levels of urinary 8-OHdG and the level of
urinary 8-OHdG in diabetes correlated with the severity of diabetic nephropathy
and retinopathy (Wu et al., 2004).
Figure 5.6: 8-Hydroxy-2-deoxyguanosine (8-OHdG) in urine.
Pre-Control: control group at baseline; Post-Control: control group at the end of
study; Pre-Treatment: treatment group at the baseline and Post-Treatment:
treatment group at the end of study. Same letters on the bars indicate no significant
differences (p ˃ 0.05).
a
a
a
a
0.0
1.0
2.0
3.0
4.0
5.0
Pre-Control Post-Control Pre-Treatment Post-Treatment
pg/m
L U
rin
e
Treatment Groups

198
The total phenols by Folin-Ciocalteu reagent and Stat-8- Isoprostane and 8-OHdG
oxidation marker tests were performed on urine samples. Therefore the results
obtained represent the whole body oxidative status (Kendall et al., 2009). But
measurement of oxidative markers as mass per unit volume in urine samples can
present a problem as individuals do not produce the same volume of urine at the
same time every day. Normal values of the oxidation markers used in this study
have not been established and the values varied from study to study. A baseline of
levels of oxidation markers should be established for these common oxidation
markers.
The results of oxidation markers indicate no significant change in prediabetic
participants with the supplementation of olive leaf extract. Similar findings were
reported earlier by (Kendall et al., 2009) when they investigated the effect of olive
leaf extract on the oxidative status of healthy young Australians, and reported that
none of the oxidative markers produced the appreciable change. They suggested
that the incompatibility of these oxidative markers with oxidative status in the
cohort may be one of the possible reasons (Kendall et al., 2009). The possible
reason for no change may be the individuals’ response to olive leaf supplement or
the dose given. Some individuals appeared to respond better to the supplement than
others but as a whole there was no significant response. It is worth mentioning that
the standard deviations for these markers were relatively high, which indicates a
high variability in the individual responses to the supplement/placebo.
Another possible reason for the lack of effect of treatment may be that the dosage
of the supplement was not high enough to produce any change. Although the dosage
was used according to manufacturer’s recommendation, this dose was for general
wellbeing and the participants of the study were prediabetic. They may need a
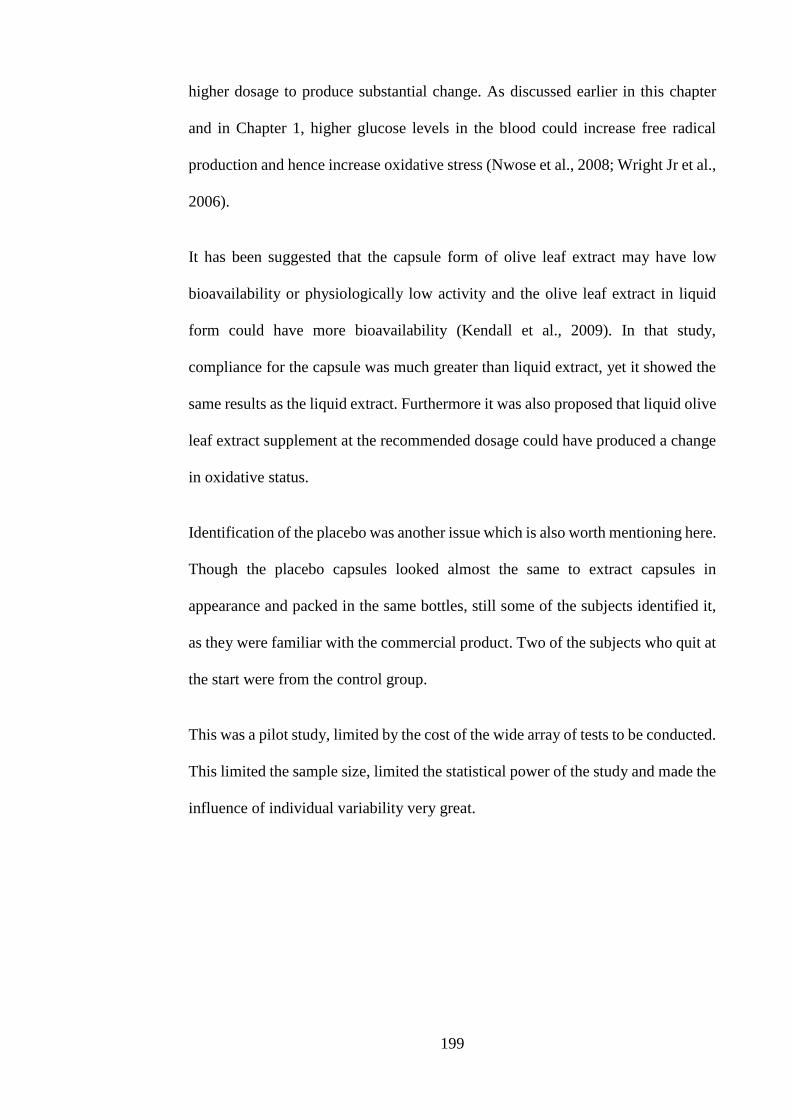
199
higher dosage to produce substantial change. As discussed earlier in this chapter
and in Chapter 1, higher glucose levels in the blood could increase free radical
production and hence increase oxidative stress (Nwose et al., 2008; Wright Jr et al.,
2006).
It has been suggested that the capsule form of olive leaf extract may have low
bioavailability or physiologically low activity and the olive leaf extract in liquid
form could have more bioavailability (Kendall et al., 2009). In that study,
compliance for the capsule was much greater than liquid extract, yet it showed the
same results as the liquid extract. Furthermore it was also proposed that liquid olive
leaf extract supplement at the recommended dosage could have produced a change
in oxidative status.
Identification of the placebo was another issue which is also worth mentioning here.
Though the placebo capsules looked almost the same to extract capsules in
appearance and packed in the same bottles, still some of the subjects identified it,
as they were familiar with the commercial product. Two of the subjects who quit at
the start were from the control group.
This was a pilot study, limited by the cost of the wide array of tests to be conducted.
This limited the sample size, limited the statistical power of the study and made the
influence of individual variability very great.
200
5.3.3. High performance liquid chromatography (HPLC) analysis of the
capsules
HPLC analysis of olive leaf capsules was performed in order to estimate the
oleuropein content of the capsules. Three different solvents; water and aqueous
methanol 50% and 80% were used to dissolve the content of the capsule, in order
to determine the most suitable solvent for maximal recovery of oleuropein content
(Figure 5.7). Oleuropein is considered as the main biophenol involved in the
hypoglycaemic effect of olive leaves (Al-Azzawie & Alhamdani, 2006; Gonzalez
et al., 1992), as in addition to its high activity it is also the major biophenol in the
extract. The results of Chapter 4 also showed good inhibition of α-amylase enzyme.
The extract of capsules prepared in 50% aqueous methanol showed significantly
higher oleuropein content than water and 80% aqueous methanol (p < 0.05), and
water showed significantly higher oleuropein content than 80% aqueous methanol
(p < 0.05). The chromatograms of Comvita olive leaf extract capsules in 50%
aqueous methanol, at 280 nm, 325 nm and their corresponding ABTS activity are
shown in Figure 5.8. A difference in oleuropein content of Comvita olive leaf
capsules was observed for different solvents , however when the Comvita olive leaf
extract was diluted in these solvents no differences were observed due to solvents
(Chapter 4). In this study we used different solvents to dissolve the contents of the
capsule for HPLC analysis, whereas in Chapter 4, solvents were used only for
dilution of the olive leaf extract. In this study, solvent may also play some part in
dissolving the solid content of the capsule. Due to that, 50% aqueous methanol
produced higher contents than other solvents. Moreover the concentration of
oleuropein was also different in the capsule from the liquid extract obtained from
the same company and analyzed in Chapter 4. For the liquid extract, we observed
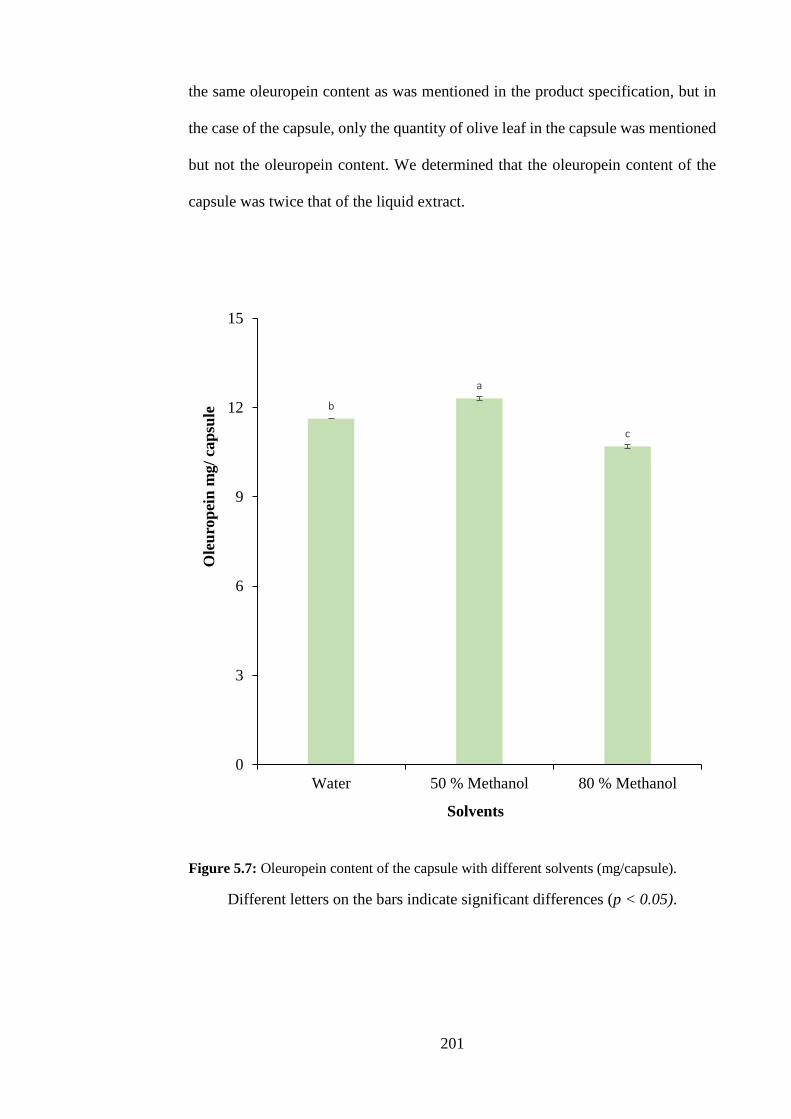
201
the same oleuropein content as was mentioned in the product specification, but in
the case of the capsule, only the quantity of olive leaf in the capsule was mentioned
but not the oleuropein content. We determined that the oleuropein content of the
capsule was twice that of the liquid extract.
Figure 5.7: Oleuropein content of the capsule with different solvents (mg/capsule).
Different letters on the bars indicate significant differences (p < 0.05).
b
a
c
0
3
6
9
12
15
Water 50 % Methanol 80 % Methanol
Ole
uro
pei
n m
g/
cap
sule
Solvents

202
Figure 5.8: HPLC chromatograms of Comvita olive leaf capsule, comparing 280 nm and
325 nm wavelength and the corresponding ABTS activity.
Comvita Olive Leaf Extract Capsule at 280 nm
Oleuropein
Comvita Olive Leaf Extract Capsule at 325 nm
Comvita Olive Leaf Extract Capsule ABTS activity
Oleuropein
203
5.4. Conclusion
As to our knowledge, no study has been performed on the effects of olive leaf
extract on the prediabetic population. The present study did not demonstrate any
significant effects of olive leaf capsule supplementation on prediabetic subjects.
The blood glucose level, glycated haemoglobin, lipid profile and oxidative markers
did not show any significant change either over time or in comparison to the control
group. Though it was a pilot study and the number of participants ended up too
small to produce any significant conclusion, this study has been a practical exercise
of the numerous challenges that face clinical trials for nutraceuticals. For the future
studies it is recommended that more careful consideration be given to the size of
cohorts, placebo, form and dosage of the supplement or extract in order to make the
judicious use of the oxidative biomarkers. The number of participants is a very
important factor as greater numbers will minimize the effect of individual variation.
It is also suggested that for any future studies the dietary intake during the study
period should be monitored. This is important for at least couple of reasons, firstly
it will ensure that the change/effect is due to supplement or food and secondly, there
may be some food and supplement interactions may involve, and if there is any that
must be accounted for the validity of results.

204
Chapter 6. General discussion, conclusion and
future directions
The concept of medicinal food and phytotherapy for health promotion and disease
prevention is gaining popularity across the globe. It is being adopted as it is more
economical and convenient than expensive medical and surgical procedures. The
way demand for nutraceuticals is increasing, it seems that in the future they would
play a vital role in disease therapy. At the same time, increasing demand and
consumer preference for nutraceuticals over synthetic drugs necessitates more
detailed and comprehensive research on nutraceutical sources. This research project
was designed for this reason, with an aim to evaluate Australian olive leaves as a
nutraceutical source of bioactive biophenols, and to study the antidiabetic effects of
olive leaf biophenols. To address this aim four experimental studies were designed.
In the first study the objective was to find out the best method for drying olive
leaves, one that allows the optimum recovery of olive leaf biophenols,
especially oleuropein. For the commercialization of olive leaves as
nutraceuticals, it is necessary to determine the best processing method, ideally
one that could increase the recovery of biophenols from the same biomass.
For this purpose, different drying treatments were tested on olive leaves and
the extracts from dried leaves were compared for biophenol contents with
extracts from fresh leaves. Olive leaf biophenolic composition and
antioxidant activity was determined by both spectrophotometric and HPLC
methods. Results of this study confirmed that the drying of olive leaves at
105 °C for 3 h before extraction results in a prodigious increase in biophenols
and antioxidant activity, in comparison to fresh leaves. The most phenomenal
increase was for oleuropein recovery, where a 38-fold increase was observed.
205
Therefore the drying of olive leaves at105 °C for 3 h before extraction
increases the suitability of olive leaves for commercial utilization in
nutraceutical industry.
For commercial purposes, it is strongly recommended that olive leaves should be
dried at a higher temperature for short time to increase the recovery of oleuropein,
other biophenols and antioxidant activity. It is worthwhile to put a little more effort
and expenditure on drying, as it pays a lot at the end in terms of more biophenols
from the same biomass. More recovery of oleuropein and other biophenols can be
easily produced on an industrial scale by drying the leaves prior to extraction and
drying in a hot air oven can be easily achieved and adopted on industrial scale. It is
likely that the consumer would be happy to pay more for a higher quality product.
Another important factor for the recovery of biophenols from plant material is the
extraction solvent. The selection of extraction solvent for olive leaf biophenols
seems not to be a complicated question anymore in the light of our results with 80%
aqueous methanol, as well as other published work (Obied, et al., 2005b; Malik and
Bradford, 2008; Abaza et al., 2011; Brahmi, et al., 2012b). It is worth mentioning
that 80% aqueous methanol has proven to be a good solvent for olive biophenols
and has demonstrated a good recovery of biophenols from olive leaves, but it may
not be as good with other plants and their different tissues/organs.
After achieving the first objective, next step was to determine the effect of season
and cultivar on the composition of olive leaf biophenols. Though it was reported in
the literature that genetic and environmental factors can greatly influence the
composition of biophenols, the variability in biophenols due to cultivar/variety and
environmental factors have not been studied extensively, particularly in Australia.

206
Therefore, it was of prime importance to study these factors, so that best time of
harvest could be identified, for optimal recovery of biophenols. For this purpose a
unique study was designed, which monitored biophenolic contents and antioxidant
activity of olive leaves for 28 months covering the complete production cycle of the
olive tree, beginning at the start of the fruiting season of one year and finishing at
the end of the 3rd year fruiting season. To our knowledge none of the previous
studies have examined biophenols for such long duration. In this study, analysis
was performed on extracts prepared from leaves dried at 105 °C for 3 h, as the
previous study confirmed that this treatment was best for highest biophenol
recovery.
Olive leaf biophenols varied quantitatively during different developmental stages
of biological cycle of olive tree, but no qualitative differences were detected. In all
the samples throughout the collection period the same biophenolic compounds were
observed. The study demonstrated that cultivar/ variety, month of collection and
season had significant effects on biophenol composition and antioxidant activity of
olive leaves. None of the cultivars followed a specific pattern for accumulation of
biophenols throughout the collection period. For the optimal antioxidant activity
and for maximum recovery of biophenols, including the oleuropein, the summer
season was found to be best. In comparing the cultivars, it became apparent that the
Leccino cultivar produced higher total phenols, phenolic compounds, o-diphenols,
hydroxycinnamic acid derivatives and higher antioxidant activity, whereas the
Hardy’s Mammoth cultivar produced higher oleuropein and total flavonoid content.
Correlation analysis revealed that biophenol contribution towards antioxidant
activity was not uniform. Biophenols responded differently to the different
antioxidant assays. Even oleuropein, which was always the major biophenol in the
207
extract, responded differently to the antioxidant assays performed. Therefore it is
recommended that antioxidant activity cannot be relied on one type of assay.
The results suggest that the time of collection is the most influential parameter with
regards to the suitability of olive leaves for commercial collection. For the recovery
of required biophenol for nutraceutical purpose, the selection of cultivar is also
important. Data generated in the study provide guidelines for seasonal and varietal
differences. Further studies on the quantification of individual biophenols and on
the bioavailability of these biophenols are required to establish the best time of
harvest for a particular biophenol recovery and to optimize their usage as a
functional food or nutraceutical.
That study answered the question regarding the best time of collection for a
particular cultivar. The next step was to find out the antioxidant and antidiabetic
activities of olive leaf biophenols, in order to determine their suitability for
nutraceutical industry. To address this objective, another study was planned, to find
out the in vitro antioxidant and antidiabetic activities of olive leaf biophenols. On
the basis of our results in the previous study it was decided that the antioxidant
activity of olive leaves should be determined by examining a number of different
mechanisms involved in antioxidant activity. The results of one single type of
antioxidant assay would not be appropriate for an actual estimate of an extract or
individual biophenol’s antioxidant capacity. Antioxidant activity should be
measured by considering different mechanisms. For the generalization of
antioxidant capacity of olive leaf biophenols, measurement should be done with a
few different assays. Moreover the antioxidant results obtained by the in vitro
assays may not reflect what would happen in vivo because of the complexity of
biological systems and due to interactions of nutritional and other factors within the
208
biological system. It was observed in the study that total phenols were not very well
correlated with antioxidant activity and it was not a given that an extract that had
higher level of total phenols would also possess higher antioxidant activity.
Olive leaf biophenols demonstrated excellent antioxidant capacity in all studied
antioxidant assays and strongly inhibited the α-amylase enzyme. This was the case
both for individual compounds and in a combined form of extract. Olive leaf
biophenols are multi efficient bioactive molecules, could be beneficial in lowering
blood glucose level. They have a great scope and have potential to be efficiently
utilized in nutraceutical industry as an antioxidant and antidiabetic agent.
Oleuropein is the major biophenol in olive leaf and appears to be mainly responsible
for olive leaf bioactivities. It possess excellent antioxidant capacity, acts as a free
radical scavenger and can be helpful in the prevention of oxidative stress as well as
in prevention of conditions associated with oxidative stress. Despite this, oleuropein
alone was not responsible for the antioxidant activity measured in the assays. It
appears that other biophenols are also involved in the antioxidant action of olive
leaves.
An excellent potency for the inhibition of α-amylase enzyme has been demonstrated
by oleuropein as an individual compound and in combination with other olive leaf
biophenols in the form of an extract. Olive leaf biophenols might therefore be
considered as a hypoglycaemic agent, may prevent hyperinsulinemia by reducing
blood glucose. This highlights the need to study the health promoting effects of
olive leaf biophenols beyond their antioxidant action.
The commercial extracts showed lower antioxidant and α-amylase inhibition
activity as compared to the crude end enriched extracts prepared in the laboratory.

209
This reflects the importance of drying of olive leaves at high temperature for a short
time before extraction, considering the remarkable increase in biophenol recovery
with drying, which was demonstrated in the first study. Furthermore, for the
preparation of the crude and enriched extracts, the leaves of the Hardy’s Mammoth
cultivar were collected at a time when oleuropein content was high. This reinforces
the earlier conclusion that drying and time of collection are important factors which
need to be considered to get extracts having more biophenols and higher potency.
This study demonstrated the in vitro antioxidant and antidiabetic activities of olive
leaf biophenols. The next step was to verify the results of in vitro study in an in vivo
experiment. For this purpose a study was planned to gain preliminary evidence of
the potential of olive leaf extract as an antidiabetic agent for pre-diabetic subjects.
To avoid the complicating effects of diabetic medication, it was decided to conduct
the study on prediabetic participants who were not taking any medication that may
have effect on blood glucose levels directly or indirectly. The intention was to
recruit at least 20 participants for the study so that the control and treatment groups
would both have at least 10 participants. Unfortunately we only found 18
participants and only 12 participants completed the study.
The study did not demonstrate any significant effects of supplementation with olive
leaf capsules on prediabetic subjects. The blood glucose level, glycated
haemoglobin, lipid profile and oxidative markers did not show any significant
change in comparison to the control group, probably due to highly individual
variability. Though some individuals did appear to respond to the supplement, as a
whole group there was no significant response.

210
To establish the in vivo antioxidant and antidiabetic activities of olive leaf
biophenols further investigation at the clinical level with a larger sample size is
needed. A small sample size can drastically effect results because of the individual
variation effect, which can be minimized in a larger population. Monitoring dietary
intake and lifestyle during a clinical study on diabetic or prediabetic subjects is of
vital importance and these factors must be considered while analysing results.
Although this data was collected, the eventual sample size of the study removed
any value from doing such an analysis.
A body of evidence suggests that olive leaf biophenols offers protection against
diseases and symptomatic conditions. Nevertheless these results are mostly
generated at the in vitro and subclinical level and only few clinical studies have
been performed. Therefore it is crucial to investigate the health promoting effects
of olive leaf biophenols at clinical levels/ in vivo for the efficient utilization of these
valuable nutraceuticals. Data generated in this research project provides a
reasonable basis for the utilization of olive leaves as a source of biologically active
compounds for health and wellbeing.
The superior biological activities of olive leaf biophenols do suggest the judicious
use of olive leaves as a supplement or nutraceutical to combat oxidative stress and
conditions associated with oxidative stress like diabetes mellitus. Olive leaves can
be consumed in a number of ways such as tea, extract, or they can be added to food
or food products to get their nutritional benefits. Fortification of food products with
olive leaves seems to be a good option to increase the value of food as it not only
increases the biophenol content but also prevents its oxidation and increases the
shelf life of food.

211
The ever increasing demand for nutraceuticals is asking for more comprehensive
investigation at the subclinical, clinical and molecular level. Moreover, questions
regarding the safety, dosage, toxicity and efficacy of these nutraceuticals must be
answered realistically by further research. This project is of utmost importance to
the nutraceutical, pharmaceutical and cosmetic industries. Olive leaf biophenols are
important bioactive molecules which bestow diverse bioactivities to olive leaves
and these bioactivities indicate that olive leaf biophenols have the potential to be
high value nutraceuticals, which might be effectively used for pathological
conditions. Olive leaf biophenols demonstrated strong inhibition of the α-amylase
enzyme, which suggests a potential role as an antidiabetic agent through reduction
in glucose uptake into the body. Though treatment with olive leaf extract did not
show an appreciable change in prediabetic patients in the pilot clinical trial due to
aforementioned constraints, it is still suggested that their antidiabetic effect should
be thoroughly investigated in controlled trials with a larger population, so that
individual variation can be minimized and more realistic results can be achieved. It
is concluded that olive leaf biophenols have a great potential as a nutraceutical, due
to their very high biophenol content, improving the quality of life by maintaining
health. This suggests that olive leaves or their isolated biophenols can be
successfully used in preventative medicine, nutraceutical, food and cosmetic
industries.

212
References
Abascal, K., Ganora, L., and Yarnell, E. (2005). The effect of freeze-drying and its
implications for botanical medicine: a review. Phytotherapy Research,
19(8), 655-660.
Abaza, L., Ben Youssef, N., Manai, H., Mahjoub Haddada, F., Methenni, K., and
Zarrouk, M. (2011). Chétoui olive leaf extracts: influence of the solvent type
on phenolics and antioxidant activities. Grasasy Aceites, 62(1), 96-104.
Afaneh, I., Yateem, H., and Al-Rimawi, F. (2015). Effect of Olive Leaves Drying
on the Content of Oleuropein. American. J. Analytical. Chemistry, 6(03),
246.
Agalias, A., Melliou, E., Magiatis, P., Mitaku, S., Gikas, E., and Tsarbopoulos, A.
(2005). Quantitation of Oleuropein and Related Metabolites in Decoctions
of Olea europaea Leaves from Ten Greek Cultivated Varieties by HPLC
with Diode Array Detection (HPLC‐DAD). Journal of Liquid
Chromatography & Related Technologies, 28(10), 1557-1571.
Ahmad-Qasem, M. H., Barrajón-Catalán, E., Micol, V., Mulet, A., and García-
Pérez, J. V. (2013). Influence of freezing and dehydration of olive leaves
(var. Serrana) on extract composition and antioxidant potential. Food
Research International, 50(1), 189-196.
Al-Aubaidy, H. A., and Jelinek, H. F. (2010). 8-Hydroxy-2-deoxy-guanosine
identifies oxidative DNA damage in a rural prediabetes cohort. Redox
Report, 15(4), 155-160.
Al-Aubaidy, H. A., and Jelinek, H. F. (2011a). Oxidative DNA damage and obesity
in type 2 diabetes mellitus. European Journal of Endocrinology, 164(6),
899-904.
Al-Aubaidy, H. A., and Jelinek, H. F. (2011b). Oxidative DNA damage:
antioxidant response in postprandial hyperglycaemia in type 2 diabetes
mellitus. The British Journal of Diabetes & Vascular Disease, 11(2), 87-91.

213
Al-Azzawie, H. F., and Alhamdani, M.-S. S. (2006). Hypoglycemic and
antioxidant effect of oleuropein in alloxan-diabetic rabbits. Life Sciences,
78(12), 1371-1377.
Al-Qarawi, A. A., Al-Damegh, M. A., and ElMougy, S. A. (2002). Effect of freeze
dried extract of Olea europaea on the pituitary–thyroid axis in rats.
Phytotherapy Research, 16(3), 286-287.
Al-Rimawi, F., Odeh, I., Bisher, A., Abbadi, J., and Qabbajeh, M. (2014). Effec of
Geographical Region and Harvesting Date on Antioxidant Activity,
Phenolic and Flavonoid Content of Olive Leaves. Journal of Food and
Nutrition Research, 2(12), 925-930.
Alagna, F., Geu-Flores, F., Kries, H., Panara, F., Baldoni, L., O'Connor, S. E., &
Osbourn, A. (2016). Identification and characterization of the iridoid
synthase involved in oleuropein biosynthesis in olive (Olea europaea) fruits.
Journal of Biological Chemistry, 291(11), 5542-5554.
Alarcon-Aguilara, F. J., Roman-Ramos, R., Perez-Gutierrez, S., Aguilar-Contreras,
A., Contreras-Weber, C. C., and Flores-Saenz, J. L. (1998). Study of the
anti-hyperglycemic effect of plants used as antidiabetics. Journal of
Ethnopharmacology, 61(2), 101-110.
Altıok, E., Bayçın, D., Bayraktar, O., and Ülkü, S. (2008). Isolation of polyphenols
from the extracts of olive leaves (Olea europaea L.) by adsorption on silk
fibroin. Separation and Purification Technology, 62(2), 342-348.
Alzheimer's-Association. (2013). Alzheimer's disease facts and figures. Alzheimer's
& dementia: the journal of the Alzheimer's Association, 9(2), 208.
Andrews, R. C., Cooper, A. R., Montgomery, A. A., Norcross, A. J., Peters, T. J.,
Sharp, D. J., . . . Dayan, C. M. (2011). Diet or diet plus physical activity
versus usual care in patients with newly diagnosed type 2 diabetes: the Early
ACTID randomised controlled trial. The Lancet, 378(9786), 129-139.
Andrikopoulos, N. K., Kaliora, A. C., Assimopoulou, A. N., and Papageorgiou, V.
P. (2002). Inhibitory activity of minor polyphenolic and nonpolyphenolic

214
constituents of olive oil against in vitro low-density lipoprotein oxidation.
Journal of Medicinal Food, 5(1), 1-7.
Ansari, M., Kazemipour, M., and Fathi, S. (2011). Development of a simple green
extraction procedure and HPLC method for determination of oleuropein in
olive leaf extract applied to a multi-source comparative study. Journal of
The Iranian Chemical Society, 8(1), 38-47.
Antonone, R., Simone, F. D., Morrica, P., and Ramundo, E. (1988). Traditional
phytotherapy in the Roccamonfina volcanic group, Campania, Southern
Italy. Journal of Ethnopharmacology, 22(3), 295-306.
Ashok Kumar, B. S., Lakshman, K., Nandeesh, R., Arun Kumar, P. A., Manoj, B.,
Kumar, V., and Sheshadri Shekar, D. (2011). In vitro alpha-amylase
inhibition and in vivo antioxidant potential of Amaranthus spinosus in
alloxan-induced oxidative stress in diabetic rats. Saudi Journal of Biological
Sciences, 18(1), 1-5.
Australian Bureau of Meterology. (2016). Climate Data Online. Retrieved 17
March 2016, from http://www.bom.gov.au/climate/data/
Babich, H., and Visioli, F. (2003). In vitro cytotoxicity to human cells in culture of
some phenolics from olive oil. Il Farmaco, 58(5), 403-407.
Balch, P. A. (2002). Prescription for Herbal Healing: An Easy-To-Use AZ
Reference to Hundreds of Common Disorders and Their Herbal Remedies:
Avery Publishing Group.
Baldi, A., Romani, A., Tatti, S., Mulinacci, N., and Vincieri, F. (1995). HPLC
analysis of polyphenolic compounds present in Olea europaea L. (cv.
Leccino). Paper presented at the Colloq. Inst. Natl. Rech. Agronomy.
Bao, J., Zhang, D. W., Zhang, J. Z. H., Huang, P. L., Huang, P. L., and Lee-Huang,
S. (2007). Computational study of bindings of olive leaf extract (OLE) to
HIV-1 fusion protein gp41. FEBS Letters, 581(14), 2737-2742.
Baynes, J. W., and Thorpe, S. R. (1999). Role of oxidative stress in diabetic
complications: a new perspective on an old paradigm. Diabetes, 48(1), 1-9.

215
Bazoti, F. N., Bergquist, J., Markides, K. E., and Tsarbopoulos, A. (2006).
Noncovalent interaction between amyloid-β-peptide (1-40) and oleuropein
studied by electrospray ionization mass spectrometry. Journal of the
American Society for Mass Spectrometry, 17(4), 568-575.
Bechiri, A., Chekroun, E., Rachid, A., and Djaziri, R. (2015). In vitro evaluation
of α-amylase inhibitory activity of some medicinal plants used in treatment
of diabetes mellitus in Algeria and their effect on postprandial
hyperglycemia in normal rats. International Journal of Phytomedicine, 7(2),
171-175.
Bellakhdar, J., Claisse, R., Fleurentin, J., and Younos, C. (1991). Repertory of
standard herbal drugs in the Moroccan pharmacopoea. Journal of
Ethnopharmacology, 35(2), 123-143.
Benavente-Garcia, O., Castillo, J., Lorente, J., and Alcaraz, M. (2002).
Radioprotective effects in vivo of phenolics extracted from Olea europaea
L. leaves against X-ray-induced chromosomal damage: comparative study
versus several flavonoids and sulfur-containing compounds. Journal of
Medicinal Food, 5(3), 125-135.
Benavente-Garcıa, O., Castillo, J., Lorente, J., Ortuño, A., and Del Rio, J. A.
(2000). Antioxidant activity of phenolics extracted from Olea europaea L.
leaves. Food Chemistry, 68(4), 457-462.
Benzie, I. F. F., and Strain, J. (1996). The ferric reducing ability of plasma (FRAP)
as a measure of “antioxidant power”: the FRAP assay. Analytical
Biochemistry, 239(1), 70-76.
Bianco, A., Coccioli, F., Guiso, M., and Marra, C. (2002). The occurrence in olive
oil of a new class of phenolic compounds: hydroxy-isochromans. Food
Chemistry, 77(4), 405-411.
Bianco, A., and Uccella, N. (2000). Biophenolic components of olives. Food
Research International, 33(6), 475-485.
Boaz, M., Leibovitz, E., Dayan, Y. B., and Wainstein, J. (2011). Functional foods
in the treatment of type 2 diabetes: olive leaf extract, turmeric and

216
fenugreek, a qualitative review. Functional Foods in Health and Disease,
11, 472-481.
Bouaziz, M., Fki, I., Jemai, H., Ayadi, M., and Sayadi, S. (2008). Effect of storage
on refined and husk olive oils composition: Stabilization by addition of
natural antioxidants from Chemlali olive leaves. Food Chemistry, 108(1),
253-262.
Bouaziz, M., and Sayadi, S. (2005). Isolation and evaluation of antioxidants from
leaves of a Tunisian cultivar olive tree. European Journal of Lipid Science
and Technology, 107(7-8), 497-504.
Boudhrioua, N., Bahloul, N., Ben Slimen, I., and Kechaou, N. (2009). Comparison
on the total phenol contents and the color of fresh and infrared dried olive
leaves. Industrial Crops and Products, 29(2–3), 412-419.
Boukef, K., Souissi, H., and Balansard, G. (1982). Contribution to the study on
plants used in traditional medicine in Tunisia. Plant Med Phytotherapy,
16(4), 260-279.
Bowden, J. (2009). Unleash the amazingly potent anti-aging, antioxidant, pro-
immune system health benefits of the olive leaf. Topanga, CA 90290 USA:
Freedom Press.
Brahmi, F., Flamini, G., Issaoui, M., Dhibi, M., Dabbou, S., Mastouri, M., and
Hammami, M. (2012a). Chemical composition and biological activities of
volatile fractions from three Tunisian cultivars of olive leaves. Medicinal
Chemistry Research, 21(10), 2863-2872.
Brahmi, F., Mechri, B., Dabbou, S., Dhibi, M., and Hammami, M. (2012b). The
efficacy of phenolics compounds with different polarities as antioxidants
from olive leaves depending on seasonal variations. Industrial Crops and
Products, 38(0), 146-152.
Brahmi, F., Mechri, B., Dhibi, M., and Hammami, M. (2013). Variations in
phenolic compounds and antiradical scavenging activity of Olea europaea
leaves and fruits extracts collected in two different seasons. Industrial Crops
and Products, 49(0), 256-264.
217
Braun, L. (2005). Olive-leaf Extract Olea europaea. Journal of Complementary
Medicine: CM, 4(3), 69.
Briante, R., Patumi, M., Terenziani, S., Bismuto, E., Febbraio, F., and Nucci, R.
(2002). Olea europaea L. Leaf Extract and Derivatives: Antioxidant
Properties. Journal of Agricultural and Food Chemistry, 50(17), 4934-
4940.
Bruneton, J. (1995). Pharmacognosy. Phytochemistry, Medicinal Plants, 2, 487-
489.
Butterfield, D. A. (2011). Oxidative stress in Alzheimer disease: synergy between
the Butterfield and Markesbery laboratories. Neuromolecular Medicine,
13(1), 19-22.
Cabrera-Gomez, A., Garrido, A., Guerrero, J. E., and Ortiz, V. (1992). Nutritive
value of the olive leaf: effects of cultivar, season of harvesting and system
of drying. The Journal of Agricultural Science, 119(02), 205-210.
Capretti, G., and Bonaconza, E. (1949). Effects of infusions or decoctions of olive
leaves (Olea europaea) on some physical constants of blood and
components of metabolism. Giorn. Clinical. Medicine, 30, 630-642.
Carrasco-Pancorbo, A., Cerretani, L., Bendini, A., Segura-Carretero, A., Del Carlo,
M., Gallina-Toschi, T., Lercker, G., Compagnone, D., and Fernandez-
Gutierrez, A. (2005). Evaluation of the antioxidant capacity of individual
phenolic compounds in virgin olive oil. Journal of Agricultural and Food
Chemistry, 53(23), 8918-8925.
Chan, E., Lim, Y., Wong, S., Lim, K., Tan, S., Lianto, F., and Yong, M. (2009).
Effects of different drying methods on the antioxidant properties of leaves
and tea of ginger species. Food Chemistry, 113(1), 166-172.
Chevallier, A. (1996). The encyclopedia of medicinal plants. London: Dorling
Kindersley 336p. ISBN, 751303143.
Chinou, I. (2012). European Medicines Agency, Assessment report on Olea
europaea L., folium (pp. 1-33). United Kingdom.
218
Cumaoğlu, A., Ari, N., Kartal, M., and Karasu, Ç. (2011). Polyphenolic extracts
from Olea europea L. protect against cytokine-induced β-cell damage
through maintenance of redox homeostasis. Rejuvenation Research, 14(3),
325-334.
Darias, V., Abdala, S., Martin, D., and Ramos, F. (1996). Hypoglycaemic plants
from the Canary Islands. Phytotherapy Research (United Kingdom).
Darias, V., Bravo, L., Barquin, E., Herrera, D. M., and Fraile, C. (1986).
Contribution to the ethnopharmacological study of the Canary Islands.
Journal of Ethnopharmacology, 15(2), 169-193.
de Bock, M., Derraik, J. G. B., Brennan, C. M., Biggs, J. B., Morgan, P. E.,
Hodgkinson, S. C., Hofman, P. L., and Cutfield, W. S. (2013). Olive (Olea
europaea L.) Leaf Polyphenols Improve Insulin Sensitivity in Middle-Aged
Overweight Men: A Randomized, Placebo-Controlled, Crossover Trial.
PLoS One, 8(3), e57622.
De Feo, V., and Senatore, F. (1993). Medicinal plants and phytotherapy in the
Amalfitan coast, Salerno province, Campania, Southern Italy. Journal of
Ethnopharmacology, 39(1), 39-51.
Dean, D., and Janićijević-Hudomal, C. (2007). Medicinal features of olive leaf
(Olea europaea L.). Praxis Medica, 35(1-2), 089-092.
DeFelice, S. (2002). FIM, Rationale and Proposed Guidelines for the Nutraceutical
Research & Education Act NREA, Foundation for Innovation in Medicine.
DeFronzo, R. A., and Abdul-Ghani, M. (2011). Type 2 diabetes can be prevented
with early pharmacological intervention. Diabetes Care, 34(Supplement 2),
S202-S209.
Dekanski, D., Janićijević-Hudomal, S., Tadić, V., Marković, G., Arsić, I., and
Mitrović, D. M. (2009). Phytochemical analysis and gastroprotective
activity of an olive leaf extract. Journal of the Serbian Chemical Society,
74(4), 367-377.

219
Del Boccio, P., Di Deo, A., De Curtis, A., Celli, N., Iacoviello, L., and Rotilio, D.
(2003). Liquid chromatography–tandem mass spectrometry analysis of
oleuropein and its metabolite hydroxytyrosol in rat plasma and urine after
oral administration. Journal of Chromatography B, 785(1), 47-56.
Delgado-Pertíñez, M., Chesson, A., Provan, G. J., Garrido, A., and Gómez-
Cabrera, A. (1998). Effect of different drying systems for the conservation
of olive leaves on their nutritive value for ruminants. Annales De
Zootechnie, 47(2), 141-150.
Delgado-Pertıñez, M., Gomez-Cabrera, A., and Garrido, A. (2000). Predicting the
nutritive value of the olive leaf (Olea europaea): digestibility and chemical
composition and in vitro studies. Animal Feed Science and Technology,
87(3-4), 187-201.
DerMarderosian, A., and Beutler, J. A. (2005). The review of natural products: the
most complete source of natural product information (4 ed.). Saint Louis,
MO: Facts and Comparisons.
Dewanto, V., Wu, X., Adom, K. K., and Liu, R. H. (2002). Thermal processing
enhances the nutritional value of tomatoes by increasing total antioxidant
activity. Journal of Agricultural and Food Chemistry, 50(10), 3010-3014.
Diabetes Australia. (2015). Retrieved 17 February, 2015, from
https://www.diabetesaustralia.com.au/diabetesinaustralia.
Diaz, M. N., Frei, B., Vita, J. A., and Keaney, J. F. (1997). Antioxidants and
Atherosclerotic Heart Disease. New England Journal of Medicine, 337(6),
408-416.
Dimitrios, B. (2006). Sources of natural phenolic antioxidants. Trends in Food
Science & Technology, 17(9), 505-512.
Duke, J. A. (2010). Handbook of Medicinal Herbs: CRC press.
Durlu-Özkaya, F., and Özkaya, M. T. (2011). Oleuropein using as an additive for
feed and products used for humans. Journal of Food Processing and
Technology, 2(113), 2.
220
Eidi, A., Eidi, M., and Darzi, R. (2009). Antidiabetic effect of Olea europaea L. in
normal and diabetic rats. Phytotherapy Research, 23(3), 347-350.
El Amin, M., Virk, P., Elobeid, M. A. , Almarhoon, Z. M., Hassan, Z. K., Omer, S.
A., Merghani N. M., Daghestani, M. H., and Al-Olayan, E. M. (2013). Anti-
diabetic effect of Murray a koenigii (L) and Olea europaea (L) leaf extracts
on streptozotocin induced diabetic rats. Pakistan Journal of Pharmaceutical
Sciences, 26(2), 359-365.
El Babili, F., Babili, M. E., Souchard, J.-P., and Chatelain, C. (2013). Culinary
Decoctions: Spectrophotometric Determination of Various Polyphenols
Coupled with their Antioxidant Activities. 15-20.
El, S. N., and Karakaya, S. (2009). Olive tree (Olea europaea) leaves: potential
beneficial effects on human health. Nutrition Reviews, 67(11), 632-638.
Erbay, Z., and Icier, F. (2009). Optimization of hot air drying of olive leaves using
response surface methodology. Journal of Food Engineering, 91(4), 533-
541.
Erdohan, Z., and Turhan, K. (2011). Olive leaf extract and usage for development
of antimicrobial food packaging. Science Against Microbial Pathogens:
Communicating Current Research and Technological Advances, 1094-
1101.
Eriksson, J. W. (2007). Metabolic stress in insulin’s target cells leads to ROS
accumulation – A hypothetical common pathway causing insulin resistance.
FEBS Letters, 581(19), 3734-3742.
Esposito, K., Marfella, R., Ciotola, M., and et al. (2004). Effect of a mediterranean-
style diet on endothelial dysfunction and markers of vascular inflammation
in the metabolic syndrome: A randomized trial. Journal of American
Medical Association, 292(12), 1440-1446.
Evans, W. C. (2009). Trease and Evans' pharmacognosy: Elsevier Health Sciences.

221
Favier, A. (2003). The oxidative stress: concept and experimental interest to
understand diseases mechanisms and therapeutic approaches. Actualite
Chimique(11-12), 108-115.
Federico, A., Morgillo, F., Tuccillo, C., Ciardiello, F., and Loguercio, C. (2007).
Chronic inflammation and oxidative stress in human carcinogenesis.
International Journal of Cancer, 121(11), 2381-2386.
Fehri, B., Aiache, J.-M., Mrad, S., Korbi, S., and Lamaison, J.-L. (1996). Olea
europaea L.: stimulant, anti-ulcer and anti-inflammatory effects. Bollettino
Chimico-Farmaceutico, 135(1), 42-49.
Fehri, B., Mrad, S., Aiache, J.-M., and Lamaison, J.-L. (1995). Effects of Olea
europaea L. extract on the rat isolated ileum and trachea. Phytotherapy
Research, 9(6), 435-439.
Fernández-Escobar, R., Moreno, R., and Garcıa-Creus, M. (1999). Seasonal
changes of mineral nutrients in olive leaves during the alternate-bearing
cycle. Scientia Horticulturae, 82(1–2), 25-45.
Fki, I., Sahnoun, Z., and Sayadi, S. (2007). Hypocholesterolemic Effects of
Phenolic Extracts and Purified Hydroxytyrosol Recovered from Olive Mill
Wastewater in Rats Fed a Cholesterol-Rich Diet. Journal of Agricultural
and Food Chemistry, 55(3), 624-631.
Flemmig, J., Kuchta, K., Arnhold, J., and Rauwald, H. W. (2011). Olea europaea
leaf (Ph.Eur.) extract as well as several of its isolated phenolics inhibit the
gout-related enzyme xanthine oxidase. Phytomedicine, 18(7), 561-566.
Florido Lopez, J. F., Quiralte Enriquez, J., Arias de Saavedra Alías, J. M., Saenz de
San Pedro, B., and Martin Casañez, E. (2002). An allergen from Olea
europaea pollen (Ole e 7) is associated with plant-derived food anaphylaxis.
Allergy, 57, 53-59.
Franco, M. N., Galeano-Díaz, T., López, Ó., Fernández-Bolaños, J. G., Sánchez, J.,
De Miguel, C., Gil M. V., and Martín-Vertedor, D. (2014). Phenolic
compounds and antioxidant capacity of virgin olive oil. Food Chemistry,
163, 289-298.

222
Fredrickson, W. R. (2000). Method and composition for antiviral therapy: Google
Patents.
Furukawa, S., Fujita, T., Shimabukuro, M., Iwaki, M., Yamada, Y., Nakajima, Y.,
Nakayama, O., Makishima, M., Matsuda, M., and Shimomura, I. (2004).
Increased oxidative stress in obesity and its impact on metabolic syndrome.
Journal of Clinical Investigation, 114(12), 1752-1761.
Gariboldi, P., Jommi, G., and Verotta, L. (1986). Secoiridoids from Olea europaea.
Phytochemistry, 25(4), 865-869.
Generalić Mekinić, I., Gotovac, M., Skroza, D., Ljubenkov, I., Burčul, F., and
Katalinić, V. (2014). Effect of the extraction solvent on the oleuropein
content and antioxidant properties of olive leaf (cv. Oblica, Lastovka and
Levantinka) extracts. Croatian Journal of Food Science and Technology,
6(1), 7-14.
Gentile, L., and Uccella, N. A. (2014). Selected bioactives from callus cultures of
olives (Olea europaea L. Var. Coratina) by LC-MS. Food Research
International, 55, 128-136.
Ghanbari, R., Anwar, F., Alkharfy, K. M., Gilani, A.-H., and Saari, N. (2012).
Valuable Nutrients and Functional Bioactives in Different Parts of Olive
(Olea europaea L.)—A Review. International Journal of Molecular
Sciences, 13(3), 3291-3340.
Ghazanfar, S., and Al-Al-Sabahi, A. (1993). Medicinal plants of Northern and
Central Oman (Arabia). Economic Botany, 47(1), 89-98.
Goldsmith, C. D., Vuong, Q. V., Sadeqzadeh, E., Stathopoulos, C. E., Roach, P. D.,
and Scarlett, C. J. (2015). Phytochemical Properties and Anti-Proliferative
Activity of Olea europaea L. Leaf Extracts against Pancreatic Cancer Cells.
Molecules, 20(7), 12992-13004.
Gómez-Cabrera, A., Garrido, A., Guerrero, J., and Ortiz, V. (1992). Nutritive value
of the olive leaf: effects of cultivar, season of harvesting and system of
drying. Journal. Agricultural. Science, 119, 205-210.

223
Gomez-Caravaca, A. M., Cerretani, L., Bendini, A., Segura-Carretero, A.,
Fernández-Gutiérrez, A., Del Carlo, M., . . . Cichelli, A. (2008). Effects of
fly attack (Bactrocera oleae) on the phenolic profile and selected chemical
parameters of olive oil. Journal of Agricultural and Food Chemistry,
56(12), 4577-4583.
Gonzalez, M., Zarzuelo, A., Gamez, M. J., Utrilla, M. P., Jimenez, J., and Osuna,
I. (1992). Hypoglycemic activity of olive leaf. Planta Medica, 58(6), 513-
515.
Goulas, V., Charisiadis, P., P Gerothanassis, I., and A Manganaris, G. (2012).
Classification, biotransformation and antioxidant activity of olive fruit
biophenols: a review. Current Bioactive Compounds, 8(3), 232-239.
Hamdi, H. K., and Castellon, R. (2005). Oleuropein, a non-toxic olive iridoid, is
an anti-tumor agent and cytoskeleton disruptor. Biochemical and
Biophysical Research Communications, 334(3), 769-778.
Han, Y., Nishibe, S., Kamazawa, Y., Ueda, N., and Wada, K. (2001). Inductive
Effects of Olive Leaf and Its Component Oleuropein on the Mouse Liver
Glutathione S-Transferases. Natural Medicines, 55(2), 83-86.
Hansen, B. C. (1999). The Metabolic Syndrome X. Annals of the New York
Academy of Sciences, 892(1), 1-24.
Hansen, M., and Verity, A. (2002). Olive Leaf Extract. Alderley, Queensland.
Australia: Goldgolf Pty. Ltd. .
Harborne, J. B. (1998). Phytochemical methods. A guide to modern techniques of
plant analysis. Science.
Hashemi, P., Delfan, B., Ghiasvand, A., Alborzi, M., and Raeisi, F. (2010). A study
of the effects of cultivation variety, collection time, and climate on the
amount of oleuropein in olive leaves. Acta Chromatographica, 22(1), 133-
140.
Haveles, E. B. (2014). Applied pharmacology for the dental hygienist (6th ed.):
Elsevier Health Sciences.

224
Hayes, J. E., Allen, P., Brunton, N., O’Grady, M. N., and Kerry, J. P. (2011).
Phenolic composition and in vitro antioxidant capacity of four commercial
phytochemical products: Olive leaf extract (Olea europaea L.), lutein,
sesamol and ellagic acid. Food Chemistry, 126(3), 948-955.
Hedgcock, T. (2016). Olive leaf extract. Retrieved 16 March, 2016, from
http://www.about-olive-leaf-extract.com/olive-leaf-extract-dosage.html
Heimler, D., Cimato, A., Alessandri, S., Sani, G., and Pieroni, A. (1996). Seasonal
trend of flavonoids in olive (Olea europaea L.) leaves. Agricoltura
Mediterranea, 126, 205-209.
Heimler, D., Pieroni, A., Tattini, M., and Cimato, A. (1992). Determination of
flavonoids, flavonoid glycosides and biflavonoids in Olea europaea L.
Leaves. Chromatographia, 33(7-8), 369-373.
Hemingway, R. W., and Karchesy, J. J. (2012). Chemistry and significance of
condensed tannins: Springer Science & Business Media.
Huang, D., Ou, B., and Prior, R. L. (2005). The Chemistry behind Antioxidant
Capacity Assays. Journal of Agricultural and Food Chemistry, 53(6), 1841-
1856.
Hung, P., and Duy, T. (2012). Effects of drying methods on bioactive compounds
of vegetables and correlation between bioactive compounds and their
antioxidants. International Food Research Journal, 19(1), 327-332.
Ignat, I., Volf, I., and Popa, V. I. (2011). A critical review of methods for
characterisation of polyphenolic compounds in fruits and vegetables. Food
Chemistry, 126(4), 1821-1835.
International Diabetes Federation. (2015). IDF Diabetes Atlas Retrieved from
http://www.idf.org/sites/default/files/EN_6E_Atlas_Full_0.pdf
Janzen, D. (1978). Complications in interpreting the chemical defenses of trees
against tropical arboreal plant-eating vertebrates. The Ecology of Arboreal
Folivores, 73-84.
225
Japón-Luján, R., and Luque de Castro, M. D. (2006). Superheated liquid extraction
of oleuropein and related biophenols from olive leaves. Journal of
Chromatography A, 1136(2), 185-191.
Japón-Luján, R., and Luque de Castro, M. D. (2008). Liquid–Liquid Extraction for
the Enrichment of Edible Oils with Phenols from Olive Leaf Extracts.
Journal of Agricultural and Food Chemistry, 56(7), 2505-2511.
Jayalakshmi, C. P., and Sharma, J. D. (1986). Effect of butylated hydroxyanisole
(BHA) and butylated hydroxytoluene (BHT) on rat erythrocytes.
Environmental Research, 41(1), 235-238.
Jemai, H., Bouaziz, M., Fki, I., El Feki, A., and Sayadi, S. (2008). Hypolipidimic
and antioxidant activities of oleuropein and its hydrolysis derivative-rich
extracts from Chemlali olive leaves. Chemico-Biological Interactions,
176(2–3), 88-98.
Jemai, H., El Feki, A., and Sayadi, S. (2009). Antidiabetic and Antioxidant Effects
of Hydroxytyrosol and Oleuropein from Olive Leaves in Alloxan-Diabetic
Rats. Journal of Agricultural and Food Chemistry, 57(19), 8798-8804.
Johansen, J. S., Harris, A. K., Rychly, D. J., and Ergul, A. (2005). Oxidative stress
and the use of antioxidants in diabetes: linking basic science to clinical
practice. Cardiovascular Diabetology, 4(1), 5.
Jomova, K., and Valko, M. (2011). Advances in metal-induced oxidative stress and
human disease. Toxicology, 283(2), 65-87.
Jones, P. J. (2002). Clinical nutrition: 7. Functional foods—more than just nutrition.
Canadian Medical Association Journal, 166(12), 1555-1563.
Julkunen-Tiitto, R., and Sorsa, S. (2001). Testing the effects of drying methods on
willow flavonoids, tannins, and salicylates. Journal of Chemical Ecology,
27(4), 779-789.
Kaeidi, A., Esmaeili-Mahani, S., Sheibani, V., Abbasnejad, M., Rasoulian, B.,
Hajializadeh, Z., and Afrazi, S. (2011). Olive (Olea europaea L.) leaf
extract attenuates early diabetic neuropathic pain through prevention of high
226
glucose-induced apoptosis: In vitro and in vivo studies. Journal of
Ethnopharmacology, 136(1), 188-196.
Kamran, M., Hamlin, A. S., Scott, C. J., and Obied, H. K. (2015). Drying at high
temperature for a short time maximizes the recovery of olive leaf
biophenols. Industrial Crops and Products, 78, 29-38.
Katsiki, M., Chondrogianni, N., Chinou, I., Rivett, A. J., and Gonos, E. S. (2007).
The olive constituent oleuropein exhibits proteasome stimulatory properties
in vitro and confers life span extension of human embryonic fibroblasts.
Rejuvenation Research, 10(2), 157-172.
Keinänen, M., and Julkunen-Tiitto, R. (1996). Effect of sample preparation method
on birch (Betula pendula Roth) leaf phenolics. Journal of Agricultural and
Food Chemistry, 44(9), 2724-2727.
Kendall, M., Batterham, M., Obied, H. K., Prenzler, P. D., Ryan, D., and Robards,
K. (2009). Zero effect of multiple dosage of olive leaf supplements on
urinary biomarkers of oxidative stress in healthy humans. Nutrition, 25(3),
270-280.
Khansari, N., Shakiba, Y., and Mahmoudi, M. (2009). Chronic inflammation and
oxidative stress as a major cause of age-related diseases and cancer. Recent
Patents on Inflammation & Allergy Drug Discovery, 3(1), 73-80.
Khayyal, M., el-Ghazaly, M., Abdallah, D., Nassar, N., Okpanyi, S., and Kreuter,
M. (2002). Blood pressure lowering effect of an olive leaf extract (Olea
europaea) in L-NAME induced hypertension in rats. Arzneimittel-
Forschung, 52(11), 797.
Komaki, E., Yamaguchi, S., Maru, I., Kinoshita, M., Kakehi, K., Ohta, Y., and
Tsukada, Y. (2003). Identification of anti-α-amylase components from olive
leaf extracts. Food Science and Technology Research, 9(1), 35-39.
Konczak, I., Zabaras, D., Dunstan, M., and Aguas, P. (2010). Antioxidant capacity
and phenolic compounds in commercially grown native Australian herbs
and spices. Food Chemistry, 122(1), 260-266.

227
Korkina, L. (2007). Phenylpropanoids as naturally occurring antioxidants: from
plant defense to human health. Cellular and Molecular Biology, 53(1), 15-
25.
Kosaraju, S. L., D'Ath, L., and Lawrence, A. (2006). Preparation and
characterisation of chitosan microspheres for antioxidant delivery.
Carbohydrate Polymers, 64(2), 163-167.
Kuwajima, H., Uemura, T., Takaishi, K., Inoue, K., and Inouyet, H. (1988). A
secoiridoid glucoside from Olea europaea. Phytochemistry, 27(6), 1757-
1759.
Lafka, T.-I., Lazou, A. E., Sinanoglou, V. J., and Lazos, E. S. (2013). Phenolic
extracts from wild olive leaves and their potential as edible oils antioxidants.
Foods, 2(1), 18-31.
Lavee, S., Harshemesh, H., and Avidan, N. (1986). Phenolic acids-possible
involvement in regulating growth and alternate fruiting in olive trees. Acta
Horticulturae (Netherlands). no. 179.
Le Tutour, B., and Guedon, D. (1992). Antioxidative activities of Olea europaea
leaves and related phenolic compounds. Phytochemistry, 31(4), 1173-1178.
Lee-Huang, S., Huang, P. L., Zhang, D., Lee, J. W., Bao, J., Sun, Y., . . . Huang, P.
L. (2007). Discovery of small-molecule HIV-1 fusion and integrase
inhibitors oleuropein and hydroxytyrosol: Part I. Integrase inhibition.
Biochemical and Biophysical Research Communications, 354(4), 872-878.
Lee-Huang, S., Zhang, L., Lin Huang, P., Chang, Y.-T., and Huang, P. L. (2003).
Anti-HIV activity of olive leaf extract (OLE) and modulation of host cell
gene expression by HIV-1 infection and OLE treatment. Biochemical and
Biophysical Research Communications, 307(4), 1029-1037.
Lee, O.-H., and Lee, B.-Y. (2010). Antioxidant and antimicrobial activities of
individual and combined phenolics in Olea europaea leaf extract.
Bioresource Technology, 101(10), 3751-3754.
228
Lee, O.-H., Lee, B.-Y., Lee, J., Lee, H.-B., Son, J.-Y., Park, C.-S., . . . Kim, Y.-C.
(2009). Assessment of phenolics-enriched extract and fractions of olive
leaves and their antioxidant activities. Bioresource Technology, 100(23),
6107-6113.
Leopoldini, M., Russo, N., and Toscano, M. (2011). The molecular basis of
working mechanism of natural polyphenolic antioxidants. Food Chemistry,
125(2), 288-306.
Lewicki, P. P. (1998). Effect of pre‐drying treatment, drying and rehydration on
plant tissue properties: A review. International Journal of Food Properties,
1(1), 1-22.
Liang, N., and Kitts, D. D. (2014). Antioxidant property of coffee Components:
Assessment of methods that define mechanisms of action. Molecules,
19(11), 19180-19208.
Lim, Y., and Murtijaya, J. (2007). Antioxidant properties of Phyllanthus amarus
extracts as affected by different drying methods. LWT-Food Science and
Technology, 40(9), 1664-1669.
Limiroli, R., Consonni, R., Ranalli, A., Bianchi, G., and Zetta, L. (1996). 1H NMR
study of phenolics in the vegetation water of three cultivars of Olea
europaea: similarities and differences. Journal of Agricultural and Food
Chemistry, 44(8), 2040-2048.
Ma, S.C., He, Z. D., Deng, X. L., But, P. P., Ooi, V. E.., Xu, H. X., Lee, S. H., and
Lee, S. F. (2001). In Vitro Evaluation of Secoiridoid Glucosides from the
Fruits of Ligustrum lucidum as Antiviral Agents. Chemical &
Pharmaceutical Bulletin, 49(11), 1471-1473.
MacKellar, F. A., Kelly, R. C., Van Tamelen, E. E., and Dorschel, C. (1973).
Structure and stereochemistry of elenolic acid. Journal of the American
Chemical Society, 95(21), 7155-7156.
Madeo, J., and Elsayad, C. (2013). The Role of Oxidative Stress in Alzheimer’s
Disease. J Alzheimers Dis Parkinsonism, 3(116).
229
Majors, R. E. (1999). An overview of sample preparation methods for solids. LC
GC: Magazine of Liquid and Gas Chromatography, 17(6S), S8-S13.
Malik, N. S. A., and Bradford, J. M. (2006). Changes in oleuropein levels during
differentiation and development of floral buds in ‘Arbequina’ olives.
Scientia Horticulturae, 110(3), 274-278.
Malik, N. S. A., and Bradford, J. M. (2008). Recovery and stability of oleuropein
and other phenolic compounds during extraction and processing of olive
(Olea europaea L.) leaves. Journal of Food, Agriculture & Environment,
6(2), 8-13.
Manna, C., Migliardi, V., Golino, P., Scognamiglio, A., Galletti, P., Chiariello, M.,
and Zappia, V. (2004). Oleuropein prevents oxidative myocardial injury
induced by ischemia and reperfusion. The Journal of Nutritional
Biochemistry, 15(8), 461-466.
Martín-García, A. I., and Molina-Alcaide, E. (2008). Effect of different drying
procedures on the nutritive value of olive (Olea europaea var. europaea)
leaves for ruminants. Animal Feed Science and Technology, 142(3–4), 317-
329.
Martın-Garcıa, A. I., Moumen, A., Yáñez-Ruiz, D. R., and Molina-Alcaide, E.
(2003). Chemical composition and nutrients availability for goats and sheep
of two-stage olive cake and olive leaves. Animal Feed Science and
Technology, 107(1–4), 61-74.
Martindale, W. (1996). The Extra Pharmacopoeia (31st ed.): Royal Pharmaceutical
Society London.
Martinez-Lirola, M., Gonzalez-Tejero, M., and Molero-Mesa, J. (1996).
Ethnobotanical resources in the province of Almería, Spain: Campos de
Níjar. Economic Botany, 50(1), 40-56.
Megías, C., Pastor-Cavada, E., Torres-Fuentes, C., Girón-Calle, J., Alaiz, M., Juan,
R., . . . Vioque, J. (2009). Chelating, antioxidant and antiproliferative
activity of Vicia sativa polyphenol extracts. European Food Research and
Technology, 230(2), 353-359.

230
Meirinhos, J., Silva, B. M., Valentão, P., Seabra, R. M., Pereira, J. A., Dias, A., . .
. Ferreres, F. (2005). Analysis and quantification of flavonoidic compounds
from Portuguese olive (Olea Europaea L.) leaf cultivars. Natural Product
Research, 19(2), 189-195.
Mert, C., Barut, E., and İpek, A. (2013). Quantitative Seasonal Changes in the Leaf
Phenolic Content Related to the Alternate-Bearing Patterns of Olive (Olea
europaea L. cv. Gemlik). Journal of Agricultural Science and Technology,
15(5), 995-1006.
Micol, V., Caturla, N., Pérez-Fons, L., Más, V., Pérez, L., and Estepa, A. (2005).
The olive leaf extract exhibits antiviral activity against viral haemorrhagic
septicaemia rhabdovirus (VHSV). Antiviral Research, 66(2), 129-136.
Mizobutsi, G. P., Finger, F. L., Ribeiro, R. A., Puschmann, R., Neves, L. L. d. M.,
and Mota, W. F. d. (2010). Effect of pH and temperature on peroxidase and
polyphenoloxidase activities of litchi pericarp. Scientia Agricola, 67(2),
213-217.
Mohagheghi, F., Bigdeli, M. R., Rasoulian, B., Hashemi, P., and Pour, M. R.
(2011). The neuroprotective effect of olive leaf extract is related to
improved blood–brain barrier permeability and brain edema in rat with
experimental focal cerebral ischemia. Phytomedicine, 18(2–3), 170-175.
Molina-Alcaide, E., and Nefzaoui, A. (1996). Recycling of olive oil by-products:
Possibilities of utilization in animal nutrition. International
Biodeterioration & Biodegradation, 38(3-4), 227-235.
Molina-Alcaide, E., and Yáñez-Ruiz, D. R. (2008). Potential use of olive by-
products in ruminant feeding: A review. Animal Feed Science and
Technology, 147(1-3), 247-264.
Molina-Alcaide, E., Yáñez-Ruiz, D. R., Moumen, A., and Martín-García, A. I.
(2003). Ruminal degradability and in vitro intestinal digestibility of
sunflower meal and in vitro digestibility of olive by-products supplemented
with urea or sunflower meal: Comparison between goats and sheep. Animal
Feed Science and Technology, 110(1-4), 3-15.
231
Motamedifar, M., Nekoueian, A. A., and Moatari, A. (2007). The effect of
hydroalcoholic extract of olive leaves against herpes simplex virus type.
Iranian Journal of Medical Sciences, 32(4), 222-226..
Mourtzinos, I., Salta, F., Yannakopoulou, K., Chiou, A., and Karathanos, V. T.
(2007). Encapsulation of Olive Leaf Extract in β-Cyclodextrin. Journal of
Agricultural and Food Chemistry, 55(20), 8088-8094.
Naczk, M., and Shahidi, F. (2006). Phenolics in cereals, fruits and vegetables:
Occurrence, extraction and analysis. Journal of Pharmaceutical and
Biomedical Analysis, 41(5), 1523-1542.
Nishibe, S., Han, Y., Noguchi, Y., Ueda, H., Yamazaki, M., Mizutani, K., and
Kambara, T., and Kishida, N. (2001). The Inhibitory Effects of Compounds
from Olive Leaf on Tumor Necrosis Factor Production and on β-
Hexosaminidase Release. Natural Medicines, 55(4), 205-208.
Nourhène, B., Mohammed, K., and Nabil, K. (2008). Experimental and
mathematical investigations of convective solar drying of four varieties of
olive leaves. Food and Bioproducts Processing, 86(3), 176-184.
Nunomura, A., Castellani, R. J., Zhu, X., Moreira, P. I., Perry, G., and Smith, M.
A. (2006). Involvement of Oxidative Stress in Alzheimer Disease. Journal
of Neuropathology & Experimental Neurology, 65(7), 631-641.
Nwose, E. U., Jelinek, H. F., Richards, R. S., and Kerr, P. G. (2007). Erythrocyte
oxidative stress in clinical management of diabetes and its cardiovascular
complications. British Journal of Biomedical Science, 64(1), 35-43.
Nwose, E. U., Richards, R., Kerr, P., Tinley, R., and Jelinek, H. (2008). Oxidative
damage indices for the assessment of subclinical diabetic macrovascular
complications. British Journal of Biomedical Science, 65(3), 136-141.
Obied, H. K. (2013). Biography of biophenols: past, present and future. Functional
Foods in Health and Disease, 3, 230-241.
Obied, H. K., Allen, M. S., Bedgood, D. R., Prenzler, P. D., Robards, K., and
Stockmann, R. (2005a). Bioactivity and analysis of biophenols recovered

232
from olive mill waste. Journal of Agricultural and Food Chemistry, 53(4),
823-837.
Obied, H. K., Allen, M. S., Bedgood, D. R., Prenzler, P. D., and Robards, K.
(2005b). Investigation of Australian olive mill waste for recovery of
biophenols. Journal of Agricultural and Food Chemistry, 53(26), 9911-
9920.
Obied, H. K., Prenzler, P. D., and Robards, K. (2008a). Potent antioxidant
biophenols from olive mill waste. Food Chemistry, 111(1), 171-178.
Obied, H. K., Bedgood, D. R., Prenzler, P. D., and Robards, K. (2008b). Effect of
processing conditions, prestorage treatment, and storage conditions on the
phenol content and antioxidant activity of olive mill waste. Journal of
Agricultural and Food Chemistry, 56(11), 3925-3932.
Obied, H. K., Bedgood, D. R., Mailer, R., Prenzler, P. D., and Robards, K. (2008c).
Impact of cultivar, harvesting time, and seasonal variation on the content of
biophenols in olive mill waste. Journal of Agricultural and Food Chemistry,
56(19), 8851-8858.
Obied, H. K., Prenzler, P. D., Konczak, I., Rehman, A.-u., and Robards, K. (2009).
Chemistry and bioactivity of olive biophenols in some antioxidant and
antiproliferative in Vitro bioassays. Chemical Research in Toxicology,
22(1), 227-234.
Obied, H. K., Prenzler, P. D., Omar, S. H., Ismael, R., Servili, M., Esposto, S.,
Taticchi, A., Selvaggini, R., and Urbani, S. (2012). Pharmacology of olive
biophenols. Advances in Molecular Toxicology, 195.
Obied, H. K., Song, Y., Foley, S., Loughlin, M., Rehman, A.-ur., Mailer, R., Masud,
T., and Agboola, S. (2013). Biophenols and antioxidant properties of
Australian canola meal. Journal of Agricultural and Food Chemistry,
61(38), 9176-9184.
Olive Australia. (2014). About Olives. Retrieved May 23, 2014, from
http://www.oliveaustralia.com.au/About_Olive_Trees/about_olive_trees.ht
ml

233
Orak, H. H., Isbilir, S. S., and Yagar, H. (2012). Determination of antioxidant
properties of lyophilized olive leaf water extracts obtained from 21 different
cultivars. Food Science and Biotechnology, 21(4), 1065-1074.
Ou, B., Huang, D., Hampsch-Woodill, M., Flanagan, J. A., and Deemer, E. K.
(2002). Analysis of Antioxidant Activities of Common Vegetables
Employing Oxygen Radical Absorbance Capacity (ORAC) and Ferric
Reducing Antioxidant Power (FRAP) Assays: A Comparative Study.
Journal of Agricultural and Food Chemistry, 50(11), 3122-3128.
Paiva-Martins, F., Correia, R., Félix, S., Ferreira, P., and Gordon, M. H. (2007).
Effects of Enrichment of Refined Olive Oil with Phenolic Compounds from
Olive Leaves. Journal of Agricultural and Food Chemistry, 55(10), 4139-
4143.
Paiva-Martins, F., and Gordon, M. H. (2001). Isolation and Characterization of the
Antioxidant Component 3,4-Dihydroxyphenylethyl 4-formyl-3-
formylmethyl-4-hexenoate from Olive (Olea europaea) Leaves. Journal of
Agricultural and Food Chemistry, 49(9), 4214-4219.
Paiva-Martins, F., and Pinto, M. (2008). Isolation and Characterization of a New
Hydroxytyrosol Derivative from Olive (Olea europaea) Leaves. Journal of
Agricultural and Food Chemistry, 56(14), 5582-5588.
Panagiotakos, D. B., and Polychronopoulos, E. (2005). The role of Mediterranean
diet in the epidemiology of metabolic syndrome; converting epidemiology
to clinical practice. Lipids in Health and Disease, 4(1), 1.
Papoti, V. T., and Tsimidou, M. Z. (2009). Impact of sampling parameters on the
radical scavenging potential of olive (Olea europaea L.) leaves. Journal of
Agricultural and Food Chemistry, 57(9), 3470-3477.
Papoti, V. T., Xystouris, S., Papagianni, G., and Tsimidou, M. (2011). “Total
flavonoid” content assessment via aluminium [Al (III)] complexation
reactions. What we really measure? Italian Journal of Food Science, 23,
252-259.
234
PDR for Herbal Medicines. (2007). PDR for Herbal Medicines (4th ed., pp. 617-
619): Medical Economics Company, Inc. at Montvale.
Pereira, A., Ferreira, I., Marcelino, F., Valentão, P., Andrade, P., Seabra, R., . . .
Pereira, J. (2007). Phenolic Compounds and Antimicrobial Activity of Olive
(Olea europaea L. Cv. Cobrançosa) Leaves. Molecules, 12(5), 1153-1162.
Perez, C., and Anesini, C. (1994). Inhibition of Pseudomonas aeruginosa by
Argentinean medicinal plants. Fitoterapia, 65, 169-172.
Perrinjaquet-Moccetti, T., Busjahn, A., Schmidlin, C., Schmidt, A., Bradl, B., and
Aydogan, C. (2008). Food supplementation with an olive (Olea europaea
L.) leaf extract reduces blood pressure in borderline hypertensive
monozygotic twins. Phytotherapy Research, 22(9), 1239-1242.
Petkov, V. (1979). Plants with Hypotensive, Antiatheromatous and
Coronarodilatating Action. The American Journal of Chinese Medicine,
07(03), 197-236.
Petroni, A., Blasevich, M., Salami, M., Papini, N., Montedoro, G. F., and Galli, C.
(1995). Inhibition of platelet aggregation and eicosanoid production by
phenolic components of olive oil. Thrombosis Research, 78(2), 151-160.
Pieroni, A., Heimler, D., Pieters, L., Van Poel, B., and Vlietinck, A. J. (1996). In
vitro anti-complementary activity of flavonoids from olive (Olea europaea
L.) leaves. Die Pharmazie, 51(10), 765-768.
Pimentel, C., Batista-Nascimento, L., Rodrigues-Pousada, C., and Menezes, R. A.
(2012). Oxidative Stress in Alzheimer's and Parkinson's Diseases: Insights
from the Yeast Saccharomyces cerevisiae. Oxidative Medicine and Cellular
Longevity, 2012, 9.
Plazonić, A., Bucar, F., Maleš, Ž., Mornar, A., Nigović, B., and Kujundžić, N.
(2009). Identification and quantification of flavonoids and phenolic acids in
burr parsley (Caucalis platycarpos L.), using high-performance liquid
chromatography with diode array detection and electrospray ionization
mass spectrometry. Molecules, 14(7), 2466-2490.
235
Polzonetti, V., Egidi, D., Vita, A., Vincenzetti, S., and Natalini, P. (2004).
Involvement of oleuropein in (some) digestive metabolic pathways. Food
Chemistry, 88(1), 11-15.
Pometto, A., Shetty, K., Paliyath, G., and Levin, R. E. (2014). Food Biotechnology,
Second Edition: Taylor & Francis.
Poudyal, H., Campbell, F., and Brown, L. (2010). Olive Leaf Extract Attenuates
Cardiac, Hepatic, and Metabolic Changes in High Carbohydrate–, High
Fat–Fed Rats. The Journal of Nutrition, 140(5), 946-953.
Powers, S. K., and Jackson, M. J. (2008). Exercise-induced oxidative stress:
cellular mechanisms and impact on muscle force production. Physiological
Reviews, 88(4), 1243-1276.
Praticò, D., and Delanty, N. (2000). Oxidative injury in diseases of the central
nervous system: focus on alzheimer’s disease. The American Journal of
Medicine, 109(7), 577-585.
Prior, R. L., Wu, X., and Schaich, K. (2005). Standardized methods for the
determination of antioxidant capacity and phenolics in foods and dietary
supplements. Journal of Agricultural and Food Chemistry, 53(10), 4290-
4302.
Privitera, R., Firepower, O. L., and Privitera, J. R. (2009). Olive Leaf Extract A
New/Old Healing Bonanza for Mankind by James.
Puel, C., Quintin, A., Agalias, A., Mathey, J., Obled, C., Mazur, A., Davicco, M.
J., Lebecque, P., Skaltsounis, A. L., and Coxam, V. (2004). Olive oil and its
main phenolic micronutrient (oleuropein) prevent inflammation-induced
bone loss in the ovariectomised rat. British Journal of Nutrition, 92(01),
119-127.
Qawasmeh, A., Obied, H. K., Raman, A., and Wheatley, W. (2012). Influence of
Fungal Endophyte Infection on Phenolic Content and Antioxidant Activity
in Grasses: Interaction between Lolium perenne and Different Strains of
Neotyphodium lolii. Journal of Agricultural and Food Chemistry, 60(13),
3381-3388.
236
Queiroz, C., Mendes Lopes, M. L., Fialho, E., and Valente-Mesquita, V. L. (2008).
Polyphenol Oxidase: Characteristics and Mechanisms of Browning Control.
Food Reviews International, 24(4), 361-375.
Quina, F. H., Moreira Jr, P. F., Vautier-Giongo, C., Rettori, D., Rodrigues, R. F.,
Freitas, A. A., Silva, P. F., andMaçanita, A. L. (2009). Photochemistry of
anthocyanins and their biological role in plant tissues. Pure & Applied
Chemistry, 81(9).
Quiralte, J., Palacios, L., Rodríguez, R., Cárdaba, B., Arias de Saavedra, J. M,,
Villalba, M., Florido, J. F., and Lahoz, C. (2007). Modelling diseases: the
allergens of Olea europaea pollen. Journal of Investigational Allergology
and Clinical Immunology, 17(Suppl 1), 24-30.
Rahman, I., Biswas, S. K., and Kirkham, P. A. (2006). Regulation of inflammation
and redox signaling by dietary polyphenols. Biochemical Pharmacology,
72(11), 1439-1452.
Rahman, K. (2007). Studies on free radicals, antioxidants, and co-factors. Clinical
Interventions in Aging, 2(2), 219.
Ramassamy, C., Doggui, S., Arseneault, M., and Dao, L. (2010). Towards a
nutritional approach for the prevention of Alzheimer’s disease: Promise of
polyphenolic components. Recent Advances on Nutrition and the
Prevention of Alzheimer’s Disease, Ramassamy, C & Bastianetto, S (Ed),
1-18.
Ranalli, A., Contento, S., Lucera, L., Di Febo, M., Marchegiani, D., and Di Fonzo,
V. (2005). Factors affecting the contents of iridoid oleuropein in olive leaves
(Olea europaea L.). Journal of Agricultural and Food Chemistry, 54(2),
434-440.
Ranalli, A., Contento, S., Lucera, L., Di Febo, M., Marchegiani, D., and Di Fonzo,
V. (2006). Factors affecting the contents of iridoid oleuropein in olive leaves
(Olea europaea L.). Journal of Agricultural and Food Chemistry, 54(2),
434-440.

237
Ribeiro, D. A., De Melo, M. M. R., De Barros, F., Gomes, C., and Trolin, G.
(1986). Acute antihypertensive effect in conscious rats produced by some
medicinal plants used in the state of Sao Paulo. Journal of
Ethnopharmacology, 15(3), 261-269.
Rivera, D., and Obon, C. (1995). The ethnopharmacology of Madeira and Porto
Santo Islands, a review. Journal of Ethnopharmacology, 46(2), 73-93.
Roberts, C. K., and Sindhu, K. K. (2009). Oxidative stress and metabolic
syndrome. Life Sciences, 84(21–22), 705-712.
Rodríguez, R., Villalba, M., Monsalve, R. I., and Batanero, E. (2001). The
Spectrum of Olive Pollen Allergens. International Archives of Allergy and
Immunology, 125(3), 185-195.
Ross, I. A. (2005). Olea europaea Medicinal Plants of the World, Volume 3:
Chemical Constituents, Traditional and Modern Medicinal Uses (pp. 373-
400).
Rovellini, P., Azzolini, M., and Cortesi, N. (1997). Tocoferoli e tocotrienoli in oli
e grassi vegetali mediante HPLC. Rivista Italiana delle Sostanze Grasse,
74(1), 1-5.
Rovellini, P., Cortesi, N., and Fedeli, E. (1997). Analysis of flavonoids from Olea
europaea by HPLC-UV and HPLC-electrospray-MS. Rivista Italiana delle
Sostanze Grasse, 74(7), 273-279.
Ryan, D., Antolovich, M., Herlt, T., Prenzler, P. D., Lavee, S., and Robards, K.
(2002a). Identification of phenolic compounds in tissues of the novel olive
cultivar Hardy's Mammoth. Journal of Agricultural and Food Chemistry,
50(23), 6716-6724.
Ryan, D., Antolovich, M., Prenzler, P. D., Robards, K., and Lavee, S. (2002b).
Biotransformations of phenolic compounds in Olea europaea L. Scientia
Horticulturae, 92(2), 147-176.
Ryan, D., Prenzler, P. D., Lavee, S., Antolovich, M., and Robards, K. (2003).
Quantitative changes in phenolic content during physiological development

238
of the olive (Olea europaea) cultivar Hardy's Mammoth. Journal of
Agricultural and Food Chemistry, 51(9), 2532-2538.
Ryan, D., and Robards, K. (1998). Critical Review. Phenolic compounds in olives.
Analyst, 123(5), 31R-44R.
Rydén, L., Standl, E., Bartnik, M., Van den Berghe, G., Betteridge, J., de Boer, M.-
J., Cosentino, F., Jonsson, B., Laakso, M., Malmberg, K., Priori, S.,
Ostergren, J., Tuomilehto, J., Thrainsdottir, I., Vanhorebeek, I., Stramba-
Badiale, M., Lindgren, P., Qiao, Q., Priori, S. G., Blanc, J. J., Budaj,
A., Camm, J., Dean, V., Deckers, J., Dickstein, K., Lekakis, J., McGregor,
K., Metra, M., Morais, J., Osterspey, A., Tamargo, J., Zamorano, J.
L., Deckers, J. W., Bertrand, M., Charbonnel, B., Erdmann, E., Ferrannini,
E., Flyvbjerg, A., Gohlke, H., Juanatey, J. R., Graham, I., Monteiro, P.
F., Parhofer, K., Pyörälä, K., Raz, I., Schernthaner, G., Volpe, M.,
andWood, D. (2007). Guidelines on diabetes, pre-diabetes, and
cardiovascular diseases: executive summary: The Task Force on Diabetes
and Cardiovascular Diseases of the European Society of Cardiology (ESC)
and of the European Association for the Study of Diabetes (EASD).
European Heart Journal, 28(1), 88-136.
Şahin, S., Malik, N. S. A., Perez, J. L., and Brockington, J. E. (2012). Seasonal
Changes of Individual Phenolic Compounds in Leaves of Twenty Olive
Cultivars Grown in Texas. Journal of Agricultural Science and Technology,
242-247.
Saiga, A., Tanabe, S., and Nishimura, T. (2003). Antioxidant Activity of Peptides
Obtained from Porcine Myofibrillar Proteins by Protease Treatment.
Journal of Agricultural and Food Chemistry, 51(12), 3661-3667.
Saija, A., and Uccella, N. (2000). Olive biophenols: functional effects on human
wellbeing. Trends in Food Science & Technology, 11(9), 357-363.
Salah, M. B., Abdelmelek, H., and Abderraba, M. (2012). Study of phenolic
composition and biological activities assessment of olive leaves from
different varieties grown in Tunisia. Medicinal Chemistry, 2(5): 107-111.
239
Salta, F. N., Mylona, A., Chiou, A., Boskou, G., and Andrikopoulos, N. K. (2007).
Oxidative Stability of Edible Vegetable Oils Enriched in Polyphenols with
Olive Leaf Extract. Food Science and Technology International, 13(6), 413-
421.
Samet, I., Han, J., Jlaiel, L., Sayadi, S., and Isoda, H. (2014). Olive (Olea europaea)
Leaf Extract Induces Apoptosis and Monocyte/Macrophage Differentiation
in Human Chronic Myelogenous Leukemia K562 Cells: Insight into the
Underlying Mechanism. Oxidative Medicine and Cellular Longevity, 2014,
1-16.
Sánchez-Vioque, R., Polissiou, M., Astraka, K., Mozos-Pascual, M. d. l., Tarantilis,
P., Herraiz-Peñalver, D., and Santana-Méridas, O. (2013). Polyphenol
composition and antioxidant and metal chelating activities of the solid
residues from the essential oil industry. Industrial Crops and Products,
49(0), 150-159.
Santangelo, C., Varì, R., Scazzocchio, B., Di Benedetto, R., Filesi, C., and Masella,
R. (2007). Polyphenols, intracellular signalling and inflammation. Annali
Dell'Istituto Superiore Di Sanita, 43(4), 394-405.
Sato, H., Genet, C., Strehle, A., Thomas, C., Lobstein, A., Wagner, A., Mioskowski,
C., Auwerx, J., andSaladin, R. (2007). Anti-hyperglycemic activity of a
TGR5 agonist isolated from Olea europaea. Biochemical and Biophysical
Research Communications, 362(4), 793-798.
Savournin, C., Baghdikian, B., Elias, R., Dargouth-Kesraoui, F., Boukef, K., and
Balansard, G. (2001). Rapid high performance liquid chromatography
analysis for the quantitative determination of oleuropein in Olea europaea
leaves. Journal of Agricultural and Food Chemistry, 49(2), 618-621.
Schäfer, H., and Wink, M. (2009). Medicinally important secondary metabolites in
recombinant microorganisms or plants: Progress in alkaloid biosynthesis.
Biotechnology Journal, 4(12), 1684-1703.
Schaffer, S., Podstawa, M., Visioli, F., Bogani, P., Müller, W. E., and Eckert, G.
P. (2007). Hydroxytyrosol-Rich Olive Mill Wastewater Extract Protects

240
Brain Cells in Vitro and ex Vivo. Journal of Agricultural and Food
Chemistry, 55(13), 5043-5049.
Scheffler, A., Rauwald, H. W., Kampa, B., Mann, U., Mohr, F. W., and Dhein, S.
(2008). Olea europaea leaf extract exerts L-type Ca2+ channel antagonistic
effects. Journal of Ethnopharmacology, 120(2), 233-240.
Scott, L. J., and Spencer, C. M. (2000). Miglitol. Drugs, 59(3), 521-549.
Servili, M., Esposto, S., Fabiani, R., Urbani, S., Taticchi, A., Mariucci, F.,
Selvaggini, R., and Montedoro, G. F. (2009). Phenolic compounds in olive
oil: antioxidant, health and organoleptic activities according to their
chemical structure. Inflammopharmacology, 17(2), 76-84.
Shaw, J. E., Zimmet, P. Z., De Courten, M., Dowse, G. K., Chitson, P., Gareeboo,
H., Hemraj, F., Fareed, D., Tuomilehto, J., and Alberti, K. G. (1999).
Impaired fasting glucose or impaired glucose tolerance. What best predicts
future diabetes in Mauritius? Diabetes Care, 22(3), 399-402.
Simpson, G. E. (1962). Folk medicine in Trinidad Folk medicine in Trinidad (Vol.
75, pp. 326-340): Port-of-Spain General Hospital.
Singh, I., Mok, M., Christensen, A.-M., Turner, A. H., and Hawley, J. A. (2008).
The effects of polyphenols in olive leaves on platelet function. Nutrition,
Metabolism and Cardiovascular Diseases, 18(2), 127-132.
Soler-Rivas, C., Espín, J. C., and Wichers, H. J. (2000). Oleuropein and related
compounds. Journal of the Science of Food and Agriculture, 80(7), 1013-
1023.
Somova, L. I., Shode, F. O., and Mipando, M. (2004). Cardiotonic and
antidysrhythmic effects of oleanolic and ursolic acids, methyl maslinate and
uvaol. Phytomedicine, 11(2–3), 121-129.
Somova, L. I., Shode, F. O., Ramnanan, P., and Nadar, A. (2003).
Antihypertensive, antiatherosclerotic and antioxidant activity of
triterpenoids isolated from Olea europaea, subspecies africana leaves.
Journal of Ethnopharmacology, 84(2–3), 299-305.
241
Steele, M., Stuchbury, G., and Münch, G. (2007). The molecular basis of the
prevention of Alzheimer’s disease through healthy nutrition. Experimental
Gerontology, 42(1-2), 28-36.
Sudjana, A. N., D’Orazio, C., Ryan, V., Rasool, N., Ng, J., Islam, N., Riley T. V.,
and Hammer, K. A. (2009). Antimicrobial activity of commercial Olea
europaea (olive) leaf extract. International Journal of Antimicrobial
Agents, 33(5), 461-463.
Susalit, E., Agus, N., Effendi, I., Tjandrawinata, R. R., Nofiarny, D., Perrinjaquet-
Moccetti, T., and Verbruggen, M. (2011). Olive (Olea europaea) leaf
extract effective in patients with stage-1 hypertension: Comparison with
Captopril. Phytomedicine, 18(4), 251-258.
Taamalli, A., Arráez-Román, D., Barrajón-Catalán, E., Ruiz-Torres, V., Pérez-
Sánchez, A., Herrero, M., Ibañez, E., Micol, V., Zarrouk, M., Segura-
Carretero, A., and Fernández-Gutiérrez, A. (2012). Use of advanced
techniques for the extraction of phenolic compounds from Tunisian olive
leaves: Phenolic composition and cytotoxicity against human breast cancer
cells. Food and Chemical Toxicology, 50(6), 1817-1825.
Tabák, A. G., Herder, C., Rathmann, W., Brunner, E. J., and Kivimäki, M. (2012).
Prediabetes: a high-risk state for diabetes development. The Lancet,
379(9833), 2279-2290.
Talhaoui, N., Gomez-Caravaca, A. M., Roldán, C., Leon, L., De la Rosa, R. l.,
Fernández-Gutiérrez, A., and Segura-Carretero, A. (2015). Chemometric
analysis for the evaluation of phenolic patterns in olive leaves from six
cultivars at different growth stages. Journal of Agricultural and Food
Chemistry, 63(6), 1722-1729.
Tan, H.-W., Tuck, K. L., Stupans, I., and Hayball, P. J. (2003). Simultaneous
determination of oleuropein and hydroxytyrosol in rat plasma using liquid
chromatography with fluorescence detection. Journal of Chromatography
B, 785(1), 187-191.

242
Tasioula-Margari, M., and Okogeri, O. (2001). Isolation and Characterization of
Virgin Olive Oil Phenolic Compounds by HPLC/UV and GC‐MS. Journal
of Food Science, 66(4), 530-534.
Taylor, R., and Burt, J. (2007). Growing olives in Western Australia. Department
of Agriculture and Food, Westren Australia, Perth.
Tayoub, G., Sulaiman, H., Hassan, A. H., and Alorfi, M. (2012). Determination of
oleuropein in leaves and fruits of some Syrian olive varieties. International
Journal of Medicinal and Aromatic Plants, 2(3), 428-433.
Tominaga, M., Eguchi, H., Manaka, H., Igarashi, K., Kato, T., and Sekikawa, A.
(1999). Impaired glucose tolerance is a risk factor for cardiovascular
disease, but not impaired fasting glucose. The Funagata Diabetes Study.
Diabetes Care, 22(6), 920-924.
Transparency Market Research. (2015). Nutraceuticals Market - Global Industry
Analysis, Size, Share, Growth and Forecast 2015 - 2021.
Turktas, M., Inal, B., Okay, S., Erkilic, E. G., Dundar, E., Hernandez, P., Gabriel,
D., and Unver, T. (2013). Nutrition metabolism plays an Important role in
the alternate bearing of the olive tree (Olea europaea L.). PLoS ONE, 8(3),
e59876.
Twigg, S. M., Kamp, M. C., Davis, T. M., Neylon, E. K., and Flack, J. R. (2007).
Prediabetes: a position statement from the australian diabetes society and
australian diabetes educators association. Medical journal of Australia,
186(9), 461-465.
Uccella, N. (2000). Olive biophenols: novel ethnic and technological approach.
Trends in Food Science & Technology, 11(9–10), 328-339.
United States Pharmacopeia XXVI (USP 26), (2002). The National Formulary 21
(NF21); United States Pharmacopeia Convention: Rockville, MD.
Van Hellemont, J. (1986). Compendium de Phytotherapie, Association
Pharmaceutique. Bruxelles, Belge, 268-270.

243
Vardanian, S. (1978). Phytotherapy of bronchial asthma in medieval Armenian
medicine. Terapevticheskiĭ Arkhiv, 50(4), 133-136.
Vera, R., Smadja, J., and Conan, J. (1990). Preliminary assay of some plants with
alkaloids from Reunion Islands. Plant Med Phytotherapy, 24(1), 50-65.
Vinha, A. F., Ferreres, F., Silva, B. M., Valentao, P., Gonçalves, A., Pereira, J. A.,
Oliveira, M. B., Seabra, R. M., and Andrade, P. B. (2005). Phenolic profiles
of Portuguese olive fruits (Olea europaea L.): Influences of cultivar and
geographical origin. Food Chemistry, 89(4), 561-568.
Vinson, J. A., Zubik, L., Bose, P., Samman, N., and Proch, J. (2005). Dried fruits:
excellent in vitro and in vivo antioxidants. Journal of the American College
of Nutrition, 24(1), 44-50.
Visioli, F., and Galli, C. (2002). Biological Properties of Olive Oil Phytochemicals.
Critical Reviews in Food Science and Nutrition, 42(3), 209-221.
Visioli, F., Petroni, A., and Galli, C. (1994). Phenolic compounds extracted from
olive oil prevent oxidation of Low Density Lipoproteins, and inhibit platelet
function and platelet and leukocyte eicosanoid production in vitro.
Oxidative Processes and Antioxidants, 199-206.
Visioli, F., Poli, A., and Gall, C. (2002). Antioxidant and other biological activities
of phenols from olives and olive oil. Medicinal Research Reviews, 22(1),
65-75.
Vissers, M. N., Zock, P. L., and Katan, M. B. (2004). Bioavailability and
antioxidant effects of olive oil phenols in humans: a review. European
Journal of Clinical Nutrition, 58(6), 955-965.
Wainstein, J., Ganz, T., Boaz, M., Bar Dayan, Y., Dolev, E., Kerem, Z., and Madar,
Z. (2012). Olive leaf extract as a hypoglycemic agent in both human diabetic
subjects and in rats. Journal of Medicinal Food, 15(7), 605-610.
Walker, M. (1997). Olive leaf extract: Kensington Publishing Corp, London.

244
Waterman, E., and Lockwood, B. (2007). Active components and clinical
applications of olive oil. Alternative Medicine Review: a Journal of Clinical
Therapeutic, 12(4), 331.
Waterman, P. G., and Mole, S. (1994). Analysis of phenolic plant metabolites.
Oxford: Blackwell Scientific Publication.
Wink, M. (2003). Evolution of secondary metabolites from an ecological and
molecular phylogenetic perspective. Phytochemistry, 64(1), 3-19.
Wong, S. P., Leong, L. P., and William Koh, J. H. (2006). Antioxidant activities
of aqueous extracts of selected plants. Food Chemistry, 99(4), 775-783.
Wright Jr, E., Scism‐Bacon, J., and Glass, L. (2006). Oxidative stress in type 2
diabetes: the role of fasting and postprandial glycaemia. International
Journal of Clinical Practice, 60(3), 308-314.
Wu, L. L., Chiou, C.-C., Chang, P.-Y., and Wu, J. T. (2004). Urinary 8-OHdG: a
marker of oxidative stress to DNA and a risk factor for cancer,
atherosclerosis and diabetics. Clinica Chimica Acta, 339(1–2), 1-9.
Xynos, N., Papaefstathiou, G., Psychis, M., Argyropoulou, A., Aligiannis, N., and
Skaltsounis, A.-L. (2012). Development of a green extraction procedure
with super/subcritical fluids to produce extracts enriched in oleuropein from
olive leaves. The Journal of Supercritical Fluids, 67(0), 89-93.
Yamada, K., Tanaka, T., Han, D., Senzaki, K., Kameyama, T., and Nabeshima, T.
(1999). Protective effects of idebenone and α-tocopherol on β-amyloid-(1–
42)-induced learning and memory deficits in rats: implication of oxidative
stress in β-amyloid-induced neurotoxicity in vivo. European Journal of
Neuroscience, 11(1), 83-90.
Yanik, H., Turktas, M., Dundar, E., Hernandez, P., Dorado, G., and Unver, T.
(2013). Genome-wide identification of alternate bearing-associated
microRNAs (miRNAs) in olive (Olea europaea L.). BMC Plant Biology,
13(1), 10.
Youngken, H. W. (2012). A Text Book of Pharmacognosy: General Books.

245
Zarzuelo, A., Duarte, J., Jiménez, J., González, M., and Utrilla, M. P. (1991).
Vasodilator effect of olive leaf. Planta Medica, 57(5), 417-419.
Zaslaver, M., Offer, S., Kerem, Z., Stark, A. H., Weller, J. I., Eliraz, A., and Madar,
Z. (2005). Natural Compounds Derived from Foods Modulate Nitric Oxide
Production and Oxidative Status in Epithelial Lung Cells. Journal of
Agricultural and Food Chemistry, 53(26), 9934-9939.
Zhao, Y., and Zhao, B. (2013). Oxidative Stress and the Pathogenesis of
Alzheimer's Disease. Oxidative Medicine and Cellular Longevity, 1-10.
Zhou, S.-F., Xue, C. C., Yu, X.-Q., and Wang, G. (2007). Metabolic Activation of
Herbal and Dietary Constituents and Its Clinical and Toxicological
Implications: An Update. Current Drug Metabolism, 8(6), 526-553.
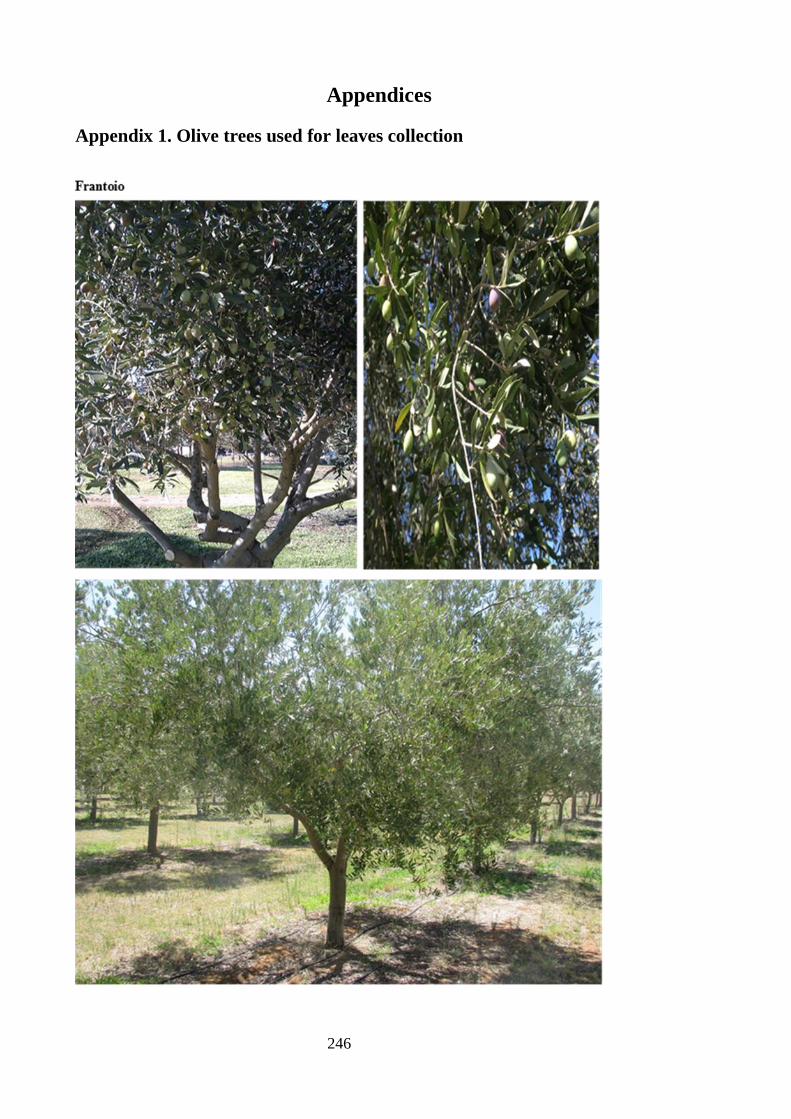
246
Appendices
Appendix 1. Olive trees used for leaves collection

247

248

249
Appendix 2. Leaflet information of commercial olive leaf extracts
Comvita olive leaf extract:
Each 500mL is equivalent to 500 grams of fresh olive (Olea europaea) leaf.
Ingredients: Olive leaf extract, glycerine (vegetable), no alcohol, no added sugar.
Main active component: Oleuropein standardised to 4.4mg/mL.
Extraction: Non alcoholic
Adult Dose: 5mL three times a day.
Minerals/Trace elements: No information provided.
Blackmores olive leaf extract:
Each 5mL is equivalent to 5 grams of fresh olive (Olea europaea) leaf.
Ingredients: Olive leaf extract, alcohol free, no added gluten, milk derivatives, salt,
artificial colours, flavours or sweeteners. Contains potassium sorbate.
Main active component: Oleuropein standardised to 4.4mg/mL.
Extraction: Non alcoholic
Adult Dose: 5mL two to three times a day.
Minerals/Trace elements: No information provided.
Swisse olive leaf extract:
Each 7.5mL is equivalent to 7.5 grams of dry olive (Olea europaea) leaf.
Ingredients: Olive leaf extract and, no added gluten, lactose, egg, yeast, salt, soy
preservatives, artificial colours and flavours.
Main active component: Oleuropein 7.5mg/mL.
Extraction: No information provided.
Adult Dose: 7.5mL diluted in water twice daily.
Minerals/Trace elements: No information provided.
Comvita olive leaf extract capsule:
Each capsule is equivalent to 2.4 grams of fresh olive (Olea europaea) leaf.
Ingredients: Concentrated pure olive leaf extract. Free of animal products, gluten
and not genetically modified.
Main active component: Oleuropein
Extraction: No information provided.
Adult Dose: Two to three capsules per day.
Minerals/Trace elements: No information provided.
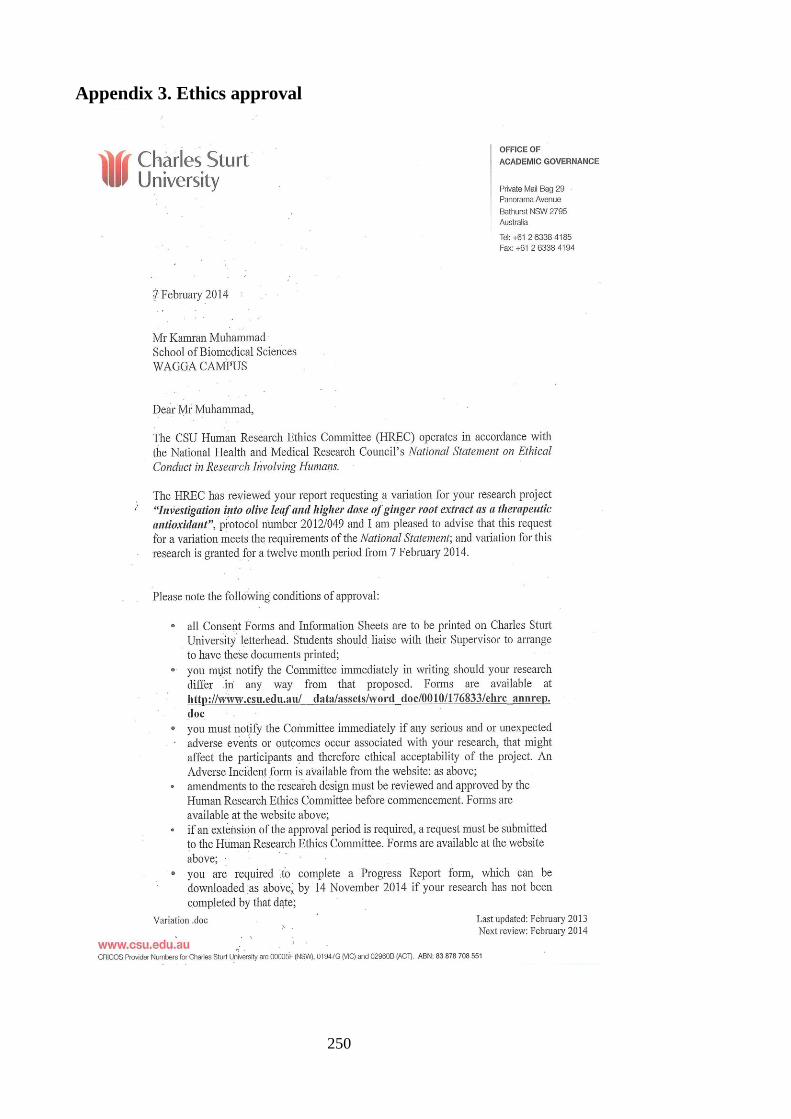
250
Appendix 3. Ethics approval

251

252
APPENDIX 4. Information statement for clinical trial participants

253

254

255
APPENDIX 5. Pre-study survey
Investigation into olive leaf extract as therapeutic
antioxidant
Study Protocol No. 2012/049
The Principal Investigator: Muhammad Kamran
School of Biomedical Sciences
PhD Student,
Charles Sturt University (02) 6933 4569
Co-Investigators:
Dr. Hassan Obied PhD (Charles Sturt University, 02 6933 2161)
Dr. Christopher Scott PhD (Charles Sturt University, 02 6933 4133)
Dr. Adam Hamlin PhD (Charles Sturt University, 02 6933 2339)
Pre survey for participants of clinical trial
Participant Name:..................................................
No:...........................................
Thank you very much for participating in the trial

256
Please circle the most appropriate option and write in the spaces
provided if needed. If you are not sure about any question please ask
the research team to explain, Thanks.
1. How old are you?
a. Under 35 years
b. 35 - 44 years
c. 45 - 54 years
d. 55 - 64 years
e. 65 years or over
2. Gender
a. Female
b. Male
3. Your height (cm)
4. Your weight (Kg)
Your waist measurement taken below the ribs (the correct place to measure your
waist is halfway between your lowest rib and the top of your hipbone, roughly in
line with your navel. Breathe out normally and measure directly against your skin
while standing.)
Less than 80 cm
80 - 90 cm
91 - 101 cm
102 - 110 cm
More than 110 cm
5. Are you of Aboriginal, Torres Strait Islander, Pacific Islander or Maori
descent?
a. No
b. Yes
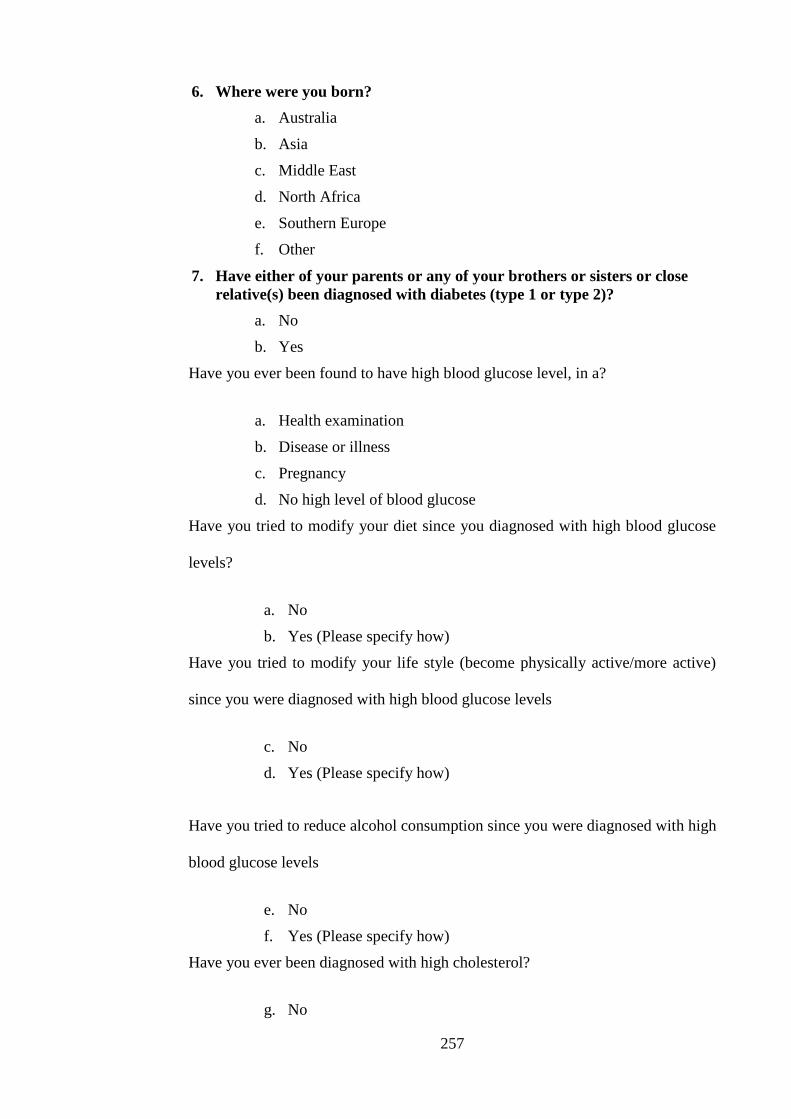
257
6. Where were you born?
a. Australia
b. Asia
c. Middle East
d. North Africa
e. Southern Europe
f. Other
7. Have either of your parents or any of your brothers or sisters or close
relative(s) been diagnosed with diabetes (type 1 or type 2)?
a. No
b. Yes
Have you ever been found to have high blood glucose level, in a?
a. Health examination
b. Disease or illness
c. Pregnancy
d. No high level of blood glucose
Have you tried to modify your diet since you diagnosed with high blood glucose
levels?
a. No
b. Yes (Please specify how)
Have you tried to modify your life style (become physically active/more active)
since you were diagnosed with high blood glucose levels
c. No
d. Yes (Please specify how)
Have you tried to reduce alcohol consumption since you were diagnosed with high
blood glucose levels
e. No
f. Yes (Please specify how)
Have you ever been diagnosed with high cholesterol?
g. No

258
h. Yes
Have you ever been diagnosed with high blood pressure?
a. No
b. Yes
Are you currently taking medication for high blood pressure?
a. No
b. Yes
Are you currently suffering from any heart disease including angina?
i. No
j. Yes
Are you currently suffering from any kidney/renal disease?
k. No
l. Yes
Do you smoke cigarettes or any other tobacco products on a daily basis?
a. No
b. Yes ( 5 or less per day)
c. Yes (more than 5 but less than 10 per day)
d. Yes (more than 10 but not more than 20 per day)
e. Yes ( more than 20 per day)
How often do you eat vegetables or fruit?
a. Every day
b. Thrice a week
c. Twice a week
d. Once a week
e. No
Are you currently taking any medication?
a. No
b. Yes ( please write name of medicine(s))
8. Are you currently taking any herbal supplement(s) for general
wellbeing?
259
a. No
b. Yes ( please write name(s))
9. Are you a regular drinker of tea, green tea, coffee or any herbal infusion?
a. No
b. Yes ( please write name of drink and number of cups/day)
10. Does your diet contain fats from animal sources like cheese, butter etc?
a. No
b. Yes (up to seven serves a week)
c. Yes (more than 7 but less than15 serves a week)
d. Yes (more than 15 but less than 21 serves a week )
e. Yes (more than 21 serves a week )
Comments:
Thanks for your cooperation in filling in the questionnaire
260
Appendix 6. Post-study survey
Investigation into olive leaf extract as therapeutic
antioxidant
Study Protocol No. 2012/049
The Principal Investigator: Muhammad Kamran
School of Biomedical Sciences
PhD Student, Charles Sturt University
Phone No. 02 6933 4569
Co-Investigators:
Dr. Hassan Obied PhD (Charles Sturt University, 02 6933 2161)
Dr. Christopher Scott PhD (Charles Sturt University, 02 6933 4133)
Dr. Adam Hamlin PhD (Charles Sturt University, 02 6933 2339)
End of study survey for participants of clinical trial
Participant Name:..................................................
No:...........................................
Thank you very much for participating in the trial
261
Please circle the most appropriate option and write in the spaces provided if needed.
If you are not sure about any question please ask the research team to explain, Thanks.
Your weight (Kg)
Your waist measurement taken below the ribs (the correct place to measure your
waist is halfway between your lowest rib and the top of your hipbone, roughly in line
with your navel. Breathe out normally and measure directly against your skin while
standing.)
Less than 80 cm
80 - 90 cm
91 - 101 cm
102 - 110 cm
More than 110 cm
Have you modified your diet during the course of the research trial?
No
Yes (Please specify how)
Have you modified your life style (became physically active/more active) during
the course of the research trial?
No
Yes (Please specify how)
Have you reduced alcohol consumption during the course of the research trial?
No
Yes (Please specify how)
During the course of the research trial how many times did you eat vegetables or
green salad?
I did not eat vegetables or green salad
1-3 times per week
4-6 times per week
1 time per day
2-3 times per day
Did you forget to take your capsule?
No
Yes ( occasionally)
Yes ( more than 5 per week)
Yes (more than 10 per week)
262
Yes (more than 60 per month)
Have you been well throughout this trial?
Yes
No ( please specify)
Have you found yourself under physical or mental stress during the course of the
research trial?
No
Yes
Have you taken any medication, vitamins supplement, traditional or herbal
medicine during the course of the research trial?
No
Yes ( please specify)
Did you feel discomfort with the herbal supplement given to you?
No
Yes ( please specify)
Did you feel any difference in general wellbeing during the research trial?
No
Yes (positive)
Yes (negative)
Comments:
Thanks for your cooperation in filling in the questionnaire
Copyright © 2022 FDOKUMEN