The Grand Bazaar in Istanbul: The ... - Iowa State University
Upload
khangminh22Category
view
1download
0
OFFICE OF AUDITOR OF STATESTATE OF IOWA
State Capitol Building
Des Moines, Iowa 50319-0006
Telephone (515) 281-5834 Facsimile (515) 281-6518
Rob Sand Auditor of State
NEWS RELEASE Contact: Marlys Gaston
FOR RELEASE March 10, 2020 515/281-5834
Auditor of State Rob Sand today released a report on the Iowa Public Employees’ Retirement
System (IPERS).
The report includes the audited Schedules of Employer Allocations and Collective Pension
Amounts Allocated by Employer required to comply with Governmental Accounting Standards
Board (GASB) Statement No. 68, Accounting and Financial Reporting for Pensions. The
Schedules present each IPERS participating employer’s contributions and proportionate share of
the net pension liability, pension expense, deferred outflows of resources and deferred inflows of
resources for the regular, sheriffs and deputies and protection occupation membership groups as
of and for the year ended June 30, 2019.
A copy of the report is available for review on the Auditor of State’s web site at
https://auditor.iowa.gov/reports/audit-reports/.
# # #

2060-5530-B001
IOWA PUBLIC EMPLOYEES’ RETIREMENT SYSTEM
INDEPENDENT AUDITOR’S REPORT SCHEDULES OF EMPLOYER ALLOCATIONS AND
COLLECTIVE PENSION AMOUNTS ALLOCATED BY EMPLOYER SCHEDULE OF FINDINGS
JUNE 30, 2019

2
Table of Contents
Page
Officials 3
Independent Auditor’s Report 4-5
Schedule Schedule of Employer Allocations and Collective Pension Amounts Allocated by Employer – Regular Membership Group 1 8-119 Schedule of Employer Allocations and Collective Pension Amounts Allocated by Employer – Sheriffs and Deputies Membership Group 2 122-127 Schedule of Employer Allocations and Collective Pension Amounts Allocated by Employer – Protection Occupation Membership Group 3 130-155
Notes to Schedules 157-173
Independent Auditor’s Report on Internal Control over Financial Reporting and on Compliance and Other Matters Based on an Audit Performed in Accordance with Government Auditing Standards 174-175
Schedule of Findings 176
Staff 177

3
Iowa Public Employees’ Retirement System
Officials
Term Name Title Expires
Investment Board
Voting Members:
Treasurer Michael Fitzgerald Chairperson Ex Officio Member Lisa Stange Vice Chairperson April 30, 2023 David Creighton Member April 30, 2021 Phyllis Peterson Member April 30, 2022 Marlene Sprouse Member April 30, 2023 Justin Kirchhoff Member April 30, 2025 Wayne Walter Member April 30, 2025
Nonvoting Members:
Representative Mary Ann Hanusa Member January 10, 2021 Representative Mary Mascher Member January 10, 2021 Senator Pam Jochum Member January 10, 2021 Senator Mark Lofgren Member January 10, 2021
IPERS
Donna M. Mueller Chief Executive Officer
Darla Iverson Chief Financial Officer

OFFICE OF AUDITOR OF STATESTATE OF IOWA
State Capitol Building
Des Moines, Iowa 50319-0006
Telephone (515) 281-5834 Facsimile (515) 281-6518
Rob Sand Auditor of State
4
Independent Auditor’s Report
To the Members of the Iowa Public Employees’ Retirement System Investment Board:
Report on the Schedules
We have audited the columns titled 2019 Actual Employer Contributions, Employer Allocation Percentage, the total for all entities of the columns titled Net Pension Liability or Net Pension Liability/(Asset), Total Deferred Outflows of Resources, Total Deferred Inflows of Resources and Total Proportionate Share of Allocable Plan Pension Expense (specified column totals) included in the accompanying Schedules of Employer Allocations and Collective Pension Amounts Allocated by Employer (Schedules) of the Iowa Public Employees’ Retirement System (IPERS) for the regular, sheriffs and deputies and protection occupation membership groups as of and for the year ended June 30, 2019, and the related Notes to Schedules.
Management’s Responsibility for the Schedules
Management is responsible for the preparation and fair presentation of these Schedules in accordance with U.S. generally accepted accounting principles. This includes the design, implementation and maintenance of internal control relevant to the preparation and fair presentation of Schedules that are free from material misstatement, whether due to fraud or error.
Auditor’s Responsibility
Our responsibility is to express an opinion on the columns titled 2019 Actual Employer Contributions, Employer Allocation Percentage and the totals for the specified columns identified in the first paragraph of this report included in the Schedules based on our audit. We conducted our audit in accordance with U.S. generally accepted auditing standards and the standards applicable to financial audits contained in Government Auditing Standards, issued by the Comptroller General of the United States. Those standards require that we plan and perform the audit to obtain reasonable assurance about whether the columns titled 2019 Actual Employer Contributions, Employer Allocation Percentage and the totals for the specified columns identified in the first paragraph of this report included in the Schedules are free from material misstatement.
An audit involves performing procedures to obtain audit evidence about the amounts and disclosures in the columns titled 2019 Actual Employer Contributions, Employer Allocation Percentage and the totals for the specified columns identified in the first paragraph of this report included in the Schedules. The procedures selected depend on the auditor’s judgment, including the assessment of the risks of material misstatement of the Schedules, whether due to fraud or error. In making those risk assessments, the auditor considers internal control relevant to IPERS’ preparation and fair presentation of the Schedules in order to design audit procedures that are appropriate in the circumstances, but not for the purpose of expressing an opinion on the effectiveness of IPERS’ internal control. Accordingly, we express no such opinion. An audit also includes evaluating the appropriateness of accounting policies used and the reasonableness of significant accounting estimates made by management, as well as evaluating the overall presentation of the Schedules.

5
We believe the audit evidence we have obtained is sufficient and appropriate to provide a basis for our audit opinion.
Opinion
In our opinion, the Schedules referred to above present fairly, in all material respects, the columns titled 2019 Actual Employer Contributions, Employer Allocation Percentage, the total for all entities of the columns titled Net Pension Liability or Net Pension Liability/(Asset), Total Deferred Outflows of Resources, Total Deferred Inflows of Resources and Total Proportionate Share of Allocable Plan Pension Expense for all IPERS participating entities for the regular, sheriffs and deputies and protection occupation membership groups as of and for the year ended June 30, 2019, in accordance with U.S. generally accepted accounting principles.
Other Matter
We have audited, in accordance with U.S. generally accepted auditing standards, the financial statements of IPERS as of and for the year ended June 30, 2019, and our report thereon, dated December 9, 2019, expressed an unmodified opinion on those financial statements.
Other Reporting Required by Government Auditing Standards
In accordance with Government Auditing Standards, we have also issued our report dated February 26, 2020 on our consideration of IPERS’ internal control over the preparation of these Schedules and on our tests of compliance with certain provisions of laws, regulations, contracts and grant agreements and other matters. The purpose of that report is solely to describe the scope of our testing of internal control over financial reporting and compliance and the results of that testing and not to provide an opinion on the effectiveness of IPERS’ internal control over financial reporting or on compliance. That report is an integral part of an audit performed in accordance with Government Auditing Standards in considering IPERS’ internal control over financial reporting and compliance.
Restriction on Use
Our report, a matter of public record, is intended solely for the information and use of IPERS management, the Iowa Public Employees’ Retirement System Investment Board, IPERS Plan employers, their auditors and citizens of the State of Iowa and is not intended to be and should not be used by anyone other than these specified parties.
Marlys K. Gaston, CPA Deputy Auditor of State
February 26, 2020

6
Iowa Public Employees’ Retirement System

7
Iowa Public Employees’ Retirement System Regular Membership Group

___________________________________________________________________________________________________
Employer ID # Employer Name
2019 Actual Employer
Contributions
Employer Allocation
Percentage ** Net Pension
Liability (NPL)
Change in NPL due to 1%
Decrease in the Actuarial Assumed
Investment Return (6.00%)
00109 REGIONAL ENVIRONMENTAL IMPROVEMENT COMM (REIC) 21,311$ 0.002947% 171,772$ 305,012
00111 PAGE COUNTY SOIL & WATER CONSERVATION 5,953 0.000823% 47,984 85,204
00113 SIOUX CO. SOIL & WATER CONSER. DISTRICT 4,817 0.000666% 38,830 68,949
00114 LYON CO SOIL & WATER CONSERVATION DIST 64 0.000009% 517 919
00115 MID IOWA COMMUNITY ACTION INC (MICA) 300,568 0.041558% 2,422,659 4,301,860
00116 ADAIR CO SOIL & WATER CONSERVATION DIST 4,212 0.000582% 33,947 60,279
00119 MARION CO. SOIL & WATER CONSERVATION DIST 4,346 0.000601% 35,032 62,205
00121 HARRISON COUNTY LANDFILL COMMISSION 23,791 0.003290% 191,764 340,510
00123 SCOTT COUNTY SOIL & WATER CONS. DIST. 3,169 0.000438% 25,543 45,356
00124 HAMPTON - DUMONT COMMUNITY SCHOOL DIST 958,025 0.132462% 7,721,943 13,711,679
00128 BUCHANAN CO ECONOMIC DEVELOPMENT COMM 6,770 0.000936% 54,570 96,899
00131 PARKERSBURG ECONOMIC DEVELOPMENT 1,878 0.000260% 15,138 26,880
00132 FREMONT COUNTY SOIL & WATER CONS DIST 1,093 0.000151% 8,812 15,647
00133 COMMUNITY HOUSING INITIATIVES INC. 165,053 0.022821% 1,330,370 2,362,308
00137 CITY OF WESTWOOD 396 0.000055% 3,196 5,675
00140 SOUTHEAST IOWA REGIONAL AIRPORT AUTH 13,478 0.001864% 108,639 192,907
00141 AUDUBON COUNTY SOLID WASTE MANAGEMENT 11,908 0.001646% 95,982 170,434
00142 HARDIN COUNTY SOLID WASTE DISPOSAL COMM 30,684 0.004243% 247,320 439,161
00145 NEW OPPORTUNITIES, INC. 279,673 0.038669% 2,254,240 4,002,803
00147 WHAT CHEER PUBLIC LIBRARY 834 0.000115% 6,721 11,934
00148 AMANA COLONIES LAND USE DISTRICT 1,661 0.000230% 13,391 23,779
00149 STATE - DEPT OF CORRECTIONS/FT DODGE 172,821 0.023895% 1,392,983 2,473,488
00153 FERTILE PUBLIC LIBRARY 1,166 0.000161% 9,398 16,688
00155 HAMILTON COUNTY SEED 2,088 0.000289% 16,828 29,880
00173 CITY OF SAINT DONATUS 1,350 0.000187% 10,882 19,322
00174 CALHOUN COUNTY ECONOMIC DEVELOPMENT CORP 4,097 0.000566% 33,019 58,632
00177 WGML REFUSE COMMISSION 113 0.000016% 913 1,621
00182 IOWA COUNTY ENGINEERS ASSOCIATION 61,451 0.008497% 495,308 879,508
00189 GREENBELT HOME CARE 100,448 0.013888% 809,635 1,437,651
00195 IMPACT COMMUNITY ACTION PARTNERSHIP, INC 123,693 0.017102% 997,000 1,770,349
00196 SOUTHERN IOWA ECONOMIC DEV. ASSOC. 385,707 0.053330% 3,108,903 5,520,407
00197 SOUTH CENTRAL IOWA COMMUNITY ACTION 157,887 0.021830% 1,272,612 2,259,748
00198 OPERATION THRESHOLD INC. 203,105 0.028082% 1,637,083 2,906,931
00199 WEST CENTRAL COMMUNITY ACTION 372,665 0.051527% 3,003,780 5,333,743
00200 NORTH IOWA COMMUNITY ACTION ORGANIZATION 315,331 0.043599% 2,541,657 4,513,162
00201 MID-SIOUX OPPORTUNITY INC. 251,710 0.034803% 2,028,847 3,602,577
00202 COMMUNITY ACTION OF SOUTHEAST IOWA 260,686 0.036044% 2,101,199 3,731,051
Iowa Public Employees' Retirement System
Schedule of Employer Allocations and Collective Pension Amounts Allocated by Employer -Regular Membership Group
As of and for the year ended June 30, 2019
See notes to Schedules.___________________________________________________________________________________________________
8

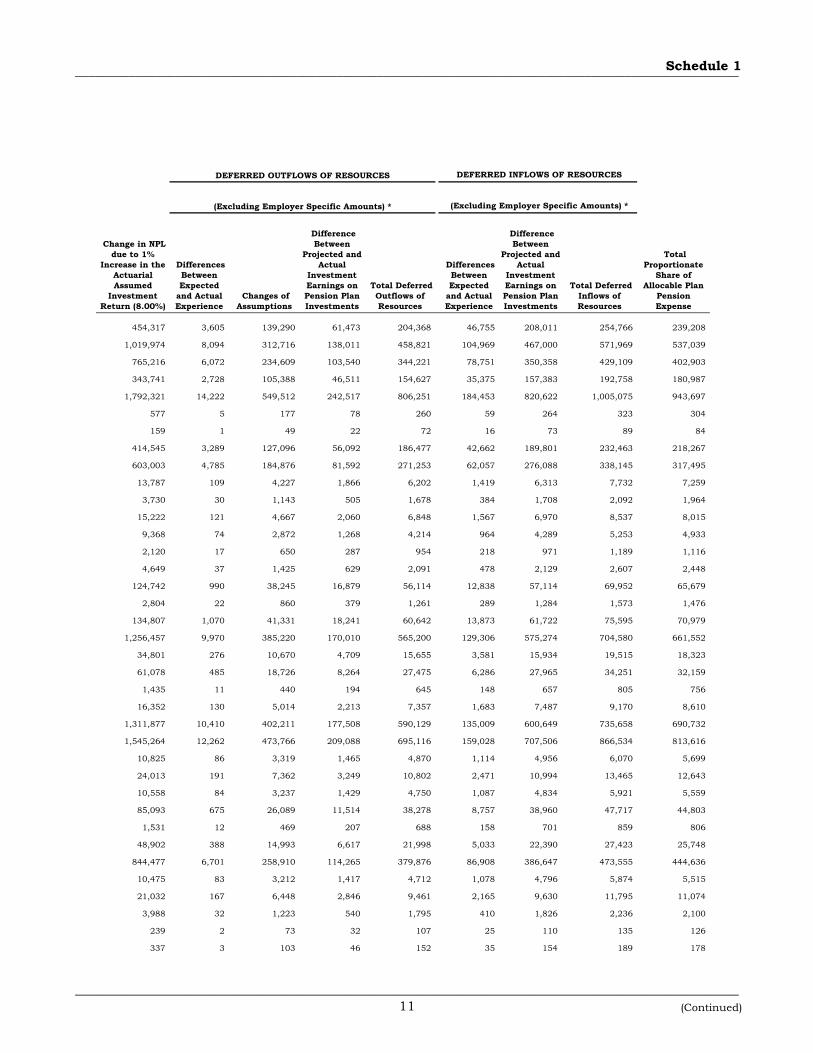
___________________________________________________________________________________________________Schedule 1
Change in NPL due to 1%
Increase in the Actuarial Assumed
Investment Return (8.00%)
Differences Between Expected
and Actual Experience
Changes of Assumptions
Difference Between
Projected and Actual
Investment Earnings on Pension Plan Investments
Total Deferred Outflows of Resources
Differences Between Expected
and Actual Experience
Difference Between
Projected and Actual
Investment Earnings on Pension Plan Investments
Total Deferred Inflows of Resources
Total Proportionate
Share of Allocable Plan
Pension Expense
60,012 476 18,399 8,120 26,995 6,176 27,477 33,653 31,598
16,764 133 5,140 2,268 7,541 1,725 7,676 9,401 8,827
13,566 108 4,159 1,836 6,103 1,396 6,211 7,607 7,143
181 1 55 24 80 19 83 102 95
846,405 6,716 259,501 114,526 380,743 87,106 387,531 474,637 445,651
11,860 94 3,636 1,605 5,335 1,221 5,430 6,651 6,245
12,239 97 3,752 1,656 5,505 1,260 5,604 6,864 6,444
66,997 532 20,541 9,065 30,138 6,895 30,675 37,570 35,275
8,924 71 2,736 1,207 4,014 918 4,086 5,004 4,699
2,697,819 21,407 827,131 365,038 1,213,576 277,641 1,235,209 1,512,850 1,420,462
19,065 151 5,845 2,580 8,576 1,962 8,729 10,691 10,038
5,289 42 1,622 716 2,380 544 2,422 2,966 2,785
3,079 24 944 417 1,385 317 1,410 1,727 1,621
464,792 3,688 142,502 62,890 209,080 47,833 212,807 260,640 244,723
1,116 9 342 151 502 115 511 626 588
37,955 301 11,637 5,136 17,074 3,906 17,378 21,284 19,984
33,533 266 10,281 4,537 15,084 3,451 15,353 18,804 17,656
86,406 686 26,492 11,692 38,870 8,892 39,562 48,454 45,495
787,565 6,249 241,461 106,564 354,274 81,051 360,590 441,641 414,670
2,348 19 720 318 1,057 242 1,075 1,317 1,236
4,679 37 1,434 633 2,104 481 2,142 2,623 2,463
486,667 3,862 149,208 65,850 218,920 50,084 222,823 272,907 256,241
3,283 26 1,007 444 1,477 338 1,503 1,841 1,729
5,879 47 1,802 795 2,644 605 2,692 3,297 3,095
3,802 30 1,166 514 1,710 391 1,741 2,132 2,002
11,536 92 3,537 1,561 5,190 1,187 5,282 6,469 6,074
319 3 98 43 144 33 146 179 168
173,046 1,373 53,055 23,415 77,843 17,809 79,230 97,039 91,113
282,863 2,245 86,724 38,274 127,243 29,110 129,510 158,620 148,933
348,322 2,764 106,793 47,131 156,688 35,847 159,481 195,328 183,399
1,086,159 8,619 333,008 146,967 488,594 111,780 497,303 609,083 571,887
444,613 3,528 136,315 60,160 200,003 45,756 203,568 249,324 234,099
571,949 4,538 175,355 77,390 257,283 58,861 261,869 320,730 301,144
1,049,432 8,327 321,748 141,997 472,072 108,000 480,487 588,487 552,549
887,980 7,046 272,248 120,151 399,445 91,385 406,566 497,951 467,541
708,819 5,625 217,319 95,909 318,853 72,947 324,536 397,483 373,209
734,097 5,825 225,068 99,330 330,223 75,548 336,110 411,658 386,518
DEFERRED OUTFLOWS OF RESOURCES
(Excluding Employer Specific Amounts) * (Excluding Employer Specific Amounts) *
DEFERRED INFLOWS OF RESOURCES
___________________________________________________________________________________________________9 (Continued)

___________________________________________________________________________________________________
Employer ID # Employer Name
2019 Actual Employer
Contributions
Employer Allocation
Percentage ** Net Pension
Liability (NPL)
Change in NPL due to 1%
Decrease in the Actuarial Assumed
Investment Return (6.00%)
Iowa Public Employees' Retirement System
Schedule of Employer Allocations and Collective Pension Amounts Allocated by Employer -Regular Membership Group
As of and for the year ended June 30, 2019
00203 MATURA ACTION CORPORATION 161,333 0.022307% 1,300,388 2,309,070
00204 COMMUNITY ACTION AGENCY OF SIOUXLAND 362,204 0.050080% 2,919,463 5,184,023
00205 COMMUNITY ACTION OF EASTERN IOWA 271,737 0.037572% 2,190,271 3,889,215
00206 OPERATION NEW VIEW COMM. ACTION AGENCY 122,066 0.016878% 983,886 1,747,065
00208 HAWKEYE AREA COMMUNITY ACTION PROG. INC. 636,473 0.088002% 5,130,144 9,109,480
00210 CITY OF BALLTOWN 205 0.000028% 1,651 2,932
00213 CITY OF KINROSS 57 0.000008% 457 811
00215 REGIONAL TRANSIT AUTHORITY INC 147,210 0.020354% 1,186,549 2,106,928
00216 STATE - DEPT OF HUMAN SERVICES/CCUSO 214,133 0.029607% 1,725,970 3,064,766
00217 MANNING MUNICIPAL COMM & TV SYS UTILITY 4,896 0.000677% 39,463 70,074
00218 FREEPORT WATER AND SANITARY DISTRICT 1,324 0.000183% 10,675 18,956
00219 DES MOINES COUNTY SOIL & WATER CONS. DIS 5,406 0.000747% 43,571 77,368
00223 MONROE COUNTY SOIL AND WATER CONS. DIST. 3,327 0.000460% 26,815 47,615
00226 APPANOOSE COUNTY SOIL AND WATER DISTRICT 753 0.000104% 6,069 10,777
00227 CEDAR COUNTY SOIL & WATER CONS DISTRICT 1,651 0.000228% 13,308 23,631
00234 THE COMMUNITY AGENCY 44,297 0.006125% 357,048 634,002
00240 MONTGOMERY SOIL & WATER CONS. DISTRICT 996 0.000138% 8,025 14,250
00241 INDEPENDENCE LIGHT & POWER TELECOMM 47,871 0.006619% 385,857 685,157
00242 NODAWAY VALLEY COMMUNITY SCHOOL DISTRICT 446,182 0.061692% 3,596,345 6,385,949
00245 CHARLES CITY AREA DEVELOPMENT CORP 12,358 0.001709% 99,609 176,874
00250 KOSSUTH COUNTY ECONOMIC DEVELOPMENT CORP 21,689 0.002999% 174,822 310,428
00256 LOUISA SOIL & WATER CONSERVATION DIST 510 0.000070% 4,109 7,296
00270 LUCAS COUNTY SOIL & WATER CONS DISTRICT 5,807 0.000803% 46,805 83,111
00278 AGWSR COMMUNITY SCHOOL DISTRICT 465,862 0.064413% 3,754,974 6,667,621
00279 WEST CENTRAL VALLEY COMMUNITY SCHOOL 548,740 0.075872% 4,422,995 7,853,812
00283 HENRY COUNTY SOIL & WATER CONS DIST 3,844 0.000531% 30,984 55,017
00287 MADISON COUNTY SOIL & WATER 8,527 0.001179% 68,731 122,044
00288 CLARKE COUNTY SOIL & WATER 3,749 0.000518% 30,219 53,660
00290 OSAGE MUNICIPAL COMMUNICATIONS UTILITY 30,217 0.004178% 243,561 432,485
00291 BALDWIN-MONMOUTH WASTEWATER TREATMENT AG 544 0.000075% 4,382 7,781
00293 COUNCIL BLUFFS AIRPORT AUTHORITY 17,366 0.002401% 139,971 248,543
00294 COMMUNITY & FAMILY RESOURCES 299,883 0.041463% 2,417,137 4,292,056
00296 E POTTAWATTAMIE SOIL & WATER CONS DIST 3,720 0.000514% 29,982 53,239
00300 CITY OF MAHARISHI VEDIC CITY 7,469 0.001033% 60,201 106,897
00301 CITY OF SAGEVILLE 1,416 0.000196% 11,414 20,267
00303 CITY OF UDELL 85 0.000012% 685 1,216
00304 CITY OF TURIN 120 0.000017% 966 1,714
See notes to Schedules.___________________________________________________________________________________________________
10
___________________________________________________________________________________________________Schedule 1
Change in NPL due to 1%
Increase in the Actuarial Assumed
Investment Return (8.00%)
Differences Between Expected
and Actual Experience
Changes of Assumptions
Difference Between
Projected and Actual
Investment Earnings on Pension Plan Investments
Total Deferred Outflows of Resources
Differences Between Expected
and Actual Experience
Difference Between
Projected and Actual
Investment Earnings on Pension Plan Investments
Total Deferred Inflows of Resources
Total Proportionate
Share of Allocable Plan
Pension Expense
DEFERRED OUTFLOWS OF RESOURCES
(Excluding Employer Specific Amounts) * (Excluding Employer Specific Amounts) *
DEFERRED INFLOWS OF RESOURCES
454,317 3,605 139,290 61,473 204,368 46,755 208,011 254,766 239,208
1,019,974 8,094 312,716 138,011 458,821 104,969 467,000 571,969 537,039
765,216 6,072 234,609 103,540 344,221 78,751 350,358 429,109 402,903
343,741 2,728 105,388 46,511 154,627 35,375 157,383 192,758 180,987
1,792,321 14,222 549,512 242,517 806,251 184,453 820,622 1,005,075 943,697
577 5 177 78 260 59 264 323 304
159 1 49 22 72 16 73 89 84
414,545 3,289 127,096 56,092 186,477 42,662 189,801 232,463 218,267
603,003 4,785 184,876 81,592 271,253 62,057 276,088 338,145 317,495
13,787 109 4,227 1,866 6,202 1,419 6,313 7,732 7,259
3,730 30 1,143 505 1,678 384 1,708 2,092 1,964
15,222 121 4,667 2,060 6,848 1,567 6,970 8,537 8,015
9,368 74 2,872 1,268 4,214 964 4,289 5,253 4,933
2,120 17 650 287 954 218 971 1,189 1,116
4,649 37 1,425 629 2,091 478 2,129 2,607 2,448
124,742 990 38,245 16,879 56,114 12,838 57,114 69,952 65,679
2,804 22 860 379 1,261 289 1,284 1,573 1,476
134,807 1,070 41,331 18,241 60,642 13,873 61,722 75,595 70,979
1,256,457 9,970 385,220 170,010 565,200 129,306 575,274 704,580 661,552
34,801 276 10,670 4,709 15,655 3,581 15,934 19,515 18,323
61,078 485 18,726 8,264 27,475 6,286 27,965 34,251 32,159
1,435 11 440 194 645 148 657 805 756
16,352 130 5,014 2,213 7,357 1,683 7,487 9,170 8,610
1,311,877 10,410 402,211 177,508 590,129 135,009 600,649 735,658 690,732
1,545,264 12,262 473,766 209,088 695,116 159,028 707,506 866,534 813,616
10,825 86 3,319 1,465 4,870 1,114 4,956 6,070 5,699
24,013 191 7,362 3,249 10,802 2,471 10,994 13,465 12,643
10,558 84 3,237 1,429 4,750 1,087 4,834 5,921 5,559
85,093 675 26,089 11,514 38,278 8,757 38,960 47,717 44,803
1,531 12 469 207 688 158 701 859 806
48,902 388 14,993 6,617 21,998 5,033 22,390 27,423 25,748
844,477 6,701 258,910 114,265 379,876 86,908 386,647 473,555 444,636
10,475 83 3,212 1,417 4,712 1,078 4,796 5,874 5,515
21,032 167 6,448 2,846 9,461 2,165 9,630 11,795 11,074
3,988 32 1,223 540 1,795 410 1,826 2,236 2,100
239 2 73 32 107 25 110 135 126
337 3 103 46 152 35 154 189 178
___________________________________________________________________________________________________11 (Continued)

___________________________________________________________________________________________________
Employer ID # Employer Name
2019 Actual Employer
Contributions
Employer Allocation
Percentage ** Net Pension
Liability (NPL)
Change in NPL due to 1%
Decrease in the Actuarial Assumed
Investment Return (6.00%)
Iowa Public Employees' Retirement System
Schedule of Employer Allocations and Collective Pension Amounts Allocated by Employer -Regular Membership Group
As of and for the year ended June 30, 2019
00306 CITY OF GIBSON 156 0.000022% 1,255 2,229
00307 CITY OF OAKLAND ACRES 396 0.000055% 3,196 5,675
00308 CITY OF GILLETT GROVE 274 0.000038% 2,207 3,918
00309 IOWA NORTHLAND REGIONAL HOUSING 6,998 0.000968% 56,408 100,162
00314 LYTTON LIBRARY 1,380 0.000191% 11,124 19,753
00316 CROSSROADS MENTAL HEALTH CENTER 112,038 0.015491% 903,055 1,603,534
00317 KIDS WORLD INC 22,717 0.003141% 183,108 325,141
00319 STATE - DEPARTMENT OF REVENUE 1,690,879 0.233790% 13,628,940 24,200,598
00320 ZION RECOVERY SERVICES INC 190,124 0.026288% 1,532,450 2,721,137
00321 GEORGE-LITTLE ROCK COMMUNITY SCHOOL 283,656 0.039220% 2,286,343 4,059,807
00322 BOARD OF PROFESSIONAL ETHICS AND CONDUCT 90,397 0.012499% 728,625 1,293,803
00324 MONONA COUNTY SANITARY LANDFILL 17,826 0.002465% 143,681 255,130
00325 APLINGTON-PARKERSBURG COMM SCHOOL DIST 566,125 0.078276% 4,563,124 8,102,636
00326 MUSCATINE CO JOINT COMMUNICATIONS COMM 55,687 0.007700% 448,855 797,021
00327 HAMILTON SOIL AND WATER CONS DIST 911 0.000126% 7,343 13,038
00329 MARION CO FAIR ASSOC 25,446 0.003518% 205,101 364,193
00330 SOUTHEAST WEBSTER-GRAND COMMUNITY SCHOOL 319,446 0.044168% 2,574,825 4,572,058
00331 BATTLE CREEK COMMUNITY AMBULANCE 963 0.000133% 7,761 13,781
00332 CLARINDA ECONOMIC DEVELOPMENT CORP 6,188 0.000856% 49,881 88,572
00334 ROCK RAPIDS MUNICIPAL UTILITY 62,773 0.008679% 505,966 898,432
00335 CRAWFORD COUNTY SWCD 112 0.000015% 900 1,598
00336 ADLM CO ENVIRONMENTAL PUBLIC HEALTH 16,208 0.002241% 130,640 231,975
00338 CLAYTON RIDGE COMM SCH DIST 389,208 0.053814% 3,137,124 5,570,519
00339 SIOUXLAND HUMAN INVEST PARTNERSHIP(SHIP) 231,268 0.031976% 1,864,087 3,310,016
00340 UNITED COMMUNITY HEALTH CENTER, INC 162,731 0.022500% 1,311,655 2,329,075
00341 MITCHELL CO ECON DEV COMMISSION 6,791 0.000939% 54,736 97,194
00342 O'BRIEN COUNTY ECONOMIC DEVELPMENT CORP. 8,539 0.001181% 68,824 122,209
00343 UNION CO SOIL & WATER CONS DISTRICT 2,265 0.000313% 18,255 32,414
00344 SOUTHERN IOWA RC&D AREA 16,617 0.002298% 133,936 237,828
00345 MASON CITY HOUSING AUTHORITY 19,428 0.002686% 156,594 278,061
00350 LINKING FAMILIES AND COMMUNITIES 9,096 0.001258% 73,313 130,180
00352 CHARITON VALLEY PLANNING & DEVELOPMENT 12,024 0.001662% 96,913 172,086
00354 GREAT PRAIRIE AREA EDUCATION AGENCY 1,642,151 0.227053% 13,236,182 23,503,187
00357 STATE - DEPT OF CORRECTIONS/PRISON INDUSTRIES 188,491 0.026062% 1,519,285 2,697,759
00358 HUDSON MUNICIPAL ELECTRIC UTILITIES 12,753 0.001763% 102,792 182,525
00359 STATE - IOWA DEPT OF VETERAN AFFAIRS 71,581 0.009897% 576,961 1,024,496
00361 GRAETTINGER-TERRIL CSD 261,096 0.036101% 2,104,508 3,736,928
See notes to Schedules.___________________________________________________________________________________________________
12

___________________________________________________________________________________________________Schedule 1
Change in NPL due to 1%
Increase in the Actuarial Assumed
Investment Return (8.00%)
Differences Between Expected
and Actual Experience
Changes of Assumptions
Difference Between
Projected and Actual
Investment Earnings on Pension Plan Investments
Total Deferred Outflows of Resources
Differences Between Expected
and Actual Experience
Difference Between
Projected and Actual
Investment Earnings on Pension Plan Investments
Total Deferred Inflows of Resources
Total Proportionate
Share of Allocable Plan
Pension Expense
DEFERRED OUTFLOWS OF RESOURCES
(Excluding Employer Specific Amounts) * (Excluding Employer Specific Amounts) *
DEFERRED INFLOWS OF RESOURCES
439 3 134 59 196 45 201 246 231
1,116 9 342 151 502 115 511 626 588
771 6 236 104 346 79 353 432 406
19,707 156 6,042 2,667 8,865 2,028 9,023 11,051 10,376
3,887 31 1,192 526 1,749 400 1,779 2,179 2,046
315,501 2,504 96,730 42,690 141,924 32,469 144,453 176,922 166,118
63,973 508 19,614 8,656 28,778 6,584 29,290 35,874 33,683
4,761,550 37,783 1,459,855 644,279 2,141,917 490,026 2,180,097 2,670,123 2,507,062
535,393 4,248 164,147 72,443 240,838 55,099 245,132 300,231 281,896
798,781 6,338 244,900 108,082 359,320 82,205 365,725 447,930 420,576
254,560 2,020 78,046 34,444 114,510 26,198 116,551 142,749 134,032
50,198 398 15,390 6,792 22,580 5,166 22,983 28,149 26,430
1,594,221 12,650 488,776 215,712 717,138 164,066 729,921 893,987 839,393
156,817 1,244 48,079 21,219 70,542 16,138 71,799 87,937 82,567
2,565 20 786 347 1,153 264 1,175 1,439 1,351
71,656 569 21,969 9,696 32,234 7,374 32,808 40,182 37,729
899,568 7,138 275,801 121,719 404,658 92,577 411,871 504,448 473,642
2,711 22 831 367 1,220 279 1,241 1,520 1,428
17,427 138 5,343 2,358 7,839 1,793 7,979 9,772 9,176
176,769 1,403 54,196 23,918 79,517 18,192 80,935 99,127 93,073
314 2 96 43 141 32 144 176 166
45,642 362 13,993 6,176 20,531 4,697 20,897 25,594 24,031
1,096,019 8,697 336,031 148,301 493,029 112,795 501,817 614,612 577,078
651,257 5,168 199,670 88,121 292,959 67,023 298,181 365,204 342,901
458,253 3,636 140,497 62,006 206,139 47,160 209,813 256,973 241,281
19,123 152 5,863 2,588 8,603 1,968 8,756 10,724 10,069
24,045 191 7,372 3,254 10,817 2,475 11,009 13,484 12,660
6,378 51 1,955 863 2,869 656 2,920 3,576 3,358
46,793 371 14,346 6,332 21,049 4,816 21,425 26,241 24,638
54,709 434 16,773 7,403 24,610 5,630 25,049 30,679 28,806
25,613 203 7,853 3,466 11,522 2,636 11,727 14,363 13,486
33,859 269 10,381 4,581 15,231 3,484 15,502 18,986 17,827
4,624,332 36,694 1,417,785 625,712 2,080,191 475,904 2,117,271 2,593,175 2,434,813
530,793 4,212 162,737 71,821 238,770 54,626 243,026 297,652 279,474
35,912 285 11,010 4,859 16,154 3,696 16,443 20,139 18,909
201,573 1,599 61,801 27,275 90,675 20,745 92,291 113,036 106,133
735,253 5,834 225,423 99,486 330,743 75,667 336,639 412,306 387,127
___________________________________________________________________________________________________13 (Continued)

___________________________________________________________________________________________________
Employer ID # Employer Name
2019 Actual Employer
Contributions
Employer Allocation
Percentage ** Net Pension
Liability (NPL)
Change in NPL due to 1%
Decrease in the Actuarial Assumed
Investment Return (6.00%)
Iowa Public Employees' Retirement System
Schedule of Employer Allocations and Collective Pension Amounts Allocated by Employer -Regular Membership Group
As of and for the year ended June 30, 2019
00363 JOINT EMERGENCY COMMUNICATIONS SERVICES ASSOC. 166,544 0.023027% 1,342,393 2,383,656
00365 GREEN HILLS AEA 1,674,897 0.231581% 13,500,126 23,971,866
00366 ST. CHARLES TOWNSHIP/SUNNYSIDE MEMORY GARDENS 3,024 0.000418% 24,378 43,288
00367 WEST FORK COMMUNITY SCHOOL DISTRICT 486,580 0.067277% 3,921,964 6,964,142
00368 EAST SAC COUNTY COMMUNITY SCHOOL DISTRICT 604,043 0.083518% 4,868,747 8,645,322
00369 IKM-MANNING COMMUNITY SCHOOL DISTRICT 425,647 0.058852% 3,430,828 6,092,043
00370 NORTH BUTLER COMMUNITY SCHOOL DISTRICT 436,569 0.060363% 3,518,866 6,248,371
00371 CAM COMMUNITY SCHOOL DISTRICT 303,080 0.041906% 2,442,909 4,337,817
00373 EAST MILLS COMMUNITY SCHOOL DISTRICT 307,978 0.042583% 2,482,389 4,407,921
00374 CENTRAL SPRINGS COMMUNITY SCHOOL DISTRICT 535,929 0.074101% 4,319,735 7,670,455
00375 SEASONS CENTER FOR COMMUNITY MENTAL HEALTH 396,497 0.054822% 3,195,871 5,674,835
00376 CREW PUBLIC LIBRARY 1,507 0.000208% 12,145 21,566
00377 DES MOINES AIRPORT AUTHORITY 410,460 0.056752% 3,308,416 5,874,678
00379 MENLO PUBLIC LIBRARY 1,329 0.000184% 10,709 19,016
00380 IOWA ASSOC OF AREA EDUCATION AGENCIES 52,123 0.007207% 420,128 746,012
00381 EDDYVILLE-BLAKESBURG-FREMONT COMM SCH DIST 652,532 0.090223% 5,259,588 9,339,330
00382 MAPLE VALLEY - ANTHON OTO COMM SCHOOL DIST 480,647 0.066457% 3,874,149 6,879,238
00383 SOUTHERN IOWA TROLLEY 88,749 0.012271% 715,338 1,270,209
00386 IOWA PUBLIC POWER AGENCY 1,359 0.000188% 10,957 19,456
00388 OSCEOLA WATER WORKS 39,922 0.005520% 321,781 571,380
00389 STATE - HOMELAND SEC & EMERG MNGMNT 413,608 0.057188% 3,333,790 5,919,735
00390 STATE - IOWA PUBLIC INFORMATION BOARD 17,563 0.002428% 141,559 251,363
00391 NORTHEAST IOWA AREA AGENCY ON AGING 227,632 0.031474% 1,834,779 3,257,976
00392 MILESTONES AREA AGENCY ON AGING 202,030 0.027934% 1,628,421 2,891,549
00393 THE HERITAGE AREA AGENCY ON AGING 66,676 0.009219% 537,429 954,301
00394 AGING RESOURCES OF CENTRAL IOWA 66,042 0.009131% 532,313 945,216
00395 CONNECTIONS AREA AGENCY ON AGING 164,880 0.022797% 1,328,977 2,359,835
00396 EASTON VALLEY COMM SCHOOL DIST 316,421 0.043750% 2,550,443 4,528,763
00397 CITY OF URBANDALE WATER UTILITY 129,041 0.017842% 1,040,109 1,846,898
00398 SOUTHWEST IOWA JUVENILE DETENTION CENTER 90,703 0.012541% 731,092 1,298,183
00399 10-15 REGIONAL TRANSIT AGENCY 150,422 0.020798% 1,212,440 2,152,902
00400 TWO RIVERS LEVEE & DRAINAGE DIST 25,054 0.003464% 201,942 358,584
00402 GREENE COUNTY COMMUNITY SCHOOL DIST 880,305 0.121716% 7,095,499 12,599,315
00403 CLARION-GOLDFIELD-DOWS COMMUNITY SCHOOL DIST 676,441 0.093528% 5,452,296 9,681,517
00404 SUMNER-FREDERICKSBURG COMM SCHOOL DIST 567,380 0.078449% 4,573,238 8,120,595
00405 SOUTH CENTRAL CALHOUN COMMUNITY SCHOOL DIST 621,273 0.085901% 5,007,631 8,891,936
00406 STATE - OFFICE OF THE CHIEF INFORMATION OFFICER 1,006,170 0.139119% 8,110,005 14,400,751
See notes to Schedules.___________________________________________________________________________________________________
14

___________________________________________________________________________________________________Schedule 1
Change in NPL due to 1%
Increase in the Actuarial Assumed
Investment Return (8.00%)
Differences Between Expected
and Actual Experience
Changes of Assumptions
Difference Between
Projected and Actual
Investment Earnings on Pension Plan Investments
Total Deferred Outflows of Resources
Differences Between Expected
and Actual Experience
Difference Between
Projected and Actual
Investment Earnings on Pension Plan Investments
Total Deferred Inflows of Resources
Total Proportionate
Share of Allocable Plan
Pension Expense
DEFERRED OUTFLOWS OF RESOURCES
(Excluding Employer Specific Amounts) * (Excluding Employer Specific Amounts) *
DEFERRED INFLOWS OF RESOURCES
468,992 3,721 143,789 63,459 210,969 48,265 214,730 262,995 246,935
4,716,546 37,426 1,446,057 638,190 2,121,673 485,394 2,159,492 2,644,886 2,483,366
8,517 68 2,611 1,152 3,831 877 3,900 4,777 4,484
1,370,219 10,873 420,098 185,402 616,373 141,013 627,361 768,374 721,450
1,700,996 13,498 521,512 230,160 765,170 175,055 778,809 953,864 895,612
1,198,630 9,511 367,491 162,185 539,187 123,355 548,798 672,153 631,105
1,229,388 9,755 376,921 166,347 553,023 126,520 562,881 689,401 647,300
853,480 6,772 261,670 115,483 383,925 87,834 390,770 478,604 449,376
867,273 6,882 265,899 117,350 390,131 89,254 397,085 486,339 456,639
1,509,188 11,976 462,705 204,206 678,887 155,315 690,988 846,303 794,621
1,116,543 8,860 342,324 151,078 502,262 114,907 511,214 626,121 587,885
4,243 34 1,301 574 1,909 437 1,943 2,380 2,234
1,155,863 9,172 354,379 156,398 519,949 118,953 529,217 648,170 608,587
3,742 30 1,147 506 1,683 385 1,713 2,098 1,970
146,780 1,165 45,002 19,861 66,028 15,106 67,204 82,310 77,283
1,837,545 14,581 563,377 248,636 826,594 189,107 841,328 1,030,435 967,508
1,353,513 10,740 414,977 183,142 608,859 139,294 619,712 759,006 712,655
249,918 1,983 76,623 33,816 112,422 25,720 114,426 140,146 131,587
3,828 30 1,174 518 1,722 394 1,753 2,147 2,016
112,421 892 34,467 15,212 50,571 11,570 51,472 63,042 59,192
1,164,728 9,242 357,097 157,598 523,937 119,866 533,276 653,142 613,255
49,456 392 15,163 6,692 22,247 5,090 22,644 27,734 26,040
641,018 5,087 196,531 86,735 288,353 65,969 293,493 359,462 337,510
568,922 4,514 174,427 76,980 255,921 58,550 260,484 319,034 299,550
187,762 1,490 57,566 25,406 84,462 19,323 85,968 105,291 98,861
185,974 1,476 57,018 25,164 83,658 19,139 85,149 104,288 97,920
464,306 3,684 142,353 62,825 208,862 47,783 212,584 260,367 244,467
891,049 7,071 273,189 120,567 400,827 91,701 407,971 499,672 469,157
363,383 2,883 111,411 49,169 163,463 37,397 166,377 203,774 191,329
255,422 2,027 78,310 34,561 114,898 26,286 116,946 143,232 134,485
423,591 3,361 129,870 57,316 190,547 43,593 193,943 237,536 223,030
70,553 560 21,631 9,546 31,737 7,261 32,303 39,564 37,148
2,478,958 19,671 760,029 335,425 1,115,125 255,117 1,135,002 1,390,119 1,305,226
1,904,871 15,115 584,019 257,746 856,880 196,036 872,154 1,068,190 1,002,957
1,597,754 12,678 489,859 216,190 718,727 164,430 731,539 895,969 841,253
1,749,519 13,883 536,389 236,725 786,997 180,048 801,025 981,073 921,160
2,833,397 22,483 868,698 383,383 1,274,564 291,593 1,297,283 1,588,876 1,491,846
___________________________________________________________________________________________________15 (Continued)

___________________________________________________________________________________________________
Employer ID # Employer Name
2019 Actual Employer
Contributions
Employer Allocation
Percentage ** Net Pension
Liability (NPL)
Change in NPL due to 1%
Decrease in the Actuarial Assumed
Investment Return (6.00%)
Iowa Public Employees' Retirement System
Schedule of Employer Allocations and Collective Pension Amounts Allocated by Employer -Regular Membership Group
As of and for the year ended June 30, 2019
00407 EXIRA-ELK HORN-KIMBALLTON COMM SCHOOL DIST 256,811 0.035508% 2,069,969 3,675,596
00408 NORTH UNION COMMUNITY SCHOOL DIST 247,498 0.034220% 1,994,898 3,542,294
00409 DES MOINES CO EMERGENCY COMM CTR 57,656 0.007972% 464,720 825,194
00411 BENTON CO SOLID WASTE DISPOSAL COMMISSION 19,215 0.002657% 154,875 275,009
00412 SOUTHWEST WEBSTER AMBULANCE SERVICE 1,726 0.000239% 13,916 24,710
00413 CLAYTON COUNTY DEVELOPMENT GROUP 4,531 0.000627% 36,523 64,853
00414 GARNER-HAYFIELD-VENTURA COMM SCHOOL DIST 649,145 0.089754% 5,232,286 9,290,851
00415 DUBUQUE COUNTY LIBRARY DISTRICT 36,426 0.005036% 293,600 521,340
00416 AHSTW COMM SCHOOL DIST 482,355 0.066693% 3,887,915 6,903,681
00417 MUNICIPAL HOUSING AGENCY OF COUNCIL BLUFFS 74,533 0.010305% 600,754 1,066,745
00418 PRAIRIE SOLID WASTE AGENCY 6,092 0.000842% 49,105 87,195
00419 OABCIG COMMUNITY SCHOOL DISTRICT 585,962 0.081018% 4,723,015 8,386,550
00420 STATE - BOARD OF EDUCATIONAL EXAMINERS 99,808 0.013800% 804,482 1,428,501
00421 ALTA-AURELIA COMMUNITY SCHOOL DISTRICT 463,675 0.064110% 3,737,345 6,636,318
00422 NORTH FAYETTE VALLEY COMMUNITY SCHOOL DIST 746,779 0.103254% 6,019,241 10,688,230
01201 ADAIR COUNTY 202,501 0.027999% 1,632,209 2,898,276
01203 ADAIR COUNTY AGRI EXT DIST 12,370 0.001710% 99,707 177,048
01204 ADAIR COUNTY HEALTH SYSTEM 396,694 0.054849% 3,197,460 5,677,657
01205 ADAIR CO ASSESSOR 11,243 0.001554% 90,620 160,912
01207 ADAIR CO SANITARY LANDFILL 10,874 0.001503% 87,645 155,630
01301 CITY OF FONTANELLE 22,301 0.003083% 179,754 319,186
01302 CITY OF GREENFIELD 96,791 0.013383% 780,159 1,385,311
01303 CITY OF CASEY 11,371 0.001572% 91,655 162,749
01306 CITY OF ADAIR 15,190 0.002100% 122,436 217,407
01308 CITY OF ORIENT 9,562 0.001322% 77,075 136,860
01309 CITY OF BRIDGEWATER 697 0.000096% 5,620 9,980
01401 GREENFIELD TOWNSHIP - ADAIR COUNTY 2,875 0.000398% 23,174 41,150
01403 SUMMERSET TOWNSHIP - ADAIR COUNTY 909 0.000126% 7,330 13,015
01528 ADAIR CASEY COMMUNITY SCHOOL DISTRICT 192,209 0.026576% 1,549,255 2,750,977
01530 ORIENT MACKSBURG COMMUNITY SCHOOL DIST 120,078 0.016603% 967,858 1,718,603
02201 ADAMS COUNTY 154,241 0.021326% 1,243,221 2,207,559
02203 ADAMS CO AGR EXT DIST 4,254 0.000588% 34,292 60,892
02301 CITY OF CORNING 29,797 0.004120% 240,173 426,470
02303 CITY OF PRESCOTT 3,115 0.000431% 25,110 44,587
02306 CORNING HOUSING COMM 8,919 0.001233% 71,893 127,659
02546 CORNING COMMUNITY SCHOOL DISTRICT 320,349 0.044293% 2,582,096 4,584,969
02701 CORNING MUNICIPAL UTILITIES 45,939 0.006352% 370,278 657,495
See notes to Schedules.___________________________________________________________________________________________________
16

___________________________________________________________________________________________________Schedule 1
Change in NPL due to 1%
Increase in the Actuarial Assumed
Investment Return (8.00%)
Differences Between Expected
and Actual Experience
Changes of Assumptions
Difference Between
Projected and Actual
Investment Earnings on Pension Plan Investments
Total Deferred Outflows of Resources
Differences Between Expected
and Actual Experience
Difference Between
Projected and Actual
Investment Earnings on Pension Plan Investments
Total Deferred Inflows of Resources
Total Proportionate
Share of Allocable Plan
Pension Expense
DEFERRED OUTFLOWS OF RESOURCES
(Excluding Employer Specific Amounts) * (Excluding Employer Specific Amounts) *
DEFERRED INFLOWS OF RESOURCES
723,186 5,739 221,723 97,853 325,315 74,425 331,114 405,539 380,774
696,958 5,530 213,682 94,305 313,517 71,726 319,106 390,832 366,964
162,360 1,288 49,778 21,969 73,035 16,709 74,337 91,046 85,486
54,109 429 16,589 7,321 24,339 5,569 24,774 30,343 28,490
4,862 39 1,491 658 2,188 500 2,226 2,726 2,560
12,760 101 3,912 1,727 5,740 1,313 5,842 7,155 6,718
1,828,006 14,505 560,453 247,345 822,303 188,126 836,961 1,025,087 962,486
102,575 814 31,449 13,879 46,142 10,556 46,965 57,521 54,008
1,358,323 10,778 416,451 183,793 611,022 139,789 621,914 761,703 715,187
209,886 1,665 64,349 28,399 94,413 21,600 96,097 117,697 110,510
17,156 136 5,260 2,321 7,717 1,766 7,855 9,621 9,033
1,650,082 13,094 505,903 223,270 742,267 169,815 755,497 925,312 868,805
281,062 2,230 86,172 38,030 126,432 28,925 128,686 157,611 147,986
1,305,718 10,361 400,323 176,675 587,359 134,375 597,829 732,204 687,490
2,102,945 16,687 644,747 284,547 945,981 216,421 962,843 1,179,264 1,107,247
570,246 4,525 174,833 77,159 256,517 58,686 261,090 319,776 300,247
34,835 276 10,680 4,713 15,669 3,585 15,949 19,534 18,341
1,117,098 8,864 342,494 151,153 502,511 114,964 511,468 626,432 588,177
31,660 251 9,707 4,284 14,242 3,258 14,496 17,754 16,670
30,621 243 9,388 4,143 13,774 3,151 14,020 17,171 16,122
62,801 498 19,254 8,498 28,250 6,463 28,754 35,217 33,066
272,565 2,163 83,566 36,880 122,609 28,050 124,795 152,845 143,511
32,021 254 9,818 4,333 14,405 3,295 14,661 17,956 16,860
42,776 339 13,115 5,788 19,242 4,402 19,585 23,987 22,522
26,928 214 8,256 3,644 12,114 2,771 12,329 15,100 14,178
1,964 16 602 266 884 202 899 1,101 1,034
8,096 64 2,482 1,096 3,642 833 3,707 4,540 4,263
2,561 20 785 347 1,152 264 1,172 1,436 1,348
541,264 4,295 165,947 73,238 243,480 55,703 247,820 303,523 284,988
338,141 2,683 103,671 45,753 152,107 34,799 154,819 189,618 178,039
434,345 3,447 133,167 58,771 195,385 44,700 198,867 243,567 228,692
11,981 95 3,673 1,621 5,389 1,233 5,485 6,718 6,308
83,909 666 25,726 11,354 37,746 8,635 38,418 47,053 44,180
8,773 70 2,690 1,187 3,947 903 4,017 4,920 4,619
25,117 199 7,701 3,399 11,299 2,585 11,500 14,085 13,225
902,108 7,158 276,579 122,063 405,800 92,839 413,034 505,873 474,980
129,364 1,027 39,662 17,504 58,193 13,313 59,230 72,543 68,113
___________________________________________________________________________________________________17 (Continued)

___________________________________________________________________________________________________
Employer ID # Employer Name
2019 Actual Employer
Contributions
Employer Allocation
Percentage ** Net Pension
Liability (NPL)
Change in NPL due to 1%
Decrease in the Actuarial Assumed
Investment Return (6.00%)
Iowa Public Employees' Retirement System
Schedule of Employer Allocations and Collective Pension Amounts Allocated by Employer -Regular Membership Group
As of and for the year ended June 30, 2019
03201 ALLAMAKEE COUNTY 333,967 0.046176% 2,691,868 4,779,889
03203 ALLAMAKEE CO AGR EXT DIST 16,354 0.002261% 131,820 234,070
03206 ALLAMAKEE CO SOIL & WATER CONS DIST 3,184 0.000440% 25,668 45,578
03301 CITY OF HARPERS FERRY 10,254 0.001418% 82,648 146,757
03302 CITY OF WAUKON 86,434 0.011951% 696,682 1,237,083
03303 CITY OF NEW ALBIN 10,604 0.001466% 85,475 151,776
03304 CITY OF LANSING 18,100 0.002503% 145,890 259,054
03306 CITY OF POSTVILLE 32,604 0.004508% 262,797 466,643
03310 CITY OF WATERVILLE 1,725 0.000239% 13,907 24,695
03312 VETERAN'S MEMORIAL HOSPITAL 854,169 0.118102% 6,884,831 12,225,236
03566 POSTVILLE COMMUNITY SCHOOL DISTRICT 519,507 0.071830% 4,187,365 7,435,409
03567 ALLAMAKEE COMMUNITY SCHOOL DISTRICT 730,537 0.101008% 5,888,324 10,455,763
03568 EASTERN ALLAMAKEE COMMUNITY SCHOOL DIST 231,136 0.031958% 1,863,020 3,308,122
03601 UPPER EXPLORERLAND REGIONAL PLANNING COM 80,957 0.011194% 652,538 1,158,697
04201 APPANOOSE COUNTY 143,187 0.019798% 1,154,125 2,049,354
04203 APPANOOSE COUNTY AGRI 7,487 0.001035% 60,351 107,164
04207 APPANOOSE CO SECONDARY RD DEPT 110,406 0.015265% 889,900 1,580,175
04301 CITY OF CENTERVILLE 113,427 0.015683% 914,254 1,623,421
04304 CITY OF MOULTON 13,463 0.001861% 108,514 192,686
04305 CITY OF MYSTIC 8,196 0.001133% 66,059 117,299
04307 CITY OF MORAVIA 12,864 0.001779% 103,685 184,110
04311 CITY OF CINCINNATI 10,005 0.001383% 80,644 143,198
04312 CITY OF PLANO 24 0.000003% 190 338
04314 CITY OF NUMA 198 0.000027% 1,598 2,837
04315 CITY OF EXLINE 614 0.000085% 4,946 8,782
04316 CITY OF RATHBUN 470 0.000065% 3,788 6,726
04317 LOW RENT HOUSING AGENCY OF CENTERVILLE 15,287 0.002114% 123,219 218,797
04321 GARRETT MEMORIAL LIBRARY 754 0.000104% 6,079 10,795
04510 CENTERVILLE COMMUNITY SCHOOL DISTRICT 896,417 0.123944% 7,225,367 12,829,920
04545 MORAVIA COMMUNITY SCHOOL DISTRICT 231,354 0.031988% 1,864,775 3,311,239
04547 MOULTON UDELL COMMUNITY SCHOOL DISTRICT 140,662 0.019449% 1,133,773 2,013,216
04703 RATHBUN AREA SOLID WASTE COMM. 23,729 0.003281% 191,265 339,625
05201 AUDUBON COUNTY 224,802 0.031082% 1,811,967 3,217,468
05203 AUDUBON COUNTY AGRI EXTENSION DISTRICT 6,597 0.000912% 53,174 94,420
05205 AUDUBON COUNTY MEMORIAL HOSPITAL 517,808 0.071595% 4,173,669 7,411,089
05301 CITY OF EXIRA 14,973 0.002070% 120,687 214,301
05302 CITY OF AUDUBON 32,017 0.004427% 258,063 458,236
See notes to Schedules.___________________________________________________________________________________________________
18

___________________________________________________________________________________________________Schedule 1
Change in NPL due to 1%
Increase in the Actuarial Assumed
Investment Return (8.00%)
Differences Between Expected
and Actual Experience
Changes of Assumptions
Difference Between
Projected and Actual
Investment Earnings on Pension Plan Investments
Total Deferred Outflows of Resources
Differences Between Expected
and Actual Experience
Difference Between
Projected and Actual
Investment Earnings on Pension Plan Investments
Total Deferred Inflows of Resources
Total Proportionate
Share of Allocable Plan
Pension Expense
DEFERRED OUTFLOWS OF RESOURCES
(Excluding Employer Specific Amounts) * (Excluding Employer Specific Amounts) *
DEFERRED INFLOWS OF RESOURCES
940,459 7,463 288,338 127,252 423,053 96,786 430,594 527,380 495,173
46,054 365 14,120 6,232 20,717 4,740 21,086 25,826 24,248
8,968 71 2,749 1,213 4,033 923 4,106 5,029 4,722
28,875 229 8,853 3,907 12,989 2,972 13,221 16,193 15,203
243,400 1,931 74,625 32,934 109,490 25,049 111,442 136,491 128,156
29,862 237 9,156 4,041 13,434 3,073 13,673 16,746 15,723
50,970 404 15,627 6,897 22,928 5,245 23,337 28,582 26,837
91,814 729 28,149 12,423 41,301 9,449 42,037 51,486 48,342
4,859 39 1,490 657 2,186 500 2,225 2,725 2,558
2,405,357 19,087 737,464 325,466 1,082,017 247,543 1,101,303 1,348,846 1,266,474
1,462,942 11,609 448,527 197,949 658,085 150,556 669,814 820,370 770,271
2,057,207 16,324 630,724 278,358 925,406 211,713 941,901 1,153,614 1,083,165
650,884 5,165 199,556 88,070 292,791 66,984 298,010 364,994 342,705
227,978 1,809 69,896 30,847 102,552 23,462 104,381 127,843 120,035
403,217 3,200 123,623 54,559 181,382 41,496 184,615 226,111 212,303
21,085 167 6,464 2,853 9,484 2,170 9,654 11,824 11,102
310,905 2,467 95,321 42,068 139,856 31,996 142,349 174,345 163,698
319,413 2,535 97,930 43,219 143,684 32,872 146,245 179,117 168,178
37,912 301 11,623 5,130 17,054 3,902 17,358 21,260 19,961
23,079 183 7,076 3,123 10,382 2,375 10,567 12,942 12,152
36,224 287 11,106 4,901 16,294 3,728 16,585 20,313 19,073
28,175 224 8,638 3,812 12,674 2,900 12,900 15,800 14,835
66 1 20 9 30 7 30 37 35
558 4 171 76 251 57 256 313 294
1,728 14 530 234 778 178 791 969 910
1,323 11 406 179 596 136 606 742 697
43,049 342 13,199 5,825 19,366 4,430 19,710 24,140 22,666
2,124 17 651 287 955 219 972 1,191 1,118
2,524,330 20,031 773,940 341,564 1,135,535 259,786 1,155,776 1,415,562 1,329,116
651,497 5,170 199,744 88,153 293,067 67,048 298,291 365,339 343,028
396,107 3,143 121,443 53,597 178,183 40,765 181,359 222,124 208,559
66,822 530 20,487 9,042 30,059 6,877 30,595 37,472 35,184
633,048 5,023 194,088 85,657 284,768 65,149 289,844 354,993 333,314
18,577 147 5,696 2,514 8,357 1,912 8,506 10,418 9,781
1,458,157 11,571 447,060 197,301 655,932 150,063 667,624 817,687 767,752
42,164 335 12,927 5,705 18,967 4,339 19,305 23,644 22,200
90,159 715 27,642 12,199 40,556 9,279 41,280 50,559 47,471
___________________________________________________________________________________________________19 (Continued)

___________________________________________________________________________________________________
Employer ID # Employer Name
2019 Actual Employer
Contributions
Employer Allocation
Percentage ** Net Pension
Liability (NPL)
Change in NPL due to 1%
Decrease in the Actuarial Assumed
Investment Return (6.00%)
Iowa Public Employees' Retirement System
Schedule of Employer Allocations and Collective Pension Amounts Allocated by Employer -Regular Membership Group
As of and for the year ended June 30, 2019
05303 CITY OF KIMBALLTON 5,854 0.000809% 47,182 83,781
05305 CITY OF BRAYTON 3,434 0.000475% 27,682 49,155
05306 CITY OF GRAY 272 0.000038% 2,191 3,891
05520 AUDUBON COMMUNITY SCHOOL DISTRICT 368,172 0.050906% 2,967,568 5,269,442
06001 IOWA BRAILLE AND SIGHT SAVING SCHOOL 291,082 0.040247% 2,346,196 4,166,087
06201 BENTON COUNTY 437,752 0.060526% 3,528,403 6,265,305
06203 BENTON COUNTY AGR EXT DIST 12,881 0.001781% 103,825 184,360
06208 BENTON COUNTY SOIL & WATER CONS DISTRICT 11,112 0.001536% 89,564 159,036
06301 CITY OF VINTON 186,438 0.025778% 1,502,741 2,668,382
06302 CITY OF BELLE PLAINE 40,734 0.005632% 328,324 582,997
06303 CITY OF BLAIRSTOWN 15,992 0.002211% 128,897 228,879
06306 CITY OF NEWHALL 14,418 0.001994% 116,214 206,358
06307 CITY OF VAN HORNE 17,320 0.002395% 139,604 247,892
06308 CITY OF ATKINS 27,029 0.003737% 217,862 386,852
06309 CITY OF NORWAY 9,434 0.001304% 76,043 135,028
06311 CITY OF KEYSTONE 9,891 0.001368% 79,727 141,569
06312 CITY OF GARRISON 4,120 0.000570% 33,205 58,962
06314 CITY OF SHELLSBURG 19,616 0.002712% 158,112 280,757
06315 CITY OF URBANA 23,702 0.003277% 191,046 339,236
06317 CITY OF WALFORD 12,018 0.001662% 96,869 172,009
06318 CITY OF LUZERNE 174 0.000024% 1,400 2,487
06550 VINTON-SHELLSBURG COMM SCH DIST 1,191,147 0.164695% 9,600,967 17,048,218
06551 BELLE PLAINE COMMUNITY SCHOOL DISTRICT 401,728 0.055545% 3,238,040 5,749,715
06552 BENTON COMMUNITY SCHOOL DISTRICT 1,072,539 0.148295% 8,644,957 15,350,653
07001 UNIVERSITY OF NORTHERN IOWA 2,112,407 0.292073% 17,026,573 30,233,697
07003 1ST JUDICIAL DIST DEPT CORR SERVICES 1,151,841 0.159260% 9,284,149 16,485,651
07201 BLACK HAWK COUNTY 1,797,845 0.248580% 14,491,116 25,731,544
07204 BLACK HAWK COUNTY AGRI 27,455 0.003796% 221,295 392,948
07302 CITY OF CEDAR FALLS 920,129 0.127222% 7,416,493 13,169,297
07303 CITY OF WATERLOO 1,769,401 0.244647% 14,261,854 25,324,448
07304 CITY OF GILBERTVILLE 19,997 0.002765% 161,179 286,202
07305 CITY OF HUDSON 44,718 0.006183% 360,440 640,025
07306 CITY OF DUNKERTON 19,176 0.002651% 154,564 274,455
07311 CITY OF LA PORTE CITY 48,397 0.006692% 390,093 692,679
07319 CITY OF EVANSDALE 54,741 0.007569% 441,227 783,477
07321 CITY OF ELK RUN HEIGHTS 17,144 0.002370% 138,188 245,378
07327 CITY OF RAYMOND 4,818 0.000666% 38,836 68,961
See notes to Schedules.___________________________________________________________________________________________________
20

___________________________________________________________________________________________________Schedule 1
Change in NPL due to 1%
Increase in the Actuarial Assumed
Investment Return (8.00%)
Differences Between Expected
and Actual Experience
Changes of Assumptions
Difference Between
Projected and Actual
Investment Earnings on Pension Plan Investments
Total Deferred Outflows of Resources
Differences Between Expected
and Actual Experience
Difference Between
Projected and Actual
Investment Earnings on Pension Plan Investments
Total Deferred Inflows of Resources
Total Proportionate
Share of Allocable Plan
Pension Expense
DEFERRED OUTFLOWS OF RESOURCES
(Excluding Employer Specific Amounts) * (Excluding Employer Specific Amounts) *
DEFERRED INFLOWS OF RESOURCES
16,484 131 5,054 2,230 7,415 1,696 7,547 9,243 8,679
9,671 77 2,965 1,309 4,351 995 4,428 5,423 5,092
766 6 235 104 345 79 351 430 403
1,036,781 8,227 317,869 140,285 466,381 106,698 474,695 581,393 545,888
819,692 6,504 251,311 110,911 368,726 84,357 375,299 459,656 431,586
1,232,720 9,782 377,943 166,798 554,523 126,863 564,406 691,269 649,054
36,274 288 11,121 4,908 16,317 3,733 16,608 20,341 19,099
31,291 248 9,594 4,234 14,076 3,220 14,327 17,547 16,475
525,013 4,166 160,965 71,039 236,170 54,031 240,380 294,411 276,431
114,707 910 35,168 15,521 51,599 11,805 52,519 64,324 60,396
45,033 357 13,807 6,093 20,257 4,634 20,618 25,252 23,711
40,602 322 12,448 5,494 18,264 4,178 18,590 22,768 21,378
48,774 387 14,954 6,599 21,940 5,019 22,331 27,350 25,680
76,114 604 23,336 10,299 34,239 7,833 34,849 42,682 40,076
26,567 211 8,145 3,595 11,951 2,734 12,164 14,898 13,988
27,854 221 8,540 3,769 12,530 2,867 12,753 15,620 14,666
11,601 92 3,557 1,570 5,219 1,194 5,312 6,506 6,108
55,240 438 16,936 7,474 24,848 5,685 25,292 30,977 29,085
66,746 530 20,464 9,031 30,025 6,869 30,560 37,429 35,143
33,843 269 10,376 4,579 15,224 3,483 15,495 18,978 17,819
489 4 150 66 220 50 224 274 258
3,354,295 26,617 1,028,401 453,865 1,508,883 345,201 1,535,779 1,880,980 1,766,111
1,131,276 8,977 346,840 153,071 508,888 116,423 517,960 634,383 595,642
3,020,293 23,966 925,999 408,672 1,358,637 310,828 1,382,855 1,693,683 1,590,251
5,948,582 47,202 1,823,790 804,895 2,675,887 612,187 2,723,585 3,335,772 3,132,061
3,243,608 25,738 994,465 438,888 1,459,091 333,810 1,485,100 1,818,910 1,707,831
5,062,769 40,173 1,552,206 685,037 2,277,416 521,025 2,318,011 2,839,036 2,665,660
77,314 613 23,704 10,461 34,778 7,957 35,398 43,355 40,707
2,591,104 20,561 794,413 350,599 1,165,573 266,658 1,186,348 1,453,006 1,364,274
4,982,671 39,538 1,527,649 674,199 2,241,386 512,782 2,281,338 2,794,120 2,623,487
56,311 447 17,265 7,619 25,331 5,795 25,782 31,577 29,649
125,927 999 38,608 17,039 56,646 12,960 57,656 70,616 66,303
54,000 428 16,556 7,307 24,291 5,557 24,724 30,281 28,432
136,287 1,081 41,785 18,441 61,307 14,026 62,400 76,426 71,758
154,152 1,223 47,262 20,858 69,343 15,864 70,579 86,443 81,164
48,279 383 14,802 6,533 21,718 4,969 22,105 27,074 25,420
13,568 108 4,160 1,836 6,104 1,396 6,212 7,608 7,144
___________________________________________________________________________________________________21 (Continued)

___________________________________________________________________________________________________
Employer ID # Employer Name
2019 Actual Employer
Contributions
Employer Allocation
Percentage ** Net Pension
Liability (NPL)
Change in NPL due to 1%
Decrease in the Actuarial Assumed
Investment Return (6.00%)
Iowa Public Employees' Retirement System
Schedule of Employer Allocations and Collective Pension Amounts Allocated by Employer -Regular Membership Group
As of and for the year ended June 30, 2019
07333 EVANSDALE MUNIC HOUSING AUTHORITY 8,458 0.001169% 68,174 121,056
07504 WATERLOO COMMUNITY SCHOOL DISTRICT 7,488,529 1.035406% 60,359,576 107,179,124
07538 CEDAR FALLS COMMUNITY SCHOOL DISTRICT 3,605,271 0.498485% 29,059,459 51,600,219
07539 DUNKERTON COMMUNITY SCHOOL DISTRICT 280,108 0.038729% 2,257,749 4,009,034
07542 HUDSON COMMUNITY SCHOOL DISTRICT 485,948 0.067190% 3,916,872 6,955,100
07546 HAWKEYE COMMUNITY COLLEGE 1,052,189 0.145482% 8,480,928 15,059,390
07548 UNION COMMUNITY SCHOOL DISTRICT 655,525 0.090637% 5,283,710 9,382,164
07601 IA NORTHLAND REG COUNCIL OF GOVTS 82,903 0.011463% 668,224 1,186,551
07604 CENTRAL RIVERS AREA EDUCATION AGENCY 3,300,798 0.456387% 26,605,323 47,242,466
07608 MET OF BLACK HAWK COUNTY 228,111 0.031540% 1,838,637 3,264,825
07609 REGIONAL TRANSIT COMMISSION 25,790 0.003566% 207,873 369,115
07701 WATERLOO WATER WORKS 118,084 0.016327% 951,791 1,690,073
07702 LA PORTE CITY UTILITY 34,560 0.004778% 278,559 494,631
07703 CEDAR FALLS UTILITIES 1,292,729 0.178740% 10,419,744 18,502,101
07704 EVANSDALE WATER WORKS 14,361 0.001986% 115,757 205,547
08001 STATE - WOODWARD RESOURCE CENTER 2,818,568 0.389711% 22,718,423 40,340,585
08201 BOONE COUNTY 544,503 0.075286% 4,388,839 7,793,160
08203 BOONE COUNTY AGRI 14,905 0.002061% 120,142 213,333
08204 BOONE COUNTY HOSPITAL 1,747,862 0.241669% 14,088,244 25,016,173
08301 CITY OF BOONE 209,256 0.028933% 1,686,657 2,994,958
08302 CITY OF OGDEN 24,124 0.003336% 194,449 345,279
08303 CITY OF MADRID 51,944 0.007182% 418,684 743,448
08307 CITY OF BOXHOLM 633 0.000088% 5,105 9,064
08308 CITY OF PILOT MOUND 2,117 0.000293% 17,060 30,293
08311 CITY OF BERKLEY 8 0.000001% 65 115
08312 CITY OF LUTHER 1,045 0.000144% 8,422 14,955
08313 CITY OF SHELDAHL 9,288 0.001284% 74,863 132,932
08314 CITY OF BEAVER 170 0.000023% 1,370 2,432
08537 UNITED COMMUNITY SCHOOL DISTRICT 215,937 0.029857% 1,740,513 3,090,590
08538 OGDEN COMMUNITY SCHOOL DISTRICT 436,235 0.060316% 3,516,176 6,243,594
08539 BOONE COMMUNITY SCHOOL DISTRICT 1,433,797 0.198245% 11,556,790 20,521,128
08542 MADRID COMMUNITY SCHOOL DISTRICT 409,187 0.056577% 3,298,159 5,856,466
08701 OGDEN MUNICIPAL UTILITIES 44,770 0.006190% 360,860 640,771
09201 BREMER COUNTY 577,154 0.079801% 4,652,018 8,260,482
09203 BREMER COUNTY AGRI EXTEN DISTRICT 13,518 0.001869% 108,955 193,469
09301 CITY OF DENVER 35,616 0.004925% 287,078 509,758
09302 CITY OF SUMNER 46,936 0.006490% 378,317 671,769
See notes to Schedules.___________________________________________________________________________________________________
22

___________________________________________________________________________________________________Schedule 1
Change in NPL due to 1%
Increase in the Actuarial Assumed
Investment Return (8.00%)
Differences Between Expected
and Actual Experience
Changes of Assumptions
Difference Between
Projected and Actual
Investment Earnings on Pension Plan Investments
Total Deferred Outflows of Resources
Differences Between Expected
and Actual Experience
Difference Between
Projected and Actual
Investment Earnings on Pension Plan Investments
Total Deferred Inflows of Resources
Total Proportionate
Share of Allocable Plan
Pension Expense
DEFERRED OUTFLOWS OF RESOURCES
(Excluding Employer Specific Amounts) * (Excluding Employer Specific Amounts) *
DEFERRED INFLOWS OF RESOURCES
23,818 189 7,302 3,223 10,714 2,451 10,905 13,356 12,541
21,087,855 167,333 6,465,374 2,853,371 9,486,078 2,170,216 9,655,169 11,825,385 11,103,224
10,152,518 80,561 3,112,684 1,373,724 4,566,969 1,044,826 4,648,376 5,693,202 5,345,526
788,791 6,259 241,837 106,730 354,826 81,177 361,152 442,329 415,316
1,368,440 10,859 419,553 185,162 615,574 140,830 626,546 767,376 720,514
2,962,986 23,511 908,430 400,917 1,332,858 304,929 1,356,616 1,661,545 1,560,078
1,845,973 14,648 565,961 249,776 830,385 189,975 845,187 1,035,162 971,946
233,458 1,853 71,576 31,589 105,018 24,026 106,890 130,916 122,921
9,295,115 73,757 2,849,811 1,257,710 4,181,278 956,589 4,255,810 5,212,399 4,894,084
642,365 5,097 196,944 86,918 288,959 66,108 294,110 360,218 338,220
72,625 576 22,266 9,827 32,669 7,474 33,252 40,726 38,238
332,528 2,639 101,950 44,994 149,583 34,221 152,249 186,470 175,083
97,320 772 29,838 13,168 43,778 10,016 44,559 54,575 51,241
3,640,351 28,886 1,116,104 492,571 1,637,561 374,640 1,666,751 2,041,391 1,916,726
40,442 321 12,399 5,472 18,192 4,162 18,517 22,679 21,294
7,937,147 62,982 2,433,468 1,073,965 3,570,415 816,836 3,634,058 4,450,894 4,179,084
1,533,331 12,167 470,107 207,473 689,747 157,800 702,042 859,842 807,333
41,974 333 12,869 5,679 18,881 4,320 19,218 23,538 22,100
4,922,017 39,057 1,509,053 665,992 2,214,102 506,540 2,253,567 2,760,107 2,591,551
589,268 4,676 180,665 79,733 265,074 60,643 269,799 330,442 310,263
67,935 539 20,828 9,192 30,559 6,991 31,104 38,095 35,769
146,276 1,161 44,847 19,792 65,800 15,054 66,973 82,027 77,018
1,783 14 547 241 802 184 817 1,001 939
5,960 47 1,827 806 2,680 613 2,729 3,342 3,138
23 - 7 3 10 2 10 12 12
2,943 23 902 398 1,323 303 1,347 1,650 1,549
26,155 208 8,019 3,539 11,766 2,692 11,975 14,667 13,771
478 4 147 65 216 49 219 268 252
608,084 4,825 186,434 82,279 273,538 62,580 278,414 340,994 320,170
1,228,448 9,748 376,633 166,220 552,601 126,423 562,451 688,874 646,805
4,037,601 32,039 1,237,898 546,323 1,816,260 415,522 1,848,634 2,264,156 2,125,887
1,152,280 9,143 353,280 155,913 518,336 118,585 527,576 646,161 606,701
126,074 1,000 38,653 17,059 56,712 12,975 57,723 70,698 66,381
1,625,278 12,897 498,298 219,914 731,109 167,262 744,141 911,403 855,745
38,066 302 11,671 5,151 17,124 3,917 17,429 21,346 20,042
100,297 796 30,750 13,571 45,117 10,322 45,921 56,243 52,808
132,173 1,049 40,523 17,884 59,456 13,602 60,516 74,118 69,592
___________________________________________________________________________________________________23 (Continued)

___________________________________________________________________________________________________
Employer ID # Employer Name
2019 Actual Employer
Contributions
Employer Allocation
Percentage ** Net Pension
Liability (NPL)
Change in NPL due to 1%
Decrease in the Actuarial Assumed
Investment Return (6.00%)
Iowa Public Employees' Retirement System
Schedule of Employer Allocations and Collective Pension Amounts Allocated by Employer -Regular Membership Group
As of and for the year ended June 30, 2019
09303 CITY OF WAVERLY 339,875 0.046993% 2,739,481 4,864,435
09304 CITY OF TRIPOLI 20,277 0.002804% 163,439 290,215
09305 CITY OF JANESVILLE 19,326 0.002672% 155,769 276,595
09307 CITY OF READLYN 18,230 0.002521% 146,938 260,914
09310 CITY OF FREDERIKA 1,595 0.000221% 12,856 22,829
09311 CITY OF PLAINFIELD 9,903 0.001369% 79,821 141,736
09313 WAVERLY UTILITIES 235,587 0.032574% 1,898,897 3,371,829
09315 WAVERLY LOW RENT HOUSING AGENCY 16,231 0.002244% 130,826 232,304
09318 WAVERLY HEALTH CENTER 2,306,610 0.318925% 18,591,905 33,013,222
09519 JANESVILLE CONSOLIDATED SCH DIST 261,344 0.036135% 2,106,500 3,740,463
09562 DENVER COMM SCH DIST 486,453 0.067260% 3,920,942 6,962,328
09563 TRIPOLI COMMUNITY SCHOOL DISTRICT 281,909 0.038978% 2,272,262 4,034,805
09566 WAPSIE VALLEY COMM SCH DIST 417,357 0.057706% 3,364,010 5,973,396
09568 WAVERLY SHELL ROCK COMMUNITY SCHOOL DIST 1,680,282 0.232325% 13,543,527 24,048,931
09602 NORTH IOWA JUVENILE DETENTION SVC 110,163 0.015232% 887,940 1,576,694
09701 SUMNER MUNIC LGT PLT 23,383 0.003233% 188,469 334,661
09702 TRIPOLI-READLYN SANITATION AGENCY 5,970 0.000825% 48,117 85,440
10001 STATE - DEPT OF HUMAN SERVICES/INDEPENDENCE 1,042,447 0.144135% 8,402,409 14,919,966
10004 BUCHANAN COUNTY SOIL & WATER CONSER 5,454 0.000754% 43,962 78,062
10201 BUCHANAN COUNTY 398,981 0.055165% 3,215,899 5,710,398
10203 BUCHANAN COUNTY AGRI - ISU EXT 16,039 0.002218% 129,279 229,559
10205 BUCHANAN COUNTY HEALTH CENTER 1,129,437 0.156162% 9,103,568 16,164,997
10301 CITY OF FAIRBANK 31,269 0.004323% 252,036 447,534
10302 CITY OF INDEPENDENCE 134,017 0.018530% 1,080,215 1,918,113
10303 CITY OF JESUP 37,082 0.005127% 298,888 530,729
10305 CITY OF QUASQUETON 5,029 0.000695% 40,538 71,982
10306 CITY OF LAMONT 9,794 0.001354% 78,942 140,175
10307 CITY OF BRANDON 5,739 0.000794% 46,260 82,142
10308 CITY OF HAZLETON 9,766 0.001350% 78,720 139,782
10309 CITY OF WINTHROP 11,507 0.001591% 92,747 164,689
10310 CITY OF ROWLEY 1,488 0.000206% 11,992 21,294
10311 CITY OF AURORA 2,184 0.000302% 17,604 31,259
10312 CITY OF STANLEY 718 0.000099% 5,787 10,275
10556 JESUP COMMUNITY SCHOOL DISTRICT 656,260 0.090738% 5,289,634 9,392,682
10557 EAST BUCHANAN COMMUNITY SCHOOL DISTRICT 380,418 0.052599% 3,066,274 5,444,713
10559 INDEPENDENCE COMMUNITY SCHOOL DISTRICT 957,325 0.132365% 7,716,303 13,701,663
10701 INDEPENDENCE LIGHT & POWER 76,412 0.010565% 615,899 1,093,637
See notes to Schedules.___________________________________________________________________________________________________
24

___________________________________________________________________________________________________Schedule 1
Change in NPL due to 1%
Increase in the Actuarial Assumed
Investment Return (8.00%)
Differences Between Expected
and Actual Experience
Changes of Assumptions
Difference Between
Projected and Actual
Investment Earnings on Pension Plan Investments
Total Deferred Outflows of Resources
Differences Between Expected
and Actual Experience
Difference Between
Projected and Actual
Investment Earnings on Pension Plan Investments
Total Deferred Inflows of Resources
Total Proportionate
Share of Allocable Plan
Pension Expense
DEFERRED OUTFLOWS OF RESOURCES
(Excluding Employer Specific Amounts) * (Excluding Employer Specific Amounts) *
DEFERRED INFLOWS OF RESOURCES
957,094 7,595 293,438 129,503 430,536 98,497 438,210 536,707 503,931
57,101 453 17,507 7,726 25,686 5,876 26,144 32,020 30,065
54,421 432 16,685 7,364 24,481 5,601 24,917 30,518 28,654
51,336 407 15,739 6,946 23,092 5,283 23,504 28,787 27,029
4,492 36 1,377 608 2,021 462 2,057 2,519 2,365
27,887 221 8,550 3,773 12,544 2,870 12,768 15,638 14,683
663,419 5,264 203,399 89,766 298,429 68,274 303,749 372,023 349,305
45,707 363 14,013 6,185 20,561 4,704 20,927 25,631 24,066
6,495,463 51,542 1,991,459 878,893 2,921,894 668,468 2,973,977 3,642,445 3,420,005
735,949 5,840 225,636 99,580 331,056 75,739 336,957 412,696 387,493
1,369,862 10,870 419,989 185,354 616,213 140,977 627,197 768,174 721,263
793,861 6,299 243,392 107,416 357,107 81,699 363,473 445,172 417,986
1,175,286 9,326 360,334 159,026 528,686 120,952 538,110 659,062 618,814
4,731,709 37,546 1,450,706 640,241 2,128,493 486,955 2,166,434 2,653,389 2,491,350
310,220 2,462 95,111 41,975 139,548 31,926 142,036 173,962 163,338
65,846 522 20,188 8,909 29,619 6,776 30,148 36,924 34,669
16,811 133 5,154 2,275 7,562 1,730 7,697 9,427 8,851
2,935,554 23,294 900,018 397,206 1,320,518 302,107 1,344,056 1,646,163 1,545,634
15,359 122 4,709 2,078 6,909 1,581 7,032 8,613 8,087
1,123,540 8,915 344,469 152,025 505,409 115,627 514,418 630,045 591,569
45,166 358 13,848 6,111 20,317 4,648 20,680 25,328 23,781
3,180,518 25,238 975,122 430,352 1,430,712 327,317 1,456,214 1,783,531 1,674,613
88,054 699 26,997 11,914 39,610 9,062 40,316 49,378 46,362
377,395 2,995 115,706 51,065 169,766 38,839 172,792 211,631 198,707
104,423 829 32,015 14,129 46,973 10,746 47,810 58,556 54,981
14,163 112 4,342 1,916 6,370 1,458 6,484 7,942 7,457
27,580 219 8,456 3,732 12,407 2,838 12,628 15,466 14,521
16,162 128 4,955 2,187 7,270 1,663 7,400 9,063 8,510
27,503 218 8,432 3,721 12,371 2,830 12,592 15,422 14,481
32,403 257 9,935 4,384 14,576 3,335 14,836 18,171 17,061
4,190 33 1,285 567 1,885 431 1,918 2,349 2,206
6,150 49 1,886 832 2,767 633 2,816 3,449 3,238
2,022 16 620 274 910 208 926 1,134 1,064
1,848,042 14,664 566,596 250,056 831,316 190,188 846,134 1,036,322 973,035
1,071,266 8,501 328,442 144,952 481,895 110,247 490,484 600,731 564,045
2,695,849 21,392 826,526 364,772 1,212,690 277,438 1,234,306 1,511,744 1,419,424
215,177 1,707 65,972 29,115 96,794 22,144 98,520 120,664 113,295
___________________________________________________________________________________________________25 (Continued)

___________________________________________________________________________________________________
Employer ID # Employer Name
2019 Actual Employer
Contributions
Employer Allocation
Percentage ** Net Pension
Liability (NPL)
Change in NPL due to 1%
Decrease in the Actuarial Assumed
Investment Return (6.00%)
Iowa Public Employees' Retirement System
Schedule of Employer Allocations and Collective Pension Amounts Allocated by Employer -Regular Membership Group
As of and for the year ended June 30, 2019
11201 BUENA VISTA COUNTY 503,126 0.069565% 4,055,334 7,200,964
11203 BUENA VISTA COUNTY AGRI 10,272 0.001420% 82,793 147,014
11204 BUENA VISTA REGIONAL MEDICAL CENTER 1,745,098 0.241287% 14,065,966 24,976,615
11205 BUENA VISTA COUNTY ASSESSOR 26,703 0.003692% 215,235 382,189
11207 BUENA VISTA CO SOIL & WATER CONS DT 9,051 0.001251% 72,956 129,546
11301 CITY OF SIOUX RAPIDS 13,890 0.001921% 111,957 198,800
11302 CITY OF NEWELL 19,538 0.002701% 157,479 279,631
11303 CITY OF MARATHON 10,321 0.001427% 83,188 147,715
11304 CITY OF REMBRANDT 1,631 0.000226% 13,150 23,349
11306 CITY OF ALTA 32,413 0.004482% 261,260 463,914
11307 CITY OF STORM LAKE 201,383 0.027844% 1,623,201 2,882,281
11318 CITY OF LINN GROVE 2,884 0.000399% 23,247 41,279
11319 CITY OF ALBERT CITY 13,180 0.001822% 106,231 188,632
11321 CITY OF TRUESDALE 422 0.000058% 3,405 6,046
11322 STORM LAKE CEMETERY 2,964 0.000410% 23,889 42,419
11325 CITY OF LAKESIDE 9,822 0.001358% 79,165 140,571
11527 ALTA COMMUNITY SCHOOL DISTRICT 51,738 0.007154% 417,023 740,498
11529 ALBERT CITY-TRUESDALE COMM SCH DIST 91,540 0.012657% 737,835 1,310,157
11531 STORM LAKE COMMUNITY SCHOOL DISTRICT 1,602,228 0.221533% 12,914,392 22,931,792
11535 SIOUX CENTRAL COMM SCH DIST 405,695 0.056094% 3,270,012 5,806,485
11536 NEWELL-FONDA COMM SCH DIST 379,490 0.052470% 3,058,792 5,431,427
11601 BUENA VISTA CO SOLID WASTE COMM 31,065 0.004295% 250,391 444,613
11701 ALTA MUNICIPAL ULTILITIES 49,192 0.006802% 396,500 704,056
12201 BUTLER COUNTY 398,301 0.055071% 3,210,410 5,700,652
12203 BUTLER COUNTY AGRI EXTENSION DIST 12,410 0.001716% 100,026 177,614
12206 BUTLER COUNTY SOLID WASTE COMMISSION 17,764 0.002456% 143,182 254,245
12207 BUTLER CO SOIL & WATER CONS DIST 1,460 0.000202% 11,767 20,895
12301 CITY OF GREENE 19,777 0.002734% 159,409 283,059
12302 CITY OF PARKERSBURG 28,718 0.003971% 231,476 411,026
12303 CITY OF SHELL ROCK 21,846 0.003021% 176,086 312,672
12304 CITY OF ALLISON 19,413 0.002684% 156,477 277,853
12305 CITY OF CLARKSVILLE 26,267 0.003632% 211,716 375,940
12307 CITY OF DUMONT 14,292 0.001976% 115,195 204,549
12309 GREENE PUBLIC LIBRARY 5,821 0.000805% 46,919 83,314
12310 CITY OF APLINGTON 19,008 0.002628% 153,212 272,055
12314 CITY OF NEW HARTFORD 12,482 0.001726% 100,606 178,644
12318 CITY OF AREDALE 662 0.000092% 5,338 9,479
See notes to Schedules.___________________________________________________________________________________________________
26

___________________________________________________________________________________________________Schedule 1
Change in NPL due to 1%
Increase in the Actuarial Assumed
Investment Return (8.00%)
Differences Between Expected
and Actual Experience
Changes of Assumptions
Difference Between
Projected and Actual
Investment Earnings on Pension Plan Investments
Total Deferred Outflows of Resources
Differences Between Expected
and Actual Experience
Difference Between
Projected and Actual
Investment Earnings on Pension Plan Investments
Total Deferred Inflows of Resources
Total Proportionate
Share of Allocable Plan
Pension Expense
DEFERRED OUTFLOWS OF RESOURCES
(Excluding Employer Specific Amounts) * (Excluding Employer Specific Amounts) *
DEFERRED INFLOWS OF RESOURCES
1,416,814 11,243 434,384 191,707 637,334 145,809 648,695 794,504 745,984
28,925 230 8,868 3,914 13,012 2,977 13,244 16,221 15,230
4,914,234 38,995 1,506,666 664,938 2,210,599 505,739 2,250,004 2,755,743 2,587,453
75,197 597 23,055 10,175 33,827 7,739 34,429 42,168 39,593
25,489 202 7,815 3,449 11,466 2,623 11,670 14,293 13,420
39,115 310 11,992 5,293 17,595 4,025 17,909 21,934 20,595
55,018 437 16,868 7,444 24,749 5,662 25,190 30,852 28,968
29,063 231 8,911 3,933 13,075 2,991 13,307 16,298 15,303
4,594 36 1,409 622 2,067 473 2,103 2,576 2,419
91,277 724 27,985 12,351 41,060 9,394 41,791 51,185 48,059
567,099 4,500 173,868 76,733 255,101 58,362 259,649 318,011 298,590
8,122 64 2,490 1,099 3,653 836 3,719 4,555 4,276
37,114 295 11,379 5,022 16,696 3,820 16,993 20,813 19,541
1,190 9 365 161 535 122 545 667 626
8,346 66 2,559 1,129 3,754 859 3,821 4,680 4,394
27,658 219 8,480 3,742 12,441 2,846 12,663 15,509 14,562
145,696 1,156 44,669 19,714 65,539 14,994 66,707 81,701 76,712
257,778 2,045 79,033 34,880 115,958 26,529 118,025 144,554 135,726
4,511,908 35,802 1,383,316 610,500 2,029,618 464,334 2,065,797 2,530,131 2,375,619
1,142,446 9,065 350,265 154,583 513,913 117,573 523,074 640,647 601,523
1,068,652 8,480 327,640 144,598 480,718 109,978 489,287 599,265 562,669
87,479 694 26,820 11,837 39,351 9,003 40,053 49,056 46,060
138,525 1,099 42,471 18,744 62,314 14,256 63,424 77,680 72,937
1,121,623 8,900 343,881 151,765 504,546 115,430 513,540 628,970 590,559
34,946 277 10,714 4,729 15,720 3,596 16,000 19,596 18,400
50,023 397 15,337 6,769 22,503 5,148 22,903 28,051 26,338
4,111 33 1,260 556 1,849 423 1,882 2,305 2,165
55,693 442 17,075 7,536 25,053 5,732 25,499 31,231 29,324
80,871 642 24,794 10,943 36,379 8,323 37,027 45,350 42,580
61,519 488 18,861 8,324 27,673 6,331 28,167 34,498 32,391
54,668 434 16,761 7,397 24,592 5,626 25,030 30,656 28,784
73,967 587 22,678 10,008 33,273 7,612 33,866 41,478 38,945
40,246 319 12,339 5,446 18,104 4,142 18,427 22,569 21,190
16,392 130 5,026 2,218 7,374 1,687 7,505 9,192 8,631
53,528 425 16,411 7,243 24,079 5,509 24,508 30,017 28,184
35,149 279 10,776 4,756 15,811 3,617 16,093 19,710 18,507
1,865 15 572 252 839 192 854 1,046 982
___________________________________________________________________________________________________27 (Continued)

___________________________________________________________________________________________________
Employer ID # Employer Name
2019 Actual Employer
Contributions
Employer Allocation
Percentage ** Net Pension
Liability (NPL)
Change in NPL due to 1%
Decrease in the Actuarial Assumed
Investment Return (6.00%)
Iowa Public Employees' Retirement System
Schedule of Employer Allocations and Collective Pension Amounts Allocated by Employer -Regular Membership Group
As of and for the year ended June 30, 2019
12321 CITY OF BRISTOW 1,983 0.000274% 15,984 28,383
12571 CLARKSVILLE COMMUNITY SCHOOL DISTRICT 193,999 0.026823% 1,563,681 2,776,593
13001 STATE - DEPT OF CORRECTIONS/ROCKWELL CITY 46,703 0.006457% 376,438 668,432
13201 CALHOUN COUNTY 357,792 0.049470% 2,883,897 5,120,870
13203 CALHOUN COUNTY AGRICULTURAL EXTENSION 10,464 0.001447% 84,344 149,768
13207 CALHOUN CO SOIL & WATER CONS DIST 378 0.000052% 3,044 5,404
13209 TWIN LAKES UTILITIES 8,361 0.001156% 67,391 119,665
13301 CITY OF ROCKWELL CITY 25,660 0.003548% 206,824 367,252
13302 CITY OF MANSON 21,281 0.002942% 171,530 304,582
13303 CITY OF LAKE CITY 27,179 0.003758% 219,066 388,991
13304 CITY OF LOHRVILLE 11,015 0.001523% 88,780 157,644
13307 CITY OF POMEROY 11,523 0.001593% 92,879 164,924
13309 CITY OF FARNHAMVILLE 7,264 0.001004% 58,550 103,965
13310 CITY OF SOMERS 2,368 0.000327% 19,089 33,897
13311 CITY OF JOLLEY 579 0.000080% 4,666 8,286
13312 CITY OF KNIERIM 752 0.000104% 6,059 10,758
13313 CITY OF RINARD 363 0.000050% 2,929 5,202
13314 CITY OF YETTER 1,225 0.000169% 9,876 17,537
13537 MANSON NORTHWEST WEBSTER COMM SCHOOL DIS 533,088 0.073708% 4,296,834 7,629,790
14201 CARROLL COUNTY 400,245 0.055340% 3,226,081 5,728,478
14203 CARROLL COUNTY AGRICULTURAL EXTENSION 13,424 0.001856% 108,198 192,125
14206 CARROLL CO SOLID WASTE MGMT COMM 46,387 0.006414% 373,894 663,915
14301 CITY OF DEDHAM 1,359 0.000188% 10,957 19,456
14302 CITY OF CARROLL 275,285 0.038062% 2,218,873 3,940,003
14303 CITY OF TEMPLETON 10,168 0.001406% 81,954 145,524
14304 CITY OF LIDDERDALE 2,775 0.000384% 22,370 39,722
14305 CITY OF BREDA 13,348 0.001846% 107,586 191,038
14308 CITY OF MANNING 41,905 0.005794% 337,766 599,763
14309 CITY OF COON RAPIDS 22,259 0.003078% 179,410 318,574
14310 CITY OF HALBUR 1,822 0.000252% 14,689 26,084
14311 CITY OF GLIDDEN 25,981 0.003592% 209,410 371,845
14312 CITY OF ARCADIA 7,675 0.001061% 61,865 109,852
14314 CITY OF WILLEY 1 0.000000% 9 16
14315 CITY OF RALSTON 1,057 0.000146% 8,522 15,132
14316 CITY OF LANESBORO 1,121 0.000155% 9,038 16,049
14317 THOMAS REST HAVEN 146,310 0.020230% 1,179,301 2,094,059
14318 MANNING MUNICIPAL HOUSING AGENCY 7,374 0.001020% 59,439 105,545
See notes to Schedules.___________________________________________________________________________________________________
28

___________________________________________________________________________________________________Schedule 1
Change in NPL due to 1%
Increase in the Actuarial Assumed
Investment Return (8.00%)
Differences Between Expected
and Actual Experience
Changes of Assumptions
Difference Between
Projected and Actual
Investment Earnings on Pension Plan Investments
Total Deferred Outflows of Resources
Differences Between Expected
and Actual Experience
Difference Between
Projected and Actual
Investment Earnings on Pension Plan Investments
Total Deferred Inflows of Resources
Total Proportionate
Share of Allocable Plan
Pension Expense
DEFERRED OUTFLOWS OF RESOURCES
(Excluding Employer Specific Amounts) * (Excluding Employer Specific Amounts) *
DEFERRED INFLOWS OF RESOURCES
5,584 44 1,712 756 2,512 575 2,557 3,132 2,940
546,304 4,335 167,493 73,920 245,748 56,222 250,128 306,350 287,641
131,516 1,044 40,322 17,795 59,161 13,535 60,215 73,750 69,246
1,007,549 7,995 308,907 136,330 453,232 103,690 461,311 565,001 530,497
29,467 234 9,034 3,987 13,255 3,033 13,492 16,525 15,515
1,063 8 326 144 478 109 487 596 560
23,544 187 7,219 3,186 10,592 2,423 10,780 13,203 12,397
72,258 573 22,154 9,777 32,504 7,436 33,084 40,520 38,045
59,927 476 18,373 8,109 26,958 6,167 27,438 33,605 31,553
76,535 607 23,465 10,356 34,428 7,876 35,042 42,918 40,298
31,017 246 9,510 4,197 13,953 3,192 14,201 17,393 16,331
32,449 257 9,949 4,391 14,597 3,339 14,857 18,196 17,085
20,455 162 6,271 2,768 9,201 2,105 9,366 11,471 10,770
6,669 53 2,045 902 3,000 686 3,054 3,740 3,512
1,630 13 500 221 734 168 746 914 858
2,117 17 649 286 952 218 969 1,187 1,114
1,023 8 314 138 460 105 469 574 539
3,451 27 1,058 467 1,552 355 1,580 1,935 1,817
1,501,187 11,912 460,252 203,124 675,288 154,492 687,325 841,817 790,408
1,127,097 8,944 345,559 152,506 507,009 115,993 516,047 632,040 593,442
37,801 300 11,590 5,115 17,005 3,890 17,307 21,197 19,903
130,628 1,037 40,049 17,675 58,761 13,443 59,808 73,251 68,778
3,828 30 1,174 518 1,722 394 1,753 2,147 2,016
775,209 6,151 237,673 104,892 348,716 79,779 354,933 434,712 408,165
28,632 227 8,778 3,874 12,879 2,947 13,109 16,056 15,076
7,815 62 2,396 1,058 3,516 804 3,578 4,382 4,115
37,587 298 11,524 5,086 16,908 3,868 17,210 21,078 19,791
118,005 936 36,180 15,967 53,083 12,144 54,029 66,173 62,132
62,681 497 19,217 8,481 28,195 6,451 28,699 35,150 33,003
5,132 41 1,573 694 2,308 528 2,350 2,878 2,702
73,162 581 22,431 9,899 32,911 7,529 33,497 41,026 38,521
21,614 172 6,627 2,925 9,724 2,224 9,896 12,120 11,380
3 - 1 - 1 1 1 2 2
2,977 24 913 403 1,340 306 1,363 1,669 1,568
3,158 25 968 427 1,420 325 1,446 1,771 1,663
412,013 3,269 126,320 55,749 185,338 42,402 188,642 231,044 216,934
20,766 165 6,367 2,810 9,342 2,137 9,508 11,645 10,934
___________________________________________________________________________________________________29 (Continued)

___________________________________________________________________________________________________
Employer ID # Employer Name
2019 Actual Employer
Contributions
Employer Allocation
Percentage ** Net Pension
Liability (NPL)
Change in NPL due to 1%
Decrease in the Actuarial Assumed
Investment Return (6.00%)
Iowa Public Employees' Retirement System
Schedule of Employer Allocations and Collective Pension Amounts Allocated by Employer -Regular Membership Group
As of and for the year ended June 30, 2019
14401 UNION TOWNSHIP - CARROLL COUNTY 2,272 0.000314% 18,309 32,511
14510 CARROLL COMMUNITY SCHOOL DISTRICT 1,081,187 0.149491% 8,714,656 15,474,417
14534 COON RAPIDS-BAYARD COMMUNITY SCHOOL DIST 265,679 0.036734% 2,141,445 3,802,514
14535 GLIDDEN RALSTON COMMUNITY SCHOOL DISTRIC 244,399 0.033792% 1,969,926 3,497,952
14601 REGION XII COUNCIL OF GOVT 179,021 0.024752% 1,442,958 2,562,227
14603 REGION XII REGIONAL HOUSING AUTH 26,913 0.003721% 216,927 385,193
14701 COON RAPIDS MUNICIPAL UTILITIES 76,203 0.010536% 614,219 1,090,654
14702 MANNING MUN LIGHT PLT 15,757 0.002179% 127,004 225,519
14703 MANNING MUNICIPAL GAS DEPARTMENT 21,288 0.002943% 171,591 304,690
14704 CARROLL SOIL & WATER CONSERV. DIST. 4 0.000001% 30 53
15201 CASS COUNTY 348,988 0.048253% 2,812,934 4,994,863
15203 CASS COUNTY AGRI 11,955 0.001653% 96,358 171,100
15205 CASS COUNTY MEMORIAL HOSPITAL 2,010,606 0.277998% 16,206,031 28,776,680
15301 CITY OF WIOTA 1,020 0.000141% 8,218 14,592
15302 CITY OF ATLANTIC 123,909 0.017132% 998,740 1,773,440
15303 CITY OF MARNE 755 0.000104% 6,087 10,808
15305 CITY OF ANITA 16,269 0.002249% 131,132 232,847
15306 CITY OF GRISWOLD 21,158 0.002925% 170,541 302,826
15309 CITY OF LEWIS 10,637 0.001471% 85,735 152,238
15310 CITY OF CUMBERLAND 7,770 0.001074% 62,625 111,201
15311 CITY OF MASSENA 11,707 0.001619% 94,366 167,563
15542 ATLANTIC COMMUNITY SCHOOL DISTRICT #2 1,055,982 0.146006% 8,511,501 15,113,679
15543 GRISWOLD COMM SCH DIST NO 4 354,802 0.049057% 2,859,799 5,078,079
15601 SOUTHWEST IOWA PLANNING COUNCIL 229,327 0.031708% 1,848,436 3,282,225
15701 ATLANTIC LIGHT & WATER DEPT 186,503 0.025787% 1,503,262 2,669,308
15702 ANITA MUNICIPAL UTILITIES 18,626 0.002575% 150,129 266,581
16201 CEDAR COUNTY 439,846 0.060816% 3,545,275 6,295,264
16203 CEDAR COUNTY AGRICULTURAL EXT OFFICE 13,453 0.001860% 108,432 192,540
16301 CITY OF BENNETT 6,871 0.000950% 55,382 98,340
16302 CITY OF STANWOOD 11,780 0.001629% 94,950 168,601
16303 CITY OF TIPTON 141,866 0.019615% 1,143,480 2,030,451
16304 CITY OF WEST BRANCH 63,483 0.008777% 511,687 908,592
16305 CITY OF DURANT 35,429 0.004899% 285,571 507,081
16306 CITY OF MECHANICSVILLE 17,572 0.002430% 141,633 251,495
16307 CITY OF CLARENCE 16,650 0.002302% 134,205 238,305
16308 CITY OF LOWDEN 12,776 0.001767% 102,979 182,858
16542 TIPTON COMM SCH DIST 576,155 0.079662% 4,643,969 8,246,189
See notes to Schedules.___________________________________________________________________________________________________
30

___________________________________________________________________________________________________Schedule 1
Change in NPL due to 1%
Increase in the Actuarial Assumed
Investment Return (8.00%)
Differences Between Expected
and Actual Experience
Changes of Assumptions
Difference Between
Projected and Actual
Investment Earnings on Pension Plan Investments
Total Deferred Outflows of Resources
Differences Between Expected
and Actual Experience
Difference Between
Projected and Actual
Investment Earnings on Pension Plan Investments
Total Deferred Inflows of Resources
Total Proportionate
Share of Allocable Plan
Pension Expense
DEFERRED OUTFLOWS OF RESOURCES
(Excluding Employer Specific Amounts) * (Excluding Employer Specific Amounts) *
DEFERRED INFLOWS OF RESOURCES
6,397 51 1,961 866 2,878 658 2,929 3,587 3,368
3,044,644 24,159 933,464 411,967 1,369,590 313,334 1,394,004 1,707,338 1,603,073
748,158 5,937 229,379 101,232 336,548 76,995 342,547 419,542 393,922
688,234 5,461 211,007 93,124 309,592 70,828 315,111 385,939 362,370
504,127 4,000 154,561 68,213 226,774 51,881 230,817 282,698 265,434
75,788 601 23,236 10,255 34,092 7,800 34,700 42,500 39,904
214,590 1,703 65,792 29,036 96,531 22,084 98,251 120,335 112,986
44,372 352 13,604 6,004 19,960 4,566 20,316 24,882 23,363
59,949 476 18,380 8,112 26,968 6,170 27,448 33,618 31,564
10 - 3 1 4 1 5 6 5
982,756 7,798 301,305 132,975 442,078 101,138 449,959 551,097 517,443
33,665 267 10,321 4,555 15,143 3,465 15,413 18,878 17,725
5,661,909 44,928 1,735,898 766,105 2,546,931 582,684 2,592,330 3,175,014 2,981,121
2,871 23 880 388 1,291 295 1,314 1,609 1,512
348,930 2,769 106,979 47,213 156,961 35,909 159,759 195,668 183,720
2,127 17 652 288 957 219 974 1,193 1,120
45,813 364 14,046 6,199 20,609 4,715 20,976 25,691 24,122
59,582 473 18,267 8,062 26,802 6,132 27,280 33,412 31,371
29,953 238 9,183 4,053 13,474 3,083 13,714 16,797 15,771
21,879 174 6,708 2,960 9,842 2,252 10,018 12,270 11,520
32,969 262 10,108 4,461 14,831 3,393 15,095 18,488 17,359
2,973,667 23,596 911,704 402,363 1,337,663 306,029 1,361,507 1,667,536 1,565,702
999,129 7,928 306,325 135,191 449,444 102,823 457,456 560,279 526,064
645,789 5,124 197,994 87,381 290,499 66,460 295,677 362,137 340,022
525,195 4,167 161,021 71,063 236,251 54,049 240,463 294,512 276,527
52,451 416 16,081 7,097 23,594 5,398 24,015 29,413 27,616
1,238,614 9,828 379,750 167,595 557,173 127,470 567,105 694,575 652,158
37,883 301 11,615 5,126 17,042 3,899 17,345 21,244 19,946
19,349 154 5,932 2,618 8,704 1,991 8,859 10,850 10,188
33,173 263 10,171 4,489 14,923 3,414 15,188 18,602 17,466
399,498 3,170 122,483 54,056 179,709 41,114 182,912 224,026 210,345
178,769 1,419 54,809 24,189 80,417 18,398 81,850 100,248 94,126
99,770 792 30,589 13,500 44,881 10,268 45,680 55,948 52,531
49,482 393 15,171 6,695 22,259 5,092 22,656 27,748 26,054
46,887 372 14,375 6,344 21,091 4,825 21,468 26,293 24,687
35,978 285 11,031 4,868 16,184 3,703 16,473 20,176 18,943
1,622,466 12,874 497,436 219,534 729,844 166,973 742,853 909,826 854,264
___________________________________________________________________________________________________31 (Continued)

___________________________________________________________________________________________________
Employer ID # Employer Name
2019 Actual Employer
Contributions
Employer Allocation
Percentage ** Net Pension
Liability (NPL)
Change in NPL due to 1%
Decrease in the Actuarial Assumed
Investment Return (6.00%)
Iowa Public Employees' Retirement System
Schedule of Employer Allocations and Collective Pension Amounts Allocated by Employer -Regular Membership Group
As of and for the year ended June 30, 2019
16544 WEST BRANCH COMMUNITY SCHOOL DISTRICT 569,314 0.078716% 4,588,822 8,148,266
16545 BENNETT COMM SCH DIST 75,600 0.010453% 609,353 1,082,014
16547 DURANT COMMUNITY SCHOOL DISTRICT 431,269 0.059630% 3,476,144 6,172,510
16548 NORTH CEDAR COMMUNITY SCHOOL DISTRICT 492,175 0.068051% 3,967,065 7,044,228
16701 DURANT MUNIC ELEC PLT 29,225 0.004041% 235,562 418,283
17201 CERRO GORDO COUNTY 954,331 0.131951% 7,692,170 13,658,811
17203 CERRO GORDO CO AGRI EXT 14,846 0.002053% 119,659 212,476
17204 CERRO GORDO CO. ASSESSOR 26,544 0.003670% 213,952 379,909
17205 CERRO GORDO CITY ASSESSORS OFFICE 22,767 0.003148% 183,511 325,856
17206 CERRO GORDO COUNTY MUNIC EMERG MANA 6,135 0.000848% 49,452 87,811
17301 CITY OF PLYMOUTH 7,590 0.001049% 61,179 108,633
17302 CITY OF MASON CITY 856,767 0.118461% 6,905,777 12,262,431
17303 CITY OF CLEAR LAKE 190,952 0.026402% 1,539,125 2,732,988
17305 CITY OF THORNTON 10,468 0.001447% 84,371 149,816
17306 CITY OF MESERVEY 1,786 0.000247% 14,398 25,566
17308 CITY OF ROCKWELL 12,303 0.001701% 99,163 176,082
17310 CITY OF DOUGHERTY 620 0.000086% 4,995 8,870
17312 CLEAR LAKE SANITARY DISTRICT 54,943 0.007597% 442,857 786,370
17313 CITY OF ROCK FALLS 868 0.000120% 6,993 12,417
17315 ROCKWELL PUB LIBRARY 3,719 0.000514% 29,978 53,230
17316 CITY OF VENTURA 19,257 0.002663% 155,213 275,609
17318 MESERVEY PUB LIBRARY 1,513 0.000209% 12,199 21,661
17320 CITY OF SWALEDALE 4,864 0.000673% 39,204 69,613
17326 SWALEDALE PUBLIC LIBRARY 941 0.000130% 7,585 13,468
17516 MASON CITY COMMUNITY SCHOOL DISTRICT 2,874,497 0.397444% 23,169,227 41,141,068
17552 CLEAR LAKE COMMUNITY SCHOOL DISTRICT 860,134 0.118927% 6,932,914 12,310,617
17556 NORTH IOWA AREA COMMUNITY COLLEGE 750,023 0.103702% 6,045,392 10,734,665
17602 NORTH IA AREA COUNCIL OF GOV'TS 120,501 0.016661% 971,271 1,724,663
17606 NORTH IOWA REGIONAL HOUSING AUTHORI 25,300 0.003498% 203,928 362,110
17607 LANDFILL OF NORTH IOWA 72,409 0.010012% 583,639 1,036,354
17608 ELDERBRIDGE AGENCY ON AGING 137,634 0.019030% 1,109,366 1,969,876
18001 STATE - DEPT OF HUMAN SERVICES/CHEROKEE 800,018 0.110615% 6,448,360 11,450,205
18201 CHEROKEE COUNTY 322,166 0.044544% 2,596,742 4,610,976
18203 CHEROKEE COUNTY AGRI EXTENSION DISTRICT 12,376 0.001711% 99,756 177,134
18207 CHEROKEE COUNTY SOLID WASTE COMMISSION 18,937 0.002618% 152,638 271,035
18301 CITY OF CLEGHORN 3,058 0.000423% 24,649 43,768
18302 CITY OF CHEROKEE 111,553 0.015424% 899,144 1,596,589
See notes to Schedules.___________________________________________________________________________________________________
32

___________________________________________________________________________________________________Schedule 1
Change in NPL due to 1%
Increase in the Actuarial Assumed
Investment Return (8.00%)
Differences Between Expected
and Actual Experience
Changes of Assumptions
Difference Between
Projected and Actual
Investment Earnings on Pension Plan Investments
Total Deferred Outflows of Resources
Differences Between Expected
and Actual Experience
Difference Between
Projected and Actual
Investment Earnings on Pension Plan Investments
Total Deferred Inflows of Resources
Total Proportionate
Share of Allocable Plan
Pension Expense
DEFERRED OUTFLOWS OF RESOURCES
(Excluding Employer Specific Amounts) * (Excluding Employer Specific Amounts) *
DEFERRED INFLOWS OF RESOURCES
1,603,199 12,721 491,529 216,927 721,177 164,990 734,032 899,022 844,120
212,890 1,689 65,270 28,806 95,765 21,909 97,473 119,382 112,091
1,214,462 9,637 372,345 164,327 546,309 124,984 556,047 681,031 639,441
1,385,976 10,998 424,929 187,535 623,462 142,635 634,575 777,210 729,747
82,299 653 25,232 11,136 37,021 8,470 37,681 46,151 43,332
2,687,417 21,325 823,942 363,631 1,208,898 276,570 1,230,446 1,507,016 1,414,985
41,805 332 12,817 5,657 18,806 4,302 19,141 23,443 22,011
74,748 593 22,917 10,114 33,624 7,693 34,224 41,917 39,357
64,113 509 19,657 8,675 28,841 6,598 29,355 35,953 33,757
17,277 137 5,297 2,338 7,772 1,778 7,910 9,688 9,097
21,374 170 6,553 2,892 9,615 2,200 9,786 11,986 11,254
2,412,675 19,145 739,708 326,456 1,085,309 248,296 1,104,654 1,352,950 1,270,327
537,725 4,267 164,862 72,759 241,888 55,339 246,200 301,539 283,124
29,477 234 9,037 3,988 13,259 3,034 13,496 16,530 15,520
5,030 40 1,542 681 2,263 518 2,303 2,821 2,648
34,645 275 10,622 4,688 15,585 3,565 15,862 19,427 18,241
1,745 14 535 236 785 180 799 979 919
154,721 1,228 47,436 20,935 69,599 15,923 70,840 86,763 81,464
2,443 19 749 331 1,099 251 1,119 1,370 1,286
10,473 83 3,211 1,417 4,711 1,078 4,795 5,873 5,514
54,227 430 16,626 7,337 24,393 5,581 24,828 30,409 28,552
4,262 34 1,307 577 1,918 439 1,951 2,390 2,244
13,697 109 4,199 1,853 6,161 1,410 6,271 7,681 7,212
2,650 21 812 359 1,192 273 1,213 1,486 1,395
8,094,644 64,232 2,481,756 1,095,276 3,641,264 833,044 3,706,169 4,539,213 4,262,010
2,422,156 19,220 742,614 327,739 1,089,573 249,271 1,108,995 1,358,266 1,275,319
2,112,082 16,760 647,548 285,783 950,091 217,361 967,026 1,184,387 1,112,058
339,333 2,693 104,037 45,915 152,645 34,922 155,365 190,287 178,667
71,246 565 21,844 9,640 32,049 7,332 32,620 39,952 37,513
203,906 1,618 62,516 27,590 91,724 20,985 93,359 114,344 107,361
387,580 3,075 118,829 52,443 174,347 39,887 177,455 217,342 204,069
2,252,867 17,877 690,712 304,832 1,013,421 231,849 1,031,485 1,263,334 1,186,184
907,225 7,199 278,148 122,755 408,102 93,365 415,377 508,742 477,674
34,852 277 10,685 4,716 15,678 3,587 15,957 19,544 18,350
53,327 423 16,350 7,216 23,989 5,488 24,416 29,904 28,078
8,612 68 2,640 1,165 3,873 886 3,943 4,829 4,534
314,134 2,493 96,311 42,505 141,309 32,329 143,828 176,157 165,399
___________________________________________________________________________________________________33 (Continued)

___________________________________________________________________________________________________
Employer ID # Employer Name
2019 Actual Employer
Contributions
Employer Allocation
Percentage ** Net Pension
Liability (NPL)
Change in NPL due to 1%
Decrease in the Actuarial Assumed
Investment Return (6.00%)
Iowa Public Employees' Retirement System
Schedule of Employer Allocations and Collective Pension Amounts Allocated by Employer -Regular Membership Group
As of and for the year ended June 30, 2019
18303 CITY OF WASHTA 3,955 0.000547% 31,878 56,605
18305 CITY OF MERIDEN 1,813 0.000251% 14,611 25,944
18306 CITY OF MARCUS 18,247 0.002523% 147,075 261,158
18308 CITY OF LARRABEE 1,921 0.000266% 15,484 27,494
18309 CITY OF AURELIA 28,424 0.003930% 229,102 406,812
18310 CITY OF QUIMBY 5,134 0.000710% 41,380 73,477
18507 CHEROKEE COMMUNITY SCHOOL DISTRICT 652,671 0.090242% 5,260,707 9,341,318
18526 AURELIA COMMUNITY SCHOOL DISTRICT 20,584 0.002846% 165,913 294,608
18528 MARCUS-MERIDEN-CLEGHORN COMM SCH DIST 246,530 0.034087% 1,987,097 3,528,443
18601 NORTHWEST IOWA MULTICOUNTY JUVENILE 39,013 0.005394% 314,458 558,376
19201 CHICKASAW COUNTY 339,458 0.046935% 2,736,127 4,858,478
19203 CHICKASAW COUNTY AGRI 10,470 0.001448% 84,392 149,854
19206 CHICKASAW CO SOIL & WATER CONS DIST 629 0.000087% 5,066 8,996
19301 CITY OF FREDERICKSBURG 26,002 0.003595% 209,586 372,157
19302 CITY OF LAWLER 9,098 0.001258% 73,336 130,221
19303 CITY OF NASHUA 19,846 0.002744% 159,967 284,050
19304 CITY OF NEW HAMPTON 126,821 0.017535% 1,022,215 1,815,124
19306 CITY OF ALTA VISTA 7,432 0.001028% 59,901 106,364
19308 CITY OF NORTH WASHINGTON 189 0.000026% 1,522 2,702
19309 CITY OF BASSETT 380 0.000053% 3,067 5,446
19311 CITY OF IONIA 5,003 0.000692% 40,326 71,606
19579 NASHUA-PLAINFIELD COMM SCHOOL DISTRICT 431,174 0.059616% 3,475,377 6,171,148
19581 NEW HAMPTON COMMUNITY SCHOOL DISTRICT 735,715 0.101724% 5,930,066 10,529,883
20201 CLARKE COUNTY 252,306 0.034885% 2,033,654 3,611,112
20203 CLARKE COUNTY AGRI EXT DIST 10,757 0.001487% 86,702 153,956
20204 CLARKE COUNTY HOSPITAL 655,300 0.090605% 5,281,897 9,378,944
20301 CITY OF OSCEOLA 105,823 0.014632% 852,964 1,514,590
20302 CITY OF MURRAY 12,744 0.001762% 102,723 182,402
20303 CITY OF WOODBURN 647 0.000089% 5,216 9,262
20306 CITY OF WELDON 929 0.000128% 7,487 13,295
20536 MURRAY COMM SCH DIST 198,304 0.027419% 1,598,380 2,838,208
20539 CLARKE COMMUNITY SCHOOL DISTRICT 934,379 0.129192% 7,531,350 13,373,246
21201 CLAY COUNTY 374,697 0.051808% 3,020,156 5,362,822
21203 CLAY COUNTY AG EXTENSION SERVICE 13,713 0.001896% 110,533 196,271
21207 IOWA LAKES REGIONAL WATER 145,087 0.020061% 1,169,439 2,076,547
21208 CLAY CO SOIL & WATER CONS DIST 58 0.000008% 469 832
21301 CITY OF EVERLY 25,562 0.003534% 206,038 365,856
See notes to Schedules.___________________________________________________________________________________________________
34

___________________________________________________________________________________________________Schedule 1
Change in NPL due to 1%
Increase in the Actuarial Assumed
Investment Return (8.00%)
Differences Between Expected
and Actual Experience
Changes of Assumptions
Difference Between
Projected and Actual
Investment Earnings on Pension Plan Investments
Total Deferred Outflows of Resources
Differences Between Expected
and Actual Experience
Difference Between
Projected and Actual
Investment Earnings on Pension Plan Investments
Total Deferred Inflows of Resources
Total Proportionate
Share of Allocable Plan
Pension Expense
DEFERRED OUTFLOWS OF RESOURCES
(Excluding Employer Specific Amounts) * (Excluding Employer Specific Amounts) *
DEFERRED INFLOWS OF RESOURCES
11,137 88 3,415 1,507 5,010 1,146 5,099 6,245 5,864
5,104 41 1,565 691 2,297 525 2,337 2,862 2,688
51,384 408 15,754 6,953 23,115 5,288 23,526 28,814 27,055
5,410 43 1,659 732 2,434 557 2,477 3,034 2,848
80,042 635 24,540 10,830 36,005 8,237 36,647 44,884 42,144
14,457 115 4,432 1,956 6,503 1,488 6,619 8,107 7,612
1,837,936 14,584 563,497 248,689 826,770 189,148 841,507 1,030,655 967,714
57,965 460 17,772 7,843 26,075 5,965 26,540 32,505 30,520
694,233 5,509 212,847 93,936 312,292 71,446 317,858 389,304 365,529
109,862 872 33,683 14,865 49,420 11,306 50,301 61,607 57,845
955,922 7,585 293,078 129,345 430,008 98,377 437,673 536,050 503,314
29,484 234 9,040 3,989 13,263 3,034 13,499 16,533 15,524
1,770 14 543 240 797 182 810 992 932
73,223 581 22,450 9,908 32,939 7,536 33,526 41,062 38,554
25,621 203 7,855 3,467 11,525 2,637 11,731 14,368 13,490
55,888 443 17,135 7,562 25,140 5,752 25,588 31,340 29,426
357,132 2,834 109,494 48,323 160,651 36,754 163,514 200,268 188,038
20,928 166 6,416 2,832 9,414 2,154 9,582 11,736 11,019
532 4 163 72 239 55 243 298 280
1,071 9 328 145 482 110 491 601 564
14,089 112 4,319 1,906 6,337 1,450 6,451 7,901 7,418
1,214,194 9,635 372,263 164,291 546,189 124,956 555,924 680,880 639,300
2,071,790 16,440 635,195 280,331 931,966 213,214 948,578 1,161,792 1,090,844
710,499 5,638 217,833 96,137 319,608 73,120 325,305 398,425 374,093
30,291 240 9,287 4,099 13,626 3,117 13,869 16,986 15,949
1,845,339 14,643 565,767 249,690 830,100 189,909 844,897 1,034,806 971,612
298,001 2,365 91,365 40,322 134,052 30,668 136,441 167,109 156,904
35,888 285 11,003 4,856 16,144 3,693 16,432 20,125 18,896
1,822 14 559 247 820 188 834 1,022 959
2,616 21 802 354 1,177 269 1,198 1,467 1,377
558,427 4,431 171,209 75,560 251,200 57,469 255,678 313,147 294,024
2,631,231 20,879 806,715 356,028 1,183,622 270,788 1,204,721 1,475,509 1,385,402
1,055,153 8,373 323,502 142,771 474,646 108,589 483,107 591,696 555,562
38,617 306 11,840 5,225 17,371 3,974 17,681 21,655 20,333
408,568 3,242 125,264 55,283 183,789 42,047 187,065 229,112 215,120
164 1 50 22 73 17 75 92 86
71,983 571 22,070 9,740 32,381 7,408 32,958 40,366 37,901
___________________________________________________________________________________________________35 (Continued)

___________________________________________________________________________________________________
Employer ID # Employer Name
2019 Actual Employer
Contributions
Employer Allocation
Percentage ** Net Pension
Liability (NPL)
Change in NPL due to 1%
Decrease in the Actuarial Assumed
Investment Return (6.00%)
Iowa Public Employees' Retirement System
Schedule of Employer Allocations and Collective Pension Amounts Allocated by Employer -Regular Membership Group
As of and for the year ended June 30, 2019
21302 SPENCER HOSPITAL 2,243,873 0.310250% 18,086,221 32,115,290
21303 CITY OF SPENCER 316,415 0.043749% 2,550,387 4,528,664
21304 CITY OF ROYAL 6,411 0.000886% 51,677 91,762
21307 CITY OF PETERSON 10,660 0.001474% 85,924 152,572
21308 CITY OF WEBB 1,430 0.000198% 11,528 20,470
21309 CITY OF DICKENS 2,062 0.000285% 16,620 29,512
21310 CITY OF FOSTORIA 2,090 0.000289% 16,849 29,918
21312 WEBB PUBLIC LIBRARY 455 0.000063% 3,666 6,509
21313 CITY OF GREENVILLE 73 0.000010% 586 1,040
21314 CITY OF ROSSIE 150 0.000021% 1,210 2,148
21529 SPENCER COMMUNITY SCHOOL DISTRICT 1,261,678 0.174447% 10,169,466 18,057,688
21531 CLAY CENTRAL-EVERLY COMM SCHOOL DISTRICT 211,428 0.029233% 1,704,165 3,026,047
21602 NORTHWEST IA PLAN & DEVELOPMENT 76,015 0.010510% 612,701 1,087,959
21603 NORTHWEST REGIONAL HOUSING AUTHORITY 23,117 0.003196% 186,332 330,866
21701 SPENCER MUNICIPAL UTILITIES 297,203 0.041093% 2,395,540 4,253,706
22201 CLAYTON COUNTY 364,746 0.050432% 2,939,950 5,220,401
22203 CLAYTON CO AGRICUL EXTENSION DISTRI 12,542 0.001734% 101,089 179,502
22207 CLAYTON CO SOIL & WATER CONS DIST 1,025 0.000142% 8,263 14,673
22301 CITY OF FARMERSBURG 4,682 0.000647% 37,741 67,016
22302 CITY OF GUTTENBERG 58,948 0.008150% 475,137 843,689
22303 CITY OF STRAWBERRY POINT 21,235 0.002936% 171,163 303,931
22305 CITY OF LUANA 7,457 0.001031% 60,102 106,722
22306 CITY OF ELKADER 31,799 0.004397% 256,305 455,115
22308 CITY OF MONONA 29,830 0.004124% 240,440 426,943
22309 CITY OF MCGREGOR 22,974 0.003177% 185,180 328,820
22311 CITY OF GARNAVILLO 14,436 0.001996% 116,356 206,611
22312 CITY OF MARQUETTE 19,029 0.002631% 153,376 272,346
22313 CITY OF VOLGA 6,010 0.000831% 48,442 86,017
22316 CITY OF ST OLAF 1,601 0.000221% 12,901 22,908
22319 CITY OF OSTERDOCK 33 0.000005% 270 479
22320 CITY OF ELKPORT 98 0.000014% 788 1,399
22323 CITY OF NORTH BUENA VISTA 316 0.000044% 2,549 4,526
22324 GUTTENBERG MUNIC HOSP 688,500 0.095196% 5,549,498 9,854,117
22327 CITY OF CLAYTON 1,630 0.000225% 13,135 23,324
22329 CITY OF GARBER 501 0.000069% 4,035 7,164
22402 CASS TOWNSHIP - CLAYTON COUNTY 566 0.000078% 4,565 8,107
22559 M F L MARMAC COMMUNITY SCHOOL DISTRICT 535,740 0.074074% 4,318,209 7,667,745
See notes to Schedules.___________________________________________________________________________________________________
36

___________________________________________________________________________________________________Schedule 1
Change in NPL due to 1%
Increase in the Actuarial Assumed
Investment Return (8.00%)
Differences Between Expected
and Actual Experience
Changes of Assumptions
Difference Between
Projected and Actual
Investment Earnings on Pension Plan Investments
Total Deferred Outflows of Resources
Differences Between Expected
and Actual Experience
Difference Between
Projected and Actual
Investment Earnings on Pension Plan Investments
Total Deferred Inflows of Resources
Total Proportionate
Share of Allocable Plan
Pension Expense
DEFERRED OUTFLOWS OF RESOURCES
(Excluding Employer Specific Amounts) * (Excluding Employer Specific Amounts) *
DEFERRED INFLOWS OF RESOURCES
6,318,792 50,140 1,937,293 854,987 2,842,420 650,286 2,893,087 3,543,373 3,326,984
891,030 7,070 273,183 120,564 400,817 91,699 407,962 499,661 469,147
18,055 143 5,535 2,443 8,121 1,858 8,266 10,124 9,506
30,019 238 9,204 4,062 13,504 3,089 13,744 16,833 15,806
4,028 32 1,235 545 1,812 414 1,844 2,258 2,121
5,807 46 1,780 786 2,612 598 2,659 3,257 3,057
5,886 47 1,805 796 2,648 606 2,695 3,301 3,099
1,281 10 393 173 576 132 586 718 674
205 2 63 28 93 21 94 115 108
423 3 130 57 190 43 194 237 223
3,552,911 28,193 1,089,295 480,740 1,598,228 365,641 1,626,716 1,992,357 1,870,687
595,385 4,724 182,540 80,561 267,825 61,273 272,600 333,873 313,483
214,060 1,699 65,629 28,964 96,292 22,030 98,008 120,038 112,707
65,099 517 19,959 8,808 29,284 6,700 29,806 36,506 34,276
836,931 6,641 256,597 113,244 376,482 86,131 383,193 469,324 440,663
1,027,132 8,150 314,911 138,980 462,041 105,705 470,277 575,982 540,808
35,318 280 10,828 4,779 15,887 3,635 16,170 19,805 18,596
2,887 23 885 391 1,299 297 1,322 1,619 1,520
13,186 105 4,043 1,784 5,932 1,357 6,037 7,394 6,943
165,999 1,317 50,894 22,461 74,672 17,083 76,003 93,086 87,402
59,799 475 18,334 8,091 26,900 6,154 27,379 33,533 31,486
20,998 167 6,438 2,841 9,446 2,161 9,614 11,775 11,056
89,545 711 27,454 12,116 40,281 9,215 40,999 50,214 47,148
84,003 667 25,755 11,366 37,788 8,645 38,461 47,106 44,229
64,697 513 19,835 8,754 29,102 6,658 29,622 36,280 34,064
40,651 323 12,463 5,500 18,286 4,184 18,612 22,796 21,404
53,585 425 16,429 7,251 24,105 5,515 24,534 30,049 28,214
16,924 134 5,189 2,290 7,613 1,742 7,749 9,491 8,911
4,507 36 1,382 610 2,028 464 2,064 2,528 2,373
94 1 29 13 43 10 43 53 50
275 2 84 37 123 28 126 154 145
891 7 273 120 400 92 408 500 469
1,938,831 15,385 594,431 262,341 872,157 199,531 887,702 1,087,233 1,020,837
4,589 36 1,407 621 2,064 472 2,101 2,573 2,416
1,410 11 432 191 634 145 645 790 742
1,595 13 489 216 718 164 730 894 840
1,508,655 11,971 462,542 204,134 678,647 155,260 690,744 846,004 794,340
___________________________________________________________________________________________________37 (Continued)

___________________________________________________________________________________________________
Employer ID # Employer Name
2019 Actual Employer
Contributions
Employer Allocation
Percentage ** Net Pension
Liability (NPL)
Change in NPL due to 1%
Decrease in the Actuarial Assumed
Investment Return (6.00%)
Iowa Public Employees' Retirement System
Schedule of Employer Allocations and Collective Pension Amounts Allocated by Employer -Regular Membership Group
As of and for the year ended June 30, 2019
22564 CENTRAL COMMUNITY SCHOOL DISTRICT 313,299 0.043319% 2,525,278 4,484,078
22569 STARMONT COMMUNITY SCHOOL DISTRICT 396,168 0.054776% 3,193,221 5,670,129
22601 AEA 1 - KEYSTONE 1,341,065 0.185423% 10,809,349 19,193,914
22701 MCGREGOR MUNICIPAL UTILITIES 10,755 0.001487% 86,689 153,932
23201 CLINTON COUNTY 695,583 0.096175% 5,606,588 9,955,490
23203 CLINTON CO ASSESSOR'S OFFICE 36,111 0.004993% 291,062 516,832
23204 CLINTON COUNTY AGRI 15,050 0.002081% 121,306 215,401
23206 CLINTON CO SOIL & WATER CONS DISTRICT 408 0.000056% 3,287 5,837
23301 CITY OF WHEATLAND 15,192 0.002100% 122,448 217,429
23303 CITY OF DEWITT 137,324 0.018987% 1,106,867 1,965,439
23306 CITY OF CHARLOTTE 4,270 0.000590% 34,415 61,109
23307 CITY OF CLINTON 546,574 0.075572% 4,405,534 7,822,806
23310 CITY OF LOST NATION 5,551 0.000767% 44,740 79,444
23311 CITY OF GOOSE LAKE 3,489 0.000482% 28,122 49,936
23312 CITY OF GRAND MOUND 9,367 0.001295% 75,497 134,058
23313 CITY OF CALAMUS 6,224 0.000861% 50,170 89,085
23315 CITY OF DELMAR 7,124 0.000985% 57,421 101,961
23316 CITY OF CAMANCHE 53,643 0.007417% 432,379 767,766
23318 CITY OF TORONTO 597 0.000083% 4,813 8,546
23319 CITY OF WELTON 1,542 0.000213% 12,433 22,077
23320 CITY OF LOW MOOR 2,604 0.000360% 20,987 37,266
23321 CITY OF ANDOVER 566 0.000078% 4,565 8,107
23322 CALAMUS PUB LIBRARY 539 0.000075% 4,346 7,717
23328 CITY OF CLINTON IA HOUSING AUTH 62,055 0.008580% 500,176 888,152
23569 CAMANCHE COMMUNITY SCHOOL DISTRICT 608,048 0.084072% 4,901,030 8,702,648
23570 CALAMUS WHEATLAND CSD 331,695 0.045862% 2,673,551 4,747,363
23572 CLINTON COMMUNITY SCHOOL DISTRICT 2,319,140 0.320657% 18,692,896 33,192,549
23573 CENTRAL DEWITT COMMUNITY SCHOOL DISTRICT 992,780 0.137267% 8,002,079 14,209,109
23574 NORTHEAST COMMUNITY SCHOOL DISTRICT 506,836 0.070078% 4,085,234 7,254,057
23577 DELWOOD COMM SCH DIST 124,280 0.017184% 1,001,731 1,778,750
23602 CLINTON CO AREA SOLID WASTE AGCY 31,374 0.004338% 252,885 449,042
23701 ELWOOD COMMUNITY SANITARY DISTRICT 96 0.000013% 776 1,378
24201 CRAWFORD COUNTY 494,570 0.068382% 3,986,372 7,078,510
24203 CRAWFORD COUNTY AGRI 8,397 0.001161% 67,680 120,178
24204 CRAWFORD COUNTY MEMORIAL HOSPITAL 1,437,093 0.198700% 11,583,356 20,568,302
24301 CITY OF DENISON 151,866 0.020998% 1,224,084 2,173,577
24302 CITY OF WESTSIDE 6,105 0.000844% 49,206 87,373
See notes to Schedules.___________________________________________________________________________________________________
38

___________________________________________________________________________________________________Schedule 1
Change in NPL due to 1%
Increase in the Actuarial Assumed
Investment Return (8.00%)
Differences Between Expected
and Actual Experience
Changes of Assumptions
Difference Between
Projected and Actual
Investment Earnings on Pension Plan Investments
Total Deferred Outflows of Resources
Differences Between Expected
and Actual Experience
Difference Between
Projected and Actual
Investment Earnings on Pension Plan Investments
Total Deferred Inflows of Resources
Total Proportionate
Share of Allocable Plan
Pension Expense
DEFERRED OUTFLOWS OF RESOURCES
(Excluding Employer Specific Amounts) * (Excluding Employer Specific Amounts) *
DEFERRED INFLOWS OF RESOURCES
882,258 7,001 270,493 119,377 396,871 90,796 403,946 494,742 464,528
1,115,617 8,852 342,040 150,953 501,845 114,812 510,790 625,602 587,397
3,776,468 29,967 1,157,836 510,989 1,698,792 388,648 1,729,073 2,117,721 1,988,394
30,287 240 9,286 4,098 13,624 3,117 13,867 16,984 15,947
1,958,776 15,543 600,546 265,039 881,128 201,584 896,834 1,098,418 1,031,339
101,688 807 31,177 13,759 45,743 10,465 46,559 57,024 53,541
42,381 336 12,994 5,734 19,064 4,362 19,404 23,766 22,314
1,148 9 352 155 516 118 526 644 605
42,780 339 13,116 5,788 19,243 4,403 19,587 23,990 22,525
386,707 3,069 118,561 52,325 173,955 39,797 177,055 216,852 203,610
12,023 95 3,686 1,627 5,408 1,237 5,505 6,742 6,331
1,539,164 12,213 471,896 208,262 692,371 158,400 704,713 863,113 810,404
15,631 124 4,792 2,115 7,031 1,609 7,157 8,766 8,230
9,825 78 3,012 1,329 4,419 1,011 4,498 5,509 5,173
26,376 209 8,087 3,569 11,865 2,714 12,077 14,791 13,888
17,528 139 5,374 2,372 7,885 1,804 8,025 9,829 9,229
20,061 159 6,151 2,714 9,024 2,065 9,185 11,250 10,563
151,061 1,199 46,314 20,440 67,953 15,546 69,164 84,710 79,537
1,681 13 516 228 757 173 770 943 885
4,344 34 1,332 588 1,954 447 1,989 2,436 2,287
7,332 58 2,248 992 3,298 755 3,357 4,112 3,861
1,595 13 489 216 718 164 730 894 840
1,518 12 465 205 682 156 695 851 799
174,747 1,387 53,576 23,645 78,608 17,984 80,009 97,993 92,008
1,712,275 13,587 524,971 231,686 770,244 176,215 783,973 960,188 901,551
934,060 7,412 286,376 126,386 420,174 96,127 427,663 523,790 491,803
6,530,746 51,822 2,002,277 883,667 2,937,766 672,099 2,990,131 3,662,230 3,438,583
2,795,690 22,184 857,137 378,281 1,257,602 287,713 1,280,019 1,567,732 1,471,993
1,427,260 11,325 437,587 193,121 642,033 146,884 653,477 800,361 751,484
349,975 2,777 107,300 47,355 157,432 36,017 160,238 196,255 184,270
88,351 701 27,088 11,955 39,744 9,092 40,452 49,544 46,519
271 2 83 37 122 28 124 152 143
1,392,721 11,051 426,997 188,447 626,495 143,329 637,663 780,992 733,298
23,645 188 7,249 3,199 10,636 2,433 10,826 13,259 12,450
4,046,883 32,112 1,240,743 547,578 1,820,433 416,477 1,852,883 2,269,360 2,130,774
427,659 3,393 131,117 57,866 192,376 44,012 195,805 239,817 225,172
17,191 136 5,271 2,326 7,733 1,769 7,871 9,640 9,051
___________________________________________________________________________________________________39 (Continued)

___________________________________________________________________________________________________
Employer ID # Employer Name
2019 Actual Employer
Contributions
Employer Allocation
Percentage ** Net Pension
Liability (NPL)
Change in NPL due to 1%
Decrease in the Actuarial Assumed
Investment Return (6.00%)
Iowa Public Employees' Retirement System
Schedule of Employer Allocations and Collective Pension Amounts Allocated by Employer -Regular Membership Group
As of and for the year ended June 30, 2019
24303 CITY OF MANILLA 33,029 0.004567% 266,221 472,723
24305 CITY OF CHARTER OAK 10,221 0.001413% 82,382 146,284
24306 CITY OF DOW CITY 9,192 0.001271% 74,090 131,561
24307 CITY OF VAIL 4,126 0.000570% 33,253 59,046
24308 CITY OF DELOIT 4,654 0.000644% 37,515 66,614
24310 CITY OF SCHLESWIG 10,596 0.001465% 85,405 151,651
24311 CITY OF ARION 198 0.000027% 1,598 2,837
24312 CITY OF RICKETTS 1,724 0.000238% 13,898 24,678
24315 CITY OF KIRON 3,480 0.000481% 28,053 49,813
24316 CITY OF BUCK GROVE 53 0.000007% 426 757
24317 CITY OF ASPINWALL 85 0.000012% 685 1,216
24536 DENISON COMMUNITY SCHOOL DISTRICT 1,513,994 0.209333% 12,203,204 21,668,950
24539 SCHLESWIG COMM SCH DIST 136,166 0.018827% 1,097,533 1,948,864
24540 AR WE VA COMM SCH DIST 156,814 0.021682% 1,263,967 2,244,397
24541 CHARTER OAK-UTE COMMUNITY SCHOOL DIST 169,860 0.023486% 1,369,121 2,431,117
24701 DENISON MUNICIPAL UTILITIES 175,032 0.024201% 1,410,804 2,505,133
25201 DALLAS COUNTY 965,792 0.133536% 7,784,543 13,822,835
25203 DALLAS COUNTY AGRI 28,637 0.003959% 230,821 409,864
25204 DALLAS COUNTY HOSPITAL 443,663 0.061343% 3,576,048 6,349,906
25301 CITY OF WOODWARD 24,660 0.003410% 198,764 352,940
25302 CITY OF DAWSON 1,280 0.000177% 10,318 18,321
25303 CITY OF MINBURN 8,677 0.001200% 69,942 124,195
25304 CITY OF REDFIELD 17,817 0.002463% 143,606 254,998
25305 CITY OF VAN METER 25,125 0.003474% 202,514 359,599
25306 CITY OF DALLAS CENTER 35,926 0.004967% 289,577 514,194
25308 CITY OF PERRY 177,322 0.024518% 1,429,263 2,537,909
25311 CITY OF DEXTER 10,437 0.001443% 84,127 149,382
25312 CITY OF ADEL 94,451 0.013059% 761,303 1,351,829
25314 CITY OF GRANGER 33,989 0.004700% 273,962 486,468
25315 CITY OF WAUKEE 494,256 0.068339% 3,983,835 7,074,005
25316 CITY OF LINDEN 793 0.000110% 6,391 11,349
25318 CITY OF DE SOTO 19,816 0.002740% 159,723 283,616
25320 CITY OF BOUTON 1,810 0.000250% 14,589 25,906
25545 VAN METER COMMUNITY SCHOOL DISTRICT 481,665 0.066598% 3,882,354 6,893,807
25546 WAUKEE COMMUNITY SCHOOL DIST 6,590,072 0.911180% 53,117,765 94,320,003
25550 DALLAS CENTER GRIMES COMM SCHOOL DIST 1,645,520 0.227519% 13,263,338 23,551,406
25553 PERRY COMMUNITY SCHOOL DISTRICT 1,205,603 0.166693% 9,717,490 17,255,125
See notes to Schedules.___________________________________________________________________________________________________
40

___________________________________________________________________________________________________Schedule 1
Change in NPL due to 1%
Increase in the Actuarial Assumed
Investment Return (8.00%)
Differences Between Expected
and Actual Experience
Changes of Assumptions
Difference Between
Projected and Actual
Investment Earnings on Pension Plan Investments
Total Deferred Outflows of Resources
Differences Between Expected
and Actual Experience
Difference Between
Projected and Actual
Investment Earnings on Pension Plan Investments
Total Deferred Inflows of Resources
Total Proportionate
Share of Allocable Plan
Pension Expense
DEFERRED OUTFLOWS OF RESOURCES
(Excluding Employer Specific Amounts) * (Excluding Employer Specific Amounts) *
DEFERRED INFLOWS OF RESOURCES
93,010 738 28,516 12,585 41,839 9,572 42,585 52,157 48,972
28,782 228 8,824 3,894 12,946 2,962 13,178 16,140 15,154
25,885 205 7,936 3,502 11,643 2,664 11,852 14,516 13,629
11,618 92 3,562 1,572 5,226 1,196 5,319 6,515 6,117
13,106 104 4,018 1,773 5,895 1,349 6,001 7,350 6,901
29,838 237 9,148 4,037 13,422 3,071 13,661 16,732 15,710
558 4 171 76 251 57 256 313 294
4,855 39 1,489 657 2,185 500 2,223 2,723 2,556
9,801 78 3,005 1,326 4,409 1,009 4,487 5,496 5,160
149 1 46 20 67 15 68 83 78
239 2 73 32 107 25 110 135 126
4,263,439 33,831 1,307,138 576,880 1,917,849 438,764 1,952,035 2,390,799 2,244,795
383,446 3,043 117,561 51,884 172,488 39,462 175,562 215,024 201,893
441,593 3,504 135,389 59,751 198,644 45,446 202,185 247,631 232,508
478,330 3,796 146,652 64,722 215,170 49,226 219,006 268,232 251,852
492,893 3,911 151,117 66,693 221,721 50,725 225,673 276,398 259,519
2,719,690 21,581 833,836 367,998 1,223,415 279,892 1,245,222 1,525,114 1,431,977
80,642 640 24,724 10,912 36,276 8,299 36,922 45,221 42,460
1,249,366 9,914 383,046 169,050 562,010 128,576 572,028 700,604 657,819
69,442 551 21,290 9,396 31,237 7,147 31,794 38,941 36,563
3,605 29 1,105 488 1,622 371 1,650 2,021 1,898
24,436 194 7,492 3,306 10,992 2,515 11,188 13,703 12,866
50,172 398 15,382 6,789 22,569 5,163 22,971 28,134 26,416
70,752 561 21,692 9,573 31,826 7,281 32,394 39,675 37,253
101,169 803 31,018 13,689 45,510 10,412 46,321 56,733 53,268
499,342 3,962 153,094 67,565 224,621 51,389 228,626 280,015 262,915
29,391 233 9,011 3,977 13,221 3,025 13,457 16,482 15,475
265,977 2,111 81,546 35,989 119,646 27,372 121,779 149,151 140,043
95,714 759 29,345 12,951 43,055 9,850 43,823 53,673 50,396
1,391,835 11,044 426,726 188,327 626,097 143,238 637,258 780,496 732,832
2,233 18 685 302 1,005 230 1,022 1,252 1,176
55,802 443 17,109 7,551 25,103 5,743 25,549 31,292 29,381
5,097 40 1,563 690 2,293 525 2,334 2,859 2,684
1,356,380 10,763 415,856 183,530 610,149 139,589 621,025 760,614 714,164
18,557,780 147,257 5,689,672 2,511,029 8,347,958 1,909,839 8,496,762 10,406,601 9,771,083
4,633,819 36,770 1,420,693 626,996 2,084,459 476,880 2,121,615 2,598,495 2,439,808
3,395,004 26,940 1,040,882 459,374 1,527,196 349,390 1,554,418 1,903,808 1,787,545
___________________________________________________________________________________________________41 (Continued)

___________________________________________________________________________________________________
Employer ID # Employer Name
2019 Actual Employer
Contributions
Employer Allocation
Percentage ** Net Pension
Liability (NPL)
Change in NPL due to 1%
Decrease in the Actuarial Assumed
Investment Return (6.00%)
Iowa Public Employees' Retirement System
Schedule of Employer Allocations and Collective Pension Amounts Allocated by Employer -Regular Membership Group
As of and for the year ended June 30, 2019
25556 WOODWARD-GRANGER CSD 757,535 0.104741% 6,105,938 10,842,175
25559 ADEL-DESOTO-MINBURN CSD 1,130,027 0.156244% 9,108,326 16,173,447
25701 PERRY WATER WORKS 50,150 0.006934% 404,221 717,766
25702 XENIA RURAL WATER DISTRICT 143,738 0.019874% 1,158,567 2,057,240
25704 SOUTH DALLAS COUNTY LANDFILL AGCY 25,889 0.003580% 208,676 370,542
26201 DAVIS COUNTY 174,537 0.024132% 1,406,816 2,498,051
26203 DAVIS COUNTY HOSPITAL 893,574 0.123551% 7,202,449 12,789,224
26204 DAVIS COUNTY AGRI 5,681 0.000786% 45,793 81,314
26205 DAVIS CO ASSESSOR 11,236 0.001554% 90,564 160,812
26207 DAVIS SOIL & WATER CONS DIST 1,160 0.000160% 9,352 16,606
26301 CITY OF BLOOMFIELD 106,343 0.014704% 857,156 1,522,033
26303 CITY OF FLORIS 258 0.000036% 2,082 3,697
26304 CITY OF DRAKESVILLE 166 0.000023% 1,339 2,378
26305 CITY OF PULASKI 941 0.000130% 7,587 13,473
26572 DAVIS COUNTY COMMUNITY SCHOOL DISTRICT 880,746 0.121777% 7,099,053 12,605,627
27201 DECATUR COUNTY 242,397 0.033515% 1,953,785 3,469,292
27203 DECATUR COUNTY AGRI 3,800 0.000525% 30,630 54,389
27204 DECATUR COUNTY HOSPITAL 401,278 0.055483% 3,234,408 5,743,264
27301 CITY OF LAMONI 34,108 0.004716% 274,922 488,173
27302 CITY OF LEON 41,021 0.005672% 330,639 587,109
27305 CITY OF DAVIS CITY 924 0.000128% 7,451 13,230
27306 CITY OF GARDEN GROVE 2,861 0.000396% 23,063 40,952
27309 CITY OF PLEASANTON 170 0.000023% 1,370 2,432
27312 CITY OF GRAND RIVER 1,419 0.000196% 11,436 20,306
27313 CITY OF DECATUR CITY 1,317 0.000182% 10,614 18,848
27314 CITY OF VAN WERT 425 0.000059% 3,424 6,080
27315 CITY OF LEROY 110 0.000015% 890 1,580
27316 LOW RENT HOUSING AGENCY OF LEON 4,852 0.000671% 39,108 69,444
27554 MORMON TRAIL COMMUNITY SCHOOL DISTRICT 168,970 0.023363% 1,361,944 2,418,372
27555 LAMONI COMM SCH DIST 253,122 0.034998% 2,040,231 3,622,791
27556 CENTRAL DECATUR COMMUNITY SCHOOL DIST 461,578 0.063820% 3,720,448 6,606,314
27701 LAMONI MUNICIPAL UTILITIES 61,440 0.008495% 495,222 879,354
28201 DELAWARE COUNTY 354,508 0.049016% 2,857,428 5,073,870
28203 DELAWARE COUNTY AGRICULTURAL COMMISSION 14,257 0.001971% 114,912 204,047
28204 REGIONAL MEDICAL CENTER 2,177,650 0.301094% 17,552,450 31,167,484
28207 DELAWARE CO SOIL & WATER CONS DIST 6,469 0.000894% 52,144 92,591
28301 CITY OF EDGEWOOD 19,896 0.002751% 160,369 284,764
See notes to Schedules.___________________________________________________________________________________________________
42

___________________________________________________________________________________________________Schedule 1
Change in NPL due to 1%
Increase in the Actuarial Assumed
Investment Return (8.00%)
Differences Between Expected
and Actual Experience
Changes of Assumptions
Difference Between
Projected and Actual
Investment Earnings on Pension Plan Investments
Total Deferred Outflows of Resources
Differences Between Expected
and Actual Experience
Difference Between
Projected and Actual
Investment Earnings on Pension Plan Investments
Total Deferred Inflows of Resources
Total Proportionate
Share of Allocable Plan
Pension Expense
DEFERRED OUTFLOWS OF RESOURCES
(Excluding Employer Specific Amounts) * (Excluding Employer Specific Amounts) *
DEFERRED INFLOWS OF RESOURCES
2,133,235 16,927 654,033 288,645 959,605 219,538 976,711 1,196,249 1,123,195
3,182,180 25,251 975,632 430,577 1,431,460 327,488 1,456,975 1,784,463 1,675,489
141,223 1,121 43,298 19,109 63,528 14,534 64,660 79,194 74,357
404,769 3,212 124,099 54,769 182,080 41,655 185,325 226,980 213,120
72,905 579 22,352 9,865 32,796 7,503 33,380 40,883 38,386
491,500 3,900 150,690 66,504 221,094 50,582 225,035 275,617 258,786
2,516,323 19,967 771,485 340,480 1,131,932 258,962 1,152,110 1,411,072 1,324,900
15,999 127 4,905 2,165 7,197 1,646 7,325 8,971 8,424
31,640 251 9,701 4,281 14,233 3,256 14,487 17,743 16,659
3,267 26 1,002 442 1,470 336 1,496 1,832 1,720
299,465 2,376 91,814 40,520 134,710 30,819 137,111 167,930 157,675
727 6 223 98 327 75 333 408 383
468 4 143 63 210 48 214 262 246
2,651 21 813 359 1,193 273 1,214 1,487 1,396
2,480,200 19,681 760,410 335,593 1,115,684 255,245 1,135,571 1,390,816 1,305,880
682,595 5,416 209,278 92,361 307,055 70,248 312,529 382,777 359,401
10,701 85 3,281 1,448 4,814 1,101 4,900 6,001 5,634
1,130,007 8,967 346,451 152,900 508,318 116,292 517,379 633,671 594,974
96,050 762 29,448 12,996 43,206 9,885 43,977 53,862 50,572
115,516 917 35,416 15,630 51,963 11,888 52,889 64,777 60,822
2,603 21 798 352 1,171 268 1,192 1,460 1,371
8,057 64 2,470 1,090 3,624 829 3,689 4,518 4,242
478 4 147 65 216 49 219 268 252
3,995 32 1,225 541 1,798 411 1,829 2,240 2,104
3,708 29 1,137 502 1,668 382 1,698 2,080 1,953
1,196 9 367 162 538 123 548 671 630
311 2 95 42 139 32 142 174 164
13,663 108 4,189 1,849 6,146 1,406 6,256 7,662 7,194
475,823 3,776 145,884 64,383 214,043 48,968 217,858 266,826 250,531
712,796 5,656 218,538 96,448 320,642 73,356 326,357 399,713 375,303
1,299,815 10,314 398,513 175,876 584,703 133,768 595,126 728,894 684,381
173,016 1,373 53,045 23,411 77,829 17,806 79,216 97,022 91,097
998,301 7,922 306,071 135,079 449,072 102,738 457,077 559,815 525,628
40,147 319 12,309 5,432 18,060 4,132 18,381 22,513 21,138
6,132,308 48,660 1,880,119 829,755 2,758,534 631,094 2,807,705 3,438,799 3,228,796
18,218 145 5,585 2,465 8,195 1,875 8,341 10,216 9,592
56,028 445 17,178 7,581 25,204 5,766 25,653 31,419 29,500
___________________________________________________________________________________________________43 (Continued)

___________________________________________________________________________________________________
Employer ID # Employer Name
2019 Actual Employer
Contributions
Employer Allocation
Percentage ** Net Pension
Liability (NPL)
Change in NPL due to 1%
Decrease in the Actuarial Assumed
Investment Return (6.00%)
Iowa Public Employees' Retirement System
Schedule of Employer Allocations and Collective Pension Amounts Allocated by Employer -Regular Membership Group
As of and for the year ended June 30, 2019
28302 CITY OF HOPKINTON 9,637 0.001332% 77,676 137,928
28303 CITY OF COLESBURG 8,709 0.001204% 70,200 124,652
28304 CITY OF MANCHESTER 135,564 0.018744% 1,092,682 1,940,251
28305 CITY OF EARLVILLE 14,761 0.002041% 118,980 211,271
28309 CITY OF DELHI 9,501 0.001314% 76,577 135,976
28310 CITY OF RYAN 7,702 0.001065% 62,079 110,233
28312 CITY OF GREELEY 1,958 0.000271% 15,778 28,017
28314 CITY OF DELAWARE 813 0.000112% 6,551 11,632
28315 CITY OF MASONVILLE 1,904 0.000263% 15,346 27,250
28317 CITY OF DUNDEE 1,242 0.000172% 10,011 17,776
28534 MAQUOKETA VALLEY COMMUNITY SCHOOL DIST 450,770 0.062326% 3,633,325 6,451,613
28535 WEST DELAWARE COUNTY COMM SCH DIST 991,290 0.137061% 7,990,064 14,187,773
28536 EDGEWOOD-COLESBURG COMMUNITY SCHOOL DIST 342,101 0.047301% 2,757,423 4,896,293
28601 DELAWARE COUNTY ECONOMIC DEVELOPMENT CO 9,551 0.001321% 76,982 136,696
28701 HOPKINTON MUNICIPAL UTILITIES 11,493 0.001589% 92,636 164,492
29201 DES MOINES COUNTY 549,726 0.076008% 4,430,942 7,867,922
29204 DES MOINES COUNTY AGRI 11,329 0.001566% 91,311 162,140
29302 CITY OF MEDIAPOLIS 25,370 0.003508% 204,492 363,112
29303 CITY OF BURLINGTON 657,299 0.090882% 5,298,005 9,407,547
29305 CITY OF WEST BURLINGTON 75,103 0.010384% 605,348 1,074,903
29306 CITY OF DANVILLE 16,211 0.002241% 130,662 232,013
29307 CITY OF MIDDLETOWN 6,746 0.000933% 54,373 96,548
29309 LOW RENT HOUSING AGENCY OF BURLINGTON 37,413 0.005173% 301,562 535,477
29506 WEST BURLINGTON INDEPENDENT SCHOOL DIST 544,764 0.075322% 4,390,947 7,796,904
29542 DANVILLE COMMUNITY SCHOOL DISTRICT 420,779 0.058179% 3,391,590 6,022,368
29543 MEDIAPOLIS COMM SCH DIST 603,648 0.083464% 4,865,563 8,639,670
29544 BURLINGTON COMMUNITY SCHOOL DISTRICT 2,635,737 0.364432% 21,244,759 37,723,834
29546 SOUTHEASTERN COMMUNITY COLLEGE 730,647 0.101023% 5,889,211 10,457,338
29603 SOUTHEAST IOWA REGIONAL HOUSING 7,329 0.001013% 59,074 104,896
29604 DES MOINES CO REG SOLID WASTE COMM 96,403 0.013329% 777,032 1,379,758
29701 BURLINGTON MUNICIPAL WATERWORKS 64,361 0.008899% 518,763 921,156
30201 DICKINSON COUNTY 371,790 0.051406% 2,996,730 5,321,225
30203 ISU DICKINSON COUNTY EXTENSION OFFICE 11,498 0.001590% 92,681 164,571
30204 LAKES REGIONAL HEALTHCARE 1,135,106 0.156946% 9,149,262 16,246,136
30207 DICKINSON CO SOIL & WATER CONS DIST 5,336 0.000738% 43,008 76,368
30301 CITY OF SPIRIT LAKE 141,004 0.019496% 1,136,534 2,018,118
30302 CITY OF ARNOLDS PARK 43,250 0.005980% 348,609 619,018
See notes to Schedules.___________________________________________________________________________________________________
44

___________________________________________________________________________________________________Schedule 1
Change in NPL due to 1%
Increase in the Actuarial Assumed
Investment Return (8.00%)
Differences Between Expected
and Actual Experience
Changes of Assumptions
Difference Between
Projected and Actual
Investment Earnings on Pension Plan Investments
Total Deferred Outflows of Resources
Differences Between Expected
and Actual Experience
Difference Between
Projected and Actual
Investment Earnings on Pension Plan Investments
Total Deferred Inflows of Resources
Total Proportionate
Share of Allocable Plan
Pension Expense
DEFERRED OUTFLOWS OF RESOURCES
(Excluding Employer Specific Amounts) * (Excluding Employer Specific Amounts) *
DEFERRED INFLOWS OF RESOURCES
27,138 215 8,320 3,672 12,207 2,793 12,425 15,218 14,289
24,526 195 7,519 3,319 11,033 2,524 11,229 13,753 12,913
381,751 3,029 117,042 51,654 171,725 39,287 174,786 214,073 201,000
41,568 330 12,744 5,625 18,699 4,278 19,032 23,310 21,887
26,754 212 8,202 3,620 12,034 2,753 12,249 15,002 14,086
21,689 172 6,650 2,935 9,757 2,232 9,930 12,162 11,420
5,513 44 1,690 746 2,480 567 2,524 3,091 2,902
2,289 18 702 310 1,030 236 1,048 1,284 1,205
5,362 43 1,644 725 2,412 552 2,455 3,007 2,823
3,497 28 1,072 473 1,573 360 1,601 1,961 1,841
1,269,377 10,073 389,181 171,758 571,012 130,635 581,190 711,825 668,355
2,791,492 22,151 855,850 377,713 1,255,714 287,281 1,278,097 1,565,378 1,469,783
963,362 7,644 295,359 130,351 433,354 99,143 441,080 540,223 507,232
26,895 213 8,246 3,639 12,098 2,768 12,314 15,082 14,161
32,364 257 9,923 4,379 14,559 3,331 14,818 18,149 17,041
1,548,040 12,284 474,617 209,463 696,364 159,314 708,777 868,091 815,078
31,902 253 9,781 4,317 14,351 3,283 14,606 17,889 16,797
71,444 567 21,904 9,667 32,138 7,352 32,711 40,063 37,617
1,850,967 14,688 567,492 250,452 832,632 190,489 847,473 1,037,962 974,575
211,491 1,678 64,841 28,617 95,136 21,765 96,832 118,597 111,355
45,649 362 13,996 6,177 20,535 4,698 20,901 25,599 24,035
18,996 151 5,824 2,570 8,545 1,955 8,697 10,652 10,002
105,357 836 32,302 14,256 47,394 10,843 48,238 59,081 55,473
1,534,067 12,173 470,333 207,573 690,079 157,876 702,380 860,256 807,720
1,184,921 9,402 363,288 160,330 533,020 121,944 542,522 664,466 623,887
1,699,884 13,489 521,171 230,009 764,669 174,940 778,300 953,240 895,027
7,422,292 58,896 2,275,618 1,004,301 3,338,815 763,851 3,398,329 4,162,180 3,908,001
2,057,517 16,327 630,819 278,400 925,546 211,745 942,043 1,153,788 1,083,328
20,639 164 6,328 2,793 9,285 2,124 9,449 11,573 10,867
271,472 2,154 83,231 36,733 122,118 27,938 124,295 152,233 142,936
181,241 1,438 55,567 24,523 81,528 18,652 82,982 101,634 95,427
1,046,969 8,308 320,993 141,664 470,965 107,747 479,359 587,106 551,252
32,380 257 9,927 4,381 14,565 3,332 14,825 18,157 17,049
3,196,482 25,364 980,017 432,512 1,437,893 328,960 1,463,524 1,792,484 1,683,019
15,026 119 4,607 2,033 6,759 1,546 6,880 8,426 7,911
397,072 3,151 121,739 53,727 178,617 40,864 181,801 222,665 209,067
121,794 966 37,341 16,480 54,787 12,534 55,764 68,298 64,127
___________________________________________________________________________________________________45 (Continued)
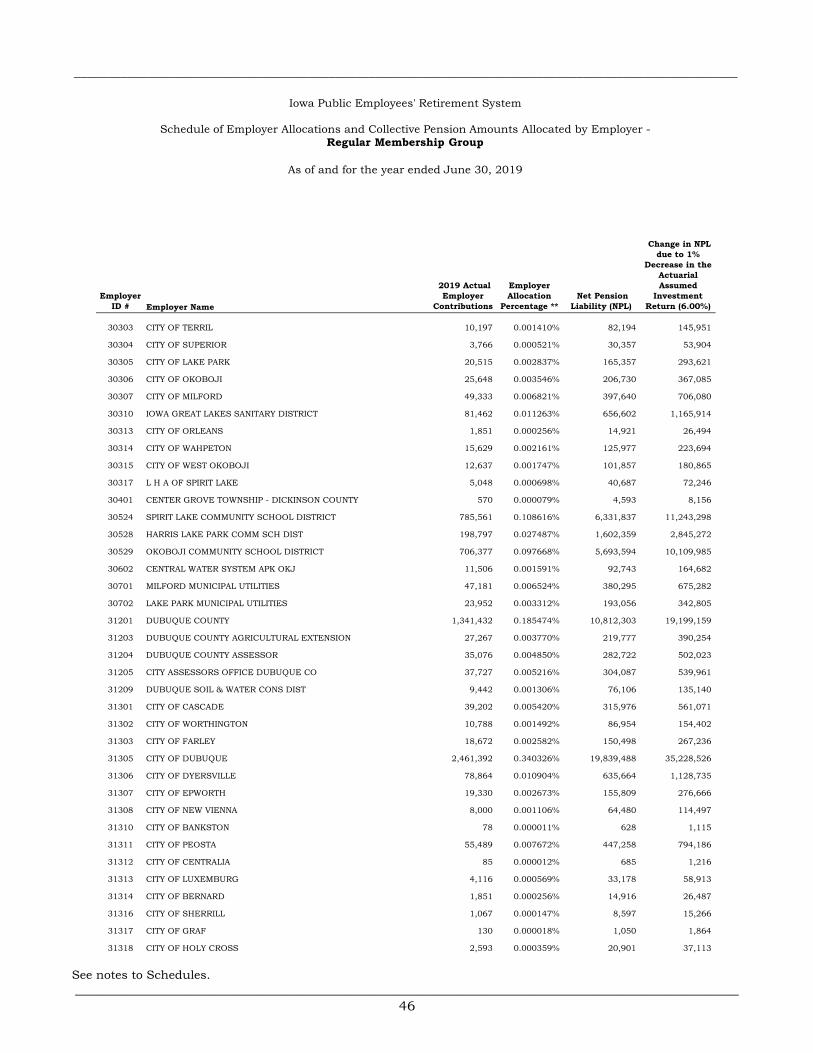
___________________________________________________________________________________________________
Employer ID # Employer Name
2019 Actual Employer
Contributions
Employer Allocation
Percentage ** Net Pension
Liability (NPL)
Change in NPL due to 1%
Decrease in the Actuarial Assumed
Investment Return (6.00%)
Iowa Public Employees' Retirement System
Schedule of Employer Allocations and Collective Pension Amounts Allocated by Employer -Regular Membership Group
As of and for the year ended June 30, 2019
30303 CITY OF TERRIL 10,197 0.001410% 82,194 145,951
30304 CITY OF SUPERIOR 3,766 0.000521% 30,357 53,904
30305 CITY OF LAKE PARK 20,515 0.002837% 165,357 293,621
30306 CITY OF OKOBOJI 25,648 0.003546% 206,730 367,085
30307 CITY OF MILFORD 49,333 0.006821% 397,640 706,080
30310 IOWA GREAT LAKES SANITARY DISTRICT 81,462 0.011263% 656,602 1,165,914
30313 CITY OF ORLEANS 1,851 0.000256% 14,921 26,494
30314 CITY OF WAHPETON 15,629 0.002161% 125,977 223,694
30315 CITY OF WEST OKOBOJI 12,637 0.001747% 101,857 180,865
30317 L H A OF SPIRIT LAKE 5,048 0.000698% 40,687 72,246
30401 CENTER GROVE TOWNSHIP - DICKINSON COUNTY 570 0.000079% 4,593 8,156
30524 SPIRIT LAKE COMMUNITY SCHOOL DISTRICT 785,561 0.108616% 6,331,837 11,243,298
30528 HARRIS LAKE PARK COMM SCH DIST 198,797 0.027487% 1,602,359 2,845,272
30529 OKOBOJI COMMUNITY SCHOOL DISTRICT 706,377 0.097668% 5,693,594 10,109,985
30602 CENTRAL WATER SYSTEM APK OKJ 11,506 0.001591% 92,743 164,682
30701 MILFORD MUNICIPAL UTILITIES 47,181 0.006524% 380,295 675,282
30702 LAKE PARK MUNICIPAL UTILITIES 23,952 0.003312% 193,056 342,805
31201 DUBUQUE COUNTY 1,341,432 0.185474% 10,812,303 19,199,159
31203 DUBUQUE COUNTY AGRICULTURAL EXTENSION 27,267 0.003770% 219,777 390,254
31204 DUBUQUE COUNTY ASSESSOR 35,076 0.004850% 282,722 502,023
31205 CITY ASSESSORS OFFICE DUBUQUE CO 37,727 0.005216% 304,087 539,961
31209 DUBUQUE SOIL & WATER CONS DIST 9,442 0.001306% 76,106 135,140
31301 CITY OF CASCADE 39,202 0.005420% 315,976 561,071
31302 CITY OF WORTHINGTON 10,788 0.001492% 86,954 154,402
31303 CITY OF FARLEY 18,672 0.002582% 150,498 267,236
31305 CITY OF DUBUQUE 2,461,392 0.340326% 19,839,488 35,228,526
31306 CITY OF DYERSVILLE 78,864 0.010904% 635,664 1,128,735
31307 CITY OF EPWORTH 19,330 0.002673% 155,809 276,666
31308 CITY OF NEW VIENNA 8,000 0.001106% 64,480 114,497
31310 CITY OF BANKSTON 78 0.000011% 628 1,115
31311 CITY OF PEOSTA 55,489 0.007672% 447,258 794,186
31312 CITY OF CENTRALIA 85 0.000012% 685 1,216
31313 CITY OF LUXEMBURG 4,116 0.000569% 33,178 58,913
31314 CITY OF BERNARD 1,851 0.000256% 14,916 26,487
31316 CITY OF SHERRILL 1,067 0.000147% 8,597 15,266
31317 CITY OF GRAF 130 0.000018% 1,050 1,864
31318 CITY OF HOLY CROSS 2,593 0.000359% 20,901 37,113
See notes to Schedules.___________________________________________________________________________________________________
46

___________________________________________________________________________________________________Schedule 1
Change in NPL due to 1%
Increase in the Actuarial Assumed
Investment Return (8.00%)
Differences Between Expected
and Actual Experience
Changes of Assumptions
Difference Between
Projected and Actual
Investment Earnings on Pension Plan Investments
Total Deferred Outflows of Resources
Differences Between Expected
and Actual Experience
Difference Between
Projected and Actual
Investment Earnings on Pension Plan Investments
Total Deferred Inflows of Resources
Total Proportionate
Share of Allocable Plan
Pension Expense
DEFERRED OUTFLOWS OF RESOURCES
(Excluding Employer Specific Amounts) * (Excluding Employer Specific Amounts) *
DEFERRED INFLOWS OF RESOURCES
28,716 228 8,804 3,886 12,918 2,955 13,148 16,103 15,120
10,606 84 3,252 1,435 4,771 1,091 4,856 5,947 5,584
57,771 458 17,712 7,817 25,987 5,945 26,451 32,396 30,418
72,225 573 22,144 9,773 32,490 7,433 33,069 40,502 38,028
138,924 1,102 42,593 18,798 62,493 14,297 63,607 77,904 73,146
229,397 1,820 70,332 31,039 103,191 23,608 105,031 128,639 120,783
5,213 41 1,598 705 2,344 536 2,387 2,923 2,745
44,012 349 13,494 5,955 19,798 4,529 20,151 24,680 23,174
35,586 282 10,910 4,815 16,007 3,662 16,293 19,955 18,737
14,215 113 4,358 1,923 6,394 1,463 6,508 7,971 7,484
1,605 13 492 217 722 165 735 900 845
2,212,157 17,554 678,230 299,324 995,108 227,660 1,012,846 1,240,506 1,164,750
559,817 4,442 171,636 75,748 251,826 57,612 256,315 313,927 294,756
1,989,174 15,784 609,865 269,152 894,801 204,712 910,752 1,115,464 1,047,344
32,402 257 9,934 4,384 14,575 3,335 14,835 18,170 17,060
132,864 1,054 40,735 17,978 59,767 13,673 60,832 74,505 69,956
67,448 535 20,679 9,126 30,340 6,941 30,881 37,822 35,513
3,777,500 29,975 1,158,152 511,129 1,699,256 388,754 1,729,545 2,118,299 1,988,937
76,784 609 23,541 10,390 34,540 7,902 35,156 43,058 40,428
98,775 784 30,284 13,365 44,433 10,165 45,224 55,389 52,007
106,239 843 32,572 14,375 47,790 10,933 48,642 59,575 55,937
26,589 211 8,152 3,598 11,961 2,736 12,174 14,910 14,000
110,393 876 33,846 14,937 49,659 11,361 50,544 61,905 58,124
30,379 241 9,314 4,111 13,666 3,126 13,909 17,035 15,995
52,580 417 16,121 7,114 23,652 5,411 24,074 29,485 27,684
6,931,332 55,001 2,125,093 937,869 3,117,963 713,324 3,173,541 3,886,865 3,649,500
222,082 1,762 68,089 30,050 99,901 22,855 101,681 124,536 116,931
54,435 432 16,689 7,366 24,487 5,602 24,923 30,525 28,661
22,528 179 6,907 3,048 10,134 2,318 10,314 12,632 11,861
219 2 67 30 99 23 100 123 115
156,259 1,240 47,908 21,143 70,291 16,081 71,544 87,625 82,274
239 2 73 32 107 25 110 135 126
11,591 92 3,554 1,568 5,214 1,193 5,307 6,500 6,103
5,211 41 1,598 705 2,344 536 2,386 2,922 2,744
3,004 24 921 406 1,351 309 1,375 1,684 1,581
367 3 112 50 165 38 168 206 193
7,302 58 2,239 988 3,285 751 3,343 4,094 3,845
___________________________________________________________________________________________________47 (Continued)

___________________________________________________________________________________________________
Employer ID # Employer Name
2019 Actual Employer
Contributions
Employer Allocation
Percentage ** Net Pension
Liability (NPL)
Change in NPL due to 1%
Decrease in the Actuarial Assumed
Investment Return (6.00%)
Iowa Public Employees' Retirement System
Schedule of Employer Allocations and Collective Pension Amounts Allocated by Employer -Regular Membership Group
As of and for the year ended June 30, 2019
31319 CITY OF ASBURY 75,340 0.010417% 607,263 1,078,303
31320 CITY OF RICKARDSVILLE 958 0.000133% 7,726 13,718
31321 CITY OF ZWINGLE 623 0.000086% 5,022 8,917
31322 CITY OF DURANGO 52 0.000007% 418 743
31551 DUBUQUE COMMUNITY SCHOOL DISTRICT 7,566,332 1.046163% 60,986,689 108,292,673
31553 WESTERN DUBUQUE COMMUNITY SCHOOL DIST 2,200,804 0.304295% 17,739,074 31,498,869
31602 EAST CENTRAL INTERGOVERNMENTAL ASSOC 269,096 0.037207% 2,168,987 3,851,421
31703 CASCADE MUNICIPAL ELECTRIC AND GAS 29,718 0.004109% 239,532 425,332
32201 EMMET COUNTY 253,568 0.035060% 2,043,826 3,629,175
32203 EMMET CO AGR EXT DIST 7,294 0.001009% 58,794 104,399
32301 CITY OF ARMSTRONG 11,706 0.001619% 94,354 167,541
32302 CITY OF RINGSTED 9,059 0.001253% 73,021 129,662
32303 CITY OF ESTHERVILLE 224,179 0.030996% 1,806,946 3,208,554
32307 CITY OF DOLLIVER 604 0.000084% 4,870 8,647
32308 CITY OF WALLINGFORD 544 0.000075% 4,387 7,789
32309 CITY OF GRUVER 378 0.000052% 3,044 5,404
32521 ESTHERVILLE LINCOLN CENTRAL CSD 898,427 0.124222% 7,241,566 12,858,683
32525 IOWA LAKES COMMUNITY COLLEGE 564,082 0.077993% 4,546,653 8,073,389
32601 EMMET COUNTY COUNCIL GOVTS 8,027 0.001110% 64,703 114,891
33201 FAYETTE COUNTY 448,026 0.061947% 3,611,213 6,412,349
33203 FAYETTE COUNTY AGRI EXTENSION DISTRICT 10,902 0.001507% 87,877 156,040
33301 CITY OF OELWEIN 145,440 0.020109% 1,172,289 2,081,607
33302 CITY OF WEST UNION 47,901 0.006623% 386,098 685,586
33303 CITY OF WAUCOMA 3,307 0.000457% 26,657 47,334
33305 CITY OF FAYETTE 24,390 0.003372% 196,586 349,073
33306 CITY OF CLERMONT 10,983 0.001519% 88,525 157,191
33307 CITY OF ELGIN 12,369 0.001710% 99,696 177,029
33308 CITY OF HAWKEYE 7,867 0.001088% 63,413 112,602
33309 CITY OF WESTGATE 2,307 0.000319% 18,596 33,021
33310 CITY OF ARLINGTON 8,281 0.001145% 66,746 118,519
33311 CITY OF MAYNARD 12,444 0.001721% 100,304 178,108
33316 CITY OF RANDALIA 611 0.000085% 4,927 8,748
33317 CITY OF ST LUCAS 1,453 0.000201% 11,713 20,799
33321 CITY OF WADENA 3,040 0.000420% 24,507 43,517
33324 WESTGATE PUBLIC LIBRARY 766 0.000106% 6,175 10,965
33565 WEST CENTRAL COMMUNITY SCHOOL DISTRICT 187,497 0.025924% 1,511,274 2,683,534
33566 OELWEIN COMMUNITY SCHOOL DISTRICT 915,054 0.126521% 7,375,584 13,096,657
See notes to Schedules.___________________________________________________________________________________________________
48

___________________________________________________________________________________________________Schedule 1
Change in NPL due to 1%
Increase in the Actuarial Assumed
Investment Return (8.00%)
Differences Between Expected
and Actual Experience
Changes of Assumptions
Difference Between
Projected and Actual
Investment Earnings on Pension Plan Investments
Total Deferred Outflows of Resources
Differences Between Expected
and Actual Experience
Difference Between
Projected and Actual
Investment Earnings on Pension Plan Investments
Total Deferred Inflows of Resources
Total Proportionate
Share of Allocable Plan
Pension Expense
DEFERRED OUTFLOWS OF RESOURCES
(Excluding Employer Specific Amounts) * (Excluding Employer Specific Amounts) *
DEFERRED INFLOWS OF RESOURCES
212,160 1,684 65,047 28,707 95,438 21,834 97,138 118,972 111,707
2,699 21 828 365 1,214 278 1,236 1,514 1,421
1,754 14 538 237 789 181 803 984 924
146 1 45 20 66 15 67 82 77
21,306,950 169,072 6,532,546 2,883,016 9,584,634 2,192,764 9,755,483 11,948,247 11,218,582
6,197,509 49,178 1,900,109 838,577 2,787,864 637,805 2,837,557 3,475,362 3,263,126
757,780 6,013 232,330 102,534 340,877 77,985 346,953 424,938 398,988
83,685 664 25,657 11,323 37,644 8,612 38,316 46,928 44,062
714,053 5,666 218,923 96,618 321,207 73,485 326,932 400,417 375,965
20,541 163 6,298 2,779 9,240 2,114 9,405 11,519 10,815
32,965 262 10,108 4,459 14,829 3,391 15,092 18,483 17,357
25,511 202 7,822 3,452 11,476 2,625 11,681 14,306 13,432
631,294 5,009 193,550 85,420 283,979 64,968 289,041 354,009 332,390
1,701 14 522 230 766 175 779 954 896
1,533 12 470 207 689 158 702 860 807
1,063 8 326 144 478 109 487 596 560
2,529,989 20,076 775,675 342,330 1,138,081 260,369 1,158,367 1,418,736 1,332,096
1,588,467 12,605 487,012 214,933 714,550 163,474 727,286 890,760 836,363
22,605 179 6,931 3,059 10,169 2,326 10,350 12,676 11,902
1,261,651 10,011 386,813 170,712 567,536 129,840 577,653 707,493 664,287
30,701 244 9,413 4,154 13,811 3,160 14,057 17,217 16,165
409,563 3,250 125,569 55,417 184,236 42,149 187,520 229,669 215,644
134,891 1,070 41,357 18,252 60,679 13,882 61,761 75,643 71,023
9,313 74 2,855 1,260 4,189 958 4,264 5,222 4,904
68,681 545 21,057 9,293 30,895 7,068 31,446 38,514 36,162
30,928 245 9,482 4,185 13,912 3,183 14,160 17,343 16,284
34,831 276 10,679 4,713 15,668 3,585 15,948 19,533 18,339
22,155 176 6,792 2,998 9,966 2,280 10,144 12,424 11,665
6,497 52 1,992 879 2,923 669 2,975 3,644 3,421
23,319 185 7,149 3,155 10,489 2,400 10,677 13,077 12,278
35,043 278 10,744 4,742 15,764 3,606 16,045 19,651 18,451
1,721 14 528 233 775 177 788 965 906
4,092 32 1,255 554 1,841 421 1,874 2,295 2,155
8,562 68 2,625 1,159 3,852 881 3,920 4,801 4,508
2,157 17 661 292 970 222 988 1,210 1,136
527,994 4,190 161,879 71,442 237,511 54,338 241,745 296,083 278,001
2,576,812 20,447 790,031 348,665 1,159,143 265,188 1,179,805 1,444,993 1,356,748
___________________________________________________________________________________________________49 (Continued)

___________________________________________________________________________________________________
Employer ID # Employer Name
2019 Actual Employer
Contributions
Employer Allocation
Percentage ** Net Pension
Liability (NPL)
Change in NPL due to 1%
Decrease in the Actuarial Assumed
Investment Return (6.00%)
Iowa Public Employees' Retirement System
Schedule of Employer Allocations and Collective Pension Amounts Allocated by Employer -Regular Membership Group
As of and for the year ended June 30, 2019
33570 TURKEY VALLEY COMMUNITY SCHOOL DISTRICT 247,421 0.034210% 1,994,277 3,541,193
34201 FLOYD COUNTY 442,838 0.061229% 3,569,397 6,338,097
34203 FLOYD CO AGRICULTURAL EXTENSION 15,007 0.002075% 120,961 214,788
34205 FLOYD COUNTY MEMORIAL HOSP 1,090,959 0.150842% 8,793,425 15,614,284
34302 CITY OF CHARLES CITY 227,232 0.031418% 1,831,552 3,252,245
34303 CITY OF ROCKFORD 20,025 0.002769% 161,405 286,604
34305 CITY OF NORA SPRINGS 18,988 0.002625% 153,051 271,769
34306 CITY OF FLOYD 6,636 0.000917% 53,486 94,974
34309 CITY OF RUDD 8,064 0.001115% 64,998 115,415
34311 CITY OF MARBLE ROCK 6,782 0.000938% 54,668 97,073
34314 CITY OF COLWELL 441 0.000061% 3,557 6,316
34529 RUDD ROCKFORD MARBLE ROCK COMM SCH DIST 314,055 0.043423% 2,531,370 4,494,895
34530 CHARLES CITY COMMUNITY SCHOOL DISTRICT 1,053,074 0.145604% 8,488,061 15,072,056
34601 FLOYD-MITCHELL-CHICKASAW SOLID WASTE MANGT AG 16,990 0.002349% 136,941 243,162
34701 ROCKFORD MUNIC LIGHT PLANT 10,945 0.001513% 88,217 156,646
35201 FRANKLIN COUNTY 389,061 0.053794% 3,135,939 5,568,416
35203 FRANKLIN CO AGRI EXT DIST 17,458 0.002414% 140,716 249,866
35205 FRANKLIN GEN HOSP 565,643 0.078209% 4,559,236 8,095,731
35301 CITY OF HAMPTON 94,722 0.013097% 763,487 1,355,707
35302 CITY OF LATIMER 8,739 0.001208% 70,440 125,079
35305 CITY OF COULTER 1,559 0.000216% 12,563 22,308
35308 CITY OF ALEXANDER 2,285 0.000316% 18,418 32,705
35309 CITY OF SHEFFIELD 16,902 0.002337% 136,239 241,916
35310 CITY OF GENEVA 1,331 0.000184% 10,728 19,050
35311 CITY OF HANSELL 1,294 0.000179% 10,433 18,526
35312 CITY OF POPEJOY 189 0.000026% 1,521 2,702
35313 ALEXANDER PUB LIBRARY 1,293 0.000179% 10,419 18,501
35314 COULTER PUBLIC LIBRARY 1,584 0.000219% 12,767 22,670
35548 CAL COMMUNITY SCHOOL DISTRICT 111,475 0.015413% 898,520 1,595,481
36201 FREMONT COUNTY 235,984 0.032628% 1,902,096 3,377,508
36203 FREMONT COUNTY AGRI EXTENSION DIST 14,876 0.002057% 119,908 212,917
36301 CITY OF HAMBURG 27,334 0.003779% 220,316 391,211
36302 CITY OF RANDOLPH 2,984 0.000413% 24,055 42,714
36303 CITY OF SIDNEY 19,971 0.002761% 160,975 285,839
36304 CITY OF RIVERTON 3,467 0.000479% 27,942 49,615
36305 CITY OF FARRAGUT 9,636 0.001332% 77,667 137,911
36306 CITY OF TABOR 17,751 0.002454% 143,078 254,061
See notes to Schedules.___________________________________________________________________________________________________
50

___________________________________________________________________________________________________Schedule 1
Change in NPL due to 1%
Increase in the Actuarial Assumed
Investment Return (8.00%)
Differences Between Expected
and Actual Experience
Changes of Assumptions
Difference Between
Projected and Actual
Investment Earnings on Pension Plan Investments
Total Deferred Outflows of Resources
Differences Between Expected
and Actual Experience
Difference Between
Projected and Actual
Investment Earnings on Pension Plan Investments
Total Deferred Inflows of Resources
Total Proportionate
Share of Allocable Plan
Pension Expense
DEFERRED OUTFLOWS OF RESOURCES
(Excluding Employer Specific Amounts) * (Excluding Employer Specific Amounts) *
DEFERRED INFLOWS OF RESOURCES
696,742 5,529 213,616 94,275 313,420 71,704 319,006 390,710 366,850
1,247,042 9,895 382,334 168,736 560,965 128,337 570,964 699,301 656,595
42,260 335 12,957 5,718 19,010 4,349 19,349 23,698 22,251
3,072,163 24,378 941,902 415,690 1,381,970 316,166 1,406,604 1,722,770 1,617,562
639,890 5,078 196,185 86,583 287,846 65,853 292,977 358,830 336,916
56,390 447 17,289 7,630 25,366 5,803 25,819 31,622 29,691
53,472 424 16,394 7,235 24,053 5,503 24,482 29,985 28,154
18,686 148 5,729 2,528 8,405 1,923 8,556 10,479 9,839
22,708 180 6,962 3,073 10,215 2,337 10,397 12,734 11,956
19,099 152 5,856 2,584 8,592 1,966 8,745 10,711 10,056
1,243 10 381 168 559 128 569 697 654
884,386 7,018 271,146 119,665 397,829 91,015 404,920 495,935 465,649
2,965,478 23,531 909,193 401,255 1,333,979 305,186 1,357,757 1,662,943 1,561,390
47,843 380 14,668 6,474 21,522 4,924 21,905 26,829 25,190
30,821 245 9,449 4,170 13,864 3,172 14,111 17,283 16,228
1,095,605 8,694 335,904 148,245 492,843 112,752 501,628 614,380 576,860
49,162 390 15,073 6,652 22,115 5,059 22,509 27,568 25,885
1,592,863 12,639 488,359 215,528 716,526 163,926 729,299 893,225 838,677
266,740 2,117 81,780 36,092 119,989 27,451 122,128 149,579 140,445
24,610 195 7,545 3,330 11,070 2,533 11,268 13,801 12,958
4,389 35 1,346 594 1,975 452 2,010 2,462 2,311
6,435 51 1,973 871 2,895 662 2,946 3,608 3,388
47,598 378 14,593 6,440 21,411 4,898 21,793 26,691 25,061
3,748 30 1,149 507 1,686 386 1,716 2,102 1,973
3,645 29 1,118 493 1,640 375 1,669 2,044 1,919
532 4 163 72 239 55 243 298 280
3,640 29 1,116 493 1,638 375 1,667 2,042 1,917
4,460 35 1,368 604 2,007 459 2,042 2,501 2,349
313,916 2,491 96,244 42,476 141,211 32,306 143,728 176,034 165,284
664,536 5,273 203,742 89,918 298,933 68,389 304,261 372,650 349,893
41,892 332 12,844 5,668 18,844 4,311 19,181 23,492 22,057
76,972 611 23,599 10,415 34,625 7,921 35,242 43,163 40,527
8,404 67 2,577 1,137 3,781 865 3,848 4,713 4,425
56,240 446 17,243 7,610 25,299 5,788 25,750 31,538 29,612
9,762 77 2,993 1,321 4,391 1,005 4,470 5,475 5,140
27,134 215 8,319 3,672 12,206 2,792 12,424 15,216 14,287
49,987 397 15,326 6,764 22,487 5,144 22,887 28,031 26,319
___________________________________________________________________________________________________51 (Continued)

___________________________________________________________________________________________________
Employer ID # Employer Name
2019 Actual Employer
Contributions
Employer Allocation
Percentage ** Net Pension
Liability (NPL)
Change in NPL due to 1%
Decrease in the Actuarial Assumed
Investment Return (6.00%)
Iowa Public Employees' Retirement System
Schedule of Employer Allocations and Collective Pension Amounts Allocated by Employer -Regular Membership Group
As of and for the year ended June 30, 2019
36308 CITY OF THURMAN 1,606 0.000222% 12,945 22,985
36310 CITY OF IMOGENE 57 0.000008% 457 811
36315 LOW RENT HOUSING AGENCY OF TABOR 1,587 0.000219% 12,791 22,712
36316 LOW RENT HOUSING AGENCY OF FARRAGUT 3,703 0.000512% 29,846 52,997
36317 LOW RENT HOUSING AGENCY OF HAMBURG 2,714 0.000375% 21,878 38,848
36318 LOW RENT HOUSING AGENCY OF SIDNEY 1,324 0.000183% 10,669 18,945
36532 SIDNEY COMMUNITY SCHOOL DISTRICT 350,821 0.048507% 2,827,715 5,021,109
36536 HAMBURG COMMUNITY SCHOOL DISTRICT 133,929 0.018518% 1,079,500 1,916,844
36537 FREMONT-MILLS COMMUNITY SCHOOL DISTRICT 281,009 0.038854% 2,265,006 4,021,920
36601 FREMONT CO LANDFILL COMMISSION 11,805 0.001632% 95,155 168,964
37201 GREENE COUNTY 291,218 0.040265% 2,347,298 4,168,043
37203 GREENE CO AGR EXT DIS 11,011 0.001522% 88,748 157,587
37204 GREENE COUNTY MEDICAL CENTER 987,952 0.136600% 7,963,158 14,139,997
37208 GREENE CO SOIL & WATER CONS DIST 2,207 0.000305% 17,786 31,583
37301 CITY OF RIPPEY 1,400 0.000194% 11,285 20,039
37302 CITY OF SCRANTON 7,061 0.000976% 56,913 101,059
37303 CITY OF JEFFERSON 124,230 0.017177% 1,001,329 1,778,038
37304 CITY OF GRAND JUNCTION 6,287 0.000869% 50,676 89,984
37306 CITY OF PATON 6,001 0.000830% 48,373 85,894
37307 CITY OF CHURDAN 6,439 0.000890% 51,900 92,158
37309 CITY OF DANA 317 0.000044% 2,556 4,539
37536 PATON-CHURDAN COMMUNITY SCHOOL DISTRICT 119,594 0.016536% 963,961 1,711,683
37701 GRAND JUNCTION MUNICIPAL LIGHT & WATER 15,344 0.002121% 123,673 219,603
38201 GRUNDY COUNTY 303,951 0.042026% 2,449,931 4,350,286
38204 GRUNDY COUNTY AGRICULTURAL EXT OFFICE 10,728 0.001483% 86,468 153,539
38210 GRUNDY CO SOIL & WATER CONS DIST 1,369 0.000189% 11,031 19,588
38301 CITY OF CONRAD 23,312 0.003223% 187,897 333,645
38302 CITY OF DIKE 25,570 0.003536% 206,104 365,975
38303 CITY OF GRUNDY CENTER 49,593 0.006857% 399,736 709,803
38304 CITY OF WELLSBURG 13,309 0.001840% 107,276 190,488
38305 CITY OF REINBECK 32,334 0.004471% 260,619 462,775
38307 CITY OF BEAMAN 3,475 0.000480% 28,005 49,729
38310 CITY OF STOUT 3,342 0.000462% 26,937 47,831
38313 CITY OF MORRISON 142 0.000020% 1,141 2,027
38318 CITY OF HOLLAND 1,466 0.000203% 11,818 20,985
38575 GRUNDY CENTER COMMUNITY SCHOOL DISTRICT 467,275 0.064608% 3,766,364 6,687,847
38577 DIKE-NEW HARTFORD COMMUNITY SCHOOL DIS 606,653 0.083879% 4,889,786 8,682,682
See notes to Schedules.___________________________________________________________________________________________________
52

___________________________________________________________________________________________________Schedule 1
Change in NPL due to 1%
Increase in the Actuarial Assumed
Investment Return (8.00%)
Differences Between Expected
and Actual Experience
Changes of Assumptions
Difference Between
Projected and Actual
Investment Earnings on Pension Plan Investments
Total Deferred Outflows of Resources
Differences Between Expected
and Actual Experience
Difference Between
Projected and Actual
Investment Earnings on Pension Plan Investments
Total Deferred Inflows of Resources
Total Proportionate
Share of Allocable Plan
Pension Expense
DEFERRED OUTFLOWS OF RESOURCES
(Excluding Employer Specific Amounts) * (Excluding Employer Specific Amounts) *
DEFERRED INFLOWS OF RESOURCES
4,522 36 1,387 612 2,035 465 2,071 2,536 2,381
159 1 49 22 72 16 73 89 84
4,469 35 1,370 605 2,010 460 2,046 2,506 2,353
10,427 83 3,197 1,411 4,691 1,073 4,774 5,847 5,490
7,643 61 2,343 1,034 3,438 787 3,500 4,287 4,024
3,728 30 1,143 504 1,677 384 1,707 2,091 1,963
987,920 7,839 302,889 133,674 444,402 101,670 452,324 553,994 520,162
377,146 2,993 115,630 51,031 169,654 38,813 172,678 211,491 198,576
791,326 6,279 242,615 107,073 355,967 81,438 362,312 443,750 416,651
33,244 264 10,192 4,498 14,954 3,421 15,221 18,642 17,504
820,077 6,507 251,429 110,963 368,899 84,397 375,476 459,873 431,789
31,006 246 9,506 4,195 13,947 3,191 14,196 17,387 16,325
2,782,092 22,076 852,968 376,441 1,251,485 286,314 1,273,793 1,560,107 1,464,833
6,214 49 1,905 841 2,795 640 2,845 3,485 3,272
3,943 31 1,209 533 1,773 406 1,805 2,211 2,076
19,884 158 6,096 2,690 8,944 2,046 9,104 11,150 10,469
349,835 2,776 107,257 47,336 157,369 36,003 160,173 196,176 184,196
17,705 140 5,428 2,396 7,964 1,822 8,106 9,928 9,322
16,900 134 5,181 2,287 7,602 1,739 7,738 9,477 8,898
18,132 144 5,559 2,453 8,156 1,866 8,302 10,168 9,547
893 7 274 121 402 92 409 501 470
336,779 2,672 103,254 45,569 151,495 34,659 154,196 188,855 177,322
43,208 343 13,247 5,846 19,436 4,447 19,783 24,230 22,750
855,934 6,792 262,423 115,815 385,030 88,087 391,893 479,980 450,668
30,209 240 9,262 4,088 13,590 3,109 13,832 16,941 15,906
3,854 31 1,182 521 1,734 397 1,765 2,162 2,029
65,646 521 20,127 8,882 29,530 6,756 30,056 36,812 34,564
72,007 571 22,077 9,743 32,391 7,410 32,969 40,379 37,913
139,656 1,108 42,817 18,897 62,822 14,372 63,942 78,314 73,532
37,479 297 11,491 5,071 16,859 3,857 17,160 21,017 19,734
91,053 723 27,916 12,320 40,959 9,371 41,689 51,060 47,941
9,784 78 3,000 1,324 4,402 1,007 4,480 5,487 5,152
9,411 75 2,885 1,273 4,233 969 4,309 5,278 4,955
399 3 122 54 179 41 183 224 210
4,129 33 1,266 559 1,858 425 1,890 2,315 2,174
1,315,857 10,441 403,432 178,047 591,920 135,419 602,471 737,890 692,828
1,708,347 13,556 523,766 231,154 768,476 175,811 782,174 957,985 899,483
___________________________________________________________________________________________________53 (Continued)

___________________________________________________________________________________________________
Employer ID # Employer Name
2019 Actual Employer
Contributions
Employer Allocation
Percentage ** Net Pension
Liability (NPL)
Change in NPL due to 1%
Decrease in the Actuarial Assumed
Investment Return (6.00%)
Iowa Public Employees' Retirement System
Schedule of Employer Allocations and Collective Pension Amounts Allocated by Employer -Regular Membership Group
As of and for the year ended June 30, 2019
38579 GLADBROOK-REINBECK COMM SCHOOL DISTRICT 301,148 0.041638% 2,427,334 4,310,162
38581 BCLUW COMMUNITY SCHOOL DISTRICT 385,634 0.053320% 3,108,317 5,519,367
38701 GRUNDY CENTER MUNIC LIGHT&POWER DEPT 48,647 0.006726% 392,105 696,251
39201 GUTHRIE COUNTY 359,674 0.049730% 2,899,067 5,147,807
39203 GUTHRIE COUNTY AGRI 8,958 0.001239% 72,204 128,210
39204 GUTHRIE COUNTY HOSPITAL 686,161 0.094872% 5,530,645 9,820,640
39205 GUTHRIE CO ASSESSOR 14,081 0.001947% 113,495 201,531
39301 CITY OF PANORA 50,546 0.006989% 407,413 723,435
39302 CITY OF GUTHRIE CTR 48,164 0.006659% 388,215 689,344
39303 CITY OF STUART 66,203 0.009154% 533,613 947,525
39304 CITY OF BAYARD 12,429 0.001719% 100,184 177,895
39305 CITY OF JAMAICA 2,088 0.000289% 16,833 29,891
39306 CITY OF BAGLEY 5,998 0.000829% 48,344 85,843
39307 CITY OF MENLO 6,665 0.000922% 53,725 95,399
39311 CITY OF YALE 2,481 0.000343% 19,997 35,508
39313 JAMAICA PUB LIBRARY 841 0.000116% 6,781 12,041
39540 GUTHRIE COMM SCH DIST 350,907 0.048518% 2,828,407 5,022,339
39544 PANORAMA COMMUNITY SCHOOL DISTRICT 473,012 0.065401% 3,812,607 6,769,960
40201 HAMILTON COUNTY 478,889 0.066214% 3,859,977 6,854,073
40202 HAMILTON HOSPITAL 1,186,192 0.164009% 9,561,027 16,977,297
40204 HAMILTON COUNTY AGRICULTURAL EXT. DIST. 14,718 0.002035% 118,635 210,657
40301 CITY OF ELLSWORTH 15,651 0.002164% 126,151 224,004
40302 CITY OF WEBSTER CITY 285,956 0.039538% 2,304,881 4,092,725
40303 CITY OF STRATFORD 15,715 0.002173% 126,669 224,923
40304 CITY OF JEWELL 13,044 0.001804% 105,137 186,689
40305 KENDALL YOUNG LIBRARY 31,405 0.004342% 253,134 449,484
40307 CITY OF BLAIRSBURG 2,828 0.000391% 22,793 40,473
40308 CITY OF WILLIAMS 8,864 0.001226% 71,450 126,872
40309 CITY OF STANHOPE 9,689 0.001340% 78,093 138,668
40310 CITY OF RANDALL 3,349 0.000463% 26,990 47,926
40311 CITY OF KAMRAR 1,552 0.000215% 12,509 22,212
40540 STRATFORD COMM SCH DIST 106,587 0.014737% 859,119 1,525,518
40541 WEBSTER CITY COMM SCH DIST 1,148,285 0.158768% 9,255,491 16,434,764
40542 SOUTH HAMILTON COMMUNITY SCHOOL DISTRICT 500,763 0.069238% 4,036,282 7,167,135
40543 NORTHEAST HAMILTON COMM SCH DIST 113,299 0.015665% 913,224 1,621,592
40601 HAMILTON CO SOLID WASTE COMM 14,583 0.002016% 117,540 208,714
41201 HANCOCK COUNTY 253,136 0.035000% 2,040,341 3,622,988
See notes to Schedules.___________________________________________________________________________________________________
54
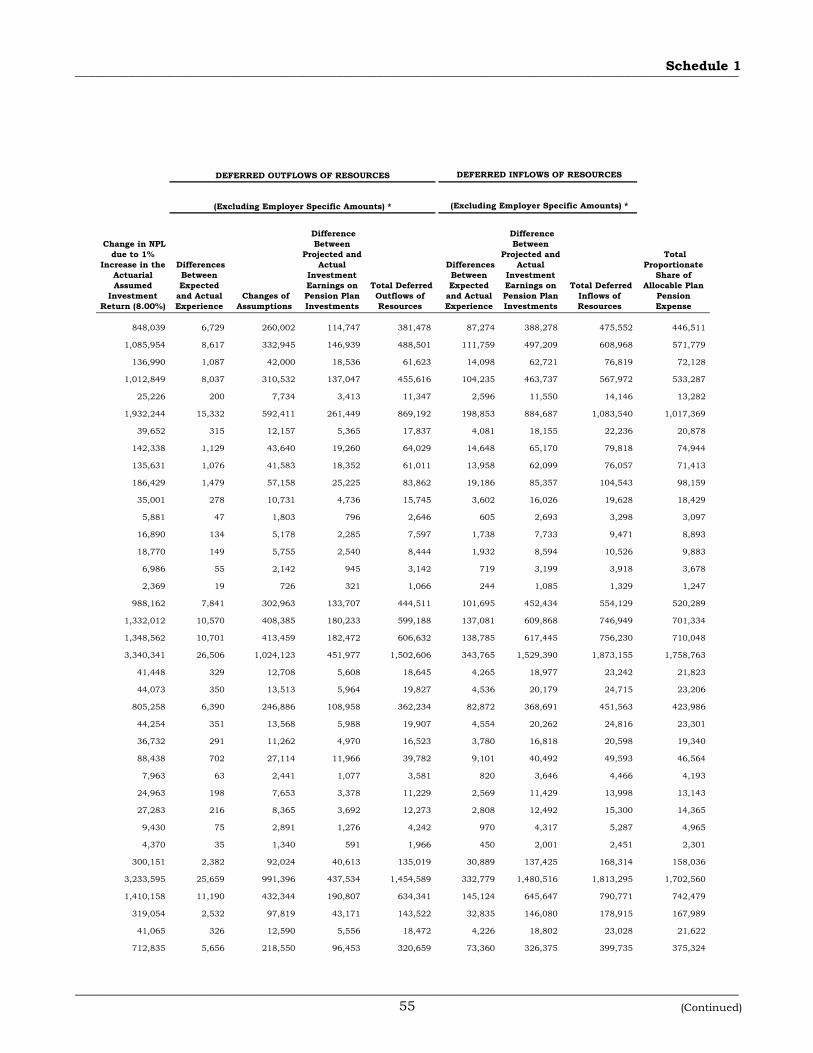
___________________________________________________________________________________________________Schedule 1
Change in NPL due to 1%
Increase in the Actuarial Assumed
Investment Return (8.00%)
Differences Between Expected
and Actual Experience
Changes of Assumptions
Difference Between
Projected and Actual
Investment Earnings on Pension Plan Investments
Total Deferred Outflows of Resources
Differences Between Expected
and Actual Experience
Difference Between
Projected and Actual
Investment Earnings on Pension Plan Investments
Total Deferred Inflows of Resources
Total Proportionate
Share of Allocable Plan
Pension Expense
DEFERRED OUTFLOWS OF RESOURCES
(Excluding Employer Specific Amounts) * (Excluding Employer Specific Amounts) *
DEFERRED INFLOWS OF RESOURCES
848,039 6,729 260,002 114,747 381,478 87,274 388,278 475,552 446,511
1,085,954 8,617 332,945 146,939 488,501 111,759 497,209 608,968 571,779
136,990 1,087 42,000 18,536 61,623 14,098 62,721 76,819 72,128
1,012,849 8,037 310,532 137,047 455,616 104,235 463,737 567,972 533,287
25,226 200 7,734 3,413 11,347 2,596 11,550 14,146 13,282
1,932,244 15,332 592,411 261,449 869,192 198,853 884,687 1,083,540 1,017,369
39,652 315 12,157 5,365 17,837 4,081 18,155 22,236 20,878
142,338 1,129 43,640 19,260 64,029 14,648 65,170 79,818 74,944
135,631 1,076 41,583 18,352 61,011 13,958 62,099 76,057 71,413
186,429 1,479 57,158 25,225 83,862 19,186 85,357 104,543 98,159
35,001 278 10,731 4,736 15,745 3,602 16,026 19,628 18,429
5,881 47 1,803 796 2,646 605 2,693 3,298 3,097
16,890 134 5,178 2,285 7,597 1,738 7,733 9,471 8,893
18,770 149 5,755 2,540 8,444 1,932 8,594 10,526 9,883
6,986 55 2,142 945 3,142 719 3,199 3,918 3,678
2,369 19 726 321 1,066 244 1,085 1,329 1,247
988,162 7,841 302,963 133,707 444,511 101,695 452,434 554,129 520,289
1,332,012 10,570 408,385 180,233 599,188 137,081 609,868 746,949 701,334
1,348,562 10,701 413,459 182,472 606,632 138,785 617,445 756,230 710,048
3,340,341 26,506 1,024,123 451,977 1,502,606 343,765 1,529,390 1,873,155 1,758,763
41,448 329 12,708 5,608 18,645 4,265 18,977 23,242 21,823
44,073 350 13,513 5,964 19,827 4,536 20,179 24,715 23,206
805,258 6,390 246,886 108,958 362,234 82,872 368,691 451,563 423,986
44,254 351 13,568 5,988 19,907 4,554 20,262 24,816 23,301
36,732 291 11,262 4,970 16,523 3,780 16,818 20,598 19,340
88,438 702 27,114 11,966 39,782 9,101 40,492 49,593 46,564
7,963 63 2,441 1,077 3,581 820 3,646 4,466 4,193
24,963 198 7,653 3,378 11,229 2,569 11,429 13,998 13,143
27,283 216 8,365 3,692 12,273 2,808 12,492 15,300 14,365
9,430 75 2,891 1,276 4,242 970 4,317 5,287 4,965
4,370 35 1,340 591 1,966 450 2,001 2,451 2,301
300,151 2,382 92,024 40,613 135,019 30,889 137,425 168,314 158,036
3,233,595 25,659 991,396 437,534 1,454,589 332,779 1,480,516 1,813,295 1,702,560
1,410,158 11,190 432,344 190,807 634,341 145,124 645,647 790,771 742,479
319,054 2,532 97,819 43,171 143,522 32,835 146,080 178,915 167,989
41,065 326 12,590 5,556 18,472 4,226 18,802 23,028 21,622
712,835 5,656 218,550 96,453 320,659 73,360 326,375 399,735 375,324
___________________________________________________________________________________________________55 (Continued)

___________________________________________________________________________________________________
Employer ID # Employer Name
2019 Actual Employer
Contributions
Employer Allocation
Percentage ** Net Pension
Liability (NPL)
Change in NPL due to 1%
Decrease in the Actuarial Assumed
Investment Return (6.00%)
Iowa Public Employees' Retirement System
Schedule of Employer Allocations and Collective Pension Amounts Allocated by Employer -Regular Membership Group
As of and for the year ended June 30, 2019
41203 HANCOCK COUNTY AGRI EXT DIST 12,646 0.001749% 101,932 180,998
41204 HANCOCK COUNTY HEALTH SYSTEM 785,210 0.108567% 6,329,004 11,238,268
41301 CITY OF KLEMME 8,904 0.001231% 71,766 127,434
41302 CITY OF BRITT 33,350 0.004611% 268,811 477,321
41303 CITY OF GARNER 60,206 0.008324% 485,274 861,690
41304 CITY OF CORWITH 7,989 0.001105% 64,393 114,341
41305 CITY OF KANAWHA 10,034 0.001387% 80,880 143,617
41306 CITY OF CRYSTAL LAKE 3,444 0.000476% 27,757 49,288
41308 CITY OF WODEN 3,984 0.000551% 32,114 57,024
41309 CITY OF GOODELL 1,159 0.000160% 9,344 16,591
41404 CONCORD TOWNSHIP - HANCOCK COUNTY 906 0.000125% 7,305 12,971
41407 ELL TOWNSHIP - HANCOCK COUNTY 1,133 0.000157% 9,131 16,213
41540 WEST HANCOCK COMMUNITY SCHOOL DISTRICT 392,214 0.054230% 3,161,348 5,613,533
42001 STATE - DEPT OF HUMAN SERVICES/ELDORA 845,366 0.116885% 6,813,877 12,099,245
42201 HARDIN COUNTY 394,028 0.054480% 3,175,971 5,639,500
42203 HARDIN COUNTY AGRI 13,219 0.001828% 106,548 189,194
42206 HARDIN CO SOIL & WATER CONS DIST 649 0.000090% 5,235 9,295
42207 RURAL IOWA WASTE MANAGEMENT ASSOCIATION 17,699 0.002447% 142,662 253,322
42301 CITY OF RADCLIFFE 9,738 0.001346% 78,491 139,376
42302 CITY OF ACKLEY 25,593 0.003539% 206,283 366,292
42303 CITY OF ELDORA 70,260 0.009714% 566,311 1,005,586
42304 CITY OF IOWA FALLS 132,860 0.018370% 1,070,888 1,901,551
42307 ELLSWORTH MUNICIPAL HOSPITAL 844,778 0.116804% 6,809,139 12,090,833
42310 CITY OF ALDEN 19,099 0.002641% 153,945 273,356
42311 CITY OF STEAMBOAT ROCK 1,952 0.000270% 15,730 27,931
42313 CITY OF BUCKEYE 780 0.000108% 6,291 11,171
42314 CITY OF UNION 7,067 0.000977% 56,963 101,148
42315 CITY OF HUBBARD 16,735 0.002314% 134,886 239,513
42317 CITY OF WHITTEN 623 0.000086% 5,022 8,917
42323 STEAMBOAT ROCK PUBLIC LIBRARY 1,381 0.000191% 11,127 19,758
42326 CITY OF NEW PROVIDENCE 2,265 0.000313% 18,255 32,415
42327 CITY OF OWASA 127 0.000018% 1,027 1,824
42333 CENTRAL IOWA JUVENILE DETENTION CTR 411,506 0.056897% 3,316,853 5,889,660
42549 ELDORA NEW PROVIDENCE COMM SCH DIST 406,101 0.056150% 3,273,287 5,812,302
42550 HUBBARD-RADCLIFFE COM SCHOOL DISTRICT 271,109 0.037485% 2,185,208 3,880,224
42555 IOWA FALLS COMMUNITY SCHOOL DISTRICT 839,546 0.116080% 6,766,968 12,015,951
42556 ALDEN COMMUNITY SCHOOL DISTRICT 147,100 0.020339% 1,185,669 2,105,365
See notes to Schedules.___________________________________________________________________________________________________
56

___________________________________________________________________________________________________Schedule 1
Change in NPL due to 1%
Increase in the Actuarial Assumed
Investment Return (8.00%)
Differences Between Expected
and Actual Experience
Changes of Assumptions
Difference Between
Projected and Actual
Investment Earnings on Pension Plan Investments
Total Deferred Outflows of Resources
Differences Between Expected
and Actual Experience
Difference Between
Projected and Actual
Investment Earnings on Pension Plan Investments
Total Deferred Inflows of Resources
Total Proportionate
Share of Allocable Plan
Pension Expense
DEFERRED OUTFLOWS OF RESOURCES
(Excluding Employer Specific Amounts) * (Excluding Employer Specific Amounts) *
DEFERRED INFLOWS OF RESOURCES
35,612 283 10,918 4,819 16,020 3,665 16,305 19,970 18,751
2,211,167 17,546 677,927 299,190 994,663 227,558 1,012,393 1,239,951 1,164,229
25,073 199 7,687 3,393 11,279 2,580 11,480 14,060 13,201
93,915 745 28,793 12,707 42,245 9,665 42,999 52,664 49,448
169,540 1,345 51,980 22,940 76,265 17,448 77,625 95,073 89,267
22,497 179 6,897 3,044 10,120 2,315 10,300 12,615 11,845
28,257 224 8,663 3,823 12,710 2,908 12,938 15,846 14,878
9,698 77 2,973 1,312 4,362 998 4,440 5,438 5,106
11,220 89 3,440 1,518 5,047 1,155 5,137 6,292 5,907
3,264 26 1,001 442 1,469 336 1,495 1,831 1,719
2,552 20 782 345 1,147 263 1,168 1,431 1,344
3,190 25 978 432 1,435 328 1,461 1,789 1,680
1,104,482 8,764 338,626 149,446 496,836 113,666 505,692 619,358 581,534
2,380,568 18,890 729,864 322,111 1,070,865 244,991 1,089,953 1,334,944 1,253,422
1,109,591 8,805 340,192 150,137 499,134 114,191 508,031 622,222 584,224
37,225 295 11,413 5,037 16,745 3,831 17,043 20,874 19,600
1,829 15 561 247 823 188 837 1,025 963
49,842 395 15,281 6,744 22,420 5,129 22,820 27,949 26,243
27,423 218 8,408 3,711 12,337 2,822 12,556 15,378 14,439
72,069 572 22,096 9,752 32,420 7,417 32,997 40,414 37,946
197,852 1,570 60,660 26,771 89,001 20,362 90,588 110,950 104,174
374,137 2,969 114,707 50,624 168,300 38,504 171,300 209,804 196,991
2,378,912 18,877 729,356 321,888 1,070,121 244,821 1,089,196 1,334,017 1,252,550
53,784 427 16,490 7,277 24,194 5,535 24,625 30,160 28,318
5,495 44 1,685 744 2,473 566 2,516 3,082 2,893
2,198 17 674 297 988 226 1,006 1,232 1,157
19,901 158 6,102 2,693 8,953 2,048 9,112 11,160 10,478
47,125 374 14,448 6,376 21,198 4,850 21,576 26,426 24,812
1,754 14 538 237 789 181 803 984 924
3,888 31 1,192 526 1,749 400 1,780 2,180 2,047
6,378 51 1,955 863 2,869 656 2,920 3,576 3,358
359 3 110 49 162 37 164 201 189
1,158,811 9,195 355,282 156,797 521,274 119,257 530,567 649,824 610,139
1,143,590 9,074 350,616 154,738 514,428 117,690 523,598 641,288 602,126
763,447 6,058 234,067 103,301 343,426 78,569 349,548 428,117 401,972
2,364,179 18,760 724,839 319,894 1,063,493 243,305 1,082,450 1,325,755 1,244,793
414,238 3,287 127,002 56,050 186,339 42,630 189,661 232,291 218,105
___________________________________________________________________________________________________57 (Continued)

___________________________________________________________________________________________________
Employer ID # Employer Name
2019 Actual Employer
Contributions
Employer Allocation
Percentage ** Net Pension
Liability (NPL)
Change in NPL due to 1%
Decrease in the Actuarial Assumed
Investment Return (6.00%)
Iowa Public Employees' Retirement System
Schedule of Employer Allocations and Collective Pension Amounts Allocated by Employer -Regular Membership Group
As of and for the year ended June 30, 2019
43201 HARRISON COUNTY 443,955 0.061384% 3,578,401 6,354,084
43203 HARRISON COUNTY AGR EXT DIST 13,027 0.001801% 105,001 186,448
43301 CITY OF MISSOURI VALLEY 48,659 0.006728% 392,206 696,431
43303 CITY OF WOODBINE 22,303 0.003084% 179,769 319,212
43305 CITY OF DUNLAP 16,790 0.002322% 135,334 240,309
43306 CITY OF LOGAN 27,704 0.003830% 223,301 396,510
43307 CITY OF PERSIA 2,688 0.000372% 21,665 38,470
43308 CITY OF PISGAH 7,803 0.001079% 62,892 111,676
43309 CITY OF MODALE 5,080 0.000702% 40,948 72,711
43310 CITY OF MONDAMIN 6,626 0.000916% 53,410 94,839
43311 WOODBINE PUBLIC LIBRARY 4,689 0.000648% 37,794 67,111
43315 CITY OF MAGNOLIA 2,426 0.000335% 19,555 34,723
43317 CITY OF LITTLE SIOUX 2,212 0.000306% 17,831 31,662
43318 LOW RENT HOUSING AGENCY OF MISSOURI VAL 11,440 0.001582% 92,210 163,735
43522 MISSOURI VALLEY COMMUNITY SCHOOL DIST 482,035 0.066649% 3,885,336 6,899,103
43563 WEST HARRISON COMM SCH DIST 219,878 0.030401% 1,772,272 3,146,984
43564 LOGAN MAGNOLIA COMM SCH DIST 411,938 0.056957% 3,320,329 5,895,833
43565 WOODBINE COMMUNITY SCHOOL DISTRICT 2 320,204 0.044273% 2,580,930 4,582,898
43567 BOYER VALLEY COMMUNITY SCHOOL DISTRICT 302,087 0.041768% 2,434,902 4,323,600
43701 MUNIC LIGHT&POWER PLT 21,554 0.002980% 173,732 308,492
44005 STATE - DEPT OF CORRECTIONS/MT PLEASANT 138,396 0.019135% 1,115,512 1,980,790
44201 HENRY COUNTY 406,193 0.056163% 3,274,029 5,813,618
44203 HENRY COUNTY AGRICULTURAL EXT OFFICE 29,217 0.004040% 235,501 418,173
44204 HENRY COUNTY HEALTH CENTER 1,182,476 0.163496% 9,531,080 16,924,122
44301 CITY OF MOUNT PLEASANT 104,150 0.014400% 839,481 1,490,647
44302 CITY OF WINFIELD 24,443 0.003380% 197,016 349,838
44303 CITY OF NEW LONDON 66,425 0.009184% 535,405 950,706
44306 CITY OF WAYLAND 26,138 0.003614% 210,676 374,093
44307 CITY OF SALEM 5,474 0.000757% 44,123 78,348
44308 CITY OF OLDS 3,362 0.000465% 27,101 48,123
44310 CITY OF ROME 1,009 0.000140% 8,134 14,443
44312 CITY OF COPPOCK 139 0.000019% 1,123 1,994
44313 CITY OF HILLSBORO 1,286 0.000178% 10,362 18,399
44563 NEW LONDON COMMUNITY SCHOOL DISTRICT 356,485 0.049290% 2,873,365 5,102,168
44564 MT PLEASANT COMMUNITY SCHOOL DISTRICT 1,231,023 0.170208% 9,922,382 17,618,948
44567 WINFIELD MT UNION COMMUNITY SCHOOL DIST 275,066 0.038032% 2,217,104 3,936,860
44568 WACO COMMUNITY SCHOOL DISTRICT 312,519 0.043211% 2,518,987 4,472,908
See notes to Schedules.___________________________________________________________________________________________________
58

___________________________________________________________________________________________________Schedule 1
Change in NPL due to 1%
Increase in the Actuarial Assumed
Investment Return (8.00%)
Differences Between Expected
and Actual Experience
Changes of Assumptions
Difference Between
Projected and Actual
Investment Earnings on Pension Plan Investments
Total Deferred Outflows of Resources
Differences Between Expected
and Actual Experience
Difference Between
Projected and Actual
Investment Earnings on Pension Plan Investments
Total Deferred Inflows of Resources
Total Proportionate
Share of Allocable Plan
Pension Expense
DEFERRED OUTFLOWS OF RESOURCES
(Excluding Employer Specific Amounts) * (Excluding Employer Specific Amounts) *
DEFERRED INFLOWS OF RESOURCES
1,250,188 9,920 383,298 169,161 562,379 128,661 572,404 701,065 658,252
36,684 291 11,247 4,964 16,502 3,775 16,796 20,571 19,315
137,025 1,087 42,011 18,541 61,639 14,102 62,738 76,840 72,147
62,806 498 19,256 8,498 28,252 6,464 28,756 35,220 33,069
47,282 375 14,496 6,398 21,269 4,866 21,648 26,514 24,895
78,015 619 23,919 10,556 35,094 8,029 35,719 43,748 41,076
7,569 60 2,321 1,024 3,405 779 3,466 4,245 3,985
21,973 174 6,737 2,973 9,884 2,261 10,060 12,321 11,569
14,306 114 4,386 1,936 6,436 1,472 6,550 8,022 7,532
18,660 148 5,721 2,525 8,394 1,920 8,543 10,463 9,825
13,204 105 4,048 1,787 5,940 1,359 6,046 7,405 6,952
6,832 54 2,095 924 3,073 703 3,128 3,831 3,597
6,230 49 1,910 843 2,802 641 2,852 3,493 3,280
32,215 256 9,877 4,359 14,492 3,315 14,750 18,065 16,962
1,357,422 10,771 416,175 183,671 610,617 139,696 621,502 761,198 714,713
619,180 4,913 189,836 83,780 278,529 63,722 283,494 347,216 326,012
1,160,025 9,205 355,655 156,961 521,821 119,382 531,123 650,505 610,779
901,701 7,155 276,455 122,008 405,618 92,797 412,848 505,645 474,765
850,683 6,750 260,813 115,105 382,668 87,546 389,489 477,035 447,903
60,697 482 18,609 8,213 27,304 6,247 27,790 34,037 31,958
389,727 3,093 119,487 52,733 175,313 40,108 178,438 218,546 205,200
1,143,849 9,077 350,695 154,773 514,545 117,717 523,716 641,433 602,262
82,277 653 25,225 11,133 37,011 8,467 37,671 46,138 43,321
3,329,878 26,423 1,020,915 450,561 1,497,899 342,688 1,524,600 1,867,288 1,753,255
293,290 2,327 89,920 39,685 131,932 30,183 134,284 164,467 154,424
68,832 546 21,103 9,314 30,963 7,084 31,515 38,599 36,241
187,055 1,484 57,350 25,310 84,144 19,250 85,644 104,894 98,488
73,604 584 22,566 9,959 33,109 7,575 33,700 41,275 38,754
15,415 122 4,726 2,086 6,934 1,586 7,058 8,644 8,116
9,468 75 2,903 1,281 4,259 974 4,335 5,309 4,985
2,842 23 871 385 1,279 292 1,301 1,593 1,496
392 3 120 53 176 40 180 220 207
3,620 29 1,110 490 1,629 373 1,657 2,030 1,906
1,003,869 7,966 307,779 135,832 451,577 103,311 459,626 562,937 528,559
3,466,588 27,508 1,062,829 469,059 1,559,396 356,757 1,587,193 1,943,950 1,825,235
774,591 6,146 237,484 104,809 348,439 79,715 354,650 434,365 407,839
880,060 6,983 269,820 119,080 395,883 90,570 402,939 493,509 463,371
___________________________________________________________________________________________________59 (Continued)

___________________________________________________________________________________________________
Employer ID # Employer Name
2019 Actual Employer
Contributions
Employer Allocation
Percentage ** Net Pension
Liability (NPL)
Change in NPL due to 1%
Decrease in the Actuarial Assumed
Investment Return (6.00%)
Iowa Public Employees' Retirement System
Schedule of Employer Allocations and Collective Pension Amounts Allocated by Employer -Regular Membership Group
As of and for the year ended June 30, 2019
44701 MT PLEASANT UTILITIES 201,983 0.027927% 1,628,039 2,890,872
45201 HOWARD COUNTY 261,160 0.036109% 2,105,023 3,737,841
45203 HOWARD COUNTY AGRI EXT DIST 7,714 0.001067% 62,175 110,403
45205 REGIONAL HEALTH SERVICES OF HOWARD CO 766,625 0.105998% 6,179,206 10,972,274
45207 HOWARD SOIL & WTR. CONS. DIST. 11,015 0.001523% 88,787 157,658
45301 CITY OF ELMA 12,294 0.001700% 99,095 175,961
45302 CITY OF CRESCO 103,732 0.014343% 836,106 1,484,654
45303 CITY OF CHESTER 2,285 0.000316% 18,417 32,703
45304 CITY OF LIME SPRINGS 9,007 0.001245% 72,602 128,918
45305 CITY OF PROTIVIN 4,144 0.000573% 33,403 59,313
45526 HOWARD WINNESHIEK COMM SCH DIST 789,989 0.109228% 6,367,522 11,306,664
45527 RICEVILLE COMMUNITY SCHOOL DISTRICT 210,468 0.029100% 1,696,429 3,012,310
46201 HUMBOLDT COUNTY 264,813 0.036614% 2,134,461 3,790,114
46203 HUMBOLDT COUNTY AGRI 6,015 0.000832% 48,481 86,086
46205 HUMBOLDT COUNTY MEMORIAL HOSPITAL 775,171 0.107180% 6,248,091 11,094,593
46301 CITY OF RENWICK 13,185 0.001823% 106,273 188,707
46302 CITY OF HUMBOLDT 102,011 0.014105% 822,236 1,460,026
46303 CITY OF RUTLAND 1,335 0.000185% 10,764 19,113
46304 CITY OF DAKOTA CITY 20,112 0.002781% 162,109 287,853
46305 CITY OF LIVERMORE 11,283 0.001560% 90,942 161,483
46307 CITY OF BODE 8,522 0.001178% 68,693 121,977
46308 CITY OF OTTOSEN 623 0.000086% 5,023 8,919
46309 CITY OF THOR 3,193 0.000442% 25,738 45,702
46311 CITY OF BRADGATE 264 0.000037% 2,130 3,783
46313 CITY OF PIONEER 497 0.000069% 4,002 7,107
46314 CITY OF HARDY 793 0.000110% 6,391 11,349
46315 LU VERNE PUB LIBRARY 1,133 0.000157% 9,133 16,217
46531 TWIN RIVERS COMMUNITY SCHOOL 57,177 0.007906% 460,866 818,349
46533 HUMBOLDT COMMUNITY SCHOOL DISTRICT 892,649 0.123423% 7,194,992 12,775,983
46534 GILMORE CITY & BRADGATE COMM SCH DIST 107,395 0.014849% 865,633 1,537,086
46601 NORTH IOWA MUNICIPAL ELECTRIC COOP ASSOC 16,174 0.002236% 130,364 231,485
47201 IDA COUNTY 145,693 0.020144% 1,174,328 2,085,228
47204 IDA COUNTY AGRI 6,452 0.000892% 52,009 92,351
47301 CITY OF ARTHUR 4,700 0.000650% 37,884 67,270
47302 CITY OF BATTLE CREEK 10,563 0.001461% 85,143 151,187
47303 CITY OF IDA GROVE 58,936 0.008149% 475,042 843,522
47304 CITY OF HOLSTEIN 34,462 0.004765% 277,776 493,241
See notes to Schedules.___________________________________________________________________________________________________
60

___________________________________________________________________________________________________Schedule 1
Change in NPL due to 1%
Increase in the Actuarial Assumed
Investment Return (8.00%)
Differences Between Expected
and Actual Experience
Changes of Assumptions
Difference Between
Projected and Actual
Investment Earnings on Pension Plan Investments
Total Deferred Outflows of Resources
Differences Between Expected
and Actual Experience
Difference Between
Projected and Actual
Investment Earnings on Pension Plan Investments
Total Deferred Inflows of Resources
Total Proportionate
Share of Allocable Plan
Pension Expense
DEFERRED OUTFLOWS OF RESOURCES
(Excluding Employer Specific Amounts) * (Excluding Employer Specific Amounts) *
DEFERRED INFLOWS OF RESOURCES
568,789 4,513 174,386 76,962 255,861 58,536 260,423 318,959 299,480
735,433 5,836 225,478 99,510 330,824 75,686 336,721 412,407 387,222
21,722 172 6,660 2,939 9,771 2,236 9,946 12,182 11,437
2,158,832 17,130 661,881 292,109 971,120 222,172 988,431 1,210,603 1,136,673
31,020 246 9,510 4,197 13,953 3,192 14,202 17,394 16,333
34,621 275 10,615 4,685 15,575 3,563 15,851 19,414 18,229
292,111 2,318 89,559 39,525 131,402 30,062 133,744 163,806 153,803
6,434 51 1,973 871 2,895 662 2,946 3,608 3,388
25,365 201 7,777 3,432 11,410 2,610 11,614 14,224 13,355
11,670 93 3,578 1,579 5,250 1,201 5,343 6,544 6,145
2,224,624 17,653 682,053 301,011 1,000,717 228,943 1,018,554 1,247,497 1,171,314
592,682 4,703 181,712 80,195 266,610 60,995 271,362 332,357 312,060
745,718 5,917 228,631 100,902 335,450 76,744 341,430 418,174 392,637
16,938 134 5,193 2,292 7,619 1,743 7,755 9,498 8,918
2,182,899 17,321 669,260 295,365 981,946 224,649 999,450 1,224,099 1,149,345
37,129 295 11,383 5,024 16,702 3,821 17,000 20,821 19,549
287,265 2,279 88,073 38,869 129,221 29,563 131,526 161,089 151,251
3,761 30 1,153 509 1,692 387 1,722 2,109 1,980
56,636 449 17,364 7,663 25,476 5,829 25,931 31,760 29,820
31,772 252 9,741 4,299 14,292 3,270 14,547 17,817 16,729
23,999 190 7,358 3,247 10,795 2,470 10,988 13,458 12,636
1,755 14 538 237 789 181 803 984 924
8,992 71 2,757 1,217 4,045 925 4,117 5,042 4,735
744 6 228 101 335 77 341 418 392
1,398 11 429 189 629 144 640 784 736
2,233 18 685 302 1,005 230 1,022 1,252 1,176
3,191 25 978 432 1,435 328 1,461 1,789 1,680
161,013 1,278 49,365 21,786 72,429 16,570 73,720 90,290 84,777
2,513,718 19,947 770,687 340,128 1,130,762 258,694 1,150,917 1,409,611 1,323,528
302,427 2,400 92,722 40,921 136,043 31,124 138,467 169,591 159,234
45,545 361 13,964 6,163 20,488 4,687 20,853 25,540 23,981
410,276 3,256 125,787 55,514 184,557 42,223 187,847 230,070 216,019
18,170 144 5,571 2,459 8,174 1,870 8,319 10,189 9,567
13,236 105 4,058 1,791 5,954 1,362 6,060 7,422 6,969
29,747 236 9,120 4,025 13,381 3,061 13,620 16,681 15,662
165,966 1,317 50,884 22,457 74,658 17,080 75,988 93,068 87,385
97,047 770 29,754 13,131 43,655 9,987 44,433 54,420 51,097
___________________________________________________________________________________________________61 (Continued)

___________________________________________________________________________________________________
Employer ID # Employer Name
2019 Actual Employer
Contributions
Employer Allocation
Percentage ** Net Pension
Liability (NPL)
Change in NPL due to 1%
Decrease in the Actuarial Assumed
Investment Return (6.00%)
Iowa Public Employees' Retirement System
Schedule of Employer Allocations and Collective Pension Amounts Allocated by Employer -Regular Membership Group
As of and for the year ended June 30, 2019
47306 CITY OF GALVA 7,845 0.001085% 63,231 112,278
47308 IDA GROVE CEMETERY 366 0.000051% 2,950 5,239
47310 HOLSTEIN CEMETERY ASSOCIATION 864 0.000119% 6,962 12,363
47520 BATTLE CREEK - IDA GROVE COMM SCH DIST 54,310 0.007509% 437,753 777,307
47523 GALVA-HOLSTEIN COMMUNITY SCHOOL DISTRICT 311,090 0.043013% 2,507,466 4,452,450
48201 IOWA COUNTY 445,515 0.061599% 3,590,972 6,376,406
48203 IOWA COUNTY AGRICULTURAL EXTENSION DIST 11,726 0.001621% 94,515 167,829
48208 IOWA CO SOIL & WATER CONS DIST 7,069 0.000977% 56,981 101,179
48301 CITY OF VICTOR 17,708 0.002448% 142,735 253,451
48302 CITY OF LADORA 1,001 0.000138% 8,065 14,322
48303 CITY OF WILLIAMSBURG 60,471 0.008361% 487,416 865,494
48305 CITY OF MARENGO 40,811 0.005643% 328,950 584,108
48307 CITY OF PARNELL 1,020 0.000141% 8,218 14,592
48308 CITY OF NORTH ENGLISH 13,975 0.001932% 112,643 200,018
48310 MARENGO MEMORIAL HOSPITAL 872,106 0.120582% 7,029,410 12,481,964
48311 CITY OF MILLERSBURG 1,293 0.000179% 10,426 18,513
48556 WILLIAMSBURG COMMUNITY SCHOOL DISTRICT 750,312 0.103742% 6,047,718 10,738,795
48558 ENGLISH VALLEY COMMUNITY SCHOOL DISTRIC 337,007 0.046596% 2,716,366 4,823,388
48559 IOWA VALLEY COMMUNITY SCHOOL DISTRICT 348,782 0.048225% 2,811,277 4,991,920
48561 H L V COMMUNITY SCHOOL DISTRICT 228,255 0.031560% 1,839,795 3,266,882
49201 JACKSON COUNTY 361,816 0.050027% 2,916,335 5,178,469
49202 JACKSON COUNTY REGIONAL HEALTH CENTER 491,303 0.067930% 3,960,033 7,031,740
49204 JACKSON COUNTY AGRI 12,199 0.001687% 98,328 174,599
49208 JACKSON CO SOIL & WATER CONS DIST 836 0.000116% 6,736 11,961
49301 CITY OF MAQUOKETA 108,769 0.015039% 876,711 1,556,755
49302 CITY OF SABULA 20,196 0.002792% 162,789 289,061
49303 CITY OF PRESTON 30,739 0.004250% 247,762 439,945
49304 CITY OF BELLEVUE 86,703 0.011988% 698,846 1,240,924
49307 CITY OF BALDWIN 1,393 0.000193% 11,231 19,942
49308 CITY OF MILES 10,517 0.001454% 84,769 150,523
49309 CITY OF LA MOTTE 1,623 0.000224% 13,078 23,222
49311 CITY OF ANDREW 4,191 0.000579% 33,778 59,978
49312 CITY OF MONMOUTH 1,419 0.000196% 11,441 20,315
49316 CITY OF SPRINGBROOK 1,247 0.000172% 10,049 17,843
49317 CITY OF SPRAGUEVILLE 718 0.000099% 5,784 10,270
49560 ANDREW COMMUNITY SCHOOL DISTRICT 140,143 0.019377% 1,129,588 2,005,783
49561 BELLEVUE COMMUNITY SCHOOL DISTRICT 408,902 0.056537% 3,295,864 5,852,390
See notes to Schedules.___________________________________________________________________________________________________
62

___________________________________________________________________________________________________Schedule 1
Change in NPL due to 1%
Increase in the Actuarial Assumed
Investment Return (8.00%)
Differences Between Expected
and Actual Experience
Changes of Assumptions
Difference Between
Projected and Actual
Investment Earnings on Pension Plan Investments
Total Deferred Outflows of Resources
Differences Between Expected
and Actual Experience
Difference Between
Projected and Actual
Investment Earnings on Pension Plan Investments
Total Deferred Inflows of Resources
Total Proportionate
Share of Allocable Plan
Pension Expense
DEFERRED OUTFLOWS OF RESOURCES
(Excluding Employer Specific Amounts) * (Excluding Employer Specific Amounts) *
DEFERRED INFLOWS OF RESOURCES
22,091 175 6,773 2,989 9,937 2,273 10,114 12,387 11,631
1,031 8 316 139 463 106 472 578 543
2,432 19 746 329 1,094 250 1,114 1,364 1,281
152,938 1,214 46,890 20,694 68,798 15,739 70,023 85,762 80,525
876,035 6,951 268,585 118,535 394,071 90,155 401,096 491,251 461,252
1,254,580 9,955 384,644 169,756 564,355 129,113 574,415 703,528 660,564
33,021 262 10,124 4,468 14,854 3,398 15,119 18,517 17,386
19,907 158 6,103 2,694 8,955 2,049 9,115 11,164 10,482
49,867 396 15,289 6,747 22,432 5,132 22,832 27,964 26,256
2,818 22 864 381 1,267 290 1,290 1,580 1,484
170,289 1,351 52,209 23,042 76,602 17,525 77,968 95,493 89,661
114,925 912 35,235 15,550 51,697 11,827 52,619 64,446 60,511
2,871 23 880 388 1,291 295 1,314 1,609 1,512
39,354 312 12,066 5,325 17,703 4,050 18,018 22,068 20,721
2,455,869 19,487 752,950 332,300 1,104,737 252,741 1,124,430 1,377,171 1,293,069
3,642 29 1,117 493 1,639 375 1,668 2,043 1,918
2,112,894 16,766 647,797 285,893 950,456 217,444 967,398 1,184,842 1,112,486
949,018 7,531 290,962 128,410 426,903 97,666 434,512 532,178 499,679
982,177 7,794 301,128 132,897 441,819 101,079 449,694 550,773 517,138
642,770 5,100 197,068 86,972 289,140 66,149 294,295 360,444 338,433
1,018,881 8,085 312,381 137,863 458,329 104,856 466,499 571,355 536,464
1,383,519 10,978 424,176 187,202 622,356 142,382 633,450 775,832 728,453
34,353 273 10,532 4,648 15,453 3,535 15,729 19,264 18,088
2,353 19 722 318 1,059 242 1,078 1,320 1,239
306,297 2,430 93,908 41,445 137,783 31,522 140,239 171,761 161,272
56,874 451 17,437 7,696 25,584 5,853 26,040 31,893 29,945
86,561 687 26,539 11,712 38,938 8,908 39,632 48,540 45,576
244,156 1,937 74,856 33,036 109,829 25,127 111,788 136,915 128,554
3,924 31 1,203 531 1,765 404 1,796 2,200 2,066
29,616 235 9,080 4,007 13,322 3,048 13,560 16,608 15,593
4,569 36 1,401 618 2,055 470 2,092 2,562 2,406
11,801 94 3,618 1,597 5,309 1,214 5,403 6,617 6,213
3,997 32 1,225 541 1,798 411 1,830 2,241 2,105
3,511 28 1,076 475 1,579 361 1,607 1,968 1,848
2,021 16 620 273 909 208 925 1,133 1,064
394,645 3,132 120,995 53,399 177,526 40,614 180,690 221,304 207,789
1,151,478 9,137 353,034 155,805 517,976 118,502 527,209 645,711 606,278
___________________________________________________________________________________________________63 (Continued)
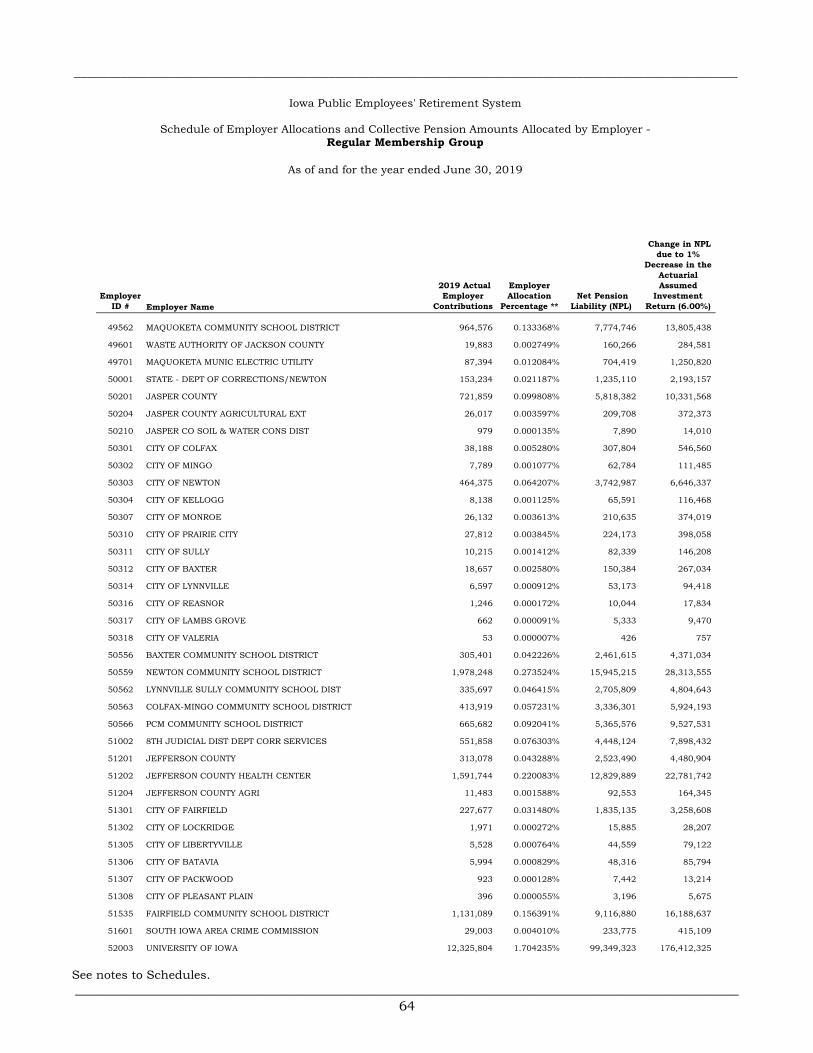
___________________________________________________________________________________________________
Employer ID # Employer Name
2019 Actual Employer
Contributions
Employer Allocation
Percentage ** Net Pension
Liability (NPL)
Change in NPL due to 1%
Decrease in the Actuarial Assumed
Investment Return (6.00%)
Iowa Public Employees' Retirement System
Schedule of Employer Allocations and Collective Pension Amounts Allocated by Employer -Regular Membership Group
As of and for the year ended June 30, 2019
49562 MAQUOKETA COMMUNITY SCHOOL DISTRICT 964,576 0.133368% 7,774,746 13,805,438
49601 WASTE AUTHORITY OF JACKSON COUNTY 19,883 0.002749% 160,266 284,581
49701 MAQUOKETA MUNIC ELECTRIC UTILITY 87,394 0.012084% 704,419 1,250,820
50001 STATE - DEPT OF CORRECTIONS/NEWTON 153,234 0.021187% 1,235,110 2,193,157
50201 JASPER COUNTY 721,859 0.099808% 5,818,382 10,331,568
50204 JASPER COUNTY AGRICULTURAL EXT 26,017 0.003597% 209,708 372,373
50210 JASPER CO SOIL & WATER CONS DIST 979 0.000135% 7,890 14,010
50301 CITY OF COLFAX 38,188 0.005280% 307,804 546,560
50302 CITY OF MINGO 7,789 0.001077% 62,784 111,485
50303 CITY OF NEWTON 464,375 0.064207% 3,742,987 6,646,337
50304 CITY OF KELLOGG 8,138 0.001125% 65,591 116,468
50307 CITY OF MONROE 26,132 0.003613% 210,635 374,019
50310 CITY OF PRAIRIE CITY 27,812 0.003845% 224,173 398,058
50311 CITY OF SULLY 10,215 0.001412% 82,339 146,208
50312 CITY OF BAXTER 18,657 0.002580% 150,384 267,034
50314 CITY OF LYNNVILLE 6,597 0.000912% 53,173 94,418
50316 CITY OF REASNOR 1,246 0.000172% 10,044 17,834
50317 CITY OF LAMBS GROVE 662 0.000091% 5,333 9,470
50318 CITY OF VALERIA 53 0.000007% 426 757
50556 BAXTER COMMUNITY SCHOOL DISTRICT 305,401 0.042226% 2,461,615 4,371,034
50559 NEWTON COMMUNITY SCHOOL DISTRICT 1,978,248 0.273524% 15,945,215 28,313,555
50562 LYNNVILLE SULLY COMMUNITY SCHOOL DIST 335,697 0.046415% 2,705,809 4,804,643
50563 COLFAX-MINGO COMMUNITY SCHOOL DISTRICT 413,919 0.057231% 3,336,301 5,924,193
50566 PCM COMMUNITY SCHOOL DISTRICT 665,682 0.092041% 5,365,576 9,527,531
51002 8TH JUDICIAL DIST DEPT CORR SERVICES 551,858 0.076303% 4,448,124 7,898,432
51201 JEFFERSON COUNTY 313,078 0.043288% 2,523,490 4,480,904
51202 JEFFERSON COUNTY HEALTH CENTER 1,591,744 0.220083% 12,829,889 22,781,742
51204 JEFFERSON COUNTY AGRI 11,483 0.001588% 92,553 164,345
51301 CITY OF FAIRFIELD 227,677 0.031480% 1,835,135 3,258,608
51302 CITY OF LOCKRIDGE 1,971 0.000272% 15,885 28,207
51305 CITY OF LIBERTYVILLE 5,528 0.000764% 44,559 79,122
51306 CITY OF BATAVIA 5,994 0.000829% 48,316 85,794
51307 CITY OF PACKWOOD 923 0.000128% 7,442 13,214
51308 CITY OF PLEASANT PLAIN 396 0.000055% 3,196 5,675
51535 FAIRFIELD COMMUNITY SCHOOL DISTRICT 1,131,089 0.156391% 9,116,880 16,188,637
51601 SOUTH IOWA AREA CRIME COMMISSION 29,003 0.004010% 233,775 415,109
52003 UNIVERSITY OF IOWA 12,325,804 1.704235% 99,349,323 176,412,325
See notes to Schedules.___________________________________________________________________________________________________
64

___________________________________________________________________________________________________Schedule 1
Change in NPL due to 1%
Increase in the Actuarial Assumed
Investment Return (8.00%)
Differences Between Expected
and Actual Experience
Changes of Assumptions
Difference Between
Projected and Actual
Investment Earnings on Pension Plan Investments
Total Deferred Outflows of Resources
Differences Between Expected
and Actual Experience
Difference Between
Projected and Actual
Investment Earnings on Pension Plan Investments
Total Deferred Inflows of Resources
Total Proportionate
Share of Allocable Plan
Pension Expense
DEFERRED OUTFLOWS OF RESOURCES
(Excluding Employer Specific Amounts) * (Excluding Employer Specific Amounts) *
DEFERRED INFLOWS OF RESOURCES
2,716,267 21,554 832,787 367,534 1,221,875 279,539 1,243,655 1,523,194 1,430,175
55,992 444 17,167 7,576 25,187 5,762 25,636 31,398 29,481
246,103 1,953 75,453 33,300 110,706 25,327 112,679 138,006 129,579
431,511 3,424 132,298 58,387 194,109 44,408 197,569 241,977 227,200
2,032,771 16,130 623,232 275,052 914,414 209,199 930,713 1,139,912 1,070,299
73,266 581 22,463 9,913 32,957 7,540 33,545 41,085 38,576
2,757 22 845 373 1,240 284 1,262 1,546 1,451
107,538 853 32,970 14,551 48,374 11,067 49,237 60,304 56,621
21,935 174 6,725 2,968 9,867 2,257 10,043 12,300 11,549
1,307,689 10,377 400,928 176,942 588,247 134,578 598,731 733,309 688,527
22,915 182 7,026 3,101 10,309 2,358 10,492 12,850 12,065
73,590 584 22,562 9,957 33,103 7,573 33,693 41,266 38,747
78,319 621 24,012 10,597 35,230 8,060 35,859 43,919 41,237
28,767 228 8,820 3,892 12,940 2,960 13,171 16,131 15,146
52,540 417 16,108 7,109 23,634 5,407 24,056 29,463 27,663
18,577 147 5,696 2,514 8,357 1,912 8,506 10,418 9,781
3,509 28 1,076 475 1,579 361 1,607 1,968 1,848
1,863 15 571 252 838 192 853 1,045 981
149 1 46 20 67 15 68 83 78
860,016 6,824 263,674 116,368 386,866 88,507 393,762 482,269 452,817
5,570,788 44,205 1,707,961 753,776 2,505,942 573,307 2,550,610 3,123,917 2,933,143
945,330 7,501 289,831 127,911 425,243 97,287 432,823 530,110 497,737
1,165,605 9,249 357,366 157,716 524,331 119,956 533,677 653,633 613,717
1,874,574 14,875 574,730 253,646 843,251 192,918 858,282 1,051,200 987,005
1,554,043 12,331 476,458 210,276 699,065 159,931 711,526 871,457 818,238
881,633 6,996 270,302 119,293 396,591 90,732 403,660 494,392 464,199
4,482,385 35,568 1,374,265 606,506 2,016,339 461,296 2,052,280 2,513,576 2,360,075
32,335 257 9,914 4,375 14,546 3,328 14,805 18,133 17,025
641,142 5,088 196,569 86,752 288,409 65,982 293,550 359,532 337,576
5,550 44 1,702 751 2,497 571 2,541 3,112 2,922
15,568 124 4,773 2,106 7,003 1,602 7,128 8,730 8,197
16,880 134 5,175 2,284 7,593 1,737 7,729 9,466 8,888
2,600 21 797 352 1,170 268 1,190 1,458 1,369
1,116 9 342 151 502 115 511 626 588
3,185,169 25,275 976,548 430,981 1,432,804 327,795 1,458,344 1,786,139 1,677,062
81,674 648 25,041 11,051 36,740 8,405 37,395 45,800 43,003
34,709,722 275,423 10,641,733 4,696,528 15,613,684 3,572,084 15,892,002 19,464,086 18,275,438
___________________________________________________________________________________________________65 (Continued)

___________________________________________________________________________________________________
Employer ID # Employer Name
2019 Actual Employer
Contributions
Employer Allocation
Percentage ** Net Pension
Liability (NPL)
Change in NPL due to 1%
Decrease in the Actuarial Assumed
Investment Return (6.00%)
Iowa Public Employees' Retirement System
Schedule of Employer Allocations and Collective Pension Amounts Allocated by Employer -Regular Membership Group
As of and for the year ended June 30, 2019
52201 JOHNSON COUNTY 1,987,443 0.274795% 16,019,331 28,445,161
52203 JOHNSON COUNTY AGRICULTURAL EXTENSION 56,960 0.007876% 459,113 815,236
52207 JOHNSON COUNTY SOIL & WATER CONS DIST 6,335 0.000876% 51,064 90,674
52302 CITY OF IOWA CITY 2,912,394 0.402684% 23,474,689 41,683,469
52303 CITY OF CORALVILLE 843,738 0.116660% 6,800,760 12,075,955
52304 CITY OF LONE TREE 17,003 0.002351% 137,050 243,357
52305 CITY OF SOLON 62,141 0.008592% 500,873 889,388
52308 CITY OF OXFORD 10,944 0.001513% 88,211 156,634
52310 CITY OF HILLS 8,970 0.001240% 72,301 128,383
52311 CITY OF UNIVERSITY HEIGHTS 2,100 0.000290% 16,923 30,051
52312 CITY OF TIFFIN 52,429 0.007249% 422,595 750,392
52314 LONE TREE HOUSING COMMISSION 3,461 0.000479% 27,898 49,539
52315 CITY OF NORTH LIBERTY 432,923 0.059858% 3,489,474 6,196,180
52316 CITY OF SWISHER 11,586 0.001602% 93,383 165,819
52317 CITY OF SHUEYVILLE 1,446 0.000200% 11,653 20,692
52564 SOLON COMMUNITY SCHOOL DISTRICT 1,007,995 0.139371% 8,124,712 14,426,866
52565 IOWA CITY COMMUNITY SCHOOL DISTRICT 10,673,307 1.475751% 86,029,745 152,761,056
52567 LONE TREE COMMUNITY SCHOOL DISTRICT 299,067 0.041351% 2,410,564 4,280,384
52571 CLEAR CREEK-AMANA COMMUNITY SCHOOL DIST 1,750,681 0.242059% 14,110,963 25,056,515
52602 EAST CENTRAL IOWA COUNCIL OF GOVERNMENTS 91,146 0.012602% 734,658 1,304,516
53001 STATE - DEPT OF CORRECTIONS/ANAMOSA 140,322 0.019402% 1,131,035 2,008,354
53002 STATE - DEPT OF CORRECTIONS/OAKDALE 837,474 0.115794% 6,750,271 11,986,302
53201 JONES COUNTY 422,366 0.058399% 3,404,385 6,045,088
53203 JONES COUNTY AGRI 13,908 0.001923% 112,100 199,053
53206 JONES COUNTY SOIL & WATER CONS DISTRICT 188 0.000026% 1,511 2,684
53301 CITY OF OXFORD JUNCTION 9,585 0.001325% 77,256 137,181
53302 CITY OF WYOMING 9,706 0.001342% 78,233 138,916
53303 CITY OF ONSLOW 3,650 0.000505% 29,418 52,237
53304 CITY OF ANAMOSA 88,031 0.012172% 709,551 1,259,933
53305 CITY OF MONTICELLO 71,727 0.009917% 578,142 1,026,594
53307 CITY OF OLIN 12,439 0.001720% 100,259 178,028
53308 CITY OF MARTELLE 2,470 0.000342% 19,911 35,356
53314 CITY OF MORLEY 1,180 0.000163% 9,509 16,884
53518 OLIN CONSOLIDATED INDEPENDENT SCHOOL DIS 80,271 0.011099% 647,008 1,148,878
53546 MONTICELLO COMM SCH DIST 735,008 0.101626% 5,924,361 10,519,752
53547 MIDLAND COMMUNITY SCHOOL DISTRICT 319,837 0.044222% 2,577,969 4,577,641
53548 ANAMOSA COMMUNITY SCHOOL DISTRICT 860,838 0.119024% 6,938,585 12,320,687
See notes to Schedules.___________________________________________________________________________________________________
66

___________________________________________________________________________________________________Schedule 1
Change in NPL due to 1%
Increase in the Actuarial Assumed
Investment Return (8.00%)
Differences Between Expected
and Actual Experience
Changes of Assumptions
Difference Between
Projected and Actual
Investment Earnings on Pension Plan Investments
Total Deferred Outflows of Resources
Differences Between Expected
and Actual Experience
Difference Between
Projected and Actual
Investment Earnings on Pension Plan Investments
Total Deferred Inflows of Resources
Total Proportionate
Share of Allocable Plan
Pension Expense
DEFERRED OUTFLOWS OF RESOURCES
(Excluding Employer Specific Amounts) * (Excluding Employer Specific Amounts) *
DEFERRED INFLOWS OF RESOURCES
5,596,682 44,410 1,715,900 757,280 2,517,590 575,972 2,562,466 3,138,438 2,946,777
160,400 1,273 49,178 21,704 72,155 16,507 73,440 89,947 84,454
17,840 142 5,470 2,414 8,026 1,836 8,168 10,004 9,393
8,201,364 65,078 2,514,475 1,109,716 3,689,269 844,027 3,755,031 4,599,058 4,318,200
2,375,985 18,854 728,459 321,491 1,068,804 244,520 1,087,855 1,332,375 1,251,009
47,881 380 14,680 6,479 21,539 4,928 21,923 26,851 25,211
174,990 1,389 53,651 23,678 78,718 18,009 80,120 98,129 92,136
30,818 245 9,449 4,170 13,864 3,172 14,110 17,282 16,227
25,260 200 7,744 3,418 11,362 2,600 11,565 14,165 13,300
5,913 47 1,813 800 2,660 608 2,707 3,315 3,113
147,642 1,172 45,266 19,977 66,415 15,194 67,599 82,793 77,737
9,747 77 2,989 1,318 4,384 1,002 4,462 5,464 5,132
1,219,119 9,674 373,773 164,957 548,404 125,463 558,179 683,642 641,893
32,625 259 10,003 4,415 14,677 3,358 14,938 18,296 17,178
4,071 32 1,248 551 1,831 419 1,864 2,283 2,144
2,838,535 22,524 870,273 384,078 1,276,875 292,122 1,299,636 1,591,758 1,494,552
30,056,255 238,498 9,215,016 4,066,873 13,520,387 3,093,182 13,761,391 16,854,573 15,825,285
842,180 6,683 258,206 113,954 378,843 86,671 385,596 472,267 443,426
4,929,954 39,120 1,511,486 667,066 2,217,672 507,357 2,257,201 2,764,558 2,595,730
256,668 2,037 78,692 34,729 115,458 26,414 117,517 143,931 135,141
395,150 3,136 121,150 53,467 177,753 40,666 180,921 221,587 208,055
2,358,345 18,714 723,051 319,105 1,060,870 242,705 1,079,779 1,322,484 1,241,721
1,189,392 9,438 364,658 160,935 535,031 122,404 544,568 666,972 626,241
39,164 311 12,007 5,299 17,617 4,031 17,932 21,963 20,621
528 4 162 71 237 54 242 296 278
26,991 214 8,275 3,652 12,141 2,778 12,358 15,136 14,211
27,332 217 8,380 3,698 12,295 2,813 12,514 15,327 14,391
10,278 82 3,151 1,391 4,624 1,058 4,706 5,764 5,411
247,896 1,967 76,004 33,542 111,513 25,511 113,499 139,010 130,523
201,986 1,603 61,927 27,330 90,860 20,787 92,480 113,267 106,350
35,028 278 10,739 4,740 15,757 3,605 16,038 19,643 18,443
6,956 55 2,133 941 3,129 716 3,185 3,901 3,663
3,322 26 1,019 449 1,494 342 1,521 1,863 1,749
226,046 1,794 69,304 30,586 101,684 23,263 103,496 126,759 119,018
2,069,797 16,424 634,584 280,061 931,069 213,009 947,666 1,160,675 1,089,794
900,666 7,147 276,137 121,868 405,152 92,690 412,374 505,064 474,221
2,424,137 19,236 743,222 328,007 1,090,465 249,475 1,109,902 1,359,377 1,276,362
___________________________________________________________________________________________________67 (Continued)

___________________________________________________________________________________________________
Employer ID # Employer Name
2019 Actual Employer
Contributions
Employer Allocation
Percentage ** Net Pension
Liability (NPL)
Change in NPL due to 1%
Decrease in the Actuarial Assumed
Investment Return (6.00%)
Iowa Public Employees' Retirement System
Schedule of Employer Allocations and Collective Pension Amounts Allocated by Employer -Regular Membership Group
As of and for the year ended June 30, 2019
53601 JONES CO SOLID WASTE MANGT COMM 12,494 0.001727% 100,705 178,820
53602 ADVANCEMENT SERVICES 94,382 0.013050% 760,747 1,350,841
54201 KEOKUK COUNTY 258,473 0.035738% 2,083,360 3,699,375
54203 KEOKUK COUNTY AGRICULTURAL EXTENSION OFF 10,970 0.001517% 88,420 157,005
54205 KEOKUK COUNTY HEALTH CENTER 533,485 0.073763% 4,300,038 7,635,479
54301 CITY OF SIGOURNEY 40,570 0.005609% 327,008 580,661
54302 CITY OF WHAT CHEER 9,038 0.001250% 72,850 129,358
54304 CITY OF KEOTA 13,940 0.001927% 112,362 199,519
54305 CITY OF SOUTH ENGLISH 1,699 0.000235% 13,697 24,321
54306 CITY OF THORNBURG 113 0.000016% 913 1,621
54307 CITY OF RICHLAND 7,076 0.000978% 57,036 101,277
54308 CITY OF HEDRICK 8,228 0.001138% 66,322 117,767
54309 CITY OF DELTA 6,014 0.000832% 48,476 86,079
54312 CITY OF OLLIE 827 0.000114% 6,665 11,835
54313 CITY OF MARTINSBURG 453 0.000063% 3,652 6,485
54314 CITY OF KESWICK 1,829 0.000253% 14,745 26,182
54318 CITY OF HARPER 538 0.000074% 4,337 7,701
54319 CITY OF WEBSTER 687 0.000095% 5,535 9,829
54320 CITY OF HAYESVILLE 41 0.000006% 329 584
54552 SIGOURNEY COMMUNITY SCHOOL DISTRICT 360,893 0.049899% 2,908,894 5,165,257
54582 TRI-COUNTY COMMUNITY SCHOOL DISTRICT 157,184 0.021733% 1,266,945 2,249,685
54583 KEOTA COMMUNITY SCHOOL DISTRICT 198,208 0.027405% 1,597,611 2,836,842
54585 PEKIN COMMUNITY SCHOOL DISTRICT 436,005 0.060284% 3,514,318 6,240,294
55001 KOSSUTH SOIL & WATER CONSERVATION DIST 696 0.000096% 5,609 9,960
55201 KOSSUTH COUNTY 449,577 0.062161% 3,623,714 6,434,547
55203 KOSSUTH COUNTY AGRI 4,727 0.000654% 38,100 67,654
55205 KOSSUTH REGIONAL HEALTH CENTER 1,023,685 0.141540% 8,251,175 14,651,424
55301 CITY OF ALGONA 136,474 0.018870% 1,100,017 1,953,276
55302 CITY OF LAKOTA 8,367 0.001157% 67,437 119,746
55303 CITY OF WESLEY 10,743 0.001485% 86,594 153,762
55304 CITY OF FENTON 9,125 0.001262% 73,551 130,602
55305 CITY OF SWEA CITY 14,885 0.002058% 119,980 213,046
55306 CITY OF BANCROFT 31,092 0.004299% 250,611 445,004
55307 CITY OF WHITTEMORE 17,764 0.002456% 143,182 254,244
55309 CITY OF BURT 16,875 0.002333% 136,019 241,527
55313 CITY OF LEDYARD 2,454 0.000339% 19,782 35,127
55314 CITY OF TITONKA 13,953 0.001929% 112,468 199,706
See notes to Schedules.___________________________________________________________________________________________________
68

___________________________________________________________________________________________________Schedule 1
Change in NPL due to 1%
Increase in the Actuarial Assumed
Investment Return (8.00%)
Differences Between Expected
and Actual Experience
Changes of Assumptions
Difference Between
Projected and Actual
Investment Earnings on Pension Plan Investments
Total Deferred Outflows of Resources
Differences Between Expected
and Actual Experience
Difference Between
Projected and Actual
Investment Earnings on Pension Plan Investments
Total Deferred Inflows of Resources
Total Proportionate
Share of Allocable Plan
Pension Expense
DEFERRED OUTFLOWS OF RESOURCES
(Excluding Employer Specific Amounts) * (Excluding Employer Specific Amounts) *
DEFERRED INFLOWS OF RESOURCES
35,184 279 10,787 4,761 15,827 3,621 16,109 19,730 18,525
265,782 2,109 81,487 35,963 119,559 27,352 121,690 149,042 139,940
727,865 5,776 223,158 98,486 327,420 74,907 333,256 408,163 383,237
30,891 245 9,471 4,180 13,896 3,179 14,144 17,323 16,265
1,502,306 11,921 460,596 203,275 675,792 154,607 687,838 842,445 790,998
114,247 907 35,027 15,459 51,393 11,758 52,309 64,067 60,154
25,452 202 7,803 3,444 11,449 2,619 11,653 14,272 13,401
39,256 311 12,036 5,312 17,659 4,040 17,974 22,014 20,669
4,785 38 1,467 647 2,152 492 2,191 2,683 2,520
319 3 98 43 144 33 146 179 168
19,927 158 6,109 2,696 8,963 2,051 9,123 11,174 10,492
23,171 184 7,104 3,135 10,423 2,385 10,609 12,994 12,200
16,936 134 5,193 2,292 7,619 1,743 7,754 9,497 8,917
2,329 18 714 315 1,047 240 1,066 1,306 1,226
1,276 10 391 173 574 131 584 715 672
5,151 41 1,579 697 2,317 530 2,359 2,889 2,712
1,515 12 465 205 682 156 694 850 798
1,934 15 593 262 870 199 885 1,084 1,018
115 1 35 16 52 12 53 65 60
1,016,282 8,064 311,584 137,512 457,160 104,589 465,309 569,898 535,095
442,633 3,512 135,708 59,892 199,112 45,553 202,662 248,215 233,056
558,158 4,429 171,127 75,524 251,080 57,442 255,555 312,997 293,883
1,227,799 9,743 376,434 166,132 552,309 126,357 562,153 688,510 646,463
1,960 16 601 265 882 202 897 1,099 1,032
1,266,019 10,046 388,152 171,303 569,501 130,290 579,652 709,942 666,587
13,311 106 4,081 1,801 5,988 1,370 6,095 7,465 7,009
2,882,717 22,875 883,819 390,057 1,296,751 296,669 1,319,865 1,616,534 1,517,815
384,314 3,050 117,828 52,001 172,879 39,551 175,960 215,511 202,350
23,560 187 7,223 3,188 10,598 2,425 10,787 13,212 12,405
30,253 240 9,275 4,094 13,609 3,113 13,852 16,965 15,929
25,696 204 7,878 3,477 11,559 2,644 11,765 14,409 13,530
41,917 333 12,852 5,672 18,857 4,314 19,192 23,506 22,070
87,556 695 26,844 11,847 39,386 9,011 40,088 49,099 46,100
50,023 397 15,337 6,769 22,503 5,148 22,903 28,051 26,338
47,521 377 14,570 6,430 21,377 4,891 21,758 26,649 25,021
6,911 55 2,119 935 3,109 711 3,164 3,875 3,639
39,293 312 12,047 5,317 17,676 4,044 17,990 22,034 20,689
___________________________________________________________________________________________________69 (Continued)

___________________________________________________________________________________________________
Employer ID # Employer Name
2019 Actual Employer
Contributions
Employer Allocation
Percentage ** Net Pension
Liability (NPL)
Change in NPL due to 1%
Decrease in the Actuarial Assumed
Investment Return (6.00%)
Iowa Public Employees' Retirement System
Schedule of Employer Allocations and Collective Pension Amounts Allocated by Employer -Regular Membership Group
As of and for the year ended June 30, 2019
55315 CITY OF LONE ROCK 2,776 0.000384% 22,376 39,733
55320 LAKOTA PUBLIC LIBRARY 1,598 0.000221% 12,884 22,878
55321 CITY OF LU VERNE 4,389 0.000607% 35,374 62,812
55548 ALGONA COMMUNITY SCHOOL DISTRICT 930,129 0.128605% 7,497,096 13,312,422
55555 LUVERNE COMMUNITY SCHOOL DISTRICT 67,869 0.009384% 547,044 971,373
55558 NORTH KOSSUTH COMMUNITY SCHOOL DISTRICT 214,097 0.029602% 1,725,681 3,064,253
55701 ALGONA MUNICIPAL UTILITIES 223,827 0.030948% 1,804,109 3,203,516
56001 STATE - DEPT OF CORRECTIONS/FT MADISON 190,508 0.026341% 1,535,549 2,726,640
56201 LEE COUNTY 666,015 0.092087% 5,368,260 9,532,298
56203 LEE COUNTY AGRICULTURAL EXTENSION OFFICE 10,093 0.001395% 81,351 144,453
56211 GREAT RIVER REGIONAL WASTE AUTHORITY 63,696 0.008807% 513,404 911,640
56301 CITY OF KEOKUK 265,205 0.036669% 2,137,625 3,795,732
56302 CITY OF DONNELLSON 11,952 0.001653% 96,335 171,060
56303 CITY OF FORT MADISON 279,374 0.038628% 2,251,831 3,998,526
56304 CITY OF WEST POINT 37,078 0.005127% 298,857 530,673
56310 CITY OF MONTROSE 12,186 0.001685% 98,224 174,414
56312 CITY OF FRANKLIN 132 0.000018% 1,065 1,892
56313 CITY OF ST PAUL 204 0.000028% 1,644 2,919
56314 KEOKUK HOUSING AUTHORITY 35,680 0.004933% 287,588 510,664
56315 FT MADISON HOUSING AUTHORITY 24,400 0.003374% 196,670 349,222
56316 DONNELLSON PUBLIC LIBRARY 4,799 0.000664% 38,681 68,686
56317 CITY OF HOUGHTON 343 0.000047% 2,762 4,905
56324 DONNELLSON MUNICIPAL WATER WORKS 4,061 0.000562% 32,734 58,124
56544 KEOKUK COMMUNITY SCHOOL DISTRICT 1,268,387 0.175374% 10,223,541 18,153,709
56545 CENTRAL LEE COMMUNITY SCHOOL DISTRICT 676,183 0.093493% 5,450,221 9,677,832
56546 FORT MADISON COMMUNITY SCHOOL DISTRICT 1,385,152 0.191519% 11,164,704 19,824,909
56601 SOUTHEAST IOWA PLANNING COMMISSION 96,197 0.013301% 775,377 1,376,819
56702 KEOKUK MUNICIPAL WATER WORKS 127,578 0.017640% 1,028,310 1,825,947
57004 6TH JUDICIAL DIST DEPT CORR SERVICES 980,474 0.135566% 7,902,882 14,032,968
57202 LINN COUNTY 3,324,643 0.459684% 26,797,522 47,583,748
57204 LINN COUNTY ASSESSOR 67,974 0.009399% 547,892 972,879
57205 LINN COUNTY AGRI 36,184 0.005003% 291,653 517,881
57206 CITY ASSESSOR'S OFFICE LINN COUNTY 99,580 0.013768% 802,638 1,425,226
57301 CITY OF CEDAR RAPIDS 5,860,840 0.810353% 47,239,963 83,882,925
57302 CITY OF CENTRAL CITY 32,051 0.004432% 258,338 458,725
57303 CITY OF COGGON 12,788 0.001768% 103,073 183,024
57304 CITY OF LISBON 36,217 0.005008% 291,922 518,359
See notes to Schedules.___________________________________________________________________________________________________
70

___________________________________________________________________________________________________Schedule 1
Change in NPL due to 1%
Increase in the Actuarial Assumed
Investment Return (8.00%)
Differences Between Expected
and Actual Experience
Changes of Assumptions
Difference Between
Projected and Actual
Investment Earnings on Pension Plan Investments
Total Deferred Outflows of Resources
Differences Between Expected
and Actual Experience
Difference Between
Projected and Actual
Investment Earnings on Pension Plan Investments
Total Deferred Inflows of Resources
Total Proportionate
Share of Allocable Plan
Pension Expense
DEFERRED OUTFLOWS OF RESOURCES
(Excluding Employer Specific Amounts) * (Excluding Employer Specific Amounts) *
DEFERRED INFLOWS OF RESOURCES
7,818 62 2,397 1,058 3,517 805 3,579 4,384 4,116
4,501 36 1,380 609 2,025 463 2,061 2,524 2,370
12,359 98 3,789 1,672 5,559 1,272 5,658 6,930 6,507
2,619,264 20,784 803,046 354,409 1,178,239 269,556 1,199,242 1,468,798 1,379,101
191,121 1,517 58,596 25,860 85,973 19,669 87,506 107,175 100,629
602,902 4,784 184,845 81,578 271,207 62,046 276,041 338,087 317,441
630,303 5,001 193,246 85,285 283,532 64,866 288,587 353,453 331,868
536,476 4,257 164,479 72,590 241,326 55,210 245,628 300,838 282,466
1,875,512 14,882 575,018 253,773 843,673 193,015 858,711 1,051,726 987,499
28,422 226 8,714 3,846 12,786 2,925 13,013 15,938 14,965
179,368 1,423 54,993 24,270 80,686 18,459 82,125 100,584 94,441
746,823 5,926 228,970 101,052 335,948 76,858 341,936 418,794 393,219
33,657 267 10,319 4,554 15,140 3,464 15,410 18,874 17,721
786,723 6,243 241,203 106,451 353,897 80,964 360,205 441,169 414,227
104,412 829 32,012 14,128 46,969 10,745 47,805 58,550 54,975
34,317 272 10,521 4,643 15,436 3,532 15,712 19,244 18,068
372 3 114 50 167 38 170 208 196
574 5 176 78 259 59 263 322 302
100,475 797 30,805 13,595 45,197 10,340 46,003 56,343 52,902
68,711 545 21,066 9,297 30,908 7,071 31,459 38,530 36,178
13,514 107 4,143 1,829 6,079 1,391 6,188 7,579 7,115
965 8 296 131 435 99 442 541 508
11,436 91 3,506 1,547 5,144 1,177 5,236 6,413 6,021
3,571,804 28,342 1,095,088 483,296 1,606,726 367,585 1,635,366 2,002,951 1,880,634
1,904,146 15,110 583,797 257,648 856,555 195,961 871,822 1,067,783 1,002,575
3,900,618 30,952 1,195,900 527,788 1,754,640 401,424 1,785,915 2,187,339 2,053,762
270,894 2,150 83,054 36,654 121,858 27,879 124,030 151,909 142,632
359,261 2,851 110,147 48,611 161,609 36,973 164,489 201,462 189,159
2,761,034 21,909 846,512 373,592 1,242,013 284,146 1,264,152 1,548,298 1,453,746
9,362,264 74,290 2,870,398 1,266,796 4,211,484 963,499 4,286,554 5,250,053 4,929,439
191,417 1,519 58,687 25,900 86,106 19,699 87,641 107,340 100,785
101,895 809 31,240 13,787 45,836 10,486 46,653 57,139 53,650
280,418 2,225 85,974 37,943 126,142 28,859 128,391 157,250 147,646
16,504,250 130,962 5,060,075 2,233,168 7,424,205 1,698,503 7,556,544 9,255,047 8,689,854
90,256 716 27,672 12,212 40,600 9,288 41,324 50,612 47,522
36,011 286 11,041 4,873 16,200 3,706 16,488 20,194 18,960
101,989 809 31,269 13,800 45,878 10,496 46,696 57,192 53,699
___________________________________________________________________________________________________71 (Continued)

___________________________________________________________________________________________________
Employer ID # Employer Name
2019 Actual Employer
Contributions
Employer Allocation
Percentage ** Net Pension
Liability (NPL)
Change in NPL due to 1%
Decrease in the Actuarial Assumed
Investment Return (6.00%)
Iowa Public Employees' Retirement System
Schedule of Employer Allocations and Collective Pension Amounts Allocated by Employer -Regular Membership Group
As of and for the year ended June 30, 2019
57305 CITY OF MOUNT VERNON 91,253 0.012617% 735,520 1,306,046
57307 CITY OF SPRINGVILLE 19,837 0.002743% 159,893 283,918
57308 CITY OF MARION 817,816 0.113076% 6,591,817 11,704,939
57309 CITY OF CENTER POINT 51,086 0.007063% 411,768 731,167
57310 CITY OF WALKER 11,654 0.001611% 93,938 166,804
57311 CITY OF PRAIRIEBURG 2,183 0.000302% 17,598 31,247
57313 MARION MUNICIPAL WATER DEPARTMENT 94,506 0.013067% 761,740 1,352,605
57314 CITY OF ALBURNETT 10,489 0.001450% 84,540 150,116
57315 CITY OF PALO 17,737 0.002452% 142,965 253,859
57316 CITY OF BERTRAM 1,430 0.000198% 11,526 20,466
57317 CITY OF ROBINS 27,156 0.003755% 218,882 388,663
57318 CITY OF ELY 50,643 0.007002% 408,198 724,827
57319 CITY OF HIAWATHA 186,382 0.025770% 1,502,288 2,667,579
57323 CITY OF FAIRFAX 52,779 0.007298% 425,414 755,397
57501 CEDAR RAPIDS COMMUNITY SCHOOL DISTRICT 13,376,651 1.849531% 107,819,437 191,452,514
57503 MARION INDEPENDENT SCHOOL DISTRICT 1,533,211 0.211990% 12,358,093 21,943,983
57508 ALBURNETT COMMUNITY SCHOOL DISTRICT 399,329 0.055214% 3,218,703 5,715,378
57551 CENTER POINT-URBANA COMMUNITY SCHOOL DIS 975,070 0.134819% 7,859,328 13,955,629
57573 COLLEGE COMMUNITY SCHOOL DISTRICT 3,994,034 0.552238% 32,193,000 57,164,375
57575 CENTRAL CITY COMMUNITY SCHOOL DISTRICT 274,035 0.037890% 2,208,794 3,922,105
57577 LINN-MAR COMMUNITY SCHOOL DISTRICT 5,514,741 0.762499% 44,450,304 78,929,391
57578 MOUNT VERNON COMMUNITY SCHOOL DISTRICT 1,013,063 0.140072% 8,165,563 14,499,403
57579 SPRINGVILLE COMMUNITY SCHOOL DISTRICT 227,799 0.031497% 1,836,125 3,260,364
57582 LISBON COMMUNITY SCHOOL DISTRICT 448,790 0.062052% 3,617,372 6,423,284
57583 NORTH LINN COMMUNITY SCHOOL DISTRICT 355,923 0.049212% 2,868,834 5,094,123
57584 KIRKWOOD COMMUNITY COLLEGE 1,843,304 0.254866% 14,857,531 26,382,178
57603 AEA 10 - GRANT WOOD 3,181,014 0.439825% 25,639,838 45,528,076
57702 COGGON MUNICIPAL LIGHT PLANT 9,524 0.001317% 76,763 136,307
57703 CEDAR RAPIDS / LINN CO SOLID WASTE AGCY 198,924 0.027504% 1,603,381 2,847,087
58201 LOUISA COUNTY 267,436 0.036977% 2,155,608 3,827,663
58203 LOUISA COUNTY AGRI EXT DISTRICT 18,679 0.002583% 150,557 267,340
58205 LOUISA COUNTY ASSESSOR 16,987 0.002349% 136,921 243,128
58301 CITY OF WAPELLO 25,890 0.003580% 208,683 370,554
58302 CITY OF MORNING SUN 16,674 0.002305% 134,399 238,649
58303 CITY OF COLUMBUS JUNCTION 30,020 0.004151% 241,971 429,662
58305 CITY OF GRANDVIEW 7,039 0.000973% 56,734 100,741
58306 CITY OF COLUMBUS CITY 2,917 0.000403% 23,512 41,750
See notes to Schedules.___________________________________________________________________________________________________
72

___________________________________________________________________________________________________Schedule 1
Change in NPL due to 1%
Increase in the Actuarial Assumed
Investment Return (8.00%)
Differences Between Expected
and Actual Experience
Changes of Assumptions
Difference Between
Projected and Actual
Investment Earnings on Pension Plan Investments
Total Deferred Outflows of Resources
Differences Between Expected
and Actual Experience
Difference Between
Projected and Actual
Investment Earnings on Pension Plan Investments
Total Deferred Inflows of Resources
Total Proportionate
Share of Allocable Plan
Pension Expense
DEFERRED OUTFLOWS OF RESOURCES
(Excluding Employer Specific Amounts) * (Excluding Employer Specific Amounts) *
DEFERRED INFLOWS OF RESOURCES
256,969 2,039 78,785 34,770 115,594 26,445 117,654 144,099 135,300
55,862 443 17,127 7,559 25,129 5,749 25,577 31,326 29,412
2,302,986 18,274 706,078 311,614 1,035,966 237,007 1,054,433 1,291,440 1,212,573
143,860 1,142 44,106 19,465 64,713 14,805 65,867 80,672 75,745
32,819 260 10,062 4,441 14,763 3,378 15,026 18,404 17,280
6,148 49 1,885 832 2,766 633 2,815 3,448 3,237
266,130 2,112 81,593 36,010 119,715 27,388 121,849 149,237 140,123
29,536 234 9,055 3,996 13,285 3,040 13,523 16,563 15,551
49,948 396 15,314 6,758 22,468 5,140 22,869 28,009 26,299
4,027 32 1,235 545 1,812 414 1,844 2,258 2,120
76,471 607 23,445 10,347 34,399 7,870 35,012 42,882 40,264
142,612 1,132 43,724 19,297 64,153 14,677 65,296 79,973 75,089
524,855 4,165 160,917 71,017 236,099 54,014 240,307 294,321 276,348
148,627 1,179 45,568 20,111 66,858 15,296 68,050 83,346 78,255
37,668,930 298,904 11,549,004 5,096,934 16,944,842 3,876,625 17,246,889 21,123,514 19,833,527
4,317,553 34,260 1,323,729 584,202 1,942,191 444,333 1,976,811 2,421,144 2,273,287
1,124,520 8,923 344,769 152,157 505,849 115,728 514,866 630,594 592,085
2,745,817 21,788 841,846 371,533 1,235,167 282,580 1,257,185 1,539,765 1,445,734
11,247,284 89,248 3,448,331 1,521,855 5,059,434 1,157,492 5,149,619 6,307,111 5,921,945
771,687 6,123 236,593 104,416 347,132 79,417 353,321 432,738 406,311
15,529,625 123,229 4,761,263 2,101,293 6,985,785 1,598,201 7,110,308 8,708,509 8,176,692
2,852,807 22,637 874,649 386,010 1,283,296 293,591 1,306,170 1,599,761 1,502,066
641,488 5,090 196,675 86,799 288,564 66,017 293,708 359,725 337,758
1,263,803 10,028 387,472 171,004 568,504 130,062 578,638 708,700 665,420
1,002,286 7,953 307,293 135,618 450,864 103,148 458,901 562,049 527,726
5,190,783 41,189 1,591,454 702,358 2,335,001 534,199 2,376,623 2,910,822 2,733,062
8,957,803 71,081 2,746,395 1,212,068 4,029,544 921,874 4,101,369 5,023,243 4,716,482
26,819 213 8,222 3,629 12,064 2,760 12,279 15,039 14,121
560,174 4,445 171,745 75,796 251,986 57,649 256,478 314,127 294,944
753,106 5,976 230,896 101,902 338,774 77,504 344,813 422,317 396,527
52,600 417 16,127 7,117 23,661 5,413 24,083 29,496 27,695
47,836 380 14,666 6,473 21,519 4,923 21,902 26,825 25,187
72,908 579 22,353 9,865 32,797 7,503 33,381 40,884 38,388
46,955 373 14,396 6,353 21,122 4,832 21,499 26,331 24,723
84,537 671 25,919 11,439 38,029 8,700 38,706 47,406 44,511
19,821 157 6,077 2,682 8,916 2,040 9,075 11,115 10,436
8,214 65 2,518 1,111 3,694 845 3,761 4,606 4,325
___________________________________________________________________________________________________73 (Continued)

___________________________________________________________________________________________________
Employer ID # Employer Name
2019 Actual Employer
Contributions
Employer Allocation
Percentage ** Net Pension
Liability (NPL)
Change in NPL due to 1%
Decrease in the Actuarial Assumed
Investment Return (6.00%)
Iowa Public Employees' Retirement System
Schedule of Employer Allocations and Collective Pension Amounts Allocated by Employer -Regular Membership Group
As of and for the year ended June 30, 2019
58307 CITY OF COTTER 94 0.000013% 761 1,351
58308 CITY OF FREDONIA 743 0.000103% 5,992 10,640
58311 CITY OF OAKVILLE 3,949 0.000546% 31,832 56,524
58314 CITY OF LETTS 3,975 0.000550% 32,042 56,896
58320 LOUISA REGIONAL SOLID WASTE 519 0.000072% 4,185 7,432
58530 WAPELLO COMMUNITY SCHOOL DISTRICT 440,015 0.060839% 3,546,638 6,297,684
58531 COLUMBUS COMMUNITY SCHOOL DISTRICT 464,581 0.064236% 3,744,645 6,649,280
58532 MORNING SUN COMMUNITY SCHOOL DISTRICT 89,298 0.012347% 719,765 1,278,071
58533 LOUISA MUSCATINE COMMUNITY SCHOOL DIST 556,787 0.076984% 4,487,855 7,968,981
59201 LUCAS COUNTY 215,566 0.029805% 1,737,521 3,085,276
59203 LUCAS COUNTY AGRI 4,962 0.000686% 39,999 71,025
59204 LUCAS COUNTY HEALTH CENTER 780,110 0.107862% 6,287,902 11,165,284
59301 CITY OF RUSSELL 5,205 0.000720% 41,954 74,497
59302 CITY OF CHARITON 56,589 0.007824% 456,121 809,924
59304 CITY OF LUCAS 729 0.000101% 5,880 10,440
59305 CITY OF DERBY 238 0.000033% 1,917 3,405
59307 CITY OF WILLIAMSON 383 0.000053% 3,089 5,486
59308 HOUSING BOARD 11,328 0.001566% 91,306 162,129
59309 CHARITON MUNICIPAL WATER 34,197 0.004728% 275,640 489,447
59562 CHARITON COMMUNITY SCHOOL DISTRICT 790,256 0.109265% 6,369,680 11,310,496
59603 SOUTH IA AREA DETENTION SERV. AGCY. 54,064 0.007475% 435,773 773,792
60201 LYON COUNTY 320,179 0.044270% 2,580,733 4,582,549
60204 LYON COUNTY AGRICULTURAL EXT DISTRICT 12,427 0.001718% 100,168 177,866
60301 CITY OF ALVORD 2,847 0.000394% 22,947 40,747
60302 CITY OF LITTLE ROCK 8,941 0.001236% 72,068 127,970
60303 CITY OF GEORGE 18,525 0.002561% 149,313 265,131
60304 CITY OF LARCHWOOD 16,601 0.002295% 133,808 237,600
60305 CITY OF INWOOD 17,107 0.002365% 137,885 244,839
60306 CITY OF DOON 7,940 0.001098% 63,997 113,637
60307 CITY OF ROCK RAPIDS 48,835 0.006752% 393,622 698,946
60308 CITY OF LESTER 2,787 0.000385% 22,461 39,884
60309 ROCK RAPIDS PUBLIC LIBRARY 9,030 0.001249% 72,783 129,239
60312 ROCK RAPIDS MUNICIPAL HOUSING AGENCY 8,424 0.001165% 67,897 120,563
60536 WEST LYON COMMUNITY SCHOOL DISTRICT 535,082 0.073983% 4,312,904 7,658,325
60538 CENTRAL LYON COMMUNITY SCHOOL DISTRICT 524,552 0.072527% 4,228,031 7,507,619
61201 MADISON COUNTY 345,603 0.047785% 2,785,653 4,946,420
61203 MADISON COUNTY AGRI EXT DISTRICT 12,645 0.001748% 101,921 180,978
See notes to Schedules.___________________________________________________________________________________________________
74
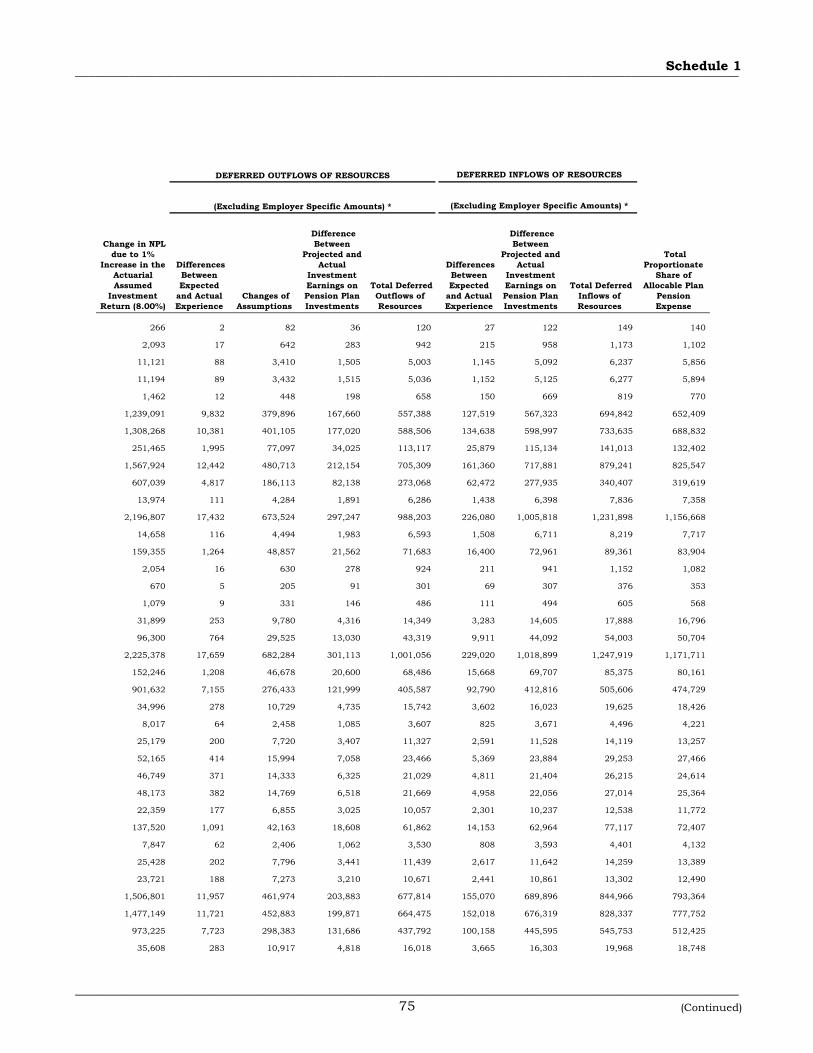
___________________________________________________________________________________________________Schedule 1
Change in NPL due to 1%
Increase in the Actuarial Assumed
Investment Return (8.00%)
Differences Between Expected
and Actual Experience
Changes of Assumptions
Difference Between
Projected and Actual
Investment Earnings on Pension Plan Investments
Total Deferred Outflows of Resources
Differences Between Expected
and Actual Experience
Difference Between
Projected and Actual
Investment Earnings on Pension Plan Investments
Total Deferred Inflows of Resources
Total Proportionate
Share of Allocable Plan
Pension Expense
DEFERRED OUTFLOWS OF RESOURCES
(Excluding Employer Specific Amounts) * (Excluding Employer Specific Amounts) *
DEFERRED INFLOWS OF RESOURCES
266 2 82 36 120 27 122 149 140
2,093 17 642 283 942 215 958 1,173 1,102
11,121 88 3,410 1,505 5,003 1,145 5,092 6,237 5,856
11,194 89 3,432 1,515 5,036 1,152 5,125 6,277 5,894
1,462 12 448 198 658 150 669 819 770
1,239,091 9,832 379,896 167,660 557,388 127,519 567,323 694,842 652,409
1,308,268 10,381 401,105 177,020 588,506 134,638 598,997 733,635 688,832
251,465 1,995 77,097 34,025 113,117 25,879 115,134 141,013 132,402
1,567,924 12,442 480,713 212,154 705,309 161,360 717,881 879,241 825,547
607,039 4,817 186,113 82,138 273,068 62,472 277,935 340,407 319,619
13,974 111 4,284 1,891 6,286 1,438 6,398 7,836 7,358
2,196,807 17,432 673,524 297,247 988,203 226,080 1,005,818 1,231,898 1,156,668
14,658 116 4,494 1,983 6,593 1,508 6,711 8,219 7,717
159,355 1,264 48,857 21,562 71,683 16,400 72,961 89,361 83,904
2,054 16 630 278 924 211 941 1,152 1,082
670 5 205 91 301 69 307 376 353
1,079 9 331 146 486 111 494 605 568
31,899 253 9,780 4,316 14,349 3,283 14,605 17,888 16,796
96,300 764 29,525 13,030 43,319 9,911 44,092 54,003 50,704
2,225,378 17,659 682,284 301,113 1,001,056 229,020 1,018,899 1,247,919 1,171,711
152,246 1,208 46,678 20,600 68,486 15,668 69,707 85,375 80,161
901,632 7,155 276,433 121,999 405,587 92,790 412,816 505,606 474,729
34,996 278 10,729 4,735 15,742 3,602 16,023 19,625 18,426
8,017 64 2,458 1,085 3,607 825 3,671 4,496 4,221
25,179 200 7,720 3,407 11,327 2,591 11,528 14,119 13,257
52,165 414 15,994 7,058 23,466 5,369 23,884 29,253 27,466
46,749 371 14,333 6,325 21,029 4,811 21,404 26,215 24,614
48,173 382 14,769 6,518 21,669 4,958 22,056 27,014 25,364
22,359 177 6,855 3,025 10,057 2,301 10,237 12,538 11,772
137,520 1,091 42,163 18,608 61,862 14,153 62,964 77,117 72,407
7,847 62 2,406 1,062 3,530 808 3,593 4,401 4,132
25,428 202 7,796 3,441 11,439 2,617 11,642 14,259 13,389
23,721 188 7,273 3,210 10,671 2,441 10,861 13,302 12,490
1,506,801 11,957 461,974 203,883 677,814 155,070 689,896 844,966 793,364
1,477,149 11,721 452,883 199,871 664,475 152,018 676,319 828,337 777,752
973,225 7,723 298,383 131,686 437,792 100,158 445,595 545,753 512,425
35,608 283 10,917 4,818 16,018 3,665 16,303 19,968 18,748
___________________________________________________________________________________________________75 (Continued)

___________________________________________________________________________________________________
Employer ID # Employer Name
2019 Actual Employer
Contributions
Employer Allocation
Percentage ** Net Pension
Liability (NPL)
Change in NPL due to 1%
Decrease in the Actuarial Assumed
Investment Return (6.00%)
Iowa Public Employees' Retirement System
Schedule of Employer Allocations and Collective Pension Amounts Allocated by Employer -Regular Membership Group
As of and for the year ended June 30, 2019
61204 MADISON COUNTY MEMORIAL HOSPITAL 833,460 0.115239% 6,717,918 11,928,853
61301 CITY OF WINTERSET 198,770 0.027483% 1,602,139 2,844,882
61303 CITY OF EARLHAM 24,682 0.003413% 198,945 353,261
61304 CITY OF TRURO 9,001 0.001245% 72,550 128,825
61308 CITY OF ST CHARLES 5,244 0.000725% 42,265 75,049
61309 CITY OF EAST PERU 227 0.000031% 1,826 3,243
61311 CITY OF MACKSBURG 378 0.000052% 3,044 5,404
61312 CITY OF BEVINGTON 189 0.000026% 1,522 2,702
61313 NORTH WARD PLAZA 8,358 0.001156% 67,366 119,621
61315 CITY OF PATTERSON 544 0.000075% 4,383 7,782
61538 EARLHAM COMMUNITY SCHOOL DISTRICT 366,551 0.050681% 2,954,504 5,246,244
61540 WINTERSET COMMUNITY SCHOOL DISTRICT 1,116,122 0.154321% 8,996,250 15,974,435
61542 INTERSTATE 35 COMMUNITY SCHOOL DISTRICT 509,917 0.070504% 4,110,072 7,298,162
61601 SOUTH CENTRAL IOWA LANDFILL AGENCY 18,570 0.002568% 149,683 265,788
62201 MAHASKA COUNTY 387,654 0.053599% 3,124,596 5,548,274
62203 MAHASKA COUNTY AGRI 12,219 0.001689% 98,489 174,884
62204 MAHASKA HEALTH PARTNERSHIP 2,524,348 0.349030% 20,346,925 36,129,571
62208 MAHASKA CO SOIL & WATER CONS DIST 5,695 0.000787% 45,904 81,510
62209 S C IA SOLID WASTE AGENCY 73,914 0.010220% 595,767 1,057,890
62301 CITY OF NEW SHARON 16,610 0.002297% 133,878 237,724
62302 CITY OF OSKALOOSA 145,807 0.020160% 1,175,247 2,086,859
62304 CITY OF FREMONT 8,011 0.001108% 64,569 114,654
62305 CITY OF UNIVERSITY PARK 909 0.000126% 7,327 13,011
62306 CITY OF LEIGHTON 283 0.000039% 2,283 4,053
62307 CITY OF BEACON 928 0.000128% 7,478 13,278
62308 CITY OF ROSE HILL 726 0.000100% 5,852 10,391
62309 CITY OF BARNES CITY 1,034 0.000143% 8,332 14,794
62402 CEDAR TOWNSHIP - MAHASKA COUNTY 802 0.000111% 6,468 11,485
62580 NORTH MAHASKA COMMUNITY SCHOOL DISTRICT 342,295 0.047328% 2,758,992 4,899,079
62581 OSKALOOSA COMMUNITY SCHOOL DISTRICT 1,418,595 0.196143% 11,434,257 20,303,550
62601 MAHASKA CO SOLID WASTE MGMT COMM 24,801 0.003429% 199,904 354,965
62701 OSKALOOSA WATER DEPT 76,487 0.010576% 616,508 1,094,718
63201 MARION COUNTY 660,497 0.091324% 5,323,784 9,453,323
63204 MARION COUNTY AGRI 11,186 0.001547% 90,160 160,096
63209 MARION COUNTY RURAL WATER DIST 25,927 0.003585% 208,979 371,079
63301 CITY OF KNOXVILLE 137,352 0.018991% 1,107,097 1,965,847
63302 CITY OF PELLA 453,244 0.062668% 3,653,273 6,487,034
See notes to Schedules.___________________________________________________________________________________________________
76
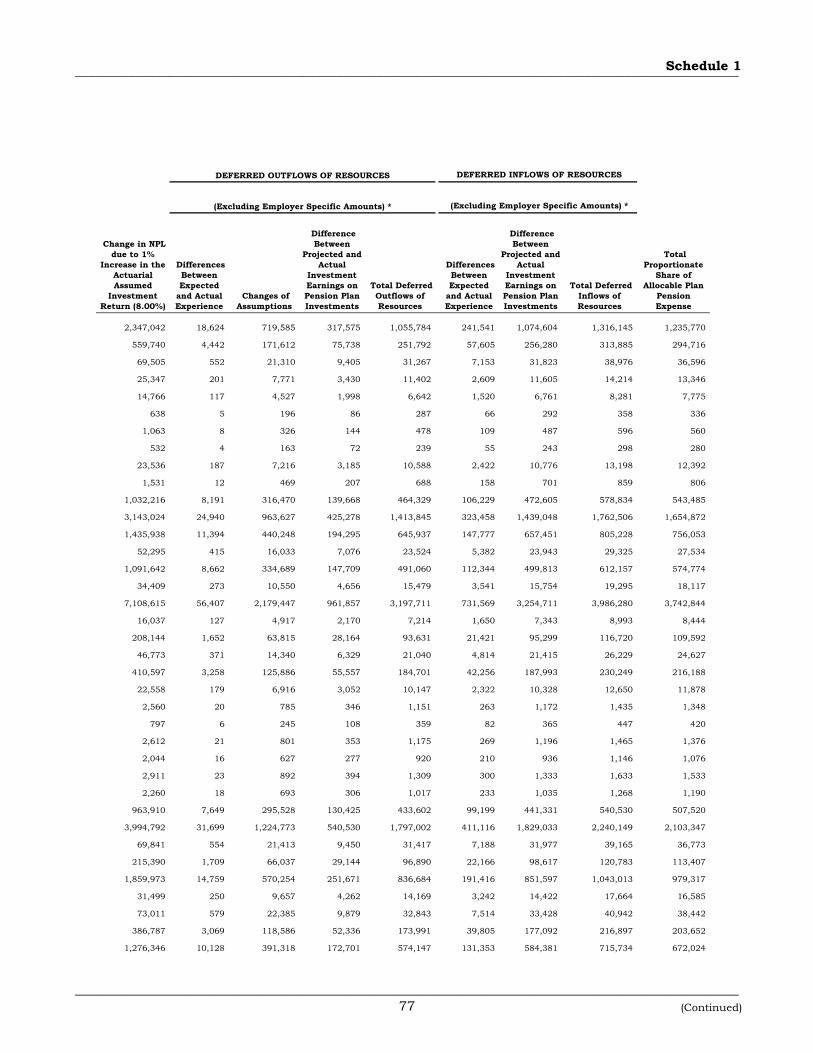
___________________________________________________________________________________________________Schedule 1
Change in NPL due to 1%
Increase in the Actuarial Assumed
Investment Return (8.00%)
Differences Between Expected
and Actual Experience
Changes of Assumptions
Difference Between
Projected and Actual
Investment Earnings on Pension Plan Investments
Total Deferred Outflows of Resources
Differences Between Expected
and Actual Experience
Difference Between
Projected and Actual
Investment Earnings on Pension Plan Investments
Total Deferred Inflows of Resources
Total Proportionate
Share of Allocable Plan
Pension Expense
DEFERRED OUTFLOWS OF RESOURCES
(Excluding Employer Specific Amounts) * (Excluding Employer Specific Amounts) *
DEFERRED INFLOWS OF RESOURCES
2,347,042 18,624 719,585 317,575 1,055,784 241,541 1,074,604 1,316,145 1,235,770
559,740 4,442 171,612 75,738 251,792 57,605 256,280 313,885 294,716
69,505 552 21,310 9,405 31,267 7,153 31,823 38,976 36,596
25,347 201 7,771 3,430 11,402 2,609 11,605 14,214 13,346
14,766 117 4,527 1,998 6,642 1,520 6,761 8,281 7,775
638 5 196 86 287 66 292 358 336
1,063 8 326 144 478 109 487 596 560
532 4 163 72 239 55 243 298 280
23,536 187 7,216 3,185 10,588 2,422 10,776 13,198 12,392
1,531 12 469 207 688 158 701 859 806
1,032,216 8,191 316,470 139,668 464,329 106,229 472,605 578,834 543,485
3,143,024 24,940 963,627 425,278 1,413,845 323,458 1,439,048 1,762,506 1,654,872
1,435,938 11,394 440,248 194,295 645,937 147,777 657,451 805,228 756,053
52,295 415 16,033 7,076 23,524 5,382 23,943 29,325 27,534
1,091,642 8,662 334,689 147,709 491,060 112,344 499,813 612,157 574,774
34,409 273 10,550 4,656 15,479 3,541 15,754 19,295 18,117
7,108,615 56,407 2,179,447 961,857 3,197,711 731,569 3,254,711 3,986,280 3,742,844
16,037 127 4,917 2,170 7,214 1,650 7,343 8,993 8,444
208,144 1,652 63,815 28,164 93,631 21,421 95,299 116,720 109,592
46,773 371 14,340 6,329 21,040 4,814 21,415 26,229 24,627
410,597 3,258 125,886 55,557 184,701 42,256 187,993 230,249 216,188
22,558 179 6,916 3,052 10,147 2,322 10,328 12,650 11,878
2,560 20 785 346 1,151 263 1,172 1,435 1,348
797 6 245 108 359 82 365 447 420
2,612 21 801 353 1,175 269 1,196 1,465 1,376
2,044 16 627 277 920 210 936 1,146 1,076
2,911 23 892 394 1,309 300 1,333 1,633 1,533
2,260 18 693 306 1,017 233 1,035 1,268 1,190
963,910 7,649 295,528 130,425 433,602 99,199 441,331 540,530 507,520
3,994,792 31,699 1,224,773 540,530 1,797,002 411,116 1,829,033 2,240,149 2,103,347
69,841 554 21,413 9,450 31,417 7,188 31,977 39,165 36,773
215,390 1,709 66,037 29,144 96,890 22,166 98,617 120,783 113,407
1,859,973 14,759 570,254 251,671 836,684 191,416 851,597 1,043,013 979,317
31,499 250 9,657 4,262 14,169 3,242 14,422 17,664 16,585
73,011 579 22,385 9,879 32,843 7,514 33,428 40,942 38,442
386,787 3,069 118,586 52,336 173,991 39,805 177,092 216,897 203,652
1,276,346 10,128 391,318 172,701 574,147 131,353 584,381 715,734 672,024
___________________________________________________________________________________________________77 (Continued)

___________________________________________________________________________________________________
Employer ID # Employer Name
2019 Actual Employer
Contributions
Employer Allocation
Percentage ** Net Pension
Liability (NPL)
Change in NPL due to 1%
Decrease in the Actuarial Assumed
Investment Return (6.00%)
Iowa Public Employees' Retirement System
Schedule of Employer Allocations and Collective Pension Amounts Allocated by Employer -Regular Membership Group
As of and for the year ended June 30, 2019
63306 CITY OF PLEASANTVILLE 24,377 0.003371% 196,488 348,900
63307 CITY OF BUSSEY 4,682 0.000647% 37,737 67,008
63312 CITY OF MARYSVILLE 29 0.000004% 236 419
63315 CITY OF HAMILTON 151 0.000021% 1,217 2,162
63316 CITY OF SWAN 187 0.000026% 1,506 2,674
63317 CITY OF HARVEY 3,540 0.000489% 28,533 50,666
63321 CITY OF MELCHER-DALLAS 19,027 0.002631% 153,364 272,326
63324 KNOXVILLE LOW RENT HOUSING AGCY 16,912 0.002338% 136,314 242,049
63589 PLEASANTVILLE COMMUNITY SCHOOL DISTRICT 479,390 0.066283% 3,864,014 6,861,242
63591 TWIN CEDARS COMMUNITY SCHOOL DISTRICT 259,527 0.035884% 2,091,857 3,714,462
63592 KNOXVILLE COMMUNITY SCHOOL DISTRICT 1,077,379 0.148965% 8,683,970 15,419,928
63593 PELLA COMMUNITY SCHOOL DISTRICT 1,531,053 0.211692% 12,340,700 21,913,100
63594 MELCHER-DALLAS COMMUNITY SCHOOL DISTRICT 224,071 0.030981% 1,806,073 3,207,002
63701 KNOXVILLE WATERWORKS 45,247 0.006256% 364,705 647,598
64001 STATE - DEPT OF HUMAN SERVICES/MARSHALLTOWN 3,820,447 0.528236% 30,793,835 54,679,910
64201 MARSHALL COUNTY 541,455 0.074865% 4,364,270 7,749,535
64203 MARSHALL COUNTY AGRI EXT DISTRICT 15,642 0.002163% 126,075 223,869
64302 CITY OF STATE CENTER 46,818 0.006473% 377,366 670,080
64303 CITY OF MARSHALLTOWN 569,999 0.078811% 4,594,347 8,158,077
64305 GUTEKUNST PUBLIC LIBRARY 5,608 0.000775% 45,203 80,265
64306 CITY OF MELBOURNE 17,199 0.002378% 138,630 246,162
64307 CITY OF RHODES 2,141 0.000296% 17,257 30,644
64308 CITY OF GILMAN 6,427 0.000889% 51,800 91,980
64309 CITY OF ALBION 9,827 0.001359% 79,205 140,642
64310 CITY OF LISCOMB 2,210 0.000306% 17,817 31,637
64312 CITY OF ST ANTHONY 307 0.000042% 2,477 4,398
64313 CITY OF CLEMONS 1,038 0.000144% 8,370 14,862
64316 CITY OF LAUREL 5,336 0.000738% 43,006 76,365
64317 CITY OF LE GRAND 15,421 0.002132% 124,299 220,716
64318 CITY OF FERGUSON 657 0.000091% 5,296 9,404
64319 CITY OF HAVERHILL 861 0.000119% 6,943 12,328
64543 MARSHALLTOWN COMMUNITY SCHOOL DISTRICT 3,612,438 0.499476% 29,117,228 51,702,797
64548 WEST MARSHALL COMMUNITY SCHOOL DISTRICT 553,988 0.076597% 4,465,291 7,928,916
64551 IOWA VALLEY COMMUNITY COLLEGE DISTRICT 621,396 0.085918% 5,008,619 8,893,690
64553 EAST MARSHALL COMMUNITY SCHOOL DISTRICT 504,222 0.069717% 4,064,169 7,216,652
64601 REGION SIX PLANNING COMMISSION 62,605 0.008656% 504,610 896,025
64603 SOLID WASTE MANGT COMM MARSHALL CO 38,089 0.005266% 307,005 545,141
See notes to Schedules.___________________________________________________________________________________________________
78

___________________________________________________________________________________________________Schedule 1
Change in NPL due to 1%
Increase in the Actuarial Assumed
Investment Return (8.00%)
Differences Between Expected
and Actual Experience
Changes of Assumptions
Difference Between
Projected and Actual
Investment Earnings on Pension Plan Investments
Total Deferred Outflows of Resources
Differences Between Expected
and Actual Experience
Difference Between
Projected and Actual
Investment Earnings on Pension Plan Investments
Total Deferred Inflows of Resources
Total Proportionate
Share of Allocable Plan
Pension Expense
DEFERRED OUTFLOWS OF RESOURCES
(Excluding Employer Specific Amounts) * (Excluding Employer Specific Amounts) *
DEFERRED INFLOWS OF RESOURCES
68,647 545 21,047 9,289 30,881 7,065 31,430 38,495 36,144
13,184 105 4,042 1,784 5,931 1,357 6,036 7,393 6,942
82 1 25 11 37 8 38 46 43
425 3 130 58 191 44 195 239 224
526 4 161 71 236 54 241 295 277
9,969 79 3,056 1,349 4,484 1,026 4,564 5,590 5,249
53,581 425 16,428 7,250 24,103 5,514 24,532 30,046 28,212
47,624 378 14,601 6,444 21,423 4,901 21,805 26,706 25,075
1,349,973 10,712 413,891 182,663 607,266 138,930 618,091 757,021 710,790
730,833 5,799 224,068 98,888 328,755 75,212 334,615 409,827 384,800
3,033,923 24,074 930,178 410,516 1,364,768 312,230 1,389,095 1,701,325 1,597,428
4,311,477 34,212 1,321,866 583,380 1,939,458 443,707 1,974,029 2,417,736 2,270,088
630,988 5,007 193,456 85,378 283,841 64,937 288,901 353,838 332,229
127,417 1,011 39,065 17,241 57,317 13,113 58,338 71,451 67,088
10,758,457 85,369 3,298,460 1,455,713 4,839,542 1,107,186 4,925,808 6,032,994 5,664,567
1,524,747 12,099 467,476 206,312 685,887 156,916 698,112 855,028 802,813
44,047 350 13,504 5,960 19,814 4,533 20,167 24,700 23,192
131,841 1,046 40,421 17,839 59,306 13,568 60,364 73,932 69,417
1,605,129 12,737 492,120 217,188 722,045 165,189 734,916 900,105 845,136
15,792 125 4,842 2,137 7,104 1,625 7,231 8,856 8,315
48,433 384 14,849 6,553 21,786 4,984 22,175 27,159 25,501
6,029 48 1,849 816 2,713 620 2,761 3,381 3,175
18,097 144 5,549 2,449 8,142 1,862 8,286 10,148 9,529
27,672 220 8,484 3,744 12,448 2,848 12,670 15,518 14,570
6,225 49 1,908 842 2,799 641 2,850 3,491 3,277
865 7 265 117 389 89 396 485 456
2,924 23 897 396 1,316 301 1,339 1,640 1,540
15,025 119 4,607 2,033 6,759 1,546 6,879 8,425 7,911
43,427 345 13,314 5,876 19,535 4,469 19,883 24,352 22,865
1,850 15 567 250 832 190 847 1,037 974
2,426 19 744 328 1,091 250 1,111 1,361 1,277
10,172,700 80,721 3,118,872 1,376,455 4,576,048 1,046,904 4,657,616 5,704,520 5,356,152
1,560,041 12,379 478,297 211,087 701,763 160,549 714,272 874,821 821,396
1,749,864 13,885 536,495 236,772 787,152 180,084 801,183 981,267 921,342
1,419,901 11,267 435,331 192,125 638,723 146,126 650,108 796,234 747,609
176,296 1,399 54,051 23,854 79,304 18,143 80,718 98,861 92,824
107,258 851 32,885 14,513 48,249 11,038 49,109 60,147 56,474
___________________________________________________________________________________________________79 (Continued)

___________________________________________________________________________________________________
Employer ID # Employer Name
2019 Actual Employer
Contributions
Employer Allocation
Percentage ** Net Pension
Liability (NPL)
Change in NPL due to 1%
Decrease in the Actuarial Assumed
Investment Return (6.00%)
Iowa Public Employees' Retirement System
Schedule of Employer Allocations and Collective Pension Amounts Allocated by Employer -Regular Membership Group
As of and for the year ended June 30, 2019
64701 MARSHALLTOWN WATER WORKS 63,525 0.008783% 512,025 909,191
65001 STATE - DEPT OF HUMAN SERVICES/GLENWOOD 3,697,805 0.511279% 29,805,313 52,924,614
65201 MILLS COUNTY 466,441 0.064493% 3,759,641 6,675,909
65203 MILLS COUNTY AGRI 13,973 0.001932% 112,624 199,983
65301 CITY OF GLENWOOD 78,674 0.010878% 634,135 1,126,018
65302 CITY OF MALVERN 17,274 0.002388% 139,232 247,231
65303 CITY OF SILVER CITY 3,499 0.000484% 28,200 50,074
65306 CITY OF EMERSON 7,706 0.001065% 62,110 110,288
65307 CITY OF HASTINGS 1,989 0.000275% 16,035 28,473
65311 CITY OF PACIFIC JUNCTION 5,675 0.000785% 45,743 81,226
65312 GLENWOOD MUNICIPAL UTILITIES 50,848 0.007030% 409,847 727,755
65314 LOW RENT HOUSING AGENCY OF MALVERN 1,866 0.000258% 15,042 26,710
65315 CITY OF HENDERSON 3,669 0.000507% 29,570 52,507
65555 GLENWOOD COMMUNITY SCHOOL DISTRICT 1,296,538 0.179267% 10,450,450 18,556,626
66201 MITCHELL COUNTY 330,203 0.045656% 2,661,528 4,726,015
66203 MITCHELL COUNTY REGIONAL HEALTH CENTER 862,644 0.119274% 6,953,141 12,346,535
66204 MITCHELL COUNTY AGRI EXT 12,250 0.001694% 98,736 175,323
66208 MITCHELL CO SOIL & WATER CONS DIST 2,827 0.000391% 22,786 40,460
66301 CITY OF OSAGE 81,315 0.011243% 655,420 1,163,815
66303 CITY OF RICEVILLE 18,283 0.002528% 147,364 261,671
66306 CITY OF STACYVILLE 5,062 0.000700% 40,800 72,448
66307 CITY OF SAINT ANSGAR 32,065 0.004434% 258,456 458,935
66309 CITY OF MITCHELL 887 0.000123% 7,149 12,694
66312 CITY OF ORCHARD 312 0.000043% 2,511 4,459
66313 CITY OF CARPENTER 481 0.000067% 3,881 6,891
66314 CITY OF MCINTIRE 312 0.000043% 2,511 4,459
66315 STACYVILLE PUBLIC LIBRARY 3,270 0.000452% 26,356 46,800
66553 OSAGE COMMUNITY SCHOOL DISTRICT 593,901 0.082116% 4,787,004 8,500,174
66555 ST ANSGAR COMMUNITY SCHOOL DISTRICT 395,187 0.054641% 3,185,312 5,656,086
66701 OSAGE MUNICIPAL LIGHT AND POWER 61,998 0.008572% 499,722 887,345
66702 OSAGE MUNICIPAL GASWORKS 30,351 0.004196% 244,633 434,390
67201 MONONA COUNTY 294,184 0.040676% 2,371,203 4,210,492
67203 MONONA COUNTY AGRI EXTENSION DISTRI 10,855 0.001501% 87,494 155,361
67205 MONONA COUNTY ASSESSOR 18,648 0.002578% 150,306 266,894
67207 LITTLE SIOUX DRAINAGE DISTRICT 18,308 0.002531% 147,566 262,029
67301 CITY OF ONAWA 93,540 0.012933% 753,961 1,338,792
67302 CITY OF MAPLETON 53,919 0.007455% 434,600 771,710
See notes to Schedules.___________________________________________________________________________________________________
80

___________________________________________________________________________________________________Schedule 1
Change in NPL due to 1%
Increase in the Actuarial Assumed
Investment Return (8.00%)
Differences Between Expected
and Actual Experience
Changes of Assumptions
Difference Between
Projected and Actual
Investment Earnings on Pension Plan Investments
Total Deferred Outflows of Resources
Differences Between Expected
and Actual Experience
Difference Between
Projected and Actual
Investment Earnings on Pension Plan Investments
Total Deferred Inflows of Resources
Total Proportionate
Share of Allocable Plan
Pension Expense
DEFERRED OUTFLOWS OF RESOURCES
(Excluding Employer Specific Amounts) * (Excluding Employer Specific Amounts) *
DEFERRED INFLOWS OF RESOURCES
178,886 1,419 54,845 24,205 80,469 18,410 81,904 100,314 94,188
10,413,097 82,629 3,192,576 1,408,982 4,684,187 1,071,643 4,767,683 5,839,326 5,482,727
1,313,508 10,423 402,711 177,729 590,863 135,177 601,395 736,572 691,591
39,347 312 12,064 5,324 17,700 4,049 18,015 22,064 20,717
221,548 1,758 67,925 29,977 99,660 22,800 101,437 124,237 116,650
48,643 386 14,914 6,582 21,882 5,006 22,272 27,278 25,612
9,852 78 3,021 1,333 4,432 1,014 4,511 5,525 5,187
21,699 172 6,653 2,936 9,761 2,233 9,935 12,168 11,425
5,602 44 1,718 758 2,520 577 2,565 3,142 2,950
15,981 127 4,900 2,162 7,189 1,645 7,317 8,962 8,415
143,188 1,136 43,900 19,375 64,411 14,736 65,559 80,295 75,392
5,255 42 1,611 711 2,364 541 2,406 2,947 2,767
10,331 82 3,167 1,398 4,647 1,063 4,730 5,793 5,439
3,651,079 28,972 1,119,393 494,023 1,642,388 375,744 1,671,663 2,047,407 1,922,374
929,860 7,378 285,088 125,818 418,284 95,695 425,740 521,435 489,592
2,429,222 19,276 744,781 328,695 1,092,752 249,999 1,112,230 1,362,229 1,279,040
34,495 274 10,576 4,668 15,518 3,550 15,794 19,344 18,163
7,961 63 2,441 1,077 3,581 819 3,645 4,464 4,191
228,984 1,817 70,205 30,984 103,006 23,565 104,842 128,407 120,565
51,485 409 15,785 6,966 23,160 5,298 23,572 28,870 27,108
14,254 113 4,370 1,929 6,412 1,467 6,526 7,993 7,505
90,297 717 27,684 12,218 40,619 9,293 41,343 50,636 47,543
2,498 20 766 338 1,124 257 1,144 1,401 1,315
877 7 269 119 395 90 402 492 462
1,356 11 416 183 610 140 621 761 714
877 7 269 119 395 90 402 492 462
9,208 73 2,823 1,246 4,142 948 4,216 5,164 4,848
1,672,438 13,271 512,757 226,295 752,323 172,116 765,733 937,849 880,576
1,112,854 8,831 341,192 150,579 500,602 114,527 509,525 624,052 585,942
174,588 1,385 53,527 23,623 78,535 17,967 79,936 97,903 91,925
85,468 678 26,204 11,565 38,447 8,796 39,132 47,928 45,001
828,429 6,574 253,990 112,094 372,658 85,256 379,300 464,556 436,186
30,568 243 9,372 4,136 13,751 3,146 13,996 17,142 16,095
52,512 417 16,100 7,105 23,622 5,404 24,043 29,447 27,649
51,555 409 15,806 6,976 23,191 5,306 23,605 28,911 27,145
263,412 2,090 80,760 35,642 118,492 27,109 120,604 147,713 138,692
151,836 1,205 46,552 20,545 68,302 15,626 69,519 85,145 79,945
___________________________________________________________________________________________________81 (Continued)

___________________________________________________________________________________________________
Employer ID # Employer Name
2019 Actual Employer
Contributions
Employer Allocation
Percentage ** Net Pension
Liability (NPL)
Change in NPL due to 1%
Decrease in the Actuarial Assumed
Investment Return (6.00%)
Iowa Public Employees' Retirement System
Schedule of Employer Allocations and Collective Pension Amounts Allocated by Employer -Regular Membership Group
As of and for the year ended June 30, 2019
67303 CITY OF UTE 7,154 0.000989% 57,665 102,395
67304 CITY OF WHITING 10,071 0.001392% 81,175 144,140
67305 CITY OF MOORHEAD 3,877 0.000536% 31,246 55,482
67306 CITY OF SOLDIER 3,711 0.000513% 29,909 53,109
67308 CITY OF CASTANA 2,496 0.000345% 20,118 35,724
67311 CITY OF RODNEY 283 0.000039% 2,283 4,053
67312 CITY OF BLENCOE 7,054 0.000975% 56,860 100,965
67313 LOW RENT HOUSING AGENCY OF ONAWA 12,088 0.001671% 97,435 173,013
67545 WHITING COMMUNITY SCHOOL DISTRICT 144,114 0.019926% 1,161,599 2,062,625
67549 WEST MONONA COMMUNITY SCHOOL DISTRICT 435,560 0.060223% 3,510,728 6,233,919
68201 MONROE COUNTY 247,870 0.034272% 1,997,900 3,547,626
68203 MONROE COUNTY AGRICULTURAL EXT. DISTRICT 10,311 0.001426% 83,105 147,568
68204 MONROE COUNTY HOSPITAL 817,210 0.112992% 6,586,933 11,696,267
68301 CITY OF ALBIA 50,226 0.006945% 404,838 718,862
68304 CITY OF LOVILIA 7,963 0.001101% 64,186 113,974
68305 CITY OF MELROSE 425 0.000059% 3,424 6,080
68307 ALBIA LOW RENT HOUSING AGENCY 14,303 0.001978% 115,286 204,710
68549 ALBIA COMMUNITY SCHOOL DISTRICT 705,978 0.097612% 5,690,374 10,104,268
68701 ALBIA MUNICIPAL WATERWORKS 19,748 0.002731% 159,177 282,647
69201 MONTGOMERY COUNTY 254,316 0.035163% 2,049,859 3,639,888
69203 MONTGOMERY CO AGRI EXTENSION DISTRI 9,560 0.001322% 77,056 136,827
69205 MONTGOMERY COUNTY MEMORIAL HOSPITAL 1,793,614 0.247995% 14,457,012 25,670,986
69301 CITY OF RED OAK 111,833 0.015463% 901,403 1,600,601
69303 CITY OF VILLISCA 23,228 0.003212% 187,221 332,445
69304 CITY OF STANTON 15,438 0.002135% 124,435 220,956
69308 CITY OF ELLIOTT 6,731 0.000931% 54,255 96,339
69312 STANTON HOUSING COMMISSION 3,761 0.000520% 30,312 53,824
69313 CITY OF GRANT 702 0.000097% 5,661 10,052
69314 LOW RENT HOUSING AGENCY OF RED OAK 16,775 0.002319% 135,207 240,085
69315 VILLISCA LOW RENT HOUSING 3,756 0.000519% 30,274 53,758
69530 VILLISCA COMMUNITY SCHOOL DISTRICT 187,431 0.025915% 1,510,748 2,682,601
69531 RED OAK COMMUNITY SCHOOL DISTRICT 668,334 0.092408% 5,386,956 9,565,496
69532 STANTON COMMUNITY SCHOOL DISTRICT 140,399 0.019412% 1,131,654 2,009,451
69701 VILLISCA MUNICIPAL POWER PLANT 20,707 0.002863% 166,903 296,366
70201 MUSCATINE COUNTY 551,735 0.076286% 4,447,132 7,896,671
70204 MUSCATINE COUNTY AGRI EXTENSION OFFICE 22,887 0.003164% 184,474 327,566
70205 MUSCATINE LOUISA DRAINAGE DIST 13 6,846 0.000947% 55,179 97,980
See notes to Schedules.___________________________________________________________________________________________________
82

___________________________________________________________________________________________________Schedule 1
Change in NPL due to 1%
Increase in the Actuarial Assumed
Investment Return (8.00%)
Differences Between Expected
and Actual Experience
Changes of Assumptions
Difference Between
Projected and Actual
Investment Earnings on Pension Plan Investments
Total Deferred Outflows of Resources
Differences Between Expected
and Actual Experience
Difference Between
Projected and Actual
Investment Earnings on Pension Plan Investments
Total Deferred Inflows of Resources
Total Proportionate
Share of Allocable Plan
Pension Expense
DEFERRED OUTFLOWS OF RESOURCES
(Excluding Employer Specific Amounts) * (Excluding Employer Specific Amounts) *
DEFERRED INFLOWS OF RESOURCES
20,147 160 6,177 2,726 9,063 2,073 9,224 11,297 10,608
28,360 225 8,695 3,837 12,757 2,919 12,985 15,904 14,932
10,916 87 3,347 1,477 4,911 1,123 4,998 6,121 5,748
10,449 83 3,204 1,414 4,701 1,075 4,784 5,859 5,502
7,029 56 2,155 951 3,162 723 3,218 3,941 3,701
797 6 245 108 359 82 365 447 420
19,865 158 6,091 2,688 8,937 2,044 9,095 11,139 10,459
34,041 270 10,437 4,606 15,313 3,503 15,586 19,089 17,923
405,829 3,220 124,424 54,912 182,556 41,765 185,810 227,575 213,678
1,226,545 9,733 376,049 165,962 551,744 126,227 561,579 687,806 645,803
698,007 5,539 214,004 94,446 313,989 71,834 319,586 391,420 367,516
29,035 230 8,902 3,929 13,061 2,988 13,294 16,282 15,287
2,301,280 18,261 705,555 311,383 1,035,199 236,832 1,053,651 1,290,483 1,211,675
141,439 1,122 43,364 19,138 63,624 14,556 64,758 79,314 74,471
22,425 178 6,875 3,034 10,087 2,308 10,267 12,575 11,807
1,196 9 367 162 538 123 548 671 630
40,277 320 12,349 5,450 18,119 4,145 18,441 22,586 21,207
1,988,049 15,775 609,521 269,000 894,296 204,596 910,237 1,114,833 1,046,752
55,612 441 17,050 7,525 25,016 5,723 25,462 31,185 29,281
716,160 5,683 219,569 96,903 322,155 73,702 327,897 401,599 377,074
26,921 214 8,254 3,643 12,111 2,771 12,326 15,097 14,175
5,050,853 40,079 1,548,553 683,424 2,272,056 519,799 2,312,556 2,832,355 2,659,386
314,924 2,499 96,553 42,612 141,664 32,410 144,189 176,599 165,814
65,410 519 20,054 8,850 29,423 6,732 29,948 36,680 34,440
43,474 345 13,329 5,882 19,556 4,474 19,905 24,379 22,890
18,955 150 5,811 2,565 8,526 1,951 8,679 10,630 9,980
10,590 84 3,247 1,433 4,764 1,090 4,849 5,939 5,576
1,978 16 606 268 890 204 906 1,110 1,041
47,237 375 14,483 6,392 21,250 4,861 21,628 26,489 24,872
10,577 84 3,243 1,431 4,758 1,089 4,843 5,932 5,569
527,811 4,188 161,823 71,417 237,428 54,319 241,661 295,980 277,904
1,882,044 14,934 577,020 254,657 846,611 193,687 861,702 1,055,389 990,938
395,366 3,137 121,216 53,497 177,850 40,688 181,020 221,708 208,169
58,311 463 17,878 7,890 26,231 6,001 26,698 32,699 30,702
1,553,697 12,329 476,352 210,229 698,910 159,896 711,367 871,263 818,056
64,450 511 19,760 8,721 28,992 6,633 29,509 36,142 33,934
19,278 153 5,910 2,608 8,671 1,984 8,827 10,811 10,150
___________________________________________________________________________________________________83 (Continued)

___________________________________________________________________________________________________
Employer ID # Employer Name
2019 Actual Employer
Contributions
Employer Allocation
Percentage ** Net Pension
Liability (NPL)
Change in NPL due to 1%
Decrease in the Actuarial Assumed
Investment Return (6.00%)
Iowa Public Employees' Retirement System
Schedule of Employer Allocations and Collective Pension Amounts Allocated by Employer -Regular Membership Group
As of and for the year ended June 30, 2019
70211 MUSCATINE CO SOIL & WATER CONS DIST 1,931 0.000267% 15,566 27,639
70302 CITY OF WILTON 62,267 0.008609% 501,892 891,199
70303 CITY OF WEST LIBERTY 108,514 0.015004% 874,648 1,553,093
70304 CITY OF MUSCATINE 791,490 0.109436% 6,379,622 11,328,150
70307 CITY OF NICHOLS 1,331 0.000184% 10,728 19,050
70316 CITY OF ATALISSA 1,373 0.000190% 11,065 19,648
70317 CITY OF CONESVILLE 1,634 0.000226% 13,171 23,387
70318 CITY OF STOCKTON 1,160 0.000160% 9,349 16,600
70319 CITY OF FRUITLAND 9,793 0.001354% 78,937 140,166
70507 MUSCATINE COMMUNITY SCHOOL DISTRICT 3,317,006 0.458628% 26,735,971 47,474,454
70542 WEST LIBERTY COMMUNITY SCHOOL DISTRICT 823,535 0.113867% 6,637,915 11,786,794
70543 WILTON COMMUNITY SCHOOL DISTRICT 539,265 0.074562% 4,346,619 7,718,192
70703 MUSCATINE POWER AND WATER 59,858 0.008276% 482,470 856,711
70704 WILTON MUNICIPAL LIGHT & POWER 32,575 0.004504% 262,560 466,222
71201 O'BRIEN COUNTY 338,116 0.046750% 2,725,308 4,839,268
71203 O'BRIEN COUNTY AGRI EXT DISTRICT 17,609 0.002435% 141,931 252,023
71301 CITY OF PRIMGHAR 33,829 0.004677% 272,669 484,172
71302 CITY OF SHELDON 129,296 0.017877% 1,042,158 1,850,535
71303 CITY OF HARTLEY 67,410 0.009320% 543,341 964,798
71306 CITY OF PAULLINA 28,862 0.003991% 232,637 413,088
71310 CITY OF SUTHERLAND 6,930 0.000958% 55,859 99,187
71312 CITY OF SANBORN 46,419 0.006418% 374,151 664,371
71317 CITY OF ARCHER 1,049 0.000145% 8,457 15,016
71319 CITY OF CALUMET 1,576 0.000218% 12,701 22,552
71401 PRAIRIE VIEW CEMETERY - O'BRIEN COUNTY 1,695 0.000234% 13,661 24,258
71530 HARTLEY-MELVIN-SANBORN COMM SCHOOL DIST 430,987 0.059591% 3,473,873 6,168,476
71534 SHELDON COMMUNITY SCHOOL DISTRICT 687,405 0.095045% 5,540,674 9,838,449
71535 NORTHWEST IOWA COMMUNITY COLLEGE 339,614 0.046957% 2,737,381 4,860,705
71537 SOUTH O'BRIEN COMMUNITY SCHOOL DISTRICT 431,089 0.059605% 3,474,695 6,169,937
71601 S & H SOLID WASTE COLLECTION AGENCY 6,264 0.000866% 50,487 89,648
71701 SANBORN MUNICIPAL LIGHT PLANT 27,151 0.003754% 218,845 388,598
72201 OSCEOLA COUNTY 198,893 0.027500% 1,603,130 2,846,642
72203 OSCEOLA COUNTY AGRI EXTENSION DISTRICT 8,041 0.001112% 64,809 115,079
72206 OSCEOLA CO SOIL & WATER CONS DIST 205 0.000028% 1,656 2,940
72301 CITY OF SIBLEY 117,750 0.016281% 949,099 1,685,294
72302 CITY OF MELVIN 2,808 0.000388% 22,633 40,189
72304 CITY OF OCHEYEDAN 7,933 0.001097% 63,939 113,536
See notes to Schedules.___________________________________________________________________________________________________
84

___________________________________________________________________________________________________Schedule 1
Change in NPL due to 1%
Increase in the Actuarial Assumed
Investment Return (8.00%)
Differences Between Expected
and Actual Experience
Changes of Assumptions
Difference Between
Projected and Actual
Investment Earnings on Pension Plan Investments
Total Deferred Outflows of Resources
Differences Between Expected
and Actual Experience
Difference Between
Projected and Actual
Investment Earnings on Pension Plan Investments
Total Deferred Inflows of Resources
Total Proportionate
Share of Allocable Plan
Pension Expense
DEFERRED OUTFLOWS OF RESOURCES
(Excluding Employer Specific Amounts) * (Excluding Employer Specific Amounts) *
DEFERRED INFLOWS OF RESOURCES
5,438 43 1,667 736 2,446 560 2,490 3,050 2,863
175,346 1,391 53,760 23,726 78,877 18,045 80,283 98,328 92,324
305,576 2,425 93,687 41,347 137,459 31,448 139,909 171,357 160,893
2,228,852 17,686 683,349 301,583 1,002,618 229,378 1,020,490 1,249,868 1,173,540
3,748 30 1,149 507 1,686 386 1,716 2,102 1,973
3,866 31 1,185 523 1,739 398 1,770 2,168 2,035
4,601 37 1,411 623 2,071 474 2,107 2,581 2,423
3,266 26 1,001 442 1,469 336 1,495 1,831 1,720
27,578 219 8,455 3,732 12,406 2,838 12,627 15,465 14,521
9,340,760 74,120 2,863,805 1,263,886 4,201,811 961,286 4,276,708 5,237,994 4,918,117
2,319,092 18,402 711,016 313,793 1,043,211 238,665 1,061,806 1,300,471 1,221,053
1,518,580 12,050 465,585 205,477 683,112 156,282 695,289 851,571 799,566
168,561 1,338 51,679 22,808 75,825 17,347 77,176 94,523 88,751
91,731 728 28,124 12,412 41,264 9,440 41,999 51,439 48,298
952,142 7,555 291,920 128,833 428,308 97,988 435,943 533,931 501,324
49,586 393 15,203 6,709 22,305 5,103 22,703 27,806 26,108
95,262 756 29,207 12,890 42,853 9,804 43,616 53,420 50,158
364,099 2,889 111,630 49,266 163,785 37,471 166,704 204,175 191,706
189,827 1,506 58,200 25,685 85,391 19,536 86,913 106,449 99,948
81,276 645 24,919 10,997 36,561 8,364 37,213 45,577 42,794
19,515 155 5,983 2,641 8,779 2,008 8,935 10,943 10,275
130,717 1,037 40,077 17,687 58,801 13,453 59,850 73,303 68,826
2,955 23 906 400 1,329 304 1,353 1,657 1,556
4,437 35 1,360 600 1,995 457 2,032 2,489 2,336
4,773 38 1,463 646 2,147 491 2,185 2,676 2,513
1,213,669 9,631 372,101 164,220 545,952 124,902 555,684 680,586 639,023
1,935,748 15,360 593,486 261,924 870,770 199,214 886,291 1,085,505 1,019,214
956,360 7,589 293,213 129,404 430,206 98,422 437,874 536,296 503,545
1,213,956 9,633 372,190 164,259 546,082 124,932 555,815 680,747 639,175
17,639 140 5,408 2,387 7,935 1,815 8,076 9,891 9,287
76,458 607 23,441 10,345 34,393 7,869 35,007 42,876 40,257
560,086 4,444 171,718 75,785 251,947 57,640 256,438 314,078 294,898
22,642 180 6,942 3,064 10,186 2,330 10,367 12,697 11,922
578 5 177 78 260 60 265 325 305
331,587 2,631 101,662 44,867 149,160 34,125 151,819 185,944 174,588
7,907 63 2,424 1,070 3,557 814 3,620 4,434 4,163
22,339 177 6,849 3,023 10,049 2,299 10,228 12,527 11,762
___________________________________________________________________________________________________85 (Continued)

___________________________________________________________________________________________________
Employer ID # Employer Name
2019 Actual Employer
Contributions
Employer Allocation
Percentage ** Net Pension
Liability (NPL)
Change in NPL due to 1%
Decrease in the Actuarial Assumed
Investment Return (6.00%)
Iowa Public Employees' Retirement System
Schedule of Employer Allocations and Collective Pension Amounts Allocated by Employer -Regular Membership Group
As of and for the year ended June 30, 2019
72306 CITY OF ASHTON 12,334 0.001705% 99,419 176,536
72308 CITY OF HARRIS 1,198 0.000166% 9,653 17,140
72310 MELVIN PUBLIC LIBRARY 388 0.000054% 3,129 5,557
72401 EAST WEST HOLMAN TOWNSHIP - OSCEOLA CO 283 0.000039% 2,283 4,053
72511 SIBLEY-OCHEYEDAN COMMUNITY SCHOOL DIST 466,829 0.064546% 3,762,766 6,681,457
72601 OSCEOLA COUNTY ECONOMIC DEVELOPMENT COMM 7,245 0.001002% 58,394 103,689
73201 PAGE COUNTY 288,891 0.039944% 2,328,538 4,134,731
73203 PAGE COUNTY AGRICULTURAL EXT OFFICE 12,047 0.001666% 97,103 172,423
73301 CITY OF SHENANDOAH 142,256 0.019669% 1,146,621 2,036,028
73302 CITY OF CLARINDA 74,732 0.010333% 602,356 1,069,591
73303 CLARINDA REGIONAL HEALTH CENTER 1,100,483 0.152159% 8,870,189 15,750,592
73304 CITY OF COIN 3,618 0.000500% 29,159 51,777
73306 CITY OF BLANCHARD 94 0.000013% 761 1,351
73309 CITY OF ESSEX 13,096 0.001811% 105,556 187,434
73311 CITY OF COLLEGE SPRINGS 1,331 0.000184% 10,729 19,050
73312 CITY OF BRADDYVILLE 453 0.000063% 3,652 6,485
73313 CITY OF HEPBURN 38 0.000005% 304 540
73316 CITY OF SHAMBAUGH 1,540 0.000213% 12,416 22,047
73319 CITY OF YORKTOWN 317 0.000044% 2,553 4,532
73321 SOUTHVIEW VILLAGE LOW RENT HOUSING 2,888 0.000399% 23,278 41,335
73323 CLARINDA LOW RENT HOUSING AGENCY 10,227 0.001414% 82,429 146,367
73324 SHENANDOAH LOW RENT HOUSING 9,792 0.001354% 78,926 140,147
73552 SHENANDOAH COMMUNITY SCHOOL DISTRICT 756,896 0.104653% 6,100,788 10,833,031
73553 SOUTH PAGE COMMUNITY SCHOOL DISTRICT 112,830 0.015601% 909,444 1,614,879
73555 CLARINDA COMMUNITY SCHOOL DISTRICT 638,795 0.088323% 5,148,860 9,142,713
73556 ESSEX COMMUNITY SCHOOL DISTRICT 156,538 0.021644% 1,261,741 2,240,445
73601 PAGE COUNTY LANDFILL ASSOCIATION 21,419 0.002962% 172,645 306,562
74201 PALO ALTO COUNTY 301,421 0.041676% 2,429,536 4,314,072
74203 PALO ALTO COUNTY EXTENSION OFFICE 9,354 0.001293% 75,395 133,877
74205 PALO ALTO COUNTY HEALTH SYSTEM 859,174 0.118794% 6,925,179 12,296,882
74301 CITY OF EMMETSBURG 86,247 0.011925% 695,170 1,234,398
74302 CITY OF GRAETTINGER 20,105 0.002780% 162,051 287,750
74303 CITY OF WEST BEND 35,143 0.004859% 283,258 502,975
74305 CITY OF RUTHVEN 15,292 0.002114% 123,255 218,861
74306 CITY OF AYRSHIRE 906 0.000125% 7,305 12,971
74307 CITY OF CYLINDER 396 0.000055% 3,196 5,675
74308 CITY OF MALLARD 8,856 0.001224% 71,380 126,748
See notes to Schedules.___________________________________________________________________________________________________
86

___________________________________________________________________________________________________Schedule 1
Change in NPL due to 1%
Increase in the Actuarial Assumed
Investment Return (8.00%)
Differences Between Expected
and Actual Experience
Changes of Assumptions
Difference Between
Projected and Actual
Investment Earnings on Pension Plan Investments
Total Deferred Outflows of Resources
Differences Between Expected
and Actual Experience
Difference Between
Projected and Actual
Investment Earnings on Pension Plan Investments
Total Deferred Inflows of Resources
Total Proportionate
Share of Allocable Plan
Pension Expense
DEFERRED OUTFLOWS OF RESOURCES
(Excluding Employer Specific Amounts) * (Excluding Employer Specific Amounts) *
DEFERRED INFLOWS OF RESOURCES
34,734 276 10,649 4,700 15,625 3,575 15,903 19,478 18,288
3,372 27 1,034 456 1,517 347 1,544 1,891 1,776
1,093 9 335 148 492 113 501 614 576
797 6 245 108 359 82 365 447 420
1,314,599 10,431 403,046 177,877 591,354 135,289 601,895 737,184 692,166
20,401 162 6,255 2,760 9,177 2,100 9,341 11,441 10,742
813,522 6,455 249,420 110,077 365,952 83,722 372,475 456,197 428,338
33,925 269 10,401 4,590 15,260 3,491 15,533 19,024 17,862
400,595 3,179 122,819 54,204 180,202 41,226 183,414 224,640 210,922
210,446 1,670 64,521 28,475 94,666 21,658 96,353 118,011 110,804
3,098,982 24,591 950,124 419,319 1,394,034 318,926 1,418,883 1,737,809 1,631,683
10,187 81 3,123 1,378 4,582 1,048 4,664 5,712 5,364
266 2 82 36 120 27 122 149 140
36,878 293 11,307 4,990 16,590 3,795 16,885 20,680 19,417
3,748 30 1,149 507 1,686 386 1,716 2,102 1,974
1,276 10 391 173 574 131 584 715 672
106 1 33 14 48 11 49 60 56
4,338 34 1,330 587 1,951 446 1,986 2,432 2,284
892 7 273 121 401 92 408 500 470
8,133 65 2,493 1,100 3,658 837 3,724 4,561 4,282
28,798 229 8,829 3,897 12,955 2,964 13,185 16,149 15,163
27,574 219 8,454 3,731 12,404 2,838 12,625 15,463 14,519
2,131,436 16,913 653,482 288,402 958,797 219,353 975,887 1,195,240 1,122,248
317,733 2,521 97,414 42,992 142,927 32,699 145,475 178,174 167,293
1,798,860 14,274 551,517 243,401 809,192 185,126 823,616 1,008,742 947,140
440,815 3,498 135,151 59,646 198,295 45,366 201,829 247,195 232,099
60,317 479 18,493 8,161 27,133 6,207 27,616 33,823 31,758
848,808 6,735 260,238 114,851 381,824 87,353 388,631 475,984 446,916
26,341 209 8,076 3,564 11,849 2,711 12,060 14,771 13,869
2,419,453 19,199 741,786 327,373 1,088,358 248,993 1,107,757 1,356,750 1,273,896
242,872 1,927 74,463 32,863 109,253 24,995 111,200 136,195 127,877
56,616 449 17,358 7,661 25,468 5,826 25,922 31,748 29,809
98,962 785 30,341 13,390 44,516 10,184 45,310 55,494 52,106
43,062 342 13,202 5,827 19,371 4,432 19,716 24,148 22,673
2,552 20 782 345 1,147 263 1,168 1,431 1,344
1,116 9 342 151 502 115 511 626 588
24,938 198 7,646 3,374 11,218 2,566 11,418 13,984 13,131
___________________________________________________________________________________________________87 (Continued)

___________________________________________________________________________________________________
Employer ID # Employer Name
2019 Actual Employer
Contributions
Employer Allocation
Percentage ** Net Pension
Liability (NPL)
Change in NPL due to 1%
Decrease in the Actuarial Assumed
Investment Return (6.00%)
Iowa Public Employees' Retirement System
Schedule of Employer Allocations and Collective Pension Amounts Allocated by Employer -Regular Membership Group
As of and for the year ended June 30, 2019
74311 CITY OF CURLEW 151 0.000021% 1,217 2,162
74312 CITY OF RODMAN 151 0.000021% 1,217 2,162
74314 EMMETSBURG LOW RENT HOUSING 2,662 0.000368% 21,457 38,100
74508 RUTHVEN-AYRSHIRE COMMUNITY SCHOOL DIST 146,598 0.020269% 1,181,618 2,098,172
74529 WEST BEND-MALLARD COMMUNITY SCHOOL DIST 249,169 0.034452% 2,008,373 3,566,222
74530 EMMETSBURG COMMUNITY SCHOOL DISTRICT 512,576 0.070872% 4,131,502 7,336,214
74602 UPPER DES MOINES OPPORTUNITY INC 492,160 0.068049% 3,966,941 7,044,007
74603 LOST ISLAND SANITARY DISTRICT 1,826 0.000252% 14,719 26,136
74701 GRAETTINGER MUNICIPAL LIGHT PLANT 13,503 0.001867% 108,835 193,256
74702 EMMETSBURG MUNICIPAL UTILITIES 38,661 0.005346% 311,619 553,335
75201 PLYMOUTH COUNTY 452,173 0.062520% 3,644,636 6,471,696
75203 PLYMOUTH COUNTY AGRI EXT DISTRICT 13,252 0.001832% 106,817 189,673
75207 PLYMOUTH CO SOIL & WATER CONS DEPT 5,116 0.000707% 41,236 73,222
75301 CITY OF AKRON 39,891 0.005516% 321,532 570,937
75302 CITY OF REMSEN 52,555 0.007267% 423,610 752,194
75303 CITY OF HINTON 30,855 0.004266% 248,700 441,610
75304 CITY OF KINGSLEY 16,701 0.002309% 134,617 239,037
75305 CITY OF LE MARS 244,044 0.033743% 1,967,058 3,492,861
75306 CITY OF MERRILL 7,613 0.001053% 61,364 108,962
75311 CITY OF WESTFIELD 1,712 0.000237% 13,796 24,496
75312 AKRON CARE CENTER, INC 154,651 0.021383% 1,246,526 2,213,428
75313 CITY OF BRUNSVILLE 189 0.000026% 1,522 2,702
75314 CITY OF CRAIG 307 0.000042% 2,473 4,391
75315 CITY OF OYENS 519 0.000072% 4,185 7,431
75316 FLOYD VALLEY HOSPITAL 1,311,007 0.181267% 10,567,068 18,763,702
75317 CITY OF STRUBLE 90 0.000012% 723 1,284
75550 HINTON COMMUNITY SCHOOL DISTRICT 500,412 0.069190% 4,033,453 7,162,110
75553 LE MARS COMMUNITY SCHOOL DISTRICT 1,465,615 0.202644% 11,813,258 20,976,533
75554 AKRON-WESTFIELD COMMUNITY SCHOOL DISTRIC 423,696 0.058583% 3,415,101 6,064,117
75557 KINGSLEY-PIERSON COMMUNITY SCHOOL DIST 287,953 0.039814% 2,320,982 4,121,315
75558 REMSEN-UNION COMMUNITY SCHOOL DISTRICT 249,472 0.034493% 2,010,810 3,570,549
75601 PLYMOUTH CO SOLID WASTE AGY 22,085 0.003054% 178,010 316,088
76201 POCAHONTAS COUNTY 300,889 0.041603% 2,425,245 4,306,453
76203 POCAHONTAS COUNTY AGR EXT DISTRICT 11,232 0.001553% 90,532 160,755
76207 POCAHONTAS CO SOIL & WATER CONS DIST 179 0.000025% 1,439 2,555
76301 CITY OF FONDA 19,683 0.002721% 158,648 281,708
76302 CITY OF POCAHONTAS 67,653 0.009354% 545,303 968,282
See notes to Schedules.___________________________________________________________________________________________________
88

___________________________________________________________________________________________________Schedule 1
Change in NPL due to 1%
Increase in the Actuarial Assumed
Investment Return (8.00%)
Differences Between Expected
and Actual Experience
Changes of Assumptions
Difference Between
Projected and Actual
Investment Earnings on Pension Plan Investments
Total Deferred Outflows of Resources
Differences Between Expected
and Actual Experience
Difference Between
Projected and Actual
Investment Earnings on Pension Plan Investments
Total Deferred Inflows of Resources
Total Proportionate
Share of Allocable Plan
Pension Expense
DEFERRED OUTFLOWS OF RESOURCES
(Excluding Employer Specific Amounts) * (Excluding Employer Specific Amounts) *
DEFERRED INFLOWS OF RESOURCES
425 3 130 58 191 44 195 239 224
425 3 130 58 191 44 195 239 224
7,496 59 2,298 1,014 3,371 771 3,432 4,203 3,947
412,822 3,276 126,568 55,858 185,702 42,485 189,013 231,498 217,360
701,666 5,568 215,125 94,942 315,635 72,211 321,261 393,472 369,443
1,443,425 11,454 442,543 195,308 649,305 148,547 660,879 809,426 759,995
1,385,932 10,997 424,916 187,529 623,442 142,630 634,555 777,185 729,724
5,142 41 1,577 696 2,314 529 2,354 2,883 2,708
38,024 302 11,658 5,145 17,105 3,913 17,409 21,322 20,020
108,871 864 33,379 14,731 48,974 11,204 49,847 61,051 57,323
1,273,328 10,104 390,393 172,292 572,789 131,042 582,999 714,041 670,436
37,319 296 11,442 5,050 16,788 3,841 17,087 20,928 19,649
14,407 114 4,417 1,949 6,480 1,483 6,596 8,079 7,585
112,334 891 34,441 15,200 50,532 11,561 51,433 62,994 59,146
147,997 1,174 45,375 20,025 66,574 15,231 67,761 82,992 77,924
86,888 689 26,639 11,757 39,085 8,942 39,782 48,724 45,749
47,031 373 14,419 6,364 21,156 4,840 21,534 26,374 24,763
687,232 5,453 210,700 92,988 309,141 70,725 314,652 385,377 361,843
21,439 170 6,573 2,901 9,644 2,206 9,816 12,022 11,288
4,820 38 1,478 652 2,168 496 2,207 2,703 2,538
435,499 3,456 133,521 58,927 195,904 44,819 199,395 244,214 229,300
532 4 163 72 239 55 243 298 280
864 7 265 117 389 89 396 485 455
1,462 12 448 198 658 150 669 819 770
3,691,822 29,295 1,131,884 499,536 1,660,715 379,937 1,690,317 2,070,254 1,943,826
253 2 77 34 113 26 116 142 133
1,409,169 11,182 432,041 190,673 633,896 145,022 645,194 790,216 741,959
4,127,204 32,750 1,265,369 558,447 1,856,566 424,743 1,889,659 2,314,402 2,173,064
1,193,136 9,468 365,806 161,442 536,716 122,789 546,282 669,071 628,212
810,883 6,434 248,610 109,719 364,763 83,450 371,266 454,716 426,948
702,518 5,575 215,387 95,057 316,019 72,298 321,651 393,949 369,891
62,191 493 19,067 8,415 27,975 6,400 28,475 34,875 32,745
847,309 6,723 259,778 114,648 381,149 87,199 387,944 475,143 446,127
31,629 251 9,697 4,280 14,228 3,255 14,482 17,737 16,653
503 4 154 68 226 52 230 282 265
55,427 440 16,994 7,500 24,934 5,704 25,378 31,082 29,184
190,513 1,512 58,410 25,778 85,700 19,606 87,227 106,833 100,309
___________________________________________________________________________________________________89 (Continued)

___________________________________________________________________________________________________
Employer ID # Employer Name
2019 Actual Employer
Contributions
Employer Allocation
Percentage ** Net Pension
Liability (NPL)
Change in NPL due to 1%
Decrease in the Actuarial Assumed
Investment Return (6.00%)
Iowa Public Employees' Retirement System
Schedule of Employer Allocations and Collective Pension Amounts Allocated by Employer -Regular Membership Group
As of and for the year ended June 30, 2019
76303 CITY OF ROLFE 14,748 0.002039% 118,871 211,076
76304 CITY OF GILMORE CITY 15,826 0.002188% 127,559 226,504
76305 CITY OF LAURENS 40,318 0.005575% 324,978 577,056
76306 CITY OF PALMER 3,141 0.000434% 25,319 44,958
76307 CITY OF HAVELOCK 1,857 0.000257% 14,965 26,573
76309 CITY OF PLOVER 969 0.000134% 7,809 13,867
76313 CITY OF VARINA 993 0.000137% 8,000 14,206
76315 POCAHONTAS COMMUNITY HOSPITAL 325,831 0.045051% 2,626,284 4,663,432
76539 POCAHONTAS AREA COMMUNITY SCHOOL DISTRIC 547,821 0.075745% 4,415,588 7,840,658
76540 LAURENS-MARATHON COMMUNITY SCHOOL DIST 129,312 0.017879% 1,042,288 1,850,767
76601 POCAHONTAS COUNTY SOLID WASTE COMMISSION 7,509 0.001038% 60,523 107,469
76701 LAURENS MUNICIPAL POWER & COMMUNICATIONS 37,489 0.005183% 302,168 536,553
77002 STATE - DEPARTMENT ON AGING 191,644 0.026498% 1,544,699 2,742,886
77003 STATE - DEPT OF AGRICULTURE 1,886,491 0.260837% 15,205,630 27,000,290
77007 STATE - ATTORNEY GENERAL 1,865,396 0.257920% 15,035,601 26,698,374
77008 STATE - AUDITOR OF STATE 680,753 0.094125% 5,487,057 9,743,243
77009 STATE - BANKING/DEPT OF COMMERCE 698,101 0.096523% 5,626,881 9,991,525
77010 STATE - ALCOHOLIC BEVERAGE/DEPT OF COMMERCE 389,141 0.053805% 3,136,583 5,569,559
77012 STATE - DEPT OF MANAGEMENT 200,549 0.027729% 1,616,480 2,870,347
77013 STATE - ETHICS & CAMPAIGN DISCLOSURE COMM 31,711 0.004385% 255,598 453,860
77014 STATE - LEGISLATIVE-CITIZENS AIDE 120,660 0.016683% 972,555 1,726,944
77015 STATE - CIVIL RIGHTS COMMISSION 117,118 0.016193% 944,006 1,676,249
77016 STATE - DEPARTMENT OF COMMERCE 497,372 0.068769% 4,008,950 7,118,601
77018 STATE - DEPARTMENT OF NATURAL RESOURCES 4,504,770 0.622855% 36,309,669 64,474,251
77019 STATE - JUDICIAL BRANCH 8,076,461 1.116697% 65,098,466 115,593,863
77021 STATE - IOWA ECONOMIC DEVELOPMENT AUTHORITY 713,905 0.098709% 5,754,269 10,217,724
77022 STATE - DEPARTMENT FOR THE BLIND 333,405 0.046098% 2,687,331 4,771,832
77027 STATE - WORKFORCE DEVELOPMENT 3,687,444 0.509847% 29,721,796 52,776,316
77033 IOWA STATE FAIR BOARD 484,066 0.066930% 3,901,704 6,928,166
77034 STATE - LEGISLATIVE - HOUSE 646,907 0.089445% 5,214,244 9,258,814
77035 STATE - LEGISLATIVE - SENATE 600,688 0.083054% 4,841,708 8,597,310
77037 STATE - OFFICE OF GOVERNOR 158,587 0.021927% 1,278,250 2,269,760
77038 STATE - DEPT OF PUBLIC HEALTH 2,973,272 0.411101% 23,965,378 42,554,774
77039 STATE - DEPT OF EDUCATION/COLLEGE AID 241,539 0.033396% 1,946,867 3,457,007
77040 STATE - IOWA FINANCE AUTHORITY 663,677 0.091764% 5,349,414 9,498,833
77043 STATE - DEPT OF COMMERCE/INSURANCE 699,614 0.096733% 5,639,080 10,013,185
77045 STATE - LAW ENFORCEMENT ACADEMY 138,175 0.019105% 1,113,729 1,977,623
See notes to Schedules.___________________________________________________________________________________________________
90

___________________________________________________________________________________________________Schedule 1
Change in NPL due to 1%
Increase in the Actuarial Assumed
Investment Return (8.00%)
Differences Between Expected
and Actual Experience
Changes of Assumptions
Difference Between
Projected and Actual
Investment Earnings on Pension Plan Investments
Total Deferred Outflows of Resources
Differences Between Expected
and Actual Experience
Difference Between
Projected and Actual
Investment Earnings on Pension Plan Investments
Total Deferred Inflows of Resources
Total Proportionate
Share of Allocable Plan
Pension Expense
DEFERRED OUTFLOWS OF RESOURCES
(Excluding Employer Specific Amounts) * (Excluding Employer Specific Amounts) *
DEFERRED INFLOWS OF RESOURCES
41,530 330 12,733 5,619 18,682 4,274 19,015 23,289 21,866
44,565 354 13,663 6,030 20,047 4,586 20,404 24,990 23,465
113,538 901 34,810 15,363 51,074 11,685 51,984 63,669 59,780
8,846 70 2,712 1,197 3,979 910 4,050 4,960 4,657
5,228 41 1,603 707 2,351 538 2,394 2,932 2,753
2,728 22 836 369 1,227 281 1,249 1,530 1,437
2,795 22 857 378 1,257 288 1,280 1,568 1,472
917,546 7,281 281,313 124,152 412,746 94,427 420,103 514,530 483,108
1,542,676 12,241 472,973 208,737 693,951 158,761 706,321 865,082 812,253
364,145 2,890 111,644 49,272 163,806 37,475 166,725 204,200 191,730
21,145 168 6,483 2,861 9,512 2,176 9,681 11,857 11,133
105,569 838 32,367 14,284 47,489 10,864 48,335 59,199 55,584
539,672 4,282 165,459 73,022 242,763 55,539 247,091 302,630 284,149
5,312,399 42,154 1,628,741 718,814 2,389,709 546,715 2,432,305 2,979,020 2,797,096
5,252,995 41,683 1,610,528 710,776 2,362,987 540,602 2,405,107 2,945,709 2,765,819
1,917,016 15,212 587,742 259,389 862,343 197,286 877,714 1,075,000 1,009,351
1,965,866 15,599 602,720 265,999 884,318 202,313 900,081 1,102,394 1,035,072
1,095,830 8,695 335,973 148,275 492,943 112,775 501,730 614,505 576,979
564,751 4,481 173,148 76,416 254,045 58,120 258,574 316,694 297,354
89,299 709 27,378 12,083 40,170 9,190 40,886 50,076 47,018
339,782 2,696 104,175 45,975 152,846 34,968 155,571 190,539 178,903
329,808 2,617 101,117 44,626 148,360 33,942 151,004 184,946 173,651
1,400,609 11,114 429,416 189,515 630,045 144,141 641,275 785,416 737,452
12,685,527 100,660 3,889,285 1,716,462 5,706,407 1,305,506 5,808,125 7,113,631 6,679,212
22,743,484 180,471 6,972,977 3,077,392 10,230,840 2,340,602 10,413,206 12,753,808 11,974,949
2,010,372 15,952 616,365 272,021 904,338 206,893 920,458 1,127,351 1,058,505
938,874 7,450 287,852 127,038 422,340 96,622 429,868 526,490 494,338
10,383,919 82,397 3,183,630 1,405,034 4,671,061 1,068,641 4,754,324 5,822,965 5,467,364
1,363,140 10,817 417,928 184,445 613,190 140,285 624,120 764,405 717,724
1,821,703 14,455 558,520 246,492 819,467 187,477 834,075 1,021,552 959,167
1,691,550 13,423 518,616 228,881 760,920 174,083 774,484 948,567 890,639
446,583 3,544 136,919 60,427 200,890 45,959 204,470 250,429 235,136
8,372,796 66,439 2,567,035 1,132,912 3,766,386 861,670 3,833,522 4,695,192 4,408,463
680,178 5,397 208,537 92,034 305,968 69,999 311,422 381,421 358,129
1,868,927 14,830 572,999 252,882 840,711 192,337 855,697 1,048,034 984,032
1,970,128 15,633 604,026 266,575 886,234 202,752 902,032 1,104,784 1,037,316
389,104 3,088 119,296 52,649 175,033 40,044 178,153 218,197 204,872
___________________________________________________________________________________________________91 (Continued)
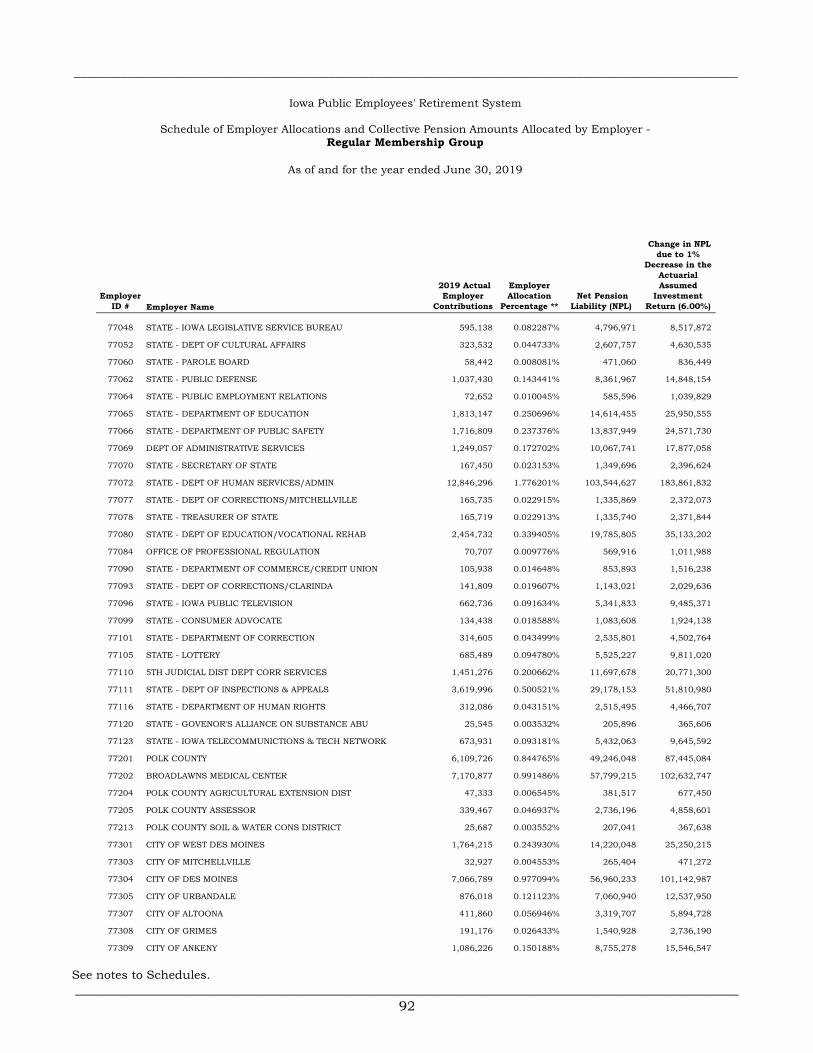
___________________________________________________________________________________________________
Employer ID # Employer Name
2019 Actual Employer
Contributions
Employer Allocation
Percentage ** Net Pension
Liability (NPL)
Change in NPL due to 1%
Decrease in the Actuarial Assumed
Investment Return (6.00%)
Iowa Public Employees' Retirement System
Schedule of Employer Allocations and Collective Pension Amounts Allocated by Employer -Regular Membership Group
As of and for the year ended June 30, 2019
77048 STATE - IOWA LEGISLATIVE SERVICE BUREAU 595,138 0.082287% 4,796,971 8,517,872
77052 STATE - DEPT OF CULTURAL AFFAIRS 323,532 0.044733% 2,607,757 4,630,535
77060 STATE - PAROLE BOARD 58,442 0.008081% 471,060 836,449
77062 STATE - PUBLIC DEFENSE 1,037,430 0.143441% 8,361,967 14,848,154
77064 STATE - PUBLIC EMPLOYMENT RELATIONS 72,652 0.010045% 585,596 1,039,829
77065 STATE - DEPARTMENT OF EDUCATION 1,813,147 0.250696% 14,614,455 25,950,555
77066 STATE - DEPARTMENT OF PUBLIC SAFETY 1,716,809 0.237376% 13,837,949 24,571,730
77069 DEPT OF ADMINISTRATIVE SERVICES 1,249,057 0.172702% 10,067,741 17,877,058
77070 STATE - SECRETARY OF STATE 167,450 0.023153% 1,349,696 2,396,624
77072 STATE - DEPT OF HUMAN SERVICES/ADMIN 12,846,296 1.776201% 103,544,627 183,861,832
77077 STATE - DEPT OF CORRECTIONS/MITCHELLVILLE 165,735 0.022915% 1,335,869 2,372,073
77078 STATE - TREASURER OF STATE 165,719 0.022913% 1,335,740 2,371,844
77080 STATE - DEPT OF EDUCATION/VOCATIONAL REHAB 2,454,732 0.339405% 19,785,805 35,133,202
77084 OFFICE OF PROFESSIONAL REGULATION 70,707 0.009776% 569,916 1,011,988
77090 STATE - DEPARTMENT OF COMMERCE/CREDIT UNION 105,938 0.014648% 853,893 1,516,238
77093 STATE - DEPT OF CORRECTIONS/CLARINDA 141,809 0.019607% 1,143,021 2,029,636
77096 STATE - IOWA PUBLIC TELEVISION 662,736 0.091634% 5,341,833 9,485,371
77099 STATE - CONSUMER ADVOCATE 134,438 0.018588% 1,083,608 1,924,138
77101 STATE - DEPARTMENT OF CORRECTION 314,605 0.043499% 2,535,801 4,502,764
77105 STATE - LOTTERY 685,489 0.094780% 5,525,227 9,811,020
77110 5TH JUDICIAL DIST DEPT CORR SERVICES 1,451,276 0.200662% 11,697,678 20,771,300
77111 STATE - DEPT OF INSPECTIONS & APPEALS 3,619,996 0.500521% 29,178,153 51,810,980
77116 STATE - DEPARTMENT OF HUMAN RIGHTS 312,086 0.043151% 2,515,495 4,466,707
77120 STATE - GOVENOR'S ALLIANCE ON SUBSTANCE ABU 25,545 0.003532% 205,896 365,606
77123 STATE - IOWA TELECOMMUNICTIONS & TECH NETWORK 673,931 0.093181% 5,432,063 9,645,592
77201 POLK COUNTY 6,109,726 0.844765% 49,246,048 87,445,084
77202 BROADLAWNS MEDICAL CENTER 7,170,877 0.991486% 57,799,215 102,632,747
77204 POLK COUNTY AGRICULTURAL EXTENSION DIST 47,333 0.006545% 381,517 677,450
77205 POLK COUNTY ASSESSOR 339,467 0.046937% 2,736,196 4,858,601
77213 POLK COUNTY SOIL & WATER CONS DISTRICT 25,687 0.003552% 207,041 367,638
77301 CITY OF WEST DES MOINES 1,764,215 0.243930% 14,220,048 25,250,215
77303 CITY OF MITCHELLVILLE 32,927 0.004553% 265,404 471,272
77304 CITY OF DES MOINES 7,066,789 0.977094% 56,960,233 101,142,987
77305 CITY OF URBANDALE 876,018 0.121123% 7,060,940 12,537,950
77307 CITY OF ALTOONA 411,860 0.056946% 3,319,707 5,894,728
77308 CITY OF GRIMES 191,176 0.026433% 1,540,928 2,736,190
77309 CITY OF ANKENY 1,086,226 0.150188% 8,755,278 15,546,547
See notes to Schedules.___________________________________________________________________________________________________
92

___________________________________________________________________________________________________Schedule 1
Change in NPL due to 1%
Increase in the Actuarial Assumed
Investment Return (8.00%)
Differences Between Expected
and Actual Experience
Changes of Assumptions
Difference Between
Projected and Actual
Investment Earnings on Pension Plan Investments
Total Deferred Outflows of Resources
Differences Between Expected
and Actual Experience
Difference Between
Projected and Actual
Investment Earnings on Pension Plan Investments
Total Deferred Inflows of Resources
Total Proportionate
Share of Allocable Plan
Pension Expense
DEFERRED OUTFLOWS OF RESOURCES
(Excluding Employer Specific Amounts) * (Excluding Employer Specific Amounts) *
DEFERRED INFLOWS OF RESOURCES
1,675,920 13,299 513,824 226,767 753,890 172,474 767,328 939,802 882,409
911,073 7,229 279,328 123,276 409,833 93,761 417,139 510,900 479,700
164,574 1,306 50,458 22,267 74,031 16,936 75,350 92,286 86,652
2,921,425 23,182 895,686 395,294 1,314,162 300,653 1,337,587 1,638,240 1,538,195
204,590 1,623 62,726 27,683 92,032 21,055 93,672 114,727 107,721
5,105,860 40,515 1,565,417 690,867 2,296,799 525,460 2,337,741 2,863,201 2,688,348
4,834,571 38,363 1,482,242 654,159 2,174,764 497,540 2,213,530 2,711,070 2,545,509
3,517,372 27,911 1,078,399 475,931 1,582,241 361,983 1,610,444 1,972,427 1,851,974
471,544 3,742 144,572 63,804 212,118 48,528 215,898 264,426 248,278
36,175,438 287,053 11,091,111 4,894,852 16,273,016 3,722,925 16,563,086 20,286,011 19,047,170
466,713 3,703 143,091 63,150 209,944 48,031 213,687 261,718 245,735
466,668 3,703 143,077 63,144 209,924 48,026 213,666 261,692 245,711
6,912,576 54,852 2,119,343 935,332 3,109,527 711,394 3,164,954 3,876,348 3,639,625
199,112 1,580 61,046 26,942 89,568 20,491 91,164 111,655 104,837
298,325 2,367 91,464 40,366 134,197 30,702 136,589 167,291 157,075
399,338 3,169 122,434 54,034 179,637 41,097 182,839 223,936 210,260
1,866,279 14,809 572,187 252,524 839,520 192,064 854,484 1,046,548 982,637
378,581 3,004 116,070 51,225 170,299 38,961 173,335 212,296 199,331
885,934 7,030 271,621 119,875 398,526 91,174 405,629 496,803 466,464
1,930,351 15,317 591,831 261,193 868,341 198,658 883,820 1,082,478 1,016,373
4,086,824 32,429 1,252,989 552,983 1,838,401 420,587 1,871,170 2,291,757 2,151,803
10,193,986 80,890 3,125,398 1,379,335 4,585,623 1,049,094 4,667,362 5,716,456 5,367,360
878,840 6,974 269,445 118,915 395,334 90,444 402,381 492,825 462,729
71,934 571 22,054 9,733 32,358 7,403 32,935 40,338 37,875
1,897,803 15,059 581,853 256,788 853,700 195,308 868,917 1,064,225 999,235
17,205,116 136,524 5,274,956 2,328,002 7,739,482 1,770,632 7,877,439 9,648,071 9,058,876
20,193,340 160,235 6,191,122 2,732,334 9,083,691 2,078,159 9,245,611 11,323,770 10,632,242
133,291 1,058 40,866 18,035 59,959 13,717 61,028 74,745 70,180
955,946 7,585 293,086 129,348 430,019 98,379 437,684 536,063 503,327
72,334 574 22,177 9,787 32,538 7,444 33,118 40,562 38,085
4,968,065 39,422 1,523,171 672,222 2,234,815 511,279 2,274,651 2,785,930 2,615,797
92,724 736 28,429 12,546 41,711 9,543 42,454 51,997 48,821
19,900,225 157,910 6,101,255 2,692,673 8,951,838 2,047,994 9,111,407 11,159,401 10,477,910
2,466,884 19,575 756,328 333,791 1,109,694 253,875 1,129,474 1,383,349 1,298,869
1,159,808 9,203 355,588 156,932 521,723 119,359 531,023 650,382 610,664
538,355 4,272 165,055 72,844 242,171 55,404 246,488 301,892 283,456
3,058,836 24,272 937,816 413,887 1,375,975 314,794 1,400,502 1,715,296 1,610,545
___________________________________________________________________________________________________93 (Continued)

___________________________________________________________________________________________________
Employer ID # Employer Name
2019 Actual Employer
Contributions
Employer Allocation
Percentage ** Net Pension
Liability (NPL)
Change in NPL due to 1%
Decrease in the Actuarial Assumed
Investment Return (6.00%)
Iowa Public Employees' Retirement System
Schedule of Employer Allocations and Collective Pension Amounts Allocated by Employer -Regular Membership Group
As of and for the year ended June 30, 2019
77310 CITY OF BONDURANT 81,637 0.011288% 658,017 1,168,427
77314 CITY OF WINDSOR HEIGHTS 68,740 0.009504% 554,064 983,839
77317 CITY OF ELKHART 8,371 0.001157% 67,473 119,811
77318 CITY OF RUNNELLS 7,231 0.001000% 58,287 103,498
77320 CITY OF CLIVE 543,442 0.075139% 4,380,291 7,777,982
77321 CITY OF PLEASANT HILL 209,491 0.028965% 1,688,558 2,998,333
77322 CITY OF POLK CITY 87,337 0.012076% 703,962 1,250,010
77330 CITY OF JOHNSTON 431,743 0.059695% 3,479,963 6,179,291
77331 CITY OF ALLEMAN 6,963 0.000963% 56,122 99,655
77402 SAYLOR TOWNSHIP TRUSTEES - POLK COUNTY 7,262 0.001004% 58,535 103,940
77515 JOHNSTON COMMUNITY SCHOOL DISTRICT 4,704,723 0.650501% 37,921,340 67,336,058
77517 SAYDEL COMMUNITY SCHOOL DISTRICT 872,431 0.120627% 7,032,027 12,486,609
77559 WEST DES MOINES COMMUNITY SCHOOL DIST 6,417,663 0.887342% 51,728,106 91,852,418
77560 ANKENY COMMUNITY SCHOOL DISTRICT 7,567,629 1.046343% 60,997,142 108,311,234
77563 NORTH POLK COMMUNITY SCHOOL DISTRICT 1,057,471 0.146212% 8,523,507 15,134,996
77565 DES MOINES INDEPENDENT COMM SCHOOL DIST 22,975,887 3.176775% 185,191,878 328,840,992
77566 BONDURANT FARRAR COMMUNITY SCHOOL DISTRI 1,274,986 0.176287% 10,276,736 18,248,166
77567 URBANDALE COMMUNITY SCHOOL DISTRICT 2,929,091 0.404992% 23,609,264 41,922,432
77569 SOUTHEAST POLK COMMUNITY SCHOOL DISTRICT 4,717,605 0.652282% 38,025,177 67,520,439
77570 DES MOINES AREA COMMUNITY COLLEGE 3,440,910 0.475760% 27,734,671 49,247,822
77605 DES MOINES AREA REGIONAL TRANSIT AUTH 1,408,986 0.194814% 11,356,809 20,166,027
77606 AEA 11 - HEARTLAND 4,588,734 0.634464% 36,986,444 65,675,984
77608 CENTRAL IOWA REGIONAL HOUSING AUTHORITY 67,091 0.009276% 540,770 960,233
77609 HIRTA 151,235 0.020911% 1,218,998 2,164,548
77610 MUNICIPAL FIRE & POLICE RETIREMENT 86,727 0.011991% 699,044 1,241,276
77611 DES MOINES AREA MPO 58,435 0.008080% 471,003 836,350
77701 DES MOINES WATER WORKS 1,606,328 0.222100% 12,947,441 22,990,476
77704 WEST DES MOINES WATER WORKS 260,909 0.036075% 2,102,998 3,734,246
77706 METRO WASTE AUTHORITY 504,197 0.069713% 4,063,966 7,216,290
78001 IOWA SCHOOL FOR THE DEAF 332,516 0.045976% 2,680,173 4,759,122
78003 4TH JUDICIAL DIST DEPT CORR SERVICES 337,317 0.046639% 2,718,863 4,827,824
78201 POTTAWATTAMIE COUNTY 1,571,246 0.217249% 12,664,668 22,488,362
78203 E POTTAWATTAMIE CO AGR EXT DIST 10,616 0.001468% 85,565 151,936
78204 WEST POTTAWATTAMIE CO EXT SERVICE 13,884 0.001920% 111,913 198,721
78205 POTTAWATTAMIE COUNTY ASSESSOR 85,764 0.011858% 691,283 1,227,495
78301 CITY OF COUNCIL BLUFFS 1,546,331 0.213804% 12,463,848 22,131,770
78302 CITY OF MCCLELLAND 331 0.000046% 2,669 4,739
See notes to Schedules.___________________________________________________________________________________________________
94

___________________________________________________________________________________________________Schedule 1
Change in NPL due to 1%
Increase in the Actuarial Assumed
Investment Return (8.00%)
Differences Between Expected
and Actual Experience
Changes of Assumptions
Difference Between
Projected and Actual
Investment Earnings on Pension Plan Investments
Total Deferred Outflows of Resources
Differences Between Expected
and Actual Experience
Difference Between
Projected and Actual
Investment Earnings on Pension Plan Investments
Total Deferred Inflows of Resources
Total Proportionate
Share of Allocable Plan
Pension Expense
DEFERRED OUTFLOWS OF RESOURCES
(Excluding Employer Specific Amounts) * (Excluding Employer Specific Amounts) *
DEFERRED INFLOWS OF RESOURCES
229,892 1,824 70,483 31,106 103,413 23,659 105,257 128,916 121,043
193,574 1,536 59,348 26,192 87,076 19,921 88,629 108,550 101,921
23,573 187 7,227 3,190 10,604 2,426 10,793 13,219 12,412
20,364 162 6,243 2,755 9,160 2,095 9,324 11,419 10,722
1,530,344 12,143 469,193 207,068 688,404 157,491 700,675 858,166 805,760
589,932 4,681 180,869 79,823 265,373 60,712 270,103 330,815 310,612
245,944 1,952 75,404 33,278 110,634 25,311 112,606 137,917 129,495
1,215,796 9,647 372,754 164,508 546,909 125,121 556,658 681,779 640,144
19,607 156 6,011 2,653 8,820 2,018 8,977 10,995 10,324
20,451 162 6,270 2,767 9,199 2,105 9,363 11,468 10,768
13,248,598 105,128 4,061,917 1,792,649 5,959,694 1,363,452 6,065,929 7,429,381 6,975,681
2,456,783 19,495 753,231 332,424 1,105,150 252,835 1,124,849 1,377,684 1,293,551
18,072,274 143,405 5,540,820 2,445,336 8,129,561 1,859,874 8,274,471 10,134,345 9,515,453
21,310,602 169,101 6,533,666 2,883,511 9,586,278 2,193,140 9,757,155 11,950,295 11,220,505
2,977,862 23,630 912,990 402,931 1,339,551 306,461 1,363,427 1,669,888 1,567,910
64,700,580 513,402 19,836,700 8,754,551 29,104,653 6,658,534 29,623,449 36,281,983 34,066,289
3,590,389 28,490 1,100,786 485,811 1,615,087 369,498 1,643,875 2,013,373 1,890,419
8,248,381 65,451 2,528,890 1,116,078 3,710,419 848,866 3,776,558 4,625,424 4,342,955
13,284,875 105,416 4,073,040 1,797,559 5,976,015 1,367,187 6,082,539 7,449,726 6,994,782
9,689,676 76,888 2,970,780 1,311,097 4,358,765 997,194 4,436,461 5,433,655 5,101,829
3,967,734 31,484 1,216,477 536,869 1,784,830 408,332 1,816,645 2,224,977 2,089,100
12,921,972 102,537 3,961,778 1,748,455 5,812,770 1,329,839 5,916,383 7,246,222 6,803,705
188,929 1,499 57,924 25,564 84,987 19,443 86,502 105,945 99,475
425,882 3,379 130,572 57,626 191,577 43,829 194,992 238,821 224,236
244,225 1,938 74,878 33,046 109,862 25,134 111,820 136,954 128,590
164,555 1,306 50,451 22,266 74,023 16,935 75,342 92,277 86,642
4,523,454 35,894 1,386,856 612,063 2,034,813 465,522 2,071,084 2,536,606 2,381,699
734,726 5,830 225,261 99,414 330,505 75,612 336,397 412,009 386,849
1,419,830 11,266 435,310 192,114 638,690 146,118 650,074 796,192 747,572
936,373 7,430 287,085 126,699 421,214 96,365 428,723 525,088 493,021
949,892 7,538 291,230 128,527 427,295 97,755 434,911 532,666 500,138
4,424,661 35,110 1,356,567 598,695 1,990,372 455,355 2,025,851 2,481,206 2,329,682
29,894 237 9,165 4,045 13,447 3,076 13,687 16,763 15,740
39,099 310 11,987 5,290 17,587 4,024 17,902 21,926 20,586
241,514 1,916 74,046 32,679 108,641 24,855 110,578 135,433 127,162
4,354,501 34,553 1,335,056 589,202 1,958,811 448,135 1,993,728 2,441,863 2,292,741
932 7 286 126 419 96 427 523 491
___________________________________________________________________________________________________95 (Continued)
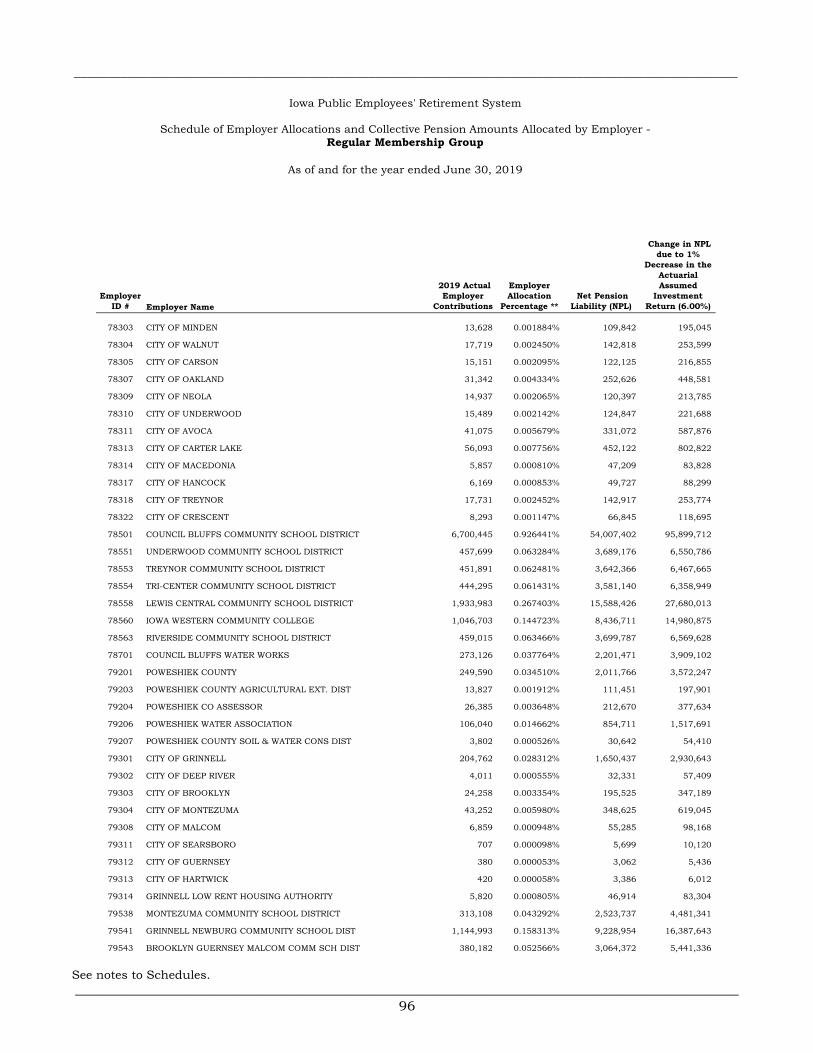
___________________________________________________________________________________________________
Employer ID # Employer Name
2019 Actual Employer
Contributions
Employer Allocation
Percentage ** Net Pension
Liability (NPL)
Change in NPL due to 1%
Decrease in the Actuarial Assumed
Investment Return (6.00%)
Iowa Public Employees' Retirement System
Schedule of Employer Allocations and Collective Pension Amounts Allocated by Employer -Regular Membership Group
As of and for the year ended June 30, 2019
78303 CITY OF MINDEN 13,628 0.001884% 109,842 195,045
78304 CITY OF WALNUT 17,719 0.002450% 142,818 253,599
78305 CITY OF CARSON 15,151 0.002095% 122,125 216,855
78307 CITY OF OAKLAND 31,342 0.004334% 252,626 448,581
78309 CITY OF NEOLA 14,937 0.002065% 120,397 213,785
78310 CITY OF UNDERWOOD 15,489 0.002142% 124,847 221,688
78311 CITY OF AVOCA 41,075 0.005679% 331,072 587,876
78313 CITY OF CARTER LAKE 56,093 0.007756% 452,122 802,822
78314 CITY OF MACEDONIA 5,857 0.000810% 47,209 83,828
78317 CITY OF HANCOCK 6,169 0.000853% 49,727 88,299
78318 CITY OF TREYNOR 17,731 0.002452% 142,917 253,774
78322 CITY OF CRESCENT 8,293 0.001147% 66,845 118,695
78501 COUNCIL BLUFFS COMMUNITY SCHOOL DISTRICT 6,700,445 0.926441% 54,007,402 95,899,712
78551 UNDERWOOD COMMUNITY SCHOOL DISTRICT 457,699 0.063284% 3,689,176 6,550,786
78553 TREYNOR COMMUNITY SCHOOL DISTRICT 451,891 0.062481% 3,642,366 6,467,665
78554 TRI-CENTER COMMUNITY SCHOOL DISTRICT 444,295 0.061431% 3,581,140 6,358,949
78558 LEWIS CENTRAL COMMUNITY SCHOOL DISTRICT 1,933,983 0.267403% 15,588,426 27,680,013
78560 IOWA WESTERN COMMUNITY COLLEGE 1,046,703 0.144723% 8,436,711 14,980,875
78563 RIVERSIDE COMMUNITY SCHOOL DISTRICT 459,015 0.063466% 3,699,787 6,569,628
78701 COUNCIL BLUFFS WATER WORKS 273,126 0.037764% 2,201,471 3,909,102
79201 POWESHIEK COUNTY 249,590 0.034510% 2,011,766 3,572,247
79203 POWESHIEK COUNTY AGRICULTURAL EXT. DIST 13,827 0.001912% 111,451 197,901
79204 POWESHIEK CO ASSESSOR 26,385 0.003648% 212,670 377,634
79206 POWESHIEK WATER ASSOCIATION 106,040 0.014662% 854,711 1,517,691
79207 POWESHIEK COUNTY SOIL & WATER CONS DIST 3,802 0.000526% 30,642 54,410
79301 CITY OF GRINNELL 204,762 0.028312% 1,650,437 2,930,643
79302 CITY OF DEEP RIVER 4,011 0.000555% 32,331 57,409
79303 CITY OF BROOKLYN 24,258 0.003354% 195,525 347,189
79304 CITY OF MONTEZUMA 43,252 0.005980% 348,625 619,045
79308 CITY OF MALCOM 6,859 0.000948% 55,285 98,168
79311 CITY OF SEARSBORO 707 0.000098% 5,699 10,120
79312 CITY OF GUERNSEY 380 0.000053% 3,062 5,436
79313 CITY OF HARTWICK 420 0.000058% 3,386 6,012
79314 GRINNELL LOW RENT HOUSING AUTHORITY 5,820 0.000805% 46,914 83,304
79538 MONTEZUMA COMMUNITY SCHOOL DISTRICT 313,108 0.043292% 2,523,737 4,481,341
79541 GRINNELL NEWBURG COMMUNITY SCHOOL DIST 1,144,993 0.158313% 9,228,954 16,387,643
79543 BROOKLYN GUERNSEY MALCOM COMM SCH DIST 380,182 0.052566% 3,064,372 5,441,336
See notes to Schedules.___________________________________________________________________________________________________
96

___________________________________________________________________________________________________Schedule 1
Change in NPL due to 1%
Increase in the Actuarial Assumed
Investment Return (8.00%)
Differences Between Expected
and Actual Experience
Changes of Assumptions
Difference Between
Projected and Actual
Investment Earnings on Pension Plan Investments
Total Deferred Outflows of Resources
Differences Between Expected
and Actual Experience
Difference Between
Projected and Actual
Investment Earnings on Pension Plan Investments
Total Deferred Inflows of Resources
Total Proportionate
Share of Allocable Plan
Pension Expense
DEFERRED OUTFLOWS OF RESOURCES
(Excluding Employer Specific Amounts) * (Excluding Employer Specific Amounts) *
DEFERRED INFLOWS OF RESOURCES
38,376 305 11,766 5,193 17,264 3,949 17,570 21,519 20,206
49,896 396 15,298 6,751 22,445 5,135 22,845 27,980 26,272
42,667 339 13,081 5,773 19,193 4,391 19,535 23,926 22,465
88,260 700 27,060 11,942 39,702 9,083 40,410 49,493 46,471
42,063 334 12,896 5,691 18,921 4,329 19,259 23,588 22,147
43,618 346 13,373 5,902 19,621 4,489 19,971 24,460 22,966
115,667 918 35,463 15,651 52,032 11,904 52,958 64,862 60,901
157,958 1,253 48,429 21,373 71,055 16,256 72,322 88,578 83,168
16,494 131 5,057 2,232 7,420 1,697 7,552 9,249 8,684
17,373 138 5,326 2,351 7,815 1,788 7,954 9,742 9,147
49,931 396 15,308 6,756 22,460 5,139 22,861 28,000 26,290
23,354 185 7,160 3,160 10,505 2,403 10,693 13,096 12,296
18,868,593 149,724 5,784,965 2,553,085 8,487,774 1,941,825 8,639,069 10,580,894 9,934,733
1,288,889 10,227 395,164 174,398 579,789 132,644 590,124 722,768 678,629
1,272,535 10,098 390,149 172,185 572,432 130,960 582,636 713,596 670,018
1,251,145 9,928 383,591 169,291 562,810 128,759 572,842 701,601 658,755
5,446,136 43,215 1,669,744 736,910 2,449,869 560,478 2,493,538 3,054,016 2,867,512
2,947,538 23,389 903,692 398,827 1,325,908 303,340 1,349,543 1,652,883 1,551,944
1,292,597 10,257 396,300 174,900 581,457 133,025 591,821 724,846 680,581
769,129 6,103 235,809 104,070 345,982 79,153 352,149 431,302 404,964
702,852 5,577 215,489 95,102 316,168 72,333 321,804 394,137 370,067
38,938 309 11,938 5,269 17,516 4,007 17,828 21,835 20,502
74,301 590 22,780 10,054 33,424 7,647 34,019 41,666 39,121
298,611 2,369 91,552 40,405 134,326 30,731 136,720 167,451 157,225
10,705 85 3,282 1,449 4,816 1,102 4,901 6,003 5,637
576,614 4,575 176,785 78,021 259,381 59,341 264,005 323,346 303,600
11,296 90 3,463 1,528 5,081 1,162 5,172 6,334 5,947
68,311 542 20,945 9,242 30,729 7,029 31,276 38,305 35,967
121,799 966 37,343 16,480 54,789 12,535 55,766 68,301 64,130
19,315 153 5,922 2,613 8,688 1,988 8,843 10,831 10,170
1,991 16 610 269 895 205 912 1,117 1,048
1,070 8 328 145 481 110 490 600 563
1,183 9 363 160 532 122 542 664 623
16,390 130 5,025 2,218 7,373 1,687 7,504 9,191 8,630
881,719 6,996 270,328 119,304 396,628 90,740 403,699 494,439 464,245
3,224,324 25,585 988,553 436,279 1,450,417 331,825 1,476,271 1,808,096 1,697,678
1,070,601 8,495 328,238 144,862 481,595 110,179 490,180 600,359 563,695
___________________________________________________________________________________________________97 (Continued)

___________________________________________________________________________________________________
Employer ID # Employer Name
2019 Actual Employer
Contributions
Employer Allocation
Percentage ** Net Pension
Liability (NPL)
Change in NPL due to 1%
Decrease in the Actuarial Assumed
Investment Return (6.00%)
Iowa Public Employees' Retirement System
Schedule of Employer Allocations and Collective Pension Amounts Allocated by Employer -Regular Membership Group
As of and for the year ended June 30, 2019
79701 MONTEZUMA MUNICIPAL LIGHT AND POWER 29,672 0.004103% 239,161 424,672
79702 BROOKLYN MUNICIPAL UTILITIES 22,460 0.003105% 181,034 321,458
80201 RINGGOLD COUNTY 241,940 0.033452% 1,950,101 3,462,750
80203 RINGGOLD COUNTY HOSPITAL 708,543 0.097967% 5,711,050 10,140,982
80204 RINGGOLD COUNTY EXTENSION 4,767 0.000659% 38,420 68,222
80207 SUN VALLEY SANITARY DISTRICT 7,030 0.000972% 56,660 100,609
80301 CITY OF DIAGONAL 6,183 0.000855% 49,833 88,488
80303 CITY OF MOUNT AYR 39,843 0.005509% 321,147 570,254
80307 CITY OF KELLERTON 3,265 0.000451% 26,320 46,736
80308 CITY OF TINGLEY 908 0.000125% 7,316 12,991
80309 CITY OF BENTON 47 0.000007% 380 676
80310 CITY OF REDDING 113 0.000016% 913 1,621
80315 LOW RENT HOUSING AGENCY OF MT AYR 5,195 0.000718% 41,871 74,349
80552 MOUNT AYR COMMUNITY SCHOOL DISTRICT 449,371 0.062132% 3,622,048 6,431,588
80553 DIAGONAL COMM SCH DIST 108,259 0.014968% 872,594 1,549,446
81201 SAC COUNTY 287,776 0.039790% 2,319,553 4,118,777
81203 SAC CO AGRI EXT DIST 8,202 0.001134% 66,109 117,388
81204 SAC COUNTY ASSESSOR 15,832 0.002189% 127,607 226,589
81207 SAC CO SOIL & WATER CONS DIST 6,215 0.000859% 50,096 88,954
81301 CITY OF ODEBOLT 16,569 0.002291% 133,550 237,141
81303 CITY OF SCHALLER 12,320 0.001703% 99,300 176,324
81304 CITY OF AUBURN 8,798 0.001216% 70,912 125,916
81305 CITY OF LAKE VIEW 48,046 0.006643% 387,265 687,658
81306 CITY OF SAC CITY 110,073 0.015219% 887,222 1,575,420
81307 CITY OF EARLY 12,090 0.001672% 97,450 173,040
81309 CITY OF LYTTON 7,347 0.001016% 59,220 105,155
81311 CITY OF WALL LAKE 31,515 0.004357% 254,017 451,052
81316 CITY OF NEMAHA 227 0.000031% 1,826 3,243
81547 ODEBOLT ARTHUR COMMUNITY SCHOOL DISTRICT 26,235 0.003627% 211,458 375,481
81548 SCHALLER-CRESTLAND COMM SCH DIST 216,041 0.029871% 1,741,345 3,092,067
81601 SAC COUNTY SOLID WASTE AGENCY 8,651 0.001196% 69,727 123,813
82201 SCOTT COUNTY 2,208,803 0.305401% 17,803,548 31,613,354
82205 SCOTT CO AGR EXT DIST 40,006 0.005532% 322,463 572,590
82211 WASTE COMMISSION OF SCOTT COUNTY 300,210 0.041509% 2,419,773 4,296,735
82301 CITY OF DAVENPORT 3,145,401 0.434901% 25,352,782 45,018,356
82303 CITY OF ELDRIDGE 145,327 0.020094% 1,171,379 2,079,991
82304 CITY OF WALCOTT 39,063 0.005401% 314,860 559,090
See notes to Schedules.___________________________________________________________________________________________________
98

___________________________________________________________________________________________________Schedule 1
Change in NPL due to 1%
Increase in the Actuarial Assumed
Investment Return (8.00%)
Differences Between Expected
and Actual Experience
Changes of Assumptions
Difference Between
Projected and Actual
Investment Earnings on Pension Plan Investments
Total Deferred Outflows of Resources
Differences Between Expected
and Actual Experience
Difference Between
Projected and Actual
Investment Earnings on Pension Plan Investments
Total Deferred Inflows of Resources
Total Proportionate
Share of Allocable Plan
Pension Expense
DEFERRED OUTFLOWS OF RESOURCES
(Excluding Employer Specific Amounts) * (Excluding Employer Specific Amounts) *
DEFERRED INFLOWS OF RESOURCES
83,556 663 25,618 11,306 37,587 8,599 38,256 46,855 43,994
63,248 502 19,391 8,558 28,451 6,509 28,958 35,467 33,301
681,308 5,406 208,884 92,187 306,477 70,115 311,940 382,055 358,724
1,995,273 15,833 611,735 269,978 897,546 205,340 913,544 1,118,884 1,050,555
13,423 107 4,115 1,816 6,038 1,381 6,146 7,527 7,067
19,795 157 6,069 2,678 8,904 2,037 9,063 11,100 10,423
17,410 138 5,338 2,356 7,832 1,792 7,971 9,763 9,167
112,199 890 34,399 15,182 50,471 11,547 51,371 62,918 59,075
9,195 73 2,819 1,244 4,136 946 4,210 5,156 4,842
2,556 20 784 346 1,150 263 1,170 1,433 1,346
133 1 41 18 60 14 61 75 70
319 3 98 43 144 33 146 179 168
14,628 116 4,485 1,979 6,580 1,505 6,698 8,203 7,702
1,265,437 10,041 387,973 171,225 569,239 130,230 579,386 709,616 666,281
304,859 2,419 93,467 41,250 137,136 31,374 139,581 170,955 160,515
810,383 6,430 248,457 109,652 364,539 83,399 371,038 454,437 426,685
23,096 183 7,081 3,125 10,389 2,377 10,575 12,952 12,161
44,582 354 13,669 6,032 20,055 4,588 20,412 25,000 23,473
17,502 139 5,366 2,368 7,873 1,801 8,013 9,814 9,215
46,658 370 14,305 6,313 20,988 4,802 21,363 26,165 24,567
34,692 275 10,636 4,694 15,605 3,570 15,884 19,454 18,266
24,774 197 7,596 3,352 11,145 2,550 11,343 13,893 13,044
135,299 1,074 41,482 18,307 60,863 13,924 61,947 75,871 71,238
309,969 2,460 95,034 41,942 139,436 31,900 141,921 173,821 163,206
34,046 270 10,438 4,607 15,315 3,504 15,588 19,092 17,926
20,690 164 6,343 2,799 9,306 2,129 9,473 11,602 10,894
88,746 704 27,209 12,008 39,921 9,133 40,633 49,766 46,727
638 5 196 86 287 66 292 358 336
73,877 586 22,650 9,996 33,232 7,603 33,825 41,428 38,898
608,375 4,827 186,523 82,318 273,668 62,610 278,547 341,157 320,323
24,361 193 7,469 3,296 10,958 2,507 11,154 13,661 12,826
6,220,034 49,356 1,907,015 841,625 2,797,996 640,123 2,847,870 3,487,993 3,274,986
112,659 894 34,540 15,244 50,678 11,594 51,581 63,175 59,318
845,397 6,708 259,192 114,390 380,290 87,002 387,069 474,071 445,120
8,857,514 70,285 2,715,646 1,198,499 3,984,430 911,554 4,055,452 4,967,006 4,663,678
409,245 3,247 125,471 55,374 184,092 42,117 187,375 229,492 215,477
110,003 873 33,726 14,884 49,483 11,321 50,365 61,686 57,919
___________________________________________________________________________________________________99 (Continued)

___________________________________________________________________________________________________
Employer ID # Employer Name
2019 Actual Employer
Contributions
Employer Allocation
Percentage ** Net Pension
Liability (NPL)
Change in NPL due to 1%
Decrease in the Actuarial Assumed
Investment Return (6.00%)
Iowa Public Employees' Retirement System
Schedule of Employer Allocations and Collective Pension Amounts Allocated by Employer -Regular Membership Group
As of and for the year ended June 30, 2019
82305 CITY OF BUFFALO 31,249 0.004321% 251,874 447,247
82308 CITY OF BETTENDORF 1,196,005 0.165366% 9,640,125 17,117,751
82309 CITY OF PRINCETON 14,857 0.002054% 119,749 212,636
82311 CITY OF LE CLAIRE 68,940 0.009532% 555,678 986,705
82312 CITY OF LONG GROVE 16,321 0.002257% 131,554 233,598
82316 CITY OF BLUE GRASS 28,913 0.003998% 233,043 413,810
82317 CITY OF DIXON 1,822 0.000252% 14,685 26,076
82319 CITY OF RIVERDALE 8,409 0.001163% 67,775 120,347
82320 CITY OF DONAHUE 959 0.000133% 7,734 13,732
82321 CITY OF MAYSVILLE 655 0.000091% 5,283 9,381
82322 CITY OF NEW LIBERTY 905 0.000125% 7,293 12,950
82324 CITY OF MCCAUSLAND 3,438 0.000475% 27,708 49,201
82501 DAVENPORT COMMUNITY SCHOOL DISTRICT 11,614,448 1.605879% 93,615,597 166,231,081
82520 BETTENDORF COMMUNITY SCHOOL DISTRICT 2,918,707 0.403557% 23,525,569 41,773,816
82550 NORTH SCOTT COMMUNITY SCHOOL DISTRICT 2,015,749 0.278709% 16,247,482 28,850,283
82552 PLEASANT VALLEY COMMUNITY SCHOOL DIST 2,912,693 0.402725% 23,477,096 41,687,744
82553 EASTERN IOWA COMMUNITY COLLEGE 1,458,141 0.201611% 11,753,016 20,869,562
82603 7TH JUDICIAL DIST DEPT CORR SERVICES 593,943 0.082122% 4,787,344 8,500,777
82604 AEA 9 - MISSISSIPPI BEND 2,082,638 0.287957% 16,786,623 29,807,624
82605 PARK VIEW WATER & SANITARY DISTRICT 19,771 0.002734% 159,357 282,966
82606 QUAD CITY GARAGE POLICY GROUP 75,686 0.010465% 610,050 1,083,253
83201 SHELBY COUNTY 324,966 0.044932% 2,619,317 4,651,062
83203 SHELBY COUNTY AG 11,471 0.001586% 92,463 164,184
83204 MYRTUE MEDICAL CENTER 1,502,369 0.207726% 12,109,500 21,502,563
83301 CITY OF HARLAN 116,296 0.016080% 937,377 1,664,479
83304 CITY OF SHELBY 20,772 0.002872% 167,429 297,300
83305 CITY OF ELK HORN 13,495 0.001866% 108,772 193,144
83306 CITY OF DEFIANCE 4,541 0.000628% 36,603 64,995
83307 CITY OF PANAMA 3,472 0.000480% 27,987 49,696
83308 CITY OF EARLING 7,905 0.001093% 63,720 113,147
83309 CITY OF IRWIN 6,245 0.000863% 50,333 89,375
83310 CITY OF PORTSMOUTH 2,516 0.000348% 20,284 36,017
83313 CITY OF KIRKMAN 227 0.000031% 1,826 3,243
83314 CITY OF WESTPHALIA 90 0.000012% 723 1,284
83315 CITY OF TENNANT 340 0.000047% 2,739 4,864
83531 HARLAN COMM SCH DIST 1,021,902 0.141294% 8,236,807 14,625,911
83701 HARLAN MUNICIPAL UTILITIES 178,449 0.024673% 1,438,347 2,554,041
See notes to Schedules.___________________________________________________________________________________________________
100

___________________________________________________________________________________________________Schedule 1
Change in NPL due to 1%
Increase in the Actuarial Assumed
Investment Return (8.00%)
Differences Between Expected
and Actual Experience
Changes of Assumptions
Difference Between
Projected and Actual
Investment Earnings on Pension Plan Investments
Total Deferred Outflows of Resources
Differences Between Expected
and Actual Experience
Difference Between
Projected and Actual
Investment Earnings on Pension Plan Investments
Total Deferred Inflows of Resources
Total Proportionate
Share of Allocable Plan
Pension Expense
DEFERRED OUTFLOWS OF RESOURCES
(Excluding Employer Specific Amounts) * (Excluding Employer Specific Amounts) *
DEFERRED INFLOWS OF RESOURCES
87,997 698 26,979 11,907 39,584 9,056 40,290 49,346 46,333
3,367,975 26,725 1,032,595 455,716 1,515,036 346,609 1,542,043 1,888,652 1,773,314
41,837 332 12,827 5,661 18,820 4,306 19,155 23,461 22,028
194,138 1,540 59,521 26,268 87,329 19,979 88,887 108,866 102,218
45,961 365 14,091 6,219 20,675 4,730 21,044 25,774 24,200
81,418 646 24,962 11,017 36,625 8,379 37,278 45,657 42,869
5,131 41 1,573 694 2,308 528 2,349 2,877 2,701
23,679 188 7,260 3,204 10,652 2,437 10,841 13,278 12,467
2,702 21 828 366 1,215 278 1,237 1,515 1,423
1,846 15 566 250 831 190 845 1,035 972
2,548 20 781 345 1,146 262 1,167 1,429 1,342
9,680 77 2,968 1,310 4,355 996 4,432 5,428 5,097
32,706,528 259,528 10,027,569 4,425,478 14,712,575 3,365,929 14,974,831 18,340,760 17,220,712
8,219,140 65,219 2,519,925 1,112,121 3,697,265 845,857 3,763,170 4,609,027 4,327,559
5,676,391 45,043 1,740,338 768,065 2,553,446 584,175 2,598,961 3,183,136 2,988,746
8,202,205 65,085 2,514,733 1,109,830 3,689,648 844,114 3,755,416 4,599,530 4,318,643
4,106,157 32,583 1,258,916 555,599 1,847,098 422,577 1,880,022 2,302,599 2,161,983
1,672,557 13,272 512,793 226,311 752,376 172,128 765,787 937,915 880,638
5,864,751 46,537 1,798,088 793,552 2,638,177 603,559 2,685,202 3,288,761 3,087,922
55,675 442 17,069 7,533 25,044 5,730 25,491 31,221 29,314
213,134 1,691 65,345 28,839 95,875 21,934 97,584 119,518 112,220
915,112 7,261 280,566 123,823 411,650 94,177 418,988 513,165 481,827
32,304 256 9,904 4,371 14,531 3,324 14,790 18,114 17,009
4,230,702 33,571 1,297,101 572,451 1,903,123 435,394 1,937,046 2,372,440 2,227,558
327,492 2,599 100,406 44,312 147,317 33,703 149,944 183,647 172,432
58,495 464 17,934 7,915 26,313 6,020 26,782 32,802 30,799
38,002 302 11,651 5,142 17,095 3,911 17,399 21,310 20,009
12,788 101 3,921 1,730 5,752 1,316 5,855 7,171 6,733
9,778 78 2,999 1,322 4,399 1,005 4,476 5,481 5,148
22,262 177 6,825 3,012 10,014 2,291 10,193 12,484 11,721
17,585 140 5,391 2,379 7,910 1,810 8,051 9,861 9,259
7,086 56 2,173 959 3,188 729 3,245 3,974 3,731
638 5 196 86 287 66 292 358 336
253 2 77 34 113 26 116 142 133
957 8 293 129 430 98 438 536 504
2,877,697 22,835 882,280 389,377 1,294,492 296,153 1,317,567 1,613,720 1,515,172
502,516 3,987 154,068 67,995 226,050 51,715 230,079 281,794 264,586
___________________________________________________________________________________________________101 (Continued)

___________________________________________________________________________________________________
Employer ID # Employer Name
2019 Actual Employer
Contributions
Employer Allocation
Percentage ** Net Pension
Liability (NPL)
Change in NPL due to 1%
Decrease in the Actuarial Assumed
Investment Return (6.00%)
Iowa Public Employees' Retirement System
Schedule of Employer Allocations and Collective Pension Amounts Allocated by Employer -Regular Membership Group
As of and for the year ended June 30, 2019
84201 SIOUX COUNTY 455,241 0.062944% 3,669,368 6,515,614
84203 SIOUX COUNTY AGRI 10,733 0.001484% 86,507 153,609
84206 ROCK VALLEY RURAL WATER DIST 22,802 0.003153% 183,794 326,359
84301 CITY OF HAWARDEN 94,158 0.013019% 758,937 1,347,627
84302 CITY OF BOYDEN 16,703 0.002309% 134,630 239,059
84303 CITY OF ROCK VALLEY 79,373 0.010975% 639,767 1,136,020
84304 CITY OF SIOUX CENTER 299,835 0.041457% 2,416,750 4,291,368
84305 CITY OF MAURICE 5,564 0.000769% 44,848 79,636
84307 CITY OF ORANGE CITY 187,574 0.025935% 1,511,897 2,684,641
84308 CITY OF IRETON 10,828 0.001497% 87,273 154,969
84309 HAWARDEN REGIONAL HEALTHCARE 356,176 0.049247% 2,870,874 5,097,746
84311 CITY OF GRANVILLE 7,989 0.001105% 64,392 114,340
84312 CITY OF ALTON 40,850 0.005648% 329,263 584,664
84314 CITY OF HOSPERS 13,799 0.001908% 111,227 197,503
84317 CITY OF HULL 43,537 0.006020% 350,918 623,118
84318 CITY OF CHATSWORTH 118 0.000016% 951 1,689
84319 CITY OF MATLOCK 333 0.000046% 2,684 4,767
84320 ORANGE CITY AREA HEALTH SYSTEM 2,061,493 0.285034% 16,616,193 29,504,994
84404 SHERMAN TOWNSHIP - SIOUX COUNTY 213 0.000030% 1,720 3,055
84544 SIOUX CENTER COMM SCH DIST 981,448 0.135700% 7,910,737 14,046,915
84545 BOYDEN HULL COMM SCH DIST 430,269 0.059491% 3,468,085 6,158,199
84546 ROCK VALLEY COMM SCH DIST 597,250 0.082579% 4,814,000 8,548,110
84547 WEST SIOUX COMMUNITY SCHOOL DISTRICT 533,674 0.073789% 4,301,554 7,638,171
84548 MOC-FLOYD VALLEY COMM SCHOOL DISTRICT 977,593 0.135168% 7,879,668 13,991,747
84601 NORTHWEST IOWA AREA SOLID WASTE AGY 35,226 0.004870% 283,927 504,163
85001 IOWA STATE UNIV OF SCIENCE & TECH 5,586,671 0.772444% 45,030,082 79,958,889
85002 DEPT OF TRANSPORTATION 14,980,427 2.071278% 120,746,306 214,406,460
85006 2ND JUDICIAL DIST DEPT CORR SERVICES 791,549 0.109444% 6,380,100 11,328,998
85201 STORY COUNTY 1,125,555 0.155626% 9,072,281 16,109,442
85203 STORY CO AGR EXT DIST 21,620 0.002989% 174,262 309,434
85204 STORY CO MEDICAL CENTER 990,503 0.136952% 7,983,719 14,176,507
85301 CITY OF HUXLEY 75,191 0.010396% 606,059 1,076,166
85302 CITY OF MAXWELL 14,011 0.001937% 112,936 200,538
85303 CITY OF AMES 2,506,268 0.346531% 20,201,202 35,870,813
85305 CITY OF STORY CITY 77,334 0.010693% 623,331 1,106,835
85308 CITY OF KELLEY 1,209 0.000167% 9,745 17,304
85310 CITY OF COLLINS 11,295 0.001562% 91,044 161,664
See notes to Schedules.___________________________________________________________________________________________________
102

___________________________________________________________________________________________________Schedule 1
Change in NPL due to 1%
Increase in the Actuarial Assumed
Investment Return (8.00%)
Differences Between Expected
and Actual Experience
Changes of Assumptions
Difference Between
Projected and Actual
Investment Earnings on Pension Plan Investments
Total Deferred Outflows of Resources
Differences Between Expected
and Actual Experience
Difference Between
Projected and Actual
Investment Earnings on Pension Plan Investments
Total Deferred Inflows of Resources
Total Proportionate
Share of Allocable Plan
Pension Expense
DEFERRED OUTFLOWS OF RESOURCES
(Excluding Employer Specific Amounts) * (Excluding Employer Specific Amounts) *
DEFERRED INFLOWS OF RESOURCES
1,281,969 10,173 393,042 173,462 576,677 131,931 586,955 718,886 674,985
30,223 240 9,266 4,089 13,595 3,110 13,838 16,948 15,913
64,212 510 19,687 8,688 28,885 6,608 29,400 36,008 33,809
265,150 2,104 81,293 35,877 119,274 27,287 121,400 148,687 139,607
47,036 373 14,421 6,364 21,158 4,841 21,535 26,376 24,765
223,516 1,774 68,528 30,244 100,546 23,003 102,338 125,341 117,686
844,341 6,700 258,869 114,247 379,816 86,894 386,585 473,479 444,564
15,669 124 4,804 2,120 7,048 1,612 7,174 8,786 8,250
528,212 4,191 161,946 71,472 237,609 54,360 241,844 296,204 278,115
30,491 242 9,348 4,126 13,716 3,138 13,960 17,098 16,054
1,002,999 7,959 307,512 135,714 451,185 103,222 459,227 562,449 528,101
22,497 179 6,897 3,044 10,120 2,315 10,300 12,615 11,845
115,035 913 35,269 15,565 51,747 11,839 52,669 64,508 60,568
38,859 308 11,914 5,258 17,480 3,999 17,792 21,791 20,460
122,601 973 37,588 16,589 55,150 12,617 56,133 68,750 64,552
332 3 102 45 150 34 152 186 175
938 7 288 127 422 97 429 526 494
5,805,207 46,065 1,779,832 785,495 2,611,392 597,432 2,657,940 3,255,372 3,056,571
601 5 184 81 270 62 275 337 316
2,763,778 21,931 847,353 373,963 1,243,247 284,429 1,265,408 1,549,837 1,455,190
1,211,647 9,614 371,482 163,946 545,042 124,694 554,758 679,452 637,959
1,681,870 13,346 515,648 227,572 756,566 173,086 770,051 943,137 885,542
1,502,836 11,925 460,758 203,347 676,030 154,661 688,080 842,741 791,277
2,752,924 21,845 844,025 372,494 1,238,364 283,312 1,260,438 1,543,750 1,449,475
99,196 787 30,413 13,422 44,622 10,209 45,417 55,626 52,229
15,732,182 124,836 4,823,365 2,128,701 7,076,902 1,619,047 7,203,050 8,822,097 8,283,343
42,185,197 334,741 12,933,657 5,708,025 18,976,423 4,341,408 19,314,681 23,656,089 22,211,441
2,229,019 17,687 683,400 301,606 1,002,693 229,395 1,020,566 1,249,961 1,173,628
3,169,587 25,151 971,771 428,873 1,425,795 326,192 1,451,210 1,777,402 1,668,858
60,882 483 18,666 8,238 27,387 6,266 27,875 34,141 32,056
2,789,276 22,133 855,171 377,413 1,254,717 287,053 1,277,082 1,564,135 1,468,616
211,739 1,680 64,918 28,650 95,248 21,791 96,946 118,737 111,485
39,457 313 12,097 5,339 17,749 4,061 18,065 22,126 20,775
7,057,704 56,003 2,163,838 954,969 3,174,810 726,330 3,231,401 3,957,731 3,716,038
217,773 1,728 66,768 29,467 97,963 22,412 99,709 122,121 114,663
3,405 27 1,044 461 1,532 350 1,559 1,909 1,793
31,808 252 9,752 4,304 14,308 3,273 14,563 17,836 16,748
___________________________________________________________________________________________________103 (Continued)

___________________________________________________________________________________________________
Employer ID # Employer Name
2019 Actual Employer
Contributions
Employer Allocation
Percentage ** Net Pension
Liability (NPL)
Change in NPL due to 1%
Decrease in the Actuarial Assumed
Investment Return (6.00%)
Iowa Public Employees' Retirement System
Schedule of Employer Allocations and Collective Pension Amounts Allocated by Employer -Regular Membership Group
As of and for the year ended June 30, 2019
85311 CITY OF GILBERT 15,860 0.002193% 127,836 226,995
85312 CITY OF SLATER 33,319 0.004607% 268,559 476,874
85313 CITY OF CAMBRIDGE 12,602 0.001742% 101,576 180,367
85315 CITY OF COLO 15,478 0.002140% 124,754 221,522
85318 CITY OF NEVADA 169,677 0.023461% 1,367,646 2,428,497
85322 CITY OF ROLAND 22,881 0.003164% 184,424 327,478
85323 CITY OF ZEARING 8,355 0.001155% 67,346 119,585
85325 CITY OF MCCALLSBURG 2,159 0.000298% 17,400 30,897
85327 MARY GREELEY MEDICAL CENTER 5,906,424 0.816655% 47,607,380 84,535,339
85544 AMES COMMUNITY SCHOOL DISTRICT 3,241,959 0.448251% 26,131,070 46,400,344
85545 GILBERT COMMUNITY SCHOOL DISTRICT 937,437 0.129615% 7,555,998 13,417,013
85547 ROLAND STORY COMMUNITY SCHOOL DISTRICT 600,302 0.083001% 4,838,594 8,591,780
85548 BALLARD COMMUNITY SCHOOL DISTRICT 1,041,680 0.144028% 8,396,221 14,908,979
85549 COLLINS MAXWELL COMMUNITY SCHOOL DISTRIC 293,355 0.040561% 2,364,520 4,198,624
85550 NEVADA COMMUNITY SCHOOL DISTRICT 1,059,529 0.146496% 8,540,094 15,164,451
85551 COLO NESCO COMMUNITY SCHOOL DISTRICT 279,922 0.038704% 2,256,247 4,006,367
85701 STORY CITY MUNICIPAL ELECTRIC UTILITY 53,392 0.007382% 430,350 764,163
86201 TAMA COUNTY 506,877 0.070084% 4,085,562 7,254,639
86203 TAMA COUNTY AGRICULTURAL EXTENSION DIST 13,738 0.001900% 110,736 196,631
86206 TAMA COUNTY SOIL & WATER CONSER DISTRICT 921 0.000127% 7,421 13,177
86301 CITY OF TAMA 45,678 0.006316% 368,176 653,762
86302 CITY OF GLADBROOK 16,167 0.002235% 130,308 231,386
86303 CITY OF TRAER 16,786 0.002321% 135,299 240,248
86304 CITY OF ELBERON 2,558 0.000354% 20,619 36,612
86305 CITY OF GARWIN 5,337 0.000738% 43,018 76,385
86306 CITY OF DYSART 25,130 0.003475% 202,553 359,668
86307 CITY OF CHELSEA 3,858 0.000533% 31,094 55,213
86308 CITY OF TOLEDO 42,963 0.005940% 346,290 614,900
86309 CITY OF CLUTIER 2,464 0.000341% 19,863 35,270
86315 CITY OF MONTOUR 5,201 0.000719% 41,922 74,440
86319 CITY OF VINING 168 0.000023% 1,351 2,398
86320 CITY OF LINCOLN 650 0.000090% 5,239 9,302
86586 SOUTH TAMA COMMUNITY SCHOOL DISTRICT 1,058,320 0.146329% 8,530,348 15,147,144
86591 NORTH TAMA COUNTY COMMUNITY SCHOOL DIST 321,723 0.044483% 2,593,177 4,604,645
86594 GMG COMMUNITY SCHOOL DISTRICT 292,054 0.040381% 2,354,032 4,180,002
86701 TRAER MUNICIPAL UTILITIES 44,840 0.006200% 361,421 641,766
87201 TAYLOR COUNTY 246,415 0.034071% 1,986,174 3,526,804
See notes to Schedules.___________________________________________________________________________________________________
104

___________________________________________________________________________________________________Schedule 1
Change in NPL due to 1%
Increase in the Actuarial Assumed
Investment Return (8.00%)
Differences Between Expected
and Actual Experience
Changes of Assumptions
Difference Between
Projected and Actual
Investment Earnings on Pension Plan Investments
Total Deferred Outflows of Resources
Differences Between Expected
and Actual Experience
Difference Between
Projected and Actual
Investment Earnings on Pension Plan Investments
Total Deferred Inflows of Resources
Total Proportionate
Share of Allocable Plan
Pension Expense
DEFERRED OUTFLOWS OF RESOURCES
(Excluding Employer Specific Amounts) * (Excluding Employer Specific Amounts) *
DEFERRED INFLOWS OF RESOURCES
44,662 354 13,693 6,043 20,090 4,596 20,449 25,045 23,516
93,826 745 28,766 12,696 42,207 9,656 42,959 52,615 49,402
35,488 282 10,880 4,802 15,964 3,652 16,248 19,900 18,685
43,585 346 13,363 5,897 19,606 4,485 19,956 24,441 22,949
477,815 3,791 146,494 64,653 214,938 49,173 218,770 267,943 251,580
64,433 512 19,756 8,717 28,985 6,630 29,500 36,130 33,925
23,529 187 7,214 3,184 10,585 2,421 10,773 13,194 12,388
6,079 48 1,864 823 2,735 626 2,783 3,409 3,201
16,632,614 131,981 5,099,431 2,250,537 7,481,949 1,711,714 7,615,317 9,327,031 8,757,440
9,129,425 72,443 2,799,012 1,235,290 4,106,745 939,537 4,179,948 5,119,485 4,806,845
2,639,843 20,947 809,356 357,194 1,187,497 271,674 1,208,664 1,480,338 1,389,936
1,690,462 13,414 518,283 228,734 760,431 173,971 773,986 947,957 890,066
2,933,392 23,277 899,355 396,913 1,319,545 301,884 1,343,067 1,644,951 1,544,496
826,093 6,555 253,274 111,778 371,607 85,016 378,231 463,247 434,957
2,983,657 23,676 914,766 403,715 1,342,157 307,057 1,366,081 1,673,138 1,570,962
788,266 6,255 241,676 106,659 354,590 81,123 360,911 442,034 415,040
150,352 1,193 46,097 20,344 67,634 15,473 68,839 84,312 79,164
1,427,375 11,326 437,622 193,136 642,084 146,895 653,530 800,425 751,545
38,688 307 11,861 5,235 17,403 3,981 17,713 21,694 20,370
2,593 21 795 351 1,167 267 1,187 1,454 1,365
128,630 1,021 39,437 17,405 57,863 13,238 58,894 72,132 67,726
45,526 361 13,958 6,160 20,479 4,685 20,844 25,529 23,970
47,270 375 14,493 6,396 21,264 4,865 21,643 26,508 24,889
7,204 57 2,209 975 3,241 741 3,298 4,039 3,793
15,029 119 4,608 2,034 6,761 1,546 6,881 8,427 7,913
70,766 562 21,696 9,575 31,833 7,283 32,401 39,684 37,260
10,863 86 3,331 1,470 4,887 1,118 4,974 6,092 5,720
120,984 960 37,093 16,370 54,423 12,451 55,393 67,844 63,701
6,940 55 2,128 939 3,122 714 3,177 3,891 3,654
14,646 116 4,490 1,982 6,588 1,507 6,706 8,213 7,712
472 4 145 64 213 49 216 265 248
1,830 15 561 248 824 188 838 1,026 964
2,980,252 23,648 913,722 403,254 1,340,624 306,707 1,364,522 1,671,229 1,569,169
905,979 7,189 277,766 122,587 407,542 93,237 414,807 508,044 477,018
822,429 6,526 252,151 111,282 369,959 84,639 376,553 461,192 433,027
126,270 1,002 38,713 17,085 56,800 12,995 57,813 70,808 66,484
693,911 5,506 212,748 93,892 312,146 71,412 317,710 389,122 365,359
___________________________________________________________________________________________________105 (Continued)

___________________________________________________________________________________________________
Employer ID # Employer Name
2019 Actual Employer
Contributions
Employer Allocation
Percentage ** Net Pension
Liability (NPL)
Change in NPL due to 1%
Decrease in the Actuarial Assumed
Investment Return (6.00%)
Iowa Public Employees' Retirement System
Schedule of Employer Allocations and Collective Pension Amounts Allocated by Employer -Regular Membership Group
As of and for the year ended June 30, 2019
87203 TAYLOR COUNTY AGRICULTURAL EXTENSION OFF 9,210 0.001273% 74,234 131,816
87205 TAYLOR CO SOIL & WATER CONS DIST 4,733 0.000654% 38,145 67,734
87301 CITY OF BEDFORD 39,135 0.005411% 315,437 560,114
87305 CITY OF NEW MARKET 6,622 0.000916% 53,377 94,780
87306 CITY OF CLEARFIELD 7,091 0.000980% 57,152 101,484
87307 CITY OF GRAVITY 453 0.000063% 3,652 6,485
87308 CITY OF BLOCKTON 1,420 0.000196% 11,443 20,319
87309 CITY OF CONWAY 79 0.000011% 635 1,128
87310 CITY OF LENOX 37,355 0.005165% 301,094 534,646
87313 CITY OF SHARPSBURG 97 0.000013% 784 1,392
87314 LOW RENT HOUSING AGENCY OF LENOX 2,386 0.000330% 19,234 34,153
87562 BEDFORD COMMUNITY SCHOOL DISTRICT 333,335 0.046089% 2,686,774 4,770,844
87563 LENOX COMMUNITY SCHOOL DISTRICT 313,368 0.043328% 2,525,830 4,485,058
87703 LENOX MUNICIPAL LIGHT AND WATER 41,487 0.005736% 334,394 593,776
88201 UNION COUNTY 220,166 0.030441% 1,774,598 3,151,114
88203 UNION COUNTY AGRI 9,512 0.001315% 76,671 136,143
88204 GREATER REGIONAL MEDICAL CENTER 2,244,643 0.310357% 18,092,430 32,126,315
88205 UNION COUNTY ASSESSOR 11,025 0.001524% 88,867 157,799
88301 CITY OF CRESTON 125,000 0.017283% 1,007,538 1,789,062
88302 CITY OF LORIMOR 4,604 0.000637% 37,113 65,900
88306 CITY OF AFTON 10,017 0.001385% 80,741 143,369
88309 CITY OF CROMWELL 340 0.000047% 2,739 4,864
88310 CITY OF ARISPE 283 0.000039% 2,283 4,053
88311 AFTON HOUSING COMMISSION 6,712 0.000928% 54,099 96,063
88312 CITY OF SHANNON CITY 85 0.000012% 685 1,216
88313 CITY OF THAYER 177 0.000024% 1,427 2,533
88532 CRESTON COMMUNITY SCHOOL DISTRICT 1,011,480 0.139853% 8,152,804 14,476,747
88533 EAST UNION COMMUNITY SCHOOL DISTRICT 364,526 0.050401% 2,938,176 5,217,252
88535 SOUTHWESTERN COMMUNITY COLLEGE 412,301 0.057007% 3,323,261 5,901,039
88601 SOUTHERN IA COUNCIL OF GOVERNM'TS 37,603 0.005199% 303,091 538,192
88603 SO IOWA REGIONAL HOUSING AUTHORITY 49,331 0.006821% 397,624 706,052
88605 SOUTHERN IOWA RURAL WATER ASSOCIATION 127,728 0.017660% 1,029,523 1,828,101
88701 CRESTON CITY WATER WORKS 104,105 0.014394% 839,114 1,489,996
89201 VAN BUREN COUNTY 186,740 0.025820% 1,505,178 2,672,710
89203 VAN BUREN COUNTY AGRICULTURAL EXT DIST 6,013 0.000831% 48,463 86,054
89204 VAN BUREN COUNTY HOSPITAL 686,625 0.094937% 5,534,383 9,827,278
89207 VAN BUREN CO SOIL & WATER CONS DISTRICT 2,224 0.000307% 17,925 31,828
See notes to Schedules.___________________________________________________________________________________________________
106

___________________________________________________________________________________________________Schedule 1
Change in NPL due to 1%
Increase in the Actuarial Assumed
Investment Return (8.00%)
Differences Between Expected
and Actual Experience
Changes of Assumptions
Difference Between
Projected and Actual
Investment Earnings on Pension Plan Investments
Total Deferred Outflows of Resources
Differences Between Expected
and Actual Experience
Difference Between
Projected and Actual
Investment Earnings on Pension Plan Investments
Total Deferred Inflows of Resources
Total Proportionate
Share of Allocable Plan
Pension Expense
DEFERRED OUTFLOWS OF RESOURCES
(Excluding Employer Specific Amounts) * (Excluding Employer Specific Amounts) *
DEFERRED INFLOWS OF RESOURCES
25,935 206 7,952 3,509 11,667 2,669 11,875 14,544 13,655
13,327 106 4,086 1,803 5,995 1,372 6,102 7,474 7,017
110,204 874 33,788 14,912 49,574 11,341 50,458 61,799 58,025
18,648 148 5,717 2,523 8,388 1,919 8,538 10,457 9,819
19,967 158 6,122 2,702 8,982 2,055 9,142 11,197 10,513
1,276 10 391 173 574 131 584 715 672
3,998 32 1,226 541 1,799 411 1,830 2,241 2,105
222 2 68 30 100 23 102 125 117
105,193 835 32,251 14,234 47,320 10,826 48,163 58,989 55,387
274 2 84 37 123 28 125 153 144
6,720 53 2,060 909 3,022 692 3,077 3,769 3,538
938,680 7,448 287,792 127,012 422,252 96,602 429,779 526,381 494,236
882,450 7,002 270,552 119,403 396,957 90,816 404,034 494,850 464,630
116,828 927 35,818 15,808 52,553 12,023 53,490 65,513 61,512
619,992 4,920 190,085 83,890 278,895 63,805 283,866 347,671 326,440
26,787 213 8,213 3,624 12,050 2,757 12,264 15,021 14,104
6,320,961 50,157 1,937,958 855,281 2,843,396 650,509 2,894,080 3,544,589 3,328,126
31,048 246 9,519 4,201 13,966 3,195 14,215 17,410 16,347
352,004 2,793 107,922 47,629 158,344 36,226 161,167 197,393 185,338
12,966 103 3,975 1,754 5,832 1,334 5,937 7,271 6,827
28,208 224 8,648 3,817 12,689 2,903 12,915 15,818 14,852
957 8 293 129 430 98 438 536 504
797 6 245 108 359 82 365 447 420
18,901 150 5,795 2,557 8,502 1,945 8,654 10,599 9,952
239 2 73 32 107 25 110 135 126
498 4 153 67 224 51 228 279 262
2,848,349 22,602 873,282 385,406 1,281,290 293,132 1,304,129 1,597,261 1,499,719
1,026,512 8,145 314,721 138,896 461,762 105,641 469,993 575,634 540,481
1,161,049 9,213 355,969 157,100 522,282 119,487 531,592 651,079 611,318
105,891 840 32,465 14,328 47,633 10,898 48,483 59,381 55,754
138,918 1,102 42,591 18,797 62,490 14,296 63,604 77,900 73,143
359,685 2,854 110,277 48,669 161,800 37,016 164,683 201,699 189,382
293,162 2,326 89,881 39,667 131,874 30,170 134,225 164,395 154,356
525,865 4,173 161,226 71,154 236,553 54,118 240,770 294,888 276,879
16,931 134 5,191 2,291 7,616 1,742 7,752 9,494 8,915
1,933,550 15,343 592,812 261,626 869,781 198,988 885,285 1,084,273 1,018,057
6,262 50 1,920 847 2,817 644 2,867 3,511 3,297
___________________________________________________________________________________________________107 (Continued)

___________________________________________________________________________________________________
Employer ID # Employer Name
2019 Actual Employer
Contributions
Employer Allocation
Percentage ** Net Pension
Liability (NPL)
Change in NPL due to 1%
Decrease in the Actuarial Assumed
Investment Return (6.00%)
Iowa Public Employees' Retirement System
Schedule of Employer Allocations and Collective Pension Amounts Allocated by Employer -Regular Membership Group
As of and for the year ended June 30, 2019
89301 CITY OF FARMINGTON 9,723 0.001344% 78,367 139,154
89302 CITY OF BONAPARTE 6,232 0.000862% 50,236 89,202
89303 CITY OF MILTON 4,353 0.000602% 35,084 62,298
89304 CITY OF STOCKPORT 3,501 0.000484% 28,219 50,108
89305 CITY OF KEOSAUQUA 29,555 0.004086% 238,222 423,006
89306 CITY OF CANTRIL 1,654 0.000229% 13,329 23,667
89308 CITY OF BIRMINGHAM 4,976 0.000688% 40,111 71,224
89546 VAN BUREN COMMUNITY SCHOOL DISTRICT 478,257 0.066126% 3,854,879 6,845,022
89547 HARMONY COMMUNITY SCHOOL DISTRICT 126,713 0.017520% 1,021,343 1,813,576
89701 KEOSAUQUA LIGHT AND POWER 15,610 0.002158% 125,821 223,418
90201 WAPELLO COUNTY 428,483 0.059244% 3,453,689 6,132,637
90203 WAPELLO COUNTY AGRICULTURAL EXT DISTRICT 15,190 0.002100% 122,437 217,409
90210 WAPELLO COUNTY SOIL & WATER 6,131 0.000848% 49,416 87,746
90301 CITY OF OTTUMWA 636,669 0.088029% 5,131,728 9,112,293
90302 CITY OF AGENCY 10,138 0.001402% 81,716 145,102
90304 CITY OF ELDON 14,597 0.002018% 117,655 208,917
90308 CITY OF EDDYVILLE 12,910 0.001785% 104,062 184,780
90309 CITY OF BLAKESBURG 3,695 0.000511% 29,780 52,880
90312 CITY OF CHILLICOTHE 396 0.000055% 3,196 5,675
90313 CITY OF KIRKVILLE 707 0.000098% 5,701 10,123
90315 EDDYVILLE PUBLIC LIBRARY 2,501 0.000346% 20,162 35,802
90316 OTTUMWA HOUSING AUTHORITY 68,588 0.009483% 552,840 981,666
90320 EDDYVILLE COMMUNITY FIRE AGENCY 501 0.000069% 4,036 7,166
90546 CARDINAL COMMUNITY SCHOOL DISTRICT 522,784 0.072283% 4,213,778 7,482,310
90549 OTTUMWA COMMUNITY SCHOOL DISTRICT 2,929,027 0.404984% 23,608,748 41,921,516
90551 INDIAN HILLS COMMUNITY COLLEGE 1,326,926 0.183468% 10,695,385 18,991,552
90602 AREA XV REGIONAL PLANNING COMMISSION 25,314 0.003500% 204,039 362,307
90604 AREA XV MULTI-COUNTY HOUSING AGY 31,229 0.004318% 251,712 446,959
90701 OTTUMWA WATERWORKS 163,059 0.022545% 1,314,299 2,333,770
90702 EDDYVILLE WATER DEPARTMENT 33 0.000005% 266 473
91201 WARREN COUNTY 703,017 0.097203% 5,666,506 10,061,885
91203 WARREN COUNTY AGRI. EXTENSION DISTRICT 10,931 0.001511% 88,108 156,452
91206 WARREN CTY HOUSING AUTHORITY 7,561 0.001045% 60,943 108,214
91301 CITY OF INDIANOLA 446,582 0.061747% 3,599,576 6,391,685
91303 CITY OF CARLISLE 94,076 0.013007% 758,275 1,346,451
91304 CITY OF LACONA 5,327 0.000736% 42,934 76,237
91305 CITY OF MILO 13,673 0.001890% 110,208 195,693
See notes to Schedules.___________________________________________________________________________________________________
108

___________________________________________________________________________________________________Schedule 1
Change in NPL due to 1%
Increase in the Actuarial Assumed
Investment Return (8.00%)
Differences Between Expected
and Actual Experience
Changes of Assumptions
Difference Between
Projected and Actual
Investment Earnings on Pension Plan Investments
Total Deferred Outflows of Resources
Differences Between Expected
and Actual Experience
Difference Between
Projected and Actual
Investment Earnings on Pension Plan Investments
Total Deferred Inflows of Resources
Total Proportionate
Share of Allocable Plan
Pension Expense
DEFERRED OUTFLOWS OF RESOURCES
(Excluding Employer Specific Amounts) * (Excluding Employer Specific Amounts) *
DEFERRED INFLOWS OF RESOURCES
27,379 217 8,394 3,705 12,316 2,818 12,536 15,354 14,416
17,551 139 5,381 2,375 7,895 1,806 8,036 9,842 9,241
12,257 97 3,758 1,659 5,514 1,261 5,612 6,873 6,454
9,859 78 3,023 1,334 4,435 1,015 4,514 5,529 5,191
83,228 660 25,517 11,261 37,438 8,565 38,106 46,671 43,821
4,657 37 1,428 630 2,095 479 2,132 2,611 2,452
14,014 111 4,296 1,896 6,303 1,442 6,416 7,858 7,378
1,346,781 10,687 412,913 182,231 605,831 138,601 616,630 755,231 709,110
356,827 2,831 109,400 48,282 160,513 36,722 163,375 200,097 187,877
43,958 349 13,477 5,948 19,774 4,524 20,126 24,650 23,145
1,206,617 9,575 369,940 163,266 542,781 124,177 552,455 676,632 635,311
42,776 339 13,115 5,788 19,242 4,402 19,585 23,987 22,523
17,264 137 5,293 2,336 7,766 1,777 7,905 9,682 9,090
1,792,875 14,227 549,682 242,591 806,500 184,510 820,876 1,005,386 943,988
28,549 227 8,753 3,863 12,843 2,938 13,071 16,009 15,032
41,105 326 12,603 5,562 18,491 4,230 18,820 23,050 21,643
36,356 288 11,147 4,919 16,354 3,742 16,646 20,388 19,142
10,404 83 3,190 1,408 4,681 1,071 4,764 5,835 5,478
1,116 9 342 151 502 115 511 626 588
1,992 16 611 269 896 205 912 1,117 1,049
7,044 56 2,160 953 3,169 725 3,225 3,950 3,709
193,146 1,533 59,217 26,134 86,884 19,877 88,433 108,310 101,696
1,410 11 432 191 634 145 646 791 742
1,472,170 11,682 451,356 199,197 662,235 151,505 674,039 825,544 775,130
8,248,200 65,450 2,528,835 1,116,053 3,710,338 848,847 3,776,475 4,625,322 4,342,860
3,736,652 29,651 1,145,629 505,601 1,680,881 384,550 1,710,843 2,095,393 1,967,430
71,285 566 21,855 9,645 32,066 7,336 32,638 39,974 37,533
87,941 698 26,962 11,899 39,559 9,050 40,264 49,314 46,303
459,177 3,644 140,780 62,131 206,555 47,255 210,236 257,491 241,767
93 1 29 13 43 10 43 53 49
1,979,710 15,709 606,964 267,872 890,545 203,738 906,419 1,110,157 1,042,361
30,782 244 9,438 4,165 13,847 3,168 14,094 17,262 16,208
21,292 169 6,528 2,881 9,578 2,191 9,748 11,939 11,210
1,257,586 9,979 385,566 170,162 565,707 129,422 575,791 705,213 662,147
264,919 2,102 81,222 35,846 119,170 27,264 121,294 148,558 139,486
15,000 119 4,599 2,030 6,748 1,544 6,868 8,412 7,898
38,503 306 11,805 5,210 17,321 3,962 17,629 21,591 20,273
___________________________________________________________________________________________________109 (Continued)

___________________________________________________________________________________________________
Employer ID # Employer Name
2019 Actual Employer
Contributions
Employer Allocation
Percentage ** Net Pension
Liability (NPL)
Change in NPL due to 1%
Decrease in the Actuarial Assumed
Investment Return (6.00%)
Iowa Public Employees' Retirement System
Schedule of Employer Allocations and Collective Pension Amounts Allocated by Employer -Regular Membership Group
As of and for the year ended June 30, 2019
91306 CITY OF NEW VIRGINIA 3,823 0.000529% 30,817 54,721
91307 CITY OF NORWALK 231,734 0.032041% 1,867,835 3,316,672
91308 CITY OF CUMMING 5,187 0.000717% 41,812 74,244
91309 CITY OF SANDYVILLE 57 0.000008% 457 811
91311 CITY OF HARTFORD 7,235 0.001000% 58,320 103,557
91312 CITY OF ST MARYS 1,311 0.000181% 10,567 18,764
91313 CITY OF MARTENSDALE 8,379 0.001158% 67,535 119,921
91318 CITY OF SPRING HILL 67 0.000009% 540 959
91319 NEW VIRGINIA SANITARY DISTRICT 1,020 0.000141% 8,218 14,592
91320 NEW VIRGINIA PUBLIC LIBRARY 839 0.000116% 6,761 12,006
91562 INDIANOLA COMMUNITY SCHOOL DISTRICT 2,432,023 0.336265% 19,602,765 34,808,183
91563 SOUTHEAST WARREN COMM SCHOOL DISTRICT 353,970 0.048942% 2,853,093 5,066,172
91565 MARTENSDALE-ST MARY'S COMM SCHOOL DIST 339,618 0.046958% 2,737,417 4,860,768
91566 NORWALK COMMUNITY SCHOOL DISTRICT 1,769,238 0.244625% 14,260,538 25,322,112
91568 CARLISLE COMMUNITY SCHOOL DISTRICT 1,250,400 0.172887% 10,078,565 17,896,277
91604 WARREN WATER DISTRICT 45,234 0.006254% 364,595 647,403
92201 WASHINGTON COUNTY 517,837 0.071599% 4,173,903 7,411,505
92203 WASHINGTON COUNTY AGRICULTURAL EXTENSION 14,189 0.001962% 114,366 203,077
92204 WASHINGTON COUNTY HOSPITAL 1,638,941 0.226609% 13,210,310 23,457,245
92207 WASHINGTON CO SOIL & WATER CONS DIS 3,358 0.000464% 27,063 48,054
92301 CITY OF WASHINGTON 185,384 0.025632% 1,494,248 2,653,302
92302 CITY OF WELLMAN 42,298 0.005848% 340,936 605,392
92303 CITY OF RIVERSIDE 15,010 0.002075% 120,986 214,831
92304 CITY OF BRIGHTON 13,238 0.001830% 106,704 189,472
92305 CITY OF KALONA 43,125 0.005963% 347,599 617,223
92308 CITY OF AINSWORTH 4,258 0.000589% 34,321 60,942
92309 CITY OF CRAWFORDSVILLE 1,556 0.000215% 12,540 22,267
92311 CITY OF WEST CHESTER 572 0.000079% 4,611 8,187
92584 MID PRAIRIE COMMUNITY SCHOOL DISTRICT 973,776 0.134640% 7,848,896 13,937,106
92585 WASHINGTON COMMUNITY SCHOOL DISTRICT 1,163,196 0.160830% 9,375,671 16,648,165
92587 HIGHLAND COMMUNITY SCHOOL DISTRICT 404,627 0.055946% 3,261,405 5,791,203
93201 WAYNE COUNTY 217,586 0.030085% 1,753,805 3,114,192
93203 WAYNE CO AGR EXT DIST 7,807 0.001079% 62,927 111,738
93204 WAYNE COUNTY HOSPITAL 1,195,379 0.165280% 9,635,080 17,108,791
93301 CITY OF CORYDON 14,571 0.002015% 117,443 208,541
93302 CITY OF SEYMOUR 12,150 0.001680% 97,933 173,897
93303 CITY OF HUMESTON 10,658 0.001474% 85,905 152,540
See notes to Schedules.___________________________________________________________________________________________________
110

___________________________________________________________________________________________________Schedule 1
Change in NPL due to 1%
Increase in the Actuarial Assumed
Investment Return (8.00%)
Differences Between Expected
and Actual Experience
Changes of Assumptions
Difference Between
Projected and Actual
Investment Earnings on Pension Plan Investments
Total Deferred Outflows of Resources
Differences Between Expected
and Actual Experience
Difference Between
Projected and Actual
Investment Earnings on Pension Plan Investments
Total Deferred Inflows of Resources
Total Proportionate
Share of Allocable Plan
Pension Expense
DEFERRED OUTFLOWS OF RESOURCES
(Excluding Employer Specific Amounts) * (Excluding Employer Specific Amounts) *
DEFERRED INFLOWS OF RESOURCES
10,767 85 3,301 1,457 4,843 1,108 4,930 6,038 5,669
652,567 5,178 200,072 88,298 293,548 67,158 298,780 365,938 343,591
14,608 116 4,479 1,977 6,572 1,503 6,688 8,191 7,691
160 1 49 22 72 16 73 89 84
20,375 162 6,247 2,757 9,166 2,097 9,329 11,426 10,728
3,692 29 1,132 500 1,661 380 1,690 2,070 1,944
23,595 187 7,234 3,193 10,614 2,428 10,803 13,231 12,423
189 1 58 26 85 19 86 105 99
2,871 23 880 388 1,291 295 1,314 1,609 1,512
2,362 19 724 320 1,063 243 1,082 1,325 1,244
6,848,628 54,344 2,099,737 926,679 3,080,760 704,813 3,135,675 3,840,488 3,605,955
996,786 7,910 305,607 134,874 448,391 102,582 456,383 558,965 524,830
956,373 7,589 293,217 129,406 430,212 98,423 437,879 536,302 503,551
4,982,211 39,534 1,527,508 674,136 2,241,178 512,735 2,281,128 2,793,863 2,623,245
3,521,153 27,941 1,079,559 476,443 1,583,943 362,373 1,612,176 1,974,549 1,853,965
127,379 1,011 39,053 17,235 57,299 13,109 58,321 71,430 67,068
1,458,239 11,571 447,085 197,312 655,968 150,072 667,661 817,733 767,795
39,956 317 12,250 5,406 17,973 4,112 18,294 22,406 21,038
4,615,292 36,623 1,415,013 624,489 2,076,125 474,974 2,113,132 2,588,106 2,430,054
9,455 75 2,899 1,279 4,253 973 4,329 5,302 4,978
522,046 4,142 160,055 70,637 234,834 53,725 239,021 292,746 274,869
119,113 945 36,519 16,117 53,581 12,258 54,536 66,794 62,716
42,269 335 12,959 5,719 19,013 4,350 19,353 23,703 22,255
37,279 296 11,430 5,044 16,770 3,837 17,068 20,905 19,628
121,441 964 37,233 16,432 54,629 12,498 55,602 68,100 63,941
11,991 95 3,676 1,622 5,393 1,234 5,490 6,724 6,313
4,381 35 1,343 593 1,971 451 2,006 2,457 2,307
1,611 13 494 218 725 166 738 904 848
2,742,173 21,759 840,729 371,040 1,233,528 282,205 1,255,516 1,537,721 1,443,815
3,275,583 25,992 1,004,269 443,215 1,473,476 337,100 1,499,740 1,836,840 1,724,667
1,139,439 9,042 349,343 154,176 512,561 117,263 521,697 638,960 599,940
612,728 4,862 187,858 82,907 275,627 63,058 280,540 343,598 322,615
21,985 174 6,740 2,975 9,889 2,263 10,066 12,329 11,576
3,366,213 26,711 1,032,055 455,478 1,514,244 346,427 1,541,235 1,887,662 1,772,386
41,031 326 12,580 5,552 18,458 4,223 18,786 23,009 21,604
34,215 271 10,490 4,630 15,391 3,521 15,665 19,186 18,015
30,013 238 9,202 4,061 13,501 3,089 13,741 16,830 15,802
___________________________________________________________________________________________________111 (Continued)

___________________________________________________________________________________________________
Employer ID # Employer Name
2019 Actual Employer
Contributions
Employer Allocation
Percentage ** Net Pension
Liability (NPL)
Change in NPL due to 1%
Decrease in the Actuarial Assumed
Investment Return (6.00%)
Iowa Public Employees' Retirement System
Schedule of Employer Allocations and Collective Pension Amounts Allocated by Employer -Regular Membership Group
As of and for the year ended June 30, 2019
93304 CITY OF ALLERTON 8,187 0.001132% 65,988 117,174
93305 CITY OF LINEVILLE 2,598 0.000359% 20,941 37,184
93306 CITY OF CLIO 42 0.000006% 342 608
93309 CITY OF PROMISE CITY 453 0.000063% 3,652 6,485
93314 SEYMOUR PUBLIC LIBRARY 853 0.000118% 6,873 12,204
93534 SEYMOUR COMMUNITY SCHOOL DISTRICT 179,536 0.024824% 1,447,109 2,569,598
93537 WAYNE COMMUNITY SCHOOL DISTRICT 387,841 0.053625% 3,126,106 5,550,956
94201 WEBSTER COUNTY 735,838 0.101741% 5,931,051 10,531,632
94203 WEBSTER COUNTY AGRICULTURAL EXT DIST 25,879 0.003578% 208,590 370,388
94207 WEBSTER CO SOIL & WATER CONS DIST 1,602 0.000221% 12,912 22,928
94301 CITY OF FORT DODGE 636,025 0.087940% 5,126,534 9,103,070
94303 CITY OF CALLENDER 9,743 0.001347% 78,527 139,439
94304 CALLENDER CEMETERY - WEBSTER COUNTY 365 0.000051% 2,944 5,228
94305 CITY OF GOWRIE 12,052 0.001666% 97,140 172,489
94306 CITY OF HARCOURT 2,612 0.000361% 21,054 37,385
94307 CITY OF DAYTON 19,765 0.002733% 159,310 282,882
94308 CITY OF LEHIGH 9,774 0.001351% 78,778 139,884
94313 CITY OF MOORLAND 1,546 0.000214% 12,460 22,125
94314 CITY OF OTHO 6,549 0.000906% 52,787 93,732
94316 CITY OF BARNUM 1,087 0.000150% 8,765 15,564
94317 CITY OF CLARE 2,361 0.000326% 19,030 33,791
94318 CITY OF DUNCOMBE 8,669 0.001199% 69,876 124,077
94319 CITY OF BADGER 13,197 0.001825% 106,370 188,879
94320 COMMUNITY LIBRARY 732 0.000101% 5,897 10,470
94321 CITY OF VINCENT 3,118 0.000431% 25,130 44,623
94325 MUNIC HOUSING AGENCY OF FT DODGE 76,407 0.010564% 615,858 1,093,565
94326 CLARE PUBLIC LIBRARY 1,022 0.000141% 8,241 14,634
94501 FORT DODGE COMMUNITY SCHOOL DISTRICT 2,612,901 0.361274% 21,060,692 37,396,990
94549 IOWA CENTRAL COMMUNITY COLLEGE 1,229,026 0.169932% 9,906,285 17,590,364
94550 PRAIRIE VALLEY COMMUNITY SCHOOL DISTRICT 407,289 0.056314% 3,282,861 5,829,302
94601 MID IOWA DEVELOPMENT ASSOC REG PLAN 118,939 0.016445% 958,677 1,702,302
94602 AEA 8 - PRAIRIE LAKES 1,408,258 0.194714% 11,350,941 20,155,607
94606 WEBSTER CO TELECOMMUNICATIONS 33,963 0.004696% 273,749 486,090
94608 N. CENTRAL IA REGIONAL SOLID WST. 88,323 0.012212% 711,907 1,264,117
94701 GOWRIE MUNICIPAL LIGHT & POWER PLANT 28,188 0.003897% 227,200 403,433
95201 WINNEBAGO COUNTY 319,298 0.044148% 2,573,629 4,569,934
95203 WINNEBAGO CO AGRI EXT DIST 5,825 0.000805% 46,948 83,365
See notes to Schedules.___________________________________________________________________________________________________
112

___________________________________________________________________________________________________Schedule 1
Change in NPL due to 1%
Increase in the Actuarial Assumed
Investment Return (8.00%)
Differences Between Expected
and Actual Experience
Changes of Assumptions
Difference Between
Projected and Actual
Investment Earnings on Pension Plan Investments
Total Deferred Outflows of Resources
Differences Between Expected
and Actual Experience
Difference Between
Projected and Actual
Investment Earnings on Pension Plan Investments
Total Deferred Inflows of Resources
Total Proportionate
Share of Allocable Plan
Pension Expense
DEFERRED OUTFLOWS OF RESOURCES
(Excluding Employer Specific Amounts) * (Excluding Employer Specific Amounts) *
DEFERRED INFLOWS OF RESOURCES
23,054 183 7,068 3,119 10,370 2,373 10,556 12,929 12,139
7,316 58 2,243 990 3,291 753 3,350 4,103 3,852
120 1 37 16 54 12 55 67 63
1,276 10 391 173 574 131 584 715 672
2,401 19 736 325 1,080 247 1,099 1,346 1,264
505,577 4,012 155,006 68,409 227,427 52,030 231,481 283,511 266,198
1,092,169 8,666 334,851 147,780 491,297 112,398 500,055 612,453 575,051
2,072,134 16,443 635,300 280,378 932,121 213,250 948,736 1,161,986 1,091,025
72,875 578 22,343 9,861 32,782 7,500 33,366 40,866 38,370
4,511 36 1,383 610 2,029 464 2,065 2,529 2,375
1,791,060 14,212 549,125 242,346 805,683 184,323 820,045 1,004,368 943,033
27,435 218 8,411 3,712 12,341 2,823 12,561 15,384 14,445
1,029 8 315 139 462 106 471 577 542
33,938 269 10,405 4,592 15,266 3,493 15,539 19,032 17,869
7,356 58 2,255 995 3,308 757 3,368 4,125 3,873
55,658 442 17,064 7,531 25,037 5,728 25,483 31,211 29,305
27,523 218 8,438 3,724 12,380 2,832 12,601 15,433 14,491
4,353 35 1,335 589 1,959 448 1,993 2,441 2,292
18,442 146 5,654 2,495 8,295 1,898 8,444 10,342 9,710
3,062 24 939 414 1,377 315 1,402 1,717 1,612
6,649 53 2,038 900 2,991 684 3,044 3,728 3,501
24,413 194 7,485 3,303 10,982 2,512 11,177 13,689 12,854
37,163 295 11,394 5,028 16,717 3,825 17,015 20,840 19,567
2,060 16 632 279 927 212 943 1,155 1,085
8,780 70 2,692 1,188 3,950 904 4,020 4,924 4,623
215,163 1,707 65,967 29,113 96,787 22,143 98,513 120,656 113,288
2,879 23 883 390 1,296 296 1,318 1,614 1,516
7,357,984 58,386 2,255,902 995,599 3,309,887 757,233 3,368,886 4,126,119 3,874,142
3,460,964 27,463 1,061,105 468,298 1,556,866 356,178 1,584,618 1,940,796 1,822,274
1,146,935 9,101 351,641 155,190 515,932 118,035 525,129 643,164 603,887
334,934 2,658 102,688 45,319 150,665 34,469 153,351 187,820 176,350
3,965,684 31,468 1,215,848 536,591 1,783,907 408,121 1,815,706 2,223,827 2,088,021
95,640 759 29,322 12,941 43,022 9,843 43,789 53,632 50,357
248,719 1,974 76,255 33,654 111,883 25,596 113,877 139,473 130,956
79,377 630 24,336 10,740 35,706 8,169 36,343 44,512 41,794
899,150 7,135 275,672 121,663 404,470 92,534 411,680 504,214 473,422
16,402 130 5,029 2,219 7,378 1,688 7,510 9,198 8,636
___________________________________________________________________________________________________113 (Continued)

___________________________________________________________________________________________________
Employer ID # Employer Name
2019 Actual Employer
Contributions
Employer Allocation
Percentage ** Net Pension
Liability (NPL)
Change in NPL due to 1%
Decrease in the Actuarial Assumed
Investment Return (6.00%)
Iowa Public Employees' Retirement System
Schedule of Employer Allocations and Collective Pension Amounts Allocated by Employer -Regular Membership Group
As of and for the year ended June 30, 2019
95204 WINNEBAGO CO ASSESSOR 17,147 0.002371% 138,207 245,411
95301 CITY OF FOREST CITY 181,019 0.025029% 1,459,066 2,590,829
95303 CITY OF BUFFALO CENTER 21,649 0.002993% 174,501 309,857
95305 CITY OF LELAND 4,545 0.000628% 36,636 65,054
95306 CITY OF THOMPSON 11,789 0.001630% 95,019 168,722
95308 CITY OF RAKE 4,408 0.000609% 35,528 63,087
95311 CITY OF LAKE MILLS 79,039 0.010928% 637,074 1,131,237
95312 CITY OF SCARVILLE 983 0.000136% 7,927 14,076
95543 LAKE MILLS COMMUNITY SCHOOL DISTRICT 452,936 0.062625% 3,650,785 6,482,616
95544 FOREST CITY COMMUNITY SCHOOL DISTRICT 771,336 0.106649% 6,217,177 11,039,700
95546 NORTH IOWA COMMUNITY SCHOOL DISTRICT 327,359 0.045262% 2,638,601 4,685,304
96201 WINNESHIEK COUNTY 502,997 0.069547% 4,054,295 7,199,118
96203 WINNESHIEK COUNTY AGR EXT DIST 12,979 0.001795% 104,618 185,768
96205 WINNESHIEK MEDICAL CENTER 1,935,974 0.267679% 15,604,473 27,708,506
96207 WINNESHIEK CO SOIL & WATER CONS 22,228 0.003073% 179,160 318,130
96208 NORTHEAST IOWA COMMUNITY ACTION CORP 442,159 0.061135% 3,563,925 6,328,381
96301 CITY OF DECORAH 228,753 0.031629% 1,843,815 3,274,021
96304 CITY OF FORT ATKINSON 8,029 0.001110% 64,717 114,917
96305 CITY OF SPILLVILLE 9,563 0.001322% 77,084 136,876
96306 CITY OF OSSIAN 17,279 0.002389% 139,271 247,300
96307 CITY OF RIDGEWAY 5,881 0.000813% 47,403 84,172
96308 CITY OF CALMAR 23,045 0.003186% 185,750 329,832
96310 CITY OF CASTALIA 1,569 0.000217% 12,649 22,461
96315 LOW RENT HOUSING AGENCY OF DECORAH 2,932 0.000405% 23,633 41,965
96554 DECORAH COMMUNITY SCHOOL DISTRICT 1,113,762 0.153995% 8,977,224 15,940,651
96556 SOUTH WINNESHIEK COMMUNITY SCHOOL DIST 383,858 0.053074% 3,094,000 5,493,945
96557 NORTH WINNESHIEK COMMUNITY SCHOOL DIST 113,161 0.015646% 912,110 1,619,613
96558 NORTHEAST IOWA COMMUNITY COLLEGE 964,227 0.133319% 7,771,933 13,800,444
97003 3RD JUDICIAL DIST DEPT CORR SERVICES 454,398 0.062828% 3,662,568 6,503,538
97201 WOODBURY COUNTY 1,409,830 0.194931% 11,363,614 20,178,110
97203 WOODBURY COUNTY AGRI EXTEN DIST 31,401 0.004342% 253,100 449,423
97209 WOODBURY CO SOIL & WATER CONS DIST 3,354 0.000464% 27,032 48,001
97301 CITY OF SIOUX CITY 2,818,661 0.389724% 22,719,171 40,341,914
97302 CITY OF CORRECTIONVILLE 14,819 0.002049% 119,447 212,098
97303 CITY OF DANBURY 6,259 0.000865% 50,453 89,588
97304 CITY OF ANTHON 21,492 0.002972% 173,229 307,599
97305 CITY OF PIERSON 6,504 0.000899% 52,422 93,085
See notes to Schedules.___________________________________________________________________________________________________
114

___________________________________________________________________________________________________Schedule 1
Change in NPL due to 1%
Increase in the Actuarial Assumed
Investment Return (8.00%)
Differences Between Expected
and Actual Experience
Changes of Assumptions
Difference Between
Projected and Actual
Investment Earnings on Pension Plan Investments
Total Deferred Outflows of Resources
Differences Between Expected
and Actual Experience
Difference Between
Projected and Actual
Investment Earnings on Pension Plan Investments
Total Deferred Inflows of Resources
Total Proportionate
Share of Allocable Plan
Pension Expense
DEFERRED OUTFLOWS OF RESOURCES
(Excluding Employer Specific Amounts) * (Excluding Employer Specific Amounts) *
DEFERRED INFLOWS OF RESOURCES
48,285 383 14,804 6,533 21,720 4,969 22,108 27,077 25,423
509,754 4,045 156,287 68,974 229,306 52,460 233,393 285,853 268,397
60,965 484 18,692 8,249 27,425 6,274 27,913 34,187 32,100
12,800 102 3,924 1,732 5,758 1,317 5,860 7,177 6,739
33,197 263 10,178 4,492 14,933 3,416 15,199 18,615 17,479
12,413 98 3,806 1,680 5,584 1,277 5,683 6,960 6,535
222,575 1,766 68,240 30,116 100,122 22,906 101,907 124,813 117,191
2,769 22 849 375 1,246 285 1,268 1,553 1,458
1,275,477 10,121 391,051 172,583 573,755 131,263 583,983 715,246 671,567
2,172,098 17,236 665,949 293,904 977,089 223,537 994,505 1,218,042 1,143,658
921,850 7,315 282,632 124,734 414,681 94,870 422,073 516,943 485,374
1,416,451 11,240 434,273 191,658 637,171 145,771 648,528 794,299 745,793
36,550 290 11,206 4,946 16,442 3,762 16,735 20,497 19,245
5,451,742 43,260 1,671,462 737,668 2,452,390 561,055 2,496,105 3,057,160 2,870,463
62,593 497 19,191 8,469 28,157 6,442 28,659 35,101 32,957
1,245,130 9,880 381,747 168,477 560,104 128,140 570,088 698,228 655,589
644,175 5,112 197,499 87,162 289,773 66,294 294,938 361,232 339,172
22,610 179 6,932 3,059 10,170 2,327 10,352 12,679 11,905
26,931 214 8,257 3,644 12,115 2,772 12,330 15,102 14,180
48,657 386 14,918 6,584 21,888 5,007 22,278 27,285 25,619
16,561 131 5,077 2,241 7,449 1,704 7,583 9,287 8,720
64,895 515 19,896 8,781 29,192 6,679 29,713 36,392 34,169
4,419 35 1,355 598 1,988 455 2,023 2,478 2,327
8,257 66 2,531 1,117 3,714 850 3,780 4,630 4,347
3,136,377 24,887 961,589 424,379 1,410,855 322,774 1,436,004 1,758,778 1,651,372
1,080,952 8,577 331,412 146,262 486,251 111,244 494,919 606,163 569,145
318,664 2,529 97,700 43,118 143,347 32,795 145,902 178,697 167,784
2,715,284 21,546 832,485 367,402 1,221,433 279,438 1,243,205 1,522,643 1,429,657
1,279,593 10,154 392,313 173,140 575,607 131,687 585,867 717,554 673,734
3,970,111 31,503 1,217,206 537,191 1,785,900 408,576 1,817,733 2,226,309 2,090,352
88,426 702 27,111 11,965 39,778 9,100 40,486 49,586 46,558
9,444 75 2,896 1,278 4,249 972 4,324 5,296 4,973
7,937,408 62,984 2,433,548 1,074,000 3,570,532 816,863 3,634,178 4,451,041 4,179,222
41,731 331 12,794 5,647 18,772 4,295 19,107 23,402 21,972
17,627 140 5,404 2,385 7,929 1,814 8,070 9,884 9,281
60,521 480 18,555 8,189 27,224 6,228 27,710 33,938 31,866
18,315 145 5,615 2,478 8,238 1,885 8,385 10,270 9,643
___________________________________________________________________________________________________115 (Continued)

___________________________________________________________________________________________________
Employer ID # Employer Name
2019 Actual Employer
Contributions
Employer Allocation
Percentage ** Net Pension
Liability (NPL)
Change in NPL due to 1%
Decrease in the Actuarial Assumed
Investment Return (6.00%)
Iowa Public Employees' Retirement System
Schedule of Employer Allocations and Collective Pension Amounts Allocated by Employer -Regular Membership Group
As of and for the year ended June 30, 2019
97306 CITY OF SERGEANT BLUFF 116,431 0.016098% 938,466 1,666,413
97307 CITY OF LAWTON 15,017 0.002076% 121,044 214,936
97308 CITY OF MOVILLE 21,875 0.003025% 176,315 313,079
97309 CITY OF SLOAN 15,857 0.002193% 127,816 226,959
97310 CITY OF SALIX 6,394 0.000884% 51,535 91,509
97311 CITY OF OTO 2,059 0.000285% 16,599 29,474
97312 CITY OF SMITHLAND 5,765 0.000797% 46,468 82,513
97314 CITY OF CUSHING 3,691 0.000510% 29,750 52,827
97315 CITY OF HORNICK 5,472 0.000757% 44,106 78,317
97316 SLOAN PUBLIC LIBRARY 3,222 0.000446% 25,974 46,121
97317 CITY OF BRONSON 4,919 0.000680% 39,649 70,403
97501 SIOUX CITY COMMUNITY SCHOOL DISTRICT 9,739,895 1.346692% 78,506,194 139,401,658
97569 LAWTON BRONSON COMM SCH DIST 395,336 0.054661% 3,186,518 5,658,227
97574 SERGEANT BLUFF LUTON COMM SCH DIST 1,189,960 0.164531% 9,591,404 17,031,237
97577 WESTWOOD COMMUNITY SCHOOL DISTRICT 388,535 0.053721% 3,131,694 5,560,878
97579 WOODBURY CENTRAL COMMUNITY SCHOOL DIST 429,843 0.059433% 3,464,654 6,152,107
97581 RIVER VALLEY COMM SCH DIST 283,716 0.039228% 2,286,825 4,060,662
97582 WESTERN IOWA TECH COMMUNITY COLLEGE 701,964 0.097058% 5,658,024 10,046,824
97602 NORTHWEST AREA EDUCATION AGENCY 1,578,889 0.218306% 12,726,274 22,597,755
98201 WORTH COUNTY 259,186 0.035836% 2,089,108 3,709,582
98203 WORTH CO AGR EXT DIST 10,867 0.001502% 87,588 155,529
98301 CITY OF GRAFTON 6,429 0.000889% 51,823 92,020
98302 CITY OF MANLY 19,706 0.002725% 158,834 282,038
98303 CITY OF NORTHWOOD 46,972 0.006495% 378,604 672,279
98304 CITY OF KENSETT 4,933 0.000682% 39,758 70,597
98305 CITY OF HANLONTOWN 2,090 0.000289% 16,844 29,909
98307 CITY OF FERTILE 6,292 0.000870% 50,718 90,059
98308 CITY OF JOICE 1,589 0.000220% 12,811 22,748
98311 KINNEY MEMORIAL LIBRARY 602 0.000083% 4,856 8,623
98312 JOICE PUBLIC LIBRARY 1,474 0.000204% 11,884 21,102
98531 NORTHWOOD KENSETT COMM SCHOOL DISTRICT 344,172 0.047587% 2,774,116 4,925,934
99201 WRIGHT COUNTY 457,185 0.063213% 3,685,035 6,543,433
99203 WRIGHT COUNTY AGRI EXTENSION DIST 11,410 0.001578% 91,967 163,304
99206 WRIGHT CO SOIL & WATER CONSERVATION 2,799 0.000387% 22,557 40,054
99301 CITY OF CLARION 59,476 0.008224% 479,396 851,253
99302 CITY OF EAGLE GROVE 79,385 0.010976% 639,863 1,136,191
99304 CITY OF BELMOND 38,533 0.005328% 310,586 551,501
See notes to Schedules.___________________________________________________________________________________________________
116

___________________________________________________________________________________________________Schedule 1
Change in NPL due to 1%
Increase in the Actuarial Assumed
Investment Return (8.00%)
Differences Between Expected
and Actual Experience
Changes of Assumptions
Difference Between
Projected and Actual
Investment Earnings on Pension Plan Investments
Total Deferred Outflows of Resources
Differences Between Expected
and Actual Experience
Difference Between
Projected and Actual
Investment Earnings on Pension Plan Investments
Total Deferred Inflows of Resources
Total Proportionate
Share of Allocable Plan
Pension Expense
DEFERRED OUTFLOWS OF RESOURCES
(Excluding Employer Specific Amounts) * (Excluding Employer Specific Amounts) *
DEFERRED INFLOWS OF RESOURCES
327,872 2,602 100,523 44,364 147,489 33,742 150,118 183,860 172,632
42,289 336 12,966 5,722 19,024 4,352 19,362 23,714 22,266
61,599 489 18,886 8,335 27,710 6,339 28,204 34,543 32,433
44,655 354 13,691 6,042 20,087 4,596 20,445 25,041 23,512
18,005 143 5,520 2,436 8,099 1,853 8,244 10,097 9,480
5,799 46 1,778 785 2,609 597 2,655 3,252 3,053
16,235 129 4,977 2,197 7,303 1,671 7,433 9,104 8,548
10,394 82 3,187 1,406 4,675 1,070 4,759 5,829 5,473
15,409 122 4,724 2,085 6,931 1,586 7,055 8,641 8,113
9,075 72 2,782 1,228 4,082 934 4,155 5,089 4,778
13,852 110 4,247 1,874 6,231 1,426 6,342 7,768 7,293
27,427,748 217,641 8,409,136 3,711,214 12,337,991 2,822,674 12,557,918 15,380,592 14,441,318
1,113,275 8,834 341,322 150,636 500,792 114,571 509,718 624,289 586,164
3,350,953 26,590 1,027,377 453,413 1,507,380 344,857 1,534,249 1,879,106 1,764,351
1,094,122 8,682 335,449 148,044 492,175 112,599 500,948 613,547 576,079
1,210,448 9,605 371,114 163,784 544,503 124,571 554,209 678,780 637,328
798,949 6,340 244,952 108,105 359,397 82,222 365,802 448,024 420,664
1,976,747 15,686 606,055 267,471 889,212 203,433 905,062 1,108,495 1,040,801
4,446,185 35,281 1,363,166 601,607 2,000,054 457,570 2,035,706 2,493,276 2,341,015
729,873 5,792 223,773 98,758 328,323 75,113 334,176 409,289 384,294
30,601 243 9,382 4,141 13,766 3,149 14,011 17,160 16,112
18,105 144 5,551 2,450 8,145 1,863 8,290 10,153 9,533
55,492 440 17,013 7,509 24,962 5,711 25,407 31,118 29,218
132,273 1,050 40,554 17,898 59,502 13,613 60,562 74,175 69,645
13,890 110 4,259 1,879 6,248 1,429 6,360 7,789 7,313
5,885 47 1,804 796 2,647 606 2,694 3,300 3,098
17,719 141 5,433 2,398 7,972 1,824 8,113 9,937 9,330
4,476 36 1,373 605 2,014 460 2,048 2,508 2,357
1,697 13 520 230 763 175 777 952 893
4,152 33 1,273 562 1,868 427 1,901 2,328 2,186
969,194 7,691 297,147 131,140 435,978 99,743 443,750 543,493 510,302
1,287,443 10,216 394,720 174,202 579,138 132,495 589,461 721,956 677,867
32,131 255 9,851 4,348 14,454 3,307 14,711 18,018 16,918
7,881 63 2,416 1,066 3,545 811 3,608 4,419 4,149
167,487 1,329 51,350 22,662 75,341 17,237 76,685 93,922 88,186
223,549 1,774 68,539 30,248 100,561 23,006 102,353 125,359 117,704
108,510 861 33,268 14,682 48,811 11,167 49,682 60,849 57,133
___________________________________________________________________________________________________117 (Continued)

___________________________________________________________________________________________________
Employer ID # Employer Name
2019 Actual Employer
Contributions
Employer Allocation
Percentage ** Net Pension
Liability (NPL)
Change in NPL due to 1%
Decrease in the Actuarial Assumed
Investment Return (6.00%)
Iowa Public Employees' Retirement System
Schedule of Employer Allocations and Collective Pension Amounts Allocated by Employer -Regular Membership Group
As of and for the year ended June 30, 2019
99305 CITY OF GOLDFIELD 12,773 0.001766% 102,950 182,806
99307 CITY OF DOWS 9,056 0.001252% 72,997 129,620
99308 BELMOND PUBLIC LIBRARY 7,374 0.001020% 59,435 105,537
99309 CITY OF ROWAN 1,363 0.000188% 10,988 19,511
99311 IOWA SPECIALTY HOSPITAL-CLARION 1,899,425 0.262625% 15,309,878 27,185,401
99312 IOWA SPECIALTY HOSPITAL-BELMOND 924,390 0.127811% 7,450,836 13,230,279
99314 TOWN OF GALT 685 0.000095% 5,524 9,809
99315 CITY OF WOOLSTOCK 2,958 0.000409% 23,839 42,330
99317 ROWAN PUBLIC LIBRARY 2,177 0.000301% 17,544 31,153
99537 BELMOND-KLEMME COMMUNITY SCHOOL DISTRICT 496,989 0.068716% 4,005,864 7,113,121
99540 EAGLE GROVE COMMUNITY SCHOOL DISTRICT 632,856 0.087502% 5,100,992 9,057,714
99601 WRIGHT COUNTY AREA LANDFILL AUTHORITY 17,471 0.002416% 140,825 250,060
Total for all entities 723,245,725$ 100.000000% 5,829,556,644$ 10,351,410,733
** - The proportions in this spreadsheet are for this membership group only, not the proportions to use to compute the change in entity proportion for the Pension note which is included in the Notes to Financial Statements. The Employer Calculation of Total Net Pension Liability/(Asset) and Proportion workbook, which is available on the IPERS website, details how to calculate an employer's proportion and net pension liability/(asset) to comply with GASB Statement No. 68.
* - Employer specific amounts excluded from this Schedule are the changes in proportion and differences between employer contributions and the proportionate share of contributions, as well as the related amortization as defined in paragraphs 54-55 of GASB Statement No. 68, Accounting and Financial Reporting for Pensions.
See notes to Schedules.___________________________________________________________________________________________________
118

___________________________________________________________________________________________________Schedule 1
Change in NPL due to 1%
Increase in the Actuarial Assumed
Investment Return (8.00%)
Differences Between Expected
and Actual Experience
Changes of Assumptions
Difference Between
Projected and Actual
Investment Earnings on Pension Plan Investments
Total Deferred Outflows of Resources
Differences Between Expected
and Actual Experience
Difference Between
Projected and Actual
Investment Earnings on Pension Plan Investments
Total Deferred Inflows of Resources
Total Proportionate
Share of Allocable Plan
Pension Expense
DEFERRED OUTFLOWS OF RESOURCES
(Excluding Employer Specific Amounts) * (Excluding Employer Specific Amounts) *
DEFERRED INFLOWS OF RESOURCES
35,968 285 11,027 4,867 16,179 3,702 16,468 20,170 18,938
25,503 202 7,819 3,451 11,472 2,625 11,677 14,302 13,428
20,765 165 6,366 2,810 9,341 2,137 9,507 11,644 10,933
3,839 30 1,177 519 1,726 395 1,758 2,153 2,021
5,348,820 42,443 1,639,907 723,742 2,406,092 550,463 2,448,981 2,999,444 2,816,272
2,603,102 20,656 798,091 352,222 1,170,969 267,893 1,191,842 1,459,735 1,370,591
1,930 15 592 261 868 199 884 1,083 1,016
8,329 66 2,554 1,127 3,747 857 3,813 4,670 4,385
6,129 49 1,879 829 2,757 631 2,806 3,437 3,227
1,399,531 11,105 429,085 189,369 629,559 144,030 640,781 784,811 736,884
1,782,136 14,141 546,389 241,138 801,668 183,405 815,959 999,364 938,334
49,200 390 15,084 6,657 22,131 5,063 22,526 27,589 25,905
2,036,675,117 16,161,149 624,428,956 275,579,833 916,169,938 209,600,431 932,500,777 1,142,101,208 1,072,354,639
___________________________________________________________________________________________________119

120
Iowa Public Employees’ Retirement System

121
Iowa Public Employees’ Retirement System Sheriffs and Deputies Membership Group

__________________________________________________________________________________________________
Employer ID # Employer Name
2019 Actual Employer
Contributions
Employer Allocation
Percentage **
Net Pension Liability (NPL)/
(Asset)
Change in NPL due to 1%
Decrease in the Actuarial Assumed
Investment Return (6.00 %)
Change in NPL due to 1%
Increase in the Actuarial Assumed
Investment Return (8.00%)
01201 ADAIR COUNTY 36,877$ 0.321472% (27,089)$ 266,980 (273,558)
02201 ADAMS COUNTY 40,281 0.351150% (29,590) 291,627 (298,812)
03201 ALLAMAKEE COUNTY 62,038 0.540814% (45,572) 449,142 (460,208)
04208 APPANOOSE COUNTY SHERIFF'S DEPT 54,208 0.472557% (39,820) 392,455 (402,124)
05201 AUDUBON COUNTY 32,375 0.282225% (23,782) 234,385 (240,161)
06201 BENTON COUNTY 86,930 0.757811% (63,857) 629,356 (644,863)
07201 BLACK HAWK COUNTY 520,438 4.536923% (382,305) 3,767,875 (3,860,712)
08201 BOONE COUNTY 88,991 0.775780% (65,371) 644,279 (660,153)
09201 BREMER COUNTY 96,616 0.842248% (70,972) 699,479 (716,714)
10201 BUCHANAN COUNTY 74,727 0.651432% (54,893) 541,009 (554,338)
11201 BUENA VISTA COUNTY 92,697 0.808084% (68,093) 671,106 (687,642)
12201 BUTLER COUNTY 71,015 0.619070% (52,166) 514,132 (526,800)
13201 CALHOUN COUNTY 44,989 0.392196% (33,048) 325,715 (333,740)
14201 CARROLL COUNTY 57,268 0.499233% (42,068) 414,609 (424,824)
15201 CASS COUNTY 57,096 0.497738% (41,942) 413,367 (423,552)
16201 CEDAR COUNTY 92,401 0.805503% (67,876) 668,963 (685,446)
17201 CERRO GORDO COUNTY 134,385 1.171504% (98,717) 972,924 (996,896)
18201 CHEROKEE COUNTY 44,092 0.384375% (32,390) 319,220 (327,086)
19201 CHICKASAW COUNTY 60,641 0.528640% (44,546) 439,031 (449,848)
20201 CLARKE COUNTY 40,278 0.351124% (29,588) 291,605 (298,790)
21201 CLAY COUNTY 73,613 0.641722% (54,075) 532,944 (546,075)
22201 CLAYTON COUNTY 81,227 0.708094% (59,668) 588,066 (602,556)
23201 CLINTON COUNTY 170,080 1.482676% (124,938) 1,231,350 (1,261,689)
24201 CRAWFORD COUNTY 61,367 0.534970% (45,079) 444,288 (455,235)
25201 DALLAS COUNTY 192,532 1.678396% (141,431) 1,393,894 (1,428,238)
26201 DAVIS COUNTY 44,638 0.389136% (32,791) 323,174 (331,136)
27201 DECATUR COUNTY 32,717 0.285215% (24,034) 236,868 (242,705)
28201 DELAWARE COUNTY 99,694 0.869085% (73,234) 721,767 (739,551)
29201 DES MOINES COUNTY 129,191 1.126223% (94,902) 935,319 (958,364)
30201 DICKINSON COUNTY 64,880 0.565589% (47,660) 469,717 (481,290)
31201 DUBUQUE COUNTY 567,114 4.943820% (416,592) 4,105,800 (4,206,962)
32201 EMMET COUNTY 50,872 0.443473% (37,369) 368,300 (377,375)
33201 FAYETTE COUNTY 80,610 0.702719% (59,215) 583,602 (597,981)
34201 FLOYD COUNTY 76,132 0.663678% (55,925) 551,179 (564,760)
35201 FRANKLIN COUNTY 37,206 0.324343% (27,331) 269,364 (276,001)
36201 FREMONT COUNTY 53,479 0.466201% (39,285) 387,176 (396,716)
37201 GREENE COUNTY 43,174 0.376370% (31,715) 312,572 (320,274)
Iowa Public Employees' Retirement System
Schedule of Employer Allocations and Collective Pension Amounts Allocated by Employer -Sheriffs and Deputies Membership Group
As of and for the year ended June 30, 2019
See notes to Schedules.___________________________________________________________________________________________________
122

__________________________________________________________________________________________________Schedule 2
Differences Between Expected
and Actual Experience
Changes of Assumptions
Difference Between Projected and Actual Investment Earnings on Pension Plan Investments
Total Deferred
Outflows of Resources
Differences Between
Expected and Actual
Experience Changes of
Assumptions
Difference Between Projected and Actual Investment Earnings on Pension Plan Investments
Total Deferred Inflows of Resources
Total Proportionate
Share of Allocable Plan
Pension Expense
4,687 37,977 19,581 62,245 9,433 54,491 68,210 132,134 29,255
5,120 41,482 21,389 67,991 10,304 59,522 74,507 144,333 31,955
7,885 63,888 32,941 104,714 15,869 91,671 114,749 222,289 49,215
6,890 55,825 28,784 91,499 13,866 80,101 100,267 194,234 43,004
4,115 33,340 17,191 54,646 8,281 47,839 59,882 116,002 25,683
11,049 89,523 46,159 146,731 22,236 128,454 160,791 311,481 68,963
66,150 535,961 276,348 878,459 133,124 769,036 962,638 1,864,798 412,870
11,311 91,645 47,253 150,209 22,763 131,499 164,604 318,866 70,598
12,280 99,497 51,302 163,079 24,714 142,766 178,707 346,187 76,646
9,498 76,956 39,679 126,133 19,115 110,422 138,220 267,757 59,282
11,782 95,462 49,221 156,465 23,711 136,975 171,458 332,144 73,537
9,026 73,133 37,708 119,867 18,165 104,936 131,353 254,454 56,337
5,718 46,331 23,889 75,938 11,508 66,480 83,215 161,203 35,691
7,279 58,976 30,409 96,664 14,649 84,623 105,927 205,199 45,431
7,257 58,799 30,318 96,374 14,605 84,370 105,609 204,584 45,295
11,744 95,157 49,064 155,965 23,635 136,538 170,911 331,084 73,303
17,081 138,394 71,357 226,832 34,375 198,577 248,568 481,520 106,610
5,604 45,408 23,413 74,425 11,278 65,154 81,556 157,988 34,979
7,708 62,450 32,200 102,358 15,512 89,608 112,166 217,286 48,107
5,119 41,479 21,387 67,985 10,303 59,518 74,501 144,322 31,953
9,356 75,809 39,088 124,253 18,830 108,776 136,160 263,766 58,398
10,324 83,649 43,131 137,104 20,777 120,026 150,242 291,045 64,438
21,618 175,153 90,311 287,082 43,505 251,323 314,592 609,420 134,927
7,800 63,198 32,586 103,584 15,697 90,681 113,509 219,887 48,683
24,472 198,274 102,233 324,979 49,248 284,498 356,120 689,866 152,738
5,674 45,970 23,703 75,347 11,418 65,961 82,566 159,945 35,412
4,159 33,693 17,373 55,225 8,369 48,346 60,516 117,231 25,955
12,672 102,668 52,937 168,277 25,501 147,315 184,401 357,217 79,089
16,421 133,044 68,599 218,064 33,046 190,902 238,961 462,909 102,489
8,246 66,815 34,451 109,512 16,596 95,871 120,006 232,473 51,470
72,082 584,029 301,132 957,243 145,063 838,006 1,048,973 2,032,042 449,899
6,466 52,389 27,012 85,867 13,013 75,171 94,095 182,279 40,357
10,246 83,014 42,803 136,063 20,619 119,115 149,102 288,836 63,949
9,677 78,402 40,425 128,504 19,474 112,497 140,818 272,789 60,396
4,729 38,316 19,756 62,801 9,517 54,978 68,819 133,314 29,516
6,797 55,074 28,397 90,268 13,679 79,024 98,918 191,621 42,425
5,488 44,462 22,925 72,875 11,044 63,797 79,858 154,699 34,251
DEFERRED INFLOWS OF RESOURCES
(Excluding Employer Specific Amounts) *
DEFERRED OUTFLOWS OF RESOURCES
(Excluding Employer Specific Amounts)*
___________________________________________________________________________________________________123 (Continued)

__________________________________________________________________________________________________
Employer ID # Employer Name
2019 Actual Employer
Contributions
Employer Allocation
Percentage **
Net Pension Liability (NPL)/
(Asset)
Change in NPL due to 1%
Decrease in the Actuarial Assumed
Investment Return (6.00 %)
Change in NPL due to 1%
Increase in the Actuarial Assumed
Investment Return (8.00%)
Iowa Public Employees' Retirement System
Schedule of Employer Allocations and Collective Pension Amounts Allocated by Employer -Sheriffs and Deputies Membership Group
As of and for the year ended June 30, 2019
38201 GRUNDY COUNTY 74,129 0.646217% (54,454) 536,677 (549,901)
39201 GUTHRIE COUNTY 56,080 0.488876% (41,195) 406,008 (416,011)
40201 HAMILTON COUNTY 63,565 0.554128% (46,694) 460,198 (471,537)
41201 HANCOCK COUNTY 56,502 0.492557% (41,506) 409,065 (419,144)
42201 HARDIN COUNTY 60,673 0.528913% (44,569) 439,258 (450,081)
43201 HARRISON COUNTY 62,480 0.544666% (45,896) 452,340 (463,485)
44201 HENRY COUNTY 71,187 0.620569% (52,292) 515,377 (528,075)
45201 HOWARD COUNTY 56,215 0.490057% (41,295) 406,988 (417,016)
46201 HUMBOLDT COUNTY 58,694 0.511666% (43,116) 424,934 (435,404)
47201 IDA COUNTY 49,783 0.433982% (36,570) 360,418 (369,299)
48201 IOWA COUNTY 78,623 0.685396% (57,755) 569,215 (583,240)
49201 JACKSON COUNTY 69,455 0.605478% (51,021) 502,844 (515,234)
50201 JASPER COUNTY 120,360 1.049239% (88,414) 871,384 (892,854)
51201 JEFFERSON COUNTY 70,892 0.618004% (52,076) 513,247 (525,893)
52201 JOHNSON COUNTY 557,489 4.859912% (409,521) 4,036,114 (4,135,561)
53201 JONES COUNTY 71,461 0.622961% (52,494) 517,363 (530,111)
54201 KEOKUK COUNTY 34,651 0.302074% (25,454) 250,870 (257,051)
55201 KOSSUTH COUNTY 62,049 0.540910% (45,580) 449,221 (460,290)
56201 LEE COUNTY 101,231 0.882482% (74,363) 732,894 (750,952)
57210 LINN COUNTY SHERIFF'S DEPARTMENT 1,105,818 9.639968% (812,314) 8,005,911 (8,203,169)
58201 LOUISA COUNTY 66,519 0.579877% (48,864) 481,583 (493,449)
59201 LUCAS COUNTY 26,443 0.230515% (19,424) 191,441 (196,158)
60201 LYON COUNTY 84,545 0.737020% (62,105) 612,089 (627,170)
61201 MADISON COUNTY 43,906 0.382753% (32,253) 317,873 (325,705)
62201 MAHASKA COUNTY 58,924 0.513669% (43,284) 426,597 (437,108)
63201 MARION COUNTY 104,737 0.913046% (76,938) 758,276 (776,960)
64201 MARSHALL COUNTY 137,329 1.197165% (100,879) 994,235 (1,018,732)
65201 MILLS COUNTY 73,583 0.641458% (54,053) 532,725 (545,851)
66207 MITCHELL COUNTY SHERIFF'S DEPT 50,609 0.441186% (37,177) 366,401 (375,429)
67201 MONONA COUNTY 47,142 0.410957% (34,629) 341,296 (349,706)
68201 MONROE COUNTY 27,239 0.237454% (20,009) 197,204 (202,063)
69201 MONTGOMERY COUNTY 52,608 0.458611% (38,645) 380,872 (390,257)
70201 MUSCATINE COUNTY 153,573 1.338770% (112,812) 1,111,836 (1,139,231)
71201 O'BRIEN COUNTY 64,667 0.563733% (47,503) 468,175 (479,711)
72201 OSCEOLA COUNTY 55,847 0.486850% (41,025) 404,325 (414,287)
73201 PAGE COUNTY 53,283 0.464492% (39,141) 385,756 (395,261)
74201 PALO ALTO COUNTY 49,395 0.430604% (36,285) 357,613 (366,424)
See notes to Schedules.___________________________________________________________________________________________________
124
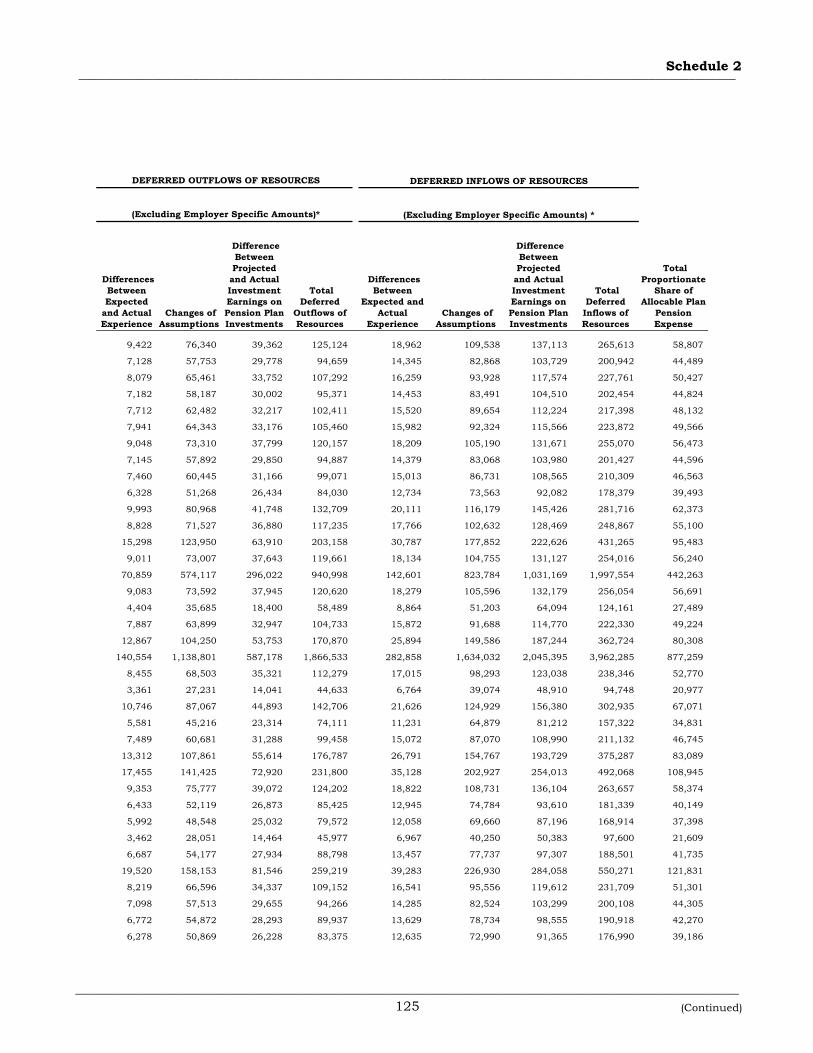
__________________________________________________________________________________________________Schedule 2
Differences Between Expected
and Actual Experience
Changes of Assumptions
Difference Between Projected and Actual Investment Earnings on Pension Plan Investments
Total Deferred
Outflows of Resources
Differences Between
Expected and Actual
Experience Changes of
Assumptions
Difference Between Projected and Actual Investment Earnings on Pension Plan Investments
Total Deferred Inflows of Resources
Total Proportionate
Share of Allocable Plan
Pension Expense
DEFERRED INFLOWS OF RESOURCES
(Excluding Employer Specific Amounts) *
DEFERRED OUTFLOWS OF RESOURCES
(Excluding Employer Specific Amounts)*
9,422 76,340 39,362 125,124 18,962 109,538 137,113 265,613 58,807
7,128 57,753 29,778 94,659 14,345 82,868 103,729 200,942 44,489
8,079 65,461 33,752 107,292 16,259 93,928 117,574 227,761 50,427
7,182 58,187 30,002 95,371 14,453 83,491 104,510 202,454 44,824
7,712 62,482 32,217 102,411 15,520 89,654 112,224 217,398 48,132
7,941 64,343 33,176 105,460 15,982 92,324 115,566 223,872 49,566
9,048 73,310 37,799 120,157 18,209 105,190 131,671 255,070 56,473
7,145 57,892 29,850 94,887 14,379 83,068 103,980 201,427 44,596
7,460 60,445 31,166 99,071 15,013 86,731 108,565 210,309 46,563
6,328 51,268 26,434 84,030 12,734 73,563 92,082 178,379 39,493
9,993 80,968 41,748 132,709 20,111 116,179 145,426 281,716 62,373
8,828 71,527 36,880 117,235 17,766 102,632 128,469 248,867 55,100
15,298 123,950 63,910 203,158 30,787 177,852 222,626 431,265 95,483
9,011 73,007 37,643 119,661 18,134 104,755 131,127 254,016 56,240
70,859 574,117 296,022 940,998 142,601 823,784 1,031,169 1,997,554 442,263
9,083 73,592 37,945 120,620 18,279 105,596 132,179 256,054 56,691
4,404 35,685 18,400 58,489 8,864 51,203 64,094 124,161 27,489
7,887 63,899 32,947 104,733 15,872 91,688 114,770 222,330 49,224
12,867 104,250 53,753 170,870 25,894 149,586 187,244 362,724 80,308
140,554 1,138,801 587,178 1,866,533 282,858 1,634,032 2,045,395 3,962,285 877,259
8,455 68,503 35,321 112,279 17,015 98,293 123,038 238,346 52,770
3,361 27,231 14,041 44,633 6,764 39,074 48,910 94,748 20,977
10,746 87,067 44,893 142,706 21,626 124,929 156,380 302,935 67,071
5,581 45,216 23,314 74,111 11,231 64,879 81,212 157,322 34,831
7,489 60,681 31,288 99,458 15,072 87,070 108,990 211,132 46,745
13,312 107,861 55,614 176,787 26,791 154,767 193,729 375,287 83,089
17,455 141,425 72,920 231,800 35,128 202,927 254,013 492,068 108,945
9,353 75,777 39,072 124,202 18,822 108,731 136,104 263,657 58,374
6,433 52,119 26,873 85,425 12,945 74,784 93,610 181,339 40,149
5,992 48,548 25,032 79,572 12,058 69,660 87,196 168,914 37,398
3,462 28,051 14,464 45,977 6,967 40,250 50,383 97,600 21,609
6,687 54,177 27,934 88,798 13,457 77,737 97,307 188,501 41,735
19,520 158,153 81,546 259,219 39,283 226,930 284,058 550,271 121,831
8,219 66,596 34,337 109,152 16,541 95,556 119,612 231,709 51,301
7,098 57,513 29,655 94,266 14,285 82,524 103,299 200,108 44,305
6,772 54,872 28,293 89,937 13,629 78,734 98,555 190,918 42,270
6,278 50,869 26,228 83,375 12,635 72,990 91,365 176,990 39,186
___________________________________________________________________________________________________125 (Continued)

__________________________________________________________________________________________________
Employer ID # Employer Name
2019 Actual Employer
Contributions
Employer Allocation
Percentage **
Net Pension Liability (NPL)/
(Asset)
Change in NPL due to 1%
Decrease in the Actuarial Assumed
Investment Return (6.00 %)
Change in NPL due to 1%
Increase in the Actuarial Assumed
Investment Return (8.00%)
Iowa Public Employees' Retirement System
Schedule of Employer Allocations and Collective Pension Amounts Allocated by Employer -Sheriffs and Deputies Membership Group
As of and for the year ended June 30, 2019
75201 PLYMOUTH COUNTY 87,508 0.762847% (64,282) 633,538 (649,148)
76201 POCAHONTAS COUNTY 45,509 0.396725% (33,430) 329,477 (337,595)
77209 POLK COUNTY ADMINISTRATION OFFICE BL 1,155,394 10.072145% (848,732) 8,364,830 (8,570,931)
78201 POTTAWATTAMIE COUNTY 380,582 3.317725% (279,569) 2,755,342 (2,823,231)
79201 POWESHIEK COUNTY 81,903 0.713991% (60,165) 592,963 (607,573)
80201 RINGGOLD COUNTY 31,554 0.275068% (23,179) 228,441 (234,070)
81201 SAC COUNTY 60,748 0.529573% (44,625) 439,806 (450,642)
82201 SCOTT COUNTY 327,194 2.852311% (240,351) 2,368,820 (2,427,186)
83201 SHELBY COUNTY 53,355 0.465125% (39,194) 386,283 (395,800)
84201 SIOUX COUNTY 102,212 0.891031% (75,083) 739,994 (758,227)
85201 STORY COUNTY 231,852 2.021168% (170,314) 1,678,563 (1,719,921)
86201 TAMA COUNTY 79,367 0.691880% (58,302) 574,601 (588,758)
87201 TAYLOR COUNTY 44,778 0.390351% (32,893) 324,183 (332,171)
88201 UNION COUNTY 35,839 0.312426% (26,327) 259,467 (265,860)
89201 VAN BUREN COUNTY 34,469 0.300486% (25,321) 249,551 (255,700)
90201 WAPELLO COUNTY 69,616 0.606874% (51,138) 504,004 (516,422)
91201 WARREN COUNTY 149,537 1.303586% (109,847) 1,082,617 (1,109,292)
92201 WASHINGTON COUNTY 120,117 1.047116% (88,236) 869,621 (891,047)
93201 WAYNE COUNTY 40,822 0.355866% (29,987) 295,543 (302,825)
94201 WEBSTER COUNTY 107,892 0.940552% (79,256) 781,120 (800,366)
95201 WINNEBAGO COUNTY 46,017 0.401150% (33,803) 333,152 (341,360)
96201 WINNESHIEK COUNTY 78,681 0.685902% (57,798) 569,636 (583,671)
97201 WOODBURY COUNTY 293,116 2.555240% (215,318) 2,122,105 (2,174,392)
98201 WORTH COUNTY 72,889 0.635411% (53,543) 527,703 (540,706)
99201 WRIGHT COUNTY 61,674 0.537643% (45,305) 446,508 (457,509)
Total for all entities 11,471,176$ 100.000000% (8,426,532)$ 83,049,130 (85,095,388)
** - The proportions in this spreadsheet are for this membership group only, not the proportions to use to compute the change in entity proportion for the Pension note which is included in the Notes to Financial Statements. The Employer Calculation of Total Net Pension Liability/(Asset) and Proportion workbook, which is available on the IPERS website, details how to calculate an employer's proportion and net pension liability/(asset) to comply with GASB Statement No. 68.
* - Employer specific amounts excluded from this Schedule are the changes in proportion and differences between employer contributions and the proportionate share of contributions, as well as the related amortization as defined in paragraphs 54-55 of GASB Statement No. 68, Accounting and Financial Reporting for Pensions.
See notes to Schedules.___________________________________________________________________________________________________
126

__________________________________________________________________________________________________Schedule 2
Differences Between Expected
and Actual Experience
Changes of Assumptions
Difference Between Projected and Actual Investment Earnings on Pension Plan Investments
Total Deferred
Outflows of Resources
Differences Between
Expected and Actual
Experience Changes of
Assumptions
Difference Between Projected and Actual Investment Earnings on Pension Plan Investments
Total Deferred Inflows of Resources
Total Proportionate
Share of Allocable Plan
Pension Expense
DEFERRED INFLOWS OF RESOURCES
(Excluding Employer Specific Amounts) *
DEFERRED OUTFLOWS OF RESOURCES
(Excluding Employer Specific Amounts)*
11,123 90,118 46,466 147,707 22,384 129,307 161,860 313,551 69,421
5,784 46,866 24,165 76,815 11,641 67,247 84,177 163,065 36,103
146,856 1,189,856 613,503 1,950,215 295,539 1,707,289 2,137,093 4,139,921 916,588
48,373 391,934 202,086 642,393 97,350 562,374 703,950 1,363,674 301,921
10,410 84,346 43,490 138,246 20,950 121,026 151,494 293,470 64,975
4,011 32,495 16,755 53,261 8,071 46,626 58,363 113,060 25,032
7,721 62,560 32,257 102,538 15,539 89,766 112,364 217,669 48,192
41,588 336,953 173,737 552,278 83,694 483,484 605,199 1,172,377 259,567
6,782 54,947 28,331 90,060 13,648 78,842 98,690 191,180 42,327
12,992 105,260 54,274 172,526 26,145 151,035 189,058 366,238 81,086
29,469 238,767 123,111 391,347 59,306 342,600 428,849 830,755 183,931
10,088 81,734 42,143 133,965 20,301 117,278 146,802 284,381 62,963
5,691 46,113 23,777 75,581 11,454 66,167 82,824 160,445 35,523
4,555 36,908 19,030 60,493 9,167 52,958 66,290 128,415 28,431
4,381 35,497 18,303 58,181 8,817 50,934 63,757 123,508 27,345
8,848 71,692 36,965 117,505 17,807 102,869 128,766 249,442 55,227
19,007 153,997 79,403 252,407 38,250 220,966 276,593 535,809 118,629
15,267 123,699 63,781 202,747 30,725 177,492 222,176 430,393 95,290
5,189 42,040 21,676 68,905 10,442 60,321 75,507 146,270 32,385
13,714 111,110 57,290 182,114 27,598 159,429 199,565 386,592 85,592
5,849 47,389 24,434 77,672 11,771 67,997 85,115 164,883 36,506
10,001 81,028 41,779 132,808 20,126 116,265 145,534 281,925 62,419
37,256 301,859 155,642 494,757 74,977 433,129 542,167 1,050,273 232,533
9,264 75,063 38,703 123,030 18,644 107,706 134,821 261,171 57,824
7,839 63,513 32,748 104,100 15,776 91,134 114,076 220,986 48,927
1,458,030 11,813,322 6,091,091 19,362,443 2,934,235 16,950,605 21,217,859 41,102,699 9,100,229
___________________________________________________________________________________________________127

128
Iowa Public Employees’ Retirement System

129
Iowa Public Employees’ Retirement System Protection Occupation Membership Group

____________________________________________________________________________________________________
Employer ID # Employer Name
2019 Actual Employer
Contributions
Employer Allocation
Percentage **
Net Pension Liability
(NPL)/(Asset)
Change in NPL due to 1%
Decrease in the Actuarial Assumed
Investment Return (6.00 %)
Change in NPL due to 1%
Increase in the Actuarial Assumed
Investment Return (8.00%)
00216 STATE - DEPT OF HUMAN SERVICES/CCUSO 468,857$ 1.256202% (382,790)$ 2,429,754 (2,738,049)
00221 MAR-MAC UNIFIED POLICE DISTRICT 9,753 0.026132% (7,963) 50,545 (56,958)
00313 POLK COUNTY RANGERS 1,698,730 4.551386% (1,386,901) 8,803,323 (9,920,316)
00331 BATTLE CREEK COMMUNITY AMBULANCE 3,898 0.010444% (3,182) 20,201 (22,764)
00348 STATE - PUB DEF - PROTECTION OCCUPATIONS 137,506 0.368419% (112,265) 712,598 (803,015)
00410 DELAWARE TOWNSHIP FIRE DEPT - POLK CO 2,557 0.006851% (2,088) 13,251 (14,932)
01201 ADAIR COUNTY 45,841 0.122821% (37,426) 237,561 (267,704)
01204 ADAIR COUNTY HEALTH SYSTEM 22,249 0.059611% (18,165) 115,300 (129,929)
01301 CITY OF FONTANELLE 917 0.002458% (749) 4,754 (5,357)
01302 CITY OF GREENFIELD 15,157 0.040610% (12,375) 78,549 (88,515)
01306 CITY OF ADAIR 6,461 0.017311% (5,275) 33,484 (37,732)
02201 ADAMS COUNTY 32,000 0.085738% (26,126) 165,834 (186,876)
03201 ALLAMAKEE COUNTY 50,844 0.136225% (41,511) 263,488 (296,920)
03304 CITY OF LANSING 14,052 0.037650% (11,473) 72,823 (82,063)
03306 CITY OF POSTVILLE 23,669 0.063416% (19,324) 122,659 (138,222)
03312 VETERAN'S MEMORIAL HOSPITAL 46,311 0.124082% (37,810) 239,999 (270,451)
03313 WAUKON POLICE DEPARTMENT 34,132 0.091450% (27,867) 176,883 (199,327)
04201 APPANOOSE COUNTY 25,995 0.069649% (21,223) 134,715 (151,808)
04301 CITY OF CENTERVILLE 20,514 0.054964% (16,749) 106,311 (119,800)
05201 AUDUBON COUNTY 18,551 0.049705% (15,146) 96,139 (108,338)
05302 CITY OF AUDUBON 24,993 0.066962% (20,405) 129,519 (145,953)
06201 BENTON COUNTY 106,652 0.285751% (87,074) 552,701 (622,830)
06301 CITY OF VINTON 59,207 0.158631% (48,338) 306,826 (345,757)
06302 CITY OF BELLE PLAINE 23,308 0.062449% (19,029) 120,789 (136,115)
06315 CITY OF URBANA 6,446 0.017270% (5,263) 33,404 (37,642)
07001 UNIVERSITY OF NORTHERN IOWA 65,971 0.176755% (53,861) 341,881 (385,260)
07201 BLACK HAWK COUNTY 133,739 0.358325% (109,189) 693,075 (781,014)
07302 CITY OF CEDAR FALLS 147 0.000394% (120) 761 (858)
07304 CITY OF GILBERTVILLE 5,023 0.013458% (4,101) 26,030 (29,333)
07306 CITY OF DUNKERTON 5,728 0.015348% (4,677) 29,686 (33,452)
07311 CITY OF LA PORTE CITY 21,418 0.057384% (17,486) 110,993 (125,076)
07319 CITY OF EVANSDALE 6,943 0.018602% (5,668) 35,979 (40,544)
07334 HUDSON POLICE DEPARTMENT 27,589 0.073920% (22,525) 142,976 (161,117)
08201 BOONE COUNTY 52,678 0.141139% (43,008) 272,991 (307,629)
08204 BOONE COUNTY HOSPITAL 70,453 0.188763% (57,520) 365,106 (411,432)
Iowa Public Employees' Retirement System
Schedule of Employer Allocations and Collective Pension Amounts Allocated by Employer -Protection Occupation Membership Group
As of and for the year ended June 30, 2019
See notes to Schedules.___________________________________________________________________________________________________
130

____________________________________________________________________________________________________Schedule 3
Differences Between Expected
and Actual Experience
Changes of Assumptions
Difference Between
Projected and Actual
Investment Earnings on Pension Plan Investments
Total Deferred
Outflows of Resources
Differences Between Expected
and Actual Experience
Changes of Assumptions
Difference Between
Projected and Actual
Investment Earnings on Pension Plan Investments
Total Deferred Inflows of Resources
Total Proportionate
Share of Allocable Plan
Pension Expense
29,730 313,068 181,429 524,227 14,323 12,366 636,473 663,162 526,335
618 6,513 3,774 10,905 298 257 13,240 13,795 10,949
107,718 1,134,290 657,344 1,899,352 51,895 44,802 2,306,026 2,402,723 1,906,981
247 2,603 1,508 4,358 119 103 5,292 5,514 4,376
8,719 91,817 53,210 153,746 4,201 3,627 186,665 194,493 154,363
162 1,707 989 2,858 78 67 3,471 3,616 2,870
2,907 30,609 17,739 51,255 1,400 1,209 62,229 64,838 51,461
1,411 14,856 8,609 24,876 680 587 30,203 31,470 24,976
58 613 355 1,026 28 24 1,245 1,297 1,030
961 10,121 5,865 16,947 463 400 20,576 21,439 17,015
410 4,314 2,500 7,224 197 170 8,771 9,138 7,253
2,029 21,367 12,383 35,779 978 844 43,440 45,262 35,923
3,224 33,950 19,675 56,849 1,553 1,341 69,021 71,915 57,077
891 9,383 5,438 15,712 429 371 19,076 19,876 15,775
1,501 15,804 9,159 26,464 723 624 32,131 33,478 26,570
2,937 30,923 17,921 51,781 1,415 1,221 62,868 65,504 51,989
2,164 22,791 13,208 38,163 1,043 900 46,335 48,278 38,317
1,648 17,358 10,059 29,065 794 686 35,289 36,769 29,182
1,301 13,698 7,938 22,937 627 541 27,848 29,016 23,029
1,176 12,387 7,179 20,742 567 489 25,184 26,240 20,826
1,585 16,688 9,671 27,944 763 659 33,928 35,350 28,057
6,763 71,214 41,270 119,247 3,258 2,813 144,780 150,851 119,726
3,754 39,534 22,911 66,199 1,809 1,562 80,373 83,744 66,465
1,478 15,563 9,019 26,060 712 615 31,641 32,968 26,165
409 4,304 2,494 7,207 197 170 8,750 9,117 7,236
4,183 44,051 25,528 73,762 2,015 1,740 89,556 93,311 74,059
8,480 89,301 51,752 149,533 4,086 3,527 181,551 189,164 150,134
9 98 57 164 4 4 199 207 165
318 3,354 1,944 5,616 153 132 6,818 7,103 5,639
363 3,825 2,217 6,405 175 151 7,776 8,102 6,431
1,358 14,301 8,288 23,947 654 565 29,075 30,294 24,043
440 4,636 2,687 7,763 212 183 9,425 9,820 7,794
1,749 18,422 10,676 30,847 843 728 37,452 39,023 30,971
3,340 35,174 20,384 58,898 1,609 1,389 71,510 74,508 59,135
4,467 47,043 27,262 78,772 2,152 1,858 95,639 99,649 79,089
DEFERRED INFLOWS OF RESOURCESDEFERRED OUTFLOWS OF RESOURCES
(Excluding Employer Specific Amounts)* (Excluding Employer Specific Amounts) *
___________________________________________________________________________________________________131 (Continued)

____________________________________________________________________________________________________
Employer ID # Employer Name
2019 Actual Employer
Contributions
Employer Allocation
Percentage **
Net Pension Liability
(NPL)/(Asset)
Change in NPL due to 1%
Decrease in the Actuarial Assumed
Investment Return (6.00 %)
Change in NPL due to 1%
Increase in the Actuarial Assumed
Investment Return (8.00%)
Iowa Public Employees' Retirement System
Schedule of Employer Allocations and Collective Pension Amounts Allocated by Employer -Protection Occupation Membership Group
As of and for the year ended June 30, 2019
08301 CITY OF BOONE 8,963 0.024015% (7,318) 46,451 (52,345)
08302 CITY OF OGDEN 12,665 0.033934% (10,340) 65,636 (73,964)
08303 CITY OF MADRID 21,837 0.058508% (17,828) 113,166 (127,525)
09201 BREMER COUNTY 67,481 0.180802% (55,094) 349,708 (394,080)
09302 CITY OF SUMNER 15,239 0.040828% (12,441) 78,970 (88,990)
09303 CITY OF WAVERLY 1,731 0.004639% (1,414) 8,972 (10,111)
09304 CITY OF TRIPOLI 6,502 0.017420% (5,308) 33,693 (37,968)
09305 CITY OF JANESVILLE 8,952 0.023985% (7,309) 46,392 (52,279)
09307 CITY OF READLYN 5,846 0.015663% (4,773) 30,296 (34,140)
09318 WAVERLY HEALTH CENTER 92,242 0.247144% (75,310) 478,027 (538,681)
09319 DENVER POLICE DEPARTMENT 19,921 0.053375% (16,264) 103,238 (116,337)
10201 BUCHANAN COUNTY 57,779 0.154808% (47,173) 299,430 (337,423)
10205 BUCHANAN COUNTY HEALTH CENTER 5,403 0.014476% (4,411) 28,000 (31,553)
10301 CITY OF FAIRBANK 7,096 0.019013% (5,794) 36,776 (41,442)
10302 CITY OF INDEPENDENCE 89,766 0.240509% (73,288) 465,194 (524,219)
10303 CITY OF JESUP 21,505 0.057619% (17,558) 111,448 (125,588)
10306 CITY OF LAMONT 123 0.000328% (100) 635 (715)
11201 BUENA VISTA COUNTY 48,974 0.131215% (39,984) 253,797 (286,000)
11204 BUENA VISTA REGIONAL MEDICAL CENTER 89,918 0.240915% (73,412) 465,980 (525,105)
11301 CITY OF SIOUX RAPIDS 4,479 0.012002% (3,657) 23,214 (26,159)
11302 CITY OF NEWELL 7,175 0.019225% (5,858) 37,185 (41,903)
11307 CITY OF STORM LAKE 6,869 0.018405% (5,608) 35,598 (40,115)
12201 BUTLER COUNTY 35,551 0.095251% (29,025) 184,234 (207,610)
12302 CITY OF PARKERSBURG 10,551 0.028269% (8,614) 54,679 (61,617)
12303 CITY OF SHELL ROCK 2,102 0.005631% (1,716) 10,892 (12,274)
12305 CITY OF CLARKSVILLE 8,142 0.021814% (6,647) 42,193 (47,547)
12310 CITY OF APLINGTON 9,651 0.025857% (7,879) 50,014 (56,359)
12321 CITY OF BRISTOW 128 0.000342% (104) 661 (745)
13201 CALHOUN COUNTY 56,832 0.152269% (46,400) 294,520 (331,890)
13301 CITY OF ROCKWELL CITY 22,890 0.061330% (18,689) 118,625 (133,677)
13303 CITY OF LAKE CITY 16,911 0.045308% (13,806) 87,636 (98,755)
13307 CITY OF POMEROY 3,868 0.010365% (3,158) 20,048 (22,591)
13309 CITY OF FARNHAMVILLE 1,474 0.003949% (1,203) 7,637 (8,606)
13323 MANSON POLICE DEPT 18,518 0.049615% (15,119) 95,965 (108,141)
14201 CARROLL COUNTY 112,516 0.301463% (91,862) 583,092 (657,076)
See notes to Schedules.___________________________________________________________________________________________________
132

____________________________________________________________________________________________________Schedule 3
Differences Between Expected
and Actual Experience
Changes of Assumptions
Difference Between
Projected and Actual
Investment Earnings on Pension Plan Investments
Total Deferred
Outflows of Resources
Differences Between Expected
and Actual Experience
Changes of Assumptions
Difference Between
Projected and Actual
Investment Earnings on Pension Plan Investments
Total Deferred Inflows of Resources
Total Proportionate
Share of Allocable Plan
Pension Expense
DEFERRED INFLOWS OF RESOURCESDEFERRED OUTFLOWS OF RESOURCES
(Excluding Employer Specific Amounts)* (Excluding Employer Specific Amounts) *
568 5,985 3,468 10,021 274 236 12,168 12,678 10,062
803 8,457 4,901 14,161 387 334 17,193 17,914 14,218
1,385 14,581 8,450 24,416 667 576 29,644 30,887 24,514
4,279 45,059 26,113 75,451 2,061 1,780 91,606 95,447 75,754
966 10,175 5,897 17,038 466 402 20,686 21,554 17,107
110 1,156 670 1,936 53 46 2,350 2,449 1,944
412 4,341 2,516 7,269 199 171 8,826 9,196 7,299
568 5,978 3,464 10,010 273 236 12,152 12,661 10,050
371 3,904 2,262 6,537 179 154 7,936 8,269 6,563
5,849 61,593 35,694 103,136 2,818 2,433 125,219 130,470 103,551
1,263 13,302 7,709 22,274 609 525 27,043 28,177 22,364
3,664 38,581 22,358 64,603 1,765 1,524 78,436 81,725 64,863
343 3,608 2,091 6,042 165 142 7,335 7,642 6,065
450 4,739 2,746 7,935 217 187 9,633 10,037 7,966
5,692 59,939 34,736 100,367 2,742 2,367 121,857 126,966 100,771
1,364 14,360 8,322 24,046 657 567 29,194 30,418 24,142
8 82 47 137 4 3 166 173 138
3,105 32,701 18,951 54,757 1,496 1,292 66,482 69,270 54,978
5,702 60,041 34,795 100,538 2,747 2,371 122,063 127,181 100,941
284 2,991 1,733 5,008 137 118 6,081 6,336 5,029
455 4,791 2,777 8,023 219 189 9,741 10,149 8,055
436 4,587 2,658 7,681 210 181 9,325 9,716 7,711
2,254 23,738 13,757 39,749 1,086 938 48,260 50,284 39,909
669 7,045 4,083 11,797 322 278 14,323 14,923 11,845
133 1,403 813 2,349 64 55 2,853 2,972 2,359
516 5,436 3,151 9,103 249 215 11,052 11,516 9,140
612 6,444 3,735 10,791 295 255 13,101 13,651 10,834
8 85 49 142 4 3 173 180 143
3,604 37,948 21,992 63,544 1,736 1,499 77,150 80,385 63,799
1,451 15,285 8,858 25,594 699 604 31,074 32,377 25,697
1,072 11,292 6,544 18,908 517 446 22,956 23,919 18,984
245 2,583 1,497 4,325 118 102 5,251 5,471 4,343
93 984 570 1,647 45 39 2,001 2,085 1,654
1,174 12,365 7,166 20,705 566 488 25,138 26,192 20,788
7,135 75,130 43,539 125,804 3,437 2,967 152,741 159,145 126,310
___________________________________________________________________________________________________133 (Continued)
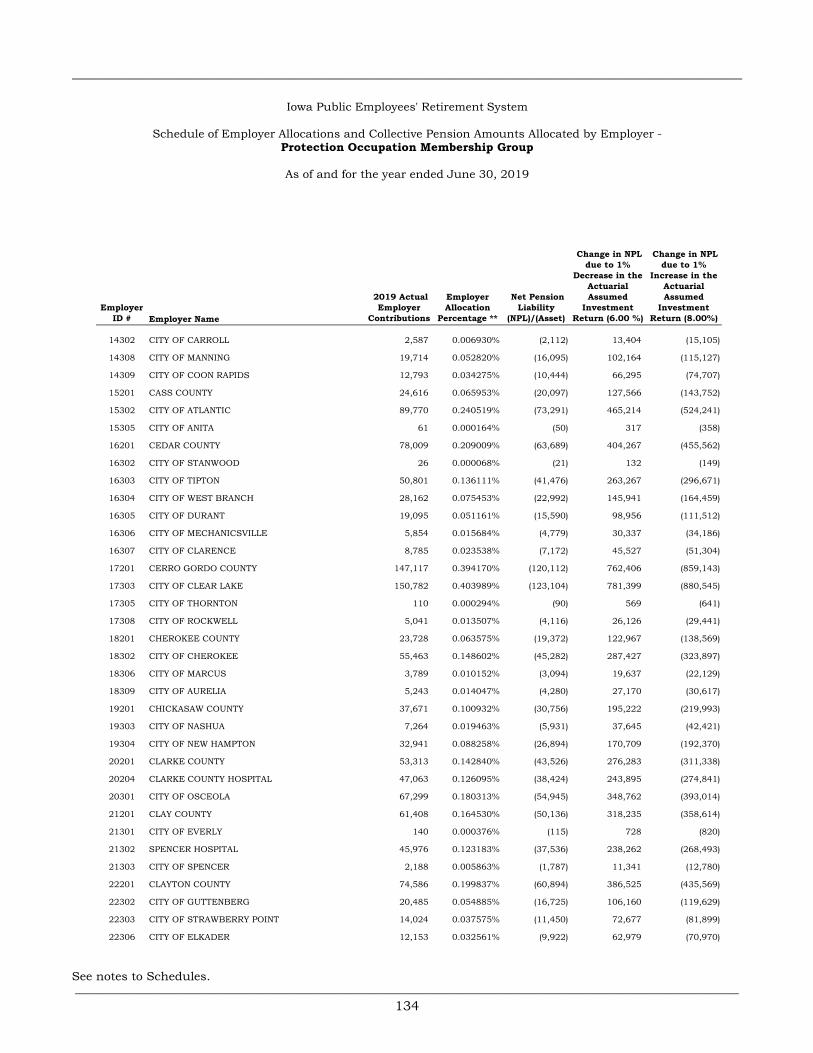
____________________________________________________________________________________________________
Employer ID # Employer Name
2019 Actual Employer
Contributions
Employer Allocation
Percentage **
Net Pension Liability
(NPL)/(Asset)
Change in NPL due to 1%
Decrease in the Actuarial Assumed
Investment Return (6.00 %)
Change in NPL due to 1%
Increase in the Actuarial Assumed
Investment Return (8.00%)
Iowa Public Employees' Retirement System
Schedule of Employer Allocations and Collective Pension Amounts Allocated by Employer -Protection Occupation Membership Group
As of and for the year ended June 30, 2019
14302 CITY OF CARROLL 2,587 0.006930% (2,112) 13,404 (15,105)
14308 CITY OF MANNING 19,714 0.052820% (16,095) 102,164 (115,127)
14309 CITY OF COON RAPIDS 12,793 0.034275% (10,444) 66,295 (74,707)
15201 CASS COUNTY 24,616 0.065953% (20,097) 127,566 (143,752)
15302 CITY OF ATLANTIC 89,770 0.240519% (73,291) 465,214 (524,241)
15305 CITY OF ANITA 61 0.000164% (50) 317 (358)
16201 CEDAR COUNTY 78,009 0.209009% (63,689) 404,267 (455,562)
16302 CITY OF STANWOOD 26 0.000068% (21) 132 (149)
16303 CITY OF TIPTON 50,801 0.136111% (41,476) 263,267 (296,671)
16304 CITY OF WEST BRANCH 28,162 0.075453% (22,992) 145,941 (164,459)
16305 CITY OF DURANT 19,095 0.051161% (15,590) 98,956 (111,512)
16306 CITY OF MECHANICSVILLE 5,854 0.015684% (4,779) 30,337 (34,186)
16307 CITY OF CLARENCE 8,785 0.023538% (7,172) 45,527 (51,304)
17201 CERRO GORDO COUNTY 147,117 0.394170% (120,112) 762,406 (859,143)
17303 CITY OF CLEAR LAKE 150,782 0.403989% (123,104) 781,399 (880,545)
17305 CITY OF THORNTON 110 0.000294% (90) 569 (641)
17308 CITY OF ROCKWELL 5,041 0.013507% (4,116) 26,126 (29,441)
18201 CHEROKEE COUNTY 23,728 0.063575% (19,372) 122,967 (138,569)
18302 CITY OF CHEROKEE 55,463 0.148602% (45,282) 287,427 (323,897)
18306 CITY OF MARCUS 3,789 0.010152% (3,094) 19,637 (22,129)
18309 CITY OF AURELIA 5,243 0.014047% (4,280) 27,170 (30,617)
19201 CHICKASAW COUNTY 37,671 0.100932% (30,756) 195,222 (219,993)
19303 CITY OF NASHUA 7,264 0.019463% (5,931) 37,645 (42,421)
19304 CITY OF NEW HAMPTON 32,941 0.088258% (26,894) 170,709 (192,370)
20201 CLARKE COUNTY 53,313 0.142840% (43,526) 276,283 (311,338)
20204 CLARKE COUNTY HOSPITAL 47,063 0.126095% (38,424) 243,895 (274,841)
20301 CITY OF OSCEOLA 67,299 0.180313% (54,945) 348,762 (393,014)
21201 CLAY COUNTY 61,408 0.164530% (50,136) 318,235 (358,614)
21301 CITY OF EVERLY 140 0.000376% (115) 728 (820)
21302 SPENCER HOSPITAL 45,976 0.123183% (37,536) 238,262 (268,493)
21303 CITY OF SPENCER 2,188 0.005863% (1,787) 11,341 (12,780)
22201 CLAYTON COUNTY 74,586 0.199837% (60,894) 386,525 (435,569)
22302 CITY OF GUTTENBERG 20,485 0.054885% (16,725) 106,160 (119,629)
22303 CITY OF STRAWBERRY POINT 14,024 0.037575% (11,450) 72,677 (81,899)
22306 CITY OF ELKADER 12,153 0.032561% (9,922) 62,979 (70,970)
See notes to Schedules.___________________________________________________________________________________________________
134

____________________________________________________________________________________________________Schedule 3
Differences Between Expected
and Actual Experience
Changes of Assumptions
Difference Between
Projected and Actual
Investment Earnings on Pension Plan Investments
Total Deferred
Outflows of Resources
Differences Between Expected
and Actual Experience
Changes of Assumptions
Difference Between
Projected and Actual
Investment Earnings on Pension Plan Investments
Total Deferred Inflows of Resources
Total Proportionate
Share of Allocable Plan
Pension Expense
DEFERRED INFLOWS OF RESOURCESDEFERRED OUTFLOWS OF RESOURCES
(Excluding Employer Specific Amounts)* (Excluding Employer Specific Amounts) *
164 1,727 1,001 2,892 79 68 3,511 3,658 2,904
1,250 13,164 7,629 22,043 602 520 26,762 27,884 22,131
811 8,542 4,950 14,303 391 337 17,366 18,094 14,361
1,561 16,437 9,525 27,523 752 649 33,416 34,817 27,633
5,692 59,942 34,737 100,371 2,742 2,368 121,863 126,973 100,775
4 41 24 69 2 2 83 87 69
4,947 52,089 30,187 87,223 2,383 2,057 105,898 110,338 87,573
2 17 10 29 1 1 35 37 29
3,221 33,921 19,658 56,800 1,552 1,340 68,963 71,855 57,029
1,786 18,804 10,897 31,487 860 743 38,229 39,832 31,614
1,211 12,750 7,389 21,350 583 504 25,921 27,008 21,436
371 3,909 2,265 6,545 179 154 7,947 8,280 6,572
557 5,866 3,400 9,823 268 232 11,926 12,426 9,862
9,329 98,234 56,929 164,492 4,494 3,880 199,712 208,086 165,153
9,561 100,681 58,347 168,589 4,606 3,977 204,687 213,270 169,267
7 73 42 122 3 3 149 155 123
320 3,366 1,951 5,637 154 133 6,844 7,131 5,659
1,505 15,844 9,182 26,531 725 626 32,211 33,562 26,637
3,517 37,034 21,462 62,013 1,694 1,463 75,291 78,448 62,263
240 2,530 1,466 4,236 116 100 5,144 5,360 4,254
332 3,501 2,029 5,862 160 138 7,117 7,415 5,886
2,389 25,154 14,577 42,120 1,151 994 51,138 53,283 42,289
461 4,850 2,811 8,122 222 192 9,861 10,275 8,155
2,089 21,996 12,747 36,832 1,006 869 44,717 46,592 36,979
3,381 35,598 20,630 59,609 1,629 1,406 72,372 75,407 59,849
2,984 31,425 18,212 52,621 1,438 1,241 63,888 66,567 52,833
4,267 44,937 26,042 75,246 2,056 1,775 91,358 95,189 75,549
3,894 41,004 23,763 68,661 1,876 1,620 83,362 86,858 68,936
9 94 54 157 4 4 191 199 158
2,915 30,699 17,791 51,405 1,405 1,213 62,413 65,031 51,612
139 1,461 847 2,447 67 58 2,971 3,096 2,457
4,730 49,803 28,862 83,395 2,278 1,967 101,250 105,495 83,729
1,299 13,678 7,927 22,904 626 540 27,808 28,974 22,996
889 9,364 5,427 15,680 428 370 19,038 19,836 15,743
771 8,115 4,703 13,589 371 321 16,497 17,189 13,643
___________________________________________________________________________________________________135 (Continued)

____________________________________________________________________________________________________
Employer ID # Employer Name
2019 Actual Employer
Contributions
Employer Allocation
Percentage **
Net Pension Liability
(NPL)/(Asset)
Change in NPL due to 1%
Decrease in the Actuarial Assumed
Investment Return (6.00 %)
Change in NPL due to 1%
Increase in the Actuarial Assumed
Investment Return (8.00%)
Iowa Public Employees' Retirement System
Schedule of Employer Allocations and Collective Pension Amounts Allocated by Employer -Protection Occupation Membership Group
As of and for the year ended June 30, 2019
22308 CITY OF MONONA 9,316 0.024960% (7,606) 48,279 (54,404)
22311 CITY OF GARNAVILLO 2,356 0.006312% (1,923) 12,209 (13,758)
22324 GUTTENBERG MUNIC HOSP 16,113 0.043172% (13,155) 83,504 (94,099)
23201 CLINTON COUNTY 84,498 0.226394% (68,987) 437,893 (493,454)
23316 CITY OF CAMANCHE - 0.000000% - - -
24201 CRAWFORD COUNTY 28,263 0.075726% (23,075) 146,469 (165,053)
24204 CRAWFORD COUNTY MEMORIAL HOSPITAL 54,813 0.146861% (44,751) 284,059 (320,101)
24301 CITY OF DENISON 83,873 0.224721% (68,477) 434,657 (489,808)
24303 CITY OF MANILLA 2,690 0.007208% (2,196) 13,942 (15,711)
25201 DALLAS COUNTY 205,731 0.551212% (167,966) 1,066,159 (1,201,436)
25301 CITY OF WOODWARD 5,966 0.015983% (4,870) 30,915 (34,838)
25303 CITY OF MINBURN 159 0.000426% (130) 824 (928)
25305 CITY OF VAN METER 10,761 0.028831% (8,785) 55,764 (62,840)
25306 CITY OF DALLAS CENTER 189 0.000506% (154) 979 (1,103)
25308 CITY OF PERRY 74,802 0.200415% (61,071) 387,644 (436,830)
25312 CITY OF ADEL 48,751 0.130618% (39,802) 252,643 (284,699)
25314 CITY OF GRANGER 12,319 0.033006% (10,058) 63,840 (71,940)
25315 CITY OF WAUKEE 301,110 0.806759% (245,836) 1,560,440 (1,758,433)
25318 CITY OF DE SOTO 7,145 0.019145% (5,834) 37,030 (41,728)
26201 DAVIS COUNTY 30,187 0.080881% (24,646) 156,440 (176,289)
26203 DAVIS COUNTY HOSPITAL 43,993 0.117870% (35,917) 227,985 (256,912)
26301 CITY OF BLOOMFIELD 31,733 0.085022% (25,908) 164,450 (185,316)
27201 DECATUR COUNTY 52,306 0.140143% (42,705) 271,066 (305,460)
27204 DECATUR COUNTY HOSPITAL 46,871 0.125581% (38,267) 242,899 (273,719)
27301 CITY OF LAMONI 17,805 0.047705% (14,537) 92,271 (103,979)
27302 CITY OF LEON 9,466 0.025363% (7,729) 49,058 (55,283)
28201 DELAWARE COUNTY 23,756 0.063648% (19,395) 123,108 (138,729)
28204 REGIONAL MEDICAL CENTER 55,772 0.149429% (45,534) 289,027 (325,699)
28301 CITY OF EDGEWOOD 2,107 0.005646% (1,721) 10,921 (12,307)
28304 CITY OF MANCHESTER 62,214 0.166690% (50,794) 322,414 (363,323)
28312 CITY OF GREELEY 153 0.000410% (125) 794 (894)
29201 DES MOINES COUNTY 129,606 0.347252% (105,815) 671,657 (756,878)
29305 CITY OF WEST BURLINGTON 60,994 0.163421% (49,798) 316,091 (356,198)
30201 DICKINSON COUNTY 65,018 0.174202% (53,083) 336,943 (379,695)
30204 LAKES REGIONAL HEALTHCARE 65,050 0.174287% (53,109) 337,107 (379,880)
See notes to Schedules.___________________________________________________________________________________________________
136

____________________________________________________________________________________________________Schedule 3
Differences Between Expected
and Actual Experience
Changes of Assumptions
Difference Between
Projected and Actual
Investment Earnings on Pension Plan Investments
Total Deferred
Outflows of Resources
Differences Between Expected
and Actual Experience
Changes of Assumptions
Difference Between
Projected and Actual
Investment Earnings on Pension Plan Investments
Total Deferred Inflows of Resources
Total Proportionate
Share of Allocable Plan
Pension Expense
DEFERRED INFLOWS OF RESOURCESDEFERRED OUTFLOWS OF RESOURCES
(Excluding Employer Specific Amounts)* (Excluding Employer Specific Amounts) *
591 6,221 3,605 10,417 285 246 12,647 13,178 10,458
149 1,573 912 2,634 72 62 3,198 3,332 2,645
1,022 10,759 6,235 18,016 492 425 21,874 22,791 18,089
5,358 56,422 32,697 94,477 2,581 2,229 114,706 119,516 94,857
- - - - - - - - -
1,792 18,872 10,937 31,601 863 745 38,367 39,975 31,728
3,476 36,600 21,211 61,287 1,674 1,446 74,409 77,529 61,533
5,318 56,005 32,456 93,779 2,562 2,212 113,858 118,632 94,156
171 1,796 1,041 3,008 82 71 3,652 3,805 3,020
13,045 137,372 79,610 230,027 6,285 5,426 279,280 290,991 230,952
378 3,983 2,308 6,669 182 157 8,098 8,437 6,697
10 106 62 178 5 4 216 225 178
682 7,185 4,164 12,031 329 284 14,607 15,220 12,080
12 126 73 211 6 5 256 267 212
4,743 49,947 28,945 83,635 2,285 1,973 101,543 105,801 83,972
3,091 32,553 18,865 54,509 1,489 1,286 66,180 68,955 54,728
781 8,226 4,767 13,774 376 325 16,723 17,424 13,829
19,093 201,059 116,518 336,670 9,199 7,941 408,757 425,897 338,023
453 4,771 2,765 7,989 218 188 9,700 10,106 8,021
1,914 20,157 11,681 33,752 922 796 40,979 42,697 33,888
2,790 29,375 17,024 49,189 1,344 1,160 59,721 62,225 49,386
2,012 21,189 12,279 35,480 969 837 43,078 44,884 35,623
3,317 34,926 20,240 58,483 1,598 1,380 71,006 73,984 58,719
2,972 31,297 18,137 52,406 1,432 1,236 63,627 66,295 52,617
1,129 11,889 6,890 19,908 544 470 24,170 25,184 19,988
600 6,321 3,663 10,584 289 250 12,851 13,390 10,627
1,506 15,862 9,192 26,560 726 627 32,248 33,601 26,668
3,537 37,240 21,582 62,359 1,704 1,471 75,710 78,885 62,609
134 1,407 816 2,357 64 56 2,861 2,981 2,366
3,945 41,542 24,075 69,562 1,901 1,641 84,456 87,998 69,841
10 102 59 171 5 4 208 217 172
8,218 86,541 50,153 144,912 3,959 3,418 175,940 183,317 145,495
3,868 40,728 23,602 68,198 1,863 1,609 82,800 86,272 68,472
4,123 43,414 25,159 72,696 1,986 1,715 88,262 91,963 72,989
4,125 43,435 25,172 72,732 1,987 1,716 88,305 92,008 73,024
___________________________________________________________________________________________________137 (Continued)

____________________________________________________________________________________________________
Employer ID # Employer Name
2019 Actual Employer
Contributions
Employer Allocation
Percentage **
Net Pension Liability
(NPL)/(Asset)
Change in NPL due to 1%
Decrease in the Actuarial Assumed
Investment Return (6.00 %)
Change in NPL due to 1%
Increase in the Actuarial Assumed
Investment Return (8.00%)
Iowa Public Employees' Retirement System
Schedule of Employer Allocations and Collective Pension Amounts Allocated by Employer -Protection Occupation Membership Group
As of and for the year ended June 30, 2019
30301 CITY OF SPIRIT LAKE 67,997 0.182185% (55,515) 352,383 (397,094)
30302 CITY OF ARNOLDS PARK 36,130 0.096803% (29,498) 187,237 (210,995)
30305 CITY OF LAKE PARK 13,179 0.035312% (10,760) 68,300 (76,966)
30306 CITY OF OKOBOJI 25,657 0.068742% (20,947) 132,962 (149,833)
30307 CITY OF MILFORD 35,091 0.094018% (28,649) 181,850 (204,924)
31201 DUBUQUE COUNTY 50,385 0.134996% (41,136) 261,111 (294,242)
31301 CITY OF CASCADE 12,058 0.032308% (9,845) 62,490 (70,419)
31303 CITY OF FARLEY 5,782 0.015490% (4,720) 29,962 (33,763)
31306 CITY OF DYERSVILLE 37,579 0.100686% (30,681) 194,748 (219,458)
31307 CITY OF EPWORTH 6,278 0.016822% (5,126) 32,536 (36,665)
31308 CITY OF NEW VIENNA 805 0.002156% (657) 4,169 (4,698)
31311 CITY OF PEOSTA 16,499 0.044205% (13,470) 85,501 (96,350)
31319 CITY OF ASBURY 29,083 0.077922% (23,745) 150,718 (169,841)
32201 EMMET COUNTY 40,210 0.107735% (32,829) 208,383 (234,823)
32301 CITY OF ARMSTRONG 6,827 0.018293% (5,574) 35,382 (39,871)
32303 CITY OF ESTHERVILLE 1,846 0.004947% (1,507) 9,568 (10,782)
33201 FAYETTE COUNTY 69,566 0.186388% (56,796) 360,513 (406,256)
33302 CITY OF WEST UNION 20,832 0.055814% (17,008) 107,955 (121,653)
33305 CITY OF FAYETTE 17,606 0.047172% (14,374) 91,241 (102,818)
34201 FLOYD COUNTY 25,805 0.069140% (21,068) 133,732 (150,700)
34302 CITY OF CHARLES CITY 620 0.001662% (506) 3,215 (3,623)
34305 CITY OF NORA SPRINGS 9,180 0.024595% (7,495) 47,572 (53,608)
35201 FRANKLIN COUNTY 22,357 0.059900% (18,253) 115,859 (130,559)
35205 FRANKLIN GEN HOSP 26,906 0.072088% (21,967) 139,433 (157,125)
35301 CITY OF HAMPTON 39,313 0.105330% (32,096) 203,730 (229,579)
35309 CITY OF SHEFFIELD 6,632 0.017769% (5,415) 34,369 (38,730)
35311 CITY OF HANSELL 198 0.000531% (162) 1,027 (1,157)
36201 FREMONT COUNTY 66,468 0.178087% (54,267) 344,457 (388,162)
36306 CITY OF TABOR 4,942 0.013240% (4,035) 25,609 (28,859)
37201 GREENE COUNTY 49,124 0.131618% (40,107) 254,576 (286,877)
37303 CITY OF JEFFERSON 42,666 0.114315% (34,834) 221,109 (249,164)
38201 GRUNDY COUNTY 29,600 0.079306% (24,166) 153,395 (172,858)
38303 CITY OF GRUNDY CENTER 41,421 0.110980% (33,818) 214,658 (241,895)
39201 GUTHRIE COUNTY 32,792 0.087859% (26,772) 169,937 (191,499)
39301 CITY OF PANORA 43,787 0.117317% (35,749) 226,916 (255,708)
See notes to Schedules.___________________________________________________________________________________________________
138

____________________________________________________________________________________________________Schedule 3
Differences Between Expected
and Actual Experience
Changes of Assumptions
Difference Between
Projected and Actual
Investment Earnings on Pension Plan Investments
Total Deferred
Outflows of Resources
Differences Between Expected
and Actual Experience
Changes of Assumptions
Difference Between
Projected and Actual
Investment Earnings on Pension Plan Investments
Total Deferred Inflows of Resources
Total Proportionate
Share of Allocable Plan
Pension Expense
DEFERRED INFLOWS OF RESOURCESDEFERRED OUTFLOWS OF RESOURCES
(Excluding Employer Specific Amounts)* (Excluding Employer Specific Amounts) *
4,312 45,404 26,312 76,028 2,077 1,793 92,307 96,177 76,333
2,291 24,125 13,981 40,397 1,104 953 49,047 51,104 40,559
836 8,800 5,100 14,736 403 348 17,891 18,642 14,795
1,627 17,132 9,928 28,687 784 677 34,829 36,290 28,802
2,225 23,431 13,579 39,235 1,072 925 47,636 49,633 39,392
3,195 33,644 19,497 56,336 1,539 1,329 68,398 71,266 56,562
765 8,052 4,666 13,483 368 318 16,369 17,055 13,537
367 3,860 2,237 6,464 177 152 7,848 8,177 6,490
2,383 25,093 14,542 42,018 1,148 991 51,014 53,153 42,186
398 4,192 2,429 7,019 192 166 8,523 8,881 7,048
51 537 311 899 25 21 1,092 1,138 903
1,046 11,017 6,384 18,447 504 435 22,397 23,336 18,521
1,844 19,420 11,254 32,518 888 767 39,480 41,135 32,649
2,550 26,850 15,560 44,960 1,228 1,061 54,586 56,875 45,140
433 4,559 2,642 7,634 209 180 9,268 9,657 7,664
117 1,233 714 2,064 56 49 2,506 2,611 2,073
4,411 46,451 26,919 77,781 2,125 1,835 94,436 98,396 78,095
1,321 13,910 8,061 23,292 636 549 28,279 29,464 23,385
1,116 11,756 6,813 19,685 538 464 23,901 24,903 19,765
1,636 17,231 9,986 28,853 788 681 35,031 36,500 28,969
39 414 240 693 19 16 842 877 696
582 6,129 3,552 10,263 280 242 12,461 12,983 10,305
1,418 14,928 8,651 24,997 683 590 30,349 31,622 25,097
1,706 17,966 10,411 30,083 822 710 36,524 38,056 30,204
2,493 26,250 15,212 43,955 1,201 1,037 53,367 55,605 44,132
421 4,428 2,566 7,415 203 175 9,003 9,381 7,445
13 132 77 222 6 5 269 280 222
4,215 44,382 25,721 74,318 2,031 1,753 90,230 94,014 74,616
313 3,300 1,912 5,525 151 130 6,708 6,989 5,547
3,115 32,802 19,009 54,926 1,501 1,296 66,686 69,483 55,146
2,705 28,489 16,510 47,704 1,303 1,125 57,919 60,347 47,897
1,877 19,765 11,454 33,096 904 781 40,182 41,867 33,228
2,627 27,658 16,028 46,313 1,265 1,092 56,230 58,587 46,499
2,079 21,896 12,689 36,664 1,002 865 44,515 46,382 36,812
2,777 29,238 16,944 48,959 1,338 1,155 59,441 61,934 49,155
___________________________________________________________________________________________________139 (Continued)

____________________________________________________________________________________________________
Employer ID # Employer Name
2019 Actual Employer
Contributions
Employer Allocation
Percentage **
Net Pension Liability
(NPL)/(Asset)
Change in NPL due to 1%
Decrease in the Actuarial Assumed
Investment Return (6.00 %)
Change in NPL due to 1%
Increase in the Actuarial Assumed
Investment Return (8.00%)
Iowa Public Employees' Retirement System
Schedule of Employer Allocations and Collective Pension Amounts Allocated by Employer -Protection Occupation Membership Group
As of and for the year ended June 30, 2019
39303 CITY OF STUART 37,900 0.101546% (30,943) 196,411 (221,332)
40201 HAMILTON COUNTY 105,951 0.283872% (86,502) 549,067 (618,735)
40202 HAMILTON HOSPITAL 50,685 0.135799% (41,381) 262,664 (295,991)
40302 CITY OF WEBSTER CITY 2,056 0.005509% (1,679) 10,656 (12,008)
40303 CITY OF STRATFORD 555 0.001488% (453) 2,878 (3,244)
40304 CITY OF JEWELL 11,779 0.031560% (9,617) 61,044 (68,789)
40307 CITY OF BLAIRSBURG 158 0.000423% (129) 819 (923)
40308 CITY OF WILLIAMS 187 0.000501% (153) 968 (1,091)
41201 HANCOCK COUNTY 40,173 0.107636% (32,799) 208,191 (234,607)
41302 CITY OF BRITT 21,093 0.056515% (17,221) 109,313 (123,182)
41303 CITY OF GARNER 30,367 0.081361% (24,792) 157,369 (177,336)
41305 CITY OF KANAWHA 6,841 0.018328% (5,585) 35,450 (39,948)
42201 HARDIN COUNTY 83,673 0.224184% (68,313) 433,617 (488,636)
42302 CITY OF ACKLEY 18,708 0.050125% (15,274) 96,951 (109,253)
42303 CITY OF ELDORA 58,001 0.155403% (47,354) 300,581 (338,719)
42304 CITY OF IOWA FALLS 58,313 0.156237% (47,609) 302,195 (340,538)
42315 CITY OF HUBBARD 201 0.000539% (164) 1,042 (1,174)
43201 HARRISON COUNTY 50,390 0.135008% (41,140) 261,133 (294,267)
43301 CITY OF MISSOURI VALLEY 31,561 0.084560% (25,767) 163,556 (184,309)
43303 CITY OF WOODBINE 15,046 0.040312% (12,284) 77,972 (87,866)
43305 CITY OF DUNLAP 9,787 0.026221% (7,990) 50,718 (57,153)
43306 CITY OF LOGAN 13,945 0.037364% (11,386) 72,269 (81,439)
44201 HENRY COUNTY 61,789 0.165550% (50,446) 320,207 (360,836)
44204 HENRY COUNTY HEALTH CENTER 81,378 0.218034% (66,439) 421,722 (475,232)
44301 CITY OF MOUNT PLEASANT 88,231 0.236397% (72,035) 457,241 (515,257)
44302 CITY OF WINFIELD 4,021 0.010774% (3,283) 20,840 (23,484)
44303 CITY OF NEW LONDON 20,120 0.053907% (16,427) 104,268 (117,498)
44306 CITY OF WAYLAND 5,391 0.014445% (4,402) 27,940 (31,485)
45201 HOWARD COUNTY 37,277 0.099876% (30,434) 193,181 (217,692)
45205 REGIONAL HEALTH SERVICES OF HOWARD CO 31,389 0.084100% (25,627) 162,667 (183,307)
45302 CITY OF CRESCO 39,853 0.106776% (32,537) 206,528 (232,733)
46201 HUMBOLDT COUNTY 21,501 0.057607% (17,554) 111,423 (125,561)
46205 HUMBOLDT COUNTY MEMORIAL HOSPITAL 11,317 0.030323% (9,240) 58,650 (66,092)
46301 CITY OF RENWICK 408 0.001094% (333) 2,116 (2,385)
46302 CITY OF HUMBOLDT 35,382 0.094798% (28,887) 183,359 (206,624)
See notes to Schedules.___________________________________________________________________________________________________
140

____________________________________________________________________________________________________Schedule 3
Differences Between Expected
and Actual Experience
Changes of Assumptions
Difference Between
Projected and Actual
Investment Earnings on Pension Plan Investments
Total Deferred
Outflows of Resources
Differences Between Expected
and Actual Experience
Changes of Assumptions
Difference Between
Projected and Actual
Investment Earnings on Pension Plan Investments
Total Deferred Inflows of Resources
Total Proportionate
Share of Allocable Plan
Pension Expense
DEFERRED INFLOWS OF RESOURCESDEFERRED OUTFLOWS OF RESOURCES
(Excluding Employer Specific Amounts)* (Excluding Employer Specific Amounts) *
2,403 25,307 14,666 42,376 1,158 1,000 51,450 53,608 42,547
6,718 70,746 40,999 118,463 3,237 2,794 143,828 149,859 118,939
3,214 33,844 19,613 56,671 1,548 1,337 68,805 71,690 56,898
130 1,373 796 2,299 63 54 2,791 2,908 2,308
35 371 215 621 17 15 754 786 624
747 7,865 4,558 13,170 360 311 15,990 16,661 13,223
10 106 61 177 5 4 215 224 177
12 125 72 209 6 5 254 265 210
2,547 26,825 15,546 44,918 1,227 1,060 54,536 56,823 45,098
1,338 14,085 8,162 23,585 644 556 28,634 29,834 23,679
1,926 20,277 11,751 33,954 928 801 41,223 42,952 34,089
434 4,568 2,647 7,649 209 180 9,286 9,675 7,679
5,306 55,871 32,378 93,555 2,556 2,207 113,586 118,349 93,930
1,186 12,492 7,239 20,917 572 493 25,396 26,461 21,002
3,678 38,729 22,444 64,851 1,772 1,530 78,737 82,039 65,112
3,698 38,937 22,565 65,200 1,781 1,538 79,160 82,479 65,462
13 134 78 225 6 5 273 284 226
3,195 33,646 19,499 56,340 1,539 1,329 68,404 71,272 56,567
2,001 21,074 12,213 35,288 964 832 42,844 44,640 35,430
954 10,047 5,822 16,823 460 397 20,425 21,282 16,890
621 6,535 3,787 10,943 299 258 13,285 13,842 10,986
884 9,312 5,396 15,592 426 368 18,931 19,725 15,655
3,918 41,258 23,910 69,086 1,888 1,630 83,878 87,396 69,363
5,160 54,338 31,490 90,988 2,486 2,146 110,470 115,102 91,354
5,595 58,914 34,142 98,651 2,695 2,327 119,774 124,796 99,048
255 2,685 1,556 4,496 123 106 5,459 5,688 4,514
1,276 13,435 7,786 22,497 615 531 27,313 28,459 22,587
342 3,600 2,086 6,028 165 142 7,319 7,626 6,052
2,364 24,891 14,425 41,680 1,139 983 50,604 52,726 41,847
1,990 20,959 12,146 35,095 959 828 42,611 44,398 35,237
2,527 26,611 15,421 44,559 1,217 1,051 54,100 56,368 44,738
1,363 14,357 8,320 24,040 657 567 29,187 30,411 24,137
718 7,557 4,379 12,654 346 298 15,363 16,007 12,705
26 273 158 457 12 11 554 577 458
2,244 23,625 13,691 39,560 1,081 933 48,031 50,045 39,719
___________________________________________________________________________________________________141 (Continued)

____________________________________________________________________________________________________
Employer ID # Employer Name
2019 Actual Employer
Contributions
Employer Allocation
Percentage **
Net Pension Liability
(NPL)/(Asset)
Change in NPL due to 1%
Decrease in the Actuarial Assumed
Investment Return (6.00 %)
Change in NPL due to 1%
Increase in the Actuarial Assumed
Investment Return (8.00%)
Iowa Public Employees' Retirement System
Schedule of Employer Allocations and Collective Pension Amounts Allocated by Employer -Protection Occupation Membership Group
As of and for the year ended June 30, 2019
47201 IDA COUNTY 27,857 0.074638% (22,744) 144,365 (162,683)
48201 IOWA COUNTY 121,412 0.325297% (99,125) 629,191 (709,025)
48303 CITY OF WILLIAMSBURG 43,294 0.115997% (35,347) 224,361 (252,829)
48305 CITY OF MARENGO 25,981 0.069610% (21,212) 134,641 (151,724)
49201 JACKSON COUNTY 46,314 0.124090% (37,813) 240,015 (270,469)
49202 JACKSON COUNTY REGIONAL HEALTH CENTER 62,439 0.167291% (50,977) 323,576 (364,633)
49301 CITY OF MAQUOKETA 2,377 0.006370% (1,941) 12,320 (13,884)
49303 CITY OF PRESTON 9,227 0.024722% (7,533) 47,818 (53,886)
49304 CITY OF BELLEVUE 28,959 0.077589% (23,643) 150,074 (169,116)
49321 SABULA POLICE DEPT 3,608 0.009668% (2,946) 18,700 (21,072)
49325 ANDREW POLICE DEPT. 429 0.001149% (350) 2,222 (2,504)
50201 JASPER COUNTY 115,801 0.310265% (94,544) 600,118 (676,262)
50301 CITY OF COLFAX 26,154 0.070073% (21,353) 135,535 (152,732)
50303 CITY OF NEWTON 6,900 0.018487% (5,633) 35,758 (40,296)
50307 CITY OF MONROE 19,131 0.051258% (15,619) 99,143 (111,722)
50310 CITY OF PRAIRIE CITY 20,227 0.054195% (16,514) 104,823 (118,124)
50312 CITY OF BAXTER 4,302 0.011527% (3,512) 22,295 (25,124)
51002 8TH JUDICIAL DIST DEPT CORR SERVICES 20,361 0.054554% (16,624) 105,518 (118,907)
51201 JEFFERSON COUNTY 86,566 0.231935% (70,675) 448,611 (505,532)
51301 CITY OF FAIRFIELD 11,632 0.031167% (9,497) 60,283 (67,932)
52003 UNIVERSITY OF IOWA 72,926 0.195391% (59,540) 377,926 (425,879)
52201 JOHNSON COUNTY 345,231 0.924973% (281,858) 1,789,090 (2,016,095)
52303 CITY OF CORALVILLE 300,497 0.805118% (245,336) 1,557,265 (1,754,855)
52310 CITY OF HILLS 245 0.000657% (200) 1,270 (1,431)
52315 CITY OF NORTH LIBERTY 179,526 0.481002% (146,571) 930,357 (1,048,403)
52319 UNIVERSITY HEIGHTS POLICE DEPT 25,714 0.068895% (20,994) 133,256 (150,164)
53201 JONES COUNTY 39,866 0.106813% (32,548) 206,599 (232,813)
53304 CITY OF ANAMOSA 43,904 0.117632% (35,845) 227,524 (256,393)
53305 CITY OF MONTICELLO 76,798 0.205764% (62,700) 397,990 (448,488)
54201 KEOKUK COUNTY 38,450 0.103019% (31,392) 199,260 (224,543)
54205 KEOKUK COUNTY HEALTH CENTER 68,023 0.182252% (55,536) 352,513 (397,241)
54301 CITY OF SIGOURNEY 16,919 0.045331% (13,813) 87,679 (98,804)
54304 CITY OF KEOTA 5,380 0.014414% (4,392) 27,879 (31,417)
54307 CITY OF RICHLAND 1,268 0.003398% (1,036) 6,573 (7,407)
55201 KOSSUTH COUNTY 52,484 0.140620% (42,850) 271,987 (306,498)
See notes to Schedules.___________________________________________________________________________________________________
142

____________________________________________________________________________________________________Schedule 3
Differences Between Expected
and Actual Experience
Changes of Assumptions
Difference Between
Projected and Actual
Investment Earnings on Pension Plan Investments
Total Deferred
Outflows of Resources
Differences Between Expected
and Actual Experience
Changes of Assumptions
Difference Between
Projected and Actual
Investment Earnings on Pension Plan Investments
Total Deferred Inflows of Resources
Total Proportionate
Share of Allocable Plan
Pension Expense
DEFERRED INFLOWS OF RESOURCESDEFERRED OUTFLOWS OF RESOURCES
(Excluding Employer Specific Amounts)* (Excluding Employer Specific Amounts) *
1,766 18,601 10,780 31,147 851 735 37,816 39,402 31,272
7,699 81,070 46,982 135,751 3,709 3,202 164,816 171,727 136,296
2,745 28,908 16,753 48,406 1,323 1,142 58,771 61,236 48,601
1,647 17,348 10,054 29,049 794 685 35,269 36,748 29,166
2,937 30,925 17,922 51,784 1,415 1,221 62,872 65,508 51,992
3,959 41,692 24,161 69,812 1,907 1,647 84,761 88,315 70,093
151 1,587 920 2,658 73 63 3,227 3,363 2,669
585 6,161 3,571 10,317 282 243 12,526 13,051 10,358
1,836 19,337 11,206 32,379 885 764 39,312 40,961 32,509
229 2,409 1,396 4,034 110 95 4,898 5,103 4,051
27 286 166 479 13 11 582 606 481
7,343 77,324 44,811 129,478 3,538 3,054 157,201 163,793 129,998
1,658 17,463 10,120 29,241 799 690 35,503 36,992 29,360
438 4,607 2,670 7,715 211 182 9,367 9,760 7,746
1,213 12,774 7,403 21,390 584 505 25,970 27,059 21,476
1,283 13,506 7,827 22,616 618 533 27,458 28,609 22,707
273 2,873 1,665 4,811 131 113 5,840 6,084 4,830
1,291 13,596 7,879 22,766 622 537 27,640 28,799 22,857
5,489 57,803 33,498 96,790 2,644 2,283 117,513 122,440 97,178
738 7,767 4,501 13,006 355 307 15,791 16,453 13,058
4,624 48,695 28,220 81,539 2,228 1,923 98,998 103,149 81,867
21,891 230,520 133,591 386,002 10,546 9,105 468,651 488,302 387,554
19,055 200,650 116,281 335,986 9,180 7,925 407,925 425,030 337,336
16 164 95 275 7 6 333 346 275
11,384 119,874 69,470 200,728 5,484 4,735 243,707 253,926 201,534
1,631 17,170 9,950 28,751 786 678 34,906 36,370 28,866
2,528 26,620 15,427 44,575 1,218 1,051 54,118 56,387 44,754
2,784 29,316 16,989 49,089 1,341 1,158 59,600 62,099 49,286
4,870 51,280 29,718 85,868 2,346 2,025 104,253 108,624 86,213
2,438 25,674 14,879 42,991 1,175 1,014 52,196 54,385 43,164
4,313 45,421 26,322 76,056 2,078 1,794 92,341 96,213 76,362
1,073 11,297 6,547 18,917 517 446 22,967 23,930 18,993
341 3,592 2,082 6,015 164 142 7,303 7,609 6,039
80 847 491 1,418 39 33 1,722 1,794 1,424
3,328 35,045 20,309 58,682 1,603 1,384 71,247 74,234 58,918
___________________________________________________________________________________________________143 (Continued)

____________________________________________________________________________________________________
Employer ID # Employer Name
2019 Actual Employer
Contributions
Employer Allocation
Percentage **
Net Pension Liability
(NPL)/(Asset)
Change in NPL due to 1%
Decrease in the Actuarial Assumed
Investment Return (6.00 %)
Change in NPL due to 1%
Increase in the Actuarial Assumed
Investment Return (8.00%)
Iowa Public Employees' Retirement System
Schedule of Employer Allocations and Collective Pension Amounts Allocated by Employer -Protection Occupation Membership Group
As of and for the year ended June 30, 2019
55301 CITY OF ALGONA 91,912 0.246259% (75,040) 476,316 (536,753)
55305 CITY OF SWEA CITY 4 0.000011% (3) 21 (24)
55306 CITY OF BANCROFT 7,755 0.020777% (6,331) 40,187 (45,286)
55309 CITY OF BURT 151 0.000404% (123) 781 (880)
55314 CITY OF TITONKA 2 0.000005% (2) 11 (12)
56201 LEE COUNTY 94,699 0.253727% (77,316) 490,761 (553,030)
56304 CITY OF WEST POINT 6,824 0.018284% (5,572) 35,365 (39,853)
56310 CITY OF MONTROSE 3,802 0.010187% (3,104) 19,704 (22,204)
57004 6TH JUDICIAL DIST DEPT CORR SERVICES 100,846 0.270196% (82,334) 522,616 (588,927)
57202 LINN COUNTY 98,442 0.263755% (80,372) 510,157 (574,887)
57301 CITY OF CEDAR RAPIDS 94,570 0.253380% (77,210) 490,089 (552,273)
57304 CITY OF LISBON 16,673 0.044673% (13,613) 86,407 (97,370)
57305 CITY OF MOUNT VERNON 42,184 0.113024% (34,441) 218,612 (246,350)
57308 CITY OF MARION 408 0.001093% (333) 2,114 (2,382)
57317 CITY OF ROBINS 9,426 0.025254% (7,695) 48,846 (55,044)
57319 CITY OF HIAWATHA 148,953 0.399088% (121,610) 771,920 (869,863)
57323 CITY OF FAIRFAX 251 0.000673% (205) 1,302 (1,467)
58201 LOUISA COUNTY 56,017 0.150085% (45,734) 290,296 (327,129)
58301 CITY OF WAPELLO 26,941 0.072183% (21,996) 139,617 (157,332)
58316 COLUMBUS JUNCTION POLICE DEPT 19,528 0.052321% (15,943) 101,200 (114,041)
59201 LUCAS COUNTY 25,609 0.068613% (20,908) 132,712 (149,551)
59204 LUCAS COUNTY HEALTH CENTER 83,927 0.224864% (68,521) 434,934 (490,120)
59301 CITY OF RUSSELL 301 0.000807% (246) 1,561 (1,759)
59311 CHARITON POLICE DEPT 32,318 0.086589% (26,385) 167,481 (188,731)
60201 LYON COUNTY 76,040 0.203732% (62,081) 394,060 (444,060)
61201 MADISON COUNTY 92,963 0.249074% (75,898) 481,762 (542,889)
61301 CITY OF WINTERSET 52,160 0.139750% (42,585) 270,306 (304,603)
61303 CITY OF EARLHAM 9,754 0.026134% (7,963) 50,548 (56,961)
62201 MAHASKA COUNTY 64,017 0.171519% (52,265) 331,754 (373,848)
62204 MAHASKA HEALTH PARTNERSHIP 63,538 0.170236% (51,874) 329,272 (371,051)
62301 CITY OF NEW SHARON 5,375 0.014401% (4,388) 27,855 (31,389)
62302 CITY OF OSKALOOSA 503 0.001348% (411) 2,607 (2,937)
63201 MARION COUNTY 89,905 0.240882% (73,402) 465,915 (525,032)
63301 CITY OF KNOXVILLE 44,183 0.118378% (36,072) 228,968 (258,020)
63306 CITY OF PLEASANTVILLE 13,922 0.037302% (11,367) 72,150 (81,304)
See notes to Schedules.___________________________________________________________________________________________________
144

____________________________________________________________________________________________________Schedule 3
Differences Between Expected
and Actual Experience
Changes of Assumptions
Difference Between
Projected and Actual
Investment Earnings on Pension Plan Investments
Total Deferred
Outflows of Resources
Differences Between Expected
and Actual Experience
Changes of Assumptions
Difference Between
Projected and Actual
Investment Earnings on Pension Plan Investments
Total Deferred Inflows of Resources
Total Proportionate
Share of Allocable Plan
Pension Expense
DEFERRED INFLOWS OF RESOURCESDEFERRED OUTFLOWS OF RESOURCES
(Excluding Employer Specific Amounts)* (Excluding Employer Specific Amounts) *
5,828 61,372 35,566 102,766 2,808 2,424 124,771 130,003 103,180
- 3 2 5 - - 6 6 5
492 5,178 3,001 8,671 237 205 10,527 10,969 8,705
10 101 58 169 5 4 205 214 169
- 1 1 2 - - 3 3 2
6,005 63,233 36,645 105,883 2,893 2,498 128,555 133,946 106,309
433 4,557 2,641 7,631 208 180 9,264 9,652 7,661
241 2,539 1,471 4,251 116 100 5,161 5,377 4,268
6,395 67,338 39,024 112,757 3,081 2,660 136,899 142,640 113,209
6,242 65,733 38,093 110,068 3,007 2,596 133,635 139,238 110,510
5,997 63,147 36,595 105,739 2,889 2,494 128,379 133,762 106,163
1,057 11,133 6,452 18,642 509 440 22,634 23,583 18,717
2,675 28,168 16,324 47,167 1,289 1,113 57,265 59,667 47,356
26 272 158 456 12 11 554 577 458
598 6,294 3,647 10,539 288 249 12,795 13,332 10,581
9,445 99,460 57,639 166,544 4,550 3,928 202,204 210,682 167,214
16 168 97 281 8 7 341 356 282
3,552 37,404 21,676 62,632 1,711 1,477 76,043 79,231 62,884
1,708 17,989 10,425 30,122 823 711 36,573 38,107 30,244
1,238 13,039 7,557 21,834 597 515 26,509 27,621 21,922
1,624 17,100 9,910 28,634 782 675 34,764 36,221 28,748
5,322 56,040 32,476 93,838 2,564 2,213 113,931 118,708 94,216
19 201 117 337 9 8 409 426 338
2,049 21,580 12,506 36,135 987 852 43,872 45,711 36,280
4,822 50,774 29,424 85,020 2,323 2,005 103,224 107,552 85,362
5,895 62,074 35,973 103,942 2,840 2,452 126,197 131,489 104,359
3,307 34,828 20,184 58,319 1,593 1,376 70,807 73,776 58,554
618 6,513 3,774 10,905 298 257 13,241 13,796 10,950
4,059 42,746 24,772 71,577 1,956 1,688 86,903 90,547 71,865
4,029 42,426 24,587 71,042 1,941 1,676 86,253 89,870 71,327
341 3,589 2,080 6,010 164 142 7,297 7,603 6,034
32 336 195 563 15 13 683 711 565
5,701 60,032 34,790 100,523 2,746 2,371 122,046 127,163 100,927
2,802 29,502 17,097 49,401 1,350 1,165 59,978 62,493 49,599
883 9,296 5,387 15,566 425 367 18,900 19,692 15,629
___________________________________________________________________________________________________145 (Continued)

____________________________________________________________________________________________________
Employer ID # Employer Name
2019 Actual Employer
Contributions
Employer Allocation
Percentage **
Net Pension Liability
(NPL)/(Asset)
Change in NPL due to 1%
Decrease in the Actuarial Assumed
Investment Return (6.00 %)
Change in NPL due to 1%
Increase in the Actuarial Assumed
Investment Return (8.00%)
Iowa Public Employees' Retirement System
Schedule of Employer Allocations and Collective Pension Amounts Allocated by Employer -Protection Occupation Membership Group
As of and for the year ended June 30, 2019
63321 CITY OF MELCHER-DALLAS 12,303 0.032963% (10,045) 63,758 (71,848)
64201 MARSHALL COUNTY 164,329 0.440285% (134,164) 851,603 (959,657)
64302 CITY OF STATE CENTER 10,038 0.026895% (8,196) 52,021 (58,622)
64306 CITY OF MELBOURNE 3,002 0.008043% (2,451) 15,556 (17,530)
65201 MILLS COUNTY 48,153 0.129016% (39,314) 249,543 (281,206)
65301 CITY OF GLENWOOD 55,665 0.149141% (45,446) 288,470 (325,072)
66201 MITCHELL COUNTY 30,708 0.082276% (25,071) 159,140 (179,332)
66203 MITCHELL COUNTY REGIONAL HEALTH CENTER 40,593 0.108761% (33,142) 210,367 (237,059)
66301 CITY OF OSAGE 35,689 0.095621% (29,138) 184,951 (208,418)
66307 CITY OF SAINT ANSGAR 5,790 0.015512% (4,727) 30,004 (33,811)
67201 MONONA COUNTY 45,401 0.121641% (37,067) 235,279 (265,132)
67301 CITY OF ONAWA 26,676 0.071472% (21,779) 138,241 (155,781)
67302 CITY OF MAPLETON 12,236 0.032785% (9,990) 63,412 (71,458)
67304 CITY OF WHITING 1,845 0.004944% (1,507) 9,563 (10,777)
67312 CITY OF BLENCOE 41 0.000111% (34) 215 (242)
68201 MONROE COUNTY 45,968 0.123160% (37,530) 238,218 (268,444)
68204 MONROE COUNTY HOSPITAL 59,125 0.158413% (48,272) 306,403 (345,281)
68301 CITY OF ALBIA 30,430 0.081531% (24,844) 157,697 (177,706)
69201 MONTGOMERY COUNTY 59,675 0.159887% (48,721) 309,254 (348,493)
69301 CITY OF RED OAK 113,974 0.305368% (93,052) 590,645 (665,588)
70201 MUSCATINE COUNTY 242,661 0.650159% (198,117) 1,257,543 (1,417,103)
70302 CITY OF WILTON 27,149 0.072739% (22,165) 140,692 (158,543)
70303 CITY OF WEST LIBERTY 42,879 0.114885% (35,008) 222,211 (250,406)
70304 CITY OF MUSCATINE 3,616 0.009688% (2,952) 18,738 (21,116)
70307 CITY OF NICHOLS 2,239 0.005999% (1,828) 11,603 (13,075)
70316 CITY OF ATALISSA 988 0.002647% (807) 5,120 (5,770)
70317 CITY OF CONESVILLE 2,137 0.005726% (1,745) 11,076 (12,481)
71201 O'BRIEN COUNTY 71,271 0.190956% (58,188) 369,349 (416,213)
71301 CITY OF PRIMGHAR 3,831 0.010266% (3,128) 19,856 (22,375)
71302 CITY OF SHELDON 54,281 0.145435% (44,317) 281,301 (316,994)
71303 CITY OF HARTLEY 249 0.000667% (203) 1,290 (1,454)
71306 CITY OF PAULLINA 9,482 0.025405% (7,741) 49,139 (55,374)
71323 HARTLEY POLICE DEPARTMENT 10,871 0.029126% (8,875) 56,335 (63,483)
71325 SANBORN POLICE DEPARTMENT 13,494 0.036153% (11,017) 69,928 (78,801)
71326 SUTHERLAND POLICE DEPARTMENT 3,843 0.010296% (3,137) 19,915 (22,441)
See notes to Schedules.___________________________________________________________________________________________________
146

____________________________________________________________________________________________________Schedule 3
Differences Between Expected
and Actual Experience
Changes of Assumptions
Difference Between
Projected and Actual
Investment Earnings on Pension Plan Investments
Total Deferred
Outflows of Resources
Differences Between Expected
and Actual Experience
Changes of Assumptions
Difference Between
Projected and Actual
Investment Earnings on Pension Plan Investments
Total Deferred Inflows of Resources
Total Proportionate
Share of Allocable Plan
Pension Expense
DEFERRED INFLOWS OF RESOURCESDEFERRED OUTFLOWS OF RESOURCES
(Excluding Employer Specific Amounts)* (Excluding Employer Specific Amounts) *
780 8,215 4,761 13,756 376 324 16,701 17,401 13,811
10,420 109,727 63,589 183,736 5,020 4,334 223,077 232,431 184,475
637 6,703 3,884 11,224 307 265 13,627 14,199 11,269
190 2,004 1,162 3,356 92 79 4,075 4,246 3,370
3,053 32,153 18,633 53,839 1,471 1,270 65,368 68,109 54,056
3,530 37,169 21,540 62,239 1,700 1,468 75,565 78,733 62,489
1,947 20,505 11,883 34,335 938 810 41,687 43,435 34,473
2,574 27,105 15,708 45,387 1,240 1,071 55,106 57,417 45,570
2,263 23,831 13,810 39,904 1,090 941 48,448 50,479 40,064
367 3,866 2,240 6,473 177 153 7,860 8,190 6,500
2,879 30,315 17,568 50,762 1,387 1,197 61,631 64,215 50,966
1,692 17,812 10,322 29,826 815 704 36,212 37,731 29,946
776 8,171 4,735 13,682 374 323 16,611 17,308 13,736
117 1,232 714 2,063 56 49 2,505 2,610 2,072
3 28 16 47 1 1 56 58 47
2,915 30,694 17,788 51,397 1,404 1,212 62,401 65,017 51,603
3,749 39,479 22,879 66,107 1,806 1,559 80,262 83,627 66,373
1,930 20,319 11,775 34,024 930 803 41,309 43,042 34,160
3,784 39,847 23,092 66,723 1,823 1,574 81,009 84,406 66,991
7,227 76,103 44,103 127,433 3,482 3,006 154,719 161,207 127,946
15,387 162,032 93,901 271,320 7,413 6,400 329,413 343,226 272,410
1,722 18,128 10,505 30,355 829 716 36,854 38,399 30,477
2,719 28,631 16,592 47,942 1,310 1,131 58,208 60,649 48,135
229 2,414 1,399 4,042 110 95 4,908 5,113 4,059
142 1,495 866 2,503 68 59 3,039 3,166 2,513
63 660 382 1,105 30 26 1,341 1,397 1,109
136 1,427 827 2,390 65 56 2,901 3,022 2,399
4,519 47,590 27,579 79,688 2,177 1,880 96,751 100,808 80,009
243 2,558 1,483 4,284 117 101 5,201 5,419 4,301
3,442 36,245 21,005 60,692 1,658 1,432 73,687 76,777 60,936
16 166 96 278 8 7 338 353 279
601 6,331 3,669 10,601 290 250 12,872 13,412 10,645
689 7,259 4,207 12,155 332 287 14,757 15,376 12,203
856 9,010 5,222 15,088 412 356 18,318 19,086 15,148
244 2,566 1,487 4,297 117 101 5,217 5,435 4,314
___________________________________________________________________________________________________147 (Continued)

____________________________________________________________________________________________________
Employer ID # Employer Name
2019 Actual Employer
Contributions
Employer Allocation
Percentage **
Net Pension Liability
(NPL)/(Asset)
Change in NPL due to 1%
Decrease in the Actuarial Assumed
Investment Return (6.00 %)
Change in NPL due to 1%
Increase in the Actuarial Assumed
Investment Return (8.00%)
Iowa Public Employees' Retirement System
Schedule of Employer Allocations and Collective Pension Amounts Allocated by Employer -Protection Occupation Membership Group
As of and for the year ended June 30, 2019
72201 OSCEOLA COUNTY 42,902 0.114947% (35,027) 222,332 (250,542)
73201 PAGE COUNTY 34,238 0.091733% (27,953) 177,431 (199,944)
73301 CITY OF SHENANDOAH 47,931 0.128421% (39,133) 248,394 (279,910)
73302 CITY OF CLARINDA 51,840 0.138894% (42,324) 268,650 (302,738)
73303 CLARINDA REGIONAL HEALTH CENTER 73,823 0.197793% (60,272) 382,573 (431,115)
73309 CITY OF ESSEX 481 0.001289% (393) 2,494 (2,810)
74201 PALO ALTO COUNTY 19,555 0.052393% (15,965) 101,339 (114,197)
74205 PALO ALTO COUNTY HEALTH SYSTEM 29,636 0.079403% (24,196) 153,583 (173,070)
74301 CITY OF EMMETSBURG 29,649 0.079439% (24,207) 153,651 (173,147)
74303 CITY OF WEST BEND 5,212 0.013963% (4,255) 27,008 (30,435)
75201 PLYMOUTH COUNTY 77,690 0.208155% (63,429) 402,615 (453,700)
75301 CITY OF AKRON 16,078 0.043079% (13,127) 83,323 (93,895)
75302 CITY OF REMSEN 10,309 0.027621% (8,417) 53,425 (60,204)
75304 CITY OF KINGSLEY 10,102 0.027067% (8,248) 52,353 (58,996)
75305 CITY OF LE MARS 67,965 0.182098% (55,489) 352,216 (396,906)
75306 CITY OF MERRILL 9,460 0.025345% (7,723) 49,022 (55,242)
75324 HINTON POLICE DEPARTMENT 6,122 0.016401% (4,998) 31,724 (35,749)
76201 POCAHONTAS COUNTY 60,035 0.160851% (49,014) 311,118 (350,594)
76301 CITY OF FONDA 5,801 0.015543% (4,736) 30,063 (33,877)
76302 CITY OF POCAHONTAS 19,716 0.052824% (16,097) 102,173 (115,137)
76303 CITY OF ROLFE 300 0.000805% (245) 1,557 (1,754)
76304 CITY OF GILMORE CITY 649 0.001740% (530) 3,365 (3,792)
76305 CITY OF LAURENS 15,522 0.041587% (12,672) 80,438 (90,644)
76315 POCAHONTAS COMMUNITY HOSPITAL 30,268 0.081096% (24,712) 156,857 (176,760)
77043 STATE - DEPT OF COMMERCE/INSURANCE 24,275 0.065040% (19,819) 125,801 (141,763)
77110 5TH JUDICIAL DIST DEPT CORR SERVICES 69,674 0.186677% (56,884) 361,073 (406,887)
77112 STATE - AIRPORT FIREFIGHTERS 224,376 0.601169% (183,188) 1,162,785 (1,310,322)
77113 STATE - CONSERVATION PEACE OFFICERS 966,286 2.588958% (788,909) 5,007,580 (5,642,957)
77114 STATE - CORRECTIONS - PROTECTION OCCUPAT 13,578,228 36.379977% (11,085,724) 70,366,412 (79,294,715)
77301 CITY OF WEST DES MOINES 360,218 0.965127% (294,094) 1,866,756 (2,103,616)
77303 CITY OF MITCHELLVILLE 18,868 0.050554% (15,405) 97,781 (110,188)
77305 CITY OF URBANDALE 10,191 0.027304% (8,320) 52,811 (59,512)
77308 CITY OF GRIMES 107,202 0.287226% (87,524) 555,555 (626,045)
77309 CITY OF ANKENY 103,340 0.276878% (84,370) 535,540 (603,491)
77310 CITY OF BONDURANT 26,525 0.071069% (21,656) 137,462 (154,904)
See notes to Schedules.___________________________________________________________________________________________________
148

____________________________________________________________________________________________________Schedule 3
Differences Between Expected
and Actual Experience
Changes of Assumptions
Difference Between
Projected and Actual
Investment Earnings on Pension Plan Investments
Total Deferred
Outflows of Resources
Differences Between Expected
and Actual Experience
Changes of Assumptions
Difference Between
Projected and Actual
Investment Earnings on Pension Plan Investments
Total Deferred Inflows of Resources
Total Proportionate
Share of Allocable Plan
Pension Expense
DEFERRED INFLOWS OF RESOURCESDEFERRED OUTFLOWS OF RESOURCES
(Excluding Employer Specific Amounts)* (Excluding Employer Specific Amounts) *
2,720 28,647 16,601 47,968 1,311 1,131 58,240 60,682 48,162
2,171 22,862 13,249 38,282 1,046 903 46,478 48,427 38,435
3,039 32,005 18,548 53,592 1,464 1,264 65,067 67,795 53,807
3,287 34,615 20,060 57,962 1,584 1,367 70,373 73,324 58,195
4,681 49,294 28,567 82,542 2,255 1,947 100,215 104,417 82,873
31 321 186 538 15 13 653 681 540
1,240 13,057 7,567 21,864 597 516 26,546 27,659 21,952
1,879 19,789 11,468 33,136 905 782 40,231 41,918 33,269
1,880 19,798 11,473 33,151 906 782 40,249 41,937 33,284
330 3,480 2,017 5,827 159 137 7,075 7,371 5,850
4,926 51,876 30,063 86,865 2,373 2,049 105,465 109,887 87,215
1,020 10,736 6,222 17,978 491 424 21,826 22,741 18,049
654 6,884 3,989 11,527 315 272 13,995 14,582 11,573
641 6,746 3,909 11,296 309 266 13,714 14,289 11,341
4,310 45,382 26,300 75,992 2,076 1,793 92,263 96,132 76,297
600 6,316 3,660 10,576 289 249 12,841 13,379 10,619
388 4,088 2,369 6,845 187 161 8,310 8,658 6,872
3,807 40,087 23,231 67,125 1,834 1,583 81,497 84,914 67,395
368 3,873 2,245 6,486 177 153 7,875 8,205 6,512
1,250 13,165 7,629 22,044 602 520 26,764 27,886 22,133
19 201 116 336 9 8 408 425 337
41 434 251 726 20 17 881 918 729
984 10,364 6,006 17,354 474 409 21,071 21,954 17,424
1,919 20,211 11,713 33,843 925 798 41,089 42,812 33,978
1,539 16,209 9,394 27,142 742 640 32,954 34,336 27,251
4,418 46,523 26,961 77,902 2,128 1,838 94,583 98,549 78,216
14,228 149,822 86,825 250,875 6,854 5,918 304,591 317,363 251,883
61,274 645,217 373,916 1,080,407 29,520 25,485 1,311,733 1,366,738 1,084,745
861,002 9,066,557 5,254,252 15,181,811 414,798 358,111 18,432,454 19,205,363 15,242,812
22,842 240,527 139,390 402,759 11,004 9,500 488,996 509,500 404,378
1,196 12,599 7,301 21,096 576 498 25,614 26,688 21,181
646 6,805 3,943 11,394 311 269 13,834 14,414 11,440
6,798 71,582 41,483 119,863 3,275 2,827 145,527 151,629 120,345
6,553 69,003 39,989 115,545 3,157 2,725 140,285 146,167 116,009
1,682 17,712 10,264 29,658 810 700 36,008 37,518 29,777
___________________________________________________________________________________________________149 (Continued)

____________________________________________________________________________________________________
Employer ID # Employer Name
2019 Actual Employer
Contributions
Employer Allocation
Percentage **
Net Pension Liability
(NPL)/(Asset)
Change in NPL due to 1%
Decrease in the Actuarial Assumed
Investment Return (6.00 %)
Change in NPL due to 1%
Increase in the Actuarial Assumed
Investment Return (8.00%)
Iowa Public Employees' Retirement System
Schedule of Employer Allocations and Collective Pension Amounts Allocated by Employer -Protection Occupation Membership Group
As of and for the year ended June 30, 2019
77314 CITY OF WINDSOR HEIGHTS 139,313 0.373258% (113,739) 721,959 (813,563)
77320 CITY OF CLIVE 159,129 0.426353% (129,918) 824,655 (929,289)
77321 CITY OF PLEASANT HILL 187,557 0.502520% (153,128) 971,978 (1,095,305)
77322 CITY OF POLK CITY 69,977 0.187487% (57,131) 362,639 (408,652)
77334 ALTOONA POLICE DEPT 367,013 0.983332% (299,641) 1,901,968 (2,143,296)
77338 JOHNSTON POLICE DEPARTMENT 389,629 1.043929% (318,106) 2,019,175 (2,275,374)
77402 SAYLOR TOWNSHIP TRUSTEES - POLK COUNTY 13,742 0.036818% (11,219) 71,213 (80,249)
78003 4TH JUDICIAL DIST DEPT CORR SERVICES 39,153 0.104901% (31,965) 202,900 (228,645)
78201 POTTAWATTAMIE COUNTY 699,694 1.874682% (571,255) 3,626,023 (4,086,105)
78307 CITY OF OAKLAND 864 0.002314% (705) 4,476 (5,044)
78311 CITY OF AVOCA 15,516 0.041572% (12,668) 80,409 (90,611)
78313 CITY OF CARTER LAKE 65,030 0.174235% (53,093) 337,007 (379,767)
79201 POWESHIEK COUNTY 65,068 0.174336% (53,124) 337,202 (379,987)
79301 CITY OF GRINNELL 1,157 0.003101% (945) 5,998 (6,759)
79304 CITY OF MONTEZUMA 746 0.001998% (609) 3,865 (4,355)
80201 RINGGOLD COUNTY 25,740 0.068965% (21,015) 133,393 (150,318)
80203 RINGGOLD COUNTY HOSPITAL 30,985 0.083019% (25,297) 160,575 (180,949)
81201 SAC COUNTY 73,116 0.195898% (59,694) 378,908 (426,985)
81305 CITY OF LAKE VIEW 19,894 0.053301% (16,242) 103,095 (116,176)
81320 SAC CITY POLICE DEPT 29,203 0.078243% (23,842) 151,337 (170,540)
82201 SCOTT COUNTY 554,641 1.486042% (452,827) 2,874,313 (3,239,015)
82303 CITY OF ELDRIDGE 55,382 0.148385% (45,216) 287,008 (323,424)
82304 CITY OF WALCOTT 19,806 0.053067% (16,170) 102,642 (115,665)
82305 CITY OF BUFFALO 19,816 0.053091% (16,178) 102,690 (115,719)
82309 CITY OF PRINCETON 8,598 0.023036% (7,020) 44,557 (50,210)
82311 CITY OF LE CLAIRE 43,946 0.117744% (35,879) 227,741 (256,638)
82316 CITY OF BLUE GRASS 14,670 0.039305% (11,977) 76,025 (85,671)
82324 CITY OF MCCAUSLAND 446 0.001194% (364) 2,310 (2,603)
83201 SHELBY COUNTY 37,425 0.100272% (30,555) 193,947 (218,555)
83301 CITY OF HARLAN 55,866 0.149682% (45,611) 289,515 (326,250)
84201 SIOUX COUNTY 98,198 0.263099% (80,172) 508,889 (573,458)
84301 CITY OF HAWARDEN 25,886 0.069356% (21,134) 134,149 (151,170)
84303 CITY OF ROCK VALLEY 38,091 0.102057% (31,099) 197,400 (222,447)
84304 CITY OF SIOUX CENTER 51,721 0.138575% (42,226) 268,032 (302,041)
84307 CITY OF ORANGE CITY 44,261 0.118589% (36,136) 229,375 (258,479)
See notes to Schedules.___________________________________________________________________________________________________
150

____________________________________________________________________________________________________Schedule 3
Differences Between Expected
and Actual Experience
Changes of Assumptions
Difference Between
Projected and Actual
Investment Earnings on Pension Plan Investments
Total Deferred
Outflows of Resources
Differences Between Expected
and Actual Experience
Changes of Assumptions
Difference Between
Projected and Actual
Investment Earnings on Pension Plan Investments
Total Deferred Inflows of Resources
Total Proportionate
Share of Allocable Plan
Pension Expense
DEFERRED INFLOWS OF RESOURCESDEFERRED OUTFLOWS OF RESOURCES
(Excluding Employer Specific Amounts)* (Excluding Employer Specific Amounts) *
8,834 93,023 53,909 155,766 4,256 3,674 189,117 197,047 156,391
10,090 106,255 61,577 177,922 4,861 4,197 216,018 225,076 178,637
11,893 125,237 72,577 209,707 5,730 4,947 254,609 265,286 210,550
4,437 46,725 27,078 78,240 2,138 1,846 94,993 98,977 78,555
23,272 245,064 142,020 410,356 11,212 9,680 498,220 519,112 412,005
24,707 260,166 150,772 435,645 11,903 10,276 528,922 551,101 437,395
871 9,176 5,317 15,364 420 362 18,654 19,436 15,426
2,483 26,143 15,151 43,777 1,196 1,033 53,150 55,379 43,952
44,369 467,205 270,756 782,330 21,375 18,454 949,836 989,665 785,471
55 577 334 966 26 23 1,173 1,222 970
984 10,360 6,004 17,348 474 409 21,063 21,946 17,418
4,124 43,423 25,164 72,711 1,987 1,715 88,279 91,981 73,003
4,126 43,448 25,179 72,753 1,988 1,716 88,330 92,034 73,045
73 773 448 1,294 35 31 1,571 1,637 1,299
47 498 289 834 23 20 1,012 1,055 837
1,632 17,187 9,960 28,779 786 679 34,942 36,407 28,896
1,965 20,690 11,990 34,645 947 817 42,063 43,827 34,784
4,636 48,821 28,293 81,750 2,234 1,928 99,255 103,417 82,079
1,261 13,284 7,698 22,243 608 525 27,006 28,139 22,333
1,852 19,499 11,300 32,651 892 770 39,643 41,305 32,783
35,171 370,349 214,626 620,146 16,944 14,628 752,925 784,497 622,635
3,512 36,980 21,431 61,923 1,692 1,461 75,182 78,335 62,172
1,256 13,225 7,664 22,145 605 522 26,887 28,014 22,234
1,257 13,231 7,668 22,156 605 523 26,900 28,028 22,245
545 5,741 3,327 9,613 263 227 11,672 12,162 9,652
2,787 29,344 17,005 49,136 1,342 1,159 59,657 62,158 49,333
930 9,796 5,677 16,403 448 387 19,915 20,750 16,469
28 298 172 498 14 12 605 631 500
2,373 24,990 14,482 41,845 1,143 987 50,804 52,934 42,013
3,542 37,303 21,618 62,463 1,707 1,473 75,838 79,018 62,715
6,227 65,569 37,999 109,795 3,000 2,590 133,303 138,893 110,236
1,641 17,285 10,017 28,943 791 683 35,140 36,614 29,059
2,415 25,435 14,740 42,590 1,164 1,005 51,709 53,878 42,761
3,280 34,535 20,014 57,829 1,580 1,364 70,211 73,155 58,061
2,807 29,554 17,127 49,488 1,352 1,167 60,085 62,604 49,687
___________________________________________________________________________________________________151 (Continued)

____________________________________________________________________________________________________
Employer ID # Employer Name
2019 Actual Employer
Contributions
Employer Allocation
Percentage **
Net Pension Liability
(NPL)/(Asset)
Change in NPL due to 1%
Decrease in the Actuarial Assumed
Investment Return (6.00 %)
Change in NPL due to 1%
Increase in the Actuarial Assumed
Investment Return (8.00%)
Iowa Public Employees' Retirement System
Schedule of Employer Allocations and Collective Pension Amounts Allocated by Employer -Protection Occupation Membership Group
As of and for the year ended June 30, 2019
84320 ORANGE CITY AREA HEALTH SYSTEM 23,752 0.063639% (19,392) 123,090 (138,708)
85001 IOWA STATE UNIV OF SCIENCE & TECH 91,224 0.244415% (74,478) 472,750 (532,734)
85101 DEPT OF TRANS PROTECTION OCCUPATION 751,899 2.014553% (613,877) 3,896,563 (4,390,971)
85201 STORY COUNTY 233,141 0.624652% (190,344) 1,208,206 (1,361,506)
85204 STORY CO MEDICAL CENTER 48,908 0.131038% (39,930) 253,455 (285,614)
85301 CITY OF HUXLEY 37,398 0.100201% (30,533) 193,809 (218,400)
85305 CITY OF STORY CITY 35,158 0.094198% (28,704) 182,198 (205,316)
85318 CITY OF NEVADA 66,445 0.178025% (54,248) 344,337 (388,027)
85322 CITY OF ROLAND 934 0.002503% (763) 4,841 (5,455)
85327 MARY GREELEY MEDICAL CENTER 138,428 0.370888% (113,017) 717,375 (808,398)
86201 TAMA COUNTY 36,585 0.098022% (29,869) 189,595 (213,651)
86301 CITY OF TAMA 42,029 0.112607% (34,314) 217,805 (245,440)
86302 CITY OF GLADBROOK 3,716 0.009956% (3,034) 19,257 (21,700)
86303 CITY OF TRAER 13,629 0.036517% (11,127) 70,631 (79,593)
86306 CITY OF DYSART 26,671 0.071459% (21,775) 138,216 (155,754)
86308 CITY OF TOLEDO 33,598 0.090020% (27,431) 174,117 (196,209)
87201 TAYLOR COUNTY 32,452 0.086948% (26,495) 168,176 (189,515)
87306 CITY OF CLEARFIELD 8 0.000022% (7) 42 (48)
87310 CITY OF LENOX 241 0.000646% (197) 1,249 (1,407)
88201 UNION COUNTY 23,420 0.062748% (19,121) 121,367 (136,767)
88204 GREATER REGIONAL MEDICAL CENTER 92,657 0.248255% (75,648) 480,176 (541,102)
88301 CITY OF CRESTON 4,621 0.012380% (3,772) 23,945 (26,983)
88306 CITY OF AFTON 4,036 0.010813% (3,295) 20,915 (23,569)
89201 VAN BUREN COUNTY 29,607 0.079325% (24,172) 153,431 (172,898)
89204 VAN BUREN COUNTY HOSPITAL 62,276 0.166856% (50,844) 322,733 (363,683)
89301 CITY OF FARMINGTON 123 0.000328% (100) 635 (715)
90201 WAPELLO COUNTY 83,210 0.222943% (67,935) 431,218 (485,933)
91201 WARREN COUNTY 13,680 0.036652% (11,169) 70,893 (79,888)
91301 CITY OF INDIANOLA 108,319 0.290218% (88,435) 561,341 (632,566)
91303 CITY OF CARLISLE 69,779 0.186958% (56,970) 361,616 (407,498)
91307 CITY OF NORWALK 205,810 0.551423% (168,030) 1,066,566 (1,201,895)
92201 WASHINGTON COUNTY 88,999 0.238453% (72,661) 461,217 (519,738)
92301 CITY OF WASHINGTON 105,541 0.282775% (86,167) 546,946 (616,344)
93201 WAYNE COUNTY 40,966 0.109760% (33,446) 212,298 (239,235)
93204 WAYNE COUNTY HOSPITAL 62,846 0.168383% (51,310) 325,688 (367,012)
See notes to Schedules.___________________________________________________________________________________________________
152

____________________________________________________________________________________________________Schedule 3
Differences Between Expected
and Actual Experience
Changes of Assumptions
Difference Between
Projected and Actual
Investment Earnings on Pension Plan Investments
Total Deferred
Outflows of Resources
Differences Between Expected
and Actual Experience
Changes of Assumptions
Difference Between
Projected and Actual
Investment Earnings on Pension Plan Investments
Total Deferred Inflows of Resources
Total Proportionate
Share of Allocable Plan
Pension Expense
DEFERRED INFLOWS OF RESOURCESDEFERRED OUTFLOWS OF RESOURCES
(Excluding Employer Specific Amounts)* (Excluding Employer Specific Amounts) *
1,506 15,860 9,191 26,557 726 626 32,243 33,595 26,664
5,785 60,913 35,300 101,998 2,787 2,406 123,837 129,030 102,407
47,679 502,065 290,957 840,701 22,970 19,830 1,020,702 1,063,502 844,076
14,784 155,675 90,217 260,676 7,122 6,149 316,489 329,760 261,722
3,101 32,657 18,925 54,683 1,494 1,290 66,393 69,177 54,904
2,371 24,972 14,472 41,815 1,142 986 50,768 52,896 41,983
2,229 23,476 13,605 39,310 1,074 927 47,727 49,728 39,468
4,213 44,367 25,712 74,292 2,030 1,752 90,199 93,981 74,590
59 624 361 1,044 29 25 1,268 1,322 1,049
8,778 92,432 53,566 154,776 4,229 3,651 187,916 195,796 155,398
2,320 24,429 14,157 40,906 1,118 965 49,664 51,747 41,070
2,665 28,064 16,263 46,992 1,284 1,108 57,054 59,446 47,181
236 2,481 1,438 4,155 114 98 5,044 5,256 4,171
864 9,101 5,274 15,239 416 359 18,502 19,277 15,300
1,691 17,809 10,321 29,821 815 703 36,206 37,724 29,940
2,130 22,435 13,001 37,566 1,026 886 45,610 47,522 37,717
2,058 21,669 12,558 36,285 991 856 44,054 45,901 36,430
1 5 3 9 - - 11 11 9
15 161 93 269 7 6 327 340 270
1,485 15,638 9,062 26,185 715 618 31,792 33,125 26,291
5,875 61,870 35,855 103,600 2,831 2,444 125,782 131,057 104,016
293 3,085 1,788 5,166 141 122 6,272 6,535 5,187
256 2,695 1,562 4,513 123 106 5,479 5,708 4,531
1,877 19,769 11,457 33,103 904 781 40,191 41,876 33,236
3,949 41,583 24,098 69,630 1,902 1,642 84,540 88,084 69,911
8 82 47 137 4 3 166 173 138
5,276 55,562 32,199 93,037 2,542 2,195 112,957 117,694 93,411
867 9,134 5,294 15,295 418 361 18,570 19,349 15,357
6,869 72,328 41,915 121,112 3,309 2,857 147,043 153,209 121,598
4,425 46,593 27,002 78,020 2,132 1,840 94,725 98,697 78,333
13,050 137,425 79,640 230,115 6,287 5,428 279,387 291,102 231,040
5,643 59,427 34,439 99,509 2,719 2,347 120,816 125,882 99,909
6,692 70,473 40,840 118,005 3,224 2,784 143,272 149,280 118,480
2,598 27,354 15,852 45,804 1,251 1,080 55,611 57,942 45,988
3,985 41,964 24,319 70,268 1,920 1,657 85,314 88,891 70,551
___________________________________________________________________________________________________153 (Continued)
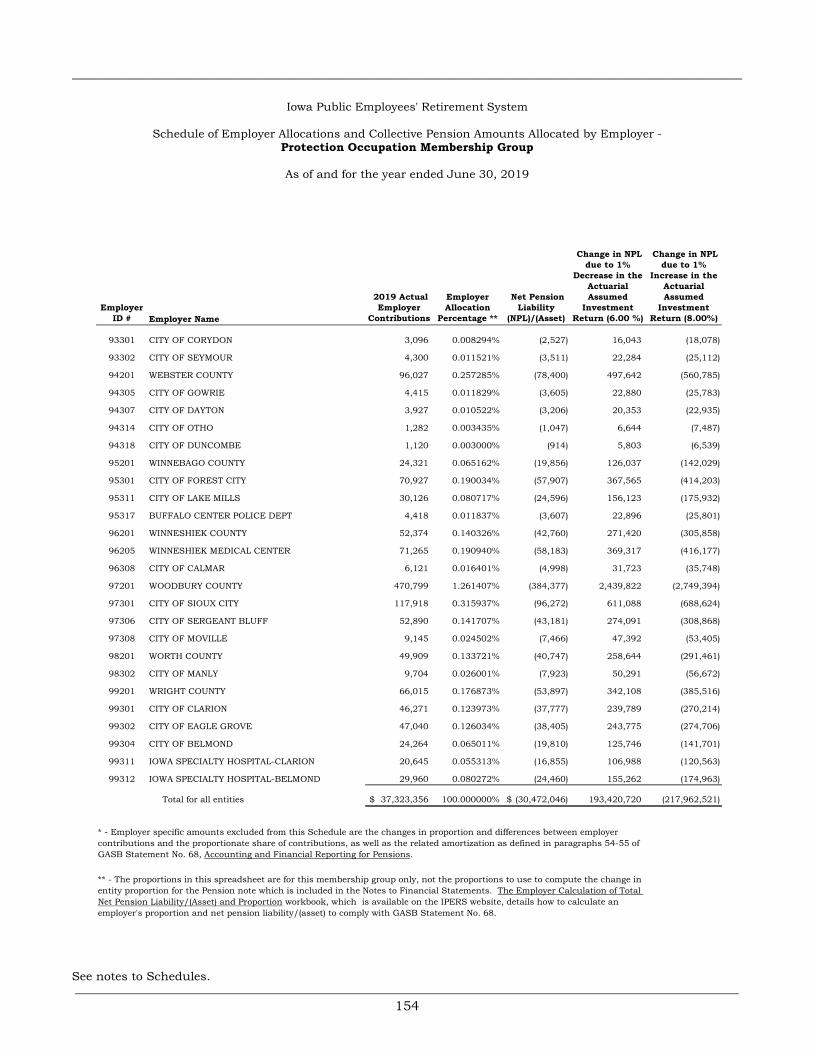
____________________________________________________________________________________________________
Employer ID # Employer Name
2019 Actual Employer
Contributions
Employer Allocation
Percentage **
Net Pension Liability
(NPL)/(Asset)
Change in NPL due to 1%
Decrease in the Actuarial Assumed
Investment Return (6.00 %)
Change in NPL due to 1%
Increase in the Actuarial Assumed
Investment Return (8.00%)
Iowa Public Employees' Retirement System
Schedule of Employer Allocations and Collective Pension Amounts Allocated by Employer -Protection Occupation Membership Group
As of and for the year ended June 30, 2019
93301 CITY OF CORYDON 3,096 0.008294% (2,527) 16,043 (18,078)
93302 CITY OF SEYMOUR 4,300 0.011521% (3,511) 22,284 (25,112)
94201 WEBSTER COUNTY 96,027 0.257285% (78,400) 497,642 (560,785)
94305 CITY OF GOWRIE 4,415 0.011829% (3,605) 22,880 (25,783)
94307 CITY OF DAYTON 3,927 0.010522% (3,206) 20,353 (22,935)
94314 CITY OF OTHO 1,282 0.003435% (1,047) 6,644 (7,487)
94318 CITY OF DUNCOMBE 1,120 0.003000% (914) 5,803 (6,539)
95201 WINNEBAGO COUNTY 24,321 0.065162% (19,856) 126,037 (142,029)
95301 CITY OF FOREST CITY 70,927 0.190034% (57,907) 367,565 (414,203)
95311 CITY OF LAKE MILLS 30,126 0.080717% (24,596) 156,123 (175,932)
95317 BUFFALO CENTER POLICE DEPT 4,418 0.011837% (3,607) 22,896 (25,801)
96201 WINNESHIEK COUNTY 52,374 0.140326% (42,760) 271,420 (305,858)
96205 WINNESHIEK MEDICAL CENTER 71,265 0.190940% (58,183) 369,317 (416,177)
96308 CITY OF CALMAR 6,121 0.016401% (4,998) 31,723 (35,748)
97201 WOODBURY COUNTY 470,799 1.261407% (384,377) 2,439,822 (2,749,394)
97301 CITY OF SIOUX CITY 117,918 0.315937% (96,272) 611,088 (688,624)
97306 CITY OF SERGEANT BLUFF 52,890 0.141707% (43,181) 274,091 (308,868)
97308 CITY OF MOVILLE 9,145 0.024502% (7,466) 47,392 (53,405)
98201 WORTH COUNTY 49,909 0.133721% (40,747) 258,644 (291,461)
98302 CITY OF MANLY 9,704 0.026001% (7,923) 50,291 (56,672)
99201 WRIGHT COUNTY 66,015 0.176873% (53,897) 342,108 (385,516)
99301 CITY OF CLARION 46,271 0.123973% (37,777) 239,789 (270,214)
99302 CITY OF EAGLE GROVE 47,040 0.126034% (38,405) 243,775 (274,706)
99304 CITY OF BELMOND 24,264 0.065011% (19,810) 125,746 (141,701)
99311 IOWA SPECIALTY HOSPITAL-CLARION 20,645 0.055313% (16,855) 106,988 (120,563)
99312 IOWA SPECIALTY HOSPITAL-BELMOND 29,960 0.080272% (24,460) 155,262 (174,963)
Total for all entities 37,323,356$ 100.000000% (30,472,046)$ 193,420,720 (217,962,521)
** - The proportions in this spreadsheet are for this membership group only, not the proportions to use to compute the change in entity proportion for the Pension note which is included in the Notes to Financial Statements. The Employer Calculation of Total Net Pension Liability/(Asset) and Proportion workbook, which is available on the IPERS website, details how to calculate an employer's proportion and net pension liability/(asset) to comply with GASB Statement No. 68.
* - Employer specific amounts excluded from this Schedule are the changes in proportion and differences between employer contributions and the proportionate share of contributions, as well as the related amortization as defined in paragraphs 54-55 of GASB Statement No. 68, Accounting and Financial Reporting for Pensions.
See notes to Schedules.___________________________________________________________________________________________________
154

____________________________________________________________________________________________________Schedule 3
Differences Between Expected
and Actual Experience
Changes of Assumptions
Difference Between
Projected and Actual
Investment Earnings on Pension Plan Investments
Total Deferred
Outflows of Resources
Differences Between Expected
and Actual Experience
Changes of Assumptions
Difference Between
Projected and Actual
Investment Earnings on Pension Plan Investments
Total Deferred Inflows of Resources
Total Proportionate
Share of Allocable Plan
Pension Expense
DEFERRED INFLOWS OF RESOURCESDEFERRED OUTFLOWS OF RESOURCES
(Excluding Employer Specific Amounts)* (Excluding Employer Specific Amounts) *
196 2,067 1,198 3,461 95 82 4,202 4,379 3,475
273 2,871 1,664 4,808 131 113 5,837 6,081 4,827
6,089 64,120 37,159 107,368 2,934 2,533 130,357 135,824 107,800
280 2,948 1,708 4,936 135 116 5,993 6,244 4,956
249 2,622 1,520 4,391 120 104 5,331 5,555 4,409
81 856 496 1,433 39 34 1,740 1,813 1,439
71 748 433 1,252 34 30 1,520 1,584 1,257
1,542 16,240 9,411 27,193 743 641 33,015 34,399 27,302
4,498 47,360 27,446 79,304 2,167 1,871 96,284 100,322 79,622
1,910 20,116 11,658 33,684 920 795 40,896 42,611 33,819
280 2,950 1,710 4,940 135 117 5,998 6,250 4,960
3,321 34,972 20,267 58,560 1,600 1,381 71,098 74,079 58,795
4,519 47,586 27,577 79,682 2,177 1,880 96,742 100,799 80,002
388 4,087 2,369 6,844 187 161 8,310 8,658 6,872
29,855 314,366 182,182 526,403 14,382 12,417 639,111 665,910 528,516
7,477 78,737 45,630 131,844 3,602 3,110 160,074 166,786 132,374
3,354 35,316 20,466 59,136 1,616 1,395 71,798 74,809 59,374
580 6,106 3,539 10,225 279 241 12,414 12,934 10,266
3,165 33,326 19,313 55,804 1,525 1,316 67,752 70,593 56,028
615 6,480 3,755 10,850 296 256 13,174 13,726 10,894
4,186 44,080 25,545 73,811 2,017 1,741 89,615 93,373 74,108
2,934 30,896 17,905 51,735 1,414 1,220 62,813 65,447 51,943
2,983 31,410 18,203 52,596 1,437 1,241 63,857 66,535 52,807
1,539 16,202 9,389 27,130 741 640 32,939 34,320 27,239
1,309 13,785 7,989 23,083 631 544 28,025 29,200 23,176
1,900 20,005 11,593 33,498 915 790 40,671 42,376 33,633
2,366,690 24,921,829 14,442,700 41,731,219 1,140,179 984,362 50,666,484 52,791,025 41,898,902
___________________________________________________________________________________________________155

156
Iowa Public Employees’ Retirement System

157
Iowa Public Employees’ Retirement System
Notes to Schedules
June 30, 2019
(1) Plan Description
Administration
IPERS is a cost-sharing, multiple-employer, contributory defined benefit public employee retirement system. Administrative expenses are appropriated each year by the Iowa Legislature and paid from the Trust Fund.
The IPERS Investment Board is designated as the Fund’s trustee. It sets investment policies and oversees the System’s actuarial program. The Board holds public meetings regularly to review actuarial findings and investment performance and to formalize policies with the administration.
The IPERS Benefits Advisory Committee is statutorily charged to make benefit and service recommendations to IPERS and the General Assembly. The Committee is composed of representatives of constituent groups concerned with the System and includes representatives of all major employer groups and major active and retired member associations.
Plan Membership
IPERS participation is mandatory for most employees of the state of Iowa and its political subdivisions, including public school systems. Exceptions include those employees covered by a retirement system at least partially supported by public contributions, other than Social Security. Membership is optional for the members of the Iowa General Assembly and certain other individuals.
At June 30, 2019, IPERS had 172,304 contributing (active) members, employed by 1,948 employers.
Plan Benefits
IPERS benefits are established under Iowa Code chapter 97B and the administrative rules thereunder. Chapter 97B and the administrative rules are the official plan documents. The following brief description is for general informational purposes only. The plan documents contain more information.
1. Vesting – Regular members who complete seven years of covered service or reach the age of 65 while in IPERS-covered employment become vested. Special Service members who complete four years of covered service or reach the age of 55 while in IPERS-covered employment become vested.
2. Service Purchases – At retirement, members who have reached the years-of-service requirement for vesting may purchase service. These members may restore (buy back) previously refunded member service, purchase (buy in) IPERS service credit for employment elsewhere or time spent away from work or convert (buy up) Regular service credit to Special Service credit.

158
3. Refunds – IPERS members who terminate public employment for any reason may request a full refund of their accumulated contributions. Vested members requesting a refund also receive a portion of their accumulated employer contributions. Acceptance of the refund automatically terminates IPERS membership and all claims to future benefits. If an employee works in covered employment for less than six months, the employer may file a wage adjustment and the applicable IPERS contributions will be refunded to the individual and employer.
4. Eligibility for Pensions – A Regular member may retire at normal retirement age and receive monthly benefits without an early- retirement reduction. Normal retirement age is age 65, anytime after reaching age 62 with 20 or more years of covered employment or when the member’s years of service plus the member’s age at the last birthday equals or exceeds 88, whichever comes first. (These qualifications must be met on the member’s first month of entitlement to benefits.) Members cannot begin receiving retirement benefits before age 55. Members who are age 70 and still working for an IPERS-covered employer may apply to begin receiving IPERS retirement benefits while still employed. Special Service members are eligible for retirement benefits if they are vested, no longer working for an IPERS-covered employer, and reach age 55. Sheriffs and Deputies are eligible for retirement benefits at age 50 if they have 22 years of qualified service.
5. Pension Benefit Formula – The formula used to calculate a Regular member’s monthly IPERS benefit includes:
• A multiplier (based on years of service).
• The member’s highest five-year average salary. (For members with service before June 30, 2012, the highest three-year average salary as of that date will be used if it is greater than the highest five-year average salary.)
• An early-retirement reduction, only if the benefit is first paid before the member reaches normal retirement age. If a Regular member receives benefits before normal retirement age, a permanent early-retirement reduction will apply. For service earned before July 1, 2012, a reduction of 3 percent a year is applied for each year the benefit is paid before normal retirement age. For service earned after June 30, 2012, the reduction is 6 percent for each year of retirement before age 65.
The formula used to calculate a Special service member’s monthly IPERS benefit includes:
• A multiplier (based on years of service).
• The member’s highest three-year average salary.
6. Dividend Payments – Once a member selects a benefit option, a monthly benefit is calculated and remains the same for the rest of the member’s lifetime. However, for retirees who began receiving benefits prior to July 1990, a guaranteed dividend is included with the November benefit payment.
7. Disability Benefits – Vested members who are awarded federal Social Security disability or Railroad Retirement disability benefits are eligible for IPERS disability benefits. Disability benefits are not reduced for early retirement. Special Service members who retire because of a disability may meet the requirements for IPERS Regular or Special Service disability benefits.

159
8. Death Benefits
Preretirement Death Benefits – If an IPERS member dies before retirement, the member’s designated beneficiary may receive a lump-sum payment based on the greater of the following two formulas:
Death benefit = The actuarial present value of the member’s accrued benefit as of date of death.
Death benefit = Member’s accumulated contributions + (Member’s highest annual covered wage × Years of service/30*)
*The denominator is 22 for all Special Service members.
If the member’s designated beneficiary is a sole individual, the beneficiary will be offered the choice between receiving a lump sum or a lifetime annuity.
Postretirement Death Benefits – If an IPERS member dies after retirement, payment is made to the beneficiary according to the option selected by the member at the time of retirement.
Contributions
Each year, IPERS’ actuary performs a valuation of the liabilities and assets of the IPERS Trust Fund in accordance with Iowa Code section 97B.4(4)(d). The actuary also calculates an actuarial contribution rate for each membership group, which is the contribution rate necessary to fully fund the benefits provided under Iowa Code Chapter 97B.
Effective July 1, 2012, as a result of a 2010 law change, the contribution rates are established by IPERS following the annual actuarial valuation, which applies IPERS’ Contribution Rate Funding Policy and actuarial amortization method. Statute limits the amount rates can vary each year to 1 percentage point for Regular members. IPERS Contribution Rate Funding Policy requires the actuarial contribution rate be determined using the entry age normal actuarial cost method and the actuarial assumptions and methods approved by the IPERS Investment Board. The actuarial contribution rate covers normal cost plus the unfunded actuarial liability payment. The payment to amortize the unfunded actuarial liability is determined as a level percentage of payroll based on the actuarial amortization method adopted by the Investment Board.
In fiscal year 2019, pursuant to the required rate, Regular members contributed 6.29 percent of pay and their employers contributed 9.44 percent for a total rate of 15.73 percent. Sheriff and Deputy members and their employers both contributed 9.76 percent of pay for a total rate of 19.52 percent. Protection Occupation members contributed 6.81 percent of pay and their employers contributed 10.21 percent for a total rate of 17.02 percent.
2019 actual employer contributions are used as the basis for calculating the employers’ proportionate shares. These are the contributions posted to member accounts for the four quarters of fiscal year 2019, up to the cutoff date of August 2, 2019. These contributions are obtained by querying the data in the I-Que employer reporting system. These contributions vary from the contributions reported in IPERS’ financial statements for the following reasons:
The financial statements include all contributions paid during the fiscal year, including payments made during the fiscal year for prior fiscal years.
A cutoff date of July 15, 2019, the employer’s wage reporting due date, was used for purposes of financial reporting.
Contributions are posted to member accounts when the employer reports the members’ wages, regardless of whether the contributions have been paid; whereas the financial statements report contributions paid and accrued.

160
(2) Summary of Significant Accounting Policies
A. Basis of Accounting
Governmental Accounting Standards Board (GASB) Statement No. 68, Accounting and Financial Reporting for Pensions, requires certain information be provided about the System. The Schedules of Employer Allocations and Collective Pension Amounts Allocated by Employer (Schedules) provide this required pension information to the state of Iowa and other employers for inclusion in their financial statements.
The underlying financial information used to prepare the Schedules is based on the System’s financial statements which are prepared using the accrual basis of accounting. Employee contributions are recognized in the period in which the contributions are due. Employer contributions are recognized when due and the employer has made a formal commitment to provide them. Benefits and refunds are recognized when due and payable according to the terms of the plan.
The Schedules are intended to present the information required by GASB Statement No. 68 and not to present the financial position of the System or the state of Iowa.
IPERS issues a publicly available financial report which includes financial statements and required supplementary information. The report may be obtained by e-mail at [email protected], by phone at 515-281-0020 or 1-800-622-3849, by mail at Iowa Public Employees’ Retirement System, P.O. Box 9117, Des Moines, IA 50306-9117, or at www.ipers.org.
B. Deferred Outflows of Resources and Deferred Inflows of Resources
Difference Between Projected and Actual Investment Earnings on Pension Plan Investments – The difference between projected and actual earnings on System investments are amortized over a five year period. The non-current amounts are presented as deferred outflows or deferred inflows of resources in the Schedules. The current amounts are included as pension expense.
Differences Between Expected and Actual Experience – The difference between expected and actual experience is amortized over the average remaining service life for all members, which is 5.50 years for the year ended June 30, 2019. The non- current amounts are presented as deferred outflows or deferred inflows of resources in the Schedules. The current amounts are included as pension expense.
Changes of Assumptions – Changes of assumptions are amortized over the average remaining service life for all members, which is 5.50 years for the year ended June 30, 2019. The non-current amounts are presented as deferred outflows or deferred inflows of resources in the Schedules. The current amounts are included as pension expense.

161
C. Changes in Proportion and Differences Between Employer Contributions and Proportionate Share of Contributions – As explained by the asterisk on pages 118, 126 and 154, employer specific amounts excluded from the Schedules are the changes in proportion and differences between employer contributions and the proportionate share of contributions, as well as the related amortization as defined in paragraphs 54-55 of GASB Statement No. 68, Accounting and Financial Reporting for Pensions.
Each employer will calculate and amortize these employer specific deferred outflows of resources and deferred inflows of resources. These differences are amortized over the average remaining service life for all members, which is 5.50 years for the year ended June 30, 2019.
(3) Net Pension Liability
The components of the net pension liability of the System at June 30, 2019 were as follows:
Regular MembersTotal pension liability 37,324,200,774$ Plan fiduciary net position 31,494,644,130 Net pension liability 5,829,556,644$
Plan fiduciary net position as a percentage of the total pension liability 84.38%
Sheriffs and DeputiesTotal pension liability 730,785,263$ Plan fiduciary net position 739,211,795 Net pension liability (8,426,532)$
Plan fiduciary net position as a percentage of the total pension liability 101.15%
Protection Occupation MembersTotal pension liability 1,746,352,760$ Plan fiduciary net position 1,776,824,806 Net pension liability (30,472,046)$
Plan fiduciary net position as a percentage of the total pension liability 101.74%
Total MembershipTotal pension liability 39,801,338,797$ Plan fiduciary net position 34,010,680,731 Net pension liability 5,790,658,066$
Plan fiduciary net position as a percentage of the total pension liability 85.45%
Actuarial Methods and Assumptions – The total pension liability (TPL) was determined by an actuarial valuation as of June 30, 2019, using the following actuarial assumptions and the entry age normal actuarial cost method, applied to all periods included in the measurement:
Assumed investment return: 7% Projected salary increases: 3.25%–16.25% depending upon years of service Mortality tables: RP-2014 Employee and Healthy Annuitant Tables with MP-2017
generational adjustments Inflation rate: 2.6% Payroll increase assumption: 3.25%

162
The actuarial assumptions used in the June 30, 2019, valuation are based on the results of the most recent actuarial experience studies. An experience study of the System’s demographic assumptions was presented to the investment Board in June 2018. This study included information on mortality, retirement, disability and termination rates, as well as salary trends, for the period of July 1, 2013 – June 30, 2017. At the Investment Board’s direction, the experience study of the System’s economic assumptions, including the long-term rate of return, was accelerated a year resulting in a full review of the economic assumptions in early 2017. The findings of the experience study on economic assumptions, along with the resulting recommendations, are included in the report dated March 24, 2017.
Several factors are considered in evaluating the actuarial assumed investment return including long-term historical data, estimates inherent in current market data, along with estimates of variability and correlations for each asset class, and an analysis in which best-estimate ranges of expected future real rates of return (expected returns, net of investment expense and inflation) were developed by the System’s investment consultant. These ranges were combined to develop the actuarial assumed investment return by weighting the expected future real rates of return by the target asset allocation percentage and then adding expected inflation. The actuarial assumed investment return reflects the anticipated returns on current and future plan assets and provides a discount rate to determine the present value of future benefit payments.
Best estimates of arithmetic real rates of return for each major asset class included in IPERS’ target asset allocation as of June 30, 2019, are shown in the following table.
Long-Term Target Expected
Asset Class Allocation Real Rate of Return
Domestic equity 22.0% 5.60%International equity 15.0% 6.08%Global smart beta equity 3.0% 5.82%Core-plus fixed income 27.0% 1.71%Public credit 3.5% 3.32%Public real assets 7.0% 2.81%Cash 1.0% -0.21%Private equity 11.0% 10.13%Private real assets 7.5% 4.76%Private credit 3.0% 3.01% Total 100.0%
Discount Rate – The discount rate used to calculate the TPL is 7 percent. The projection of cash flows used to determine the discount rate assumed that contributions from employees and employers will be made at the contractually required rates, which are set by the Contribution Rate Funding Policy and derived from the actuarial valuation. Based on those assumptions, IPERS’ fiduciary net position is projected to be available to make all projected future benefit payments of current plan members. Therefore, the actuarial assumed investment return was applied to all periods of projected benefit payments to determine the TPL.
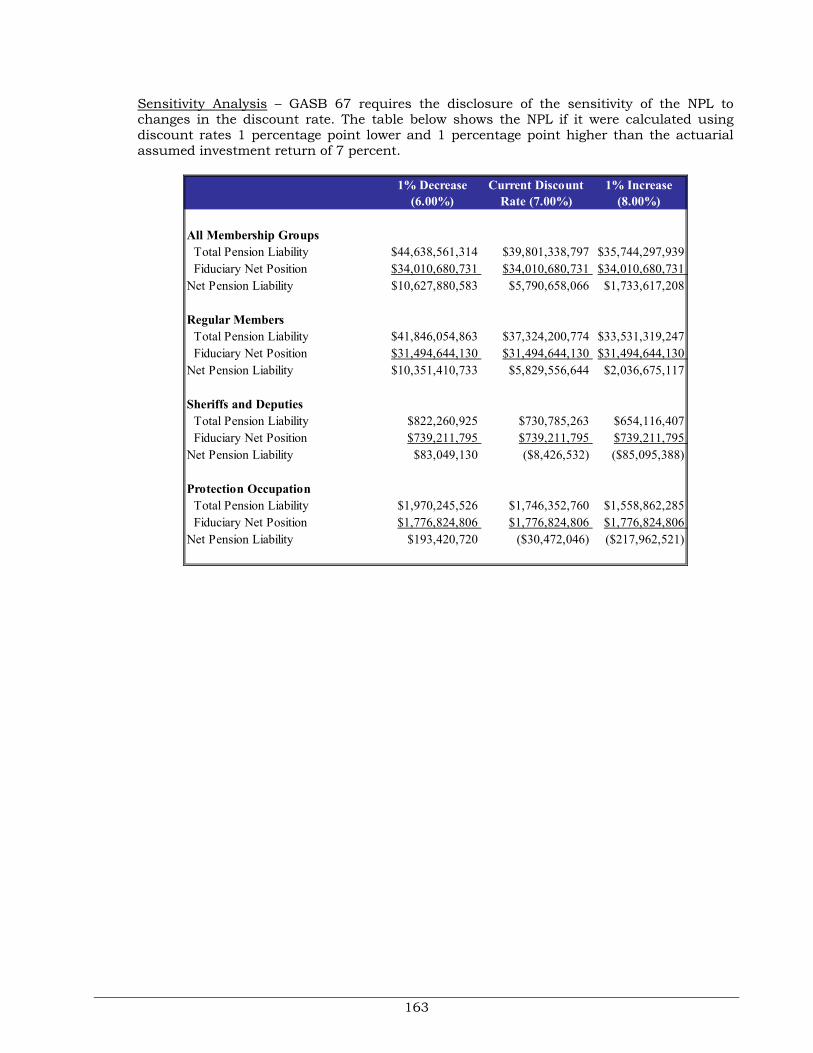
163
Sensitivity Analysis – GASB 67 requires the disclosure of the sensitivity of the NPL to changes in the discount rate. The table below shows the NPL if it were calculated using discount rates 1 percentage point lower and 1 percentage point higher than the actuarial assumed investment return of 7 percent.
1% Decrease (6.00%)
Current Discount Rate (7.00%)
1% Increase (8.00%)
All Membership Groups Total Pension Liability $44,638,561,314 $39,801,338,797 $35,744,297,939 Fiduciary Net Position $34,010,680,731 $34,010,680,731 $34,010,680,731 Net Pension Liability $10,627,880,583 $5,790,658,066 $1,733,617,208
Regular Members Total Pension Liability $41,846,054,863 $37,324,200,774 $33,531,319,247 Fiduciary Net Position $31,494,644,130 $31,494,644,130 $31,494,644,130 Net Pension Liability $10,351,410,733 $5,829,556,644 $2,036,675,117
Sheriffs and Deputies Total Pension Liability $822,260,925 $730,785,263 $654,116,407 Fiduciary Net Position $739,211,795 $739,211,795 $739,211,795 Net Pension Liability $83,049,130 ($8,426,532) ($85,095,388)
Protection Occupation Total Pension Liability $1,970,245,526 $1,746,352,760 $1,558,862,285 Fiduciary Net Position $1,776,824,806 $1,776,824,806 $1,776,824,806 Net Pension Liability $193,420,720 ($30,472,046) ($217,962,521)
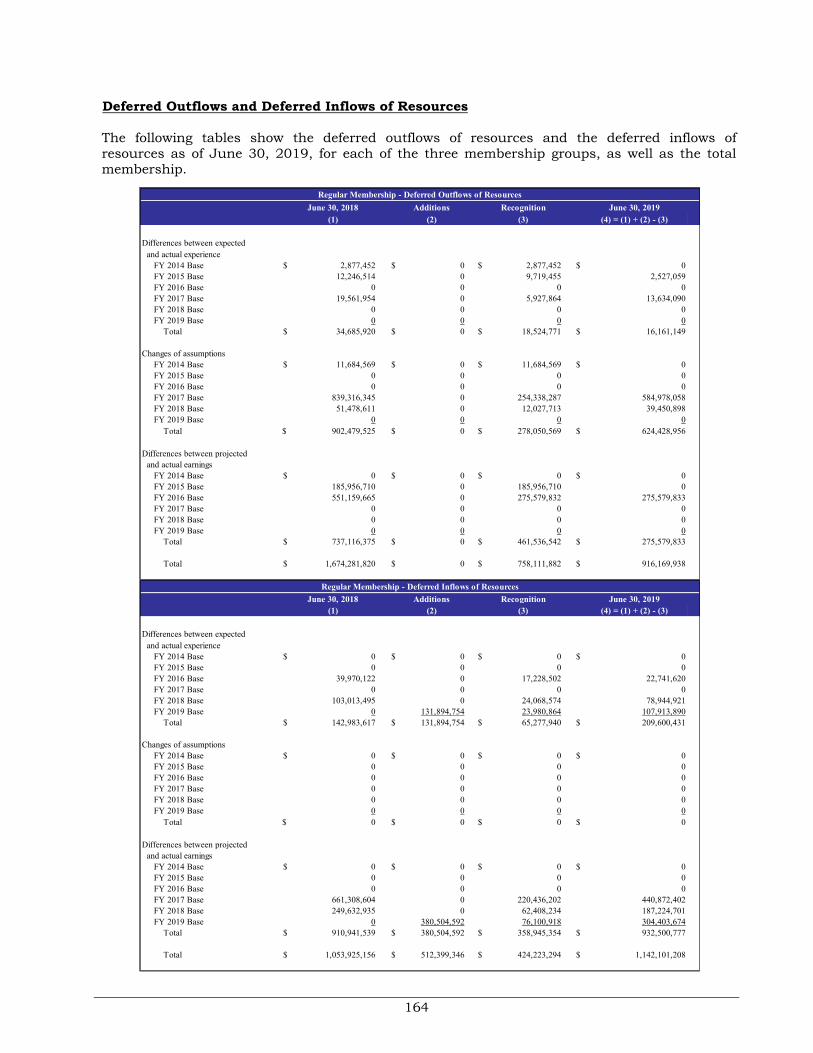
164
Deferred Outflows and Deferred Inflows of Resources
The following tables show the deferred outflows of resources and the deferred inflows of resources as of June 30, 2019, for each of the three membership groups, as well as the total membership.
June 30, 2018 Additions Recognition June 30, 2019
(1) (2) (3) (4) = (1) + (2) - (3)
Differences between expected and actual experience FY 2014 Base $ 2,877,452 $ 0 $ 2,877,452 $ 0 FY 2015 Base 12,246,514 0 9,719,455 2,527,059 FY 2016 Base 0 0 0 0 FY 2017 Base 19,561,954 0 5,927,864 13,634,090 FY 2018 Base 0 0 0 0 FY 2019 Base 0 0 0 0 Total $ 34,685,920 $ 0 $ 18,524,771 $ 16,161,149
Changes of assumptions FY 2014 Base $ 11,684,569 $ 0 $ 11,684,569 $ 0 FY 2015 Base 0 0 0 0 FY 2016 Base 0 0 0 0 FY 2017 Base 839,316,345 0 254,338,287 584,978,058 FY 2018 Base 51,478,611 0 12,027,713 39,450,898 FY 2019 Base 0 0 0 0 Total $ 902,479,525 $ 0 $ 278,050,569 $ 624,428,956
Differences between projected and actual earnings FY 2014 Base $ 0 $ 0 $ 0 $ 0 FY 2015 Base 185,956,710 0 185,956,710 0 FY 2016 Base 551,159,665 0 275,579,832 275,579,833 FY 2017 Base 0 0 0 0 FY 2018 Base 0 0 0 0 FY 2019 Base 0 0 0 0 Total $ 737,116,375 $ 0 $ 461,536,542 $ 275,579,833
Total $ 1,674,281,820 $ 0 $ 758,111,882 $ 916,169,938
June 30, 2018 Additions Recognition June 30, 2019(1) (2) (3) (4) = (1) + (2) - (3)
Differences between expected and actual experience FY 2014 Base $ 0 $ 0 $ 0 $ 0 FY 2015 Base 0 0 0 0 FY 2016 Base 39,970,122 0 17,228,502 22,741,620 FY 2017 Base 0 0 0 0 FY 2018 Base 103,013,495 0 24,068,574 78,944,921 FY 2019 Base 0 131,894,754 23,980,864 107,913,890 Total $ 142,983,617 $ 131,894,754 $ 65,277,940 $ 209,600,431
Changes of assumptions FY 2014 Base $ 0 $ 0 $ 0 $ 0 FY 2015 Base 0 0 0 0 FY 2016 Base 0 0 0 0 FY 2017 Base 0 0 0 0 FY 2018 Base 0 0 0 0 FY 2019 Base 0 0 0 0 Total $ 0 $ 0 $ 0 $ 0
Differences between projected and actual earnings FY 2014 Base $ 0 $ 0 $ 0 $ 0 FY 2015 Base 0 0 0 0 FY 2016 Base 0 0 0 0 FY 2017 Base 661,308,604 0 220,436,202 440,872,402 FY 2018 Base 249,632,935 0 62,408,234 187,224,701 FY 2019 Base 0 380,504,592 76,100,918 304,403,674 Total $ 910,941,539 $ 380,504,592 $ 358,945,354 $ 932,500,777
Total $ 1,053,925,156 $ 512,399,346 $ 424,223,294 $ 1,142,101,208
Regular Membership - Deferred Outflows of Resources
Regular Membership - Deferred Inflows of Resources

165
June 30, 2018 Additions Recognition June 30, 2019
(1) (2) (3) (4) = (1) + (2) - (3)
Differences between expected and actual experience FY 2014 Base $ 0 $ 0 $ 0 $ 0 FY 2015 Base 0 0 0 0 FY 2016 Base 0 0 0 0 FY 2017 Base 2,091,956 0 633,926 1,458,030 FY 2018 Base 0 0 0 0 FY 2019 Base 0 0 0 0 Total $ 2,091,956 $ 0 $ 633,926 $ 1,458,030
Changes of assumptions FY 2014 Base $ 0 $ 0 $ 0 $ 0 FY 2015 Base 0 0 0 0 FY 2016 Base 0 0 0 0 FY 2017 Base 16,949,549 0 5,136,227 11,813,322 FY 2018 Base 0 0 0 0 FY 2019 Base 0 0 0 0 Total $ 16,949,549 $ 0 $ 5,136,227 $ 11,813,322
Differences between projected and actual earnings FY 2014 Base $ 0 $ 0 $ 0 $ 0 FY 2015 Base 4,027,716 0 4,027,716 0 FY 2016 Base 12,182,183 0 6,091,092 6,091,091 FY 2017 Base 0 0 0 0 FY 2018 Base 0 0 0 0 FY 2019 Base 0 0 0 0 Total $ 16,209,899 $ 0 $ 10,118,808 $ 6,091,091
Total $ 35,251,404 $ 0 $ 15,888,961 $ 19,362,443
June 30, 2018 Additions Recognition June 30, 2019
(1) (2) (3) (4) = (1) + (2) - (3)
Differences between expected
and actual experience
FY 2014 Base $ 241,766 $ 0 $ 241,766 $ 0 FY 2015 Base 29,297 0 23,250 6,047
FY 2016 Base 1,177,325 0 507,468 669,857
FY 2017 Base 0 0 0 0
FY 2018 Base 2,839,904 0 663,529 2,176,375 FY 2019 Base 0 100,168 18,212 81,956
Total $ 4,288,292 $ 100,168 $ 1,454,225 $ 2,934,235
Changes of assumptions FY 2014 Base $ 296,187 $ 0 $ 296,187 $ 0
FY 2015 Base 0 0 0 0
FY 2016 Base 0 0 0 0 FY 2017 Base 0 0 0 0
FY 2018 Base 22,118,473 0 5,167,868 16,950,605
FY 2019 Base 0 0 0 0
Total $ 22,414,660 $ 0 $ 5,464,055 $ 16,950,605
Differences between projected
and actual earnings FY 2014 Base $ 0 $ 0 $ 0 $ 0
FY 2015 Base 0 0 0 0
FY 2016 Base 0 0 0 0
FY 2017 Base 14,840,198 0 4,946,732 9,893,466 FY 2018 Base 5,623,446 0 1,405,861 4,217,585
FY 2019 Base 0 8,883,510 1,776,702 7,106,808
Total $ 20,463,644 $ 8,883,510 $ 8,129,295 $ 21,217,859
Total $ 47,166,596 $ 8,983,678 $ 15,047,575 $ 41,102,699
Sheriffs and Deputies - Deferred Outflows of Resources
Sheriffs and Deputies - Deferred Inflows of Resources

166
June 30, 2018 Additions Recognition June 30, 2019
(1) (2) (3) (4) = (1) + (2) - (3)
Differences between expected and actual experience FY 2014 Base $ 0 $ 0 $ 0 $ 0 FY 2015 Base 0 0 0 0 FY 2016 Base 0 0 0 0 FY 2017 Base 827,223 0 250,674 576,549 FY 2018 Base 0 0 0 0 FY 2019 Base 0 2,187,950 397,809 1,790,141 Total $ 827,223 $ 2,187,950 $ 648,483 $ 2,366,690
Changes of assumptions FY 2014 Base $ 0 $ 0 $ 0 $ 0 FY 2015 Base 0 0 0 0 FY 2016 Base 0 0 0 0 FY 2017 Base 35,757,406 0 10,835,577 24,921,829 FY 2018 Base 0 0 0 0 FY 2019 Base 0 0 0 0 Total $ 35,757,406 $ 0 $ 10,835,577 $ 24,921,829
Differences between projected and actual earnings FY 2014 Base $ 0 $ 0 $ 0 $ 0 FY 2015 Base 9,512,487 0 9,512,487 0 FY 2016 Base 28,885,398 0 14,442,698 14,442,700 FY 2017 Base 0 0 0 0 FY 2018 Base 0 0 0 0 FY 2019 Base 0 0 0 0 Total $ 38,397,885 $ 0 $ 23,955,185 $ 14,442,700
Total $ 74,982,514 $ 2,187,950 $ 35,439,245 $ 41,731,219
June 30, 2018 Additions Recognition June 30, 2019
(1) (2) (3) (4) = (1) + (2) - (3)
Differences between expected and actual experience FY 2014 Base $ 459,978 $ 0 $ 459,978 $ 0 FY 2015 Base 885,530 0 702,801 182,729 FY 2016 Base 435,966 0 187,916 248,050 FY 2017 Base 0 0 0 0 FY 2018 Base 925,680 0 216,280 709,400 FY 2019 Base 0 0 0 0 Total $ 2,707,154 $ 0 $ 1,566,975 $ 1,140,179
Changes of assumptions FY 2014 Base $ 10,980 $ 0 $ 10,980 $ 0 FY 2015 Base 0 0 0 0 FY 2016 Base 0 0 0 0 FY 2017 Base 0 0 0 0 FY 2018 Base 1,284,472 0 300,110 984,362 FY 2019 Base 0 0 0 0 Total $ 1,295,452 $ 0 $ 311,090 $ 984,362
Differences between projected and actual earnings FY 2014 Base $ 0 $ 0 $ 0 $ 0 FY 2015 Base 0 0 0 0 FY 2016 Base 0 0 0 0 FY 2017 Base 35,280,377 0 11,760,125 23,520,252 FY 2018 Base 13,713,881 0 3,428,470 10,285,411 FY 2019 Base 0 21,076,026 4,215,205 16,860,821 Total $ 48,994,258 $ 21,076,026 $ 19,403,800 $ 50,666,484
Total $ 52,996,864 $ 21,076,026 $ 21,281,865 $ 52,791,025
Protection Occupation - Deferred Inflows of Resources
Protection Occupation - Deferred Outflows of Resources

167
June 30, 2018 Additions Recognition June 30, 2019
(1) (2) (3) (4) = (1) + (2) - (3)
Differences between expected and actual experience FY 2014 Base $ 2,877,452 $ 0 $ 2,877,452 $ 0 FY 2015 Base 12,246,514 0 9,719,455 2,527,059 FY 2016 Base 0 0 0 0 FY 2017 Base 22,481,133 0 6,812,464 15,668,669 FY 2018 Base 0 0 0 0 FY 2019 Base 0 2,187,950 397,809 1,790,141 Total $ 37,605,099 $ 2,187,950 $ 19,807,180 $ 19,985,869
Changes of assumptions FY 2014 Base $ 11,684,569 $ 0 $ 11,684,569 $ 0 FY 2015 Base 0 0 0 0 FY 2016 Base 0 0 0 0 FY 2017 Base 892,023,300 0 270,310,091 621,713,209 FY 2018 Base 51,478,611 0 12,027,713 39,450,898 FY 2019 Base 0 0 0 0 Total $ 955,186,480 $ 0 $ 294,022,373 $ 661,164,107
Differences between projected and actual earnings FY 2014 Base $ 0 $ 0 $ 0 $ 0 FY 2015 Base 199,496,913 0 199,496,913 0 FY 2016 Base 592,227,246 0 296,113,622 296,113,624 FY 2017 Base 0 0 0 0 FY 2018 Base 0 0 0 0 FY 2019 Base 0 0 0 0 Total $ 791,724,159 $ 0 $ 495,610,535 $ 296,113,624
Total $ 1,784,515,738 $ 2,187,950 $ 809,440,088 $ 977,263,600
June 30, 2018 Additions Recognition June 30, 2019(1) (2) (3) (4) = (1) + (2) - (3)
Differences between expected and actual experience FY 2014 Base $ 701,744 $ 0 $ 701,744 $ 0 FY 2015 Base 914,827 0 726,051 188,776 FY 2016 Base 41,583,413 0 17,923,886 23,659,527 FY 2017 Base 0 0 0 0 FY 2018 Base 106,779,079 0 24,948,383 81,830,696 FY 2019 Base 0 131,994,922 23,999,076 107,995,846 Total $ 149,979,063 $ 131,994,922 $ 68,299,140 $ 213,674,845
Changes of assumptions FY 2014 Base $ 307,167 $ 0 $ 307,167 $ 0 FY 2015 Base 0 0 0 0 FY 2016 Base 0 0 0 0 FY 2017 Base 0 0 0 0 FY 2018 Base 23,402,945 0 5,467,978 17,934,967 FY 2019 Base 0 0 0 0 Total $ 23,710,112 $ 0 $ 5,775,145 $ 17,934,967
Differences between projected and actual earnings FY 2014 Base $ 0 $ 0 $ 0 $ 0 FY 2015 Base 0 0 0 0 FY 2016 Base 0 0 0 0 FY 2017 Base 711,429,179 0 237,143,059 474,286,120 FY 2018 Base 268,970,262 0 67,242,565 201,727,697 FY 2019 Base 0 410,464,128 82,092,825 328,371,303 Total $ 980,399,441 $ 410,464,128 $ 386,478,449 $ 1,004,385,120
Total $ 1,154,088,616 $ 542,459,050 $ 460,552,734 $ 1,235,994,932
Deferred Outflows of ResourcesTotal Membership
Deferred Inflows of Resources

168
Pension Expense
The following tables show the summary of pension expense as of June 30, 2019, for each of the three membership groups, as well as the total membership.
REGULAR MEMBERS
Service Cost at end of year $807,424,088
Interest on the Total Pension Liability 2,467,854,953
Current-period benefit term changes 0
Expensed portion of current-period difference between expected and actual experience in the Total Pension Liability (23,980,864)
Expensed portion of current-period assumption changes 0
Employee contributions including service purchases (485,925,506)
Projected earnings on plan investments (2,065,930,457)
Expensed portion of current-period difference between projected and actual earnings on plan investments (76,100,918)
Administrative expenses 15,042,973
Recognition of beginning Deferred Outflows of Resources 758,111,882
Recognition of beginning Deferred Inflows of Resources (324,141,512) Total Pension Expense $1,072,354,639
Note: System experience and assumption changes are recognized over the average expected remainingservice life for all System members, which is 5.50 years.

169
SHERIFFS AND DEPUTIES
Service Cost at end of year $20,194,364
Interest on the Total Pension Liability 47,643,194
Current-period benefit term changes 0
Expensed portion of current-period difference between expected and actual experience in the Total Pension Liability (18,212)
Expensed portion of current-period assumption changes 0
Employee contributions including service purchases (11,543,120)
Projected earnings on plan investments (48,157,751)
Expensed portion of current-period difference between projected and actual earnings on plan investments (1,776,702)
Administrative expenses 122,156
Recognition of beginning Deferred Outflows of Resources 15,888,961
Recognition of beginning Deferred Inflows of Resources (13,252,661) Total Pension Expense $9,100,229
Note: System experience and assumption changes are recognized over the average expected remaining service life for all System members, which is 5.50 years

170
PROTECTION OCCUPATION
Service Cost at end of year $54,828,429
Interest on the Total Pension Liability 113,022,969
Current-period benefit term changes 0
Expensed portion of current-period difference between expected and actual experience in the Total Pension Liability 397,809
Expensed portion of current-period assumption changes 0
Employee contributions including service purchases (25,187,547)
Projected earnings on plan investments (115,454,727)
Expensed portion of current-period difference between projected and actual earnings on plan investments (4,215,205)
Administrative expenses 532,398
Recognition of beginning Deferred Outflows of Resources 35,041,436
Recognition of beginning Deferred Inflows of Resources (17,066,660) Total Pension Expense $41,898,902
Note: System experience and assumption changes are recognized over the average expected remainingservice life for all System members, which is 5.50 years.

171
ALL MEMBERSHIP GROUPS
Service Cost at end of year $882,446,881
Interest on the Total Pension Liability 2,628,521,116
Current-period benefit term changes 0
Expensed portion of current-period difference between expected and actual experience in the Total Pension Liability (23,601,267)
Expensed portion of current-period assumption changes 0
Employee contributions including service purchases (522,656,173)
Projected earnings on plan investments (2,229,542,935)
Expensed portion of current-period difference between projected and actual earnings on plan investments (82,092,825)
Administrative expenses 15,697,527
Recognition of beginning Deferred Outflows of Resources 809,042,279
Recognition of beginning Deferred Inflows of Resources (354,460,833) Total Pension Expense $1,123,353,770
Note: System experience and assumption changes are recognized over the average expected remaining service life for all System members, which is 5.50 years

172
Amortization of Deferred Outflows and Deferred Inflows of Resources
The following tables show the deferred outflows of resources and the deferred inflows of resources as of June 30, 2019, for each of the three membership groups, as well as the total membership which will be recognized in pension expense in future years.
Regular Membership Year Ended June 30:
Deferred Outflows
of Resources
Deferred Inflows
of Resources
Net Deferred Outflows/(Inflows)
of Resources
2020 $550,400,756 $424,223,294 $126,177,462 2021 272,293,864 412,507,908 (140,214,044)2022 90,107,559 186,558,589 (96,451,030)2023 3,367,759 106,820,983 (103,453,224)2024 0 11,990,434 (11,990,434)
Thereafter 0 0 0
Sheriffs and Deputies Year Ended June 30:
Deferred Outflows
of Resources
Deferred Inflows
of Resources
Net Deferred Outflows/(Inflows)
of Resources
2020 $11,861,244 $14,492,419 ($2,631,175)2021 5,770,153 14,141,295 (8,371,142)2022 1,731,046 9,032,174 (7,301,128)2023 0 3,427,703 (3,427,703)2024 0 9,108 (9,108)
Thereafter 0 0 0

173
ALL MEMBERSHIP GROUPS
Protection Occupation Year Ended June 30:
Deferred Outflows
of Resources
Deferred Inflows
of Resources
Net Deferred Outflows/(Inflows)
of Resources
2020 $25,926,760 $20,290,835 $5,635,925 2021 11,484,060 19,980,326 (8,496,266)2022 3,723,685 8,160,066 (4,436,381)2023 397,809 4,359,798 (3,961,989)2024 198,905 0 198,905
Thereafter 0 0 0
Year Ended June 30:
Deferred Outflows
of Resources
Deferred Inflows
of Resources
Net Deferred Outflows/(Inflows)
of Resources
2020 $588,188,760 $459,006,548 $129,182,212 2021 289,548,077 446,629,529 (157,081,452)2022 95,562,290 203,750,829 (108,188,539)2023 3,765,568 114,608,484 (110,842,916)2024 198,905 11,999,542 (11,800,637)
Thereafter 0 0 0

OFFICE OF AUDITOR OF STATESTATE OF IOWA
State Capitol Building
Des Moines, Iowa 50319-0006
Telephone (515) 281-5834 Facsimile (515) 281-6518
Rob Sand Auditor of State
174
Independent Auditor’s Report on Internal Control over Financial Reporting and on Compliance and Other Matters
Based on an Audit Performed in Accordance with Government Auditing Standards
To the Members of the Iowa Public Employees’ Retirement System Investment Board:
We have audited in accordance with U.S. generally accepted auditing standards and the standards applicable to financial audits contained in Government Auditing Standards, issued by the Comptroller General of the United States, the columns titled 2019 Actual Employer Contributions, Employer Allocation Percentage, the total for all entities of the columns titled Net Pension Liability or Net Pension Liability/(Asset), Total Deferred Outflows of Resources, Total Deferred Inflows of Resources and Total Proportionate Share of Allocable Plan Pension Expense (specified column totals) included in the accompanying Schedules of Employer Allocations and Collective Pension Amounts by Employer (Schedules) of the Iowa Public Employees’ Retirement System (IPERS) for the regular, sheriffs and deputies and protection occupation membership groups as of and for the year ended June 30, 2019 and the related Notes to Schedules, and have issued our report thereon dated February 26, 2020.
Internal Control Over Financial Reporting
In planning and performing our audit of the Schedules, we considered IPERS’ internal control over financial reporting to determine the audit procedures appropriate in the circumstances for the purpose of expressing our opinion on the Schedules, but not for the purpose of expressing an opinion on the effectiveness of IPERS’ internal control. Accordingly, we do not express an opinion on the effectiveness of IPERS’ internal control.
A deficiency in internal control exists when the design or operation of a control does not allow management or employees, in the normal course of performing their assigned functions, to prevent or detect and correct misstatements on a timely basis. A material weakness is a deficiency, or a combination of deficiencies, in internal control such that there is a reasonable possibility a material misstatement of IPERS’ Schedules will not be prevented or detected and corrected on a timely basis. A significant deficiency is a deficiency, or a combination of deficiencies, in internal control which is less severe than a material weakness, yet important enough to merit attention by those charged with governance.
Our consideration of internal control was for the limited purpose described in the first paragraph of this section and was not designed to identify all deficiencies in internal control that might be material weaknesses or significant deficiencies. Given these limitations, during our audit we did not identify any deficiencies in internal control we consider to be material weaknesses. However, material weaknesses may exist which have not been identified.

175
Compliance and Other Matters
As part of obtaining reasonable assurance about whether IPERS’ Schedules are free of material misstatement, we performed tests of its compliance with certain provisions of laws, regulations, contracts and grant agreements, non-compliance with which could have a direct and material effect on the determination of Schedule amounts. However, providing an opinion on compliance with those provisions was not an objective of our audit and, accordingly, we do not express such an opinion. The results of our tests disclosed no instances of noncompliance or other matters which are required to be reported under Government Auditing Standards.
Purpose of this Report
The purpose of this report is solely to describe the scope of our testing of internal control and compliance and the results of that testing and not to provide an opinion on the effectiveness of IPERS’ internal control or on compliance. This report is an integral part of an audit performed in accordance with Government Auditing Standards in considering IPERS’ internal control and compliance. Accordingly, this communication is not suitable for any other purpose.
We would like to acknowledge the many courtesies and assistance extended to us by personnel of IPERS during the course of our audit. Should you have any questions concerning any of the above matters, we shall be pleased to discuss them with you at your convenience.
Marlys K. Gaston, CPA Deputy Auditor of State
February 26, 2020

Iowa Public Employees’ Retirement System
Schedule of Findings
Year ended June 30, 2019
176
Findings Related to the Schedules:
INTERNAL CONTROL DEFICIENCIES:
No material weaknesses in internal control over financial reporting were noted.
INSTANCES OF NON-COMPLIANCE:
No matters were noted.

Iowa Public Employees’ Retirement System
Staff
177
This audit was performed by:
Marlys K. Gaston, CPA, Deputy Pamela J. Bormann, CPA, Manager Cole L. Hocker, CPA, Senior Auditor II Steven D. Rater, Staff Auditor Michael S. Team, Assistant Auditor
Copyright © 2022 FDOKUMEN