
of the scientific-technical union of mechanical engineering
139
2
-
Upload
khangminh22 -
Category
Documents
-
view
3 -
download
0
Transcript of of the scientific-technical union of mechanical engineering

2

S C I E N T I F I C P R O C E E D I N G S OF THE SCIENTIFIC-TECHNICAL UNION OF MECHANICAL ENGINEERING
Year XX Volume 6/135 SEPTEMBER 2012
IV INTERNATIONAL CONGRESS MMAACCHHIINNЕЕSS,, TTEECCHHNNOOLLООGGIIEESS,,
MMAATTEERRIIAALLSS 22001122 September 19 – 21 2011 VARNA, BULGARIA
IV МЕЖДУНАРОДЕН КОНГРЕС ""ММААШШИИННИИ,, ТТЕЕХХННООЛЛООГГИИИИ,,
ММААТТЕЕРРИИААЛЛИИ"" 22001122 19– 21 СЕПТЕМВИ 2011, ВАРНА, БЪЛГАРИЯ
VOLUME 2 ТОМ SECTION MACHINES. MATERIALS СЕКЦИЯ: „МАШИНИ. МАТЕРИАЛИ”
SYMPOSIUM „POWER TRANSMISSIONS 2012’’SYMPOSIUM „BULTRIB 2012“ SYMPOSIUM “INDUSTRIAL DESIGN
ENGINEERING & ERGONOMICS 2012’’
ISSN 1310-3946

C O N T E N T S DIAGNOSIS OF TECHNICAL CONDITION IN DIESEL ENGINE TRIBOLOGY ASSEMBLIES Karić A. ....................................................................................................................................................................... 5 ROTARY INTERNAL-COMBUSTION ENGINE OF TURBO-COMPRESSOR TYPE Tokarev Al., M. Tokarev ............................................................................................................................................. 9 ПЛАСТИЧНИЯТ СТИЛ В МОДАТА НА 21 ВЕК Димитрова П. ........................................................................................................................................................... 12 THEORETICAL ASSESSMENT OF THE FRICTION COEFFICIENT OF A THRUST ROLLER BEARING Kolev P. ..................................................................................................................................................................... 15 DEFINING THE OPTIMAL BANDWIDTH IN BRIDGE POWER CONVERTERS Stefanov G., Lj. Karadzinov, V. Sarac, R. Dambov ................................................................................................. 19 APPLICATION OF SPHERICAL BEARINGS IN TURBOFAN AIRCRAFT ENGINE Rejman E., M. Rejman .............................................................................................................................................. 23 ERGONOMIC RESEARCH FOR THE QUALITY OF THE ENGINEERING TRAINING Karamanska D., I. Yoshovska I. ................................................................................................................................ 27 ALTERABLE IN TIME TRANSFORMATION OF AGGRIGATIVE STATE OF MACHINE SYSTEM WITH CHANGEABLE STRUCTURE AND COMPONATICS ON BASIS OF AUTOMATICALLY RENEWABLE PRISMATIC MODULAR UNITS Tsaryev A. ................................................................................................................................................................. 31 SYSTEMATIC AND METHODICAL APPROACHES TO LIGHTING DESIGN. “SATI” SYSTEM Kyuchukov T. ............................................................................................................................................................ 35 TROUBLESHOOTING FOR RELIEF VALVES USED IN HYDRAULIC SYSTEMS Yasar P., H. Sevil1 .................................................................................................................................................... 37 PRESSURE RELIEF VALVE SELECTION AND APPLICATIONS FOR HYDRAULIC SYSTEMS H. Sevil ...................................................................................................................................................................... 40 ANALYSIS OF TRIBOLOGICAL PROCESSES OF CONSTRUCTION MATERIALS IN THE SOIL MASS ABRASIVE WEAR PROCESS. Napiórkowski J. P. Drożyner, K. Kołakowski, P.Mikołajczak ................................................................................. 44 TEORETICAL ASPECTS OF ENGINEERING DESIGN Georgieva B. .............................................................................................................................................................. 47 VIBRATION SIGNATURE ANALYSIS OF THE BEARINGS FROM FAN UNIT FOR FRESH AIR IN THERMO POWER PLANT REK BITOLA Geramitchioski T., Lj.Trajcevski .............................................................................................................................. 50 HETEROSTRUCTURED ANTIFRICTION AND ANTISCUFF ADDITIVES FOR LUBRICATING MATERIALS WITH REGULATED TRIBOLOGICAL PROPERTIES Gorokhovsky A., V. Safonov, A. Azarov, E. Tretyachenko ..................................................................................... 55 THERMAL GROWTH INFLUENCE ON THE SHAFT ALIGNMENT AND VIBRATION OF CENTRIFUGAL PUMP Priževaitis A., D. Litvinov, E. Geriņš ....................................................................................................................... 59

THE EFFECT OF MICROSTRUCTURE OF COMMERCIALLY PURE COPPER ON TRIBOLOGICAL PROPERTIES Semenov V., S.-J. Huang, L. Shuster, S. Chertovskikh, S. Faizova, P.-Ch. Lin ....................................................... 61 INVESTIGATION OF WEAR BEHAVIOUR OF HARDFACE CLADDINGS REINFORCED BY FERROCHROMIUM AND FERROBORON POWDERS Yuksel N. ................................................................................................................................................................... 65 ERGONOMIC REQUIREMENTS AND FURNITURES SPECIALITY OF CLASSROOMS Dobreva D., S. Vachinska S. ..................................................................................................................................... 66 THE THIRD TEACHER: NEW APPROACH TO DESIGN OF EDUCATIONAL ENVIRONMENT FOR CHILDREN Nikolova D. ….......................................................................................................................................................… 70 EКОДИЗАЙНЪТ КАТО ФАКТОР ЗА БЪДЕЩО РАЗВИТИЕ НА ЕКОЛОГОСЪОБРАЗНИ МЕБЕЛИ В МЕБЕЛНАТА ПРОМИШЛЕНОСТ Банкова А. Г. Жечева ..........................................................................................................................................… 74 FEATURES OF MECHANISMS AND MACHINES WITH RETARDED FEEDBACK Zhunisbekov P.,. Bekbossynov ................................................................................................................................. 78 BLADE GROUP RESONANT STRESSES FEM SIMULATIONS Petreski Z., G. Tasevski ............................................................................................................................................. 81 PRINCIPLES OF AUTOMATED EQUIPMENT DEVELOPMENT FOR PROCESSING PRECISE FORGED COMPONENTS MADE OF HEAT-RESISTANT ALLOYS Sukhorukov R., F.Utyashev, A.Blagonravov ............................................................................................................ 85 ECLECTICISM OF CHOICE OR EMOTION BY CONTRAST Ochkova-Dimitrova E. .............................................................................................................................................. 88 CORPORATE BPM ACTIVITIES TOOLS IN THE BULGARIAN ENTERPRISES Nikolova - Alexieva V. ............................................................................................................................................. 91 THE IMPORTANCE OF USER AND TASK ANALYSIS FOR THE DESIGN OF NEW SYSTEMS INTERFACES Ivanova-Vassileva S. ................................................................................................................................................. 95 DESIGN OPTIMIZATION ON EVELATOR CAR FOR DOUBLE-DECK SYSTEM Imrak C., M. Kocaman .................................................................................................................................................................................... 99 DESIGN AND ANALYSIS WITH FINITE ELEMENT METHOD OF JIB CRANE Gerdemeli I., S. Kurt., B. Tasdemir ........................................................................................................................ 103 ANALYSIS WITH FINITE ELEMENT METHOD OF WIRE ROPE Gerdemeli I., S. Kurt, A. Anıl ................................................................................................................................. 107 ANALYSIS OF BELT CONVEYOR USING FINITE ELEMENT METHOD Kurt S., I. Gerdemeli, C. Cengiz ............................................................................................................................. 111 ЦВЕТНИ АКЦЕНТИТЕ В ИНТЕРИОРА (АНАЛИЗИ КЪМ ПОСТАНОВКА НА ВЪПРОСА) Евтимова M. ........................................................................................................................................................... 114 DESIGN OF MINE SHAFT ELEVATOR Gerdemeli I., A. Candas, M. Unalan ....................................................................................................................... 117

ПРОЧНОСТЬ СТАЛЬНЫХ ИЗДЕЛИЙ ДЛЯ УНИКАЛЬНЫХ МЕТАЛЛИЧЕСКИХ КОНСТРУКЦИЙ Ведяков И., П. Одесский, А. Егорова …..........................................................................................................… 121 REMODELING AND ENVIRONMENTAL ADAPTATION OF CONCRETE BATCHING FACTORY González L., J. Sanz, E. Sánchez, T. Alquezar, R. Escribano, R. Aroca, E. Chavarría, J. Sola 123 ОТНОСНО ЗНАЧЕНИЕТО НА ЛОГОТО, КАТО СИМВОЛ ЗА ПРОДУКТИТЕ НА АВТОМОБИЛНАТА ИНДУСТРИЯ Върбанова Д. .......................................................................................................................................................... 127 СТРУЙНО-АБРАЗИВНА ИЗНОСОУСТОЙЧИВОСТ НА ГАЗОТЕРМИЧНИ ПОКРИТИЯ С МИКРОЧАСТИЦИ Кандева М., И. Пейчев .......................................................................................................................................... 131 MEASURING THE MOMENT OF FRICTION, COEFFICIENT OF FRICTION AND ANGLE OF FRICTION IN THE SLIDING BEARINGS FOR UNSTEADY MOTION Pllana G., F. Azemi ................................................................................................................................................. 136 MODERN TEHNOLOGIES OF PROJECTING, CONSTRUCTING AND MAKING OF CHAIN DRIVES ARE FROM POLYMERIC COMPOSITES Pilipenko O. ............................................................................................................................................................ 139

DIAGNOSIS OF TECHNICAL CONDITION IN DIESEL ENGINE TRIBOLOGY ASSEMBLIES
Alija Karić, PhD Faculty of Technology – University of Tuzla, Bosnia and Herzegovina
Abstract: Lubrication is the primary activity in prevention maintenance of technical systems and is defined as the
application of certain lubricant in order to decrease the force as well as the wear and sliding surface damaging. Sliding surface material which causes these effects represents grease. Even though the lubrication process and grease are defined solely from tribological aspect, their primary role is much more important and diversely expressed in the wide range of technical systems. Each role demands a specific grease and its additives' characteristics. This paper will show the experimental investigation results performed on the gear (dumper trucks' diesel engines) in the ,,Banovići'' coal mine, while the laboratory sample examination of grease has been performed in the "Modriča'' oil refinery.
Keywords: TRIBOLOGICAL SYSTEM, TECHNICAL STATE, DIESEL ENGINE
1. INTRODUCTION The basic function of lubrication oil in tribo-mechanical system is of tribological nature and consists of disuniting the direct impact between contact surfaces which have a relative movement – this is the role of lubrication in the narrow sense. However, grease as an element of a system also has other functions related to protection of elements from other (non- tribological) influences. Components of a tribomechanical system are exposed to effects of heat generated by friction, but they, in addition, absorb heat that is being produced through processes of internal combustion of fuel or compression of the working medium. Grease exhibits the role of absorbing heat from rotational elements and transferring it onto the bearing box or leading it from the tribomechanical system thanks to continuous movement through the circulatory system of greasing (1).
2. THEORETICAL EXPLORATIONS The greatest number of machine systems has one or more pairs of elements that are interconnected and in a state of relative movement. The characteristics of these mutual contacts of elements are defined through mutual physical exertion and the shape of of contact surface, type and intensity of relative movement, topography of surfaces in contact, kinds of materials in the contact zone, generated thermal energy, etc. The contact of two elements with a third element that separates them in a smaller or larger manner is called a TRIBOLOGICAL SYSTEM (TS). The internal process in a tribological system is called TRIBOLOGICAL PROCESS (TP), which usually encompasses friction and attrition of contact surfaces (2). Practice in machine and mechanisms exploitation has shown that providing prognoses regarding their spoilage is in an entire string of cases most efficient when based on parameters that directly “bear witness” to processes of fraying – particles that are result of fraying. Through examination of oil sample containing particles that originated from fraying, it is possible to evaluate the condition of TS in early stages of utilization. Generally, the concentration of particles in the sample and their distribution through dimensions exhibits the velocity of fraying and level of scuffing. Equable concentration of minuscule particles fits normal working regime. An abrupt appearance of bigger particles in the oil points to the beginning of process of catastrophic scuffing.
For years, most laboratories that were engaged in analysis of grease from the exploitation process, have been examining certain physical and chemical alterations, such as: - viscosity on various temperatures, - temperature of ignition, - neutralizing number (acidic number), - fuel contents, - water contents etc. Further development of methods expanded those explorations also to: - determining contamination of grease with metal particles, as well as - determining only chemical changes in oil, not only qualitatively but also quantitatively. Today, the most significant are the following methods: - gas chromatography, - atomic absorption and emission spectroscopy, - infrared spectroscopy, - ultraviolet spectroscopy, - mass spectroscopy and - nuclear magnetic resonance.
Among these methods, the most significant are atomic spectroscopy and differential infrared spectrometry, which, combined with membrane filtration offer the greatest number of most reliable data.
5

3. Experimental research
3.1. Experiment plan The research was conducted on the surface pit in hard coal mine – Banovići, on dumper trucks: Tereks-MT 3600 B with bearing capacity 1540KN int. mark (5), Mark 36 with bearing capacity 1540KN int. mark (11) and Tereks-MT 3600 B with bearing capacity 1540KN int. mark (4). The requirements for implementation of the aim were fulfilled as follows: – technical systems, – tribological system, – research parameters, – temporal interval of oil samples, – methods of examining oil, – means-appliances for examination, – oil examination, – analysis of acquired research data, – analysis of measured quantities – comparison with boundary values – concluding observations.
3.2. Technical systems In the process of coal exploitation, in hard coal mine – Banovići mining machinery and equipment of great capacities is applied, which results in vast amounts of mined mineral raw materials. This paper will, due to spatial limitations, represent research results only for dumper Mark-36. In hard coal mine “Banovići” temporal status images are meticulously managed. Temporal status image is the result of working process and processes of conducting maintenance, and represents the elementary basis for research of system efficacy during working process. Analysis of temporal status image of dumper truck Mark-36 has shown that the critical subsystem, from the standpoint of quantity and duration of status “TERMINATED”, is in fact the diesel motor. These dumpers have built in diesel motors CUMMINS – KTA 50 C with 1194 (KW) output with 1900 o/min. Experiences with exploitation have proved that newly built motors generally undergo repair after 18.000 – 20.000 motor hours in average. After the general repair is completed, these motors work 7.000 motor hours. The manufacturer gives warranty for one year on a new motor and extended warranty on certain sub-assemblies and elements such as motor block and crankshaft. During warranty period, it is necessary to strictly uphold manufacturer's instruction manuals regarding exploitation and motor maintenance. The manufacturer prescribed manuals for maintaining and monitoring the work of the motor during exploitation. Therefore, according to this manual, oil gets changed after 250 hours of motor work in exploitation. These motors use motor oil 15W-40, which has the characteristics in accordance with those prescribed by the manufacturer. Evaluation of the motor's state in exploitation is conducted through monitoring working parameters, such as: pressure, temperature, number of orbits etc. In order to extend the working life of the motor, that is, to reduce the number and duration of standstill, monitoring working parameters only is not sufficient. It is necessary to include new methods of maintenance, which would reflect maintenance according to status. For this purpose, a new diagnostic method of ascertaining the status of diesels motors was included – procedure of control of fraying and combustion. Practice in exploitation of technical systems has shown that prognosis of their breakdowns in an array of cases is most efficient when based on parameters that are direct 'witnesses' of fraying process – particles that arise through fraying. Examination of oil samples with particles from fraying process enables the assessment of the state of tribological assemblies in the early stages of usage. Generally, the concentration of particles in a
sample and their distribution through dimensions points to velocity of fraying and level of wearing. Normal working regime requires a leveled concentration of small particles. Abrupt increase in larger particles in oil points to the beginning of the process of catastrophic fraying. 3.3. Defining tribological systems Experimental research was conducted in exploitation conditions on sliding bearings (recumbent and volatile) of the crankshaft in diesel motor Cummins KTA50C, which were built in dumper trucks, and they are the subject of this research. Tribological systems, in this concrete case, are consisted of trunnions of reciprocating rod (recumbent – main and volatile), their associated sliding bearings (sleeves – halves) and greasing substance (oil).
3.4. Defining time intervals of oil sampling Oil sampling during exploitation is the most critical aspect of its analysis, with the aim of acquiring data which serve as basis for diagnosing the status of a lubricated system, from the aspect of state of tribological assemblies, as well as from the aspect of state of lubricating oil. Literature recommends sampling intervals when it comes to lubricating oil. For diesel motor, the recommended interval of sampling is 150 – 500 working hours. These recommendations apply to typical equipment which is used in average conditions. Considering the fact that technical systems which are subject of these experimental research work in difficult conditions (geo-mechanical, temporal, etc.), it is necessary, while determining the dynamics of sampling, to take into account other influential factors. Those factors refer to various consequences of failure, exploitation conditions from the aspect of working regime and maintenance conditions, age of the system, age of the lubricant, defined tolerance in changing oil and the entire system. According to manufacturer's recommendations, in Cummins diesel engines oil is changed every 250 motor hours, so this factor should also be included while determining the dynamics of sampling. Taking into account factors such as: gravity of consequences of failure, exploitation conditions, age of the system and oil change period, for this experimental research the following sampling dynamics was determined – new oil sample is taken, then a sample is taken after 100, 150, 200 and 250 motor hours when oil is changed, after which the procedure is repeated.
3.5. Defining quantity and manner of oil sampling In order to acquire a representative sample, considering the fact that a non-representative sample inevitably renders all following steps in analysis procedure unsuccessful, results in inaccurate diagnosis of status and presents a basis for reaching inaccurate conclusions and conducting wrong activities in maintenance, it was determined that samples should be taken from three dumper trucks of the same bearing capacities, which work in very similar conditions. Ten samples were taken for every dumper, which means that the procedure was repeated twice, due to limited possibilities in sampling since sampling was conducted in dumper exploitation stage. During oil sampling (determining location, procedure and sampling instruments), rules described in the theoretical part were complied with. 3.6. Defining methods of oil examination There is a great number of different tests within oil analysis that are used while assessing status. Tests must cover three
6

interest areas: – state of the technical system, – state of impurities in lubricant and – state of the lubricant. The term “oil analysis” has been accepted in the industry and can be understood in a way that the primary area of interest is analysis of state of the lubricant, while in reality, that is in fact monitoring the status of the technical system. From the aspect of mechanical system state, special attention should be paid to appearance and changing trends of the number of mechanical particles in the oil. The second focus would be state of the lubricant, where it is significant to consider the signs that point to appearance of viscosity, increase of oxidation and additive wasting. The third focus includes the state of impurities in oil, where attention should be paid to the quantity of particles, water content and metallic impurities. Theoretically, oil analyses are divided into three classes. In reality, all three classes of status monitoring are interconnected and must be observed as a whole. In practice, it is common to talk about conventional or classical laboratory technique and methodology of quality control of lubricant on the one hand, and on the other hand, about modern instrumental technique which has been perfected during the past years so much that it provides desired data. Considering the complexity of this problem, in practice, of course depending on equipment of certain laboratories, all known methods of examining lubricant characteristics changes during exploitation are used. For years, most laboratories examined certain physical and chemical changes, such as: – viscosity on various temperatures, – ignition temperature, – neutralizing number (acidic number), – content of non-soluble materials in organic solvents, – content of fuel, – content of water, – color. With further perfection of methods, these examinations have expanded also to certain contaminations of lubricants with metallic particles, as well as to determining the very chemical change in oil, not only qualitatively but also quantitatively.
Today, the most significant are the following methods: – gas chromatography, – atomic absorption and emission spectroscopy, – infrared spectroscopy, – ultraviolet spectroscopy, – mass spectroscopy, – nuclear magnetic resonance. In this research the following methods were employed: a) To determine changes in physical and chemical oil characteristics: – Kinematic viscosity (mm²/s) on temperatures 40°/C and 100°/C – examination conducted according to standard BAS ISO 3104 and DIN 51526, – Viscosity index – examination conducted according to standard BAS ISO 2909 and ASTM D 2207, – Ignition point – examination conducted according to standard ISO 2592 and ASTM D 92, – Total basis number (TBN) (mgKOH/g) – examination conducted according to standard BAS ISO 3771, – Neutralization number (TAN) (mgKOH/g) – examination conducted according to standard ASTM 664. b) In order to determine metal content (Fe, Cu, Al, Pb) (mg/kg-ppm) – examination conducted according to standard ASTM D 5863, that is, atomic absorption spectrometry was applied. 3.7. Results of experiments In the following tables the results of researching physical and chemical characteristics of oil and presence of mechanical impurities in oil are represented. Here, only the results for diesel motor CUMMINS – KTA 50 C, which is built in a dumper Mark 36 internal mark (11) are shown. Laboratory examinations of oil were conducted in Oil refinery Modriča.
Table 1. Physical and chemical characteristics of oil
x y visc40 visc100 IV TP TBN TAN new oil 0 m/hr 103,12 13.82 135 234 8,89 2,69 2 100 m/hr 103,97 14,01 136 224 9,4 3,06 3 160 m/hr 103,84 14,17 139 218 9,4 3,17 4 200 m/hr 102,86 14,11 140 222 9,43 3,22 5 243m/hr 102,79 14,03 138 224 9,38 3,22 6 0 m/hr 110,07 14,59 136 237 10,18 2,71 7 100 m/hr 104,37 14,09 137 228 9,7 3,06 8 200 m/hr 104,17 14,06 137 230 9,7 3,19 9 246 m/hr 103,85 14,05 137 235 9,6 3,18 10 0 m/hr 112,7 15,15 140 234 10,05 2,93 11 120 m/hr 98,87 13,83 141 225 9,39 2,75 12 270 m/hr 94,74 13,51 143 227 9,46 2,87 Table 2. Presence of mechanical impurities in oil Fe Cu Pb Al Cr m/hr 11,65 1,92 5,96 0 0 33271 7,11 0,91 1,88 4,57 0 33371 5,66 0,61 1,89 4,58 0 33431 9,13 0,69 2,52 5,74 0 33471 5,85 0,7 1,87 11,34 0 33514 11,46 0,86 0 0 0 33750 3,89 0,8 1,24 6,79 0 33850 4,95 0,41 1,9 29,98 0 33950 5,43 0,41 2,53 16,08 0 33996 19,8 0,92 5,65 0 0 5,57 0,43 1,22 15,9 2,46 34116 4,94 0,65 2,43 18,14 1,64 34266
7

Upon laboratory examinations of oil and data analysis, a regression analysis was conducted for every characteristic separately in order to determine the trend, that is to establish mathematical models of oil characteristics changes and presence of mechanical impurities (presence of metals) in accordance to time of oil exploitation. In this research, accent was given to determining the trend of presence of metals in oil, in order to diagnose status of tribological systems in diesel engines. The following picture shows dependence between change in viscosity and time of oil exploitation.
SUMMARY REPRESENTATION OF TEREX MEASUREMENT
Picture 1. Viscosity at 40° x = motor hours, y = Viscosity at 40° The following pictures show dependence between the change of presence of metals and oil exploitation time.
Picture 2. Presence of Fe in oil
Picture 3. Presence of Cu in oil
Picture 4. Presence of Pb in oil
Picture 5. Presence of Al in oil 4. CONCLUDING CONSIDERATIONS In hard coal mine Banovići there are 40 CUMMINS motors in exploitation at this time, of which 17 are built in dumper trucks of bearing capacity 1000 – 1700 [KN]. For each of these motor temporal status image is being followed every day. In addition, for every type of these motors a data base has been set up, which contains basic technical data with all necessary instructions (servicing instructions, repair instructions, etc.). In accordance with manufacturer's instructions, all motors regularly undergo: daily inspection, servicing, smaller, middle-scale and large repairs. Diagnosing working parameters of motors is also conducted regularly. In this research, diagnosing status of tribological mechanisms is presented, and this was conducted employing diagnostic methods of scuffing products control (control of mechanical impurities in motor oil). Acquired results by using the above-mentioned two diagnostic methods are satisfactory. Absence of atomic absorption spectroscopy is due to the fact that it does not provide information about size of mechanical impurities, but only about their quantity. Further research should be directed at constructing a program for diagnosing tribological assemblies of motors with the aim of extending the interval between oil changes, longer motor work and reaching prognoses regarding motors' functionality in the future. 5. BIBLIOGRAPHY [1] Adamović Ž., Tehnička dijagnostika, Zavod za udžbenike i nastavna sredstva, Beograd, 1996. [2] Ekinović S., Osnovi tribologije i sistema podmazivanja, Mašinski fakultet u Zenici, Zenica, 2000. [3] Avdić H., Tufekčić Dž., Karić A., Vibration Influence on operational status of complex technical systems, 2nd DAAAM International Conference on ATDC 03, Tuzla, 2003. [4] Sebastijanović S., Karić A., Tufekčić Dž., Tribološki efekti kod elastohidrodinamičkog podmazivanja XXVIII Naučno – stručni skup o održavanju mašina i opreme, Budva, 17-20 juni 2003. [5] Karić A., Istraživanje modela klizajućeg trošenja za parcijalne kontakte, PhD thesis, Mašinski fakultet, Tuzla, 2008. [6] H. Avdić., Dž. Tufekčić., A. Karić., Infuence of qualitative characteristics of technical construction on maintainability, 6th International research/expert conference TMT 2002, Neum, 2002.
8

ROTARY INTERNAL-COMBUSTION ENGINE OF TURBO-COMPRESSOR TYPE
Tokarev Alexander, Dr., prof., Al ta i S t a te Technical Univers i t y Tokarev Mihail, student, Al t a i S ta t e Technical Univers i t y
Abstract: Design of turbo-compressor type of internal-combustion rotary engine (TIRE) was made. The design is the hybrid of conventional internal combustion engine and gas turbine. Design of engine reminds gas-driven turbine, because it has compression pump, turbine and combustion chamber. Operating principle is similar to conventional engine because it has not uninterrupted but portion process of fuel combustion. The engine has two rotors: compressor rotor and turbine rotor. Both rotors are stiffly fixed on the engine shaft and rotated in the engine cavity. There is a cylindrical type combustion chamber between compressor rotor and turbine rotor. Gas-distributing butting mechanism of spool type is inside combustion chamber. Spool has a port for input and output of working mixture. The same ports are in the engine body. Drive of spool is through the reduction gear from engine sharf. Operating principle: working mixture is compressed by the compressor and directed to the combustion chamber. In the combustion chamber it is ignited and through the outlet ports is directed to the turbine rotor and makes it rotate. Turbine rotor rotates engine shaft, from which useful output is removed Total shedule of gas-distributing phases comprises intake, compression, power stroke, scavenging combustion chamber and outlet (exhaust). The RTD has traditional piston engines power systems, ignition liquid and air and cooling. In the lubrication of the working model is added to the fuel. The working model of engine was made and preliminary tests were carried out. Results showed that the engine needs same improvements. KEY WORDS: ROTARY ENGINE, COMPRESSOR, TURBINE, GAS-DISTRIBUTING BUCKET, COMBUSTION CHAMBER, PHASES OF VALVE TIMING, WORKING DUMPER PLATE OF COMPRESSOR, INTAKE AND OUTLET PORTS, VALVE, WORKING STROKES OF THE ENGINE.
A lot of engineers of the most countries of the world are
working to create internal-combustion rotary engine. Number of patents that inventors of this direction have got is estimated in tens of thousands. Only the very few of the inventions come to implementation (like Wankel engine) but that doesn't stop inventors and they look for new ways, new ideas.
In I.I.Polzunov Altai State Technical University (AltSTU) construction design of turbo-compressor type of internal-combustion rotary engine (TIRE). Is developed construction design is protected by several patents [1].
Developed construction of the engine represents a hybrid of conventional engine and gas-driven turbine. Authors tried to take into account advantages both of conventional engine and gas-driven turbine in the developed engine construction. Design of engine reminds gas-driven turbine, because it has compression pump, turbine and combustion chamber, operating principle is similar to conventional engine because it has not continuous but batch process of fuel combustion.
Figure 1- Principal diagram of TIRE
1- motor shaft, 2 – compressor rotor, 3 – turbine rotor, 4 – outer side cheek (вариант со стенкой корпуса outer body wall), 5 – inner side cheek (inner body wall), 6 – combustion chamber, 7 – gas-distributing chuck, 9 – piston ring, П –consumer.
Principle of design of TIRE is that, like in gas-driven
turbine, compressor rotor 2 and turbine rotor 3 are installed and hard attached to the same shaft (ref. to fig. 1). The body of the engine is piston ring 9 in side which compressor rotor is rotated and side cheeks (4,5). The body of the engine is turbine rotor 3 represents a chuck, inner surface of which is above outer cylindrical surface of piston ring 9. Axes of inner and outer surfaces of are shifted to the opposite sides from rotation axis of motor shaft 1. In
the widest part of piston ring 9 there is cylindrical combustion chamber 6 with gas distribution mechanism.
Gas distribution mechanism is of spool-type. It is a chuck 7 with by-pass port 15 to intake into combustion chamber combustible mixture and for outlet burning combustible mixture to work space of turbine (ref. to fig.2). In the bead forming ring there is inlet port 10 and outlet ports 11. Detailed description of construction design of engine is described in literature [2].
9

Figure 2 – Schematic cross-section of engine 2 - compressor rotor, 3 – turbine rotor, 6 – combustion chamber, 7 – gas-distributing chuck, 8 – working gate of compressor, 9 – piston ring,
10 – inlet port into combustion chamber, 11 – outlet ports from combustion chamber into work space of turbine, 12 – working gate of turbine, 13 – work cavity of turbine, 14 – entry port, 15 – by-pass port, 16 – outlet port, А – start cavity, Б – compression cavity, В – cavity
of combustion chamber, С – combustion stroke cavity, Д – outlet cavity of waste gases
Operating principle of rotary engine is similar to conventional engine. First, inlet stroke takes place, then compression of combustible mixture in the combustion chamber, then ignition fuel-air mixture in combustion chamber and outlet of it
into the work space of turbine, where happens combustion stroke takes place, and the last one, outlet of waste gases. General scheme, of operating principle of TIRE is given at figure 3.
Figure 3 – Schematic of operating principle of TIRE.
The rotary engine uses the similar principle of converting pressure into rotating motion as the piston engine.
The rotor successively executes the processes of intake of the working mixture in the combustion chamber, its compression, ignition (combustion), exhaust into the working chamber of the turbine for the working stroke, and the final exhaust of the combusted gases out of the
housing. The following figure 3 illustrates the working principle of
the rotary engine. The intake stroke and the compression stroke occur in the
rotor of the compressor, while the working stroke and the exhaust stroke occur in the rotor of the turbine. Due to the rotation of the shaft, the gate of the rotor of the compressor divides its working chamber into two constantly changing in volume chambers (A and B). Shaft rotation generates the negative pressure behind the
compressor valve, so that the working mixture goes
through the intake port to the chamber A, whereas the constant reduction of its volume in the chamber B before gate leads to the compression stroke. The compression stroke is divided into two stages. The first one is preliminarily compression of the working mixture in the chamber B when the shaft turns from 0 to 180 degrees. Note that the compressor valve facing the combustion chamber is considered to be 0 degrees. The final one is full
10

compression when the preliminarily compressed working mixture passes from the chamber B to the combustion chamber.
After passing of all working mixture from cavity B the combustion chamber, the intake port is closed. During this part of the cycle, the spark plug ignites the mixture. Since the mixture is ignited, the exhaust ports are opened and the combustible working mixture reaches the working chamber of the turbine, chamber C, which on the gate of the turbine, creating torque on the shaft. From other side of turbine working gate in the cavity D are free to flow out of the housing through the exhaust port.
Thus, one full rotation of the shaft has all strokes. This leads to increase in decrease of useless wastes and efficiency of the comparison with piston engines.
The rotary engine uses valve mechanism for gas distribution. This valve is made in a form of a glass having by-pass ports on its sides. Gas distribution glass rotates in the combustion chamber with the same frequency as the shaft by means of the reducer. Due to the rotating of the valve, its bypass port alternately coincides with intake and exhaust ports, letting the working mixture in or out of the combustion chamber.
Figure 4 – The overall schedule of gas distribution:
S – area of the ports opening in the gas distribution mechanism; α – the rotation angle of the engine shaft, β – the angle of the scavenging of the combustion chamber.
According to the schedule timing, gas distributing
mechanism works as follows (see Figure 4). At point 1, there is the ignition of the working mixture in the combustion chamber and at the same time, the outlet window of the combustion chamber starts to open and the burning mixture rushes into the working cavity of the turbine. At point 2, the outlet box is fully opened and stays open until the point 3. There is the process of closing the exhaust window (from point 3 to point 4). In point 5 there is an opening of inlet window and fresh fuel mixture is sucked into the combustion chamber. From point 5 to point 4 there is a process of the combustion chamber, as at this moment both windows, inlet and outlet remain scavenging open. The angle of turning of the motor shaft on which a process of scavenging occurs corresponds to 30 degrees.
At point 6 the inlet window is opened fully and stays open until point 7, followed by a process of gradual closing of the intake box to the point 8. One cycle of the RTD is completed. Then everything is repeated.
The proposed of valve mechanism RTD has a simple and good kinematics, as all the details perform a rotational movement.
In the RTD traditional for piston engines feed systems, ignition and cooling. Are used on the working model the lubrication of engine parts is carried out by adding the oil to the fuel.
In developing of the working model of the RTD was assumed that the working volume of the compressor is 0.1 liters. The compression ratio is 8. Estimated engine power - from 3 to 6 kW. Based on these initial data of working model dimensions are: outer diameter - 280 mm, width - 90 mm (without the length of the motor shaft). Tests conducted on a working model showed that the engine is efficient, but requires further development.
To our mind invented rotary internal combustion engine has some of advantages compared with traditional piston engine, namely:
• higher efficiency by reducing losses due to the reciprocating motion of the main parts of the engine
• all four strokes of the engine occur simultaneously in one revolution of the motor shaft, that is, at the turning angle of
equals to 360 degrees, which gives the right to talk about less "useless" costs of engine
• all major engine parts have a high technology of makers , as They have the form of body rotation
• minimum of parts, performing the reciprocating motion (rather than up and down motion as the piston internal combustion engine) in a small range of angle turning (15-30 degrees)
• the engine design allows to have different working volumes of compressor and turbine, which involves improving the efficiency of the engine and improve its environmental performance.
• engine can be designed of any capacity, by increasing its size or the number of pairs of the rotor-turbine The above advantages allow to speak about the prospects of the developed rotary internal combustion engine of turbo-compressor tupe. Literature:
1. Patents for inventions: 2351780, 2425233, 2427716. Russian Federation: МПК F02B 53/8. Rotary-piston internal combustion engine. Tokarev A.N., Tokarev M. Y.
2. Non-traditional internal combustion engines: tutorial/ A.N. Tokarev, V.V. Neshataev, S.A. Ulrich, - Barnaul: publishing house of ASTU, 2010, - 82 p.
3. A.N. Tokarev, I.A. Silchenko/ Gas distribution mechanism for a rotary internal combustion engine of turbo-type, - Barnaul: publishing by ASTU, 2011, -112 p
11

ПЛАСТИЧНИЯТ СТИЛ В МОДАТА НА 21 ВЕК THE PLIABLE STYLE IN THE 21 ST CENTURY FASHION
доц. д-р Пенка Ангелинова Димитрова1 Технически университет София, кат. Инженерен дизайн 1
Assoc. Prof. Penka Angelinova Dimitrova, PhD1 Technical University of Sofia, dpt. Industrial Design Engineering 1
Резюме: Тази статия разглежда абстрактния женски стил според характеристиките на човешката фигура. Тя е изследване на силуета и най-често срещаните пластични форми в женските дрехи. Заключение е направено върху специфичния композиционен център и неговите пластични детайли и драперии. Промените в модата се характеризират със специфични стилове: авангарден, класически и спортен. Главния фокус е върху структурата на формата и специфичните детайли.
Abstract: This study comments the abstract design of lady’s clothing according to the characteristics of human figure. It is an examination of the silhouette and the most frequent seen pliable shapes in the fashion clothes. A conclusion is made on the specific center of composition and its pliable details and drapes. The changes in fashion are characterized throughout different styles: avant-garde, classic and sport. The main focus is on the structure of the shape and the specific details.
Keywords: пластика, стил, форма, пластичен стил, мода, пластична форма, пластични детайли
От 2000 до 2011 г. геометричния стил е свързан с новите материали. Построяването на структурата на дадено облекло изисква търсенето на най-типичните линии за дадена форма и свеждането й до най-простия геометричен вид.
Стабилните елементи като по-голяма основна единица в структурата определят силуетните форми и обединяват подвижните отделни групи елементи.
Съвременният стил се проявява и върху различните форми и обеми на ръкавите, както и ръкавните извивки. Някои рокли остават със срязани на ленти корсажи изпод които прозират в контрастни цветове. Ханшът често се акцентира с изкуствени подплънки, поставени ниско отзад под талията, подчертаващи пластиката на формата.
Съществуват предпоставки за многообразна и изразителна пластика на фигурата при относително прости геометрични форми в една структура. Това се забелязва особено в творчеството на Мичико Кошино в нейните ревюта в Лондон.
През 2000–2010 г. известните вече дизайнери затвърждават своя стил, показвайки сезон след сезон все по-съвършени тоалети от висшата и авангардната мода. Вечерните рокли са или пищни и ефирни или плътно прилепващи по женското тяло. Роклята на ХХI век отново е белег на добър вкус и елегантен стил. Най-големи виртуози във вечерните и официалните тоалети са италианците. Валентино наслагва воали в своите ефирни творения. Прада създава официални рокли, обсипани с миниатюрни бродирани цветя. Армани препоръчва бежов шифон за най-празничните случаи, а Джанфранко Фере облича жените като нимфи в прозрачни вълнисти рокли.
Роклите на 2000 – 2001 година са с права линия, меко падаща материя и дължина до глезена. Разнообразието идва от плитко изрязаното трапецовидно деколте и подчертаното рамо. Разголените рокли от по-прозрачни тъкани се носят с туника с дълъг ръкав. Ако долната част е на фалти и плисета, то горната е по тялото. Примамлив е моделът с гол гръб и широка презрамка през врата.
През 2002 г. дизайнерите определено се стремят да преоткрият изящната женственост, показват мода за очарователната жена. Сякаш всички залагат на тази съблазнителна лекота на дрехата, на меко падащите тъкани, които подчертават формите на тялото. Полите имат зашеметяващи странични цепки, а деколтетата са дълбоки и V-образни.
Цялостното решение на официалните ансамбли трябва да е изпълнено в един стил.
Дължините – те са преди всичко реалистични. Посоката е определена надолу, въпреки някои от свръх разголените модели.
Силуетът – линията на дрехите е права, липсва и най-малкият стремеж към самоцелна оригиналност. Ръкавите се скъсяват, за да изглеждат ръцете по-грациозни и дълги, а често срещаната диагонална кройка позволява да се подчертае фигурата и умело да се прикрият нейните недостатъци. Принципът тук е един и същ – върху прилепналата рокля от плътна материя се облича прозрачно одеяние от воал или органза. Ефектът е достатъчно сексапилен без да надхвърля границите на добрия тон и благоприличието. Единствената част от женската анатомия, която дизайнерите тази година показват повече от охотно е гърбът – разголват го до талията и дори по-надолу (фиг. 1).
фиг. 1
Съвременните жени през 2003 г. отново откриват краката си и особено добре изглеждат на високи токчета. Позволяват си сексапилни деколтета с романтични цветове, с волани, дантели, придаващи екстравагантност и много настроение.
Роклите често се оформят с басти, набори, драперии в различни направления. Понякога драпериите се вмъкват в самата конструкция, а често са и диагонално разположени в различни посоки.
През 2004 – 2005 г. Баленсиага разработва асиметрични черни рокли достигащи до прасеца, обточени с извити червени линии. Носят се над къси шорти [1].
През 2004 – 2005 г. Баленсиага създава рокли като изрязва елипсовидни елементи в горната част на корсажа при гърдите в средната линия от бюста до пъпа и в страничния шев. В полите редува по-малки и по-големи еленси като ги нашива върху тъканта [10] Използва един елемент, но с различни пропорции.
12

През 2005 – 2007 г. се забелязва усложняване на конструкцията чрез контраст на форми и съчетание на разнообразни срязвания и асиметрично решение с направляващо движение.
Формата е динамична в основата лежи кръг. Линията на силуета е твърде изтънчена, появяват се колосани и опънати върху обръч елементи пластично третирани (фиг. 2.) [2] Това особено се забелязва в творчеството на Карл Лагефелд.
фиг. 2
По-голямата изразителност на силуета се подчертава чрез различните оттенъци на черно при различни структури платове в един и същи силует. Баленсиага разработва всекидневни рокли от вълнени платове в бежовата и сребристо-сивата гама, като дясната част на предницата на роклята оформя като сако с различни ревери.
Костюм и рокля заедно в едно – това е замисъла на твореца. Поставя се акцент на асиметричното деколте и различното оформление на яките и реверите.
Това доказва колко смели са търсенията на дизайнерите през 2004 – 2005 г. и колко добре са изчистени линиите при едни пластически поднесени форми и цветове.
През 2006 г. Ери Матсук използва в роклите си силна геометризация. Чрез един триъгълен елемент но различен по мащаб и пропорции оформя цялостната структура (фиг. 3.) [3].
Обръща се към 60-те години и към творчеството на Пиер Карден и Пако Рабан.
Ери Матсук се обръща и към съвременната архитектурна пластика наподобяваща бионични структури. Полите на роклите са особено обемни (фиг. 4). В 2006 г. в Милано се представят рокли с обтекаеми пресичащи се линии, създаващи движение от необичайни силуети и структури
фиг. 3 фиг. 4
Жан Франко Фере през 2006 – 2007 г. разработва колекция от пластове платове, които предават на роклите пищност и силует на нереално съществуване, получено от материи и конструкции, излъчващи светлина [4].
В колекцията се забелязва нежна хармония, в която присъства черно и кокосово, в която чистите цветове избликват
и наелектризират. Вечерните рокли напомнят фауната с вибриращия чар на животински орнаменти. Роклите са от шифон в съчетание с трико от богати оттенъци с невероятни бродерии и инкрустации от стилизирани цветя и водни линии. В колекциите от рокли Жан Франко Фере има безупречни детайли, виртуозни конструкции, фантастични материи. Полите грандиозно се люлеят около коляното. Блузите от трико са в комбинация от шифон и сатен и придават романтична визия. [4]
Карл Лагефелд разработва рокля за Шанел 2008 – 2009 г. с нервюри, които се спускат от деколтето. Ръкавите в горната част са с нервюри. В много рокли ръкавите са оголемени и по-обемни. Основните цветове, които използва Карл Лагефелд са сребристо сиво и бежово. Създава рокли с обемни ръкави в Т-образен силует [5].
Карл Лагефелд създава рокли с обемни ръкави в раменния пояс, които силно разширяват Т-образния силует. Върху дантелени вечерни рокли Лакроа също поставя болеро с огромни буфан ръкави [6].
През 2008 – 2009 г. Джорджис Чакра разработва вечерни рокли с асоциации от флората с мотиви и пластика, наподобяващи цветя и листа. Върху черна рокля поставя в предната част листо от цвете от бяла тъкан, придаващо изискана пластичност. Акцентът на цялата композиция е върху изрязания в кръгове колан. Контрастът е постигнат чрез черно и бяло. [7]
Сарли Кутюр разработва черна рокля и в полукръг поставя вмъкнати в конструкцията форми, наподобяващи на листа на цвете (фиг. 5).
Формите пластично нагъва и асиметрично в конструкцията и в други свои рокли (фиг. 6).
фиг.5
фиг. 6
През 2009 г. Карл Лагефелд разработва рокли върху полите на които поставя конусовидни форми (фиг. 7). Роклята в горната част е с лодка деколте и ръкави тип камбана. Модна къща „Диор“ разработва рокли от вмъкнати раирани платове, които се вграждат или обгръщат конструкцията на роклята.
Фиг. 7
През 2001 – 2011 г. типично за роклите за свободното време, които могат да се приложат за младежката мода е свежата непринуденост, вдъхновена от 50-те години
13

Дължините са до коляното или глезена. Деколтетата са четвъртити, дълбоки, остри V-образни, овални или деколте тип „лодка“. По деколтетата се използват гарнитури от дантела и рюшове, шнурове, ресни.
Използват се и свободни конструктивни решения.
Друга тенденция при роклите е линията на тялото, оформена с пенсове и широки поли с асиметрични подгъви.
Моделите в спортен стил се придържат към формата на тялото; те са с дълбока ръкавна извивка и ново решение на гърба с широки презрамки; злободневни са шевовете, които обединяват елементите по стил и конструктивно решение.
Модата през 2001 – 2011 г. се характеризира с подчертана женственост и една силно изразена привлекателност, като умело се съчетават подчертана елегантност с един „небрежен“ моден израз [8].
Меката линия оформя тесния и издължен силует. Развитие получават правоъгълният, трапецовидният и А-образният силует, а във вечерните тоалети се забелязва О-образният.
Силуетите леко обгръщат тялото и очертават фигурата, като талията често се губи в богатството на веревни дипли. Ударението се поставя върху дължините, оформени от слоеве и пластове, които комбинират и допълват формата. Насочват се към прасеца, като се забелязват драстични дълги решения.
Основната конструкция е осеяна с конструктивни шевове с детайли от набори и драпирани яки, като шалове или качулки.
Тъканите и цветовете през 2000 – 2010 г. много ентусиазирано приветстват абсолютния лидер на сезона – розовото, без което не мина нито една колекция в световните столици на модата. При това розовото във всичките му оттенъци – от неистово цикламено до бебешко. Далеч по-назад не остават и останалите ярки цветове: лимонено жълто, виолетово, смарагдово, зелено, небесно синьо и т.н. Разбира се черното и бялото са неизменната класика при вечерните и коктейлните рокли. Освен черното се налагат тоновете на пролетта, златото и среброто. Огненото червено разтуптява сърцето, затова повече официални тоалети са пурпурни. Блестящите нишки и пайетите са за модели от трико, тафтата приляга на деловите, а модерните комбинации от тюл, коприна и кожа са за романтичките, които мечтаят за екзотични кътчета.
От анализа следва, че кафявото с цвят на препечено кафе и битер шоколад е в предните позиции на новите колекции. То създава чувство за топлина и комфорт, а моделите са семпли, но стилни и елегантни. Официалните рокли в кафяво са със стилни бродерии от маниста или перли.
Белият цвят също е широко застъпен н новите тенденции. За моделите в искрящите снежни цветове са характерни оригиналните шевове, бастите, копчетата отпред, отзад или встрани, цепките, дъговидните кройки на талията, малките ръкавчета или пък силно изрязаното рамо. Но за да не омръзне белотата, към нея дизайнерите често прибавят по няколко капки лимонов и портокалов цвят, щипка кафе или шоколад. Новото при роклите в бяло са декорациите с нежни шевици, широките колани от плата с елегантни метални катарами, комбинациите с дълги до земята ризи, етноелементи.
В злато и сребро ще засияе всяка изискана дама, която за вечерната си рокля избере цветът на звездите или луната. Ефектът на роклята се подсилва чрез отблясъците на златистата или сребристата рокля на изкуственото вечерно осветление. Тези цветове превръщат всяка жена в приказна фея.
Тъканите – есенно-зимното господство на трикотажа се запазва. Наред с благородните материи лен, памук и коприна, просто задължително за лятото, отново ще правят настъпление високотехнологичните материи на базата на полиамид, ликра, тактел, които просто омагьосват дизайнерите с възможностите си. Много популярни ще бъдат роклите без ръкави от двустранно метализирана тъкан и тафта.
Тъканите – десените са заимствани от природата; пеперуди, тропически декоративни риби; миди и вкаменелости.
Дизайнерите ще черпят идеите отДревен Рим и Гърция.
Наред с това ще се чувства и ориенталското влияние – от облеклото сари до надиплени и усукани шлейфове.
Тъканите – шифон, воали, крепове, муселини, батиста, шантунг и „китайски“ коприни.
Ще навлизат отново дантели и бродирани тъкани, фини поплини, твил, рипс.
Особено ще се наложат промазаните печатни платове.
Темата „Екзотика“ е повлияна от изкуството на Източна и Средна Америка, както и от африкански и японски елементи.
Изискана мода, предназначена за града с цветове на препеченооранжев цвят, тонове на горчица, нюанси на тютюн.
Използват се пъстри разработки – батик и икат; тъкани с апликации и бродерии, флорални мотиви тип „хавай“.
За десените ще са характерни флагови щампи, мотиви на рекламната графика, фигурални рисунки.
Литература:
1. Вълев Ст. За формата, структурата и съдържанието, Промишлена естетика, Декоративно изкуство, 6/1989, с. 15-17
2. Гай Р.К., Н. Брейн Математический цветник, М., Мир, 1983
3. Делчев, С., Основи на промишления деизайн в архитектурата, С. Техника 1983
4. Градоба К., Е. Гутина Театральньiй костюм, Всерос-сийское театральное общество, 1976
5. Гиндев Г., Н. Панова, Н. Петров, Конструиране на облекло 2 част, С. Техника, 1988
6. Дворецкий И., Покупателю об одежду, М. Э1981 7. Дамянов, Г. и др. Наръчник на деснатора. Проектиране
на тъкани, С. Техника, 1983 8. Димитрова П., Модата на границите на две столетия,
С., Крисан – С, 2012
14

THEORETICAL ASSESSMENT OF THE FRICTION COEFFICIENT OF A THRUST ROLLER BEARING
ТЕОРЕТИЧНА ОЦЕНКА НА КОЕФИЦИЕНТА НА ТРИЕНЕ
НА АКСИАЛЕН РОЛКОВ ЛАГЕР
Assoc. Prof. Dr. Eng. KOLEV P. K. Technical University of Sofia, Bulgaria
Abstract: The coefficient of friction of the widely used today rolling bearings is one of the parameters, that influences the efficiency and thermal regime in mechanical equipment and the searching for effective analytical determination is a logical target for research in this area. The complexity of the modern theory of EHL provides an opportunity to seek simpler solutions. In previous research it has found that the classical equation of Reynolds “make difference” between rolling friction and sliding friction and for these two cases and their combination are obtained expressions for the friction force in contact of plate on cylinder in fluid friction. In the present study is derived an expression for the corresponding normal load and are calculated the coefficient of friction as well as the friction torque at selected thrust roller bearing as a function of fluid layer thickness, normal loading and rotational speed. Qualitatively, the corresponding diagrams have confirmation from those published in other studies. Quantitatively, the obtained friction ratio varies from 0,0001 to 0,001, applies to main contact only. KEYWORDS: LUBRICATED CONTACT, PLATE ON CYLINDER, REYNOLDS, THRUST ROLLER BEARING, FRICTION COEFFICIENT
1. Introduction
Rolling bearings are machine elements with the most widely application in all fields of technology. One of the main advantages is the low coefficient of friction over a wide range of rotational speeds, whith a lower bound nmin0, which is an immanent feature of the physical phenomenon of friction in the dry rolling. In order to reduce the wear, in bearing technique are used plastic or liquid lubricant substances, the presence of which, especially the latter, is a prerequisite for the realization of fluid friction in the contact zones between rolling elements and the paths of the bearing. The liquid friction is more likely in the upper frequency range of the bearing, where nnmax and is also characterized whith a low coefficient of friction. The friction coefficient define the power losses and thermal regime of the bearing and his determinativeness is an essential prerequisite for the optimal design of power transmissions.
2. Prerequisites for the problem solution
The practical value of the knowing of the friction coefficient is a main reason for the presence of a large number of studies devoted to the determination of its derivative value - the friction torque of the bearing MR. Contemporary review on this topic is given in [7] and [9]. First Stribeck [2] has formulated the known relation MR=.F.dm/2. Here F is the load, dm=(d+D)/2 is the average and d and D are the inner and outer diameters of the bearing. Later Palmgren [3] provides the expression MR=M0+M1, where М0 and М1 are respectively independent and dependent on the load F components of friction torque. This equation is still used by reputed manufacturers of bearings such as INA, FAG and until recently SKF. М0 depends on the type of bearing and lubrication, on the oil viscosity and on the rotational speed n. For values .n<2000 mm2/s.min, М0, according to [3], is negligible [9]. For the torque М1 in [8] and [11] is proposed to place M1=f1.P1.dm. Factor f1 and workload P1 are determined according expressions, depending on the type of the bearing. The equations in [2] and [8] are similar and when М00 is valid МRМ1. Then, as the meaning F=P1, it turns out /2f1. For give [3] and [4] values from 0,001 to 0,005, depending on the type of the bearing - for example, for a thrust bearing with short cylindrical rollers =0,004 [9]. For the same axial roller bearing, in [8] and [11] is given the value f1=0,0015. The attitude /f1=0,004/0,0015=2,67 confirms the relationship /f12.
Basis for the study of phenomena in the loaded dynamic contact of two solids in the presence of lubrication is the equation of Reynolds [1], which in the case of tangential sliding of cylinder on the plane for isothermal two-dimensional viewing, constant density
and constant pressure p in film thickness hx has the form [7], [10]:
(1) dx
dhU
dx
dph
dx
d xx ...6.3
Here x is the tangential coordinate, is the dynamic
viscosity, U=U1+U2 is the effective hydrodynamic speed, U1 and U2 are the linear velocities of the two bodies in the contact area. The general form of (1) is a basic equation of the hydrodynamic (HD) lubrication theory. The contact of elastic bodies is now a subject of the elastohydrodynamic lubrication (EHL) theory [7]. For example, well known is the isothermal solution for the minimum thickness of lubricant layer in contact of elastic bodies under incompressible Newtonian fluid hmin=2,65.G0,54.U0,7/W0,13. Here G, U and W are parameters of material, speed and load in the contact. EHL is developed by considering the thermal effects, the properties of the nonnewtonian fluids, the rheology of the lubricants and others. In [7] predicate that "[modern numerical solutions based on EHL, describe well the distribution of pressure, temperature and thickness of the lubricant layer in the contact, but the description of friction is an unsolved problem. Good results are achieved only in the cases when in the contact is present a significant slide. For pure rolling, predominantly in the rolling bearings, it is difficult today to find an adequate solution]". The reason, according to [7] citing [6] is, that "[in heavily loaded bearings, under the influence of extremely high pressure, in the middle of the liquid lubricant layer, the contact surfaces of the two bodies formed glass hardening of the fluid, whose thickness increases with decreasing of the sliding speed and of the heat and that touching in marginal or no sliding. Thus, in pure rolling and rolling with marginal sliding, the friction is no longer carried in the liquid phase, the EHL lubricated contact transform to direct dry contact and hydrodynamic methods are inapplicable]". It is known, however, that in practice the rolling bearings combines rolling and sliding, for example "cinematic" and others, which, especially at low load, make the case described in [7] atypical.
а) b) c)
Fig. 1: Types of friction in a rolling bearing [10]
15

The complexity of the theory of EHL reasons to seek for simpler solutions. In [10], Fig. 1, are reviewed the three possible types of friction in the roller bearings, in inverted kinematics: а) pure rolling (freely rotating roller), b) rolling and sliding (with hampered roller rotation) and c) pure sliding (fully blocked roller). With U1=UK and U2=URO are labeled the peripheral speed of the bearing path and of the roller and through them are expressed the effective hydrodynamic velocity U and the sliding speed UGL in the contact zones for the three cases:
(2) a) U=2.U1 ; UGL=0, (3) b) U=U1 + U2 ; UGL=U1 - U2 (4) c) U=U1 ; UGL=U1
Thus, in [10] is found, that the equation of Reynolds [1] "make difference" between the three types of friction and on this basis is formulated the hypothesis, that this equation is applicable not only to sliding but also to rolling bearings with hydrodynamic lubrication.
Fig. 2: Model of the contact in the rolling bearing [10] For description of the contact, in [10] is composed the
model shown in Fig. 2 and are derived dependencies for the pressure p, for the profile of the speed u and for the frictional forces FR in the lubricant layer for all the three studied cases.
3. Aim of the work
Aim of the work is, based on the findings in [10], to perform a theoretical determination of the friction coefficient and by comparison with previously published values to assess the applicability of equation (1) of Reynolds [1] for the case of rolling bearing at fluid friction.
4. Solution of the problem
The coefficient of friction in the considered contact is defined by the well-known relation =FR/F between the normal load F and the friction force FR, shown in Fig. 2. Unto given model parameters, the friction forces are defined here on the basis of summary record of the equations derived in [10], namely:
(5) ;.1
)2( a
Barctg
aI IFR ;.
.2
1)2(2)1(
IFR
BIFR I
X
B
aI
(6)
)2()1(2/1 ..
3
11...2.....6 IFR
GLIFRpR I
U
UIhRRUbF
The phenomenon FR1FR2 is described in [5], and the
conclusion (6) also confirms this. The normal force F is balanced by the pressure p in the lubricant layer, which expresses the load capacity of a part of an infinite cylinder with width b and is obtained here in the form:
(7) B
dxxpbF0
).(.
(8) ;/..3 21 hUCF ;).4/(.32 hhC pF
(9) ;2/)ln(ln 21 aXI BF
(10) ;2/)ln.(ln)/(. 22 BF XaaaBarctgBI
(11) ;2/)( 123
BF XaI
(12) )/.(. 211 aIICbF FFF
)3/..2/.( 32
212 FFFF IaaIIC
The model parameters а, B, XB and hp are defined in [10].
As object of study is selected an axial roller bearing 81118 TN from the product catalog of the company SKF [12], Fig. 3, whith the geometry of the contact near to the model in Fig. 2. The width of the roller is b=(117-93)/2=12 mm, Fig. 3. The upper limit of the integral in (7) is the abscissa x=B, Fig. 2, where the pressure p in the lubricated layer becomes negligible. Here, according to [10], it is adopting BR/3. The referent and the maximum rotational speed of the bearing are 1300 min-1 and 2600 min-1 [12]. For the operating speed and the operating temperature is taken n=1300 min-1 and T=70 C, which unto average diameter (d+D)/2=105 mm defines a minimum kinematic viscosity to provide a liquid friction =10 mm2/s at 70 C and =28,4 mm2/s at 40 C [12]. It is selected an oil ISO class VG100 with =100 mm2/s at 40 C and 27,5 mm2/s at 70 C.
Fig. 3: Thrust roller bearing 81118 TN [12] Typical for the axial roller bearings is the presence of a
cinematic conditioned slide. The velocities plan of the relative movement in case "stopped cage" is shown in Fig. 4. n1=650 min-1 and the bearing size determines the average peripheral speed U1=(U1a+U1b)/2=3573 mm/s on the bearing paths. For the peripheral roller speed is taken U2=U1a=3165 mm/s, which determines a sliding speed in the contact UGL=408 mm/s.
Fig. 4: Plan of velocities in the contact zones As is meant, that one bearing roller contacts with two
bearing washers, Fig. 4, that dm=(Ea+Eb)/2 is the average diameter of each of two bearing paths and that the bearing can be seen as a friction gear, Fig. 5, for the friction torque МR, caused in the both contacts of one bearing roller follows:
(13)
R
R
m M
FR
d
R
n
ni
..2.2
2
1 and mR dFM ..
In the expressions from (6) to (13) FR, F, and МR are
functions of the thickness of the lubricant layer h, Fig. 2. On this basis, after entering of the described numerical values of model parameters, for series of values of the layer thickness h, in the working environment of MS EXCEL are obtained numerical values of the power characteristics and of the friction coefficient in both hydrodynamic contacts of one single roller of the testing bearing.
16

Fig. 5: The axial roller bearing seen as a friction gear 5. Results and discussion
The results of the computational test of the expressions from (6) to (13) are presented here in the form of a graphical correlations for the three cases of friction in the bearing а), b) and c). In the studied interval of the lubricant layer thickness, with decreasing of h increases both the load capacity of hydrodynamic contact F, Fig. 6, and the maximum friction force in the layer FR, Fig. 7. These dependencies are formulated in [5] as well, which confirms the principal correctness of the results obtained here.
y = 0,0003x-2,8307
R2 = 0,9972
c
y = 0,0015x-2,6823
R2 = 0,9993
b
y = 0,0016x-2,6738
R2 = 0,9994a
100
1000
10000
100000
0,002 0,003 0,004 0,005 0,006 0,007 0,008 0,009 0,01
h, mm (x)
F,
N
(y)
Fig. 6: Layer thickness h and load capacity F
y = 0,0028x-0,6777
R2 = 0,9985
y = 0,003x-0,6685
R2 = 0,9986
y = 0,0046x-0,6054
R2 = 0,9995
a
b
c
0
0,05
0,1
0,15
0,2
0,002 0,003 0,004 0,005 0,006 0,007 0,008 0,009 0,01
h, mm (x)
FR,
N
(y)
Fig. 7: Layer thickness h and friction force FR
c
b
a
y = 3E+09x6 - ...
R2 = 1 y = 4E+08x6 - ...
R2 = 1
y = 2E+08x6 - ...
R2 = 1
0
0,0002
0,0004
0,0006
0,0008
0,001
0,0012
0 0,002 0,004 0,006 0,008 0,01 0,012 0,014 0,016 0,018
h, mm (x)
(y)
Fig. 8: Layer thickness h and friction coefficient
The maximum (FR1>FR2) friction coefficient decreases with decreasing of the film thickness h, Fig. 8, i.e. parallel with the increasing of the load capacity F of the fluid friction contact, Fig. 9.
This principle dependence is also known subject and here is yet another confirmation. The calculated low values of the friction coefficient , Fig. 8, are typical for the hydrodynamic lubrication at all, which in turn speaks for the correctness of the conclusions from (5) to (12). Fig. 8 shows, how these equations, respectively the equation of Reynolds [1], report the influence of sliding in the contact, giving significantly different results in the ideal case а) for the research bearing, namely the pure rolling, and practically the unlikely but possible case c), when all the rollers are blocked, not rotate and the bearing does not work as a rolling bearing, but as axial plain bearing.
ab
c
y = 0,016x-0,7694
R2 = 0,9997
y = 0,0179x-0,7825
R2 = 0,9997
y = 0,0321x-0,8256
R2 = 0,9998
0
0,0002
0,0004
0,0006
0,0008
0,001
0,0012
0 50 100 150 200 250 300 350 400 450 500
F, N (x)
(y)
Fig. 9: Load capacity F and friction coefficient
Fig. 8 leads to the conclusion, that unto the fluid friction the
pure rolling а) is an operating mode, energetically more favorable in comparison with the case of pure sliding c). The real operating mode b) in the research thrust bearing with short cylindrical rollers is predominantly pure rolling accompanied by minor cinematic sliding and is close to the perfect mode а) of the pure rolling unto the fluid friction and therefore the graphs describing the cases а) and b) are close to each other and nearly overlap.
y = 0,2566x-0,6967
R2 = 0,9945
b
c
y = 0,2764x-0,6859
R2 = 0,9951
y = 0,4561x-0,6138
R2 = 0,9981
a
1
10
100
0 0,002 0,004 0,006 0,008 0,01 0,012 0,014 0,016 0,018
h, mm (x)
MR,
Nm
m
(y)
Fig. 10: Layer thickness h and friction torque МR
y = 1,5549x0,247
R2 = 0,9993a
y = 1,6858x0,2408
R2 = 0,999b
y = 3,3674x0,1859
R2 = 0,9731
c
1
10
100
1 10 100 1000 10000 100000 1000000F, N (x)
MR,
Nm
m
(y)
Fig. 11: Load capacity F and friction torque МR
The values of the friction coefficient, obtained here for one
single hydrodynamic contact, 0,0001-0,001, Fig. 8, are up to an order of magnitude lower than the indicated in [9] value =0,004
17

for a complete thrust roller bearing. The main reason is the simple two-dimensional model of the contact, Fig. 2 [10], which is limited only in the half-plane x0. Furthermore, the conclusions and calculations made here for the main contact in the bearing, between the roller and the bearing washers unto fluid friction, not cover the contact friction between the cylindrical and top surfaces of the roller on the walls of the cage window, that contributes to an increase in the coefficient of friction.
The test calculation shows, that the friction torque МR, caused by contact of a single roller with the two washers increases when the fluid layer thickness h reduces, Fig. 10 and when the load F increases, Fig. 11. The latter dependence is in agreement with the results in [7] and is in agreement with the quoted above equation of Palmgren [3], that contains a component of the friction torque М1, proportional to the load F.
Here is also done a numerically study of the impact of the roller rotational speed n1, relatively to the bearing washers, on the friction coefficient , Fig. 12 and on the friction torque МR, Fig. 13., when the lubricant film thickness is taken h=8 m.
a y = 4E-17x4 - … ; R2 = 1
b y = 4E-17x4 - … ; R2 = 1
c y = 4E-16x4 - … ; R2 = 1
0
0,00015
0,0003
0,00045
200 400 600 800 1000 1200 1400 1600
n1, min-1 (x)
(y)
Fig. 12: Rotational speed n1 and friction coefficient
a y = 0,0118x; R2 = 1
b y = 0,0121x + 1E-14; R2 = 1
c y = 0,0138x - 1E-14; R2 = 1
0
5
10
15
20
25
200 400 600 800 1000 1200 1400 1600
n1, min-1 (x)
MR,
Nm
m
(y)
Fig. 13: Rotational speed n1 and friction torque МR
The both diagrams in Fig. 12 and in Fig. 13 are generally
confirmed by the published experimental results in the doctoral theses [7] and [9], for example, and Fig. 12 shows the apparent greater stability of the friction coefficient in case а) and b), where the pure rolling prevails.
6. Conclusion
The friction coefficient of the mass used now rolling bearings is one of the parameters that affect the efficiency and thermal regime in machine technology and the search for effective method for his analytical determination is a logical target for research in this area. The complexity of the modern theory of EHL reasons to seek simpler solutions. It is found in a previous research, that the classical equation of Reynolds "make difference" between rolling friction and sliding friction and for these two cases and their combination are obtained expressions for the friction force in the contact of plate on cylinder in fluid friction. In this study is derived
an expression for the corresponding normal force and are calculated the friction coefficient and the friction torque in a selected thrust roller bearing, as a function of the lubricant layer thickness, of the load and of the rotational speed. The here obtained graphical relationships have received confirmation from those, published in other studies, qualitatively. Quantitatively, the values obtained for the coefficient of friction, from 0,0001 to 0,001, only for the main contact between the bearing roller and path, are up to an order of magnitude lower than indicated in the literature, eg 0,004 for a complete bearing. The difference would be smaller, when one considers the friction in other contact pairs of the bearing, which is not addressed here. The obtained results are initial and can serve as a basis for further theoretical and experimental studies.
7. References
[1] Reynolds, O.: Trans. Roy. Sos., 1886, vol. 177, p. 190
[2] Stribeck, R.: Kugellager für beliebige Belastungen. VDI-Zeitschrift, Band 45, Heft 3, S. 73-79 und S. 118-125, 1901
[3] Palmgren, A.: Neue Untersuchungen über
Energieverluste in Wälzlagern. VDI-Berichte, Band 20, 1957, S. 117-121
[4] Eschmann; Hasbargen; Weigand: Wälzlagerpraxis, 2.
Auflage 1978, R.Oldenbourg Verlag München Wien
[5] Lang, O.R.; Steinhilper, W.: Gleitlager. Springer-Verlag 1978
[6] Zhang, Y.: On the heavily loaded rolling-sliding elasto-hydrodynamic lubrication of rectangular contacts with two phase flow. Transactions of machine elements division, Lund Technical University, Sweden, 1984
[7] Dauber, O.: Elastohydrodynamische Rollreibung in Stahl-Keramik-Kontakten. Dissertation, Universität Karlsruhe, 2002
[8] FAG Kugelfischer Georg Schäfer AG: Schmierung von Wälzlagern. 2002.
[9] Koryciak, J.: Einfluss der Ölmenge auf das Reibmoment von Wälzlagern mit Linienberührung. Dissertation, Ruhr-Universität Bochum, 2007
[10] Колев, П.: Характеристики на мазилния слой при плъзгане на цилиндър по плоскост. IV конф. с межд. участие “Машинознание и Машинни елементи”, Сб. Докл., стр. 101-108, ноември 2008. ISSN-1310-3946.
[11] INA/FAG http://medias.ina.de/: Grundlagen, Wälzlager, Reibung und Erwärmung. 2012
[12] SKF http://www.skf.com: Entwurf von Wälzlagerungen – Grundlagen. 2012
18

DEFINING THE OPTIMAL BANDWIDTH IN BRIDGE POWER CONVERTERS
Assistant Msc. Eng. Stefanov G. 1 , prof. Dr. Eng. Karadzinov Lj.2, Assist. prof. Dr. Eng. Sarac V.3, prof. Dr. Eng. Dambov R.4 Faculty of Electrical Engineering-Radovis, University ‘Goce Delcev’-Stip, Macedonia 1,3, FEIT - University Ss. Cyril and Methodius –
Skopje, Macedonia, FNTS-Stip, University ‘Goce Delcev’-Stip, Macedonia4
Abstract: In this paper optimal bandwidth of power converters loaded with resonant circuit is defined based on calculations of the switching power losses. Switching power losses in IGBT bridge converters are analyzed depending of the converter’s switching frequency. The operation of a full bridge serial resonant converter for switching frequency below and above the resonant frequency is analyzed. Typical application of such converter with variable resonant frequency is when the converter supplies a device for induction heating of metals. In the paper PowerSim and SemiSiel simulations programs are used. The obtained results are experimentally verified and on their basis an induction heating device for metals is constructed. Keywords: POWER CONVERTER, BANDWIDTH, IGBT BRIDGE
1. Introduction One of the basic requirements of power electronic converters is
to convert the energy from one form to another with as high as effi-ciency possible. To achieve this, power electronic circuits utilize semiconductor devices as switches [1].
Size, weight and price reduction of the converters is also one of the major requirements in the design of power electronic circuits. The basic means to achieve this is by using a high operating fre-quency. The increased frequency allows obtaining the same reac-tance values (ωL and 1/ωC) with reduced inductance and capaci-tance values [2], [8]. However, the increased operating frequency increases the switching power losses and degrades the power con-verter stability [4], [9].
To reduce the switching power losses at higher frequencies, resonant converter topologies are used which ensure low switching power losses. Circuits that allow zero voltage and zero current switching (ZVS and ZCS) of the power switches are used i.e. the resonant full bridge converter.
In this paper, analysis of the influence of the switching frequency on the switching power losses in IGBT bridge converter loaded with serial resonant circuit is presented. Then, a full bridge serial resonant converter operation is analyzed in the mode of induction heating of metals.
The metal work piece that is put for heating inside the inductor acts as a short circuit secondary transformer winding and load at the same time and together with the capacitor it can be modelled as series resonant RLC circuit. The parameters of this resonant load change during the metal treatment and have a dynamics that de-pends from these parameters and that affects the operation of the resonant converter. With such loads, converter output power de-pends not only from the voltage rms value, but from the switching frequency as well. The dynamics of the induction heating process is affected by the values of the primary inductance L and the resonant load. As the resonant frequency is determined by L and C, the oper-ating frequency has to be changed according to the change of L and C to maintain constant output power.
2. Influence of the switching frequency on switching power losses
Power losses in IGBT modules When semiconductor switching devices operate in Hard
Switching mode a certain current is turned on or off at a certain voltage level whenever switching occurs, as shown in Fig. 1, [3]. This process results in switching losses. The higher the frequency is the switching losses are greater which obstructs the intention to increase the frequency.
Switching losses can be calculated in a simple way as:
(1) )(21
offonsswswsw ttfIVP +=
Fig. 1. Switching waveforms of a semiconductor switching device.
where, Psw - switching losses [W] Vsw - switching voltage [V] Isw - switching current [A] fs - switching frequency [Hz] ton - switch turn-on time [s] toff - switch turn-off time [s] For a hybrid power module with n IGBTs and m diodes the total power losses are:
(2) DtotTtotMtot mPnPP +=
where, Ptot/T is total transistor power losses and Ptot/D is total diode power losses.
Operating conditions The operating of a full bridge converter in the mode of
induction heating of metals is analyzed. In the simulation program for induction device design ELTA, a copper work piece with mass of 5 kg is thermally treated to melting temperature of 1083 ºC. In the simulation program ELTA the distribution on the inductance is obtained for thermal treatment of a copper work piece, Fig 2.
Fig. 2. Inductance change in induction device for thermal treatment of cop-
per work piece to the melting temperature.
Also, values for the parameters of the supply voltage source, the average, minimal and maximal value of the inductance are ob-tained in the simulation program: the rms voltage is 56 V and the switching frequency is 6 kHz. The simulation results are given in Table 1.
19

Table 1. Simulation results L
(µH) Re
(Ω) C
(µF) Usource
(V) fo
(kHz) Average value 26 0.21 27 56 6
min 25.2 0.21 27 56 6.15 max 27 0.21 27 56 5.85
From Table 1 we can conclude:
Thermal treatment of copper work piece with induc-tion heating to melting temperature is dynamic and it dynamically impacts on inductance change and reso-nant frequency,
The capacitor value for inductance compensation for practical applications is constant.
The values obtained in the program ELTA are used for the power converter design.
Simulation results in the PowerSim program Based on the simulation results for parameters values obtained
in Table 1, simulations are performed in the PowerSim simulation program [6] for full bridge IGBT power converter with resonant load circuit. In the Fig. 3 the simulation circuit in the PowerSim program of the full bridge converter is given. .
Fig. 3. The circuit for the full bridge converter simulation in the PowerSim program.
In the Table 2 values for the voltage, current, power and power losses in the full bridge converter with serial resonant circuit obtained with simulation of the circuit in the Fig. 3 are given with switching frequency of 6 kHz and inductance changes given in the
Table 1. The circuit in the Fig. 3 is simulated with freewheeling diodes connected to the IGBT transistors of the power converter and without these diodes.
Table 2. Values for the voltage, current, power and power losses in the full bridge converter
L
(μH)
Creson
(μF)
Re(Z)
(Ω)
Ioutrms
(A)
Uoutrms
(V)
Sconv.
(kVA)
IDC
(A)
UDC
(V)
PDC
(kW)
PR
(kW)
fsw
(kHz)
fo
(kHz)
Pcz
(W)
PTz
(W)
ηconv
(%)
With freewheeling diode and resonant frequency 26 27 0.21 240 56.6 13.58 219 60 13.14 12.1 6 6 1040 260 92
With freewheeling diode and below resonant frequency 25.2 27 0.21 236 57 13.4 213 60 12.78 11.7 6 6.15 1080 270 92 25.2 27 0.21 212 57 12.08 176 60 10.56 9.44 5.75 6.15 1120 280 90 25.2 27 0.21 202 57 11.5 169 60 10.14 8.57 5.5 6.15 1571 392 85
With freewheeling diode and above resonant frequency 27 27 0.21 237 57 13.5 215 60 12.9 11.8 6 5.85 1104 276 92 27 27 0.21 212 57 12.08 177 60 10.62 9.44 6.25 5.85 1180 295 90 27 27 0.21 199 57 11.3 165 60 9.9 8.3 6.5 5.85 1583 395 84
Without freewheeling diode and resonant frequency 26 27 0.21 238 57 13.57 217.5 60 13.05 11.89 6 6 1154 290 91
Without freewheeling diode and below resonant frequency 25.2 27 0.21 236 57 13.5 215 60 12.9 11.7 6 6.15 1200 300 90 25.2 27 0.21 226 57 12.88 202 60 12.12 10.73 5.75 6.15 1394 348 88 25.2 27 0.21 210 57 11.97 189 60 11.34 9.26 5.5 6.15 2079 519 81
Without freewheeling diode and above resonant frequency 27 27 0.21 236 57 13.5 216 60 12.96 11.7 6 5.85 1260 315 90 27 27 0.21 223 57 12.7 204 60 12.24 10.44 6.25 5.85 1796 449 85 27 27 0.21 199 57 11.3 189 60 11.34 8.316 6.5 5.85 3023 755 73
20

The work on the converter is simulation with IGBT transistor by Vcesat=1.67V and diode voltage VF=1.45V.
In the Table 2 the magnitudes are:
VVUdttuT
U cesatIGBTDC
T
outoutrms 4.5634.3602)(1
0
2 =−=−== ∫,
eoutrmsR RIP 2= power on load resistance eR ,
DCDCDC IUP = power on the DC link circuit,
%100DC
Rconv P
P=η converter efficiency,
MtotRDCcz PPPP /=−= total power losses of the converter,
Tzcz PP =4/ total power losses in one transistor module PTz (transistor and diode).
From Table 2 we can conclude: On the switching frequency same with the resonant
the power losses are lowest, On the switching frequency below and above the re-
sonant frequency converter power losses are in-creased and the efficiency of the converter is de-creased,
In the topology of the power converter with IGBT modules with freewheeling diodes the power losses are decreased and the efficiency of the converter is increased compared to the topology of power con-verter with IGBT modules without freewheeling diodes,
Values for the power losses given in the Table II de-fine optimal bandwidth of the converter (from 5.75 kHz to 6.25 kHz) for which the efficiency of the converter is greater than 90% (converter topology with freewheeling diodes).
On the Fig. 4 is given change of the power losses of IGBT module to the change switching frequency for IGBT module with freewheeling diode and without diode. Fig. 4 is obtained from the values on the Table 2.
Fig. 4. Dependence of the power losses of IGBT module to the change switching frequency PTz = F(f).
Simulation results in the SemiSiel program Simulations are done in the SemiSiel [7] program for the full
bridge converter with parameters defined in the Table 2. The power losses values of the converter are given in the Table 3. In the
simulations two IGBT modules type SKM195GB066D are used in each branch, which means that there are eight semiconductor switches in the converter.
Table 3. Simulations results obtained in SemiSiel program
SKM195GB066D 4 modules
on resonant frequency f0 = 6 kHz , fsw = 6 kHz
SKM195GB066D 4 module
below resonant frequency f0 = 6.15 kHz , fsw = 6 kHz
SKM195GB066D 4 module
above resonant frequency f0 = 5.85 kHz , fsw = 6 kHz
Pcond tr 115 W 116 W 118 W PswT= Pon/T+Poff/T 6.78 W 6.89 W( Pon) 7.01W(Poff/T)
PTr 122 W 123 W 125 W Pcond d 0.00 W 0.00 W 0.00W Psw/d 8 W 12W(Poff/d) 11W(Pon/d) Pd 8 W 12 W 11 W
Pcz=Ptotal 1040W 1080 W 1088W From the Table 3 losses of the transistors and diodes in the
converter can be read. Table 3 shows that: On switching frequency below the resonant frequen-
cy transistors in the converter are switching with hard turn on (non ZVS) and soft turn off (ZCS). Diodes are switching with hard turn off and soft turn on, and the power losses occur as a result of their switching,
On switching frequency above the resonant frequen-cy transistors in the converter are switching with hard turn off (non ZCS) and soft turn on (ZVS). Diodes are switching with hard turn on and soft turn off, and the power losses occur as a result of their switching.
Summary of the results The results in the program ELTA show that for induction
heating of copper work piece to melting temperature the circuit
21

inductance is changing in the range from 25.2 µH to 27 µH, and the required resonant frequency changes from 5.85 kHz to 6.15 kHz.
The results obtained from the ELTA program for the power converter which supplies an induction device are used in the PowerSim and SemiSiel programs to obtain the power losses and they are given in the Table 2.
Based on the results for the power losses efficiency of the power converter can be calculated and also the optimal bandwidth in which the converter will operate with efficiency greater than 90% can be defined.
The calculations show that optimal bandwidth is in the range from 5.75 kHz to 6.25 kHz. This frequency range is wider than the resonance range which is from 5.85 kHz to 6.15 kHz defined in the Table 1.
3. Experimental results In this section we are interested for the total power losses in a
practically constructed power converter obtained with measurement. Topology of IGBT full bridge power converter with serial resonant load with parameter values as in the Table 1 and 2, is used for supplying induction heating device used for melting of a copper work piece with mass 5 kg.
The Table 4 shows values of the magnitudes obtained with measurement in a practically constructed power converter with switching frequency of 6.15 kHz, operating slightly above the resonant frequency 6 kHz. In the converter two IGBT modules type SKM195GB066D are used in each branch.
Table 4. Power losses in a practically constructed power converter in mode of induction heating device obtained with measurement
)(AI DClink
)(V
U DClink
)(kWPDC
)(A
Ioutrms
)(VU outrms
)(kVA
PS outout ≈
(%)convη
225 60 13.5 225 55 12.38 92
Table 4 shows that:
DClinkDClinkDC UIP = is the power on the DC link circuit, this is the input power of the converter,
outrmsoutrmsoutout UIPS =≈ is the apparent output power of the converter, because the converter operates close to resonant frequency, the apparent output power is close to the active power,
WPP outDC 1120=− is the total power loss in the converter, and it is close to the total power losses given in the Table II and III.
%92== convDC
out
PP η is the efficiency of the power
converter. In the Fig. 3 the practically constructed converter is given on
which the above measurements were performed.
Fig. 3. Practically constructed power converter
4. Conclusion In this paper is show a procedure for optimal bandwidth of
power converters loaded with resonant circuit. The bandwidth is defined based on calculations of the switching power losses. Switching power losses in IGBT bridge converters are analyzed depending of the converter’s switching frequency. The operation of a full bridge serial resonant converter for switching frequency below and above the resonant frequency is analyzed. Also here are give results from practical application on this power converter in induction device for melting on work piece copper.
5. References [1] Williams W. B.,Principles and Elements of Power Electronics, University of Strathclyde, Glasgow, 2006. [2] G.Stefanov, L.Karadzinov, D.Karanfilov: Design of Power Converter for Induction Furnaces with Computer Simulation, MIPRO 2010, Opatia, Croatia, 33 International Convention, pp.164-169, 24- 28.05.2010. [3] Viriya Pichetjamroen,. Naras Yongyuth, and Kouki Matsuse, Analysis of Two Continuous Control Regions of Conventional Phase Shift and Transition Phase Shift for Induction Heating Inver-ter under ZVS and NON ZVS Operation, IEEE, 2008. [4] M. Hierholzer, H. Brunner, T.Laska, A. Porst, Characteristics of High Voltage IGBT Modules PCIM Proc. Power Electronics, pp.135-139, 1995, Nürnberg. [5] C. Soule, Thermal Management of IGBT Power Modules, PCIM, Proc. Power Electronics, pp.297-312, 1995, Nürnberg [6] WWW.PowerSim.com, simulation program for power electron-ic 8.0.5. [7] WWW.semikron.com, simulation program semesiel for power electronic. [8] G.Stefanov, R. Dambov, Fundemental principes of working in resonant converter for induction heating, MGU International Scientific Conference, Sofia, VOL. 52, pp. 23-27, 19–20 Oct 2009.
[9] S. Konrad, Thermal Behaviour of Power Modules in PWM-Inverter, EPE 1995, Sevilla, Spanien, Proc. Vol. 1, pp. 565-570 [10] Semikron, Application manual, 2008.
22

APPLICATION OF SPHERICAL BEARINGS IN TURBOFAN AIRCRAFT ENGINE Rejman E., Ph.D.,Eng.
Faculty of Mechanical Engineering – Rzeszów University of Technology, Poland
Rejman M.,M.Sc., Eng. Designer, Turbine Engines Design Department – Wytwórnia Sprzętu Komunikacyjnego „WSK PZL-Rzeszów” S.A, Poland
Abstract: Spherical bearings have a very common application in machine and aircraft industry where rotational flexibility is required at joint connection. In an aircraft the application of spherical bearings plays an important role since they are used in critical interfaces of aircraft or aircraft engine structure. The article presents different types of spherical bearings with their applications, typical materials used for the bearings and bearing life calculation method.
Keywords: SPHERICAL BEARING, TURBOFAN ENGINE
1. Introduction Spherical bearings have a very common application in machine
and aircraft industry where rotational flexibility is required at joint connection. In an aircraft spherical bearings have applications in different places starting from the aircraft structure, finishing on the turbofan engine. Figure 1 shows typical locations of spherical bearings in turbofan engine.
Fig. 1 Spherical bearings application in turbofan engine: 1) Fan, variable geometry actuator bearings, 2) Compressor, variable geometry actuator bearings, 3) variable nozzle, actuator bearings, 4) thrust reverser and blocker door actuator and support bearings, 5) engine mounts, 6) gearbox mounts, 7) oil tank mounts, 8) oil cooler mounts
Figure 2 shows typical locations of spherical bearings in an aircraft structure.
Fig. 2 Spherical bearings application in aircraft structure: 1) Nose landing gear actuator, steering and support bearings 2) main landing gear actuator and support bearings, 3) door and canopy actuator and support bearings, 4A) leading edge slat actuator and support bearings, 4B) trailing edge flap actuator and support bearings, 4C) spoiler actuator and support bearings, 4D) aileron actuator and support bearings, 5) horizontal stabilizer actuator and support bearings, 6) vertical stabilizer actuator and support bearings, 7) thrust reverser actuator bearings, 8) pylon and engine mount bearings
2. Discussion Variety of bearings application enforced different types of
design like: swaged bearings, loader slot bearings, split ball bearings, split race bearings, bearing with teflon insert and the seal.
2.1 Swaged bearing The bearing is manufactured by swaging a ductile race
around a hardened ball. The race is machined and the assembly released to obtain proper clearance between spherical ball outer diameter and race inner diameter. Swaged spherical bearings have from 80 to 100 % contact between race inner diameter and ball outer diameter. The large contact area between ball and race allows to take very high static loads. The disadvantage of this type of bearing is the lack of exact control of bearing radial clearance.
Fig. 3 Swaged spherical bearing
2.2 Loader slot bearing Loader slot bearing is a non-swaged bearing type. The
spherical race inner diameter is fully machined, case hardened and lapped. Lapping operation enables to achieve very exact dimension tolerances which give a very good control of internal radial clearance and contact area of mating surfaces. On the front face of the race there are machined entry slots which facilitate an assembly of the ball. At the assembly of the bearing in dedicated part it’s important that the loader slots will be positioned in the angle of 90 deg to the load which will be acting on the bearing. It’s important since the loader slot cross section is the weakest portion of the bearing.
An advantage of loader slot bearing is the fact that a ball is exchangeable without the need of bearing race removal from the next higher assembly. These types of bearings support static and dynamic loads.
23

a)
b)
Fig. 4 Loader spherical bearing: a)Spherical ball and outer race with loader slot, b) Example arrangement of loader slot bearing
2.3 Split ball and split race bearing Split ball spherical bearings are designed to offer similar
advantages like slot bearings. In the split ball bearing there is no loss of bearing area due to the entry slot. The split ball is machined and ground in matched sets with zero gap at the separation plane. The ball is typically a copper alloy. Just as the load slot bearing, the race is fully machined, wear surface hardened, then finished with a lap operation. Because the race is the harder member, the wear is intended to occur on the ball. The split ball design allows to replace the ball without the need of replacement of all bearing assembly. Split ball designs are intended for applications only where pin rotation will occur. There are no clamping force on the ball faces.
Split race bearings have a race that is circumferentially or transversely split. The resulting two half races are placed around the ball and retained by a housing. Split race designs are used principally on larger bearings when installation in the applications is difficult.
a)
b)
Fig. 5 Split spherical bearing: a)Split ball bearing, b) Split race bearing
2.4 Sealed bearing For applications in which there is dirty environment sealed
bearing is required. The seal is a mixture of rubber and silicone, which is secured by metal shield welded to the outer race. Teflon liner is used for bearings working in high load conditions. An example of bearing application can be aircraft landing gear and wing flap actuator.
Fig. 6 Sealed spherical bearing
2.5 Typical materials for spherical bearings Materials used for spherical bearings can have different ball-
race configurations which depend on an application, working conditions, maximum loads and maintenance criteria. Table 1 shows common used materials.
Table 1: Materials for spherical bearings Application Corrosion
resistant steel Nickel based
alloy Cobalt
based alloy
Ball 303
440C
PH13-8Mo
15-5PH
17-4PH
A-286
BG42
Greek Ascoloy
Inconel 718
InconelX-750
Rene 41
Waspaloy
Stellite 3
Stellite 6
Stellite 6B
L-605
MP35N
Race 303,304
410,416,422
431,440C
PH13-8Mo
15-5PH
17-4PH
A-286
Greek Ascoloy
Inconel 718
Inconel X-750
Monel 400
Monel K500
Rene 41
Waspaloy
L-605
3. Results of discussion Boundary dimensions of spherical joint depend on ball
diameter in function of contact stress:
a
a
a
r
r
pA
F
A
F
D**
2
2
2
2
ϕπ
−− +
= (1)
24

2
4DAA r
r π=
−
(2)
2
4DAA a
a π=
−
(3)
r
a
AA
=ϕ (4)
where: Fr – radial load, Fa – axial load, Ar – nominal area of contact, Aa – effective area of contact, ϕ - the ratio between the effective and nominal area, pa – maximum contact pressure.
Fig. 7 Spherical joint loading scheme
The stress in the dangerous section of the spindle is calculated by the following equation:
30
20
max324
daF
dF ra
ππσ += (5)
where: d0 – diameter of the spindle in the weakest area.
The safety calculations are performed in terms of contact pressure:
aa
a
r
r
pDA
F
A
F
≤
+ −−
2
2
2
2
2
**
4
ϕπ (6)
Calculations of spherical bearing taking axial and radial load are performed with taking under consideration static and dynamic loads.
Contact pressure pe for dynamic load conditions is calculated from equation (7):
DBF
FFpr
are **
6 22 += (7)
where: B – width of the bearing race, D – spherical diameter of the ball.
Fig. 8 Spherical joint radial-axial loading scheme
Knowing the contact pressure it can be calculated the durability of the bearing expressed in the number of cycles:
53
000 10*
=
eppfL (8)
where: f0 – bearing lubrication factor, po – dynamic permissible contact pressure for L0=105 number of cycles.
For static calculations of spherical bearing it is considered the condition:
ase pp ≤ (9)
where: pas – admissible static contact pressure.
Nominal bearing life is calculated by the following equation:
53321 10**)(**
=
PCaaaL (10)
where: a1 - the coefficient of the direction of acting of the load, having values a1 = 0.015÷5, as a function of the kind of load and kind of material pair, a2 - coefficient of maintenance having values a2=1 or a2=15, as a function of the existence or non existence of lubrication and the kind of material pair, a3 - coefficient of temperature of the bearing having values a3=0.3÷1, as a function of the working temperature and the nature of the material pair, C – dynamic loading capacity factor, P – equivalent load In many cases spherical bearings are working under radial, radial-axial and axial load conditions. Then dynamic loads for the bearings are calculated by the equation:
ar FYFXP ** += (11) where: X - the coefficient of radial load (for radial bearings X=1, for
radial axial ones X=1 if 8.0≤r
a
FF and X = 0.6 if 8.0⟩
r
a
FF , for axial
ones X=1.2), Y - the coefficient of axial load (for radial bearings Y=1÷6 as a function of the ratio Fa/Fr=0.2÷1.6 and the nature of the
material pair, for the radial axial bearings Y=0 if 8.0≤r
a
FF and
Y=0.7 if 8.0⟩r
a
FF , for axial ones Y=1).
Working conditions of the spherical joint include also rotational movement of the ball in the race (yawing movement) which has an influence on bearing life. To establish an allowable limit for ball sliding speed it’s necessary to establish p*V factor:
25

BDFp r
*= (12)
where: p – contact pressure [N/mm2], Fr – radial load [N], B – width of the bearing race [mm]. Sliding velocity is calculated by the equation:
60*90*** fDV βπ
= (13)
where: V – sliding velocity [mm/s], β – half angle of turn of ball in the race , f – frequency of yawing motion of the ball in the race. Factor p*V needs to meet following criteria”
pV < pVallowable (14) An example value of pVallowable factor for material steel on steel is 400 [N/mm2*mm/s].
4. Conclusions The weight of the gearbox is the basic criteria used in aircraft industry. Gearbox arrangement at the early phase of the design has a serious impact on the gearbox weight. An application of the gearbox ratio share methodology for specific gearbox stages allows to minimize gearbox weight.
5. References [1]. MIL-HDBK-1599A. Department of defense handbook: Bearing, control system components and associated hardware used in the design and construction of aerospace mechanical systems and subsystems. Washington 11 March 1997.
[2]. NAS0331. National aerospace standards committee: Bearing installation and retention by swaging or staking. June 1992.
[3]. HEIM BEARINGS catalogue: rod ends, spherical, rolling element bearings.
[4]. NHBB astro division products and engineering catalogue: spherical bearings, loader slot bearings, rod end bearings, sleeve bearings.
[5]. Stanton, John F.; Roeder, Charles W.; Campbell, T. Ivan: High-Load Multi-Rotational Bridge Bearings: NCHRP Report 432. Transportation Research Board 1999. ISBN: 978-0-309-06614-3.
[6]. U.S. Army Materiel Command: Engineering Design Handbook, Helicopter Engineering, Part Two - Detail Design: (AMCP 706-202).
26

ERGONOMIC RESEARCH FOR THE QUALITY OF THE ENGINEERING TRAINING
ЕРГОНОМИЧНО ИЗСЛЕДВАНЕ КАЧЕСТВОТО НА ИНЖЕНЕРНОТО ОБУЧЕНИЕ
Assist. Prof Karamanska, D. Y. PhD.1, Dipl. Eng. Yoshovska, I. N.2 University of Chemical Technology and Metallurgy, Bulgaria1
Bulgarian Association Intelligent Transport Systems, Bulgaria2
Abstract: In ergonomic aspect engineering training is complex and intense human activity. It is a subject of research and analysis in order to optimize it. Quality of education is seen as a trinity of effectiveness, efficiency and satisfaction – criterias, which are defined, tested and evaluated by a specially developed original methodology by the authors.
Keywords: QUALITY OF TRAINING, ERGONOMIC RESEARCH, EFFECTIVENESS, EFFICIENCY, SATISFACTION
1. General characteristics of the problem Training of students in engineering universities is highly intense
intellectual activity associated with acquiring specific knowledge and expertise in various fields. Like any other human activity training is subject to optimization, which requires permanent research and evaluation. Ergonomics is a scientific field aimed at continuous improvement of human activities, by considering the "human factor" as at an individual level (each person is a unique individual with his physique, psychology, anatomy, etc.) and in organizational plan of activities which he/she performs to achieve predefined objectives (activities). The criteria for making such an ergonomic evaluation of each activity are [1]:
• good and excellent results in labor; • protect the health of each worker; • providing conditions in which a person feels satisfied. "Usability" [8] and "usability engineering" [6] have been
developing and specifying these "ergonomic" criteria during the last decade. At the beginning these criteria applied only to evaluation of usability of software products [9]. Gradually they are shown to apply to the evaluation of other products, systems, services - activities [3]. The essence of "usability" is concluded in: the quality of every product, system or service is assessed by users themselves in the summary criteria: effectiveness, efficiency and satisfaction. The meaning and content of these criteria are defined in international standards such as series of standards ISO 9242.
In ergonomic aspects the quality of engineering training includes research and evaluation of engineering training in order to reach aims of training considering students’ efforts and satisfaction in the process of training. In its essence, the quality of education is regarded as a trinity of its effectiveness, efficiency and satisfaction.
The Ergonomic study of the quality of engineering training enables students-users of "service" – training to assess the achievement of the main goal: acquisition of high quality and adequate to the time training. (Axiomatic is a link training – education. High quality training is essential for highly quality education).
The quality of training depends on the specific conditions under which it occurs. The survey, represented in this article, includes the activities of students with their success, efforts and satisfaction with: fulfillment of academic tasks (examinations, development and defence of a projects); characteristics of training such as: the level of teaching, consisting content, complexity, actuality, organization and informational cover, laboratory and IT equipment (hardware, software), physical and not least the social and professional environment at the university.
2. Methods of Ergonomic research 2.1 Tasks The tasks of the ergonomic research of quality of engineering
training include: • Definition of the terms quality of training, effectiveness and
efficiency from the Ergonomics point of view;
• Development of adequate methods for ergonomic approach for obtaining the necessary information for defining and measuring quality of engineering training;
• Research and evaluation of quality of training, according to the ergonomic approach.
2.2 Definitions In this article under the term Ergonomic quality of training we
understand: the degree of achievement of the goal: accomplishment of high quality and adequate up to date training, evaluated by the users-students themselves, which is effective, efficient and satisfactory.
Effectiveness (EF) reflects the degree of attainment of training objectives – the successful solution of academic tasks (command of basic theory, special, specialized and practical knowledge and skills through good teaching and methodical work).
Efficiency (EC) reflects efforts in passing exams, development and defence of projects: as time, cost of resources in psychological, health, social and material aspect.
Satisfaction (ST) reflects the attitude (positive or not) of the user-student to the overall process of training, expressed in the sensation of comfort or discomfort in the university intellectual, social and physical environment.
Experience shows that it is possible by using objective or subjective tests (measurements) to obtain data associated with each component of the ergonomic quality of every human activity, including in training [4]. For satisfaction, for example, we can draw conclusions and by objective measurements concerning behavior – demonstrated confidence, activity outside the university and academic activities. The effectiveness and efficiency can be assessed by subjective opinion of the users about their work and results during their training [5].
2.3 Model and methods of the study Fig. 1 shows definition of the aims of ergonomic research.
Fig. 1 Model of Ergonomic research and evaluation of quality of
engineering training
Components for Ergonomic evaluation: - Teachers’ work - Academic tasks and methodological organization of training - E-learning - Learning environment (working places and physical conditions)
Aim: high quality of training, evaluated for: - Fundamental-theoretical disciplines (FED); - General engineering disciplines (GED); - Specialized engineering disciplines (SED); - Practices, internships and theses (PR) Generalized Ergonomic Assessment (GEA)
Criteria for EA of quality of training
EFFECTIVENESS EFFICIENCY
SATISFACTION
27

The aim of the survey is the increase of the quality of engineering training. This aim is investigated by sub aims, which include improving education in:
- Fundamental-theoretical disciplines (FED); - General engineering disciplines (GED); - Specialized engineering disciplines (SED); - Practices, internships and theses (PR).
Every one sub aim is evaluated for effectiveness, efficiency and satisfaction through a set of assessments for deferent indicators.
Description of the components of ergonomic research and evaluation
The teachers’ work – assessed trough parameters which reveal their professional and pedagogical competence and their ability to work with new IT.
Academic tasks and methodical organization of training – assessment of the characteristics of academic tasks that affect the ergonomic quality of training as content and complexity of educational information, provision of textbooks and other materials, methodical organization of seminars, optimization of the schedule of classes, deadlines for the learning of material, frequency and duration of the academic tasks, success and difficulties in examinations, etc.
Learning environment – assessment of important characteristics of the physical and social environment such as equipment for classrooms and workplaces with the necessary technical equipment, availability of libraries and their informational and technical support, computer networks, equipment, furniture, assessment of physical environment: microclimate (temperature, relative humidity), lighting, noise, social and cultural environment (e.g. internships, organizational structure).
E-learning – assessment of important characteristics for e-learning, such as availability of educational and informational materials uploaded for the specific field of training, in different subjects, the degree of free access to information and usage of specialized software.
Ergonomic assessment of the quality of training (EAQT) with Ergonomic checklist (ECL)
The method of ECL allows evaluation of multiple single, private or complex ergonomic factors and indicators through questions, answers of which include using of multi-scale system [1, 2]. Each factor, indicator or component has its own weight, which is part of a complex ergonomic assessment of EAQT. The value of the weight coefficient is determined by the expert method and depends on the degree of influence of the factors and its structural defined place in the hierarchical model of EAQT. The complex EAQT is evaluated by the equation below:
(1) Е = αEFЕAEF + αECЕAEC + αSTЕAST,
where E is EAQT; EAEF; EAEC; EAST are ergonomic assessments (EA) of: effectiveness, efficiency, satisfaction with training; αEF; αEC; αST are weights for effectiveness, efficiency, satisfaction with training.
Fig. 2 The structural scheme of the ECL
Each of the assessments of key criteria (effectiveness, efficiency and satisfaction) is also the result of a hierarchical system of assessments of specific for the component ergonomic factors and indicators. This requires a thorough analysis of the influence of each investigated factor/indicator and its weight in the structural model of EAQT as well as the mathematical model for processing the experimental results. The development of ECL is a long and responsible process which requires multiple inspections, adjustments and optimization in order to obtain maximum reliable ergonomic assessment for the investigated system. Fig. 2 shows a structural scheme for the evaluation of training for criteria effectiveness, efficiency, satisfaction for each group of subjects (FED, GED, SED and PR) and GEA.
The effectiveness of training for each group of subjects (FED, GED, SED and PR) is formed by assessments of the indicators from ECL:
- The work of teacher according to criteria – AEF 1 ....... n; - Academic tasks and methodical organization – BEF 1 ...... p; - E-learning environment – C: 1 ....... s; - Learning environment, D1, D2, D3. The efficiency of training for each group of subjects (FED,
GED, SED and PR) is formed from the assessments of indicators different from those for EF:
- The work of teacher according to criteria – AEC 1 ....... n; - Academic tasks and methodical organization – BEC 1 ...... p; - E-learning environment – C: 1 ....... s; - Learning environment, D1, D2, D3. Satisfaction with training for each group of subjects (FED,
GED, SED and PR) is formed by assessments of special questions asked in the ECL for:
- The work of teacher according to criteria – AST 1 ....... n; - Academic tasks and methodical organization – BST 1 ...... p; - E-learning environment – C: 1 ....... s; - Learning environment, D1, D2, D3. Technical and technological preparation of the study Technology of research includes consideration of the following
requirements: - The respondents have completed a particular specialty with a
bachelor degree in a recent one or two years, which draws the attention of some researchers to students in master degree in related disciplines;
- Preliminary study of the objects of study – curricular, specifics of the courses for the specific specialty in bachelor degree and other academic tasks;
- Preparation of printed and/or electronic materials for each group of respondents.
For the study seven ECLs have been developed for different engineering specialty in bachelor degree in three universities: University of Chemical Technology and Metallurgy (UCTM), University of Forestry (UF) and Technical University - Sofia (TU).
Each checklist contains questions (total 355), requiring assessments in 5 degree levels scale of effectiveness, efficiency and satisfaction. Questions on the checklist have been grouped into four sections for evaluation of training in:
- Fundamental-theoretical disciplines (FED); - General engineering disciplines (GED); - Specialized engineering disciplines (SED); - Practices, internships and theses (PR). 3. Results and analysis of the research The research was conducted during the school year 2010/2011.
The students who were surveyed were 150 and all were MA students. The results are presented summarized below. (Summarized results help to show general trends for the optimization of engineering training while any assessment of single or private ergonomic factors and indicators is an indicator of success or problems in the training of students in different engineering specialty in a certain university.)
Table 1 and Fig. 3 present the results of evaluations of the effectiveness of engineering training. These assessments have been arranged from good to very good. The lowest assessments are those
А. Teacher’s work
B. Academic tasks and methodological organization
D. Learning environment: D1. Technical equipment D2. Working places D3. Physical parameters
C. E-learning
Assessment by indicators from ECL АEF.1.......n; AEC: 1……..m; AST: 1…...k BEF: 1......p; BEC: 1……..q ; BST: 1…. r C:1…….s D1, D2, D3
EAQT: FED/GED/SED/PR and generalized
28

of fundamental training and there is a trend for their increase for GED and SED.
Table 1: Effectiveness of engineering training Effectiveness of training UCTM FU TU
FED 4.13 4.09 4.05 GED 4.22 4.38 3.81 SED 4.43 4.24 4.29 PR 4.55 4.96 4.35 EAEF 4.33 4.42 4.13
The highest assessments of the effectiveness of the activities of the students are in PR.
Fig. 3 Effectiveness of engineering training
Students give a fairly good estimation for the effectiveness of engineering training, which means that they successfully deal with the set of academic tasks.
Table 2: Efficiency of engineering training Efficiency of training UCTM FU TU FED 4.09 3.93 3.83 GED 4.08 4.36 3.71 SED 4.45 4.2 4.11 PR 4.27 4.75 4.64 EAEC 4.22 4.31 4.07
Table 2 and Fig. 4 show the results of assessments of the efficiency of engineering training. The results shows a reduction in assessments in comparison with those of effectiveness, i.e. the efforts, which students put to execute academic tasks and are the main part of the assessments of the efficiency of training, are the reason for these lower assessments.
Fig. 4 Efficiency of engineering training
Once again, we could notice the relatively low assessments for FED, but in assessments for GED we also could notice decline for two of the universities (UCTM and TU). This is an indicator for a need of improvement of training in this group of subjects.
In terms of PR UF and TU show even very good assessments, but for UCTM we could notice decrease of assessments compared to those of the SED. This is also an indication of the level of organization and achieved good results in this group of engineering training.
Table 3 and Fig. 4 present the results of generalized ergonomic assessments (GEAs) for the three universities and the assessment of student satisfaction with the e-learning.
Table 3: EAQT and EA of E-learning UCTM FU TU
EAEL 3.42 3.34 3.33
EAQT 4.35 4.37 4.14
Generally, conclusion is that the available e-Learning is underdeveloped and this could be one important direction to improve the quality of education.
Fig. 5 EAQT and EA of E-learning
Table 4 and Fig. 6 show the results of evaluations to the satisfaction with engineering training.
Table 4: Satisfaction with engineering training Satisfaction with training: UCTM FU TU
FED 4.08 4.02 3.94 GED 4.14 4.4 3.8 SED 4.41 4.09 4.12 PR 4.75 4.61 5.3 EAST 4.5 4.39 4.23
Assessments for the satisfaction with FED, GED and SED, with few exceptions (UF - GED), are lower than the assessments of effectiveness and efficiency. The highest assessments for the entire research are assessments of satisfaction for the PR.
Fig. 6 Satisfaction with engineering training
Table 5 and Fig. 7 summarize the ergonomic assessments for the three universities in the three components: effectiveness, efficiency and satisfaction.
Table 5: Generalized ergonomic assessments (GEAs)
UCTM FU TU EAEF
4.33 4.42 4.13 EAEC
4.22 4.31 4.07 EAST
4.5 4.39 4.23
29

The results show a sustainable trend for a good assessment of the effectiveness of training, decrease in the assessment of the efficiency and very good assessments for satisfaction with engineering training.
Fig. 7 Generalized ergonomic assessments
The analysis of the overall results shows the following: - The students from the investigated speciality in the three
universities cope successfully with the academic tasks (the average EAEF = 4.29)
- The efforts which students put are relatively higher. The students have some claims to the quality of teaching, methodical work and equipment. (This affects the efficiency of training, the average EAEC = 4.2)
- As potential for improving the quality of engineering training assessments of student satisfaction could be considered (the average EAST = 4.37). This potential should be utilized towards increasing individual assignments and initiative of students themselves.
Conclusion The Ergonomic approach of research of the quality of
engineering training has the following advantages: - The investigated aspects of ergonomic quality of engineering
training are an essential part of the overall assessment of the quality of education.
- The success of training (effectiveness and efficiency of the training) and satisfaction of consumers-students can be used to assess the quality of engineering training in a particular university.
- The assessment of the effectiveness and efficiency of engineering training and user-students satisfaction is the basis for comparison of the quality of training among universities.
- Quality of training can be defined, documented and verified, and this could be a significant moment as part of the quality plan of each university.
In ergonomic aspect the quality of engineering training can be improved by bricking those characteristics and properties that are known to be friendly to the user-student in each educational context. It is important and necessary dynamic characteristics and parameters of training to be monitored and evaluated, such as:
• rates of penetration of informational technology and e-learning;
• updating of teaching and conditions of training, • optimizing the content and complexity of the educational
content, increasing actuality, problematic in training; • modernization of facilities with modern equipment for
effective study laboratories, auditoriums. In ergonomic aspect the raising of the quality of engineering
training is a prerequisite to improve educational outcomes and attainment of educational goals.
References
1. Karamanska, D., Engineering Psychology and Ergonomics, Sofia, Es Print, 2006, p. 250 – 254, [Караманска, Д., Инженерна психология и ергономия, София, Ес Принт,2006, стр. 250 – 254].
2. Karamanska, D., I. Yoshovska, Ergonomic research and evaluation of equipment for the Engineering education, V
International Scientific Conference “Management and Engineering’07” Sozopol, June 2007, Vol.2(97) p. 255-258 [Караманска, Д., И. Йошовска, Ергономично изследване и оценка на технологично обезпечаване на инженерно обучение, V International Scientific Conference “Management and Engineering’07” Sozopol, June 2007, Vol.2(97) p. 255-258].
3. Karamanska, D., Usability engineering of products and systems, Sofia, Publishing House “Prof. Petko Venedikov”, 2007, p. 79 – 85 [Караманска, Д., Техническа използваемост на продуктите и системите, София, ИК Петко Венедиков, 2007, стр. 79 – 85].
4. Karamanska, D., I. Yoshovska, Ergonomics design of human activity - a factor for efficient management of human resources, VI International Scientific Conference “Management and Engineering’08” Sofia, June 2008, Vol.1(104), p. 151-154 [Караманска, Д., И. Йошовска, Ергономичното проектиране на човешката дейност – фактор за ефективен мениджмънт на човешките ресурси, VI International Scientific Conference “Management and Engineering’08” Sofia, June 2008, Vol.1(104), p. 151-154].
5. Karamanska, D., I. Yoshovska, Ergonomic principles and objectives in the design of work equipment and systems, VI International Scientific Conference "Management and Engineering'08" Sofia, June 2008, Vol.1 (104), p147-150 [Караманска, Д., И. Йошовска, (2008), Ергономични принципи и задачи при проектиране на работни съоръжения и системи, VI International Scientific Conference "Management and Engineering'08" Sofia, June 2008, Vol.1 (104), p147-150].
6. Faulkner, X., Usability engineering, Pal grave, Grassroots, 2000, p. 20 – 45.
7. Gould, J, (2000), “How to Design Usable System” in Grudging, San Francisco, Buxton and Greenberg (eds) Readings in HCI, Morgan Kaufman, 2000, p. 56 – 70.
8. Jordan, P., An introduction to Usability, London, Taylor and Francis, 1998, 40 – 70.
9. Pressman, R., Software Engineering: A Practitioner’s
Approach, 2 nd edition, Hemel Hempstead, McGraw Hill, 2004, 89 – 102.
30

ALTERABLE IN TIME TRANSFORMATION OF AGGRIGATIVE STATE OF MACHINE SYSTEM WITH CHANGEABLE STRUCTURE AND COMPONATICS ON
BASIS OF AUTOMATICALLY RENEWABLE PRISMATIC MODULAR UNITS
ИЗМЕНЯЕМОЕ ВО ВРЕМЕНИ ПРЕОБРАЗОВАНИЕ АГРЕГАТНОГО СОСТОЯНИЯ СИСТЕМЫ МАШИН ПЕРЕМЕННОЙ СТРУКТУРЫ И КОМПОНОВКИ НА ОСНОВЕ АВТОМАТИЧЕСКИ
СМЕННЫХ МОДУЛЕЙ ПРИЗМАТИЧЕСКОЙ ФОРМЫ
Prof.Dr.Eng. Tsaryev A. Togliatti State University, Togliatti, Russia
Abstract It is represented the scientific Statements of Aggrigative State of Machine Systems with changeable structure and componatics
with usage of automatically interchangeable and renewable aggregates and modular units. A Recomponation and units change Automatization on various structural levels are main properties of the time – invariant transformation of aggregative state Machine System and their exploitation parameters.
KEYWORDS: MACHINE SYSTEMS WITH CHANGEABLE STRUCTURE AND COMPONATICS, AUTOMATICALLY INTERCHANGEABLE AND RENEWABLE MODULAR UNITS
Introduction. One of direction of increasing of Manufacture effectiveness it is become the creation of Mechatronic Automatic Manufacturing Machines (MAMM) possessing by properties of Structural and Componatic Transformation and of Componatics Changing.
The Recomponatics is necessary property of MAMM Flexibility to change and transform the Componatics in process of structure changing in a coordinated fashion with transformation of technological process structure and work – piece machining. The Recomponatics is directed to changing of MAMM Configuration, its overall view in changing process of units space orientation, relative allocation, basing and clamping. In Componated Status of MAMM it is performed production process, conjoint functioning of units and mechanisms, performing technological functions.
The MAMM appearance as scientific direction reply to contemporary tendencies and development strategy Multivariant Production in optimal range of production program changing from Mass to Individual Productions.
The Aggrigative State Transformation of Machine Systems on Basis of Automatically Renewable Prismatic Modular Units МАММ with Aggregation Principle and properties variability
of MAMM Machine Systems changeable structure and componatics are named as Recomponateable Manufacturing Systems (RMS1) [11,12,13,17,19,21,22] and in contradistinction from Reconfigurable Manufacturing Systems (RMS2) [32,33,34,35] are based on distinctive characteristics such as multiplicity and multivariation usage and modules goal destination, changeability of units bases and allocation and clamping places in Recomponation process. In fulfillment of production process with usage Recomponateable Manufacturing Systems (RMS1) there are performed the control by material, energetic, information and product flows varied in real time. With usage of aggregate composition and automatic changing Machine System aggregate modular units it is decided problem of life cycle increasing and problem of Manufacturing System Rejuvenation and Renewal [21]. The Recomponateable Manufacturing Systems (RMS1) are related to the Avant-Garde Manufacture Technologies (AMT) of Machine – building industry evoluation. The RMS1 is constituted the main field of contemporary Manufacture development that they might be not only readjusted and had the automatic mechanisms for tools changing, but might automatically change the Componatics and Structure in real time and they might be componated from various aggregates and modular units and be recomponated with decision of concrete production task don’t stopping continuous process of technology changing. These RMS1 Machine Systems presuppose new possibilities of industrial contradiction overcoming when time factors: dates of realization, attainment of quality and quantity production are defined by requirement of all growing rivalry and
business struggle [18]. The Recomponation is become by necessary flexibility property to change and transform the Structure, Composion and Componation in process RMS1 Machine System changing in correlation with technological process structure transformation of work – pieces production [10,13,15].
The hierarchy system of aggregation is composed the base of multilevel RMS1 Componation from automatically changing modular units [12,13,15,23,24,25,26,27,28]. In common case for each two units, forming hierarchy aggregation subsystem, one from these units of the most hierarchy level is by basic elsewise bearing (carrier) unit, i.e. is revealed by bearer towards to units of smaller level of structural hierarchy. The bearer y structural hierarchy level is aggregate or modular unit serving for allocation on them unit (units) and mechanisms of y - 1 level in RMS1 structure for performing conjoint technological functions.
Viewing the bearers as automatically changing aggregates and modular units, there are separated two group of Componation branches on RMS1 work station. 1. The branch (branches) joined bearers, units, aggregates for technological and multitools action on work – pieces. This branch is named – the Machining Tools Branch (MTB). 2. The branch (branches) of bearers, units and aggregates for basing and clamping of work – pieces. This branch is named – Work – Piece Branch (WPB).
RMS1 Componation elements are revealed by automatically changing modular units of technique means complex [9,10,12,14,23,24,25,26]. The modular units are represented by single – level aggregates and modules for multilevel composition on various levels of structural hierarchy. The componated multilevel aggregate are stated by RMS1 technological complete. The technological complete, allocated in production componation space, is formed work station of technological and transport componation branches [17,28].
The aggregate formation principle of automatic Manufacturing Systems don’t be new [1,2,3,4,8,10]. On its basis there are designed and created the Transfer Lines, Aggregate Machine Tools, Flexible Manufacturing Systems, Flexible Manufacturing Modules [4,5,6,7].
The Main Aggregation Principles of Recomponateable Manufacturing Systems (RMS1) relative to Avant-Garde Manufacture Technologies (AMT) 1. The principle of differentiation and concentration processes
combination for machining work – pieces [10,14,15,17]. The performance of this principle is fulfilled to provide the machining of several work – pieces allocated on lateral sides (planes) of bearer including:
- multisided machining; - multicoordinated machining; - multiplace machining with allocation of basing and clamping
places and points for work – pieces in various coordinate planes of bearer;
31
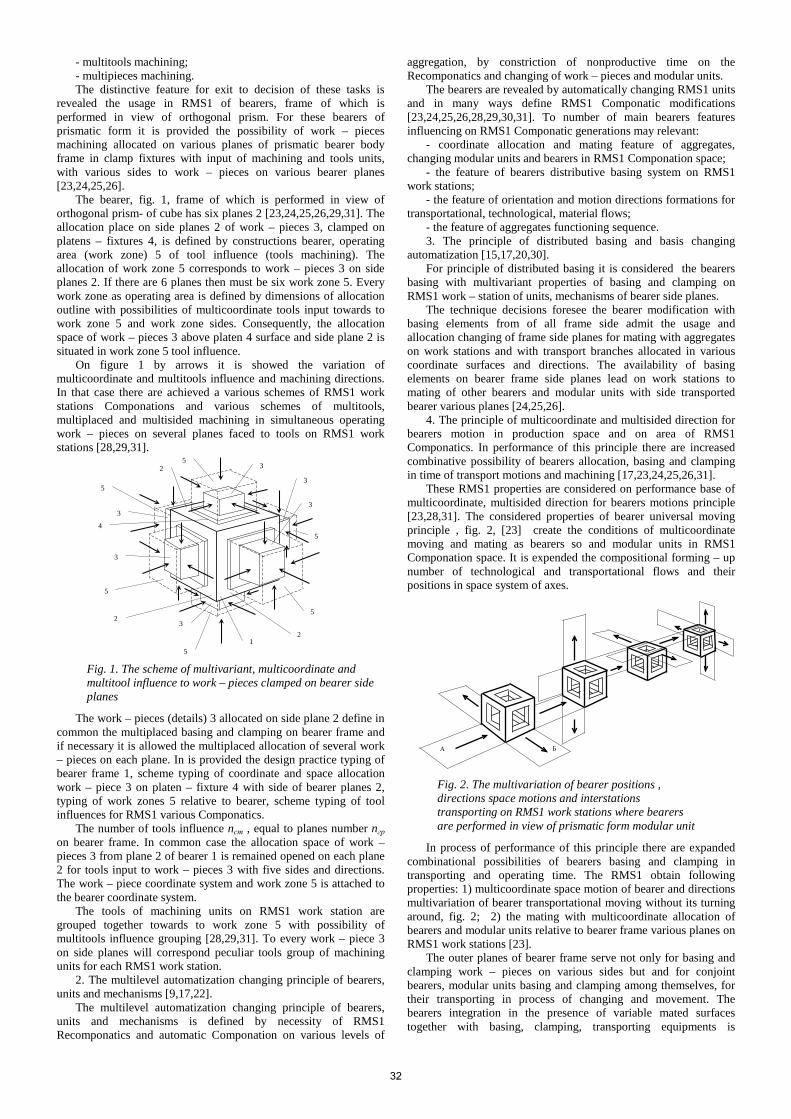
- multitools machining; - multipieces machining. The distinctive feature for exit to decision of these tasks is
revealed the usage in RMS1 of bearers, frame of which is performed in view of orthogonal prism. For these bearers of prismatic form it is provided the possibility of work – pieces machining allocated on various planes of prismatic bearer body frame in clamp fixtures with input of machining and tools units, with various sides to work – pieces on various bearer planes [23,24,25,26].
The bearer, fig. 1, frame of which is performed in view of orthogonal prism- of cube has six planes 2 [23,24,25,26,29,31]. The allocation place on side planes 2 of work – pieces 3, clamped on platens – fixtures 4, is defined by constructions bearer, operating area (work zone) 5 of tool influence (tools machining). The allocation of work zone 5 corresponds to work – pieces 3 on side planes 2. If there are 6 planes then must be six work zone 5. Every work zone as operating area is defined by dimensions of allocation outline with possibilities of multicoordinate tools input towards to work zone 5 and work zone sides. Consequently, the allocation space of work – pieces 3 above platen 4 surface and side plane 2 is situated in work zone 5 tool influence.
On figure 1 by arrows it is showed the variation of multicoordinate and multitools influence and machining directions. In that case there are achieved a various schemes of RMS1 work stations Componations and various schemes of multitools, multiplaced and multisided machining in simultaneous operating work – pieces on several planes faced to tools on RMS1 work stations [28,29,31].
3
3
3
3
3
3
1
2
2
2
5
5
5
5
5
5
4
The work – pieces (details) 3 allocated on side plane 2 define in
common the multiplaced basing and clamping on bearer frame and if necessary it is allowed the multiplaced allocation of several work – pieces on each plane. In is provided the design practice typing of bearer frame 1, scheme typing of coordinate and space allocation work – piece 3 on platen – fixture 4 with side of bearer planes 2, typing of work zones 5 relative to bearer, scheme typing of tool influences for RMS1 various Componatics.
The number of tools influence nст , equal to planes number nгр on bearer frame. In common case the allocation space of work – pieces 3 from plane 2 of bearer 1 is remained opened on each plane 2 for tools input to work – pieces 3 with five sides and directions. The work – piece coordinate system and work zone 5 is attached to the bearer coordinate system.
The tools of machining units on RMS1 work station are grouped together towards to work zone 5 with possibility of multitools influence grouping [28,29,31]. To every work – piece 3 on side planes will correspond peculiar tools group of machining units for each RMS1 work station.
2. The multilevel automatization changing principle of bearers, units and mechanisms [9,17,22].
The multilevel automatization changing principle of bearers, units and mechanisms is defined by necessity of RMS1 Recomponatics and automatic Componation on various levels of
aggregation, by constriction of nonproductive time on the Recomponatics and changing of work – pieces and modular units.
The bearers are revealed by automatically changing RMS1 units and in many ways define RMS1 Componatic modifications [23,24,25,26,28,29,30,31]. To number of main bearers features influencing on RMS1 Componatic generations may relevant:
- coordinate allocation and mating feature of aggregates, changing modular units and bearers in RMS1 Componation space;
- the feature of bearers distributive basing system on RMS1 work stations;
- the feature of orientation and motion directions formations for transportational, technological, material flows;
- the feature of aggregates functioning sequence. 3. The principle of distributed basing and basis changing
automatization [15,17,20,30]. For principle of distributed basing it is considered the bearers
basing with multivariant properties of basing and clamping on RMS1 work – station of units, mechanisms of bearer side planes.
The technique decisions foresee the bearer modification with basing elements from of all frame side admit the usage and allocation changing of frame side planes for mating with aggregates on work stations and with transport branches allocated in various coordinate surfaces and directions. The availability of basing elements on bearer frame side planes lead on work stations to mating of other bearers and modular units with side transported bearer various planes [24,25,26].
4. The principle of multicoordinate and multisided direction for bearers motion in production space and on area of RMS1 Componatics. In performance of this principle there are increased combinative possibility of bearers allocation, basing and clamping in time of transport motions and machining [17,23,24,25,26,31].
These RMS1 properties are considered on performance base of multicoordinate, multisided direction for bearers motions principle [23,28,31]. The considered properties of bearer universal moving principle , fig. 2, [23] create the conditions of multicoordinate moving and mating as bearers so and modular units in RMS1 Componation space. It is expended the compositional forming – up number of technological and transportational flows and their positions in space system of axes.
А Б
In process of performance of this principle there are expanded
combinational possibilities of bearers basing and clamping in transporting and operating time. The RMS1 obtain following properties: 1) multicoordinate space motion of bearer and directions multivariation of bearer transportational moving without its turning around, fig. 2; 2) the mating with multicoordinate allocation of bearers and modular units relative to bearer frame various planes on RMS1 work stations [23].
The outer planes of bearer frame serve not only for basing and clamping work – pieces on various sides but and for conjoint bearers, modular units basing and clamping among themselves, for their transporting in process of changing and movement. The bearers integration in the presence of variable mated surfaces together with basing, clamping, transporting equipments is
Fig. 2. The multivariation of bearer positions , directions space motions and interstations transporting on RMS1 work stations where bearers are performed in view of prismatic form modular unit
Fig. 1. The scheme of multivariant, multicoordinate and multitool influence to work – pieces clamped on bearer side planes
32

generated the Componatic decisions variation of RMS1 work stations. The correlation of bearer frame sides among themselves in the presence of connections lead to consideration of conjoint allocation and Componation places.
With bearers usage for RMS1 there are realized the variable properties as technological so and transporting flows, there are performed the changing of materiel and informative flows, of production organization and control [12,17]. There are changing RMS1 structural parameters, such as variable, number of work stations from technology aggregate kits and of parallel technology kits, Componatic branches flows.
The Automatically Renuwable Prismatic Modular Units and theirs influence on RMS1 Componation To number of RMS1 main modular units there are related the
bearers performed in view of hollow multiplane prism [17,22,23,24,25,26]. The bearer is revealed by automatically changing transport - technological device that on side planes frame or inside frame there are based and clamped the work – pieces and actuating units, fig 3, [26]. For providing of the most work – pieces machining process concentration and of fixture and tools allocation on side planes in maximal differentiation of operations the multiplane bearers allowed to model and create the most optimal RMS1 Componatics [14].
The bearer has nгр – quantity of planes with outer side prism frame. This quantity characterizes the side plane number of bearer frame for basing and clamping of blanks with their following machining. For bearer, fig 3, nгр = 6, [17,26]. The work – pieces allocation on planes is provided the accessibility of tools group input in direction of tool machining to any plane from six planes.
As far as the work – piece on side plane is undergone to tools machining with possibility of multicoordinate direction and tools input and bearer allow to perform the work – pieces multisided allocation on side planes that there are achieved the multiplacement of work – pieces, manysidedness and multitooling machining simultaneously of several work – pieces on various dearer side planes. On side planes there are performed the base holes for distributive basing of any frame plane relative to RMS1 work station [24,25,26].
Mating lead – up directly between machining units bearer and work – pieces bearer provides kinematical connection between basic parts of machining unit and work – pieces clamping fixture, foreseeing in Machinery time [26,28,31]. Kinematical connection increases structural stiffness in machining process and accuracy of work – pieces production. The kinematic fastening of machining units bearer is admitted with sides of all work – pieces allocation bearer frame planes [20].
Located bearers of tool machining units and bearers of work – pieces on base bearers – housings and beddings the kinematic fastening will be characterized by flexible mating of units relating to technological influence, tools branch and to work – pieces basing and clamping branch. Using distinctive properties of bearer and on
basis of considered principles there is possibility to perform the multivariation bearers connection of various branches, fig 4, [28,30].
1
1
2
5 3 3
3
3
4
The presence of advanced supporting surfaces on bearer frame side planes give the basis for perfection of bearers basing, clamping automatization and among yourselves that there are decided the tasks of stiffness and accuracy increasing. The lead – up of mating immediately between bearers of tool machining units and work – pieces provides kinematical connection between basis parts of machining unit and work – pieces clamping fixture in operating time. to work – pieces bearer the kinematical fastening is admitted with side of various bearer frame planes, fig. 5 [17,29].
2
2
2
2
1
1 1
1
1 1 1
6 7 4
8
9
Conclusion The bearers application of prism form expand the RMS1
technological possibilities, give to RMS1 the new technique – exploitation feature:
- multisided allocation of work –pieces and mechanisms on side planes of bearer frame, providing the multiplaced work – pieces machining with side of various planes;
- multisided workpieces machining, opening access of tools in side of each plane to work – pieces on planes and to work zones of allocation work – pieces on various planes in machining process;
- multitool machining with the help of tools group of several work – pieces in any direction of tool influence towards any from six side planes.
The received RMS1 technique – exploitational properties defined the technique - economical advantages of RMS1 creation relation to contemporary Manufacturing Systems (FMS, FMM, FTL, TL and others). First of all it is decided with usage RMS1 the following production problems:
- flexibility increasing of Structural and Componatic transformation and RMS1 usage in conditions of Reconfigurable Production;
- flexibility increasing of work – pieces nomenclature changing, Production Capacity, exploitational reliability;
Fig. 4. The Componation of RMS1 work station with application of bearers tool machining units and work – pieces with one – sided mating of bearers
Fig. 5. The Componation of RMS1 work station with application of machining units bearers group and of work – pieces bearer with multisided connection of bearers
Fig. 3. The automatically changing the modular unit – bearer of prism form for basing and clamping of work – pieces, work tools, fixture, actuating mechanisms
33

- increasing machining accuracy and Manufacturing System stiffness, decreasing cost and production area;
- improvement of working conditions and decision of ecological problems;
- possibilities increasing of aggregative regeneration of working ability and rejuvenation in respect physical wearing and moral ageing;
- decreasing of RMS1 cost and accordingly of labor costs relative to FMS.
The automatization of RMS1 Structural and Componatic transformations is appeared as major link of automatization development of technological preparation, production organization and control.
References 1. Averiyanov O.I. The modular principle of NC machine tools
building.- Moscow.: Machinary, 1987.- 232 p. (in Russian). 2. Bazrov B.M. The modular technology in machinery.-
Moscow.: Machinery, 2001.- 368 p. (in Russian). 3. Boiytsov V.V. The mechanization and automatization in
small – size serial and serial productions.- Moscow,: Machinery, 1971.- 416 p. (in Russian).
4. Volotsenko P.V. The aggregate – modular principle of building of multioperational drilling – milling – boring machine tools.- Moscow.: 1982.- 52 p. (in Russian).
5. Vochkevich L.I. The reliability of transfer lines.- Moscow.: Machinery, 1969.- 309 p. (in Russian).
6. Vragov U.D. The analysis of machine tools componatics.- Moscow.: Machinery, 1978.- 208 p. (in Russian).
7. Dashchenko A.I., Belousov A.P. The designing of transfer lines.- Moscow.: High School, 1983.- 328 p. (in Russian).
8. The technological bases of assembly equipment aggregation / A.I. Dashchenko and others.- Moscow, 1991.- 272 p. (in Russian).
9. Tsaryev A.M. Several principles of flexible reconfigurable systems formation in machinery // The paths and measures for realization of usage industrial robot program, engineering of robotic complexes and production shops on machinery enterprises. Abstracts of interuniversity science – technique Conference.- Ufa, 1984.- pp. 27 -28 (in Russian).
10. Tsaryev A.M., Uliyanov S.V. About of automatic action structure simulation aggregated machine system // Science of machines.- Moscow, 1986, 2.- pp. 12 – 20 (in Russian).
11. Tsaryev A.M. The development tasks of flexible systems of variable structure // The problem tasks of production automatization. Abstracts of All – Union science – technique Symposium.- Voronej, 1987, part I .- pp. 112 – 114 (in Russian).
12. Tsaryev A.M. The formation principles of modular reconfigurable systems in machinery // The robot machine and flexible manufacturing systems.- Kuibishev: Kuibishev book publishing house, 1987,- pp. 39 – 42 (in Russian).
13. Tsaryev A.M. The creation suppositions of aggregated machine systems of variable structure and componatics // The high productivity equipment and progressive technologies in machinery. Abstracts of All – Union science – technique Conference, Krasnogorsk.- Moscow, 1991.- pp. 80 – 82 (in Russian).
14. Tsaryev A.M. The decompositional simulation questions of flexible aggregated machine systems // The Technology. Series: Flexible manufacturing systems and Robotics: Inter – industry science – technique collected Papers.- Moscow, 1991, issue 2.- pp. 18 – 32 (in Russian).
15. Tsaryev A.M. The questions of aggregated machine systems structural synthesis // The Technology. Series: Flexible manufacturing systems and Robotics: Inter – industry science – technique collected Papers.- Moscow, 1991, issue 2.- pp. 32 – 46 (in Russian).
16. Tsaryev A.M. The flexible manufacturing systems and development tendencies // Herald of the Bauman University.- 3, 1995.- pp. 21 – 24 Flexible manufacturing systems and Robotics: Inter – industry science – technique collected Papers.- Moscow, 1991, issue 2.- pp. 18 – 32 (in Russian).
17. Tsaryev A.M. The machine systems of variable componatics and structure in machinery (The theoretical foundations of creation).- Togliatti.: Togliatti State University publishing house, 2000.- 382 p. Flexible manufacturing systems and Robotics: Inter – industry science – technique collected Papers.- Moscow, 1991, issue 2.- pp. 18 – 32 (in Russian).
18. Tsaryev A.M. The production capacity and flexibility in usage conditions of machine systems with variable componatics and structure // Science to manufacture, 2001, 9.- pp. 42 – 43 Flexible manufacturing systems and Robotics: Inter – industry science – technique collected Papers.- Moscow, 1991, issue 2.- pp. 18 – 32 (in Russian).
19. Tsaryev A.M. The recomponatic manufacturing systems in development of contemporary manufacture // Machinery and Automatization problems, 2004, 1.- pp. 3 – 14 Flexible manufacturing systems and Robotics: Inter – industry science – technique collected Papers.- Moscow, 1991, issue 2.- pp. 18 – 32 (in Russian).
20.Tsaryev A.M. The Palindrom principle usage in recomponatic manufacturing systems // Machining and automatization problems, 2006, 1.- pp. 20 -28 (in Russian).
21. Tsaryev A.M. The usage of recomponatic manufacturing systems for tasks decision of manufacture technique re – equipment // Mechanician, 2006, 6.- pp. 22 – 31 (in Russian).
22. Tsaryev A.M. The recomponatic manufacturing systems – perspective direction of manufacture development.- Togliatti.: Togliatti State University publishing house, 2007.- 156 p. (in Russian).
23. I.C. 1215256. The pallet for work –pieces transportation at multistational automatized manufacturing systems / A.M. Tsaryev, 1985 (in Russian).
24. I.C. 1302576. The pallet to multistational automatized manufacturing systems for work – pieces machining / A.M. Tsaryev, 1986 (in Russian).
25. I.C. 1343694. The pallet to multistational automatized manufacturing systems / A.M. Tsaryev, 1987 (in Russian).
26. I.C. 1381878. The transfer line of pallet type / A.M. Tsaryev, 1987 (in Russian).
27. А.С. 1649753. Многоместное приспособление – спутник / А.М.Царев, Е.Н.Бабушкина, 1991.
28. Патент РФ 2080975. Перекомпонуемая автоматическая линия / А.М.Царев, 1997.
29. Патент РФ 2082585. Автоматическая линия многосторонней обработки / А.М.Царев, 1997.
30. Патент РФ 2157307. Способ базирования и крепления спутника и станок с плавающей системой базирования для его реализации / А.М.Царев, 2000.
31. Patent 2159695. The method of multitool units changing and transportation at transfer line and transfer line for its realization / A.M. Tsaryev, 2000 (in Russian).
32. Koren, Y., Heisel, U., Jovane, F., Moriwaki, T., Pritchow, G., Van Brussel, H., Ulsoy, A.G., 1999, Reconfigurable manufacturing systems, CIRP Annals, Vol.48, No.2.
33. Koren, Y., Ulsoy, A.G., 2002, Vision, principles and impact of Reconfigurable manufacturing systems. Powertrain International, pp. 14-21.
34. Mehrabi, M.G., Ulsoy, A.G., Koren, Y., 2000, Reconfigurable manufacturing systems: Key to future manufacturing, J. of Intelligent manufacturing, Vol. 11, No.4, pp.403 – 419.
35. Reconfigurable Manufacturing Systems and Transformable Factories. Dashchenko, Anatoli I. 2006. XXXIII, 769 p.
Comments It is denoted in text: RMS1 – Recomponateable Manufacturing
System, RMS2 – Reconfigurable Manufacturing System, where lexical morphology “Recomponateable” is formed on behalf of words “Componation, Componatics”, which are read on transcription as in Russian “komponovanie, componovka” and “Reconfigurable” – from word “Configuration”.
34

SYSTEMATIC AND METHODICAL APPROACHES TO LIGHTING DESIGN. “SATI” SYSTEM
МЕТОДИЧНИ ПОДХОДИ НА СИСТЕМНИЯ СВЕТЛИНЕН ДИЗАЙН.
СИСТЕМА “SATI”
Teodor Kyuchukov Department of Industrial Design - University of Ruse “Angel Kanchev”, Bulgaria
Abstract: The report represents the fundamentals of SATI System. KEYWORDS: SYSTEMATIC AND METHODICAL APPROACHES, SUSTAINABLE LIGHTING, LIGHTING DESIGN, SATI SYSTEM.
Introduction Historically, at the very first steps, the electric lighting systems was realized through analysis, synthesis and evaluation of individual items without applying any systematic approach, without taking into account the principles and laws of the "man-machine-environment" system, but only simply focused on the methods of technical sciences, hence machine-centric approach. At a later stage the human factor took a larger role in the design of lighting systems, as it provided the opportunity to explore specific problems with the light climate and the processes that occurred in the human perception towards visual information. Therefore, thanks to the anthropocentric approach, today the contemporary lighting systems have acquired other dimensions, as the operator is not treated as a simple unit but rather as a highly organized subsystem with essential and specific functions. There has been noticed that the lighting system should be considered as a complex system "man-machine-environment" built by a number of subsystems. 1. Structure of the "SATI" system - I-st level The methodological lighting design system "SATI" (System Approach Towards Illumination) includes twelve major approaches which covers the main issues when building sustainable lighting systems.
Fig. 1. Structure of the SATI system
1. Aesthetic approach The Aesthetic approach represents three main groups: 1. Compositional criterion. 2. Lighting criterion. 3. Color criterion. Compositional criterion refers to the composition development in lighting design, focusing on the major categories, and properties - their interaction with light environment. Lighting criterion examines the relationship between the lighting design and the various types of lighting sources, the behavior of light in space and evaluation of the light climate by qualitative and quantitative indicators. The colour criterion plays a critical role in the design process towards the lighting environment.
In general the Aesthetic approach provides a that works to thorough determined insight and concrete focus to direct aesthetic "tools" necessary for the realization of lighting systems with leading In general plan Aesthetic approach is focused on the basic aesthetic "tools", which are essential for the development of complex lighting system with a distinctively decorative character (decorative application). 2. Functional Approach The Functional approach examines the variety of lighting systems in terms of their practical use. Two main groups are defined here - functional and decorative lighting. Despite the strong distinction between the both types of lighting application, there has been found a third one that refers to both types of application with a different “weight” of the functional and decorative element. There also have been pointed out some aspects of the pure functional nature of lighting systems and the way they work towards several specific visual task. 3. Ergonomic approach The Ergonomic approach focuses on the objectively necessary requirements and constraints which influence the design of the lighting systems including the normal functioning of the eye and the direct impact of light on it (types of glare, visual dysfunctions, direct exposure to strong light) the general human condition, taking into account the peculiarities of the climate, latitude, seasons and others. 4. Psycho-physiological approach The Psycho-physiological approach reveals the influence of lighting systems on the activity of the human body. The approach takes on focus the various characteristics of visual functions, the visual perception of shapes, color and light. 5. Visual communication approach The Visual communication approach examines the visual information transfer which concerns the elements of visual communication process, the distribution of information relating to the human receptors, the characteristics of visual information and others. In addition, there is a focus on the physiological characteristics in visual perception and specific factors that affects the human interaction with light environment. 6. Biological approach The Biological approach takes direct role of the light design with regard to natural and healthy development of biological objects (people, animals, plants). With particular relevance in this section is concerned the impact of artificial light sources in terms of their radiation spectrum. 7. Social approach The Social approach plays an important role in the adaptation of the light climate to the visual necessity of the different social groups distinguished by gender and age. The social approach is essential for the development of the advanced lighting systems and it dramatically changes the quality of light when the main parameters are synchronized the values specified in the Bulgarian standards (Bulgarian Institute for Standardization).
35

8. Energy-economic approach The Energy-economic approach examines in detail the possibilities for optimal energy management of functional and decorative lighting towards the use of light sources, luminaires and lighting systems. 9. Ecological approach The Ecological approach provides a detailed overview of the possible types of lighting pollution and especially the impact of the artificial light. In this regard, the use of modern energy sources leads to the use of a small amount of energy generated by power plants and thus it reduces the greenhouse effect globally. 10. Sanitary-hygienic approach The Sanitary-hygienic approach outlines the basic requirements that must be observed when using artificial lighting. Ensuring healthy and safe working conditions and rest is a matter of the rational design quantitative and qualitative indicators, light modeling (adequate amount of light, biodynamic lighting planning) which are dependent to the specific conditions of the light environment in certain geographical areas. 11. Multicomponent approach The Multicomponent approach reveals the complex nature of the lighting systems – a network of individual lighting elements which have different functional application to build up certain lighting environment in specific fields like Architectural lighting, Road and Street Lighting, Advertising and Information lighting, Automotive Lighting and Interior lighting. 12. Systemological approach The Systemological approach reveals the boundless horizons of conceptual solutions in modern lighting design. The knowledge of systems’ types and behaviors namely linear and nonlinear, open and closed (and the possible combinations between them) provokes and encourages the innovative and creative thinking. The Automotive Lighting Sculpture is a clear example of that philosophy (ALS concept). The Systemological approach is an open window to novelty and beauty, to the future. 2. Structure of "SATI" system - II-nd level The SATI system includes subsystems ("Extended Block of the Systematic Lighting Design") including twelve fundamental approaches (needed for building sustainable lighting systems) with a definitive autonomy and with a direct interaction in the lighting network. Each subsystem has an individual conceptual focus, structure and properties. The subsystems are built up of elements, called "factors" that make up the uniqueness of each approach. The information of each factor is otginized by a number of criteria that determine the systematic nature of the whole block system.
Fig. 2. Structure of ,"SATI" system. Extended Block of the
Systematic Lighting Design
Table 1. Number of the SATI system elements Approach Number of elements
Aesthetic approach 38 Functional approach 7
Ergonomic approach 8 Psycho-physiological approach 6 Visual communication approach 7 Biological approach 3 Social approach 2 Energy-economic Approach 4 Ecological approach 2 Sanitary-hygienic approach 4 Multicomponent approach 33 Systemological approach 7
3. Focus of the "SATI" System Modern urban area includes a wide variety of lighting solutions with specific lighting behavior (specific application). The focus of the "SATI" System concerns five fileds of lighting design – Architectural Lighting, Road and Street Lighting, Commercial and Informationn lighting, Automotive Lighting and Interior Lighting. Their choice has been motivated primarily by the specificity of their application - functional, decorative and functional-decorative purpose. 1.Architectural lighting The Architectural lighting is a leading filed in the lighting design with definitive decorative application creating a spectacular night picture in which the city sights (with cultural, historical and social significance) are harmoniously assembled with the beautiful nature by appropriate lighting design. 2. Road and Street Lighting The Road and Street lighting is functional outdoor lighting that mainly provide visual comfort of the participants on the road but also it is factor that efficiently influences the decrease the criminal activities and accidents. 3. Commercial and Information lighting The Commercial and information lighting design is a field that includes solutions with complex nature depending on the specific task they perform – there are either lighting solutions with pure functional or decorative application, or such which have both functional and decorative features in their layout. The main objective of the this group is to present certain information in the most attractive and accessible to the audience way to promote and facilitate public awareness and communication. 4. Interior lighting The Interior lighting also has a dual nature as the leading task it faces is to achieve adequate light climate, according to the use of the premises. 5. Automotive lighting The Automotive lighting has changed significantly due to the rapid development of the lighting industry. Today there are many good examples of advanced lighting systems with leading functional application (that meets the main visual tasks) and decorative features depending on the brand identity they follow. Conclusion There has been developed a methodological model (SATI - System Approach Towards Illumination) represented by the “Extended Block of the Systematic Lighting Design”, which has the main role to identify and satisfy the needs of certain lighting environment with specific nature of application. The extended block includes a set of twelve approaches as they follow - Aesthetic approach, Functional approach, Ergonomic approach, Psycho-physiological approach, Visual communication approach, Biological approach, Social approach, Energy-economic approach, Ecological approach, Sanitary-hygienic approach, Multicomponent approach and Systemological approach. REFERENCES [1] Орлоев Н. Методология на научните изследвания. Русенски университет “Ангел Кънчев”, 2002. [2] Орлоев Н. Вземане на управленски решения. Методи на творчество. Русенски университет “Ангел Кънчев”, 2000. [3] Кючуков Р., Т. Кючуков. Системен светлинен дизайн на монументални обекти. Русе, Русенски университет “Ангел Кънчев”, 2009. [4] Кючуков Р., Т. Кючуков. Архитектурно-художествено осветление на обществени сгради. International scientific Conference Unitech `08. Gabrovo, Proceedings, 2008. [5] Кючуков Т. Развитие на светлинните системи и съвременните автомобили. Национална конференция „Инженерен дизайн и ергономия”, София, 2009. [6] Kyuchukov R., T. Kyuchukov. Sustainable Lighting Solution To Electrical Energy Consumption. Illumination Towards Multifunctional and Multiple Domestic Lighting Installations. Balkan Light 2008, Ljubljana, Slovenija, 2008.
36

TROUBLESHOOTING FOR RELIEF VALVES USED IN HYDRAULIC SYSTEMS
Prof. Dr. M. Sc. Pancar Yasar1, Assoc. Prof. Dr. M. Sc. Ergur H. Sevil1
Faculty of Mechanical Engineering – Eskisehir Osmangazi University, Eskisehir1, Turkey.
Abstract: This study relates to the description of a relief valve briefly and troubleshooting due to pressure rise in hydraulic system. In any hydraulic system, it is essential to limit the maximum pressure generated by the constant displacement pump. For this purpose, usually pressure relief valve is used and pressure across the relief valve can be balanced. Many of the failures in a hydraulic system show similar symptoms such as, a gradual or sudden loss of high pressure, resulting in loss of power or speed in the cylinders. Due to possible malfuntions, the cylinders may stall under light loads or may not move at all. Often the loss of power is accompanied by an increase in pressure which must be taken away by a relief valve.
Keywords: TROUBLESHOOTING, RELIEF VALVE, PRESSURE-SENSITIVE VALVE, HYDRAULIC SYSTEM.
1. Introduction
It is believed that the French scientist Denis Papin was the inventor of the safety valve at the end of the seventeenth century. The safety valve was kept closed by means of either a spring or a lever and a movable weight; sliding the weight along the lever to regulate the pressure. Some believe that, Papin was only the inventor of some improvements and that safety valves were already being used some 50 years earlier on a steam digester designed by Rudolf Glauber, a German-Dutch alchemist. Timothy Hackworth developed an open-ended safety valve for the steam trains and boilers that were first being built around 1830 when the starting of the safety valve designs as we use today [1].
Hydraulic systems are used in so many automatic machines. It is equipped with a pressure relief valve to maintain the operation pressure of the system at a pre-determined level. Relief valve protects the hydraulic pump and in turn the prime mover from overload quickly in case the system is exposed to overpressure. That’s why, characteristics of such a valve like the other system components are very important in designing the hydraulic system. The basic pressure relief valve is dynamically undesirable due to relatively low viscous damping. This kind of valve provides low damping during upward movement of the relief valve arbor [2].
Pressure relief valves used in hydraulic systems are spring-loaded valves designed to open and relieve excess pressure, then immediately close, preventing any loss of flow of fluid after normal conditions have been renovated [3]. They are designed and manufactured to act as a safety measure in pressurized liquid system. The relief valve is a device utilized to divert excess pressure (sudden surges) in the discharge side of the pump into the suction side. Generally, these changes are so rapidly and of such magnitude, that the pump operator can not correct quickly enough. The properly set and maintained relief valve can make these corrections for the operator [4].
The pressure relief valve shall safely control increase in pressure by venting the pressurized liquid from the location. Another application is to protect equipment from overpressure. The valves are generally “back-pressure dependent”, so can be discharged to atmosphere easily. Once a valve has discharged, replacement is usually adviced, as the set pressure can no longer be guaranteed. It is recommended to have a relief valve pressure setting at least 25% higher than the maximum system operating pressure. One must be sure that set pressure should not be higher than the design pressure of the hydraulic system [5].
2. Description of Relief Valves Design
A historic introduction to the pressure relief valve evolution leads to the definition of the best performance characteristic of pressure relief valves. The salient features of the valve's best performance characteristic as a combination of the valve ‘best dynamic performance’ and the valve ‘best discharge capacity’ and factors leading to distortions of the best performance characteristics [6].
Relief valves are classified in two types. In the direct acting type, the pressure to be relieved acts directly on the fluid regulating element. This type is commonly employed in systems with relatively low flow rates. For high flow rates, a pilot operated type is commonly employed. In this type the pressure to be controlled acts on a pilot. As soon as this pilot allows flow, the pressure difference across the main regulating element
becomes large enough to provide a force. It causes the valve to open rapidly because the spring controlling the main element is light. A relief valve may be installed wherever there is a need to protect a probably the most common application. It would be protecting a pump against an excessive pressure rise when the motion of an actuator or motor becomes blocked. Although the load may be abnormal, actuator motions are often blocked deliberately, for example in a clamping application [7].
Fig.1. Pump protection circuit with relief valve [10]
The function of the relief valve is to limit the maximum
pressure that can exist in a system [8]. Under ideal condition, the relief valve should provide alternative flow path to tank for the system fluid while keeping the system pressure constant. There are two types of valves that are commercially available such as, direct and pilot type (9).
3. Types of Relief Valves
3.1. Direct Acting Type
It is usually a poppet, but other geometries such as a ball or a spool may be encountered. During normal system operation, the regulating element is held in a fluid blocking position by a spring. If the system pressure reaches a preset value, the force on the regulating element will equal the spring preload force. This is called the cracking pressure. Further, increase in pressure will cause movement for the regulating element from its fluid blocking position. Then it allows fluid to flow to the system reservoir [11].
3.2. Pilot Operated Type
Element can be quite small because this pilot is only required to pass a small flow in a hydraulic circuit (see Figure 2). During the normal closed condition of the valve, there is no flow through the orifice in the main regulating element, so there is no pressure difference across the main element. Thus, the main element can be held in a closed position by a light spring [11].
37

Fig.2. Basic types of relief valves for different operations [5]
4. Operation of Relief Valves in Hydraulic Systems
The machine tolerances are critical and even a small amount of dirt can cause the relief valve system to malfunction. A good preventive maintenance program is essential to prevent the problems in relief valve system. It is important to realize that for the relief valve to function properly, the discharge pressure should be at least 3-4 bar greater than the suction or incoming pressure. If not, the relief valve opens but the fluid will not be able to flow from the discharge to the suction area.
It is a common fallacy of some pump operators to think the installed relief valves protect them under all conditions. Normal relief valve systems cannot relieve discharge pressure below the incoming or suction side pressure. Surges such as those encountered in a relay operation, if not controlled, it will be transmitted to the discharge side of the pump. If companies get involved in relay operations over 3 bar, a suction side relief valve must be installed [12]. These are usually a one-piece unit (entirely separate from those previously discussed) in which pre-settting the pressure by adjusting a spring-loaded valve. When the pressure rises above the setting level, the valve opens and dumps the fluid to the tank. This continues up to the pressure drops below the preset pressure. Without a suction-type relief valve you are risking the possibility of excess pressure cracking the pump body or, even worse, the inability of your engineer to be able fully to control discharge pressure.
A conventional pressure relief valve is to be designed to open at a preset liquid pressure. A spring exerts a force on a valve seat via a piston assembly. At the set pressure, the piston begins to lift resulting in a small amount of flow through the valve and the pressure force. This force acts on the piston that increases importantly, and overcomes the spring force. The imbalance of forces cause the valve to fully open. By design, the difference in pressure from the valve set point to the fully open condition is no more than 10 %. The valve then re-closes at a pressure where the spring force overcomes the piston force. Under normal system operating conditions, the pressure at the valve inlet is below the set pressure. Only under abnormal operating conditions should the pressure relief valve be open [12]. The reasons for the usage of relief valves are listed below. (1) Protect system operators (2) Prevent the demolotion of capital investment (3) Preserve the production (4) Reducing downtime of the system (5) Comply with codes and standards (6) Protect the environment
In the daily operation of hydraulic system overpressure can happen due to incidents like a blocked discharge, fire exposure, tube rupture, check valve failure. This can lead to a major incident in plant if the pressure relief system is not in place or not functional. It is very important to properly select, size, locate and maintain the pressure relief systems to prevent or minimize the losses from major incident like fire or other issues [2].
4.1. Causes of overpressure
Overpressure is significant in preliminary steps of pressure relief system design. It helps the designer to understand the cause of overpressure and minimize the effect. It is the result of an unbalance or disruption of the normal flows of material and energy that causes the material or energy, or both, to build up in some part of the system.
4.1.1 Blocked Discharge
Blocked discharge can be explained at any system, pump or other equipment is the closure of blockage at outlet either by mechanical
failure or human error. This exposes the system to a pressure that exceeds the maximum allowable working pressure. So, the relief valve is required unless administrative procedures to control valve closure.
4.1.2. Fire Exposure
Fire may occur in hydraulic systems. So, all equipments must be protected from overpressure which is controlled by pressure relief valves.
4.1.3. Check Valve Failure
It is generally placed at a pump outlet. Malfunction of the check valve can lead to overpressure in hydraulic system. When a fluid is pumped into a system, failure of the check valve causes reversal of the liquid flow back to pump. When the liquid is displaced into a suction system and high pressurizied fluid enters, overpressure is occured.
4.1.4. Thermal Expansion
If isolation of a piping on the cold side of system can result in overpressure due to heat input from the warm side, then the line or cold side of the system must be protected by a relief valve [12]. Hydraulic systems for the pressure protection, following categorization can be used for the product standards especially in EU countries. EN ISO 4126-1: Presssure safety relief valves EN ISO 4126-2: Bursting disc safety devices EN ISO 4126-3: Safety valves and bursting disc safety devices in combination EN ISO 4126-4: Pilot operated safety valves EN ISO 4126-5: Controlled safety pressure relief systems EN ISO 4126-6: Application, selection and installation of bursting disc safety devices DIN EN 12953-8: Shell boilers, safety devices against excessive presssure DIN EN 764-7: Sizing and spring-Setting
4.2. Troubleshooting the relief valves
Listed below are the areas that you can troubleshoot the relief valves [7]. When working on a specific machine for more information technical manual is prefered.
If low or erratic pressure occurs for the sake of troubleshooting, the following items must be considered.
Adjustment is incorrect. Dirt, chip, or burrs may cause the valve partially
open. Poppets or seats may be worned or damaged. Valve piston in the main body may be sticked. Selection of spring is wrong Spring ends may be damaged. Valve in the body may be cocked. Orifice or balance hold may be blocked. If relief valve has no pressure, the following items must
be considered.
Orifice or balance hole may be plugged. Poppet does not seat. Valve may have a loose fit. Spring may be broken. Dirt, chip, or burrs may cause the the valve
partially open. Poppet or seat may be worned or damaged. Valve in the body may be cocked. If excessive noise occurs consider the following items;
38

Oil viscosity may be too high. Poppet or seat may be faulty or worned. Line pressure may have an excessive return. Pressure setting is too close to that of another valve in the
circuit. Spring may be broken. If adjustment of the relief valve can not be achieved properly,
consider the following items; Spring may be broken. Fatique for spring material may come across. Improper spring may have been used. Drain line in system may be restricted.
4. 3. Relief Valve Failures and Remedies
Hydraulic valves are precision-made and must be very accurate in controlling a fluid pressure, direction, and volume within a hydraulic system. Contaminants, such as dirt, in the oil are the major problems in valve failures. Small amounts of dirt, lint, rust, or sludge can cause annoying malfunctions and extensively damage valve parts. Such material will cause a valve to stick, plug small openings, or abrade the mating surfaces until a valve leaks. Only the specified oils must be used in a hydraulic system.
Following recommendations are advisable before servicing a relief valve [1].
Disconnect the electrical power source before removing a hydraulic relief valve's components.
Release the system's hydraulic pressure before disconnecting any hydraulic valve components.
Lower all hydraulic working units to the ground before disconnecting any parts.
Clean a valve and its surrounding area before removing any part for service.
Paint thinner or acetone for cleaning is not advisable.
Fig.3. Troubleshooting nomogram for hydraulic system with relief valve
The following must be fulfilled when disassembling a valve.
Maintenance operator must be certain that all tools are clean and free of grease and dirt.
One must be careful to identify the parts when disassembling for later reassembly. The valve sections to be reassembled in the same order.
If possible, use a vise equipped with lead or brass jaws, or protect the component by wrapping component in a protective covering.
Sealing all the valve's housing openings to remove the components during service work is advisable.
If the shut down for pressurized equipment is reduced, the intervals between relief valve examinations need to be similarly extended, or systems developed to allow the examinations to be carried out on-line [13]. Besides these above mentioned remedies, we also use Figure 3 in order to troubleshoot the problem arising in relief valves [14].
5. Conclusion
As with all troubleshooting techniques, knowledge of components and their function in a system is vitally important. It is probably fair to say that, when all the components of a hydraulic system have been identified, their function determined and the operation of the system as a whole understood, the troubleshooter has gone 51% of the way towards finding the problem. It is important to make the use of advices given for relief valves effectively, a good understanding of the basic principles of relief valves with a knowledge of the operation and application of them.
Hydraulic systems are getting more and more complex as methods of controlling machines become increasingly developed. Technological advances in many hydraulic system components such as, relief valves were exhibited in the last twenty years. The object of this study is to provide procedure for a logical approach on troubleshooting which can be extended when necessary to cover specific machines in all areas of industry either using the advices or flow charts given. In order to control pressure of flow, the fundamentals for this procedure must be developed.
The main problem in philosophy of the troubleshooting procedure is determining the aspects of the hydraulic system, such as fault, flow, pressure or direction. By consulting the circuit diagram, a list of possible causes can be drawn up. The next stage is to search for the obvious remedy. Certain controls that are achieved on a hydraulic system using the human senses of sight, touch and hearing which can be carried out very quickly.
6. References
[1] M. Hellemans, The Safety Relief Valve Handbook, Design and Use of Process Safety Valves to ASME and International Codes and Standards, (1st edition, Macmillan Company, 2009).
[2] J. Watton, The Design of a Single-Stage Relief Valve with Directional Damping, The Journal of Fluid Control Including Fluidics Vol. 18, n. 2, pp. 22–35, 1988.
[3] K. Dasgrupta, R. Karmakar, Modelling and Dynamics of Single-Stage Pressure Relief Valve with Directional Damping, Simulation Modelling Practise and Theory, Vol. 10, n. 1-2, pp. 51-67, 2002.
[4] www.haleproducts.com. [5] Y. Pancar, H.S. Ergur, Hydraulic Circuits, Design and
Application, (Lecture notes, ESOGU, Eng. Faculty, Mech. Eng. Dept., 2009).
[6] N. G. Gavrila, S. Sethi, Best Performance Characteristic of Pressure Relief Valves and The Amount of Lost Product, Journal of Loss Prevention in the Process Industries, Vol. 4, n. 4, pp. 265-271, 1991.
[7] F. C. Parry, Relief System Handbook, (Institution of Chemical Engineers, ICE, 1992).
[8] K. Dasgupta, R. Karmakar, Dynamic Analysis of Pilot Operated Pressure Relief Valve, Simulation Modelling Practice and Theory Vol. 10, pp. 35–49, 2002.
[9] A. Misra, K. Behdinanb, W.L. Cleghorna, Self-Excited Vibration of a Control Valve due to Fuid–Structure Interaction, Journal of Fluids and Structures Vol. 16, n. 5, pp. 649-665, 2002.
[10] S. Hayashi, K. Ohi, Global Stability of a Poppet Valve Circuit, Journal of Fluid Control, Vol. 21, n. 4, pp. 48-63. 1999.
[11] J. S. Cundiff, Fluid Power Circuits and Controls, (1st edition, CRC Pres LLC, 2002).
[12] www.grothcorp.com [13] T. Nicholls, Benefits of On-line Relief Valve Testing, World
Pumps, Vol. 2004, n. 456, pp. 50-54, 2004. [14] Guide to Industrial Hydraulics, Maintanence Manual, (Vickers,
1998)
39

PRESSURE RELIEF VALVE SELECTION AND APPLICATIONS FOR HYDRAULIC SYSTEMS
Assoc. Prof. Dr. M. Sc. Ergur H. Sevil
Abstract: The flow-pressure relationship is an important external characteristic of the pressure relief valve and the hydraulic circuit. So, many engineers have been put an effort on this topic for its significant impact on the overall hydraulic system. Most of them are focused on the influences of the pressure relief valves, their selections and applications. It is very important to select, size, locate properly and maintain the pressure relief systems to prevent or minimize the losses from major incidents. Detail of selection and sizing of pressure relief valve is shown the following sections of this study. In order to help the circuit operators, a few flow charts are also included. Pressure relief system is used to protect piping and equipment against excessive overpressure for equipment and personnel safety. Keywords: RELIEF VALVE, PRESSURE SENSITIVE VALVE, VALVE SELECTION, HYDRAULIC SYSTEM.
1. Introduction
The pressure relief valve is used in almost every hydraulic system. The function of the relief valve is to limit the maximum pressure that can exist in a system. Under ideal conditions, the relief valve should provide alternative flow path to tank for the fluid while keeping the system pressure constant [1]. Pressure relief valves are spring-loaded valves designed to open and relieve the excess pressure, then immediately close, preventing any loss of fluid flow after normal conditions have been reinstated. Pressure relief valves are designed to act as a safety measure in hydraulic system. It is a device designed for the automatic release of a substance from hydraulic system when the pressure preset limits to protect system [2]. In spite of the high development status of the conventional pressure relief valves, there is an important research demand on the investigation of them, since they are the most used devices for protections of human life, environment and equipment.
Several types of pressure-control valves are encountered in hydraulic systems. Some keep the whole system from excess pressure while other equipments only protect a portion of the system. They allow fluid flow to a circuit after reaching a preset pressure. Bypass fluid at low or no pressure when activated.
All fixed-volume pumps in hydraulic systems require a relief valve to protect the system from excess pressure. Fixed-volume pumps must move fluid when they run. Pressure compensated pump circuits could operate successfully without relief valves because they only pass fluid when pressure drops below their compensator setting. In either cases, a relief valve is similar to a fuse in an electrical system. When circuit amperage stays below the fuse amperage, all is well. When circuit amperage tries to exceed fuse amperage, the fuse blows and disables the circuit. Both devices protect the system from excess value by keeping it below a preset level. The difference is that when an electrical fuse blows it must be reset or replaced by maintenance personnel before the machine can cycle again. This requirement alerts the electricians to a possible problem and usually causes them to look for the reason before restarting the machine. Without the protection of a fuse, the electrical circuit would finally overheat and starts a fire.
2. Description of Relief Valve Design
In a hydraulic circuit, a relief valve opens and bypasses fluid when pressure exceeds its set value. The valve then closes again when pressure falls down. This means a relief valve can bypass fluid anytime or all the time without intervention by operator. Many fixed-volume pump circuits depend on this bypassing capability during the cycle, and some even by-pass fluid during idle time. A well-designed circuit never bypasses fluid unless there is a malfunction, such as a limit switch not closing or an operator overriding the controls. This eliminates most overheating problems and saves energy too.
Ray [3] formulated a non-linear dynamic model of a relief valve in the stage form. It is developed from fundamental principles of rigid-body motion and fluid dynamics in 1978. According to the results, opening time of the valve is linearly related to the
dimensionless parameter given by the ratio of orifice length to radius. Sethi and Lai [3] developed dynamic models of a spring-loaded pressure relief valve with computational fluid dynamics and valve dynamic modelling. In 2002, Dasgupta and Karmakar [4] studied the dynamics of a pilot operated pressure relief valve through Bondgraph simulation technique. The governing equations of the system were derived from the model. Prescott and Ulanicki [5] developed a relatively simple and accurate model to solve the dynamical behaviour of a pressure reducing valve. In 2005, Suzuki and Urata [6] investigated the dynamic characteristics of a direct-pressure sensing water hydraulic relief valve with Matlab–Simulink.
Sizing is the most important component in selecting the right presssure relief valve for the circuit assuring reliable safety of the system. Nowadays, sizing is achieved entirely with software some available on the market and some provided by manufacturers. It is very important to know what is behind the software and to look into the formulas on which these calculations are based. It is also important that, relief valves be selected by the operators who do have a detailed knowledge of all the pressure-relieving requirements of the system to be protected [7]. Circuit designer must be aware of what is available on the market in order to select the right valve for the correct application, assuring a safe hydraulic system.
2.1. Operation of Relief Valves in Hydraulic Systems
Some manufacturers generally assist the end user in sizing the valve based on his input of the relevant technical data. But, it is responsibility of the end user to select the right valve based not only on the system data but also on all other effective factors. Many manufacturers hand over offer dependable programs for valve sizing. Since, most are based exclusively on their own specific products, it will be difficult to compare valve brands [8].
There are two different designs of relief valves in common use such as, direct acting and pilot operated. Both types have advantages and work better in certain applications in the hydraulic circuits. Some terms relating to relief valves and their functions are explained in (a), (b), (c), (d) and (e) such as overshoot, hysteresis, stability, reset pressure and pressure overrides respectively. (a) The actual pressure reading when a relief valve first opens
to bypass fluid. (It can be up to twice the actual pressure setting.)
(b) The difference in pressure between when a relief valve starts letting fluid flow and when fluid flow is passing.
(c) The fluctuation of pressure as a relief valve is bypassing at set pressure.
(d) The pressure at which valve closes after it has been bypassing.
(e) The difference in the pressure reading, a relief valve first opens (cracking pressure) until pump flow pass to tank.
40

2.2. The Fundamentals of Sizing Rules in Selection of Relief Valves
In general, presssure relief valve sizes are decided by only coordinating the size of an existing nozzle or the pipeline. This method is very dangerous and does not comply with the codes. Correct and extensive sizing and selection is complex. That’s why multistep process should be followed by step-by-step method. Therefore, following items in four separate section must be taken in account for right sizing [9]. 1. Each piece of equipment in the system must be calculated for present overpressure master plan. 2. Establish a suitable design foundation must be prepared for each item of the system which needs protection based on overpressure cases. 3. The size of the relief valve based on the design necessity must be determined. 4. By the establishment of the system, the ideal size for the relief valve, selection of the type are to be achieved. Then, design can be controlled by analysis with piping engineering basic standards.
In sizing the relief valve the other requirement is to determine the correct orifice of a valve type for relieving capacity. That’s why the following methodology is advised. A set pressure at which the relief valve is to operate based
upon operational limits of the system must be determined. Relieving capacity of the valve has to be assigned. For particular application size and the type of the valve with
suitable capacity within the limits can be selected. Sizing of relief valves is calculated but, selection is from a capacity chart in a manufacturer’s operation manual. This method is also preferable by the end users [10]. If the reliability of that chart can be demonstrated by the manufacturer then, the last method is used. In selection and properly sizing the relief valves following list of servicing conditions can be advised in Tablo 1.
Table 1. The advised parameters of selection and properly sizing the relief valves in servicing conditions
Fluid properties Fluid and state Molecular weight Viscosity Specific gravity Liquid Compressibility factor Opening conditions Operating pressure Operating temperature Maximum allowable working pressure Relieving conditions Required relieving capacity Set pressure Allowable overpressure Superimposed backpressure Built-up backpressure Relieving temperature Liquid discharge
In the pressure relief systems, the first step is to decide the
location where the pressure relief can be mounted. So it will be easy to name the type for each location in the second step. After the selection of the type of device, the specific type of safety valve and/or bursting disc should be chosen [11]. In selection of the pressure relief valve, there are few subjects which must be taken in account. These subjects are such as, seat tightness, blowdown, operation temperature, orifice and sizing, liquid and materials [12-14] respectively.
2.3. The Characteristics of Relief Valves in Hydraulic System
2.3.1. Seat Tightness
Operating pressures between 90% and 95% of set pressure, pilot-operated safety relief valves and spring-operated are used. Since metal-seated spring valves will get damaged in a short time so, they don’t stay tight for long durations. The soft-seated valves are limited in temperature and often in pressure. If operation pressure above 95%, soft-seated valves are prefable.
2.3.2. Blowndown
Some soft-seated, spring-operated valves have large alterable blowdown ranges. Present blowdown can usually be set shorter than 5 % on conventional spring valves. Long blowdown required due to inlet pressure losses above 3 %: In case of losses, pilot-operated valves with a remote sensor must be used.
2.3.3. Operation Temperature
At 197°C and below temperatures, it is recommended to use soft-seated and for high-performance soft-seated snap action spring valves are used at 200oC and below temperatures [12]. Valves with following specifications such as bubble tightness close to set pressure, opening faster than 10% overpressure and short adjustable blowdown are prefered. For operation at 70°C and below values and backpressures needing a balanced valve pilot-operated, soft seated valves are preferable.
2.3.4. Orifice and Sizing
Some of the spring valves can be equipped with customized nozzles. One may have the option of installing multiple spring valves or using a pilot-operated valve with full bore orifice. Pressure/size limits are generally higher for pilot-operated valves than for spring-loaded valves [13]. The valve should modulate from 0 up to full lift and then will not chatter, even if oversized.
2.3.5. Liquid
Spring-operated valves can be used but need to be equipped with a trim suitable for liquid service so, they can obtain nominal flow at 10 % overpressure. When quick opening or closing is necessary, the operation will be unstable and possibly causes water hammer. Alternatively, a modulating pilot valve can be used, preferably equipped with a filter. The volume of the filter slows the pilot, which reacts too fast, creating instability and water hammer.
2.3.6. Materials
An important factor in selecting the correct relief valve is choosing the correct materials for the application. Since it is quite difficult to show all the materials for relief valve body in this study, we can give some more important ones. These are named [12,14] as: ASTM A890 CE3MN UNS J93404 ASME SA 351 CD3MWCuN UNS J93380 ASME SA 351 CE8MN UNS J93380 Z 6 CNDU 28.08 M, NF A 320-355 at 17 HRC MAX ASTM A351 CK3MCUN (6Mo) For high temperature operations we can prefer following ones: ASME SA 351 CF8 SAME (with same chemical restrictions as CF8M) ASME SA 217 WC6 (up to maximum 593°C) ASME SA 217 WC9 (up to maximum 593°C) For high temperature operations up to 815oC, we can prefer following ones: ASME SA 479 Grade 304H (same chemical restrictions as 316H)
41

ASME SA 479 Grade 347H (same chemical restrictions as 316H)
2.4.Selection Parameters of Pressure Relief Valves
2.4.1.The Selection on Location of Pressure Relief Valves
If the systems have two or more separate branches, the engineer has to decide whether a pressure relief device is required for every branch or not. For this decision tree (see Fig. 1) can be used in deciding the valve. In this tree, there are six questions for every chamber.
Fig. 1. Decision tree for pressure relief device [15]
Besides these, uncomprimising are following as; (1) What are the sources of over pressure to the compartment? (2) Are the connections of large enough diameters to allow required relief flow via another of the compartment? (3) Do you really have any reasons for not installing pressure relief connected? (4) Is one other device alternate to valve sufficiently safe?
2.4.2. The Selection of Type of Pressure Relief Devices
After establishing the pressure relief valve for adviced point, the engineer has to to select a suitable type of valve. The decision tree (see Fig. 2) for selecting between safety valves and bursting discs are shown.
Fig 2. Decision tree for selection of relief devices [15]
Besides these one can also discuss the following questions; (1) What is the pressure rise for a safety valve, is it rapid or slow? (2) What is the value of the set pressure? Is it small or large for the selected valve? (3) What is the value of the temperature? Is it low or too high for the selected valve? (4) What is the value of the diameter of relief valve? Is it too small or too large for safety valve?
The answer might be yes or no, if it is yes, this means any leakge will not be accepted in this unit. (5) Is hydraulic fluid toxic or expensive? (6) Is hydraulic fluid probably to freeze-up? (7) Is the fluid too viscous for a valve?
(8) Is the fluid too corrosive for a selected valve? (9) Does the process need two-stage relief, one for small and the other for large flows?
Once more the answer might be yes or no, If it is yes, valve and a bursting disc must be used in parallel. (10) Can a single safety valve meet the required relief rate? If the answer is no, multi-safety valves in parallel must be used. (11) Are there reasons to copy a safety valve? (12) Is the process corrosive?
2.4.3.The Selection of Special Features for Safety Valves
The decision tree prepared for the selection of typical safety valves is shown in Fig. 3.
Fig. 3. Decision tree for safety valves selection [15] Questions are useful in following to explain the details of the tree. (1) What is the set pressure, is it high or low? (2) What is the diameter, is it large or small? (3) What is margin between operating and set up pressure, is it tight or wide? (4) Is the process fluid toxic or flammable? (5)What is the fluid temperature? Is it high or low?
3. Conclusion
In the design of pressure relief systems regulations, codes and standards must be taken into account seriously. Otherwise, design assignment might be complex and time consuming. In order to execute the design efficiently, decision trees are used. Figure 1 is for the selection of the location of pressure relief valves. After the identification of the valves, Figure 2 is used for the selection of the type of pressure relief valves. For the selection of the special features of safety valves and bursting discs, Figure 3 is used. Besides all these studies, evaluations are also advisable to reverse the decision trees into practical design tools.
4. References
[1] B. Stein, E. Vier, Structural Analysis in Control Systems Design of Hydraulic Drives, Engineering Applications of Artificial Intelligence, Vol. 13, pp. 741-750, 2000. [2] American Petroleum Institute, Sizing, Selection and Installation
of Pressure-Relieving Devices in Refineries, Part 1-Sizing and Selection, (7th edition, Recommended Practice 520, 2000).
[3] S. Sethi, Y.S. Lai, A simulation model to predict performance characteristics of safety relief valve, Proc. 1st Summer Computer Simulation Conference, Vancouver, Canada, 1993, pp. 800-806.
42

[4] K. Dasgupta, R. Karmakar, Dynamic Analysis of Pilot Operated Pressure Relief Valve, Simulation Modeling Practice and Theory, Vol.10, pp. 35-49, 2002.
[5] S. L. Prescott, B. Ulanicki, Dynamic Modeling of Pressure Reducing Valves, Journal of Hydraulic Engineering, Vol. 129, pp. 804-812 (2003).
[6] K. Suzuki, E. Urata, Dynamic characteristics of a direct-pressure sensing water hydraulic relief valve, Proc. 6th JFPS International Symposium on Fluid Power, Tsukuba, 2005, pp. 461-466.
[7] A.J. Ortega, B.N. Azevedo, L.F.G. Pires, A.O. Nieckele, A numerical model about the dynamic behavior of a pressure relief valve, Proc. 12th Brazilian Congress of Thermal Engineering and Sciences, Belo Horizonte, MG, 2008, pp. 1-8.
[8] S. Chabane, S. Plumejault, D. Pierrat, A. Couzinet, Vibration and chatterring of conventional safety relief valve under build up back pressure, Proc. 3rd IAHR International Meeting of the Workgroup on Cavitation and Dynamic Problems in Hydraulic Machinery and Systems, Brno, Czech Republic, 2009, pp. 1-14.
[9] A.J. Ortega, B.N. Azevedo, L.F.G. Pires, A.O. Nieckele, Analysis of the discharge coefficient of a spring-loaded pressure relief valve
during its dynamic behavior, Proc. 20th International Congress of Mechanical Engineering, Gramado, Brazil, 2009, 1-9.
[10] B. Bonham, H. Izuchi, Stability analysis of safety valve, Proc. 10th Topical Conference on Gas Utilization, San Antonio, Texas, 2010, pp. 21–25.
[11] X. G. Song, L. Cui, Y. C. Park, Three-dimensional CFD analysis of a spring-loaded pressure safety valve from opening to re-closure, Proc. ASME Pressure Vessels and Piping Division/K-PVP Conference, Bellevue, Washington, 2010, pp. 295-304.
[12] M. Hellemans, The Safety Relief Valve Handbook, Design and Use of Process Safety Valves to ASME International Codes and Standards, (1st edition, Macmillan Company, 2009).
[13] C. F. Parry, Relief Systems Handbook (Institution of Chemical Engineers, ICE, 1992).
[14] R. W. Zappe, Valve Selection Handbook (3rd edition, Houston Gulf Publishing Company, 1991).
[15] P. W. H Chung., S. H. Yang., C. H. He., Conceptual Design of Pressure Relief Systems, Journal of Loss Prevention in the Process Industries, Vol. 13, N. 6, pp. 519-526, 2000.
43

ANALYSIS OF TRIBOLOGICAL PROCESSES OF CONSTRUCTION MATERIALS IN THE SOIL MASS ABRASIVE WEAR PROCESS.
Associate Prof. M.Eng.Napiórkowski J. PhD., M.Eng.Drożyner P. PhD., M.Eng. Kołakowski K., M.Eng.Mikołajczak P PhD., University of Warmia and Mazury in Olsztyn, Poland
Abstract: Rational selection of construction materials for working elements requires knowledge not only in the macroscopic friction processes, but also elementary processes occurring in the contact layer of element with the soil mass. Studies have shown the importance of the impact of stationary and dynamic properties of soil mass and speed of the wear process on wear intensity of martensitic steel. Studies are supplemented by measurements of the coefficient of friction force in different types and conditions of soil mass and the assessment of the elementary wear processes.
Keywords: ABRASIVE SOIL MASS, WEAR PROCESS, INTENSITY OF WEAR
1. Introduction Selecting of constructional and technological properties of
elements used in abrasive soil mass and planning the exploitation process is possible when the course of the depletion of utility resource of material is known. Description of the wear process of this elements is reduces to the structural, functional and evolutional identification of the system of processes. [4]. Specification of system is determined by interpenetration of constructional and technological characteristics of working element, randomness of biological factor which is abrasive soil mass, and impact of constraints of wear process. [5,6,7,8]. Presented in the literature results of surface layers wear process researches mostly concern the estimation for the model abrasive grains. [3,9]. The wear process of working element is a dynamic change of energy stuff and an information, which are proceed in the time and can be regarded as a process. Every process in turn can be describe in the system approach and present in the simplest way in the black box aspect (fig.1).
g g g g g
11 1
2 2
3 3
c τ
1 2 3 η
2
3
d
ωωω
ωω
…… …
Ω
ψ ϕψ ϕψ ϕ
ψ ϕ
Ψ Φ
ψ ϕ
G Fig.1. Conceptual model of wear process of working elements in
abrasive wear mass: ψψ1, ψ2, ψ3, ..., ψc – set of process parameters, Ωω1, ω2, ω3,...ωd – set of characteristics of working element, Gg1, g2, g3, ..., gη – set of properties of abrasive wear mass, Φ ϕ1, ϕ2, ϕ3, ..., ϕτ – set of answers which describes the wear process.
Aim of this study is to analyze the tribology processes of the
construction materials in different abrasive wear mass properties.
2. The Research Methodology The laboratory researches have been conducted on a wear
machine "spinning mass" type. The sample was a rectangular prism with dimensions 30x25x10 mm, cut from the test material. The abrasive surface was mounted at 2-3° to the work surface. During the test the linear velocity was controlled from 1,39 to 2,00 m/s. Maximum load of the sample - 50kN (67 kPa). The summary distance of wear of the sample was from 10 to 20 km. After the each wear distance of 2 km the weight of the sample was measured and the soil was changed for the new one. To the tests the steal 38GSA with chemical composition: C – 0,38%, Mn – 1,07%, Si – 1,17%, P – 0,028%, S – 0,02%, Cr – 0,18%, Cu – 0,16%, Al. – 0,022% was used. The average value of the measure hardness of the steel was 414HV10. The granulometric composition, characteristic of the percentage of friction dimensions in the soil mass, was
determined by aerometric Casagrande method (tab 1.). The acidity was determined by electromotive method with device EpH-117/118.
Table 1.The granulometric composition of the soil abrasive mass.
Estimation of the wear surface of samples was made under the
photographs from JOEL JEM5200 scanning electron microscope.
2. The Results
To the basic mechanical characteristic of static abrasive wear mass granulometric composition is taken which describes the contents of soil fractions [7]. Presented in Figure 1 results showed that with increasing in the abrasive wear mass particle size of diameter <0. 1mm the wear value decreases. In dry soil conditions in the gravel the wear rate was 1.9 x higher than in the medium clay , and 2.4 x higher than in the silt.
Fig.2. The process of the wear of 38GSA steel depending on the
composition of the wear mass.
The basic dynamic characteristics of the abrasive wear mass is density (hardness), acidity and moisture [1,4,5]. The course of wear described as exponential functions (fig. 3-5):
b xj eaZ ⋅=
where: a and b are coefficients dependent on the characteristics of the condition and the type of mass.
Name of the soil
% fraction of the diameter in mm Gravel > 1,0
Sand 0,1-1,0
Silt 0,02-0,1
Clay <0,02
Gravel 56,6 25,4 9,4 8,6 Medium Clay
1,2 56,5 18,5 25,0
Silt 0,0 9,0 23,6 67,4
44

Fig. 3. The course of wear of steel in different states of moisture.
Fig.4. Relation between consumption of steel and abrasive wear mass
density.
Fig. 5. Dependence of the unit wear rate of steel on abrasive soil mass
acidity.
The basic characteristics of the working process is the speed of its implementation. Figure 6 shows the effect of friction speed on the course of wear, which is usually identified with the work of friction [2].
Fig.6. The course of wear of the steel depending on the speed in medium
clay abrasive mass
These results of experimental researches point to the importance of the speed of working process and the static and dynamic characteristics of soil mass on the abrasive wear process. Searching for the qualitative or quantitative relation between the forces of friction, and wear intensity made the evaluate of the friction coefficient necessary. The friction coefficient was determined using the indirect method of appointment of friction forces, which measured the U98-type force sensor with a recorder Hottinger GMBH SPIDER 8 (Table 2.).
Table 2. Summary of friction coefficient Type of the soil
Moisture
Gravel
_ μ
Coefficient of variation [%]
Dry 0,2001 6,25
Humid 0,2892 8,19
Wet 0,5595 3,52
Saturated 0,4073 20,50
Type of the soil
Moisture
Medium Clay
_ μ
Coefficient of variation [%]
Dry 0,5830 32,72
Humid 0,5357 33,93
Wet 0,2029 21,41
Saturated 0,2829 33,64
Type of the soil
Moisture
Silt
_ μ
Coefficient of variation [%]
Dry 0,6824 20,07
Humid 0,6268 35,80
Wet 0,4342 40,58
Saturated 0,0952 20,07
Picture of the phenomena occurring on the surface of the work
sample during soil treatment is the condition of the soil surface area. You can see clear traces of scalloping and scratching (fig. 7), local craters (Fig. 8) and multi-cycle fatigue wear(Fig.8-9).
Fig.7. Image of the wear surface in the gravel.
45

Fig.8. Image of the wear surface in medium loam.
Fig.9. Image of the wear surface in silt. 4. Summary
The demands on the formation of the surface layer from the dependence obtained and the analysis of elementary phenomena of wear process indicate a need a of different, depending on abrasive soil mass type and state, construction and fabrication of work elements. In selecting the properties of construction of the materials should be considered first granulometric composition of abrasive wear mass, because it is the sum of determined characteristics of the physical and chemical properties of soils and is a fundamental quantity describing the effect of abrasive soil wear. With the soil mass with water saturation is a reduction in the intensity of wear in all types of soil masses. However, the extent of these changes depends on the type. All the soil masses change their properties with the change of water content. Apparently they are visible in the clay soil. Soil density significantly affect the intensity of wear especially in cohesive masses, commonly regarded as concise. Significant differences were found between the intensity of wear of abrasive acidic soil masses and neutral and alkaline. There were no differences in the intensity of wear in neutral and alkaline soils. These results of experimental investigations point to the importance of speed on wear intensity. With the decrease of speed is an increase in intensity. When significant differences were obtained depending on the nature of the formation of the friction coefficient for the mass of abrasive soils, depending on the grain size composition. The greatest value of the coefficient of friction obtained for the heavy abrasive masses, with a high fraction of clay and silt. The average value of the coefficient for this type of dry soil was three times higher than for gravel.
Bibliography 1. Balla J. 1996. Modelovanie povrchovych interakcji nastrojom a podou. VI th. International Symposium, Intertibo 96, str. 133-136.
2. König U., Grewe H. 1981. Untresuchungen über Herstellung und Eigenschaften von Hartstoffschichten die durch reaktives Aufdampfen abgescheiden werden. Tribologie, Bd 1, Berlin, Springer 1981, str. 197 –250.
3. Gierek A., 2005, Zużycie tribologiczne, Wydawnictwo Politechniki Śląskiej Gliwice 2005(in polisch).
4. Napiórkowski J. Zużyciowe oddziaływanie gleby na elementy robocze narzędzi rolniczych. Inżynieria Rolnicza 2005, Nr 12 (in polisch).
5. Napiórkowski J. Analiza właściwości glebowej masy ściernej w aspekcie oddziaływania zużyciowego. Tribologia 2010, 5: 53-62 (in polisch).
6. Napiórkowski J., Pękalska L., Pękalski G. 1998. Structure of material and its wear resistance in the soil. Tribologia 1998; 6 : 871-879.
7. Natsis A, Petropoulos G, Piandazaras C. Influence of local soil conditions on mouldboard ploughshare abarsive wear. Tribology Int 2008; 41 :151 – 157.
8. Owsiak Z. Wear of symmetrical wedge-shaped tillage tools. Soil Tillage Res 1997; 43 (3,4) 295-308.
9. Stachowiak G W, . Betchelor A W. Engeineering tribology. Elselvier BH 20
46

TEORETICAL ASPECTS OF ENGINEERING DESIGN ТЕОРЕТИЧНИ АСПЕКТИ НА ИНЖЕНЕРНИЯ ДИЗАЙН
Msc. Eng.–manager Georgieva, Boryana Georgieva
Faculty of Mechanical Engineering – Technical University of Sofia, Bulgaria
маг. инж.–мениджър Боряна Георгиева Георгиева Технически университет – София, Машиностроителен факултет
Abstract: This report describes an attempt to represent some theoretical aspects of Engineering Design based on the viewpoint of General Theory of Systems. Knowledge in Engineering Design is formed as a result of a complex and interdisciplinary training in engineering and artistic disciplines. Theoretical knowledge is equally directed to a wide variety of different scientific and artistic fields. This is necessary to form methods that allows parallel and systematic summary of the required theoretical knowledge. On the other hand, General Theory of Systems is just such an interdisciplinary science that tries to summarize the knowledge in different areas and present them in a form, useful for specific aspects of science and practice. Considered of the General System viewpoint, the theoretical knowledge in Engineering Design would acquire a comprehensive and universal nature, which itself will contribute to improving the quality of students education in the field and to better their professional realization.
Keywords: ENGINEERING DESIGN, GENERAL THEORY OF SYSTEMS, THEORETICAL ASPECTS, KNOWLEDGE, INTERDISCIPLINARY.
1. Introduction What is “Design”? In this simple question people can find
several different answers. This is because everyone gives individual understanding of the word “Design”. Hence, there are many ideas for theoretical base of design. What is it? Purely artistic or project activities, or any compilation of them, which is leading the artistic and the other is a minor addition, ignorance of which can be excused with excessive artistic attitude of the designer.
Another reason of considerable importance for uncertainty about the Design and understanding of its nature as a profession and in particular the Engineering Design as such is widely disseminated claim that the theoretical basis of the Design is Aesthetic.
If this was enough at the time of formation and establishment of Design as a profession, today is no longer enough. Aesthetics is still and always will be an integral part of Design, but parity with others rather than leading. Therefore, the moment is ripe for finding another theoretical basis for Design that can bring unique concepts and principles to its essence based on his integrative nature. Should seek scientific theory that manages to combine all components of design – technical, artistic, ergonomic, etc. One such theory is formed in the 50s of the 20th century General Theory of Systems (GTS).
When people, who dealing in the Design, realize the need to rethink their profession and its specificity, will realize the necessity of going beyond the boundaries of their field. Then it will form a new thinking, new insights on Design, unusual for one who is determined style and object at the time of its formation as a profession. [7 http://www.kaminata.net/post577315.html#p577315] This realization is possible by using the philosophical categories and philosophy of science, which will bring the theoretical basis of the Engineering Design of a new theoretical level.
Once the Design is complex, interdisciplinary concept, the methodology of this study should be the same range. As mentioned, a good theoretical basis for Engineering Design because of its versatility and wide range may be GTS. According to current understanding, it is placed alongside mathematics and philosophy as a fundamental science, which has application in all aspects of cognition. GTS is inseparably linked with systemic–structural approach to science.
The tendency for understanding of Design as a unity of diversity determines the use of the system approach as a means for realizing the need to overcome the contradictions in the notion of Design.
2. Nature and characteristics of the products of Engineering Design from GTS viewpoint
Design product – material or virtual – is the unity of form–function–material. This is achieved with in–depth knowledge of the three compositing components. Way for its creation is a creative, constantly repeated, open process, beginning with the birth of an idea, concept development, design, build and aesthetic arrangement of the components and elements that make up the product. However, today this is a necessary but not sufficient condition for obtaining a good and useful result. Besides creative, process of creating a product is also engineering, and one does not contradict the other. Long ago, has been developed and studied engineering creative works, but this is not mean a mechanical compilation of the two. On the contrary – there is need of deep and clear understanding of the principles and laws in Fundamental, Engineering and Applied sciences.
In this context, each design product is appropriate to consider as a specific system, i.e. as a unity, consisting of components and elements, which are incorporate in the structures, which are determined by different types of connections and performing within the system defined and strictly deterministic functions.
The categories of wholeness, systems, structures, elements, relations and functions are subject to examination of GTS. [3, 4]
Design products are a separate class of systems. On the one hand, they should be regarded as individually, i.e. product for itself as a complex system, and on the other hand as integral part of the system product–user–environment.
Hence, there is formed a complex problem for the understanding of the products as an indivisible wholeness in itself, and again an indivisible wholeness of the product–user. Each of these relationships has its own characteristics and peculiarities.
Design products independently and in relation with the customer should be treated as complex systems with many hierarchical levels. Therefore, for each product are valid system properties and can be applied systematic criteria, and all transactions inherent in any system.
The creation of each Design product is the result not only from a strictly defined algorithm, but also a reflection of factors, not suitable for rigorous and unambiguous prescription. They are reflection on the one hand to the achievements of science and technology in the advancement of humanity, and on the other hand – of personality, character and level of education and intelligence of that/those who create them, and the degree of spiritual maturity of
47

their users. It does not pass the economic and social factors, but they are a more general feature that is part of these individual ones.
In addition to meet specific human needs, Design products should reflect the characteristics and interactions between different cultural, aesthetic, ethnic and even religious beliefs and traditions to consumers. It is important to combine knowledge of material and spiritual, expressed with certain parameters and properties, as well as symbols and signs expressing the meaning and message addressed to the user.
The Design product is an intermediary between users and designers, presenting their views on culture and the world. [5] I.e. product of the Design work is simultaneously reflection, result and resource of education of many factors, shown in figure 1.
Figure 1 – Design product as precondition and result
Another major precondition for the base of GTS is a unity of Design products such as subject/object–property–relationship. Design products, real or virtual, in themselves represent an object, possessing certain properties and having regard to other objects that can be both products and their users, i.e. products consumers, who in their turn also have some properties (nature, knowledge, values, etc.) and enter into a relationship with their environment. This closed and endless cycle resembles the Paradoxes of Zeno, but as they have their decision, also shown dialectical problem can be solved by GTS.
The other argument for considering Designer products such systems in the GTS viewpoint is that in this theory are many studies conducted regarding the new concepts about the nature of categories such as composition, harmony, symmetry, projection and others, i.e. concepts that appear traditional in art and design.
Basic categories of GTS are: element, system, structure, connections, relationships, etc. The composition is considered as invariant characteristics of a system. By definition, all systems have the structure or composition, not just distinctive aesthetic qualities. This gives reasons to distinguish the composition of the harmony, which usually in the examination of Design products in viewpoint of Aesthetic, taken for the theoretical basis of Design is not done. In GTS viewpoint a composition is characteristic of the wholeness of a system, while the harmony reflects to the “consonance”, i.e. aesthetic aspects of the relationship between the elements that set up a system. In other words, each system has its overall structure, which can be harmonized or not.
Another important property of Design products and basic art category is symmetry, which in GTS is seen as a universal property of the real world. Without denying the fact that symmetry is the basis of aesthetic perceptions of people, in general, it is operated with a limited number, and moreover, simple symmetries. With the GTS are deduced a multitude of complex symmetries, closely associated with Design products.
The result of the work of the designers is a product – material or virtual. This product consists of direct or indirect bound together elements that have some relationship to each other and are combined into integral whole forming composition, which
corresponds to the sixth criteria for systems, describing complex systems with multiple hierarchical levels.
The creation of Design products can not be achieved without passing through a stage of project.
In the field of philosophy of science project is regarded as a step in the process of cognitive transition from material to ideal, and vice versa – figure 2.
This figure shows that the project process in the broadest sense is objectify ideas. [2]
newphenomena
structured andorganized material
worldmaterial world
research project
knowledge ideas values andgoals
Figure 2 – project form Philosophy of Science viewpoint
A main aspect in the project process is the initial definition of product features and performance of system–functional analysis. This is the system–integrative aspect of Design product in connection with his versatility, which is a subject of study of many different sciences. Systemic–functional analysis is directly related both to the functioning of the system as a correlate wholeness and in its operation or behavior in the environment. In most cases it is necessary to know the structure, the laws of interaction of subsystems and elements, the relationship between the properties of elements and integrated properties or functions of the wholeness, how to act or conduct, interaction with other systems and the system environment. [6]
The creation of the Design products should always begin by defining the function, i.e. identification and definition of the system. The definition must include information for the primary purpose of the product and the conditions under which it will operate. Saying by other words – there is necessity of creation to a multilayered quality “portrait” of the product and then to recreate all its details.
In GTS viewpoint Design product can be regarded as a categorical model built by the unity of many different theories on nature, science and principles. It is result of the development of the absolute idea, system theories, systematically organized categories – art, science, technology, philosophy. Genesis of the idea of the Design product is the result of so–called sensory awareness, based on cultural, historical and ideological forms. Depending on whether it is necessary to creating an entirely new product or improving existing, the project process goes through the process of creation or termination of the object. [7 http://www.kaminata.net/hegeloviyat-ontologichen-model-
t56059.html]
Designer products today are not only material but also virtual who possess many of the characteristics and properties of material, but have their own, extraneous to the material. Design product has become from a result of the artistic–aesthetic and object–practical area to integrative, complex and multilevel systems, principles and laws which are described by GTS and should be seen through its prism. [2]
Each Design product consists of a number of different parts, which in turn constitute a separate system, constituting a wholeness in itself and in some respect to other autonomous systems and thus gets complicated hierarchical level, which ensures wholeness – the final product.
Presentation of Design products such as object–system and in this connection – manifestation of their complex and multi
• scientific• technological• historical• regional• social• economical• cultural• ecological• aestetic• religious• ethnical
preconditions
Design prodict
• scientific• technological• historical• regional• social• economical• aestetic• cultural• ecological
result
48

hierarchy properties is a prerequisite for referral to the methodological requirements of CTS.
Conclusion: Each product of the design activity – material or virtual – is the
result of knowledge and skills in various fields of science, technology and practice. The end result is a compilation and inseparable unity of scientific, mathematical, physical, technical, artistic, aesthetic and ergonomic features that are connected together by some relations and within the existing laws against those elements, called in common “law of composition”. Suitable theoretical basis for studying and understanding all of them is General Theory of Systems.
Application of GTS as a theoretical basis for Engineering Design will contribute to new understanding of Design as a profession, specifying living standards, making the increasingly higher requirements to extending technologies and sitting is an incentive for new technological elaborations and discoveries.
References: 1. Денчев М., Магнетичната сила на дизайна в аспекта на съвременното проектиране, VI-ти международен конгрес „Машини, технологии, материали”, 18–19 февруари 2009, София, България, том 5/108. 2. Денчев М., Преосмисляне на понятийния апарат на инженерния дизайн, конференция на Национална Художествена Академия, София, България, 2005 3. Бобков А. Н., Общая теория систем и диалектика единого и множестенного, Философия и общество 4/2005 4. Богданович Л. Б., В. А. Бурьян, Ф. И. Раутман, Художественное конструирование в машиностроении, Киев, „Технiка”, 1976 5. Ермолина, Л. А., Промышленный дизайн: сущность, содержание, тенденции развития, Автореферат, артикул 403051, 2010 6. Система, симметрия, гармония, Москва, изд. „Мысль”, 1988 7. http://www.kaminata.net/
49

VIBRATION SIGNATURE ANALYSIS OF THE BEARINGS FROM FAN UNIT FOR FRESH AIR IN THERMO POWER PLANT
REK BITOLA
Prof. Geramitchioski T. PhD.1, Doc.Trajcevski Lj. PhD.2
Faculty of Technical Science – University St. Kliment Ohridski Bitola, Republic of Macedonia 1
Abstract: This paper shows the procedure for prediction of rolling bearings defect in the motor-fan machinery for fresh air used in Thermo Power Plant REK Bitola, R. Macedonia, the biggest energetic institution for manufacturing the electrical power in the country. Detecting the condition of periodical measuring the vibration condition allows early detection and timely intervention renounced by replacing damaged parts and given as a contribution on this part of the predicting maintenance of the Thermo Power Plant.
It will decrease the cost’s for maintains the bearings, save many and avoided some possible failure of the bearings and the whole part of the fan unit for fresh air and increase the probability and efficiency of the Thermo Power Plant.
Keywords: Vibration, Bearing, FFT analysis, bearing failure, thermo power plant
1. Introduction
Mining and Power Company ELEM REK “Bitola” is the largest power generating capacity in Macedonia. It provides more than 70% of power and part of the coal needed for the industry and households in Macedonia.
Social economic importance of the energetic, especially in the last decades, after the oil shock crisis, gets special importance and needs special attention from all citizens and employees to the energy savings from one side and from the employed into energy sector on the other side from which depends safety and reliability of the operation of the energetic plants, equipment life cycle and the price of generated power (1).
Power Generation as all other technologies is a common effort of multidisciplinary specialists. Its efficient operation mostly depends from the quality and reliability of the technology and from the people operating and maintaining the equipment.
Power production process in ELEM REK “Bitola” is organized in two production units: Coal Mine and Thermal Power Plant. Scheme of production technology of electricity from coal mining to the handover of power to consumers is shown in fig 1.
Fig.1 Scheme of production technology of ELEM REK “BITOLA”
The experience of the maintenance process in REK
BITOLA determinates the bearings as mayor sensitive elements in the machinery. Reliability of the rotating machines with rolling bearings strongly depends of the
bearings condition. There are many factors influencing bearing life: difference between design and operating conditions, bearing installation, proper lubrication and machines installation(4,5).
Very important is to establish proper method of the monitoring of the bearing condition and to take on time activity to correct situation or to change damaged bearing (2).
Here is presented a method of a rolling bearings condition monitoring and detecting the possible start of failure on the bearing parts.
Bearing vibration analysis can detect lubrication failures, misalignment, out of tolerance running, rubbing, improper gear teeth meshing, out of balance, bent shafts, loose components, worn parts, faulty couplings, improper operating conditions (like pump cavitations) and deflecting support structures (5,7). However to be able to analyses the presence of these type of problems requires a highly skilled person with much experience and exposure to bearing vibration signatures at various stages of failure.
As a fault begins to develop, the vibration produced by the bearing are changes all the time. Every time a rolling element encounters a discontinuity in its path a pulse of vibration results. The resulting pulses of vibration repeat periodically at a rate determined by the location of the discontinuity and by the bearing geometry. These repetition rates are known as the bearing frequencies, more specifically:
Ball passing frequency of the outer race (BPFO) for a fault on the outer-race
Ball passing frequency inner race (BPFI) for a fault on the inner-race
Ball spin frequency (BSF) for a fault on the ball itself
The fundamental train frequency (FTF) for a fault on the cage.
The bearing frequencies can easily be calculated from the bearing geometry using the formulae given in Fig. 2.
50

Fig. 2. Formulas for calculating bearing frequencies
2. Monitoring of bearing vibrations
Monitoring refers to the analysis of vibrations measured at bearings of fan fresh air in REK Bitola. Fan for fresh air consists of the following main parts: body-shaped spiral impeller, shaft with bearings and regulatory apparatus (see fig.3).
Fig.3. Fan unit for fresh air BCB type ВДН-32Б
The rolling bearings used in this analysis are bearing number 3: SKF 7338BCBM-angular contact ball bearings, single row (see fig.4) and bearing number 4: SKF NU 244MA- cylindrical rollers bearings (see fig. 4)
The measuring vibration instrument used the model of SKF CMVA60 working with software PRISM 4. Also, the REK Bitola adopted the ISO 10816 standard by which a certain number and measuring points are set for measuring vibration in horizontal and vertical machines.
Fig.4. Bearing SKF 7338 BCBM and bearing NU 244MA
To calculate the generate frequency we used the software GEARBOX (see fig.5).
Fig. 5 Calculate general frequency for SKF 7338 and NU244 bearings with the GERABOX
51

For analysis of the dynamic state of 3VSV-A, a total 99 measurements of vibration were measured on the fan for fresh air branch-A TE Bitola Block 3 (Fig.6). The time period was from 09.06.2003 to 10.03.2011. Each measure has a total of eighteen measurement data. The effective vibration velocity V ( rms ), measured in an area up to 1000 Hz as defined by ISO standard. Through specter frequency (FFT) are diagnose the causes of vibration (imbalance, misalignments, mechanical looseness, and a combination of them). These reasons are synchronous with the rotor rotation.
Limits on a different machines and setting mechanisms are defined by standard ISO-10816-3.
Analysis of the frequency spectra (FFT) provides signs where defect occurred: at the inner race, of the bearing cage or on the outer race. These defects are not synchronous with the rotation shaft. If there are synchronous peak, it is the same sign that there are mechanical problems present in the spectrum of the vibration speed. Envelope of acceleration technology works in areas up to 1000 Hz. Warning limit is 4 gE, and the limit risk is 10 gE. Vibration acceleration is measured up to 5000 Hz and is useful for early detection of defects in bearings even when in areas of high frequencies.
The following shows just a sample of the overall analysis of the third and fourth bearing. The analysis shows the display of the spectrum in the period before the change bearing (2003-2007), to time when bearing working in failure period (2007-2010), and period after replacement of the bearing with new (2010 till now).
Fig. 6 The data of 99 measurements on SKF 7338 and SKF NU244 using envelope gE
3. RESULTS AND DISCUSSION
Figure 7 shows the spectrum measured for the third bearing SKF 7338, and Fig.8 of fourth bearing NU244MA. Spectrum measured period is on 30 June 2003 until 17 May 2012.This period is classified: 30 June 2003 (period before change bearing), 10 Mart 2010 (period when bearing working in failure period) and 16 May 2011 (period after replacement the bearing with new).
Fig. 7 Spectrum for bearing SKF 7338 before change period, bearing working in failure period (with FFT) and after replacement
the bearing with new
The figure 7 can be seen that the maximum peak in the spectrum is the frequency of 4.25Hz corresponding to the fundamental train frequency FTF=4.24Hz. Also can be noted that the spectrum of frequencies occurs matching first eight FTF harmonics which means that early measurement of vibrations has some damage to the balls of the third bearing and this indicates looseness. This frequency is not encountered very often, but it can occur when some defect affects the rotation of the train. Following are some examples of problems that can cause the generation of the fundamental train frequency. 1. In rare cases when one or more rollers are missing from a bearing, the FTF can be generated. The problem occurs as a pulse at the FTF. The frequency spectra contain a series of harmonics of the FTF. The amplitude of the first harmonic is quite low, the second, third, and fourth harmonics are higher in amplitude as determined by the pulse. 2. Sometimes, attempts to lubricate sealed or shielded bearings can cause the seal or shield to deflect inward. If the cage touches the seal or shield, the FTF and/or two times FTF plus harmonics can be generated. 3. Excessive clearance in an antifriction bearing can cause the generation of a discrete frequency at the FTF and/or modulations of the FTF at rotating speed and harmonics. Except for defects that occur in bearing components during manufacturing, the cage is usually the last component to fail. The typical failure sequence is as follows: defects form on the races, the balls, and then finally the cage. A severely damaged cage can cause constant frequency shifts that are observable with the use of a real-time analyzer. When the cage is broken in enough places to allow the balls or rollers to bunch up, wide shifts in frequencies accompanied by loud noises can occur.
4H-e
0
5
10
15
20
25
30
дата
gE
3H-e
0
10
20
30
40
50
60
дата
gE
52

This conclusion can be confirmed by the measured data are shown in fig.7 where noted sizes larger than the value 4gE giving warning alarm for mechanical problems in the bearing.
Fig. 8 Spectrum for bearing NU244MA before change period, bearing working in failure period (with FFT) and after replacement
the bearing with new
The figure 8 can be seen that the maximum peak in the spectrum is the frequency of 4.35Hz corresponding to the fundamental train frequency FTF=4.4Hz. From research it is known that when a bearing is defective rotating elements then the frequency must pass through more mechanical interfaces and balls generate FTF frequency which is rarely presented as a discrete frequency. Frequency modulated in this way generates other frequencies such as frequencies of rotation (10Hz) etc. Since the value of the frequency of rotation is not very large it indicates that the balls are not always loading zone at the outer or inner ring. Also, we may be noted that there is absent the occurrence of BSF frequency because the damaged bearing balls roll is in one direction and spin is in another direction. It can also be observed elevated amplitudes of all other frequencies, suggesting that there are serious problems with the bearing. The spectrum can be seen that the dominant frequency is the rotating frequency of 10Hz with its harmonics, as well as all other frequencies FTF=4.4Hz, BPFI=107.3Hz, BPFO=82.7Hz and BSF=38.1Hz. So, we can observe that after bearings replacement, they are working correct. From presented analysis we can note that the analysis of spectrum requires good professional knowledge of the person performing the analysis, as well as good knowledge of signal processing techniques for analysis.
In further analysis is given vibration condition of the rolling bearing set on the front and the back of the electric motor and a point marked by the point 1 and point 2. Finally, recent measurements at the beginning of 2011 showed a significant increase in the amplitudes of vibration rolling elements and cage (Fig.9). Two types of bearing defects, namely, rolling elements and cage defects were studied. Measurements were carried out on two sets of bearings. The defective bearing was replaced by good bearing after predicting the failure with vibration signal analysis. After dismantling the bearing, the photo showed
the place where it caused the failure of the bearing cage (Fig.8).
Fig.9. Damaged cage of the SKF 7338 rolling bearing
Defects on the rolling elements (Fig.10) can generate a frequency at twice ball spin frequency and harmonics and the fundamental train frequency. Twice the rolling element spin frequency can be generated when the defect strikes both raceways, but sometimes the frequency may not be this high because the ball is not always in the load zone when the defect strikes and energy is lost as the signal passes through other structural interfaces as it strikes the inner raceway. Also, when a defect on a ball is orientated in the axial direction it will not always contact the inner and outer raceway and therefore may be difficult to detect.
Fig.10. Damaged rolling elements of the SKF NU244
The bearing cage tends to rotate at, typically, 0.4 times inner ring speed, has a low mass and, therefore, unless there is a defect from the manufacturing process, is generally not visible. Unlike raceway defects, cage failures do not usually excite specific ringing frequencies and this limits the effectiveness of the envelope spectrum. In the case of cage failure (Fig.9), the signature is likely to have random bursts of vibration as the balls slide and the cage starts to wear or deform and a wide band of frequencies is likely to occur.
4. CONCLUSION
Trend of overall frequencies and vibration spectrum provide useful information to analyze defects in roller bearings. Trend indicates severity of vibration in defective bearings. Vibration domain spectrum identifies amplitudes corresponding to defect frequencies and enables to predict presence of defects on inner race and outer race of roller bearings. The distinct and different behavior of vibration signals from bearings with inner race defect and outer race defect helps in identifying the defects in roller bearings. In the analysis problem, the defect is rolling bearing cage. The bearing cage tends to rotate at typically 0.4 times inner ring
53

speed, has a low mass and therefore, unless there is a defect from the manufacturing process, is generally not visible.
Unlike raceway defects, cage failures do not usually excite specific ringing frequencies and this limits the effectiveness of the envelope spectrum. In the case of cage failure, the signature is likely to have random bursts of vibration as the balls slide and the cage starts to wear or deform and a wide band of frequencies is likely to occur.
When deep fatigue spalls are present, pulses are generated. The FTF contains several harmonics when pulses are present. Etching, corrosion, and fluting can also cause many harmonics.
Bearings in rotating machinery should be periodically checked with a frequency spectrum and time signal to detect and study developing defects on the outer and inner races. An accurate method for the calculation of bearing defect length is needed to allow a quantitative determination of the defect severity. With the defect size and progression of development determined, the remaining bearing life can be estimated.
From the conducted analyzes and made the conclusion that the rolling bearings 3 and 4 mounted on the shaft of the impeller fan for fresh air to the steam generators in the Bitola stayed very small life of exploitation in terms of projected (only 25%) which makes them quite uneconomical and quite ineffective in operation.
Given their size, cost and other data related to the cost of assembly-disassembly, disruption of operations, it is evident that haphazardly increased costs of exploitation of the system. This condition is a consequence of defective assembly for overhaul in 2002, which cause imbalance and misalignment the shaft, further drastically loaded bearings. This is particularly important conclusion for bearing number 4 which is a rolling bearing with cylindrical rolling bodies not suffer greater slope for increased deformation of the shaft. Accordingly, we recommend using the same bearing dimensions but another type of rolling bodies’ breaker, the type that has the ability to automatically compensate for the increased deformations expressed through large slope in the supports.
REFERENCES
[1] Albrecht, P.F., R.M. McCoy and E.L. Owen, 1986. Assessment of the reliability of motors in utility application, IEEE Transactions on Energy Conversation, vol. EC-1, no. 1, March 1986
[2] Lindh, T., 2003. On predictive bearing condition monitoring of induction motors, Ph.D. dissertation, Lappeenranta University of Technology, Isbn 951764-3, Isssn 1456-4491,2003.
[3] Henderson, D.S., K. Lothian and J. Priest, 1998. Pc based monitoring IEE/IMechE International Conference on Power Station Maintenance Profitability through Reliability, no. 452, March/ April 1998, pp: 28-31.
[4] Li, Y. and C. Zhang, 2004, Dynamic Prognostic Prediction of Defect Propagation on Rolling Element Bearing. Journal of Vibration and Acoustics, Trans of ASME, vol 85, no. 1, pp: 214-220. July 2004.
[5] Igarishi, T. and Hiroyoshi., 1980. Studies on Vibration and Sound of Defective Rolling Bearing. Bulletin JSME, vol 25, no. 204, pp: 994-1001.
[6] Chaudhary, A. and N. Tandon, 1998. A Theoretical Model to Predict Vibration Response of Rolling Bearings to Distributed Defects under Radial Load. Journal of Vibration and Acoustics, Transactions of ASME, vil 120, no. 1, pp: 214-220.
[7] Taylor, I.J., 1980. Identification of Bearing Defects by Spectral Analysis. Journal of Mechanical Design, Transaction of ASME, Vol. 120: 199-204
54

HETEROSTRUCTURED ANTIFRICTION AND ANTISCUFF ADDITIVES FOR LUBRICATING MATERIALS WITH REGULATED TRIBOLOGICAL PROPERTIES
Dr.Sc., Prof. Gorokhovsky A.1, Dr.Eng., Prof. Safonov V.2, PhD., Azarov A. 2,
PhD., Assoc. Prof. Tretyachenko E.1
Faculty of Technical Physics – Yu.A. Gagarin State Technical University, Saratov, Russia 1
Faculty of Mechanization and Technical Service in Agriculture – A.A.Vavilov State Agricultural University, Saratov, Russia 2
Abstract: Antifriction, antiscuff and antiwear properties of lubricating materials produced on the base of standard greases containing additives of new heterostructured nanopowders were investigated. Heterostructured nanopowders were synthesized by intercalation of some transition metals (Cu, Ni, Zn, Mn, Co, Cr) in the layered matrix of the potassium polytitanate and following low temperature treatment. It was recognized that the introduction of heterostructured additives intercalated with Zn, Cu and Mn allowed obtaining the greases characterized with tribological properties significantly superior to the greases produced with additives of nanoscale particles of corrersponding metals and commercial analogists based on MoS2 additives. KEYWORDS: LUBRICATING MATERIALS, ANTIFRICTION ADDITIVES, NANOPARTICLES, TRIBOLOGICAL PROPERTIES
1. Introduction
Lubricaiting compositions are widely used in different technical areas including ball and sliding bearings, sliding members, ball-screw and spur gears of different type, friction assemblies, ball-and-socket joints in all kinds of carriers and transport systems, screw couplings etc. It is well known that high antiwear and antiscuff properties can be obtained by the use of molybdenum disulfide (MoS2) as a component of lubricating systems. Its application promotes reduced consumption of greases as well as low wear. Nowadays, almost all leading manufacturers of lubricating oils and greases apply MoS2 as an antifriction admixture (Shell, Mobil, Esso, Castro, etc.). However, in spite of its advantages, MoS2 is an expensive material and cannot be used in all areas of its potential application as a lubricant due to relatively high corrosion activity and generation of abrasion particles of molybdenum oxide during exploitation [1]. On the other hand, there is a lot of other antifriction admixtures proposed last decade and recommended to apply in the composition of greases and oils due to their perfect tribilogic characteristics. The substances consisting of nanoscale particles are of great interest because of highe tribilogic properties in comparison with microscale particles of the same composition. However, synthetic nanoparticles of this type (WS2, fullerenes, carbon nanotubes, nanodiamonds, ZrO2, ZnO, Al2O3, different metals etc.) [1-6] are characterized by high cost; whereas interesting natural antifriction analogs, i.e. natural serpentinites, contain abrasive admixtures (silica sand, magnetite, pyroxenes, etc.) and their benefication dramatically increases a price) [7-9].
2. Preconditions and means
The authors have developed the technology to produce a new kind of material (potassium polytitanate, PPT) which is promising for its application as a cheap analog of MoS2 [10]. The potassium polytitanate has a layered platelet structure. Each layer is presented by polyanion constructed by titanium-oxygen octahedra; the K+ cations as well as hydronium ions and H2O molecules are located between the layers of polyanion. The quasi-amorphous structure of PPT particles is similar to the crystalline structure of lepodocrocite; however the distance between the layers is very irregular. The K+ content and [H2O] depend on PPT synthesis conditions and can be regulated in a wide range [11]. The PPT particles are characterized with some properties important for the antifriction additives, such as high mechanical strength (Young’s modulus of about 280 MPa), low friction coefficient (similar to MoS2) and high thermal stability (up to 750-800 oC). Taking into account the abovementioned comments the authors of this paper proposed to introduce the PPT in the composition of some well-known commercial lubricating compositions instead of MoS2 additives. Such investigations realized with different types of basic oils and greases have shown [10, 12] that an exchange of the molybdenum disulfide and potassium polytitanate is possible in all standard lubricating materials and pastes which are produced in Russia and abroad. On the other hand, it was demonstrated that a
correct selection of the surfactants applied to obtain stable dispersions of PPT particles in the basic oils allowed increasing the main tribology properties of lubricating compositions up to the level better of similar compositions based on MoS2 additives [13].
However, the tests realized before have shown that the antiwear effect of the potassium polytitnate additives is not so high as in the case of MoS2 or metal (Cu, Zn, Pb) nano-sized additives. That is why, the objective of this research was to define a possibility to produce the heterostructured nanoparticles consisting of the layered potassium polytitanate matrix and nanoparticles of some transition metals promoting cladding of rubbed steel surfaces. It was assumed that such particles could promote twin effect combining high antifriction properties of the potassium polytitanate modified by organic surfactants and high antiwear properties of metal nanoparticles.
3. Solution of the examined problem
The basic potassium polytitanate (PPT) powder was synthesized in accordance with [11]. The TiO2 powder (anatase, Aldrich, purity of 99%, average diameter of particles of 7 µm) was treated in the molten mixture of KOH and KNO3 (weight ratio of 1:1:8) at 500 oC for 2 h in the alumina crucible. The obtained product was washed with distilled water (20 weight parts of H2O for 1 weight part of the product), separated from the aqueous solution by Whatman paper filter (No40) and dried in the oven at 60oC for 4h. The obtained product was characterized with a chemical composition corresponding to the molar ratio of TiO2: K2O = 4.1. To produce heterostructured particles, the basic PPT powder was dispersed in the distilled water (1:10) containing admixture of non-ionic surfactant (trade-mark OP-10, 0.1%) at the room temperature using the ultrasonical treatment. Further, the salts of different transition metals were introduced into the obtained aqueous dispersion in quantity corresponding to the ratio of 10 g of PPT to 0.01 mol of the salt. The sulfates of Ni, Co, Zn, Cu, Cr and Mn were applied for the treatment during 6 h, corresponding to the equilibrium in the system obtained. After the treatment the modified PPT powder was separated from the solution by filtration (paper Whatman No42), thermally treated at 90 oC for 4h in the oven and further used to produce lubricating compositions. The modified PPT powders obtained in accordance with abovementioned method were investigated to identify their chemical composition and structural features using the following methods. The morphology and size of the particles were measured with a Hitachi H-600 Transmission Electron Microscopy, 200 kV. XRD spectra of the nanoparticles were measured with a Philips X’Pert X-ray diffractometer, Cu target, voltage: 40 kV; chemical composition - with a SEM Philips MP-3, equipped with the EDS analyzer EDAX Pegasus) . The TEM images of the particles of some modified potassium polytitantes and their X-ray diffracograms are presented in fig.1. The obtained products can be classified as powders consisting of heterostructured particles. Each particle has a matrix formed by the basic PPT layered structure; at the same time, the ions of the metals,
55

intercalated into the interlayer space of PPT particles, due to a high reduction activity of the potassium polytitanate [14] are transformed into an atomic species and form the nanocrystals (diameter of 5-50 nm).
Fig.1. TEM images and XRD patterns of the PPT/Ni (A) and
PPT/Zn (B) particles. Table 1. Chemical composition of the PPT powders doped by different metals.
PPT/Me K2O TiO2 Me PPT 18.9 81.1 -
PPT/Cu 9.9 80.2 8.9 PPT/Zn 10.0 81.4 6.6 PPT/Mn 9.2 83.7 7.1 PPT/Cr 9.8 84.3 5.9 PPT/Ni 9.1 82.6 8.3
Such small size of the crystals does not support obtaining the XRD patterns typical for crystalline structures of the metals. The X-ray diffractograms don not change their character typical for amorphous (semicrystalline) potassium polytitanates. The chemical composition of heterostructured PPT/Me powders, obtained by intercalation of Me ions from the salts and further used as antifriction/antiscuff additives, are reported in table 1. To produce lubricating compositions, the heterostructured PPT-based powders were dispersed in the basic oil (I-20) in presence of oleophylic surfactant (monohydro-citrate of diethylamin-glizeride) admixture (0.1%), which, as a result of sonification, allowed obtaining stable 50% dispersions with average size (diameter) of platelet particles equal to 380 nm (data obtained with the particle size analyzer Shimadzu 2201). The obtained dispersions were used to manufacture model greases. These lubricating compositions were produced on the base of the universal Russian grease of the Litol-24 trademark (RF Standard GOST 21150-87) traditionally applied in different types of bearings. The model greases were prepared by mixing of Litol-24 with oil dispersions of the PPT/Me nanopowders in proportion, which allowed obtaining the greases containing 3 wt.% of the modified PPT. This concentration of antifriction and antiwear admixture was selected taking into account that a most part of the commercial greases of this type (including Megaplex XD3 used in
comparative tests) are characterized with 3 wt.% admixture of the MoS2 powder). The homogenization of the lubricating composition was realized in the UPPS-1 grease stirrer for 1h (controlled with the Micromed C-11 optical microscope). Taking into account that the modified PPT powders consisted of the potassium polytitanate matrix and metal nanocrystals, some model greases only containing nanoparticls of different metals, including intercalated into the PPT/Me particles, were also prepared to compare their influence on tribology properties of the same Litol-24 basic grease. The metal nano-powders applied to prepare the greases (Ni, Cu, Zn) were produced by spark-plasma method [15] and characterized with average size of particles equal to 20 nm. The content of metal nanopowder in the greases was selected in accordance with the paper [16], in which the admixture of 1.6 wt.% of the metal nano-powder was recognized as optimal. The maximum nonseizure loads (PB) and other tribilogical characteristics of the investigated greases were evaluated, according to ASTM D2783, on a modified four-ball CM-1 tribotester, equipped with ZET 210 - ZET 410 tenzometric complex, at 1435 rpm and room temperature. The balls (12.7 mm in diameter) in the test were made of ШХ-15 bearing steel (RF standard GOST 801-78). A dependence of the wear-scar diameter on friction time was selected as antiwear characteristic and measured under a constant load of 100 N after 1 h testing. The wear-scar diameter and friction force torque (friction coefficient) were measured after a given time limited by 1 h with a step of 3 min; the whole process was repeated several times. Each test was realized with a new portion of the corresponding grease and new balls.
The ball after the four-ball test was cleaned using an ultrasonic bath in ligroin and then in distilled water for 5 min. EDS analyses of the elements on the wear scar were conducted on a SEM (MIRA 2 LMU) equipped with the EDS analyzer (INCA Energy 350) using pass energy of 20 eV and Cu Ka line excitation source. The wear scar diameter (dws) was measured with an optical microscope (BMI-1) for each of three down balls obtained after 3 testing series; the measurements were done in two perpendicular directions. The resulted dws was estimated as average value of 18 measurements (3 balls of 3 series in 2 perpendicular directions).
4. Results and discussion
The kinetic data on a change of the friction force torque value with a testing time of Litol-24 basic grease containing different PPT/Me and Me additives is presented in fig.2. The obtained results demonstrated the following features: 1) The PPT/Me additives promote reduced friction for all types of
heterostructured PPT/Me particles. 2) The antifriction properties (equilibrium friction force torque
values) of the PPT/Me additives are similar to that obtained with corresponding Me nanoparticles applied as additives. Mfr(PPT/Ni) ≈ Mfr(/Ni). Mfr(PPT/Cu) ≈ Mfr(PPT/Cu). Significant difference only takes place for PPT/Zn and Zn admixtures; in this pair the antifriction properties of the PPT/Zn additive is much better.
3) The PPT/Me nanopowders can be shared in the two groups. The additives of the 1st group (PPT/Ni, PPT/Co) reduce friction coefficient in 1.6 times in comparison with the basic grease (Litol-24). The additives of the 2nd group (PPT/Zn, PPT/Mn, PPT/Cu, PPT/Cr) decrease this tribological characteristics in 2.1 times and allow obtaining a friction coefficient lower of this one recognized for the commercial grease of Megaplex XD3 trademark containing 3 wt.% of MoS2 additive.
A
B
Metal Particles
Metal Particles
56

0
0,1
0,2
0,3
0,4
0,5
0,6
0,7
0,8
0,9
1
0 10 20 30 40 50 60
time, min
Fri
cti
on
fo
rce
to
rqu
e, N
*см
PPT/Ni
Zn Ni
PPT/Co
PPT/Cu Cu
PPT/Zn
PPT/Cr
Litol-24
Megaplex
Fig.2. Kinetic covers of the friction force torque change during the
tests realized with Litol-24 containing different antiftiction/antiwear additives (3 wt.%).
Table 2. Friction coefficient (µ), average wear scar diameter after 1h test realized with Litol-24 containing different antifriction/antiwear additives (3 wt.%), microhardness (H) and nonseizure load (PB).
Lubricant µ d, mm H, GPa PB, N
Litol-24 0.024 0.64 3.2 735 Litol-24/Zn 0.017 0.65 - -
Litol-24-PPT/Zn 0.010 0.43 9.9 784 Litol-24-PT/Ni 0.011 0.55 - -
Litol-24-PPT/Cu 0.011 0.51 - 929 Litol-24-PPT/Cr 0.012 0.45 6.2 - Megaplex XD3 0.013 0.39 3.1 -
It is well known that tribilogical properties of rubbed surfaces, including microhardness and wear, depend on tribochemical processes taking place in the contact points in the conditions of high pressure and temperature accompanying with intensive elastic deformations [1, 17]. That is why the structure and chemical composition as well as microhardness of wear scar obtained on the ball surfaces lubricated with different nanoadditives, were investigated. The microhardness was analized by Vickers method (diamond pyramid) using the PMT-3 equipment with 0.2N indentation load at 20 oC. The microhardness values were calculated from the following equation:
H μ= 1854,4103P
d 2 , (6.1)
where: Hμ – microhradness (MPa), P – indentation load (g), d – length of the indentation, μm. The average microhardness were estimated taking into account 9 measurements in the scars of 9 balls (for each 3 bottom balls tested in 3 series of the same conditions. It was recognized (table 2) that a use of PPT/Me additives in the composition of the basic grease promoted increased microhardness of the worn surfaces depending the type of additive. The maximal effect was obtained for the PPT/Zn additive which improved the microhardness of rubbing surfaces in 2.14 times in comparison with pure Litol-24. Fig.4 shows the SEM micrographs of the worn surfaces of the balls obtained under various lubricating conditions.
Fig.3. SEM images of the rubbed surface lubricated by Litol-24 (1), Litiol-24+3% PPT/Co (2), Litol-24+3% PPT/Zn (3) and Megaplex-
XD3 (4). Magnification X200. A number of small holes and deep grooves coupled with plastic deformation were found on the worn surface for the basic grease Litol-24, grease Megaplex XD3 and, especially, for the Litol-24/PPT/Co composition, indicating that severe scuffing happened. While for the Litol-24/PPT/Cu and, especially, Litol-24/PPT/Zn lubricating compositions the worn surfaces were relatively smooth. To identify the mechanism of the processes promoting improved tribological characteristics, the EDS analysis of the rubbing surfaces was applied. The obtained results (table 3) indicated that a high antiwear effect of the PPT-based heterostructued additives could be explained by introduction of Ti and Me, presented in the composition of PPT/Me heterostructured particles, into the structure of the surface layer of balls. This modification of rubbing surfaces promotes increased microhardness, due to Ti atoms incorporation [18], while the Me, introduced into the surface layer of steel, supports increased plasticity and antiscuff properties, as well as
1
2
3
4
57

increased corrosion resistance [1]. The heterostructured character of the PPT/Me nanoparticles promotes a combined influence of the additive. It is interesting that, in the case of the PPT/Zn composition, a synergetic effect takes place; an introduction of Zn in presence of Ti promotes more intensive effect in comparison with pure PPT and Zn additives.
Table 3. Chemical composition of the wear spot surfaces lubricated with different additives (greases).
Lubri-cating
Content, wt.%
C O Cr Fe Ti Zn S Mo
Basic steel
7.4 - 1.5 91.2 - - - -
Litol-24 (pure)
5,5 - 1.8 92.5 - - - -
PPT/Zn 5.2 6.9 1.4 83.7 2.3 0.6 - - Megap-lexXD3
7.3 - 1.6 89.4 - - 0.3 1.5
Thus, the lubricating composition based on PPT/Zn heterostructured nanoparticles is a more promising to use in the composition of different universal and special greases as a new antifriction, antiwear and antiscuff additive (table 3), which is characterized by high tribology properties, better of the same obtained with the model greases based on Me nanoparticles and some commercial samples of greases based on MoS2 powders. At the same time, the PPT/Zn powder has a cost in 3-4 times lower of the MoS2 powders and in 15-20 times lower of the cost of Me-nanopowders. In the case of the PPT/Zn powder application in the lubricating compositions, the surface layer of rubbing surfaces achieves improved tribological characteristics due to chemical modification supporting increased microhardness, corrosion resistance and antiscuff properties. 5. Conclusions
1. The nano-powders of complex chemical composition can be produced by intercalation of layered potassium polytitanate (PPT) particles with transition metal ions in the aqueous solutions of corresponding salts.
2. Due to the reduction properties of the PPT powders, the low temperature thermal treatment of their intercalated particles allows obtaining the heterostructured nanoparticles consisting of potassium polytitanate layers and Me nanoparticles located in the interlayer space and onto the surface of these particles.
3. The admixtures of the suspensions of heterostructured PPT/Me nanoparticles, obtained with special surfactants in the basic oils, can be easy dispersed in different greases, i.e. Litol-24, to obtain new effective lubrication compositions.
4. The tests realized using the four-balls machine in accordance with ASTM D2783 have shown that the model greases prepared in the system of Litol-24 - PPT/Me (3wt.%), Me=Zn,Cu,Cr are characterized with excellent antifriction properties, similar to the same obtained for the additives based on the corresponding Me nanoparticles. These lubricating compositions, especially the Litol-24/PPT/Cu, were also characterized with high values of nonseizure loads (antiscuff properties) and small values of wear spots, especially Litol-24/PPT/Zn, (antiwear properties).
5. The analysis of the chemical composition and morphology for the balls lubricated with different types of additives, based on PPT/Me nanopowders, has shown that these additives allowed obtaining the friction surfaces characterized with improved corrosion and wear resistance due to incorporation of Ti and Me into the structure of worn surfaces.
6. It was shown, in the control testing experiments with some standard bearings that a use of the PPT/Zn additives in the composition of the Litol-24 standard grease (3 wt.%) promoted reduced wear (in 3 times), increased time resource
(in 3.2 times) and decreased friction force torque (in 1.45 times). References 1. Lubricant Additives. Chemistry and Applications. 2nd edition, Ed. by Rudnick, L.R., NY, CRS Press, 2010. 796 p. 2. Hernández Battez, A., R. González, J.L. Viesca, J.E. Fernández, J.M. Díaz Fernández, A. Machado, R. Chou, J. Riba, CuO, ZrO2 and ZnO nanoparticles as antiwear additive in oil lubricants, Wear, 265, 2008, 422. 3. Chou, C.C., S.H. Lee, Rheological behavior and tribological performance of a nanodiamond-dispersed lubricant. J. Mater. Process. Technol., 201, 2008, 542. 4. B. Zhang, B. Xu, Y. Xu, F. Gao, P.Shi, Y.Wu. Cu nanoparticles effect on the tribological properties of hydrosilicate powders as lubricantadditive for steel–steel contacts. Tribol. Int., 44, 2011, 878. 5. Jiao, D., S. Zheng, Y. Wang, R. Guan, B. Cao. The tribology properties of alumina/silica composite nanoparticles as lubricant additives, Appl. Surf. Sci., 257, 2011, 5720. 6. Fernández Rico, E., I. Minondo, D. García Cuervo. The effectiveness of PTFE nanoparticle powder as an EP additive to mineral base oils, Wear, 262, 2007, 1399. 7. Zhang, B., Y. Xu, F. Gao, P. Shi, B. Xu, Y.Wu, Sliding friction and wear behaviors of surface-coated natural serpentine mineral powders as lubricant additive, Appl. Surf. Sci., 257, 2011, 2540. 8. Jin, Y.S., S.H. Li, Z.Y. Zhang, H. Yang, F. Wang, In situ mechanochemical reconditioning of worn ferrous surfaces, Tribol. Int., 37, 2004, 561. 9. Yu, Y., J.L. Gu, F.Y. Kang, X.Q. Kong, W. Mo, Surface restoration induced by lubricant additive of natural minerals, Appl. Surf. Sci., 253, 2007, 7549. 10. Safonov, V.V., A.V. Gorokhovskii, A.I. Palagin., A.S. Azarov., D.A. Aristov, S.I. Khorukov, Tribological properties of antifriction suspensions based on potassium titanate nanopowders, Nanotekhnika (Rus), No4, 2009, 94. 11. Sanchez-Monjaras, T., A.V. Gorokhovsky, J.I. Escalante-Garcia, Molten salt synthesis and characterization of polytitanate ceramic precursors with varied TiO2/K2O molar ratio, J. Am. Ceram. Soc., 91, 2008, 3058. 12. Safonov, V.V., A.S. Azarov, A.V. Gorokhovskii, A.I. Palagin, Modernization of lubricating mateirals by nanodispersed potassium polytitanate powder, Remont, Vosstanoblnie, Modernizatsiya (Rus), No 1, 2011, 17. 13. Tretyachenko, E.V., A.V. Gorokhovskii, G.Yu. Yurkov, T.V. Nikityuk, A.I.Palagin, Influence of the surfactant on the structure of the potassium polyutitanate, Bashkirskii Khimicheskii Zhurnal (Rus), No 5, 2010, 137. 14. Gorokhovsky, A.V., E.V.Tretyachenko, I.D. Kosobudsky, G.Yu. Yurkov.,L.V. Nikitina. Potassium polytitanates intercalated with Ni ions and their thermal transformations, Rus. J. Inorg. Chem., 56, 2011, 1775. 15. Krapivina S.A.. Plasma chemical technological processes (Rus). Leningrad. Khimiya, 1981. 247 p. 16. Safonov, V.V., A.S.Azarov, V.A.Alexandrov. Nanosized additives in the lubricating compositions and modeling of tribological contacts Remont, Vosstanovlenie, Modernizatsiya (Rus). No 2, 2008, 8. 17. Friction Wear and Lubricating (Tribology and Tribotechnique). Ed. By Tchitchinadze A.V., Moscow. Mashinostroenie, 2003, 576 p. 18. Xue, Q., W.Liu, Z.Zhang, Friction and wear properties of a surface modified TiO2 particle as an additive in liquid paraffin, Wear, 213, 1997, 29.
58

THERMAL GROWTH INFLUENCE ON THE SHAFT ALIGNMENT AND VIBRATION OF CENTRIFUGAL PUMP
ВЛИЯНИЕ ТЕРМИЧЕСКОГО РАСШИРЕНИЯ НА ЦЕНТРОВКУ ВАЛОВ И ВИБРАЦИЮ ЦЕНТРОБЕЖНОГО НАСОСА.
M.Sc. Priževaitis A.1, Dr.sc.ing. Litvinov D.1, Prof., Dr.sc.ing. Geriņš Ē.1
Riga Technical University1 – Riga, Latvia
Abstract: Shaft alignment of any rotor equipment is an important task. It must do an alignment after repair of equipment, and also periodically to check the alignment of shafts. During alignment works it is recommended to take into account thermal growth of pumping unit components that strongly influences on the capacity of pump and on the vibration level. In this article the analysis of vibration level dependence from shaft alignment quality and thermal growth is resulted. KEY WORDS: SHAFT ALIGNMENT, VIBRATION, ANALYSIS, IMPELLER, BEARING
1. Introduction
Figure 1. Centrifugal pumping unit [1; 2]
A centrifugal pumping unit consists of pump and electromotor. The pump consists of corps and impeller revolved in it. At the wheel rotation in the stream of liquid there is a difference of pressures for both sides of every blade and, consequently, power interaction of stream with an impeller. The increase of liquid stream energy in an impeller depends on a flow rate, rotation frequency of wheel, it dimensions and form of the blade. The hydraulic energy of liquid increasing takes place in the revolved impeller. In the tale races of corps kinetic energy of liquid will be transformed in pressure energy. Energy content, obtained by a liquid in a pump, expended on resistances and counterpressure overcoming in the system. The centrifugal pumping units’ application domain is vast: for a domestic and industrial water-supply, in circulation, feeding, network and other settings of power-stations, in land-reclamation, introduction of a heating system, in pumping, in paper, mining, metallurgical, chemical industry etc. [3]. Therefore it is very important to provide the reliable capacity of pumping unit. One of important protracted pumping units’ capacity providing methods is a shaft alignment. The procedure of the shaft alignment must be carried out by experienced personnel, with the modern devices using, and also taking into account compensation of thermal growth. 2. Centrifugal pumps shaft alignment methods
The centrifugal pumping unit’s methods are differing nothing from the majority of rotor equipment shaft alignment methods. At an alignment the followings methods are used:
By a caliper or probes is measuring of radial and butt-end gaps on couplings. (Fig.2, a)
By equipment with the sentinel type indicators: a) A rim and face method, (Fig.2, b); b) Reversed indicators method, (Fig.2, c); By the scopes. By devices with the contactless sensors of shaft pulsations. By laser devices. Laser sensors location, accordingly,
on the S-machine and M-machine. Where S – immobile (stationary), and M – movable machines. (Fig.2, d)
а) b) c) d)
Figure 2. Shaft alignment methods [4]
For the shaft alignment of all rotor equipment, including centrifugal pumps , it is most correct to apply a laser method. This method abbreviates time of alignment, not only considerably, but also allows to conduct alignment with maximal exactness (up to 0,001 мм). Most modern laser shaft alignment systems have the thermal growth compensation function, that very influences on quality of alignment and on the pumping unit efficiency.
3. Thermal growth
A coefficient of thermal growth is the standard length or volume of material relative measuring, attributed to unit of temperature scale.
59

Under thermal growth it is necessary to understand the change of pumping unit components sizes due to heating of moving parts. The electro motors of pumping unit are most strongly subject to thermal growth. Heating takes place due to mechanical friction and electric energy transformation to thermal energy.
Thermal growth of stationary and moving machines parts can influence on the measuring results. For example, the thermal growth coefficient of steel is approximately equal 0,01 mm/m on every increasing degree of temperature. If moving and stationary machines have identical workings temperatures, then influence of thermal growth it is possible to ignore. Otherwise, it is necessary to conduct an alignment till machines will cool off after a shutdown, or it will be necessary to take into account the difference of temperature growth coefficients. At determination of temperature growth factor role it is needed always to check following:
Working temperature of both machines
Temperature coefficient for both machines
Influence of surrounding heat sources at machine, including machines and mechanisms isolation, external heat sources, action of the cooling systems.[4]
The coefficient of linear thermal growth calculates on a formula (1):
TL
LX
0
(1)
Where, X - coefficient of linear growth ( C0 ); L - specimen length change at heating or cooling; 0L
- specimen
length at a room temperature; T - difference of temperatures (
C0 ), which the specimen length change is measured for.
4. Centrifugal pumps vibration
Thermal growth of centrifugal pumping unit components straight influences on a vibration. If at an alignment thermal growth is not taken into account or make a wrong calculation one, in that case takes place vibration level increasing, both at general level measuring and on informative frequencies. At general vibration level measuring it is possible only roughly to judge about the unit condition. In an order to expose a concrete defect, it is necessary to measure a direct spectrum and envelope spectrum of vibration and conduct the analysis of informative frequencies of pumping unit. Mainly, at rotation machinery vibrodiagnostics informative frequencies of bearings are analyzed.
Rolling bearing’s work in centrifugal pump composition and at presence faults in it can influence on a vibration and modulating it processes with the followings fundamental frequencies:
Rotation frequency of movable ring in relation to immobile: rotf ;
Rotation frequency of separator in relation to an outer ring:
cos1
2
1
r
srrotr d
dff ; (2)
Where: srd - solid of revolution diameter;
inoutr ddd 2
1 - Diameter of separator;
outd - Diameter of outer ring;
ind - Diameter of inner ring;
- contact angle of bodies and rolling paths;
Rolling frequency of solid of revolution on an outer ring:
zfzd
dff r
r
srrotout
cos1
2
1 ; (3)
Where: z - solid of revolution number;
Rolling frequency of solid of revolution on an inner ring:
zffzd
dff rrot
r
srrotin
cos1
2
1 ; (4)
Rolling frequency of solid of revolution in relation to the surface of rings:
2
2
2
cos12
1
r
sr
sr
rrotsr d
d
d
dff ; (5)
Expressions (Eq.2, Eq.3, Eq.4, and Eq.5) are evaluating only basic harmonics frequencies in the vibration spectrums and envelope of its high-frequency components at the different types of defects. [5]
5. Conclusion
Compensation of thermal growth is a very important factor which must be taken into account at the shaft alignment of centrifugal pumping unit. This value influences not only on shaft alignment quality, but also on the vibration level, and also on the capacity of the unit. During pumping unit operation there almost always is a difference in a temperature between a pump and electromotor. In order that it is correct to define the value of thermal growth, it is necessary to conduct regular temperature control of the pumping unit components, take into account the operation conditions and pumping liquid description. Also at vibration control it is necessary to conduct the analysis of spectrums before and after an alignment.
6. Literature
1. http://www.darwin-pumps.ru/pdf/ctlg_dk_dkb_dkl.pdf 2. www.tapflo.lv/lv/.../Industrial_centrifugal_pumps_br_
web_LV.pdf 3. Михайлов А.К., Малюшенко В.В.Лопастные
насосы. Теория, расчет и конструирование. – Москва: Машиностроение, 1977. – 288 с.
4. Measurement and alignment systems «Easy Laser». Manual 05-0100 Rev.7// Damalini AB, - 2005.p. A2-F8.,
5. Барков А.В., Баркова Н.А., Азовцев А.Ю., Мониторинг и диагностика роторных машин по вибрации. – Санкт Петербург: Изд. Центр СПбГМТУ, 2000. -159с.
60

THE EFFECT OF MICROSTRUCTURE OF COMMERCIALLY PURE COPPER ON TRIBOLOGICAL PROPERTIES
ВЛИЯНИЕ МИКРОСТРУКТУРЫ ТЕХНИЧЕСКИ ЧИСТОЙ МЕДИ НА ТРИБОЛОГИЧЕСКИЕ
СВОЙСТВА
Leader Researcher, dr. eng. Semenov V.I.1, Assoc. Prof., dr. eng. Huang S.-J.2, Prof., dr. Shuster L.Sh.3,
Assoc. Prof., dr. eng Chertovskikh S.V.4, Assoc. Prof., dr. eng Faizova S.N.5, Ph.D student Lin P.-Ch.6 Institute of Physics of Advanced Materials1,5, Faculty of Aviation Technical Systems3,4 - Ufa State Aviation Technical University, Ufa, Russia; Department of Mechanical Engineering2,6 - National Taiwan University of Science and Technology, Taipei, Taiwan
Abstract: The paper reports the results of tribological investigations performed on commercially pure (CP) Cu in triboconjunction with the tool steel R18 and graphitiferous material. The investigated material was in two structural states: initial (annealed) state and state after severe plastic deformation (SPD) by equal-channel angular pressing (ECAP). As a result of the preliminary investigations it was established that in the whole investigated temperature range in case of grain size decrease there is a significant growth of normal stresses on the contact predetermined by the increase of strength of the investigated material (Cu) and a decrease of the full and adhesive component of friction coefficient. The lowest values of full friction coefficient and adhesive component of friction coefficient (strength of adhesive bonds) are demonstrated by material processed by ECAP. Consequently, the full friction coefficient, strength of adhesive bonds and the adhesive component of friction coefficient are structure sensitive parameters. KEYWORDS: COMMERCIALLY PURE COPPER, SEVERE PLASTIC DEFORMATION, EQUAL-CHANNEL ANGULAR PRESSING, MICROSTRUCTURE, FRICTION COEFFICIENT, ADHESIVE COMPONENT OF FRICTION COEFFICIENT.
1. Introduction It is known that harder materials provide less wearing and friction coefficient [1]. For alloys in most cases there are various ways for increase of hardness by means of thermal treatment [2]. However for many pure metals and low-alloyed alloys thermal treatment with the view of hardness increase is inefficient. For such materials there are applied different ways of chemical-thermal [3] and surface plastic deformation [4], which allow increasing strength of the surface of processed materials. The drawback of such techniques is a relatively small depth of the strengthened surface layer that is why they can be applied only as finish treatment for relatively simple and low-loaded details of triboconjunctions. There are known works on estimation of influence of structure condition on tribological properties of copper [5], and also of phase composition and microstructure of tool carbon steel on its tribological properties [6, 7]. In works, devoted to the studies of steels tribological studies were performed on materials with various ways of thermal treatment, which caused changes of microstructure and phase composition of the material. As of today there is developed a technology of efficient and multiple increase of strength with retention of high technological ductility, based on the severe plastic deformation techniques (SPD), which allows producing high-strength bulk billets out of metallic materials [8]. One of the SPD techniques is equal channel angular pressing (ECAP) [9], effected in several deformation cycles. The essence of this technique of material strength increase is the maximum refinement of grain structure to submicrocrystalline and nano sizes [10]. SPD techniques allow considerably increasing the sphere of application of commercially pure and low-alloyed alloys. Therefore a great scientific and practical interest is attracted to complex comparative tribological studies of materials in various structure condition. At present a great interest is given to complex studies of nanostructured copper and copper-based alloys [11]. One of the most promising spheres for innovation application of these materials is high-speed railways. Due to the increase of speeds of railway transport a big attention is given to studies of tribological parameters of a current collector with a contact wire [12].
2. Methods and materials of investigation The object of investigations was commercially pure copper M1 in the annealed (coarse grained) and submicrocrystalline (SMC) conditions after 8 cycles of severe plastic deformation (SPD) by
equal channel angular pressing (ECAP) at room temperature with rotation of the billet around the longitudinal axis by 90° after every cycle. The ECAP scheme [13, 14] is represented in fig. 1. The channel intersection angle made 90°.
Fig. 1. Schemes of one of the SPD techniques – equal channel angular pressing (ECAP): 1 – die; 2 – punch; 3 – billet. For calculation of the accumulated strain degree the following formula was used [13, 15]:
ε = N 3
)2/(2 ctg , (1)
where N – the number of cycles of deformation processing; φ – channel intersection angle. For tribological studies there were used two schemes, represented in fig. 2.
a) b)
Fig. 2. Schemes for tribological investigations: a) 1 – lower sample (graphitiferous plate); 2 – upper sample (copper); 3 – chuck; b) 1 – tested samples; 2 – spherical indenter; 3 – cable; 4 – disk groove; 5 – current conductor line; 6 – electrical insulating spacer.
61

The first scheme with reciprocal motion (fig. 2, а) was used for assessment of the friction coefficient in the couple “commercially pure copper – graphitiferous plate EK-40”. The testing conditions were the following: normal load Р made 80 N, relative sliding speed – 0,1 m/s, time period of every test – 60 min. Normal load was chosen basing on the conditions of maximum force of holding of the contact wire to the graphitiferous current collector on a railway transport. The test speed regime was predetermined by the possibilities of the used tribometer. The time was set basing on the experience of performance of similar tests. The tests were performed at room temperature. The second scheme (fig. 2, b) was used for assessment of shear strength of adhesion bonds and the molecular component of the friction coefficient in the contact couple “commercially pure copper – tool steel R18». With this view there were prepared disk-shaped samples with the diameter of 20 mm and a thickness of 5 mm out of commercially pure copper, and a spherical indenter with the sphere radius of 2.5 mm out of steel R18. The tests were performed at the temperatures of 20; 150; 250 and 450оС on a one-ball adhesion tester [16]. The basis of this technique was a physical model, which at a first approximation reflects the real conditions of friction on a local contact. In accordance with this model, the spherical indenter 2 (imitating single asperity of the contact spot of the friction solid bodies), compressed by two plane-parallel samples 1 (with high precision and purity of contact surfaces) rotates under load around its own axis. The force F, spent on the indenter rotation and applied to the cable 3, in the groove of the disk, is connected mainly with the shear strength τnn of adhesion bonds. With the view of application of this technique in conditions of increased temperatures of the contact there was developed and fabricated a special equipment, allowing performance of electrical contact heating of the contact zone (through conductor lines isolated by insulating spacers from the frame). The initial roughness of contact surfaces of the tested samples and indenter in both testing schemes made 0.06 – 0.16 μm by the Ra scale. The roughness of copper samples was measured on a profilometer – profile recorder SE-3500K 2D-3D.
The shear strength of adhesion bonds n (МPа) was determined
from the ratio:
,
2
75,0 3
2,1
d
Mn
(2)
where d1,2 – diameters of indents on the tested samples, mm; М – moment at indenter rotation, N mm. The adhesion (molecular) component of the friction coefficient was determined as:
r
пM р
f
, (3)
where pr – normal pressure, МPа
22,1
2π
d
Ррr
(4)
where Р – compression force of samples, N. Prior to performance of tribological tests by the first scheme (fig. 2, а) and after them there were performed hardness measurements H on the Micromet-5101 machine under the loading of 0,98 N with holding under the load for 15 s.
3. Investigation results and discussion
3.1. Investigation of structure and microhardness As a result of the microstructure studies of copper samples in the annealed and deformed conditions (fig. 3) it was established that the average size of grains in the annealed commercially pure copper
makes about 80 μm, and after 8 cycles of SPD by ECAP there is formed almost equiaxed SMC structure with the average grain size of 0,22 μm.
a) b)
Fig. 3. а) – initial (annealed) structure of commercially pure copper in the as-received condition (average grain size 80 μm ); b). – submicrocrystalline structure of commercially pure copper after SPD (TEM, average grain size 0.22 μm). Microhardness measurements on samples with various microstructures before and after tribological tests are represented in table 1. Table 1.
Values of microhardness of the investigated material in the annealed and deformed conditions before and after tribological
tests
Material Before test After test
M1 (99.9% copper) 120.9 125.1
M1 (99.9% copper) ECAP 8 passes 141.9 145.0
As it is seen from table 1, the deformed material has higher microhardenss than the annealed one. Moreover, it was noted that after friction interaction the microhardness of the friction surface increases, though insignificantly, in both cases. 3.2. Tribological studies 3.2.1. Assessment of friction coefficient The results of tribological tests by the first scheme (fig. 2, а) in the friction couple “commercially pure copper – graphitiferous plate EK-40” are represented in fig. 4.
Fig. 4. Dependence of the friction coefficient on the friction way: 1 – copper in the annealed condition (coarse grained); 2 – copper with a SMC structure after SPD processing by ECAP technique. As it is seen in the represented graph, the friction coefficient values of the annealed samples (1), are higher than those of the samples with a SMC structure (2). Also it was noted that in samples with a coarse-grained structure the friction coefficient almost does not change during the whole testing period. The samples with a SMC
62

structure demonstrate a tendency for a slight decrease of friction coefficient. This fact can be explained by the increase of strength of the samples after deformation processing by means of grain structure refinement and the significant development of grain boundaries, which contributes to activation of grain boundaries and increase of diffusion interaction of copper with the carbon of the graphitiferous material. This assumption requires further investigation. 3.2.2. Assessment of shear strength of adhesive bonds and molecular component of the friction coefficient On the basis of analysis of the obtained investigation results, represented in table 2, it was established that with the decrease of the grain size within the whole investigated temperature range there is observed a considerable growth of normal stresses on the contact, predetermined by the increase of strength of the investigated material (commercially pure copper), and also decrease of the adhesive component of the friction coefficient. The lowest values of shear strength of adhesive bonds and of the adhesive component of the friction coefficient fM is observed in the material with a SMC structure, subjected to SPD by ECAP technique.
Fig. 5 Dependencies of the molecular component of the friction coefficient a) shear strength of adhesive bonds b) normal stresses с) temperature on the contact in the friction couple “commercially pure copper – tool steel R18”: 1 – material in the initial condition (annealed, coarse grained); 2 – material with a SMC structure after SPD by ECAP. The performed studies prove the obtained earlier results [17]. In samples of commercially pure copper within the investigated temperature range the molecular component of the friction coefficient changes insignificantly in both structural conditions. In the annealed samples these values are slightly higher than in samples with a SMC structure. It follows that the strength of adhesive bonds and the adhesive component of the friction coefficient are structurally sensitive parameters. Table 2 represents results of tribological investigations of the commercially pure copper with various structure in contact with the tool steel R18.
Table 2.
Tribomechanical characteristics of commercially pure copper with different structure in contact with tool steel Р18
Material condition
Normal stresses on a contact, pr, МPа Adhesive component of the friction coefficient, fАTemperature, оС Temperature, оС
20 150 250 450 20 150 250 450 1. Cu(annealed) 1060 1020 940 940 0,110 0,110 0,115 0,115 2. Cu(SMC) 1480 1360 1200 1140 0,085 0,085 0,090 0,090
4. Conclusion
There was established a dependence between the friction coefficient and the way of friction in the couple “graphitiferous material – tool steel R18” for a material in various structure conditions. From these dependencies it follows that tribological contact parameters are structurally sensitive characteristics. It was established that the investigated material with a SMC structure has lower values of both the friction coefficient and the molecular component.
6. References:
[1]. S.N. Faizova, R.Z. Valiev, G.I. Raab, N.V. Mazhitova, D.A. Aksenov, E.A Sarkeeva Development of SPD-based manufacturing technology of high-strength nanostructured copper-rich alloys for electrical applications// Proceed. of 2nd Int. Symp. “Bulk Nanostructured Materials: from fundamentals to innovations”, BNM-2009, USATU, 22-26 September, 2009, Ufa, p. 57-59.
[2]. Kirshenbaum V.Y. Mechanical-thermal formation of friction surfaces. Moscow: Mashinostroenie Publ., 1987. 230 p.
[3]. Belyi A.V., Karpenko G.D., Myshkin N.K. Structure and methods of formation of wear-resistant surface layers. Moscow: Mashinostroenie Publ., 1991. 208 p.
[4]. Odintsov L.G. Hardening and finishing of the workpieces by means of plastic deformation: Handbook. Moscow: Mashinostroenie Publ., 1987. 327 p.
[5]. Rybakova L.M., Kuksenova L.I. Structure and wear-resistance of metals. – Moscow: Mashinostroenie Publ., 1982, 212 p.
[6]. Pearlite in the carbon steels / V.M. Schastlivtsev, D.A. Mirzaev, I.L. Yakovleva, et al. Yekaterinburg: Ural Branch of RAS, 2006. ISBN 5-7691-1713-3.
[7]. Schastlivtsev V.M., Zeldovich V.I., Mirzaev D.A., etc. The development of the ideas of Academician V.D. Sadovskiy. Proceedings. Yekaterinburg, 2008. ISBN 5—900474—58—5
[8]. Valiev R.Z., Aleksandrov I.V. Nanostructured materials produced by severe plastic deformation. Moscow: Logos Publ., 2000. 272 p.
[9]. Raab G.I., Valiev R.Z., Equal channel angular pressing of long-sized billets. Nonferrous metallurgy -2000 –No.5, pp.50-53.
[10]. Equal channel angular pressing of metallic materials: achievements and development trends (special issue guest-edited by V.M. Segal, S.V. Dobatkin, R.Z. Valiev)//Rus. Metall. (Metally) 2004, Nos. 1, 2.
[11]. S.N. Faizova, R.Z. Valiev, G.I. Raab, N.V. Mazhitova, D.A. Aksenov, E.A Sarkeeva Development of SPD-based manufacturing technology of high-strength nanostructured copper-rich alloys for electrical applications// Proceed. of 2nd Int. Symp. “Bulk Nanostructured Materials: from fundamentals to innovations”, BNM-2009, USATU, 22-26 September, 2009, Ufa, p. 57-59.
[12]. Shakhvorostov D., Jian L., Nold E., Beuchle G., Scherge M. Influence of Cu Grain Size on Running-in Related Phenomena. Tribol. Lett., 28, 307–318 (2007).
[13]. Segal V.M., Reznikov V.I., Drobyshevskiy A.E., Kopylov V.I. Plastic processing of metals by simple shear //Proceedings of the USSR Academy of Sciences. Metals. 1981. No. 1. pp. 115–123.
63

[14]. R.Z. Valiev, Y. Estrin, Z. Horita, T.G. Langdon, M.J. Zehetbauer, Y.T. Zhu Producing bulk ultrafine-grained materials by severe plastic deformation//JOM-2006. 58, No4, p33.
[15]. Segal V.M., Reznikov V.I., Kopylov V.I. et al. Processes of plastic structuring of metals. Minsk: Nauka i tekhnika Publ., 1994. 232 p.
[16]. Shuster L.Sh. Adhesion interaction of metal solids. - Ufa: Guilem Publ., 1999. 198 p.
[17]. Semenov V.I., Shuster L.Sh., Chertovskikh S.V., Raab G.I. Influence of the complex parameter of plastic frictional contact and material structure on the strength of adhesive bonds //Friction and wear. 2005. Vol. 26. No. 1. pp. 74 – 79.
________________________________________________ The work was carried out within the frames of the joint Russian-Taiwan project No 11-08-92001 HHC_a, supported by RFBR, jointed with project NSC 100-2923-E-011-003-MY3 by NSC of Taiwan.
64

INVESTIGATION OF WEAR BEHAVIOUR OF HARDFACE CLADDINGS REINFORCED BY FERROCHROMIUM AND FERROBORON POWDERS
PhD Student Nilay YÜKSEL
Докладът не е получен в срок. The paper isn't received in time!
65

ERGONOMIC REQUIREMENTS AND FURNITURES SPECIALITY OF CLASSROOMS
M. Sc. Dobreva D. Ph.D. student1, M. Sc. Vachinska S. Ph.D. Eng.2
Technical University of Varna, Bulgaria
Abstract: The report examines the most important aspects in the furnishing of classrooms in the context of modern ergonomic requirements. Object of the study are furniture and tools in an academic learning environment. Classroom is a workplace for both students and teachers. It may be a risk factor that can affect human health and work ability of participants in the process. Improper arrangement of furniture may cause the staff to: suffer injuries, feel fatigue in certain muscles, lose concentration, reduce speed and quality of their work, developing musculoskeletal disorders from awkward postures, etc. Measurements were made and equipment in the classrooms is analyzed. The results are described and summarized in the report. In order to enhance the retirement age, health care of people seen through the ergonomics of the furniture of their jobs is a current topic nowadays.
Keywords: ERGONOMY, FURNITURE, CLASSROOMS
1. Introduction Youth's education is a basic concern of the contemporary
society. In the nowadays technological world, awareness and the knowledge reserve are important for the future development of growing young people. Undoubtedly, the way to knowledge is related and passes through the school benches and the university desks.
Subject of the present research is the furniture and the implements in an academic classroom. The term „implement“ we shall use to designate all implements necessary for the training – о aids, items, furniture – a chair, a table, a cupboard, a black board, multimedia, computer etc. [1]. All they show considerable influence on concentration, perception and reproduction of the educational material from the training process.
A classroom appears a working place for students and their lecturers. The equipment in those room can be a crucial factor which could influence the health and the performance of the persons participating in the educational process. Upon incorrect choice and arrangement of the working furniture, the following problems may appear: Loss of concentration; Starting of fatigue and weakness; Distraction or need of changing the environment; Reduced quality and speed of work; Injuries on sharp edges or worn surfaces and/or elements
(bolts, nails, clout-nails, wooden particles etc.); Injuries from narrow passages, non-designated edges of
podiums and stairs, from insufficient space for body extremities etc.
All those factors have complex causers. In this report we will only take a look at the comfort and, respectively, the discomfort of used furniture and the equipment in a conventional classroom..
The produced work is part of a larger research for the ergonomics of a classroom and its influence on the training process, funded by the „Scientific researches“ Fund after contract DMU 03/99 from the „Young scientists-2011“ contest.
The report considers the most important aspects upon furnishing of classrooms with a view to modern ergonomic requirements. Attention is paid to the type of used furniture and their attitude to anthropometric indicators of students. Concerned is the moment of safety from point of view signalling or securing of hazardous edges, angles, providing of sufficient width of transport hallways, analysis of the psychological influence of the arrangement of furniture etc.
2. Peculiarities of the furniture in an academic classroom
Each educational institution is proud of its history, paying the deserved tribute to its founders and ancestors, and marking with pride all its anniversaries. This year, the Technical University – Varna marks its 50th anniversary. Undoubtedly, past year have had their influence on the furniture of classrooms. Fig. 1 and fig. 2 show images of classrooms for lectures and seminars. Traditionally, all „working“ places of the students are directed to the white, green or still black board.
Fig. 1. View of a conventional lecture room
It is obvious that throughout the years, wooden benches, desks and tables have lost even their good appearance and need renovation.
Fig. 2. View of a conventional classroom for seminars and laboratory
classes for general engineering disciplines
An auditorium is the place where students spend most of their time during the educational process. Average daily, they spend between 6 and 8 class hours in there. This makes between 4 ½ and 6 astronomic hours. There they listen to lectures, participate in seminars and laboratory exercises, making certain movements for writing, drawing, connecting, measuring etc. In this relation, the hall auditorium appears working place for students and their lecturers.
As per Runge and Manusevich [2] the working place is related to part of the space, where one implements his working activity and spends most of his working time. As per both of them, it is the smallest whole unit of performance and life functions in which there have been three basic elements present: object, means and subject of work. In our case, we determine notebooks, handbooks and textbooks of students as object. Means are the various methods and approaches for demonstration and studying of technical knowledge accumulated by future engineers. Subject of work appears the man– himself, trained with all physical and psychological restrictions, specific for the individual.
66

During the most of the educational process, students don't have the possibility to move their bodies and they occupy a definite immobile posture. In most of the cases this posture is sitting. It was so far believed that this was the best posture for work [3], but the latest trends in the design of working environments and processes prove the need of change. More and more researches prove that less physical energy is lost in standing posture work. The possibility for easy change of the working posture not only gives a chance for working, but also acts psychologically calming in the working person, so that he decides what posture to occupy without being imposed any restrictions [4]. For the purposes of this research measured were the sized of the basic furniture for sitting and work (chairs, tables, desks, benches) in two lecture rooms and seven classrooms for laboratory and seminar exercises. Two of the auditoriums have had renovated tables, two of the auditoriums have had desks for computers, purchases within the last 3-7 years. In two of the auditoriums, chairs have been purchased within the last year.
Use of computers in any field of activity is not a novelty but a practical need. Fig. 3, 4 and 5 show solutions for classrooms where computers are used. An important requirement upon furnishing is providing of minimum 90 cm transport hallway for movement to and from working place. Upon arrangement of the tables/desks in several rows, the distances between them must also be not less than 90 cm. This size is also complied with the requirement for accessibility of the environment for people with disabilities. The discomfort observed in fig. 5 is the lateral situation of the blackboard towards thew working places. This arrangement is only allowed for short periods (10 – 15 min.) of use of the blackboard. Otherwise, turning the head at more than 20˚ awry, falls withing the danger – red zone for working movements and has to be avoided or to seek for possibility for another posture or another working organization [5].
Fig. 3. View of a classroom with computers – with one wide central
transport hallway
After analyzing the sizes, the type and the materials composing the tables in computer labs, it becomes clear that everywhere they have adjustable height. In some places, there lacks a lower platform for keyboard, and where it is present – it is not used. Part of the monitors don't have the possibility for adjustment of the height of the screen, but all of them have the possibility for adjustment of the tilting angle for good visibility of the user. Chairs are wooden, not upholstered, or of „visitor“ type.
Fig. 4. View of a classroom with computers – with two lateral transport hallway
Fig. 5. View of a classroom with computers situated around a central
straight line Part of the analyzed furniture has a need to be renovated or refurbished. The podium in front of the blackboard has to have a clearly visible edge. Furniture situated too close to each other create a suppressing feeling and increase the risk of injury. It has been proven that the seat has to be upholstered in order to not impede blood flow of the lower extremities. The back has to be propped in the lumbar area, and the working surface has to be at the level of the elbows bent at a right angle.
Interior, as an entirety of object – space environment influences the psychophysiology of human perceptions:
• hearing – perception of a live speech and information from technical media;
• vision – perception of information and colours; • tactile sense – sense for matters and materials upon touch. Upon poor hearing, poor vision and unpleasant feelings upon
touch, one intuitively seeks for a change, desiring to change his place or loses concentration of his actions. He can be injured or to make his presence in the classroom senseless.
As per Pisareva [6], a designer has to put an accent of his attention towards the area, the shape, the arrangement and the lighting of a classroom. Her opinion is that the development of technologies conditions the changes in the functional and visual building of the furniture.
The colours in the interior also influence the overall perception of the environment. Of interest is the fact that working surfaces are wooden or made of wooden particles, and their colour resembles the natural colour of timber. The composition interactions of the colour with the furniture can help or affect the educational process. With well selected colour solutions one influences the perception and human self – feeling [7]. Creation and arrangement of shapes in one working environment is based on „The great theory of beauty“, created by ancient Greeks. It is founded on the order and the proportions which are the skeleton of a composition in contemporary design. The combination and application of this knowledge through building of a project culture [8-10], favours the efficiency of the educational process and can increase the motivation of the persons participating in it.
Fig. 6 shows images of used chairs, and fig. 7 shows the schemes of measurement. Dimensions are taken in a straight line, without exerting pressure on soft parts of the chair and without reporting the curve of the backrest. All dimensions are reported on the axes of symmetry of the specific geometric shape and are presented in table 1 and table 2
Chair-1-not upholstered
Chair-2-upholstered Chair-3-„visitor“ type
Fig. 6. Images of commonly used chairs in classrooms
67

„Chair“ diagram „Table“ diagram Fig. 7 Scheme of measurement of the dimensions of the equipment
Table 1: Dimensions of commonly seen chairs at the Technical university– Varna
Dimensions as per „Chair” type
Chair-1 Chair-2 Chair-3 Desk
backrests 1 [mm] 420 430 470 460 2 [mm] 390 370 470 480 3 [mm] 360 380 410 450 4 [mm] 225 240 330 200 5 [mm] 400 370 480 3890 * 6 [mm] 550 560 520 540
* Desks' backrest is one per 7 seats
Table 2: Dimensions of commonly seen tables, desks and benches at the Technical University – Varna
Dimensions as per„Table”
scheme
Table for 1
Drafting table
Table for 3
Desk Bench
А [mm] 740 780/860 ** 780 740 795/830 ** Б [mm] 720 760/840 ** 760 640 815/850 ** В [mm] 1200 1300 1800 1200 3890 Г [mm] 750 (700*) 900 790 590 325
* Dimension in the middle of the curved part of the table
** Dimension in the beginning and at the end the tilt of the table surface
Where there is not enough space for free movements of the
extremities, the quality of the performance is deteriorated, because one starts feeling claustrophobia. If soft tissues are pressed, and blood flow is impaired in them, there may occur limb numbness, headache and fit.
Upon incorrect and irregular leaning of the back in “sitting“ posture, spine curvature appears, as well as back pains, changes in the discs between the spinal vertebrae, pressure of the nerves (discopathy) etc.
Table 3 shows basic anthropometric indicators as base dimensions for assessment of furniture with the physical parameters of people. Data relate to the smallest, average and largest man or woman, and have been taken from BSS 15592:1982 and BSS 15591:1982. The places of the dimension indicators are presented in fig. 8.
Table 3: Dimensions of P5, P50 and P95 for men and women from BSS 15592:1982 and BSS 15591:1982
: Indicator Dimensions are in mm
Women Men P5 P50 P95 P5 P50 P95
36: height of 3th lumbar vertebrae
168 198 227 178 204 234
37: popliteal height 369 402 439 407 450 494 38: elbow height 218 252 288 226 262 295
40: knee – floor height 444 485 529 488 531 577 41: hip thickness 118 140 170 118 138 161 44: sitting depth 436 474 518 444 481 524
45: width of leaning until the knee
526 570 621 545 592 640
50: bottom width 314 368 424 302 341 383 51: elbow width 359 422 496 388 454 519 52: knee width 158 188 233 164 188 222 53: hip width 328 374 429 299 333 375
Fig. 8 Anthropometric indicators of a man in „sitting” posture
As per the requirements for ergonomics, working furniture is desirably to be adapted as per the anthropometric and physiological indicators of students with the purpose of providing comfort, security and safety. It is necessary to provide preconditions for increase of the performance, the aesthetics and the modern appearance during the educational process [11].
3. Results and discussion
Furniture measurements show that their dimensions do not comply with the individual properties and anthropometric characteristics of each single student. Fulfillment of this conditions is of extreme difficulty because dimensions of individuals are absolutely not uniform. That is why, more and more manufacturers offer adjustable furniture. For instance, chairs with a possibility for individual adjustment of the sitting level, height and the tilt of the backrest etc. Offered are also desks/tables with possibility to adjust the level of the surface height.
The good look of the surrounding working environment favours the motivation to work. The correct arrangement of furniture, their appropriateness and safety are part of the care of the health of people. Due to the growing threshold of retirement age, each manager should pay attention to the working conditions and the comfort at the working place with a view of providing quality of life and preconditions for continuous performance. This way would prevent pains and injuries in muscles and joints, known as musculoskeletal disorders (MSD).
The furnishing of a class hall has to be complied both with the contemporary conditions for organization of a quality educational process (using implements – computers, multimedia projector, interactive board), and with individual indicators of students. In order to have an academic and complete educational process, a working place has to cover the following requirements:
providing of necessary space (for hands, legs, place for sitting) of the studying person, regardless of his/her height;
possibility for occupying a safe and suitable working posture – sitting with propped waist, or standing without bowing at more than 30˚ forwards;
providing of sufficient lighting of the working surface of 500 lx, and avoiding of glare and reflections in the monitor;
providing of space for teamwork – round tables or arrangement of the desks around one centre;
possibility for matching of the equipment with the anthropometric characteristics of people – adjustable chairs, table surfaces, level of monitors etc.
The expectations of the specialists in the near years are related to the mass integration of interactive technologies in the educational process. This could change not only the furnishing itself, but also the way of training, because students will be able:
68

to quickly, easily and accessibly find information on a given topic;
to communicate with colleagues of other universities; to be educated through teamwork in real time; to visualize the educational material through virtual
laboratories etc.
4. Conclusion
In conclusion, we can mark that the dimensions of the furniture do not correspond completely to the individual needs and the anthropometric characteristics of each single student. This we explain with the acceleration in the last years, one hand, and the lack of profound studies concerning the anthropometric characteristics of young men and women, on the other hand. This issue should be paid special attention, as furniture and interior appear an important part of the studying environment which is also working environment for students themselves.
Our opinion is that the ergonomics upon furnishing will increase the motivation for attendance of lectures and exercises, as well as it would increase the interest in studied subjects and will positively affect the professionalism and quality of future engineering staff.
In order to cover ergonomic requirements, working space of students has to be sufficient for:
possibility for making working movements with a view to the needs during the needs of the educational process – writing, drawing, seeking information in implements, work with computer etc.;
maximum perception of information from a visual source, presentation from multimedia, a large TV screen etc.;
change of the working posture: upon carrying out presentation – from sitting into standing posture, upon implementation of tasks – drawing or writing etc.
An ergonomic working place is a combination of correctly selected furniture, comfort microclimate and calm psychological environment. Upon designing of ergonomic furniture, designers have to take into account anthropometric, physiological, clinical and age characteristics of students. This way will increase the efficiency of the working process and will reduce the fatigue in students. The quality of training will be improved.
The conclusions and the recommendations which we can do, are as follows: it is recommended to use adjustable furniture (chairs,
tables/desks) with a view to the possibility for individual adjustment by each user as per their anthropometric peculiarities;
it is necessary to take into account the factors like noise, lighting, colour combination upon arrangement of a classroom with the purpose of reducing the stress and providing a more effective educational process;
the provision of ergonomic furniture and equipment helps both for the prevention of occupational diseases like spinal curvatures, discopathies, and for reducing the performance .
The recommendations and conclusions made are topical for the ergonomics and are useful and applicable upon furnishing of classrooms and implementation of the educational process.
5. References
[1] Добрева, Д. Етномотиви в училищните пособия, // II Международный научный симпозиум, Москва, 2012, стр. 330
[2] Рунге, В. Ф., Манусевич, Ю. П. Эргономика в дизайне среды. Москва, 2009
[3] Национален съвет по ергономия и промишлена естетика, Основи на ергономията, Том 1, София, 1972
[4] Въчинска С., З. Цонева, Каква работна поза да изберем - Седяща или Стояща?,// Научни трудове на РУ, Том 49, Серия 1.1, Русе, 2010, стр. 108-113
[5] Въчинска С., Подходи за предотвратяване на вредни работни пози в шевната промишленост,// Общотекстилна
конференция‘2011 – Иновации в текстила и облеклото, сп. Текстил и облекло 1/2012, София, стр. 2-7
[6] Писарева, Е., Гъвкавост на учебната среда// Списание ДМТ, 2005, 5
[7] Дойчинов, Й., Цвят и взаимодействие между категориите на композицията при различна степен на активност на пространствената структура.// Научна конференция на РУ// Научни Трудове Том 40, серия 2, Русе, 2003, стр. 105-109,
[8] Дойчинов Й., К. Узунов, “Модерните” пропорции.// Научна конференция на РУ, Русе, 2011, Том 50, серия 1., стр. 151-155,
[9] Конов, Цв., К. Узунов, Й. Дойчинов, Виртуалното формообразуване и композиционно формоизграждане като елемент от дидактична технология // Научни Трудове Том 44, Допълнително издание, Русе, 2005, брой 1, стр. 154-157
[10] Узунов К., Промишлен дизайн – въведение в обучението по проектна култура.// Научна конференция на РУ, Русе, 2005, Том 44, стр. 206-211
[11] Добрева, Д., Ergonomic issues of school furnishing.// First International Scientific-Practical Conference of the Latvian Ergonomics Society, Riga, 2011 The present article has been developed with the help of project DMU 03/99 „Innovation and ergonomic assessment of educational environment and its influence on the efficiency of the educational process and the human physiology during the training process“ funded by the FNI after the „Young scientists-2011“ contest.
69

THE THIRD TEACHER: NEW APPROACH TO DESIGN OF EDUCATIONAL ENVIRONMENT FOR CHILDREN
M.Sc. Eng. Designer Donika Nikolova, PhD student at Technical University-Sofia
Department of Engineering Design
Abstract: The paper considers children needs, how they learn, what they should learn through the different stages of their development and how the design of educational environment should respond to their needs. Based on the new learning concepts, culture and climate, the new approach is discussed. Various aspects of school physical environment are analysed and new design concepts are presented. The topic examine real issues and approaches for planning an optimal learning environment, that is consistent both with children and the specifics of various educational concepts and processes.
Keywords: EDUCATIONAL ENVIRONMENT FOR CHILDREN, LEARNING ENVIRONMENT, CHILD DEVELOPMENT, LEARNING CONCEPTS
1. Introduction
Children are not small adults, they are in a continual process of growth and development. They need to realize who are they, what is their world and how to influence it. Children learn all day, not only from their parents and teacher, but throw active interaction with their physical environment. It is proved that inappropriate environment not only promotes the development of children, but may delay it. For this, optimal environment is crucial for cognitive, psychological, physical and emotional development.
2. From traditional to new educational approach
Children spend most of the day in educational institutions and is appropriate to question today learning environment “Is it adequate? Does it meet the needs of children, teachers, educational process and contemporary research?” In fact, most of the schools not only in Bulgaria are build with identical classrooms, that still follow the layout created in 19th century – one teacher to 25-30 children, facing towards them and students sited in row of desks. This layout is created to place greater control over children and the size of the room is determined by the reach of teacher's voice. 19th century scheme, thoughtfully or not, suggests that children learn in the same way, at the same time, from the same person, in the same place and they learn better in isolation. This approach ignores the impact of physical environment on children and learning, and students are treated as one homogenous mass, not as individuals. But children are individuals, just like adults, and even if they are on the same age, some of them are more advanced in their development compered to others. It follows that the educational approach, respectively, the environment should be changed so as to meet the individual needs of children, because they learn in different patterns, different things, at different time, from different people and places.
19th century approach teach children to be disciplined, organized, productive, pragmatic, predictable, grateful - all qualities needed for the labor community, but not for today progressive time when we need to be creative, intuitive, flexible, good communicators and motivators, with collaborative skills and diverse knowledge. We need to rethink the traditional approach, respectively, the learning environment in order to adequately meet the need of 21st century.
3. Preschool age – needs, learning patterns, effective learning environment
Spaces in the kindergartens are more than a “containers” for social interactions, experience and education ( Gandini, 1998). Appropriate environment promote learning (for instance, round objects roll and can't stand one over another) and mastering of different activities (drawing, climbing on top, sipping water). Unfortunately, the reverse is also true. Poorly designed environment, which is not equipped with materials appropriate to the children age of children, can inhibit the growth and
development. Spaces in kindergarten affect cognitive and physical development through supportive or inhibited behavior.
Infants and toddlers (0-3 years) learn trough experience the environment by their senses. According to Piage's theory, this period of child development is sensorymotor stage. Children at that stage learn through touch, sight, hearing, taste and smell. The environment should reflect this and invite them to play with toys and available materials, to look around, interact and explore. They just realized that they could affect their world and want to learn about everything. Although children demonstrate independence they still need regular physical proximity, to feel safe. Since children spend most of the day away from their family and home, they need connections with their homes while creating new friendships and becoming part of larger community.
Children between age 4 and 6 years learn trough repetition and practice (preoperational stage according to Piage's theory). Preschool environment for these children should encourage representation of real-life situations, through toy kitchens, shops, banks and etc. While playing, children unconsciously prepare both for real life and for school subjects, as reading and math. If learning is not fun, it is not life long learning.
The organization of the space should encourage children to follow their interest, to give answers of their questions, to represent what is on their mind, and build healthy relationships and love of learning. Open shelves, which offer variety of materials will enhance the imagination of children and will meet their desire to rearrange and combine materials for experiment and discoveries. Furthermore, children need not only area for “messy” and noisy play, but also places for quite and restorative activities to calm and communicate with their friends.
Activity centers are excellent example of how design environment can influence behavior. For example, activity center designed for 4-5 children will cause interaction between children, while larger will not predispose them to group on small groups and play together. Activity centers can be separate by difference in floor level, while giving the children different perspective to explore the relationship between their bodies and space. Environment should be with appropriate scale.
Filling environment with things from natural world can activates the senses and sensibilities of those present. For example, replacement of plastic container for toys with baskets from natural materials, or replacement of plastic toys with wooden and textile ones, will create a completely different sensory experience.
Learning and literacy involves unlocking a system of symbols and codes, and there are many ways you can increase the experience of children with these processes. The most extensive world of symbolic representation is the visual arts. The provision of multiple materials will help children to explore the world, will encourage them to understand and express themselves using art materials, music, dance and theatrical expression. The variety of materials and
70

opportunities will support the development of “multiple intelligences”(Howard Gardner) or “hundred languages”(Reggio Emilia).
Atelier from Reggio Emilia School
Piazza from Reggio Emilia School
A successful approach to design of educational environment for preschool and primary school age children is a consequence of the pedagogical approach of Reggio Emilia. In the core of of this approach is the natural development of children and their close relation with the environment. It includes several key features of the environment:
1. Recognition- architectural language and atmosphere of the environment have an established identity
2. Horizontality – the horizontal plan of the school building emphasizes the conscious choice of not to create hierarchy among the different by function spaces. Horizontality is physical manifest for democracy of functions, equal status and sociality.
3. Piazza – presence of large connecting space in the center is consciously designed to eliminate corridors, as their function is subject only to the connection, guidance and their area is unusable for children's activities. Piazza, like city square, not only perform the connecting function, but also creates an environment for relationships, communication, interaction between children and adults.
4. Transformability and flexibility – learning environment should allow to be modeled and changed as a result of children and teacher experiments, during the day and year. Temporary transformations are made by movable furniture, screens, partitions, wall panels, etc. Permanent
ones are made by physical modification of the space, through additions to the main building and other technical systems.
5. Varied use of space- the group keeps its teacher but each year they switch their space. In this way each room is equipped for specific age, and children growth is more tangible for them.
6. Atelier – studio which compliments the functions of the classroom, whit out replacing it. Used for research, experiments, and work with variety materials.
7. School as workshop – while atelier is dedicated to investigation and experiments, the whole school is considered as a workshop for autonomous learning. Each space is designed according this and is equipped with materials encouraging exploration. It is important all spaces in the school to be accessible to the children to use them, including the kitchen and the offices.
8. School and community – the architecture and the design of the school environment should be in connection with the surrounding aesthetic and culture. School should be part of the community, not isolated.
9. Inside-outside relationship – another important element is the strong connection between inside and outside. School should “feel”what is going on outside – from weather to seasons change, from time to the rhythm of the town, simply because it exists at a certain place and time. Several elements strengthen the link inside-outside: filtering spaces (porches, sheds etc.); conservatories, interior courtyards with plants and other natural elements, hills, patios, installations which make visible the actions of physical forces, like wind, water etc.; an entrance who give information for the school and its work, space for welcoming.
10. Transparency – transparency does not exclude opacity and focus on providing sense of depth and perception of space. For example, providing visibility between rooms helps children gain a better understanding of the building structure and space or uncovered brick wall declares static role of each part and give positive value of each element.
11. Communication – communication is an essential tool for any activity involving research, exchange of ideas, discussions and also an important element of educational projects in preschool centers in Reggio Emilia. Parents are active participants in the educational process, which increases the need for large spaces inside and outside, and furniture for adults. The environment should be able to communicate the school life and children activities, for example with walls which could accommodate large displays with children works.
4. School age - needs, learning concepts, effective learning environment
New learning concepts are focused on lifelong learning, which is not isolated process that occurs only in the school, but continue with no time and space boundaries; just-in-time learning, which use curiosity as natural motivator for learning; project-based learning with real life projects involving collaboration, hands-on, research and production; problem based learning which include student as active problem solver; student centered learning, consider students as individuals and they should have greater choice
71

what, how and when to learn; collaborative learning requires interaction between peers; brain based learning requires conditions to support natural learning processes and patterns etc. All these concepts create a new learning culture, which requires consideration of the physical educational environment, its functions and impact on learning.
Significant part of the research on design of environment show that comfort has positive effect on learning, productivity and creativity. We need to go over the required minimum for comfort as temperature, humidity, ventilation, lighting etc., and to consider possibilities for more natural light in all rooms, child size windows with beautiful landscapes, operable windows for fresh air at any time, access to food and beverages through the day in a comfortable environment, comfortable seats and private spaces. The hierarchy of spaces and grouping them is one of the key aspect to achieving comfort and security. By providing spaces for different groups can reinforce a sense of belonging. For example: individual rocking chair or cubies for kindergarten to the private working station for students; areas for small groups and collaborative work; small learning communities of 100-150 students; educational camp of two
or more communities.
Individual spaces at Ordrub School Gentofte, Denmark
From traditional classroom to small learning community, www.designshare.com
The traditional classroom with fixed furniture and with little or no options for reconfiguration should be transformed to a more fluid and flexible space, in order to support the new learning concepts. It is needed to allow both arranging quite spaces for individual work and stimulating places for socializing and
collaborative projects. Movable equipment such as furniture, including storage furniture, movable screens and sound absorbing panels, presentation displays for daily work of students, not only perform their specific function but also help in the reorganization of space. Learning is more complex process than memorizing. It involves thinking, communicating, analyzing, doing, and other
activities, but the most lasting impression of learning is left by doing and failure. Failure get our attention, provoking emotions which are crucial for learning. Having atelier for creative work and experiments with direct access to the outdoors and outdoors learning spaces with protection from rain, sun, storage and power supply, will complement the classroom's functions and will give opportunity for learning by doing.
The layout of traditional school is build with identical classrooms and corridors, which may support the orientation and navigation, but does not contribute to the educational process. Corridors functions is only to connect the rooms and guide the flow and their area is unusable for children's activities. Often they accommodate lockers for students personal belongings. For several reasons, this is rather a coincidence than a deliberate design: in terms of function, it creates chaos when students at the same time want access to the lockers, the traffic flow is interrupted and because of the noise there are no possibility for communication; in terms of children's needs for territory and personal space, they are uncomfortable because when children are digging in their lockers they are backwards to the traffic flow and can't see who is behind them, but everyone needs to monitor who is coming and who is going; in terms of perception, when the corridor has lockers on both walls it is very dark and unpleasant. There is a concept for school without corridors, but with one space connecting all classrooms. This new space, like the town square, gives opportunity for meetings and interactions, and for displaying children's works. Places for personal belongings are organized in small family like groups, with open and closed shelves, and hangers like home
wardrobes.
Millenium High School, New York
Nowadays schools are becoming larger, which makes children fell into anonymity. As a result, the vandalism increased and the sense of belonging is reduced. According to some
72

anthropologists the critical size of one group to be cohesive is 60-70 persons. Malcolm Gladwell writes about learning group maximum of 150 people to function effectively. Based on these researches, the new approach suggests schools should be build from small learning communities with no more than 150 students. In Western Heights Secondary College in Geelong, Australia, decided to reate a flexible space for 100 children from the seventh grade, by removing the walls of the corridors and classrooms. By movable glass partitions and equipment, space can be organized as a single space or as separate spaces for each class or team working on a project. As space permits passive monitoring, the teacher can focus on individual work with one or more students and leave others to work independently on a project. This model not only avoid the anonymity of children, but also increase their sense of belonging, indirecly theaches responsibility and self-control. The results after reconstruction shows that the moral is raised from 17% to 80%, efficiency of teachers jumped from 20% to 87% and peer interactions increased from 20% to 85%.
Western Heights Secondary College in Geelong, Australia, small learning
community for 7th grade
Concept Diagram for small learning community of 125 students and five to six techers , wwwfieldingnair.com
We need to consider other school areas such as cafeteria, library, teachers working area, sports area and recreation, as well as the yard.
Cafeteria should be designed like these out of school, with variety of seats and groups arrangements. The aim is to avoid institutional look with long rows of tables and chairs.
The library must be available to children at any time and equipped with new technologies. As part of the concept for lifelong learning, the library should be available to adults too.
Theachers need a working space to prepare educational materials and for individual work with students. By imposing the individual approach to each student, theachers need at least 2 hours to prepare for the day.
Spaces for sport and active recreation, should provoke children while educate them for lifetime physical activity.
All people benefit from connection with nature. The yard can strenghten that connection with local trees and plants, with walking, jogging and cycling paths, fountains, benches and amphitheater for events or interactions. Installations which demonstrate the action of natural forces and equipment for renewable energy, not only familiarize the children with them, but make children more responsible users.
5. Conclusion
Spaces are ussually created with purpose or intention, whether visible or not. Each environment gives group of values or beliefs about people who will use the space and the activities to be carried in it. Intentionally or not, more or less, any environment affects people who use it. Educational environment can be an active participant in the educational process through its passive lessons. Consioucly designed, for the purposes of the educational process, it can provide the necessary climate and can stimulate learning.
Amphitheater at Scoth Oakburn College's Middle School
Educational Camp of four small learning communities School Bendigo Secondary Schools, www.fieldingnair.com 6. References 1. www.designshare.com 2. www.fieldingnair.com 3. Fielding, R., and P.Nair, The Language of School Design: Design Patterns for 21st Century, Designshare, Inc. 2005 4. Christopher Day, Environment and Children: Passive Lessons from the Everyday Environment, Architectural Press, 2007 5. Rani Lueder (editor), Valerie Rice (editor), Ergonomics for Children: Designing Products and Places for Toddlers to Teens, Taylor & Francis, 2007
73

EКОДИЗАЙНЪТ КАТО ФАКТОР ЗА БЪДЕЩО РАЗВИТИЕ НА ЕКОЛОГОСЪОБРАЗНИ МЕБЕЛИ В МЕБЕЛНАТА ПРОМИШЛЕНОСТ
ECODESIGN AS A FACTOR FOR FUTURE DEVELOPMENT OF ENVIRONMENTALLY FRIENDLY
FURNITURE IN FURNITURE INDUSTRY
д-р инж. Банкова А. И., д-р Жечева Г.В. – Технически университет – Варна, България
Abstract: Ecodesign is related to the development of environmentally friendly products in their design process are met important requirements such as quality, durability, ergonomics, aesthetics, environmental and product safety. Ecodesign is determined by the requirements and directives of the European Union. For future realization and implementation of eco-design and in particular the Ekomebel practice role and importance factors could have played like the innovative thinking of the population among informativnostta society poznavene best practices in application in the furniture industry and not least the achievement of environmental effect of their use. The purpose of this paper is to examine and analyze the role and importance of eco-design as a decisive factor for the production of environmentally friendly furniture in the furniture industry to reduce the harmful impact to the environment.
Keywords: EKODESIGN, ENVIRONMENTALLY FRIENDLY FURNITURE, ECOLOGY
1. Увод
Екодизайнът налага нови изисквания към проектирането на продукти с по-ниско потребление на енергия и по-добри екологични показатели през целия им жизнен цикъл. С новата директива се разширява обхватът на тези продуктови групи и се установяват изисквания за екодизайн при всички изделия[1]. Екодизайнът и производството на екомебели е обусловено от навлизането на “зелените технологии” и е нова тенденция в световен мащаб като навлизат все повече на пазара в отговор на глобалната екологична криза. В условията на изчерпващи се природни ресурси, нарушени екосистеми и намаляващо екоразнообразие е необходимо все по – мащабно анализиране и търсене да се търсят съвременни начини за ограничаване на вредното въздействие върху околната среда на продуктите. Смята се, че един от най-адекватни и ефективни подходи в тази насока е именно изпозване на екомебели, които да заместят конвенционалните. Екодизайнът, или още както го наричат “зелен дизайн”, “дизайн за околната среда”, по своята същност представлява проектирането на продукти, отговарятщи на принципите за устойчивото развитие – постигане на баланс между икономически, социални цели и околна среда[3]. Във тази връзка екомебелите са един такъв продукт. Основната цел при внедряването на екомебелите е да се намали използването на невъзобновяеми ресурси както и да се свеждае до минимум вредното въздействие върху околната среда[4]. 2. Предпоставки за навлизане на екомебелите Навлизането на екомебелите в практиката ще спомогне за засилване на присъствието международните пазари, където все повече се говори и осъзнава нуждата от за екологично равновесие. В последните години се правят редица проучвания и се изготвят екологосъобразни проекти в мебелната промишленост, което доказват необходимостта от екодизайна като решаващ фактор за изграждане на „зелената политика” в страната. От проучения и анализирания доклад за развитие на отрасъла до 2020 Британската изследователска асоциация за мебелната индустрия (FIRA) съвместно с водещи представители на сектора се посочва, че пестенето на енергия, ефективното използване на материали и рециклирането ще бъдат от особена важност за функционирането на бизнеса в бъдеще. В споменатия доклад се казва още, че разходите, свързани с унищожаването на отпадъците от мебели и дървени изделия са значителни и възлизат на около 3,6% от оборота на мебелната промишленост във Вели-кобритания или се равняват на 250 милиона паунда годишно. Счита се, че една голяма част тези разходи могат да бъдат избегнати като едно от възможните действия в тази насока е именно иновативният дизайнерски подход [2].
Все повече екомебелите се налагат като тенденция в областта на интериорното и дизайнерско проектиране. Ето защо е необходимо да се изяснят: - основните принципи на екодизайна като важен фактор за производството на екомебели; - ролята и значението им в мебелното производство; - предимствата на екомебелите; - мерки, които могат да се предприемат за насърчаване на производството им; 3. Основни проблеми при организиране производството на екомебели [6]: 3.1. Осигуряване на подходяща екологосъобразна дървесна суровина.
В нашата страна има огромен потенциал (средно годишно добивът на трупи от иглолистни и широколистни дървестни видове е над 3 милиона м³). Големи са запасите от дървесина, годна за производството на био мебели от видовете бук, дъб, ясен, бор, смърч и ела. Условията на месторастене са планинска еколого чиста среда.
3.2. Осигуряването на екологосъобразни дървестни производства.
Засега при масовото производство на мебели основно се употребяват токсични дървесни продукти – ПДЧ (Плочи от дървесни частици), ПДВ (Плочи от дървесни влакна), МДФ (средно плътни плочи от дървесни влакна), слоеста дървесина и др. Изброените материали са слепени със синтетични токсични лепила. Следователно за производство на биомебели тези лепила трябва да се подменят с нетоксични.
3.3. Осигуряването на нетоксични лакове за повърхностна обработка на мебелите.
Необходимо е да се редуцира до санитарно допустимо ниво отделянето на вредни емисии от лаковете или повърхностното обработване да се извършва с безвредни лакове.
3.4. Екомебелите трябва да бъдат ергономични и функционални. Това се получава, когато дадената мебел е проектирана специално за даден човек 4. Основни принципи на екодизайна като ключов фактор за проектиране на екомебели 4.1. Проектиране на целия жизнен цикъл на продукта, а не на самата мебел. Тук се взема под внимание периодът от идеята и проектирането през производството и потреблението до излизането на самата мебел от употреба. 4.2. Рационален подбор на използваните материали, минимизиране на количеството им и намаляване на разнообразието им в продукта. Материалите са основен фактор определящ влиянието върху околната среда на много от продуктите (мебелите).
74

Рационалния подбор на материали е от особено важно значение при производството на екомебели. Основни действия в тази насока могат да се предприемат относно:
- свеждане до минимум на елементите, които не играят важна функция, не подобряват качеството на мебелите или нямат естетическа стойност;
- оптимизиране на дебелините на стените и плътността на материалите;
- повторно използване на части и компоненти, когато е възможно;
- избягване използванто на бои, лакове и други защитни слоеве, когато е възможно. Необходимите материали за изработката на екомебели би следвало да се намалят до голяма степен, като се запазят функциите им. Чрез свеждане на материалите до минимум значително ще се намалят разходите за извличане, обработване, транспортиране и отпадъци. При проектиране на екологосъобразна мебел е от особено важно значение да се избягва голямо разнообразие от материали.
Използване на еднородни материали допринася от една страна за намаляване на оделните процеси и транспортни операции в производството и от друга лесното им рециклиране след края на употребата им. Действия в тази насока са:
- ако се използва дървен материал да не се комбинират различни видове;
- готовият продукт да бъде лесен за разглобяване на еднородни части;
- минимизиране на необходимите заварки и съединения. И на последно място изборът на материали които не са
вредни за околната среда материали също е от голямо значение.
Ето и някои правила които могат да са в полза при избора им:
- произлизащи от възобновяеми ресурси; - лесно и ефективно рециклируеми; - не съдържащи вредни вещества; - получени посредством по-малко вредни за околната среда; технологии;
Енергията, катоважен фактор запроизводството на еко– мебели.
Фиг. 1 Етапи при производството на екомебели
Етапи при производството на екомебели основани на принципи на екодизайна
Проектиране не на самата мебел, а на цели и жизнен цикъл.
Рационален подбор на използваните материали
-насърчаване наповторното използване
- Избор наадекватни материали
- Проектиранечрез модули, коитода позволяватпромяна на продукта
- Улесненапоправка иподдръжка
- Съкръщаване нафазите напроизводство; - Използване напроизводствени процеси, които сасвързани сефективно използване наенергия; -Оптимизиране надистрибуцията напродукта;
-Свеждане до минимум накомпонентите -Оптимизиране надебелините на стените иплътността наматериалите; -Повторно използване начасти и компоненти,когато е възможно; Избягване на използванена бои, лакове и другизащитни слоеве, когато евъзможно.
Проектиране на продукти с по дълъг срок на ползване
Оптимизиране наотпадъците от продуктаслед излизането му отупотреба
Многофункционалност на продукта
- Да се използватрециклируеми материали
- Да се използватпо-малко материали
- Минималноизползване на бои,лакове, байцове и др.
- Осигуряване налесно и пълноразглобяване напродукта
75

4.3. Енергията, като важен фактор за производството на екомебели. В повечето случаи именно използваната енергия е най-голямата вреда, която нанася върху околната среда един продукт. Именно поради тази причина е необходимо да се обмисли вариант за оптимизиране на енергията, която ще се ползва по време на производството и дистрибуцията на екомебели. Действия в тази насока могат да бъдат:
- съкръщаване на фазите на производство; - използване на производствени процеси, които са свързани
с ефективно използване на енергия; - оптимизиране на дистрибуцията на продукта; 4.4. Проектиране на продукти с по дълъг срок на
ползване Колкото по-дълготрайни продукти се използват, толкова
по-малко вредно въздействие за околната среда ще има. Действия, в тази насока са:
- да се направи възможно и да се насърчава повторното използване
- да се индентифицират и съответно отстранят до възможно най – голяма степен слабите страни на продукта
- избор на адекватни материали и суровини, които са устойчиви на продължителна употреба на продукта
- проектиране на базата на модулния принцип, който позволява промяна на продукта според променящите се изисквания на клиента
- улеснена поправка и поддръжка 4.5. Многофункционалност на продукта Интегрирането на повече функции в един продукт
позволява ползването му като няколко продукта и съответно намалява необходимостта от други.
4.6. Оптимизиране на отпадъците от продукта след излизането му от употреба
За да се намали вредно въздействие върху околната среда от продукта е желателно след излизането му от употреба, той да може да се използва отново и/или да се рециклира ако не напълно, то поне до голяма степен. Това може да се постигне като се вземе под внимание следното:
- да се използват рециклируеми материали - да се използват по-малко материали или такива, които да
могат да се рециклират заедно едновременно - минимално използване на бои, лакове, байцове и др. - осигуряване на лесно и пълно разглобяване на продукта 4.7. Непрестанно търсене на по-добри решения,
взаимстване и обмен на идеи 4. Предимства на екомебелите (фиг. 2) 4.1. Не замърсяват околната среда. Произвеждат се от
естествени материали – дърво, стъкло, метал, кристали, естествени масла.
4.2. Характеризират се с високото си качество и здравина. 4.3. Обзавеждането с екологосъобразни мебели осигурява
здравословен начин на живот, като това ги отличава от мебелите, произведени от ПДЧ и МДФ, които са слепени със синтетични лепила, съдържащи свободен формалдехид и
фенол. Избягват се вредните емисии, отделящи се при стареенето на химическите лакове.
4.4. Екомебелите са функционални и ергономични. 4.5. Удобни и лесни за ползване. Животът им е практически
вечен. 4.6.Екомебелите се подържат лесно. Поправят ако бъдат
надраскани или наранени. 4.7. За производството на екомебелите се използват
екологични технологии на високо световно ниво.
6. Перспективи за прилагането на екомебели в мебелното производство
Някои предприятия и фирми вече предлагат екомебели, предназначени предимно за деца, за хора физически увреждания, поради това най-често се произвеждат по поръчка. Ето защо в напредналите страни са създадени и успешно работят специализирани центрове и дизайнерски бюра за проектиране на екологосъобразни и ергосъобразни мебели. У нас едва сега се правят първите стъпки по организирането на съответните центрове.
Производството на екомебели е перспективно поради следното :
използват се по малко материали; използват се енергоефективни технологии; характеризират с многофункционалност;
С навлизането на европейските изисквания за осигуряване на здравословни и безопасни условия на труд в мебелните предприятия също се налагат промяни в досега прилаганите технологии. В най-голяма степен това се отнасят за повърхносната обработка – по отношение на методите на нанасяне на лакови покрития, както и използваните материали, съдържащи опасни химически вещества. Новите нормативни уредби засягат и тре тирането на отпадъците и особено на тези, които попадат в категорията “опасни”. Това предполага добри перспективи за развитието и производството на екомебелите у нас.
7. Мерки, които могат да се предприемат за
бъдещо производство на екомебели Информативност на обществото.
Информацията по отношение на екомебелите е твърде оскъдна;
Подобряване на системата за разделно събиране на отпадъци.
Рециклирането на отпадъци като цяло не е добре развито, особено по отношение на старите мебели и материали от дърво, където за момента напълно отсъства. За това и за момента в българската мебелна промишленост няма практика да се използват рециклирани материали, както и да се мисли за рециклирането на материалите, които се използват.
Насърчаване на специалистите в тази област;
Фиг. 2 Предимства на екомебелите
Притежават високо качество издравина
Предимства на екомебелите
Не замърсяват
околната
среда.
Функционални и ергономични
Удобни и лесни
за ползване. Животът им е
практически вечен.
За производството на еко мебелите се използват екологични технологии
Мерки, стимулиращи производството на екомебели
Информативност
на обществото
Подобряване насистемата за разделносъбиране
Насърчаване на
специалистите в тази област
Фиг.3 Мерки, за внедряване на екомебели
76

На базата на казаното по горе може да се направи извода че приложението на екомебелите и екодизайна като цяло в мебелната промишленост е бъдещ переспективен поход за намаляване на вредното въздействие върху околната среда.
Основни предимства за предприятията и за фирмите, които все повече разработват и произвеждат екомебели са следните:
1. Намаляване на производствените разходи; 2. Стимулиране на иновативното мислене; 3. Подобрен имидж на продукта и търговската марка; 4. Отговаряне на законовите изисквания по отношение на
околната среда; 5. Подобрено качество на продукта чрез повишаване на
срока за ползване на продукта, неговата функционалност и улесненото му поправяне и рециклиране;
6. Придаване на допълнителна стойност на продукта благодарение на намаленото му вредно въздействие върху околната среда по време на целия му жизнен цикъл и същевременно подобрено качество;
7. По-добро познаване на продукта и процесите свързани с жизнения му цикъл;
7. Заключение
Проектирането на екомебели се базира на разнообразни иновативни идеи, като е неоходимо следването на една и съща концепция – намаляване на вредното въздействие върху околната среда по време на целия им жизнен цикъл.
1. Екологосъобразните мебели са иновативни, като се
изработват от материали които не са вредни за околната среда. 2. Внедряването на екомебелите в мебелната промишленост е все успешно начинание за бизнеса и води до видими предимства за компаниите, които го прилагат, както и има принос към общонационални и световни политики за устойчиво развитие.
8. Литература
[1]. http://www.ecodesignarc.info [2]. http://www.ecosmes.com [3]. http://greenlivingideas.com/furniture/ecofurniture- a-product-of-green-design.html [4]. Schumacher, E.F., 1973. Small Is Beautiful: Economics As If People Mattered, .... [5]. EEA Environmental management tools for SMEs. C., 1998, 127 p. [6] http:// www. tanin-design.com/pages/bio
Контакти:
гл. ас.д-р инж.Александрина Иванова Банкова, Технически университет – Варна, катедра МЕ ул.Студентска 1, тел.383 300 е_mail: [email protected] [email protected]
77

FEATURES OF MECHANISMS AND MACHINES WITH RETARDED FEEDBACK
Akademik, Ph.D of technical sciences P. Zhunisbekov, Ph.D S. Bekbossynov
KazNAU, Almaty, Kazakhstan
Summary. Many constructional, road, agricultural and other machines have bearing wheels or skiing installed on working/execution unit/mechanism. Therefore it has retarded feedback in kinematical scheme. Minor alteration of rute depth, formed by supports, effects major change in depth of processing or width of its capture. Required quality maintenance of technological operations performance of these cars can be achieved with consideration of their constructional features.
Key words: Mechanisms, machines, retarded feedback, the working/execution unit/mechanism, wheels, depth.
Initial purpose of machines and tools development
is to ensure the required quality of technical operations (eg, depth of soil cut ), what is the designation of machines and tools itself. For this task, various constructional schemes are used in existing groups of machines and tools classification. In the prototype formation of machines and tools, including frame features and quality assessment of machine under examination it is possible to optimize the constructional schemes, optimal parameters for the various external effects (eg, surface roughness of the field). For the preparation of their prototypes constructional schemes of machines and tools was studied, and it was determined that the supporting elements such as wheels, running roller, ski, bearing located behind the execution unit and move on surfaces generated by this unit during the execution of operation in the majority of groups of machines. (Pic .1).
In kinematical schemes of these machines and mechanisms there is inclosed circuits of influence transfer: the deviation down the bearing parts located behind execution unit, is transferred through a frame to execution unit, and from the last through a surface of movement formed by it to a bearing part. Thus, transfer of influences on a bearing part-frame- execution unit chain a forms direct link, and from execution unit through a surface formed by it again to a bearing part – backup/1/. Feedback at the specified machines is retarded: deviations of the bearing parts located behind execution unit, are caused by offsets of the last, but in relation to them delay in time occurred which depends on distance from execution unit to a bearing part and forward speed of machine movement. In the majority groups of machines and mechanisms this concept is used mainly in agriculture, for an example, soil-cultivating, sowing and other cars, tools and separate mechanisms for agricultural purpose, and also ameliorative and road-building machines.
There are two standard task depending on machines and tools designation /3/. The first standard task is solved by machines which creates flat surface of a field (in relation to conditionally set base surface). The second standard task is solved by machines which maintain constant depth of processing (in relation to surface of a field relief) /3/. Simultaneously, there are high agro technical requirements set for technological operation of both groups. The first machine’s group formed by schedulers and other machines for continuous processing of the soil or a ground. Among agricultural tools to the second group of machines belongs the share-fall off (лемешно отвальный) plows having rear furrow wheels, moving on a bottom of furrows, formed by share advanced corps; the milling and combined units having basic running roller, located behind execution unit, seeders vomer etc.
Picture 1. Scheme of machines with retarded feedback
a) scheduler b) bulldozer c) milling machines.
Picture.2 Classification of machines and mechanisms with retarded feedback by V. A. Ksendzov
Machines with retarded feedback
With positive-negative retarded feedback
With negative retarded feedback
With positive- retarded feedback
With several retarded
factors less and morethan
one k=1/L
With retarded
factor more than one k=1/L
With retarded
factor less than one k=1/L
78

Picture.3. Planner with positive retarded feedback Feedbacks can be positive and negative. Positive
feedback possess ability to force processes, to strengthen reaction of system to influence. Negative on the contrary, possess feature to stabilize processes, to reduce system reaction. Among considered group of machines there are machines with positive, and negative feedback. Machines shown in picture 1 a) and 3 belongs for the first group. In the initial moment its knife is deepen so that it forms a surface lying below the initial. The support located behind a knife, copying this fall, through a frame will cause a new deepening of a knife and formation of the surface, located is even lower. New copying will cause a knife deepening again, etc. The total deepening of a knife will exceed the initial.
Other machines and mechanisms, such as milling units (picture 1 c)), equalizer with the running roller, certain vomer knots have negative feedback. At these machines and mechanisms execution unit conducts such functions as loosening or pulling soils, pulling the soil to the center which elevates surface. The subsequent return of support, for example, of running roller, on this excalation causes reduction of a execution body deepening, and consequently soil fluff of size etc. As a rule, operation of these machines and mechanisms is accompanied by considerable consolidation of a fluffed layer by running roller that can essentially reduce effect of retarded feedback.
For endorsement of theoretical thesis, identification of factors which are affected deviation of calculated processes from actual, registration of modifications with the aim of their rapprochement, and also test of the developed methods of calculation there were laboratory installation designed.
The laboratory work program provide research of model transients at a push alike deviation of point of trailer10 and change of track depth of, identification of the significant factors causing a deviation of calculated transients from actual laboratory and the registration of modifications for the purpose of rapprochement, research of trench-digger model on specially designed device for modeling of soil-cultivating and ameliorative machines and tools with feedback at occasional stationary impact on model, comparison of the achieved results with theoretical thesis and identification of the factors causing their divergence, test of a graphical method of calculation of transients.
Experiments were conducted in the soil channel. The soil in the channel – loamy at middle level. The length of trench - 1000 cm, width – 95 cm. Cart 2 were established on rails 3 of soil trench 1 the cart 2 (picture 4) which is actuated by the driving mechanism consisting of a driving cable 4, the reel 5 with the clutch, two transmission 6 and the electric motor 7 with the capacity of 1,4 kW and the
speed 1450 revolutions per minute. Constant speed of cart moving maintained constant, equal to 0,4 m/s.
Picture 4. Scheme of laboratory installation.
The model of a trench-digger joined the cart 2 via the mechanism of a hitch point 0 deviation. The mechanism of a hitch point 0 deviation contains support 8 attached to the cart, a vertical axis 9 with slider 10 and the lever ІІ, which retains slider in the top position. At lever II turn slider 10 is released and slides down on an axis 9 under the influence of tool model and additional weight. Slider 10 joins to frame12 of tool model via hinge through a horizontal axis. The least has execution unit 13 and basic wheels 14 with a rack.
Picture 5. The channel scheme of the trapezoidal section with depth up to 10 cm, width on a bottom 10 cm and with a
1:1 slope establishment.
Double dumped execution unit 13 creates channel (picture 5) with trapezoidal section with the depth up to10 cm, width on a bottom 10 cm and with a 1:1 slope establishment. Basic wheels are replaceable and also have a cylindrical or conic rim. Diameter of wheels is 270 mm. Width of a cylindrical wheel rim is 70 mm, and conic - 42 mm with a cone in 90. The least is applied in experiences with sharp change of track depth an established support. The execution unit and wheels can be regulated on height and to move along a frame to which they are attached by means of collars.
Laboratory installation (picture 4) has also the mechanism of model’s frame lifting for transportation position and additional weight retention-lowering a frame. Mechanism’s support 15 is attached to cart 2 by bolts, and has two axes 16 and 17, on an axis 16 is hung G-shaped lifting mechanism’s lever 19 on which end there are hooks 20 and 21 for a hanging of weights and lifting of a frame 12 for transportation position. Another end is affected by the fist lifting mechanism with an axis 17. For automatic weight lowering 23 hung on the lever 19, ring with a wire set for the end of the lever 18. Wire is at necessary length when pulled the lever 19 is released and lowers weights 22 on a frame. ІІ – shaped weights in 10kg are hung on lever 19 hooks (picture 4). Height of weight lowering is about 10 mm. It is
79

possible to hang up to 5 weights on a frame at the same time.
The trajectory of execution unit’s edge movement registered on the paper tape attached to the vertical screen, established along the soil channel. Registration means with pencil holder is attached to one end of the lath, second end pressed on a frame of tool model
Other two ends of a lath join via two sliding bearings to the cart. Record of several executions unit’s movement trajectory curves at the same tape is achieved by turn of the pencil holder. The basic line recorded by writing means attached to the cart. Pressure of pencils upon a tape is regulated by adjusting screw’s spring compression measure.
Depth of a track, created by a wheel, measured by depth gage with measuring ruler, attached to a rack, a horizontal board and directing cores. Measurements were made each 15 cm of passed track.
Experiments were carried out at constant density and humidity of the soil and speed of installations movement at soil channel
Humidity of the soil supervised by weight method, via drying of removed samples. Calculation formula of the soil relative humidity is as below:
where a–difference of weight of the soil before
and after drying, A – weight of absolutely dry soil. Experiences were carried out at humidity of the soil W = 15-17 %.
Experiments on the transients caused by a deviation of a hitch point, were carried out as follows.
Positions of the execution unit and supports were established on a horizontal adjusting board with the consideration of track formed by support. At the beginning of a models’s movements hitch point (picture. 4) with the slider was kept in the top position by the dumping mechanism. Wheel with a cylindrical rim is established to exclude formation of a big track and influence of digging depth fluctuation measure by the change of last.
On a models’ frame additional 3 weights were hung near a point10 in gross weight of 30 kg that promoted sharp falling of a hitch point in the moment of dumping operation activation. Necessary parameters were set according to experiences schedule. In test the size of deviation (falling) of a hitch point is equal to h1 = 130 mm.
After the first preliminary pass of installation the layer o soil were removed to maintain constancy of average digging depth at transients. It is necessary to exclude influence of model’s load change in a transient mode.
Thereafter main experiments were conducted. By winch switching installation were moved from one end to another. When execution unit approached to the end of establishment table the hitch point automatically fell. The trajectory of execution unit movement and the basic line registered by writing means. Upon termination of experiment, tool transferred to transportation state and returned to initial position for the next experience of repeated frequency. Frequency of experiences the 10-time.
Experiments on the transients caused by a change of track depth, were carried out as follows.
For the purpose of receiving essential change in track depth, formed by support, wheel with a conic rim were established. To prevent of hitch point fluctuations slider were suspended. In actual condition change of track size is observed when change of surface density of movement or loading measure. A dense surface created by installation at the beginning of the channel board, and the soil of the soil channel were less dense.
The sock of execution unit and support were established at one level. After preliminary pass the part of the soil was taken away to keep constant digging depth in transient.
At recopying of a semi-cylindrical surface experiments semi-cylindrical surface in radius of R = 130mm were established between execution unit and support on furrow bottom. Experience frequency – 10 time.
Theoretical transients calculated in the assumption of affecting tool module by an individual push.Many construction, road, agricultural and other machines and mechanisms have basic wheels or skis established behind the execution unit. Or they have retarded feedback in the kinematical scheme. Minor alteration of rurte depth formed by support, effects in considerable change of processing depth or their capture width, to violation of technological process. Required quality maintenance of technological operations performance of these cars can be achieved with consideration of their constructional features.
Literature
1. Ksendzov V.A.Introduction to mechanics of machines and mechanisms with retarded feedback. Publishing house «Satellite *», Moscow, 2005.
2. Zhunisbekov P. Zh. Transients of soil-cultivating machines and tools with the retarded feedback. Scientific research. Kazakh Agricultural Institute. Volume XV, Issue.1 Kazakh Agricultural Institute. Almaty, 1972.
3. Zhunisbekov P. Zh. The standard tasks solved by actuation devices of machines and units. Technology and mechanization means of production in plant growing of Kazakhstan. Collection of scientific works of Kazakh Agricultural Institute. Almaty, 1989.
Summary. Many constructional, road, agricultural
and other machines have bearing wheels or skiing installed on working/execution unit/mechanism. Therefore it has retarded feedback in kinematical scheme. Minor alteration of rute depth, formed by supports, effects major change in depth of processing or width of its capture. Required quality maintenance of technological operations performance of these cars can be achieved with consideration of their constructional features.
Key words: Mechanisms, machines, retarded
feedback, the working/execution unit/mechanism, wheels, depth.
FEATURES OF MECHANISMS AND
MACHINES WITH RETARDED FEEDBACK Professor, doctor of technical sciences Zhunisbekov P., Ph.D. Bekbossynov S. KazNAU, Almaty, Kazakhstan.
80
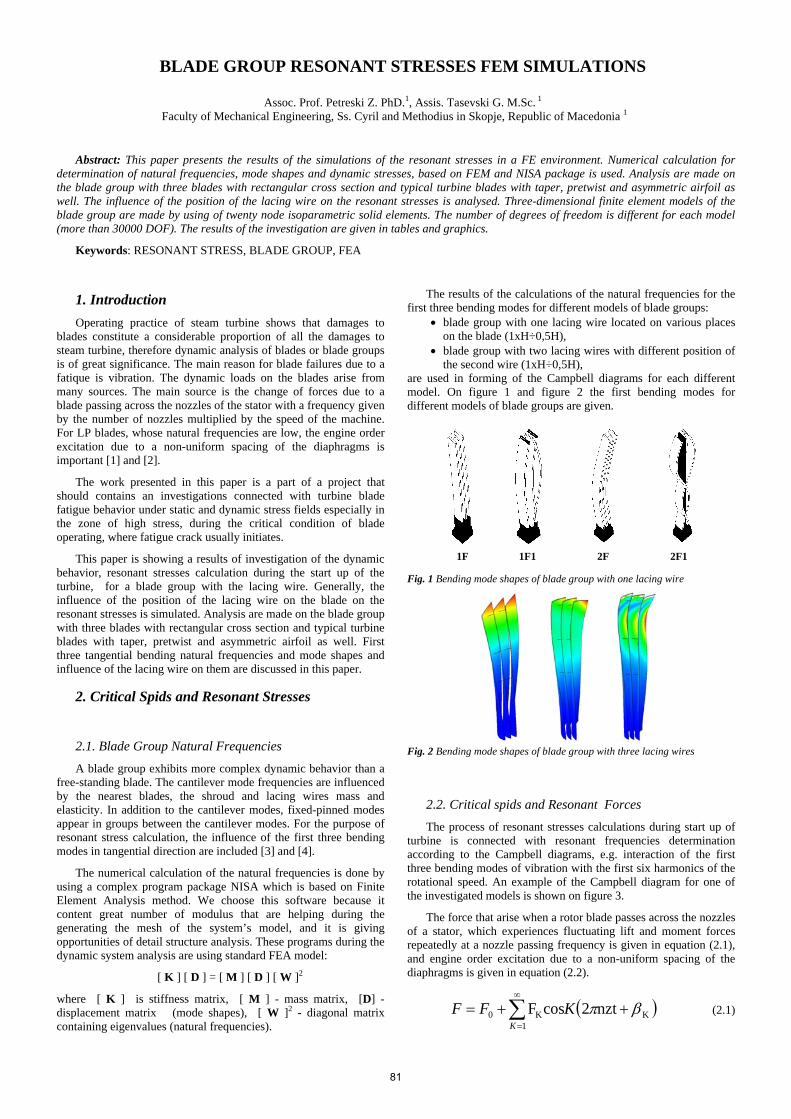
BLADE GROUP RESONANT STRESSES FEM SIMULATIONS
Assoc. Prof. Petreski Z. PhD.1, Assis. Tasevski G. M.Sc. 1 Faculty of Mechanical Engineering, Ss. Cyril and Methodius in Skopje, Republic of Macedonia 1
Abstract: This paper presents the results of the simulations of the resonant stresses in a FE environment. Numerical calculation for determination of natural frequencies, mode shapes and dynamic stresses, based on FEM and NISA package is used. Analysis are made on the blade group with three blades with rectangular cross section and typical turbine blades with taper, pretwist and asymmetric airfoil as well. The influence of the position of the lacing wire on the resonant stresses is analysed. Three-dimensional finite element models of the blade group are made by using of twenty node isoparametric solid elements. The number of degrees of freedom is different for each model (more than 30000 DOF). The results of the investigation are given in tables and graphics.
Keywords: RESONANT STRESS, BLADE GROUP, FEA
1. Introduction
Operating practice of steam turbine shows that damages to blades constitute a considerable proportion of all the damages to steam turbine, therefore dynamic analysis of blades or blade groups is of great significance. The main reason for blade failures due to a fatique is vibration. The dynamic loads on the blades arise from many sources. The main source is the change of forces due to a blade passing across the nozzles of the stator with a frequency given by the number of nozzles multiplied by the speed of the machine. For LP blades, whose natural frequencies are low, the engine order excitation due to a non-uniform spacing of the diaphragms is important [1] and [2].
The work presented in this paper is a part of a project that should contains an investigations connected with turbine blade fatigue behavior under static and dynamic stress fields especially in the zone of high stress, during the critical condition of blade operating, where fatigue crack usually initiates.
This paper is showing a results of investigation of the dynamic behavior, resonant stresses calculation during the start up of the turbine, for a blade group with the lacing wire. Generally, the influence of the position of the lacing wire on the blade on the resonant stresses is simulated. Analysis are made on the blade group with three blades with rectangular cross section and typical turbine blades with taper, pretwist and asymmetric airfoil as well. First three tangential bending natural frequencies and mode shapes and influence of the lacing wire on them are discussed in this paper.
2. Critical Spids and Resonant Stresses
2.1. Blade Group Natural Frequencies
A blade group exhibits more complex dynamic behavior than a free-standing blade. The cantilever mode frequencies are influenced by the nearest blades, the shroud and lacing wires mass and elasticity. In addition to the cantilever modes, fixed-pinned modes appear in groups between the cantilever modes. For the purpose of resonant stress calculation, the influence of the first three bending modes in tangential direction are included [3] and [4].
The numerical calculation of the natural frequencies is done by using a complex program package NISA which is based on Finite Element Analysis method. We choose this software because it content great number of modulus that are helping during the generating the mesh of the system’s model, and it is giving opportunities of detail structure analysis. These programs during the dynamic system analysis are using standard FEA model:
[ K ] [ D ] = [ M ] [ D ] [ W ]2
where [ K ] is stiffness matrix, [ M ] - mass matrix, [D] - displacement matrix (mode shapes), [ W ]2 - diagonal matrix containing eigenvalues (natural frequencies).
The results of the calculations of the natural frequencies for the first three bending modes for different models of blade groups:
blade group with one lacing wire located on various places on the blade (1xH÷0,5H),
blade group with two lacing wires with different position of the second wire (1xH÷0,5H),
are used in forming of the Campbell diagrams for each different model. On figure 1 and figure 2 the first bending modes for different models of blade groups are given.
Fig. 1 Bending mode shapes of blade group with one lacing wire
Fig. 2 Bending mode shapes of blade group with three lacing wires
2.2. Critical spids and Resonant Forces
The process of resonant stresses calculations during start up of turbine is connected with resonant frequencies determination according to the Campbell diagrams, e.g. interaction of the first three bending modes of vibration with the first six harmonics of the rotational speed. An example of the Campbell diagram for one of the investigated models is shown on figure 3.
The force that arise when a rotor blade passes across the nozzles of a stator, which experiences fluctuating lift and moment forces repeatedly at a nozzle passing frequency is given in equation (2.1), and engine order excitation due to a non-uniform spacing of the diaphragms is given in equation (2.2).
K1
K0 nzt2cosF
KFFK
(2.1)
1F 1F1 2F 2F1
81

K1
K0 nt2cosF
KFFK
(2.2)
where: z – number of diaphragms, - phase, F0 – static force of the pressure, FKcosK(2nzt+K) – dynamic force-K-th harmonic.
Because of the complex and nonlinear damping mechanisms (friction from slipping surfaces, material damping and aerodynamic damping), the equivalent viscous damping effect is used to estimate the resonant stresses with damping ratio of 0,02 [1], [2].
Fig. 3 Campbell diagram
The results of resonant stresses calculations during start up of the turbine for interaction of the I, II and III harmonics with the bending modes of vibration are shown on Fig. 4 to 6.
Fig. 4 Resonant stresses due to a first harmonic
Fig. 5 Resonant stresses due to a second harmonic
Fig. 6 Resonant stresses due to a third harmonic
The results of resonant stresses calculations due to a I harmonic for the model of blade group with three blades, and a change of position of the lacing wire (1xH÷0,56H) are shown on Fig.7 to 12.
Fig. 7 Resonant stresses due to a first harmonic-lacing wire on 1xH
Fig. 8 Resonant stresses due to a first harmonic-lacing wire on 0,92xH
Fig. 9 Resonant stresses due to a first harmonic-lacing wire on 0,81xH
82

Fig. 10 Resonant stresses due to a first harmonic-lacing wire on 0,78xH
Fig. 11 Resonant stresses due to a first harmonic-lacing wire on 0,69xH
Fig. 12 Resonant stresses due to a first harmonic-lacing wire on 0,56xH
Resonant stresses calculations due to a I harmonic for the model with two lacing wires, and a change of position of the second lacing wire (1xH÷0,56H) are shown on Fig.13 to 17.
Fig. 13 Resonant stresses due to a first harmonic-second wire on 0,92xH
Fig. 14 Resonant stresses due to a first harmonic-second wire on 0,81xH
Fig. 15 Resonant stresses due to a first harmonic-second wire on 0,78xH
Fig. 16 Resonant stresses due to a first harmonic-second wire on 0,68xH
Fig. 17 Resonant stresses due to a first harmonic-second wire on 0,56xH
83

3. Resonant Stresses Analysis and Conclusion
During the simulations of the resonant stresses, a unit resonant force excitation is submitted. The results of the simulations of the resonant stresses changes for the models of blade group with one lacing wire mounted on different height of the blade is given in Table 1 and Fig.18.
It can be seen that when the lacing wire is mounted near node of the mode the resonant stresses are increased, and in the situation when the lacing wire is mounted near antinodes of the mode the resonant stresses are decreased.
The results of the simulations of the resonant stresses changes for the models of blade group with two lacing wires with second wire mounted on different height of the blade is given in Table 2 and Fig.19.
The influence of the damping ratio changes on the resonant stresses is given in Table 3 and Fig. 20. It can be seen that the decrease of the damping ratio increase the resonant stresses on the blade group.
Table 1: Influence of the position of the lacing wire on resonant stresses due to a I harmonic of excitation
a [N/mm2]
1F 1F1 2F 2F1
1.0xH 5.34 4.45 1.96 0.55
0.92xH 5.34 3.91 2.06 0.22
0.81xH 5.26 2.33 2.75 0.25
0.78xH 5.24 1.81 2.73 0.6
0.69xH 5 0.83 1.61 1.6
0.56xH 4.33 0.22 1.55 0.63
0.5xH 3.83 0.12 1.69 0.1
Fig. 18 Resonant stresses due to change of position of the lacing wire
Table 2: Influence of the position of the second lacing wire on resonant stresses due to a I harmonic of excitation
a [N/mm2] 1F 1F1 2F
1.0xH 5.34 4.45 1.96
0.92xH 5.34 3.91 2.06
0.81xH 5.26 2.33 2.75
0.78xH 5.24 1.81 2.73
0.69xH 5 0.83 1.61
0.56xH 4.33 0.22 1.55
0.5xH 3.83 0.12 1.69
Fig. 19 Resonant stresses due to change of position of the second lacing wire
Table 3: Influence of the damping ratio changes on resonant stresses
a [N/mm2]
1F 1F1 2F 2F1
0.02 5.34 4.45 1.96 0.55
0.018 5.93 4.92 2.14 0.62
0.016 6.67 5.6 2.4 0.7
0.014 7.62 6.35 2.75 0.84
0.012 8.88 7.42 3.2 0.98
0.01 10.6 8.94 3.84 1.2
Fig. 20 Resonant stresses due to change of damping ratio
4. References
[1]Rao, J.S., Vyas N.S., Determination of the Blade Stresses under Constant Speed and Transient Conditions with Nonlinear Damping, J of Engng of Gas Turbines and Power, Trans ASME, vol. 118, No. 2, 1996, p. 424
[2] Vyas N.S., Sidharth and Rao, J.S., Dynamic Stress Analysis and A Fracture Mechanics approach to Life Prediction of Turbine Blades, Mechanism and Machine Theory, v. 32, No. 4, 1997, p. 511
[3] Z.Petreski, “Natural frequencies of a blade group with a lacing wire”, Mechanical Engineering Scientific Journal 28-1, 2009, p. 1-5
[4]Z.Petreski, G.Tasevski, J.Jovanova, “Possible ways for correction the dynamic parameters of the blade packages at the turbomachines”, Proc. AMO 9th International Conference, Kranevo, Bulgaria, June 2009,Vol. 2, pp. 319-322
0
1
2
3
4
5
6
0,50,60,70,80,91
1F
1F1
2F
Height H [%]
Res
onan
t stre
ss [N
/mm
2 ]
0123456789
1011
0,010,0120,0140,0160,0180,02
1F1F12F2F1
Damping
Res
onan
t str
ess
[N/m
m2 ]
0
1
2
3
4
5
6
0,50,60,70,80,91
1F1F12F2F1
Height H
Res
onan
tstre
ss[N
/mm
2 ]
84

PRINCIPLES OF AUTOMATED EQUIPMENT DEVELOPMENT FOR PROCESSING PRECISE FORGED COMPONENTS MADE OF HEAT-RESISTANT ALLOYS
Ph. D. (Eng.) R.Yu.Sukhorukov*, Sc. D. (Eng.). F.Z.Utyashev** * A.A.Blagonravov Institute for Machine Science of the Russian Academy of Sciences (IMASH RAN); 4, Maly Kharitonyevsky Per.,
Moscow, 101990, Russia; ** Institute for Metals Superplasticity Problems of RAS (IMSP RAS); 39, Khalturin str., Ufa, 450001;
Abstract: Results of a theoretical and pilot study are given for the purpose of development of the main technical solutions providing the solution to a problem of the equipment development for forming parts out of titanium- and nickel-based heat-resistant alloys using of plastic deformation methods. The results of the study are used for the development of equipment of a new class for the forging and stamping production, in particular, roll-forming mills, forging and rotational machines, intended for deformation of low-plasticity and hard-to-deform materials and manufacturing the accurate components and parts using superplasticity effect.
Key words: roll-forming mill, superplastic deformation (SPD), control system, tool, processing conditions, local shape-forming methods (LSFM).
1. Introduction
In modern gas-turbine engines and similar power
installations the large-sized axisymmetric parts like disks, shafts, rings and a number of others are widely used. These parts are made of low ductile and hard-to-deform heat-resistant nickel-, iron- or titanium-based superalloys. Metallurgical production of such details is expensive. When manufacturing such superalloys by powder metallurgy methods, the increase in their production costs is due to the use of both sophisticated equipment and multi-operational technologies of obtaining granules, compact semi-finished products and, actually, the parts themselves. Moreover, for a production of the parts and components with better mechanical properties, their shape-forming is carried out through forging under superplasticity conditions using extremely expensive vacuum-forging equipment consisting of several presses developing strong loads of 10-30 thousand tons.
Production of axisymmetric parts made of hard-to-deform heat-resistant nickel-based alloys is also characterized by multi-operational character, high labor intensity and power consumption due to a low ductility and deformability of these alloys. The most essential factor leading to the increase in cost of such parts is low metal utilization factor 1020%.
2. Possibilities of the Methods of Local Shape-
Forming (LSF) under Superplastic Deformation Conditions (SD)
The methods of local shape-forming under
superplastic deformation and equipment for the implementation of the described methods [1] allow one to solve the problem of manufacturing the axisymmetric parts of intricate shape with a minimum metal loss, without application of both a big press equipment and massive forging tools and with minimum number of operations. Let us consider these methods and the correcponding equipment taking as an example the roll forming of metal discs for gas-turbine engines (GTEs).
The essence of the process of roll forming of metal
discs under superplasticity conditions is that a billet is heated to the temperature of deformation, then is sandwiched between the spindles, then the billet is rotated. Under the load of one or two pairs of inclined rotating rollers which have a possibility to compress the billet and to move from its center and also to change a tilt angle towards it, each local area of the billet is deformed with a decrease in its thickness and with an increment of the diameter. Due to the high accuracy and metal utilization factor of roll forming the discs produced by this methods have a quality not worse than that of the discs produced by precision forging. Purity of a surface also corresponds to the level of precision forged parts (Rz =-840 мкм).
Depending on the diameter required, roll forming of a titanium disc requires from about 20 to 40 minutes, while for making a similar disс out of of heat-resistant nickel alloy it will take twice more time due to a limited capacity of the mill. When comparing the productivity of roll forming and forging it is obvious that the machine time of rolling discs is longer than that of forging. However, if we take into consideration the total time required for carrying-out the order for the production of a new disc, including the time necessary for preparation of manufacture process and for the machining of the disk, then for the parts and items obtained by the described method of local shape-forming (LSF) in superplastic deformation conditions (SD), the time is much less than for forged.
Critical factors that reduce costs and time for manufacturing the parts by LSF-methods in superplastic conditions are: increase in metal utilization factor up to 0.50.8, decrease in metal for tools as well as the reduction of labor costs for manufacturing tools. So, the weight of one roll-forming roller is 2030 kg and the roller is, similarly to a cutting tool, universal as it is used for rolling of different discs. Meanwhile, the weight of a forge depends on the sizes of discs and its weight may have hundreds or thousands kilograms, and a separate forge is designed for a manufacture of each parts of one type or size. Besides, the roller has a simple shape and it is usually casted with high accuracy and it is made of heat-resistant alloys of ZhS6U-type
85

and a roller is subjected to a lesser machining, as compared to a forge. It is easier to repair and to maintain the roller, it requires less time for replacement.
A significant reduction in the of deformation load is another obvious advantage of roll forming before the forging. Low flow stress of heat-resistant nickel- and titanium alloys under superplastic deformation and the application of a local shape-forming method for roll forming of metal billets allow one to manufacture discs of the same size as those manufactured on a hydraulic forging press with loads not less than 5-10 thousand tons, and the load on the rollers of a mill using roll forming process is limited by 5-10 tons.
Theoretical prerequisites for the development of local shape-forming under superplastic deformation have been the statement and solution of a boundary-value problem for roll forming of discs, the development of engineering techniques and methods for a computation of thermomechanical regimes of deformation and extensive metallurgical studies experimentally proved by multiple tests of roll-formed items [2].
Formerly only symmetric discs with flat web and with small protrusions on it have been manufactured using methods of the local shape-forming under superplastic deformation. It has been stipulated not by limitations of the given LSF-method, but due to an absence of the equipment adopted for implementation of such tasks.
Experience of exploitation of SRD-800 rolling mill, in roll forming of discs using this mill allowed us to develop and manufacture the automatic line for roll forming ALRD-800 and to start a development of a special mill for roll forming of discs out of different heat-resistant alloys SRZhD-800. The automatic line and the SRZhD 800 mill are capable to develop a stronger load of deformation, and the line also has been supplied by a number of furnaces for preliminary heating of billets and for thermal treatment of parts and components. Since during roll forming it is necessary to control multiple parameters of the shape-forming of a billet, we developed a new concept of control for forming equipment has been developed on the example of the SRZhD-800 mill. It is based on a continuous uptake and processing of information on the parameters of the process and calculation of regulatory regimes of deformation of a part or a component [3]. In other words, the roll forming process is performed not only automatically, but using adaptive control, i.e. through control of its real parameters and with corrections of its modes, if necessary.
Due to these innovations, the performance of the developed equipment has been greatly increased; the possibilities of the equipment, concerning its level of automatic control and flexibility exceed those of the vacuum-forging equipment. Moreover, at present, owing to modification of conventional rotary drwaing
equipment and thanks to using new schemes of deformation, greatly expanded the range of produced items which can be manufactured by methods of local shape-forming under superplastic deformation conditions [4,5].
Along with roll forming the discs under superplastic conditions there can be produced rings, hollow shafts, elliptical and conical shells, aircraft and automobile wheels and other parts of a complex axisymmetric profile.
PNC-600 machine-tool for rotary drawing can be taken as an example of the modified equipment. In its basic version the machine-tool is computer-aided and has a spindle, tailstock, drive for the transverse and longitudinal movement of a roller. After its modernization the machine-tool has been also supplied by high-temperature furnace with an operating chamber of diameter 800 mm and length 1000 mm and with instrumental unit, which provides high performance of its roller at temperatures above 1100о С, which makes it possible to manufacture parts and components made of heat-resistant nickel- and titanium-based alloys with high accuracy.
While roll forming the alloy, it is necessary to control many parameters of the process of shaping the billet, in particular, it is required to track the trajectory and speed of displacement of rollers, to coordinate the rotation of the tool with a billet, to determine and compare efforts to the rollers, to define and control the temperature of deformation.
Actually, it is impossible to perform such a multi-parameter control without automation of the process, and in this regard the roll forming is a more complex process as compared to forging. Nevertheless, the modern computer-aided equipment is capable to cope with this task. Moreover, the described equipment together with certain features of roll forming under superplastic conditions can provide the items not only with traditional level of quality through the control over the actual parameters of the process, but also to give the manufactured products new, higher properties which are not provided by conventional forging [1, 2].
3. Quality of Parts and Components Obtained Using Local Shaping Method under Superplastic Deformation
The considered methods of local shape-forming
in plastic deformation allow one to produce the critical parts and components. Mechanical properties of the alloys from which the parts are made of are the most important characteristics for such parts. In its turn, the mechanical properties depend on a microstructure attained by the part or component under deformation process. Using specific features of the local shape-forming under plastic deformation, one can control the shape-forming of the
86

structure and mechanical properties of the parts and components. One of such opportunities is reported in the paper [6], in which it is described how the disc has been obtained with different properties of its microstructure through varying the thermal and mechanical modes of deformation while roll forming the part; the authors have obtained different microstructure in the hub, web and rim, and respectively, with different mechanical properties which responded to temperature and stress conditions for operation of the disc.
Obtaining a homogeneous microstructure in discs made of heat-resistant nickel- and titanium-based alloys is considered as a more traditional approach. In this regard systematic research into properties of roll formed discs has been conducted according to specially developed program with participation of a number of Russian engine manufacturing enterprises and research institutes. In particular, there has been thoroughly studied the impact of initial structure of the billets on the properties of the roll formed discs made of titanium alloys. Billets for roll forming out of two-phase alloy (VT-9-Alloy) and of pseudo - -alloy (VT18U-Alloy) with different micro- and macrostructures have been produced and supplied by Verkhniaya Salda metallurgical enterprise. Discs have been roll formed out of these billets on the SRD-800 mill. Thermal treatment and metallurgical studies of the discs have been carried out at research test laboratories of a number of engine manufacturing enterprises and at institutes. It has been shown that the roll formed discs meet all the requirements and standards on mechanical properties and are not inferior by their quality to the forged discs traditionally used for manufacturing the gas-turbine engines. The best quality has been shown by discs roll formed out of billets with a uniform fine-grained structure [7-10].
4. Conclusion Methods of local shape-forming of components
under superplastic conditions are to be considered as an alternative to conventional and isothermal forging. The interest to application of such technologies shown by foreign and native aircraft engine companies is attributed to the following advanced potential of the identified methods:
- an increase in material utilization factor up to 0,5 0,8 while producing the large-scale parts of intricate shape;
- a decrease in load and reduction of expenses for tool manufacturing by a factor of 1000 as compared to forging;
- a reduction of a number of shape-forming passes down to one, decrease in labor content and component price. In many cases the local shape-forming makes it possible to give up the use of expensive powder
materials as the saving consumption of ingot material allows producing the ingots from analogous cast and strained materials;
- an increase of quality and reliability of components. Components and semi-finished products with homogeneous fine-grained structure are more transparent for ultrasonic control than coarse-grained materials, this provides more precise testing of their defects. Moreover, the presence of initial homogeneous fine-grained structure makes it possible to process specified grain size distribution in microstructure by using heat treatment for attaining the best mechanical properties.
References 1. Kaibyshev O.A.,, Superplasticity, Grinding of
Structure and Treatment of Low Deformable Alloys//O.A.Kaibyshev, F.Z.Utiashev, M. Nauka, 2002, - 438 p.
2. Kaibyshev O.A., Superplasticity: microstructural refinement and superplastic roll forming. / Kaibyshev O.A., Utyashev F.Z. ISTC Science and Technology series, Vol. 3. - Arlington, Virginia, USA: Futurepast, 2005. – 386 p.
3. Rotation Method and Mill for Disks Production of Gas Turbine Engines Made of Heat-Resistant Alloys // , F.Z.Utiashev, Sukhorukov R.Yu., Afonin V.L., et al.//J. of Mechanical Engineering and Automation Problems, 2012, # 1, p. 109-116.
4. Kaibyshev O.A., Utiashev F.Z., Manufacture of Complex Parts by Rolling in Superplasticity, KShP, 1999, # 4, pp. 32-36.
5. Utiashev F.Z., Baimurzin R.G, Plekhov V.A., Reeling out the Rings Made of Highly Heat-Resistant Nikel Alloys under Superplasticity Condition// Forging-Stamping Production, 1999, # 7, pp. 14-16.
6. Valitov V.A., Utiashev F.Z., Baimurzin R.G., Effect of Rolling Conditions on the Structure and Properties of Disks Made of Heat-Resistant Nickel Alloy (EP 962),// Aviation Industry, 1994, # 11, 12.
7. .Evaluation of Superplastically Roll Formed VT 25./, Gigliotti M.F.X, Bewlay B. P, Kaibyshev O.A, Utyashev F.Z.//Proceesings of the 9th Wold Conference on Titanium, July 7-11, 1999, St. Peterburg, Russia. in press.
8. Superplastic roll forming of Ti alloys./Bewlay B. P., Gigliotti M.F.X., Utyashev F.Z., Kaibyshev O.A. // Materiais and Design 21 (2000) 287-295.
9. Reeling out Disks Made of Heat-Resiatant Nickel Alloys/ Kaibyshev O.A., Utiashev F.Z., Baimurzin R.G., et al.// Aviation Industry, 1987, # 11, c.60-62.
10. A New Mode of Heat Treatment of Rolled Disks Made of VT18U Alloy// Shestakova L.O., Salischev G.A, Solonina O,P, et al. // Aviation Industry, 1986, # 11.
87

ECLECTICISM OF CHOICE OR EMOTION BY CONTRAST
ЕКЛЕКТИКА НА ИЗБОРА ИЛИ ЕМОЦИЯТА ЧРЕЗ КОНТРАСТА
Asst. Prof. Ochkova-Dimitrova E. Department of Engineering Design
Technical University of Sofia
Abstract: The report examines the impact of emotion on form-formation, change of form, as modified choice and introduction of opportunity for transformation of property. Viewing the form-oriented environment surrounding our subject, closely tied to the character and personal characteristics of individuals. Personal choice as a prerequisite for the emergence of the idea of form. The choice is closely linked to emotions, environment and general attitudes. In multicultural space 21c eclecticism itself as the only option. Contrast as a formal principle in building a harmonious form is viewed as a tool for art and for the emotional choice. Keywords: FORM-FORMATION, CHOICE, EMOTIONS, ECLECTICISM, POSTMODERN SITUATION
1. Introduction
Nick Gentry “Auto emotion”
Contemporary multicultural society is in search of its forms in a large range of styles. Our world, dynamic and eclectic, is provoked by science, politics, religion, economics and a large number of other social factors. The new aesthetic systems are submerged into fast developing technologies, seasonally altering fashion, as well as in the intransigence towards monotony and “boredom”, which is being satisfied by the permanent consumption and replacement of our belongings. In order to satisfy the consumer, contemporary design attempts to accept more and more challenges.
There is no doubt, one of the leading tendencies is to satisfy client’s emotion, and at the same time to inspire one with the product. Many researches are done in the way of analyzing the emotional influence, to the other characteristics of the form, color, texture and structure of objects, which help provoke feelings. Every change is a condition for occurring emotion leading to different choice, which provokes different idea of form – formation of the objective background. This shows that the dynamic form with transforming option would cause different emotions or could respond to the changing ones.
The design looks for closer borders with the individuality and personal characteristics of the individual. Of course, it’s hard to speak about design in just one aspect that makes the view abstract. But going from the formal principles for composition, we will look for a bond between individuality, personal choice and idea to “form“. Contrast as a building element of artistic composition is in tight relation with emotions, since it contains the contradiction of two different natures. In finding “dialogue“ or “conflict”, the difference gives life to new forms and ideas, provoked by the emotions.
2. Content
Personal appearance or self- portrait by design.
“Not only does big art depict life, but participating in life it changes it” – Ilya Ehrenburg.
Long time ago art has crossed the borders of museum expositions and found it’s own way in our vital nature by design.
The role of the user is not restricted by the use of a concrete product. There is active participation and desire for building an individuality in the blurred whole. The relation, between the one, who gives orders and the one that performs those orders, are bilateral. Even without realizing this, forming the parameters of our desires and trying to put into effect our personality, we change into innocent participants of projecting the subjective nature. Personality needs to form itself by it’s own reflections.
“ DESIGN YOUR SELF“
Plamen Motev "Mirror"
Of course design looks for the forms of vision through the prism of personal desires. Personal choice is a prerequisite for the occurrence of the idea of form. However, there are as many ideas as we let them be. Choice is something we often face in everyday life and it becomes almost impossible to restrict it in any frames. Destined by desires and different ambitions, our decisions of “form” are being provoked by opposite and often eclectic sources. The American post- modernist Donald Barthelme, exclaims : “the principle of collage is the central principle of all art in the twentieth century” Postmodernism uses collage techniques and most accurately depicts the eclectic conception of modernity. Commercial success, anti-utopianism and rejection of the previous cultural paradigm, also conformism and undeclared democratism are only a few of the characteristics of post modern society which critic Brainin-Passek has made. Not only in literature do we notice rapid transition through different realities. Collage can combine incompatible elements, destroy and rebuild overall shape, which allows expressing the emotional essence. Undoubtedly this leads to eclecticism and here the role of quality design is of great importance. Eclecticism as a choice arisen from different emotions, needs to be overcome/ mastered and refracted through the prism of professional opinion. “There is no formula for good design; every problem is unique, just like every solution. What more, the design world
88

isn’t utopian; solutions are often intentional, crotchety or a product of endless compromises.” Paul Rend Design seeks for solutions by interrelating all aspects of a
problem. Emotion turns up to be one of those problems and she is the one who expresses the individual character/personality. In the multicultural space of the 21st century, eclecticism imposes itself as a possible choice, but it is insufficient as a final form of expression. That “aura” of uniqueness, which things tend to lose during this technological age, is trying to make its way back by means of emotions. It aims to identify the value of the object by binding it to personal feelings.
“ Vases with knitted texture” “Ceramics container” Annette Bugansky Tomas Kral Annette Bugansky is a designer, who reveals to us how love could be possibly related to knitting by interpreting it into vases with the help of ceramic material. Yet, Tomas Kral has created an incredibly fresh/pure/plain design of a trash container, emotionally provoked by a clown nose. Umberto Eco has finished his book “History of beauty”, with the remark: “Our explorer from the future wouldn’t be able to define the esthetic ideal, commonly widespread by mass media of the 20th century and after that. He will have to give up to the orgy of tolerance, to total syncretism, to the absolute and uncontrollable polytheism of Beauty”. Beauty is in the eye of the observer. Therefore, notion is what gives shape to personal choice in the variety of possibilities and builds the idea of form. Richard Appignanesi is an art historian, who thinks that the spirit of romanticism could be the homeopathic cure for the postmodern eclecticism: “The only cure for postmodernism is the irremediable disease of romanticism” (Postmodernism for Beginners, UK, 1999). and what is romanticism if not appreciation of feelings? Enchanting, emotional, exalted/lofty and prosaic. The reproduction of the internal world by the impressions of the external one. Transmitting personal emotions in creating shapes when the more individual likes/preferences are affected, the higher the esthetic value of these shapes is.
Ivaylo Nedelchev "self-portrait - pen"
3. Contrast as an instrument of artistic and emotional choice. Instruments for achieving and giving interpretation to emotions by design can be different, but undoubtedly one of them is contrast.
Emotional is considered the choice, provoked by spontaneous feelings and thoughts, and by artistic we mean the choice dictated
by the aesthetic standards of the personality. Contrast, as an opposition, is a provocation for emotions and one of the formal signs/indications for creating an artistic composition.
One of the assignments in the discipline of “Form building“ (Department of Engineering Design, Technical University Sofia) is based on different categories, with the help of which is made a composition with a leading factor contrast between materials, factors and other elements of the system. What we are aiming for is a fully balanced composition. When analyzing the detected solutions attention was brought to their emotional value.
Independence, freedom, indefiniteness are typical characteristics for emotions, which contemporary design has needs to capture. Put this way, the task gives students a chance to apply their knowledge of building a composition and to seek emotional effect through the conflict of balance demand.
Diana Dineva "Chaos and form" Savina Stoeva "Contrast"
Contrast is that part of a composition, which brings along a problem and simultaneously allows its solution. Exactly this accent draws one’s attention and gives rise to emotions by comparing opposites.
Part of the above can be observed in Sayaka Ganz’s works. The author creates emotionally influential figures using banal/ ordinary everyday things. She refracts personal choice through the prism of various initial shapes. In search of an idea of convergence, she manages to find and express that hidden meaning, in which Person / Idea / Shape overcome eclecticism of postmodern reality and remind us of the dynamics of contemporary transformations.
Sayaka Ganz “Convergence”
4. Conclusion
“The world of stocks has gained an incomparable ability to overfill with its images modern people’s perception, whatever their status – the difference between the artist and the ordinary person is of minor importance.“ Umberto Eco
Modern man comes across the contradictions of his own environment more and more often. Big social networks have engulfed the intimate, personal world. Knowledge isn’t gained, it’s being used in the new postmodern environment. Shortening distances, global cyber space, theory and the project of human genome – all these are products of the present, which standardizes us and makes our personalities disappear just like things disappear because of mass equalization and overproduction.
89

This is why emotions, as short-lived and imperceptible conditions, have become the main accent in contemporary design; they have an important role in shaping when displaying their dynamism and changeability. Namely emotions complete the interaction between the separate parts of a project. A creative personality will use emotions to form ideas, avoiding cliché patterns and by freeing one’s imagination, will turn eclecticism into wanted contrast, which will restore the lost “aura” of uniqueness.
Claes Oldenburg “Spoon,bridge and Cherry”
5. References
‐ Rand, P „Design Form and Chaos“, Yale University Press New Heaven and London, 1993
‐ Appignanesi, R. Garratt, C. Ziauddin, S. Curry, P. Postmodernism for Beginners, UK, 1999 Bulgarian translation by Rositza Raicheva „Представяме ви Постмодернизъм“ Апострофи, 2002
‐ Eco,U “History of Beauty”, 2004 /Storia della bellezza (2004, co-edited with Girolamo de Michele – English translation by Alastair McEwen , History of Beauty, 2004)
Bulgarian translation by Margarita Zlatarova and Evdokia Zlatarova „История на красотата“, Кибеа 2006
6. Authors and works
‐ Gentry,Nick “Auto emotion” -2010
‐ Bugansky,Annette “ Vases with knitted texture” - 2012
‐ Kral, Tomas “Ceramics container” – 2010
‐ Sayaka Ganz “Convergence” - 2009
‐ Oldenburg, Claes “Spoon, bridge and Cherry” – 1988
Featured are works by students from the educational process "Form building", (Department "Engineering Design", Technical University of Sofia)
Plamen Motev, Ivaylo Nedelchev Diana Dineva, Savina Stoeva
Teacher: Asst. Prof. Ochkova-Dimitrova E - 2011
90

CORPORATE BPM ACTIVITIES TOOLS IN THE BULGARIAN ENTERPRISES
ИТСТРУМЕНТИ ЗА ПРИЛАГАНЕ НА ПРОЦЕСЕН МЕНИДЖМЪНТ В БЪЛГАРСКИТЕ
ПРЕДПРИЯТИЯ
Head Assist. Eng.Nikolova - Alexieva V. PhD.,
Faculty of Economics – University of Food Technology – Plovdiv, Bulgaria
Abstract: Until recently most business processes efforts focused on redesigning or improving specific business processes. In the past few years leading organizations have realized that they cannot achieve the results they want by modifying specific process in isolation from one another. The only way to achieve a significant competitive advantage is to assure that all the processes that make up a common value chain are integrated and support each other. This insight, in turn has lead organization to begin to focus on enterprise -level or to focus on BPM strategy. Business Process Management (BPM) is a management approach that describes how companies can achieve efficiencies by integrating and improving their business processes and by aligning those business processes with corporate strategies and goals. Companies that routinely practice Business Process Management (BPM) are able to consistently improve on the results obtained from existing processes. This BPM research report summarized information provided by 350 respondents who participated in the survey within the period of three years (2009-2011). The respondents represent a broad cross section of Bulgarian industries. The main goal of this survey is to summarize the BPM tools and activities and to draw a picture of the latest concepts in BPM. The results reflect the perspectives of a broad base of Bulgarian managers interested in BPM. The results show that more and more Bulgarian companies recognize the need for developing a system for measuring the functioning of the company; as the necessity as well for developing process architecture to specify interrelation between a strategy and processes. More and more Bulgarian companies use outstanding consultants for training the company’s process managers; for using balanced scorecards; for undertaking Six Sigma projects and an process - automation procedures, for outsourcing of business - processes as well as the ERP - support of Business Process Management.
Keywords: BUSINESS PROCESSES MANAGEMENT; BUSINESS PROCESSES MANAGEMENT SYSTEMS; SIX SIGMA; BUSINESS PROCESS REENGINEERING, WORKFLOW; ERP
1. Introduction
Business Process Management is a management approach that describes how companies can achieve efficiencies by integrating and improving their business processes and by aligning those business processes with corporate strategies and goals. Companies that routinely practice Business Processes Management (BPM) are able to consistently improve on the results obtained from existing processes. Companies that undertake more extensive business process redesign efforts [5] frequently achieve improvements in excess of 50 %. It simply reflects the fact that most existing processes are less efficient that they could be and new technologies and processes management make it design much more efficient processes.
Business Process Management has been a hot business topic in Bulgaria since 2005. Most managers think of it as the logical continuation of the interest in business processes that started in early Nineties and reached a crescendo in the beginning of the new Millennium with Business Process Reengineering [2], Six Sigma, Workflow [6] and ERP. Because of its extensive roots and because there are several new approaches included the Business Process Management it is difficult to develop clear picture of BPM. Like any phrase that is comprised of familiar words and embraced by a number of rather different communities-including executives, business process consultants, business analysts, Six Sigma experts, enterprise architects, CIOs and software developers- the phrase Business Process Management (BPM) means different things to different people.
This corporate BPM activities’ analysis report summarized information provided by 350 respondents who participated in the survey within the period of three years (2009-2011). The respondents represented a broad cross section of Bulgarian industries. Given the size and diversity of the respondents, this is the representative overview of how Bulgarian organizations understand BPM, what BPM activities companies are currently engaged in and what BPM activities Bulgarian companies are planning for the future. The main goal of this survey is to draw picture of the latest concepts in BPM and the results reflect the perspectives of a broad base of business managers interested in Business Process Management. Report offer readers insights into
the kinds of BPM development efforts currently underway and the ways their own company’s BPM efforts compare with those of other companies.
2. Exploration
For settle what is the importance of BPM and wether this approach is used this survey was held in 350 Bulgarian enterprises during the 2011. Two earlier surveys with similar questions were conducted in the 2010 and 2009. In all cases we sent an e-mail to the membership of Bulgarian Chamber of Commerce and Confederation of the Employers and Industrialists in Bulgaria – CEIBG invited them to participate in the survey. We had 350 people completed the survey in 2011. During the 2010, 250 people took the survey and during 2009, 320 people completed survey. In all three cases we had additional responses from people who looked at the survey and answered only a few questions. We have ignored these partially completed responses and report only on the responses of those who completed the questionnaire. Even then the total responses to each specific question vary because some respondents answered every question while others skipped one or two specific questions.
The respondents were asked to describe if their organizations had Business Process Management Group to coordinate, train and support business process efforts within the organization. Those that had a BPM Group were asked to specify where it was located. The enterprises that are mature [1] about enterprise level work – companies moving from CMMI Level 3 to CMMI Level 4- usually have their BPM Group at the enterprise level [3], reporting to a corporate level executive like planning and strategy. Companies, that have their business process groups located in IT and Quality Control [4] usually have a more limited perspective on BPM and are focused only on a part of the total BPM picture (See Fig.1)
As can see at Figure 1 there isn’t much difference between the responses over time. Of those of the respondent having a BPM group, most report the group is located at the executive level, at the departmental level or in IT level. The survey shows that about 40% of the enterprises said they do not have a BPM group and this tendency is not changes trough the years. This overall patterns reflected by all the respondent subgroups, except for enterprises
91

with a major commitment to BPM and almost a 30% of those respondent indicated that their organization are more likely to have a BPM group at Strategic level.
Another main question to the respondents was “Which BPM tools are most valuable for the company today. Comparing 2011 to 2010 it is noticed that the slight but continuing decline in
Fig. 1 Where the BPM Group is located within the organization
respondents who say graphics tools are most important and the slow increase in those that say that repository –based process modeling tools, Business rules tool and BPMS software have been most important to their process efforts (See Fig.2).
Fig.2 The BPM software tool that was most valuable for the company
The results show that Process Modeling tools were most valuable for about 50 % of the respondents and this tendency increase trough the years. The wide variety of other tools, that some companies
found most valuable are Graphics tools, BPMS Suite and Organizational Modeling tool. In 2010 and 2011 only 5 % of the respondents found a Simulation Tool to be their most valuable business process tool. Similarly in 2011 only 6% found some kind of performance metrics tool or system was their most valuable tool. Obviously these responses suggest the range of projects and BPM corporate activity begin undertaken by the Bulgarian enterprises. It interesting to see that through the years BPMS tools are still in third place after Process Modeling tools and Graphics tools and the interest tends to growing.
Another important question to the respondents was “What business process products and services were currently being used at their organizations” and their responses have summarized in Fig. 3.
Fig. 3 Process products and services currently used by companies
Respondents are moving away from graphic modeling tools and shifting to repository –based process modeling tools that enable users to save and accumulate process models. In 2011 the most interesting change is the sharp rise in the number of respondents that said they were using repository –based modeling tools. There is also a growing interest in analyzing and redesigning processes. The growing interest in enterprise work is probably also driving the growing focus on process modeling tools. In spite of budget cuts many Bulgarian enterprises continue to train their workforce in process analysis and design skills and enterprise technologies. In 2011 32% of the respondents said that they were using a BPMS tool, up from 30% who said they were using a BPMS tool in 2010. The respondents who were using a BPMS tool were asked “What specific BPMS product they were using” (See Fig. 4). In 2011 as in 2010, the tools that were most commonly chosen were sold by IBM, Oracle and SAP.
To determine what kinds of business process efforts companies were currently engaged in the respondents were asked to choose from a wide variety of BPM initiatives. In 2011 the largest number of respondents said their companies were working on the development of enterprise architecture. In 2010 however there is a large amount of respondents that said they were focused on major process redesign projects. We interpret this as a shift in emphasis that resulted from a greater emphasis on a project that would show immediate result (See Fig. 5). In 2010 as in 2009 the largest number indicated that they were working on the development of enterprise process architecture. The second largest group is focused on Major
92

Process Redesign projects. Given other indicators that suggest that most companies are between CMMI level 2 and 3, it can see as an indicator that most companies are at least interested in moving from CMMI Level 2 to Level 3. Given the complexity of BPM market most companies may be firmly at Level 2 in terms of business process redesign but be engaged in ERP installation that is leading them to focus on IT architecture.
Fig.4 BPMS Tools being used by respondents’ companies
Another interesting question that we asked the respondents is to describe how important SOA and Cloud Computing are to their business process projects. The results show that most Bulgarian enterprises weren’t ready to use SOA or Cloud Computing in conjunction with their business process activities. These results doesn’t mean that the companies not used SOA and Cloud Computing for some other purpose, but the question is only focused on enterprises that are using these new technologies in conjunction with process efforts.
As can see in Figure 6 the largest number of the respondents is not too concerned about SOA or Cloud Computing. 68% are either not interested or just beginning to explore SOA and Cloud computing. At the same time 8% indicated that SOA was very important to their process efforts and 3% said that Cloud Computing was very important. The main conclusion is that Cloud Computing was just coming out the labs and hasn’t got full market acceptance yet. SOA seems to be further along the adoption curve and is probably in the process of being explored by the “early majority “(from the Moore’s technology adoption life cycle curve [4]).The “early majority” represent some 35% of the market. They won’t adopt new technologies until they consider it well-proven. But neither is widely used by BPM practioners today and vendors will need to continue to promote both technologies if they are to become a key part of BPM (See Fig. 6).
About 80% of the respondents from Central, Norht, East and South Bulgaria said that neither SOA nor Cloud Computing were very
important to their organizations. By contrast, only 15 % from Sofia-capital and the region (West Bulgaria) responded in the same way. 21 % from the West Bulgaria said that SOA was very important to them while only 8% from Central, North, East and South Bulgaria said the same. On the other hand only 4% from the Bulgarian respondents said that Cloud Computing was very important. Of the various industry groups, government and military respondents, 34% said that SOA was very important to their
Fig.5 BPM activities in which companies were engaged in organization and 4% indicated that Cloud Computing was very important. All respondents from large companies were slightly more interested in SOA and Cloud Computing than the average but only 12% of the respondents from large companies said SOA was very important and only 5% said that Cloud Computing was very important to them. BPMS tools were XML based tools that included modeling, EAI and Workflow. No sooner did most process practitioners begin to master these terms than BPMS was expanded to include Business Rules, Data Mining and Business Intelligence. Within the past three years the BPMS tool set has expanded to include SOA, and within the past two years the vendors have begun to promote Cloud Computing. When you consider that most companies are still trying to model their core processes, this onslaught of technologies, one after another has been a bit overwhelming and that most companies would uninterested in trying to mater the newest addition to the BPMS mix. In fact so many companies have embraced SOA, given how new it is. To inquire about obstacles to wider acceptance of business processes within organizations the respondents were asked
93

“What is your biggest challenge as you seek to gain widespread acceptance for BPR activities at your organization”. 36% of the respondents said that senior management wasn’t interested or was distracted. Given the economic downturn in 2009 senior executives can be executed for being focused on external events and on finances and the economy. Moreover the economic downturn had
Fig.6 Process work and SOA or Cloud Computing
something to do with the fact that many management teams were calling for action to reduce costs and that several different groups – from Six Sigma to Process Redesign to IT-were suddenly offering solutions. There are only a few companies who have gone far as to establish a Chief Process Officer, but many have established Business Process Management Centers of Excellence [5], and many more are talking about BPM and putting a major emphasis on the centralized Management of the organization’s process initiatives. If the lack of such central coordination is really the major problem that 60% of companies face, then it can expect that centralization is going to become a growing issue in the near future (See Fig.7).
Doing ROI on small projects is easy so the fact that 22% say they have trouble with ROI suggests that they are concerned with larger process projects. Process redesign projects that introduce new technology are always hard to cost accurately, since the organization isn’t sure exactly what it will cost to get the technology implemented. Harder are process management projects, like an effort o establishing business architecture? One doesn’t create process architecture to make money – one creates it to provide tools and data one can use to improve process management. Executives often do argue about the costs of process architecture work because they don’t realize that they need an accurate description of all their processes as part of ongoing effort to gather good data on how processes are performing. The main conclusion is that selling the idea of enterprise process work is tightly integrated with how well senior executives understand and value processes.
3. Main conclusions
In general the results show that the initiatives regarding business processes are in a good shape. The Bulgarian enterprises decrease their expenses in 2009 for such initiatives, but the effect was a general decrease of growth of those initiatives, and not initiatives as redesign of the processes and implementation of systems for BPM are the main ones that have been undertaken in time of crisis. In the long term in 2009 the research includes questions for measurement of the general process maturity of the organizations and to follow the growth of their process maturity.
Fig.7 Challenges to widespread acceptance of process efforts
The results from 2011 prove that the Bulgarian enterprises continue to become more mature with regard to their processes. Most of the companies in Bulgaria are still focused on documenting, modeling and improvement of the processes.
In comparison to 2010 however most companies work also on the modeling of the processes and they are more and more interested in elaboration of means which are necessary in order to be able to measure and manage the processes on the enterprise level.
It seems that the enterprises from Sofia and the region and Varna and the region advance equally. There are some regions where the trend of the organizations to model and rely on methodologies place them ahead, and there are regions where the reorganizations tend to focus on new technologies and to be innovative. But most companies in both regions are very similar.
The variety of activities which fall under “management of business processes” is still very big, but it seems that there exists a growing consensus that there is a need to integrate the approaches towards BPM and to train practitioners in a variety of process techniques, including Lean, Six Sigma, business rules, business process and business analysis. Slow but surely a process discipline establishes.
The software merchandisers slow but surely create more complex and highly integrated platforms for BPM or platforms which will support the practitioners in very different projects. Still real barriers for using BPMS exist. Until most companies do not understand better business processes they will not be able to make use of the advantages which the new software products offer. In spite of the problems however the software BPM market continues to grow and the respondents await this to continue in 2012.
References
1. Alexievа V., Research of the maturity in the management of the processes in the Bulgarian small- and middle-scale enterprises, Annual scientific conference, Scholarly coalition labors of the scientists in Bulgaria, v.VІІІ, ISSN 1311-9192, 2011, (p.338-342)
2. Darrel Rigby,The Secret History of Process Reengineering, Planning Review, 2007,( p.23-90)
3. EFQM Levels of Excellence. European Quality Award Information Brochure, EFQM, 2007
4. European Commission - Aid Delivery Methods, Vol.1, Project Cycle Management Guidelines, Brussels, 2008
5. Fisher, L. BPM and Workflow Handbook, Future Strategies Inc., New York, 2007,( p.122-140)
6. Fong, J. Information Systems Reengineering and Integration. Springer, 2006,( p.78-90)
94

THE IMPORTANCE OF USER AND TASK ANALYSIS FOR THE DESIGN OF NEW SYSTEMS INTERFACES
РОЛЯТА НА АНАЛИЗА НА ПОТРЕБИТЕЛИТЕ И ЗАДАЧИТЕ ИМ ПРИ
ПРОЕКТИРАНЕ НА ИНТЕРФЕЙСИ ЗА НОВИ СИСТЕМИ
M.Sc. Ivanova-Vassileva S. Department of Engineering Design – Technical University of Sofia, Bulgaria
Abstract: This paper describes a research on different approaches for user and task analysis in the design process of user interfaces for new systems in Bulgaria such as different vending machines. It is discussed the possibility to use conventional techniques for the development of user profiles, use case scenarios and low-fidelity prototypes respectively the need of a specific approach for the particular system. A further goal is to investigate the influence of the initial research on user characteristics, their typical tasks and various scenarios of the using the developed system on the user interface usability and acceptability. As a result of that is expected to obtain design process optimization and re-design expenses decrease for the user interfaces design of new systems.
Keywords: USER INTERFACES DESIGN, ACCEPTABILITY, USABILITY, USER PROFILES, TASK ANALISES, USE CASE
SCENARIOS, INTERFACES PROTOTYPING
1. Въведение
В процеса на проектиране на потребителски интерфейси може да се приложат различни подходи за анализ на потребителите и техните задачи, които зависят, както от спецификата на конкретния интерфейс (например за различни видове автомати за самообслужване, за уеб базирани приложение, за специфични приложения и т.н.), така и от етапа на проучването, новостта на системата и др. Независимо от избрания метод за набавяне на този тип информация в резултат на анализа и свързаното с него подготвяне на прототипи се повишават степента на ползваемост и приемливост на разработваната система, оптимизира се проектният процес и се намаляват разходите за дизайн и ре-дизайн.
2. Предпоставки и средства за решаване на проблема.
Представено е изследване на нови за България системи, които са две групи. Първата по-голяма група са автомати с различно предназначение – например за наемане на автомобил, за закупуване на билети и карти за градски транспорт, за използване на обществен велопаркинг, за билети и карти за лифт и влек, за връщане и резервация на книги в библиотека, за поръчки и доставка на хранителни продукти, готови ястия и напитки, за разпечатване на снимки, албуми и календарчета, за изработване на визитни картички, за четене и разпечатване на вестници и списания, за обмен на валута и едри банкноти и др. Втората група обхваща нови за България устройства като: уред за базови медицински измервания, устройство за локализиране на деца, многофункционален обществен телефон, устройство за навигация в голям търговски или културен център, интериорен конфигуратор и др. под. При обучението по Инженерен дизайн студентите се запознават с различни техники за подготвяне на потребителски профили, сценарии за случаите на приложение и за изработване на груби прототипи на интерфейси в рамките на дисциплините Ергономично проектиране, Софтуерна ергономия и Техническа използваемост. Класическите подходи за анализ на потребителите и техните задачи в процеса на проектиране на потребителски интерфейси се базират на международния стандарт БДС ЕN ISO 9241-11 [1]. Тъй като в случая става дума за нови системи, е възможно да се приложи систематично предварително планиране на ползваемостта на интерфейса и още в най-ранна фаза да се констатират евентуални проблеми, които да се отстранят без сериозни разходи, свързани с ре-дизайна.
Първоначално най-общо се проучва контекста на използване на проектираната система. В таблица 1 е даден пример за автомат за наемане на автомобил.
Таблица 1: Пример за описание на контекста на използване на автомат за наемане на автомобил (потребителите и задачите им).
Потребители
Групи потребители
Основни потребители Лица със свидетелство за управление на МПС, сключили необходимите застраховки.
Второстепенни и индиректни потребители
Лица, упълномощени от водача, да наемат МПС.
Умения и познания
Умения/познания относно с продукта
Не са необходими.
Умения/познания относно системата
Предимство са умения или познания за други автомати.
Опит със задачата Не е необходим.
Организационнен опит Не е необходим.
Степен на обученост Всеки потребител, който може да чете и има основни познания в използване на компютри и автомати.
Умения с входни устройства Не са необходими специфични умения с входни устройства. Предимство е познаването на подобни автомати (АТМ или др. под.). Неопитните потребители биха се справили, но за повече време.
Квалификации Потребителите нямат нужда от каквато и да е квалификация.
95

Езикови умения Езикови умения по български или английски, немски, френски език.
Общи култура Предимство е познаването на автомати.
Личностни характеристики
Възраст Водачи на МПС 18-65 години. (САЩ от 21 г).
Пол Мъже и жени.
Физически способности Способност за натискане на бутони на входното устройство или виртуални бутони на дисплея му.
Физически ограничения и инвалидност
Те са по-скоро индиректни потребители - лица, които се возят с придружител.
Интелектуални способности Средно ниво на интелигентност.
Отношение и мотивация Готовност за използване на автомати и желание да спести време
Задачи
Разделяне на задачата на подзадачи
Възможно е задачата да се раздели на серия подзадачи.
Наименование на задачата Основната задача е: наемане на лек автомобил (или мотоциклет).
Честота на изпълнение на задачата
От рядко (веднъж годишно), или епизодично (2-3 пъти годишно) до често (поне веднъж месечно)
Продължителност на задачата
Зависи от категорията потребители, като средно е от порядъка на 1-2 мин.
Гъвкавост на задачата Реализира се, чрез опция за корекция на поръчката.
Изисквания относно физическото и умствено равнище
Средно-статистическият потребител е в състояние да се справи с поставените задачи и няма специфични изисквания към него
Резултат от задачата Наемане на автомобил, издаване на документ за наема.
Опасни последствия от грешки
Наемане на погрешен автомобил или фининсови загуби
Критични изисквания по отношение на безопасността
Налице е защита от злоупотреби с данните и самоличността на потребителя, не се допускат потребители без валидно свидетелство за управление на МПС.
На този етап също се планира какви са целите на ползваемостта и как ще се измерва тя по отношение на ефикасността, ефективността и удовлетвореността (виж примера в таблица 2).
Таблица 2: Пример за планиране на ползваемостта
Цели на ползвае-мостта
Измерване на ефикас-ността
Измерване на ефектив-ността
Измерване на удовлетворе-ността
Адекват-ност за обучени потребители
Брой успешно изпълнени задачи
Време за изпълнение
Удовлетвореност по отношение на основните функции
3 3-5 min. 9 по скала от 1-10
Измерени 3 ср. 4,1 min ср. 9,5
Разбирае-мост за начинаещи потребители
Процент за-дачи, из-пълнени успешно при първи опит
Време за изпълнение при първи опит
Честота на повторно ползване
90% 8-10 min. 90% от потре-бителите
Измерени 100% ср. 8,8 min 100%
Адекват-ност за рядко или епизодично ползване
Процент за-дачи, из-пълнени успешно след определен период на прекъсване
Време за повторно научаване на функции
Честота на повторно ползване
95% 1-2 min. 90% от потре-бителите
Измерени 100% ср. 1,2 min 100%
Улесняване на обучението
Брой научени функции
Време за научаване
Скала за оценяване на лесното научаване
3 2 min. 8 по скала от 1-10
Измерени 3 ср. 1,5 min ср. 9,5
Четливост Процент думи, про-четени пра-вилно от номално зрително разстояние
Време за правилно прочитане на конкретен брой знаци
Скала за оценява-не на зрителния дискомфорт
95% 30 sec. 2 по скала от 1-10 Измерени 100% 26 sec. няма дискомфорт
Изготвена е също спецификация на ползваемостта за конкретен контекст на използване , в която вече се задават параметрите на ползваемостта за конкретните проектни условия. Пример за спецификация на измерванията на ползваемостта за контекста ”промяна на настройките” е даден в таблица 3.
На базата на тези предварителни анализи и планиране се провеждат измервания на различни параметри на ползваемостта за подготвените прототипи [1, 2]. Броят на подопитните лица в конкретния случай е 4 човека - от 24-годишна до 60-годишна възраст. Експериментът е проведен в подобна на реалната среда и индивидуално с всеки един участник. Сред подопитните лица има млади и дългогодишни шофьори. Първото лице е наемало многократно леки коли в чужбина. Другите лица са наемали 1-2 пъти коли в България, т.е. нямат много опит с подобни услуги. На базата на
96

проведения експеримент е направен анализ и по-долу са обобщени резултатите. В случаят този брой подопитни лица е достатъчен за получаване на обща представа за степента на ползваемост на системата, която не е много сложна и макар и нова, не е от нов тип.
Таблица 3: Пример за спецификация на измерванията на ползваемостта за специфичен контекст (промяна на настройките)
Задача: Промяна на настройките в личния профил на клиент (лични данни като адрес, телефони за връзка, въвеждане на предпочитани превозни средства и др)
Специфичен контекст: Стандартни указания посочват на потребителя от къде може да направи корекции в профила си или корекции в запитването за определено превозно средство, което е стартирал. Потребителите могат да извършват процедурата и чрез интернет.
Ефикасност: Точност - Въведената информация не съдържа грешки или ако съдържа, тя може да се отстрани чрез редакция.
Завършеност - Завършеност е налице, когато няма пропуски при информацията, която трябва да бъде въведена, изтрита или редактирана.
Ефективност: Всички необходими промени трябва да могат да се извършват за много кратко време (от 30 до 60 секунди).
Удовлетвореност: 5% от потребителите изразяват неудовлетвореност относно процедурата на промяна на настройките.
Съществуват редица традиционни подходи и техники за анализ на потребителите и изпълняваните задачи [3] - подготвят се потребителски профили, в които са проучени характеристиките на отделните групи потребителите, типичните им задачи и разработват се сценарии за случаите на приложение или сценарии, които описват взаимодействията със системата. В случаят като алтернатива е използван методът „ориентирано към задачите проектиране” [4]. С негова помощ се подготвят сценарии (табл.. 4) за изпълнение на типични задачи, на базата на които се изработват груби прототипи на системата (фиг. 1). Формулират се и изискванията към системата, които включват следните категории: задължителни, препоръчителни, пожелателни и несъществени (табл. 5).
Таблица 4: Пример за сценарий
Сценарий: Стефан е правоспособен водач на автомобил, често пътуващ с аеролиниите, с установени навици, който се възползва от възможността за вземане на кола под наем всеки месец (редовен потребител). Той избира от няколко класа автомобили (икономична, компактна, луксозна, лимузина, бус, ван и др.). След като е избрал клас автомобил, посочва конкретна марка и модел, място и начин да получи автомобила (от посочен паркинг в града или да му бъде докарана до даден адрес). Посочва 36 часа като време, за което желае да наеме автомобила. След това Стефан избира допълнителните екстри, които ползва всеки път, когато наема кола(GPS навигация, детско столче, вериги за сняг) За наемането на автомобил предоставя личните си данни и плаща за услугата. За да му бъде отдадена кола под наем, задължително условие е сключването на застраховка. След това получава точни указания откъде (според заявеното от него) и как ще получи колата, регистрационния номер на колата и възможностите за нейното връщане след изтичане на уречения срок за ползване. Забележка: Извършената задача по наемане на кола е основната задача за системата. Изборът на марка, модел, клас и т.н. са често извършвани подзадачи с особена важност. Без тяхното изпълнение услугата не може да бъде извършена. Поради опитност на потребителя изпълнението на задачите е автоматично.
Фиг. 1: Груб прототип на графичния потребителски интерфейс на автомат за наемане на автомобил
Таблица 5: Списък с изисквания към системата
Абсолютно задължителни изисквания: възможност за смяна на езика, опция сключване на застраховка, помощна информация, възможност за връщане стъпки назад и промяна на заявката, ясна и логична последователност на изпълнението на задачите, работа на системата 24/7. Препоръчителни изисквания възможност за избор на автомобил, възможност за избор на времеви граници. Пожелателни изисквания възможност за свързване с оператор, плащане в брой Несъществени изисквания разпечатване на маршрут,
На базата на написаните сценарии е проведено „проиграване” [4, 5] (виж табл. 6), за да се установи дали при изработените прототипи не са налице груби грешки в структурирането и представянето на информацията, интуитивна ли е последователността на екраните, къде потребителят има нужда от помощ. Проиграването е с участието също на четирима участници – също между 24-годишна и 60-годишна възраст и дава информация относно мнението на потребителя за подобрения и алтернативни решения.
Таблица 6: Пример за конкретна стъпка от проиграването
Описание на стъпката Избор на менюто „помощ” от навигационната лента
Има ли познания потребителят да извърши тази стъпка?
Да, тъй като става въпрос за ползването на стандартен бутон, познат от други подобни системи.
Грешки, колебания, време за изпълнение
Без грешка, без колебание, за 2-3 сек.
Констатирани проблеми “Контакт с оператор” да се премести.
Коментари вкл. възможни решения
“Контакт с оператор” да е включено в подменюто “помощ”.
3. Резултати и дискусия
След проиграването е направен анализ, който включва идентифицирането на проблемните елементи на системата от гледна точка на успешното изпълняване на задачите от потребителя и изготвянето на списък на препоръки и предложения за отстраняване на проблемите. Изследвани са две вариантни решения.
При първия интерфейс е необходимо да се промени последователността на езиците и да отпаднат част от изброените езици, като се постави български език на първо място, а след него английски, немски, руски, френски и испански. Часът на взимане на превозното средство не е
97

необходим. Не е ясна формулировката „специални превозни средства”. С цел защита на лични данни трябва да е налице сигурност както за потребителя, който предоставя на системата данните си, така и за фирмата, предлагаща услугата. Липсва крайна сума и как е калкулирана. Да се добавят опции за начин на плащане (напр. плащане в брой). „Помощ” и „контакт с оператор” да се обединят. От менюто с екстри да отпаднат опциите за „зимни гуми”, „шофьор” и „хладилна чанта”, като се добави „брой врати”. Липсва описание как работи системата.
При втория вариант за интерфейс липсва избор на език различен от български. Да се използва термина „икономичен клас”, а не „компактна класа” и да се добавят „спортен клас”, „високопроходими автомобили” към списъка с клас автомобили. Да са ясни от самото начало цените на наеманите автомобили, за да се спести време и да потребителят да има възможност за избор според наличните си финанси. За марката „Сеат” няма луксозни коли, така че да се замени с друга марка автомобил. Не са изброени моделите, а само марките на автомобили, от които потребителя може да избере. Да се добавят екстри като „брой врати” и други. Не е посочена крайната сума, която зависи от дните на наемане, екстрите и др. Да се махне e-pay от опциите за плащане. Няма посочена валута или избор на такава.
В резултат на проиграването се прави избор на вариант, отстраняват се проблемните елементи и се провежда измерване на ползваемостта. Анализът на резултатите (виж. някои резултати в табл. 2) констатира, че разработеният интерфейс за системата за наемане на автомобили е ефикасен и лесен за употреба за дългогодишни и за начинаещи потребители на автомати в еднаква степен. Информацията е подредена логично и е степенувана по важност. Поднесена е на прост и достъпен език. Не се използва неразбираема терминология. Повечето потребители смятат, че е осигурена последователност, като са използвани едностилни елементи (бутони и полета) и е използван един шрифт за изписване на въвежданите и пояснителни текстове. Гарантирана е познаваемостта на марката - логото присъства по време на цялата сесия на потребление. Цветовото кодиране спомага за по-бързата работа със системата и изясняване на активността на съответните бутони или подменюта. Потребителите имат контролирана свобода на действие в системата - могат да разглеждат и коригират до момента въведена информация в заявката си. Въвеждането на данни е сведено до минимум - въвеждане на номер на свидетелство за правоуправление и номер на кредитка карта. Грешки при въвеждане могат да станат само в тези две полета. Потребителите са на мнение, че пътищата към информацията са ясни и кратки. Ползването на системата е логично и оптимално с оглед на бързото използване. Съобщенията за грешка и успешно извършена заявка са ясни и точни - информативни, без да са обяснителни, като комбинацията от графични метафори ги прави по-бързо разпознаваеми.
Направени са следните предложения за корекции и подобрения на интерфейса: да се замени фразата „шофьорска книжка номер” със „ номер на свидетелство за правоуправление”; при избиране на модел на автомобил да се постави пояснителен текст „Избери модел...”; при съобщение за грешка, което гласи „Вашата заявка не може да бъде изпълнена”, да се поясни защо и да се даде на потребителя възможност за корекция; да се подравнят текстовете и полетата с етикетите на подменютата; да се добави в подменюто „екстри” опцията велобагажник преди багажник за ски, тъй като е по-често ползвана.
След корекциите за постигане на съответствие с констатираните проблеми и с направените предложения за подобрение са разработени фини протопи (виж фиг. 2). Чрез такива прототипи е оценена приемливостта на системата за потребителите. Дадената оценка се изчислява на базата на данни, събрани чрез въпросници.
Фиг. 2: Фин прототип на графичния потребителски интерфейс на автомат за наемане на автомобил.
Като се използват в комбинация тези подходи (планиране респ. измерване на ползваемостта в съответствие с ISO 9241-11 и писане на сценарии респ. проиграване според класическия метод за ориентирано към задачите проектиране) за проучване на потребителите и задачите им, се постига много висока степен на ползваемост на проектираната ситема, като спецификата е свързана по-скоро с прилагането на съответния подход за определен етап от анализа и прототипирането и избора на конкретни параметри на ползваемостта, които са релевантни за разработваната система.
4. Изводи
Независимо от това дали ще се използват един или повече подходи за планиране и оценяването на ползваемостта при анализа на потребителите и техните задачи и дали са класически методи, дали са базирани на нормативни документи или са подготвени специфични, т.е. адаптирани към конкретния случай, важен е резултатът, а именно с помощта на предварителен анализ и изработване на груби и/или фини прототипи на интерфейса да се повиши степента на ползваемост и приемливост на потребителския интерфейс и съответно да се постигне оптимизация на процеса на проектиране и да се намалят разходите за ре-дизайн при разработването на потребителски интерфейси за нови за България системи като например различни видове автомати за самообслужване.
5. Литература
[1] International Standard Organisation, ISO 9241-11 (1998) Ergonomic requirements for office work with visual display terminals (VDTs) - Part 11: Guidance on usability
[2] Stowasser, S., Methodische Grundlagen der softwareergonomischen Evaluationsforschung. Aachen: Shaker Verlag, Institut fuer Arbeitswissenschaft und Betriebsorganisation, 2006, pp. 113-118
[3] Nielsen, J. Usability Engineering. San Francisco, Morgan Kaufmann Publishers Inc., 1993, pp. 43-48, 73-77
[4] Lewis, C., Task-Centered User Interface Design: A Practical Introduction. Colorado: University of Colorado, Boulder, 1993, (Lewis, C., J. Rieman)
[5] Nielsen, J., Usability Inspection Methods. New York, John Wiley & Sons, 1994, pp. 105-140 (Nielsen, J., R. L. Mack)
98

DESIGN OPTIMIZATION ON EVELATOR CAR FOR DOUBLE-DECK SYSTEM
Prof. Dr. Imrak C.E. 1, Kocaman M. 2 Faculty of Mechanical Engineering Istanbul Technical University - Turkey 1,2
Abstract: This study is focused on CE based design processes and design tools DFA and DFMt. After discussing these design tools’ structures
and criticizing advantages and disadvantages of them, an industrial case study will be illustrated. Some subassemblies of one filling and packaging system have been redesigned with the help of CAD software. Then current and new designs have been compared at the point of assembly time, ease of assembly, part varieties and quantities, required equipment quantities and complexity. In this study, Boothroyd & Dewhurst DFA Method have been chosen for evaluation procedure. Renewed designs were compared according to their part numbers, costs, efficiency and reliability.
Keywords: DOUBLE DECK, ELEVATOR CAR, BOOTHROYD-DEWHURST METHOD, DFMA
1. Introduction
Manufacturing of a product has a lot of steps up to the final product and these steps contain some others. Planning, product design and product development, material selection, management marketing are some of these processes. These processes involve the design process and designers need to use systematic approaches for the great design. For this reason, user involvement has become a widely accepted point of the usable systems [1-4].
The most common purpose of the design and manufacturing works is reducing the cost and time factors. So, reaching to the final product will be easy with the decrease of time and cost. Design and manufacturing phases of a product are related to each other. Optimising these concepts automatically helps to improve the simplicity of the operations [5-7].
Engineering design is a process of developing a system, component, part or process to meet desired needs with a basic meaning. Keeping in mind this main definition and current competitive commercial conditions, the importance of Concurrent Engineering (CE) can be understood better. Beginning from the late ‘70s, because of improvements in manufacturing and automation systems, Design for Assembly (DFA) and Design for Maintainability (DFMt) have growing importance at design engineering. Both scientific and industrial area, many studies have been done since last 25 years and many articles have been published. The implementations of DFA and DFMt led to enormous benefits including simplification of products, reduction of assembly and manufacturing costs, improvements of quality, reliability and reduction of time to market.
There are great number of methods that provide the desired features on design and manufacturing. Design for manufacturing and assembly method is one of them and it is generally evaluated as using the basis for concurrent engineering. The aim of the usage of the method is reducing the costs of manufacturing and assembly steps, simplifiying the product structure by redesigning it with the fewer parts and ease of manufacturing. The method is the combination of Design for Manufacturing (DFM) and Design for Assembly (DFA) methodologies. DFM means the ease of manufacturing and DFA is the assembly design of the product [8-9].
There are many of published studies on design for assembly application in computer aided engineering [1-9]. Design for assembly (DFA) is a product of the automation endeavors of the late seventies and early eighties when moves toward high levels of automated assembly highlighted deficiencies in current product design with respect to automation capability. There are a number of designs for assembly techniques and evaluative mechanisms [7].
The three best-known and also the most well-documented DFA methods are the Boothroyd Dewhurst System, the Lucas DFA Methodology and the Hitachi Assemblability Evaluation Method [8,9]. Boothroyd-Dewhurst Method is based on two principles: (a) the application of criteria to each part to determine if it should be separate from all other parts, and (b) estimation of the handling and assembly costs for each part using the appropriate assembly process [10].
The works of the manufacturing and design developments contain every areas of products. Transportation area is also one of the developable areas with the new technologies and elevator industry is essential for especially high rise buildings. Sometimes, conventional systems can not meet the requirements for high rise buildings. Double deck elevators were developed to avoid this negotiation.
An application of double deck elevators will be given with details and the effect of the method on the original and revised designs will be evaluated via the related method and the effect of the method on the revised product will be considered. The enhancement of the revised product will be evaluated depend on the related method criterions.
2. Design for Assembly and Manufacturing DFA is a systematic method, which analyzes product designs to
improve assembly easy and reduce assembly time. DFA method can be also explained by helpful of Design for Manufacturing. The objective of DFM is integration of product design and process planning into one common activity. DFA as a central element of DFM has one important characteristic and it addresses product structure simplification, since the total number of parts in a product is a key indicator of product assembly quality.
A review is made of design for assembly (DFA) methods developed over the last fifteen years. It is round that implementation of DFA at the early conceptual stage of design has led to enormous benefits including simplification of products, lower assembly and manufacturing costs, reduced overheads, improved quality and reduced time to market. This integrated structure of DFA and DFM is illustrated in Figure 1 [8,9].
99

Fig. 1: Typical stages in a DFMA procedure DFA methodologies were developed to support the designer by
generating feedback on the consequences of design decisions on product assembly. The aim is to help the designer to produce an efficient and economic design. The application of DFA guides the designer towards a product with an optimum number of parts that requires simple, cost-effective assembly operations and the most appropriate manufacturing processes and materials for its components [8,9]. A number of different DFA methodologies have been developed recently and there are several quantitative evaluation DFA methods. Three best-known and also the most well-documented DFA methods are Boothroyd & Dewhurst DFA Method, Lucas DFA Method and Hitachi Assemblability Evaluation Method [8,9]. In this study, Boothroyd & Dewhurst DFA Method have been chosen for evaluation procedure. Design implementations can be carried out using either its handbook or its DFA software. This method can be applied to either manual assembly systems, special-purpose assembly systems or robot assembly systems.
The aim of design for assembly (DFA) is to simplify the product so that the cost of assembly is reduced. However, consequences of applying DFA usually include improved quality and reliability, and a reduction in production equipment and part inventory. These secondary benefits often outweigh the cost reductions in assembly. It recognizes the need to analyze both the part design and the whole product for any assembly problems early in the design process. Design for assembly concept may be defined as a process for improving product design for easy and low-cost assembly, focusing on functionality and on assemblability concurrently.
3. Boothroyd Dewhurst Method Approaches
Boothroyd-Dewhurst method is a widely used method of the design for manufacturing and assembly and the objective of the method is minimizing the assembly requirement for existing products. This can be achieved by reducing the number of parts to have assembled for the product. Also, the shape and complexity tried to hold on the minimum. The procedure of Boothroyd-Dewhurst method can be divided into the three steps. The first one is assembly type selection. The assembly type selection stage is determined with the factors such as complexity, shape and tolerance. The next issue is ensuring that the remaining parts are easy to assemble. The last factor is reducing the number of individual parts that must be assembled.
In the Boothroyd-Dewhurst method, the works generally contains the original and re-designed works of a product and they are compared depend on assembly cost, part number, handling time and insertion time factors. The final revised design is expected to have lesser value of the design efficiency coefficient [2,4,10].
The flow of the application is considered depend on the Boothoyd Dewhurst rules [10]. The parts of the new design are considered with their elimination situation. It can be eliminated or there is a combination with another parts of the related assembly.
After applying the method to the product, there are;
Lowered part numbers and assembly varieties
The symmetrical parts and ease of handling. So, design efficiency increases automatically.
Minimised number of the fault for the assembly of a product
Boothroyd & Dewhurst DFA Method address the problems of to determine the suitable assembly method, to reduce the number of each part that must be assembled, and to get the handling and insertion processes easily [2]. This method has two strong points of consideration. First, one is effort of reducing the number of part since saving the functionality of product. If all answers are NO, then the part can be eliminated or combined with the others [4]. Secondly, this method is based on a system of penalties, which for the particular activity, including part’s handling, part’s insertion and using these penalties a quantitative judgment options can be established. Using the explanations and tables of handbook, each part in the assembly is compared to its handling and insertion situations.
It is important to quantify the improvements and goals of DFA. Two methods for DFA quantification considered here are the Boothroyd-Dewhurst method and the Lucas method. Boothroyd-Dewhurst Method is based on two principles:
the application of criteria to each part to determine if it
should be separate from all other parts. estimation of the handling and assembly costs for each
part using the appropriate assembly process.
This method relies on an existing design which is iteratively evaluated and improved. Generally, the process follows these steps:
1. Select an assembly method for each part 2. Analyze the parts for the given assembly methods 3. Refine the design in response to shortcomings identify by the analysis 4. Loop to step 2 until the analysis yields a sufficient design
The values are collected and it is obtained a total assembly time. Then DFA index of assembly is computed. The DFA index of a product is computed with EM AM x ( NM x TM) where EM
is DFA Index, AM is basic assembly time for each part, NM is theoretical minimum number of parts, and TM is total assembly time. AM can be accepted as 3 s. as generally. Different implementations can be used different basic assembly times. However, it provides an accurate relative comparison between design choices [2,4,10] On the calculations; the number of the each part, manual handling time of the parts, manual insertion times, total operation time, operation cost and the decision that if the part can be eliminated or not are used. Operation cost is a function of operation time (0.4 x operation time). TM is the sum of the operation times, CM is the sum of the operation costs and NM is the total number of the parts that will not be eliminated. Figure 2 shows the relation between the part number and design efficiency. Operation times are calculated with sum of part number times sum of total handling and insertion times. TM, CM and NM are choosen than the related tables. This tables are manual handling and manual insertion tables.
100

Fig. 2 Design efficiency relation with part number[10]
Insertion time can be determined via the assembly difficulties. The table has the angle values for alpha and beta symmetries. Alpha symmetry is rotational symmetry of a part about an axis perpendicular to its axis of insertion and beta symmetry is rotational symmetry of a part about its axis of insertion [10]. Alpha and beta rotational symmetries for part shapes can be determined by using Table 1.
Table 1: Alpha and beta symmetries determination table [10]
Part thickness and shape also have an effect on determining the handling time. Figure 3 show the relation between handling time and part thickness and the effect of part shape to the handling time.
Fig. 3 Effect of part thickness and part size on the handling time
This method contains the improvement with the part considerations on elimination possibility of the parts and combinations between the parts.
It’s obviously seen that the assembly becomes easier with the new design. By changing the assembly, efficiency of the design is considered and the improvement of the new design is given in percentage.
4. Double Deck Elevators
Reducing the space required by elevators in high-rise buildings
is the use of mutlideck or double deck elevators. Here the upper and lower decks of each elevator are loaded simultaneously with passengers destined for the odd-numbered floors entering the lower deck and those for the even-numbered floors entering the upper deck [11]. There are many advantages to using double-deck elevators, among which are the following: (1) more passenger-handling space per hoistway, (2) fewer double-deck elevator are required, (3) up-peak operation is optimized.
Double deck elevators are the systems that designed with two elevator cars and one car is attached on top of the other on the whole system. Both cabs are connected to a single carcass and a drive system together. The lower deck and the upper deck serve two adjacent floors and it allows the passengers on two consecutive floors to be able to use the elevator simultaneously. During a trip, the two decks are arranged to serve odd and even floors. The passengers at the even and odd floors use the related deck to reach to the destination that they want. Double deck elevator systems require escalators or stairs for the transportation of the passengers from ground floor to the upper floor. A view of a common double deck system can be seen in Figure 4.
Fig.4 Sectional rendering of double deck elevators Double deck elevators are the systems that two elevator cars
are attached one on top of the another (see Figure 5). The main concept of the product development is needed to be explained depend on the related design first and the properties of product development concept will be associated with design for manufacturing and assembly method. The sequential and concurrent approaches are also needed to be determined.
101

Fig.5 Double-decked elevator car [11]
5. Application on Double Deck Elevator Car
In this work, a double deck elevator car will be determined
depend on the Boothroyd-Dewhurst method and the factors of the design for the original and revised designs will be compared. Figure 5 shows the original design of the double deck. The thickness of the ground of the cabs are 3 mm. The other sheets have the 1.5 mm. Design of the original double deck car can be seen in Figure 6.
Fig.6 Design of the double-deck elevator car
The sheet part is inserted in the chassis. The number of
fasteners is reduced significantly at the revised design. All the fastener parts are groups and a bolt needs washer and nut to complete the assembly. So, one part of fastener causes three parts to the design. Also, Table 2 shows the modular sheet number at the original design. It is significantly reduced by the support elements. There is just 12 parts support element for the double deck added to the design for reducing the side sheet number. The other parts have the same value in both designs. Total mass of the revised deck is almost the half of the mass of the original design. So, the same
functional product is designed with the half mass for the whole design. This is one of the benefits of the related method.
Part number of the new design is less than the half of the original design. The original one was with fastener design and there were too many parts on the car. So, the cost and assembly time were higher. The revised car was designed to reduce the number of parts and so the cost became lower at the new design and efficiency factor becomes higher [12-15]. The first one has 1188 parts. There are 26 different kind of parts and total time of manual handling and manual insertions is 8701,6 seconds. For the revised design, the number different kind of parts is 27 but there are totally 572 parts in the whole system for the double deck. Total time for handling and insertion is 4444,88.
6. Conclusions
Elevator car design for the double deck systems is the subject of the study. Design for manufacturing and assembly methods are considered for the design. Original and revised elevator cars are evaluated by using Boothroyd- Dewhurst methodology. Design efficiency factor is calculated and the values of design efficiency for both designs are compared. Number of parts at the original car is tried to be halved. An analyze model and the calculations are given and the compare of the systems is shown in tables. Total assembly cost is an important factor on manufacturing as total assembly time.
References [1] E. Appleton, J.A. Garside, (2000) A Team-based Design for
Assembly Methodology, Assembly Automation, 20 (2), pp. 162-169.
[2] G. Boothroyd, L. Alting, (1992) Design for Assembly and Disassembly, CIRP Annals, 41(2), pp. 625-636.
[3] B. Miles, K.G. .Swift, (1988). Design for Assembly, Automotive Engineer, 13 (3), pp. 38-40.
[4] G. Boothroyd, (1994) Product Design for Manufacture and Assembly, Comp. Aided Design, 26 (7), pp. 505-520.
[5] G. Boothroyd, G (1998) Making It Simple: Design For Assembly, Mechanical Engineering, 110 (2), pp. 28-31.
[6] P. Radhakrishnan, S. Subramanyam (2008) CAD, CAM,CIM Third Edition, (pp 13-41)
[7] Singh, N., (1996) Systems Approach to Computer Integrated Design and Manufacturing, pp. 103-397, John Wiley & Sons, Inc, New York.
[8] A.Özdemirkiran, C.E.İmrak, M.C.Fetvacı, (2008), Design for Assembly and Maintainability in Computer Aided Engineering and A Case Study: Packaging, University Review, Vol. 2, No. 4, pp.21-25.
[9] I.Gerdemeli, C.E.İmrak, M.C.Fetvacı, Design for Assembly Methodology and Its Application to Elevator Car Door Design, V. International Congress Mechanical Engineering Technologies’06, Varna, Bulgaria, pp. 3-6.
[10] Boothroyd G, Dewhurst P, Knight W., (1991) Product Design for Manufacture and Assembly, 2nd Edition, Marcel Dekker, New York, Product Design for Assembly, Geoffrey Boothroyd and Peter Dewhurst, Boothroyd Dewhurst Inc.
[11] G.R: Strakosch, R.S. Caporale, (2010) The Vertical Transportation Handbook, 4th Edition, John Wşley & Sons Inc. New Jersy.
[11] A.C. Redford, (1994) Design for Assembly, McGraw-Hill Book Company, London.
[12] K.L., (2002). Towards More Strategic Product Design for Manufacture and Assembly: Priorities for Concurrent Engineering, Material and Design, 23,651-656. [13] Ed. J R Behun (1995) Design for Manufacturability, DE-Vol. 81, ASME [14] El Wakil, S. D. (1998) Processes and design for manufacturing. 2nd edn. Boston: PWS Publishing.
102

DESIGN AND ANALYSIS WITH FINITE ELEMENT METHOD OF JIB CRANE
Assist. Prof. Gerdemeli I. 1, Assoc. Prof. Kurt S. 1, Tasdemir B. 2
Faculty of Mechanical Engineering Istanbul Technical University - Turkey 1,2
Abstract: Cranes are transport machines, which generally used in heavy machinery industry, shipyards, seaports, warehouses and construction sector. There are several factors that have to be taken into consideration when a crane being designed. Most important factors are; own weight of the crane, the weight of the bulk which has to be transported and the dynamic loads which occur during the movements. Moreover, for the cranes which operate in open-air, the external loads caused by wind and the other climate conditions have to be considered. In order to prevent possible accidents which can cause enormous losses after manufacturing, all these factors have to be taken into account during the design process. That means crane design process requires repetitive strength calculations. During the design process, time can be saved by handling these calculations with the assistance of Finite Element Method. In this study; results of the analytical calculation and the results that were obtained by finite element method have been compared. In this way, it has been investigated the reliability of the finite element method for JIB crane design. As a result, it has been seen that, F.E.M is the most practical and reliable method which can be utilized during JIB crane design process.
Keywords: JIB CRANE, DESIGN, FINITE ELEMENT METHOD, ANALYSIS
1. Introduction
In this study; JIB cranes, which generally used in ship manufacturing and maintenance processes, have been analyzed. JIB cranes can be considered as a combination of gantry cranes and tower cranes. Because it can move on a rail like a gantry crane, on the other hand has a boom like a tower crane. JIB cranes consist of these components from bottom to top: At the bottom there are bogie groups which collect the crane wheels [1-4]. Legs are the elements between the bogie groups and the main frame. Over the main frame, there is a cylindrical part which is called pedestal. Engine room is placed on this pedestal. In the engine room there are balancing weight and the required mechanism for the rotation. On the engine room there are two drums, one for the boom movements and the other one for lifting the bulk. Also there are two frames on the engine room, one is called back stay and the other one is called A frame. These frames are connected with I-beam profiles which are called arm. And the last part of JIB crane is called boom. Boom has joints at the bottom and also it is connected to the frames with steel wire ropes. The crane which was designed during this study is shown in the figure below (Fig.1).
Fig. 1 JIB crane model.
Crane design process starts with the classification of the crane according to FEM or DIN standards. The main parameters used in the classification are the number of load application cycles and the load spectrum. JIB crane firstly has been classified according to these standards. And the working group of the JIB crane was determined as 3m according to DIN standards and M6 according to FEM standards [4].
2. Analytical Analysis of the Jib Crane
JIB crane has been analysed analytically, before it was analysed with finite element method. Firstly the static balance of the crane was checked. After that, basic crane elements and their dimensions have been defined. At the beginning, required wire rope diameters were calculated for the maximum load. According to these rope diameters, the pulley and the drum diameters were defined via the coefficients which were taken from the FEM and DIN tables. Also the dimensions of the wheels and the rails for the crane were calculated. After all the dimensions of the JIB crane components were defined, the required electrical motor powers were calculated. For a JIB crane, there are four different electrical motors which have varied capacity. First one is used in bogie group to move the crane along the rails. And the second one is located in the engine room, that one is used to rotate the boom around the rotation axis. The wind and the acceleration loads should be considered for both of these electrical motors. The third motor works for a drum, which changes the boom radius. And the last one is used for the other drum, which lifts the bulk. After all the basic components of the crane were defined; strength of the JIB crane was calculated analytically according to FEM and DIN standards. In this section of the study, stress and deformation of the boom and stress of the crane main frame were calculated, taking into account the wind, acceleration and the braking loads. According to these results, crane model was revised to achieve better strength values.
3. Analysis of the Jib Crane with Finite Element Method
The next stage of the study includes the analysis of the JIB crane with finite element method. To be able to analyse the crane by means of this method, firstly 3D solid model of the crane must be generated.
103

3.1 Modelling Of the Crane
Boom, basically consist of two components. The bottom side of the boom is a box girder and the rest of it is lattice or truss girder. The box girder is made of sheet metal which has 9 mm thickness. And the lattice girder consists of pipe profile beams. The lattice girder has four main beams, and there are support beams between them which have smaller diameters. The main pipes have 154, 2 mm diameter and 10 mm thickness, while support beams have 73 mm diameter, 10 mm thickness and 51 mm diameter, 8 mm thickness. These support elements doesn’t carry loads, they are used to hold the main beams together and make the girder more rigid. All the boom elements are made of St 52 structural steel.
The main frame or the carrier body of the crane is a box girder like the bottom side of the boom. But the sheet metals used in the main frame are much thicker than the ones used in boom’s box girder. The thickness of the sheet metals, used for the main frame’s box girders, change between 20 mm and 24 mm. And as material, St 37 structural steel was chosen for the main frame of the crane.
In this study SolidWorks 3D design software has been used for modelling the JIB crane. All the crane components were modelled one by one, and then they were combined in the assembly module of the software.
3.2 Analysis of the Crane Using ANSYS FEA Software
The models, which were generated via SolidWorks CAD software, were transferred to ANSYS finite element analysis software and they were prepared for the analysis. For defining the problem, firstly the models were meshed in ANSYS software.
Boom model consists of 486.661 elements and 353.298 nodes. Components of the boom were modelled as surface bodies or shell elements to reduce the element and node number of the model.
Fig. 2 Mesh detail of the boom.
After the meshing process, the load combinations and the boundary conditions were defined for the model. Firstly, two springs were defined for representing the wire ropes. One of the springs, which represent the wire rope that hoists the boom, was defined with a high spring constant for limiting the displacement of the boom. And the second spring was defined to represent the wire rope which lifts the bulk. This second spring was defined with a preload which equals to % 25 of the maximum load that desired to be lifted.
Except the wire ropes, joints of the boom have to be defined as a boundary condition during the pre-process. One degree of freedom was defined for these joints which take place at the bottom section of the boom. For these joints, all the movements along X, Y, Z axis and the rotations about Z and Y axis were constrained but, only the rotation about X axis was allowed. After this preparation process, only standard earth gravity was defined as an external load to analyse the stress and displacement which were caused by own weight of the boom. According to this first analysis it has been seen
that, maximum stress (65-70 MPa) and displacement (105, 33 mm) caused by own weight, occur at the middle section of the boom.
Fig. 3 Springs for representing the wire ropes.
Furthermore, a secondary scenario was applied to the boom model, for analysing the behaviour of the boom under maximum load combination. For this purpose, the bulk desired to be lift (40 tons), standard earth gravity, wind loads and the loads caused by acceleration were defined as external loads to the model. Figure 4 illustrates the loads applied to the model in this stage of the study.
Fig. 4 JIB crane model.
The software was runned with these boundary conditions and the load combinations mentioned above. According to this analysis, stress occurred at the middle section of the boom changes between 175 MPa and 190 MPa; and the stress occurred at the bottom section of the boom changes between 90 MPa and 120 MPa. The stress distribution of the boom is shown in Figure 5.
Fig. 5 Result of the stress analysis under maximum external load.
104

After the stress and displacement analysis of the boom; the main frame of the crane was analysed using ANSYS software as well. Analysis of the main frame started with meshing process of the model. Main frame consists of sheet metals and has a simple geometry compared to the boom. As a result it can be meshed much easier and quicker according to the boom. The model of main frame of the crane consists of 84.997 elements and 169.675 nodes. Figure 6 illustrates the mesh detail of the main frame.
Fig. 6 Mesh detail of the main frame.
Afterwards the meshing process, the boundary conditions and external loads were defined for the main frame of the crane. Firstly the model was fixed from the joints where the bogie groups were connected to. And then, weight of the engine room and the components which were located on the engine room were applied on the model. Also the wind load and the loads which were caused by the acceleration were defined for the model. On the other hand, standard earth gravity was defined for taking into account the effect of the own weight of the main frame. And finally the bending moment, which was caused by the weight of the boom and bulk and the lateral loads were applied on the model. All the boundary conditions and the loads defined for the main frame are shown in Figure 7.
Fig. 7 The external loads applied to the main frame.
With these boundary conditions and the load combinations, program was runned for the stress analysis of the main frame. According to this analysis, maximum stress occurs at the triangular support plates of the legs. The stress value detected at this point equals to 145 MPa which is under the allowable stress 180 MPa for St 37 structural steel. And the stress value at the bottom section of the cylindrical pedestal, changes between 95 MPa and 105 MPa. The stress distribution of the main frame is illustrated in Figure 8.
Fig. 8 The stress distribution of the main frame.
4. Conculision
At the end of the study, results of the analytical calculation and the results that were obtained by finite element method have been compared. According to these comparison results, it has been seen that, the error margins were between the acceptable boundaries. This comparison is given in the table below (Table 1).
Table 1. Comparison of the result. Section / Loading Type
Analytical Calculation
Finite Element Method
Difference
Boom Middle Sec. (Self Weight +Stress)
67,7 MPa 65÷70 MPa % 0,3
Boom Middle Sec. (Self Weight + Displacement)
106,39 mm 105,33 mm % 1
Boom Middle Sec.(Hz) 178,2 MPa 175÷190 MPa % 2,4
Boom Middle Sec.(Hz) 101,3 MPa 90÷120 MPa % 3,6
Cylindrical Pedestal (Hz)
111,6 MPa 95÷105 MPa % 10,3
Stress and the deformation results of the boom according to finite element method were fairly similar to analytical calculations. But it has been seen that, there was % 10 difference between the two method’s stress values for the cylindrical pedestal. This relatively big error rate comes from the assumption which made during the analytical calculation. Because there are support plates inside the pedestal and they have been ignored during the analytical calculation.
On the other hand, some spots have been detected in the stress analysis with finite element method of the boom, which include high stresses that could not be able to occur in the real system. That kind of spots takes place in the connection areas of the beams. This situation illustrates that, finite element method could be inadequate over some cases and the results should be checked carefully. In this study, these spots were ignored and the stresses which occur several elements away from these spots were taken into consideration. As a result, it has been seen that if it is applied appropriately and the results could be analysed in the right way, finite element method gave proper results for stress and deformation analysis.
During the design process of cranes or the similar structures, it is not enough only system’s being safe in terms of strength. The design must fulfil the minimum safety conditions and should be light and cheap as well. Therefore, to be able to reach the optimum design, system should be modified and revised numerous times.
105

During all these modifications, calculating the system with analytical method causes design process to take long. In crane design process and the similar studies which require repetitive calculations, designers can save time by using finite element method on condition that checking the reliability of the method for the model. Constructor can change the model in computer environment and get the results of the new design via finite element method without wasting time. And this is the most practical and reliable way to reach the optimum design in terms of strength, weight and cost.
References
[1] H.Oztepe, (1999) Material Handling, Istanbul Technical University Ofset Center, Istanbul.
[2] Imrak C.E, Gerdemeli I. (2011) Course Notes of Material Handling, Istanbul Technical University Offset Center, Istanbul.
[3] Gerdemeli I. (2012) Course Notes of Material Handling, Istanbul Technical University Offset Center, Istanbul.
[4] Imrak C.E, Gerdemeli I. (2008) “Strength Equations and Finite Element Modeling of JIB Crane Construction”, 5th European Congress on Computational Methods in Applied Sciences & Engineering, 30 June – 5 July 2008, Venice, Italy.
[5] Zeid, I . (1991) CAD/CAM Theory and Practice, McGraw-Hill, Delhi.
[6] Gerdemeli I.,Imrak C.E, (2008) “Modeling of JIB Crane Construction Analysis with Finite Element Method”, The 13th International Conference on Problems of Material Engineering, Mechanics & Design, 26-29 August 2008, Rajecke Teplice, Slovakia
106

ANALYSIS WITH FINITE ELEMENT METHOD OF WIRE ROPE
Ass.Prof. Gerdemeli I.1, Assoc.Prof. Kurt S. 1, Anıl A.S.2 Faculty of Mechanical Engineering Istanbul Technical University - Turkey 1,2
Abstract: Wire rope strands are examined in computer environment. For this purpose generated models about finite element analysis of wire
ropes, conducted researches and fatigue condition of wire ropes are examined. The condition required in order not to contact outer wires with each other is expressed with the purpose of modeling simple strand and the generated model is confirmed by using defined geometrical values. 3D solid model of simple strand used in finite element analysis is generated in CAD software SolidWorksTM. Finite element analysis of simple strand is done by FEA software ANSYSTM. Fatigue analyses are done by ANSYS/Workbench for experimental groups generated by using 3 different parameters which are strand length, helix angle and force range. Graphics which show fatigue life variance of axial loaded simple strand, are created by obtaining fatigue life distribution according to Goodman approach.
Keywords: WIRE ROPE, FINITE ELEMENT METHOD, ANALYSIS, FATIGUE
1. Introduction
Wire ropes, which are main components of systems like elevator, crane, etc., work at high stress conditions and are almost always subject to variable loads. The primary mechanisms responsible for stress fluctuations in wire ropes can be specified as tension-tension, bending-over-sheaves, free bending and torsion. Tension-tension fatigue determines the wire rope fatigue resulting from applying of variable axial tensile loading.
Most analytical solutions in the literature are based on the solution of equilibrium equations in connection with the boundary conditions and physical situation of the problem. In theoretical studies wire ropes are analyzed in different conditions, but most of them exclude frictional and contact effects. It is possible to consider frictional, contact and the other working conditions by using solid modeling and finite element analysis in computer environment.
Wire rope theory is based on equilibrium equations which are derived by Love. General equilibrium equations of a thin rod on arc length s is derived and presented. Hruska’s study is the first one in literature investigating the mechanical behavior of wire ropes using the simplest constraints. Green and Laws, in general theory of rods mention to restricted and linearized form to determine stress in helical wires in wire ropes . Costello [1] and then Utting and Jones [2,3] make different assumptions relative to the rope geometry or the interwire contact condition, considering each wire in a wire rope as a helical rod.
Analytical models of wire rope theory are compared by Cardou and Jolicoeur. According to this study mechanical models of helical strands are purely tensile or fiber model, semi-continuous strand model, theory of thin rods model and helical rod model [4]. Helical rod model is introduced by Philips and Costello based on the equilibrium equations derived by Love [1]. The method of separation the strand into thin wires and solution of the general nonlinear equations for the bending and twisting of a thin rod subjected to line loads is accepted and six nonlinear equations of equilibrium for each wire are examined [5].
Chaplin and Potts investigate the researches about wire rope endurance in offshore applications in a critical review. Fatigue mechanisms are determined depending on working conditions of wire rope used in these applications and experimental studies are presented comparatively [6]. Feyrer investigates the behavior and fatigue properties of wire ropes under tensile load and also behavior of wire ropes under bending and tensile stresses in his book in which his theoretical and experimental studies are collected [7].
The finite element method is used with a simplified model in a study conducted by Carlson and Kasper [8]. Chiang generates a small length of single strand wire rope for geometric optimization purposes [9]. Jiang et al. develop a concise finite element model using solid brick elements in which helical symmetry features of a strand is considered. Precise boundary conditions are developed by simplifying finite element model [10]. Jiang and Henshall investigate a finite element model of a 1+6 simple strand in order to determine the termination effects. The effects of a fixed-end termination on the contact forces (pressure) and the relative movements between the wires along the contact lines are determined [11]. Knapp et al. develop a software code for the geometric modeling and finite element analysis of wire ropes. Finite element mesh and nodes for all components of the model are generated automatically [12]. Elata et al. present a new model for simulating the mechanical behavior of a wire rope with an IWRC. The generated model considers the double-helix configuration of individual wires within the strand. The double-helix geometry is modeled with the parametric equations because of its complex structure [13]. Erdönmez and İmrak introduce an accurate 3D modeling approach and finite element analysis of wire ropes with IWRC [14]. Erdönmez and İmrak introduce a new methodology to define and to model nested helical structure (NHS) for wire ropes, and to present an accurate wire rope 3D solid modeling, which can be used for finite element analysis [15]. Erdönmez and İmrak develop a code considering both single and double helical geometry in modeling and analyzing wire ropes with IWRC and use it in modeling [16]. Stanova et al. derive mathematical models in order to generate geometric models of wire rope and strands and implement them in the CAD software CATIATM [17]. Stanova et al. implement the generated mathematical geometric model in the FEA software ABAQUS/Explicit in order to predict the behavior of the multi-layered strand under tensile loads. Anıl investigates the parameters effect on fatigue life of axial loaded simple wire rope strands in computer environment [17].
2. Fatigue in Wire Ropes
Essentially, the process of fatigue in metals involves crack initiation and propagation from some stress concentrating defect by mechanisms which involve local plasticity at the crack tip under the influence of a variable load. Wire ropes are constructed of a complex assembly of steel wires. The division of the load bearing capacity between many wires has two essential benefits; (i) it assures the essential combination of high axial strength and stiffness with bending flexibility, and (ii) allows the structural use of essentially brittle steel at very high stresses with subdivision of the structure to isolate local fractures.
107

Wire ropes works at high stress levels and are almost always subject to variable loads. In a transport system, tension fluctuations are the dominant source of fatigue stresses. In a given time and sufficiently high fluctuation in stress range, fatigue is inevitable. However complete failure of a wire rope requires that many wires are broken in close proximity. But the fatigue of a single wire in the wire rope is always more than stress fluctuation. There is usually some other process which exacerbates and accelerates the fatigue, and which focuses the process to specific locations. This process depends on fretting between wires or another degradation mechanism such as wear, corrosion, etc. The primary mechanisms responsible for stress fluctuations in wire ropes can be collect under four titles; tension-tension, bending-over-sheaves, free bending and torsion [6].
2.1 Tension-Tension Fatigue
Tension-tension fatigue involves stress fluctuations resulting from changes in axial tensile loading. It is occurred in fixed wire ropes and also lifting or hoisting applications in which mass changes and accelerations are the primary sources of axial load fluctuation. The dominant parameter for this type of fatigue is load range, and a good model for tension-tension fatigue performance is provided by using a simple power law equation [6].
Fig. 1 Equivalent load range transformation for a wire rope.
Equivalent load range qR is,
max
2.100a
qm
SR
F S
Equation Section 2(2.1)
m
q
CN
R
(2.2)
In this equation load range 2Sa, mean load Sm, ultimate breaking load Fmax, number of load cycles N and C is a constant obtained experimentally according to wire rope diameter. The power m typically has a value of about 5, but can be much higher for wire rope with small diameter wires. Equivalent load range transformation for a wire rope is defined in Fig.1 [9].
3. Investigation of Wire and Strand Construction
In this chapter modeling of 1+6 simple strand in computer environment in order to determine fatigue life with finite element method is presented. For this purpose geometric validation of the strand is obtained by means of Costello’s study. Subsequently solid model of the strand is generated by using CAD software SolidWorksTM.
A steel wire as the basic component of strands and wire ropes can be (i) a core of the strand, (ii) a wire in a layer of the strand, (iii) a strand core of the multi-strand rope or (iv)a wire in a strand layer of the multi-strand rope. Consequently the centerline of a wire can
form from single or double helix depending on its location in the strand or in the wire rope.
3.1 Generation of Simple Strand Model
The configuration and cross section of a loaded simple strand is shown in Fig.2. For initial condition the strand include a center wire of radius R1, surrounded by m=6 helical wires of radius R2. It is assumed that the center wire is of sufficient size to prevent the outer wires from contact each other in order to minimize the effect of friction in the bending of the strand [1].
Fig. 2 Simple strand construction under load. .
The initial radius of the helix for an outer wire is given by the expression
2 1 2r R R Equation Section 3(3.1)
The initial helix angle α2 of an outer wire is determined by the expression
22
2
tan2
p
r
(3.2)
p2 is the initial pitch of an outer wire. An expression is derived to determine the minimum value of R1 in order to prevent the outer wires from contact each other. A wire cross section in a plane perpendicular to the strand is shown in Figure 2. Since the wires are thin, the equation of cross section can be assumed as elliptical and (p,q) is any point on the ellipse. Hence,
2 2
1sin
p q
R R
(3.3)
2
2
sin
sin1
dq p
dp pR
R
(3.4)
Also at the point (p1,q1) the slope is equal to tan
2 m
as shown.
Hence, the solution for p1 and q1, 2
1
2
1
sintan
2 sin1
p
m pR
R
1
2 2
1tan
sin 2sin tan
2
Rp
m
m
(3.5)
1
2 2
sin
sin tan2
Rq
m
(3.6)
(3.7) It is shown that r =b1 + q1 in Figure 2. Hence,
108

1 1 tan2
b pm
(3.8)
2
2
tan2
1sin
mr R
(3.9)
Equation (3.9) defines the radius of the wire helix in which the wires are just in touch with each other. Hence, the equation,
2
2 1 22
tan2
1sin
mR R R
(3.10)
must be valid in order not to be in contact outer wires with each other [1].
Geometrical parameters of the simple strand model which is wanted to be generated are given in Table 1.
Table 1. Geometrical parameters of simple strand
Geometrical parameters Value
Strand diameter (d) 11,400mm
Center wire diameter (2R1) 3,940mm
Outer wire diameter(2R2) 3,730mm
Helix angle (α) 78,2°
Hence, the initial radius of the helix for an outer wire is (see Eq.3.1)
2 1 2 3,835r R R mm
The initial pitch length p2 of an outer wire is (see Eq.3.2)
22tan 78, 2 115,341
2 3,835
pp mm
The condition required in order not to contact outer wires each other is (see Eq.3.10)
2 2
2 1 22 22
tan tan2 2 6
1 1,865 1 3,791 3,835sin sin 78,2
mR R R mm mm
Simple strand model generated in SolidworksTM for finite element analysis is shown in Figure 3.
Fig.3 Generated simple strand model for finite element analysis.
4. Analysis of with Finite Element Method
In this chapter fatigue analysis of the simple strand is done with FEA software ANSYSTM. The equations derived by Costello are regarded as a baseline, and finite element analysis results are compared with theoretical results in order to confirm generated finite element model. Fatigue life under axial loading and the effect of considered parameters on tension-tension fatigue life are investigated for generated strand models. Experimental groups have
been generated by using 3 different parameters which are strand length, strand helix angle and force range.
4.1. Contact Condition
Contact condition is existed between wires of simple strand. Two cases are regarded; (i) determination of contact region and (ii) friction. Geometrical values provide the required condition expressed with Equation 3.10 in order not to contact outer wires each other. Hence, the contact is existed between center wire and outer wires.
Generated models remain over a critical length, considering the contact condition between center wire and outer wires. Simple strand lengths regard as 10 to 16 per cent of pitch length for defined geometric values. Jiang and Henshall [11] report that no contact is existed between the center wire and outer wires, from the fixed-end to 3 per cent of the pitch length. The contact loads (pressure) increase gradually and relative movements through the contact lines between center wire and outer wires for simple strand lengths which are from 3 to 9 per cent of the pitch length. The contact loads (pressure) reach the uniform value, and relative movements between center wire and outer wires reach zero value for simple strand lengths which are over 9 per cent of pitch length.
4.2. Boundary Condition Boundary conditions are compatible with the model generated
by Costello. One end is fixed in all directions while the other end is restrained not to displace in x and y directions. Considered loading condition is applied to the end, which is restrained not to displace in x and y directions, up to ε = 0,015 strain value in increments of ε = 0,001 linearly by using the displacement equivalent to the axial strain in order to confirm simple strand model.
4.3. Material Properties Material model for finite element analyses is defined as bilinear
isotropic (BISO) which is a non-linear material model. The curve in linear region is elasticity modulus of material.
In consequence of axial strain for fixed-end case, numerical force values obtained by finite element analysis are in accordance with theoretical force values of Costello. Numerical moment values obtained by finite element analysis are also in similar trend with theoretical moment values of Costello.
4.4 Finite Element Analysis
The method of finite element analysis of simple strand which is done in ANSYS Workbench environment of FEA software ANSYSTM is presented. It is known that no contact is existed between outer wires of simple strand model, but it is between center wire and outer wires. Contact condition is defined as Frictional between center wire and outer wire and friction coefficient is inserted as 0,115.
Fig.4 (a) mesh, (b,c,d) analysis results, (e) fatigue life variance for variable strand length for 20mm strand length
109

Fig.5 (a) mesh, (b,c,d) analysis results and (e) fatigue life variance for variable helix angle for 80° helix angle.
Fig.6 (a) mesh, (b,c,d) analysis results and (e) fatigue life variance for variable force range for 15mm strand length and 78,2° helix angle.
Face Sizing is done for all surfaces in order to obtain a uniform mesh. Boundary conditions are defined as one end is fixed with Fixed Support while the other end is restrained with Displacement, ε = 0 for x and y directions and ε =0,006 for z direction in order to implement displacement.
The mesh, the analysis results (equivalent strain, equivalent (von-Mises) stress, Goodman fatigue distributions), the graphic of fatigue life variation for 20mm strand length and for 80° helix angle are shown respectively in Figure 4 and 5. The mesh, the fatigue life analysis results and the graphic of fatigue life variance for variable force range for 15mm strand length and 78,2° helix angle are shown in Figure 6. Force range is changed by using the axial pre-strains equivalent to the axial forces. The effect of variables used in experimental groups on number of load cycle is investigated.
5. Conclusions
In present study, finite element analysis results and theoretical results of Costello are compared for fixed-end condition. Results in similar trend indicate that the generated model corresponds to the theoretical model.
Experimental groups are generated by using 3 different parameters which are strand length, helix angle and force range. Strand lengths are 15mm, 17,5mm and 20mm with 78,2° helix angle and ε = 0,006
axial strain for each model. Helix angles are 75°, 77,5° and 80° with 15mm strand length and ε =0,006 axial strain for each model. Force range is changed by using the axial strains equivalent to the axial forces. Axial strains are ε = 0 ~ 0,006, ε = 0,0015 ~ 0,006, ε =0,003 ~ 0,006 with 15mm strand length and 78,2° helix angle.
According to analysis results, tension-tension fatigue life increases approximately linearly with the increase of strand length for variable strand length. It is supposed that the reason for the longer fatigue life of the longer strands is the relaxation of the structure can be compensated better.
Tension-tension fatigue life increases with the increase of helix angle for variable helix angle. It is supposed that the reason for the longer fatigue life of the higher helix angle can be the less contact between center wire and outer wires per unit length, and hence less
force requirement in order to overcome friction.Tension-tension fatigue life increases with the situation of increase of pre-strain in which axial force is changed by using equivalent strain for variable force range. The smaller force magnitude can be regarded as superiority in similar engineering applications. Fatigue life increases with the decrease of additional force applied to the strand.
In conclusion, investigation of parameters effecting on fatigue life of simple wire rope strand seems possible with finite element analysis. In all experimental groups, it seems that the most effective parameter on number of fatigue cycles is helix angle. Although strand length seems a little more effective than force range on number of fatigue cycles, they are both in similar trend approximately.
References [1] Costello, G. A.,( 1997) Theory of Wire Rope. 2nd ed., Springer-
Verlag, New York. [2] Utting, W. S., Jones N., (1987)The response of wire rope strands
to axial tensile loads: Part I. International Journal of Mechanical Science, 29 (9), pp. 605-619.
[3] Utting, W. S., Jones N., (1987) The response of wire rope strands to axial tensile loads: Part II. International Journal of Mechanical Science, 29 (9), pp. 621-636.
[4] Cardou A., Jolicoeur, C.( 1997) Mechanical Models of Helical Strands. ASME Applied Mechanics Reviews, 50 (1), pp. 1-14.
[5] Philips, J. W., Costello, G. A.(1973) Contact Stresses in Twisted Wire Cables. ASCE Journal of Engineering Mechanics Division, 99 (EM2), pp. 331-341.
[6] Chaplin C. R., Potts A. E.(1991)Wire Rope Offshore - A Critical Review of Wire Rope Endurance Research Affecting Offshore Applications. Health and Safety Executive, OTH 91 341.
[7] Feyrer, K., (2007) Wire Ropes: Tension, Endurance, Reliability. Springer-Verlag, Berlin
[8] Carlson, A. D., Kasper, R. G.(1973) A Structural Analysis of a Multiconductor Cable. Naval Underwater Systems Center, Acc. No: AD0767963.
[9] Chiang, Y. J.(1996) Characterizing Simple Stranded Wire Cables Under Axial Loading. Finite Element in Analysis and Design, 24, pp. 49-66.
[10] Jiang, W. G., Yao, M. S., Walton, J. M.(1999) A Concise Finite Element Model for Simple Straight Wire Rope Strand. International Journal of Mechanical Sciences, 41 (2), pp. 143-161.
[11] Jiang, W. G., Henshall, J. L., (1999) The Analysis of Termination Effects in Wire Strand Using the Finite Element Method. The Journal of Strain Analysis for Engineering Design, 34 (1), pp. 31-38.
[12] Knapp, R. H., Das S., Shimabukuro T. A.,(2002) Computer-aided Design of Cables for Optimal Performance - Geometric Modeling and Finite Element Software for Structural Design of Cables. Sea Technology, 43 (7), pp. 41-6.
[13] Elata, D., Eshkenazy, R. Weiss, M. P.,(2004) The Mechanical Behavior of a Wire Rope with an Independent Wire Rope Core. International Journal of Solids and Structures, 41 (5-6), pp. 1157-1172.
[14] Erdönmez, C., İmrak, C. E. (2010) On The Problem of Wire Rope Model Generation with Axial Loading, Mathematical and Computational Applications, 15 (2), pp. 259-268.
[15] Erdönmez, C., İmrak, C. E. (2011) Modeling Techniques of Nested Helical Structure Based Geometry for Numerical Analysis. Strojniški vestnik - Journal of Mechanical Engineering, 57 (4), pp. 283-292.
[16] Erdönmez, C., İmrak, C. E., (2011) A Finite Element Model for Independent Wire Rope Core with Double Helical Geometry Subjected to Axial Loads. Sadhana-Academy Proceedings in Engineering Sciences, 36 (6), pp. 995-1008.
[17]Anıl, A. S., (2011) Investigation Of Fatigue Life Of Axial Loaded Wire Rope Strands In Computer Environment, Master of Science Thesis, Istanbul Technical University.
110

ANALYSIS OF BELT CONVEYOR USING FINITE ELEMENT METHOD
Assoc.Prof. Dr. Kurt Serpil. 1, Assist.Prof. Dr. Gerdemeli I. 1 Cengiz C. 2 Faculty of Mechanical Engineering Istanbul Technical University - Turkey 1,2
Abstract: Belt conveyors are the most common material handling conveyor in use today. They are generally the least expensive powered conveyor
and are capable of handling a wide array of materials. Depending on the type chosen, belt conveyor can carry everything. Today, belt conveyors are in use in many industries, like mining industry, belt conveyors has an increasing importance and use. They have important part of mining and cement factories, grain manipulation, etc. For a belt conveyor longer than one kilometer, viscoelastic properties of the belt is unneglibible and longer-life with healthy operation for conveyors design require detailed engineering calculation. In this study, a real conveyor project is taken into account. Wave propagation speeds are calculated. Studied belt is divided into finite number of beam elements all of which are represented by mass, spring and a dashpot. Motions of equations are derived by obtaining mass, stiffness and damping matrices. Initial conditions are specified and effecting forces are calculated. Equations of motions formed a linear, second order ordinary differential equation system and it’s transformed into state-space equations. By using MATLAB’s Control System Toolbox commands, the system is simulated for a step input. Results are separated as velocities and displacements. The conveyor is examined on carry and return sides. Return side and carry side reactions are compared. In the light of obtained data and drawn graphs, belt strength and mill diameters or materials are advised to be revised due to the excessive forces occurred in transient stage. Some additional recommendations are proposed to improve the performance.
Keywords: ANALYSIS, BELT CONVEYOR, FINITE ELEMENT METHOD
1. Introduction
For more than 200 years, belt conveyors are in use in many industries, especially in mining, cement, steel and agricultural industries. Belt conveyors have had an increasing importance and use during the past century. Today, they have the key role in mining, cement factories, grain manipulation, etc. By time, applications of transporting materials from one point to another extended its boundaries; by requiring longer transfer distances, much faster speeds and much higher capacities. While expectations from belt conveyors are growing bigger, problems to be solved grew in parallel. For a belt conveyor longer than one kilometer, viscoelastic properties of the belt is un-negligible and longer-life with healthy operation for conveyors' design require extensive engineering work and more complex calculations.
The dynamic behavior of conveyors have not been an issue of interest until a few decades ago. However, as a general issue, dynamic behavior of axially moving continua is first examined in late 19th century. This subject hasn't met a general interest until 1960s. Scientists and engineers accelerated their research on analytical solutions for axially moving strings as they are the simplest form. From 1960s to 1970s, the solution techniques, scenarios and models have been improved. From 1970s, various beam models have been introduced. In parallel to emerging capabilities of computers, in 1984 first FE (finite element) model of a belt conveyor is applied. The use of FE models expanded the research of belt conveyor dynamic behavior research. As an advantage of FEM (finite element methods) planar and web methods have been introduced lately [1-9].
2. Parameters of Belt Conveyors Belt conveyors typically consist of a series of sections that
makeup an entire conveyors. Shorter units can be single self-contained conveyors. All conveyors consist of sections: intermediate beds, drive, take-up, end pulleys (end brackets).
Several calculation methods for conveyors are mentioned and described. Those methods are identified and common figures and differences are mentioned and compared. Furthermore, the most frequently used two methods; DIN 22101[9] and CEMA[10] (Conveyor Equipment Manufacturers Association) Universal
Method are introduced in detail, formulas and tables are included. German standards have much wider scope and specify the full conveyor design process. The CEMA approach is based on identifying the tension and power contributions from several friction mechanisms and components.
In this study a real conveyor project is taken into account. The studied overland belt conveyor is planned and designed to be operative in ERDEMIR which is the largest flat steel manufacturer of Turkey [12]. This conveyor is a troughed belt conveyor with 35° trough angle on carrying side. Return side is flat. The conveyor is the longest part of a conveyor system which is over 3 kilometers in total to transport 1500 tons of iron ore per hour from New Ore Stock Area to existing ore manipulation system in the factory.
The belt conveyor is designed to carry iron ore pellets with lump size less than 20 mm. The desired capacity to be conveyed is 1500 tones and a safety factor; 1.25 is used in order to compensate the irregularities during reclaim. The conveyor speed is chosen to be 2.6 m/s; the same speed value as the existing ore manipulation system. Studied conveyor is the longest belt conveyor in the system and is 1000 meters long. It has a straight profile without any vertical or horizontal curves. ERDEMİR Plant Standards are also followed in the design, like idler distance is taken as 1 meter.
Before the calculations, some simplifications are considered. All the secondary resistances according to DIN 22101 are ignored. Gravity take-up is assumed to be connected to the head / drive pulley. Pulley resistances are ignored.
The conveyor power is calculated with DIN 22101-1982 method. General friction coefficient, f is taken as 0,022. Required, steady-state drive torque is obtained. Then a reducer and hydraulic coupling is chosen. Considering the total efficiency motor power requirement is also calculated.
Reducer is chosen according to the motor speed, in this case 1500 rpm, and desired conveying speed. Hydraulic coupling is preferred to limit the excessive start-up torque of the motor.
After selection of drive equipments, belt tensions are calculated. Eytelwein Equation is used to determine the steady state tension values on carry side and return sides of the drive pulley. Belt safety is checked with the highest belt tension. Steady-state tension on carry side is wanted to be over a certain value that the sag between
111

two carrying idlers is not less than 1,5 % of the distance. Weight of the gravity take-up is calculated according to the steady state tensions.
Fig. 1 Dynamic Model of Belt Conveyors
In this study, the startup of the conveyor after an emergency stop is examined. Early seconds of transient behavior of the conveyor belt is studied. The conveyor is supposed to start while carried material is fully laid on the carry side of the belt. The belt is initially tensioned with gravity take up.
3. Finite Element Method Approaches
The finite element method has been most extensively used in the field of solid and structural mechanics. The various types of problems solved by the finite element method in this field include the elastic, elastoplastic and viscoelastic analysis of trusses, frames, plates, shells, and solid bodies. In dynamic problems the displacements, velocities, strains, stresses, and loads are all time dependent.
Fig. 2 The variation of velocity on the carry side of the conveyor.
Studied belt is divided into finite number of beam elements all of which are represented by a mass, spring and a dashpot (Fig.1). Motions of equations are derived by obtaining mass, stiffness and damping matrices. Initial conditions are specified and affecting forces are calculated.
Conveyor belt is discretized as a collection of beam elements. Beam properties for each element are specified. Since we are mostly interested in longtitudal behaviors we are able to determine longer beam elements as compared to transverse vibration study. In this study, it's chosen that all beam elements are with the equal length; 40 meters.
A model of viscoelastic beams lined one after another can be represented as a multi-degree of freedom mass-spring-damper system. Motor torque output through the hydraulic coupling and reducer is introduced to the first element as the drive force. Resistance, inertial and viscoelastic forces that applies on each element is assigned.
To obtain the equations of motion; mass, stiffness and damping matrices are determined. Mass matrix is a diagonal matrix and elements representing the carry side and return side have significantly different values. In stiffness matrix, the connection pattern is not changed for the entire conveyor. Damping coefficient varies on carry side and return side. Thus, damping matrix element values are significantly different for representing carry and return sides. Force vector is formed as the only external force is applied at the drive pulley.
Fig. 3 The variation of velocity on the return side of the conveyor.
Equations of motions formed alinear, second order ordinary
differential equation system and its transformed into state-space equations. By using MATLAB's Control System Toolbox commands, the system is simulated for a step input. Results are separated as velocities (Fig. 2, Fig.3) and displacements (Fig.5) and variation of tensions on the carry side of the conveyor belt (Fig.4).
Fig. 4 The variation of tensions on the carry side of the conveyor belt.
4. Discussion and Results
112

CEMA and DIN 22101 standards use static analysis. It is used as all masses are accelerated at same rate and time and the belt like a rigid body. The belt on drive pulley with drive torque creates a stress wave. The stress wave propagates along the belt when the belt starts moving. There are stress variations along the belt. These stress variations are cause longitudinal waves. Longitudinal waves are dampened by resistances to motion. Therefore belt elasticity is taken into consideration in the mathematical model of the conveyor belt.
Wave propagation speeds are calculated for carrying side and return side of the conveyor. It's observed that there is no single wave propagations speed that is unique all around the belt but two different speeds due to element masses in carry side and return side. Due to load in the carry side, wave propagation speed of the return side is almost bigger than on the carry side.
The transient behavior of the conveyor for early stages of start-up is examined on carry and return sides. Three locations are viewed through simulations; head, intermediate and tail. Speed and displacements of the chosen nodes and speed and displacement of carry and return sides are plotted together and compared. Return side and carry side reactions are calculated. Tension changes are plotted. Wave propagation speed differences and its effects are given at various plots.
The variation of velocity on the carry side of the conveyor belt is displayed in Fig. 2. The velocity values at head, intermediate and return ends of the belt conveyor can be investigated.
The variation of velocity on the return side of the belt conveyor is displayed in Fig. 3. The values of velocity on head, intermediate and return ends of the belt conveyor can be investigated.
Fig. 5 The variation of displacements on the carry side of the conveyor belt.
5. Conclusions
The higher tension means the higher forces acting on the shaft of the pulley. Therefore, the diameter of the pulley shaft should be increased.
It has been observed that the wave propagation progress to the other side of the belt. It caused the excessive stretch of the belt. Therefore, initial choice of belt can be made carefully.
References [1] Roberts A.W. (2001)Recent developments in belt
conveying – bulk solid and conveyor belt interactions, Edited A.Levy and H.Kalman, Handbook of Conveying
and Handling of Particulate Solids, Elsevier Science, pp. 225-233.
[2] Yardley E.D., Stace L. R., (2008) Belt conveying of minerals, Woodhead Publishing Ltd., Cambridge, England.
[3] Nordel, L.K., Ciozda,Z.P.(1984) Transient belt Stresses During Starting and Stopping: Elastic Response Simulated by Finite Element Methods. Bulk Solids Handling 4/1, pp. 93-98.
[4] Ulsoy, A.G., Mote, C.D. (1980) Analysis of band Saw Vibration. Wood Science 13, pp. 1-10.
[5] Mote, C.D. (1968) Dynamic Stability of an Axially Moving Band. Franklin Institute 285, pp. 329-346.
[6] Zhang, S., Xia, X. (2009) A New Energy calculation Model of Belt conveyor. IEEE Africon .
[7] Li, Y.H., Gao, Q., Jian K.L. (2003) Dynamic Responses of Viscoelastic Axially Moving Belt. Applied Mathematics and Mechanics English Edition 24.
[8] Zür, T.V. (1986) Viscoelastic Properties of Conveyor Belts; Modeling of Vibration Phenomena in Belt Conveyors during Starting and Stopping. Bulk Solids Handling 6/3, pp. 553-560
[9] DIN 22101 “Continuous conveyors – Belt conveyors for loose bulk materials- Basic for calculation and dimensioning”.
[10] CEMA. (2007) Belt Conveyors for Bulk Materials 6th Ed., Conveyor Equipment Manufacturers Association, p.599, USA
[11] Rao S. Singiresu (2005) The Finite Element Method in Engineering (Fourth Edition), Elsevier Inc, e-book
[12] Cengiz C., (2012). Modelling of Belt Conveyor, Master Thesis Division of Science and Technology of Istanbul Technical University.
113

ЦВЕТНИ АКЦЕНТИТЕ В ИНТЕРИОРА (АНАЛИЗИ КЪМ ПОСТАНОВКА НА ВЪПРОСА)
доц. Мария Димитрова Евтимова Технически университет София, кат. Инженерен дизайн 1
Assoc. Prof. Maria Dimitrova Evtimova1 Technical University of Sofia, dpt. Industrial Design Engineering 1
Резюме: Умелото използване на акценти в интериора създава възможност да се изрази смисловия характер на композиционната. Цветните решения на аксесоарите в интериорния дизайн влият на цветовия климат. Ако дадено помещение е решено в пастелна гама, с използването на ярки или наситени цветни акценти (художествени произведение или дизайнерски продукти), без да са променяни основни цветовѝ решения на стени и мебели, цялостният му облик се преобразява. Цветовата гама на интериора се разнообразява и с помоща на текстилни декоративни елементи, събразени с типа помещение. Изразът на характерните му особеностите, като материал, цвят, фактура, орнаментика, изпозвани в интериорните решения, е предпочитан и в българската традиция
Keywords: цвят, цветова гама, цветни решения, цветови климат, интериор, композиция, мебели, декоративни елементи
Цветът е част от живота ни. Непрекъснатото му въздейст-вие носи различни емоционални и знакови послания. Всеки път, когато се опитаме да вникнем в смисъла на информацията визуално, ние първо разглеждаме сходните и различаващи се белези на предметите, свързвайки ги с нашето познание. Към тези белези можем да определим и цвета. Осъзнаването и сис-тематизирането му, е свързано с конкретно знание. Когато то е усвоено чрез практика, се увеличава възможността за точност при комуникацията. “Възприятието не се състои от пасивно получаване на сигнали, а от активно тълкуване на сигналите”1. Следователно, когато предаваме дадена идея е необходимо и определена точност на изразът на посланието, която определя конкретна база за разбирателство.Можем да кажем, че знанието за цветът е „едно обединено човешко познание”2. Разглеждайки въпросите за творческото мислене Томас Джон определя твор-чеството като “изобретателно и артистично използване на въображението”3, като определя израза му в три насоки. Посоч-ва, че това са три начина за реализация на творческите способ-ности:
o използване на въображението за реализация на функционални, практични произведения;
o използване на въображението за израз на емоционални послания, чрез реализация на произведения на изкуството;
o “Концептуални творчески способности – начинът по който се формират целите и произведенията се превръщат в реалност.
Умелото използване на аксесоарите, като акценти в инте-риора създава възможност да се изрази смисловия характер на композиционната обословеност и подчертаят „функционалните особености на интериора”4. Цветните решения на аксесоарите в интериорния дизайн влият на цветовия му климат. Например помещение, решено в неутрални цветове с използването на цветни аксесоари, без да са променяни основни цветовѝ реше-ния на стени и мебели, променят цялостен облик на поме-щението.
Акцентите, които могат да привлечат вниманието, като художествено произведение (живопис, графика, скулптура, фотография), могат да бъдат временните акценти. Характерното за тях е, че се определят като „подвижни”.
1 Уилсън, Р, Квантова психология ,Дилок, С 2001 с.42 2 Пономарьов Л. Под знака на кванта НИ, С.19891 с.141 3 Томас Дж. Тайни и техники на творческото мислене АРАТРОН, 1999 С. с.8-11 4 Беджев Ив. Интериорът какво и как ИТ С. 1984, с.94
1.Всекидневна
Цветовата гама на интериора се разнообразява и с помоща на текстилни декоративни елементи, събразени с типа поме-щение. Изразът на характерните му особеностите, като материал, цвят, фактура, орнаментика, изпозвани в интериор-ните рещения, като акценти, е предпочитан при обзавеждането на дома и в българсите традиции.
2.Автентична бродерия от 30-те години от Станке Димитров
Съчетаването им с естествените материали – дърво, камък, цветя, предоставя възможност за изява на естеството на при-родата, от която в своя стремеж да се откъсне от атмосверните условия, човека се изолира в помещенията на сградите.
Цветът има и материален израз. Винаги е възприеман като част от бита на човека. Двойственият характер на цвета се проявява при употребата му в народните обреди и обичаи: като знак и като украса. Цветовете са част “от фолклорното информационно пространство”5. Интерес представляват решенията на традиционните цветове на орнаментиката, които са свързани със символичните значения на цвета.
5 Алмалех М. Цветовете в балканският фолклорУИ,1997 С. с 11
114

3.Етнографска сбирка на кюстендилския музей
При постилките и различните месали от Кюстендилския край, разликата в цветовите съчетания е ясно изразена. Например - съчетание на ахроматични, топли и студени фризови композиционни елементи, с преобладаващ черен тон са характерни за погребалните обреди, а топлата гама с редуващи се контрастни зелени и ахроматични фризови композиции са за ежедневието.
Познаваемостта на значенията на цвета като знак е много по-универсална от тази на звуковете от естествените езици. Затова в древността знаковите послания са били добре познати и използвани. Философията на цветовите езици в национален план е универсална – това са мистично религиозните тайни познания и представи, които не са еднозначни, а в зависимост от мястото и начинът на употреба се характеризират с многозначността на всеки цвят.Като пример ще цитирам цветовите изрази на чакрите6, като заедно с тяхната функция ще посоча израза им чрез символичното значение на цветовете от друг автор7. Преплитането на двата изказа е очевидно вследната схема:
ЧАКРА ФУНКЦИЯ ЦВЯТ СИМВОЛИЧНО ЗНАЧЕНИЕ
Коренна Оцеляване,заземяване
Червено Физическа сила
Сексуална Желание,удоволствие,Сексуалност,потомство
Оранжево Физическа и интелектуална
сила
Пъпна Воля, сила Жълто Небесна енергия и интелектуална
сила Сърдечна Любов Зелено Равновесие на
силите, влизане в хармония
Гърлена Общуване, съзидателност
Яркосиньо Духовната сила
Трето око Виждане, интуиция
Индигово синьо
Интуиция и тайнственост
Теменна Разбиране Виолетово Физическа и духовна сила
Съвремието създава нови възможности за произведения реализирани чрез нестандартни художествени форми, които да съчетават в себе си познат с конкретна функция дизайнерския продукт и представянето му с ново звучене, реализирано с творческото въображение на автора. Тази тип предмети въздей-стват и същевременно се превръщат в своеобразни акценти при интериорното рещение. В работите на американската дизайнерка Паула Хейс (Paula Hayes), своеобразното съчетание между няколко природни елемента – вода, пясък, сухи клонки, кристали, стъкло, минерали, зелени растения, създава възможност за реално присъствие на природата в съвременният ни дом. Цветовете са с естественият им израз и ситуирането им в различна колористична среда е възможно.
4.Паула Хейс
6 Лин Дж.”Фън Шуй ароматотерапия Кибея С.1999 стр103 - 132 7 Буш Дж,Холи Д.”Магията на цветовете”, Кибея С.1998 с. 48-66
Когото говорим за цветовото разнообразяване на интериора чрез цветовете и в частност – чрез аксеорите е необходимо да се съобразим с конкретна идея. Ако това е зимния период, определено помещение от дома, например за спалнята може да е „топлина”. Студът и преобладаващите студени цветове – синьо-виолетово и синьо-зелено, както и неутралните бяло и черно, характерни за природата през този сезон, провокират спомени за топлотата на лятото.
Психолозите са установили, че предпочитанието към определени цветове зависи преди всичко от пола и възрастта. Например, жените проявяват влечение повече към топлите и ярки цветове, а мъжете към по-студените и приглушени тонове. Цветовият климат в дома е съвкупност и от цветовете на тъканите, осветителните тела, картините, фотосите и декоративните предмети. Затова разнообразието може да се постигне чрез цветовата характеристика на всеки от тях. Не е нобходимо да се налагат ограничения при избора на цветовото решение в интериора до един - единствен цвят. Освен това, когато цветовете са с еднаква светлост, наситеност, различни нюанси и отенъци, те взаимно се допълват, като подчертават своята изразителност.
Спалнята, трябва преди всичко да отпуска. В спалните помещения цветната динамика не трябва да е активна. Спрямо идеята „топлина”, големите площи е добре да бъдат в меки, пастелни тонове. Тъй като мебелите представляват съществен цветен фактор, разнообразието в инериора може да се постигне покривайки текстилните им части с тъкани в по-топли нюансирани цветове - оранжеви, охровати, или с отенъци на розови. Прекомерната слънчева светлина може значително да влоши качеството на съня, затова прозорците е желателно да са с по-плътни завеси. Съобразявайки се с цвета на стените, могат да се поставят завеси с отенъци на жълто, охра или нюансирани кафяви тонове, които внасят чувство за топлота, уют и отмора. Освен естествено осветление, присъщо за деня, трябва да бъде предвидена възможност за изкуствена светлина, като към горното осветление допълненията са нощни лампи, яркостта на които може да се контролира. Това създава възможност за смяна на цветовете чрез светлината. Подовото покритие може да се разнообрази с цветните съчетания на килим или черга. Цветовете могат да са топли или студени, но по-плътни и дори да присъства контрастът. При спалното бельо включването на нюансирани топли цветове, според индивидуалните предпо-читания е колоритно решение. Калъфките на възглавниците като акцент могат да са с по-ярки и наситени тонове. Изпол-зватено на контрастите е препоръчително, особено ако се изразява чрез съчетаване на обикновените повърхности и ненатрапчивата игра на орнаменти върху текстила. Психо-лозите твърдят, че цветята спомагат да се освободи стреса и раздразнението през отминалия ден. Затова е добре в спалнята да се аранжира букет от свежи цветя или клонки от елха с подходяща украса, ако наближава съответния празник.
115

Когото говорим за цветовото разнообразяване на интериора чрез цветовете и в частност – чрез аксеорите е необходимо да се съобразим с конкретна идея. Ако това е зимния период, определено помещение от дома, например за спалнята може да е „топлина”. Студът и преобладаващите студени цветове – синьо-виолетово и синьо-зелено, както и неутралните бяло и черно, характерни за природата през този сезон, провокират спомени за топлотата на лятото.
5.Цветови решения
Независимо от цялостното колористично рещение, цветовите акценти е необходимо да бъдат в контраст, да се групират, за да привлекат вниманието и по този начин да се подпомогне съчетаването на обеми, форми и цветове. Те спомагат функционалната същност на помещенията. Но не бива да се прекалява стях за да не се конкурират.
6.Цветови решения
Цветовата гама на интериора се разнообразява и с помоща на текстилни декоративни елементи, събразени с типа помещение. Ситуирането в интериора им е акцент, който неизменно е свързан с функционалната същност на помещени-ето или определена зона, като спомага неината определеност.
Литература:
1. Уилсън, Р, Квантова психология ,Дилок, С 2001 2. Пономарьов Л. Под знака на кванта НИ, С.19891 3. Томас Дж. Тайни и техники на творческото мислене
АРАТРОН, 1999 С. 4. Беджев Ив. Интериорът какво и как ИТ С. 1984, 5. Алмалех М. Цветовете в балканският фолклор УС С.
1997 С. 6. Лин Дж.”Фън Шуй ароматотерапия Кибея С.1999 7. Буш Дж,Холи Д.”Магията на цветовете”, Кибея С.1998 8. http://www.spalni.org/ 9. http://www.comfort.bg/bg/interesno/view/1389.html 10. http://www.comfort.bg/bg/interesno/view/934.html
116

DESIGN OF MINE SHAFT ELEVATOR
Asst.Prof. Dr. Gerdemeli I.1, Candas A.2, Unalan M.3 Faculty of Mechanical Engineering Istanbul Technical University - Turkey1,2,3
Abstract: This study is focused on basic design of mine shaft elevator. After discussing design basic of mine shaft elevators and criticizing advantages and disadvantages of them, mine case study will be illustrated. The using of elevators is increasing too and this situation encourages contractors to pay attention to vertical transport systems in mine industry. Technology changes every single day and elevator technology has to be developed for comfortable and reliable transports in mine area. Using elevators at such kind of places is vital for working. New design parameters will be compared according to old design parameters.
Keywords: MINE, MINE SHAFT ELEVATOR, BASIC HOISTING INSTALLATION.
1. Introduction Even ancient civilizations needed to use vertical transportation
in their routine. Hence, humanity used some kind of lifting systems which were work with the help of human or animal resources or water power. The first elevator, which had gear system and ropes, was designed by a Greek scientist Archimedes. Since the 80s AD, elevators began to be used in the Colosseum, in Italy. Gladiators and wild animals were transported by lifting systems. So, those systems officially started to take an important place in people's lives. Even though elevators began to be used, nevertheless, there was a big problem with them. There was not any safety system in case if the ropes ruptured. It was the main disadvantage of elevators until Elisha Otis solved this problem with the first safety system that was developed for vertical transport systems. That was a system with some springs which were connected to carry a rope. Hence, if the rope was torn, the spring would have pushed the tooth and that tooth would cover the guide rails. Thereby, the car could be easily stopped without any difficulties [3-11]. Kinds of Elevators;
Passenger elevators, Hoist elevators, Service elevators, Car elevators, Elevators for the disabled, Mining elevators.
Mining: Almost all underground mines all over the World have hoisting
installations. A small number of these installations can also be found in open cast mines. Generally, they are mounted on the surface, but some hoisting installations are located underground in very deep mines [1]. The ore and waste from the development work are transported to the shaft station and then hoisted to the ground surface. This, as well as ascent and descent of men, supplies and tools. is accomplished by the mine hoisting plant [2]. Mining process is made in four steps;
Searching and finding mineral deposits, Exploration, discovering of location, amount and removal
a coast of the ore body, Preparation, preparing a map to remove the ore in the
most effective way, Operation, a period of removing the ore body.
There are two kinds of mines. When an ore body is close to the surface, then there is no need to have a mine shaft. By the removing a surface of the territory by heavy construction equipments it would
be enough to gain minerals. This kind of mines is called "opencast mining". Contrarily, if an ore body is very deep, then there is supposed to be a mine shaft. Even though that costs even more, an opencast mining would not be used for that deep excavations and that process is called “deep mining". When it comes to design of a mine shaft, there are two options: circular shafts and horizontal shafts (Figure 1, Figure 2). Circular shaft is the most commonly used one. If the shaft should be deep and shaft diameter is supposed to be more than 4.5 meters, circular shafts are the best choice. Because of their circular shape, they are easier by the usage. Rectangular shafts, which use timber supports, are still commonly used [13-14]. Timber supports, bricks, and concrete blocks are common types of shaft liners used in the shafts with short life-span expectancies in a competent rock. However, in a rocks exhibiting of a high lateral pressures, these liners don’t withstand crafts well due to the bending moments created along the length of the excavation.
2. Design of Elevator
To prevent a potential danger at mining elevators, their components should be chosen carefully by correct calculations. Basically a mining elevator can be seen on figure 3.
.
Fig. 1 A circular mine shaft. Suspension ropes are enwrapped around a drum and
counterweight is attributed to the end of the suspension rope and the other end is connected to the car.
117
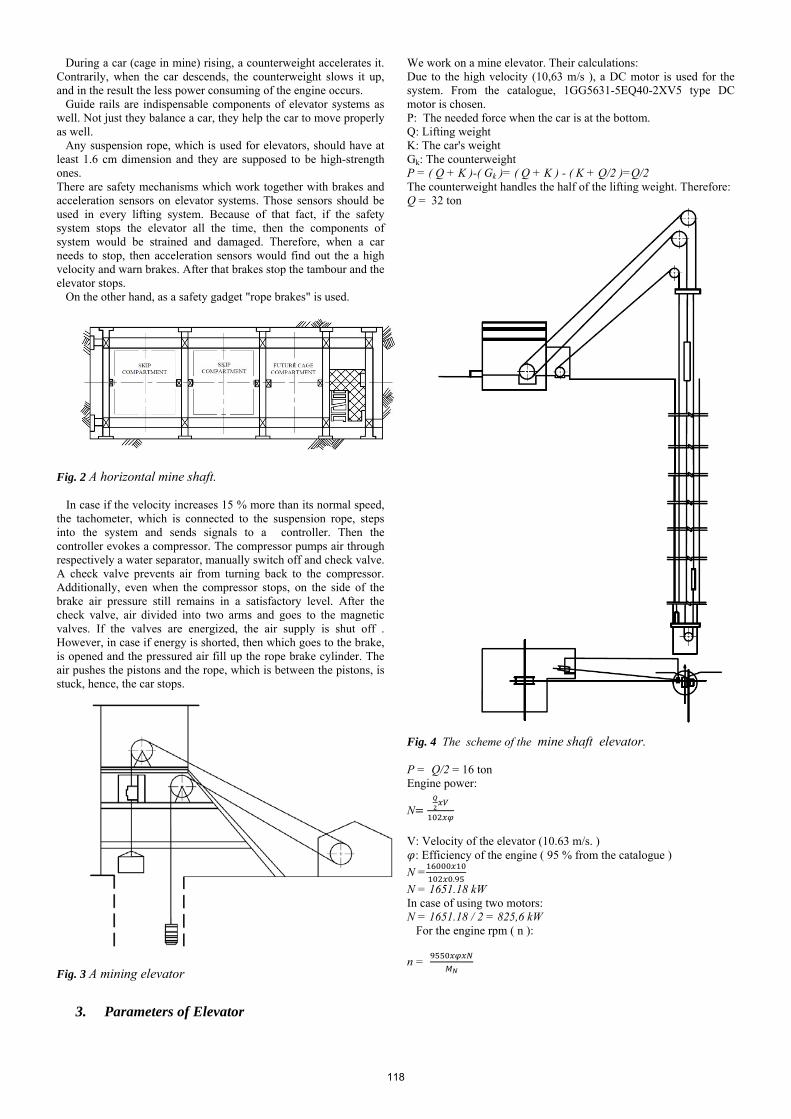
During a car (cage in mine) rising, a counterweight accelerates it. Contrarily, when the car descends, the counterweight slows it up, and in the result the less power consuming of the engine occurs. Guide rails are indispensable components of elevator systems as well. Not just they balance a car, they help the car to move properly as well. Any suspension rope, which is used for elevators, should have at least 1.6 cm dimension and they are supposed to be high-strength ones. There are safety mechanisms which work together with brakes and acceleration sensors on elevator systems. Those sensors should be used in every lifting system. Because of that fact, if the safety system stops the elevator all the time, then the components of system would be strained and damaged. Therefore, when a car needs to stop, then acceleration sensors would find out the a high velocity and warn brakes. After that brakes stop the tambour and the elevator stops. On the other hand, as a safety gadget "rope brakes" is used.
Fig. 2 A horizontal mine shaft.
In case if the velocity increases 15 % more than its normal speed, the tachometer, which is connected to the suspension rope, steps into the system and sends signals to a controller. Then the controller evokes a compressor. The compressor pumps air through respectively a water separator, manually switch off and check valve. A check valve prevents air from turning back to the compressor. Additionally, even when the compressor stops, on the side of the brake air pressure still remains in a satisfactory level. After the check valve, air divided into two arms and goes to the magnetic valves. If the valves are energized, the air supply is shut off . However, in case if energy is shorted, then which goes to the brake, is opened and the pressured air fill up the rope brake cylinder. The air pushes the pistons and the rope, which is between the pistons, is stuck, hence, the car stops.
Fig. 3 A mining elevator
3. Parameters of Elevator
We work on a mine elevator. Their calculations: Due to the high velocity (10,63 m/s ), a DC motor is used for the system. From the catalogue, 1GG5631-5EQ40-2XV5 type DC motor is chosen. P: The needed force when the car is at the bottom. Q: Lifting weight K: The car's weight Gk: The counterweight P = ( Q + K )-( Gk )= ( Q + K ) - ( K + Q/2 )=Q/2 The counterweight handles the half of the lifting weight. Therefore: Q = 32 ton
Fig. 4 The scheme of the mine shaft elevator. P = Q/2 = 16 ton Engine power:
N
V: Velocity of the elevator (10.63 m/s. ) : Efficiency of the engine ( 95 % from the catalogue )
N =.
N = 1651.18 kW In case of using two motors: N = 1651.18 / 2 = 825,6 kW For the engine rpm ( n ):
n =
118

Tab. 1 Parameters of elevator
MN: Rated torque (16200 Nmm, from the catalogue)
n = .
= 627 r/min
Rotation speed:
np=
DT: Pulley diameter (3500 mm)
np = .
. = 58 r/min
4. Selection of the Suspension Rope
The number of bends and the degree of severity of each The degree of severity of each bend can be equated to a number of simple bends. A simple bend is defined by the rope travelling over a semi circular groove where the radius of the groove is about 5 − 6 % greater than the nominal rope radius. The number of simple bends corresponds to an equivalent number of pulleys Nequiv, which can be derived from: N = Nt + Np Nequiv (p) = Kp. ( Nps + 4. Npr ) Kp = ( DT / DP )4 DT = Drive pulleys' diameter DP = Other pulleys' diameter Kp = Proportion of drive pulleys' diameter with the other pulleys
Nps= Number of pulleys with simple bends Npr= Number of pulleys with reversed bends Therefore: Kp = ( 3,5 / 3,5 )4 = 1 Nequiv (t); for 40o bevel angle: 7,1 Nps, number of pulleys with simple bends: 2 Npr, number of pulleys with reversed bends: 0 Hence: Nequiv (p) = Kp. ( Nps + 4. Npr ) = 1. ( 2 + 0 ) = 2 Nequiv = Nequiv (t) + Nequiv (p) = 7.1 + 2 = 9.1
Fig.5 Basic scheme of the pulleys
The safety factor: Sf = 6.811 Max. load which effects on the suspension ropes: Fmax= gn. [(P+Q+ H) /(n.i)] (N) S= Tmin/Fmax > Sf Tmin = Min. rupture force according to the standards H : The weight of the suspension ropes provided that if the car is at the bottom n : The number of suspension ropes i : Rope selection factor gn : Gravitational acceleration, Fmax = 9.81 [(15500+8320+4453) / (4 . 2)] Fmax = 32160.53 N S = Tmin/Fmax > Sf From the catalogue below, Tmin = 887 kN S = 887000/32160.53=27.58>6.811 (Sf ) (The suspension rope is reliable) Even though the suspension rope, which has 38 mm in diameter, is available. As it selected from the catalogue, that rope is shown as "-38 mm", which means that this rope is a special product and costs pretty much. Thus, if the construction is able to handle the difference of weight, then we should use 40 mm. diameter suspension rope. Between 38 mm and 40 mm suspension ropes, for 730 meters height, there is difference in 438kg and the system is able to handle this difference. Therefore, as the suspension rope of the elevator is chosen as 40 mm. diameter.
5. Selection of the Guide Rails
The calculations will be done in terms of the guide rails which are chosen from the catalogue. n=Hbina/ln n: The number of rails
Item Technical Characteristics Type and Specification
Multi-rope
frictional winder
Main guide wheel diameter 3500 mm
Pulley diameter 3500 mm Max rope static tensile force 887 kN Max rope static tensile force diff. 78.48 kN
Rope quantity 4
Max. hoisting speed 10.63 m/s
Motor
Type 1GG5631-5EQ40-2XV5
Power 1120 kW
Rotation speed 58 r/min
Voltage 720 V
Current 1620 A
Inertia moment 174 kgm2
Motor weight 7450 kg
Head rope
Type 6×19+FC
Rope diameter 40mm.
Tensile strength 1670 N/mm2
Unit weight 6.1 kg/m
Vessel Type
5.3 m3 double-deck car Counterweight 22000kg
Dead weight 15500 kg
People carried 104 people
Crane Lifting capacity 16t + 16t
119

ln: Length of the rail( From the catalogue: 5 m ) l: Distance between a console of the rails Hbina : The length of the whole system n = 735 / 5 = 147 pieces of the rail. The guide rails should be calculated according to three situations: 1) In case of safety system works; 2) Nominal use by moving 3) Nominal use by having loaded For the x-axial; The bending stress is:
Fx =
h: The distance between the car's rollers of the rail ( 4500 mm ) k1: 3 ( a constant coefficient of impact ) Fx = 205.898 N Fy = 0
My=
My = .
= 115818.06 Nmm
σy= (Wyis found by the catalogue.)
σy = 115818.06/11300=10.25 N/mm2
The bending:
Fk =
Fk = .
=4768.86 N
Selection of buffers and brakes are made by calculation and catalogue findings.
Ropes are a vital part of the mine shaft elevators, the safety of hoisting being largely dependent upon their reliability.
All calculation are made by computers again and both values are compared and design parameters are decided by engineers.
6. Conclusions
Elevator (hoisting) design for Mine Shaft systems is the subject of the study. Design for Mine Shaft is considered for basic well. Elevator parameters are calculated and the values of design parameters for both computers are compared. An analyze of computer and the calculations are investigated.
References [1] Czaaplicki J.M.,2010, Mining Equipment Systems, CRC
Press, taylor & Francis group,London. [2] Tarasov L. (1973), Mining Practice, Mir Publisher, Moscow. [3] İmrak C. E. and Gerdemeli İ.(2000) Elevators and Escalator,
Birsen Publishing, Istanbul, Turkey. [4] Thomas D. Barkand, "Emergency Braking Systems for Mine
Elevators", US Department of Labour, Pennsylvania, USA. [5] Thomas D. Barkand, "Safe Electrical Design of Mine Elevator
Control Systems", US Department of Labour, Pennsylvania,USA
[6] Turkish Standards Institute for elevator standards. [7] Ilkyung Miju Rail, The Catalogue of Guide Rails. [8] Matunhire I. I., "Design of Mine Shafts", Pretoria, South Africa. [9] UCOP Safety Conference, (2007)"Elevator Safety ", California,
USA [10] Beyer R., "Elevators - First Things First", Architectural Record
(1994) [11] Briem U., Rebel G, Verret R., ( 2005 )" Composite Steel Wire
Ropes for Mine Hoisting Applications", Hoist and Haul Conference, Perth, Australia
[12] Magnusson A., (2008) "Celebrating a Heritage of Mine Safety Improvement", Alimak Hek, Skellefteå, Sweden [13]http://www.emt-india.net/process/mining/mining_overview.htm [14] https://wiki.queensu.ca/display/mine448/Mine+Shaft+ Development [15] Unalan M., (2012) “Design Parameters of Mine Elevator”, Master Thesis, ITU Institute of Science and Technology
120

ПРОЧНОСТЬ СТАЛЬНЫХ ИЗДЕЛИЙ ДЛЯ УНИКАЛЬНЫХ МЕТАЛЛИЧЕСКИХ КОНСТРУКЦИЙ
THE STRENGTH OF STEEL PRODUCTS FOR THE UNIQUE METAL STRUCTURES
Проф., д.т.н. Ведяков И.И., проф., д.т.н. Одесский П.Д., инж. Егорова А.А.
ЦНИИСК им В.А. Кучеренко, Москва
Abstract: Тhe discuss the strength of the plate of large thickness (plate to 230 mm, shaped sections with a thickness of up to 125 mm shelves, etc.) used in the construction unique buildings. The problems of developing requirements and these products, methods for assessing the strength, the choice of materials and efficiency of application. KEYWORDS: PLATE OF LARGE THICKNESS, OVERALL STRENGTH, DUCTILITY, RESISTANCE TO BRITTLE FRACTURES. В настоящее время в нашей стране начали широко возводится уникальные строительные объекты – высотные здания, большепролетные (пролеты свыше 100 м) конструкции, стадионы и т.п., где необходимо применять стальные изделия больших толщин с высокими эксплуатационными и технологическими свойствами: толстолистовой прокат толщиной до 230 мм и выше (в опорных частях конструкций), фасонные профили с толщиной полок до 125 мм, поковки диаметром свыше 500 мм.
Одновременно появилась возможность использования в строительстве сталей повышенной и высокой прочности нового поколения с дисперсными структурами и высокой частотой по вредным примесям, упрочнение проката из которых при массовом производстве налажено в потоке станов с использованием эффектов термомеханической обработки (ТМО).
С учетом возможности поставок с различных заводов проката из новых марок стали и интеграции российского строительства в систему мирового хозяйства были разработаны
и введены в действующие строительные нормы новые универсальные требования к материалам различной прочности В прокате больших толщин для сварных металлических конструкций в зависимости от схемы упрочнения распределения прочностных свойств по сечению может быть как достаточно однородным. Так и с высокой степенью неоднородности (рисунок 1).
Таблица 1 Нормируемые показатели ударной вязкости проката
Примечание 1 KCA – ударная вязкость образцов типа 1 по ГОСТ 9454, испытанных при температуре +20°С, с U – образным надрезом после деформационного старения; KCV – ударная вязкость образцов с V – образным надрезом (типа 11 по ГОСТ 9454). 2 В толстолистовом прокате испытываются поперечные образцы, в фасонном и сортовом - продольные.
Требования основаны на выявленных параметрических зависимостях величины контролируемых характеристик от микроструктуры. О сопротивлении хрупким разрушениям в этих нормах судят по величине ударной вязкости при
отрицательных температурах KCV-t , гарантируется свариваемость, свойства по толщине проката (Z – свойства). Для случая применения изделий упомянутых выше больших толщин, в уникальных сооружениях проведена корректировка этих требований, в том числе с учетом имеющихся разрушений элементов конструкций. Здесь нетрадиционно стадится вопрос об однородности свойств по сечению.
В прокате больших толщин для сварных металлических конструкций в зависимости от схемы упрочнения, распределение прочности свойств по сечению может быть как достаточно однородным, так и с высокой степенью неоднородности (рисунок 1).
Распределение предела текучести по толщине листового
проката (сплошные линии – результаты испытаний цилиндрических пропорциональных образцов;
прерывистые – интегральных плоских; t – толщина листов, мм).
Толщины 60, 150, и 230 мм – нормализация, толщина 120 мм – упрочнение в потоке стана
Последнее имеет, место при термомеханической прокатке изделий с последующим охлаждением с достаточно высокой скоростью. В этом случае высокое сопротивление хрупким разрушениям различной природы, переменным нагрузкам, коррозионным и сейсмическим воздействиям обеспечивается при наличии поверхностного упрочненного слоя, где предел текучести на 100…200 Н/мм2 выше, чем в сердцевине; кроме того при упрочнении в потоке станов в поверхностном слое формируются остаточные напряжения сжатия на уровне σост. ≈ 0,25σт.
121

Наблюдаемая неравномерность прочностных характеристик обусловлена неравномерностью микроструктуры по сечению, связанной с высокой интенсивностью охлаждения поверхности проката при достаточно высокой скорости движения металла по рольчагу. Однако подобная неоднородность структуры может привести и к сильной неоднородности распределения ударной вязкости по сечению (рисунок 2).
Влияние температуры на ударную вязкость стали 09ГДФБ с полкой толщиной 125 мм двутавровой балки (испытывались долевые образцы, отобранные на разных уровнях по сечению
полки; цифры у кривых – расстояние от оси образца до поверхности проката).
При хрупком состоянии сердце проката здесь в сварных соединениях могут возникнуть слоистые трещины. Достаточно высокая ударная вязкость в осевой зоне была достигнута корректировкой технологии термомеханической прокатки: она велась по режимам высокотемпературной термомеханической прокатки, способствующим формированию в осевых зонах благоприятной микроструктуры. Результаты испытаний показали, что прокат полностью соответствует требованиям (KCV-40 = 40 Дж/см2) по всему сечению (таблица 2). Таблица 2 Ударная вязкость локальных образцов балок с σт = 450 Н/мм2 толщиной полки 125 мм.
Также способом проверки достаточно хороших свойств сердцевины проката больших толщин является оценка величины относительного сужения ψz при испытании на растяжение цилиндрических образцов, вырезанных нормально плоскости проката. Обсуждаемые стали имеют высокую чистоту по вредным примесям и облагороженную, глобулированную фазу неметаллических включений, благодаря чему обсуждаемый прокат имеет максимально высокое гарантированное значение (группу качеств) по этому показателю: ψz ≥ 35%. Хладостойкость сварных соединений проката больших толщин оценивалась при испытании в диапазоне температур на статический изгиб крупных образцов с наплавкой (рисунок 3) по провоцирующим режимам (14 кДж/см). Критериальное значение испытаний – деформационное: минимальная
температура, при которой сужение у дна надреза разрушенного образца ψ = 1%; эта критическая температура рассматривается как температура нулевой пластичности Тнп. Результаты испытаний (таблица 3), показывают, что у рассматриваемого проката Тнп - 40°С, что позволяет эксплуатацию конструкций из него не всей территории РФ.
Резюме Современный толстолистовой и фасонный прокат больших толщин имеет высокие эксплуатационные свойства, позволяющие обеспечивать надежную работу уникальных строительных сооружений не всей территории Российской Федерации.
122

REMODELING AND ENVIRONMENTAL ADAPTATION OF CONCRETE BATCHING FACTORY
ARCHITECTS: LORENZO ALONSO ARQUITECTOS: Lorenzo Alonso González, José Luis Cerezo Sanz, Enrique García Sánchez;
COLLABORATORS: Talleres Alquezar, Raúl Gómez Escribano, Raúl Cebrián Aroca, Ester Fuente Chavarría; TECHNICAL ARCHITECT: José Manuel García Sola; PROMOTER / OWNER: Morteros y Áridos Especiales S.A.; CONSTRUCTION
COMPANY: Morteros, Áridos y Hormigones S.A.
PRIZE DISTINCTIONS COAM 2011
Abstract: Inside the city of Madrid, near the main trade fair enclosures, existed a traditional factory of manufacture of concrete whose process of gather of arid in surface and handcrafted dosing by means of contribution with tractor mounted scoops, generated serious environmental problems: Noises, Powder, unforeseen Movement of heavy vehicles. In conclusion, not only environmental pollution but also aesthetic. An inappropriate place for the city. The Challenge: To make compatible an industrial use with the life of the urban ecosystem. The Solution:- To transform the system of surface collections to silos in height.
-To design the whole system of transport of the different flows of materials making easier "the mixtures" -To wrap all this under a skin that promotes the urban image and identifies the activity.
Project dates: Basic project: December 2006, Project of Execution: September 2009, Completion date: abril 2010; Data of the site: C/Tomás Redondo 7,Madrid, España
Keywords: URBAN SUSTAINABILITY, INDUSTRIAL DESIGN PROJECT, CONCRETE BATCHING PLANT, RAW MATERIALS, NOBLE MODERN MATERIALS, ENERGY EFFICIENCY, REDUCTION OF IMPACTS, PASSIVE SYSTEMS
1. Introduction
1.1. The Order: The studio received the proposal to act in an old cement factory that was fully operative and which generated negative impacts on the surroundings (visual, noise, dust, etc.). The idea was to mitigate these impacts and optimize production, as well as environmental and landscape parameters, with the final aim of integrating the factory into the city. We accepted the task as an urban and architectural challenge; the challenge of integrating a “cement factory” in a consolidated urban network. Fig. 1 Place Representative and very visible place Fig. 2 Previous state Degraded and suburbial image
Nowadays, there does not yet exist a typology of this type of intervention, neither in Spain nor in Europe, as it has always been associated to an impressive holding, hardly compatible with urban areas. From an architectural and urban point of view we believe that with adequate treatment, any industrial activity can be adapted to the city. This entails carrying out an extensive study of the problems that can arise and providing them with a solution, thus aiming for the sustainable exploitation and coexistence of industry and city.
Fig. 3 Transformation Organization of the industrial process Fig. 4 Architectural treatment Architectural response to an industrial urban element The project arises from the search for an industrial prototype of urban batching plant of concrete, which supposes a great advance both in the minimization of the consumption of resources and in the efficiency and quality of the production.
123

2. The concrete CITIUS, ALTIUS, FORTIUS Three Olympian words to define a noble material, which for more than two millenniums competes in the career of the materials to offer useful and beautiful solutions in the construction of the human habitat. Its manufacture is the result of man's cleverness, the concrete is fusion, mixture of different materials. Each of them yields its characteristics to the set to fuse into a new one, original materials that share and transform themselves into a new one, a "networked", modern, digital material. It is a challenge to place its manufacture nearby the places where it is going to be used so as to make it really useful. It has to coexist with the City, to be adapted to it.
3. Principles of sustainability 3.1. Situation of the plant (Fig. 5) An indispensable element of necessary consumption as a concrete factory can be joins the city, integrating itself into the environment by means of the suitable architectural treatments. This proximity reduces the tours of trucks, and therefore, the pollution produced and the consumed resources are also reduced. 3.2. Storage of arid (Fig. 6, Fig. 7) The original plant had a system of traditional arid storage, which is set in surface. The trucks came and went constantly from the gravel pits to leave the material needed for the concrete. We introduce a collecting system of in silos, which allows to have major quantity of arid in the plant. Therefore, improvements take place: -environmental: emissions to the atmosphere are avoided because it is a completely closed system. -energy efficiency: the machinery is more efficient, and as we are able to gather more arid the traffic of trucks is reduced. In this way, an idustrial prototype of urban concrete plant is achieved, which supposes a great advance both in the minimization of the consumption of resources and in the efficiency and quality of the production. 3.3. Reduction of impacts (Fig. 8) -visual impact: the "skin" provides to the Concrete Factory a more urban façade integrating it in an environment of office blocks . -emission of dust and noise: the framework that shelters the exploitation serves as a filter, controlling the emission of dust and noise. -tour of trucks: the possibility of storing more arid allows fewer trucks tours and off-peak hours. 3.4. Passive systems (Fig. 9) -ventilation: a zone of ventilation is left in the whole roof perimeter where the hot air escapes -treatment of the skin: we provide a façade of uglass with diverse finishings, that vibrate adapting to the solar control according to the orientation; and different degrees of transparency that sift the sights of the interior.
Fig. 5 Situation of the factory Fig. 6 Storage in the surface Fig. 7 Storage in silos Fig. 8 Architectural skin Fig. 9 Batching factory
124

Fig. 10 Ground floor
4. In conclusion
The processes of transformation of raw materials have formed the city historically, today the city has to recover the industrial activities and adapt them to the urban ecology. Any activity tied to the development of humanity has to be able to be done in the urban field. The human being has to design the necessary processes to make the activities that accompany him compatible throughout history.
Fig. 11 Sections
Fig. 12 Layers The concrete is an invention of the human being, an inseparable partner, that has helped him to build his cover for centuries. It has helped to write in the city a modern and beautiful language. The city does not have to relegate it, it has to integrate the concrete as a fundamental piece in its construction. Fig. 13 Photographs of the constructive process Fig. 14 Photographs of the constructive process Fig. 15 Silos (3500 m³ of arid)
125

Fig. 16 Section
4. In conclusion
The industrial architecture has formed cities and has taken part of its economy and its identity. The industrial buildings are real cathedrals for the deepest religion: Human work.
Fig. 17 Silos
Fig. 18 Constructive section
126

ОТНОСНО ЗНАЧЕНИЕТО НА ЛОГОТО, КАТО СИМВОЛ ЗА ПРОДУКТИТЕ НА АВТОМОБИЛНАТА ИНДУСТРИЯ
The importance of the logo as a symbol of the automobile industry's products Маг.инж.дизайнер Върбанова Д.,
Машиностроителен факултет – Технически университет, София, Република България
Abstract: The object of the following article is to describe the relationship between the logo and the identity of the modern automobile. Survey was conducted with 10 people of whom six were shown frontal images of cars with digitally removed logos. Using deviation analysis and Fisher’s criterion it was proven that the absence of a logo makes it difficult for participants to recognize the car.
Keywords: автомобилно лого, дисперсионен анализ, критерий на Фишър
1. Въведение
Терминологично понятието лого може да бъде заменено с думи като марка (търговска), емблема или графичен знак, и всъщност става дума за продукт на графичния дизайн, с който пазарното изделие е разпознаваемо еднозначно. Логата се използват за разпознаване на организации или други нетърговски дружества. Днес съществуват много корпорации, продукти, услуги, агенции и други подобни, използващи идеограма (знак, икона, емблема) или логотип (уникално представен и подреден шрифт), или комбинация от двете като лого. Идеограмите (икони, знаци, емблеми) могат да са по-ефективни от логотипа, особено за логата, които се превеждат на други езици. Логото играе ролята на визуална връзка между стоките и услугите, предлагани от дадена компания и потребителите. Без търговската марка, потребителят няма да бъде в състояние да направи разграничение между себе си и останалите компании, и следователно не може да очаква на оценки за определен стандарт или качество. Ефективното лого, представящо определен бранд, е предпоставка за определяне избора на потребителя спрямо представения продукт или услуга, тъй като е заело място в съзнанието му.
Логото се явява основна част от рекламата за даден производител. То е част от „запазената“ територия, монопол на производителя. Едни от най-популярните лога в световен мащаб, заради масовата използваемост на продуктите на съответните производители и според оценката на специалистите, са показани на фиг.1.
Процесът на изграждане на благоприятен имидж за даден производител, както и за конкретен негов продукт, който, в съзнанието на потребителите и потенциалните клиенти, го отличава от конкурентите, се нарича бранд. Част от бранда е и логото. В частност автомобилният бранд включва задължително и логото на производителя. На фиг.2 е показана хронологията в развитието на логото на Renault. На фиг.3 е показана хронологията в развитието на логото на Ford, на фиг.4 – това на Mercedes, а на фиг.5 - на AUDI.
Фиг.2. Хронология в развитието на логото на Renault.
Фиг.1. Едни от най-популярните лога в света.
127

Фиг.3. Хронология в развитието на логото на Ford.
Фиг.5. Хронология в развитието на логото на Audi.
Фиг.4. Хронология в развитието на логото на Mercedes.
Renault претърпява значителни промени в дизайна на
логото си. Първият им знак е монограма представляваща комбинация от инициалите на създателите на компанията през 1900 г. Следващите две лога изобразяват актуалната тогава производствена дейност - автомобили и танкове. Дизайнът на следващите лога на компанията тръгва в друга посока и знакът вече е стилизирана радиаторна решетка, често срещана в превозните средства. Следва и промяна в общия изглед на логото, като то вече приема формата на ромб, с която е разпознаваемо и до днес.Примерите с хронологичното развитие на останалите автомобилни лога показва, че всяка марка е претърпяла своето развитие във времето. При AUDI например това е в резултат от фирмени промени и сливания като се асимилират логата на компаниите, основатели и постепенно се заменят със символ на обеденение, запазвайки търговското име на главната компания. За други като Ford и Mercedes е видимо, че знакът, като форма и символ, е устойчив във времето. Той се променя и еволюира, но само следвайки актуалните тенденции в графичния и по-специално в лого-дизайна. Отпадат допълващите декоративни елементи.
Целта на настоящата работа е да се докаже потребността от логото за разпознаваемостта на автомобила, независимо от модификацията, модела и времето на неговото производство.
128

2. Същност на изследванията На фиг.6 са показани четири фронтални изображения [1,2,
3,4], снимки на съвременни автомобили, на които графично, с помощта на подходящ софтуер са заличени логата. Подобен пример може да се приведе и с ретроавтомобили [5, 6] без лога, при които, поради тяхната отдалеченост във времето на производство, както и поради отсъствието им по пътищата днес, затрудненията при тяхното разпознаване са още по-големи. На фиг.7 са показани две подобни изображения на изключително популярни за своето време автомобили, на които логата са заличени.
Автомобил 1
Автомобил 2
Автомобил 3
Автомобил 4
Фиг.6. Фронтални изображения на съвременни популярни модели автомобили, на които графично са заличени логата.
Автомобил 5
Автомобил 6
Фиг.7. Фронтални изображения на популярни ретроавтомобили, на които графично са заличени логата.
Проведена беше анкета сред хора, които имат отношение
към проблематиката. Става дума за автомобилисти с дълъг стаж, различна възраст и опит.
В табл.1 са показани резултатите от тази анкета. Поставен беше единственият въпрос: познавате ли този автомобил?
129

Според точността на съответния отговор бяха попълнени и полетата в таблицата-матрица на Фишър.
Табл.1
Поредно изобра-жение на
автомо-бил ↓
j1÷6, n=6
Пореден анкетиран, i1÷10, m=10
1 2 3 4 5 6 7 8 9 10
автомобил
1 0 0 0 0 0 0 0 0 0 0
автомобил
2 0 1 0 0 0 0 1 0 0 0
автомобил
3 0 0 0 0 0 0 0 0 0 0
автомобил
4 1 0 0 1 0 0 1 1 0 0
автомобил
5 1 0 0 1 0 0 0 1 0 1
автомобил
6 0 0 0 1 0 0 0 0 0 0
Парци-ална срeдна cтой-ност
0,33 0,17 0 0,50 0 0 0,33 0,33 0 0,17
обща средна стой-ност
= 0,182
Резултатите от табл. 1 (оценка 1 се отнася за правилен
отговор; оценка 0 – за неправилен отговор) бяха подложени на дисперсионен анализ [8]. Пресметнатата стойност за коефициента на Роналд Фишър е илюстрирана с помощта на табл.2. Вижда се, че получената емпирична стойност за коефициента на Фишър е Fe=0,572, която се сравнява с табличната FT,0,05 = 2,23. Очевидно е, че Fe < FТ, от което следва, че възможността за познаването на марката на автомобила без лого е незначителна. Това на практика показва, че наличието на лого върху автомобила влияе много съществено върху неговата разпознаваемост.
Табл.2
. QA=6[2(0,33-0,182)+2(0,17-
0,182)+(0,5-0,182)+2(0,33-0,182)] = 3,268
. QR=[4(1-0,33)+3(1-0,50)+2(1-0,83)] = 34,11
SA=QA/KA, KA = n-1=10-1=9 SA = 3,268/9 = 0,363;
SR=QR/KR, KR= mn-n=60-6=54 SR = 34,11/54 = 0,631;
Fe= SA/SR = 0,363/0,631= 0,572 FT;0,05 = 2,23
3. Заключение Полученият резултат от проведения дисперсионен анализ за определяне на влиянието на логото върху разпознаваемостта на
автомобила показва недвусмислено, че поставеното лого върху челния панел (решетка или преден капак) на автомобила е необходимо за неговата разпознаваемост. Този извод се отнася в една степен за съвременните и в много по-голяма - за старите автомобили. В интерес на читателите, които биха се заинтересували от това кои са автомобилите от фиг.6 и 7, следващата табл.3 ги разшифрова.
Табл.3
Очевидно е, че автомобил 4 е разпознат от 40% от анкетираните, защото решетката на Mercedes е силно запомняща се. Освен това, този водещ световен производител на автомобили поддържа неизменно тази решетка във времето. Трябва да се отбележи, че подобно дизайнерско поведение във времето има и BMW с неговата решетка, макар че логото на този производител не е обект на разглеждане в настоящата статия. Автомобил 2 е разпознат от само 20% от анкетираните, вероятно поради формата на контура на мястото за разполагане на логото, което място е еквидистантно на самото ромбично лого на Renault. Подобен успех има и ретроавтомобилът на Ford (автомобил 5), докато неговият събрат от същата 1910 г. (автомобил 6) не е познат за никой от анкетираните, вероятно защото е специален луксозен модел от своето време. Липсата на лого върху решетката на автомобил 3 (SEAT) го прави неузнаваем за всички анкетирани, макар че моделът LEON има силно пазарно присъствие. Подобен „успех“ сред анкетираните бележи и автомобилът 1, вероятно защото става дума за експериментален модел на PEGEOUT, който все още го няма на пазара. В крайна сметка беше доказано, че разпознаваемостта на автомобилното лого може да се постигне обективно с помощта на научни средства и по-точно с помощта на дисперсионния анализ на Р.Фишър.
Литература:
[1] http://nmrp.log.bg/article. php?article_id=14080 [2] www.lincah.com/2010-mercedes-benz-e-63-amg [3]www.zeocars.com/wp-content/uploads/2010/11/2012-Renault-ZOE-Front-View-3.jpg [4] www.nicedeals.co.uk/product_info.php?products_id=8876 [5] www.roadincorporated.com/cars/veterans/ford-model-t/ [6]www.gminsidenews.com/forums/f62/my-trip-new-mercedes-benz-museum-35257/ [7]http://best-ad.blogspot.com/2008/08/evolution-of-logos.html [8] Ангелов, Н.П., Учебно помагало с протоколи за лабораторни упражнения по обработване на материалите и инструментална екипировка, Издание на Техническия университет – София, 2008 г. За автора: Маг. инж.-дизайнер Дияна Върбанова е редовна докторантка в катедра „Инженерен дизайн“ в ТУ - София.
Автомобил 1 Peugeot RC HYmotion4 от 2008 г.
Автомобил 2 Renault ZOE от 2010 г.
Автомобил 3 SEAT León Copa Edition от 2008 г.
Автомобил 4 Mercedes, модел Е63 от 2010 г.
Автомобил 5 Ford, модел Т от 1910 г.
Автомобил 6 Benz Prinz Heinrich Rennwagen от 1910 г.
130

СТРУЙНО-АБРАЗИВНА ИЗНОСОУСТОЙЧИВОСТ НА ГАЗОТЕРМИЧНИ ПОКРИТИЯ С МИКРОЧАСТИЦИ
Доц. д-р инж. М. Кандева, Маг. инж. И. Пейчев
Технически университет – София, България
JET-ABRASIVE WEARRESISTANCE OF GAS-THERMAL POWDER COATINGS WITH MICROPARTICLES
Assoc. Prof. Dr. Kandeva M., Peychev I.
Technical University – Sofia, Bulgaria
Abstract: Device and procedure for coatings’ testing of wear and wearresistnace under the action of air blast containing abrasive particles have been developed. The obtained results refer to the wearresistance of 10 types of coatings obtained using the technology of the HVOF (high velocity oxygen fuel) thermal spray process.
.
Keywords: TRIBOLOGY, WEAR, WEARRESISTANCE, COATINGS, EROSION
1. Въведение
Настоящата тема се разработва в контекста на докторска дисертация и е посветена на износоустойчивостта на газотермични прахови композитни покрития, нанесени чрез свръхзвукова струя (HVOF – процес).
Изследванията по темата се провеждат в условия на абразивно износване като най-интензивният режим на износване в експлоатационната практика на машините.
Прието е покритията да се изследват и изпитват методично по показателя «износоустойчивост» при два алтернативни режима на износване: единият е износване при неподвижен абразив, а другият – износване със свободен абразив, като свободният абразив може да се среща в различни състояния.
Предмет на настоящото изследване е вторият случай на износване при свободен абразив, пренасян от въздушни струи. В литературата процесът на този вид износване е известен като „ерозия” или «ерозийно износване» [1,2,3].
В работата се изследва износоустойчивостта на износоустойчиви покрития при контактното им взаимодействие с въздушно-абразивна струя. Покритията се получени чрез нанасяне на многокомпонентни суперсплави в прахово състояние върху подложка с помощта на свръхзвукова газова пламъчна струя (HVOF-процес) [4,5].
2. Изложение
2.1. Теоретични въпроси
Изхожда се от общия закон за контактното взаимодействие в трибологията [ ]:
(1) A
dA
R
dR
където AdA / е относителното смущение, RdR / - относителната реакция и - комуникативният потенциал на контактното взаимодействие между акцията (смущението) и реакцията.
В разглеждания случай на износване комуникативният потенциал е постоянен и 1 ; относителното смущение се представя чрез масовия дебит на абразивния материал, т.е.
(2) a
a
m
dm
A
dA
където tmm aa е законът за изменение на ударната
маса на абразива, атакуваща покритието чрез въздушва струя, и
(3) m
dm
R
dR
представлява относителното масово износване на покритието. Тук tmm е законът за масовото износване на покритието.
Отчитайки формули (2) и (3), общият закон във формата (1) се редуцира до:
(4) a
a
m
dm
m
dm
Интегрира се (4)
(5) nknmnm a
или
(6) anmk
mn
След антилогаритмуване се намира връзката между двата закона tmm и tmm aa , т.е.
(7) tmktm a.
След отчитане на получените формули и заместване във формула (1) се получава законът за скоростта на струйно-абразивното износване във вида:
131

(8) amkmdt
dm
От (8) се определя интензивността на износването:
(9) ma
mi P k
m
Износоустойчивостта mI , както е известно, се измерва с
реципрочната стойност на интензивността на износване, т.е.
(10) m
m
iI a
mm
1
Индексът m отразява масовата износоустойчивост на покритието.
Разработената експериментална методика и изследванията се основават на формула (10).
2.2. Методика и устройство за изследване на износването и износоустойчивостта в условия на струйно-абразивна ерозия
Функционалната схема на устройството за изследване на струйно-абразивна ерозия е представена на фиг. 1. Предназначението на устройството е да се формират два самостоятелни стационарни потока – въздушен и абразивен, които в последствие на изхода образуват работеща двуфазна струя, облъчваща повърхнината на изследваното покритие.
Фиг. 1: Функционална схема на лабораторна уредба за изследване и изпитване в условия на струйно-абразивно
износване
Стационарният свободно падащ абразивен поток се формира с помощта на три камери: захранваща камера (1), която се запълва с работния абразивен материал; стабилизираща камера (2), запълнена със същия вид абразив и работна камера (3), която е предназначена за ускоряване абразивните частици и смесването на двата потока.
Въздушният поток се подготвя последователно от източник на сгъстен въздух (4), пневмо-подготвяща група (ППГ) за пречистване на въздуха от механични частици, влага и маслени пари, превключвател (5) и регулатор на налягане (6) за захранване и стабилизиране на фиксираното
въздушно налягане P във въздушната камера (7), измервано по скалата на манометъра (8).
Формирането на работната двуфазна струя като краен продукт от смесването се осъществява на изхода на работната камера (3).
Изпитваният образец (10) се позиционира в държача (11), свързан с реверсивен механизъм (12), с който се регулират разстоянието между дюзата и повърхнината, и ъгълъг между оста на струята и нормалата към повърхнината на образеца.
Последователността на работа с устройството е следната: подходящо подготвеният образец (9) се поставя в държача (10) като се фиксира с реверсивния механизъм (11) на
определено разстояние и ъгъл на взаимодействие . Смесителната камера се захранва с чист въздух чрез отваряне на превключвателя (5) като се задава стационарно работно налягане P с регулатора (6). Работното количество абразивен материал се поставя в захранващата камера (1) при запълнена стабилизираща камера (2) със същия вид абразив при затворен механизъм (11). С отваряне на механизма (11) започва процеса на струйно-абразивно облъчване на покритието на образеца и продължава до момента на изчерпване на абразива в камера (1). В този момент се превключва механизъм (11), с което едновременно се прекратява изтичането на въздушния поток от камера (7) и на абразивния поток от работната камера (1) и стабилизиращата камера (2).
2.3. Експериментални изследвания и резултати
С описаните устройство и методика се изследва струйно-абразивното износване на 10 серии високоизносоустойчиви покрития, нанесени по технологията, известна като HVOF-процес (газотермична свръхзвукова струя) от различни прахови композиции със среден размер на частиците 35 m
В таблица 1 са представени обозначенията, наименованията, химическият състав, твърдостта и дебелината на покритията.
Параметрите на експериманталното изследване са представени в таблица 2.
В таблица 3 са представени експериментални резултати за масовото износване, скоростта на износването, интензивността на ерозията и износоустойчивостта за 10 серии образци с покрития.
На фиг. 2 е представена диаграма на струйно-абразивната износоустойчивост на изследваните образци с покрития.
0123456789
10
Износоустойчивост
Im.1
0-4
1 2 3 4 5 6 7 8 9 10
Номер на серията образци
Фиг.2: Износоустойчивост на ерозия на 10 серии покрития
132

Таблица 1
Наименование Химически състав Твърдост Дебелина
______________________________________________________________________________________________________________
%07,0%;03,0 232 SiOOAl
1 32OCr %03,0%;02,032 CaOOFe 62-64 HRC 200 m
Подложка Ст3 %02,0%;01,0 2 TiOMeO
32OCr -баланс
%37,4%;2,14 SiCr
2 6080M %54,4%;9,2%;6,0 FeBC 60-62 HRC 695 m
Подложка Ст3 %01,0%;51,2%;36,2 CoMoCu
Ni -баланс
%37,4%;2,14 SiCr
3 6080M %54,4%;9,2%;6,0 FeBC 54-56 HRC 450 m
Подложка Al %01,0%;51,2%;36,2 CoMoCu
Ni -баланс
%37,4%;2,14 SiCr
4 6080M %54,4%;9,2%;6,0 FeBC 66-68 HRC 510 m
Подложка Ст3 %01,0%;51,2%;36,2 CoMoCu
Затопяване до Т= Co650 Ni -баланс
WCP506 %9,36%;28,0 WSi
5 P602 %4,3%;9,3%;9,42 FeCoNi 65-66 HRC 520 m
12/88/CoWC %82,0,%;8,11 CBCr
1:1:1 Студен процес
WCP506 %9,36%;28,0 WSi
6 P602 %4,3%;9,3%;9,42 FeCoNi 62-64 HRC 490 m
12/88/ CoWC %82,0,%;8,11 CBCr
1:1:1 Затопяване до Т= Co650
%014,0%;25,2 22 SiOTiO
7 232 TiOOAl %01,0%;01,032 CaOOFe 38-40 HRC 250 m
(97/3) %36,2%014,0MgO
Подложка Ст3 32OAi -баланс
%014,0%;25,38 22 SiOTiO
8 232 TiOOAl %01,0%;01,032 CaOOFe 50-52 HRC 380 m
(60/40) %36,2%014,0MgO
Подложка Ст3 32OAi -баланс 120L mm ; o60
133

%014,0%;25,38 22 SiOTiO
9 232 TiOOAl %01,0%;01,032 CaOOFe 52-54 HRC 240 m
(60/40) 0,014%MgO
Подложка Ст3 32OAi -баланс 100L mm ; o90
%014,0%;25,38 22 SiOTiO
10 232 TiOOAl %01,0%;01,032 CaOOFe 56-58 HRC 320 m
(60/40) 0,014%MgO
Подложка Ст3 32OAi -баланс 80L mm ; o90
Таблица 3
________________________________________________________________________________________
Износване Скорост на износване Интензивност Износоустойчивост
g g/min
________________________________________________________________________________________
1. 0,0762 0,0127 410.76,0 410.3,1
________________________________________________________________________________________
2. 0,1484 0,0247 410.48,1 410.67,0
________________________________________________________________________________________
3. 0,2002 0,0334 410.00,2 410.5,0
________________________________________________________________________________________
4. 0,0132 0,0022 410.1,0 410.10
________________________________________________________________________________________
5. 0,0418 0,007 410.42,0 410.4,2
________________________________________________________________________________________
6. 0,0662 0,011 410.66,0 410.5,1
________________________________________________________________________________________
7. 0,0335 0,0056 410.33,0 410.3
________________________________________________________________________________________
8. 0,2249 0,0375 410.25,2 410.44,0
________________________________________________________________________________________
9. 0,0886 0,0148 410.88,0 410.14,1
________________________________________________________________________________________
10. 0,0142 0,0024 410.14,0 410.14,7
________________________________________________________________________________________
134

3. Заключение
Основните приноси в настоящата работа се свеждат до:
- Разработени са лабораторно устройство и методика за изследване и изпитване на материали и покрития в условия на струйно-абразивно износване, съобразени с изискванията на действащите стандарти [6]. Устройството позволява формиране на двуфазни струи – въздушни, носещи абразивни частици, чрез независимо регулиране на дебитите на двете фази – въздушна и абразивна. Това гарантира управление на интензивността на взаимодействие между струята и повърхнината.
- Проведено е сравнително изследване и са получении експериментални резултати за износването, скоростта на износване, интензивността и износоустойчивостта на 10 вида прахови покрития от микрочастици, нанесени чрез свръхзвукова пламъчна струя (HVOF-процес). Резултатите са представени в табличен и графичен вид.
Изследването в настоящата работа и нейното публикуване са свързани с проблематиката и финансирането по договор ДУНК-01/3 на Техническия университет-София с МОН на тема: „Създаване на Университетски научно-изследователски комплекс (УНИК) за иновации и трансфер на знания в областта на микро/нано технологии и материали, енергийна
ефективност и виртуално инженерство”, за което авторите изказват дълбока благодарност.
Литература
[1] ASMT G 76-95: “Standard test method for conducting erosion test by solid particle impingement using gas jets”
[2] Kimpel A., T. Kik, Erosionand abrasion wear resistance of GMA wire surfaced nanostructural deposits, Archived of Materials Science and Engineering, Vl. 30, 2008, pp 121-124
[3] Теофилова М., Трибомеханични аспекти на дисперсни системи, Автореферат, дис., С., 1990.
[4] Kandeva M., M. Teofilova, Erosion and aluminium alloys, Journal of the Balkan Tribological Association, Sofia, vol 5, 3, 1999, 182-188.
[5] Кандева М., Контактният подход в инженерната трибология, ТУ-София, 2012, монография
[6] BS 1615
135

MEASURING THE MOMENT OF FRICTION, COEFFICIENT OF FRICTION
AND ANGLE OF FRICTION IN THE SLIDING BEARINGS FOR UNSTEADY MOTION
Mr. sc. Dipl.-Ing. Gani PLLANA, PhD Student
University of Prishtina, Faculty of Mechanical Engineering, “Bregu i Diellit” p.n. 10000 Prishtina, Republic of Kosovo
Mr.sc. Dipl.-Ing. Fatmir AZEMI, Technical Secondary School ”Lutfi Musiqi” Vushtrri, Republic of Kosovo
Abstract: The mechanism is analyzed for two different angle velocities of the operating part. The measurements were
performed with lubrication and without lubrication. Forces in the mechanism were determined using the computer. These forces were derived without taking in account the variable load on the bearings, and the results were presented graphically. The bearing shell on which the measurements were performed has three different diameters (60, 70 and 80 mm). The material of the bearings is polyamide 6.6 with addition of molybdenum disulfide (MoS2).
Key words: bearings, sliding bearings, lubrication of the bearings, the moment of friction, coefficient of friction, angle of friction.
1. Introduction
In our experiments, we performed measurements of impact forces, moments of friction, coefficient of friction and angle of friction in the bearings, for this purpose a specially constructed mechanism (four bar mechanism, fig. 1.), with these dimensions:
Fig. 1. Four bar mechanism
Plain bearings offer the advantage of noiseless operation
and a high damping ability under cyclic and impact loads. If designed and lubricated correctly, the plain
(Sliding) bearings can carry heavy loads at a high rotational speed. These bearings are light in weight, have small radial dimensions and do not require special equipment for manufacture.
The reducing friction in bearings is often important for efficiency, to reduce wear and to facilitate extended use at high speeds and to avoid overheating and premature failure of the bearings. Essentially, a bearing can reduce friction by its shape, by its material, or by introducing and containing a fluid between surfaces or by separating the surfaces with an electromagnetic field.
2. Material for placenta of sliding bearings For our experiments, the placenta of sliding bearings is of
Polyamide 6.6 with the addition of molybdenum disulphide (MoS2) is also known by various names (U.S. Plaskon, Zytel, Germany-Ultramid, Durethan; England-Maarnyl, etc.), and is one of the thermoplastic poly condensate [Pllana, 1984].
These placentas were done in three dimensions with inside diameters of 60 mm, 70 and 80 mm. The fig. 2 shows the test sample.
Fig. 2. The placenta of sliding bearings
Coefficient sliding friction and the amount of consumption in dry friction. tab.1. Tab.1. Material for placenta of sliding bearings, POLIAMID 6.6+MoS2
Material The coefficient of friction
Fraying [μm/Km]
POLIAMID 6.6+ MoS2
0,32 to 0,35 0,7
136

Mechanical properties of material of the placenta of sliding bearings, tab.2.
Tab.2. Mechanical properties of material for our experiments
3. Measurement methods Fig. 3 shows the diagram of the dependence of the angle of friction
of the operating member with the angles of the oscillatory member (working member), as in one way as well as in the other direction of motion.
Fig. 3. Dependence angle of the angle of the angle Radial forces which act on the placenta of sliding bearings (tab. 3) Tab. 3
G[N] FR[N] 1 20 189,3 2 40 378,4 3 60 567,6 4 80 756,6 5 90 851,4
Moments of friction in the bearings for small speeds are considered characteristic, and in this case it will be valid as:
because:
from form (1) follows:
where:
-radial forces –the leverage transmission ratio of the device
- weights - coefficient of friction,
D- diameter of placenta sliding bearings From these results the appropriate coefficient of friction for the defined characteristic points of the oscillatory link mechanism has been calculated radial forces of different weights: Fig. 4 shows the effect of the radial force of the placenta sliding bearings.
Fig. 5 The effect of the radial force on the placenta of sliding
bearings. Changing the angle of friction, this is the gradient of the resulting force FR according to Figure 24 in the placenta of sliding bearings, given by the expression:
because:
follows:
In our measurements were used only the characteristic points B3, B4 and B5 for the working movement of the operating member of the measuring mechanism, and the points B8, B9, B10 and B11 for the reversible movement (idle movement) of the operating member of the mechanism. 4. RESULTS
Based on the diagrams for all combinations of loads, of
speed of the samples of sliding bearings and of change of the angle oscillating link mechanism, and by using the calibrated chart, and the above mathematical procedure, were constructed tables of calculated moments of friction.
Mechanical properties by:
Material POLIAMID 6.6+ MoS2
DIN 53 455 53 371
Yield on the train
N/mm2 (80) 50
DIN 53 452 Yield bending N/mm2 (94) 27 DIN 53 371 modulus N/mm2 (3200) 1500 DIN 53 455
53 371 Elongation at
break % (130) 250
Volume weight kg/m3 1150
FF
F
D
brake disk
placenta sliding bearingß
LR
N
137
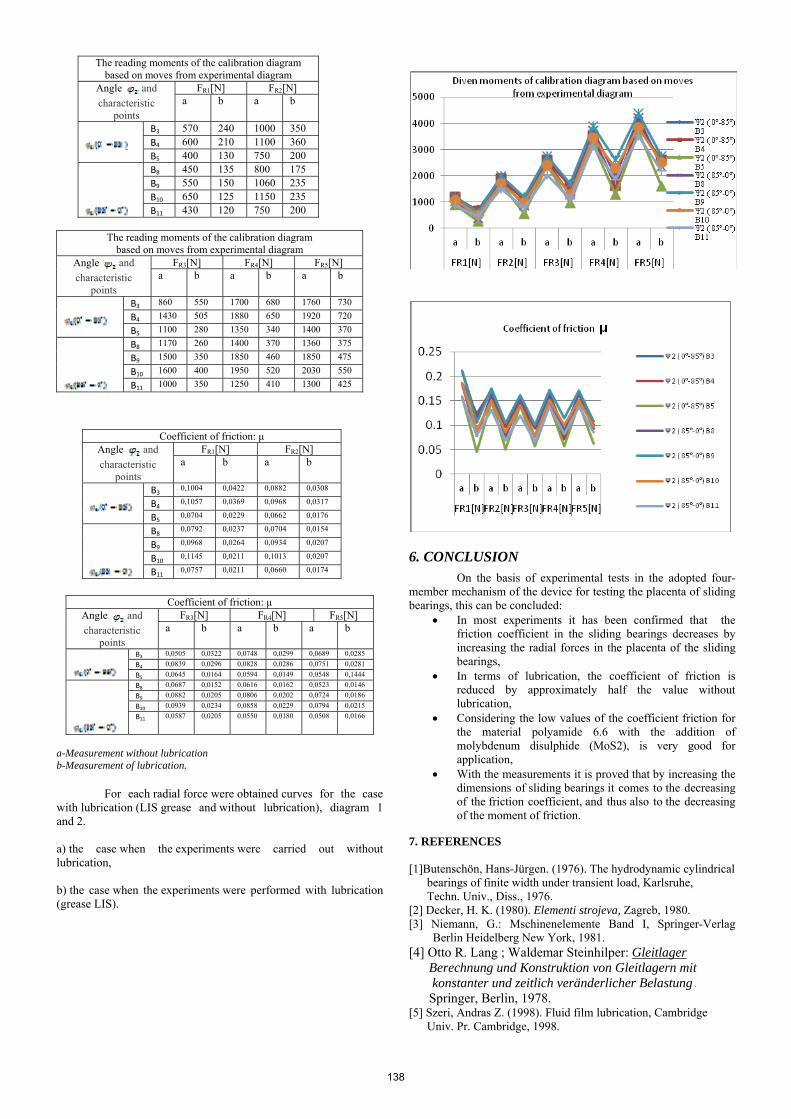
Coefficient of friction: μ Angle and
characteristic points
FR3[N] FR4[N] FR5[N] a b a b a b
B3 0,0505 0,0322 0,0748 0,0299 0,0689 0,0285
B4 0,0839 0,0296 0,0828 0,0286 0,0751 0,0281
B5 0,0645 0,0164 0,0594 0,0149 0,0548 0,1444
B8 0,0687 0,0152 0,0616 0,0162 0,0523 0,0146
B9 0,0882 0,0205 0,0806 0,0202 0,0724 0,0186
B10 0,0939 0,0234 0,0858 0,0229 0,0794 0,0215
B11 0,0587 0,0205 0,0550 0,0180 0,0508 0,0166
a-Measurement without lubrication b-Measurement of lubrication.
For each radial force were obtained curves for the case
with lubrication (LIS grease and without lubrication), diagram 1 and 2.
a) the case when the experiments were carried out without lubrication, b) the case when the experiments were performed with lubrication (grease LIS).
6. CONCLUSION
On the basis of experimental tests in the adopted four-member mechanism of the device for testing the placenta of sliding bearings, this can be concluded:
In most experiments it has been confirmed that the friction coefficient in the sliding bearings decreases by increasing the radial forces in the placenta of the sliding bearings,
In terms of lubrication, the coefficient of friction is reduced by approximately half the value without lubrication,
Considering the low values of the coefficient friction for the material polyamide 6.6 with the addition of molybdenum disulphide (MoS2), is very good for application,
With the measurements it is proved that by increasing the dimensions of sliding bearings it comes to the decreasing of the friction coefficient, and thus also to the decreasing of the moment of friction.
7. REFERENCES [1]Butenschön, Hans-Jürgen. (1976). The hydrodynamic cylindrical bearings of finite width under transient load, Karlsruhe, Techn. Univ., Diss., 1976. [2] Decker, H. K. (1980). Elementi strojeva, Zagreb, 1980. [3] Niemann, G.: Mschinenelemente Band I, Springer-Verlag
Berlin Heidelberg New York, 1981. [4] Otto R. Lang ; Waldemar Steinhilper: Gleitlager Berechnung und Konstruktion von Gleitlagern mit konstanter und zeitlich veränderlicher Belastung Springer, Berlin, 1978. [5] Szeri, Andras Z. (1998). Fluid film lubrication, Cambridge Univ. Pr. Cambridge, 1998.
The reading moments of the calibration diagram based on moves from experimental diagram
Angle and
characteristic points
FR1[N] FR2[N] a b a b
B3 570 240 1000 350 B4 600 210 1100 360 B5 400 130 750 200
B8 450 135 800 175 B9 550 150 1060 235 B10 650 125 1150 235 B11 430 120 750 200
The reading moments of the calibration diagram based on moves from experimental diagram
Angle and
characteristic points
FR3[N] FR4[N] FR5[N] a b a b a b
B3 860 550 1700 680 1760 730
B4 1430 505 1880 650 1920 720
B5 1100 280 1350 340 1400 370
B8 1170 260 1400 370 1360 375
B9 1500 350 1850 460 1850 475
B10 1600 400 1950 520 2030 550
B11 1000 350 1250 410 1300 425
Coefficient of friction: μ Angle and
characteristic points
FR1[N] FR2[N] a b a b
B3 0,1004 0,0422 0,0882 0,0308
B4 0,1057 0,0369 0,0968 0,0317
B5 0,0704 0,0229 0,0662 0,0176
B8 0,0792 0,0237 0,0704 0,0154
B9 0,0968 0,0264 0,0934 0,0207
B10 0,1145 0,0211 0,1013 0,0207
B11 0,0757 0,0211 0,0660 0,0174
138