of the gadhingkaj urban op-operative bank i/td..ga3qhinglaj
95
general backrdund about urban co-op. banks and history OF THE GADHINGKAJ URBAN OP-OPERATIVE BANK I/TD..GA3QHINGLAJ • 2.1 Introduction. 2.2 urban Co-op. Bank 2.3 Main functions of urban Co-op. Ban*. 2.4 Urban Co-op. Banks in Maharashtra <; including Kolhapur District ) • 2.5 Urban Co-op. Banks in Gadhinglaj Town. 2*6 About the Gadhinglaj Urban Co-op. Bank Ltd.# Gadhinglaj. r i) Brief history, ii) Management of the Bank, iii) present position of the Bank, iv) Organisational chart of the Bank.
-
Upload
khangminh22 -
Category
Documents
-
view
0 -
download
0
Transcript of of the gadhingkaj urban op-operative bank i/td..ga3qhinglaj
general backrdund about urban co-op. banks and history
OF THE GADHINGKAJ URBAN OP-OPERATIVE BANK I/TD..GA3QHINGLAJ •
2.1 Introduction.
2.2 urban Co-op. Bank
2.3 Main functions of urban Co-op. Ban*.
2.4 Urban Co-op. Banks in Maharashtra <; including
Kolhapur District ) •
2.5 Urban Co-op. Banks in Gadhinglaj Town.
2*6 About the Gadhinglaj Urban Co-op. Bank Ltd.#
Gadhinglaj.
r
i) Brief history,
ii) Management of the Bank,
iii) present position of the Bank,
iv) Organisational chart of the Bank.
CHAPTER - II
GENERAL BACKGROUND ABOUT URBAN CO-OP.
BANKS & HISTORY OF THE GADHINGLAJ
URBAN CO-OP . BANK LID. , GADHINGLAJ .
2.1 INTRODUCTION s
The Co-op. Societies are generally classified into
Agricultural Credit Societies and Non-Agricultural Credit
Societies. Agricultural Credit Societies were established
for rural masses. They were of Raiffeisen Model/fBut it
was also realised that like Agricultural Credit Societies
Non-Agricultural Credit Societies can be established in
the urban and seni-urban areas for providing cheaper credit
14
to small traders# employees# artisans and other middle
class men*l-Non-Agricult oral Credit Societies were
established in urban and semi-urban area on the Schulze-
Delitsch Model. T$ey are classified into -
a) Urban banks
b) Employees Credit Societies
c) Other Credit Societies
Among Nan-Agricultural Societies Urban Co.op.
Banks are the most important. This banking sector has been
the pioneering sector of the co-operative movement in the
country. The urban co-op. banks are also known as primary
credit societies or primary co-op. banks*
15
2.2 URBAN CO-OP. BANK t
“Urban Co-op* Bank is one which has been organised
£or accepting deposits from public* which are usually
repayable by cheques* which carry on normal banking -
industry*“ This is the general definition of urban Co-op.
Bank. But the definition of Urban Co-op. Bank* But the
definition of urban Co-op. Bank wa3 modified from time to
time. At the beginning of urban co-op. movement most of
the urban banks were organised as urban credit societies or
primary credit societies. Later on* they were converted
into Urban Co-op. Banks. No difference was made between
urban credit societies or primary credit societies -
Urban C£-op« Banks.
At the beginning of co-op. movement in India non-
agricultural credit societies with owned fund of
8s. 20*000/- were called as 'Urbah Banks*, -\fter some period
non-agricultural credit societies with owned fund of
Rs. 50*000/- and accepting deposits were called as Urban
Banks. Later on* only those which accepted current accounts*
and allowed operations on them* with cheques were defined
as ‘Urban Banks'.'‘According to Mehta Bhansali Committee
Report* the step was taken in 1939 to end the confusion
over banking by defining co-op. bank. It was declared
after 1st June* 1941 that no bank would be called as
16
‘Urban Bank* which would not having paid up capital of 8s, 20 #000/- and over and accepting deposits of money on current account otherwise subject to withdrawl by cheque, draft or order. In Madras province urban credit societies accepting deposits on current account and maintaining fluid resources according to the standardsprescribed by the Registrar of Co-op, Societies were
1*3called ‘Urban Banks1,
“While in Maharashtra according to Study Group on Credit Co-op* in non-agricultural credit co-op, in 1963“ an urban credit society can be styled as an urban bank which includes the following features s-
a) “a credit co-op, society registered under the StateCo-op, Societies Act in urban and semi- urban area,
b) a minimum capital of 8s, 50# 000/-*
c) provision of banking facilities e,g. accepting for the purpose of lending or investment of deposits from members or non-members repayable on demand or otherwise withdrawl by cheque, draft, order etc.**4
17
In the year 1975, the Reserve Bank took decision for the strengthening of urban banks and advised to The Registrar not to register new urban bank# without a minimum paid up capital of 8s* one Lakh, And *now urban bank or primary co-op* bank is defined as a co-op- society other than primary Agricultural Society with the following eharacteristics *-
a) its primary object is the transaction of banking business*
b) its paid up capital and reserves are not less than rupees One Laidn
c) its bye-laws do not permit admission of any other co-op* society as a member except whena c&-qp* bank contributes to its share capital
5with the help of funds provided by the state***
\
2.3 MAIN FUNCTIONS OF URBAN CO-OP. BANKS *
It has already been discussed about the definition of urban co-op. bank- Now we will discuss about the main functions of urban co-op. banks. Accepting deposits from members and non-members is the main function of urban co-op. banks. These banks always try to mobilise their deposits to a maximum by introducing attractive schemes under the directives of R.B.I. These banks are authorised to pay 1% extra interest on deposits. This helps them in deposit mobilisation efforts.
Advancing loans on security to the members for their various purposes is the another main function of these banks. But it does not mean that they are only cooperative moneylenders. They are social institutions having the responsibility of raising the standard of life of their members through growth.
These banks can undertake agency business of buying and selling of securities, debentures and essential consumer goods. These banks can undertake business such as borrowing, drawing, accepting,and discounting bills of exchangee.
19
These banks can undertake other types of business
like issue of travellers cheques, issues of letter of
credit, receiving various types of bonds, scrip etc. for
safe custody, services as collection of railway receipts,
remittances and payment of insurance premium, collection
of salaries, pension etc. as instructed by the customers.
Thus, the main function of urban co-op. banks is to
encourage thirft and self help. These banks are to raise
resources such as capital, reserves, deposits and borrowings.
These banks are to encourage saving habits of their members*
The fair interest is charged on deposits of members and
non-members • These banks finance to their members for the
purposes of trade, business, industry, profession, -
education, marriage, house construction etc. Such finance
may be provided either by secured loans or by unsecured
loans. On these loans fair interest is charged. The loans
and advances granted by these banks are against personal
security and securities such as gold and silver, fixed and
other deposits, Government securities, shares, debentures,
insurance policies, house etc* The object of the loans and
advances is not to raise debts of members but to help them
to come out of their financial difficulties and to start a
new life economically. According to recent national policy
r
these banks have to advance 60% of their loans and advances to priority sectors and 25% of their loans and advances to weaker section of the society. For these banks 'service* is the motto and not profit. These banks offer services to their members at a reasonable cost.These banks have also provided modern banking services. Those are offered by commercial bank but in the matter of functioning of urban co-op. banks these are few points of differences.
Urban co-op. bank generally functions in the town or city or at a district place. Its area of operation is restricted to a town or city or district. Thus it becomes compact organisation with members knowing each other. Though this bank is small organisation with essential local character in exceptional cases this bank may be permitted by the R.B.I. to establish its branch in another district of the same state in which it is functioning. In case of commercial bank the area of operation is not subject to the restriction as above.
Commercial banks are owned by the public in general but urban co-op. banks are owned by their members. “Urban co-op. bank is a co-op. society carrying on the business of banking. It offers greater access to its members
21/•*
for waving and borrowing facilities and at relatively
cheaper cost than a traditional commercial bank,“
The regular members of urban co-op. bank contribute share
capital of the bank and they have right to vote. The
nominal members have no right to vote. They are not
required to make any contribution to the share capital.
Further, nominal members are for limited purpose for
enabling them to stand as sureties for borrowing for short
period.and that too against tangible security. The regular
members irrespective of the size of share holding has
right of only one vote. In case of commercial bank, a
number of voting right depends upon his share holdings.
The share capital of commercial banks is generally
fixed while the share capital of urban co-op, bank varies
continuously due to admission of new members, grant of
loans to members etc.
The important feature of urban co-op, banks is
their democratic management. The Directors of the Board
are elected at fixed intervals on the basis of • one member
one vote* • Their Directors are comparatively less educated
and rarely possess enough knowledge of banking and manage
ment skill. However, they possess close Knowledge of the
situation and can estimate the problems of members and
their credit worthyness.
22r
2.4 URBAN QO-QP. BANKS IN MAHARASHTRA t
(INCLUDING KOLHAPUR DISTRICT)
History helps in guiding us for the future from
the mirror of the past. It is useful in evaluating fhe
present and may serve as a guide to the future. Hence#
after considering the main functions of urban co-op*
banks it is also important to throw light on the urban
banks in Maharashtra*
Maharashtra has played a pioneering role in the
urban co-op. credit movement in India. The first urban
co-op. credit society named “Anyonya Sahayakari Mandali*
was established in Baroda City. “On February 9, 1889
Prof* Laxman alias Bapusaheb Kavathekar arranged a dinner
at his residence in Baroda and the party ended with sett-7
ing up the society Anyonya Sahayakari Mandali** This
society was formed with the object of promoting thrift
and providing relief among the Maharashtrian families in
Baroda city. The twenty one Maharashtrians became founder
members with subscribing Rs. 2/- per month, it was a mutual
aid society of subscribing manbers. Its funds were
deposited in the post at bank and it had no assistances
from the Government* Inspiring the experiments of this
society voluntary associations were set up in Bombay
presidency without Government assistance.
23
The formation of co-op. societies was provided
by the Co-op. Societies Act of 1904 and more particularly
its amendment in 1911, enhancing its scope to formation
of non-agricultural credit societies specifically.
Initially, non-agricultural credit movement was confined
to the salary and wages earners and middle class people.
In the course of time, however, traders, and businessmen
became aware of the potentialities of such institutions
and showed the initiative in expanding the scope of such
organisational functions as full fledged banks.
The real boost to the formation of such societies
was provided by the Co-op. Societies Act of 1904. Enact
ment of this act gave birth to the urban banks in
Maharashtra. “The oldest among urban banks is The Shamrao
Vitthal Co-op. Bank Ltd., Bombay which was set up on 27thQ
December, 1906.“ This bank was established by the fore
most founding father of co-op. movement in India, Rao
Bahadur S. S. Talmaki, with the help of few dedicated
workers in the field of co-operation. This bank was
started to promote and encourage thirft and savings among
the members particularly at a time when usurious money
lenders exercised unbribed away over the destiny of their
debtors. The main purpose of starting the banks was to
24r
provide easy credit to persons of small means at low rate of interest, “This bank was first in the country to initiate the concept of cumulative deposit in 1907, a scheme that has since been successfully adopted by all banks. The various names of recurring and thirft
gdeposits.*
During the period from 1904 to 1915 the agricultural credit societies and non-agricultural credit societies were numbered to 13,882 and 602 respectively.In the sane period totally 12 urban banks were established in Maharashtra of which two were in Greater Bombay, one in Dhule district, four in Pune district, two in Ahmednagar district, One in So la pur district, two in Kolhapur district. Of these two urban banks named Kolhapur Urban Co-op. Bank Ltd., Kolhapur, Shri Balbhim Co-op. Bqnk Ltd., Kolhapur were established in Kolhapur district on 30/9/1913 and 15/10/1915 respectively.
Due to crisis among the joint stock banks, the Government of India promoted to appoint a committee on October 8, 1914, under the Chairmanship of Sir E. D. Maclagan, Foxmer Secretary to Government of India. This committee was appointed to suggest measures of improvement in regard to the constitution and working of central and provisional banks and the financial connection
25
between the various parts of the co-operative - organisations•
The importance of urban co-op* banks as an institution best-suited to cater to the banicing and credit needs of persons of limited means was first recognised by this committee in 1915. ^It pointed out that urban co-op* societies would serve the useful purpose of training the urban middle classes to understand the banking
Irtprinciple and practices** As a result of this committee's recommendations number of societies began to increase and the failure of local joint stock banks made easy the way for the organisation of new urban credit societies* It was then realised that urban credit societies were prominently suitable institutioned agencies for collecting local savings and to provide relief to those who were in clutches of money-lenders by providing - financial assistance to them*
Upto 1920 non-agricultural societies were called as parents of urbah banks. Most of the urban banks formerly were urban co-op. societies. They were managed by honorary workers and part-time staff. Several urban credit societies were established after the end of first world war. Tftey introduced a variety of measures to
mobilise deposit resources and simple banking facilities.*Also under the Chelmsford Reforms Act of 1919 co-operationwas made a state subject. Bombay state gave a lead bypassing a separate Act for that State in 1925 and other
11States also followed suit.*
Twenty urban banks were established during the period from 1916 to 1926. Of these six were in Greater Bombay, one in Thana district, one in Ratnagiri district and three in Nasik district, one in Pune district, two in Jalgaon district, one in Sangli district,Atwo in— dlti+wfcV*, Oft< In Ahm«.d,n<i.3c'X d>.s¥*>c.tKolhapur district and urban banks were established. The names of the urban banks established in Kolhapur district were Kagal Co-op. Bank Ltd., Kagal (21/7/1917) and Kolhapur zilla sahakari Nagari-Kanchi Sahakari Bank Ltd. Kolhapur (3/7/1917) • During the period from 1927 to 1937 totally 35 banks were established in Maharashtra of which in Greater Bombay - 8, Thana district - 1, Kulaba district— 3, Ratnagiri district - 3, Dhule district - 1, Jalgaon district - 2, Pune district - 2, Sholapur district - 1,Sangli district - 4, Satara district - 2,^Nagpur district
0£.Jr>am\V=*Aa *=<tsW\c.t-i— 1 and in Kolhapur district — 4 urban banks were established. The names of the urban banks established in Kolhapur district during the period from 1927 to 1937 were Shri Sbahu Co-operative Bank Limited, Kolhapur
27
C24/3/IS27) , Shri Mahalaxmi Sahakari Bank Ltd,, Kolhapur
(10/10/19 33) , Kolhapur Karat ha Co-op. Bank Ltd,, Kolhapur
(20/10/1933) , Shri Mahaveer Co-op. Bank Ltd., Kolhapur
(11/5/1937) .
Luring the above period the local support -
received by the urban banks was very important base for
their development in the urban area, very few members of
management knew the banking business. There was no agency
to guide then and supervise their working. The wrong
practices of borrowings from multiple agencies, the
extension of the period of repayment without justifica
tion of advances against landed property crept were at the
start itself. The facility for cleaning the cheques helped
the urban banks to print their cheques • This became a
symbol of status and deposits of urban banks nearly
doubled during 1924-29.
The Government of India fiarmed in June, 1929
Central Banking Enquiry Committee to investigate the
existing condition of banking in India and also to
recommend steps to meet the needs of agriculture, -
commerce, and industry.** In 1931 this committee -
recommended that limited liability co-ogT. societies
generally known as urban banks should be established for
28
the benefit of these classes of the population. The dutyfor these urban banks should be try to do for the smalltraders, small aierchents, the middle class populationwhat the commercial banks are doing for the big traders
12and the big merchants.** This committee felt that the urban co-op. banks should provide to the small traders, small merchants, and the middle classes. The same - facilities and services as commercial were provided to big businessmen. The committee was also of view that urban banks should concentrate on short term business* They should not lock up their funds in loans on the security of landed property. They should not also tend to joint-stock companies. It made detailed recommendations relating to their management, business etc. The - recommendations of this committee were accepted by the Government of India. The measures suggested, for the development and regulation of banking had been tagged with the establishment of R.B.I. The suggestions were slowly carried into effect after 1935.
The co-op. banking system strengthened and widened its urban base during 1938-47. Its major source of - strength was non-agricult oral sector. It is continued to be far in excess of the demand on them. Provided support to the expansion of co-operative activity on a large scale

in the sphere of distribution of essential goods including agricultural inputs and marketing produce and strengthened its ties with the money market. The establishment of closer relations with R.B.I. and Co-op. Banks# for co-ordinating and guiding the activities of co-op. banks were significant developments in the future reference.
The second World War imposed additional strains on co-op. banking system. The co-op. banking in Maharashtra met the demands. This was possible because they could draw on their liquid funds and banks were fully responsive to the needs of the urban banks. The outbreak of the Second World War made the whole banking system. This made them conscious of the importance of sound banking policy. The better check in statements of fluid resources was made.The audit was also tightened. As a result# the financial position of urban banks improved by the end of 1940-41.The financially sound banks were allowed to grant loans on the security of immovable property within a stipulated limits.
In 1941 State Government advised the Registrar to take action in case of co-op. banks in view of wrong banking practices adopted by some banks. After thus
30
ensuring the Government encouraged public and semi public institutions to deposit their surplus funds witfe1 co-operative banks* At the same time the banks increased the banking facilities which the central financing agencies and urban banks could use for bettering and widening the banking services to their customers •
Since the beginning of 1941 important developmentstook place* First, various steps were taken to avoidunfair competition from financing agencies* Second, thevarious standards of sound banking policies were madeapplicable to urban banks. Third, the bank resortedto a policy of developing urban banks of small traders,at taluka market centres. The growing prosperity ofof the semi-urban areas the urban banks efforts to expandbanking services and better their quality combined toproceed the speed of their growth. Even the Registrarproudly recommended in his administration report for1945-46 that * some of the urban banks in cities andbigger towns were keenly competing with the joint stock
13banks’*. At the same time co-operative planning committee found that the joint stock banks could not be expected to extend financial assistance to persons of small means to any appreciable extend and recovering small
loans and also they were not likely to have intimate
knowledge of the standing and resources of persons of
limited means. The committee, therefore, observed that
31
'* urban banks would be the most suitable agency for
serving the credit needs of classes like traders, artisans,
factory workers, technicians and skilled workmen like14
carpenters, black smiths, mechanics etc**. ‘
Eighteen urban banks were stablished in Maharashtra
during the years from 1938 to 1947 • Of these six were in
Greater Bombay one, in Kulaba District, one in Ratnagiri
District, one in Dhule District, three in Nasik District,
two in Jalgaon District, one in Solapur District, one in
Sangli District, Two in Kolhapur district urban banks were
established. The names of the banks established in Kolhapur
district during the same period were Prathamik Shikshak
Sahakari Bank Ltd. Kolhapur (20-10-1939) , Murgud Sahakari
Bank Ltd., Murgud (15-12-1947) •
It is further to note that the urban co-operative
banking acquired a considerable structure during pre-inde-
-pendance period due to four reasons. First, the failure
of local joint stock banks gave impetus to the growth
of urban co-operative banks, second, urban co-operative
banks were suitable institutional agencies for collecting

local saving and providing financial accommodation to those who were in the clutches of money lenders. Third# the great depression of 19 30 aid not hinder the developments of urban co-operative banks mainly because the fall in the urban incomes was not as steep as the fall in rural income. Fourth# the economic boom created by the second world war# provided a continuous growth of the urban banks.
After studying the historical background oturban co-operative banks in Maharashtra prior toindependence# it is considerable to l<bok after the growth
co-operativeof urban^banks in Maharashtra prior to independence period. The following table shows the growth of urban co-operative banks in Maharashtra state prior to independence.
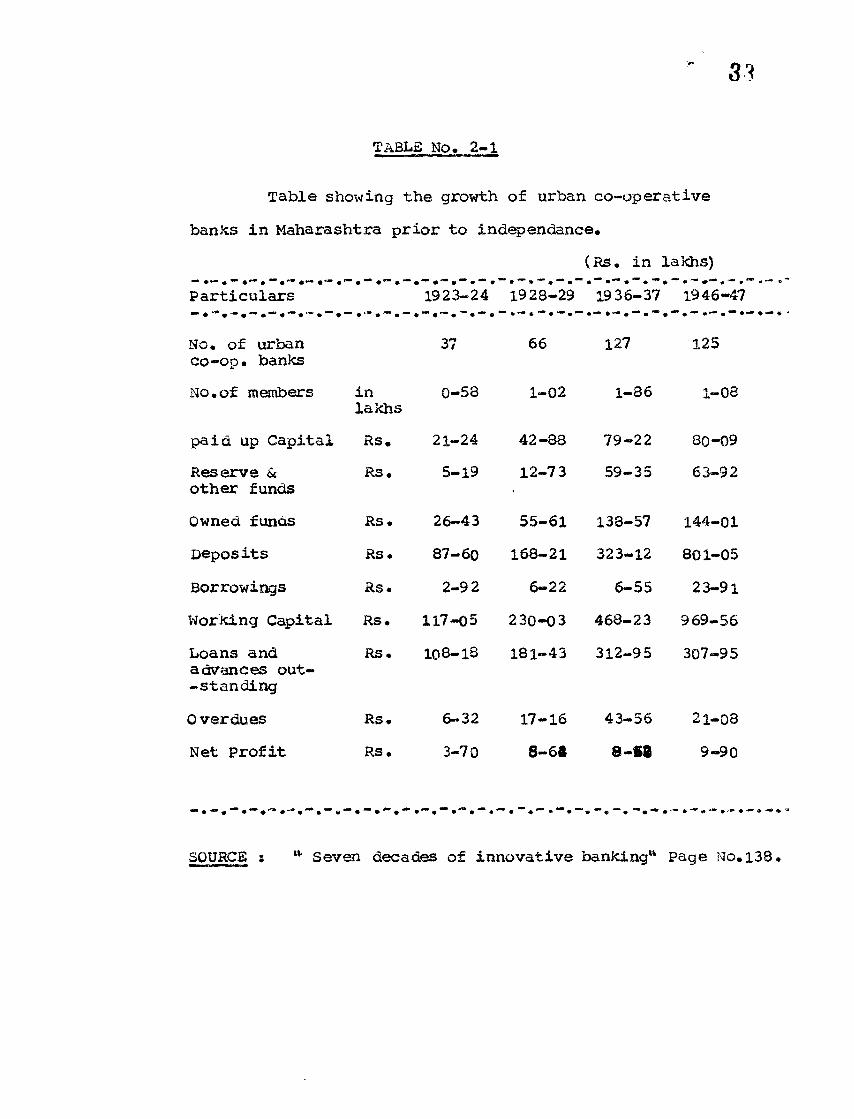
TABLE NO. 2-1
Table showing the growth of urban co-operative
banks in Maharashtra prior to independence.
(Rs. in lakhs)
Particulars 1923-24 1928-29 19 36-37 1946-47
No. of urban co-op. banks
37 66 127 125
No.of members inlakhs
0-58 1—02 1-86 1-08
paid up Capital Rs . 21-24 42-88 79-22 80-09
Reserve & other funds
Rs. 5-19 12-73 59-35 63-92
Owned funds Rs. 26-43 55-61 138-57 144-01
Deposits RS. 87-60 168-21 323-12 801-05
Borrowings Rs. 2—9 2 6-22 6-55 23-91
Working Capital RS. 117-05 230—03 468-23 969-56
Loans and advances out- -standing
RS, 108-18 181-43 312-95 307-95
0 ver dues RS. 6-32 17-16 43-56 21—08
Net profit RS. 3-70 8-64 8-68 9—90
•— • —»—. — • • *“*•*“
SOURCE s '* Seven decades of innovative banking11. Page No.138
r 31
The table No. 2-1 clearly shows that the total
number of urban co-operative banks in Maharashtra was
increased from 37 in 1923-24, to 66 in 1928-29# to 127
in 1936-37# but the same number decreased to 125 in
1946-47. Thus number of urban co-operative banks increased
by morethan 2 times with in the period from 1923-34 to
1946-47.
The table No. 2-1 also indicates that the
membership of urban co-operative banks increased from
0-58 lakhs in 1923-24 to 1-02 lakh in 1928-29, to 1-86
lakhs in 19 36-37 but the same was decreased to 1-08 lakhs
in 1946-47. It means the membership of urban from
1923-24 to 1946-47 .
The table No. 2-1 reveals that the paid-up capital
which was Rs. 21-24 lakhs in 19 23-24 increased to
Rs. 42-88 lakhs in 19 28-29# to Rs. 79-22 lakhs in 1936-37#
to Rs. 80-09 lakhs in 1946-47• This means the paid-up
capital was increased by 3-80 timass with in the period of
23 years.
THE TABLE No. 2-1 also reveals that the reserves
and other funds which were Rs. 5-19 lakhs in 1923-24,
raised to Rs. 12-73 lakhs in 1928-29, to Rs. 59-35 in
1936-37, to Rs. 63-92 lakhs in 19 46-47. Thus the
35r
reserves and other funds of urban co-operative banks
increased by raorethan 12 times during period of 23 years*
The table No, 2-1 indicates that the owned funds
which were Rs, 26-43 lakhs in 1923-24 reached to Rs. 55-61
lakhs in 1928-29, to Rs* 138-57 lakhs in 1936-37, to
Rs. 144-01 lakhs in 1946-47. This means the owned funds
increased by raorethan 5 times during the period 23 years.
The table No. 2-1 also shows that the deposits
which were Rs. 87-60 lakhs in 1923-24 remarkably raised
to Rs. 168-21 lakhs in 1928-29# to Rs* 323-12 lakhs in
19 36-37, to Rs. 801-05 lakhs in 1946-47. Thus the deposits
of urban co-operative banks in Maharashtra increased by
more than 9 times during the period from 1923-24 to 1946-47.
The table No. 2-1 also reveals that the borrowings
of urban co-operative banks in Maharashtra increased from
Rs. 2-92 lakhs in 19 23-24, to Rs. 6-22 lakhs in 1928-29,
to Rs. 6-55 lakhs in 19 36-37, to Rs. 23-91 lakhs in
1946-47. This means the borrowings from 1923-24 to 1946-47
increased by more than 8 times.
The table No. 2-1 also indicates that the working
capital of these banks increased from Rs. 117-05 lakhs
in 1923-24# to Rs* 230-03 lakhs in 1928-29, to 468-23 lakhs
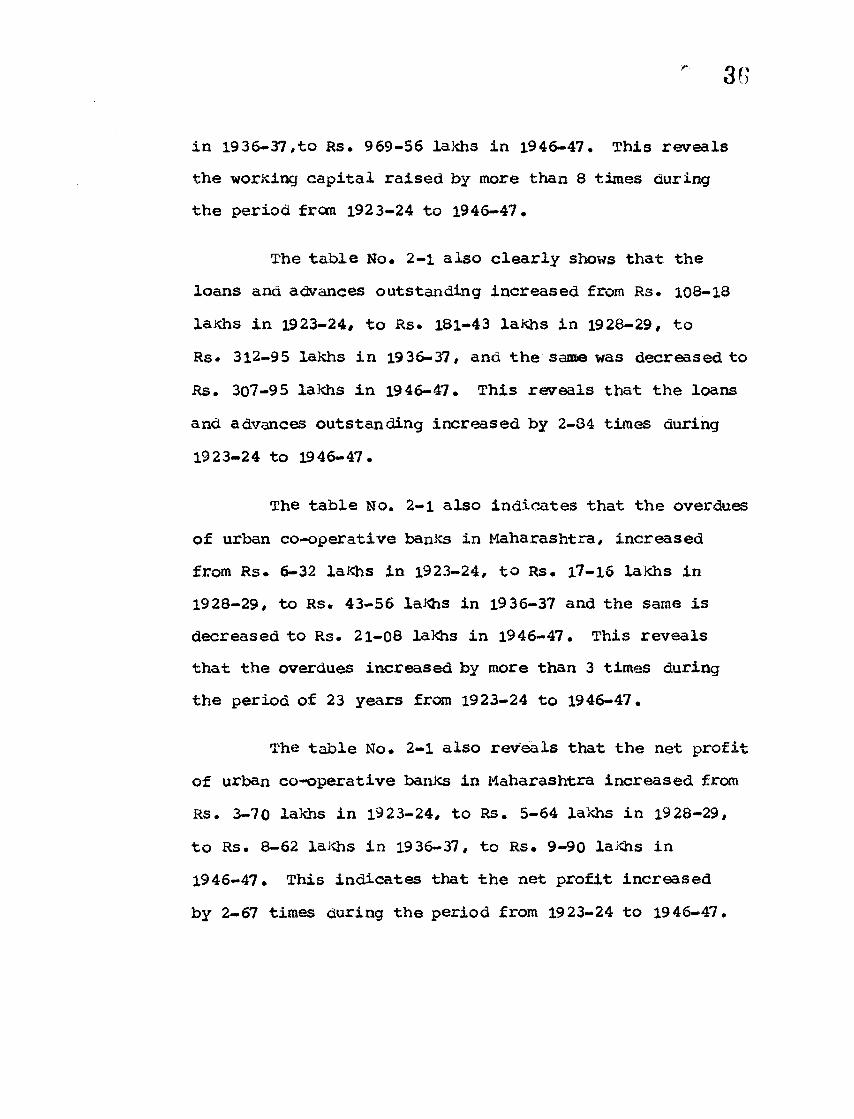
in 1936-37,to Rs. 969-56 lakhs in 19 46-47. This reveals
the working capital raised by more than 8 times during
the period from 1923-24 to 1946-47.
The table No. 2-1 also clearly shows that the
loans and advances outstanding increased from Rs. 108-18
lakhs in 1923-24, to Rs. 181-43 lakhs in 1928-29, to
Rs. 312-95 lakhs in 1936-37, and the same was decreased to
Rs. 307-95 lakhs in 1946-47. This reveals that the loans
and advances outstanding increased by 2-84 times during
1923-24 to 1946-47.
The table No. 2-1 also indicates that the over dues
of urban co-operative banks in Maharashtra, increased
from Rs. 6-32 lakhs in 1923-24, to Rs. 17-16 lakhs in
1928-29, to Rs. 43-56 lakhs in 1936-37 and the same is
decreased to Rs. 21-08 lakhs in 1946-47. This reveals
that the overdues increased by more than 3 times during
the period of 23 years from 1923-24 to 1946-47,
The table No. 2-1 also reveals that the net profit
of urban co-operative banks in Maharashtra increased from
RS. 3-70 lakhs in 1923-24, to Rs. 5-64 lakhs in 19 28-29,
to Rs. 8-62 lakhs in 1936-37, to Rs. 9-90 lakhs in
19 46-47. This indicates that the net profit increased
by 2-67 times during the period from 1923-24 to 1946-47.
37
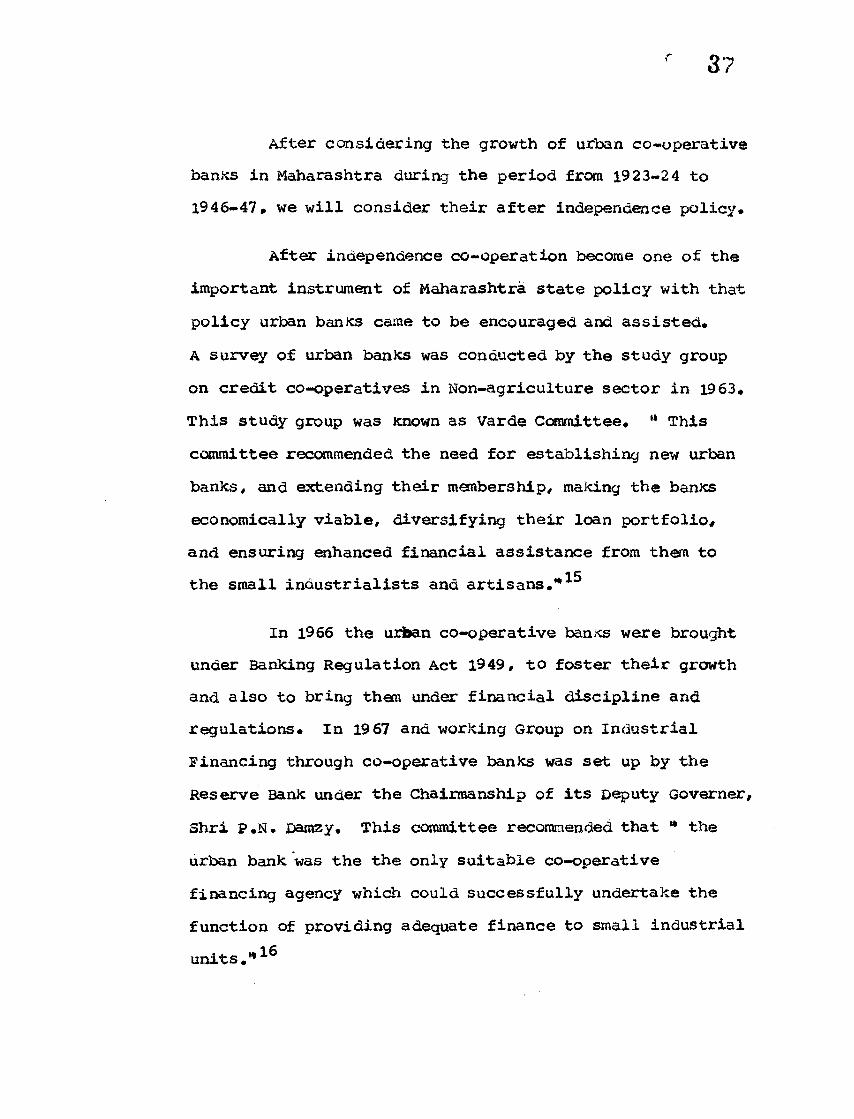
After considering the growth of urban co-operative banks in Maharashtra during the period from 1923-24 to 1946-47* we will consider their after independence policy.
After independence co-operation become one of theimportant instrument of Maharashtra state policy with thatpolicy urban banks came to be encouraged and assisted.A survey of urban banics was conducted by the study groupon credit co-operatives in Non-agriculture sector in 1963.This study group was Known as Varde Committee. ** Thiscommittee recommended the need for establishing new urbanbanks# and extending their membership# making the bankseconomically viable, diversifying their loan portfolio#and ensuring enhanced financial assistance from them to
ISthe small industrialists and artisans.**
In 1966 the urban co-operative banks were brought under Banking Regulation Act 1949, to foster their growth and also to bring them under financial discipline and regulations. In 1967 and working Group on Industrial Financing through co-operative banks was set up by the Reserve Bank under the Chairmanship of its Deputy Governer# Shri p.N. Damzy. This committee recommended that ** the urban bank was the the only suitable co-operative financing agency which could successfully undertake the function of providing adequate finance to small industrial
i» 16units
38
The development of urban co-operative banks
attracted by Government and Apex bank and resulted in to
rapid growth of the urban co-operative banks. At that
time Apex bank declared its policy not to competing with
urban co-operative banks. Mobilisation of small savings
and financing to the members of limited means are also
the reasons for the growth of urban co-operative banks.
Taking into consideration these facts the Registrar
permitted to urban co-operative banks ti finance industrial
and housing sector. This resulted that number urban
co-operative banks in Maharashtra state doubled during
the period from 1948 to 1970. At the same time seventeen
urban co-operative banks were established in Kolhapur
district, Fotakowing are the names of urban co-operative
banks established in Kolhapur district during 1948 to 1970.
1) Shri Veershaiv Co-operative Bank Ltd., Kolhapur
(2—8—195©) .
2) Gadhinglaj Urban Co-operative Bank Ltd. Gadhinglaj
(13-11-1950)
3) Raviwarpeth Co-operative Bank Ltd. Kolhapur (23-1-1951)
4) Kurundwad Urban Co-operative Bank Ltd, Kurundwad
(25-3-1956)
Wadgaon Urban Co-operative Bank Ltd. Wadgaon (12-10-57)5)
6) jaysingpur-Udgaon Co-operative Bank Ltd. Jaysingpur C 22-6-1960) .
7) ichalkaranj i Kamgar Nagrik Sahakari Bank Ltd. Ichalkaranj i (6-9-1060)
8) Ajara Urban Co-operative Bank Ltd. A jar a (19-10-1960)9) Kolhapur Janata Sahakari Bank Ltd. Kolhapur (17-11-60)
10) Commercial Co-operative Bank Ltd.# Kolhapur (18-12-61)11) Nagari Sahakari Bank Ltd. Kodoli# (27-10-1962) .12) Ichalkaranj i Janata Sahakari Bank Ltd. Ichalkaranji.
(5-11-1962).13) Peoples Co-operative Bank Ltd. Ichalkaranji (12-12-62)14) Janata Sahakari Bank Ltd. Ajara (5-4-1963) .15) Ren dal Sahakari Bank Ltd. Ren dal# (17-8-1964) .16) Ganesh Sahakari Bank Ltd. Kurundwad (28-2-1966) .17) Shri Warana Sahakari Bank Ltd. Warananagar (28-2-1966)
In 1977# Madhavdas Das Committee was set up by Reserve Bank of India# under the Charmanship of Executive Director# Shri Madhavdas. This committee made a study of past performance and future potentialities of urban co-operative banks. This committee noticed that the urban banks were mainly suitable to fill existing gaps in banking and credit needs in urban and semi urban areas# comparatively less cost of operation and with their simplicity# close contact, local feel and financial
40
difficulties could also enjoy the confidence of local
people. Therefore, ** this committee recommended a
preference for urban banks in opening branches in semi 17urban areas**.
The urban co-operative banks are the institutions
meant for men of small means. They provide adequate
credit support to the various categories of beneficieries
under priority sectors. But there were some urban
co-operative banks which had not bestowed adequate -
attention on such lendings with the result that the level
of their advances had been regularly low. It was,
therefore, considered necessary to issue guidelines to all
the urban co-operative banks to improve their priority
sector lending* Therefore, in 1983 the standing Advisory
Committee for urban co-operative banks was set up by
Reserve Bank of India under the Chairmanship of Deputy
Governer Dr. M.V. Hate, This committee is known as Hate
Committee. The committee recommended that ** the urban
co-operative banks should be exhorted to achieve a target
of 60% of their total advances for priority sector lending
by 30th June 1985**. Of the total priority sector advances
at least 25% ( or 15% of the total loans and advances)
should have been advanced to weaker sections by the above
date*1.
r 41
It is further to note that during the period from 1971 to 1985, one hundred six urban co-operative banks were established in Maharashtra state. Of these thirty seven were in Greater Bombay, nine in Thane - district, one in Sindhudurg district, six in Nasik district, five in Dhule district, three in Jalgaon district, twenty four in Pune district, six in Ahmednagar district, seven in Solapur district, eight in Sangli district, seven in satara district, two in Aurangabad district, one in Jaina district, one in Handed district, two in Later district, cne in parbhani district, five in Nagpur district, one in 3handara district, five in Amaravati district, two in Akola district, ten in Kolhapur district.
The names of urban co-operative banks established in Kolhapur district during the period from 1971 to 1985 were -
1) Shrl Bharat Urban Co-operative Bank Ltd. Jaysingpur (18-1-1971)*
2) Nutan Nagari Sahakari Bank Ltd.Ichalkaranji (31-3-1971).
3) Shri Shivaji Sahakari Bank Ltd.Gadhinglaj (8-10-1971) .
4) Ichalkaranji Mahila Sahakari Bank Ltd., Ichalkaranji (21-10-1971).
A-
42
5) Shri panchangaga Co-operative Bank Ltd*
Kolhapur (10-2-1972).
6) Shri Shivneri Sahakari Bank Ltd.,
Ichalkaranji (18-4-1972).'Kuditye-
7) Shri Yashwant Sahakari Bank Ltd.,Ke^faapur«
(29-6-1974) .
8) Youth Development Co-operative Bank Lt a.,
Kolhapur (16-6-1975).
9) Choudeshwari Sahakari Bank Ltd.
Ichalkaranji (7-9-19S1) .
10) Chandgad Urban Co-operative Bank Ltd.,
Chandgad (6-5-1982) .
After considering the Urban co-operative banks
policy after independence, it is important to throw light
on the growth of urban co-operative banks, in Maharashtra
after independence. The following table shows the growth
of urban co-operative banks in Maharashtra from 1946-47
to 1969-70.
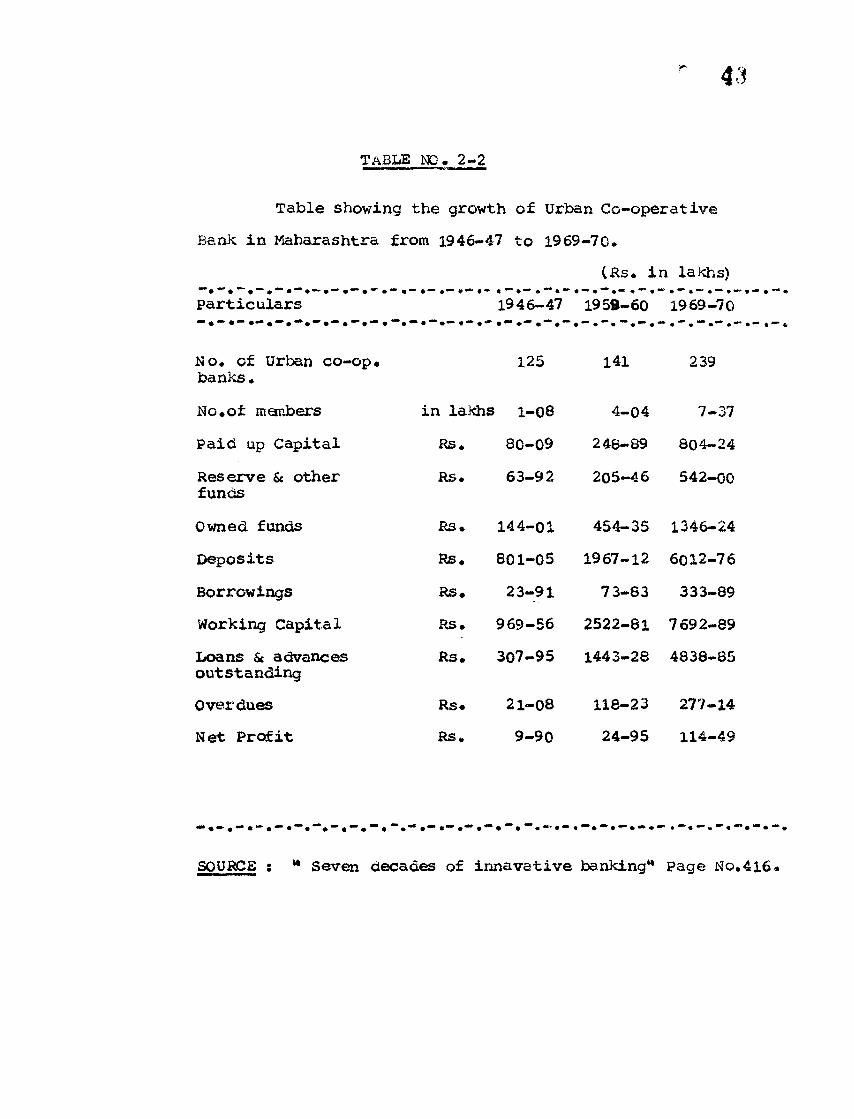
TABLE NO. 2-2
Table showing the growth of Urban Co-operative Bank in Maharashtra from IS46-47 to 1969-70.
(Rs. in lakhs)particulars 1946-47 1950-60 1969-70
No. of Urban co-op. banks. 125 141 239
No.of members in lakhs 1-08 4-04 7-37Paid up Capital Rs. 80-09 248-89 804-24Reserve & other funds Rs • 63-92 205-46 542-00
Owned funds RS » 144-01 454-35 1346-24Deposits Rs. 801-05 1967-12 6012-76Borrowings Rs. 23-91 73-83 333-89Working Capital RS. 969-56 2522-81 7692-89Loans & advances outstanding Rs. 307-95 1443-28 4838-85
Overdues Rs» 21-08 118-23 277-14Net Profit Rs. 9-90 24-95 114-49
•i•i.i•i.i«t•i.1.i*1 • 1 • 1 • 1 • ! • 1 •
SOURCE : * Seven decades of innavative banking** Page No.'
41
The table No. 2-2 indicates that the number of
urban co-operative banks in Maharashtra was increased from
125 in 1946-47 to 141 in 1959-60 and to 239 in 1969-70.
This indicates that the number of urban co-operative banks
in Maharashtra increased by 114 during the period from
19 46—47 to 1969—70.
The table No. 2-2 clearly shows that the number
of members of urban co-operative banks in Maharashtra was
increased from 1-08 lakh in 19 46-47 to 4-04 lakhs in
1959- 60# to 7-37 lakhs in 1969-70. This indicates that
the number of member of urban co-operative banks in
Maharashtra was increased by more than 6 times from
1946-47 to 1969-70.
The table No. 2-2 indicates that the paid up
capital of urban co-operative banks in Maharashtra was
increased from Rs. 80-09 lakhs in 1946-47# fco Rs. 248-89
lakhs in 1959-60# to Rs. 804-24 lakhs in 1969-70* This
shows that the paid up capital of urban co-operative banks
in Maharashtra was increased by more than 10 times from
1946-47 to 1969-70.
The table No. 2-2 reveals that the Reserves and
other funds increased from Rs. 63-92 lakhs in 1946-47#
to Rs. 205-46 lakhs in 1959-60# to Rs. 542 lakhs in

1969-70* This means the Reserves and other funds increased by 6-48 times curing the period from 1946-47 to 1969-70.
The table No, 2-2 shows that the Owned funds of urban co-operative banks in Maharashtra increased from Rs. 144-01 lakhs in 1946-47* to Rs. 454-35 lakhs in 1959-60* to Rs, 1346-24 lakhs in 1969-70, This shows that the owned funds of urban co-operative banks in Maharashtra increased by 9-34 times during the period from 19 46-47 to 1969-70.
The table No, 2-2 indicates that the deposits of urban co-operative banks in Maharashtra increased from Rs. 801-05 lakhs in 1946-47* to Rs. 1967-12 lakhs in 1959-60* to Rs. 6012-76 lakhs in 1969-70. This reveals that the deposits of urban co-operative banks in Maharashtra increased by 7-50 times during the period from 1946-47 to 19 69-70*
The table No. 2-2 reveals that the borrowings of urban co-operative banks in Maharashtra increased from Rs. 23-91 lakhs in 1946-47* to Rs. 7 3-83 lakhs in 1959-60* to Rs. 333-89 lakhs in 1969-70. This means borrowings of urban co-operative banks in Maharashtra increased by 13-96 times during the year from 1946-47 to 1969-70.
r 46
The table No, 2-2 shows that wording capital of urban co-operative banks in Maharashtra increased from Rs. 969-56 lakhs in 1946-47, to Rs. 2522-81 laKhs in 1959- 60, to Rs. 7 692-89 laKhs in 19 69-70. This indicates that the working capital of urban co-operative banks in Maharashtra increased by 7-93 times from 1946-47 to 1969-70*
The table No. 2-2 indicates that the loans and advances outstanding of urban co-operative banks in Maharashtra increased from Rs. 307-95 laKhs in 19 46-47, to Rs. 1443-28 lakhs in 1959-60, to Rs. 4838-35 lakhs in 1969-70. This shows that the loans and advances outstanding increased by 15-71 times during period from 1946-47 to 1969-70*
The table No. 2-2 clearly shows that the Overdoes of urban co-operative banks in Maharashtra increased from Rs. 21-08 lakhs in 1946-47, to Rs. 118-23 lakhs in 1959-60, to Rs. 277-14 lakhs in 1969-70. This indicates that the overdues of urban co-operative banks in Maharashtra increased by 13-14 times during the period from 1946-47 to 19 69 -70*
The table No. 2-2 indicates that the net profits of urban co-operative banks in Maharashtra increased from Rs. 9-90 lakhs in 1946*47, to Rs. 24-95 lakhs in 1959-60,
to Rs. 114-49 lakhs in 1969-70. This nmta« reveals that the net profits of urban co-operative banks in Maharashtra increased by 11.56 times during the period from 1946-47 to 1969-70.
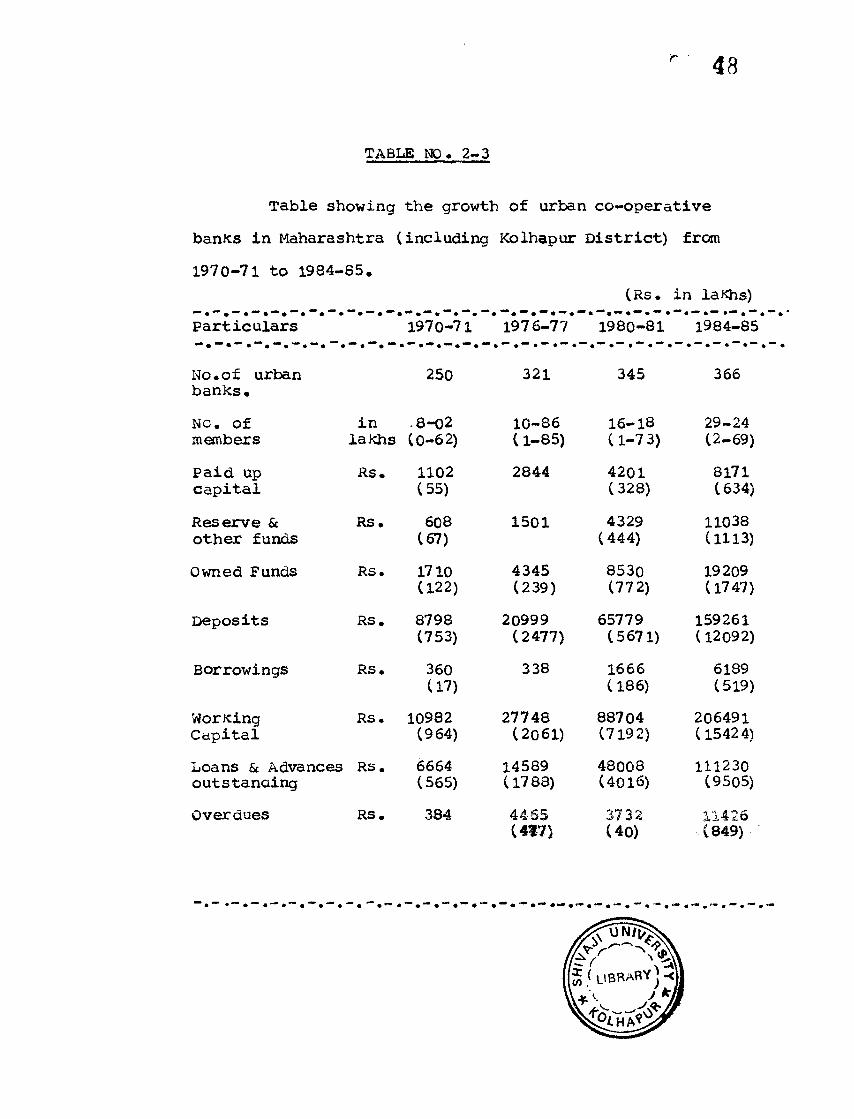
After discussing about growth of urban co-operative banks in Maharashtra from 1946-47 to 1969-70* it is considerable to look after in the growth of urban co-operative banks in Maharashtra (including Kolhapur District) from 1970-71 to 1984-85. The following table shows the growth of urban co-operative banks in - Maharashtra (including Kolhapur District) from 1970-71 to 1984-85.
r 48
TABLE NO. 2-3
Table showing the growth of urban co-operative
banks in Maharashtra (including Kolhapur District) from
1970-71 to 1984-85.(Rs. in laKhs)
Particulars**• " # "* •
1970-71 1976-77 1980-81 1984-85
No.of urban banks.
250 321 345 366
NO. Of members
inlakhs
8-02(0-62)
10-86 (1-85)
16-18 (1-7 3)
29-24(2-69)
Paid up capital
Rs. 1102(55)
2844 4201(328)
8171(634)
Reserve & other funds
Rs. 608(67)
1501 4329(444)
11038(1113)
Owned Funds Rs. 1710(122)
4345(239)
8530(772)
19209(1747)
Deposits RS. 8798(753)
20999(2477)
65779(5671)
159261 (12092)
Borrowings RS. 360(17)
338 1666(186)
6189(519)
WorkingCapital
RS. 10982(964)
27748(2061)
88704(7192)
206491(15424)
Loans & Advances outstanding
Rs . 6664(565)
14589(1788)
48008(4016)
111230(9505)
Overdues RS. 384 4465(417)
3732(40)
11426(849)
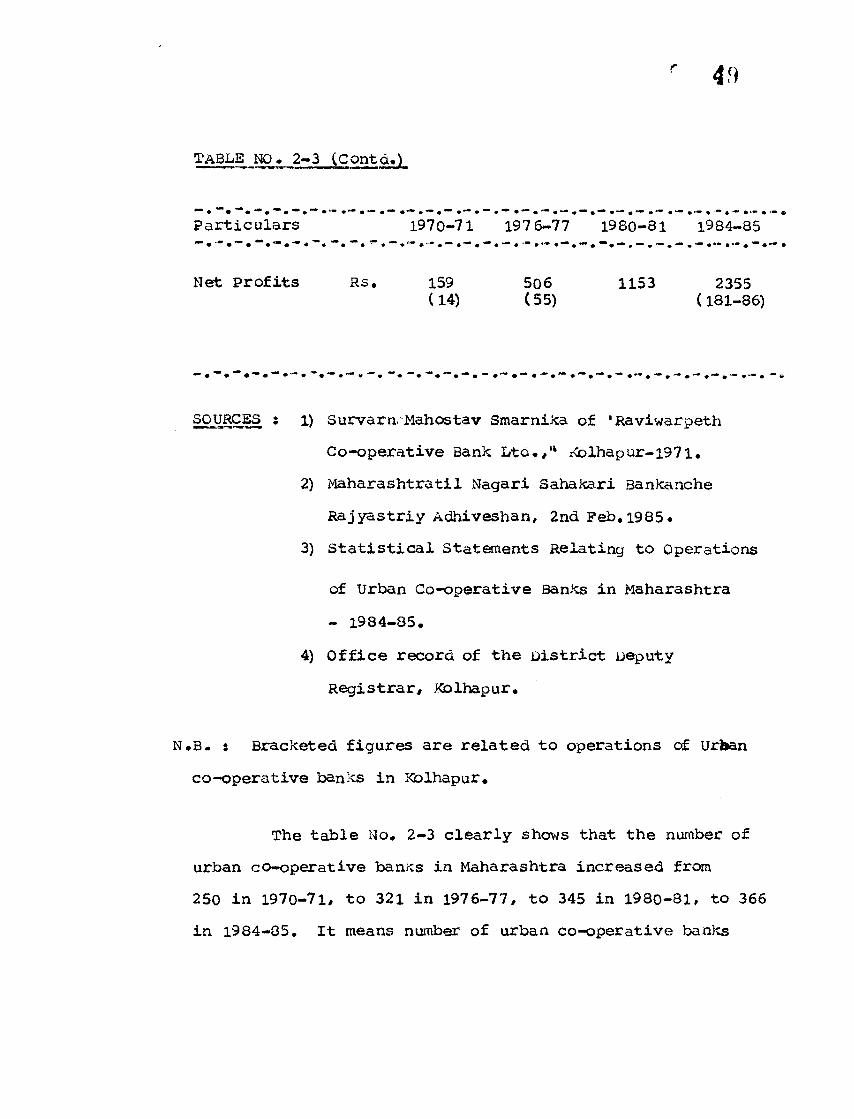
Table ho. 2-3 (Contd.)
Particulars 1970-71 197 6-77 1980-81 1984-85
Net profits Rs. 159 506 1153 2355(14) (55) (181-86)
SOURCES 1) Survarn Mahostav Smarnika of 'Raviwarpeth
Co-operative Bank Ltd.,H Kolhapur-1971.
2) Maharashtra til Nagari Sahakari Bankanche
Rajyastriy Adhiveshan, 2nd Feb.1985.
3) Statistical Statements Relating to Operations
of Urban Co-operative Banks in Maharashtra
- 1984-85.
4) Office record of the District Deputy
Registrar, Kblhapur.
N.B. s Bracketed figures are related to operations of url»an
co-operative banks in Kblhapur.
The table No. 2-3 clearly shows that the number of
urban co-operative banks in Maharashtra increased from
250 in 1970-71, to 321 in 1976-77, to 345 in 1980-81, to 366
in 1984-85. It means number of urban co-operative banks
50
Maharashtra increased by 116, during the period from
1970-71 to 1984-85. At the same time number of urban
co-operative banks in Kolhapur district increased from
21 in 1970-71 to 37 in 1976-77, to 39 in 1980-81, to 40 in
1984-85. It means number of urban co-operative banks in
Kolhapur increased by 19 during the period from 1970-71
to 1984-85.
The table No. 2-3 indicates number of members
of urban co-operative banks in Maharashtra increased
from 8-02 lakhs in 1970-71, to 10-86 lakhs in 1976-77,
to 16-18 lakhs in 1980-81, to 29-14 lakhs in 1984-85.
This means number of members of urban co-operative banks
in Maharashtra^3.63 times during the time from 1970-71
to 1984-35. While number of members of urban co-operative
banks in Kolhapur district increased from 0-62 lakhs in
1970-71 to 1-85 lakh in 1976-77 and the same is decreased
to 1-73 lakh in 1980-81 but thereafter it is increased
to 2-69 lakhs in 1984-85. This shows that the number of
members of urban co-operative banks in Kolhapur district
increased by 4-34 times during 1970-71 to 1984-85.
The table No- 2-3 reveals that the paid up capital
of urban co-operative banks in Maharashtra increased from
Rs. 1102 lakhs in 1970-71, to Rs. 2844 in 1976-77 , to
Rs. 4201 lakhs in 1980-81, to Rs. 8l7l lakhs in 1984-85.
Ml. BAIASAHEB KHATOWR UBRABI^diVAJI UNIVeHSITY.
r 51
the table No. 2. - & reveals that the amount of paidup
capital of urban co-operative banks in Maharashtra increased
by 7-41 times during the period from 1970-71 to 1984-85.
At the same time paidup capital urban co-operative banks
in Kolhapur district increased from Rs. 55 lakhs in
1970-71, to Rs. 328 lakhs in 1980-81, to Rs. 634 lakhs in
1984-85. It means paidup capital of urban co-operative
banks in Kolhapur increased by 11-52 times during the
period from 1970-71 to 1984-85.
The table No. 2-3 indicates that the Reserve and
other funds of urban co-operative banks in Maharashtra
increased from Rs. 60S lakhs in 1970-71, to Rs. 1501 lakhs
in 197 6-77, to Rs. 4329 lakhs in 1980-81, to Rs. 11,038
lakhs in 1984-85. This reveals that the Reserve and other
funds increased by 18-15 times during the period from
1970-71 to 1984-85. Ait the same time the Reserve and
other funds of urban co-operative banks in Kolhapur
district increased from Rs. 67 lakhs in 1970-71, to Rs.444
lakhs in 1976-77, to Rs. 1113 lakhs in 1984-35. This
means the Reserve and other funds of urban co-operative
banks in Kolhapur district increased by 16-61 times
during 1970-71 to 1984-85.
The table No. 2-3 shows that Owned funds of
urban co-operative banks in Maharashtra raised from
Rs. 1710 lakhs in 1970-71, to Rs. 4345 lakhs in 1976-77, toRs, 8530 lakhs in 1980-81, to Rs. 19209 lakhs in 1984-85, This indicates that the owned fends of urban co-operative banks in Maharashtra raised by 11-23 times during the period from 1970-71 to 1984-85. The owned funds of urban co-operative banks in Kolhapur district also raised from Rs. 122 lakhs in 1970-71, to Rs. 239 lakhs in 1976-77, to Rs. 772 lakhs in 1980-81, to Rs. 1747 lakhs in 1984-85.This shows that the owned funds of urban co-operative banks in Kolhapur district also raised by 14-32 times during the period from 1970-71 to 1984-85.
The table No. 2-3 also indicates that deposits of urban co-operative banks in Maharashtra tremendously increased from Rs. 8798 lakhs in 1970-71, to Rs. 20999 lakhs in 1976-77, to Rs. 65779 lakhs in 1980-81, to Rs. 1,59,261 lakhs in 1984-85. This reveals that deposits of urban co-operative banks in Maharashtra increased by 18-10 times during the years from 1970-71 to 1984-85. Whereas the deposits of urban co-operative banks in Kolhapur district also increased from Rs. 753 lakhs in 1970-71 to Rs. 2477 lakhs in 1976-77, to Rs. 5671 lakhs in 1980-81, to Rs. 12092 lakhs in 1984-85. This indicates that the deposits of urban co-operative banks in Kolhapur district raised by 16-06 times during the years from 1970-71 to 1984-85.
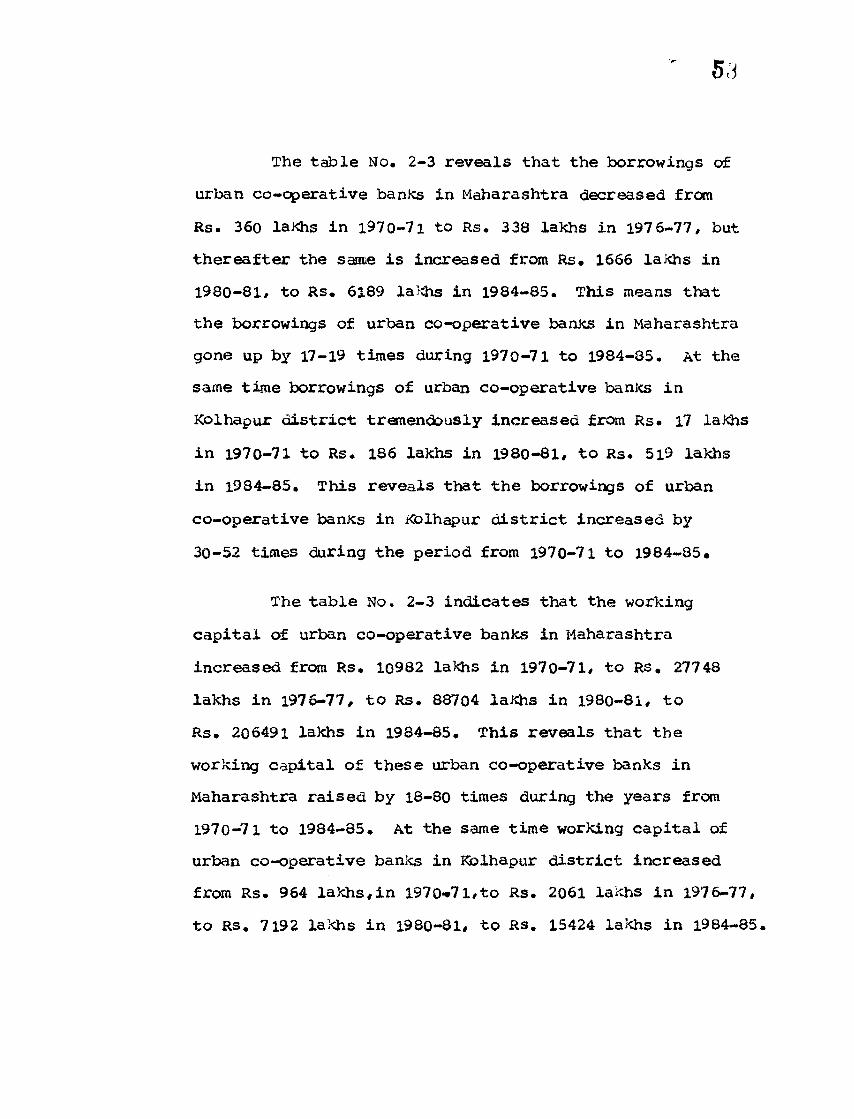
The table No, 2-3 reveals that the borrowings of urban co-operative banks in Maharashtra decreased from Rs. 36o lakhs in 1970-71 to Rs. 338 lakhs in 1976-77, but thereafter the same is increased from Rs, 1666 lakhs in 1980-81, to Rs, 6189 lakhs in 1984-85. This means that the borrowings of urban co-operative banks in Maharashtra gone up by 17-19 times during 1970-71 to 1984-85. At the same time borrowings of urban co-operative banks in Kolhapur district tremendously increased from Rs, 17 lakhs in 1970-71 to Rs. 186 lakhs in 1980-81, to Rs* 5l9 lakhs in 1984-85. This reveals that the borrowings of urban co-operative banks in Kolhapur district increased by 30-52 times during the period from 1970-71 to 1984-85,
The table No. 2-3 indicates that the working capital of urban co-operative banks in Maharashtra increased from Rs. 10982 lakhs in 1970-71, to Rs. 27748 lakhs in 1976-77, to Rs. 88704 lakhs in 1980-81, to Rs, 206491 lakhs in 1984-85. This reveals that the working capital of these urban co-operative banks in Maharashtra raised by 18-80 times during the years from 1970-71 to 1984-85. At the same time working capital of urban co-operative banks in Kolhapur district increased from Rs. 964 lakhs,in I970-*7l,to Rs. 2061 lakhs in 1976-77, to Rs. 7192 lakhs in 1980-81, to Rs. 15424 lakhs in 1984-85.
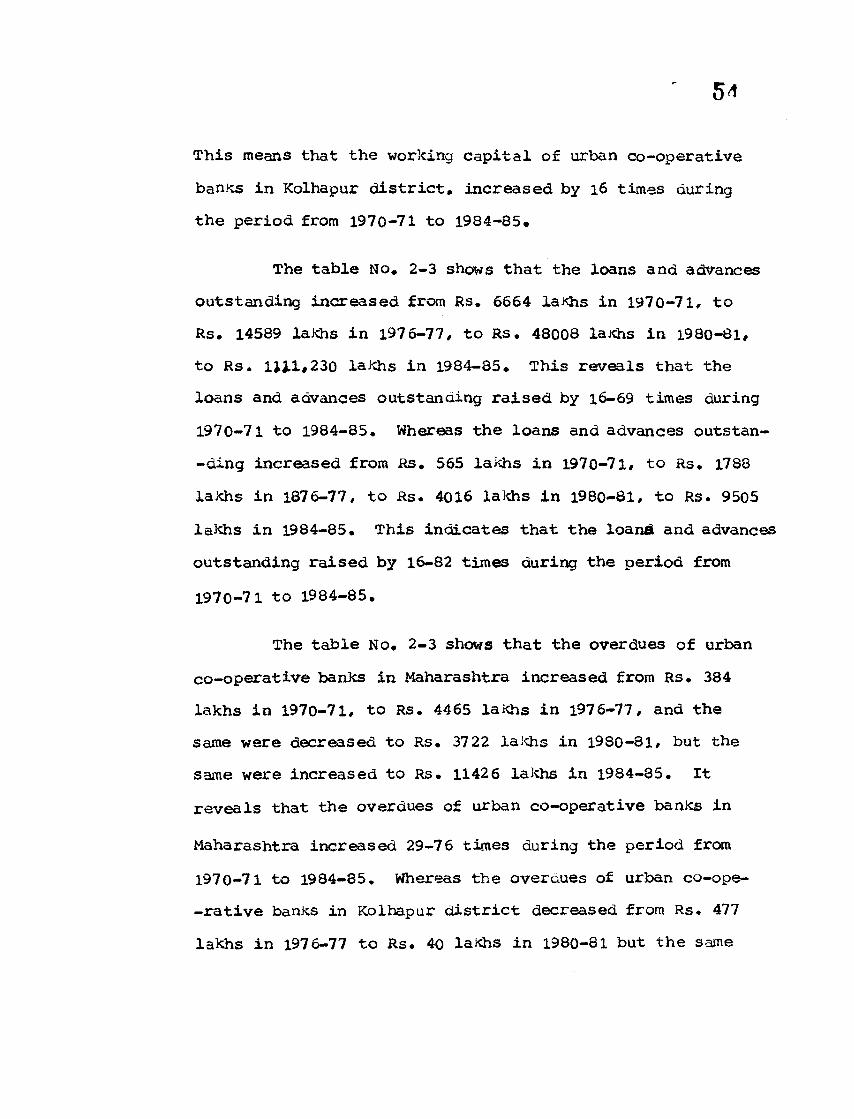
54This means that the working capital of urban co-operative banks in Kolhapur district, increased by 16 times during the period from 1970-71 to 1984-85,
The table No, 2-3 shows that the loans and advances outstanding increased from Rs. 6664 la*hs in 1970-71, to Rs. 14589 lakhs in 1976-77, to Rs. 48008 lakhs in 1980-81, to Rs. 1111,230 lakhs in 1984-85. This reveals that the loans and advances outstanding raised by 16-69 times during 1970-71 to 1984-85. Whereas the loans and advances outstan- -ding increased from Rs. 565 lakhs in 1970-71, to Rs. 1788 lakhs in 1876-77, to Rs. 4016 lakhs in 1980-81, to Rs. 9505 lakhs in 1984-85. This indicates that the loans and advances outstanding raised by 16-82 times during the period from 1970-71 to 1984-85.
The table No. 2-3 shows that the overdues of urban co-operative banks in Maharashtra increased from Rs. 384 lakhs in 1970-71, to Rs. 4465 lakhs in 1976-77, and the same were decreased to Rs. 3722 lakhs in 1980-81, but the same were increased to Rs. 11426 lakhs in 1984-85. It reveals that the overdues of urban co-operative banks in
Maharashtra increased 29-76 times during the period from 1970-71 to 1984-85. Whereas the overaues of urban co-ope- -rative banks in Kolhapur district decreased from Rs. 477 lakhs in 1976-77 to Rs. 40 lakhs in 1980-81 but the same
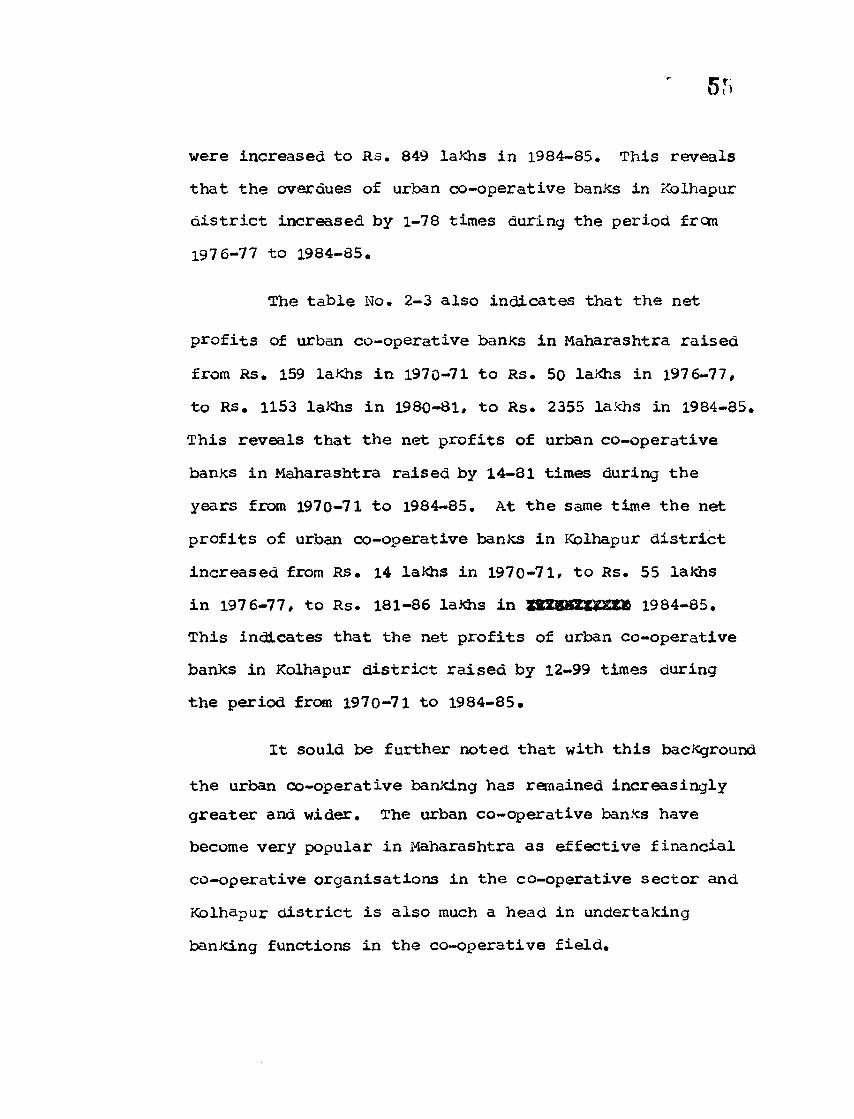
55
were increased to Rs. 849 lakhs in 1984-85. This reveals
that the overdues of urban co-operative banks in Kolhapur
district increased by 1-78 times during the period from
1976-77 to 1984-85.
The table No. 2-3 also indicates that the net
profits of urban co-operative banks in Maharashtra raised
from Rs. 159 lakhs in 1970-71 to Rs. 50 lakhs in 1976-77,
to Rs. 1153 lakhs in 1980-81, to Rs. 2355 lakhs in 1984-85.
This reveals that the net profits of urban co-operative
banks in Maharashtra raised by 14-81 times during the
years from 1970-71 to 1984-85. At the same time the net
profits of urban co-operative banks in Kolhapur district
increased from Rs. 14 lakhs in 1970-71, to Rs. 55 lakhs
in 1976-77, to Rs. 181-86 lakhs in Z2ZB8ZSXSZK 1984-85.
This indicates that the net profits of urban co-operative
banks in Kolhapur district raised by 12-99 times during
the period from 1970-71 to 1984-85.
It sould be further noted that with this background
the urban co-operative banking has remained increasingly
greater and wider. The urban co-operative banks have
become very popular in Maharashtra as effective financial
co-operative organisations in the co-operative sector and
Kolhapur district is also much a head in undertaking
banking functions in the co-operative field.
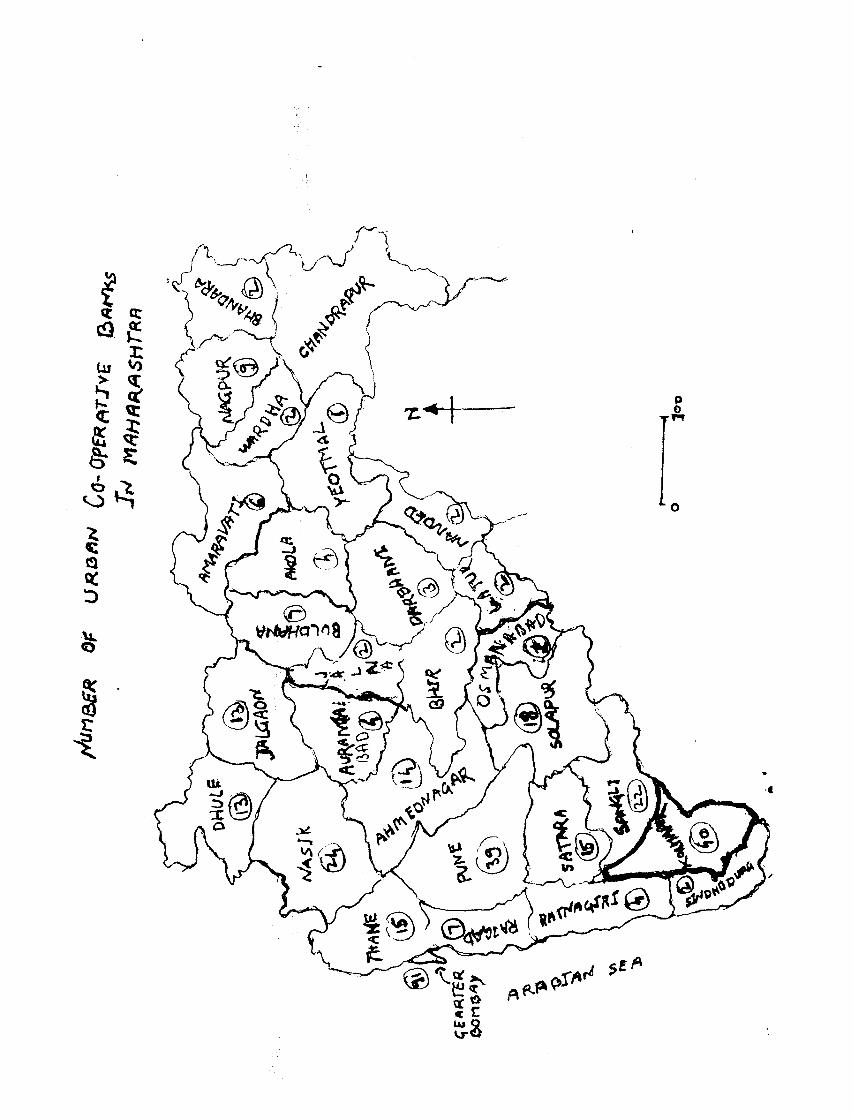
r*qe
*nrE
n
* U«a
flN Co-
Ope
RfiT
Jve Bm
* Jt
J TW
Hfif
KA
ShTR
Fi
r 58
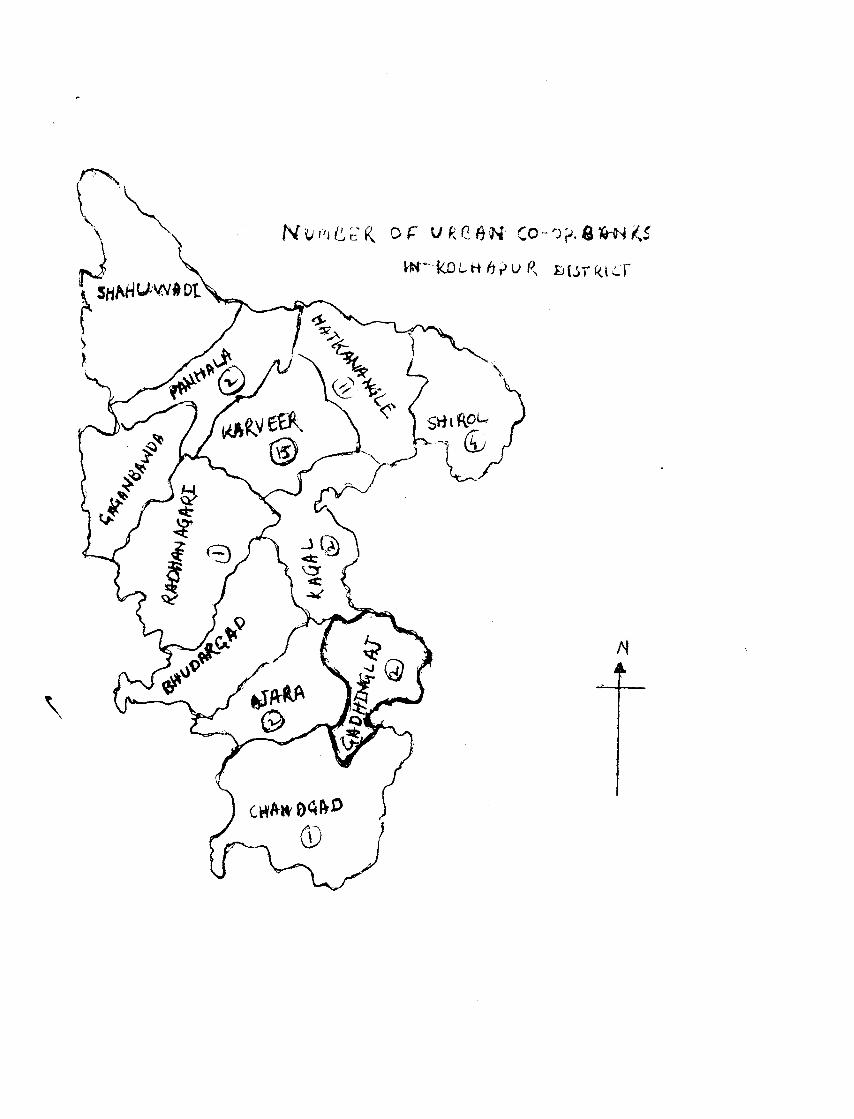
2.5 ; URBAN CO-OPERATIVE BANKS IN GADHINGLAJ TOWN :
After discussing urban co-operative banks in Maharashtra including Kolhapur district# we will discuss
about urban co-operative banks in Gadhinglaj town.
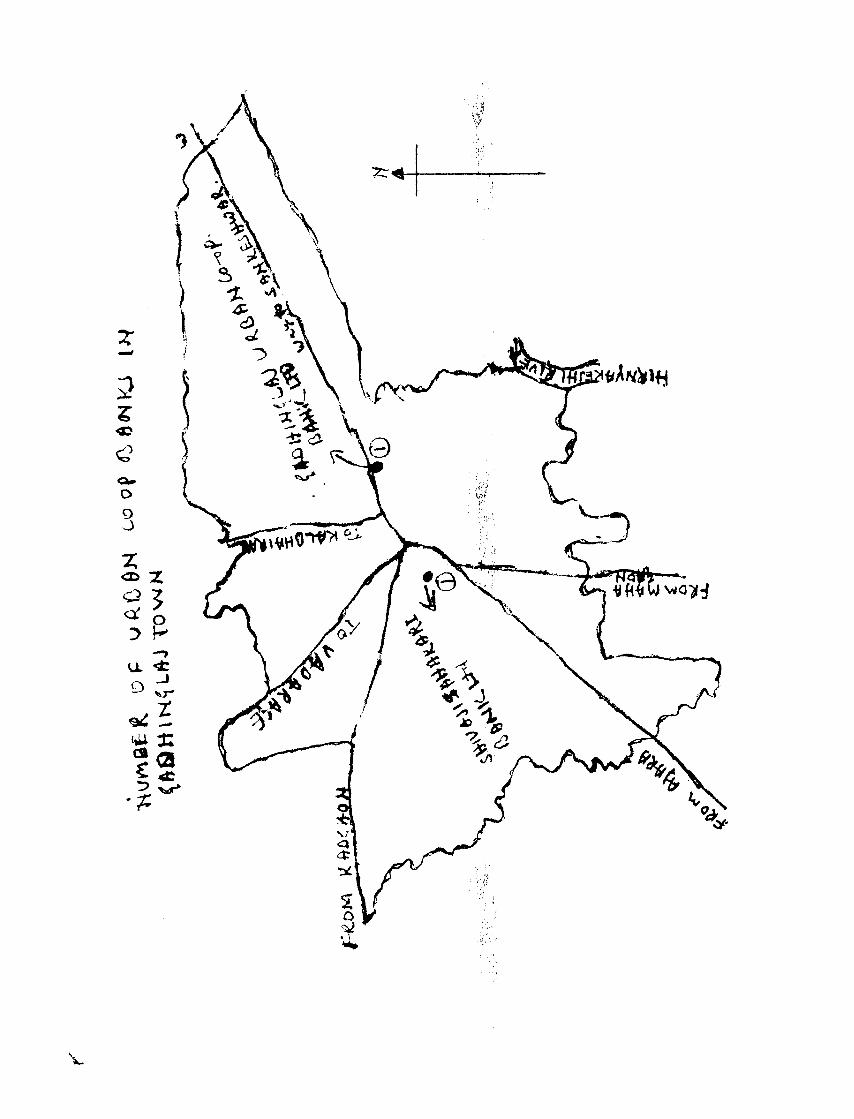
Gadhinglaj town is located in souarthern area of Kolhappcrdistrict# in the south Maharashtra. It is situated on the state highway of Maharashtra state. It is a taluka place. It is followed by Karnataka state boundry. The Gadhinglaj town is at a distance of 2i kins, from Ajara# 4o kms. from Chandgad# 63 kms. from Belgaum City# 6o kms. from Kolhapur city# 555 kms. from Bombay City. At present Gadhinglaj town is included in the urban area. It is the marketiing centre connected with marketing villages Nesary# Halkarni, uttur.
“Late Shri Chhatrapati Shahu Maharaj has establishedthis Gadhinglaj gaon at a distance of 6 kins, from thehistorical samangad killa and at the bank of river -Kiranvakeshi. There is municipality established in 1887.The area covered by this town is 3-38 square kms. and the
19population according to census of 1981 is 18535.lt
Gadhinglaj town is playing an important role in the commercial and agricultural f-ite field. The town is supported by commercial and agricultural personalities.
5;
The town is popular in Kolhapur district inrespect of markets of pur,chilly,ground-nut. These are the gifts of river Hiranyakeshi and Ghataprabha. The market cf these agricultural commodities are captured by commission agents located in the market yard. At present, there is one Sugar Factory, Four Oil Mills, one plastic Industry, One Milk Project and other small industries, number of powerlooms in addition to the number of small retail and whole sale trade shops, Hospital, Hotels etc.
Due to the progress of these trading units, industries, the town becomes urban area, and favourable situation is created for expanding banking business in this town. To provide finance to the trading units various banks have started banking business in this town.At present there are twelve banks working in this town, of which branch of land Development Bank is agricultural credit bank. Union Bank at India, BanK of Maharashtra,Bank of India are the branches of nationalised banks.State Banx of Inaia, Bank of Karat are the branches of other commercial banks. Veershaiv co-operative bank Ltd., Kolhapur District,Central Co-operative Bank Ltd.(Gadhinglaj) (Gandhi Road) , Kolhapur District Central Co-operative Bank Ltd., The Prathmik Shikshak Sahakari Bank Ltd., are the branches of co-operative banKs and remaining. The Gadhinglaj
58
Urban co-operative Bank Ltd. and Shivaji Sahakari Bank Ltd. are the banks which are established in Gadhinglaj town only and who have no branches outside the Gadhinglaj town.
Of the above banxs, the Gadhinglaj Urban - Co-operative Bank Ltd. is the first bank which is established in 1950 for developing financial position of common people. This bank owned the confidence of people and helped to increase the standard of living of artisams, small traders, salary earners, and other common middle class people. This bank has developed its performance satisfactorily since 1950 because of the co-operation of the local people. There after scope of Gadhinglaj Market has become wider population which was 8546 at the end of 1951 increased to 10681 at the end of 1961, 14663 at the end of 1971. Working of the Gadhinglaj Urban Co-operative Bank Ltd., creat confidence among the people and helped to promote thrift among people and also to increase banking business in this town. At that, time the situation was created for expansion of banking field in this town. There was possibilities of formation of Sugar Factory, plastic Industry, Co-operative Milk Project, Co-operative Spinning Mill, Co-operative Housing societies, and other industries and trading units in future. Thus
5't
the situation created the need of another urban co-operative
bank of take advantage of expansion of above businesses
and industries in this area and with this background
another urban bank named ’Shivaji Sahakari Bank Ltd. is
established on 8th Nov. 1971, under the Presidentship
of Hon. Shri S.E. Chavan of Nool, with the authorised
capital of Rs. 5,00#000 divided into shares of Rs. 10 each. Shri R.G. Mandekar, Shri A.T. Chavan, Shri Y.B.d&a Mohite, Shri D.S. Kadam, etc. are the other main co-operators
for establishing* Shri Shivaji Sahakari Bank Lta. in
the Gadhinglaj town.
After considering the above background of
“Shivaji Sahakari Bank Ltd" it is important to throw light
on the growth of Shivaji Sahakari Bank Ltd. during the
period from 1976-77 to 1985-86. The following table shows
the growth the Shivaji Sahakari Bank Ltd. Gadhinglaj
during the period from 1976-77 to 1985-86.
60
TABLE NO. 2-4
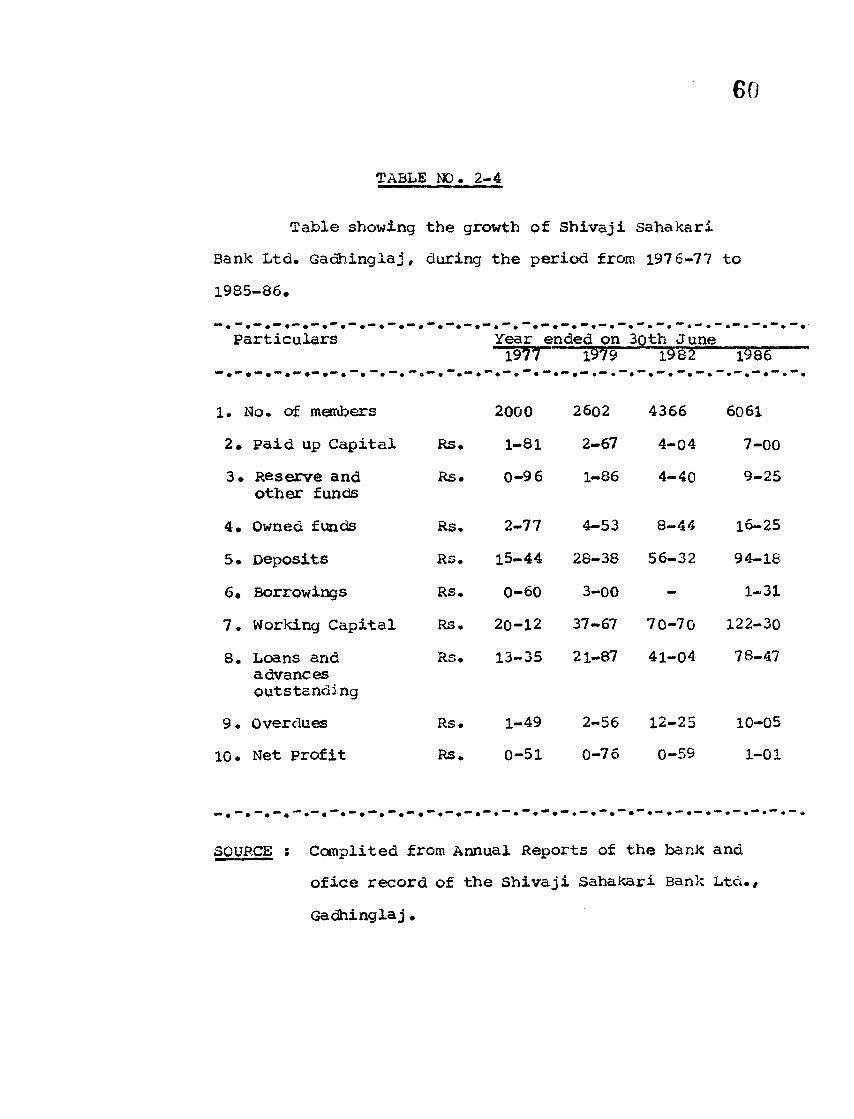
Table showing the growth of Shivaji sahakari Bank Ltd. Gaahingiaj, during the period from 1976-77 to 1985-86.
Particulars Year <ended on 3oth June1977 1979 1982 1983 “
1. No. of members 2000 2602 4366 60612. Paid up Capital Rs. 1-81 2-67 4-04 7-003. Reserve and
other fundsRs. 0-96 1-86 4-40 9-25
4. Owned funds Rs. 2-77 4-53 8-44 16-255. Deposits Rs. 15-44 28-38 56-32 94-186. Borrowings Rs. 0-60 3-00 mm 1-317. Working Capital RS. 20-12 37-67 70-70 122-308. Loans and
advancesoutstanding
RS. 13-35 21-87 41-04 78-47
9. Overdues Rs. 1-49 2-56 12-25 10-05
i m
• o
i • Net Profit Rs. 0-51 0-76 0-59 1-01
SOURCE s Computed from Annual Reports of the bank and of ice record of the Shivaji Sahakari Bank Ltd., Gadhinglaj.
61
The table No. 2-4 clearly indicates the number of members of Shivaji Sahakari Bank Ltd. increased from 2000 in the year 1977,to 2602 in 1979, to 4366 in 1982, to 6061 in 1986. The table No. reveals that the numbersincreased by more than 3 times during 1977 to 1986.
The table No. 2-4 indicates that paidup capital of Shivaji SahaKari Bank Lta. raised from Rs. 1-81 lakh in 1977 to Rs. 2-67 lakhs in 1979, to Rs. 4-04 lakhs in 1982, to Rs. 7 lakhs in 1986. This means the paidup capital of Shivaji Sahakari Bank Ltd. gone up by 3-87 times during the period from 1977 to 1986.
The table No. 2-4 reveals that the Reserve and other funds increased from Rs. 0-96 lakh in 1977, to Rs. 1-86 lakhs in 1979, to Rs. 4-40 lakhs in 1982, to Rs. 9-25 lakhs in 1986. This shows that the Reserve and other funds of the bank increased by 9-64 times during period under review.
The table No. 2-4 indicates that Owned funds of Shivaji Sahakari Bank Ltd. raised from Rs. 2-77 lakhs in 1977, to Rs. 4-53 lakhs in 1979, to Rs. 8-44 lakhs in 1982, to Rs. 16-25 lakhs in 1986. This reveals that the owned funds of the bank increased by 5-87 $lmes from 1977 to 1986.
62
The table No. 2-4 also reveals that deposits of
Shivaji Sahakari Bank Ltd. goneup from Rs. 15-44 laxhs in
1977, to Rs. 28-38 lakhs in 1975, to Rs. 56-32 lakhs in
1982, to Rs. 94-18 lakhs in 1986. This indicates more than
6-10 times increases during the period from 1977 to 1986.
The table No. 2-4 also clearly shows that the
borrowings of shivaji Sahakari Banks Ltd., increased from
Rs. 0-60 lakh to Rs. 3 lakhs in 1979 but the same is
decreased to NIL balance upto 1982, thereafter it was again
increased upto Rs. 1-31 lakhs in 1986.
The table No. 2-4 indicates that the working capital
of Shivaji Sahakari Bank Ltd. goneup from Rs. 20-12 lakhs
in 1977, to Rs. 33-67 lakhs in 1979, to Rs. 70-70 lakhs
in 1984, to Rs. 122-30 lakhs in 1986. This reveals that
the working capital of this bank goneup by 6-08 times
during the last ten years.
The table No. 2-4 also reveals that the loans
and advances outstanding increased from Rs. 13-35 laitfis
in 1977, to Rs. 21-87 lakhs in 1979, to Rs. 41-04 lakhs
in 1982, to Rs. 78-47 lakhs in 1986. This indicates that
loans and advances of this bank raised by 5-88 times
during the period under review.
The table No, 2-4 indicates the overdues of thisbank increased from Rs. 1-49 lakhs in 1977, to rs* 2-56 lakhs in 1979, to Rs, 12-25 lakhs in 1982, but the same is decreased to Rs, 10-05 laKhs in 1986, This indicates that overdues increased by 6-75 times during the period from 1977 to 1986.
The table No, 2-4 also indicates that the net profits of the bank increased fromRs. 51 thousand, to Rs. 76 thousand in 1971, but the same is decreased to Rs. 59 thousands in 1982 but the same is increased to Rs. 1-01 lakhs in 1986. This means the profits of Shivaji sahakari Bank Ltd. increased by more than 2 times during the period under review.
8^
2-6 : ABOUT THE GADHINGLAJ URBAN CO-OPERATIVE BANK DTP. GADHINGLAJ
After having studied urban co-operative bank in Gadhinglaj town, an attempt has been made to study about the Gadhinglaj urban Co-operative Bank Ltd. Gadhinglaj.
2-6(i) BRIEF HISTORY :
The concept of starting,'The Gadhinglaj Urban Co-operative Bank Ltd. 'was mainly by forsight outlook of Late Ravsaheb D.B. Mali. He was well experienced person in co-operative sector in Kolhapur district. “He has established many societies and co-operative banks like Mali Co-operative Society, Kolhapur, 'Servey Co-operative Society,Kolhapur, Ravivarpeth Co-operative Bank Ltd. Kolhapur, Shri Veershaiv Co-operative Bank Ltd. ,Kolhapur*i
The Gadhinglaj urban Co-operative Bank Ltd. is established in the year 1950, with the objectives -
i) to §pread banking habits among the people in the town area.
ii) to promote habits of thrift among people and to encourage them to make savings,
iii) to provide finance to the members for their needs.
v

r 65
iv) To solve financial problems of weaker section of the community by giving them small loans on security.
The bank is established under the presidentship of Late Shri S.N. Daddi, Late Shri K.s. Naik, Shri N.H.Khot, Shri V.S. Kulkami, Shri r.t. Shah and others. The bank was formed with the paidpp capital of Rs. 27,7 20 divided into shares of Rs. 10 each, contributed by 94 members.The authorised capital was consisted of 12500 shares of Rs. 10 each.
At that time there were other three branches of banks namely, ‘The Laxrni Bank Ltd.*, 'The Kolhapur Bank Ltd.* and ' The Veershaiv Co-operative Bank Ltd.', making
banking business in this town. * But out of these three banks 'The Laxrni Bank Ltd.* and 'The Kolhapur Bank Ltd.' went into liquidation after 1951. There remained. 'The Gadhinglaj Urban Co-operative Bank Ltd. and 'Veershaiv Co-operative Bank Ltd.* but Veershaiv Co-operative Bank Ltd. is the branch of Veershaiv Co-operative Bank Ltd., which is established in Kolhapur. Thus there remained only The Gadhinglaj Urban Co-operative Bank Ltd., which is established in Gadhinglaj town only for assisting the members. It has no branches outside Gadhinglaj town.
This bank is continuously making banking business and developing rapidly. The bank has made progress under the Presindentship of Hon. Shri a.N. Ajari (from 1957 to 1964) , Hon. Shri B.M. Shintre (from 1965 to 1967), Hon. Shri S.3. Kitturkar (from 1969 to 1984) , Hon. Shri V.S. Bagi,(from 1984-85), Hon. advocate Shri B.G. Bhosaki (1985-86).
The Gadhinglaj Urban Co-operative Bank Ltd. is located first in the rental house owned by Shri 3.N.Ghugare upto the year 1974-75, in the main market. This area is crowded by retailshops and wholesale shops.Lateron bank office has been transferred to another rental house owned by Shri R.G. Baddi upto the year 1982-83. At present bank office is located in its own building on the main road. The main road area is covered by various branches of bank viz Bank of Maharashtra, Bank of Karad,Shri Veershaiv Co-operative Bank Ltd., State Bank of India, Kolhapur district Central Co-operative Bank Ltd., office of The Life Insurance Corporation of India, Municipality,Prant Office, various retail and wholesale shops, commission agencies, small industries, hotels, lodging ai»d boarding, hospitals etc.
2-6: ii) MANAGEMENT OF BAHK ;
Management is a difficult ward. It denotes not
only function but also the people who discharge it. It denotes a social position and rank as well as discipline and field of the study. All the institutions have in common. The management function, task and management work, it is the organ on which the performance and survival of the institution depends. Management; is the organ of leadership, direction and decision - management. Management has to give direction to the institution. It is responsible for directing, vision and resources towards greater results and contributors. It is a function, a discipline, a task to be done.
Urban co-operative banking structure has beeomean integral part of our banking system in the country.Financial discipline is of crucial importance in thebanking system to inspire and maintain the confidence ofthe investing public. The efficiency of the bankingsystem depends, on the 'Management*. " It is generallybelieved that the success or failure of co-operativebank is closely linked with the character and ability
21of its Management.*1
The Gadhinglaj urban Co-operative Bank Ltd. is organised by the middle class persons with small means. The Democratic Management is important feature of this
r 68
bank. It is run by democratic way. This is the bank of the members, by the members and for the members. Like other co-operative bank, this bank has a general body of all members. The meeting of the general body is held every year for imforming and supplying literature about this bank and making the decisions about future plans. Annual general meeting is always held in every Febtu*ary to transit the following business.
1) Confirmation of the proceedings of the last annual general meeting*
2) Adoption of Annual Report with Balance Sheet, Profits and Loss a/c. of the last year ended on 3oth June.
3) Declaration of dividend and allocation of Profits.4) Disposal of any other business that may be
brought before the meeting and answering of questions, if any related to the working of the bank during the year, permissible under byelaws of the bank.
Management is an organ of higher control. The Directors of Management are elected by at 5 years intervals by General Body on the basis of 1 one member one vote* irrespective of shareholding. Nine elected members are
consisted in the Board of Directors. One Director iselected as ‘President’ and One Director is elected as 'Vice-President*. Researcher personally interviewed all the Directors and found that seven directors are from trading units and two directors are advocates.
It is further to note that this bank has humble and dedicated leadership* which always thinks of development of the condition of its members* raising quality of their lives who are poor people and also middle class people in majority.
An an economic organisation it also works for profits but it gives prominence to the social objectives alongwith basic canous of banking. The bank has traditional management. Though the final dieisions rest with General Body but the actual affairs of the bank rests with the Board, of Directors, planning for future gearing up for working of the bank to achieve the targets is also vested to the Board of Directors.
But a Board of Directors cannot possibly manage a complete bank, it has neither the time nor the ability to do that nor it is necessary that it should but it should be noted that the decision making is based on the information supplied to the top management by the middle
70
and base level management• Therefore, the manager is performing the middle management functions of this bank. The manager is the key person.in this bank. He regulates the business operations. He makes plans and takes steps to carryout the general policies laid down by the Board of Directors. He also plans the internal business - activities and assigns appropriate duties to the - employees who are working at buse level management to carryout policies and plans approved by the Board of Directors.
It is to be further noted that the bank reflects the co-operative features and business features in its financial transactions. A major portion of its deposits come from individual members and non-members also.Lending policy is in favour of its members only, afterconsidering their attention on financial management. As
«the bank is dealing in deposits, loans and advances, it mobilise the deposits from people and formating economical management. The bank management is always considering market competition and has given special attention for collecting deposits from people and sanctioning the loans to the needed members.
A
71
2-6 i iii) PRESENT POSITION OF THE BANK :
After discussing the management of Bank, it
is better to see present position of the Bank. This
can be studied as under*
1) AREA OF OPERATION s
The Bank’s area of operation was restricted
to the Gadhinglaj Municipal area in 1950-51. The area
of operation remained unchanged upto 1969-70. But it also
served whole of the Gadhinglaj Taluka since from 1970-71.
2) MEMBERS s
“ The members of the Bank admitted on to adult
individuals, who are competent to contract and residesin 22
with^the area of operation of the bank.1* They are
classified into Regular members, which are known as,lA“class
members - and Nominal members which are known as “ Bu class
members. In the beginning of the banking business there
were only 94 members. They were all WA** class members.
The bank started to serve *B“ class members since from
1970-71. The following table shows the numberical trend
of members of the bank for the period of 10 years from
1976-77 to 1985-86.
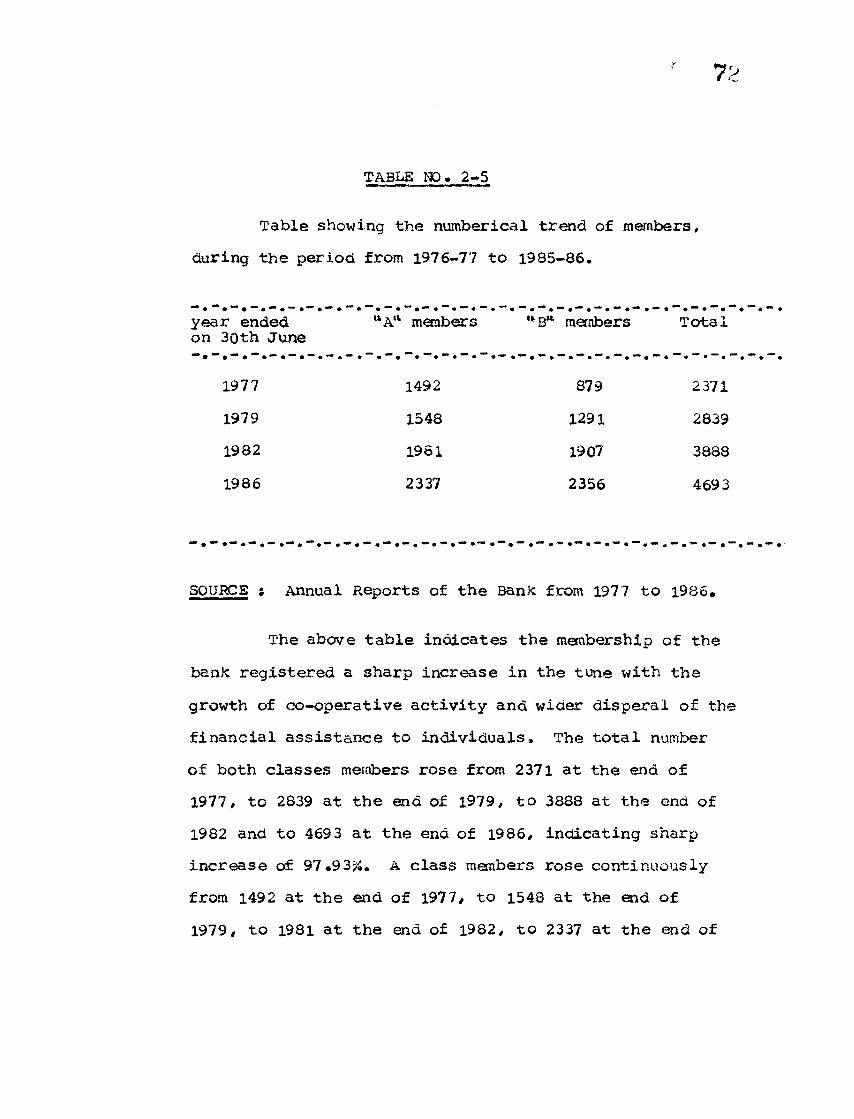
TABLE NO. 2-5
72
Table showing the numberical trend of members.
during the period from 1976-77 to 1985-86.
year ended “A'*on 30th June
members "tB“ members Total
1977 1492 879 2371
1979 1548 1291 2839
1982 1981 1907 3888
1986 2337 2356 4693
SOURCE ; Annual Reports of the Bank from 1977 to 1986.
The above table indicates the membership of the
bank registered a sharp increase in the tune with the
growth of co-operative activity and wider disperal of the
financial assistance to individuals. The total number
of both classes members rose from 2371 at the end of
1977, to 2839 at the end of 1979, to 3888 at the end of
1982 and to 4693 at the end of 1986, indicating sharp
increase of 97.93%. A class members rose continuously
from 1492 at the end of 1977, to 1548 at the end of
1979, to 1981 at the aid of 1982, to 2337 at the aid of
1986. This showing growth of 56*34% curing the last 10 years. B class members also rose from 879 at the end of 1977 to 1291 at the end of 1979, to 1907 at the end of 1982, 2356 at the end of 1986. This representing sharp growth of 168-03%.
In the decade the rate of average total members rose from 156 in 1977 to 1979, 350 in 1980 to 1982 and reduced to 201 in 1981 to 1986. The average rate of A class manbers rose from 18*66 in 1977 to 1979, 144-33 in 1980 to 1982, and reduced to 89 in 1981 to 1986. And also the average rate of B class members rose from 137 in 1977 to 1979, 205 in 1980 to 1982, and decreased to 112 in 1981 to 1986*
3) SHARE CAPITAL ;
Mobilisation of share capital was very difficult task at the time of starting the banking business in 1950-51 due to clutches of money lenders in the market. For this purpose fi»st leading power of bank who were also members of 3oara of Directors had struggled very much. The Board's policy in respect of mobilisation of share capital was guided by power and it was needed for mobilisation of resources share capital is prime element of owned fund.
r 71
The authorised capital of the bank was Rs. 1,25,000 in shares of Rs. 10 each in 1550-51. It was raised from Rs. 1,25,000 to Rs. 3,00,000 in 1972-73, to Rs. 5,0C#000 in 1976-77. At present the authorised capital consists of 20,000 shares of Rs. 25 each. The paid up capital of the bank was Rs. 27,720 in shares of Rs. 10 each in 1950-51. It was raised from Rs. 27,7 20 in 19 50-51 to Rs. 1,24,9 30 in 197 2-73, to Rs. 1, 43,950 in 1975-76. The following table consists of the position of paidup capital during the decade from 1976-77 to 1985-86.
r
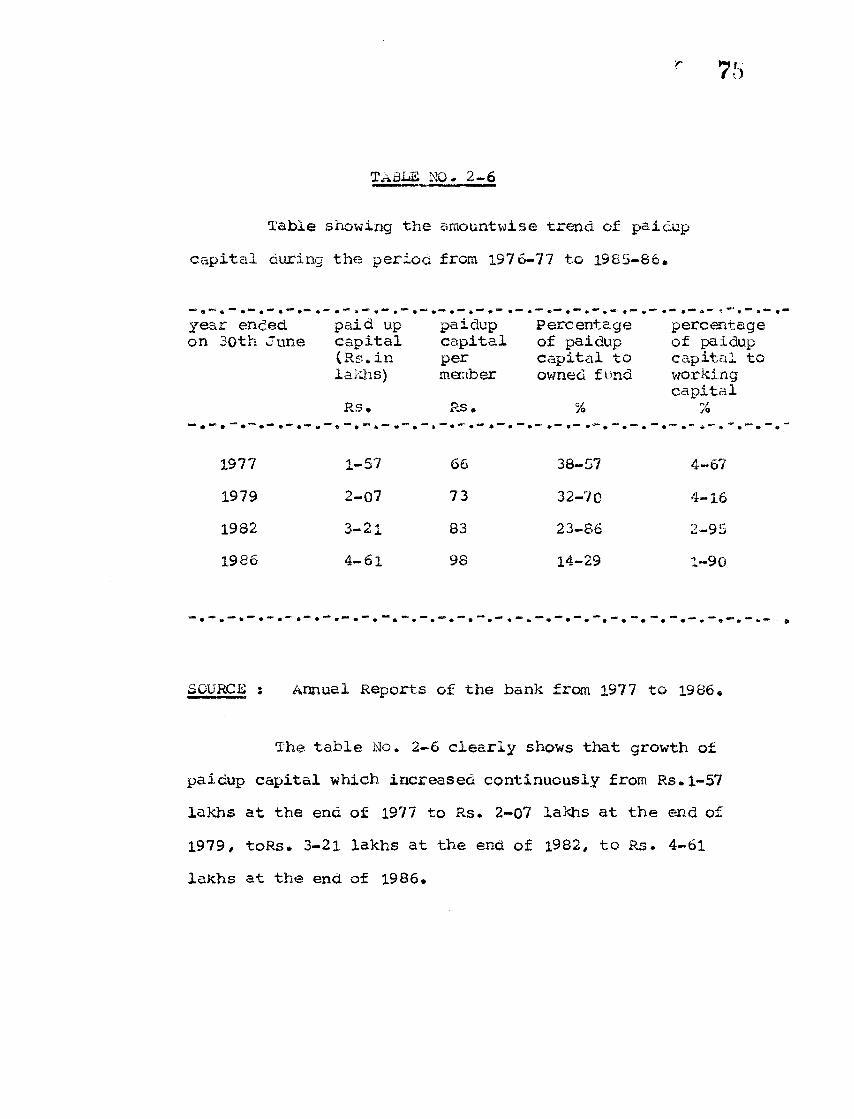
TABLE MO. 2-6
Table showing the amountwise trend, of paidup capital during the perioc from 1976-77 to 1985-86*
year ended on 30th June
paid up capital (Rs.in lakhs)Rs.
paidupcapitalpermemberRs.
Percentage of paidup capital to owned fund
%
percentage of paidup capital to working capital
f>//©
1977 1-57 66 38-57 4-671979 2-07 73 32-70 4-161982 3-21 83 23-86 2-951986 4-61 98 14-29 1-90
SOURCE j Annual Reports of the bank from 1977 to 1986*
The table No. 2-6 clearly shows that growth of paidup capital which increased continuously from Rs.l-57 lakhs at the end of 1977 to Rs. 2-07 lakhs at the end of 1979# toRs. 3-21 lakhs at the end of 1982, to Rs. 4-61 lakhs at the end of 1986.
The table No.2.6 also indicates that the paid up capital perm ember increased frorjt Rs.66 in 1977 to Rs.33 in 1979 to Rs.83 in 1982, to 8s.98 in 1986.
The average rate of growth of paid up capital stepped up from Rs.o-17 lakh in 1977 to 1979, to Rs.o-38 lakh in 1980 to 1982, but it dropped to Rs.0-35 lakh in 1983 to 1986. The paid up capital of the Bank shut up from Rs.1.57 lakhs at the end of 1977 to Rs.4.61 lakhs at the end of 1986. The paid up capital of the Bank multiplied nearly 3 times during the last deceade from 1977 to 1986.
But the table No.2.6 reveals that the percentage of paid up capital to owned fund declined fro® 38.57% at the end of 1977, to 32.70% at the end of 1979, to 23.86% at the end of 1982, to 14.29% at the end of 1986. Whereas the percentage of paid up capital to working capital - dropped from 4.67% at the end of 1977 to 4.16% at the end of 1979, to 2,95% at the end of 1982, to 1.90% at the end of 1986. These percentages indicate the unsatisfactory trend of the Bank* s share capital. While it should be noted that the growth rate of the paid up capital stepped up to 31.9354 at the end of 1979, to 104.2154 at the end of 1982, to - 193.52% at the end of 1986. These noted the satisfactory percentage rates, during the year 1977 to 1986. Every admitted member required to acquire share of the 3ank. This is the major cause for sspectacular increase in paid up capital.
r Ti
4) RESERVE SiOTHER FUNDS >
Reserve & other funds are the second major element
of owned fund* These are helpful to remove financial
obstacles of the Bank. At present the Bank is allocating
25% of the net profit towards Reserve Fund, 25% of the net
profits towards Special Reserve Fund, 15% of the net profit
towards Dividend. The balance of net profit is allocating
towards Building fund, Dharmaday Fund, Sanskrutik Vikas
Fund,Dividend Equalisation fund. Gratuity Fund, Reserve for
Doubtful Debts, Permanent increase in the Reserve & other
Funds reveal financial soundness of the banking business.
The following table reveals the position of Reserve & other
Funds of the Bank during the period from 1976-77 to
1985-86.
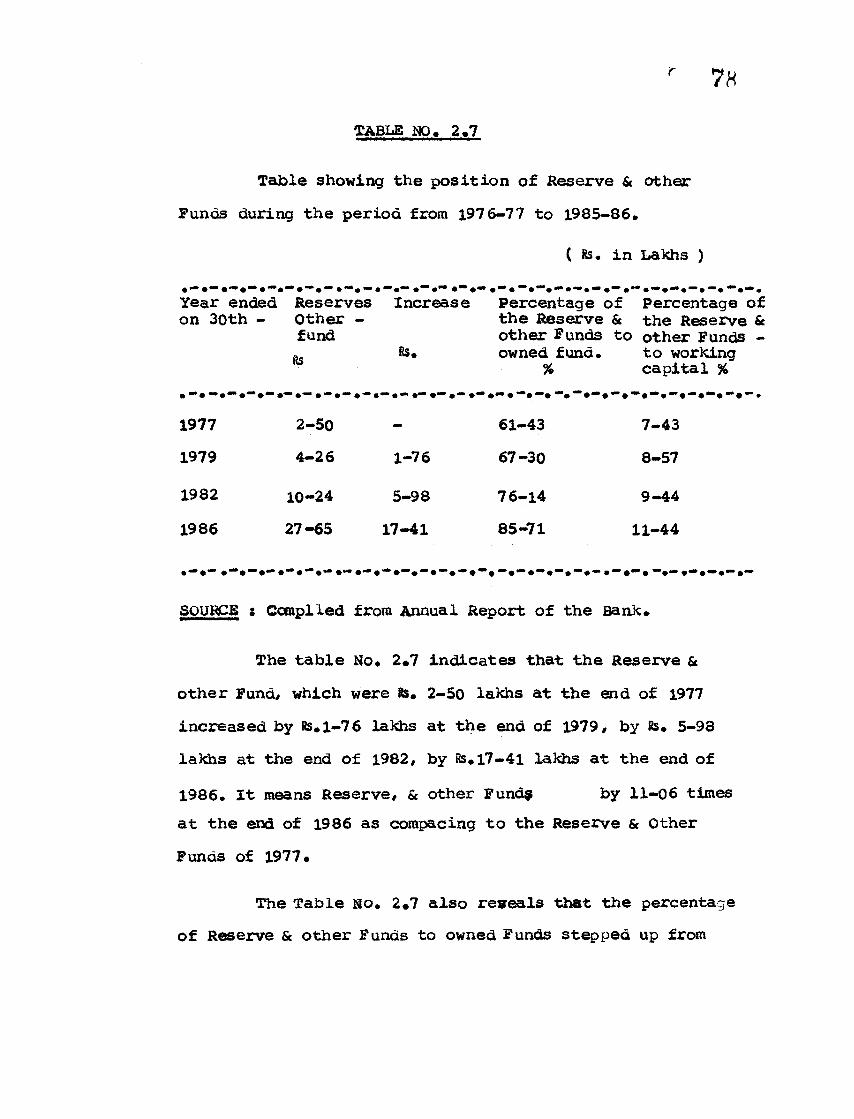
r 78TABLE MO. 2.7
Table showing the position of Reserve & other Punas during the period from 1976-77 to 1985-86.
( Is. in Lakhs )
Year ended on 30th -
Reserves Other - fundIs
Increase
Is.
Percentage of the Reserve & other Funds to owned fund.
%
Percentage of the Reserve &
> other Funds - to working capital %
—' •1977 2-50 - 61-43 7-431979 4-26 1-76 67-30 8-57
1982 10-24 5-98 76-14 9-441986 27-65 17-41 85-71 11-44
SOURCE s Compiled from Annual Report of the Bank.
The table No. 2*7 indicates that the Reserve & other Fund# which were Is. 2-50 lakhs at the end of 1977 increased by Is. 1-76 lakhs at the end of 1979# by Is. 5-98 lakhs at the end of 1982# by Is. 17-41 lakhs at the end of
1986. It means Reserve# & other Funds by 11-06 timesat the end of 1986 as corapacing to the Reserve & Other Funds of 1977.
The Table No. 2*7 also reveals that the percentage of Reserve & other Funds to owned Funds stepped up from
61.4354 at the end of 1977, to 67-3054 at the end of 1979,
to 76-1454 at the end of 1982, St to 85-7154 at the end of
1986.
The percentage of Reserve & other Funds to
worKing capital also rose fro* 7-43% at the end of 1977,
to 8-57% at the end of 1979, to 9-44% at the end of 1982,
11-44% at the end of 1986.
4) OWNED FUNDS :
The owned funds are the total of share capital
St Reserve St other Funds. The owned funds are useful to
face the financial difficulties of the bank. So the large
amount of owned funds, working as a shockobserving cushion
of the bank. The following table showing the position of
owned funds during the period from 1976-77 to 1986-86.
80
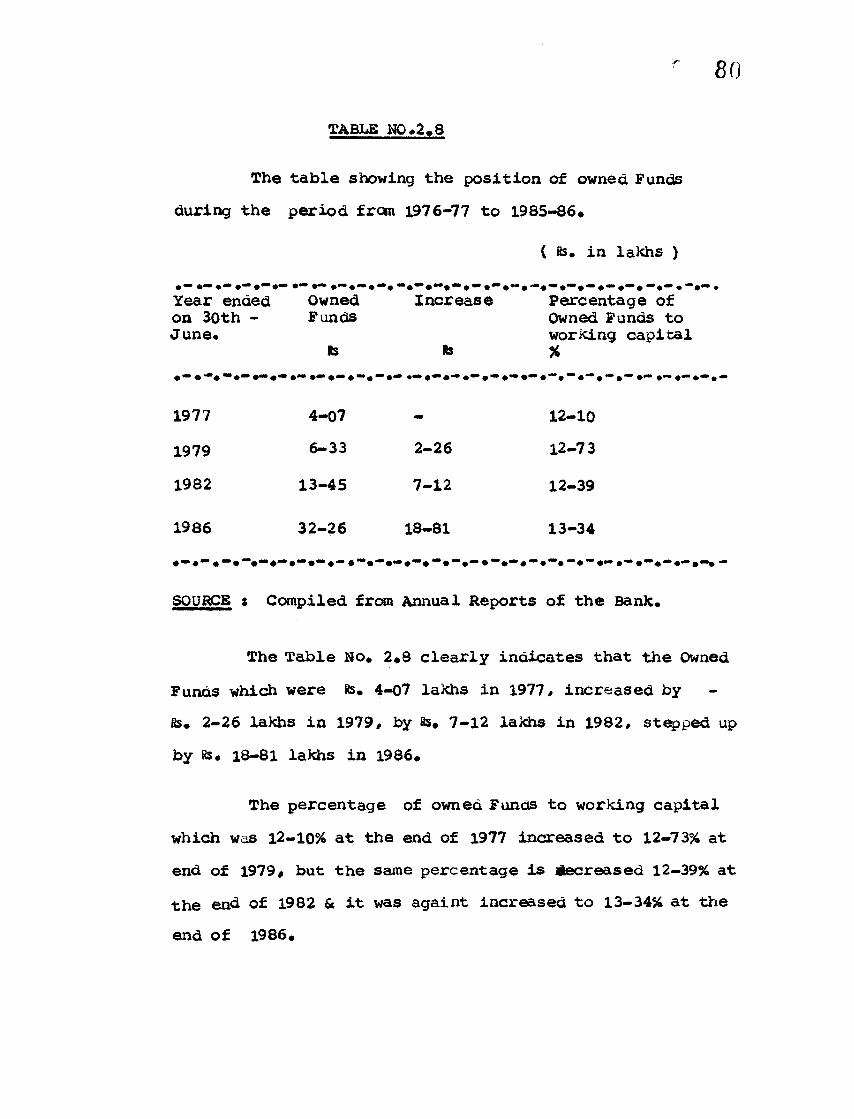
TABLE NO,2.8
The table showing the position of owned Funds
during the period from 1976-77 to 1985-86*
( 8s. in lakhs )
Year ended on 30th - June.
OwnedFunds
Rs
Increase
8S
Percentage ofOwned Funds to working capital %
1977 4-07 12-10
1979 6-33 2-26 12-73
1982 13-45 7-12 12-39
1986 32-26 18-81 13-34
SOURCE s Compiled from Annual Reports of the Bank.
The Table Ho. 2*8 clearly indicates that the Owned
Funds which were 8s. 4-07 lakhs in 1977# increased by
8s. 2-26 lakhs in 1979# by 8s* 7-12 lakhs in 1982# stepped up
by 8s. 18-81 lakhs in 1986.
The percentage of owned Funds to working capital
which was 12-10% at the end of 1977 increased to 12-73% at
end of 1979# but the same percentage is decreased 12-39% at
the end of 1982 & it was againt increased to 13-34% at the
end of 1986*
r 81
5) DEPOSITS & OTHER ACCOUNTS i
The Bank accepts deposits from its members
and also from non members. It is the main function
of the Bank. Similarly deposits are main part of the
resources of the Bank. * Deposits may be received under
the co-operative societies Act & Rules,on such rates of
interest and subject to such rules and regulations as
may be approved by the Board of Directors and also
subject to the directives issued by the RBI in this
from time to time
The Researcher observed that the Bank has accepted
deposits mainly from individuals. The members have less
capacity to save and they need accommodation from the -
Bank. In a way the credit goes to the Bank which has
attracted deposits from non-members while working a
competitive banking business. T£e following table showing
the position of deposits & other Accounts of the Bank and
their contribution into working capital of the Bank from
the year 1977 to 1986.
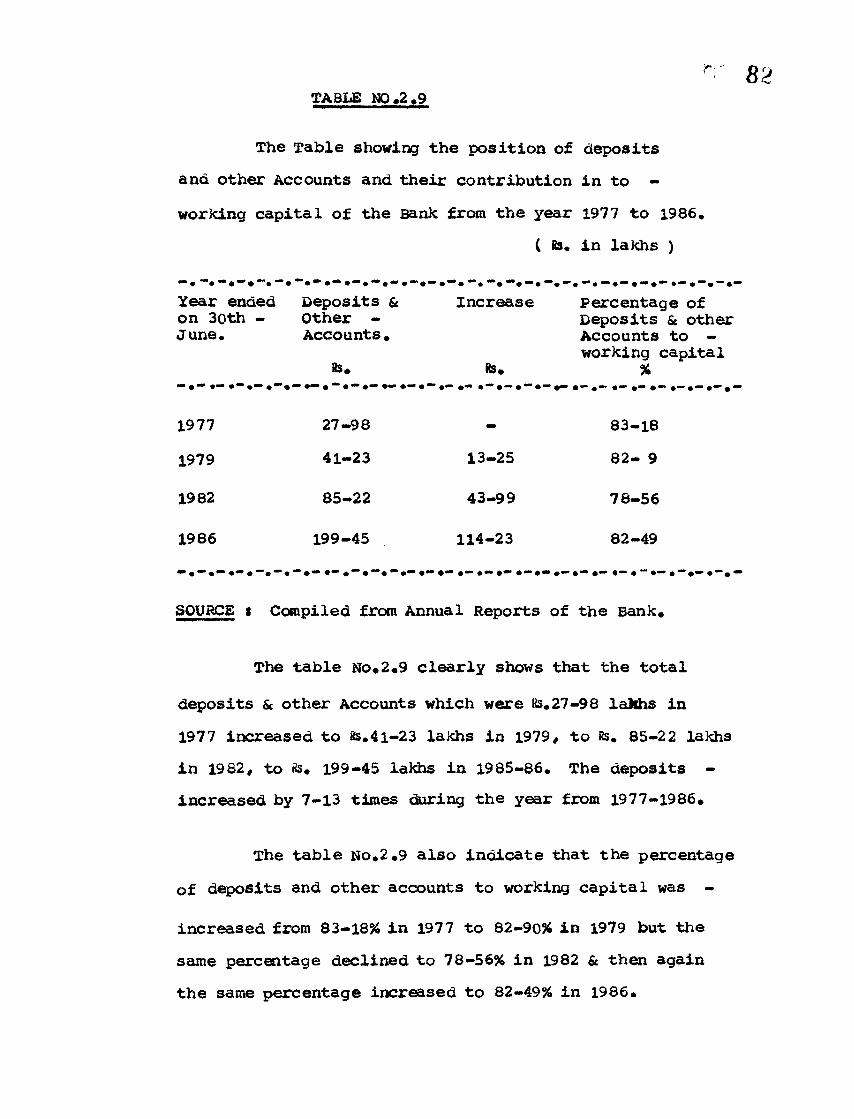
TABLE NO >2.9
The Table showing the position of deposits
and other Accounts and their contribution in to -
working capital of the Bank from the year 1977 to 1986.
( 8s. in lakhs )
Year ended Deposits Sc Increase Percentage ofon 30th - June.
«■ ^ mm i
Other - Accounts.
8S. 8s.
Deposits Sc other Accounts to - working capital
%•— •“ .— .— .— .—
1977 27-98 - 83-18
1979 41-23 13-25 82— 9
1982 85-22 43-99 78-56
1986 199-45 114-23 82-49
SOURCE s Compiled from Annual Reports of the Bank.
The table No.2.9 clearly shows that the total
deposits & other Accounts which were fis.27-98 laMis in
1977 increased to 8s. 41-23 lakhs in 1979, to Rs. 85-22 lakhs
in 1982, to 8s. 199-45 lakhs in 1985-86. The deposits -
increased by 7-13 times during the year from 1977-1986*
The table No.2.9 also indicate that the percentage
of deposits and other accounts to working capital was -
increased from 83-18% in 1977 to 82-90% in 1979 but the
same percentage declined to 78-56% in 1982 & then again
the same percentage increased to 82-49% in 1986.
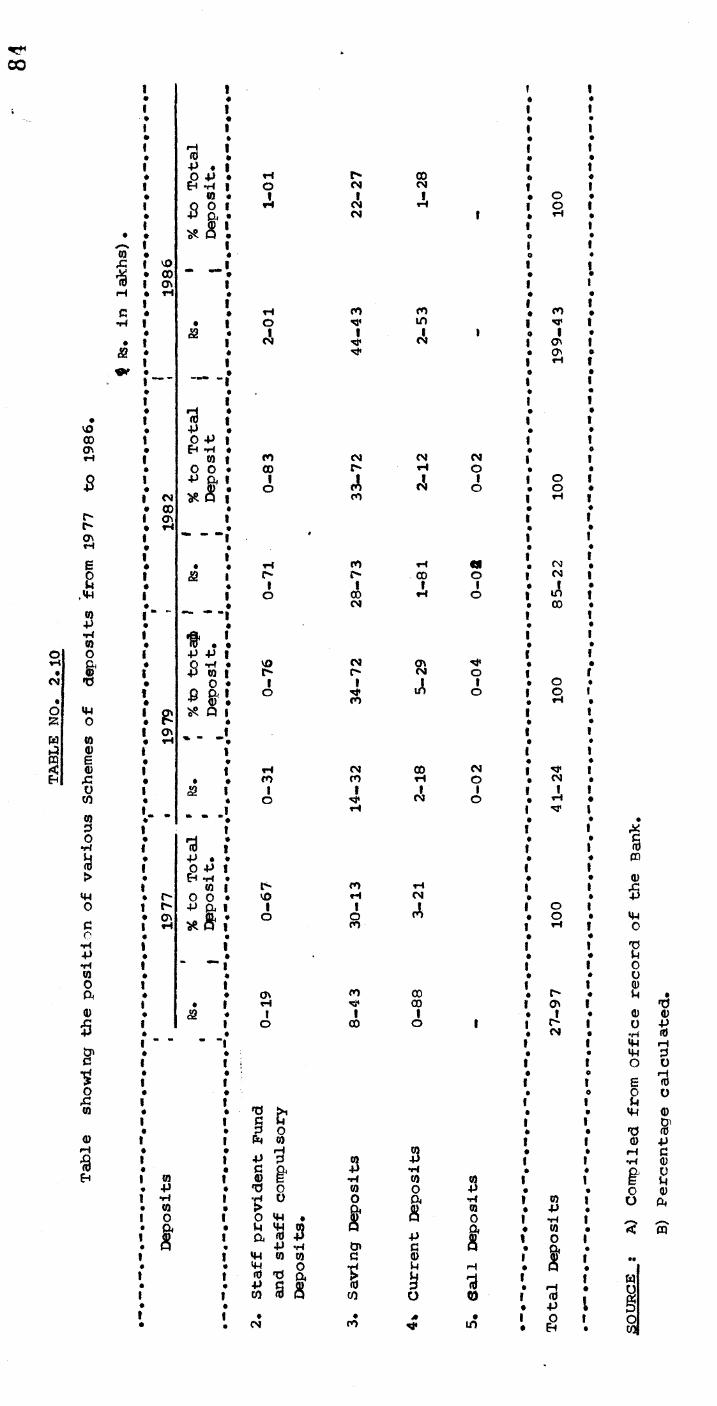
Tabl
e sho
wing
the pos
itio
n of v
ario
us S
chem
es o
f deposits
from
19 7
7 to
1986
CO
1•t
rt |to ;+> . i
i•i
19t
♦ o 4J • ft CO a 9t rt ft » o CM CM f 1• to • I t I • O 9| Q O f rt (M rt 1 o t•i
■P 0, • in ■
CM 1 • rt 9ft•
1•
tt S 1 10
19
>•% t 1 f 1W • o 9x 1 '■O . _ 1 1 |M • CO • 9ro 1 ON 1 1 !rt • rt • • 9•C
1•
1• rt oo CO • <n 1
9•rt 1 • 1 O m1 If) 1 v 1
« & • 1 t 1 1 o 1 9• I CM •sc CM 1 ON 1& •
1«|
• ON1 rt
9f
9* • — _ • •1
919
1•t
91
^ tI•|
f•t
• ■P . • •1 0 -P » t 1• £-4 rt • • »1 W | CO CM CM CM 1 l• O O • CO ft rt o • •I •P Pi 1 1 * 1 1 1 o l• o co CM o • o •1 N ^ P I 00 1 rt l• 00 • • •1 ON t 1 1• rt 1
^ ^ 9 4•1
•l
•1•
•1
• • rt CO rt «R • CM
91•
1 £ 19
r- ft 00 o 1 CM 1• 1 1 I 1
i A •1 | o 00 rt o t•I *■ - • CM • CO
1•1
•
•
•a i* ro • •
•1•
•1•
I •P 4J | I f• O rt • VO CM ON • •t -P 01 | ft r~ CM o 1 f•»•
O • 1o 13co
A 1o 100 •
i•
i £ ^ Q 1•
t•
\•
1 ON 1 1 1# tH
•|
^ " *■ •f♦1 rt CM 00 CM
•1•1 v
•1•1
• • • CO CO rt o • CM •1 <2 I
•i 1 1 1 r i 1
• O CM o • H •1 1 rt 1 ^ 1« m•t
•1
•1
»!•1 •a ; 9
t•1
c
• •P • * 9 • m
1 O -P 1 1 1• EH rt *
t> CO9 • ©
I 01 | rt 1 1 X* ft 0 0* vO rt CM 9 • 4- '1 t" ■p a i 1 1 «* • o 1• ON1 rt
S • XG i
o OCO
9 OI ^
•f
440
•|
•v 9|
9I P
• • 9 9 $-1 | 1 C>9■ 9i 9i
9ft
o©p •
I• 19 ON co 00 • ft 1
9
I • 1 rt *3* 00 I ON 1 P• a * 1 1 1 t 1 9 © ©1 o co o 1 1 C' 1 0 -p» # ♦ CM 9 rt ©• 1• 1
9m rt m b
1 t 1 o V•1
•1
9
I 6 *3• • » 9 0 0I t P >i 1 1 P• • 9 «w ©1 1 c u I 1 ft• • p ° • 9 p ©1 1 Pm o> t « © •p• • © • 9 rt c1 1 •P P 0} -P 1 1 rt ©• • G P* ■p •rt • 9 D 01 © 1 © tf •rt 0) © I 1 B g• -P • •0 O w 0 p • 9 0 ©1 -H 1 ■rt 0 O a© •rt I © 1 o ft• W 9 Oi © • -P 91 O• ft 1 ©
1•I
0 •g *w ©O, © -P
§ p•p
0ftf
1 -rt• ©1 o
19| «< CP
• O • •p -rt o» c p * ft1 © 9
1 t m oi oi c © | ••• • <« _ 0 W M rt • ft 9t•1
•1
©Pa ■P c e wrap&05
no
3o
(• rt1 ©
f9■
wy(V• • • -P l 5t• I• • •ro
*<* •in 1 P• rt l9
ow|
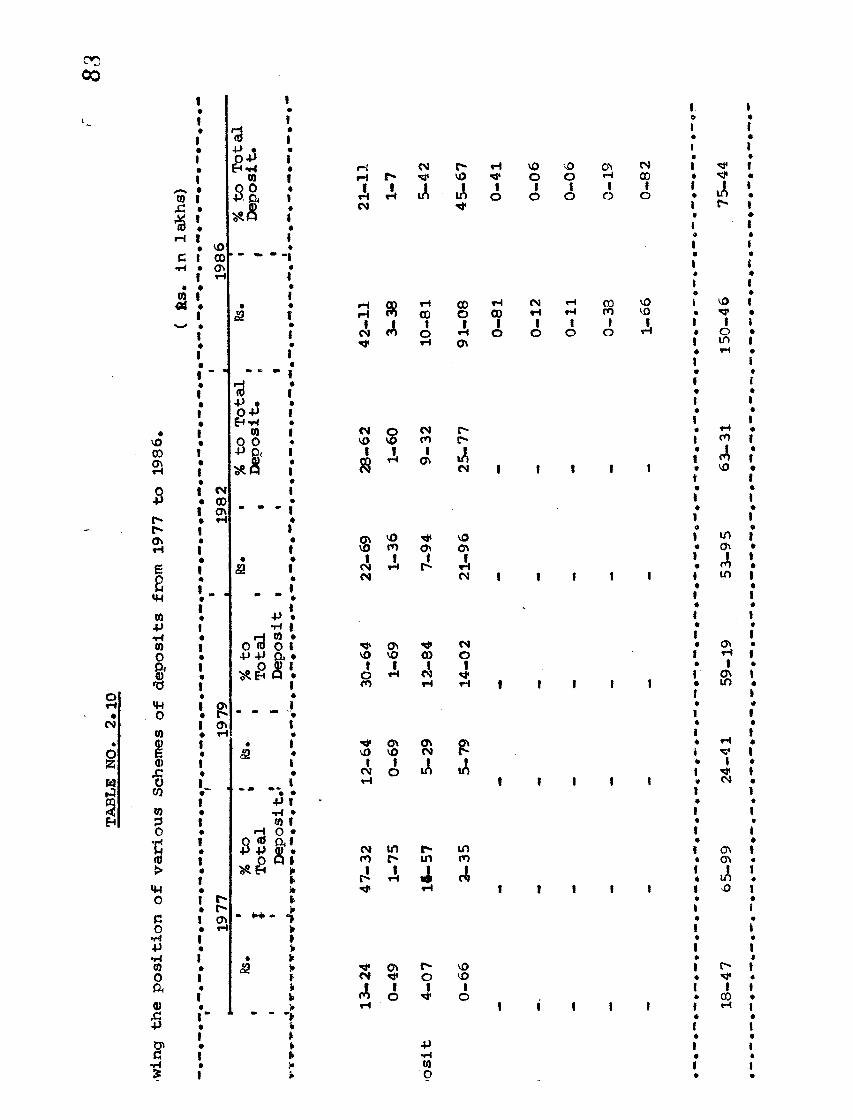
% to
Tota
l D
epos
it.
rH4,CN
I**4, 5-
42
45-6
70-
41
0-06 VO
oto 0-
19
10
CMCO1o 75
-44
1986
•3
— m
m
— - V
— ,
42-1
13-
38
10-8
1
91-0
8
0-81 CM*H
1O 0-11
0-33
1-66 VO
V1oin■H
% to
Tota
l D
epos
it. J •
cm
VO1n 1-
60
9-32
25-7
71 1 l l i 63
-31
1982 m m m
•a
m
22-6
9 vOm4, 7-
94
21-9
6
1 1 1 l i
mOv
in
% to To
tal
Dep
osit
30-6
4 OHVOIrH 12
-84
14-0
2
I 1 1 l l 59-1
9
* * * * 19
79
•3
m m
12-6
40-
69
5-29
5-79
1 1 1 l 24-4
1
1977 '
% to
f To
tal
' D
epos
it*
47-3
21-
75 r-in
4H
2-35
» 1 1 l « 65-99
•a
” " "
13-2
40-
49os
it 4-
07
0-66
l 1 l l l 18-4
7
win
g the p
ositi
on of
vario
us Sc
hem
es of
depo
sits
from
1977
to 19
86.
( &s. in
lakhs
)
' 83
TAB
LE HO
. 2.10
85
At present stage Bank is collecting the deposits
under main schemes like term deposits, saving deposits,
current deposits from the customers of the Bank.
TERM DEPOSITS I
* A Term Deposit is withdrawable after the period
contracted for 24 The term deposits include the following
deposits.
i) Fixed Deposits,
ii) Recurring Deposits
iii) Dainandin Bhishi Deposits
iv) Damdupatt Deposits
v) Lakshadhish Deposits
vi) Shubha Mangal Deposits
vii) Peas ion Deposits
viii) Certificate Deposits,
ix) Samrudhi Deposits .
Out of the above Term Deposits schemes Bank is
collecting deposits under Lakshadish Deposits, Shubh -
Mangal Deposits, Pension Deposits, Certificate Deposits,
Schemes since 1982-83 & under samrudhi Deposits scheme
since 1983-84.
The Table No.2.10 indicates that Tern deposits
which were Is. 18-67 lakhs at the end of 1977, increased
to Is. 24-61 lakhs at the end of 1979, to Is. 53-95 lakhs
in 1982, to Is. 150-46 lakhs, at the endof 1986. The
.sat® nai man? ffiUHnctrap
r 8f>
percentage of Terra Deposits to Total Deposits which
was 65-99% at the end of 1977# declined to 59-19%
at the end of 1979# but this percentage increased to
63-31% in 1982# to 75-44% in 1986.
The table No. 2.10 also indicated that the Bank
has collected Terras Deposits mainly under Fixed
Deposits scheme# Dainandin Bhishi deposits scheme#
Damdupat Deposits Scheme# The fixed deposits which were
8s. 13-24 lakhs in 1977# decreased to 8s. 12-64 lakhs in
1979# St these deposits increased to Bs. 22-69 lakhs in
1982# to 8s. 42-11 lakhs in 1986. The percentage of Fixed
deposits to total deposits went on decreasing in these
years from 1977 to 1986. The percentage of Fixed Deposits
to Total Deposits which was 47-32% at the end of 1977 -
declined to 30-64% at the end of 1979# to 26-62% at the
of end of 1982# to 21-11% at the end of 1986.
The table No. 2.10 also reveals that Dainandin
Bhishi deposits which were 8s. 0-49 lakh in 1977 increased
to Bs. 0-69 lakh in 1979, to Rs. 1-36 lakh in 1982# 8s.3-38
lakhs in 1986. The percentage of Dainandin Bhishi Deposits
to total deposits which was 14-57% at the end of 1977 -
declined to 12-84% at the end of 1979# to 9-32% at the end
of 1982# to 5-42% at the end of 1986.
The table No.2.10 shows that the Damdupat Deposits
which was Rs. 0-66 lakh at the end of 1977 increased to -
8s.5-79 lakhs at the end of 1979# to Bs.12-96 lakhs in 1982
87r
to Rs. 91-08 lakhs at the end of 1986*
The percentage of Damdupat Deposits to Total Deposits which was 2-38% at the end of 1977 increased to 14-02% at the end of 1979, to 25-77% at the end of 1982, to 45-67% at the aid of 1986.
The table No. 2*10 also clearly shows the amount and percentages Recurring Deposits Lakshadhish Deposit, Shubhmangal Deposits, Pension Deposits, Provident Fund Deposit to Total Deposit were very poor.
SAVINGS DEPOSITS 8
** A savings Account or Savings Bank Account or Savings Deposit Account is a form of demand deposit. It is subject to restrictions as to the number and amount of withdrawals permitted by the bank during any specified period “25. Saving Deposits Scheme is one of the important scheme which develop the habit and thrift among the members and non members of the Bank . At person who is a member - of this scheme receives pass book and cheque book facilities immediately on opening saving Deposit Account with the Bank. A member of this type of deposit can withdraw the amount once or twice in a week. He has to give notice to the Bank for drawing amount beyond the limit prescribed by RBI. In the case of saving Deposit interest is allowed to pay on the minimum balance in the account during the
period from tenth of the month to the last day of each calender month.
The table No. 2*10 indicates that the Saving Deposits which were 8s* 8-43 lakhs in 1977 increased to 8s. 14-32 lakhs in 1979. to 8s. 28-73 lakhs in 1982. to 8s.44-43 lakhs in 1986. The percentage of Saving Deposits to Total Deposits which was 30-13% in 1977 increased to 34-72% in 1979. but the same percentage is decreased to 33-72% in 1979. to 22-27% in 1986.
CURRENT ACCOUNT :
* Deposits maintained in the form of a current Account are withdrawal on demand any number of times depending upon the balance or upto agreed amount** 26.A member of the current deposits scheme also receives pass book. Cheque Book facilities immediatelyon opening Current Account with the bank. This Scheme is mostly used by businessmen, Partemership firms. Professionals and other organisations, who required to operate this account frequently.
The table No. 2.10 clearly shows that the amount of current deposits which was 8s. o-88 lakh in 1977 increased to 8s. 2-l8 lakhs in 1979, but same deposits in decreased to Rs. 1-81 lakh in 1979 and then this current deposit again increased to 8s* 2—53 lakhs in 1986.
8,')r
The table No. 2.10 also Indicates that the
percentage current deposits to total deposit increased
from 3-21% in 1977 to 5-29% in 1979 but the same
percretage in declined to 2-12% in 1982. to 1-28% in
1986.
The table No. 2.10 indicates that the call
deposits which were 8s. o-o2 lakh in 1979 remained same
in 1982 but there were balance on account of call
deposit in the years 1977 fas and 1986.
6. RESOURCES :
Owned Funds. Deposits and borrowings of the bank
are the main elements of Resources of the Bank. This -
Bank has borrowed the money from other banks only in the
years 1981-82, 1982-83. 1983-84 Ss.3-56 lakhs, 8s. 1-49 -
lakhs, 8s. 0-13 lakh respectively .The following table
showing the position of Resources during the years from
1976-77 to 1985-86*
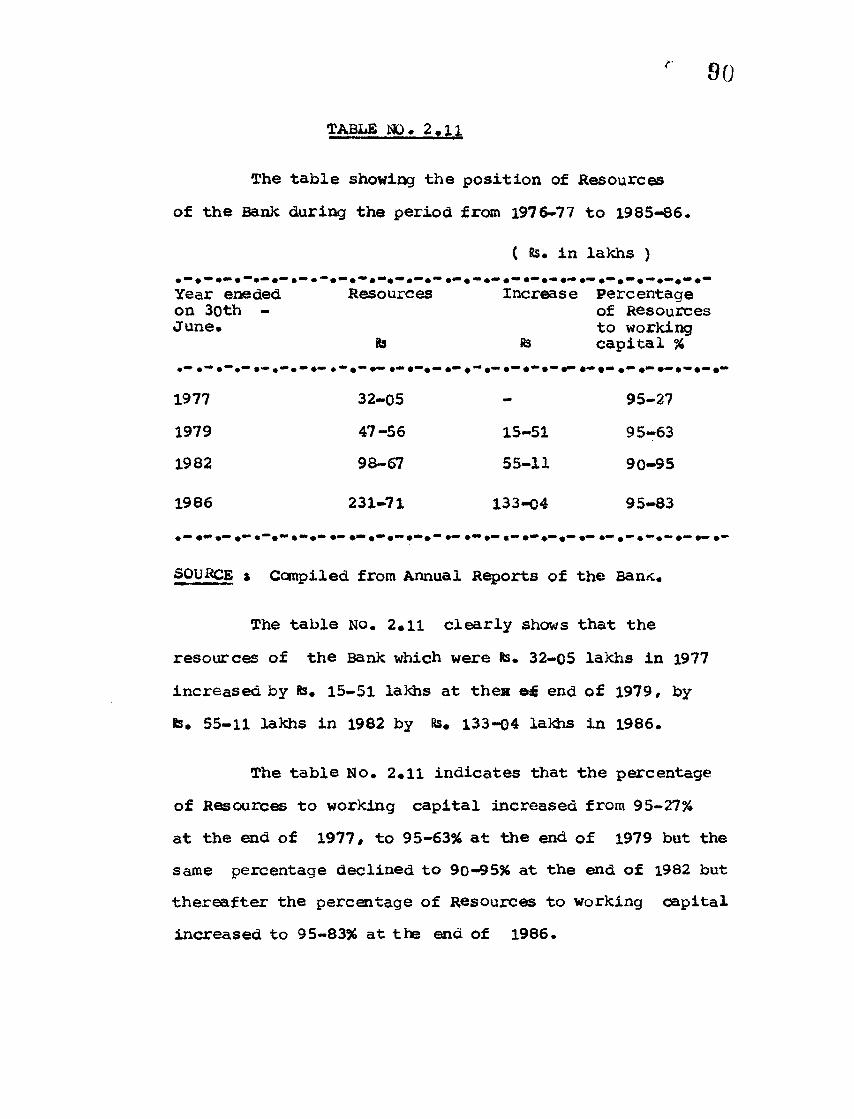
r 90TABLE NO. 2.11
The table showing the position of Resourcesof the Bank during the period from 1976-77
( 8s. in
to 1985-86.
lakhs )
Year eneded Resources Increase Percentageon 30th - June.
8s*— •— •—•—
of Resources to working
& capital %
1977 32-05 mm 95-271979 47-56 15-51 95-631982 98-67 55-11 90-95
1986 231-71 133-04 95-83
SOURCE » Compiled from Annual Reports of the Bank,
The table No. 2.11 clearly shows that the resources of the Bank which were 8s. 32-05 lakhs in 1977 increased by 8s. 15-51 lakhs at then e£ end of 1979, by 8s. 55-11 lakhs in 1982 by Rs. 133-04 lakhs in 1986.
The table No. 2.11 indicates that the percentage of Resources to working capital increased from 95-27% at the end of 1977# to 95-63% at the end of 1979 but the same percentage declined to 90-95% at the end of 1982 but thereafter the percentage of Resources to working capital increased to 95-83% at the end of 1986.
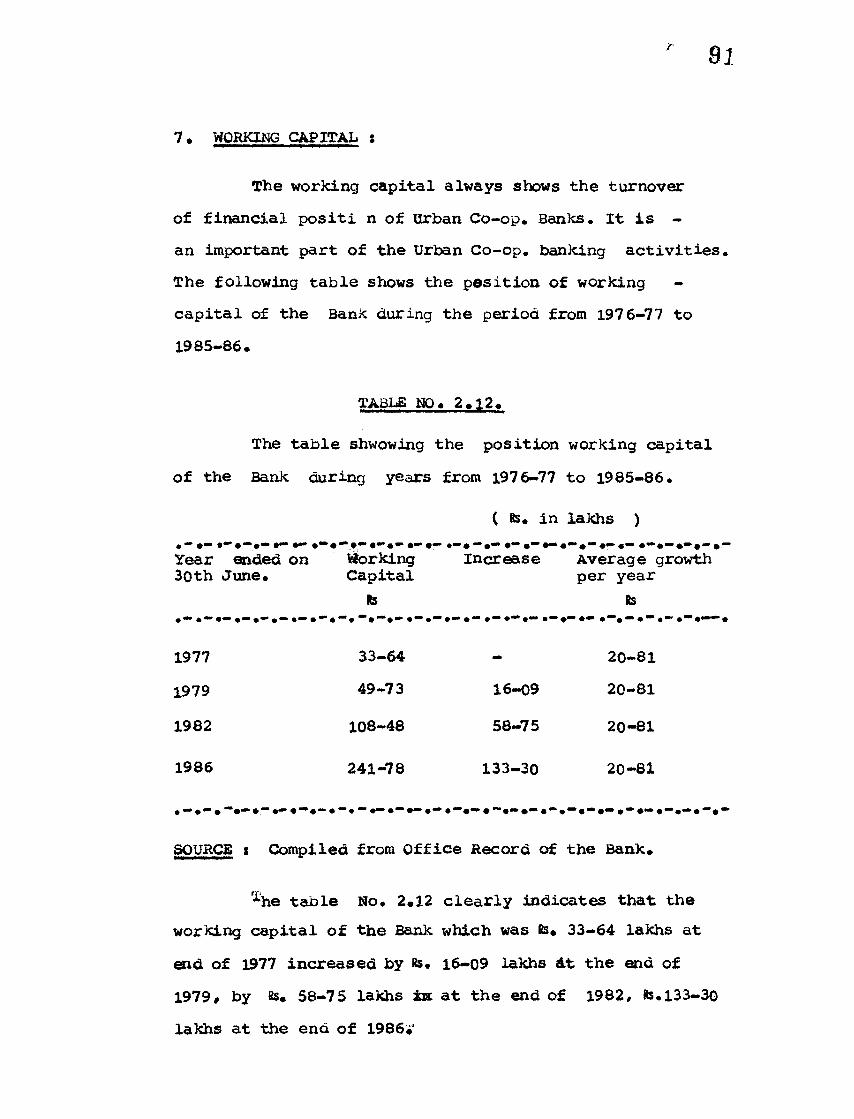
91r
7* WORKING CAPITAL *
The working capital always shows the turnover
of financial positi n of Urban Co-op. Banks. It is -
an important part of the Urban Co-op. banking activities.
The following table shows the pesition of working
capital of the Bank during the period from 1976-77 to
1985-86.
TABLE NO, 2.12.
The table shwowing the position working capital
of the Bank during years from 1976-77 to 1985-86.
( fis. in lakhs )
Year ended on Working Increase Average growth 3Qth June. Capital per year
1977 33-64 - 20-81
1979 49-73 16-09 20-81
1982 108-48 58-75 20-81
1986 241-78 133-30 20-81
SOURCE s Compiled from Office Record of the Bank.
r<the table No. 2.12 clearly indicates that the
working capital of the Bank which was te. 33-64 lakhs at
end of 1977 increased by 8s. 16-09 lakhs At the aid of
1979# by 8s. 58-75 lakhs ±n at the end of 1982# 8$. 133-30
lakhs at the end of 1986.
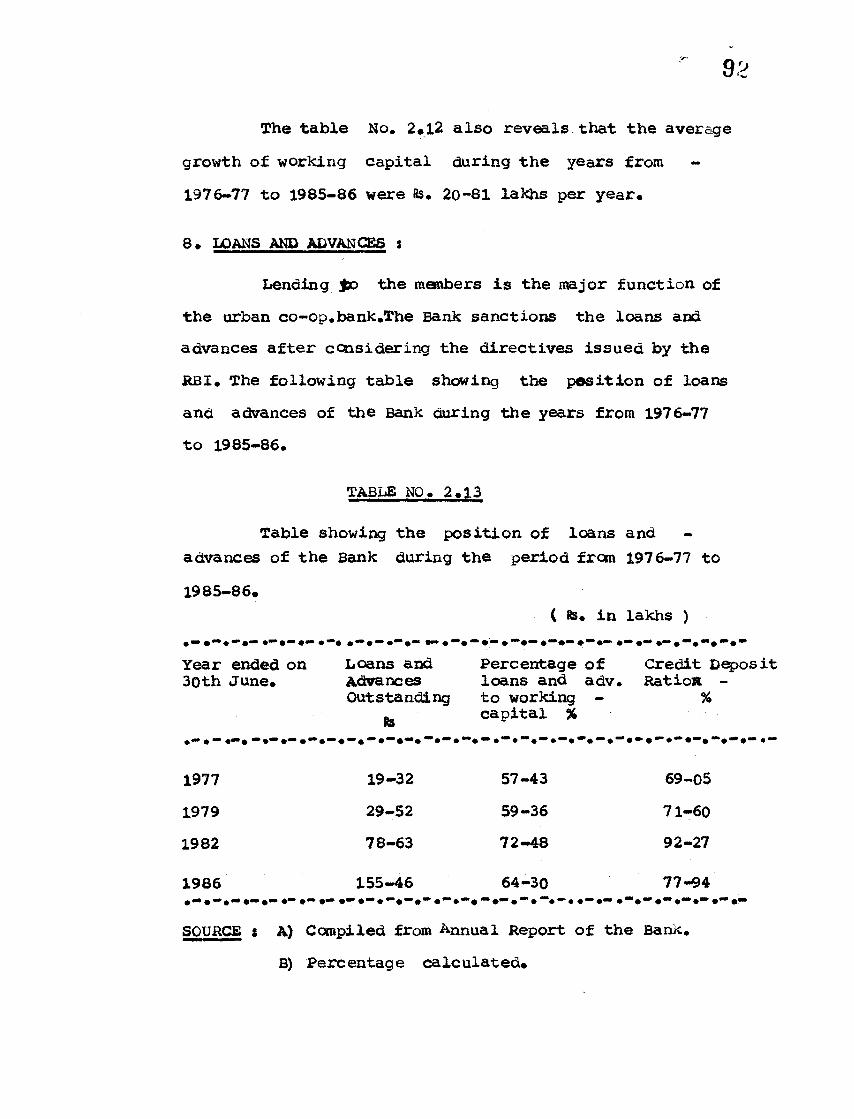
The table No. 2.12 also reveals that the average
growth of working capital during the years from
1976-77 to 1985-86 were 8s. 20-81 lakhs per year.
8. LOANS AND ADVANCES S
Lending Jao the members is the major function of
the urban co-op. bank.The Bank sanctions the loans and
advances after considering the directives issued by the
RBI. The following table showing the position of loans
and advances of the Bank during the years from 1976-77
to 1985-86.
TABLE NO. 2.13
Table showing the position of loans and - advances of the Bank during the period from 1976-77 to
1985-86.( 8s. in lakhs )
Year ended on Loans and Percentage of Credit Deposit3oth June. Advances loans and adv. Ration -
Outstanding to working - %capital %
1977 19-32 57-43 69-05
1979 29-52 59-36 71-60
1982 78-63 72-48 92-27
1986 155-46 64-30 77-94
SOURCE s A) Compiled from Annual Report of the Bank.
B) Percentage calculated.
r 93
The table No. 2*13 clearly indicates that the
loans and advances outstanding rose from is. 19-32 lakhs
at the end of 1977, to Bs. 29-52 lakhs at the end of -
1979, to is. 78-63 lakhs at the end of 1982, 8S.155-46 -
lakhs at the end of 1986.
The table no. 2.13 also indicates that the
percentage of loans and advances to working capital
of the Bank increased from 57-43% at the ©ad of 1977
to 59-36% at the end of 1979, to 72-48% at the end aE
1982 but the same percentage is decreased to 64-30% at
the end of 1986.
The table no. 2.13 reveals that the credit
deposit ratio rose from 69-05%at the end of 1977 to -
71-60% at the end of 1979, to 92-27% at the end of 1982
and declined to 77-94% at the end of 1986.
9. 0VENDUES s
There is a general belief that loans given by
the co-operative bank are not repaid in time result in
high percentage of overdues. This however, does not
apply to all the Urban Co-op.Banks. The following
table shows the position of overdues the Bank during
the period from 1976-77 to 1985-86.
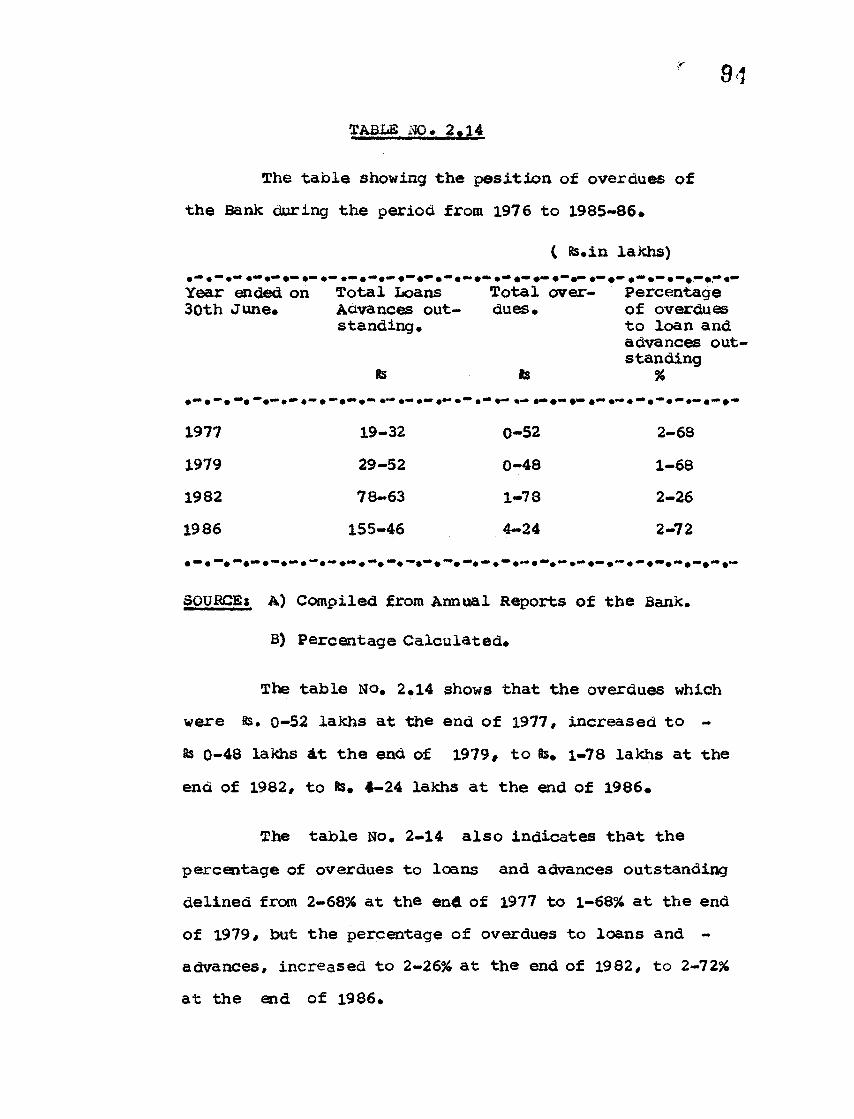
94
TABLE HQ. 2.14
The table showing the pesition of overdues of
the Bank during the period from 1976 to 1985-86*
( 8s.in lakhs)
Year ended on 30th June*
Total Loans Advances outstanding.
8s
Total over- dues*
Is
Percentage of overdues to loan and advances outstanding
%
1977 19-32 0-52 2-68
1979 29-52 0-48 1-68
1982 78-63 1-78 2-26
1986 155-46 4—24 2-72
BOURSE? A) Compiled from Annual Reports of the Bank.
B) Percentage Calculated*
The table No. 2*14 shows that the overdues which
were fis. 0-52 lakhs at the end of 1977, increased to -
8s o-48 lakhs 4t the end of 1979# to 8s* 1-78 lakhs at the
end of 1982, to 8s* 4-24 lakhs at the end of 1986*
The table No. 2-14 also indicates that the
percentage of overdues to loans and advances outstanding
delined from 2-68% at the end of 1977 to 1-68% at the end
of 1979, but the percentage of overdues to loans and -
advances, increased to 2-26% at the end of 1982, to 2-72%
at the end of 1986.
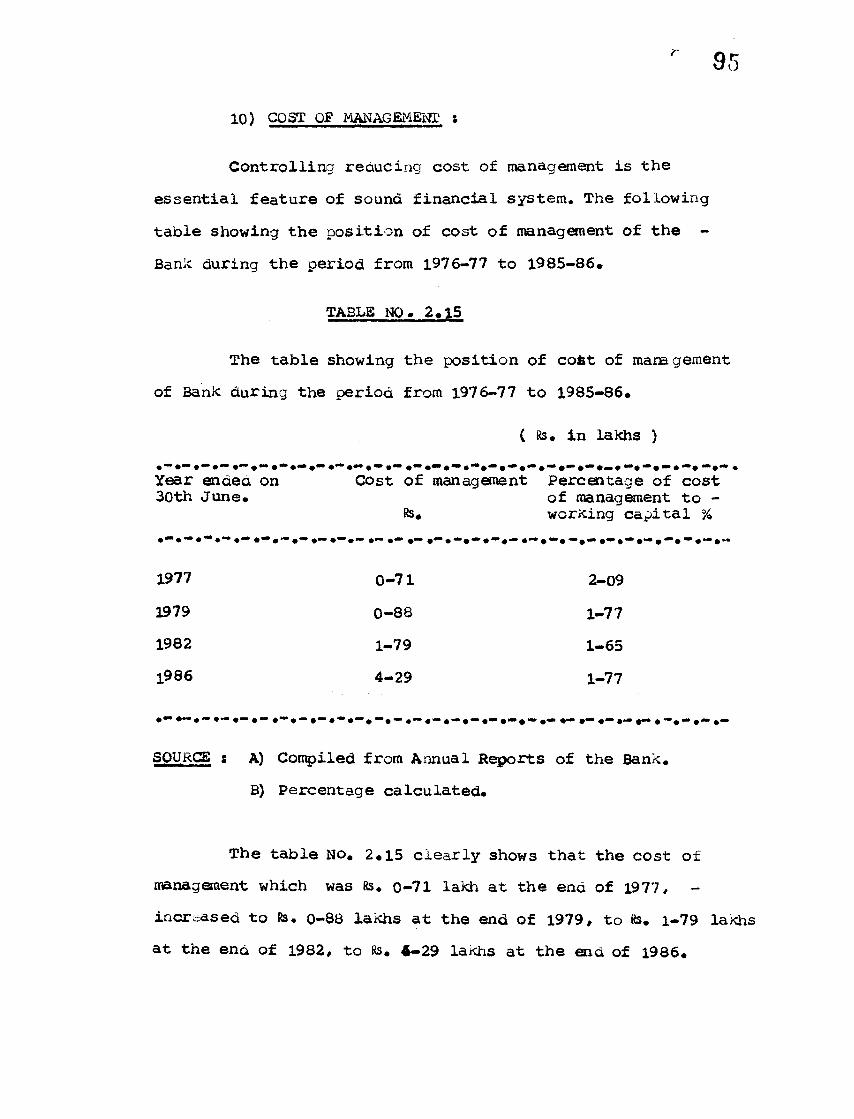
95r
10) COST OF MAN AG EHEHT *
Controlling reducing cost of management is the
essential feature of sound financial system. The following
table showing the position of cost of management of the -
Bank during the period from 1976-77 to 1985-86.
TABLE NO. 2.15
The table showing the position of cofit of management
of Bank during the period from 1976-77 to 1985-86.
( 8s. in lakhs )
• • • 0 ** • •• 0^ • 0 ••0 9 *"* 0 9 "■0<* #
Year ended on Cost of management Percentage of cost30th June. of management to -
Rs. working capital %• *** 0 mm 0 ** %•* 0 0 M* #***' 0*® •*** •** •** •'** • *0 «*» 0 • 0M» 0 <■* 0 ^*0 «■» 0*v £ «■» 0** ^ «■*0 ^ mb ^ *.•
1977 0-71 2-09
1979 0-88 1-77
1982 1-79 1-65
1986 4-29 1-77
SOURCE s A) Compiled from Annual Reports of the Bank.
B) Percentage calculated.
The table No. 2.15 clearly shows that the cost of
management which was 8s. o-71 lakh at the end of 1977, -
increased to Rs. 0-88 lakhs at the end of 1979, to 8s. 1-79 lakhs
at the ena of 1982, to 8s. 4-29 lakhs at the end of 1986.
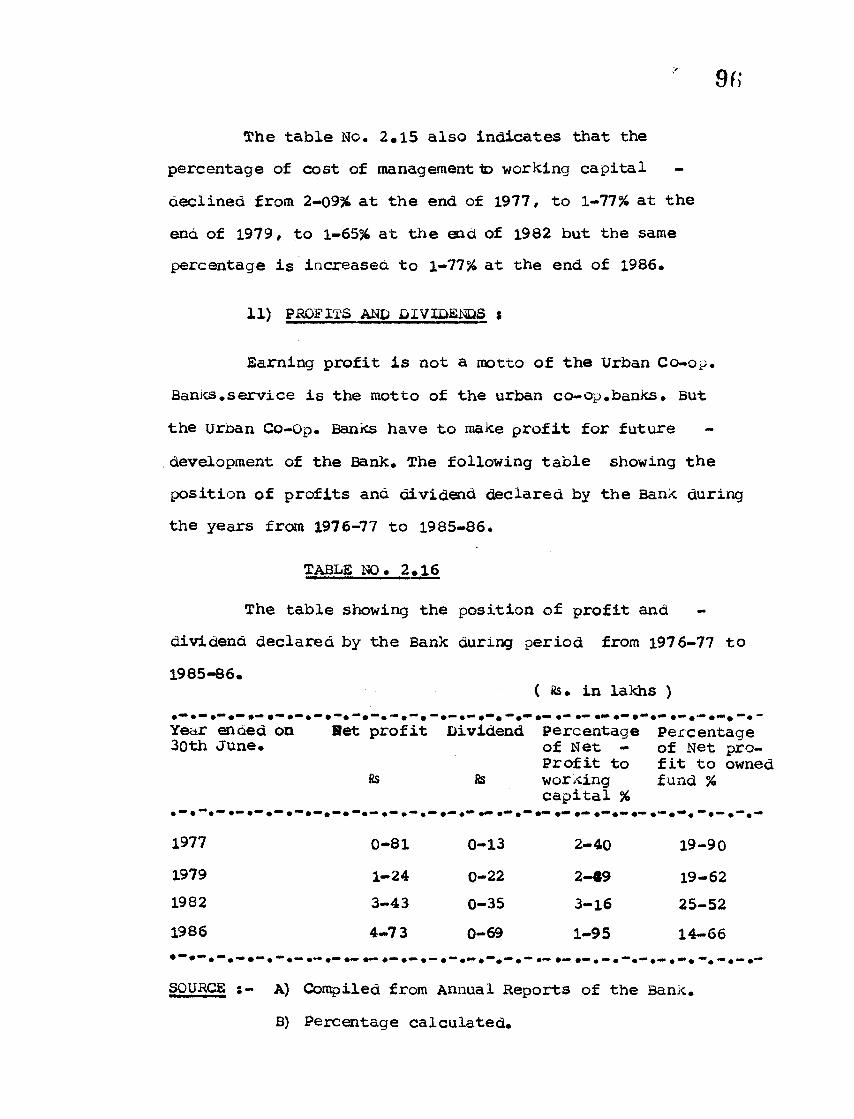
The table No. 2,15 also indicates that the
percentage of cost of management to working capital
declined from 2-09% at the end of 1977, to 1-77% at the
end of 1979, to 1-65% at the end of 1982 but the same
percentage is increased to 1-77% at the end of 1986.
11) PROFITS AND DIVIDENDS 8
Earning profit is not a motto of the Urban Co-op.
Banks.service is the motto of the urban co-op.banks. But
the urban Co-Op. Banks have to make profit for future -
development of the Bank. The following table showing the
position of profits and dividend declared by the Bank during
the years from 1976-77 to 1985-86.
TABLE NO. 2.16
The table showing the position of profit and -
dividend declared by the Bank during period from 1976-77 to
1985-86.( 8s. in lakhs )
Year ended on 30th June.
Het profit
Ss
Dividend
Rs
Percentage of Net - Profit to working capital %
Percentage of Net profit to owned fund %
1977 0-81 0-13 2-40 19-90
1979 1-24 0-22 2—49 19-621982 3-43 0-35 3-16 25-52
1986 4-73 0-69 1-95 14-66
1•1•I•1•1•1•1• •— • — 1•»•1•1•1•
*i 1 i i i *j
SOURCE s- A) Compiled from Annual Reports of the Bank.
B) Percentage calculated*
97ir■
The table No. 2*16 clearly shows that the Net
profit of the Bank which was Rs.q-81 lakh at the end of
1977/ increased to Rs. i-24 lakh at the end of 1979, to
Rs. 3-43 lakhs at the end of 1983, to Rs.4-73 lakhs at
ena of 1986 •
The table No. 2*16 indicates that the dividend
dedleared by the Bank increased from Rs, 0-13 lakh in -
1976-77 to Rs. -022 lakh in 1978-79, to Rs. 0-35 lakh in
1981-82, to Rs. 0-69 lakh in 1985-86.
The table No. 2.16 also reveals that the percentage
of Net profit to working capital increased from 2-40% -
at teh end of 1977, to 2-49% at the end of 1979, to -
3-16% at the end of 1982, but the percentage of net profit
to working capital declined to 1-95% at the end of 1986.
The table No. 2.16 indicates that the percentage
of Net profit to owned fund decreased from 19-90% at the
end of 1977, to 19-62% at the end of 1979, but the percentage
of Net Profit to owned fund increased to 25-52% at the end
of 1982, but the same is declined to 14-66% at the end of
1986.
\
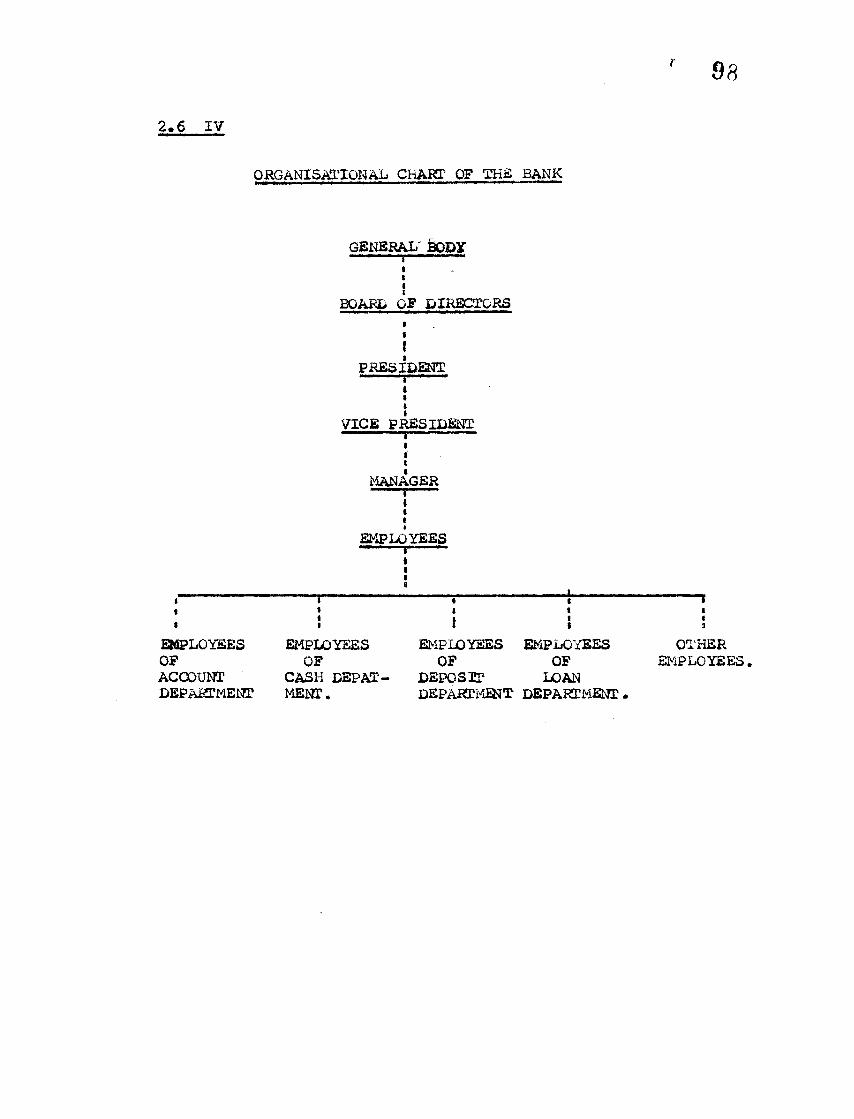
r 98
2,6 IV
ORGANISATIONAL CHART OF THE BANK
GENERAL BODY"" " " I... T
«tIf
BOARD OF DIRECTORS
II
EMPLOYEESOFACCOUNTDEPARTMENT
IPRESIDENT.... ...r'-—"
t»t
VICE PRESIDENT...y,,--- - - - - - - - - - - - - - - - - -
*IIMANAGER
1 1»Iit
EMPLOYEESi
<ii
x«ii
EMPLOYEESOF
CASH DEPAT- MENT.
EMPLOYEES EMPLOYEES OF OF
DEPOSIT LOANdepartment department
1I«3
OTHEREMPLOYEES.
I 9f)
* REg EREMCSS
1, C*3.Mamoria
& R.D. Saksena
2. B.S.Mathur.
3. R.B.I.
4, B.S.Mathus.
5, S.S.Sisodia.
Co-Operation in India *
Kitab Mahal
Allahabad, 1977
Page Mo. 359,
'Co-Operation in India *
Sahitya Bhavan
Agra, 1984
Page No. 262*
•Report of the Committee
on Urban Co-op.Banks'
1977, Page No. 11.
'Co-operation in India'
Sahitya Bhavan
Agra, 1984.
'Urban Co-Op. Banks in India'
Inter India Publication, 1986
Page No. 29.
6. S.M.Ghatpande. 'The Role of Nigerian
Co-op.Banks in Agricultural
finance *
A Co-operative Journal
Co-Op.Perspective *
Vol 17, No.4, Jan-March 83,
Page No.35.
100
7 • A booklet published by
'Anyonya Sahakari Mandali Co-op.
Bank Ltd., Baroda,
August 1986.
8. Platinum Jubilee Magazine
of the Shamrao Vithal Co-op.Bank
Ltd, Page No.7.
9. Abdul Kareem Khan ‘Role of Urban Co-op.Banks*
A Co-operative Journal
Urban Credit, New Delhi
Vol 3, No.2, June 1981
Page No.34,
10* R.3.I. ‘Report of the committee on
Urban Co.op.Banks*
1979, Page No. 26.
11. S.S.Sisodia ‘Role of Urban Co-Op.Bank'
Co-operation for Development
4th All India Conference of
Urban Co-0p.3anks & Credit
Societies, New Delhi on
25th Sc 26th Nov. 1986.
Page No.l.
101
12. Hajela T.N
13. G.M.Laud.
14. R.B.I.
15. R.B.I.
16. R.B.I.
17.
'Principles, Problems, &
practice of Co-operation1
Shivlal Agrawal, Agra 1973.
Page No.431.
"Seven Decades of innovative
Banking 1911-1981 *
Maharashtra state Co-op.Banic Ltd.,
Page No. 138.
Report of the committee on
Urban Co-Op.Banks'
1979, Page No. 26.
Report of the committee on
Urban Co-Op.Band's
1979, Page No. 27.
Report of the committee on
Urban Co-op .Bank* s
1979, Page No. 29.
Urban Co.Op.Banks &
Credit societies conference
Magazine
3rd All India Conference of
Urban Co-Op.Banks & Credit Societies
New Delhi, 1984, Page No.28.
Urban Co-Op. Banks &
Credit Societies conference Magazine
4th All India Conference of
Urban Co-Op.Banks & Credit
Societies# New Delhi# 1986
Page No.21.
Constitutional Documents of
the Gaahinglaj Municipality*
Roupya Mahostav Smurtigranth
of Shri Veershaiv Co-Op .Banks
Ltd. Kolhapur 1969*
Mannual for Urban Co-Op .Banks
Bombay - 1984.
Page No. 3.
Byelaws of the Bank
page No.5#
Byelaws of the Bank
Page No. 25.
Credit Information Review
No.79# of Feb. 1986
103r
25* R.B.I. Credit Information Review
No.79/ of Feb. 1986*
26* R*B*I* Credit Information Review
No.79# of Feb. 1986.