Operative Dentistry - Allen Press
108
march-april 2001•volume26 •number 2 • 113-216 (ISSN 0361-7734) Downloaded from http://meridian.allenpress.com/operative-dentistry/article-pdf/26/2/1/1819280/1559-2863-26-2-1.pdf by guest on 17 July 2022
-
Upload
khangminh22 -
Category
Documents
-
view
0 -
download
0
Transcript of Operative Dentistry - Allen Press

march-april 2001•volume26 •number 2 • 113-216
(ISSN 0361-7734)
Dow
nloaded from http://m
eridian.allenpress.com/operative-dentistry/article-pdf/26/2/1/1819280/1559-2863-26-2-1.pdf by guest on 17 July 2022

MARCH-APRIL 2001 • VOLUME 26
Aim and Scope
Operative Dentistry publishes articles that advance the practice of operative dentistry. The scope of the journal includes conservation and restoration of teeth; the scientific foundation of operative dental therapy; dental materials; dental education; and the social, political, and economic aspects of dental practice. Review papers, book reviews, letters, and classified ads for faculty positions are also published.
Operative Dentistry (ISSN 0361-7734) is published bimonthly for $60.00 per year in the USA (all other countries $70.00 per year) by Operative Dentistry, Indiana University School of Dentistry, Room S411, 1121 West Michigan Street, Indianapolis, IN 46202-5186. Periodicals postage paid at Indianapolis, IN, and additional mailing offices. Postmaster: Send address changes to: Operative Dentistry, Indiana University School of Dentistry, Room S411, 1121 West Michigan Street, Indianapolis, IN 46202-5186.
Subscriptions: Fax (317) 852-3162
Yearly subscription in USA is $60.00; all other countries, $70.00 (sent by air where appropriate); dental students (send verification of student status), $25.00 in USA; other countries, $34.00; single copy in USA, $14.00; other countries, $17.00. For back issue prices, write the journal office for quotations. Make remittances payable (in US dollars only) to Operative Dentistry and send to the above address. Credit card payment (Visa, MasterCard, or JCB-Japanese equivalent) is also accepted by providing card type, card number, expiration date, and name as it appears on the card.
Contributions
Contributors should study the instructions for their guidance printed in this journal and should follow them carefully.
Permission
For permission to reproduce material from Operative Dentistry please apply to Operative Dentistry at the above address.
The views expressed in Operative Dentistry do not necessarily represent those of the Academies or of the Editors.
Editorial Office
Operative Dentistry Indiana University School of Dentistry, Room S411 1121 West Michigan Street, Indianapolis, IN 46202-5186 Teleph one: (317) 278-4800, Fax: (317) 278-4900 URL: http://www.jopdent.org/
• NUMBER 2 • 113-216
Editorial Staff
Editor: Michael A Cochran Editorial Assistant/Subscription Manager: Joan Matis Editorial Associate: Karen E Wilczewski Associate Editors: Bruce A Matis, Edward J DeSchepper
and Richard B McCoy Managing Editor: Timothy J Carlson Assistant Managing Editors: Joel M Wagoner
and Ronald K Harris
Editorial Board Kinley K Adams Maxwell H Anderson Steven R Armstrong Tar-Chee Aw Wayne W Barkmeier Douglas M.Barnes Mark W Beatty K. Birgitta Brown Lawrence W Blank Murray R Bouschlicher William W Brackett William Browning John 0 Burgess Fred J Certosimo Daniel CN Chan David G Charlton Gordon J Christensen Kwok-hung Chung N Blaine Cook David Covey Gerald E Denehy Joseph B Dennison E Steven Duke Frederick C Eichmiller Sigfus T Eliasson Omar M El-Mowafy John W Farah Dennis J Fasbinder Mark Fitzgerald Kevin B Frazier Toh Chooi Gait James C Gold Valeria V Gordan William A Gregory Charles B Hermesch Harald 0 Heymann Van B Haywood Richard J Hoard Ronald C House Gordon K Jones Barry Katz Robert C Keene Edwina A M Kidd George T Knight Kelly R Kofford
Harold R Laswell MarkA Latta Xavier Lepe Walter Loesche Melvin R Lund Dorothy McComb Jonathan C Meiers Georg Meyer Ivar AMjor Michael P Molvar B Keith Moore Graham J Mount David F Murchison Jennifer Neo John W Osborne Michael W Parker Craig J Passon Tilly Peters Frank E Pink TR Pitt Ford Jeffrey A Platt L Virginia Powell James C Ragain John W Reinhardt Philip J Rinaudo Frank T Robertello Henry A St Germain, Jr David C Sarrett Gregory E Smith W Dan Sneed Ivan Stangel James M Strother James B Summitt Edward J Swift, Jr Peter T Triolo, Jr Karen Troendle Richard D Tucker Martin J Tyas Marcos Vargas Joel M Wagoner Charles W Wakefield Steve W Wallace Nairn HF Wilson PeterYaman Adrian U J Yap
©2000 Operative Dentistry, Inc. • Printed in USA
Dow
nloaded from http://m
eridian.allenpress.com/operative-dentistry/article-pdf/26/2/1/1819280/1559-2863-26-2-1.pdf by guest on 17 July 2022

©Operative Dentistry, 2001, 26, 113-114
Guest Editorial
Operative Dentistry—The Past,Present and Future
When the organized profession of Dentistry wasfirst established in the 19th century, the disci-pline of Operative Dentistry was considered to
be the entire clinical practice. As scientific informationincreased in the 20th century and the need for more com-plex patient treatment was recognized, separate disci-plines evolved from Operative Dentistry, such asEndodontics, Periodontics, Prosthodontics, OralPathology and Orthodontics and they continue to existtoday as specialties in dentistry. The scope of OperativeDentistry today involves the restoration of teeth toproper form, function and esthetics, while maintainingthe integrity of the adjacent soft and hard tissues of theoral cavity. This includes both direct and indirectrestorations, including full coronal coverage. The valueof Operative Dentistry to the profession of Dentistry isstill reinforced by the extensive amount of time this dis-cipline occupies in the overall clinical science curricu-lum of dental schools. In the last decade, surveys of thegeneral practice of dentistry indicate that at least 30%of clinical treatment time is spent providing OperativeDentistry procedures for their patients.
Significant advancements in Operative Dentistryhave been realized. Before the 20th century, gold foil fill-ing materials were the major restorative materialsused for Operative Dentistry procedures. Some of themajor developments in the last 100 years include thestandardization of dental amalgam alloy in the early1900s, the “lost-wax” gold casting procedure introducedin the early 1900s and scientifically refined in the1930s, the ability to create a micromechanical bond totooth structure by acid-etching procedures developed inthe 1950s and the development of a stable tooth-coloredmaterial (resin composite) in the 1960s. Dental amalgamalloy was further improved by the addition of increasedamounts of copper in the 1960s, and resin compositematerials have been further refined by the develop-ment of sub-micron sized filler particles. In the 1980s,the ability to etch and bond porcelain to tooth structureprovided another dimension to our restorative arma-mentarium. Today, Operative Dentistry proceduresroutinely include bonding to both enamel and dentin in
conjunction with resin composite, glass-ionomercement, fired feldspathic and cast/pressed ceramics andmetallic restorative materials. Manufacturers, in coop-eration with dental researchers and clinical practition-ers, have continually introduced new materials andclinical procedures for the restoration of teeth for thebenefit of the practicing restorative dentists and theirpatients.
Although the 21st century dentist can do incredibleprocedures for patients today with the restorativematerials available, it is critically important that wecontinue to investigate these products and furtherrefine our clinical skills. Often, materials are developedwithout the clinical research and proven clinical manip-ulative techniques that either refute or support theclinical success of these new materials. It is exciting tobe involved with the development of new materials butdisheartening if we are unable to meet the expectationsof our patients. Restorative dental materials will notperform adequately if they are placed incorrectly. Thisreality must be remembered in the discipline ofOperative Dentistry and other specialties as we contin-ually strive to meet the needs of our patients in an effi-cient and cost-effective manner while providing restora-tions with the best possible durability. Knowledge of thephysical, chemical and mechanical requirements forrestorations, as well as an intimate knowledge of therequirements of occlusion, go “hand-in-hand” with theproper clinical manipulation and selection of dentalmaterials. Development of the skills necessary to prac-tice restorative dentistry requires clinical practice will-ingness to be a “continual learner.” Education begins inearnest when a dentist graduates from dental school.
As we move ahead to the 21st century, it is imperativethat Operative Dentistry not only embraces the bestrestorative materials and techniques available, but thatwe also become experts in the management of dentalcaries. Since the 1950s the success of fluoridation inpreventing caries has demonstrated the dental profes-sion’s commitment to preventive dentistry, but unfortu-nately we have not yet completed the job. Dental cariesis still a significant disease for our patients, either man-
Dow
nloaded from http://m
eridian.allenpress.com/operative-dentistry/article-pdf/26/2/1/1819280/1559-2863-26-2-1.pdf by guest on 17 July 2022

ifesting as new caries or recurrent caries around defec-tive dental restorations. We know today that dentalcaries is a multifactorial disease dependent mainly on aspecific bacterial plaque composition and a diet ofrefined carbohydrates. It is not enough to tell ourpatients that they need to brush and floss their teethbetter to avoid dental caries. A customized caries man-agement program, which includes therapies such asproviding therapeutic exposures to accepted fluoridemodalities, prescribing antimicrobial rinses to reducespecific bacteria when appropriate and recommendingother preventive treatments designed to raise the bac-terial plaque pH to a level where remineralizationinstead of demineralization of tooth structure isfavored, should be provided to our patients. Finally andmost importantly, we need to work together with ourpatients to modify “caries-promoting” dietary habitswhich focus on reducing the intake of refined carbohy-drates. We will truly make progress in the discipline ofOperative Dentistry in controlling dental caries if weembrace the concept of caries management for ouridentified “caries-risk” patients, with the ultimate goalof preventing future restorative treatment.
One way that dentists can demonstrate a commit-ment to the pursuit of quality restorative dentistry andmore specifically to our discipline of OperativeDentistry is by challenging and completing the BoardCertification in Operative Dentistry program adminis-tered by the American Board of Operative Dentistry,Inc. (ABOD). The ABOD certification program is athree-part program involving written, clinical and oralexaminations. The ultimate goal of the certification pro-gram is to enhance the quality of Operative Dentistryin practice, education and research. Attaining certifi-cation status recognizes significant disciplined study aswell as excellence in clinical achievement. Since 1985our board-certified members now total 37. We also have16-founding members of the ABOD. Eighteen of our 50states are represented by our membership, and we alsohave three certified members from the country of
Thailand. As of October 2000, we have 23 board-eligiblecandidates at various stages of the certification pro-gram. I encourage you to join these dedicated individualsto begin the process of challenging our certification pro-gram and to actively contribute in helping us maintainthe high esteem of our Operative Dentistry disciplinewithin the profession of Dentistry!
Henry A St Germain, Jr, DMD, MSD, MEdPresident, American Board of Operative Dentistry
Associate Professor and ChairmanDepartment of Adult Restorative Dentistry
University of Nebraska Medical CenterCollege of Dentistry
114 Operative Dentistry
Commentary
It is a pleasure to feature this guest editorial from DrHenry St Germain, particularly in promoting the activ-ities of the American Board of Operative Dentistry. DrSt Germain received his DMD degree from TuftsUniversity in 1975, an MSD in Operative Dentistryfrom Indiana University in 1983 and an MEd fromGeorge Washington University in 1992. He completed adistinguished career in the US Navy Dental Corps in1995, finishing a tour as Chairman of OperativeDentistry at the Naval Postgraduate Dental School inBethesda, MD. He currently serves as Chairman ofAdult Restorative Dentistry at the University ofNebraska Medical Center College of Dentistry.
Dr St Germain was board-certified as the 22nd memberby the American Board of Operative Dentistry in 1990.He has actively supported this organization, serving asChairman of the Examination and CertificationCommittee from 1994-2000 and as the currentPresident of the ABOD (2000-2002). I would like to joinDr St Germain in strongly encouraging our Academymembership to consider the professional challengesand rewards of seeking certification by the AmericanBoard of Operative Dentistry.
Michael A CochranEditor
Henry A St Germain, Jr, DMD, MSD, MEd
Dow
nloaded from http://m
eridian.allenpress.com/operative-dentistry/article-pdf/26/2/1/1819280/1559-2863-26-2-1.pdf by guest on 17 July 2022

©Operative Dentistry, 2001, 26, 115-120
Clinical Research
SUMMARY
This study evaluates the one-year clinical per-formance of a polyacid-modified resin compositematerial, Dyract (DeTrey Dentsply, Konstanz,Germany), in Class III cavities.
Sixty-two Class III cavities in 30 patients wererestored with Dyract. Restorations were evalu-ated at baseline and one-year recall according tomodified Ryge criteria by two experienced, cali-brated examiners.
At one-year recall the rate of retention was98.4%. None of the restorations were clinicallyunacceptable in regard to color match, wear orloss of anatomical form, marginal discoloration,
caries, marginal adaptation and surface texture.After one year, color change and marginal dis-coloration in restorations were statistically sig-nificant (p=0.031) but did not require thereplacement of any of the restorations. At base-line, only one patient reported postoperativesensitivity and two months later, endodontictreatment was performed.
Dyract’s clinical performance in Class III cavi-ties at one year recall is promising but furtherlong-term clinical research on color change andmarginal discoloration is needed.
INTRODUCTION
Since the introduction of glass ionomer cements in1972, some developmental changes in the liquid andpowder components of the material have occurred.These changes were to obtain physical properties sim-ilar to amalgam and esthetic properties similar to com-posite resin. Recently, these changes have focused onthe liquid part of glass-ionomer cements (Hammesfahr,1994). By using different chemical approaches, such ascombining methacrylate technology with glass
Clinical Evaluation of aPolyacid-Modified Resin
Composite in Class III Cavities:One Year Results
M Demirci • M Üçok
Clinical Relevance
Dyract’s clinical performance in Class III cavities at one year recall is promising.
The University of Istanbul, Faculty of Dentistry,Department of Conservative Dentistry, ÇAPA,ISTANBUL-TURKEY, 34390
Mustafa Demirci, DMD, doctor of conservative den-tistry
Mete Üçok, DMD, professor
Dow
nloaded from http://m
eridian.allenpress.com/operative-dentistry/article-pdf/26/2/1/1819280/1559-2863-26-2-1.pdf by guest on 17 July 2022

116 Operative Dentistry
ionomer chemistry, a new group of materials wereintroduced as hybrid materials (Hammesfahr, 1994).Chemically, hybrid materials are between glassionomer cements and composite resins (Burgess,Norling & Summit, 1994). The new materials aregrouped into two categories: resin-modified glassionomer cements and polyacid-modified resin compos-ites (Gladys & others, 1997; Hammesfahr, 1994;McLean, Nicholson & Wilson, 1994).
Polyacid-modified resin composites are also known ascompomers. This term refers to a derivative of glass-ionomer cements and composite resins (Berg, 1998;García-Godoy, 2000). Although compomers are similarto resin-based composites in their chemical structure,differences include reactive, ion-leachable glass parti-cles and polymerizable monomers. Compomers containno water in their formulation and are one-componentmaterials, which do not need mixing, in contrast toglass ionomer and resin-modified glass-ionomercements. An acid-base reaction does not occur duringthe setting process of compomers, as in the typical set-ting of glass-ionomer cements (García-Godoy, 2000).Dyract, found in this group, is a single component mate-rial. The resin matrix in Dyract is TCB, the reactionproduct of butanetetracarboxylic acid and 2-hydrox-yethyl methacrylate. This material contains two acidic,carboxylate groups and two polymerizable methacry-late groups within the same molecule. The filler is areactive silicate glass (72%) containing fluoride.Following the light-curing phase, an acid-base reactionoccurs only after the restoration is placed and water isabsorbed from saliva into the surface. In the presence ofwater from the tooth and oral environment, the activecarboxylate group on the TCB, which is now part of thepolymerized material, can react with glass to initiate anacid-base reaction. As a result of this reaction, fluoridecan be released (Berg, 1998; Hammesfahr, 1994; Tyas,1998), but the amount of total fluoride released is sig-nificantly less than that released by glass ionomer orresin-modified glass-ionomer cements (Rothwell,Anstice & Pearson, 1998; Shaw, Carrick & McCabe,1998; Yip & Smales, 2000; Yip, Lam & Smales, 1999).
The bonding of Dyract to tooth structure is achievedby means of Primer/Adhesive (Tyas, 1998). This systemuses an acetone solvent with PENTA (dipentaerythri-tolpentacrylate phosphoric acid ester) as the primaryadhesion promoter (Barkmeier, Hammesfahr & Latta,1999). The multi-step application of dentin bondingagents for composites has been seen by the practitioneras a clinical inconvenience. Although Dyract is similarto composite resins, its PSA Primer/Adhesive is a self-etching system (Berg, 1998). It replaces the conditioner,primer and adhesive resin, thus providing great ease ofapplication (Roeters & others, 1998).
In primary molar restorations, it was reported thatDyract provided satisfactory results and low failure
rates after three years (Marks & others, 1999; Roeters& others, 1998). In another study, this material showedsignificant color change and was far less satisfactory inesthetic performance than conventional resin compos-ites after 18 months (Gladys & others, 1999). However,other studies have reported low levels of failure in ClassIII cavities after three and five years (van Dijken, 1996;van Dijken 1999).
This paper evaluated the clinical performance ofDyract restorations in Class III cavities at baseline andat one-year recall in regard to color match, wear or lossof anatomical form, marginal discoloration, caries, mar-ginal adaptation and surface texture.
METHODS AND MATERIALS
This clinical study was performed at the Departmentof Conservative Dentistry, Istanbul University. Sixty-two Class III carious lesions in 30 patients were selected.The average age of patients was 29.9 years (range 13-78 years). All cavities were prepared and restorationsplaced by the same operator. Cavity preparation waslimited to the removal of caries. The incisal margins ofthe cavities were cervical to the incisal edge of theteeth and the cervical margins were at/or incisal to thecemento-enamel junction. After the cavities were pre-pared, the manufacturer’s instructions were closelyadhered to regarding cavity treatment and placementof the restorative material. Isolation was achieved withcotton rolls and saliva ejectors. After air drying the cav-ities, the PSA Primer/Adhesive was applied in twocoats. The first coat was left on for 30 seconds, gentlyair dried and cured for 10 seconds. The second coat wasimmediately placed, air dried and cured for 10 seconds.Color matching was done with a Vita shade guide (VitaZahnfabrik, Bad Sackingen, Germany) and the materi-al, delivered in compules, was injected into the cavi-ties. In deep cavities the first material layer wasapplied on the pulpal walls and light cured for 40 sec-onds. Then a second layer was applied and light curedfor an additional 40 seconds. In shallow cavities, thematerial was placed in a single increment and lightcured for 40 seconds from both the buccal and palatalsides. The intensity of the curing light (XL3000, 3MDental Products, St Paul, MN, USA) was measuredbefore and after application and the light output wasnever below 450 Mw/cm2. Following the removal ofexcess material with fine diamond burs and strips, therestorations were finished and polished with Sof-Lexabrasive disks (3M Dental Products, St Paul, MN,USA).
The restorations were evaluated by two experienced,calibrated examiners according to the modified Rygecriteria (Ryge, 1980) (Table 1). At baseline and one yearrecall, color match, wear or loss of anatomical form,marginal discoloration, caries, marginal adaptationand surface texture were evaluated.
Dow
nloaded from http://m
eridian.allenpress.com/operative-dentistry/article-pdf/26/2/1/1819280/1559-2863-26-2-1.pdf by guest on 17 July 2022

According to the modified Ryge criteria, Alpha (A)indicates the clinically ideal situation, Bravo (B) indi-cates a clinically acceptable situation, Charlie (C) is aclinically unacceptable situation where the replace-ment of the restoration is required and Delta (D) indi-cates a situation where the restoration is unacceptabledue to fracture, mobility or loss and has to be replaced.Conflict in scoring was resolved with consensus. Datawere analyzed statistically using the McNemar test.
RESULTS
Sixty-two Class III restorations in 30 patients wereevaluated at baseline. At one-year recall, 61 restora-
tions were evaluated and the rate of retention was98.4%. Direct clinical evaluation rates are shown inTable 2. None of the restorations were clinically unac-ceptable in regard to color match, wear or loss ofanatomical form, marginal discoloration, caries, mar-ginal adaptation or surface texture. However, after oneyear, color change and marginal discoloration inrestorations were statistically significant (p=0.031)(Table 2), but the changes were to Bravo values and didnot require the replacement of any of the restorations.
At baseline, only one patient reported a moderate sen-sitivity which resolved within one week. The sensitivitywas thought to be from the depth of the cavity. Two
117Demirci & Uçok: Clinical Evaluation of a Polyacid-Modified Resin Composite in Class III Cavities
Rating Aspect Method
Color MatchAlpha (A) There is no a mismatch in color, shade and/or translucency between the restoration and the Visual inspection
adjacent tooth structure.
Bravo (B) There is a mismatch in color, shade and/or translucency between the restoration and the Visual inspectionadjacent tooth structure, but the mismatch is within the normal range of tooth color, shade and/or tranclucency.
Charlie (C) The mismatch is between restoration and adjacent tooth structure outside the normal range Visual inspectionof tooth color,shade and/or translucency.
Cavosurface Marginal Discoloration
Alpha (A) There is no discoloration anywhere on the margin between the restoration and the tooth structure. Visual inspection
Bravo (B) There is discoloration anywhere on the margin between the restoration and the tooth structure, but Visual inspectionthe discoloration has not penetrated along the margin of the restorative material in a pulpal direction.
Charlie (C) The discoloration has penetrated along the margin of the restorative material in a pulpal direction. Visual inspection
Wear/Anatomic Form
Alpha (A) The restoration is not under-contoured,that is, the restorative material is not discontinuous with Visual inspectionexisting anatomic form. and explorer
Bravo (B) The restoration is under-contoured, that is, the restorative material is discontinuous with Visual inspectionexisting anatomic form, but sufficient restorative material is not missing so as to expose the and explorerdentin or base.
Charlie (C) Sufficient restorative material is missing so as to expose the dentin or base. Visual inspection
Caries
Alpha (A) There is no evidence of caries contiguous with the margin of the restoration. Visual inspection
Bravo (B) There is evidence of caries contiguous with the margin of the restoration. Visual inspection
Marginal Adaptation
Alpha (A) There is no visible evidence of a crevice along the margin into which the explorer will penetrate. Visual inspectionand explorer
Bravo (B) There is visible evidence of a crevice along the margin into which the explorer will penetrate. Visual inspectionThe dentin or base is not exposed. and explorer
Charlie (C) There is visible evidence of a crevice along the margin into which the explorer will penetrate. Visual inspectionThe dentin or base is exposed. and explorer
Delta (D) The restoration is fractured or missing in part or in toto. Visual inspectionand explorer
Surface Texture
Alpha (A) Surface of restoration is smooth. Explorer
Bravo (B) Surface of restoration is slightly rough or pitted, can be refinished. Explorer
Charlie (C) Surface deeply pitted, irregular grooves (not related to anatomy), cannot be refinished. Explorer
Delta (D) Surface is fractured or flaking. Explorer
Table 1: Direct Clinical Evaluation Criteria (Modified Ryge Criteria)
Dow
nloaded from http://m
eridian.allenpress.com/operative-dentistry/article-pdf/26/2/1/1819280/1559-2863-26-2-1.pdf by guest on 17 July 2022

118 Operative Dentistry
months later, the patient returned with an acute apicalabscess. Endodontic treatment was performed and therestoration replaced. At baseline and one-year recall, noother cases of sensitivity were reported.
DISCUSSIONAt one year recall, the retention was 98.4%. Theauthors found the results of Dyract’s one-year retentionrate to be consistent with the rates reported by others:>97% (van Dijken, 1996) and 100% (Prati & others,1998). Such a retention rate is remarkably high, giventhat Dyract’s adhesive agent (PSA Prime/Adhesive) isan acid primer and HEMA-like resin monomer (Ferrari& others, 1998) which contains acetone. Acetone wetsthe enamel surface, penetrates the dentin, and by dif-fusing into the dentinal tubules, forms a layer of inter-diffusion between the surface treated dentin and theadhesive system (Abate & others, 1997; DentsplyDeTrey-DeDent, 1994; Ferrari & others, 1998).Furthermore, the authors also claim that thehydrophilic phosphate groups in the PENTA molecule,which is in the formulation of PSA Primer/Adhesive,reacts with the tooth surface and forms an ionic bondwith the calcium ions of the hydroxyapatite (Abate &others, 1997; Çehreli & Altay, 2000; Dentsply DeTrey-DeDent, 1994; Toledano & others, 1999; Tyas, 1998;Yap, Lim & Neo, 1995). In addition to the ionic bondingof the material to the tooth structure, macromechanicalretention obtained from the cavity preparation mightbe a factor contributing to this high retention rate.
At baseline, 95.2% of the restorations had ideal colormatch (Alpha) and only 4.8% had clinically acceptablecolor match (Bravo). At one-year recall the rates wereas follows: ideal color match–85.2%; clinically accept-able color match–14.8%. While at the end of one yearthe tendency ranged from ideal color match group tothe clinically acceptable color match group with a 10%increase in the latter, all values were observed to still bewithin the clinically acceptable color match range.These results are consistent with those of van Dijken(1995). van Dijken (1996) reported that the hybridmaterials’ high content of hydrophilic monomer causes
a high rate of water sorption, which results in a colorchange. This assumption might explain the colorchange found in this study. However, Gladys & others(1999) demonstrated that the color changes of Dyractoccurred in the first six months and were less pro-nounced in the following 12 months of their study. Colorchanges were observed to range from “excellent colormatch” to “slight color mismatch” by the end of the first12 months. Compared with their observations, the colorchanges ranged from “ideal color match (Alpha)” to“clinically acceptable color match (Bravo)” and weremore pronounced. This difference might be due to the dif-ferent cavity types selected in the two studies. Roeters& others (1998), in contrast to these results, observedan improvement in the color match of Dyract in pri-mary Class I and Class II restorations after one year.However, after three years they reported a pronouncedcolor change from “ideal color match (Alpha)” towards“clinically acceptable color match (Bravo).” The extentof color change over time remains in question and fur-ther evaluation with long-term clinical studies is needed.
At one-year recall, marginal discoloration wasobserved only in 9.8% of the restorations and was onlylocated on an unspecific point on the enamel surroundingthe restoration and did not progress towards the pulp.This was a clinically acceptable situation.
At baseline, 96.7% of the restorations had ideal mar-ginal adaptation (Alpha). Only 3.3% of the restorationshad a crevice along the margins (Bravo). At one yearrecall 91.8% of restorations had clinically ideal marginaladaptation (Alpha) and 8.2% of the restorations had acrevice (Bravo). But in the restorations with a crevice,neither dentin nor base was exposed, and this was aclinically acceptable situation.
Marginal alterations and marginal discoloration werefrequently observed in the same cases after one year.Marginal discoloration was related to a crevice at Bravoalong the margins in 66.7% of the cases. Furthermore,a crevice was found in 80% of the cases wheremarginal discoloration at Bravo was present at theone-year recall.
Color Match Marginal Wear/Anatomic Caries Marginal Adaptation Surface TextureDiscoloration Form
A B C A B C A B C A B A B C D A B C D
Baseline 95.2 4.8 0 100 0 0 100 100 0 100 0 96.7 3.3 0 0 100 0 0 0n=62
1 year 85.2 14.8 0 90.2 9.8 0 91.8 8.2 0 100 0 91.8 8.2 0 0 95.1 4.9 0 0n=61
p p=0.031 (S) p=0.031 (S) p=0.063 (NS) p=0.250 (NS) p=0.250 (NS)
S=significant (p<0.05)
NS=not significant
Table 2: Results of Clinical Evaluation of Dyract Restorations (Observation are in %). O: Oscar, A: Alpha, B: Bravo, C: Charlie, D: Delta
Dow
nloaded from http://m
eridian.allenpress.com/operative-dentistry/article-pdf/26/2/1/1819280/1559-2863-26-2-1.pdf by guest on 17 July 2022

119Demirci & Uçok: Clinical Evaluation of a Polyacid-Modified Resin Composite in Class III Cavities
The manufacturer claimed that Dyract’s bondstrength to dentin (14.5 MPa) is higher than its bondstrength to enamel (9.6 MPa) (Dentsply DeTrey-DeDent, 1994). Tyas reported (1998) that this differencein bonding strengths may be the factor which causesdiscoloration at the enamel level. The manufacturerdoes not recommend the application of the material onacid treated surfaces. However, many researchersthought that since Dyract is a composite-like material,its bonding strength to etched enamel should be higher(Cortes & others, 1993; Desai & Tyas, 1996; Tyas, 1998).When tooth surface is acid etched, the bonding strengthis found to be approximately three times higher thanthat of unetched surfaces (Cortes, García-Godoy & Boj,1993; Cortes & others, 1998; Desai & Tyas, 1996). Whenacid is applied, El-Kalla and García-Godoy (2000)reported the formation of a hybrid layer between thematerial and enamel into which resin tags penetrateand showed that an improved adaptation was achieved.Some microleakage studies also showed an improvedmarginal seal when enamel etching is performed(Brackett & others, 1998; Owens, Halter & Brown,1998). Çehreli and Altay (2000) have proposed usingDyract with acid etching procedures on enamel to pre-vent marginal discoloration. However, although vanDijken (1995) has not performed acid etching in enam-el, he has found marginal discoloration in only 3.6% ofthe restorations after six months. This study agreeswith his results; the authors also observed marginal dis-coloration at the enamel level in only 9.8% of therestorations at one-year recall, which showed that theclinical performance of the material was satisfactory.
At one-year recall, 91.8% of the restorations were clin-ically ideal (Alpha) in regard to wear and loss of anatom-ical form, while only 8.2% had a rating of Bravo. That is,they were still clinically acceptable. Wear was limited tothe restorative material and did not extend to the soundtooth structure.
At one-year recall secondary caries was not detected.In regard to surface texture, 4.9% of the restorationswere slightly pitted and had rough surfaces (Bravo)which could be restored by repolishing.
At baseline and one-year recall, only one case of sensi-tivity was reported. This patient complained of a mod-erate level of sensitivity, which was resolved in a week.Two months later the patient returned with an acuteapical abscess. Endodontic treatment was performedand the restoration was replaced. The reason for thefailure was thought to be the non-healing pulpalresponse to the cavity preparation and the materialapplication.
CONCLUSIONS
1.At baseline only one patient reported postoperativesensitivity and two months later endodontic treat-ment had to be performed.
2.After one year, the rate of retention was 98.4% andall the restorations were clinically acceptable (Alphaand Bravo) in regard to color match, wear or loss ofanatomical form, marginal discoloration, caries,marginal adaptation and surface texture.
3.After one year, color change and marginal discol-oration in restorations were statistically significant(p=0.031). However, the values were at Bravo anddid not require the replacement of any of the restora-tions.
4.Dyract’s clinical performance in Class III cavities atone-year recall was found to be promising but fur-ther long-term clinical researches on color changeand marginal discoloration are needed.
(Received 7 November 2000)
References
Abate PF, Bertacchini SM, Polack MA & Macchi RL (1997)Adhesion of a compomer to dental structures QuintessenceInternational 28(8) 509-512.
Barkmeier WW, Hammesfahr PD & Latta MA (1999) Bondstrength of composite to enamel and dentin using Prime &Bond 2.1 Operative Dentistry 24(1) 51-56.
Berg JH (1998) The continuum of restorative materials in pedi-atric dentistry—a review for the clinician Pediatric Dentistry20(2) 93-100.
Brackett WW, Gunnin TD, Gilpatrick RO & Browning WD(1998) Microleakage of Class V compomer and light-curedglass ionomer restorations Journal of Prosthetetic Dentistry79(3) 261-263.
Burgess J, Norling B & Summit J (1994) Resin ionomer restora-tive materials: The new generation Journal of EstheteticDentistry 6(5) 207-215.
Çehreli ZC & Altay N (2000) Three-year clinical evaluation of apolyacid-modified resin composite in minimally-invasiveocclusal cavities Journal of Dentistry 28(2) 117-122.
Cortes O, García-Godoy F & Boj JR (1993) Bond strength ofresin-reinforced glass ionomer cements after enamel etchingAmerican Journal of Dentistry 6(6) 299-301.
Cortes O, García C, Perez L & Bravo LA (1998) A comparison ofthe bond strength to enamel and dentin of two compomers: Anin vitro study ASDC Journal of Dentistry for Children 65(1)29-31.
Desai M & Tyas MJ (1996) Adhesion to enamel of light-curedpoly-acid dental materials Australian Dental Journal 41(6)393-397.
Dentsply Detrey-Dedent (1994) Dyract product informationVersion III GB 7/94.
El-Kalla IH & García-Godoy F (2000) Compomers adaptation toClass I and V cavities in permanent teeth Journal of Dentistryfor Children 67(1) 29-36.
Dow
nloaded from http://m
eridian.allenpress.com/operative-dentistry/article-pdf/26/2/1/1819280/1559-2863-26-2-1.pdf by guest on 17 July 2022

120 Operative Dentistry
Ferrari M, Vichi A, Mannocci F & Davidson CL (1998) Sealingability of two ‘‘compomers’’ applied with and without phos-phoric acid treatment for Class V restorations in vivo Journalof Prosthetic Dentistry 79(2) 131-135.
García-Godoy F (2000) Resin-based composites and compomersin primary molars Dental Clinics of North America 44(3) 541-570.
Gladys S, Van Meerbeek B, Lambrechts P & Vanherle G (1999)Evaluation of esthetic parameters of resin-modified glass-ionomer materials and a polyacid-modified resin composite inClass V cervical lesions Quintessence International 30(9) 607-614.
Gladys S, Van Meerbeek B, Braem M, Lambrechts P & VanherleG (1997) Comparative physico-mechanical characterization ofnew hybrid restorative materials with conventional glass-ionomer and resin composite restorative materials Journal ofDental Research 76(4) 883-894.
Glass Ionomer-Resin (1993) state of art: CRA Newsletter 17 1-2.
Hammesfahr PD (1994) Development in resionomer systems In:Hunt PR, (Ed) Glass Ionomers: The next generation.Proceeding of the 2nd International Symposium on GlassIonomers, Pennsylvania: International Symposia in Dentistry,PC, pp 47-56.
Marks LAM, Weerheijm KL, Van Amerongen WE, Groen HJ &Martens LC (1999) Dyract versus Tytin Class II restorationsin primary molars: 36 months evaluation Caries Research33(5) 387-392.
McLean JW, Nicholson JW & Wilson AD (1994) Proposednomenclature for glass ionomer dental cements and relatedmaterials Quintessence International 25(9) 587-589.
Mitra S (1994) Curing reactions of glass-ionomer materials In:Hunt PR, (Ed) Glass Ionomers: The next generation.Proceeding of the 2nd International Symposium on GlassIonomers, Pennsylvania: International Symposia in Dentistry,PC, pp 13-22.
Owens BM, Haltr TK & Brown DM (1998) Microleakage oftooth-colored restorations with a beveled gingival marginQuintessence International 29(6) 356-361.
Prati C, Chersoni S, Cretti L & Montanari G (1998) Retentionand marginal adaptation of a compomer placed in non-stress-bearing areas used with the total-etch technique: A 3-year ret-rospective study Clinical Oral Investigation 21(4) 68-73.
Roeters JJ, Frankenmolen F, Burgersdijk RCW & Peters TC(1998) Clinical evaluation of Dyract in primary molars: 3-yearresults American Journal of Dentistry 11(3) 143-148.
Rothwell M, Anstice HM & Pearson GJ (1998) The uptake andrelease of fluoride by ion-leaching cements after exposure totoothpaste Journal of Dentistry 26(7) 591-597.
Ryge G (1980) Clinical criteria International Dental Journal30(4) 347-358.
Shaw AJ, Carrick T & McCabe JF (1998) Fluoride release fromglass-ionomer and compomer restorative materials: 6-monthdata Journal of Dentistry 26(4) 355-359.
Sidhu SK & Watson TF (1995) Resin-modified glass ionomermaterials A status report for the American Journal ofDentistry American Journal of Dentistry 8(1) 59-67.
Toledano M, Osorio E, Osorio R & García-Godoy F (1999)Microleakage of Class V resin-modified glass ionomer andcompomer restorations Journal of Prosthetic Dentistry 81(5)610-615.
Tyas MJ (1998) Clinical evaluation of a polyacid-modified resincomposite (compomer) Operative Dentistry 23(2) 77-80.
van Dijken JWV (1995) Clinical investigation of Dyract in ClassIII cavities at the University of Umea, 2-year resultsSummary by Dentsply Dentsply De Trey Publication.
van Dijken JW (1996) 3-year clinical evaluation of a compomer,a resin-modified glass ionomer and a resin composite in ClassIII restorations American Journal of Dentistry 9(5) 195-198.
van Dijken JWV (1999) Longevity of new hybrid restorativematerials in Class III cavities European Journal of OralScience 107(3) 215-219.
Wilson AD (1990) Resin-modified glass-ionomer cementsInternational Journal of Prosthodontics 3(5) 425-429.
Yap AU, Lim CC & Neo JC (1995) Marginal sealing ability ofthree cervical restorative systems Quintessence International26(11) 817-820.
Yip H-K & Smales RJ (2000) Fluoride release from a poly-acid–modified resin composite and 3 resin-modified glass-ionomer materials Quintessence International 31 261-266.
Yip HK, Lam WT & Smales RJ (1999) Fluoride release, weightloss and erosive wear of modern aesthetic restoratives BritishDental Journal 187(5) 265-270.
Dow
nloaded from http://m
eridian.allenpress.com/operative-dentistry/article-pdf/26/2/1/1819280/1559-2863-26-2-1.pdf by guest on 17 July 2022

©Operative Dentistry, 2001, 26, 121-126
Laboratory Research
SUMMARY
This study evaluated the microleakage perform-ance of a new generation of composites known as“packable” composites within a high C-factorpreparation. Class V cavity preparations withocclusal margins in enamel and gingival marginsin dentin were prepared on extracted humanmolar teeth. Prepared teeth were randomly dis-tributed into four treatment groups (n=18) con-sisting of three “packable” composites—Alert,Solitaire, and SureFil—and a traditional anterior/posterior small particle hybrid composite Z-100.Prime & Bond NT bonding agent was used witheach composite. Samples were stored in tapwater for 24 hours, thermocycled, stained withdye, sectioned into halves and scored formicroleakage. All test groups showed a signifi-cant increase in both linear and penetrating
dentinal microleakage when compared to enamelmicroleakage. Z-100 had significantly lessdentinal marginal microleakage than SureFil.There was no significant difference in the enamelmicroleakage values between groups. However,the “packable” composites exhibited significantlyhigher percentages of enamel crazing adjacent tothe cavity walls when compared to Z-100. Theenamel crazing within the “packable” compositegroups warrants further investigation to deter-mine if this is a characteristic related to the com-position of this class of composites, the mode oflight curing used in this study or the result of thecavity/marginal design.
INTRODUCTIONDental amalgam has been widely used as the primaryrestorative material in posterior teeth for more than100 years. However, the use of composite resins torestore posterior teeth has expanded in recent yearsdue not only to the increased demand for esthetics, butalso concern over mercury toxicity in amalgam restora-tions. Despite many improvements in the properties ofcomposites, a number of problems still exist related totheir clinical use. These include postoperative sensitiv-ity, technique-sensitivity and microleakage (Eick &Welch, 1986; Browne & Tobias, 1986; Prati, 1989;Rykke, 1992). In the past, composites traditionally pos-sessed poor wear resistance (Leinfelder & others,1980). However, more recent clinical studies suggest
Microleakage of PackableComposite Resins
JC Meiers • R Kazemi •CD Meier
Clinical Relevance
Packable composite resins, when placed in bulk, demonstrated significantly moreenamel crazing in butt joint cavity preparations when compared to a conventionalanterior/posterior hybrid composite resin.
University of Connecticut School of DentalMedicine, Department of Prosthodontics andOperative Dentistry, 263 Farmington Ave,Farmington, CT 06030-1615
Jonathan C Meiers, DMD, MS, associate professor,division head for Operative Dentistry
Reza Kazemi, DMD, assistant professor
C Dean Meier, BSc DMD, pediatric dentistry resident
Dow
nloaded from http://m
eridian.allenpress.com/operative-dentistry/article-pdf/26/2/1/1819280/1559-2863-26-2-1.pdf by guest on 17 July 2022

122 Operative Dentistry
that the wear rates of numerous posterior compositesmay approach those of amalgam (Johnson & others,1992; Willems & others, 1993; Taylor & others, 1994)and the ADA Council on Scientific Affairs has recentlysupported their use in initial and moderate size Class Iand II restorations (Association Report, 1998).
Although considerable research has led to improvedcomposite resins, their clinical handling characteristicscontinue to discourage and challenge many clinicianswhen placing composite restorations in posterior teeth.Most traditional composites are sticky and will not holdtheir shape, which leads to difficulty in manipulation,making it difficult to establish proper proximal contourand contact in Class II cavity preparations (Williams,1996). Recently, a new generation of composites hasbeen introduced to the market with new filler designsthat permit them to be packed with more force into cavitypreparations. This allows for a more consistent achieve-ment of proximal contacts. Manufacturers of these newmaterials have classified them “condensable” or “pack-able” posterior composites. These composite formula-tions are designed to hold their shape and not slump onplacement. The difference in the plasticity of the “con-densable/packable” posterior composites may makeclose contact and adaptation to the dentin bondingagent and walls of the cavity preparation more difficultand less consistent when compared to the current, moreplastic anterior/posterior composite resin restorativematerials. This may present a greater challenge to pre-venting microleakage with these types of materials.
This study investigated and compared the micro-leakage within a high C-factor cavity preparation ofthree “packable” composite resins, Alert, Solitaire andSureFil and a conventional anterior/posterior compositeresin Z-100.
METHODS AND MATERIALS
Thirty-six non-carious extracted teeth stored in deion-ized water containing 0.2% sodium azide bactericidalagent were selected for this study. For teeth to be selected,they had to be examined to ensure the absence of anyenamel crazing or cracks using a binocular microscopeat 20X magnification (Olympus Co, Lake Success, NY12422). Residual tissue tags were removed from theteeth and were thoroughly rinsed under running tap
water for 15 minutes to remove the sodium azide solu-tion. Class V cavity preparations were made on the buccaland lingual surfaces of each tooth using a high-speedhandpiece and a #330 bur (Brassler, USA, Savannah,GA 31419). Oblong preparations, measuring approxi-mately 2 x 6 x 1.5 mm, were made parallel to thecementoenamel junction (CEJ), with the gingival half ofthe preparations extending 0.5mm apical to the CEJ.Cavosurface walls were finished to a butt joint. Thebuccal and lingual surfaces of the teeth being studiedwere randomly assigned a number from 1 to 72. Thetreatment scheme for each surface was determinedusing a random number generation.
Three “packable” composites and one conventionalanterior/posterior composite (Table 1) were investigated,with 18 preparations included in each group. Thepreparations were restored as follows:
The entire preparation was etched with 37% phos-phoric acid. The enamel was etched for 20 seconds withthe dentin etched for 15 seconds. The gel etch wasrinsed thoroughly for 15 seconds, and dried to removeexcess water, leaving the dentin visibly moist. Prime &Bond NT (Caulk/Dentsply, Milford, DE 19963) was thenapplied to the preparation for 20 seconds using a dis-posable brush tip. Excess solvent was removed withmild air flow, then light cured with a visible light unitthat produced 600 mW/cm2 (Caulk/Dentsply, Milford,DE 19963) of light output for 20 seconds. The visiblelight-curing unit was checked for light output by usinga radiometer (Demetron Research Corp, Danbury, CT06810) before each curing session. If the dentin did notappear shiny, then Prime & Bond NT was reapplied tothe dentin, gently dried and light cured again for 20 sec-onds. Either Solitaire (Heraeus Kulzer, Inc, SouthBend, IN 46614), Alert (Jeneric/Pentron Inc,Wallingford, CT 06492), SureFil (Caulk/Dentsply,Milford, DE 19963) or Z-100 (3M Corp, St Paul, MN55144) composite was then condensed in bulk into thepreparation and light cured for 60 seconds following therandomized treatment sequence.
All restorations were finished flush to the marginsusing Sof-lex (3M Corp, St Paul, MN 55144) disks withinfive minutes after light curing. The restorations werestored in room temperature water for 24 hours, thenthermocycled for 1,000 cycles between 5°C and 55°C
Product Filler Average Filler Particle Linear Polymerization Volumetric Polymerization Flexural ModulusVolume % Size µm Shrinkage % Shrinkage % MPa
Alert 70 0.7 with Filamentous 0.8 2.3 15,840glass 20-50 µm in length
Solitaire 66 2-20 1.2 3.5 3,960
SureFil 60 0.8 0.8 2.2 11,440
Z-100 66 0.6 1.0 2.8 14,362
Table 1: Compositional Values, Physical and Mechanical Properties*
Data obtained from Manufacturer’s Data Files and Dental Advisor, Vol 15, No 7, 1998
Dow
nloaded from http://m
eridian.allenpress.com/operative-dentistry/article-pdf/26/2/1/1819280/1559-2863-26-2-1.pdf by guest on 17 July 2022
123
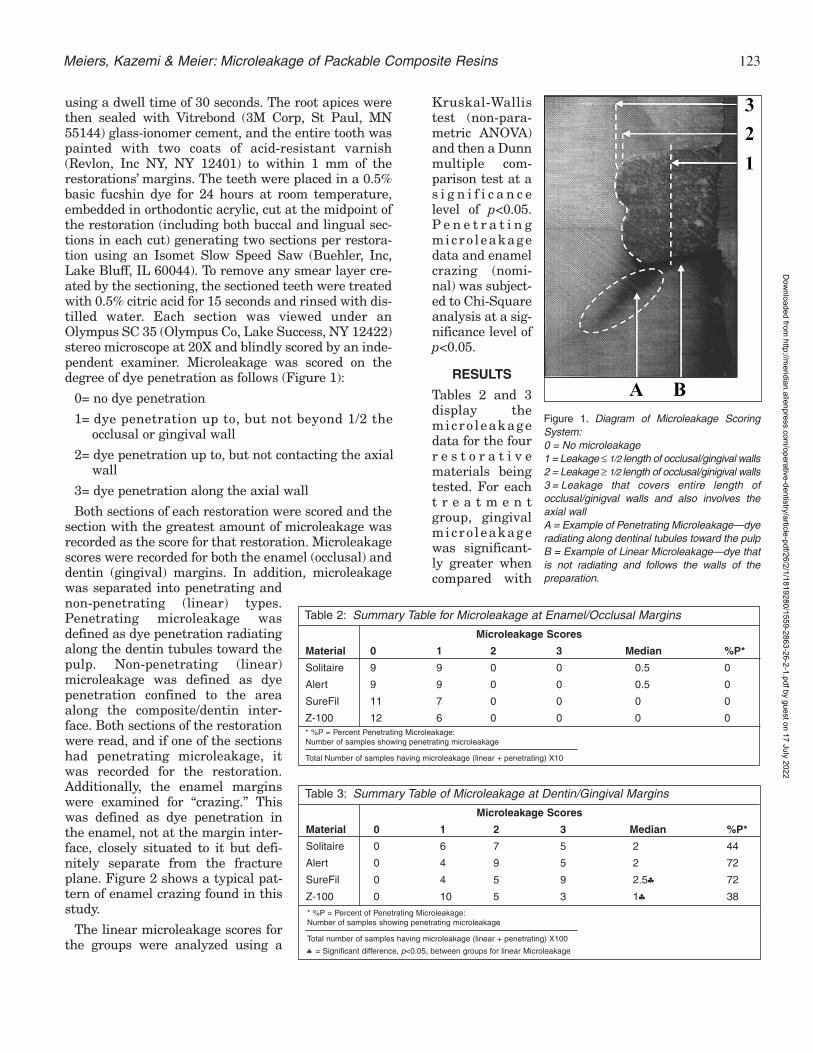
using a dwell time of 30 seconds. The root apices werethen sealed with Vitrebond (3M Corp, St Paul, MN55144) glass-ionomer cement, and the entire tooth waspainted with two coats of acid-resistant varnish(Revlon, Inc NY, NY 12401) to within 1 mm of therestorations’ margins. The teeth were placed in a 0.5%basic fucshin dye for 24 hours at room temperature,embedded in orthodontic acrylic, cut at the midpoint ofthe restoration (including both buccal and lingual sec-tions in each cut) generating two sections per restora-tion using an Isomet Slow Speed Saw (Buehler, Inc,Lake Bluff, IL 60044). To remove any smear layer cre-ated by the sectioning, the sectioned teeth were treatedwith 0.5% citric acid for 15 seconds and rinsed with dis-tilled water. Each section was viewed under anOlympus SC 35 (Olympus Co, Lake Success, NY 12422)stereo microscope at 20X and blindly scored by an inde-pendent examiner. Microleakage was scored on thedegree of dye penetration as follows (Figure 1):
0= no dye penetration
1= dye penetration up to, but not beyond 1/2 theocclusal or gingival wall
2= dye penetration up to, but not contacting the axial wall
3= dye penetration along the axial wall
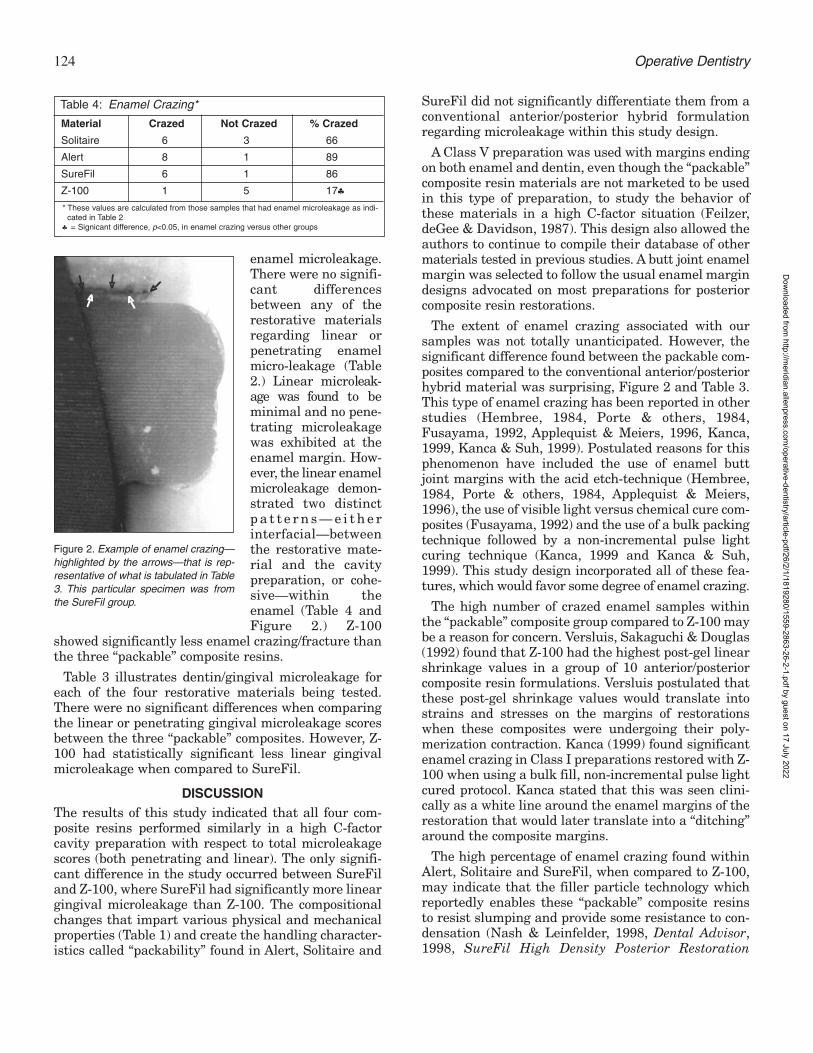
Both sections of each restoration were scored and thesection with the greatest amount of microleakage wasrecorded as the score for that restoration. Microleakagescores were recorded for both the enamel (occlusal) anddentin (gingival) margins. In addition, microleakagewas separated into penetrating andnon-penetrating (linear) types.Penetrating microleakage wasdefined as dye penetration radiatingalong the dentin tubules toward thepulp. Non-penetrating (linear)microleakage was defined as dyepenetration confined to the areaalong the composite/dentin inter-face. Both sections of the restorationwere read, and if one of the sectionshad penetrating microleakage, itwas recorded for the restoration.Additionally, the enamel marginswere examined for “crazing.” Thiswas defined as dye penetration inthe enamel, not at the margin inter-face, closely situated to it but defi-nitely separate from the fractureplane. Figure 2 shows a typical pat-tern of enamel crazing found in thisstudy.
The linear microleakage scores forthe groups were analyzed using a
Kruskal-Wallistest (non-para-metric ANOVA)and then a Dunnmultiple com-parison test at as i g n i f i c a n c elevel of p<0.05.P e n e t r a t i n gmicro leakagedata and enamelcrazing (nomi-nal) was subject-ed to Chi-Squareanalysis at a sig-nificance level ofp<0.05.
RESULTS
Tables 2 and 3display themicro leakagedata for the fourr e s t o r a t i v ematerials beingtested. For eacht r e a t m e n tgroup, gingivalmicro leakagewas significant-ly greater whencompared with
Meiers, Kazemi & Meier: Microleakage of Packable Composite Resins
Figure 1. Diagram of Microleakage ScoringSystem:0 = No microleakage1 = Leakage ≤ 1/2 length of occlusal/gingival walls2 = Leakage ≥ 1/2 length of occlusal/ginigival walls3 = Leakage that covers entire length ofocclusal/ginigval walls and also involves theaxial wallA = Example of Penetrating Microleakage—dyeradiating along dentinal tubules toward the pulpB = Example of Linear Microleakage—dye thatis not radiating and follows the walls of thepreparation.
Microleakage Scores
Material 0 1 2 3 Median %P*
Solitaire 9 9 0 0 0.5 0
Alert 9 9 0 0 0.5 0
SureFil 11 7 0 0 0 0
Z-100 12 6 0 0 0 0
Table 2: Summary Table for Microleakage at Enamel/Occlusal Margins
* %P = Percent Penetrating Microleakage:Number of samples showing penetrating microleakage
Total Number of samples having microleakage (linear + penetrating) X10
Microleakage Scores
Material 0 1 2 3 Median %P*
Solitaire 0 6 7 5 2 44
Alert 0 4 9 5 2 72
SureFil 0 4 5 9 2.5♣ 72
Z-100 0 10 5 3 1♣ 38
Table 3: Summary Table of Microleakage at Dentin/Gingival Margins
* %P = Percent of Penetrating Microleakage:Number of samples showing penetrating microleakage
Total number of samples having microleakage (linear + penetrating) X100
♣ = Significant difference, p<0.05, between groups for linear Microleakage
Dow
nloaded from http://m
eridian.allenpress.com/operative-dentistry/article-pdf/26/2/1/1819280/1559-2863-26-2-1.pdf by guest on 17 July 2022
124 Operative Dentistry
enamel microleakage.There were no signifi-cant differencesbetween any of therestorative materialsregarding linear orpenetrating enamelmicro-leakage (Table2.) Linear microleak-age was found to beminimal and no pene-trating microleakagewas exhibited at theenamel margin. How-ever, the linear enamelmicroleakage demon-strated two distinctp a t t e r n s — e i t h e rinterfacial—betweenthe restorative mate-rial and the cavitypreparation, or cohe-sive—within theenamel (Table 4 andFigure 2.) Z-100
showed significantly less enamel crazing/fracture thanthe three “packable” composite resins.
Table 3 illustrates dentin/gingival microleakage foreach of the four restorative materials being tested.There were no significant differences when comparingthe linear or penetrating gingival microleakage scoresbetween the three “packable” composites. However, Z-100 had statistically significant less linear gingivalmicroleakage when compared to SureFil.
DISCUSSIONThe results of this study indicated that all four com-posite resins performed similarly in a high C-factorcavity preparation with respect to total microleakagescores (both penetrating and linear). The only signifi-cant difference in the study occurred between SureFiland Z-100, where SureFil had significantly more lineargingival microleakage than Z-100. The compositionalchanges that impart various physical and mechanicalproperties (Table 1) and create the handling character-istics called “packability” found in Alert, Solitaire and
SureFil did not significantly differentiate them from aconventional anterior/posterior hybrid formulationregarding microleakage within this study design.
A Class V preparation was used with margins endingon both enamel and dentin, even though the “packable”composite resin materials are not marketed to be usedin this type of preparation, to study the behavior ofthese materials in a high C-factor situation (Feilzer,deGee & Davidson, 1987). This design also allowed theauthors to continue to compile their database of othermaterials tested in previous studies. A butt joint enamelmargin was selected to follow the usual enamel margindesigns advocated on most preparations for posteriorcomposite resin restorations.
The extent of enamel crazing associated with oursamples was not totally unanticipated. However, thesignificant difference found between the packable com-posites compared to the conventional anterior/posteriorhybrid material was surprising, Figure 2 and Table 3.This type of enamel crazing has been reported in otherstudies (Hembree, 1984, Porte & others, 1984,Fusayama, 1992, Applequist & Meiers, 1996, Kanca,1999, Kanca & Suh, 1999). Postulated reasons for thisphenomenon have included the use of enamel buttjoint margins with the acid etch-technique (Hembree,1984, Porte & others, 1984, Applequist & Meiers,1996), the use of visible light versus chemical cure com-posites (Fusayama, 1992) and the use of a bulk packingtechnique followed by a non-incremental pulse lightcuring technique (Kanca, 1999 and Kanca & Suh,1999). This study design incorporated all of these fea-tures, which would favor some degree of enamel crazing.
The high number of crazed enamel samples withinthe “packable” composite group compared to Z-100 maybe a reason for concern. Versluis, Sakaguchi & Douglas(1992) found that Z-100 had the highest post-gel linearshrinkage values in a group of 10 anterior/posteriorcomposite resin formulations. Versluis postulated thatthese post-gel shrinkage values would translate intostrains and stresses on the margins of restorationswhen these composites were undergoing their poly-merization contraction. Kanca (1999) found significantenamel crazing in Class I preparations restored with Z-100 when using a bulk fill, non-incremental pulse lightcured protocol. Kanca stated that this was seen clini-cally as a white line around the enamel margins of therestoration that would later translate into a “ditching”around the composite margins.
The high percentage of enamel crazing found withinAlert, Solitaire and SureFil, when compared to Z-100,may indicate that the filler particle technology whichreportedly enables these “packable” composite resinsto resist slumping and provide some resistance to con-densation (Nash & Leinfelder, 1998, Dental Advisor,1998, SureFil High Density Posterior Restoration
Material Crazed Not Crazed % Crazed
Solitaire 6 3 66
Alert 8 1 89
SureFil 6 1 86
Z-100 1 5 17♣
Table 4: Enamel Crazing*
* These values are calculated from those samples that had enamel microleakage as indi- cated in Table 2
♣ = Signicant difference, p<0.05, in enamel crazing versus other groups
Figure 2. Example of enamel crazing—highlighted by the arrows—that is rep-resentative of what is tabulated in Table3. This particular specimen was fromthe SureFil group.
Dow
nloaded from http://m
eridian.allenpress.com/operative-dentistry/article-pdf/26/2/1/1819280/1559-2863-26-2-1.pdf by guest on 17 July 2022

125
Manual, 1998) may also translate into increased post-gellinear shrinkage stresses direct toward margins—especially where these materials are firmly attached,that is, etched enamel margins. It may also indicatethat the interlocking particle technology inherent tothe “packable” composites decreases the capacity forflow for these composites in helping to compensate forthe shrinkage stressed placed on the walls of therestoration. Table 1 shows percent of linear polymer-ization shrinkage for the four tested composites. Thesevalues are rather similar, with Solitaire having thehighest and Surefil and Alert the lowest numerical val-ues. Unfortunately, these are not the same as post-gellinear shrinkage values, so the way they would trans-late into the type stresses induced at margins as sug-gested by Versluis is unknown.
The modulus of elasticity has also been related tostressed induction at a margin from a composite resin(Braem et al, 1987, Kemp-Scholte & Davidson, 1990).Materials with a higher modulus of elasticity arestiffer, and as a result have a greater susceptibility tointernal stress. Consequently, materials with a lowermodulus are said to be more flowable and undergoplastic deformation. This inherent flow, which allowsthe molecules to slip into new positions and orienta-tions, compensates for any stresses caused by contrac-tion shrinkage, thereby allowing for the maintenanceof the adhesive bond (Feilzer, DeGee & Davidson,1990). However, Solitaire had the lowest flexural mod-ulus of this group of composites but still displayed highpercentages of enamel crazing when compared to Z-100, which has a significantly higher flexural modulus(Table 4.) Therefore, for some materials, this propertyalone cannot be relied on to be a predictor of craze-freemarginal performance.
CONCLUSIONS
The “packable” composite formulations Alert, Solitaireand SureFil, performed similarly to the anterior/poste-rior hybrid formulation Z-100 with respect to enameland gingival/dentin linear and penetrating micro-leakage with the exception of SureFil demonstratingsignificantly greater linear dentinal microleakage thanZ-100. However, the “packable” composite formula-tions demonstrated a significantly higher percentageof enamel crazing than Z-100. This phenomenon mayhave been due to the margin design of the preparation,the composition of the materials, the bulk filling tech-nique and the mode of visible light activation or a com-bination of these factors. While this data cannot betransferred directly to the clinical situation, cliniciansmay want to be aware of this phenomenon and monitorif further in vitro or in vivo research confirms orrefutes this relationship associated with this class ofcomposite.
(Received 29 November 1999)
ReferencesApplequist EA & Meiers JC (1996) Effect of bulk insertion, pre-
polymerized resin composite balls and beta-quartz insertson microleakage of Class V resin composite restorationsQuintessence International 27(4) 253-258.
Association report: Statement on posterior resin-based com-posites (1998) Journal of the American Dental Association129 1627-1628.
Braem M, Lambrechts P, Vanherle G & Davidson CL (1987)Stiffness increase during the setting of dental compositeresins Journal of Dental Research 66(12) 1713-1716.
Browne RM & Tobias RS (1986) Microbial microleakage andpulpal inflammation. A review Endodontics and DentalTraumatology 2(5) 177-183.
Eick JD & Welch FH (1986) Polymerization shrinkage of pos-terior composite resins and its possible influence on postop-erative sensitivity Quintessence International 17(2) 103-111.
Farah JW & Powers JM Eds (1998) Dental Advisor 15 1-4.
Feilzer AJ, deGee AJ & Davidson CL (1987) Setting stress inresin composite in relation to configuration of the restora-tion Journal of Dental Research 66(11) 1636-1639.
Feilzer AJ, deGee AJ & Davidson CL (1990) Quantitativedetermination of stress reduction by flow in compositerestorations Dental Materials 6(3) 167-171.
Fusayama T (1992) Indications for self-cured and light-curedadhesive composite resins Journal of Prosthetic Dentistry67(1) 46-51.
Hembree JH Jr (1984) Microleakage of microfilled compositeresin restorations with different cavosurface designsJournal of Prosthetic Dentistry 52(5) 653-656.
Johnson GH, Bales DJ, Gordon GE & Powell LV (1992) Clinicalperformance of posterior composite restorationsQuintessence International 23(10) 705-711.
Kanca J (1999) Class I marginal damage consequent to follow-ing manufacturers’ instructions Journal of Dental Research78 (IADR Abstracts) #67 114.
Kanca J & Suh BI (1999) Pulse activation: Reducing resin-based composite contraction stresses at the enamel cavosur-face margins American Journal of Dentistry 12(3) 107-112.
Kempe-Scholte C & Davidson C (1990) Marginal integrityrelated to bond strength and strain capacity of compositeresin restorative systems Journal of Dental Research 64658-664.
Leinfelder KF, Sluder TB, Santos JFF & Wall JT (1980) Five-year clinical evaluation of anterior and posterior restora-tions of composite resin Operative Dentistry 5 57-65.
Nash RW & Leinfelder KF (1998) A report on new condensablecomposite resin Compendium of Continuing Education inDentistry 19(3) 230-232, 236-237.
Porte A, Lutz F, Lund MR, Swartz ML & Cochran MA (1984)Cavity designs for composite resins Operative Dentistry 9(2)50-56.
Prati C (1989) Early marginal microleakage in Class II resincomposite restorations Dental Materials 5(6) 392-398.
Meiers, Kazemi & Meier: Microleakage of Packable Composite Resins
Dow
nloaded from http://m
eridian.allenpress.com/operative-dentistry/article-pdf/26/2/1/1819280/1559-2863-26-2-1.pdf by guest on 17 July 2022

126 Operative Dentistry
Rykke M (1992) Dental materials for posterior restorationsEndodontics and Dental Traumatology 8(4) 139-148.
Surefil High Density Posterior Restorative Manual (1998)Dentsply Caulk, Milford, DE.
Taylor DF, Bayne SC, Leinfelder KF, Davis S & Koch GG (1994)Pooling of long-term clinical wear data for posterior compos-ites American Journal of Dentistry 7(3) 167-174.
Versluis A, Sakaguchi R & Douglas W (1993) Post gel shrink-age measurements by emans of strain gages Journal ofDental Research 72 (IADR Abstracts) #2236 366.
Williams P (1996) Goodbye Amalgam, Hello Alternatives?Journal of the Canadian Dental Association 62(2) 139-144.
Willems G, Lambrechts P, Braem M & Vanherle G (1993) Threeyear follow-up of five posterior composites: In vivo wearresults Journal of Dentistry 21(2) 74-78.
Dow
nloaded from http://m
eridian.allenpress.com/operative-dentistry/article-pdf/26/2/1/1819280/1559-2863-26-2-1.pdf by guest on 17 July 2022

©Operative Dentistry, 2001, 26, 127-133
SUMMARY
During the last few years a number of one-bottleadhesive systems have been developed. However,no “universal” adhesive system recommended foruse with different polyacid-modified resins(PMR) is currently available. This study com-pared the shear bond strengths of four PMRDyract AP (D), Compoglass F (C), F 2000 (F) andHytac (H)) to enamel and dentin using (1) theadhesive system provided by the manufacturerand (2) a new one-step “universal” adhesive sys-tem (Prompt L-Pop).
Seventy enamel and 70 dentin-surfaces wereprepared for 10 replications of each bondingcombination (C1, C2, D1, D2, F1, F2, H1/2). Afterthe bonding procedure and subsequent storageof the specimens in distilled water at 37°C for 24hours, shear bond strengths were determinedusing a Universal Testing Machine at a cross-
head speed of 0.75 mm min-1 until failureoccurred. Fracture modes were examined at 25xmagnification under a light microscope.
The median shear bond strength values (MPa)to enamel were 13.2 (C1), 16.5 (C2), 17.7 (D1), 41.2(D2), 12.7 (F1), 41.2 (F2), 33.9 (H1/2); to dentin, val-ues of 3.3 (C1), 3.7 (C2), 7.4 (D1), 12.2 (D2), 11.4(F1), 8.6 (F2) and 4.6 (H1/2) were measured. Inboth enamel and dentin, bond strengths of thetested PMR were either not significantly differ-ent or significantly higher using the universaladhesive system compared to the adhesive sys-tems provided by the manufacturers. Bondstrengths to enamel and dentin were not signifi-cantly different from each other in D and F withtheir corresponding adhesive system. In all othergroups, bond strengths to enamel were signifi-cantly higher compared to dentin. Failure modeswere mostly adhesive in dentin and mixed adhe-sive/ cohesive in enamel. SEM observationsrevealed similar hybrid layer and tag formationin dentin for the four adhesive systems. On enam-el, a clearly visible etch pattern was detected onlyfor the universal adhesive system.
In conclusion, the universal adhesive systemachieved equal or higher bond strengths of thetested PMR to enamel and dentin compared tothe adhesive systems provided by the manufac-turers.
Department of Operative Dentistry andPeriodontology, University Clinics, 93042Regensburg, Germany
Heinrich Oberländer, DDS, DMD, assistant professor
Karl-Heinz Friedl, DDS, DMD, assistant professor
Gottfried Schmalz, DDS, DMD, PhD, professor andchairman
Bond Strength ofPolyacid-Modified Resins
Using a New One-StepAdhesive System
H Oberländer • K-H Friedl • G Schmalz
Clinical Relevance
The tested “universal” adhesive system provides equal or higher bond strengths of thetested polyacid-modified resins to enamel and dentin compared to the adhesive systemsprovided by the manufacturers.
Dow
nloaded from http://m
eridian.allenpress.com/operative-dentistry/article-pdf/26/2/1/1819280/1559-2863-26-2-1.pdf by guest on 17 July 2022
128 Operative Dentistry
INTRODUCTION
Most dental adhesive systems still require several timeconsuming procedural steps resulting in practitioners’demands for simplification of use. For enamel, condi-tioning by acid etching (Buonocore, 1955) is a simplemethod to achieve high bond strengths and reliablemarginal sealing of composite resin restorations basedon microretention.
In dentin, moisture presents a major problem forbonding of the mainly hydrophobic composite resins.Many adhesive systems consist of several componentsto prepare the dentin surface for resin infiltration. Anacid is used to penetrate the smear layer and to de-mineralize the superficial dentin, thus opening andexposing the collagen network. A priming agent con-taining solvents and hydrophilic monomers infiltratesthe conditioned surface and stabilizes the collagen fibers(Nakabayashi & Pashley, 1998). These bi-functionalmonomers provide the link for incorporating an adhe-sive resin, thus forming a hybrid layer (Nakabayashi,Kojima & Masuhara, 1982), which enables micro-reten-tive bonding of the restorative material to dentin.
The recently introduced polyacid-modified resinshave become quite popular for Class V restorations inadults and multiple applications in deciduous teethbecause of their fluoride release and good handling andesthetic properties (Attin, Vataschki & Hellwig, 1996;van Dijken, 1996). The adhesive systems for thesematerials are designed to work on both enamel anddentin. However, the bond strengths to enamel are infe-rior to those achievable with conventional acid etching.A simplified adhesive system which produces gooddentin bond strength without compromising enamelbonding would, therefore, be highly desirable.
This study tested the shear bond strength to enamel anddentin of a recently introduced one-step adhesive systemwhich provides simple handling properties and which isclaimed to be compatible with any polyacid-modifiedresin.
METHODS AND MATERIALS
Preparation of Specimens
One hundred and forty caries-free, unrestored humanthird molars which had been stored in a 0.5% chlo-ramine solution immediately after extraction wereselected for the study. After cleaning, the teeth werekept in distilled water at 4°C for no longer than twomonths, then mounted in a holder using an acrylicresin (Sampl Kwick, Buehler, Lake Bluff, IL 60044,USA). Wet grinding of the buccal surfaces was per-formed with up to 600 grit silicon carbide abrasivepaper until a flat enamel or superficial dentin area ofat least 3 mm in diameter was exposed. Prior to thebonding procedures, the specimens were stored in dis-tilled water at a temperature of 23°C for 24 hours.
Bonding Procedures
The adhesive systems were applied precisely accordingto the manufacturers’ instructions (Table 1). A splitteflon mold was used to prepare cylindrical specimens3 mm in height and 3 mm in diameter. The mold wasfirmly clamped to the tooth surface to define the bondingarea. After application of the adhesive system, themold was filled with the restorative material in twoincrements of 1.5 mm each to allow adequate light curing.The curing light unit (Elipar Highlight, ESPE, 82229Seefeld, Germany) was set to the conventional curingmode at 800 mW/cm2. Output intensities were moni-tored with a light meter (Cure Rite, Caulk/ Dentsply,Milford, DE 19963, USA). Immediately after the bondingprocedure, the mold was removed and specimens werestored in distilled water at 37°C for 24 hours. The poly-acid-modified resins were bonded to enamel anddentin using either the corresponding adhesive systemprovided by the manufacturer or the “universal” one-step adhesive system, Prompt L-Pop (ESPE, 82229Seefeld, Germany) (Table 2).
Shear Bond Strength
The prepared specimens were secured in a mountingjig. The shear force was transmitted by a 0.5 mmblunt-edge chisel with a standardized distance of 200µm between blade and tooth surface using a ZwickMaterials Testing Machine (model #1446, Zwick,89079 Ulm, Germany) at a cross-head speed of 0.75mm min-1 until failure occurred. Shear bond force wasrecorded in Newtons and bond strength was calculatedin MPa. The failure modes were examined visuallyunder a light microscope (M5A, Wild, 9435 Heerbrugg,Switzerland) at 25x magnification.
Scanning Electron Microscope (SEM)- ExaminationEnamel
Following the same storage and preparation methods asdescribed for the shear bond strength tests, additionalenamel specimens were prepared to examine theenamel surface patterns produced by application of thefour tested adhesive systems. One layer of each adhe-sive system was applied to the enamel surface accordingto the manufacturers’ instructions with respect to appli-cation mode (active or inactive) and time. Without lightcuring, the specimens were rinsed in acetone for 30 sec-onds to dissolve and remove the adhesive layer from theenamel surface. After the drying procedure the speci-mens were gold sputtered and the treated surfaces wereexamined under a scanning electron microscope(Stereoscan 240, LEO Elektronenmikroskopie, 73446Oberkochen, Germany) at 2800x magnification.
Dentin
Superficial dentin specimens bonded to each materialusing its corresponding adhesive system according tothe manufacturers’ instructions (Table 1) were prepared
Dow
nloaded from http://m
eridian.allenpress.com/operative-dentistry/article-pdf/26/2/1/1819280/1559-2863-26-2-1.pdf by guest on 17 July 2022

129Oberländer, Friedl & Schmalz: Bond Strength of a One-Step Adhesive System
to examine the formation of a hybrid layer and resintags. The bonded specimens were cross-sectioned per-pendicular to the long tooth axis using a water-cooledlow-speed saw (Leitz, Microtome 1600, 64625 Bensheim,Germany). The resulting slices were polished using 600-grit silicon carbide abrasive paper. For clearer visualiza-tion of the resin-infiltrated dentin layer and resin tags,the specimens were treated according to a method pro-posed by Nakabayashi and Takarada (1992). The speci-mens were immersed in 6 mol/L HCl for 30 seconds tosuperficially dissolve any mineral dentin componentswhich were not protected by resin. The specimens wererinsed with water, treated by immersion in 1 wt%NaOCl for one hour and again rinsed with water. ByNaOCl-treatment, the HCl-demineralized dentin matrixis removed and clearer SEM-examination of the resin-infiltrated bonding interface is permitted (Nakabayashi& Saimi, 1996).
Statistical Analysis
Medians and 25%- and 75%-percentiles were deter-mined from 10 replications of each bonding combination.The Mann-Whitney-Wilcoxon rank sum test (SPSS/PC+,Vers 5.01, SPSS Inc, Chicago, IL 60611, USA) was usedfor pair-wise comparisons between groups (α=0.05). Inorder to assess the influence of material, substrate andadhesive system on shear bond strength in general, thelevels of significance were adjusted to α∗=1–(1-α)1/k (k= number of performed pair-wise tests) using the errorrates method (Miller, 1981).
RESULTS
The median shear bond strengths (MPa) to enamel anddentin with the corresponding 25%- and 75%-quartilesare shown in Figure 1. Pair-wise testing showed that inboth enamel and dentin, bond strengths of the tested PMRwere either not significantly different or significantlyhigher using the universal adhesive system compared tothe adhesive systems provided by the manufacturers.For Dyract AP and F 2000 with their correspondingadhesive systems, bond strengths to enamel and dentinwere not significantly different from each other. In allother groups, significantly higher bond strengths toenamel compared to dentin were found. The error ratesmethod showed an influence of material, substrate andadhesive system on shear bond strength in general.
The determination of failure modes revealed mostlyadhesive failures in dentin and mixed adhesive/cohesivefailures in enamel (Table 3). In the cases where mixedadhesive/cohesive failures were observed, the cohesivepart of the fractures occurred exclusively within therestorative material and in no case within dental hardtissue.
SEM observations of the enamel surfaces revealed aclearly visible micro-retentive etching pattern onlyafter treatment with the “universal” one-step adhesivesystem (Figure 2).
Scanning electron microscopic examination of thecross-sectioned specimens detected very similar hybrid
Adhesive System Enamel and Dentin Pretreatment Restoration Material Manufacturer(Batch-No) (Batch-No)
Syntac Single Component 1) Apply Syntac Single Component with a brush Compoglass F Vivadent, 9494 (812599) 2) Wait for 20 seconds, air thin and light cure for 20 (924919) Schaan, Liechtenstein
seconds3) Repeat step 1), air thin and light cure for 20 seconds
Prime & Bond 2.1 1) Apply Prime & Bond with applicator tip Dyract AP DeTrey/Dentsply, 78467 (9802000643) 2) Wait for 30 seconds, air thin and light cure (9801001235) Konstanz, Germany
for 10 seconds3) Repeat step 1), air thin and light cure for 10
seconds
F 2000 Primer/Adhesive 1) Apply F 2000 Primer/Adhesive with a brush F 2000 3M Dental Products, St (19970902) 2) Wait for 30 seconds, air thin for 5-10 seconds (702) Paul, MN 55144-1000,
and light cure for 10 seconds USA)
Prompt L-Pop 1) Apply Prompt L-Pop with applicator tip Hytac (032) ESPE, 82229 Seefeld,(001) 2) Agitate for 15 seconds and air thin Germany
Table1: Bonding Procedures, Batch Numbers and Manufacturers of Products Tested
Compoglass F Dyract AP F 2000 Hytac
Manufacturer’s adhesive C1 D1 F1system
Prompt L-Pop C2 D2 F2H1/2
Table 2: Codes for Bonding Combinations
Dow
nloaded from http://m
eridian.allenpress.com/operative-dentistry/article-pdf/26/2/1/1819280/1559-2863-26-2-1.pdf by guest on 17 July 2022

130 Operative Dentistry
layers and tag formation (Figure 3) for any of the testedadhesive systems.
DISCUSSIONUnlike many conventional composite resin restorativematerials, separate conditioning and bonding proce-dures for enamel and dentin are not recommended forpolyacid-modified resins. Their adhesive systems aredesigned to work on both substrates.
Multi-step bonding procedure to dentin may increasepotential risks that could endanger successful clinicalperformance of the restoration. After application of anacidic conditioner, inadequate rinsing may leave residualacid, which can over-etch the dentin or block the inter-fibrillar space with residual reaction products
(Nakabayashi & Pashley, 1998). Insufficient air dryingmay leave the surface too wet. Either problem mayhinder adequate penetration of the priming agent andadhesive resin (Jacobsen & Söderholm, 1995; Tay,Gwinnett & Wei, 1996). Overdrying, on the otherhand, may lead to a collapse of the collagen network,resulting in dramatically worse bonding properties(Tay & others, 1996). If the adhesive resin does notcompletely infiltrate the collagen network and leavesunprotected, decalcified collagen fibers at the base ofthe hybrid layer (Nakabayashi & Takarada, 1992;Kato, Watanabe & Nakabayashi, 1994), hydrolyticdegradation and degradation from acids and enzymesreleased by bacteria may occur by nanoleakage (Sano& others, 1995) in this gap (Burrow, Satoh & Tagamo,1996).
Based on these potential problems, the reduction ofprocedural steps in adhesive systems is not only fortime saving reasons, but also for elimination of possiblerisks that may lead to deterioration of the bond. Majorimprovements have been observed with bonding sys-tems incorporating self-etching primers (Chigira &others, 1994; Watanabe, Nakabayashi & Pashley,1994; Ikemura, Kouro & Endo, 1996). These productsavoid the rinsing and drying steps which may be criticalfor the demineralized matrix (Pashley & others, 1995)and resin infiltration. If the acidic monomers pene-trate the demineralized zone to its full depth,nanoleakage should be eliminated or greatly reduced.
However, achievement of perfectly hybridized dentinwithout losing optimum bonding properties to enamelis a problem. In a recent SEM investigation of severalone-bottle systems, a traditional pattern of etchedenamel could only be achieved after treatment withphosphoric acid, whereas direct application of theadhesive systems resulted in no characteristic etch
Figure 1. Median shear bond strengths (MPa). Histograms representmedian values and vertical lines represent 25%/75%-quantiles of 10replications. Significant differences (α=0.05) are labeled with horizontalbars.
Figure 2. Etch pattern as produced by Prompt L-Pop on enamel (2800xmagnification).
Figure 3. Typical hybrid layer and resin tag formation as produced by F2000 Primer/Adhesive on superficial dentin (1580x magnification).
Dow
nloaded from http://m
eridian.allenpress.com/operative-dentistry/article-pdf/26/2/1/1819280/1559-2863-26-2-1.pdf by guest on 17 July 2022

131
pattern (Ferrari, Goracci & García-Godoy, 1997).Although good immediate bond strengths are pro-duced, the degree of etching of enamel seems to beminimal (Shono, 1995). These shallow bonds mightlimit the longevity of enamel-resin bonding undercyclic thermal and masticatory stress in the clinicalsituation (Nakabayashi & Pashley, 1998).
Despite recent improvements in the hybridization ofdentin, the challenge in the development of adhesivesystems still is providing a conditioner which avoidsover-etching of dentin without compromising optimumenamel adhesion.
In this study the adhesion of four current adhesivesystems was compared by determination of the shearbond strength to human enamel and dentin, which is awidely used method to initially evaluate new adhesivesystems (Rueggeberg, 1991; Fowler & others, 1992).The results of recent studies indicate that in vitroapplication of the new hydrophilic bonding systemsleads to results similar to in vivo application withrespect to shear bond strength testing (Mason & others,1996) and SEM morphology of the hybrid layer(Ferrari & others, 1996).
With the introduction of a microtensile bond strengthtesting method, it has been proposed that relativelylarge bonded areas, as used in shear bond strengthtests, may contain small flaws or defects in the bondedinterfaces (for example, water blisters, air bubbles),which may lead to crack propagation and catastrophicfailure (Sano & others, 1994). Other test methods areclaimed to apply force more specific to the bondedinterface, for example, fracture toughness test (Tam &Pilliar, 1994; Ruse & others, 1996).
However, the determination of failure modes in thisinvestigation revealed mostly adhesive failures indentin and mixed adhesive/cohesive failures in enamel.If mixed adhesive/cohesive failures were observed, thecohesive part of the fractures occurred exclusivelywithin the restorative material and in no case withinenamel or dentin. It has been suggested byNakabayashi and Pashley (1998) that if high bondstrengths can be measured without inducing cohesive
failure of dental hard tissue, the stress distributionswere adequate to uniformly stress the bonding inter-face allowing for valid comparisons between adhesivesystems.
With the universal adhesive system, significantlyhigher shear bond strengths to enamel were recordedcompared to dentin, which was also found for otherself-etching systems in recent studies (Gordan, Boyer& Söderholm, 1998; Barkmeier, Hammesfahr & Latta,1999). Recent findings confirm similarly high values of31.1 MPa (Issa & Watts, 1999) and 39.4 MPa (Li &Powers, 1999) for Prompt L-Pop/Hytac to humanenamel. With the universal adhesive system, bondstrengths to dentin ranged from 3.7 MPa forCompoglass F to 12.2 MPa for Dyract AP and wereeither not significantly different or significantly highercompared to the manufacturers’ adhesive systems.Several studies investigating Prompt L-Pop foundgood marginal sealing (Nunes, Perdigão & Rosa, 1999),etched enamel morphology (Breschi & others, 1999)and dentin interaction (Lopes, Perdigão & Ambrose,1999) similar to conventional adhesives. Findings ofMiyazaki & others (1996) indicate that active applica-tion may result in higher bond strengths to dentincompared to inactive application. This could explainwhy agitating only one layer of Prompt L-Pop by brushfor 15 seconds is sufficient to form a 3.0-4.8 µm thickhybrid layer in dentin (Lopes & others, 1999).
SEM examination revealed similar hybrid layer andresin tag formation to superficial dentin for all testedadhesive systems. Due to the low PH-value of theinvolved methacrylated phosphates, only the “univer-sal” one-step adhesive system produced a clearly visibleetching pattern on enamel surfaces, which could be thereason for the outstanding enamel shear bondstrength values of up to 41.2 MPa measured in thisinvestigation.
As a significant decrease in shear bond strength withincreased storage time could be observed for other sys-tems (Lucena-Martin & others, 1999), long-term invitro testing will be helpful to gain further knowledge.Though the “universal” one-step adhesive system, due
Oberländer, Friedl & Schmalz: Bond Strength of a One-Step Adhesive System
ENAMEL DENTIN
Bonding n Adhesive Mixed Adhesive/ Adhesive Mixed Adhesive/Combination Cohesive Cohesive
C1 10 3 7 9 1
C2 10 2 8 10 0
D1 10 5 5 9 1
D2 10 3 7 10 0
F1 10 5 5 10 0
F2 10 2 8 9 1
H1/2 10 3 7 10 0
Table 3: Failure Modes in Enamel and Dentin
Dow
nloaded from http://m
eridian.allenpress.com/operative-dentistry/article-pdf/26/2/1/1819280/1559-2863-26-2-1.pdf by guest on 17 July 2022

132 Operative Dentistry
to its simple handling properties and good bonding toboth enamel and dentin, seems to be a promisingapproach for future development of adhesive systems,clinical data are needed to confirm the in vitro findings
CONCLUSIONS
The tested one-step “universal” adhesive systemachieved equal or higher bond strengths of the testedpolyacid-modified resins to enamel and dentin com-pared to the adhesive systems provided by the manu-facturers.
Acknowledgment
The authors thank Dr Karl-Anton Hiller for the statistical analysisand Prof John M Powers, Houston, Texas for his advice concerningthe manuscript. This study was supported by ESPE, Seefeld,Germany.
(Received 15 December 1999)
References
Attin T, Vataschki M & Hellwig E (1996) Properties of resin-mod-ified glass-ionomer restorative materials and two polyacid-modified resin composite materials Quintessence International27(3) 203-209.
Barkmeier WW, Hammesfahr PD & Latta MA (1999) Bondstrength of composite to enamel and dentin using Prime &Bond 2.1 Operative Dentistry 24(1) 51-56.
Breschi L, Perdigão J, Mazzotti G, Nunes MF & Gobbi P (1999)Ultramorphology and shear bond strength of self-etching adhe-sives on enamel Journal of Dental Research 78 (IADRAbstracts) p 475 Abstract 2957.
Buonocore MG (1955) Simple method of increasing the adhesionof acrylic filling materials to enamel surfaces Journal of DentalResearch 34(6) 849-853.
Burrow MF, Satoh M & Tagami J (1996) Dentin bond durabilityafter three years using a dentin bonding agent with and with-out priming Dental Materials 12(5) 302-307.
Chigira H, Yukitani W, Hasegawa T, Manabe A, Itoh K,Hayakawa T, Debari K, Wakumoto S & Hisamitsu H (1994)Self-etching dentin primers containing phenyl-P Journal ofDental Research 73(5) 1088-1095.
Ferrari M, Cagidiaco MC, Kugel G & Davidson CL (1996) Dentininfiltration by three adhesive systems in clinical and laboratoryconditions American Journal of Dentistry 9(6) 240-244.
Ferrari M, Goracci G & García-Godoy F (1997) Bonding mecha-nism of three “one-bottle” systems to conditioned and uncondi-tioned enamel and dentin American Journal of Dentistry 10(5)224-230.
Fowler CS, Swartz ML, Moore BK & Rhodes BF (1992) Influenceof selected variables on adhesion testing Dental Materials 8(4)265-269.
Gordan VV, Boyer D & Söderholm KJ (1998) Enamel and dentineshear bond strength of two resin-modified glass ionomers andtwo resin based adhesives Journal of Dentistry 26(5-6) 497-503.
Ikemura K, Kouro Y & Endo T (1996) Effect of 4-acry-loxyethyltrimellitic acid in a self-etching primer on bonding toground dentin Dental Materials 15 132-143.
Issa MH & Watts DC (1999) Shear strengths of a compomer adhe-sive to enamel and dentine Journal of Dental Research 78(IADR Abstracts) p 446 Abstract 2725.
Jacobsen T & Söderholm KJ (1995) Some effects of water ondentin bonding Dental Materials 11(2) 132-136.
Kato G, Watanabe I & Nakabayashi N (1994) Effect of 4-METAacetone solution on bonding resin to dentin etched with phos-phoric acid Journal of the Japanese Society for DentalMaterials Development 13 29-35.
Li D & Powers JM (1999) Bond strength of compomers withacidic primers to human enamel Journal of Dental Research 78(IADR Abstracts) p 445 Abstract 2719.
Lopes M, Perdigão J & Ambrose WW (1999) Ultramorphologicalstudy of dentin treated with a simplified adhesive Journal ofDental Research 78 (IADR Abstracts) p 475 Abstract 2955.
Lucena-Martin C, Gonzalez-Rodriguez MP, Ferrer-Luque CM,Robles-Gijon V & Navajas JM (1999) Study of the shear bondstrength of five one-component adhesives under simulatedpulpal pressure Operative Dentistry 24(2) 73-80.
Mason PN, Ferrari M, Cagidiaco MC & Davidson CL (1996)Shear bond strength of four dentinal adhesives applied in vivoand in vitro Journal of Dentistry 24(3) 217-222.
Miller RG (1981) Simultaneous statistical inference Springer,Berlin Heidelberg New York
Miyazaki M, Platt JA, Onose H & Moore BK (1996) Influence ofdentin primer application methods on dentin bond strengthOperative Dentistry 21(4) 167-172.
Nakabayashi N, Kojima K & Masuhara E (1982) The promotionof adhesion by the infiltration of monomers into tooth sub-strates Journal of Biomedical Materials Research 16(3) 265-273.
Nakabayashi N & Takarada K (1992) Effect of HEMA on bondingto dentin Dental Materials 8(2) 125-130.
Nakabayashi N & Saimi Y (1996) Bonding to intact dentinJournal of Dental Research 75(9) 1706-1715.
Nakabayashi N & Pashley DH (1998) Hybridization of dentalhard tissues Tokyo: Quintessence Publishing Co, Ltd.
Nunes MF, Perdiãgo J & Rosa BT (1999) The effect of an experi-mental one-application self-conditioning adhesive onmicroleakage Journal of Dental Research 78 (IADR Abstracts)p 306 Abstract 1602.
Pashley DH, Sano H, Ciucchi B, Yoshiyama M & Carvalho RM(1995) Adhesion testing of dentin bonding agents: A reviewDental Materials 11(2) 117-125.
Rueggeberg FA (1991) Substrate adhesion testing to tooth struc-ture–Review of the literature Dental Materials 7(1) 2-10.
Ruse ND, Troczynski T, Macentee MI & Feduik D (1996) Novelfracture toughness test using a notchless triangular prism(NTP) specimen Journal of Biomedical Materials Research31(4) 457-463.
Sano H, Shono T, Sonoda H, Takatsu T, Ciucchi B, Carvalho RM& Pashley DH (1994) Relationship between surface area foradhesion and tensile bond strength–Evaluation of a microten-sile bond test Dental Materials 10(4) 236-240.
Dow
nloaded from http://m
eridian.allenpress.com/operative-dentistry/article-pdf/26/2/1/1819280/1559-2863-26-2-1.pdf by guest on 17 July 2022

133
Sano H, Takatsu T, Ciucchi B, Horner JA, Matthews WG &Pashley DH (1995) Nanoleakage: Leakage within the hybridlayer Operative Dentistry 20(1) 18-25.
Shono T (1995) Pulpal responses to light-cured restorative glasspolyalkenoate cements and ultrastructure of cement-dentininterface Japanese Journal of Conservative Dentistry 38 514-548.
Tam LE & Pilliar RM (1994) Fracture surface characterization ofdentin-bonded interfacial fracture toughness specimensJournal of Dental Research 73(3) 607-619.
Tay FR, Gwinnett JA & Wei SHF (1996) Micromorphologicalspectrum from overdrying to overwetting acid-conditioneddentin in water-free, acetone-based, single-bottle primer/adhe-sives Dental Materials 12(4) 236-244.
van Dijken JW (1996) 3-year clinical evaluation of a compomer, aresin-modified glass ionomer and a resin composite in class IIIrestorations American Journal of Dentistry 9(5) 195-198.
Watanabe I, Nakabayashi N & Pashley DH (1994) Bonding toground dentin by a phenyl-P self-etching primer Journal ofDental Research 73(6) 1212-1220.
Oberländer, Friedl & Schmalz: Bond Strength of a One-Step Adhesive System
Dow
nloaded from http://m
eridian.allenpress.com/operative-dentistry/article-pdf/26/2/1/1819280/1559-2863-26-2-1.pdf by guest on 17 July 2022

AUJ Yap • CL ChewSH Teoh • LFKL Ong
©Operative Dentistry, 2001, 26, 134-144
Clinical Relevance
Increase in contact stress significantly enhances the wear of composites. Contact stresson occlusal contact areas should be quantified on restorations analyzed for clinical trialsin order to make clinical wear assessment more discriminating and to avoid misinter-pretations. Composite usage in patients with large biting forces and parafunctionalbehavior should be avoided in large restorations.
SUMMARY
Occlusal contact area (OCA) wear has beenshown to exceed contact-free area wear by three-to-five times in clinical studies. A reciprocal com-pression sliding wear device was used to investi-
gate the influence of contact stress on OCA wearof four resin composite restoratives (Silux, Z100,Ariston and Surefil). A dental amalgam(Dispersalloy) was used for comparison. The pat-tern and mechanisms of wear, and the relation-ship between wear and composite surface hard-ness were also studied. Thirty wear specimensand six hardness specimens were made for eachmaterial. Wear specimens were tested at 20 to 60MPa contact stresses against SS304 counter-bod-ies with artificial saliva as lubricant up to 20,000cycles. Wear depth (µm; n=6) was measured usingprofilometry. Hardness testing (KHN) was donewith a digital microhardness tester (load=500 gf,dwell time=15 seconds). Results were analyzedusing ANOVA/Scheffe’s test (p<0.05). At all contactstresses Dispersalloy had significantly betterOCA wear resistance than the composites. Thewear of Z100 was significantly greater than Silux,Ariston and Surefil. The influence of stress onwear and counter-body loss was material depend-ent. Correlation between contact stress and wearwas significant for all materials with correlationcoefficient (r) ranging from 0.96 for Z100 to 0.88for Ariston. The wear mechanisms for the differ-ent composites varied depending on theirmicrostructure and the contact stress. There was
Department of Restorative Dentistry, Faculty ofDentistry, National University of Singapore, 5Lower Kent Ridge Road, Singapore 119074,Republic of Singapore
Adrian UJ Yap, BDS, MSc, FAMS, FADM, FRSH,assistant professor, Department of RestorativeDentistry, Faculty of Dentistry, assistant director,Center for Biomedical Materials Applications andTechnology, Faculty of Engineering, NationalUniversity of Singapore
Chew Lin Chew, BDS, MDS, MSD, FDSRCS, FAMS,professor, head
SH Teoh, PhD, BEng, CPENG MIE (Aust), MASAIO,MIM, MASTM, associate professor, director, Centerfor Biomedical Materials Applications andTechnology, Faculty of Engineering
LFKL Ong, Beng, research engineer, Center forBiomedical Materials Applications and Technology,Faculty of Engineering
Influence of Contact Stresson OCA Wear of
Composite Restoratives
Dow
nloaded from http://m
eridian.allenpress.com/operative-dentistry/article-pdf/26/2/1/1819280/1559-2863-26-2-1.pdf by guest on 17 July 2022

135
no significant correlation between materialhardness and wear/counter-body loss.
INTRODUCTION
Wear is a natural process that occurs whenever two ormore surfaces move in contact with one another (Zum-Gahr, 1987). Wear can be defined as the ultimate con-sequence of interaction between surfaces, manifestedin the gradual removal of materials. Since teeth,together with any restorations, move in contact withone another, wear is inevitable. Composite resins(‘Composites’) have been available to the dental pro-fession for about four decades. Composite resins maybe defined as three-dimensional combinations of aleast two chemically different materials with a distinctinterface (Phillips, 1981).
The first generation composites contained fillers witha mean diameter of 30 to 50 µm. Although there werevariations of filler types, most consisted of quartz.Based on a number of clinical studies which indicatedthat the wear resistance of these materials was notsubstantially different from amalgams, recommenda-tions were made for their use in posterior teeth. Whileearly research suggested that composites could possi-bly serve as amalgam substitutes (Phillips & others,1971), subsequent long-term investigations were lessoptimistic (Phillips & others, 1973; Leinfelder & oth-ers, 1980). After 12-18 months of service, the degree ofwear and loss of anatomical form was found to beextensive.
All modern-day composites are basically the productof evolution and refinement of previously developedcomposites. Their tooth-color matching ability and lackof metallic mercury have caused them to be promoted
as an amalgam substitute for the restoration of poste-rior teeth. The use of dental amalgam is expected todecrease because of increasing emphasis on alterna-tive materials and environmental/health concernscausing changes in government regulations (Roulet,1997). The wear of many current composites in conser-vative restorations is nearly equivalent to that ofamalgam (10 to 20 µm a year) (Leinfelder & others,1986). However as clinical studies (Lutz & others,1984) showed that occlusal contact area (OCA) or slidingcontact wear can exceed that of contact free abrasive(slurry) wear by three to five times, wear continues tobe an important consideration for large restorations. IfOCA wear is of sufficient magnitude, appreciablechanges may develop in functional occlusion.
The objectives of this investigation include: (1) evalu-ating the effects of contact stress on wear behavior offour different composites, (2) comparing the OCA wearperformance, (3) determining the pattern and mecha-nisms of wear and (4) studying the relationshipbetween wear and composite surface hardness.
METHODS AND MATERIALSSpecimen Preparation
Four different visible-light cured composites wereinvestigated (Table 1). They include a microfilled(Silux Plus), two minifilled (Z100 and Surefil) and amidifilled (Ariston pHc) composite. Table 1 shows thepolymers and fillers used for the different composites.An amalgam alloy (Disperalloy, Dentsply Inc, Milford,DE 19963) was used for comparison. The compositeswere placed in the rectangular recesses (8 mm long x 4mm wide x 2 mm deep) of customized acrylic moldsand covered with acetate strips (Hawe-Neos Dental,
Material Manufacturer Type Polymer Fillers Filler size Filler content Lot No(µm) (% by volume)
Silux Plus 3M Dental Products, Microfill BisGMA Silica 0.04 (mean) 40 19980106St Paul, MN 55144 TEGDMA
Z100 3M Dental Products, Minifill BisGMA Zirconia Silica 0.5–0.7 ) 66 19980203St Paul, MN 55144 TEGDMA (mean)
Ariston pHc Vivadent Midifill BisGMA Ba-Al- 1.3 (mean) 59 A06719Schaan, Liechtenstein UDMA Fluorosilicate
Dimeth- glassacrylate Alkaline glass
SilicaYtterbiumTrifluoride
Surefil Dentsply-Caulk Minifill Urethane- Ba-Boron- 0.8 (mean) 65 980709Milford, DE 19963 modified Fluorosilicate
BisGMA glassSilica
Table 1: Description of Composite Materials
BisGMA = Bisphenol A-glycidyl methacrylateTEDGMA = Triethylene glycol dimethacrylateUMDA = Urethane dimethacrylate
Composite classification based upon that reported by Ferracane (1995)
Yap & Others: Influence of Contact Stress on OCA Wear of Composite Restoratives
Dow
nloaded from http://m
eridian.allenpress.com/operative-dentistry/article-pdf/26/2/1/1819280/1559-2863-26-2-1.pdf by guest on 17 July 2022

136 Operative Dentistry
Bioggio, Switzerland). A glass slide was placed over theacetate strip and pressure was applied to extrude theexcess material. The composites were light-polymer-ized according to the manufacturers’ cure-timesthrough the glass slide with a curing light (Spectrum;Dentsply Inc, Milford, DE 19963). The intensity of thelight-source was checked with a radiometer (Cure Rite,EFOS Inc, Ontario, Canada) before starting eachexperimental session. The mean output was 421±1.5mW/cm2 and the output was not affected by illumina-tion through the glass slide and acetate strip.Immediately after light polymerization, the acetatestrips were discarded and the composites stored inartificial saliva (Artificial Saliva, NUH PharmacyLaboratory, Singapore) for 24 hours at 37°C. The amal-gam alloy was condensed into the customized moldsand carved flat using a plastic instrument. It wasallowed to set for 24 hours at 37°C in artificial salivaand “wet” finished with silicone abrasives (PN 308,Shofu, Kyoto, Japan) with a slow-speed handpiece at40,000 rpm.
The materials for hardness testing were also pre-pared as mentioned above. The dimensions of therecesses in the acrylic molds were 3 mm long x 4 mmwide x 2mm deep. A total of 30 wear and 6 hardnessspecimens were made for each restorative material.
Hardness Testing
After 24 hours storage, the specimens were blotted dryand positioned centrally beneath the indentor of a digitalmicrohardness tester (FM7, Future-Tech Corp, Tokyo,Japan). A 500 gf load was applied through the indentorwith a dwell time of 15 seconds. The Knoop HardnessNumber (KHN) of each specimen was recorded and themean for each material was computed.
Wear Apparatus and Testing
The wear apparatus used was a reciprocating com-pression-sliding system in which the material speci-
mens were moved back and forth against a loadedcounter-body. The apparatus utilized a crank-and-slidermechanism, whereby rotary action from an inductionmotor was translated to the linear motion of the slidingplatform. One complete circle of radius 1.5 mm drawnby the crank directly translated to a complete horizontalmotion of the platform, comprising a forward and back-ward stroke of 3 mm each. Resolving the circularmotion on a plane-to-motion in a line, this circularmotion at constant speed gave a line motion with sinu-soidal speed. An induction motor with a synchronousspeed of 1500 rpm at 230 V and 50 Hz was used with areduction gear ratio of 15. The resultant speed of thecrank was 100 rpm, which gave an angular velocity ofω=(10/3)π. Together with the crank offset of 1.5 mm,the resultant sinusoidal horizontal platform velocitywas V=5πsin[(10/3)πt]. Thus, the platform had a speedof 0 mm/s at each end of the 3 mm stroke and smoothlyreached a maximum speed of about 16 mm/s at thecenter of the stroke.
Figure 1. The wear instrumentation.
Materials 20 MPa 30 MPa 40 MPa 50 MPa 60 MPa
Wear in µm
Silux Plus 31.5 (1.0) 42.3 (0.7) 46.7 (4.2) 53.2 (2.9) 64.0 (7.1)
Z100 59.6 (19.5) 117.4 (13.0) 175.4 (30.8) 253.7 (28.3) 378.0 (32.9)
Ariston pHc 24.4 (2.7) 30.5 (4.8) 48.0 (6.6) 56.3 (9.8) 55.2 (3.8)
Surefil 24.8 (6.9) 34.5 (5.8) 48.0 (7.2) 56.0 (8.4) 81.4 (9.1)
Dispersalloy 5.9 (0.6) 7.4 (1.8) 8.1 (1.4) 9.5 (1.6) 11.8 (5.8)
Wear Factor
Silux Plus 5.3 5.7 5.8 5.6 5.4
Z100 10.1 15.9 21.8 26.7 31.9
Ariston pHc 4.1 4.1 6.0 5.9 4.6
Surefil 4.2 4.7 6.0 5.9 6.9
Table 2: Mean Wear in µm (standard deviation) After Wear Testing and Wear Factor for the Various Contact Stresses
Dow
nloaded from http://m
eridian.allenpress.com/operative-dentistry/article-pdf/26/2/1/1819280/1559-2863-26-2-1.pdf by guest on 17 July 2022
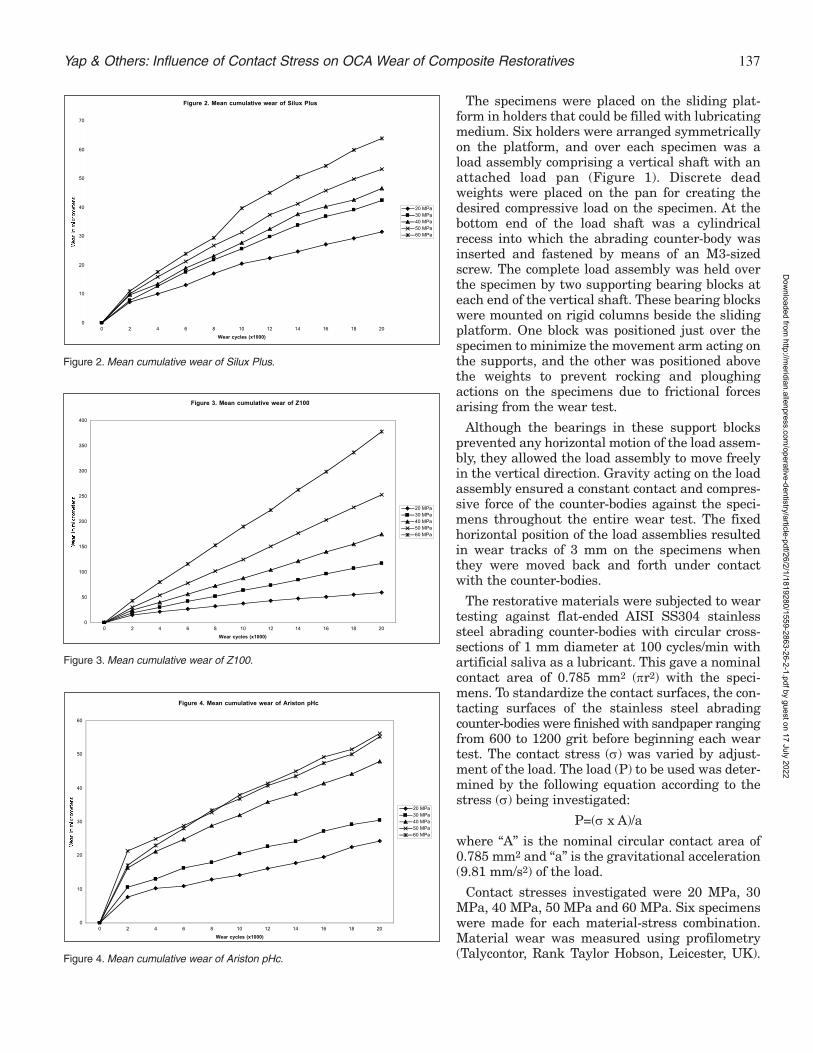
137
The specimens were placed on the sliding plat-form in holders that could be filled with lubricatingmedium. Six holders were arranged symmetricallyon the platform, and over each specimen was aload assembly comprising a vertical shaft with anattached load pan (Figure 1). Discrete deadweights were placed on the pan for creating thedesired compressive load on the specimen. At thebottom end of the load shaft was a cylindricalrecess into which the abrading counter-body wasinserted and fastened by means of an M3-sizedscrew. The complete load assembly was held overthe specimen by two supporting bearing blocks ateach end of the vertical shaft. These bearing blockswere mounted on rigid columns beside the slidingplatform. One block was positioned just over thespecimen to minimize the movement arm acting onthe supports, and the other was positioned abovethe weights to prevent rocking and ploughingactions on the specimens due to frictional forcesarising from the wear test.
Although the bearings in these support blocksprevented any horizontal motion of the load assem-bly, they allowed the load assembly to move freelyin the vertical direction. Gravity acting on the loadassembly ensured a constant contact and compres-sive force of the counter-bodies against the speci-mens throughout the entire wear test. The fixedhorizontal position of the load assemblies resultedin wear tracks of 3 mm on the specimens whenthey were moved back and forth under contactwith the counter-bodies.
The restorative materials were subjected to weartesting against flat-ended AISI SS304 stainlesssteel abrading counter-bodies with circular cross-sections of 1 mm diameter at 100 cycles/min withartificial saliva as a lubricant. This gave a nominalcontact area of 0.785 mm2 (πr2) with the speci-mens. To standardize the contact surfaces, the con-tacting surfaces of the stainless steel abradingcounter-bodies were finished with sandpaper rangingfrom 600 to 1200 grit before beginning each weartest. The contact stress (σ) was varied by adjust-ment of the load. The load (P) to be used was deter-mined by the following equation according to thestress (σ) being investigated:
P=(σ x A)/a
where “A” is the nominal circular contact area of0.785 mm2 and “a” is the gravitational acceleration(9.81 mm/s2) of the load.
Contact stresses investigated were 20 MPa, 30MPa, 40 MPa, 50 MPa and 60 MPa. Six specimenswere made for each material-stress combination.Material wear was measured using profilometry(Talycontor, Rank Taylor Hobson, Leicester, UK).
Figure 2. Mean cumulative wear of Silux Plus
0
10
20
30
40
50
60
70
0 2 4 6 8 10 12 14 16 18 20
Wear cycles (x1000)
We
ar
in m
icro
met
ers
20 MPa30 MPa40 MPa50 MPa60 MPa
Figure 2. Mean cumulative wear of Silux Plus.
Yap & Others: Influence of Contact Stress on OCA Wear of Composite Restoratives
Figure 3. Mean cumulative wear of Z100
0
50
100
150
200
250
300
350
400
0 2 4 6 8 10 12 14 16 18 20
Wear cycles (x1000)
We
ar
in m
icro
me
ters
20 MPa30 MPa40 MPa50 MPa60 MPa
Figure 3. Mean cumulative wear of Z100.
Figure 4. Mean cumulative wear of Ariston pHc
0
10
20
30
40
50
60
0 2 4 6 8 10 12 14 16 18 20
Wear cycles (x1000)
We
ar
in m
icro
me
ters
20 MPa30 MPa40 MPa50 MPa60 MPa
Figure 4. Mean cumulative wear of Ariston pHc.
Dow
nloaded from http://m
eridian.allenpress.com/operative-dentistry/article-pdf/26/2/1/1819280/1559-2863-26-2-1.pdf by guest on 17 July 2022

138 Operative Dentistry
Wear measurements were taken at the center of thewear track at every 2000 cycles up to 20,000 cycles.The wear factor for the composites at the various con-tact stresses was calculated using the equation:
Wear Factor=Wear of composite/Wear of comparison(Dispersalloy)
Counter-body height loss (µm) was measured byweighing the specimens after each 2000 cycles intervalusing the following formula:
Abrader height lost (h)=w/(d x πr2)
where “w” is the weight loss and “d” is the density ofSS304 (8.03 g/cm3).
SEM Evaluation
Specimens wear tested at 20, 40 and 60 MPa contactstress were examined with scanning electronmicroscopy (SEM) after 20,000 cycles to compare wear
patterns and evaluate the wear mechanisms.Representative specimens were mounted andexamined with a JSM-5800 LV SEM (Joel Ltd,Tokyo, Japan) at an accelerating voltage of 15 keVand a working distance of 10 mm.
Statistical Evaluation
With the exception of correlation, a confidencelevel of 0.05 was used for all statistical analysis.Two-way analysis of variance (ANOVA) was per-formed on wear test and counter-body loss data,with restorative material and contact stresses asmain effects, and all possible combinations ofthese variables as interaction effects in theANOVA model. Post-hoc Scheffe’s test was used totest for differences among means (SPSS Inc,Chicago, IL 60611). For each contact stress, a one-way ANOVA was performed on wear and counter-body loss data, with materials as the independentvariable and wear and counter-body loss asdependent variables. One-way ANOVA was alsoperformed for each material to determine theeffects of contact stress on wear and counter-bodyloss. In addition, significant differences in surfacehardness between restoratives were evaluated.Correlation between hardness and wear, hardnessand counter-body loss, stress and wear, and stressand counter-body loss were conducted usingPearson’s product-moment correlation coefficientat 0.01 significance level.
RESULTS
The mean material wear, wear factor and meancounter-body loss after wear testing with the vari-ous contact stresses are shown in Tables 2 and 3.The mean KHN of the various composites areshown in Table 4. Figures 2 to 6 show the cumula-tive wear of the various materials. The SEMs of theworn surfaces after wear testing for 20,000 cycles at20 and 40 MPa contact stress are shown in Figures7 to 8. Results of statistical analyses are displayedin Tables 5 to 7.
For all contact stresses evaluated, Z100 had the highestwear and Dispersalloy the lowest. Dispersalloy had sig-nificantly lower wear than all the composites evaluated.The wear of Z100 was significantly greater than Silux,Ariston and Surefil. No significant difference in wearperformance was noted between the latter three com-posites. With the exception of Z100, OCA wear factorranged from 4 to 7 for the various composite-contactstress combinations. Wear factor for Z100 was higher,ranging from 10 for 20 MPa to 32 for 60 MPa contactstresses. The greatest counter-body loss was alsoobserved with Z100. For all contact stresses, wearagainst Z100 resulted in significantly greater counter-body loss compared to the all composites evaluated. In
Figure 5. Mean cumulative wear of Surefil
0
10
20
30
40
50
60
70
80
90
0 2 4 6 8 10 12 14 16 18 20
Wear cycles (x1000)
We
ar
in m
icro
me
ters
20 MPa30 MPa40 MPa50 MPa60 MPa
Figure 5. Mean cumulative wear of Surefil.
Figure 6. Mean cumulative wear of Dispersalloy
0
2
4
6
8
10
12
14
0 2 4 6 8 10 12 14 16 18 20
Wear cycles (x1000)
We
ar
in m
icro
me
ters
20 MPa30 MPa40 MPa50 MPa60 MPa
Figure 6. Mean cumulative wear of Dispersalloy.
Dow
nloaded from http://m
eridian.allenpress.com/operative-dentistry/article-pdf/26/2/1/1819280/1559-2863-26-2-1.pdf by guest on 17 July 2022

139
addition, wear testing with Surefil alsoresulted in significantly greater counter-body wear compared to Dispersalloy for con-tact stress of 20 MPa.
Two-way ANOVA of wear and counter-body loss showed significant interactionbetween contact stress and materials. Inother words, the influence of stress on wearand counter-body loss was material-dependent. The influences of contact stresson wear of individual restoratives arereflected in Table 5. For all restoratives,wear at contact stress of 60 MPa was sig-nificantly greater than that at 20 MPa.Correlation between stress and wear wassignificant for all restoratives. No signifi-cant difference in counter-body loss wasobserved between the different contactstresses for all restoratives with the excep-tion of Z100. For Z100, counter-body loss at60 MPa was significantly greater than atother contact stresses. With the exception ofZ100, no significant correlation wasobserved between stress and counter-bodyloss.
Ranking of surface hardness from small-est to largest KHN was as follows:Silux<Ariston<Surefil<Z100<Dispersalloy.Silux was significantly softer than all theother restoratives. Dispersalloy was signifi-cantly harder than Z100, Ariston andSurefil. Z100 and Surefil was significantlyharder than Ariston. There was no signifi-cant correlation between restorative hard-ness and wear/counter-body loss.
DISCUSSION
The use of composite resins as amalgamsubstitutes in posterior restorations hadbeen limited by their ability to withstandthe physical and mechanical rigors of serv-ice in the oral environment. Although thewear resistance of composites has beensubstantially improved, it is still lowerthan amalgam (Chadwick & others, 1991).To develop more wear-resistant restorativematerials, it is necessary to acquire a deep-er understanding of the fundamentalmechanisms that drive the intra-oral wearprocess. Clinical wear of composites occursat both the occlusal contact (OCA) and con-tact-free areas (CFA). Until recently, muchof the published clinical data on compositewear had concentrated on generalized(CFA) loss of material. Although this type ofwear pattern is important, localized (OCA)
Yap & Others: Influence of Contact Stress on OCA Wear of Composite Restoratives
(7a) Silux Plus, (7b) Z100, (7c) Ariston pHc,(7d) Surefil and (7e) Dispersalloy
(8a) Silux Plus, (8b) Z100, (8c) Ariston pHc,(8d) Surefil and (8e) Dispersalloy
Figure 7. SEMs of the worn surfaces afterwear testing for 20,000 cycles at 20 MPacontact stress. Magnification x1500.
Figure 8. SEMs of the worn surfaces afterwear testing for 20,000 cycles at 40 MPacontact stress. Magnification x1500.
Dow
nloaded from http://m
eridian.allenpress.com/operative-dentistry/article-pdf/26/2/1/1819280/1559-2863-26-2-1.pdf by guest on 17 July 2022
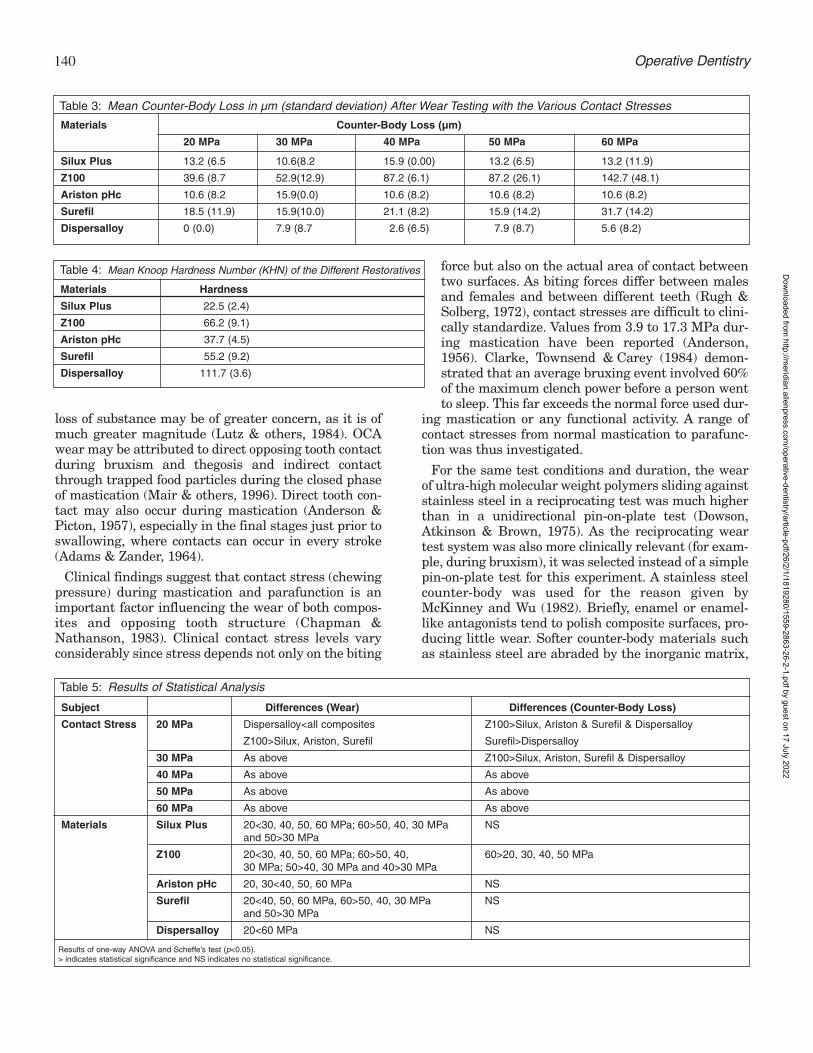
140 Operative Dentistry
loss of substance may be of greater concern, as it is ofmuch greater magnitude (Lutz & others, 1984). OCAwear may be attributed to direct opposing tooth contactduring bruxism and thegosis and indirect contactthrough trapped food particles during the closed phaseof mastication (Mair & others, 1996). Direct tooth con-tact may also occur during mastication (Anderson &Picton, 1957), especially in the final stages just prior toswallowing, where contacts can occur in every stroke(Adams & Zander, 1964).
Clinical findings suggest that contact stress (chewingpressure) during mastication and parafunction is animportant factor influencing the wear of both compos-ites and opposing tooth structure (Chapman &Nathanson, 1983). Clinical contact stress levels varyconsiderably since stress depends not only on the biting
force but also on the actual area of contact betweentwo surfaces. As biting forces differ between malesand females and between different teeth (Rugh &Solberg, 1972), contact stresses are difficult to clini-cally standardize. Values from 3.9 to 17.3 MPa dur-ing mastication have been reported (Anderson,1956). Clarke, Townsend & Carey (1984) demon-strated that an average bruxing event involved 60%of the maximum clench power before a person wentto sleep. This far exceeds the normal force used dur-
ing mastication or any functional activity. A range ofcontact stresses from normal mastication to parafunc-tion was thus investigated.
For the same test conditions and duration, the wearof ultra-high molecular weight polymers sliding againststainless steel in a reciprocating test was much higherthan in a unidirectional pin-on-plate test (Dowson,Atkinson & Brown, 1975). As the reciprocating weartest system was also more clinically relevant (for exam-ple, during bruxism), it was selected instead of a simplepin-on-plate test for this experiment. A stainless steelcounter-body was used for the reason given byMcKinney and Wu (1982). Briefly, enamel or enamel-like antagonists tend to polish composite surfaces, pro-ducing little wear. Softer counter-body materials suchas stainless steel are abraded by the inorganic matrix,
Materials Counter-Body Loss (µm)
20 MPa 30 MPa 40 MPa 50 MPa 60 MPa
Silux Plus 13.2 (6.5 10.6(8.2 15.9 (0.00) 13.2 (6.5) 13.2 (11.9)
Z100 39.6 (8.7 52.9(12.9) 87.2 (6.1) 87.2 (26.1) 142.7 (48.1)
Ariston pHc 10.6 (8.2 15.9(0.0) 10.6 (8.2) 10.6 (8.2) 10.6 (8.2)
Surefil 18.5 (11.9) 15.9(10.0) 21.1 (8.2) 15.9 (14.2) 31.7 (14.2)
Dispersalloy 0 (0.0) 7.9 (8.7 2.6 (6.5) 7.9 (8.7) 5.6 (8.2)
Table 3: Mean Counter-Body Loss in µm (standard deviation) After Wear Testing with the Various Contact Stresses
Materials Hardness
Silux Plus 22.5 (2.4)
Z100 66.2 (9.1)
Ariston pHc 37.7 (4.5)
Surefil 55.2 (9.2)
Dispersalloy 111.7 (3.6)
Table 4: Mean Knoop Hardness Number (KHN) of the Different Restoratives
Subject Differences (Wear) Differences (Counter-Body Loss)
Contact Stress 20 MPa Dispersalloy<all composites Z100>Silux, Ariston & Surefil & Dispersalloy
Z100>Silux, Ariston, Surefil Surefil>Dispersalloy
30 MPa As above Z100>Silux, Ariston, Surefil & Dispersalloy
40 MPa As above As above
50 MPa As above As above
60 MPa As above As above
Materials Silux Plus 20<30, 40, 50, 60 MPa; 60>50, 40, 30 MPa NSand 50>30 MPa
Z100 20<30, 40, 50, 60 MPa; 60>50, 40, 60>20, 30, 40, 50 MPa30 MPa; 50>40, 30 MPa and 40>30 MPa
Ariston pHc 20, 30<40, 50, 60 MPa NS
Surefil 20<40, 50, 60 MPa, 60>50, 40, 30 MPa NSand 50>30 MPa
Dispersalloy 20<60 MPa NS
Table 5: Results of Statistical Analysis
Results of one-way ANOVA and Scheffe’s test (p<0.05).> indicates statistical significance and NS indicates no statistical significance.
Dow
nloaded from http://m
eridian.allenpress.com/operative-dentistry/article-pdf/26/2/1/1819280/1559-2863-26-2-1.pdf by guest on 17 July 2022

141
producing a rough contact surface which theoreticallywears the composite matrix preferentially. This resultsin a “plucking” effect in which the unworn filler parti-cles are removed in their entirety. The “plucking” wearpattern has been observed clinically on posterior com-posite restorations (Abell, Leinfelder & Turner, 1983).As OCA wear is also caused by indirect contact throughtrapped food particles, a more relevant counter-bodyshould be softer than enamel, having the hardnesscloser to that of hard foods. In addition, the OCA wearobserved with bruxism is the sum result of slurry wearduring mastication and sliding wear during the bruxingevent.
For all contact stresses, the amalgam alloy(Dispersalloy) had significantly less wear than compos-ite resins. This agrees with the findings of various clin-ical studies (Chadwick & others, 1991; Lambrechts,Braem & Vanherle, 1987) which compared the clinicalwear of Dispersalloy with composites. Figure 8e showsthe wear site on a Dispersalloy restoration after weartesting for 20,000 cycles at 40 MPa. At the OCA wearfacet, zones of smearing, pitting, scratching anddestructive creep can be observed. The resulting sur-face, however, remains relatively smooth. At 60 MPacontact stress, the surface topography remained rela-tively similar, although wear grooves caused by thestainless steel counter-body and smearing were moreprominent.
Clinical studies showed that wear was less severewith microfilled composites than with minifilled and
midifilled composite resins (Dietschi & Holz, 1990;Lundin & others, 1990). The better OCA or attritionwear of microfills was also generally observed in labo-ratory tests (Condon & Ferracane, 1997; Yap & others,1999) using enamel and cobalt-chromium antagonists.At contact stresses of 40 to 50 MPa, the microfilled com-posite (Silux) in this study also had less wear thanminifilled and midifilled composites. However at lowerstresses of 20 and 30 MPa, the minifilled (Surefil) andmidifilled (Ariston) composites had lower wear than themicrofilled composite. At 60 MPa, Ariston had the leastwear, followed second by Silux. Contact stresses must,therefore, be taken into consideration when rankingwear performance of composite resins.
Although the OCA wear resistance of a microfilledcomposite was reported to be similar to Dispersalloy(143 µm in four years) in the clinical study byLambrechts & others (1987), about 20% of the micro-filled restorations suffered catastrophic failure afterfour years. Silux, used in this experiment, has alsoshown excellent clinical CFA wear resistance after fiveyears but experienced a higher incidence of fracturethan more heavily filled materials (Tyas & Wassenaar,1991). The clinical failure of microfilled compositesoften comes as a surprise to clinicians since the amountof wear prior to fracture is negligible. Other clinicalstudies have demonstrated that microfilled compositesundergo greater marginal degradation and localizedwear in contact sites than do more heavily filled com-posites with larger particles (Bryant, Marzbani &Hodge, 1992; Mazer & Leinfelder, 1992). A currenthypothesis is that inadequate fatigue resistance isresponsible for the accelerated OCA wear and marginaldegradation observed in composites with filler particlesthat average less than 1.0 µm in size (Mazer, Leinfelder& Russell, 1992; Braem, Lambrechts & Vanherle,1994a). Microfilled composites have been shown to havefracture resistance, stiffness and fatigue strength lowerthan those of more heavily filled composites(Drummond, 1989; Willems & others, 1992, Braem &
Yap & Others: Influence of Contact Stress on OCA Wear of Composite Restoratives
Differences
Z100, Ariston, Surefil & Dispersalloy > Silux
Dispersalloy > Z100, Ariston & Surefil
Z100 & Surefil > Ariston
Table 6: Comparison of Surface Hardness Between Materials
Results of one-way ANOVA and Scheffe’s test (p<0.05).
> indicates statistical significance and NS indicates no statistical significance.
Correlations Contact Stress Hardness and Wear Hardness and Counter-Body Loss
20 MPa -0.34 (NS) -0.20 (NS)
30 MPa -0.16 (NS) 0.05 (NS)
40 MPa -0.12 (NS) -0.00 (NS)
50 MPa -0.06 (NS) 0.09 (NS)
60 MPa -0.10 (NS) 0.07 (NS)
Correlations Materials Stress and Wear Stress and Counter-Body Loss
Silux Plus 0.93 (S) 0.52 (NS)
Z100 0.96 (S) 0.75 (S)
Ariston pHc 0.88 (S) -0.11 (NS)
Surefil 0.92 (S) 0.30 (NS)
Dispersalloy 0.60 (S) 0.21 (NS)
Table 7: Results of Pearson Correlation (correlation coefficient)
S indicates correlation is significant at the 0.01 level. NS indicates no statistical significance.
Dow
nloaded from http://m
eridian.allenpress.com/operative-dentistry/article-pdf/26/2/1/1819280/1559-2863-26-2-1.pdf by guest on 17 July 2022

142 Operative Dentistry
others, 1994b). In stress-bearing situations, microfilledcomposites with their low modulus will undergo moredeformation, resulting in possible crack formation andincreased strain on the resin matrix. An additional factorcontributing to their degradation is the fact that thepre-polymerized resin fillers (Figure 7a and 8a) are notwell bonded to the polymer matrix. The resin fillers areheat-cured and do not form covalent chemical bondswith the resin matrix due to the lack of availablemethacrylate groups on their surfaces. They may,therefore, become debonded and dislodged under highstresses. This was, however, not observed for Siluxwear tested at both 40 and 60 MPa. This reinforces theimportance of fatigue in the failure of microfilled com-posites. The composites in this study may not be sub-jected to sufficient fatigue to cause catastrophic failure.From Figures 2 to 6, it can be seen that no wear ratediscontinuity was observed. Rate discontinuity resultsfrom a possible change in wear mode for which wear isenhanced by the generation of subsurface damageresulting from fatigue. The number of cycles (20,000)was limited by fracture of the stainless steel counter-bodies when wear tested with Z100 at high stresses inthe pilot study. The use of microfilled composites forposterior restorations is therefore not advised despitethe low wear found in this study.
The ideal OCA wear factor for the composite restora-tives should be one, but this was not achieved by anycomposites evaluated. Excluding Z100, the OCA wearof composites were generally four to seven timesgreater than amalgam for the various contact stresses.For Z100, OCA wear resistance was 10 to 32 timespoorer than amalgam. The clinical use of composites asamalgam substitutes in larger and more posteriorrestorations is therefore not recommended, especiallyin patients with parafunctional habits where contactstresses can be very high. Differences in contact stressesexperienced in molars and pre-molars (Rugh & Solberg,1972) may account for the markedly different clinicalOCA wear rates. Over a period of four years, steady-wear rates on occlusal contact areas of 29 µm formolars and 15 µm for premolars were reported byLambretchs & others (1989). The wear factor of themicrofilled composite, Silux, remained fairly constantwith increased contact stresses, while the minifilledand midifilled composites (Z100, Surefil and Ariston)generally showed an increase in wear factor withincrease contact stress.
The wear performance of the various composites canbe partially explained by their microstructures.Composites can be considered biphasic, with one phase(fillers) embedded in the other (resin/polymer matrix).From the SEM micrographs of the microfilled com-posite Silux (Figures 7a and 8a), it can be observed thatthe main mechanism of material loss is abrasive wear.The simultaneous loss of both phases does not cause
surface protrusions after wear testing. They thereforemaintain a relatively smooth surface which minimizessurface friction and wear. As the contact stress isincreased, the wear grooves left by the stainless steelcounter-body becomes deeper and more distinct (Figure8a). For the minifilled composite Z100, preferentialwear of the resin matrix occurred, followed by displace-ment or “plucking” of the filler particles as a result offiller-matrix adhesive failure. This was observed asspherical black spaces in Figures 7b and 8b. At contactstresses of 40 and 60 MPa, these black spaces appearedto increase in both size and quantity (Figure 8b). Theformer suggests possible cohesive failure of the polymermatrix, which occurs subsequent to microcrack forma-tion as the protruding intact fillers transmit shearforces to the surrounding matrix. Filler displacementand microcracking were also observed with Surefil andAriston at higher contact stresses (Figures 8c and 8d,respectively). These microcracks were more obviousaround the large fluorosilicate glass fillers (observed asgray to white opaque masses) used in both composites.In addition to wear resulting from filler-matrix adhe-sive failure and cohesive failure through the matrix,shearing of the fluorosilicate glass fillers was alsoobserved (Figures 8c and 8d), as evidenced by their flatsurfaces after wear testing. As with Z100, preferentialwear of the matrix, followed by filler particle displace-ment, was the major perceptible wear mode at 20 MPacontact stress.
In this study the influence of contact stress on wearand counter-body loss was found to be material depend-ent. For the composites, a significant positive correla-tion was observed between stress and wear, that is,greater contact stress results in more wear. The corre-lation coefficient (r) ranged from 0.96 for Z100 to 0.88for Ariston. This is in agreement with past studies(Harrison & Moores, 1985; Lutz, Krejci & Barbakow,1992) conducted on earlier composites which showedthat increases in contact stress significantly enhancedwear. The contact stress on occlusal contact areasshould, therefore, be quantified on restorations ana-lyzed for clinical trials in order to make clinical wearassessment more discriminative and to avoid misinter-pretations. For more conclusive results, it was suggestedthat an adequate number of large, uniformly-sizedstress-bearing MOD restorations be placed in molars offully dentate patients (Lutz & others, 1992). This wouldhelp reduce standard deviations and justify the costs ofclinical wear tests. No correlation was observedbetween surface hardness and wear of the materials.
Counter-body loss was generally less than materialloss and can be attributed to abrasive wear. Abrasivewear occurs when hard asperites plough into softer sur-faces. In this case the asperites are an integral part ofthe composite surface (that is, the inorganic filler par-ticles). The roughened contact surfaces of the stainless
Dow
nloaded from http://m
eridian.allenpress.com/operative-dentistry/article-pdf/26/2/1/1819280/1559-2863-26-2-1.pdf by guest on 17 July 2022
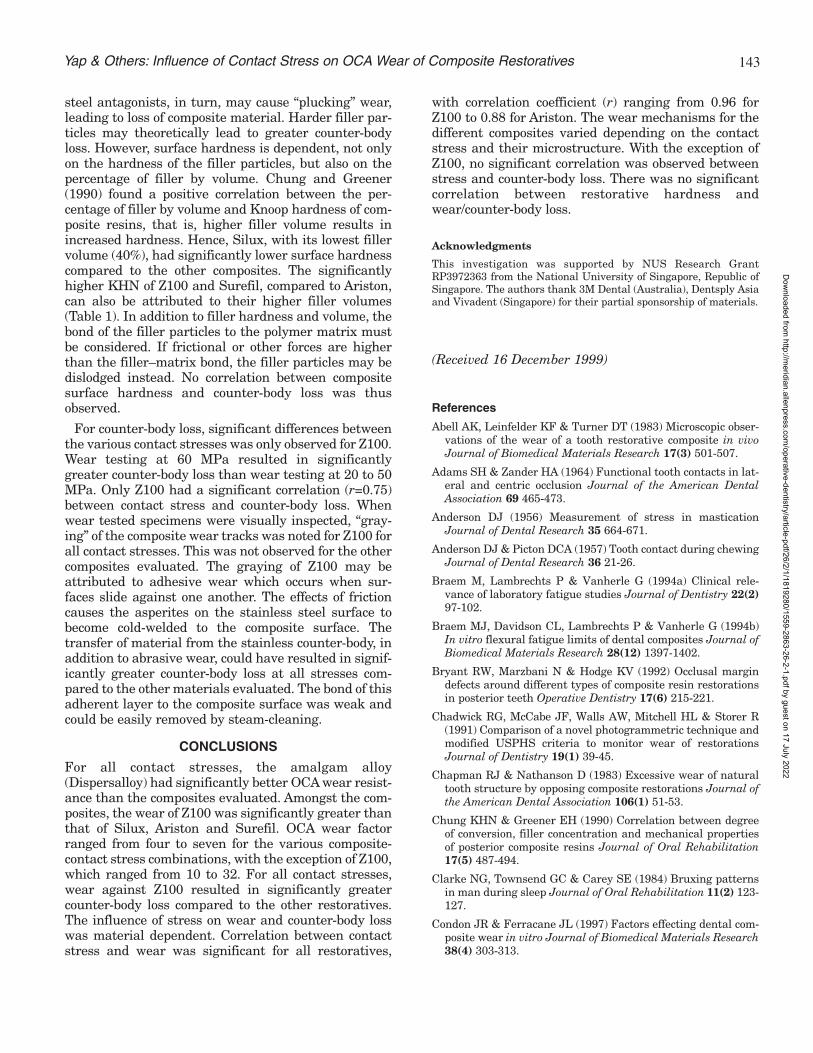
143Yap & Others: Influence of Contact Stress on OCA Wear of Composite Restoratives
steel antagonists, in turn, may cause “plucking” wear,leading to loss of composite material. Harder filler par-ticles may theoretically lead to greater counter-bodyloss. However, surface hardness is dependent, not onlyon the hardness of the filler particles, but also on thepercentage of filler by volume. Chung and Greener(1990) found a positive correlation between the per-centage of filler by volume and Knoop hardness of com-posite resins, that is, higher filler volume results inincreased hardness. Hence, Silux, with its lowest fillervolume (40%), had significantly lower surface hardnesscompared to the other composites. The significantlyhigher KHN of Z100 and Surefil, compared to Ariston,can also be attributed to their higher filler volumes(Table 1). In addition to filler hardness and volume, thebond of the filler particles to the polymer matrix mustbe considered. If frictional or other forces are higherthan the filler–matrix bond, the filler particles may bedislodged instead. No correlation between compositesurface hardness and counter-body loss was thusobserved.
For counter-body loss, significant differences betweenthe various contact stresses was only observed for Z100.Wear testing at 60 MPa resulted in significantlygreater counter-body loss than wear testing at 20 to 50MPa. Only Z100 had a significant correlation (r=0.75)between contact stress and counter-body loss. Whenwear tested specimens were visually inspected, “gray-ing” of the composite wear tracks was noted for Z100 forall contact stresses. This was not observed for the othercomposites evaluated. The graying of Z100 may beattributed to adhesive wear which occurs when sur-faces slide against one another. The effects of frictioncauses the asperites on the stainless steel surface tobecome cold-welded to the composite surface. Thetransfer of material from the stainless counter-body, inaddition to abrasive wear, could have resulted in signif-icantly greater counter-body loss at all stresses com-pared to the other materials evaluated. The bond of thisadherent layer to the composite surface was weak andcould be easily removed by steam-cleaning.
CONCLUSIONS
For all contact stresses, the amalgam alloy(Dispersalloy) had significantly better OCA wear resist-ance than the composites evaluated. Amongst the com-posites, the wear of Z100 was significantly greater thanthat of Silux, Ariston and Surefil. OCA wear factorranged from four to seven for the various composite-contact stress combinations, with the exception of Z100,which ranged from 10 to 32. For all contact stresses,wear against Z100 resulted in significantly greatercounter-body loss compared to the other restoratives.The influence of stress on wear and counter-body losswas material dependent. Correlation between contactstress and wear was significant for all restoratives,
with correlation coefficient (r) ranging from 0.96 forZ100 to 0.88 for Ariston. The wear mechanisms for thedifferent composites varied depending on the contactstress and their microstructure. With the exception ofZ100, no significant correlation was observed betweenstress and counter-body loss. There was no significantcorrelation between restorative hardness andwear/counter-body loss.
Acknowledgments
This investigation was supported by NUS Research GrantRP3972363 from the National University of Singapore, Republic ofSingapore. The authors thank 3M Dental (Australia), Dentsply Asiaand Vivadent (Singapore) for their partial sponsorship of materials.
(Received 16 December 1999)
References
Abell AK, Leinfelder KF & Turner DT (1983) Microscopic obser-vations of the wear of a tooth restorative composite in vivoJournal of Biomedical Materials Research 17(3) 501-507.
Adams SH & Zander HA (1964) Functional tooth contacts in lat-eral and centric occlusion Journal of the American DentalAssociation 69 465-473.
Anderson DJ (1956) Measurement of stress in masticationJournal of Dental Research 35 664-671.
Anderson DJ & Picton DCA (1957) Tooth contact during chewingJournal of Dental Research 36 21-26.
Braem M, Lambrechts P & Vanherle G (1994a) Clinical rele-vance of laboratory fatigue studies Journal of Dentistry 22(2)97-102.
Braem MJ, Davidson CL, Lambrechts P & Vanherle G (1994b)In vitro flexural fatigue limits of dental composites Journal ofBiomedical Materials Research 28(12) 1397-1402.
Bryant RW, Marzbani N & Hodge KV (1992) Occlusal margindefects around different types of composite resin restorationsin posterior teeth Operative Dentistry 17(6) 215-221.
Chadwick RG, McCabe JF, Walls AW, Mitchell HL & Storer R(1991) Comparison of a novel photogrammetric technique andmodified USPHS criteria to monitor wear of restorationsJournal of Dentistry 19(1) 39-45.
Chapman RJ & Nathanson D (1983) Excessive wear of naturaltooth structure by opposing composite restorations Journal ofthe American Dental Association 106(1) 51-53.
Chung KHN & Greener EH (1990) Correlation between degreeof conversion, filler concentration and mechanical propertiesof posterior composite resins Journal of Oral Rehabilitation17(5) 487-494.
Clarke NG, Townsend GC & Carey SE (1984) Bruxing patternsin man during sleep Journal of Oral Rehabilitation 11(2) 123-127.
Condon JR & Ferracane JL (1997) Factors effecting dental com-posite wear in vitro Journal of Biomedical Materials Research38(4) 303-313.
Dow
nloaded from http://m
eridian.allenpress.com/operative-dentistry/article-pdf/26/2/1/1819280/1559-2863-26-2-1.pdf by guest on 17 July 2022

144 Operative Dentistry
Dietschi D & Holz J (1990) A clinical trial of four light-curingposterior composite resins: Two-year report QuintessenceInternational 21(12) 965-975.
Dowson D, Atkinson JR & Brown K (1975) The wear of ultrahigh molecular weight polyethylene In Lieng-Huang Lee (ed)Advances in polymer friction and wear New York: Plenum p533-548.
Drummond JL (1989) Cyclic fatigue of composite restorativematerials Journal of Oral Rehabilitation 16(5) 509-520.
Ferracane JL (1995) Current trends in dental compositesCritical Review in Oral Biology and Medicine 6(4) 302-318.
Harrison A & Moores GE (1985) Influence of abrasive particlesize and contact stress on the wear rate of dental restorativematerials Dental Materials 1 14-18.
Lambrechts P, Braem M & Vanherle G (1987) BuonocoreMemorial Lecture Evaluation of clinical performance for pos-terior composite resins and dentin adhesives OperativeDentistry 12(2) 53-78.
Lambrechts P, Braem M, Vuylsteke-Wauters M & Anherle G(1989) Quantitative in vivo wear of human enamel Journal ofDental Research 68 1752-1754.
Leinfelder KF, Sluder TB, Santos JF & Wall JT (1980) Five-yearclinical evaluation of anterior and posterior restorations ofcomposite resin Operative Dentistry 5 57-65.
Leinfelder KF, Taylor DF, Barkmeier WW & Goldberg AJ (1986)Quantitative wear measurement of posterior resins DentalMaterials 2(5) 198-201.
Lundin SA, Andersson B, Koch G & Rasmusson G (1990) ClassII composite resin restorations: A three-year clinical study ofsix different posterior composites Swedish Dental Journal14(3) 105-114.
Lutz F, Krejci I & Barbakow F (1992) Chewing pressure vs wearof composites and opposing enamel cusps Journal of DentalResearch 71(8) 1525-1529.
Lutz F, Phillips RW, Roulet JF & Setcos JC (1984) In vivo and invitro wear of potential posterior composites Journal of DentalResearch 63(6) 914-920.
Mair LH, Stolarski TA, Vowles RW & Lloyd CH (1996) Wear:Mechanisms, manifestations and measurement Report of aworkshop Journal of Dentistry 24(1-2) 141-148.
Mazer RB & Leinfelder KF (1992) Evaluating a microfill poste-rior composite resin: A five-year study Journal of theAmerican Dental Association 123(4) 32-37.
Mazer RB, Leinfelder KF & Russell CM (1992) Degradation ofmicrofilled posterior composite Dental Materials 8(3) 185-189.
McKinney JE & Wu W (1982) Relationship between subsurfacedamage and wear of dental restorative composites Journal ofDental Research 61(9) 1083-1088.
Phillips RW (1981) Symposium on composite resins in dentistryDental Clinics of North America 25(2) 209-219.
Phillips RW, Avery DR, Mehra R, Swartz ML & McCune RJ(1971) Observations on a composite resin for Class II restora-tions Journal of Prosthetic Dentistry 26(1) 68-77.
Phillips RW, Avery DR, Mehra R, Swartz ML & McCune RJ(1973) Observations on a composite resin for Class II restora-tions: Three-year report Journal of Prosthetic Dentistry 30(6)891-989.
Roulet JF (1997) Benefits and disadvantages of tooth-coloredalternatives to amalgam Journal of Dentistry 25(6) 459-473Review.
Rugh JD & Solberg WK (1972) Measurement of human oralforces Behaviour Research Methodology and Instrumentation4 125-128.
Tyas MJ & Wassenaar P (1991) Clinical evaluation of four com-posite resins in posterior teeth: Five-year results AustralianDental Journal 36(5) 369-373.
Willems G, Lambrechts P, Braem M, Celis JP & Vanherle G(1992) A classification of dental composites according to theirmorphological and mechanical characteristics DentalMaterials 8(5) 310-319.
Yap AU, Ong LF, Teoh SH & Hastings GW (1999) Comparativewear ranking of dental restoratives with the BIOMAT wearsimulator Journal of Oral Rehabilitation 26(3) 228-235.
Zum-Gahr KH (1987) Classification of wear processes. InMicrostructure and wear of materials Amsterdam: Elsevier p80-131.
Dow
nloaded from http://m
eridian.allenpress.com/operative-dentistry/article-pdf/26/2/1/1819280/1559-2863-26-2-1.pdf by guest on 17 July 2022

AUJ Yap • SH Teoh • KB Tan
Three-Body Abrasive Wearof Composite Restoratives
©Operative Dentistry, 2001, 26, 145-151
Clinical Relevance
The use of composites as an amalgam substitute in low stress, contact-free areas exposedto three-body abrasive wear is feasible. Choice of composite material is, however, animportant consideration.
SUMMARY
This investigation studied the three-body abra-sive wear resistance and wear patterns of fivecomposite restoratives. The possible relationbetween three-body wear and surface hardnesswas also investigated. A three-body wear instru-mentation was used to investigate the wear resist-ance of five composite restoratives [Silux Plus(SX), Z100 (ZO), Ariston pHc (AR), Surefil (SF) andTetric Ceram (TC)]. An amalgam alloy[Dispersalloy (DA)] was used as control. Theamalgam alloy (DA) had the lowest three-bodywear (0.3±0.27 µm) and the highest surface hard-ness (KHN 131.5±27.87). TC had the most wear
(2.14±0.58 µm) and SX was the softest restorative(KHN 34.04±2.73). Ranking was as follows: Wearresistance—DA>ZO>SF>AR>SX>TC; Hardness—DA>SF>ZO>TC>AR>SX. With the exception of ZO,DA was significantly more wear resistant than allthe composites evaluated. ZO was significantlymore wear resistant than SX and TC. DA was sig-nificantly harder than all the composites evaluated.SF was significantly harder than AR and SX. Forthe composite restoratives, correlation betweenhardness and wear was significant, with a corre-lation coefficient of r=-0.45. A significant negativebut weak correlation exists between hardnessand three-body wear of composite restoratives.
INTRODUCTIONWear is a natural process that occurs whenever two ormore surfaces contact one another (Zum-Gahr, 1987).With patients keeping their natural dentition longer,the potential for tooth and restoration wear is greaterand is increasingly becoming a clinical problem.Traditionally, three terms—attrition, abrasion and ero-sion—have described the wear of teeth and dentalmaterials. Erosion has been used in dental literature todescribe the surface loss attributed to chemical effects.Attrition describes the surface loss at sites of occlusalcontact and abrasion describes wear at non-contact orcontact-free areas together with a number of other sit-uations which cannot be ascribed to erosion or attrition(Smith, 1989). According to Mair & others (1996), there
Department of Restorative Dentistry, Faculty ofDentistry, National University of Singapore, 5Lower Kent Ridge Road, Singapore 119074,Republic of Singapore
Adrian UJ Yap, BDS, MSc, FAMS, FADM, FRSH,assistant professor, Department of RestorativeDentistry, Faculty of Dentistry, assistant director,Center for Biomedical Materials Applications andTechnology, Faculty of Engineering, NationalUniversity of Singapore
SH Teoh, PhD, BEng, CPENG MIE (Aust), MASAIO,MIM, MASTM, associate professor, director
KB Tan, BEng (Hons), research engineer
Dow
nloaded from http://m
eridian.allenpress.com/operative-dentistry/article-pdf/26/2/1/1819280/1559-2863-26-2-1.pdf by guest on 17 July 2022
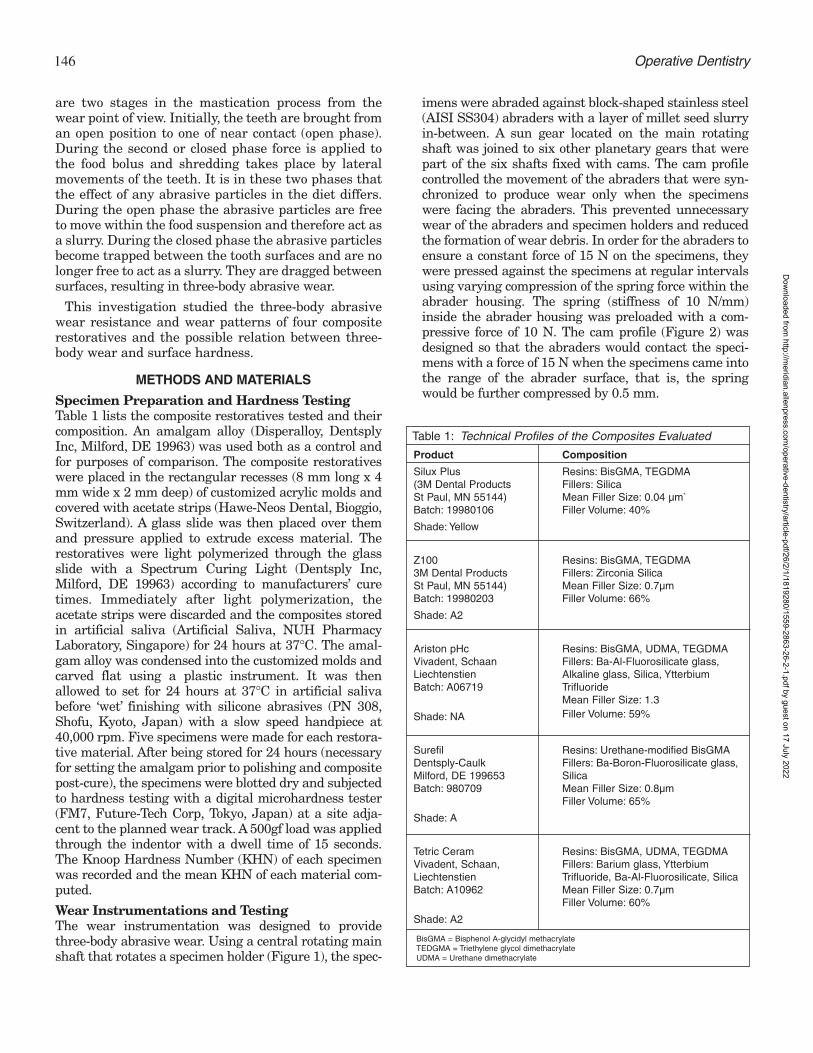
146 Operative Dentistry
are two stages in the mastication process from thewear point of view. Initially, the teeth are brought froman open position to one of near contact (open phase).During the second or closed phase force is applied tothe food bolus and shredding takes place by lateralmovements of the teeth. It is in these two phases thatthe effect of any abrasive particles in the diet differs.During the open phase the abrasive particles are freeto move within the food suspension and therefore act asa slurry. During the closed phase the abrasive particlesbecome trapped between the tooth surfaces and are nolonger free to act as a slurry. They are dragged betweensurfaces, resulting in three-body abrasive wear.
This investigation studied the three-body abrasivewear resistance and wear patterns of four compositerestoratives and the possible relation between three-body wear and surface hardness.
METHODS AND MATERIALS
Specimen Preparation and Hardness TestingTable 1 lists the composite restoratives tested and theircomposition. An amalgam alloy (Disperalloy, DentsplyInc, Milford, DE 19963) was used both as a control andfor purposes of comparison. The composite restorativeswere placed in the rectangular recesses (8 mm long x 4mm wide x 2 mm deep) of customized acrylic molds andcovered with acetate strips (Hawe-Neos Dental, Bioggio,Switzerland). A glass slide was then placed over themand pressure applied to extrude excess material. Therestoratives were light polymerized through the glassslide with a Spectrum Curing Light (Dentsply Inc,Milford, DE 19963) according to manufacturers’ curetimes. Immediately after light polymerization, theacetate strips were discarded and the composites storedin artificial saliva (Artificial Saliva, NUH PharmacyLaboratory, Singapore) for 24 hours at 37°C. The amal-gam alloy was condensed into the customized molds andcarved flat using a plastic instrument. It was thenallowed to set for 24 hours at 37°C in artificial salivabefore ‘wet’ finishing with silicone abrasives (PN 308,Shofu, Kyoto, Japan) with a slow speed handpiece at40,000 rpm. Five specimens were made for each restora-tive material. After being stored for 24 hours (necessaryfor setting the amalgam prior to polishing and compositepost-cure), the specimens were blotted dry and subjectedto hardness testing with a digital microhardness tester(FM7, Future-Tech Corp, Tokyo, Japan) at a site adja-cent to the planned wear track. A 500gf load was appliedthrough the indentor with a dwell time of 15 seconds.The Knoop Hardness Number (KHN) of each specimenwas recorded and the mean KHN of each material com-puted.
Wear Instrumentations and TestingThe wear instrumentation was designed to providethree-body abrasive wear. Using a central rotating mainshaft that rotates a specimen holder (Figure 1), the spec-
imens were abraded against block-shaped stainless steel(AISI SS304) abraders with a layer of millet seed slurryin-between. A sun gear located on the main rotatingshaft was joined to six other planetary gears that werepart of the six shafts fixed with cams. The cam profilecontrolled the movement of the abraders that were syn-chronized to produce wear only when the specimenswere facing the abraders. This prevented unnecessarywear of the abraders and specimen holders and reducedthe formation of wear debris. In order for the abraders toensure a constant force of 15 N on the specimens, theywere pressed against the specimens at regular intervalsusing varying compression of the spring force within theabrader housing. The spring (stiffness of 10 N/mm)inside the abrader housing was preloaded with a com-pressive force of 10 N. The cam profile (Figure 2) wasdesigned so that the abraders would contact the speci-mens with a force of 15 N when the specimens came intothe range of the abrader surface, that is, the springwould be further compressed by 0.5 mm.
Product Composition
Silux Plus Resins: BisGMA, TEGDMA(3M Dental Products Fillers: SilicaSt Paul, MN 55144) Mean Filler Size: 0.04 µm`Batch: 19980106 Filler Volume: 40%
Shade: Yellow
Z100 Resins: BisGMA, TEGDMA3M Dental Products Fillers: Zirconia SilicaSt Paul, MN 55144) Mean Filler Size: 0.7µmBatch: 19980203 Filler Volume: 66%
Shade: A2
Ariston pHc Resins: BisGMA, UDMA, TEGDMAVivadent, Schaan Fillers: Ba-Al-Fluorosilicate glass,Liechtenstien Alkaline glass, Silica, YtterbiumBatch: A06719 Trifluoride
Mean Filler Size: 1.3
Shade: NA Filler Volume: 59%
Surefil Resins: Urethane-modified BisGMADentsply-Caulk Fillers: Ba-Boron-Fluorosilicate glass, Milford, DE 199653 SilicaBatch: 980709 Mean Filler Size: 0.8µm
Filler Volume: 65%
Shade: A
Tetric Ceram Resins: BisGMA, UDMA, TEGDMAVivadent, Schaan, Fillers: Barium glass, Ytterbium Liechtenstien Trifluoride, Ba-Al-Fluorosilicate, SilicaBatch: A10962 Mean Filler Size: 0.7µm
Filler Volume: 60%
Shade: A2
Table 1: Technical Profiles of the Composites Evaluated
BisGMA = Bisphenol A-glycidyl methacrylateTEDGMA = Triethylene glycol dimethacrylateUDMA = Urethane dimethacrylate
Dow
nloaded from http://m
eridian.allenpress.com/operative-dentistry/article-pdf/26/2/1/1819280/1559-2863-26-2-1.pdf by guest on 17 July 2022
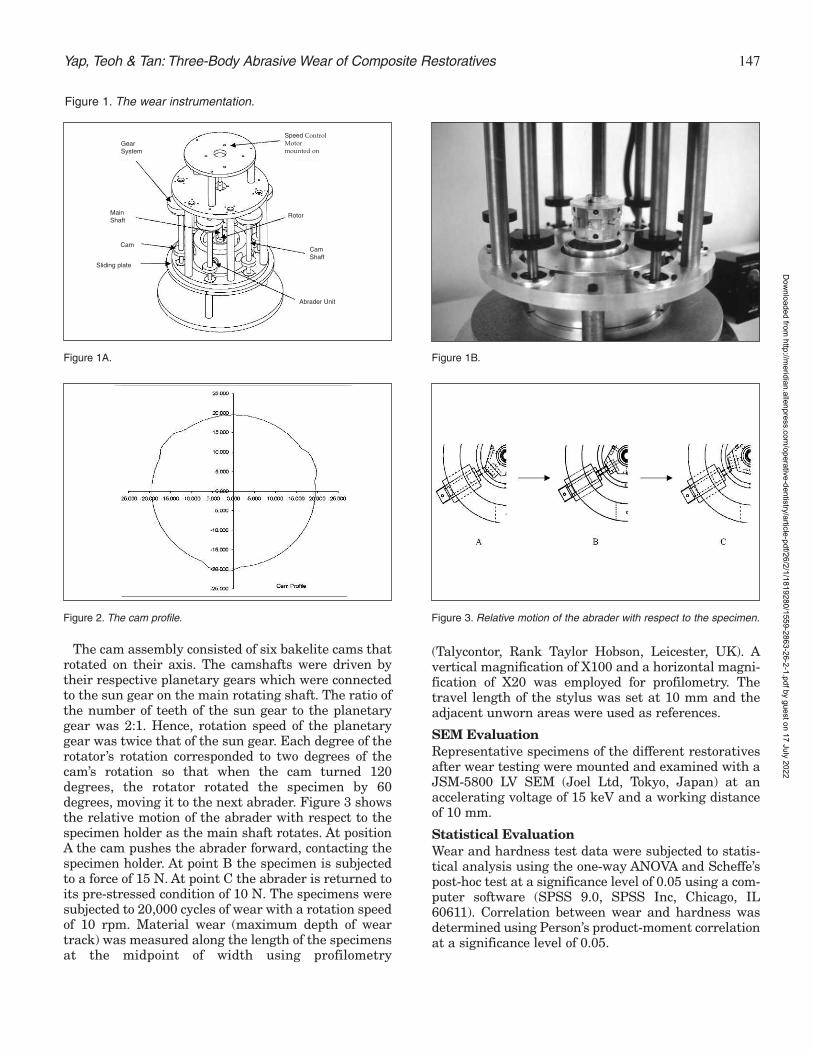
The cam assembly consisted of six bakelite cams thatrotated on their axis. The camshafts were driven bytheir respective planetary gears which were connectedto the sun gear on the main rotating shaft. The ratio ofthe number of teeth of the sun gear to the planetarygear was 2:1. Hence, rotation speed of the planetarygear was twice that of the sun gear. Each degree of therotator’s rotation corresponded to two degrees of thecam’s rotation so that when the cam turned 120degrees, the rotator rotated the specimen by 60degrees, moving it to the next abrader. Figure 3 showsthe relative motion of the abrader with respect to thespecimen holder as the main shaft rotates. At positionA the cam pushes the abrader forward, contacting thespecimen holder. At point B the specimen is subjectedto a force of 15 N. At point C the abrader is returned toits pre-stressed condition of 10 N. The specimens weresubjected to 20,000 cycles of wear with a rotation speedof 10 rpm. Material wear (maximum depth of weartrack) was measured along the length of the specimensat the midpoint of width using profilometry
(Talycontor, Rank Taylor Hobson, Leicester, UK). Avertical magnification of X100 and a horizontal magni-fication of X20 was employed for profilometry. Thetravel length of the stylus was set at 10 mm and theadjacent unworn areas were used as references.
SEM EvaluationRepresentative specimens of the different restorativesafter wear testing were mounted and examined with aJSM-5800 LV SEM (Joel Ltd, Tokyo, Japan) at anaccelerating voltage of 15 keV and a working distanceof 10 mm.
Statistical EvaluationWear and hardness test data were subjected to statis-tical analysis using the one-way ANOVA and Scheffe’spost-hoc test at a significance level of 0.05 using a com-puter software (SPSS 9.0, SPSS Inc, Chicago, IL60611). Correlation between wear and hardness wasdetermined using Person’s product-moment correlationat a significance level of 0.05.
147Yap, Teoh & Tan: Three-Body Abrasive Wear of Composite Restoratives
Figure 1A.
Figure 1. The wear instrumentation.
Figure 1B.
Figure 2. The cam profile. Figure 3. Relative motion of the abrader with respect to the specimen.
Speed ControlMotormounted on
Rotor
CamShaft
Abrader Unit
Sliding plate
Cam
MainShaft
GearSystem
Dow
nloaded from http://m
eridian.allenpress.com/operative-dentistry/article-pdf/26/2/1/1819280/1559-2863-26-2-1.pdf by guest on 17 July 2022

148 Operative Dentistry
RESULTSThe mean hardness values (KHN) and three-body wear(µm) are shown in Table 2 and Figures 4 and 5. Table 3reflects the results of statistical analysis for inter-mate-rial comparison.
Dispersalloy was significantly harder than all thecomposite resins evaluated. For the composite restora-tives, ranking of hardness values from largest to smallestwere as follows: Surefil>Z100>Tetric>Ariston>Silux.Surefil was significantly harder than Ariston and Silux.No other significant difference in hardness wasobserved among the different composites.
Dispersalloy had the least three-body wear. With theexception of Z100, the amalgam alloy was significantly
more wear resistant than all the compositesevaluated. No significant difference inwear was observed between Z100 andDispersalloy. The ranking for compositewear from least to most three-body abrasivewear was: Z100<Surefil<Ariston<Silux<Tetric.Z100 had significantly less three-bodywear than Silux and Tetric. No other sig-nificant differences in three-body wearwere observed between the different com-posites.
Correlation between hardness and wearwas significant at the 0.05 level with a cor-relation coefficient (r) of -0.45. Thus, high-er surface hardness was associated withless three-body abrasive wear. The SEMmicrographs of the wear tracks and adja-cent unworn areas of the different restora-tives are shown in Figures 6 to 11. TheSEM of the unworn areas of all compositesshowed a predominance of microfillers. Allcomposites demonstrated exfoliation offiller particles after three-body abrasivewear testing. Abrasive wear on the amal-gam produced a roughened, scratched sur-face (Figure 11).
DISCUSSION
Wear, as a micromechanical surface inter-action, cannot be observed directly.Scientific knowledge about wear has beendeducted from indirect evidence, such aswear rates, microstructural changes orwear debris type (Sarkar, 1980).Deductions were made in this study fromthe wear measurements and themicrostructural features of the worn com-posite specimens. Three-body abrasivewear has been considered the main wearmechanism active in contact-free areas,resulting in generalized loss of form (Lutz& others, 1984). The forces produced during
the closed phase of mastication have been modeled inthe range of 10 to 20 N (de Gee, Pallav & Davidson,1986; Sakaguchi & others, 1986). A 15 N force wasapplied on the specimens in the three-body wearinstrumentation used in this study. The abraders weremade of stainless steel as recommended by McKinneyand Wu (1982). Enamel or enamel-like abraders arevery hard and tend to polish composite surfaces, pro-ducing little wear. Softer abraders, such as stainlesssteel, are abraded by the hard inorganic fillers, producinga rough contact surface which theoretically wears theresin matrix preferentially.
The wear of modern composite restoratives is sub-stantially better than the first generation composite
Material Hardness [KHN] Three-body Wear [µm]
Silux Plus 34.04 (2.73) 1.88 (0.63)
Z100 62.90 (12.41) 0.66 (0.23)
Ariston pHc 41.50 (3.84) 1.74 (0.25)
Surefil 73.70 (4.83) 1.44 (0.65)
Tetric Ceram 48.18 (2.06) 2.14 (0.58)
Dispersalloy 131.50 (27.87) 0.30 (0.27)
Table 2: Mean KHN and Three-Body Wear
Figures in brackets are standard deviations.
Subject Differences
Hardness Dispersalloy > all compositesSurefil > Silux, Ariston
Three-body Wear Silux, Ariston, Surefil, Tetric > DispersalloySilux, Tetric > Z100
Table 3: Results of Statistical Analysis
Results of one-way ANOVA and post-hoc Scheffe’s tests (p < 0.05); > indicates statistical significance
Figure 4. Mean KHN of the different restoratives.
0
20
40
60
80
100
120
140
160
180
Silux Plus Z100 Ariston pHc Surefil Tetric Ceram Dispersalloy
Materials
Mea
n K
HN
Figure 4. Mean KHN of the different restoratives.
Dow
nloaded from http://m
eridian.allenpress.com/operative-dentistry/article-pdf/26/2/1/1819280/1559-2863-26-2-1.pdf by guest on 17 July 2022

149Yap, Teoh & Tan: Three-Body Abrasive Wear of Composite Restoratives
resins. Wear resistance has been improvedprimarily by the reduction of filler particlesize and increase filler loading. Despitethis, the occlusal contact attrition wear ofcomposites is still higher than amalgam(Chadwick & others, 1991), limiting theirclinical use in posterior teeth. In the cur-rent view of dental composite abrasivewear, three-body action gradually removesthe soft resin matrix between the hardfiller particles. Eventually, the particles areleft unsupported and are easily exfoliated,leaving a layer of unprotected resin. Thislayer of unprotected resin wears away rap-idly and the process continues. This viewhad been substantiated by the dependenceof the abrasive wear rate on the degree ofcure of the polymer resin (Ferracane & oth-ers, 1997) and the relationship between thelevel of filler loading and wear rate(Condon & Ferracane, 1997). SEM evalua-tion of the composite specimens in thisstudy also support the current view of abra-sive wear.
The microstructure of the unworn areasof all composites showed a predominance ofmicrofillers (Figures 6a to 10a). Thisresults from using acetate strips and apply-ing pressure during specimen preparation.Exfoliation of filler particles was observedwith all composites after three-body abra-sive wear. Comparing the SEM micro-graphs of wear tracks and unworn areas ofthe different composites showed a greateroccurrence of black voids on the surfacemicrostructure. Such exfoliation or “pluck-ing” wear patterns has been noted clinicallyon posterior composite restorations (Abell,Leinfelder & Turner, 1983). Themicrostructure of the wear track of Siluxwas particularly different from thatobserved at the unworn areas. This can beattributed to the exposure of the prepoly-merized filler complexes after wear testing(Figure 6b). Exfoliation of the silica micro-fillers was also observed with Silux as withall other composites. Large voids wereobserved, especially with Surefil (Figure9b), and this is associated with the exfoliation of thelarge barium fluoroalumino borosilicate glass particlesthat have a mean diameter of 5.2 µm and the largestdiameter of 9 µm.
The amalgam alloy had the lowest three-body wear.With the exception of Z100, the amalgam alloy experi-enced significantly less wear than all the compositesevaluated. No significant difference in three-body wear
was observed between Dispersalloy and Z100. The wearresistance of Silux and Tetric was significantly lowerthan that of Z100. The choice of composite in non-stressbearing, contact-free areas exposed to abrasive wear istherefore important. Composites with small particles arebelieved to resist abrasion by a protection mechanismin which thin expanses of resin are protected from abra-sive forces by the presence of more closely spaced fillerparticles (Bayne, Taylor & Heymann, 1992). Silux,
Figure 5. Mean three-body wear depth of the different restoratives.
0
0.5
1
1.5
2
2.5
3
Silux Plus Z100 Ariston pHc Surefil Tetric Ceram Dispersalloy
Materials
Mean
Wear
Dep
th (
mic
rom
ete
rs)
Figure 5. Mean three-body wear depth (microns) of the different restoratives.
Figure 6. SEM micrograph of Silux: (a) unworn area, (b) wear track. Magnification x1500.
Figure 7. SEM micrograph of Z100: (a) unworn area, (b) wear track. Magnification x1500.
Dow
nloaded from http://m
eridian.allenpress.com/operative-dentistry/article-pdf/26/2/1/1819280/1559-2863-26-2-1.pdf by guest on 17 July 2022

150 Operative Dentistry
being a microfilled composite, should theoretically bethe most resistant to abrasive wear. The wear resist-ance provided by the microfillers may be mitigated by
the low filler volume (40%). The signifi-cantly better three-body wear resistance ofZ100, as compared to Tetric, could also beexplained in part by filler volume, as themean filler size was similar. Z100 had afiller volume of 66% while Tetric had alower filler volume of 60%. Other factors,including filler type, filler shape and resintype may also play a part in three-body wearbut this could not be determined due to theunsystemic nature of the differences incomposition between materials.
Composite with higher filler volumes,such as Surefil and Z100, exhibited highersurface hardness when compared withcomposites with lower filler volumes. SiluxPlus, with the lowest filler volume, alsohad the lowest surface hardness. For thecomposite restoratives, a significant nega-tive correlation (correlation coefficient r=-0.45) was observed between hardness andabrasive wear. This means that materialswith higher surface hardness are lessprone to three-body abrasive wear (that is,more wear resistant). Attempts had beenmade to relate simple mechanical proper-ties to the abrasion resistance of restora-tive materials. If such a relationship exists,it would satisfy the requirements of a testmethod for research, quality control andstandard specification tests. Resistance toindentation has been studied by manyworkers using either hardness (McCabe &Smith, 1981; Jørgensen, 1980) or scratchtests (Roberts, Powers & Craig, 1977). Thisparameter would be expected to have aconsiderable influence if abrasive wearforms an important part of the wearprocess. Relatively good agreement wasdemonstrated between hardness and in-vitro abrasion resistance (McCabe &Smith, 1981; Jørgensen, 1980). This wasalso found in this study. However, the cor-relation was not strong and more researchmust be conducted on a wide variety ofcomposite types to further validate this.Whether this relationship can be extendedinto in-vivo abrasive wear is yet to be con-firmed as there is a general lack of correla-tion between in vivo and in vitro wear stud-ies (Mair & others, 1996). It is important tonote that the results apply specifically tothree-body abrasive wear and cannot be translated to two-body attrition or occlusalcontact area wear (Yap & others, 1999).
Figure 8. SEM micrograph of Ariston pHc: (a) unworn area, (b) wear track. Magnification x1500.
Figure 9. SEM micrograph of Surefil: (a) unworn area, (b) wear track. Magnification x1500.
Figure 10. SEM micrograph of Tetric Ceram: (a) unworn area, (b) wear track. Magnification x1500.
Figure 11. SEM micrograph of Disperalloy: (a) unworn area, (b) wear track. Magnificationx1500.
Dow
nloaded from http://m
eridian.allenpress.com/operative-dentistry/article-pdf/26/2/1/1819280/1559-2863-26-2-1.pdf by guest on 17 July 2022

151Yap, Teoh & Tan: Three-Body Abrasive Wear of Composite Restoratives
CONCLUSIONS
The amalgam alloy Dispersalloy had the lowest three-body wear and the highest surface hardness. With theexception of Z100, the amalgam alloy was significantlymore wear resistant than all the composites evaluated.Z100 had significantly better three-body wear resist-ance than Silux and Tetric Ceram. A significant butweak correlation exists between three-body abrasivewear resistance and surface hardness. The use of com-posites as an amalgam substitute in low stress, contact-free areas exposed to three-body abrasive wear is feasi-ble. However, choice of composite material is an impor-tant consideration.Acknowledgments
This investigation was supported by NUS Research GrantRP3972363 from the National University of Singapore, Republic ofSingapore. The authors thank 3M Dental (Australia), Dentsply Asiaand Vivadent (Singapore) for their partial sponsorship of materials.
(Received 16 December 1999)
References
Abell AK, Leinfelder KF & Turner DT (1983) Microscopic obser-vations of the wear of a tooth restorative composite in vivoJournal of Biomedical Materials Research 17(3) 501-507.
Bayne SC, Taylor DF & Heymann HO (1992) Protection hypoth-esis for composite wear Dental Materials 8(5) 305-309.
Chadwick RG, McCabe JF, Walls AW, Mitchell HL & Storer R(1991) Comparison of a novel photogrammetric technique andmodified USPHS criteria to monitor the wear of restorationsJournal of Dentistry 19(1) 39-45.
Condon JR & Ferracane JL (1997) In vitro wear of compositewith varied cure, filler level and filler treatment Journal ofDental Research 76(7) 1405-1411.
de Gee AJ, Pallav P & Davidson CL (1986) Effect of abrasionmedium on wear of stress-bearing composites and amalgam invitro Journal of Dental Research 65(5) 654-658.
Ferracane JL, Mitchem JC, Condon JR & Todd R (1997) Wearand marginal breakdown of composites with various degreesof cure Journal of Dental Research 76(8) 1508-1516.
Jørgensen KD (1980) Restorative resins: Abrasion versusmechanical properties Scandinavian Journal of DentalResearch 88 557-568.
Lutz F, Phillips RW, Roulet JF & Setcos JC (1984) In vivo and invitro wear of potential posterior composites Journal of DentalResearch 63(6) 914-920.
Mair LH, Stolarski TA, Vowles RW & Lloyd CH (1996) Wear:Mechanisms, manifestations and measurement. Report of aworkshop Journal of Dentistry 24(1-2) 141-148.
McCabe JF & Smith BH (1981) A method for measuring the wearof restorative materials in vitro British Dental Journal 151(4)123-126.
McKinney JE & Wu W (1982) Relationship between subsurfacedamage and wear of dental restorative composites Journal ofDental Research 61(9) 1083-1088.
Roberts JC, Powers JM & Craig RG (1977) Wear of dental amal-gam Journal of Biomedical Materials Research 11(4) 513-523.
Sakaguchi RL, Douglas WH, DeLong R & Pintado MR (1986)The wear of a posterior composite in an artificial mouth: Aclinical correlation Dental Materials 2(6) 235-240.
Sarkar AD (1980) Dental Tribology. In Friction and Wear NewYork: Academic Press p 380-410.
Smith BGN (1989) Toothwear: Aetiology and diagnosis DentalUpdate 16 204-212.
Yap AU, Ong LF, Teoh SH & Hastings GW (1999) Comparativewear ranking of dental restoratives with the BIOMAT wearsimulator Journal of Oral Rehabilitation 26(3) 228-235.
Zum-Gahr KH (1987) Classification of wear processes In:Microstructure and wear of materials Amsterdam: Elsevier p80-131.
Dow
nloaded from http://m
eridian.allenpress.com/operative-dentistry/article-pdf/26/2/1/1819280/1559-2863-26-2-1.pdf by guest on 17 July 2022

Wear Assessment ofHigh Viscosity and Conventional
Composite RestorativeMaterials
©Operative Dentistry, 2001, 26, 152-156
WW Barkmeier • MA LattaTM Wilwerding • SM Blake
Clinical Relevance
Relative wear rates of composite restoratives are important in the selection of materialsfor the placement of posterior resin restorations. The results of this study indicate thatthere is a significant difference in in-vitro wear rates of resin restorative materials.
SUMMARY
Newer composite restoratives used in the posteriordentition are marketed as high viscosity, condens-able or packable materials. The in-vitro wear char-acteristics of three newer generation materialswere compared to three conventional hybrid com-posites. Specimens were subjected to wear in aLeinfelder wear simulator equipped with a conicalstylus tip to simulate localized wear. Using surfaceprofilometry, computer generated surface mapswere analyzed to determine both volumetric lossand maximum depth of wear facets for the materi-als tested. Volume loss (mm3) was as follows: Z100 –0.010 ± 0.003; SureFil – 0.014 ± 0.004; Alert 0.016 ±0.005; Spectrum TPH – 0.042 ± 0.003; Prodigy – 0.055 ±0.005; Solitaire – 0.062 ± 0.008. Maximum depth ofthe wear facets (mm) was as follows: Z100 – 69.2 ± 8.8;Alert 80.9 ± 15.4; SureFil – 82.6 ± 11.4; Spectrum
TPH – 125.2 ± 15.4; Solitaire – 159.2 ± 14.9; Prodigy –162.9 ± 22.2. The results of this study indicate thatthere are significant differences in the wear ratesof composite materials. However, there was noclear trend that the newer high viscosity compos-ites exhibited superior wear characteristics whencompared to conventional composites.
INTRODUCTION
Wear resistance of composite resin restorative materialsis a major concern in clinical practice for restorationsinvolving posterior occlusion (Swift 1987; Wilson,Mandradjieff & Brindock, 1990; Hu, Marquis &Shortall, 1999). While long-term clinical studies are thebest way to evaluate the durability of these materials,clinical trials are time-intensive and often technicallychallenging to execute. The desire for reliable in vitrowear testing to shorten the time for obtaining mean-ingful data predictive of a material’s clinical perform-ance (Mazer & others, 1992) has been expressed.
Considerable efforts to develop an in vitro test thatcan simulate the masticatory conditions leading tomaterial wear and reliably predict clinical performance(DeGee, Pallav & Davidson, 1986; Sakaguchi & others,1986; Leinfelder, Beaudreau & Mazur, 1989; Suzuki &Leinfelder, 1994) have been made. Kawai andLeinfelder (1995) have described wear as initiated bygeneralized conditions (the type of wear generated by afood bolus during mastication) or localized conditions
Creighton University School of Dentistry,Department of General Dentistry, Omaha, NE68178
WW Barkmeier, DDS, MS, dean and professor
MA Latta, DMD, MS, associate dean and associateprofessor, Department of General Dentistry
TM Wilwerding, chair and associate professor,Department of Prosthodontics
SM Blake, DDS
Dow
nloaded from http://m
eridian.allenpress.com/operative-dentistry/article-pdf/26/2/1/1819280/1559-2863-26-2-1.pdf by guest on 17 July 2022

153Barkmeier & Others: Wear Assessment of High Viscosity and Conventional Composite Restorative Materials
(represented by direct tooth-to-materials contact).While several clinical studies have concentrated on gen-eralized loss of material (Mair, 1990; Freilich & others1992; Tyas & Wassennar, 1991; Dickinson, Gerbo &Leinfelder, 1993), Lutz & others (1984) and Lambrechts,Braem and VanHerle (1985) have suggested that local-ized wear may be more than twice as great as that innon-contact areas.
Leinfelder and colleagues (1989, 1999) developed asystem which transfers masticatory-like stresses to acomposite specimen by means of a flattened polyacetalstylus (generalized wear) or a stainless steel conical stylus(localized wear) in the presence of a slurry of poly-methylmethacrylate beads (PMMA). This system hasbeen used for evaluating the wear characteristics onnumerous dental materials (Suzuki & Leinfelder, 1994;Leinfelder & Broome, 1994; Suzuki & others, 1995;Suzuki, Leinfelder & Shinkai, 1995; Leinfelder &Suzuki, 1999).
Recently developed hybrid composite resins haveshown excellent resistance to wear in clinical trials(Christensen, 1998; Latta & others 1998). Continueddevelopment of composite resins has led to formulationsdesigned to improve the handling characteristics ofthese materials. Of particular note has been the devel-opment of the so-called high viscosity, packable or con-densable composites whose handling has been modifiedto mimic the condensability of amalgam (Leinfelder,Radz & Nash, 1998). These materials employ newapproaches to the glass filler systems and new resinchemistries to theoretically offer superior handling andmechanical properties (product information literature,Dentsply/Caulk, Jeneric Pentron, & Heraeus Kulzer,1999). This new class of composite resins is specificallydesigned for posterior restorations where wear resist-ance is of paramount importance. This studyevaluated and compared the in vitro wearresistance of three new high viscosity compositeresins and three conventional hybrid resins.
METHODS AND MATERIALS
An acrylic-filled custom fixture was used toplace the composite resin materials for testingin a Leinfelder wear simulator. Ten specimensof three high viscosity composite and 10 speci-mens of three conventional hybrid resins (Table1) were prepared. Cavities 6 mm in diameterand 3 mm deep were lathe cut into the customfixture and composite resin materials wereplaced in two increments into the preparedcavity. Each increment of composite was lightpolymerized for 40 seconds using an Optilux500 curing unit (Demetron/Kerr, Danbury, CT06810). The light output, as measured with theinternal radiometer, ranged from 520 to 570mW/cm2. The cavities were slightly overfilled
with the composite materials and the surfaces polishedflat using a sequence of 320 to 4000 grit silicon carbidepapers (SiC paper, Stuers, Eastlake, OH 44145). Thefinal surface finish was generated using 0.05 micronalumina polishing paste (Buehler, Lake Bluff, IL60044).
Prior to wear testing, each specimen was surface pro-filed with an MTS 3D Profiler (MTS SystemsCorporation, Eden Prairie, MN 55344) using Capturesoftware (Figure 1). A tight-fitting cylinder was placedaround the specimens and the assembly mounted intoa water bath fixture in the wear simulator. A slurry ofunplasticized PMMA beads averaging 44 microns indiameter was poured into each cylinder, covering theresin specimens. A conical stainless steel stylus mountedin a spring-loaded piston was used to produce localizedwear. At a rate of approximately 2Hz, the stylus wasvertically loaded onto the specimen at a load of 78.5
High-Viscosity Composites
Alert Jeneric/Pentron IncWallingford, CT 06492
Solitaire Heraeus Kulzer IncSouth Bend, IN 46614
SureFil DENTSPLY CaulkMilford, DE 19963
Conventional Composites
Prodigy Kerr CorporationOrange, CA 92867
Spectrum TPH DENTSPLY CaulkMilford, DE 19963
Z100 3M Dental ProductsSt Paul, MN 55144
Table 1: High-Viscosity and Conventional Composite Restorative Materials
Material Volume Loss (mm3) Maximum Depth (µm)
Z100 0.010 ± 0.003 69.2 ± 8.8
SureFil 0.014 ± 0.004 82.6 ± 11.4
Alert 0.016 ± 0.005 80.9 ± 15.4
Spectrum TPH 0.042 ± 0.003 125.2 ± 15.4
Prodigy 0.055 ± 0.005 162.9 ± 22.2
Solitaire 0.062 ± 0.008 159.2 ± 14.9
Table 2: Mean Wear Rates for Composite Restorative Materials
Groups connected by vertical lines are not different at the 5% significance level.
Sum-of Squares df Mean-Square P
Volume LossSource/Group 0.027 5 210.578 < 0.001
Maximum Depth
Source/Group 86692.321 5 17338.464 < 0.001
Table 3: Analysis of Variance
Dow
nloaded from http://m
eridian.allenpress.com/operative-dentistry/article-pdf/26/2/1/1819280/1559-2863-26-2-1.pdf by guest on 17 July 2022
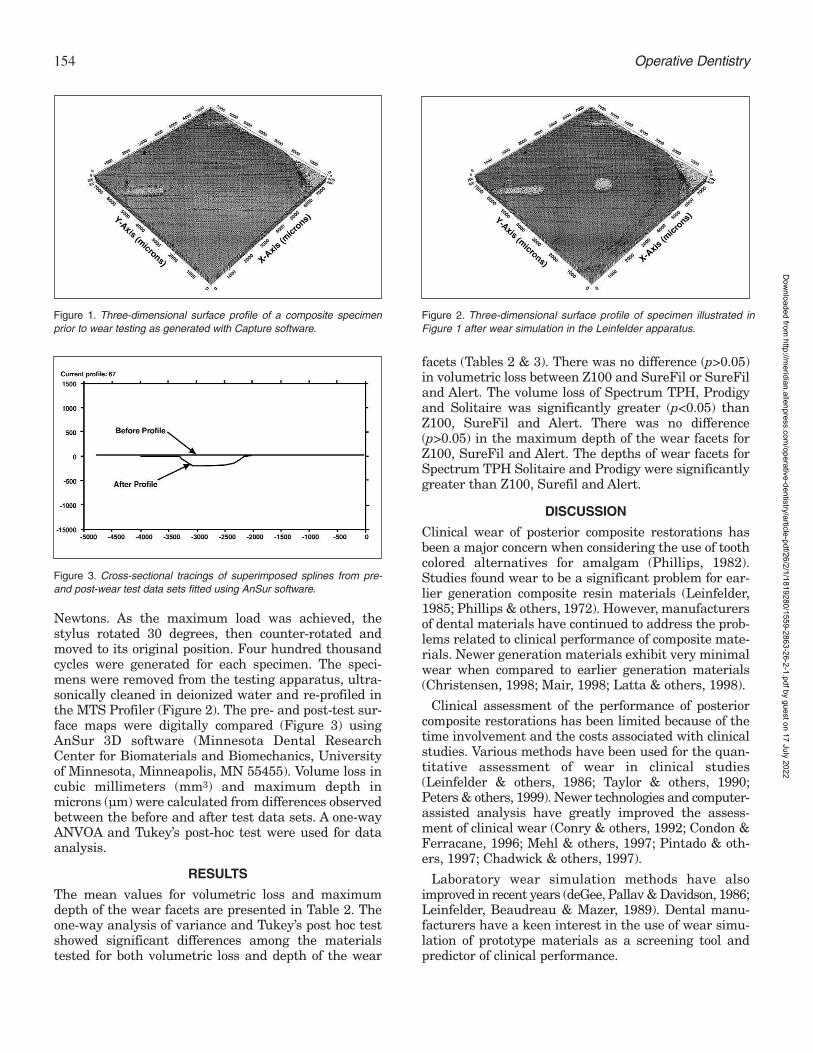
154 Operative Dentistry
Newtons. As the maximum load was achieved, thestylus rotated 30 degrees, then counter-rotated andmoved to its original position. Four hundred thousandcycles were generated for each specimen. The speci-mens were removed from the testing apparatus, ultra-sonically cleaned in deionized water and re-profiled inthe MTS Profiler (Figure 2). The pre- and post-test sur-face maps were digitally compared (Figure 3) usingAnSur 3D software (Minnesota Dental ResearchCenter for Biomaterials and Biomechanics, Universityof Minnesota, Minneapolis, MN 55455). Volume loss incubic millimeters (mm3) and maximum depth inmicrons (µm) were calculated from differences observedbetween the before and after test data sets. A one-wayANVOA and Tukey’s post-hoc test were used for dataanalysis.
RESULTS
The mean values for volumetric loss and maximumdepth of the wear facets are presented in Table 2. Theone-way analysis of variance and Tukey’s post hoc testshowed significant differences among the materialstested for both volumetric loss and depth of the wear
facets (Tables 2 & 3). There was no difference (p>0.05)in volumetric loss between Z100 and SureFil or SureFiland Alert. The volume loss of Spectrum TPH, Prodigyand Solitaire was significantly greater (p<0.05) thanZ100, SureFil and Alert. There was no difference(p>0.05) in the maximum depth of the wear facets forZ100, SureFil and Alert. The depths of wear facets forSpectrum TPH Solitaire and Prodigy were significantlygreater than Z100, Surefil and Alert.
DISCUSSION
Clinical wear of posterior composite restorations hasbeen a major concern when considering the use of toothcolored alternatives for amalgam (Phillips, 1982).Studies found wear to be a significant problem for ear-lier generation composite resin materials (Leinfelder,1985; Phillips & others, 1972). However, manufacturersof dental materials have continued to address the prob-lems related to clinical performance of composite mate-rials. Newer generation materials exhibit very minimalwear when compared to earlier generation materials(Christensen, 1998; Mair, 1998; Latta & others, 1998).
Clinical assessment of the performance of posteriorcomposite restorations has been limited because of thetime involvement and the costs associated with clinicalstudies. Various methods have been used for the quan-titative assessment of wear in clinical studies(Leinfelder & others, 1986; Taylor & others, 1990;Peters & others, 1999). Newer technologies and computer-assisted analysis have greatly improved the assess-ment of clinical wear (Conry & others, 1992; Condon &Ferracane, 1996; Mehl & others, 1997; Pintado & oth-ers, 1997; Chadwick & others, 1997).
Laboratory wear simulation methods have alsoimproved in recent years (deGee, Pallav & Davidson, 1986;Leinfelder, Beaudreau & Mazer, 1989). Dental manu-facturers have a keen interest in the use of wear simu-lation of prototype materials as a screening tool andpredictor of clinical performance.
Figure 1. Three-dimensional surface profile of a composite specimenprior to wear testing as generated with Capture software.
Figure 2. Three-dimensional surface profile of specimen illustrated inFigure 1 after wear simulation in the Leinfelder apparatus.
Figure 3. Cross-sectional tracings of superimposed splines from pre-and post-wear test data sets fitted using AnSur software.
Dow
nloaded from http://m
eridian.allenpress.com/operative-dentistry/article-pdf/26/2/1/1819280/1559-2863-26-2-1.pdf by guest on 17 July 2022

155Barkmeier & Others: Wear Assessment of High Viscosity and Conventional Composite Restorative Materials
Lienfelder (1989) developed a piston-driven wear sim-ulator that can be used for the generation of both local-ized and generalized wear. In a study using a bluntedstylus of hardened steel to produce localized wear,Kawai and Leinfelder (1995) found significant differ-ences in the worn areas of nine composite materials fol-lowing 100,000 cycles. The surface areas of the defectsranged from 17,410 µm2 for P50 to 180,610 µm2 forPrisma APH.
A device similar to the original Leinfelder wearmachine was used in this study to produce localizedwear in six composite resin restorative materials.However, the assessment method was improved byusing before and after digitized profiles and a sophisti-cated software program which generated both volumetricloss and maximum depth of the facet created duringthe cycling process. The results of this study also foundsignificant differences in laboratory wear rates amongthe composites evaluated.
The primary objective of in vitro studies is to help pre-dict in vivo performance. Previously published studieshave shown correlation between in-vitro wear and invivo generalized wear of dental restorative materials(Leinfelder & Suzuki, 1999). Recent clinical trials haveshown minimal generalized wear with newer genera-tion composite restorative materials (Christensen,1998; Mair, 1998; Ferracane & others, 1997). Becauseimproved resin formulations and greater polymeriza-tion conversion of the resin matrix have nearly elimi-nated generalized wear as a reason for clinical failure,localized wear may be more discriminating and clini-cally relevant in assessing the potential of compositematerials. The in vitro localized wear model used inthis study represents an efficient and rapid predictivetool for the wear performance of modern compositeresins.
There is a tremendous demand to develop compositeresins that are easy to use and provide clinical longevitysimilar to amalgam restorations. The newer compos-ites, marketed as high-viscosity, packable or high-den-sity composite, may exhibit more desirable handlingcharacteristics for posterior restorations when com-pared to conventional hybrid composite resins.However, the results of this study indicate that the lab-oratory wear rates of the three newer high viscositycomposites evaluated are similar, and in one case morethan wear rates for conventional or hybrid composites.
CONCLUSIONS
Based on the results of this study, which indicate a sig-nificant difference in in vitro wear rates of resinrestorative materials, it appears that the selection of ahigh viscosity material should not be based solely onthe expectation of superior wear performance.
(Received 4 January 2000)
References
Chadwick RG, Mitchell HL, Cameron I, Hunter B & Tulley M(1997) Development of a novel system for assessing tooth andrestoration wear Journal of Dentistry 25(1) 41-47.
Christensen GJ, (1980) Amalgam vs composite resin: 1998Journal of the American Dental Association 129(12) 1757-1759.
Condon JR & Ferracane JL (1996) Evaluation of composite wearwith a new multi-mode oral wear simulator Dental Materials12(4) 218-26.
Conry JP, Beyer JP, Pintado MR & Douglas WH (1992)Measurement of preventive resin restorations using computerprofilometry Journal of Dentistry for Children 59(3) 177-181.
DeGee AJ, Pallav P & Davidson CL (1986) Effect of abrasionmedium on wear of stress-bearing composite and amalgam invitro Journal of Dental Research 65(5) 654-658.
Dentsply/Caulk SureFil product documentation (1999www.caulk.com/Profiles/SurefilBrochure).
Dickinson GL, Gerbo LR & Leinfelder KF (1993) Clinical evalu-ation of a highly wear resistant composite American Journalof Dentistry 6(2) 85-87.
Ferracane JL, Mitchem JC, Condon JR & Todd R (1997) Wearand marginal breakdown of composites with various degreesof cure Journal of Dental Research 76(8) 1508-1516.
Freilich MA, Goldberg AJ, Gilpatrick RO & Simonsen RJ (1992)Three-year occlusal wear of posterior composite restorationsDental Materials 8(4) 224-228.
Heraeus Kulzer Solitaire product literature (1999) www.kulz-er.com/sol_faq.
Hu X, Marquis PM & Shorttall AC (1999) Two-body in vitro wearstudy of some current dental composites and amalgamsJournal of Prosthetic Dentistry 82(2) 214-220.
Jeneric/Pentron Alert product literature (1999)www.jeneric.com/products/alertoverview.
Kawai K & Leinfelder KF (1995) In vitro evaluation of OCA wearresistance of posterior composites Dental Materials 11(4) 246-251.
Lambrechts P, Braem M & Vanherle G (1995) Accomplishmentsand expectations with posterior composite resins In: PosteriorComposite Resin Dental Restorative Materials Vanherle G &Smith DC, eds, Netherlands, Peter Szule Publishing Co, pp521-540.
Latta MA, Barkmeier WW, Triolo PT, Cavel WT & BlankenauRJ (1998) Three-year clinical evaluation of Z-100 in posteriorrestorations Journal of Dental Research 77 236 abstract 1046.
Leinfelder, KF (1985) Evaluation of clinical wear of posteriorcomposite resins In: Posterior Composite Resin DentalRestorative Materials Vanherle G & Smith DC, eds,Netherlands, Peter Szule Publishing Co, pp 501-510.
Leinfelder KF, Beaudreau RW & Mazer RB (1989) An in vitrodevice for predicting clinical wear Quintessence International20(10) 755-761.
Leinfelder KF & Broome JC (1994) In vitro and in vivo evalua-tion of a new universal composite resin Journal of EstheticDentistry 6(4) 177-183.
Dow
nloaded from http://m
eridian.allenpress.com/operative-dentistry/article-pdf/26/2/1/1819280/1559-2863-26-2-1.pdf by guest on 17 July 2022
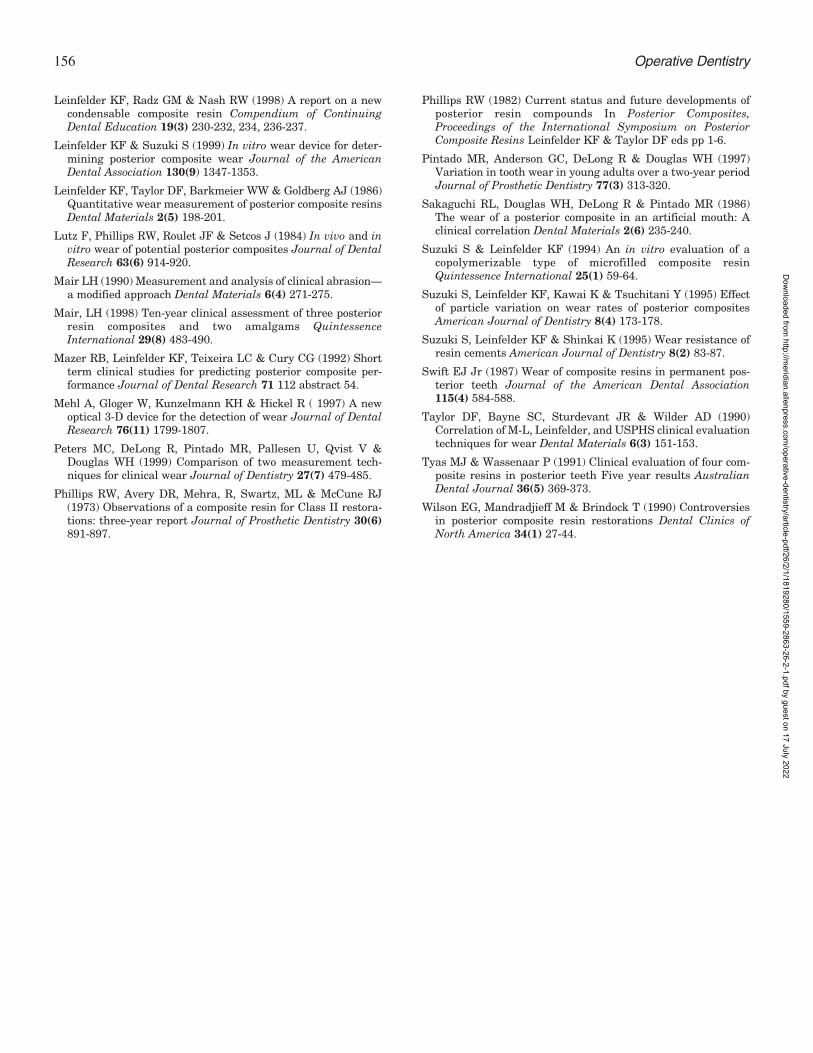
156 Operative Dentistry
Leinfelder KF, Radz GM & Nash RW (1998) A report on a newcondensable composite resin Compendium of ContinuingDental Education 19(3) 230-232, 234, 236-237.
Leinfelder KF & Suzuki S (1999) In vitro wear device for deter-mining posterior composite wear Journal of the AmericanDental Association 130(9) 1347-1353.
Leinfelder KF, Taylor DF, Barkmeier WW & Goldberg AJ (1986)Quantitative wear measurement of posterior composite resinsDental Materials 2(5) 198-201.
Lutz F, Phillips RW, Roulet JF & Setcos J (1984) In vivo and invitro wear of potential posterior composites Journal of DentalResearch 63(6) 914-920.
Mair LH (1990) Measurement and analysis of clinical abrasion—a modified approach Dental Materials 6(4) 271-275.
Mair, LH (1998) Ten-year clinical assessment of three posteriorresin composites and two amalgams QuintessenceInternational 29(8) 483-490.
Mazer RB, Leinfelder KF, Teixeira LC & Cury CG (1992) Shortterm clinical studies for predicting posterior composite per-formance Journal of Dental Research 71 112 abstract 54.
Mehl A, Gloger W, Kunzelmann KH & Hickel R ( 1997) A newoptical 3-D device for the detection of wear Journal of DentalResearch 76(11) 1799-1807.
Peters MC, DeLong R, Pintado MR, Pallesen U, Qvist V &Douglas WH (1999) Comparison of two measurement tech-niques for clinical wear Journal of Dentistry 27(7) 479-485.
Phillips RW, Avery DR, Mehra, R, Swartz, ML & McCune RJ(1973) Observations of a composite resin for Class II restora-tions: three-year report Journal of Prosthetic Dentistry 30(6)891-897.
Phillips RW (1982) Current status and future developments ofposterior resin compounds In Posterior Composites,Proceedings of the International Symposium on PosteriorComposite Resins Leinfelder KF & Taylor DF eds pp 1-6.
Pintado MR, Anderson GC, DeLong R & Douglas WH (1997)Variation in tooth wear in young adults over a two-year periodJournal of Prosthetic Dentistry 77(3) 313-320.
Sakaguchi RL, Douglas WH, DeLong R & Pintado MR (1986)The wear of a posterior composite in an artificial mouth: Aclinical correlation Dental Materials 2(6) 235-240.
Suzuki S & Leinfelder KF (1994) An in vitro evaluation of acopolymerizable type of microfilled composite resinQuintessence International 25(1) 59-64.
Suzuki S, Leinfelder KF, Kawai K & Tsuchitani Y (1995) Effectof particle variation on wear rates of posterior compositesAmerican Journal of Dentistry 8(4) 173-178.
Suzuki S, Leinfelder KF & Shinkai K (1995) Wear resistance ofresin cements American Journal of Dentistry 8(2) 83-87.
Swift EJ Jr (1987) Wear of composite resins in permanent pos-terior teeth Journal of the American Dental Association115(4) 584-588.
Taylor DF, Bayne SC, Sturdevant JR & Wilder AD (1990)Correlation of M-L, Leinfelder, and USPHS clinical evaluationtechniques for wear Dental Materials 6(3) 151-153.
Tyas MJ & Wassenaar P (1991) Clinical evaluation of four com-posite resins in posterior teeth Five year results AustralianDental Journal 36(5) 369-373.
Wilson EG, Mandradjieff M & Brindock T (1990) Controversiesin posterior composite resin restorations Dental Clinics ofNorth America 34(1) 27-44.
Dow
nloaded from http://m
eridian.allenpress.com/operative-dentistry/article-pdf/26/2/1/1819280/1559-2863-26-2-1.pdf by guest on 17 July 2022

©Operative Dentistry, 2001, 26, 157-165
Composite-to-DentinBond Strength,
Micromorphology of theBonded Dentin Interface and
Marginal Adaptation ofClass II CompositeResin Restorations
Using Self-Etching Primers
SUMMARY
This in vitro study 1) investigated the composite-to-dentin bond strength, 2) analyzed the micro-morphology of the resin-dentin interface and 3)evaluated the marginal adaptation of resin com-posite restorations in Class II cavities using
three self-etching priming agents. In the firstpart of the study 30 extracted human thirdmolars were embedded in acrylic resin andground flat with 800-grit paper. The followingthree self-etching priming agents/compositeresins were applied to the dentinal surfaces of 10teeth each: Clearfil Liner Bond 2/Clearfil AP-X(Group I), Etch & Prime 3.0/Degufill mineral(Group II), Resulcin AquaPrime + MonoBond/Arabesk (Group III). Shear bond strengthvalues measured on a T 22 K testing machine(Lloyds Instr) at a crosshead speed of 1 mm/minwere: 21.7 ± 2.6 MPa (Group I), 22.4 ± 1.4 MPa (II)and 29.5 ± 2.5 MPa (III). ANOVA revealed signifi-cant (p<0.001) differences in shear bond strengthbetween groups, except comparison of Group Iand II. In the second part of the study specimenswere prepared by application of the above men-tioned bonding materials to wet-ground dentinalsurfaces of 24 freshly extracted caries-freehuman premolars. Morphology of the resin-
M Hannig • K-J Reinhardt • B Bott
Clinical Relevance
Measurement of shear bond strength and analysis of marginal adaptation in Class II com-posite resin restorations indicate that self-etching priming agents, based on phosphatederivatives of hydrophilic monomers, are effective adhesives for composite-to-dentin bondingrestorative requirements.
Department of Operative Dentistry andPeriodontology, University of Freiburg,Hugstetter Str 55, D-79106 Freiburg, Germany
M Hannig, DDS, PhD, associate professor, universitylecturer
B Bott, DDS, senior research assistant, Clinic ofOperative Dentistry and Periodontology, Universityof Kiel, Arnold-Heller-Str 16, D-24105 Kiel, Germany
K-J Reinhardt, DSc, PhD; associate professor, universityLecturer, Institute for Experimental Dentistry,University of Münster, Waldeyerstr 30, D-48149Münster
Dow
nloaded from http://m
eridian.allenpress.com/operative-dentistry/article-pdf/26/2/1/1819280/1559-2863-26-2-1.pdf by guest on 17 July 2022

158 Operative Dentistry
dentin interface was studied by scanning andtransmission electron microscopic analyses. Tagformation could be detected with all bondingagents. Thickness of the demineralizedzone/resin infiltrated layer at the dentinal sur-face varied from 0.8 to 2.3 µm (Group I), 2.5 to 4.0µm (Group II), 3.5 to 6.5 µm (Group III). In thethird part of the study 18 standardized Class IIcavities with the proximal box extending 0.5 mmbeyond the CEJ were prepared in extractedhuman molars. Enamel margins were beveled,dentinal cavosurface margins were prepared asbutt joint and the teeth were divided into threegroups (n=6, each). Cavities were restored withcomposite resin using the self-etching primingagents Clearfil Liner Bond 2 (Group I), Etch &Prime 3.0 (Group II) and Resulcin AquaPrime +MonoBond (Group III). Marginal adaptation ofthe restorations was analyzed by SEM after ther-mocycling (5-55°C, 2,500 cycles) and mechanicalloading (100 N, 500,000 cycles). Mean/median per-centages of excellent, gap-free marginal adapta-tion observed at the restorations proximal dentinalmargins after loading were 97.5%/99% in Group I,90.7%/98.5% in Group II and 76.3%/98% in GroupIII. There were no statistically significant differ-ences between the three groups (p<0.01). It wasconcluded that the three self-etching primingagents evaluated in this in vitro study have thepotential to provide an effective bondingbetween composite and dentin.
INTRODUCTIONCurrently, the vast majority of effective dentin bondingagents involve acid-etching, rinsing and drying forremoval of the bur-prepared smear layer before primerapplication. The conditioning agent, the priming solu-tion and the adhesive resin are subsequently applied inseparate steps to accomplish the resin-to-dentin bond-ing. With these bonding systems, the demineralizationdepth is frequently greater than the zone of monomerdiffusion and impregnation. The resulting quality ofsuch resin dentin bonding is suspect (Van Meerbeek &others, 1992, 1993; Eick & others, 1997). Recently, self-etching priming agents which serve simultaneously asconditioner and primer without being rinsed off havebeen introduced as dentin adhesive systems(Watanabe, 1992; Chigira & others, 1994; Watanabe,Nakabayashi & Pashley, 1994). The reactive moleculesin these self-etching/self-priming systems are estersfrom bivalent alcohols with methacrylic acid and phos-phoric acid or derivates (Table 1). The combined self-etching, self-priming adhesive agent applied to a dentinalsurface penetrates the substrate via three-dimensional,reticulate channels formed by the self-etching primer(Watanabe & others, 1994; Nakabayashi & Saimi,
1996). Demineralization and monomer infiltration ofthe dentin take place simultaneously, thereby creatinga hybrid layer with no need for separately applied acidetching and priming (Nakabayashi, Nakamura &Nasuda, 1991; Watanabe, 1992; Nakabayashi & Saimi,1996).
In vitro bond strength measurements reveal thepotential of self-etching priming agents in composite-to-dentin as well as composite-to-enamel bonding(Barkmeier, Los & Triolo, 1955; Gordan & others, 1997;Prati & others, 1998; Hannig, Reinhardt & Bott, 1999).The self-etching/self-priming system Clearfil LinerBond 2, which contains the so-called phenyl-P (2-Methacryloyloxyethyl-phenyl-hydrogenphosphate,Table 1) as reactive molecule has been studied exten-sively (Chigira & others, 1994; Watanabe & others,1994; Watanabe, Saimi & Nakabayashi, 1994;Barkmeier & others, 1995; Nakabayashi & Saimi,1996; Yoshiyama & others, 1996, 1998; Miyazaki &others, 1998; Hannig & others, 1999; Ogata & others1999) and is considered a promising material for resincomposite restorations (Hayakawa, Kikutake &Nemoto, 1998). In contrast, only sparse data have beenpublished concerning the bonding potential of morerecently introduced self-etching/self-priming adhesivesystems containing 2-Methacryloyloxyethyl-dihydro-genphosphate and Di-Methacryloyloxyethyl-monohy-drogenphosphate (Table 1) for enamel and dentin etchingpurposes (Reinhardt & Rüter, 1998; Hannig & others,1999).
This in vitro investigation 1) measured the compositeresin-to-dentin shear bond strength after dentin pre-treatment with three different self-etching/self-primingbonding agents, 2) analyzed the micromorphologicalaspect of the resin-dentin interface after application ofthe self-etching primers and 3) evaluated the marginaladaptation of composite resin restorations placed inClass II cavities with proximal margins located indentin by use of these self-etching/self-priming materials.
METHODS AND MATERIALS
Measurement of Shear Bond Strength
Shear bond strength measurement of the three bondingagents and composite resins listed in Tables 1 and 2took place on human dentin. The buccal surfaces of 30crowns cut off from freshly extracted human thirdmolar teeth stored in water were affixed to a glass plateand embedded in self-polymerizing acrylic resin(Technovit; Kulzer, Wehrheim, Germany). The pulpchamber was blocked with cement to prohibit any infil-tration of the monomer into the dentin. Buccal aspectsof the crowns were ground on a wet-grinding disk (800-grit) to expose a dentinal area large enough for theshear bond test. Specimens were divided into three
Dow
nloaded from http://m
eridian.allenpress.com/operative-dentistry/article-pdf/26/2/1/1819280/1559-2863-26-2-1.pdf by guest on 17 July 2022

159
groups (I to III) with 10 specimens each. The dentinwas conditioned by application of the self-etchingbonding agents Clearfil Liner Bond 2 (Group I), Etch &Prime 3.0 (Group II) and Resulcin AquaPrime+MonoBond (Group III) (Table 1). Application of thebonding agents and subsequent light curing adheredstrictly to the manufacturers’ instructions (Table 1).The priming agents were thoroughly rubbed into thedentinal surface with a little brush and left undis-turbed for 30 seconds. The primed surfaces were driedwith a gentle stream of air rather than vigorouslyblown dry. Glass tubes with a diameter of 4 mm weremounted on the pretreated dentin surfaces to apply the
composite resins (Table 2). The glass tubes could be easilyremoved after light curing the composite materials for40-seconds (Translux EC; Kulzer, Wehrheim,Germany). The test objects obtained by this procedurewere stored in water at 37°C for 24 hours prior to theshear bond test. After the specimens had cooled to roomtemperature, their shear bond strength was measuredon a T 22K testing machine (JJ Lloyds Instr, Gerlingen,Germany) at a crosshead speed of 1 mm/min. Statisticalanalysis of comparisons among the materials wereachieved by one-way ANOVA and pairwise multiplecomparison (Tukey-test). The level of significance wasset at p<0.01.
Hannig, Reinhardt & Bott: Self-Etching Primers and Dentin Bonding
Group Product (manufacturer) Components (Lot #) Principle Ingredients Mode/Steps of Application
I Clearfil Liner Bond 2 LB PRIMER liquid A 2-Methacryloyloxyethyl- -mix LB PRIMER liquid A and liquid B(Kuraray Co; (Lot #41134) phenyl-hydrogen- -apply to enamel and dentin for 30 Osaka, Japan) phosphate seconds
N-Methacryloyl-5- -air blow gentlyaminosalicylic acid -apply LB Bond to enamel and dentinEthylalcohol -air blow gently
LB PRIMER liquid B Hydrophilic dimethacrylate -light-cure for 20 seconds(Lot #41134) 2-Hydroxyethyl-
methacrylateWater
LB BOND 10-Methacryloyloxydecyl-(Lot #41178) dihydrogen phosphate
2-HydroxyethylmethacrylateHydrophobic dimethacrylateBis-phenol A diglycidyldi-methacrylateSiO2
II Etch & Prime 3.0 Etch & Prime 3.0 2-Hydroxyethylmethacrylate -mix Etch & Prime 3.0 Universal and(Degussa AG; Universal Ethanol CatalystD-63403 Hanau, (Lot #059703) Water -apply to enamel and dentin for 30Germany) seconds
-air blow gently-light-cure for 10 seconds-repeat the above mentioned steps
Etch & Prime 3.0 Catalyst tetra-Methacryloyloxy(Lot #059703) ethylpyrophosphate*
2-Hydroxyethylmethacrylate
III Resulcin AquaPrime + AquaPrime 2-Methacryloyloxyethyl- -mix AquaPrime with water (1:1)MonoBond (Lot #97200061) dihydrogenphosphate** -scrub into the enamel and dentinal (Merz Dental; surface for 30 secondsD-24319 Lütjenburg, -gently air dry
Germany) -apply MonoBond to enamel and dentin
-air blow gently-light-cure for 20 seconds
MonoBond Bis-phenol A diglycidyldi-(Lot #97200061) methacrylate
Triethylenglycoldi-methacrylatePolymethacryl-oligomaleic acid
Table 1: Bonding Agents Used in Experimental Groups I to III (components, ingredients, application according to manufacturers’ instructions)
* Contrary to the manufacturer’s declaration, no pyrophosphoric acid ester could be detected by NMR-spectroscopy of Etch & Prime 3.0 (Hannig & others, 1999), rather exclusively its hydrolyzed components (2-Methacryloyloxyethyl-dihydrogenphosphate and Di-Methacryloyloxyethyl- monohydrogenphosphate).
** Resulcin AquaPrime also contains Di-Methacryloyloxyethyl- monohydrogenphosphate (Hannig & others, 1999).
Dow
nloaded from http://m
eridian.allenpress.com/operative-dentistry/article-pdf/26/2/1/1819280/1559-2863-26-2-1.pdf by guest on 17 July 2022

160 Operative Dentistry
Micromorphology of the Resin-Dentin-Interface
To evaluate the resin-dentin interface by scanning elec-tron microscopy, the buccal surfaces of 12 extractedhuman premolars were ground down using 600-gritpaper to expose the dentinal surface. The three self-etching bonding agents and composite resin materialslisted in Table 2 were applied to four of these dentinalsurfaces. Application and light curing were performedas described above (Table 1). The bonded samples werefractured perpendicular across the resin-dentin inter-face, demineralized by 30 second phosphoric acid (35%)treatment and deproteinized by 5 min NaOCl (5%)treatment, water-rinsed and air-dried. SEM-analysiswas performed after sputter coating with gold at 1,250xmagnification.
Specimens for transmission electron microscopicanalysis were also cut from 12 freshly extracted caries-free human premolars. The buccal surface wasremoved by wet-grinding with 600-grit paper and theexposed dentin was polished by 1,200 grit paper. Thethree self-etching priming agents were applied to four
dentinal surfaces each, strictly follow-ing the manufacturer’s instructions foreach material (Table 1). No compositeresin was applied to the specimens’surfaces after light curing of the adhe-sive bonding layer. Ultrathin sectionswere cut from the specimens withoutembedding and demineralization on anUltracut E ultramicrotome (Reichert,Benzheim, Germany) equipped with aMicrostar 45° diamond knife. Sectionswere mounted on Pioloform-coatedcopper grids, contrasted with uranylacetate and lead citrate and investigatedin a TEM 201 (Philips, Eindhoven, TheNetherlands) at 80 kV. Representativephotographs were obtained at 3,000 to10,000 fold magnification.
SEM-Analysis of the MarginalIntegrity of Class II CompositeRestorations
Standardized, box-shaped proximo-occlusal cavities with rounded innerangles were prepared in 18 freshlyextracted human third molar teeth.Gingival margins of the proximal boxended 0.5 mm beyond the cemento-enamel junction. Dimensions of proxi-mal box preparations were 4.0 mm inwidth and 1.5 mm in depth (at the bottomof the box). Dimensions of the occlusalisthmus were 2-3 mm in width and 2mm in depth. The cavo-surface mar-gins located in enamel were beveled ata width of 0.5 mm with a diamond fin-
isher. The gingivo-proximal margins located in dentinwere prepared as butt joint. After preparation the teethwere randomly assigned to three experimental groups(I-III), each containing six teeth. Application of bondingagents in Groups I-III was performed according to theprotocol summarized in Table 1 strictly following themanufacturers’ directions. Dehydration and overwet-ting of the dentin was avoided. All priming agents wereapplied in excess during conditioning of the enamel anddentin. Subsequently, the pretreated cavities in GroupsI-III were restored with the fine-particle hybrid com-posite materials listed in Table 2. Before application ofthe composite resin materials, a steel matrix band wasplaced and tightly adapted to the gingivo-proximal cavitymargin. In proximal areas, up to five composite incre-ments with a thickness of less than 1.5 mm wereapplied. At the occlusal part of the cavities the restora-tions were built up in three increments. Each compositelayer was individually light cured for 40 seconds(Translux EC; Kulzer, Wehrheim, Germany) from theocclusal direction. After removing the steel matrix
Group Bonding Agent Composite Resin (Manufacturer)
I Clearfil Liner Bond 2 Clearfil AP-X(Kuraray Co; Osaka, Japan)Lot #0309A
II Etch & Prime 3.0 Degufill mineral(Degussa AG; D-63403 Hanau, Germany)Lot #301
III Resulcin AquaPrime + MonoBond Arabesk(Voco; D- 27457 Cuxhaven, Germany)Lot #55155
Table 2: Composite Resins and Bonding Agents Used in Experimental Groups I to III
Group Bonding Agent Shear Strength [MPa]
I Clearfil Liner Bond 2 21.7 ± 2.6
II Etch & Prime 3.0 22.4 ± 1.4
III Resulcin AquaPrime + MonoBond 29.5 ± 2.5
Table 3: Dentin-to-Composite Bond Strength Measured in Groups I to III (vertical lines indicate significant differences between groups; ANOVA, p<0.001, Tukey-Test p<0.01)
Group Proximal Enamel Margins Proximal Dentinal Margins
Before Loading After Loading Before Loading After Loading
I 99.0 ± 1.7 97.6 ± 3.5 99.2 ± 1.9 97.5 ± 6.1100 99 100 99
II 98.4 ± 2.6 96.1 ± 6.9 98.0 ± 3.0 90.7 ± 19.1100 98 100 98.5
III 98.8 ± 1.8 89.6 ± 15.3 96.6 ± 8.1 76.3 ± 31.8100 91 100 98
Table 4: Marginal Integrity of the Proximal Region of the Restorations Expressed as Mean Percentages (± standard deviations) and Medians of Perfect, Continous Gapfree Marginal Adaptation (before and after thermo-mechanical loading)
Dow
nloaded from http://m
eridian.allenpress.com/operative-dentistry/article-pdf/26/2/1/1819280/1559-2863-26-2-1.pdf by guest on 17 July 2022

161Hannig, Reinhardt & Bott: Self-Etching Primers and Dentin Bonding
band, additional light curing was performed for 60 sec-onds from the buccal and lingual aspects. Removingexcesses, contouring and final finishing of the restora-tions were performed with diamond finishers(Composhape H40/H15; Intensiv, Lugano, Switzerland)and flexible disks of decreasing grain sizes (Sof-LexPop-On; 3M, St Paul, MN, USA).
After placement of the restorations the teeth weresubjected in sequence to thermal cycling and occlusalload. Thermal cycling included 2,500 cycles within atemperature range of 50 K for the duration of 60 sec-onds at a minimum temperature of 5°C and a maxi-mum of 55°C. The occlusal load involved 500,000 cycleswith a force of 100 N. A stamp made of Co-Cr-Mo-alloy(Remanium CD; Dentaurum, Pforzheim, Germany)and coated with composite served as the antagonistduring occlusal load. Load was applied to the restoredteeth axially via the antagonist resting solely on theocclusal surface of the composite resin fillings.
Marginal integrity of the restorations was analyzedby scanning electron microscopy performed on epoxyresin replica models (Stycast; Grace, Westerlo,Belgium) before and after in vitro load. Marginal adap-tation of the fillings was evaluated in steps of 100 µmat a 300x magnification according to the following mor-phologically defined parameters: “perfect margin,”defined as a continuous, gap-free transition betweenfilling and dentin or enamel, respectively; “marginalgap” (gap formation/loss of interfacial adhesion); “over-hang;” and “marginal irregularity,” characterized as anon-continuous, yet gap-free transition between fillingand dentin or enamel. Means and medians for the per-centage distribution of the varying qualities of marginaladaptation in the three groups were calculated for thegingival margins located in dentin as well as for theproximal margins located in enamel. Statistical analysestook place with non-parametrical tests (H-test accord-ing to Kruskal-Wallis at a 0.01 level of significance, theMann-Whitney U-test for pairwise comparison of thegroups with a Bonferroni-adjusted p-value of 0.01 andthe Wilcoxon test for pre- and post-loading comparisonswithin groups at a 0.05 level of significance).
RESULTS
Shear Bond Strength
Table 3 summarizes the results of the shear bondstrength measurement. ANOVA indicated significant dif-ferences (p<0.001) between groups. The application ofResulcin AquaPrime + MonoBond resulted in the signifi-cantly highest shear bond strength (29.5 MPa). The appli-cation of Etch & Prime 3.0 and Clearfil Liner Bond 2resulted in significantly lower values of shear bondstrength (22.4 MPa and 21.7 MPa, respectively). Shear bondstrength values using Clearfil Liner Bond 2 and Etch &Prime 3.0 showed no statistically significant differences.
Scanning Electron Microscopic Analysis of theAdhesive Resin-Dentin Interface
Characteristic SEM micrographs of representativespecimens from Groups I-III are found in Figures 1a-c.SEM showed resin tag formation of different morphology
Figure 1. SEM micrographs showing the resin composite (Rc)-dentin (d) interfaces of fractured, demineralized and deproteinizedspecimens treated with Clearfil Liner Bond 2 (a), Etch & Prime 3.0(b), and Resulcin AquaPrime + MonoBond (c). Arrows indicate thehybrid layer (resin-infiltrated layer). Note the funnel-shaped mor-phology of the resin tags (triangle markers) directly adjacent to thehybrid layer in micrographs b and c indicating hybridization of theperitubular dentin. The resin tags exhibit multiple lateral extensionsin micrographs b and c. Original magnification: x1,250; bar indicates10 µm.
Dow
nloaded from http://m
eridian.allenpress.com/operative-dentistry/article-pdf/26/2/1/1819280/1559-2863-26-2-1.pdf by guest on 17 July 2022

162 Operative Dentistry
and length depending on the self-etching dentin bond-ing agent used. Tags measured 10-40 µm (Group I andII) and 10- 70 µm (Group III) in length. Treatment withLiner Bond 2 revealed a very thin hybrid layer of ca 1µm thickness in SEM micrographs (Figure 1a), where-as application of Etch & Prime 3.0 and ResulcinAquaPrime resulted in resin-infiltrated zones of 2.5- 4µm and 3.5-6 µm thickness, respectively. Adjacent tothe hybrid layer, resin tags appeared funnel-shaped inGroups II and III. There were few extensions of theresin tags into the lateral branches of the dentinaltubules in Group I. When the dentin was treated withEtch & Prime 3.0 (Group II) and Resulcin AquaPrime(Group III), many resin tags exhibited lateral exten-sions.
Transmission Electron MicroscopyTransmission electron microscopic analysis of theadhesive-dentin interface revealed ultrastructurallydifferent resin-infiltrated dentin surface layers afterapplication of the three self-etching primers (Figure2a-c). In TEM micrographs from ultrathin sections ofspecimens belonging to Group III (Resulcin AquaPrime
+ MonoBond) the dentinalsurface appeared lessaltered by the self-etchingpriming agents as com-pared to specimens ofGroups I (Clearfil LinerBond 2) and II (Etch &Prime 3.0). In Groups Iand II a rather abrupttransition existedbetween the base of theresin-infiltrated layer andthe adjacent mineralizeddentin, whereas in GroupIII the transition betweenthe partially demineral-ized superficial dentinand the unaltered dentinwas smooth rather thandemarcated. Thickness ofthe demineralized resin-infiltrated intertubulardentinal surface layer was0.8 to 2.3 µm in Group I,2.5 to 4.0 µm in Group IIand 3.5 to 6.5 µm inGroup III.
In all three groups thesuperficial dentin layerwas characterized by aloose meshwork of dem-ineralized collagenous fib-rils which showed the typ-ical cross-banding in lon-
gitudinally sectioned fibrils, particularly near thedentinal surface. In Groups I and II, the deeper zone ofthe resin-infiltrated layer adjacent to the mineralizeddentin appeared less dense than the outer zone. At thedentinal surface there was no evidence for residues ofthe original smear layer. Longitudinally-sectioned col-lagen fibrils at the top of the resin-infiltrated layer inall three groups were often directed upward andappeared frayed at their ends (Figure 2).
Quantitative Marginal Analysis
The results reported in this study refer to the percent-ages of gap-free perfect marginal adaptation (Table 4)as well as marginal gap formation as a loss of interfa-cial adhesion (that may be relevant for clinical failureof the restorations). Overfilled margins and marginalirregularities represented insignificant percentages ofless than 0.5%. Therefore, these data are not reported.
The proximal, dentinal and enamel margins of therestorations in Groups I-III revealed high rates of “per-fect” marginal adaptation after application of the fill-ings, reaching levels of more than 96% (Table 4). No
Figure 2. TEM micrographs illustrating the resin-infiltrated dentinal surface layer obtained after application ofClearfil Liner Bond 2 (a) Etch & Prime 3.0 (b) Resulcin AquaPrime + MonoBond (c) arrows indicate the transitionof the hybrid layer (demineralized, resin-infiltrated dentin) and the unaltered (non-demineralized) dentin. The elec-tron density of the hybrid layer gradually diminishes from the dentinal surface toward the transition to the unal-tered dentin. In micrograph c multiple electron-lucent channels separating the collagenic fibrils inside the hybridlayer are detectable. Note the crossbanding of the collagenic fibrils in micrograph a (*). Microfiller particles belongingto the LB Bond resin can be seen above the hybrid layer in micrograph a. Original magnification: x 10,000 (a,b),x 7,000 (c).
Dow
nloaded from http://m
eridian.allenpress.com/operative-dentistry/article-pdf/26/2/1/1819280/1559-2863-26-2-1.pdf by guest on 17 July 2022

163Hannig, Reinhardt & Bott: Self-Etching Primers and Dentin Bonding
significant differences were found between groups. Thequality of the marginal adaptation decreased onlyslightly and insignificantly as a result of thermo-mechanical loading in Groups I and II (Table 4),whereas in Group III, a significant (p<0.05) increase ingap formation due to the loading tests was observed atthe dentin-restoration interface. However, differencesbetween Groups I, II and III with respect to the per-centage frequency of “perfect margins” as well as mar-ginal gaps after loading were not statistically signifi-cant (p>0.01). Mean (median) percentages of gap for-mation at the proximal margins located in dentin afterthermo-mechanical loading were 2.5±6.1 (median: 0)in Group I, 9.2±19.1 (median: 0) in Group II and23.7±31.8 (median: 2.0) in Group III. Debonding at thedentin restoration interface consistently took place atthe top of the hybrid layer (resin adhesive layer).
DISCUSSION
Concerning the dentin-adhesive resin bonding viahybridization, the depth of demineralization and thedepth of monomer diffusion have to be considered.Self-etching priming agents are very effective in pene-trating the dentin while simultaneously promotingmonomer impregnation at the same depth(Nakabayashi & Saimi, 1996). Hybridization createdin this way is free from defects and shows a continuoustransition from resin to non-demineralized dentin asclearly seen in the non-decalcified TEM micrographs ofthe three products evaluated in this study. However, asalso shown by the SEM and TEM investigation, thehybrid layer produced by the Clearfil Liner Bond 2 sys-tem was very shallow, with a depth of only 0.8 to 2.3µm. Similar data (ca 1 µm thick resin-infiltrated layer)has been previously published for Clearfil Liner Bond2 (Yoshiyama & others, 1996, 1998; Hayakawa & oth-ers, 1998; Ogata & others 1999). Despite the limitedresin-infiltrated dentinal surface layer, the ClearfilLiner Bond 2 is known to produce high immediatebond strengths (Gordan & others, 1997; Prati & oth-ers, 1998). In this study shear bond strength values ofClearfil Liner Bond 2 were in the same magnitude asthose measured for the Etch & Prime 3.0 system whichcaused formation of a 2.5 to 4.0 µm thick hybrid layer.Resulcin AquaPrime + MonoBond, however, character-ized by the most extensive hybrid layer formation inthis investigation, revealed significantly higher com-posite-to-dentin shear bond strength as compared tothe other two bonding systems.
SEM and TEM investigations revealed distinct dif-ferences in the ultrastructural appearance and thick-ness of the intertubular resin-infiltrated layer dependingon the particular self-etching priming agent used. Thedifferences in the interfacial hybridization process toproduce the resin-dentin bond could be explained bythe specific etching components contained in the
primer solutions of the bonding agents. Etch & Prime3.0 and Resulcin AquaPrime contain considerablymore acidic 2-Methacryloyloxyethyl-dihydrogenphos-phate and Di-Methacryloyloxyethyl-monohydrogen-phosphate, while Clearfil Liner Bond 2 containsphenyl-P along with methacryloyl-aminosalicylic acidas reactive agents. The ultrastructural differences inhybrid layer formation observed after application ofEtch & Prime 3.0 and Resulcin AquaPrime, which con-tain similar self-etching molecules, could be related tothe fact that Resulcin AquaPrime is a mixture of waterwith phosphoric acid esters, whereas Etch & Primecontains water, ethanol and HEMA in the primer solu-tion. In the case of Resulcin AquaPrime, the purelywater-based solution might have favored dissociationof the phosphoric acid residues in primer molecules,causing deeper demineralization of the dentinal sur-face as compared to the application of Etch & Prime3.0. The extensive tag formation observed with allthree self-etching priming agents reflects the good wet-ting and penetration properties of the ethanol/water orsolely water-based bonding materials.
Due to its intrinsic acidity, the self-etching primer isable to penetrate the smear layer and the dentinal sur-face and thereby creates a three-dimensional reticu-late system of diffusion channels around the dentincollagen fibrils (Nakabayashi & Saimi, 1996) (Figure2). As the self-etching process proceeds into the inter-tubular dentin, the perifibril porosities previouslyoccupied by apatite crystallites become filled with theself-etching primer solution which must reach near-saturation levels of calcium and phosphate (Eick &others, 1997). Since the primer is not rinsed but onlyair-dried, the calcium and phosphate ions that weresolubilized from the hydroxy-apatite crystals must besuspended in the watery solution of the primer. Whenthe water is evaporated, the concentrations of calciumand phosphate in the interfibril spaces may exceed thesolubility product constants for a number of calciumphosphates (Yoshiyama & others, 1996). Presumably,these minerals might precipitate as amorphous calciumphosphate particles dispersed throughout the resininfiltrated layer, like a colloidal suspension (Eick &others, 1997). The high concentrations of calcium andphosphate will tend to limit further dissolution of theapatite and thereby quickly limit the depth of surfacedemineralization (Yoshiyama & others, 1996; Eick &others, 1997). In addition, buffer capacity of thedentin, evaporation of water during air drying andlight curing of the primer and subsequently appliedbonding agents will restrict and inhibit the self-etchingeffect of the primer molecules.
The establishment and maintenance of an effectivemarginal seal should be a major criterion in evaluationof materials and techniques for Class II compositeresin restorations (Garberoglio, Coli & Brännström,
Dow
nloaded from http://m
eridian.allenpress.com/operative-dentistry/article-pdf/26/2/1/1819280/1559-2863-26-2-1.pdf by guest on 17 July 2022

164 Operative Dentistry
1995). Adhesion of composite resin materials to enamelhas become a routine and reliable aspect in restorativetreatment of Class II cavities (Swift, Perdigão &Heymann, 1995; Hannig & others, 1999), but dentinaladhesion has proved to be more difficult and less pre-dictable. The ability to render a non-leaking, gap-freeClass II composite resin restoration beyond the cemen-to-enamel junction depends on how the dentin adhe-sive/bonding agent performs in resisting polymeriza-tion contraction, thermal and occlusal loading stresseson the resin composite (Retief, 1994). After placementof the restorations, high rates of more than 96% gap-free perfect marginal seal were established in all testgroups at the interface both between restoration mate-rial and enamel and dentin. Thus, polymerizationshrinkage alone did not cause any significant marginaldisintegration at the cervico-proximal area of the ClassII restorations placed with the adhesive-restorativematerial combinations chosen in this study. Similarfindings have been previously reported by Da cunhaMello & others (1997).
Concerning the median values of perfect marginaladaptation obtained in Groups I, II and III after ther-mocycling and mechanical loading, all three materialcombinations tested in this study provided a satisfac-tory marginal integrity in Class II cavities with proxi-mal margins located in dentin. However, loading testsled to a significant loss of the restorations’ seal at thecervical dentinal margins in Group III, whereas inGroups I and II no significant load-induced marginaldisintegration could be detected. In addition, a greatervariability in the percentages of perfect marginalintegrity was observed with the Resulcin AquaPrime +MonoBond (Group III) as compared to the ClearfilLiner Bond 2 and Etch & Prime 3.0 systems. Onemajor difference among the three self-etching primingagents tested in this study is that Clearfil Liner Bond2 and Etch & Prime 3.0 have alcohol as a solvent intheir composition, compared to Resulcin AquaPrime +MonoBond, which is a solely water-based system. Thealcohol containing systems showed less variability inmarginal sealing compared to the water-based system.The presence of alcohol in the priming solution mighthave favored evaporation of water during air drying ofthe primer treated dentinal surface.
Water persisting within the bonding resin couldadversely affect co-polymerization between therestorative material and the adhesive treated dentinalsurface, thereby causing marginal disintegration duringthermo-mechanical loading of the composite resinrestorations. Further studies are underway to clarifythese presumptions.
The data on the excellent marginal adaptation of theLiner Bond 2 fillings in Class II cavities after in vitroloading match previous findings indicating that only asmall decrease in bond strength to dentin is observed
after extensive thermal cycling (30,000 cycles) of LinerBond 2 specimens (Miyazaki & others, 1998). The Etch& Prime 3.0 bonding system evaluated in this study, incombination with a composite resin material, also per-forms well in combination with an Ormocer material inClass II cavities with proximal margins located indentin (Hannig & Bott, 2000). Comparison of the presentdata on marginal integrity obtained by the use of theself-etching bonding agents with data on marginal sealachieved with other adhesive systems is limited by thefact that only few studies have been published on themarginal adaptation of Class II composite restorationsusing a similar experimental design of in vitro loadingas in this study. Gap formation on less than 10% of thedentin-filling interface after in vitro loading was foundin Class II composite restorations placed by use of theScotchbond Multi-Purpose or the All-Bond 2 adhesivesystem after total etching with phosphoric acid(Thonemann & others, 1999). Dietschi & Herzfeld(1998) reported a value of 74.6% continuous margins atthe cervico-proximal area of direct Class II compositeresin restorations after thermal cycling and mechanicalloading when using the Syntac Classic adhesive sys-tems. These results indicate that the self-etching primingagents evaluated in this study have at least the samepotential as the well established adhesive systemsmentioned above to provide a load resistant adaptationat the dentinal proximal margins of Class II compositeresin restorations.
Previous studies concerning the effect of the smearlayer on dentinal bonding mediated by self-etchingadhesive materials indicated that the smear layershould possibly be removed prior to application of theself-etching primer even when reinforced by diffusedand polymerized resin (Watanabe & others, 1994;Toida, Watanabe & Nakabayashi, 1995). However, nospecial treatment for smear layer removal was per-formed in this study; nevertheless, high percentages ofcontinuous gap-free marginal adaptation were detected.Therefore, a separate previous removal of the smearlayer does not appear essential for obtaining a perfectmarginal adaptation when using self-etching primingagents.
High levels of gap-free marginal adaptation wereobtained not only at the restoration-dentin interfacebut also at the restoration’s proximal margins locatedin enamel using the self-etching primers. These resultsare consistent with other data on the marginal adap-tation of Class II composite resin restorations placedby use of self-etching priming agents without phos-phoric acid pretreatment of the enamel (Hannig & oth-ers, 1999).
CONCLUSIONS
The results of this in vitro study indicate that self-etching primers are effective in conditioning the dentinal
Dow
nloaded from http://m
eridian.allenpress.com/operative-dentistry/article-pdf/26/2/1/1819280/1559-2863-26-2-1.pdf by guest on 17 July 2022

165Hannig, Reinhardt & Bott: Self-Etching Primers and Dentin Bonding
surface to secure a durable bonding and marginal sealof composite resin restorations.
The composite-to-dentin bond strengths attained bythe three tested self-etching primers were comparableto that attained by the conventional acid-etch tech-nique at the enamel surface. Hybrid layer formation, aswell as extensive tag formation, could be observed withthe three self-etching/self-priming systems involved inthis investigation. However, depending on the particularself-etching primer used, distinct differences in ultra-structural appearance and thickness of the resin-infil-trated layer were detected.
Placement of Class II composite resin restorationsusing self-etching primers revealed a satisfactory mar-ginal adaptation at the restoration’s margins located indentin and enamel even after thermo-mechanical loading.
Acknowledgments
The authors thank Mrs Astrid Röhl for her skillful assistance withthe scanning electron microscopic analyses and Mrs Wiebke Hoth forthe transmission electron microscopic analysis of the specimens.
(Received 4 January 2000)
References
Barkmeier WW, Los SA & Triolo PT (1995) Bond strengths andSEM-evaluation of Clearfil Liner Bond 2 American Journal ofDentistry 8(6) 289-293.
Chigira H, Yukitani W, Hasegawa T, Manabe A, Itoh K,Hayakawa T, Debari K, Wakumoto S & Hisamitsu H (1994)Self-etching dentin primers containing phenyl-P Journal ofDental Research 73(5) 1088-1095.
Da cunha Mello FS, Feilzer AJ, de Gee AJ & Davidson CL (1997)Sealing ability of eight resin bonding systems in a Class IIrestoration after mechanical fatiguing Dental Materials 13(6)372-376.
Dietschi D & Herzfeld D (1998) In vitro evaluation of marginaland internal adaptation of Class II resin composite restora-tions after thermal and occlusal stressing European Journalof Oral Sciences 106(6) 1033-1042.
Eick JD, Gwinnett, AJ, Pashley DH & Robinson SJ (1997)Current concepts on adhesion to dentin Critical Review ofOral Biology and Medicine 8(3) 306-335.
Garberoglio R, Coli P & Brännström M (1995) Contraction gapsin Class II restorations with self-cured and light-cured resincomposites American Journal of Dentistry 8(6) 303-307.
Gordan VV, Vargas MA, Cobb DS & Denehy GE (1997)Evaluation of adhesive systems using acidic primersAmerican Journal of Dentistry 10(5) 219-223.
Hannig M & Bott B (2000) Randschlußverhalten von plastischenzahnfarbenen Füllungen in dentinbegrenzten Klasse-II-Kavitäten (in German)/Marginal adaptation of tooth-colouredrestorations in Class II cavities with proximal margins locatedin dentin Deutsche Zahnärztliche Zeitschrift 55 134-138.
Hannig M, Reinhardt KJ & Bott B (1999) Self-etching primer vsphosphoric acid: An alternative concept for composite-to-enamel bonding Operative Dentistry 24(3) 172-180.
Hayakawa T, Kikutake K & Nemoto K (1998) Influence of self-etching primer treatment on the adhesion of resin compositeto polished dentin and enamel Dental Materials 14(2) 99-105.
Miyazaki M, Sato M, Onose H & Moore BK (1998) Influence ofthermal cycling on dentin bond strength of two-step bondingsystems American Journal of Dentistry 11(3) 118-122.
Nakabayashi N, Nakamura M & Yasuda N (1991) Hybrid layeras a dentin-bonding mechanism Journal of Esthetic Dentistry3(4) 133-138.
Nakabayashi N & Saimi Y (1996) Bonding to intact dentinJournal of Dental Research 75(9) 1706-1715.
Ogata M, Nakajima M, Sano H & Tagami J (1999) Effect ofdentin primer application on regional bond strength to cervicalwedge-shaped cavity walls Operative Dentistry 24(2) 81-88.
Prati C, Chersoni S, Mongiorgi R & Pashley DH (1998) Resin-infiltrated dentin layer formation of new bonding systemsOperative Dentistry 23(4) 185-194.
Reinhardt KJ & Rüter W (1998) Einsatz vonPhosphorsäureestern als Haftvermittler (in German) PhillipJournal 15 335-342.
Retief DH (1994) Do adhesives prevent microleakage?International Dental Journal 44(1) 19-26.
Swift EJ, Perdigão J & Heymann HO (1995) Bonding to enameland dentin: A brief history and state of the art, 1995Quintessence International 26(2) 95-110.
Thonemann B, Federlin M, Schmalz G & Grundler W (1999) Totalbonding vs selective bonding: Marginal adaptation of Class 2composite restorations Operative Dentistry 24(5) 261-271.
Toida T, Watanabe I & Nakabayashi N (1995) Effect of smearlayer on bonding to dentin prepared with bur JournalJapanese Dental Materials 14 109-116.
Van Meerbeek B, Inokoshi S, Braem M, Lambrechts P &Vanherle G (1992) Morphological aspects of the resin-dentininterdiffusion zone with different dentin adhesive systemsJournal of Dental Research 71(8) 1530-1540.
Van Meerbeek B, Dhem A, Goret-Nicaise N, Braem M,Lambrechts P & Vanherle G (1993) Comparative SEM andTEM examination of the ultrastructure of the resin dentininterdiffusion zone Journal of Dental Research 72(2) 495-501.
Watanabe I (1992) Photocure bonding agents to ground dentinJournal Japanese Dental Materials 11 955-973.
Watanabe I, Nakabayashi N & Pashley DH (1994) Bonding toground dentin by a phenyl-P self-etching primer Journal ofDental Research 73(6) 1212-1220.
Watanabe I, Saimi Y & Nakabayashi N (1994) Effect of smearlayer on bonding to ground dentin—Relationship betweengrinding condition and tensile bond strength JournalJapanese Dental Materials 13 101-108.
Yoshiyama M, Sano H, Ebisu S, Tagami J, Ciucchi B, CarvalhoRM, Johnson MH & Pashley DH (1996) Regional strengths ofbonding agents to cervical sclerotic root dentin Journal ofDental Research 75(6) 1404-1413.
Yoshiyama M, Matsuo T, Ebisu S & Pashley DH (1998) Regionalbond strengths of self-etching/self-priming adhesive systemsJournal of Dental Research 26(7) 609-616.
Dow
nloaded from http://m
eridian.allenpress.com/operative-dentistry/article-pdf/26/2/1/1819280/1559-2863-26-2-1.pdf by guest on 17 July 2022

Color Stability ofIonomer and Resin
Composite Restoratives
©Operative Dentistry, 2001, 26, 166-171
MA Vargas • HL Kirchner AM Diaz-Arnold• VL Beck
Clinical Relevance
Perceptible changes in color were recorded for the conventional glass ionomer, resin-modified glass ionomer and compomer materials tested in this study. Therefore, thosematerials should not be considered color stable.
SUMMARY
This study compared the color stability of a con-ventional glass ionomer (Ketac-Fil), a light poly-merized resin-modified glass ionomer (Photac-Fil), a polyacid-modified resin composite or com-pomer (Dyract) and a microfilled resin compos-ite (Silux Plus). Thirty-two specimens (n=8/mate-rial) were fabricated and stored in artificial sali-va at 37°C for seven weeks. A colorimetric evalu-ation, according to the CIE L*a*b* system, wasperformed at 24 hours (baseline) and at the endof each week. Color difference values (∆∆E*ab)were calculated. The conventional glassionomer, resin-modified ionomer and compomermaterials underwent significant color changes
over time (p<0.01). Those materials darkenedand showed color shifts in both the red-greenand yellow-blue axes.
INTRODUCTION
Glass-ionomer (GI) restorations are known to releasefluoride and are indicated for use in teeth with a highcaries potential (Swartz, Phillips & Clark, 1984;Hattab, Mok & Agnew, 1989). However, the materialsare also technique sensitive and their aesthetic proper-ties have limited their use as dental restoratives. Earlyglass-ionomers lacked color stability and were likely toyellow and darken over time, leading to unaestheticrestorations. Recent improvements have made newergenerations of glass ionomers a potential alternative inmany restorative situations (Mount, 1994). The resin-modified glass ionomers and polyacid-modified resincomposites (compomers) may possess superior aestheticproperties when compared to traditional glass ionomers(Burgess, Norling & Summitt, 1994; Inokoshi & others,1996). This study evaluated the color stability of a con-ventional GI, a resin-modified GI and a polyacid-modi-fied resin composite (compomer) compared to a micro-filled resin composite material.
METHODS AND MATERIALS
Table 1 lists the restoratives selected for this investiga-tion. The materials included a conventional GI (Ketac-
Department of Family Dentistry, College ofDentistry, University of Iowa, Iowa City, IA52242
Marcos A Vargas, DDS, MS, associate professor,Department of Operative Dentistry
H Lester Kirchner, PhD, instructor, Department ofPediatrics, Case Western Reserve University,Cleveland, OH
Ana M Diaz-Arnold, DDS, MS, associate professor
V Lyle Beck, dental student
Dow
nloaded from http://m
eridian.allenpress.com/operative-dentistry/article-pdf/26/2/1/1819280/1559-2863-26-2-1.pdf by guest on 17 July 2022
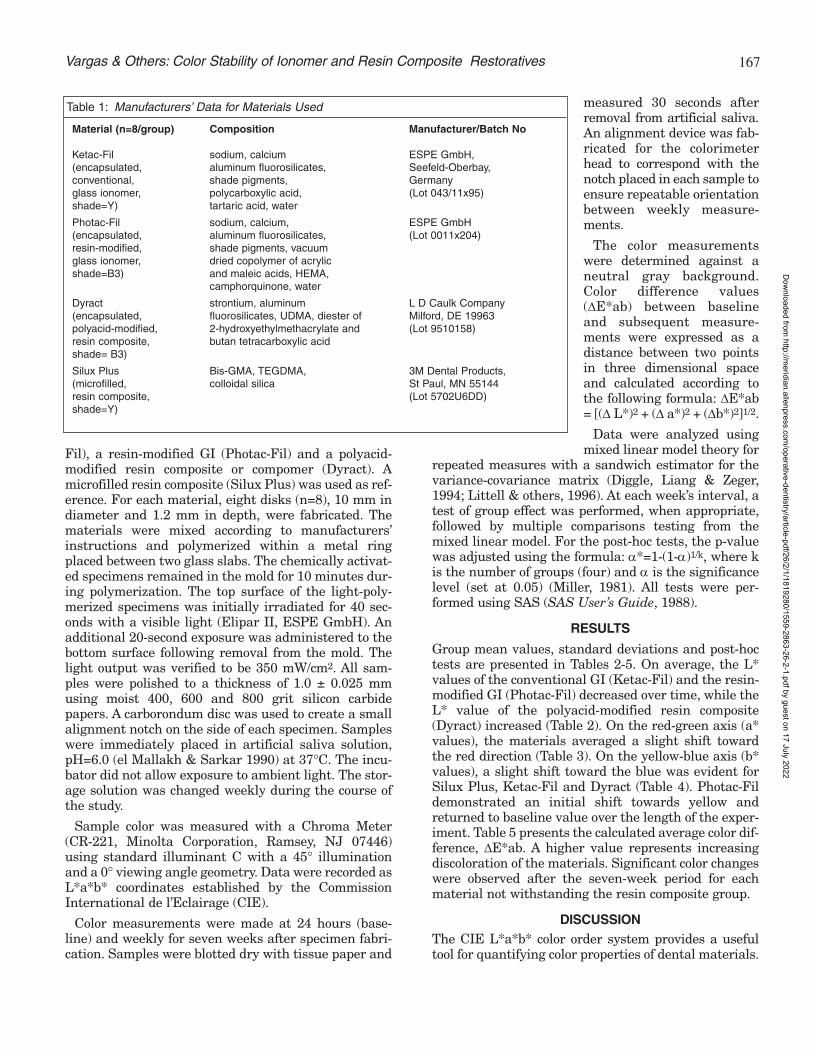
167Vargas & Others: Color Stability of Ionomer and Resin Composite Restoratives
Fil), a resin-modified GI (Photac-Fil) and a polyacid-modified resin composite or compomer (Dyract). Amicrofilled resin composite (Silux Plus) was used as ref-erence. For each material, eight disks (n=8), 10 mm indiameter and 1.2 mm in depth, were fabricated. Thematerials were mixed according to manufacturers’instructions and polymerized within a metal ringplaced between two glass slabs. The chemically activat-ed specimens remained in the mold for 10 minutes dur-ing polymerization. The top surface of the light-poly-merized specimens was initially irradiated for 40 sec-onds with a visible light (Elipar II, ESPE GmbH). Anadditional 20-second exposure was administered to thebottom surface following removal from the mold. Thelight output was verified to be 350 mW/cm2. All sam-ples were polished to a thickness of 1.0 ± 0.025 mmusing moist 400, 600 and 800 grit silicon carbidepapers. A carborondum disc was used to create a smallalignment notch on the side of each specimen. Sampleswere immediately placed in artificial saliva solution,pH=6.0 (el Mallakh & Sarkar 1990) at 37°C. The incu-bator did not allow exposure to ambient light. The stor-age solution was changed weekly during the course ofthe study.
Sample color was measured with a Chroma Meter(CR-221, Minolta Corporation, Ramsey, NJ 07446)using standard illuminant C with a 45° illuminationand a 0° viewing angle geometry. Data were recorded asL*a*b* coordinates established by the CommissionInternational de l’Eclairage (CIE).
Color measurements were made at 24 hours (base-line) and weekly for seven weeks after specimen fabri-cation. Samples were blotted dry with tissue paper and
measured 30 seconds afterremoval from artificial saliva.An alignment device was fab-ricated for the colorimeterhead to correspond with thenotch placed in each sample toensure repeatable orientationbetween weekly measure-ments.
The color measurementswere determined against aneutral gray background.Color difference values(∆E*ab) between baselineand subsequent measure-ments were expressed as adistance between two pointsin three dimensional spaceand calculated according tothe following formula: ∆E*ab= [(∆ L*)2 + (∆ a*)2 + (∆b*)2]1/2.
Data were analyzed usingmixed linear model theory for
repeated measures with a sandwich estimator for thevariance-covariance matrix (Diggle, Liang & Zeger,1994; Littell & others, 1996). At each week’s interval, atest of group effect was performed, when appropriate,followed by multiple comparisons testing from themixed linear model. For the post-hoc tests, the p-valuewas adjusted using the formula: α*=1-(1-α)1/k, where kis the number of groups (four) and α is the significancelevel (set at 0.05) (Miller, 1981). All tests were per-formed using SAS (SAS User’s Guide, 1988).
RESULTS
Group mean values, standard deviations and post-hoctests are presented in Tables 2-5. On average, the L*values of the conventional GI (Ketac-Fil) and the resin-modified GI (Photac-Fil) decreased over time, while theL* value of the polyacid-modified resin composite(Dyract) increased (Table 2). On the red-green axis (a*values), the materials averaged a slight shift towardthe red direction (Table 3). On the yellow-blue axis (b*values), a slight shift toward the blue was evident forSilux Plus, Ketac-Fil and Dyract (Table 4). Photac-Fildemonstrated an initial shift towards yellow andreturned to baseline value over the length of the exper-iment. Table 5 presents the calculated average color dif-ference, ∆E*ab. A higher value represents increasingdiscoloration of the materials. Significant color changeswere observed after the seven-week period for eachmaterial not withstanding the resin composite group.
DISCUSSIONThe CIE L*a*b* color order system provides a usefultool for quantifying color properties of dental materials.
Material (n=8/group) Composition Manufacturer/Batch No
Ketac-Fil sodium, calcium ESPE GmbH,(encapsulated, aluminum fluorosilicates, Seefeld-Oberbay,conventional, shade pigments, Germanyglass ionomer, polycarboxylic acid, (Lot 043/11x95)shade=Y) tartaric acid, water
Photac-Fil sodium, calcium, ESPE GmbH(encapsulated, aluminum fluorosilicates, (Lot 0011x204)resin-modified, shade pigments, vacuumglass ionomer, dried copolymer of acrylicshade=B3) and maleic acids, HEMA,
camphorquinone, water
Dyract strontium, aluminum L D Caulk Company(encapsulated, fluorosilicates, UDMA, diester of Milford, DE 19963polyacid-modified, 2-hydroxyethylmethacrylate and (Lot 9510158)resin composite, butan tetracarboxylic acidshade= B3)
Silux Plus Bis-GMA, TEGDMA, 3M Dental Products,(microfilled, colloidal silica St Paul, MN 55144resin composite, (Lot 5702U6DD)shade=Y)
Table 1: Manufacturers’ Data for Materials Used
Dow
nloaded from http://m
eridian.allenpress.com/operative-dentistry/article-pdf/26/2/1/1819280/1559-2863-26-2-1.pdf by guest on 17 July 2022

168 Operative Dentistry
Color is described using a mathematical three-dimensional system based on an equal distance in thecolor space that is directly correlated with equally per-ceived gradations. This system divides color into threeattributes. L* is a measure of value or brightness. Thea* measures the hue-chroma in the red-green direction,while b* measures hue-chroma in the blue-yellow axis.High L* values are obtained for bright or white sam-ples. Positive a* values are red, negative values aregreen. Positive b* values are yellow, negative values areblue. Each unit of color difference (∆E*ab) representsthe delineation point of human detection for 50% of thesubjects studied (Kuehni & Marcus, 1979). Colorimetricmeasurements have correlated well with visual obser-
vations (Johnston & Kao, 1989; Seghi, Hewlett & Kim,1989) and changes in color difference values of less than3.3 are considered clinically insignificant (Ruyter, Nilnu& Moller, 1987).
The discoloration of dental materials is multifactorialand related to water sorption, cracks, porosities andsurface finish, conversion rates and thermal postcuringor photochemical aging (Dietschi & others, 1994). Inthis study, the conventional ionomer (Ketac-Fil) showedthe most abrupt and significant color change. Thenewer generation materials (Photac-Fil and Dyract)showed a more gradual color change over time.However, by the end of the seven weeks, those threetypes of materials showed color differences greater
L* coordinate. Raw data and post-hoc tests
Baseline 1 wk 2 wk 3 wk 4 wk 5 wk 6 wk 7 wk
Silux 63.87 63.97 63.92 64.22 64.50 64.36 63.82 64.3Plus (0.3) (0.42) (0.57) (0.37) (0.43) (0.36) (0.39) (0.36)
Ketac-Fil 69.22 66.35 64.03 64.37 64.75 64.41 63.80 66.47 (0.81) (0.67) (1.29) (1.19) (1.44) (1.20) (1.09) (0.95)
Photac-Fil 62.93 61.43 60.17 60.62 60.34 59.71 59.53 59.87 (2.0) (1.89) (1.45) (1.87) (2.21) (1.57) (1.37) (1.70)
Dyract 58.91 59.01 59.41 59.25 60.03 60.76 61.52 61.38 (1.23) (1.37) (1.38) (1.02) (1.66) (1.57) (1.75) (1.89)
Baseline 1 wk 2 wk 3 wk 4 wk 5 wk 6 wk 7 wk
Silux Plus A A A A A A A A
Ketac-Fil B B B A A A A B
Photac-Fil A C C B B B B C
Dyract C D C B B B B C
Table 2
Group means, by time, with the same letter are not statistically significant (p<0.001).
Standard deviations in parentheses.
a* coordinate. Raw data and post-hoc tests.
Baseline 1 wk 2 wk 3 wk 4 wk 5 wk 6 wk 7 wk
Silux Plus -3.13 -3.05 -3.28 -2.84 -3.21 -3.07 -2.9 -2.56 (0.06) (0.05) (0.06) (0.05) (0.05) (0.03) (0.03) (0.07)
Ketac-Fil -0.94 -0.95 -1.28 -0.82 -1.22 -1.07 -0.92 -0.38 (0.10) (0.01) (0.12) (0.10) (0.12) (0.15) (0.09) (0.08)
Photac-Fil -0.32 -0.32 -0.52 -0.18 -0.52 -0.41 -0.24 0.12 (0.11) (0.05) (0.05) (0.05) (0.06) (0.05) (0.06) (0.05)
Dyract -0.40 -0.47 -0.64 -0.33 -0.68 -0.6 -0.43 -0.06 (0.05) (0.08) (0.07) (0.09) (0.07) (0.05) (0.07) (0.08)
Baseline 1 wk 2 wk 3 wk 4 wk 5 wk 6 wk 7 wk
Silux Plus A A A A A A A A
Ketac-Fil B B B B B B B B
Photac-Fil C C C C C C C C
Dyract D D D D D D D D
Table 3
Group means, by time, with the same letter are not statistically different (p<0.001).
Standard deviations in parentheses.
Dow
nloaded from http://m
eridian.allenpress.com/operative-dentistry/article-pdf/26/2/1/1819280/1559-2863-26-2-1.pdf by guest on 17 July 2022

169Vargas & Others: Color Stability of Ionomer and Resin Composite Restoratives
than 3.3, while the microfilled resin composite (SiluxPlus) showed minimal color change (∆E*ab = 1.08,Table 5).
Inokoshi & others (1996) reported that resin-modifiedGIs undergo an abrupt change in color. Other studieshave shown that the intrinsic coloration of composites isaffected by storage conditions (Powers, Barakat &Ogura, 1985; Asmussen, 1981; Fruits, Duncanson &Miranda, 1997). Inokoshi & others (1996) acceleratedthe aging of samples by storing them at 37°C betweentwo glass slides for one week followed by water storageat 60°C. Their sample surfaces were coated with light-polymerized unfilled resin and not polished. The reportedrapid change in color may reflect the rapid deterioration
of the thin resin film during the stress of acceleratedaging. In contrast, Hotta, Hirukawa & Yamamoto (1992)concluded that light-polymerized bonding agents main-tained the color stability of glass ionomer cements bylimiting water movement across the setting-cement sur-face. It may be that the bonding agent can minimize ini-tial color change but cannot compensate for long-termdiscoloration.
The GI samples in this study were not coated withunfilled resin, so as to standardize the testing surfacebetween the glass ionomers and the resin compositematerial. Burgess, Norling & Summitt (1994) recom-mend the application of unfilled resin to the surface ofresin ionomers only in low caries-risk patients because
b* coordinate. Raw data and post-hoc tests.
Baseline 1 wk 2 wk 3 wk 4 wk 5 wk 6 wk 7 wk
Silux Plus 6.81 6.69 6.94 6.75 6.81 6.44 6.36 6.06 (0.19) (0.23) (0.09) (0.20) (0.32) (0.26) (0.36) (0.27)
Ketac-Fil 12.42 11.51 12.62 11.80 11.40 10.95 11.14 8.27 (0.48) (0.72) (1.21) (1.27) (1.70) (1.43) (1.08) (1.18)
Photac-Fil 7.66 7.79 8.42 8.17 8.28 8.31 8.30 7.61 (0.74) (0.84) (0.44) (0.97) (0.97) (0.67) (0.50) (0.65)
Dyract 6.70 6.59 6.32 6.42 6.21 4.90 4.36 4.17 (0.62) (0.64) (0.63) (0.49) (1.07) (1.19) (0.95) (1.12)
Baseline 1 wk 2 wk 3 wk 4 wk 5 wk 6 wk 7 wk
Silux Plus A A A A A A A A
Ketac-Fil B B B B B B B B
Photac-Fil C C C C C C C C
Dyract A A A A A A A A
Table 4
Group means, by time, with the same letter are not statistically different (p<0.001).
Standard deviations in parentheses.
Calculated color difference (∆∆E*ab) and post-hoc tests.
1 wk 2 wk 3 wk 4 wk 5 wk 6 wk 7 wk
Silux Plus 0.33 0.50 0.56 0.72 0.64 0.78 1.08 (0.30) (0.22) (0.17) (0.21) (0.28) (0.37) (0.26)
Ketac-Fil 3.05 5.36 5.01 4.93 5.30 5.75 5.14 (0.66) (1.52) (1.19) (1.38) (0.70) (1.20) (0.80)
Photac-Fil 1.54) 2.91 2.50 2.78 3.43 3.54 3.46 (0.71 (1.36) (0.61) (1.14) (1.29) (1.46) (1.37)
Dyract 0.54 0.89 0.94 1.51 2.60 3.52 3.58 (0.60) (0.83) (0.41) (1.11) (1.29) (1.45) (1.74)
1 wk 2 wk 3 wk 4 wk 5 wk 6 wk 7 wk
Silux Plus A A A A A A A
Ketac-Fil B B B B B B B
Photac-Fil C C C C C C C
Dyract A D D C C C C
Table 5
Group means, by time, with the same letter are not statistically different (p<0.001).
Standard deviations in parentheses.
Dow
nloaded from http://m
eridian.allenpress.com/operative-dentistry/article-pdf/26/2/1/1819280/1559-2863-26-2-1.pdf by guest on 17 July 2022

170 Operative Dentistry
the resin film fills in small defects but decreases fluo-ride release and uptake. Our samples also underwentprogressive surface finishing to optimize the surfacefinish and remove the “resin-rich layer” obtained whencomposite has been polymerized against a glass sur-face. The improved resistance to discoloration in pol-ished samples has been previously documented(Hachiyha & others, 1984; Stanford & others, 1985).
An attempt was made to confirm the shade of allmaterials tested. Vita B3 shade (Vita-Zahnfabrik, BadSäckingen, Germany) was selected for Photac-Fil andDyract. Ketac-Fil and Silux Plus are not available inVita shades; thus, the corresponding available “yellow”shade was tested. A yellow, high chroma shade wasselected because a previous study identified the maincomponent of discoloration for resin-modified GIs to bea decrease in lightness (Inokoshi & others, 1996). It wasthe authors’ intent to investigate differences in a colorrich shade. Indeed, the conventional and resin-modifiedGIs used in this study darkened over time (lower L*value). The compomer material (Dyract) showed a gradualincrease in lightness. During this investigation allmaterials showed a slight increase in a* values (shifttowards red) and a slight up and down variation in b*values (yellow to blue).
Clinical evaluations of resin-modified glass ionomershave reported favorable color retention after one year(Maneenut & Tyas, 1995) or slight, but acceptable colorshifts after three years (van Dijken, 1996). Other stud-ies have shown evidence of darkening after two or threeyears of service (Abdalla, Alhadainy & García-Godoy,1997; de Araujo, Araujo & Marsilio, 1998). Brackett &others (1999) judged 34 Class V Photac-Fil restorationsand reported 100% acceptable color match at place-ment. However, by 12 months, 7% of the restorationswere judged to have an unacceptable mismatch and17% showed evidence of marginal discoloration.
Conventional glass ionomers have demonstrated sub-stantial cavosurface discoloration during clinical service(Osborne & Berry, 1990). Brackett & others (1999)reported that 27% of Ketac-Fil restorations had a colormismatch (although acceptable) and 7% showed evi-dence of marginal discoloration as early as 12 months.Brackett & others (1999) concluded that Ketac-Fil andPhotac-Fil demonstrated adequate clinical performancebut warned that conventional GI and resin-modified GIrestorations would be subject to discoloration in theanterior maxilla of smokers.
Recently, the manufacturers of Photac-Fil introducedPhotac-Fil Quick. The newer product incorporates theacid into the liquid component to facilitate the bond todentin and enamel and discontinue the use of Ketac-conditioner (a 25% polyacrylic acid surface cleaningsolution). A radiopaque, strontium-lanthanum-alu-minum-silicate filler was also incorporated. Dyract AP
has superseded Dyract with changes in the particle sizeof their SrAlFSiO4 filler. However, the HEMA or UDMAcontent of Photac-Fil Quick and Dyract AP, respectively,remain the same when compared to the HEMA andUDMA content of their predecessors. Those methacry-late components are hydrophilic and susceptible towater uptake and water-based staining (Mount, 1999).Thus, the color stability of the older and newer versionsshould be similar (Paul Hammesfahr, LD CaulkCompany, personal communication; Robert May, ESPEGmbH, personal communication).
In this study, the authors did not dismiss the activerole of dietary and hygiene habits in maintaining theintegrity of dental restorations. While the study did notduplicate intraoral conditions, it is interesting to notethat the conventional ionomer, resin-modified ionomerand compomer materials exhibited color changes evenunder minimally taxing conditions. It was the authorsintent to identify short-term discoloration characteris-tics. This finding is of value to the clinician when selectinga restorative material for use in an aestheticallydemanding situation.
CONCLUSIONS
The conventional GI (Ketac-Fil), the resin-modified GIand the compomer (Dyract) exhibited significant colorchange over time. Thus, although resin-modified glassionomers and compomers may be less technique sensi-tive, the material types represented in this investiga-tion should not be considered color stable.
(Received 7 January 2000)
References
Abdalla AI, Alhadainy HA & García-Godoy F (1997) Clinicalevaluation of glass ionomers and compomers in Class V cari-ous lesions American Journal of Dentistry 10(1) 18-20.
Asmussen E (1981) An accelerated test for color stability ofrestorative resins Acta Odontologia Scandinavia 39 329-332.
Brackett WW, Gilpatrick RO, Browning WD & Gregory PN(1999) Two-year clinical performance of a resin-modifiedglass-ionomer restorative material Operative Dentistry 24(1)9-13.
Burgess J, Norling B & Summitt J (1994) Resin ionomerrestorative materials: The new generation Journal ofEsthetic Dentistry 6(5) 207-215.
de Araujo MA, Araujo RM & Marsilio AL (1998) A retrospectivelook at esthetic resin composite and glass-ionomer Class IIIrestorations: A 2-year clinical evaluation QuintessenceInternational 29(2) 87-93.
Dietschi D, Campanile G, Holz J & Meyer JM (1994)Comparison of the color stability of ten new-generation com-posites: An in vitro study Dental Materials 10(6) 353-362.
Dow
nloaded from http://m
eridian.allenpress.com/operative-dentistry/article-pdf/26/2/1/1819280/1559-2863-26-2-1.pdf by guest on 17 July 2022
171Vargas & Others: Color Stability of Ionomer and Resin Composite Restoratives
Diggle PJ, Liang KY & Zeger SL (1994) Analysis of longitudinaldata Oxford: Clarendon Press.
Fruits TJ, Duncanson MG Jr & Miranda FJ (1997) In vitroweathering of selected direct esthetic restorative materialsQuintessence International 28(6) 409-414.
Hachiyha Y, Iwaku M, Hosoda H & Fusayama T (1984) Relationof finish to discoloration of composite resins Journal ofProsthetic Dentistry 52(6) 811-14.
Hattab FN, Mok NY & Agnew EC (1989) Artificially formedcaries like lesions around restorative materials Journal ofthe American Dental Association 118(2) 193-197.
Hotta M, Hirukawa H & Yamamoto K (1992) Effect of coatingmaterials on restorative glass-ionomer cement surfaceOperative Dentistry 17(2) 57-61.
Inokoshi S, Burrow MF, Kataumi M, Yamada T & Takatsu T(1996) Opacity and color changes of tooth-colored restorativematerials Operative Dentistry 21(2) 73-80.
Johnston WM & Kao EC (1989) Assessment of appearancematch by visual observation and clinical colorimetry Journalof Dental Research 68(5) 819-822.
Johnston WM & Reisbick MH (1997) Color and translucencychanges during and after curing of esthetic restorative mate-rials Dental Materials 13(2) 89-97.
Kuehni RG & Marcus RT (1979) An experiment in visual scan-ning of small color differences Color Research Applications 483-91.
Littell RC, Milliken GA, Stroup WW & Wolfinger RD (1996)SAS system for mixed models Cary NC: SAS Institute Inc.
Maneenut C & Tyas MJ (1995) Clinical evaluation of resin-mod-ified glass-ionomer restorative cements in cervical abrasionlesions: One-year results Quintessence International 26(10)739-743.
Miller RG (1981) Simultaneous statistical inference (2nd ed)New York: Springer.
Mount GJ (1994) Buonocore Memorial Lecture Glass ionomercements: Past, present and future Operative Dentistry 19(3)82-90.
Mount GJ (1999) Glass ionomers: A review of their current sta-tus Operative Dentistry 24(2) 115-124.
Osborne JW & Berry TG (1990) Three-year clinical evaluationof glass ionomer cements as Class III restorations AmericanJournal of Dentistry 3 40-43.
Powers JM, Barakat MM & Ogura H (1985) Color and opticalproperties of posterior composites under accelerated agingDental Materials Journal 4(1) 62-67.
Ruyter IE, Nilnu K & Moller B (1987) Color stability of dentalcomposite resin materials for crown and bridge veneersDental Materials 3(5) 246-251.
SAS User’s Guide Version 6 (1988): Cary NC: SAS Institute.
Seghi RR, Hewlett ER & Kim J (1989) Visual and instrumentalcolorimetric assessments of small color differences ontranslucent dental porcelain Journal of Dental Research68(12) 1760-1764.
Stanford WB, Fan PL, Wozniak WT & Stanford JW (1985)Effect of finishing on color and gloss of composites with dif-ferent fillers Journal of the American Dental Association110(2) 211-213.
Swartz ML, Phillips RW & Clark HE (1984) Long-term Frelease from glass ionomer cements Journal of DentalResearch 63(2) 158-160.
van Dijken JWV (1996) 3-year clinical evaluation of a com-pomer, a resin-modified glass-ionomer and a resin compositein Class III restorations American Journal of Dentistry 9(5)195-198.
Dow
nloaded from http://m
eridian.allenpress.com/operative-dentistry/article-pdf/26/2/1/1819280/1559-2863-26-2-1.pdf by guest on 17 July 2022

Microleakage of“One Bottle” Dentin Adhesives
©Operative Dentistry, 2001, 26, 172-175
Clinical Relevance
There was no significant difference in microleakage scores between the fifth generation(One Bottle) and fourth generation dentin adhesive resins.
AA Al-Ehaideb •H Mohammed
SUMMARY
This study evaluated the marginal sealing abilityof five “One Bottle” fifth generation dentin adhe-sive resins. Bond 1, Single Bond, Tenure Quickwith fluoride, One-Step and Prime & Bond 2.1were evaluated. Tenure All-Surface BondingSystem, a fourth generation dentin adhesiveresin, was used as the control group.
A Class V preparation (3 mm diameter, 1.5 mmdeep) was placed at the cemento-enamel junc-tion of 60 extracted human premolar teeth. A 1mm 45° bevel was placed at the enamel margin.Each group of cavities were restored using oneof the dentin adhesives and the same restorativeresin. Following five days storage in 37°C water,the restored teeth were thermocycled for 500cycles between 5°C and 55°C for one minute ineach cycle. Microleakage was assessed by dye
penetration using 0.2% Basic Fuchsin dye. After24 hours the teeth were sectioned longitudinallyand evaluated for microleakage. The resultswere analyzed using the non-parametricKruskal-Wallis Test.
Microleakage at the enamel margins was notevident in any group. However, leakage was pres-ent at the gingival margin (cementum) in all ofthe treated groups. There were no significant dif-ferences between gingival margins (0.75>p>0.5).When comparing the gingival margin microleak-age scores between two groups or within thesame group, statistical analysis showed no signif-icant difference. The new “One Bottle” dentinadhesives have similar marginal sealing abilityto that of the control group.
INTRODUCTION
The effects of bacterial leakage upon the dental pulp arewell documented (Bergenholtz & others, 1982;Brannstrom, 1981 & 1987). Prevention of bacterial accessalong the margins of restorations are therefore a high pri-ority. As early as 1861, in an effort to determine the effec-tiveness of dental restoratives as sealant, microscopicexamination of amalgam marginal contraction was car-ried out by Tomes (Blackwell, 1955), followed by experi-ments into the leakage of dye indicators around the mar-gins of amalgam packed into glass tubing.
Department of Dentistry, King Fahad NationalGuard Hospital, PO Box 9042, Riyadh 11411,Saudi Arabia
Ali A Al-Ehaideb, BDS, MSc, pediatric dentist, associateconsultant
Hamdi Mohammed DDS, MSc, PhD, College of Dentistry,King Saud University, Riyadh, Saudi Arabia
Dow
nloaded from http://m
eridian.allenpress.com/operative-dentistry/article-pdf/26/2/1/1819280/1559-2863-26-2-1.pdf by guest on 17 July 2022

173Al-Ehaideb & Mohammed: One Bottle Adhesives Microleakage
Since these early experiments, countless workers haveattempted to demonstrate microleakage and improve themarginal seal. Microleakage may be defined as the pas-sage of bacteria, fluid, molecules or ions between a cavitywall and the restorative material applied to it (Kidd,1976). Many different techniques have been used todemonstrate microleakage. These techniques include theuse of bacteria, compressed air, chemical and radioactivetracers, electrochemical investigations, scanning electronmicroscopy, and perhaps most common of all, dye pene-tration. These methods have also been used with varyingdegrees of success in the study of modern endodonticmaterials (Taylor & Lynch, 1992). Investigation of leak-age has been carried out both in vivo and in vitro, but thelatter is more common. In vitro experiments fall broadlyinto two categories—those which use a clinically relevantmodel that attempts to reproduce the oral situation andthose where the model does not represent a clinical sim-ulation and is purely a test of the materials behavior(Taylor & Lynch, 1992). The most currently used dentinadhesive resins (DAR) are known as fourth and fifth gen-eration. The use of fourth generation DAR involves threesteps: etching with an acidic conditioner, priming withhydrophilic resin in solvent and bonding with an unfilledor lightly filled resin (Pilo & Ben-Amar, 1999). Newergenerations of DAR combine both primer and adhesiveresin into a single solution and is referred to as the fifthgeneration. The use of one bottle makes their use in theclinic simpler and less time-consuming (Pilo & Ben-Amar,1999). There is little published data available comparingthe fourth and fifth generations. Castelnuovo, Tjan & Liu(1996) have found less microleakage at the cementummargins with OptiBond FL and One-Step compared totheir multi-step versions. Pilo & Ben-Amar (1999) havereported that the Scotchbond Multi-Purpose and SingleBond adhesives provided the best seal for enamel mar-gins, and One-Step and OptiBond FL adhesives were bestfor cementum margins. This study evaluated five “OneBottle” fifth generation dentin adhesive resins in pre-venting microleakage.
METHODS AND MATERIALS
Sixty non-carious extracted human permanent premo-lars were used. The teeth were stored in 0.1% thymolsolution at room temperature after extraction. Theywere cleaned by removing the remaining soft tissueand stored in a saline solution until use. The apices ofthe roots were removed with a separating disc.Immediately prior to the cavity preparation, the toothsurfaces were cleaned with pumice and water with arubber cup using a slow speed handpiece. Class Ipreparations were made at the cut root surfaces withan inverted cone carbide bur. Two coats of Copal cavityvarnish were applied to the preparations and the spec-imens were restored with Dispersalloy amalgam. Thisprocedure effectively eliminates microleakage at the
root apices. A Class V cavity was prepared in the buccalsurface of each tooth with a #330 carbide bur in a highspeed handpiece with water coolant.
Each cavity preparation included an occlusal marginin enamel and a gingival margin in dentin or cementum.All cavities were prepared as uniformly as possible witha mesio-distal length of 3 mm and an occluso-gingivalwidth of 3 mm. The axial wall was prepared at a depthof 1.5 mm. A short bevel (45°, 1 mm) was prepared atthe occlusal margin using a fine diamond point. Thecavities were conditioned using one of the dentin adhe-sive resins. The six dentin adhesives were Bond 1 (J/PInc Wallingford, CT), Single Bond (3M, St Paul, MN),Prime & Bond 2.1 (Caulk/Dentsply, Milford, DE),Tenure Quick with Fluoride (DenMat, Inc, SantaMaria, CA), One-Step (BISCO, Inc, Itasca, IL) andTenure All-Surface Bonding System (DenMat, Inc,Santa Maria, CA). Each adhesive was handled accord-ing to the manufacturer’s instructions. The cavitieswere restored with the composite resin (Z100 A4 - 3M,St Paul, MN) and cured for 40 seconds. Ten specimenswere made for each adhesive material. During compos-ite placement, a two-step procedure was used. The firstincrement was placed into the gingival part, condensedand cured. The second increment was applied to fill therest of the cavity and cured. Finishing and polishingwere accomplished using Sof-lex discs. The restoredteeth were stored in water at 37°C for five days beforefurther treatment.
The teeth in each group were thermocycled for 500cycles at 5°C and 55°C. Immersion time was 30 sec-onds in each bath. Following thermocycling, all teethwere coated with a nail polish 1 mm short of therestoration margins. The restoration was evaluated formicroleakage by immersion in 0.2% Basic Fuchsinedye for 24 hours. Following removal from the solution,the teeth were rinsed in tap water. Each tooth wasmounted in cold cure acrylic resin using a plastic mold.The restored area was protected by sticky wax followedby clear nail polish to avoid dissolution of the dye duringthe mounting procedure. Each tooth was sectionedbuccolingually through the center of the restorationwith a diamond blade (ISOMET, Buehler Ltd,Evanston, IL). The specimens were examined under amicroscope at 10X magnification. Microleakage scoreswere assigned according to the criteria shown in Table 1.
RESULTSTables 2 and 3 list the microleakage scores at the enameland gingival margins. No microleakage was evident inany group at the enamel margins. However, leakagewas present at the gingival margin in all treatmentgroups. Kruskal-Wallis non-parametric analysis showedno significant difference between all treatment groups(0.75<p>0.5). However, Tenure All-Surface Bondingsystem (Group 5) was the only group that showed a
Dow
nloaded from http://m
eridian.allenpress.com/operative-dentistry/article-pdf/26/2/1/1819280/1559-2863-26-2-1.pdf by guest on 17 July 2022

174 Operative Dentistry
microleakage score of 3 at the gingival margins (twosamples).
DISCUSSION
It was suggested that microleakage is the result of poly-merization shrinkage and the thermal expansion coeffi-cient differences between tooth structure and restora-tive material. The polymerization shrinkage and expan-sion coefficient differences can exert significant forces atthe restorative material/tooth interface, resulting inbond failure and gap formation. Clinical symptoms ofbond failure and gap formation include post-insertionsensitivity, marginal staining, recurrent decay and/orpossible loss of the restoration (Reeves & others, 1995;Phillips, 1996). Many controversies were found in theliterature when comparing in vivo and in vitromicroleakage testing and whether the results from invitro investigations can be applied to clinical situations.Barnes & others (1993) reported that in vitro studies are
more prone to dye penetration at the resin com-posite/tooth interface than in vivo studies.Sidhu & Henderson (1992) found that in vitrostudies are useful but may not reproduce thematerials performance in vivo.
In vitro studies the fourth and fifth genera-tions are reported. Santini & Mitchell (1998)compared three new DAR (Syntac Single-Component, Scotchbond 1 & Prime & Bond2.1) using two dentin bonding techniques onmicroleakage. Their results showed microleak-age at both the enamel and gingival margins.At the gingival margin, there was no signifi-cant difference between any of the experimen-tal materials and the control for either wetbonding or dry bonding or between the twotechniques for each material. Castelnuovo &others (1996) evaluated the microleakage ofthree pairs of multi- and simplified-step DAR(OptiBond vs OptiBond FL, AllBond2 vs One-Step and Tenure vs Tenure Quick). Theirresults showed less microleakage at thecementum margins of OptiBond FL and One-Step compared to their multi-step versions. Atthe enamel margins Tenure Quick showed lessmicroleakage compared to Tenure, and none ofthe other DARs tested showed significant dyepenetration of that interface. In this studyOne-Step was the only DAR that showed dyepenetration at the enamel margins and TenureAll Surface Bonding System was the only DARthat showed dye penetration involving theaxial wall at the gingival margins. However,there was no statistically significant differencein microleakage scores among all treatmentgroups in both enamel and gingival margins.The authors’ results showed that “One Bottle”DAR performed equally in terms of microleak-
age compared with multi-step DAR. These results are inagreement with other studies (Fortin, Perdiãgo & Swift,1997; Pilo & Ben-Amar, 1999; Castelnuovo & others,1996; Santin & Mitchell, 1998; Settembrini & others,1997).
The composite restorations showed relatively greaterleakage at the gingival than at the occlusal margin. Themost likely cause for this phenomenon is the polymer-ization contraction of the composite, which is manifestedin three ways: shrinkage towards the center of therestoration; towards the “stronger” enamel-compositeinterface and towards the light source (Yap, Stokes &Pearson, 1996; Felizer, deGee & Davidson, 1987). Themagnitude of this contraction may be so great thatwater sorption and stress relaxation cannot compensatefor it (Yap & others, 1996). Since many variables makeit difficult to assess the absolute value of microleakagefor a given material, only one type of composite resin
Score Description
0 No microleakage.
1 Dye penetration extending less than or up to one half of the cavity depth.
2 Dye penetration greater than one half of the cavity dept but not extending to the axial wall.
3 Dye penetration involving the axial wall.
Table 1: Microleakage Scoring System
(N=10)
Type of Resin SCORE
0 1 2 3
Bond 1 (J/P) 10 0 0 0
Single Bond (3M) 10 0 0 0
One Step (BISCO) 9 1 0 0
Tenure Quick (DenMat) 10 0 0 0
Prime & Bond 2.1 (Caulk) 10 0 0 0
Tenure All Surface Bonding 10 0 0 0System (DenMat)
Table 2: Microleakage Scores - Enamel Margin
(N=10)
Type of Resin SCORE
0 1 2 3
Bond 1 (J/P) 5 4 1 0
Single Bond (3M) 2 7 1 0
One Step (BISCO) 2 8 0 0
Tenure Quick (DenMat) 1 7 2 0
Prime & Bond 2.1 (Caulk) 3 5 2 0
Tenure All Surface Bonding 3 3 2 2System (DenMat)
Table 3: Microleakage Scores—Gingival Margin
Dow
nloaded from http://m
eridian.allenpress.com/operative-dentistry/article-pdf/26/2/1/1819280/1559-2863-26-2-1.pdf by guest on 17 July 2022

175Al-Ehaideb & Mohammed: One Bottle Adhesives Microleakage
was used as a filling material for all Class V restora-tions. Microfilled composite resins are supposed to givebetter marginal performances in non stress-bearingareas (Sidhu & Henderson, 1992), and because of theirhigh elasticity and flow ability, they are the material ofchoice for cervical Class V restorations (Van Meerbeek& others, 1993). Two previous studies used differentnumbers of cycles during thermocycling—300 cycleswithout loading (Castelnuovo & others, 1996) and 1400cycles after application of occlusal load of 10 kg for 0.5second for 500 times (Pilo & Ben-Amar, 1999). Thisstudy used 500 cycles without loading forces. As withthis study, both studies concluded no significant differ-ence in microleakage of both margins.
Masticatory loading has been found to promote gapformation and subsequent marginal leakage in Class Vcervical restorations due to the bending of tooth struc-ture, creating compressive and tensile stress (Ferrari &others, 1994; Rigsby & others, 1992; Van Meerbeek,1993). Rigsby & others (1992) reported highermicroleakage values when thermocycling was followedby load-cycling. Future comparative studies for thesame DAR using thermocycling followed by load-cyclingare recommended.
The results of this study suggested that none of thebonding agents tested was consistently capable ofresisting the forces exerted during polymerizationand/or thermocycling, especially at the gingival margin.However, because of the numerous uncontrolled vari-ables encountered in patient treatment, laboratorystudies cannot reliably predict clinical performance ofadhesives or other dental materials (Jeffery & Edward,1994). Clinical trials are needed to assess the perform-ance of these new dentin adhesives.
CONCLUSIONS
1. The new “One Bottle” DAR have similar marginalsealing ability to that of the control group.
2. Clinical trial is needed to assess the performance ofthese new dentin adhesives.
*Based on a thesis submitted in partial fulfillment of the MScDegree New York University, 1997.
Acknowledgments
The senior author gratefully acknowledges Dr Allan Schulman forhis encouragement and support during his studies.
(Received 14 January 2000)
References
Anusavice K, Phillips (1996) Science of Dental Materials 10th edWB Saunders Company, Philadelphia.
Barnes DM, Thompson VP, Blank LW & McDonald NJ (1993)Microleakage of Class 5 composite resin restorations: A com-parison between in vivo and in vitro Operative Dentistry 18(6)237-245.
Bergenholtz G, Cox CF, Loesche WJ & Syed SA (1982) Bacterialleakage around dental restorations: Its effect on the dentalpulp Journal of Oral Pathology 11(6) 439-450.
Blackwell RE (1955) Black’s Operative Dentistry Vol II—Technical Procedures—Materials 5th ed Oxford, Blackwell pp387-388.
Brannstrom M (1981) Dentin and Pulp in Restorative Dentistry1981; 1st ed Sweden Dental Therapeutics AB.
Brannstrom M (1987) Infection beneath composite resin restora-tions: Can it be avoided? Operative Dentistry 12(4) 158-163.
Castelnuovo J, Tijan AH & Liu P (1996) Microleakage of multi-step and simplified-step bonding systems American Journal ofDentistry 9(6) 245-248.
Felizer AJ, de Gee AJ & Davidson CL (1987) Setting stress incomposite resin in relation to configuration of the restorationJournal of Dental Research 66(11) 1636-1639.
Ferrari M, Yamamoto K, Vichi A & Finger WJ (1994) Clinical andlaboratory evaluation of adhesive restorative systemsAmerican Journal of Dentistry 7(4) 217-219.
Kidd EA (1976) Microleakage: A review Journal of Dentistry47(5) 199-205.
Linden JJ & Swift EJ Jr (1994) Microleakage of two new dentinadhesives American Journal of Dentistry 7(1) 31-34.
Pilo R & Ben-Amar A (1999) Comparison of microleakage forthree one-bottle and three multi-step dentin bonding agentsJournal of Prosthetic Dentistry 82(2) 209-213.
Reeves GW, Fitchie JG, Hembree JH Jr & Puckett AD (1995)Microleakage of new dentin bonding systems using humanand bovine teeth Operative Dentistry 20(6) 230-235.
Rigsby DF, Retief DH, Bidez MW & Russell CM (1992) Effect ofaxial load and temperature cycling on microleakage of resinrestorations American Journal of Dentistry 5(3) 155-159.
Santini A & Mitchell S (1998) Microleakage of composite restora-tions bonded with three new dentin bonding agents Journal ofEsthetic Dentistry 10(6) 296-304.
Settembrini L, Gultz JP, Scherer W & Kaim J (1997) A single-component bonding system microleakage study Journal ofGeneral Dentistry 45(4) 341-343.
Sidhu SK & Henderson LJ (1992) Dentin adhesives andmicroleakage in cervical resin composites American Journal ofDentistry 5(5) 240-244.
Taylor MJ & Lynch E (1992) Microleakage (review) Journal ofDentistry 20(1) 3-10.
Van Meerbeek B, Braem M, Lambrechts P & Vanherle G (1993)Two-year clinical evaluation of two dentin-adhesive systems incervical lesions Journal of Dentistry 21(4) 195-202.
Yap A, Stokes AN & Pearson GJ (1996) An in vitro microleakagestudy of a new multi-purpose dental adhesive system Journalof Oral Rehabilitation 23(5) 302-308.
Dow
nloaded from http://m
eridian.allenpress.com/operative-dentistry/article-pdf/26/2/1/1819280/1559-2863-26-2-1.pdf by guest on 17 July 2022

Determination of theMinimum Irradiance Requiredfor Adequate Polymerization
of a Hybridand a Microfill Composite
©Operative Dentistry, 2001, 26, 176-180
SUMMARY
This in vitro study determines the minimum irra-diance values required for adequate polymeriza-tion of a microfill and a hybrid resin compositewhen cured for 40 and 60 seconds.
A curing light (Optilux 401) with an 8-mm-diameter tip (SaniCure) was used as the lightsource. The irradiance output of the light unit,measured with a laser power meter, was variedby altering the input voltage using a variablepower supply. Two-mm-thick hardness test spec-
imens were made with a microfil composite(Silux Plus) and a hybrid composite (Z-100) foreach combination of exposure time (40, 60 sec-onds) and irradiance value (100 mW/cm2 to 700mW/cm2 in 25-mW/cm2 increments). After 24hours, Knoop hardness (KH) measurements weremade for each side of each specimen, means werecalculated and a top/bottom KH percentage wasdetermined. A value of at least 80% was used toindicate satisfactory polymerization. A linearregression of irradiance versus KH percentagewas performed and the resulting equation usedto predict the irradiance value required to pro-duce a KH value of 80% for the test conditions.
Results showed that the hybrid composite, Z-100, required 260.1 mW/cm2 @ 40 seconds or 185.0mW/cm2@ 60 seconds for satisfactory polymeriza-tion. The microfil, Silux Plus, required 542.9mW/cm2 @ 40 seconds or 449.0 mW/cm2 @ 60 sec-onds. These findings indicate that previouslystated minimum irradiance values may be insuf-ficient for adequate polymerization of microfilresin composites.
INTRODUCTION
Visible light-curing units are used extensively in den-tistry. They are commonly used to polymerize light-sen-sitive restorative materials, such as resin composites,
DL Leonard • DG Charlton • HR Roberts
TJ Hilton • A Zionic
Clinical Relevance
The generally accepted minimum irradiance value of 300 mW/cm2 may be insufficient foradequate polymerization of some microfilled resin composites.
USAF Dental Investigation Service, Detachment1, USAFSAM, 310C B St, Bldg. 1H, Great Lakes,IL 60088
Daniel L Leonard, Col, USAF, DC, chief, USAF DentalInvestigation Service
David G Charlton, Col, USAF, DC, director, MaterialsEvaluation
Howard R Roberts, LtCol, USAF, DC, director,Equipment Evaluation
Thomas J Hilton, DMD, associate professor, OregonHealth Sciences University School of Dentistry
Anne Zionic, student researcher, Harvard UniversitySchool of Dentistry
Dow
nloaded from http://m
eridian.allenpress.com/operative-dentistry/article-pdf/26/2/1/1819280/1559-2863-26-2-1.pdf by guest on 17 July 2022

177Leonard & Others: Minimum Irradiance to Polymerize Composites
resin-modified glass ionomers, polyacid-modified resincomposites and pit and fissure sealants. In addition,visible light-curing units are required for most bondingsystems, an increasing number of bases and liners, var-ious luting agents and some provisional restorativematerials. Adequate polymerization of these materialsdepends on the light source intensity (irradiance),wavelength and curing time. Unless all three are ade-quate, the materials will not completely polymerize andexhibit poor physical properties that may lead to earlyfailure (Rueggeberg, Caughman & Curtis, 1994a; Cook,1982).
Visible light-activated resins utilize a diketoneabsorber, such as camphoroquinone, to create free radi-cals that initiate the polymerization process (Council onDental Materials, 1985; Cook, 1982). The effective wave-length range to activate camphoroquinone has beenreported to be between 410 nm and 500 nm, with a peakwavelength of 470 nm (Cook, 1982; McCabe & Carrick,1989). Research has shown that an irradiance of from300 mW/cm2 to 400 mW/cm2 is necessary to adequatelycure a 2-mm thick resin composite specimen (Bayne &Taylor, 1995; Rueggeberg & others, 1994a). This assumesthat the correct wavelength of light (390 nm to 520 nm)is used as well as a minimum 40-second curing time.Irradiance values less than 300 mW/cm2 can be com-pensated for by longer exposure times, however lightsources with irradiance values less than 233mW/cm2
should not be used (Rueggeberg & others, 1994a).Ideally, a 60-second cure of 1-mm-thick resin compositeincrements using a light irradiance of at least 400mW/cm2 is recommended (Rueggeberg & others, 1994a).
The degree to which a resin composite can be poly-merized using a visible light-curing unit is affected bycharacteristics inherent to the particular materialbeing polymerized. For example, for adequate polymer-ization, previous investigations have concluded thatmicrofil resin composites require greater irradiancethan hybrids (Rueggeberg & others, 1994b; Atmadja &Bryant, 1990). Although some studies have found thatdarker shades are more difficult to polymerize thanlighter shades (Cook & Standish, 1983; Swartz, Phillips& Rhodes, 1983), other work indicates that depth ofcure may actually be less dependent on shade than ontranslucency (Ferracane & others, 1986).
Minimal irradiance values previously cited have eitherbeen unsupported by scientific studies or nonspecificwith regard to the particular type of resin compositebeing polymerized. This study determined the minimumirradiance required to adequately polymerize a 2-mmincrement of a hybrid and a microfil resin composite.
METHODS AND MATERIALS
An Optilux 401 curing light (Demetron ResearchCorporation, Danbury CT 06810) with an 8-mm diameter
SaniCure tip (Dentsply/Caulk, Milford DE 19963) wasused as the light source for all procedures. The curinglight’s power was measured with a laboratory-gradepower meter (PowerMax 500D with PM10 Probe,Molectron Detector, Inc, Portland OR 97224) and theirradiance calculated. The irradiance output of the curinglight was varied by altering the input voltage using avariable AC power supply (Model 1001P, CaliforniaInstruments, San Diego CA 92129). The power supplymaintained the selected line voltage, thereby negatingthe effect of transient line voltage fluctuations on thelight’s intensity during testing (Fan & others, 1987).Three 60-second exposures of the curing light spaced onesecond apart were performed before any irradiancemeasurements were made. This was done to eliminatethe possibility of irradiance variations as a result of acool bulb (Rueggeberg, 1993). Initial testing with theDemetron light indicated that the irradiance peakedimmediately after initiating an exposure but returnedafter 20 seconds to a lower stable level for the remainderof the exposure. For that reason, all timed light expo-sures began after the light had been operating for 20 sec-onds. Spectral radiance plots from 100 mW/cm2 to 700mW/cm2 in 100-mW/cm2 increments were obtained witha Photo Research PR-650 SpectraColorimeter (PhotoResearch, Inc, Chatsworth CA 91313-2192) and found tobe similar. This eliminated concerns that the light unit’sspectral radiance plots might be different when theunit’s output irradiance was altered by changing thevoltage to the curing light.
A polytetrafluoroethylene mold 2-mm high and 8 mmin diameter was used to prepare five depth-of-cure testspecimens. To prepare each specimen, the mold wasplaced on a clear glass slide and the resin compositeplaced in the mold. The resin composite was then cov-ered with a second glass slide to ensure that the exposedsurface of the composite was flat and parallel to the sur-face of the mold. One side of the specimen was thenexposed to the visible light polymerization unit for 40 or60 seconds at various experimental irradiance levels. Ahybrid resin composite (Z-100 shade A-3, 3M DentalProducts, St Paul MN 551444-1000) and a microfil resincomposite (Silux Plus, universal shade, 3M DentalProducts) were used to address reported differentdegrees of cure between hybrid and microfil resins(Atmadja & Bryant, 1990). Following fabrication, speci-men thickness was measured with an electronic digitalcaliper (Fowler & NSK, Newton MA 02166) to ensureproper dimensions (± 0.1 mm). Twenty-four hours afterpolymerization, hardness indentations were made witha Knoop hardness tester (M-400-G2, LECO, St JosephMI 49085) using a 100-gram load and a dwell time of 10seconds. For each specimen, three hardness measure-ments were made for the top surface and three for thebottom surface. Mean hardness values were then calcu-lated for each surface. These values were then averaged
Dow
nloaded from http://m
eridian.allenpress.com/operative-dentistry/article-pdf/26/2/1/1819280/1559-2863-26-2-1.pdf by guest on 17 July 2022

178 Operative Dentistry
for the five specimens to obtain a mean top surfacevalue and a bottom surface value. The bottom value wasthen divided by the top value and multiplied by 100 toobtain percentage depth of cure. If that mean valueexceeded 80%, the specimen was considered adequatelypolymerized (Watts, Amer & Combe, 1984; Breeding,Dixon & Caughman, 1991; Manga, Charlton &Wakefield, 1995).
For each resin composite and exposure time, the datawere plotted and a simple linear regression was per-formed with Knoop hardness (KH) percentage as thedependent variable and irradiance as the independentvariable. The resulting regression equation was used topredict the irradiance value required under the testconditions to produce a specimen with a KH percentageof 80%.
RESULTS
Data for KH percentage at the difference irradiancelevels are presented in Figures 1-4. Each point represents
the mean KH percentage of five specimens. As can beseen in Figure 1, the first mean KH percentage valueabove 80% for Z100 using a 40-second exposure time wasrecorded when the irradiance value was 275 mW/cm2.Analysis showed that the irradiance values correlatedsignificantly with the measured KH percentages of thespecimens (p<0.0001, r2=0.86). From the regression equa-tion, the predicted irradiance value required to produce aspecimen with KH percentage of 80% is 260.1 mW/cm2.
Figure 2 shows that the first mean KH percentagevalue above 80% for Z100 using a 60-second exposuretime was recorded when the irradiance value was 175mW/cm2. The irradiance values correlated significantlywith the KH percentages of the Z100 specimens(p<0.0001, r2=0.96). The regression equation revealedthat the predicted irradiance value required to produce aspecimen with KH percentage of 80% under these testconditions is 185.0 mW/cm2.
The first mean KH percentage value above 80% meas-ured for Silux Plus using a 40-second exposure time
Figure 1. Correlation and linear regression between the measuredKnoop hardness percentages of Z100 and irradiance values of the lightunit using a 40-second exposure time.
Figure 2. Correlation and linear regression between the measuredKnoop hardness percentages of Z100 and irradiance values of the lightunit using a 60-second exposure time.
Figure 3. Correlation and linear regression between the measuredKnoop hardness percentages of Silux Plus and irradiance values of thelight unit using a 40-second exposure time.
Figure 4. Correlation and linear regression between the measuredKnoop hardness percentages of Silux Plus and irradiance values of thelight unit using a 60-second exposure time.
Dow
nloaded from http://m
eridian.allenpress.com/operative-dentistry/article-pdf/26/2/1/1819280/1559-2863-26-2-1.pdf by guest on 17 July 2022

179Leonard & Others: Minimum Irradiance to Polymerize Composites
(Figure 3) was recorded when the irradiance value was575 mW/cm2. Statistical testing found that the irradiancevalues correlated significantly with the KH percentages(p<0.0001, r2=0.95). Based on the regression equation, thepredicted irradiance value required to produce a SiluxPlus specimen with KH percentage of 80% is 542.9mW/cm2.
For Silux Plus using a 60-second exposure, the firstmean KH percentage value above 80% was recordedwhen the irradiance value was 350 mW/cm2. The irradi-ance values correlated significantly with the KH percent-ages of the specimens (p<0.0014, r2=0.66). The regressionequation revealed that the predicted irradiance valuerequired to produce a specimen with KH percentage of80% under these test conditions is 449.0 mW/cm2.
The predicted irradiance required to produce a speci-men with KH percentage of 80% for each material at 40and 60 seconds is summarized in Table 1.
DISCUSSION
Because of the large number of light-activated dentalmaterials, visible light-curing units have become com-mon equipment in dental offices. The proper perform-ance of these units (that is, their ability to provide ade-quate irradiance) is crucial to optimizing the physicalproperties of light-activated materials. Inadequatepolymerization has been associated with inferior physi-cal properties, higher solubility, retention failures andadverse pulpal responses due to unpolymerizedmonomers (Council on Dental Materials, 1985;Blankenau & others, 1991).
The minimum irradiance necessary to adequatelypolymerize a 2-mm thickness of composite resin is gen-erally accepted to be 300 mW/cm2. At least one textbookcites this value, and curing light manufacturers rein-force it in their operating instructions. However, recentresearch suggests that this value may not be adequate.In a study using two brands of resin composite,Rueggeberg & others (1994a) recommended 400mW/cm2 for 60 seconds to ensure adequate polymer-ization. Manga & others (1995) found that an irradi-ance of 600 mW/cm2 for 40 seconds was required to be75% confident that a 2-mm-thick hybrid compositespecimen was adequately polymerized.
This study found adequate polymerization was notonly a function of curing time and irradiance, but wasalso significantly affected by composition of the resincomposite. The microfil composite Silux Plus required
more than twice the irradiance required by the hybridcomposite, Z-100 in order to be considered adequatelypolymerized. This is in agreement with previous studiesthat found that microfil resin composites demonstrate adecreased depth of cure compared to hybrid and macro-filled resin composites (Ruyter & Oysaed, 1982;Atmadja & Bryant, 1990; Ferracane & others, 1986). Itis believed that microfills exhibit this reduced depth ofcure because their small filler particles cause light scat-tering, which decreases the effectiveness of the curinglight.
The results of this study indicate that the minimumirradiance value of 300 mW/cm2 recommended by curinglight manufacturers may be adequate for hybrid resincomposites but is insufficient for microfil resins. Thisappears to be true for both 40- and 60-second exposuretimes. This finding is important given the fact thatmany practitioners use lights that provide inadequateirradiance. Barghi, Berry & Hatton (1994) measuredthe irradiance levels of 209 curing lights from 122 pri-vate practice offices and found that 45% had light out-puts of less than 300 mW/cm2. Of these, 65% had out-puts of less than 200 mW/cm2. What was most discon-certing was that only 10% of the clinicians realized thattheir units were providing inadequate irradiance.Using this study as a baseline, it is conceivable that asignificant number of hybrid and a majority of microfilresin composites are inadequately polymerized.
Microfills are commonly used in the anterior regionwhere esthetics is a primary concern. Frequently, theyare also the material of choice for direct placementveneers and esthetic alterations. In these situations, cli-nicians often use larger-diameter curing tips to exposethe entire area of the resin composite to the light. Theuse of these larger tips, however, further reduces thelight intensity level. A recent study by Leonard,Charlton & Hilton (1999) found that using a 12-mm-diameter curing tip reduced the curing light’s irradi-ance by 39% when compared to a standard 8-mm curingtip. In addition, the study found that many of the mostpopular radiometers on the market overestimated thetrue irradiance from 12-mm tips by as much as 50%.Therefore, even clinicians who periodically assess theirlight unit’s irradiance with a commercial radiometermay be unaware of this reduction. These findings, cou-pled with the poor performance of the majority of cur-ing lights in use and the observed need for higher irra-diance levels with microfil resin composites, stronglysuggests that a substantial number of resin compositerestorations currently being placed are potentiallyunderpolymerized.
CONCLUSIONS
The effect of resin composite composition (that is,hybrid versus microfil) on the minimum irradiancerequired to adequately polymerize a 2-mm increment of
Exposure Time
Material 40 Seconds 60 Seconds
Silux Plus 542 mW/cm2 449.0 mW/cm2
Z-100 260.1 mW/cm2 185.0 mW/cm2
Table 1
Dow
nloaded from http://m
eridian.allenpress.com/operative-dentistry/article-pdf/26/2/1/1819280/1559-2863-26-2-1.pdf by guest on 17 July 2022
180 Operative Dentistry
the composite was evaluated. The results of this studyindicate a significant difference between the minimumirradiance required to adequately polymerize thehybrid resin composite, Z-100, and the microfil, SiluxPlus. The generally accepted value of 300 mW/cm2
appears to be adequate for proper polymerization of thehybrid resin composite used in this study. However, themicrofil resin composite required twice the irradianceas that of the hybrid for adequate polymerization.Higher minimum irradiance values need to be estab-lished and recommended for microfil resin composites.
Note
The views expressed in this article are those of the authors and donot reflect the official policy of the Department of Defense or otherdepartments of the United States Government.
Acknowledgments
The authors thank 3M for supplying the resin composites used inthis study.
(Received 27 January 2000)
References
Atmadja G & Bryant RW (1990) Some factors influencing thedepth of cure of visible light-activated composite resinsAustralian Dental Journal 35(3) 213-218.
Barghi N, Berry T & Hatton C (1994) Evaluating intensity out-put of curing lights in private dental offices Journal of theAmerican Dental Association 125(7) 992-996.
Bayne SC & Taylor DF (1995) Dental materials In: The Art andScience of Operative Dentistry St. Louis: Mosby p 260.
Blankenau RJ, Kelsey WP, Powell GL, Shearer GO, BarkmeierWW & Cavel WT (1991) Degree of composite resin polymer-ization with visible light and argon laser American Journal ofDentistry 4(1) 40-42.
Breeding LC, Dixon DL & Caughman WF (1991) The curingpotential of light-activated composite resin luting agentsJournal of Prosthetic Dentistry 65(4) 512-518.
Cook W (1982) Spectral distributions of dental photopolymer-ization sources Journal of Dental Research 61(12) 1436-1438.
Cook WD & Standish PM (1983) Cure of resin-based restorativematerials II White light photopolymerized resins AustralianDental Journal 28(5) 307-311.
Council on Dental Materials Instruments & Equipment (1985)Visible light-cured and activating units Journal of theAmerican Dental Association 110(1) 100-102.
Fan PL, Wozniak WT, Reyes WD & Stanford JW (1987)Irradiance of visible light-curing units and voltage variationeffects Journal of the American Dental Association 115(3)442-445.
Ferracane JL, Aday P, Matsumoto H & Markerer VA (1986)Relationship between shade and depth of cure for light-acti-vated dental composite resins Dental Materials 2(2) 80-84.
Leonard DL, Charlton DG & Hilton TJ (1999) Effect of curing-tip diameter on the accuracy of dental radiometers OperativeDentistry 24(1) 31-37.
Manga RK, Charlton DG & Wakefield CW (1995) In vitro evalu-ation of a curing radiometer as a predictor of polymerizationdepth General Dentistry 43(3) 241-243.
McCabe JF & Carrick TE (1989) Output from visible-light acti-vation units and depth of cure of light-activated compositesJournal of Dental Research 68(11) 1534-1539.
Rueggeberg FA (1993) Precision of hand-held dental radiometersOperative Dentistry 24(6) 391-396.
Rueggeberg FA, Caughman WF & Curtis JW (1994a) Effect oflight intensity and exposure duration on cure of resin com-posite Operative Dentistry 19(1) 26-32.
Rueggeberg FA, Caughman WF, Curtis JW Jr & Davis HC(1994b) A predictive model for the polymerization of photo-activated resin composites International Journal ofProsthodontics 7(2) 159-166.
Ruyter IE & Oysaed H (1982) Conversion in different depths ofultraviolet and visible light activated composite materialsActa Odontologica Scandinavica 40(3) 179-192.
Swartz ML, Phillips RW & Rhodes B (1983) Visible light-acti-vated resins—depth of cure Journal of the American DentalAssociation 106(5) 634-637.
Watts DC, Amer O & Combe EC (1984) Characteristics of visi-ble-light-activated composite systems British Dental Journal156(6) 209-215.
Dow
nloaded from http://m
eridian.allenpress.com/operative-dentistry/article-pdf/26/2/1/1819280/1559-2863-26-2-1.pdf by guest on 17 July 2022

©Operative Dentistry, 2001, 26, 181-185
Pulpal Temperature Changewith Visible
Light-Curing
C Porko • E-L Hietala
Clinical Relevance
The warming effect of the light curing lamp on pulp should be taken into account whencuring large restorations or inlays/onlays that need several consecutive light curingexposures.
SUMMARY
In vitro measurements were made to reveal theheat transference to the pulp chamber duringlight curing. Ten extracted human teeth were keptin physiologic saline at body temperature. In thefirst part of the study, five light curing exposuresof 40 seconds were given to the occlusal surface ofeach tooth with a light curing unit.The tempera-ture of the pulp was measured by a thermocoupleprobe that was inserted into the pulp through theapex. The maximal temperature rise was 2.2°C.Thereafter, standard occlusal cavities were pre-pared in all 10 teeth and filled with compositeresin filling material in three parts. The dentaladhesive was light cured for 20 seconds and eachcomposite increment for 40 seconds. An extracycle of 40 seconds was given when the cavity wasfilled as a post cure. The maximal temperature dif-ference during the total procedure was 7.2°C. Theheating effect of light curing should thus be takeninto account when restorations are cured.
INTRODUCTION
The dental pulp is vulnerable tissue whose viability maybe compromised during cavity preparation and otherrestorative procedures. Consecutive hole drilling andplacing of four dentin pins caused a statistically signifi-cant increase in temperature in the pulp chamber (Anil& Keyf, 1998). Thermal injury can occur due to theexothermic hardening process of filling materials or theheating effect of the curing lamp. Hussey (1995) hasmeasured a maximum temperature rise of 12°C in thecomposite in situ during polymerization, although thismay only be for a short period. When Castelnuovo &Tjan (1997) measured temperature rise in the pulp duringfabrication of provisional resinous crowns, the resultsdemonstrated that the amount of heat generated duringresin polymerization and transmitted to the pulpalchamber could be damaging to pulpal tissues, includingodontoblasts. Hartanto, Benthem & Ott (1990) have alsopointed out the possibility of high temperaturesobserved in the polymerization of most composites andtheir adverse effects on pulp tissue. The greatest rise intemperature occurred when the first layer of compositewas light cured (Goodis & others, 1990). When the tem-perature in the pulp chamber rises by 5.5°C, the pulp isirreversibly damaged (Zach & Cohen, 1965). On theother hand no signs of pulpal inflammation wereobserved four weeks after electrothermal debonding ofceramic brackets. In this in vitro experiment, the maxi-mum temperature increase at the enamel-dentin inter-
Institute of Dentistry, University of Oulu, PL5281, FIN-90014 Oulun Yliopisto, FINLAND
Carita Porko, DDS
Eeva-Liisa Hietala, DDS, PhD
Dow
nloaded from http://m
eridian.allenpress.com/operative-dentistry/article-pdf/26/2/1/1819280/1559-2863-26-2-1.pdf by guest on 17 July 2022

182 Operative Dentistry
face was 6.9°C (Jost-Brinkmann & others, 1997).Curing lamps vary from one to another in the amount ofheat generated (Goodis & others, 1990), and the mosteffective light sources give the highest temperature rise(Hansen & Asmussen, 1993). According to a recentpaper by Powell, Anderson & Blankenau (1999), pulpchamber temperature increases from laser units weresignificantly lower than those of conventional curinglights tested in vitro. In that study, temperature increasesfor the argon laser for the recommended curing timewere 3°F or less. Dentin has low thermal conductivity,but its insulation property diminishes when the thick-ness decreases (Thompson, Gomez & Puckett, 1997;White, Fagan & Goodis, 1994; Lauer & others, 1990).When the remaining dentin thickness was 1.0 mm orless, the percentage of teeth with abscess formationsincreased in composite filled teeth (Stanley, Going &Chauncey, 1975). Also, the thickness of remainingdentin was significant for the amalgam restorationswhen temperature rise in the pulp due to finishing ofdirect restorative materials was measured (Stewart,Bachman & Hatton, 1991). Glass ionomer cements aremore irritating, especially when used as luting agents inareas where the remaining dentin thickness is 0.5 mmor less (Stanley, 1992). The balancing factor in vivo isblood flow (Andersen, Aars & Brodin, 1994; Raab &Muller, 1989).
Little research has been published concerning theeffect of light curing on the dental pulp. This studyexplored the effect of light curing on the pulpal temper-ature in vitro.
METHODS AND MATERIALS
Ten third molars were voluntarily donated after extrac-tion from young healthy students. All extractions werecarried out in the course of normal student dental caredue to lack of space. The molars were put in physiologicalsaline immediately upon extraction.
Due to the fragility of the thermocouple probe, theaccess through the apex was confirmed by pre-openingthe canal through the apex with a root canal reamer#30. In some teeth, the most apical 2-3 mm of the rootwas cut off with a diamond bur to enable access. Theteeth were transferred into a water bath kept at bodytemperature (37.0 +- 0.1°C). The temperature of thewater bath was checked with both an ordinary mercurythermometer and the thermocouple probe (+- 0.1°C).The needle probe (Hypodermic Needle Probe HYP-30-1/2-T-G-60-SMP-M, Omega Engineering, Inc, Stamford,CT 06906 USA) connected to a NiCr-NiAl thermocouplethermometer (Fluke 52 K7J Thermometer, John FlukeMfg Co, Inc, Everett, WA, USA) was pushed through theapical foramen into the coronal pulp chamber up to thewidening of the neck in the probe or until resistance wasfelt. The probe remained in place without any specialfixing because of the narrowness of the root canal. The
exact location of the probe was checked radiographically.The teeth were adjusted with sticky wax in a cover on astand so that the crown of the tooth was above liquidlevel and the root was in a water bath at 37.0+-0.1°C.The room temperature was about 21°C. Five consecu-tive 40 second light curing exposures (3M Curing LightXL3000, made in Germany for 3M Dental ProductsDivision, St Paul, MN, USA; light output 650 mW/cm2)were directed on the occlusal surface of the teeth andthe temperature rise was registered immediately aftereach exposure. The time interval between each consecu-tive light curing set was five to 10 seconds. The teethwere thereafter preserved totally under water in thesame water bath until an occlusal cavity was prepared.
A standard occlusal cavity (2 mm broad, 5 mm longand 2 mm deep extending just to the dentin) was pre-pared with a diamond high speed friction grip bur underwater cooling and the teeth were preserved in a waterbath as above. The thermoprobe was pushed throughthe apical foramen and the tooth was adjusted, usingsticky wax when needed, with the crown above the liquidlevel and the root in a water bath (37.0+-0.1°C). Thetemperature was allowed to settle for two minutes Thecavities were then etched with 30% phosphoric acid for20 seconds (Delton Etching Liquid, Ash/Dentsply, York,GB), rinsed with water for 15 seconds and dried gentlyfor two seconds. For bonding, Scotchbond Multi-PurposeDental Adhesive system (3M Dental Products, St Paul,MN, USA) was used. The primer was applied to enameland dentin and dried gently for five seconds. Then theadhesive was applied into the cavity and light cured for20 seconds. Temperature was measured immediatelyafter each stage. Each cavity was filled in three incre-ments (3M Restorative Z100, batch number 1999-1014FX, Vita Shade C4, 3M Dental Products, St Paul, MN,USA) and each increment was light cured for 40 secondsimmediately after application. One extra light curinginterval of 40 seconds was used to confirm the polymer-ization. Temperature rise during the procedure was reg-istered as described above. After the last curing interval,the temperature was allowed to settle for two minutesand measured once again.
Statistically significant differences between the tem-peratures were assessed using paired sample t-test(SPSS 8.0 for Windows).
RESULTS
Radiographs revealed that the end of the thermocoupleprobe was situated in the pulp just beneath the dentin(Figure 1). Because the crown of the tooth was abovethe liquid level, the temperature of the pulp decreasedby 0.4-2.1°C during the settling time of two minutes.Light exposures caused the temperature to rise in allteeth examined. The mean temperature at the begin-ning of the experiment, after settling time, was 35.89°C(SD 0.62°C) and the mean temperature after five con-
Dow
nloaded from http://m
eridian.allenpress.com/operative-dentistry/article-pdf/26/2/1/1819280/1559-2863-26-2-1.pdf by guest on 17 July 2022

183
secutive light curing sets was37.49°C (SD 0.28°C). The differ-ence was statistically significant(p<0.01). The highest temperatureregistered in unprepared teeth was37.7°C, and the lowest 36.8°C afterfive 40-second light curing expo-sures. The maximum temperaturerise in unprepared teeth was 2.2°Cafter five consecutive 40-secondlight exposures, and the minimumtemperature rise was 1.1°C,respectively (Figure 2).
The temperature curves duringrestoration procedures are shownin Figure 3. The mean startingtemperature was 35.77°C (SD0.67°C). The curves show that tem-perature rise follows a very similarpattern in all molars examined.The lowest temperatures were reg-istered after etching and rinsingwith water (mean 32.51°C, SD1.34°C). The highest temperatures(mean 37.15°C, SD 0.54°C) wereregistered in all teeth after fivelight curing exposures (20 secondsfor adhesive and 4x40 seconds forrestoration). The difference wasstatistically significant (p<0.01).
Porko & Hietala: Light Curing and Pulpal Temperature Change
Figure 1. Radiograph representing the situa-tion of the thermoprobe just beneath thedentin in the pulp.
Figure 2. Temperature rise (°C) in the pulp of 10 third molars when five 40-second light intervals weredirected on the surface of the teeth with a light curing lamp. Vertical axis: Temperature °C; horizontalaxis: number of light curing exposures.
Figure 3. Temperature rise (°C) in the pulp of 10 third molars when the cavity was filled with three incre-ments of composite and each increment was light cured for 40 seconds. An extra “post curing shot” of40 seconds was given. Vertical axis: Temperature °C; horizontal axis: stages of the filling procedure.Abbreviations: Start = first registration of the temperature after two minutes settling time; etch = tem-perature after etching for 20 seconds and rinsing for 15 seconds and gentle drying for two seconds; adh= temperature after priming and gentle drying for five seconds and curing the adhesive for 20 seconds;1-3 = 40 seconds light curing intervals after each increment; 4 = 40 seconds post curing shot immedi-ately after filling the cavity, 2 min = temperature after two minutes settling time.
Dow
nloaded from http://m
eridian.allenpress.com/operative-dentistry/article-pdf/26/2/1/1819280/1559-2863-26-2-1.pdf by guest on 17 July 2022

184 Operative Dentistry
The difference between the starting temperatures andthe maximum temperatures after light curing was alsostatistically significant (p<0.01). The maximum tem-perature difference between the lowest and the highesttemperature during the total procedure was 7.2°C, andthe minimum was 1.8°C, respectively. The maximumdifference between starting and ending temperatureswas not more than 1.4°C. The highest temperature reg-istered was 37.8°C and the lowest maximum tempera-ture after light curing was 37.2°C. Immediately afterlight curing, the temperatures began to fall. Table 1summaries the most meaningful results.
DISCUSSIONCavity preparation under water cooling, and the subse-quent etching and priming, lowered the pulpal temper-ature. In this experimental procedure, it was impossibleto simulate the stabilizing effect of blood flow in a vitaltooth, which the authors tried to compensate for withthe constant temperature of the surroundings. Waterbath has a very stabilizing effect on pulpal tempera-tures. This fact was further emphasized when intra-pulpal temperatures were tested while holding theextracted tooth in the air with forceps. An increase intemperature up to 15 degrees was achieved when sta-bilizing water was removed from the system. In clinicalcircumstances, the surrounding temperature may varymore during restorative procedures, for example,because of breathing. In vivo rubber dam inhibits theeffect of breathing, and the circumstances are similarto this experiment. The balancing blood flow is oftensuppressed by local anesthesia (Muller & Raab, 1990)depending on the type of anesthetic used. On the otherhand, it has been concluded that painful stimulationcan induce significant increases in blood flow in theregion adjacent to the stimulus (Kemppainen & others,1994).
The distance from the light source to the tip of thetemperature probe was not exactly the same. Combinedwith individual variation in tooth morphology anddentin structure, this may explain the temperature dif-ferences between the teeth tested.
The temperature curves presented clearly show thatboth curing light per se and in connection with compositefilling techniques can affect pulpal temperature in
vitro. The polymerization process is known to be anexothermic reaction (Hartanto, Benthem & Ott, 1990;Hussey, 1995; Castelnuovo & Tjan, 1997) which isenhanced by light curing, as shown in this study. Therise of temperature by 2°C is within the limit of pulpalphysiology (Ma, Marangoni & Flint, 1997). The tem-perature rises in this study stayed mostly within thislimit, although temperature differences of as high as7.2°C could be registered during the total filling proce-dure when the cooling effect of etching and rinsing wasalso taken into account. According to studies related tolaser irradiation, Chang & Wilder-Smith (1998) statedthat pulp tissues must be present to ensure clinical rel-evance of thermal measurements. So, the proceduredoes not allow the authors to draw any conclusion onthe absolute temperatures which may be reached in vivo.
It is known that composite filling should be cured inincrements of 2 mm thickness to assure maximal poly-merization of the material. The depth of curingdepends on the material, for example, shade and fillersize. It should also be kept in mind that a smallincrease in the depth of cure is followed by a dispropor-tionately high increase in temperature (Hansen &Asmussen, 1993). Because the depth of curing cannotbe effectively compensated for by prolonged light cur-ing, which also causes a marked warming effect on dentalpulp as shown in this study, it is rational to restore withincremental curing of thin layers of composite, ratherthan bulk placement of composite and extended lightcuring, which can cause a marked rise in pulpal tem-perature.
CONCLUSIONS
The warming effect of light curing devices per se and inconnection with composite filling can affect pulpal tem-perature in vitro. When five consecutive light curingsequences were applied to the occlusal surface ofunprepared teeth, the maximum temperature rise of2.2°C was measured in the pulp. This could simulatethe curing process of an inlay or onlay. When placing adirect composite restoration in three increments, thetemperature difference between the start and end ofthe process was maximally only 1.4°C, and thus withinthe range of pulpal physiology. However, the maximumdifference between the lowest and highest tempera-
Mean Temp Mean Temp Range of Temp Range of MaxBefore After Change Temp Differential
(Before/After) (Anytime)
No Prep 35.89°C 37.49°C 2.8°C 2.2°C
Prep + Restored 35.77°C 37.15°C 2.9°C 7.2°C
Table 1:
Summary of the most meaningful results. Abbreviations: Temp = temperature, Prep = preparation, Max = maximum, Before/After = temperature difference between the start andthe end of the measurements, Anytime = temperature difference between the lowest and highest temperature during the whole procedure.
Dow
nloaded from http://m
eridian.allenpress.com/operative-dentistry/article-pdf/26/2/1/1819280/1559-2863-26-2-1.pdf by guest on 17 July 2022

185
ture in the pulp during the total process was as high as7.2°C. The cooling effect of the rinsing water after etchingcauses the pulpal temperature to fall quickly, and thuscauses extra stress on the pulp. With respect to thepostoperative sensitivity of composite fillings or inlaysand onlays, reaction to temperature differences shouldbe taken into account. More sophisticated methods areneeded to solve the problem in vitro and in vivo.
(Received 15 February 2000)
References
Andersen E, Aars H & Brodin P (1994) Effects of cooling andheating of the tooth on pulpal blood flow in man Endodontics& Dental Traumatology 10(6) 256-259.
Anil N & Keyf F (1998) Determining the temperature rise in thepulp and at the root surface during pin hole drilling and placingof dentine pins European Journal of Prosthodontics andRestorative Dentistry 6(3) 111-114.
Castelnuovo J & Tjan AH (1997) Temperature rise in pulpalchamber during fabrication of provisional resinous crowns TheJournal of Prosthetic Dentistry 78(5) 441-446.
Chang JC & Wilder-Smith P (1998) Laser-induced thermalevents in empty and pulp-filled dental pulp chambers Lasersin Surgery and Medicine 22(1) 46-50.
Goodis HE, White JM, Gamm B & Watanabe LG (1990) Pulpchamber temperature changes with visible-light-cured com-posites in vitro Dental Materials 6(2) 99-102.
Hansen EK & Asmussen E (1993) Correlation between depth ofcure and temperature rise of light-activated resinScandinavian Journal of Dental Research 101(3) 176-179.
Hartanto H, van Benthem H & Ott KH (1990) Untersuchungenuber das Temperaturverhalten von Komposit-Kunststoffen beider Polymerization [Study of temperature of composite resinsduring polymerization] (1990) ZWR 99(12) 986-988 (German).
Hussey DL, Biagioni PA & Lamey PJ (1995) Thermographicmeasurement of temperature change during resin compositepolymerization in vivo Journal of Dentistry 23(5) 267-271.
Jost-Brinkmann PG, Radlanski RJ, Artun J & Loidl H (1997)Risk of pulp damage due to temperature increase during ther-modebonding of ceramic brackets European Journal ofOrthodontics 19(6) 623-628.
Kemppainen P, Leppanen H, Jyvasjarvi E & Pertovaara A (1994)Blood flow increase in the orofacial area of humans induced bypainful stimulation Brain Research Bulletin 33(6) 655-662.
Lauer HC, Kraft E, Rothlauf W & Zwingers T (1990) Effects ofthe temperature of cooling water during high-speed and ultrahigh-speed tooth preparation The Journal of ProstheticDentistry 63(4) 407-414.
Ma T, Marangoni RD & Flint W (1997) In vitro comparison ofdebonding force and intrapulpal temperature changes duringceramic orthodontic bracket removal using carbon dioxidelaser American Journal of Orthodontics and DentofacialOrthopedics 111(2) 203-210.
Muller H & Raab WH (1990) Einfluss der Lokalanasthesie aufdie Thermoregulation der Zahnpulpa [The effects of local anes-thesia on the thermoregulation of the tooth pulp] DeutscheZanhärztliche Zeitschrift 45(4) 216-218 [German].
Powell GL, Anderson JR & Blankenau RJ (1999) Laser and curinglight induced in vitro pulpal temperature changes Journal ofClinical Laser Medicine and Surgery 17(1) 3-5.
Raab WH & Muller H (1989) TemperaturabhängigeVeränderungen der Mikrozirkulation der Zahnpulpa[Temperature-dependent changes in the microcirculation ofthe dental pulp] Deutsche Zahnärztliche Zeitschrift 44(7) 496-497 [German].
Stanley HR (1992) Local and systemic responses to dental com-posites and glass ionomers Advances in Dental Research 6 55-64.
Stanley HR, Going RE & Chauncey HH (1975) Human pulpresponse to acid pretreatment of dentin and to compositerestoration Journal of the American Dental Association 91(4)817-825.
Stewart GP, Bachman TA & Hatton JF (1991) Temperature risedue to finishing of direct restorative materials AmericanJournal of Dentistry 4(1) 23-28.
Thompson MN, Gomez HF & Puckett AD (1997) Pulpal temper-ature changes after exposure to a light curing source Journalof Dental Research 76 79 abstract 524.
White SM, Fagan MC & Goodis HE (1994) Intrapulpal tempera-tures during pulsed Nd:YAG laser treatment of dentin, in vitroThe Journal of Periodontology 65(3) 255-259.
Zach L & Cohen G (1965) Pulp response to externally appliedheat Oral Surgery Oral Medicine Oral Pathology 19 515-530.
Porko & Hietala: Light Curing and Pulpal Temperature Change
Dow
nloaded from http://m
eridian.allenpress.com/operative-dentistry/article-pdf/26/2/1/1819280/1559-2863-26-2-1.pdf by guest on 17 July 2022

SUMMARY
After polishing or glazing, slight color changes ofmachined porcelain restorations may be per-ceived, compared to the originally selectedshade. This study compared the precision of thetristimulus colorimeter with the spectropho-tometer to quantitatively measure the colorchanges of milled porcelain restorations afterpolishing or glazing and to evaluate the relation-ship between the color changes and the surfaceroughness. Ten two-millimeter thickness speci-mens of each shade were prepared from five
shades of Vita Cerec Mark II porcelain blocks.Each specimen was ground with #220 grit SiCpaper on an automatic polishing machine to sim-ulate the surface roughness of milled restorationground with 54 or 64 µm diamond grinding tools.To compare the precision of the spectrophotometerwith the tristimulus colorimeter, CIE Lab* valuesof each specimen were measured and the coeffi-cients of variation (CV) for each instrument com-puted. Ra values were also obtained using aSurface Analyzer. After verifying the precision ofthe tristimulus colorimeter, a second set of meas-urements were taken after the polishing or glazingprocedure to quantitatively evaluate the effect ofthese procedures on the shade of the milledrestorations. To evaluate the relationshipbetween the color change and the surface rough-ness, a second set of Ra measurements weretaken and the correlation between them ana-lyzed. The tristimulus colorimeter measured theL* value more precisely than the spectropho-tometer (p<0.05), but on the a* and b* color coor-dinates, it was not significantly superior to thespectrophotometer (p>0.05). The color differencevalues produced by polishing or glazing weregreater than 2 ∆∆E units. After polishing and glaz-ing, among the three coordinates examined, ∆∆L*was the most prominent determinant on∆∆E*(∆∆R2/polishing=0.9744 and ∆∆R2/glazing=0.9413),
©Operative Dentistry, 2001, 26, 186-192
Colorimetric and RoughnessChanges of Ceramic Blocks
by Polishing and Glazing
BH Cho • SJ Heo • CG ChangHH Son • HC Kwon • CM Um
Clinical Relevance
Color changes caused by polishing or glazing of porcelain blocks could be easily perceivedby the naked eye.
Seoul National University, College of Dentistry,Department of Conservative Dentistry andDental Research Institute, 28-2 Yeongun-dong,Chongro-gu, Seoul, Korea 110-749
Byeong-Hoon Cho, DDS, MSD, PhD, assistant professor
Seoung-Joo Heo, DDS, MSD, PhD, assistant professor,Department of Prosthodontics
Chang-Gok Chang, PhD, associate professor, DongdukWomen’s University, Department of Health Science
Ho-Hyun Son, DDS, MSD, PhD, assistant professor
Hyuk-Choon Kwon, DDS, MSD, PhD, professor
Chung-Moon Um, DDS, MSD, PhD, professor and chair
Dow
nloaded from http://m
eridian.allenpress.com/operative-dentistry/article-pdf/26/2/1/1819280/1559-2863-26-2-1.pdf by guest on 17 July 2022

187Cho & Others: Colorimetric and Roughness Changes of Ceramic Blocks by Polishing and Glazing
but ∆∆a* and ∆∆b* had little effect. There was no sta-tistically significant correlation between thechanges in surface roughness and color in eitherpolishing (r=0.3555, p=0.0812) or glazing (r=-0.1570, p=0.4520).
INTRODUCTION
Traditionally, porcelain laminates, inlays and onlayswere fabricated by the refractory die method, but recentlya method to fabricate these restorations with millingtools was developed—the so-called “milling method.”The CAD/CAM and copy-milling methods are includedin this category. In this method, porcelain restorationsare made from porcelain blocks pre-fabricated underclosely controlled conditions in the factory. These newrestorative materials have improved physical propertieswhen compared with traditional powder-type ceramicmaterials (Jedynakiewicz & Martin, 1993; Eidenbenz,Lehner & Schärer, 1994).
However, these pre-fabricated porcelain blocks havelimitations. Although the manufacturers supply theblocks in several shades, they are monochromatic, andit is difficult to express the various color changes fromthe cervical to the incisal segments of the natural tooth.Secondly, porcelain laminates, inlays and onlays madeby the milling method must be polished after cementa-tion or glazed before cementation. This is becausemilling is performed with 54 or 64 µm diamond grindingtools (Mikrona Technology AG, 1995; Pfeiffer, 1996).Clinically, slight color changes may be perceived in theporcelain restorations after polishing or glazing.Therefore, it was hypothesized that the color of milledporcelain restorations would change from the originallyselected shade after polishing or glazing, and thischange could be perceived by the naked eye.
To assess the color of the teeth being restored, variousshade guides were used. This empirical method is unre-liable because it is highly dependent on subjectiveassessment and a lack of standardization. Optical elec-tronic instruments have been developed for more pre-cise and reliable quantification of the color than visualshade tabs (Bangtson & Goodkind, 1982; Goodkind,Keenan & Schwabacher, 1985; Wozniak & others, 1985;van der Burgt & others, 1990; O’Brien, Boenke & Groh,1991; Swift, Hammel & Lund, 1994). In dentistry, quan-titative color measurements were carried out with aspectrophotometer and the CIELAB system for qualitycontrol (Brewer & others, 1985; Seghi, Johnston, &O’Brien, 1986a; ten Bosch & Coops, 1995). Recently,portable tristimulus colorimeters were evaluated tomeasure the color of natural teeth in the mouth. Theiraccuracy and effectiveness were compared with those ofthe well-studied reference instrument, a spectropho-tometer (Bangtson & Goodkind, 1982; Seghi, Johnston& O’Brien, 1986b; Seghi, Johnston & O’Brien, 1989a;van der Burgt & others, 1990; Seghi, 1990).
This study compared the precision of the tristimuluscolorimeter with the spectrophotometer to quantita-tively measure the color changes of the milled porcelainrestorations after polishing or glazing and evaluatedthe relationship between color change and surfaceroughness.
METHODS AND MATERIALS
Sample Preparation
In this study commercially available porcelain blocks(Vita Cerec Mark II, I8 size; Vita Zahnfabrik H RauterGmbH & Co, KG, D-79704 Bad Säckingen, Germany) offive different shades were used. The shades were #A1,A2, A3, A3.5 and B3. Ten specimens were prepared fromeach shade by sectioning the blocks into 2 mm slabs witha diamond saw (Isomet; Buehler Ltd, Lake Bluff, IL60044, USA), then grinding with #220 grit SiC paper onan automatic polishing machine (LotoPol-V & Pedemat;Struers Ltd, Glasgow G60 5EU, UK) to simulate thesurface roughness of milled restoration with 54 or 64 µmdiamond grinding tools (European FEPA standard).
Comparison of Spectrophotometric andColorimetric Measurements
To evaluate the precision of the tristimulus colorimeter(Chroma Meter CR-321; Minolta Co Ltd, Osaka 541,Japan) utilizing 45° illumination/0° viewing anglegeometry, a spectrophotometer (SpectrophotometerCM-3500d; Minolta Co Ltd, Osaka 541, Japan) with dif-fuse illumination/10° viewing angle geometry was usedas a reference instrument. For reference purposes, spec-trophotometric measurements were performed underconditions of standard C-illumination (C: representa-tive of overcast whole sky illumination), specular com-ponent excluded, 3 mm target mask and the absoluteblack acrylic plate on 50 specimens ground with #220grit SiC paper. Initially, CIE Lab* values were meas-ured at five points on the ground surfaces of the 50ground specimens. Because each shade was sampled 10times, 50 measurements were performed on each shadegroup. A total of 250 measurements were taken.
Colorimetric measurements were performed in thesame manner to evaluate the coefficient of variationbetween the two instruments using standard C-illumi-nation and on the standard photographic 18% gray card(Eastman-Kodak Co, Rochester, NY 14624, USA) in adarkroom.
Colorimetric Comparison Between Before andAfter Polishing or Glazing
After verifying the precision of the colorimeter, thisinstrument was used to take additional measurementsafter polishing or glazing to quantitatively evaluate theeffect of these procedures on the shade of the milledrestorations. Ten specimens in each of five shade groupswere divided into two subgroups of five specimens. The
Dow
nloaded from http://m
eridian.allenpress.com/operative-dentistry/article-pdf/26/2/1/1819280/1559-2863-26-2-1.pdf by guest on 17 July 2022

188 Operative Dentistry
ground surfaces of the specimens of one subgroup werepolished using the Soflex Finishing/Polishing System(3M Dental Products, St Paul, MN 55144, USA), andthose of the other subgroup were glazed with the glazeof Vita Shading Paste (sp 15; Vita Zahnfabrik H RauterGmbH & Co, KG, D-79704 Bad Säckingen, Germany).CIE Lab* values were then measured in the mannerdescribed above. From the two sets of CIE Lab* meas-urements, color differences (∆E*) of each group wereobtained from the following equation :
∆E* = [(∆L*)2 + (∆a*)2 + (∆b*)2)]1/2
Surface Roughness AnalysisTo evaluate the relationship between the surfaceroughness and the color change, average roughness
(Ra) values of the 50 specimens of porcelain blocksground with #220 grit SiC paper were obtained with aSurface Analyzer (Form Talysurf Plus; Rank TaylorHobson Ltd, Leicester LE4 9JQ, England). For eachspecimen five one-millimeter line-scans were per-formed in different areas. After the previouslydescribed polishing or glazing procedures, the Ra valuesof all the specimens were obtained with the sameinstrument. From these measurements, the correlationbetween the changes of the CIE Lab* values and thoseof the Ra values for each specimen were analyzed.
Statistical Analysis
The coefficients of variation (CV) for each instrumenton each of the three color coordinates L*, a* and b* were
Instrument Shade L* a* b*
Spectrophotometer A1 53.96 (0.64) -0.81 (0.05) 1.55 (0.23)
A2 53.11 (0.75) -0.92 (0.04) 1.49 (0.35)
A3 52.16 (0.74) -0.35 (0.05) 5.77 (0.28)
A3.5 53.13 (1.25) -0.16 (0.04) 8.39 (0.53)
B3 51.82 (0.97) -0.74 (0.04) 6.43 (0.32)
Colorimeter A1 60.85 (0.65) -1.22 (0.05) 2.78 (0.30)
A2 59.52 (0.73) -1.38 (0.04) 3.14 (0.31)
A3 58.42 (0.26) -1.08 (0.11) 8.63 (0.23)
A3.5 57.89 (0.75) -1.07 (0.19) 13.39 (0.67)
B3 57.78 (0.71) -1.61 (0.15) 9.88 (0.49)
Table 1: CIE Lab* Values of Five Shades of Vita Cerec Mark II Porcelain Blocks Ground with #220 SiC Paper Measured with Spectrophotometer and Colorimeter. (Numbers in parentheses are standard deviations, n=10)
Color Instruments Mean of CVs Standard Deviation t p-Value
L* Colorimeter 1.0528 0.3499 3.0659 0.0374Spectrophotometer 1.6483 0.4659
a* Colorimeter -8.851 5.9020 -1.197 0.2972Spectrophotometer -11.04 8.7413
b* Colorimeter 6.6585 3.4994 1.7399 0.1569Spectrophotometer 10.895 8.1652
Table 2: Paired t-Test of Coefficient of Variation (CV) of Two Instruments by Color Coordinates
Treatment Variables Steps R2 ∆R2 p-Value
Polishing ∆E* - ∆Lab* ∆L* entered 0.9744 0.9744 <0.0001∆b* entered 0.9951 0.0207 0.0099∆a* entered 0.9965 0.0014 <0.0001
Glazing ∆E* - ∆Lab* ∆L* entered 0.9413 0.9413 <0.0001∆b* entered 0.9985 0.0572 0.0392∆a* entered 0.9988 0.0003 <0.0001
Table 3: Forward Stepwise Regression Analysis for ∆E* Dependent on ∆L*, ∆a* and ∆b* Values After Polishing or Glazing
Dow
nloaded from http://m
eridian.allenpress.com/operative-dentistry/article-pdf/26/2/1/1819280/1559-2863-26-2-1.pdf by guest on 17 July 2022

189Cho & Others: Colorimetric and Roughness Changes of Ceramic Blocks by Polishing and Glazing
computed to compare the precision of the two instru-ments. The results were analyzed using the paired t-test. To evaluate changes in the colorimetric valuesbetween before and after polishing or glazing proce-dures, the paired t-test analyzed the statistical signifi-cance of changes in each color coordinate of all the sub-groups. The Forward Stepwise Regression Analysisevaluated the effect of the changes of each color coordi-nate on the color differences (∆E*) after polishing orglazing. Finally, the correlation between the color differ-ences and the changes of the average roughness values(∆Ra) were analyzed using Pearson Product MomentCorrelation Analysis. Statistical analyses were carriedout using SigmaStat software system (SigmaStat forwindows version 1.0; Jandel Scientific Co, San Rafael,CA 94912-7005, USA).
RESULTS
Table 1 shows the CIE Lab* values of the five shades ofVita Cerec Mark II porcelain blocks ground with #220grit SiC paper obtained from both instruments. Usingthese data, the coefficient of variation (CV) of each
instrument for the three different color coordinates L*,a* and b* were computed. The mean CV of the tristim-ulus colorimeter was smaller than the spectrophotome-ter. In detail, the tristimulus colorimeter measured theL* value more precisely than the spectrophotometer(p<0.05). Although on the a* and b* color coordinates,the mean CV values of the tristimulus colorimeter weresmaller than the spectrophotometer, the former wasnot significantly superior to the latter (p>0.05) (Table 2).
After polishing, L* values decreased (p<0.05) and a*and b* values increased (p<0.05) except for shades A1-a* (p=1.0000) and A2-a* (p=0.1194) (Figures 1-3). L*values also decreased after glazing (p<0.01; Figure 1).The a* values decreased after glazing in the A1 and A2shade groups (p<0.05) and remained unaltered in theA3 (p=0.0971), A3.5 (p=0.5012) and B3 (p=0.1573)shade groups (Figure 2). However, glazing increasedthe b* values in all shade groups (p<0.05; Figure 3).Therefore, colorimetric measurements indicated thatthe L* values (brightness) of the porcelain specimens
Treatment Shade Ra (#220)† Ra (treated)‡ ∆∆Ra§ ∆∆E* r¶ p-Value
Polishing A1 0.51 (0.09) 0.21 (0.20) -0.30 (0.24) 3.93 (0.44) 0.3555 0.0812A2 0.29 (0.09) 0.11 (0.03) -0.18 (0.10) 1.62 (0.80)A3 0.34 (0.06) 0.14 (0.08) -0.21 (0.12) 2.07 (0.35)A3.5 0.40 (0.12) 0.22 (0.23) -0.18 (0.18) 2.19 (1.07)B3 0.35 (0.10) 0.12 (0.04) -0.23 (0.12) 2.11 (0.82)
Glazing A1 0.32 (0.08) 0.88 (0.26) 0.57 (0.29) 3.39 (0.59) -0.1570 0.4520A2 0.35 (0.13) 1.04 (0.28) 0.69 (0.35) 3.29 (0.82)A3 0.35 (0.09) 1.06 (0.29) 0.71 (0.31) 2.09 (0.27)A3.5 0.26 (0.05) 0.92 (0.36) 0.66 (0.36) 2.28 (0.59)B3 0.28 (0.10) 0.65 (0.14) 0.37 (0.16) 3.09 (0.35)
Table 4: Pearson Product Moment Correlation Analysis Between the Changes of the Average Roughness Values and Color Difference Values of Different Shades of Ceramic by Polishing or Glazing. (Numbers in parentheses are standard deviations, n=25, unit of Ra: µm)
†Ra (#220): average roughness values of specimens ground with #220 SiC paper.‡Ra (treated): average roughness values of specimens after polishing with Soflex Finishing/Polishing System or glazing with the glaze of Vita Shading Paste.§ ∆Ra: Ra(polishing or glazing) – Ra(#220)¶ r: Correlation Coefficient
52
54
56
58
60
62
beforepolishing
afterpolishing
beforeglazing
afterglazing
L*
A1A2A3A3.5B3
Figure 1. Changes of L* values before and after polishing or glazing.
-2
-1.5
-1
-0.5
0
beforepolishing
afterpolishing
beforeglazing
afterglazing
a*
A1A2A3A3.5B3
†
†
†
†
†
Figure 2. Changes of a* values before and after polishing or glazing.(†: the color coordinates whose changes after polishing or glazing arestatistically not significant (p>0.05)).
Dow
nloaded from http://m
eridian.allenpress.com/operative-dentistry/article-pdf/26/2/1/1819280/1559-2863-26-2-1.pdf by guest on 17 July 2022

190 Operative Dentistry
were decreased and the b* values shifted towards theyellow region by both the polishing and glazing proce-dures. However, the color changes in a* values weredependent on the original shades of the porcelainblocks.
Considering that color difference values greater than2 ∆E units were correctly judged by the observer group100% of the time (Seghi, Hewlett & Kim, 1989b), thecolor changes of all the shades produced by polishing orglazing would be easily perceived, with the exception ofshade A2 by polishing (Figure 4). After polishing, ∆L*was the most prominent determinant on ∆E* amongthe three coordinates (∆R2=0.9744, p<0.0001), but ∆a*(∆R2=0.0014, p<0.0001) and ∆b*(∆R2=0.0207,p=0.0099) had little effect. After glazing, ∆E* was alsodetermined primarily by ∆L* (∆R2=0.9413, p<0.0001)and not by ∆a* (∆R2=0.0003, p<0.0001) or ∆b*(∆R2=0.0572, p=0.0392) (Table 3).
The average roughness values of the polished speci-mens decreased from their original ground values, butthose of the glazed specimens increased (Table 4).Pearson Product Moment Correlation analysis showedno statistically significant correlation between changesin the average roughness values and the color differ-ences for both polishing (r=0.3555, p=0.0812) and glaz-ing (r=-0.1570, p=0.4520).
DISCUSSION
In the dental industry, color monitoring and evaluationhave been carried out using both tristimulus colorime-ters and spectrophotometers. Although the spectropho-tometer had tremendous potential for its use in popula-tion samples, manufacture of porcelain and the devel-opment of shade guides, it was too complex and expen-sive for routine use in the dental office or laboratory.The main disadvantage of this instrument was thatteeth must be extracted and placed in the machine(Miller, 1987). To overcome this problem, small area col-orimeters used in the mouth were introduced, and theiraccuracy and effectiveness have been evaluated against
the spectrophotometer (Bangtson & Goodkind, 1982;Seghi & others, 1986b; Seghi & others, 1989a; van derBurgt & others, 1990; Seghi, 1990).
In this study, the shades of Vita Cerec Mark II blockswere measured with both instruments. As the shadedesignation number increased, L* values decreased anda* and b* values increased; that is, the brightness(Value) of the color decreased and the Hue shiftedtoward red and yellow (Table 1). However, the absolutevalues of the translucent ceramic blocks measured bythe spectrophotometer were lower in L* and b* coordi-nates and higher in a* coordinate than the results ofthe colorimeter. These differences can be explained bythe different backgrounds used, that is, spectrophoto-metric measurements were obtained using the absoluteblack acrylic plate, but colorimetric results wereobtained using the 18% standard gray card. This obser-vation is in partial agreement with Knispel. All threevalues rose significantly when the sample was movedfrom a black to a white background (1991). Anotherexplanation might result from the edge loss phenome-non (van der Burgt & others, 1990). During color meas-urement, sideward displacement of light in a specimencauses severe edge loss when the same small window isused for both the illumination and the collection oflight. Because the spectrophotometer detects thereflected light from a 10° viewing angle and excludesscattered components, 3 mm diameter windows mightgive significant edge loss in the case of the spectropho-tometer. Moreover, because light scattering and absorp-tion resulting in edge loss showed a degree of wave-length dependence, it may also play a role in edge loss.Edge loss affects Value, Chroma and Hue scores.Because the values obtained by various instrumentswere not the same, Seghi recommended these instru-ments be restricted to the use of differential assess-ments (1990).
The effectiveness of utilizing instrumental colorimetrictechniques in dentistry will ultimately depend on theaccuracy and precision of the measurements on
0
5
10
15
20
beforepolishing
afterpolishing
beforeglazing
afterglazing
b*
A1A2A3A3.5B3
Figure 3. Changes of b* values before and after polishing or glazing.
0
1
2
3
4
5
A1 A2 A3 A3.5 B3
dE
polishingglazing
Figure 4. ∆E* values of different shades of ceramic by polishing or glazing.
Dow
nloaded from http://m
eridian.allenpress.com/operative-dentistry/article-pdf/26/2/1/1819280/1559-2863-26-2-1.pdf by guest on 17 July 2022

191
translucent dental structures. The accuracy of aninstrument was assessed by comparing the measure-ments obtained on the test instrument with correspon-ding values obtained on the reference instrument, andthe instrument precision by evaluating the errors asso-ciated with the repeatability of the L*, a* and b* meas-urements for each instrument (Seghi & others, 1989a).The colorimetric instruments were capable of producingcolor measurements with precision (Seghi & others,1986b; Seghi & others, 1989a; Seghi & others, 1989b;van der Burgt & others, 1990; Seghi, 1990; Goldstein &Schmitt, 1993). However, because the degree of accuracywith which the color measurements were made varieddepending on the instrument used and the type ofmaterial surface being measured, the accuracy of theinstrument is of least importance (Seghi & others,1989a). Nevertheless, the authors needed to decidewhich instrument to use to measure the shade changescaused by polishing or glazing, and compare the coeffi-cients of variation (CV) of each instrument to evaluateits precision. The CV can be used to evaluate the sam-pling errors of the unit in the estimation of the popula-tion. This study used the CV values to compare themeasuring precision of both instruments. The CV valueof the tristimulus colorimeter was smaller than thespectrophotometer. Actually, the tristimulus colorimetermeasured the L* value more precisely than the spec-trophotometer (p<0.05), but on the a* and b* color coor-dinates, it was not significantly superior to the spec-trophotometer (p>0.05) (Table 2).
Thus, the colorimeter was used for subsequent meas-uring. In the past, zero-degree viewing-type instru-ments were considered sensitive to variations in sur-face finishes, which have the effect of varying theamount of surface-scattered light. However, with vastlyimproved electronics and circumferential illuminatingoptics, the sensitivity to specimen orientation has beenreduced (Seghi, 1990). The translucency, thickness,repeated firing, background and even minor variations,such as surface geometry and texture, can also signifi-cantly affect the data collected by a colorimeter(Jorgenson & Goodkind, 1979; Obregon, 1981;Sorensen & Torres, 1987; Seghi & others, 1986a). Tolessen the effects of these factors in this experiment,the flat-polished standard surfaces of specimens wereused by grinding ceramic blocks with #220 SiC paperon an automatic polishing machine. Colorimetric valueswere measured using a 45° illumination/0° viewingangle geometry, which had smaller CV values than thespectrophotometer.
The polishing and glazing procedures decreased thevalues of the porcelain specimens (Figure 1) and shiftedthe Hue to yellow in the yellow-blue axis (Figure 3).However, the Hue changes in the red-green axis weredependent on the original shade of the porcelain
(Figure 2). From the two sets of CIE Lab* measure-ments, color differences (∆E*) of each group were calcu-lated. Many suggestions concerning the validity of ∆E*values higher than those detectable by the human eyehave been made (Farbmessung, 1981; Seghi & others,1989b; Wozniak, 1987; Ruyter & others, 1987).Generally, these suggestions agree that a measuredcolor difference value (∆E* value) of 1.0 to 2.0 is usuallyaccepted by observers as being identical, and those withdifferences greater than two units correctly assessedthem to be different 100% of the time. Bearing in mindthese suggestions, it appears that the color changesproduced in all shades by polishing and glazing wouldbe readily perceived by well-trained clinicians, exceptfor shade A2 by polishing (Figure 4).
After polishing and glazing, the major changes in ∆E*values resulted from a decrease in ∆L* values, but ∆a*and ∆b* values had little, if any, determining power inthe changes in ∆E* values (Table 3). These observationsagree with the observations of Goldstein & Schmitt(1993), who also concluded that major changes weredue to variations in the L* values. After polishing, theaverage surface roughness (Ra) values decreased in allshade groups, but after glazing, they increased.Pearson Product Moment Correlation analysis showedthat the ∆E* values had no statistically significant cor-relation with the ∆Ra values in either polishing or glazing(Table 4). However, the distribution of ∆E* values of allshade groups after glazing was within a narrowerrange than after polishing (Figure 4). These findingsmight consider the inherent color of the glazing materialas a cause for the measured color difference. Moreresearch with various glazing materials would be neededto evaluate the influence of the inherent shade of thematerials and the relationship between color differ-ences and surface roughness. Conclusively, the colorchanges after polishing or glazing could be easily per-ceived by the naked eye.
CONCLUSIONS
The tristimulus colorimeter measured the value moreprecisely than the spectrophotometer. As the color dif-ference values measured were greater than two ∆Eunits, the color changes in all the shades produced bypolishing or glazing would be readily perceived. Afterpolishing and glazing, ∆E* was mostly affected by ∆L*.However, no correlation was found between the changesin ∆E* values and the changes in surface roughness.
(Received 23 February 2000)
References
Bangston LK & Goodkind RJ (1982) The conversion ofChromascan designations to CIE tristimulus values Journal ofProsthetic Dentistry 48(5) 610-617.
Cho & Others: Colorimetric and Roughness Changes of Ceramic Blocks by Polishing and Glazing
Dow
nloaded from http://m
eridian.allenpress.com/operative-dentistry/article-pdf/26/2/1/1819280/1559-2863-26-2-1.pdf by guest on 17 July 2022

192 Operative Dentistry
Brewer JD, Akers CK, Garlapo DA & Sorensen SE (1985)Spectrometric Analysis of the Influence of Metal Substrates onthe Color of Metal-Ceramic Restorations Journal of DentalResearch 64(1) 74-77.
Eidenbenz S, Lehner CR & Schärer P (1994) Copy milling ceram-ic inlays from resin analogs: A practicable approach with theCelay system International Journal of Prosthodontics 7(2)134-142.
Farbmessung (1981), Gleichheitsverfahren, DIN 5033-5, Berlin,Deutsches Institut fur Normung.
Goldstein GR & Schmitt GW (1993) Repeatability of a speciallydesigned intraoral colorimeter Journal of Prosthetic Dentistry69(6) 616-619.
Goodkind RJ, Keenan KM & Schwabacher WB (1985) A compar-ison of Chromascan and spectrophotometric color measure-ments of 100 natural teeth Journal of Prosthetic Dentistry53(1) 105-109.
Jedynakiewicz N & Martin N (1993) CAD/CAM in restorativedentistry: The Cerec Method, 3rd edition, Liverpool: LiverpoolUniversity Press pp 144-148.
Jorgenson MW & Goodkind RJ (1979) Spectrophotometric studyof five porcelain shades relative to the dimensions of color,porcelain thickness, and repeated firings Journal of ProstheticDentistry 42(1) 96-105.
Knispel G (1991) Factors affecting the process of color matchingrestorative materials to natural teeth QuintessenceInternational 22(7) 525-531.
Mikrona Technology AG (1995) Range of milling tools for CelayCelay News, Spreitenbach: Mikrona Technologie AG January1995 5-7.
Miller L (1987) Organizing color in dentistry Journal of theAmerican Dental Association (Special Issue) 26E-40E.
Obregon A, Goodkind RJ & Schwabacher WB (1981) Effects ofopaque and porcelain surface texture on the color of cer-amometal restorations Journal of Prosthetic Dentistry 46(3)330-340.
O’Brien WJ, Boenke KM & Groh CL (1991) Coverage errors oftwo shade guides International Journal of Prosthodontics 4(1)45-50.
Ruyter IE, Nilner K & Moller B (1987) Color stability of dentalcomposite resin materials for crown and bridge veneers DentalMaterials 3(5) 246-251.
Seghi RR, Johnston WM & O’Brien WJ (1986a)Spectrophotometric analysis of color differences betweenporcelain systems Journal of Prosthetic Dentistry 56(1) 35-40.
Seghi RR, Johnston WM & O’Brien WJ (1986b) The accuracy andprecision of two Minolta Colorimeters on dental porcelainsJournal of Dental Research 65 Abstracts of Papers pp 230Abstract 543.
Seghi RR, Johnston WM & O’Brien WJ (1989a) Performanceassessment of colorimetric devices on dental porcelainsJournal of Dental Research 68(12) 1755-1759.
Seghi RR, Hewlett ER & Kim J (1989b) Visual and instrumentalcolorimetric assessments of small color differences of translu-cent dental porcelain Journal of Dental Research 68(12) 1760-1764.
Seghi RR (1990) Effects of Instrument-measuring Geometry onColorimetric Assessments of Dental Porcelains Journal ofDental Research 69(5) 1180-1183.
Sorensen JA & Torres TJ (1987) Improved color matching ofmetal ceramic restorations. Part II. Procedures for visual com-munication Journal of Prosthetic Dentistry 58(6) 669-677.
Swift EJ, Hammel SA & Lund PS (1994) Colorimetric evaluationof Vita shade resin composites International Journal ofProsthodontics 7(4) 356-361.
ten Bosch JJ & Coops JC (1995) Tooth color and reflectance asrelated to light scattering and enamel hardness Journal ofDental Research 74(1) 374-380.
van der Burgt TP, ten Bosch JJ, Borsboom PCF & KortsmitWJPM (1990) A comparison of new and conventional methodsfor quantification of tooth color Journal of Prosthetic Dentistry63(2) 155-162.
Wozniak WT, Fan PL, McGill S, Moser JB & Stanford JW (1985)Color comparisons of composite resins of various shade desig-nations Dental Materials 1(4) 121-123.
Wozniak WT (1987) Proposed guidelines for the acceptance pro-gram for dental shade guides, Chicago, American DentalAssociation, p 1-2.
Dow
nloaded from http://m
eridian.allenpress.com/operative-dentistry/article-pdf/26/2/1/1819280/1559-2863-26-2-1.pdf by guest on 17 July 2022

©Operative Dentistry, 2001, 26, 193-200
SUMMARY
This study determined the influence of a flow-able composite lining on marginal microleakageand internal voids in a Class II compositerestoration. Forty-eight extracted molars wereprepared with Class II cavities and randomlydivided into four groups: Group I–Prodigy filling/Revolution lining; Group II–Prodigy filling only;Group III–Tetric Ceram/Tetric Flow lining;Group IV–Tetric Ceram filling only. After thermo-cycling tests and dye soaking, these teeth weresectioned longitudinally. Gingival-marginalmicroleakage and internal voids in three sepa-rate portions of the restoration (Interface,Cervical and Occlusal voids) were observed witha stereomicroscope. Results revealed no signifi-cant difference in the marginal sealing betweenpairs with or without the flowable composite lin-
ing. Restorations conducted with a flowable com-posite lining (Groups I and III) exhibited fewertotal voids and fewer voids in the interface(p<0.05). However, there was no significant cor-relation between the number of restoration voidsand the associated microleakage. A flowable com-posite lining in a Class II resin filling could effec-tively reduce the voids in the interface and thetotal number of voids in the restoration, but maynot necessarily improve marginal sealing.
INTRODUCTION
Dentistry is facing a transition into the age of adhesivedental restorations (Christensen, 1995). Considering issuessuch as perceived mercury toxicity, overall restorationaesthetics and patients’ discretion, since the 1980s moreand more clinicians have been choosing compositerestoration materials in lieu of amalgam for posteriorteeth fillings. Lutz (1996) referred to resin compositematerials as viable amalgam alternatives given thematerial’s compressive strength, wear resistance,longevity and radiopacity, etc. In the ADA Council onDental Benefit Programs (1998), potential uses for poste-rior teeth resin-based composites were discussed. Apartfrom teeth that are subject to heavy occlusal stress andfor patients who are allergic or sensitive to resin-basedmaterials, posterior resin composite restorations havebeen well accepted due to improvements in the materialsand the development of better dentin adhesives.
Microleakage andInternal Voids in Class II
Composite Restorations withFlowable Composite Linings
S-F Chuang • J-K Liu • Y-T Jin
Clinical Relevance
In a simulated Class II box-only composite restoration, the use of a flowable resincomposite lining achieved a reduction in the number of internal voids but no benefitregarding marginal sealing. In addition, this study revealed no absolute correlationbetween the extent of microleakage and the presence of internal voids in a restoration.
Department of Dentistry, National Cheng-KungUniversity Hospital, 138 Sheng-Li Road, Tainan70428 Taiwan
Shu-Fen Chuang, DDS, attending staff, Section ofOperative Dentistry
Jia-Kuang Liu, DDS, chief, lecturer
Ying-Tai Jin, DDS, MS, chief, professor, Department ofPathology
Dow
nloaded from http://m
eridian.allenpress.com/operative-dentistry/article-pdf/26/2/1/1819280/1559-2863-26-2-1.pdf by guest on 17 July 2022

194 Operative Dentistry
There are, however, some problems associated withcomposite resin restorations for posterior teeth, includinga less-than-optimal wear resistance, a lack of fracturetoughness and marginal adaptation problems(Leinfelder, 1988). Wear resistance and mechanicalstrength, however, have recently been improved by theoptimization of the filler particle used, with the particlesize reduced and the filler loading increased. Somesofter filler particles have been incorporated in order todecrease the modulus of elasticity of the resin and toprevent fracture, reducing wear rate from nearly 100µm/year, previously, to less than 10 µm/year, currently(Leinfelder, 1995). These materials remain technique-sensitive, however, due to the extensive contractionwhich accompanies polymerization (from 1.67 to5.68%; de Gee & others, 1981) and negatively influ-ences marginal sealing (Ferracane, 1995).
To improve the marginal sealing of a compositerestoration, many clinical techniques have been tested.These include incremental techniques (Tzan & others,1992) and various modifications to the light-curingtechnique used (Lutz & others, 1986), although nonotable benefit from these modifications has beendemonstrated. Use of low-modulus lining materialsuch as glass ionomers (Aboushala & others, 1996;Crim & Chapman, 1994), resinous liners (Kakaboura& others, 1996; Ulusu & others, 1996) or new-genera-tion dentin bonding agents (Chan & Swift, 1994;Goracci & others, 1995; Nakabayashi & Saimi, 1996)have been proposed. However, these lining materialsreduced but did not completely eliminate microleak-age. Recently, packable or condensable compositeswere developed by densely loading fillers into hybridcomposites (Nash, 1998), with all mechanical proper-ties except flowability being further improved (Perry &others, 1999). The resulting high viscosity could, how-ever, increase the possibility of internal voids (Opdam& others, 1996).
Flowable composite resins were introduced in late1996 and were characterized by fluid injectability intocavities. Bayne & others (1998) classified modernresin-based restorative materials according to theirfiller content—for example, pit and fissure sealantresins, microfill composite resins, flowable compositeresins, hybrid composite resins and packable/condens-able composite resins. The filler particle size used forthese resins is similar to that used for hybrid compos-ites, but the volume content ranges between that ofhybrid composites and microfill composite resins(Bayne & others, 1998). In that paper, the physical andmechanical properties of several commercial flowablecomposites were investigated, with the authors con-cluding that mechanical properties (compressivestrength, diametral tensile strength, toughness) ofthese materials were generally about 60-90% of thoseof conventional composite resins. They suggested that
flowable composites may be used in initial Class I andII restorations, but felt that clinical application in high-occlusal load areas should be avoided. Another practicalapplication for such flowable resins appears to be asliners in areas of difficult access, such as proximal boxrestorations of Class II cavities. When used as liningmaterials beneath composite resin restorations, theymay improve marginal adaptation.
Recently, some in vitro studies have reported a reduc-tion in microleakage but an increase in the presence ofinternal voids in conservative Class I & II flowableresin composite fillings when compared to hybrid com-posite restorations (Ferdianakis, 1998; Payne, 1999). Arecent study describing the use of low-viscosity inter-mediate resins as lining materials (Swift & others,1996) reported reduced microleakage with several dif-ferent dentinal adhesive systems, although long-terminvestigation of commercial flowable composite liningshas yet to be reported.
This study investigated the influence of two commer-cial flowable composite linings on marginal micro-leakage and the presence of internal voids in Class IIcomposite restorations. It has always been presumedthat the presence of internal voids in a restoration pos-itively correlates to microleakage. In this study, thepotential correlation between these two variables wasinvestigated.
METHODS AND MATERIALS
Forty-eight freshly-extracted human molars withoutdecay, cracks or previous restorations were chosen. Theteeth were scaled and cleaned with tap water. To sim-ulate clinical posterior teeth alignment, the teeth weremounted in stone jigs with one premolar and one molareach on mesial and distal sides. Two Class II box-onlycavities without retention lock (a bucco-lingual widthof 4 mm, an occluso-gingival height of 3 mm and a pulpaldepth of 2 mm) were prepared in mesial and distal sur-faces. The margins were all located within enamel. Allthe margins were kept as close as possible to a 90°cavo-surface angle. Two flowable composite resins,Revolution (Kerr Corp, Orange, CA, USA, 906838) andTetric Flow (Vivadent Ets, Schaan, Liechtenstein,A02474), and their compatible hybrid composites,Prodigy (Kerr Corp, Orange, CA, USA, 608743) andTetric Ceram (Vivadent Ets, Schaan, Liechtenstein,A07008) respectively, were selected as experimentalmaterials. Table 1 lists a summary of experimentalmaterials used, their manufacturers, type, compositionand filler content, with experimental design depictedin Figure 1. These teeth were randomly divided intotwo groups. Then, two cavities on the same tooth ineach group were randomly assigned “with and with-out” (Group I-II or III-IV) flowable composite lininggroups to reduce the inter-tooth variation. One well-trained specialist in operative dentistry undertook the
Dow
nloaded from http://m
eridian.allenpress.com/operative-dentistry/article-pdf/26/2/1/1819280/1559-2863-26-2-1.pdf by guest on 17 July 2022

195Chuang, Liu & Jin: Flowable Composite Lining in Class II Composite Restorations
entire filling and testing procedures. All specimenswere polished with pumice powder and rinsed with tapwater after cavity preparations. The teeth were thenwrapped with metal matrix and matrix retainers, andtwo wooden wedges were inserted at the buccal andlingual sides to tightly seal the matrix—cavity margin.
For Group I and II restorations, the entire cavity(enamel and dentin) was etched with 35% phosphoricacid (Ultraetch, Untradent Products Inc, SouthJordan, Utah, USA) for 15 seconds, then washed withtap water and air dried. A single-component dentinadhesive (Optibond Solo; Kerr Corp, Orange, CA, USA,812088) was brushed into the cavity with a mini-brushfor 15 seconds and light cured (Curing light XL 3000,3M Co, St Paul, MN, USA) for 20 seconds. For Group Irestorations, cavities were covered with Revolutionabout 1 mm thick and light cured from the occlusalsurface for 20 seconds. The hybrid composite Prodigywas then placed and packed over the Revolution liningwith a resin instrument (LM 437-445si, LM-Dental,Finland) in two increments each about 1 mm thick inorder to conform to the tooth morphology, then lightcured for 40 seconds. For Group II restorations, thecavity floor was first covered with Prodigy to a depth ofone millimeter, with the remaining restoration processbeing the same as for Group I restorations. Afterremoval of the metal matrix and wooden wedges, therestorations were both light cured from the buccal andlingual sides for 20 seconds.
The cavities of Group III and IV restorations werealso etched with 35% phosphoric acid for 15 seconds,washed and air dried. The compatible bonding systemSyntact Single component (Vivadent Ets, Schaan,Liechtenstein, 926755) was applied and allowed to
stand for 20 seconds before air drying and light curingfor 20 seconds. According to the manufacturer’sinstructions, a second layer of Syntact Single compo-nent was then applied in the same manner. For GroupIII restorations, Tetric Flow was injected into cavitiesto a depth of about one millimeter, then light cured for20 seconds. Tetric Ceram was placed in cavities andlight cured in two increments for 40 seconds each. ForGroup IV restorations, cavities were filled with TetricCeram and light cured in three consecutive incre-ments of 40 seconds each. After removal of the metalmatrix and wooden wedges, the restorations wereboth light cured from the buccal and lingual sides for20 seconds.
The restorations were finished with a scalpel and finediamond burs, then polished with paper disks (Sof-Lex,3M Co). After finishing and polishing, the experimentalteeth were removed from the stone mounting jigs and
Material Manufacturer Type Composition Lot No Filler Content
Revolution Kerr Corp, Flowable resin Filler: Barium glass; synthetic silica 906838 Weight%:62Orange, CA, USA Matrix: Bis-GMA Volume%:46
Tetric Flow Vivadent Ets, Flowable resin NA* A02474 NA*Schaan,Liechtenstein
Prodigy Kerr Corp, Hybrid resin Filler: Barium fluorosilicate 608743 Weight%:79Orange, CA, USA Matrix: Bis-GMA Volume%:59
Tetric Ceram Vivadent Ets, Hybrid resin Filler: Barium glass, ytterbium trifluoride, A07008 Weight%:80Schaan, Ba-Al-F silicate glass, silicon dioxide Volume%:60Liechtenstein Matrix: Bis-GMA, UDMA, TEG-DMA
Optibond Kerr Corp, Single Filler: Fumed silica, Barium glass 812088 Volume%: 25Solo Orange, CA, USA component Matrix: NA
Dentin-bondingsystem
Syntac Vivadent Ets, Single maleic acid, HEMA, methacrylate modified 926755 NA*Single Schaan, component polyacrylic acid, initiators, stabilizers, waterComponent Liechtenstein Dentin-bonding
system
Table 1: Experimental Restorative Materials and Dentin Bonding Agents Used in This Study
*NA: Information not available.
Figure 1. Illustration of experimental model and description of three sep-arated parts of internal voids.
Dow
nloaded from http://m
eridian.allenpress.com/operative-dentistry/article-pdf/26/2/1/1819280/1559-2863-26-2-1.pdf by guest on 17 July 2022

196 Operative Dentistry
placed in isotonic saline at 37°C in a water bath for 24hours (Crim & García-Godoy, 1987). The teeth werethen placed in a thermocycling machine for 1,500 cyclesranging from 5-60°C (each dwelling time for 20 seconds),after which the root apex was sealed with utility wax.The teeth were entirely coated with nail varnish exceptfor the restoration and one millimeter beyond the mar-gins, then soaked in a 2% basic-Fuchsin dye for 24hours. Subsequent to this, the teeth were removed fromthe bath, embedded in epoxy resin and sectioned in amesio-distal direction along their longitudinal axisusing an Isomat 2000 precision saw (Buehler Ltd, USA).The sectioned teeth were observed with a 50x stereomi-croscope (Stemi SV 6, Zeiss, Germany) and scored for thedegree of dye penetration and internal porosity. Theassessor was blind to which group the teeth belonged.The scoring scales for marginal microleakage areshown:
Score 0 = No dye penetration
Score 1 = Dye penetration into enamel only
Score 2 = Dye penetration beyond the Dentino-Enamel Junction
Score 3 = Dye penetration into the pulpal wall
The scoring system for internal voids was modifiedfrom Ferdianakis’s study (Ferdianakis, 1998). For thedescription of thelocation and semi-q u a n t i t a t i v eanalysis of theinternal porosityin the restoration,the assessment ofthe voids presentwas performed inthree differentparts of the restora-tion (Figure 1):
The gingivalmarg in—res ininterface (Inter-face void).
The cervical half(Cervical void) orthe occlusal half(Occlusalvoid) of theentire restoration.
Scores for record-ing voids in thethree parts areshown as:
Score 0 = no void
Score 1 = somevoids exist
The sum of the scores for each of the three parts(Interfaced void, Cervical void and Occlusal void) wasexpressed as Total voids. Scores for Total voids rangedfrom 0-3, depending on the sum of the three individualvoid scores.
The Kruskal-Wallis test statistically examined thedata for microleakage and internal voids (three sepa-rated parts and the Total voids) in four groups. Thecomputation of significant differences was assigned at ap<0.05 level. Correlation between marginal micro-leakage and internal voids in any of the three restora-tion regions was examined by the Pearson test, withp<0.05 considered significant and p<0.01 as very signif-icant.
RESULTS
Ninety-six restorations were prepared. During the pro-cessing and sectioning procedures two specimens fromGroup I were excluded due to damage. The specimennumber of Group I was 22, whereas the other groupswas 24.
None of the groups showed complete prevention of dyepenetration. Table 2 demonstrates the frequency of thescores for marginal microleakage. Except for Group I,there was severe gingival marginal microleakage (score3) in the other groups. Group I (Prodigy/Revolution lin-
Group Score
0 1 2 3
I. Prodigy/Revolution Lining (n=22) 6 10 6 0
II. Prodigy (n=24) 2 13 6 3
III. Tetric Ceram/Tetric Flow Lining (n=24) 0 11 11 2
IV. Tetric Ceram (n=24) 2 8 7 7
Table 2: Frequency of Dye Penetration Scores as an Indicator of Marginal Microleakage
Kruskal-Wallis test: Significant difference (p<0.05) between Group I-III, I-IV.
Group Interface Cervical Occlusal Total
Void Void Void Void
0 1 0 1 0 1 0 1 2 3
I. Prodigy/ (n=22) 22 0 10 12 11 11 2 17 3 0RevolutionLining
II. Prodigy (n=24) 10 14 0 24 9 15 0 5 9 10
III. Tetric (n=24) 24 0 13 11 12 12 6 13 5 0Ceram/TetricFlow Lining
IV. Tetric (n=24) 11 13 6 18 13 11 0 12 6 6Ceram
Table 3: Frequency of Scores of Three Parts of Internal Voids and Total Voids
Kruskal-Wallis test:
Interface void: Significant difference (p<0.05) between Group I-II, I-IV, II-III, III-IV.
Cervical void: Significant difference (p<.05) between Group I-II, II-IV, II-III, III-IV.
Total void: Significant difference (p<0.05) between Group I-II, I-IV, II-III, III-IV.
Dow
nloaded from http://m
eridian.allenpress.com/operative-dentistry/article-pdf/26/2/1/1819280/1559-2863-26-2-1.pdf by guest on 17 July 2022

197Chuang, Liu & Jin: Flowable Composite Lining in Class II Composite Restorations
ing) restorations demonstrated superior marginal seal-ing, compared to Group III (Tetric Ceram/Tetric Flow)and Group IV (Tetric Ceram only) (p<0.05). There wasno statistical difference for marginal microleakagebetween Group I and II, and Group III and IV, bothwith and without flowable composite lining pairs atp=0.05 level.
The results of the assessment of internal voidspresent in the restoration are expressed as internalvoid results for each of the three separate parts of therestoration and a value for the total voids (Table 3). Thevalue for Interfaced void in Groups I and III restora-tions was zero, suggesting effective elimination of voidswithin the composite in the restoration–tooth interfaceregion for groups using flowable composite linings(p<0.05). Compared to without-lining groups (II andIV), flowable composite lining groups (I and III) exhib-ited less void formation in the filling—tooth interface ofthe restoration (p<0.05). In the cervical area, resultsshowed significant differences (p<0.05) betweenGroups I-II, III-IV pairs and II-III, II-IV comparisons.Thus, the use of flowable composite linings clearlyreduces the likelihood of Interface voids and CervicalVoids. Observing the Occlusal voids showed no signifi-cant differences among any of the four experimentalgroups at the p=0.05 level. Total voids were also lowerfor restorations utilizing a flowable composite lining.There were significant differences (p<0.05) betweenGroup I-II, III-IV pairs and I-IV, II-III comparisons.
The Pearson test examined the correlation betweenmarginal microleakage and internal voids in the threerestoration regions (Table 4). There was no correlationbetween marginal microleakage and the presence ofTotal voids or voids in any region of the restoration(p>0.05). Even the value for Interfaced voids did notcorrelate with the microleakage value (p>0.05).
From microscopic examination, some flowable com-posite lined specimens with no Interface voids revealedextensive dye penetration (score=3). Although speci-mens from Groups II and IV exhibited little voids in thetooth-resin interface, only minor dye penetration (score0 or 1) was noted. There were 26 specimens withInterface voids present that also exhibited marginal
leakage. In about 50% of the specimens demonstratingmicroleakage, the progression of dye penetration wasfound adjacent to the Interfaced void. It may be thatthe progression of dye penetration into the restorationis reduced or stopped when voids in the resin areencountered.
DISCUSSION
Marginal gaps and internal voids exist between cavitywalls and restorative materials when these materialsare poorly adapted. Microleakage may result frommany factors, such as the extent of the marginal gap,polymerization shrinkage of materials used (Eick &Welch, 1986), the degradation of the particular bondingor restorative material used (Õilo, 1992), dissolution ofliners or smear layers (Fortin & others, 1994), varyingcoefficients of thermal expansion for restoration andnative materials and varying degrees of deformationupon mechanical loading for restoration (Suzuki &others, 1985). Microleakage via the tooth restorationinterface may lead to a marginal stain, post-operativesensitivity, recurrent caries and possibly pulpal prob-lems (Brannstrom, 1986), thus prevention ofmicroleakage is very important in restorative den-tistry.
Ferdianakis (1998) tested a flowable composite resin(Revolution) for initial Class I restorations. Comparedto the control group of hybrid composite resins, flow-able composite resins more effectively reduce marginalleakage in shallow pit and fissure caries, depending ontheir flowability. However, this study revealed that theuse of flowable composite resins as a restoration liningmaterial should result in a reduction in the likelihoodof the formation of internal voids although no evidencehas been presented suggesting any substantial reduc-tion in marginal microleakage.
Flowable composite resins exhibit a lower filler con-tent (60-70% by weight and 46-70% by volume) and agreater proportion of resin matrix than hybrid resins.The greater proportion of resin matrix in flowable com-posite resins may contribute to their greater polymer-ization shrinkage. In a related sense, the elastic modu-lus of flowable composite resins is lower than that for
hybrid resins. Whenoverlying hybrid com-posite resins are light-irradiated, the contrac-tion stress generated asa result of the curingprocess may pull thelining materials awayfrom the tooth wall.Recently, some factors,such as the configura-tion of the cavity, the
Marginal Interfaced Cervical Occlusal TotalMicroleakage Void Void Void Void
Marginal Microleakage
Interfaced Void ** **
Cervical Void ** **
Occlusal Void **
Total Void ** ** **
Table 4: Significant Correlation Between the Variables (Marginal microleakage, three parts ofinternal voids, total void)
Pearson test: ** Correlation is very significant at the 0.01 level (2-tailed).
Dow
nloaded from http://m
eridian.allenpress.com/operative-dentistry/article-pdf/26/2/1/1819280/1559-2863-26-2-1.pdf by guest on 17 July 2022

198 Operative Dentistry
degree of shrinkage of the composite mass (de Gee &others, 1993) and the direction of the shrinkage vectors(Versluis & others, 1998) have been investigated andappear to be important influences on the degree ofmarginal microleakage of a restoration. While thisstudy revealed that flowable composite linings improvemarginal adaptation, concomitant contraction stressesgenerated during curing may result in a restorationwith no real improvement in marginal sealing com-pared to restorations without such linings.
Porosity is considered an undesirable property indental materials. The porosity of impression materials,poured casts and finished castings may lead to poorquality of restorations. It is generally believed thatpoor marginal adaptation is related to internal porosityand that the more voids present at a restoration inter-face, the lower the bonding efficiency of the restorationto the tooth structure (Opdam & others, 1996).However, there are suggestions that a reduction of con-traction may result from the presence of some degreeof porosity (Alster & others, 1992). These authors cre-ated porosity in the lining by stirring the luting cementand claimed that a certain number of retained porescontributed to the stress reduction of the restorationand the maintenance of marginal integrity. Theseinvestigations found that in most specimens withvoids, the progression of dye penetration into therestoration was halted when encountering a void. Theysuggested that “tension” due to void-entrapped air pre-sumably inhibited further dye penetration. However,this study had a very limited sample size and the theoryneeds further investigation.
Unrestrained porosity still provides a number ofproblems for restoration integrity. For example, largevoids will reduce the mechanical strength of therestoration. Huysmans & others (1996) reported thatimproper placement of resin composite may interferewith cavity-wall adaptation and decrease the overallflexural strength of the restoration. Extensive internalporosity distributed throughout the restoration willdecrease the contact surface area between the restora-tion and the tooth. Porosity of the external surface ofthe restoration will result in surface roughness andmay lead to staining. Thus it appears that a techniqueattempting to improve the chances of success of suchrestorations by creating porosity either at the innerinterface or within the body of the restoration itselfmay elicit unpredictable results.
Currently, flowable composite resins are consideredan emerging concept for conservative restorative den-tistry (Bayne & others, 1998) that has the potential tosave practitioners’ time. Combined with an air-abra-sion procedure, initial Class I and II caries may be easilyand efficiently addressed by such a technique(Ferdianakis, 1998; Payne, 1999). Further, when
access to the cavity is limited, the relatively fluidnature of the material virtually guarantees effectivemarginal sealing.
Many materials, such as glass-ionomer cements,resin-based materials and even dentinal adhesive havebeen considered as a lining under composite restora-tions, and most have exhibited some degree of improve-ment in marginal sealing (Crim & Chapman, 1994;Hotta & Aono, 1994; Friedl & others, 1997). An appro-priate evaluation of these lining materials related totheir long-term biodegradation, will warrant additionaltrials. Another advantage associated with the use offlowable composite resins is their mechanical strengthcompared to other analogous materials. One deficiencyof glass-ionomer cement is its lower mechanicalstrength (Gladys & others, 1997), with even resin-modified glass ionomers failing to perform well inshear-loading tests (Sidhu & others, 1999). Accordingto Bayne & others (1998), many flowable compositeresins demonstrate sufficient biaxial flexural strengthand fracture toughness to warrant their use as restora-tive materials. In addition, the radiopacity of flowablecomposite resins facilitates the distinction of the mate-rial from secondary caries (Bouschlicher & others,1999). As a lining material under a restoration, flow-able composites thus constitute the more appropriatechoice compared to other currently available restora-tive materials.
CONCLUSIONS
Results from this study reveal a reduction in the pres-ence of internal restoration voids when using flowablecomposite resins (Revolution or Tetric Flow) as a liningmaterial for composite restorations. The incidence ofinternal voids was significantly reduced at both therestoration’s interface and within its mass. No signifi-cant difference in the likelihood of marginal micro-leakage between pairs with or without flowable com-posite resin linings was demonstrated (p<0.05). No sig-nificant correlation between the number of voidsdetected in any part of the restoration and marginalmicroleakage has been found (p<0.05). The influence ofthe internal porosity on marginal microleakage andrestoration stress-relief warrants further research.
Acknowledgments
The authors thank Miss Lin-Fang Ho for her help in the statisticalwork.
The study was supported by Grant NCKUH-89-085, NationalCheng-Kung University Hospital, Tainan, Taiwan.
(Received 29 March 2000)
Dow
nloaded from http://m
eridian.allenpress.com/operative-dentistry/article-pdf/26/2/1/1819280/1559-2863-26-2-1.pdf by guest on 17 July 2022

199Chuang, Liu & Jin: Flowable Composite Lining in Class II Composite Restorations
References
Aboushala A, Kugel G & Hurley E (1996) Class II compositeresin restorations using glass-ionomer liners: Microleakagestudies Journal of Clinical Pediatric Dentistry 21(1) 67-71.
ADA Council on Scientific Affair & ADA Council on DentalBenefit Programs (1998) Statement on posterior resin-basedcomposites Journal of the American Dental Association129(11) 1627-1628.
Alster D, Feilzer AJ, deGee AJ, Mol A & Davidson CL (1992) Thedependence of shrinkage stress reduction of porosity concen-tration in thin resin layers Journal of Dental Research 71(9)1619-1622.
Bayne SC, Thompson JY, Swift EJ, Stamatiades P & WilkersonM (1998) A Characterization of first-generation flowable com-posites Journal of the American Dental Association 129(5)567-577.
Bouschlicher MR, Cobb DS & Boyer DB (1999) Radiopacity ofcompomers, flowable and conventional resin composites forposterior restorations Operative Dentistry 24(1) 20-25.
Brannstrom M (1986) The cause of postrestorative sensitivityand its prevention Journal of Endodontics 12(10) 475-481.
Chan KC & Swift EJ (1994) Marginal seal of new-generationdental bonding agents Journal of Prosthetic Dentistry 72(4)420-423.
Christensen GJ (1995) Restorative Dentistry: An update forpractitioners, educators, examining boards Journal of theAmerican Dental Association 126(8) 1165-1168.
Crim GA & García-Godoy F (1987) Microleakage: The effect ofstorage and cycling duration Journal of Prosthetic Dentistry57(5) 574-576.
Crim GA & Chapman KW (1994) Reducing microleakage inClass II restorations: An in vitro study QuintessenceInternational 25 (11)781-785.
de Gee AJ, Davidson CL & Smith A (1981) A modified dilatomerfor continuous recording of volumetric polymerization shrink-age of composite restorative materials Journal of Dentistry9(1) 36-42.
de Gee AJ, Feilzer AJ & Davidson CL (1993) True linear poly-merization shrinkage of unfilled resins and composites deter-mined with a linometer Dental Materials 9(1) 11-14.
Eick JD & Welch FH (1986) Polymerization shrinkage of poste-rior composite resins and its possible influence on postopera-tive sensitivity Quintessence International 17(2) 103-111.
Ferdianakis K (1998) Microleakage reduction from neweresthetic restorative materials in permanent molars Journal ofClinical Pediatric Dentistry 22(3) 221-229.
Ferracane JL (1995) Current trends in dental compositesCritical Review of Oral Biology and Medicine 6(4) 302-318.
Fortin D, Swift EJ Jr, Denehy GE & Reinhardt JW (1994) Bondstrength and microleakage of current dentine adhesivesDental Materials 10(4) 253-258.
Friedl KH, Schmalz G, Hiller KA & Mortazavi F (1997) Marginaladaptation of composite restorations versus hybrid ionomer/composite sandwich restorations Operative Dentistry 22(1)21-29.
Gladyss S, Van Meerbeek B, Braem M, Lambrechts P &Vanherle G (1997) Comparative physico-mechanical charac-terization of new hybrid restorative materials with conven-
tional glass-ionomer and resin composite restorative materi-als Journal of Dental Research 76(4) 883-894.
Goracci G, Mori G & Bazzucchi (1995) Marginal seal and bio-compatibility of a fourth-generation bonding agent DentalMaterials 11(6) 343-347.
Hotta M & Aono M (1994) Adaptation to the cavity floor of thelight-cured glass ionomer cement base under a compositerestoration Journal of Oral Rehabilitation 21(6) 679-685.
Huysmans MC, Vander Varst PG, Lautenschlager EP &Monaghan P (1996) The influence of simulated clinical han-dling of the flexural and compressive strength of posteriorcomposite restorative materials Dental Materials 12(2)116-120.
Kakaboura AI, Eliades GC & Palaghias G (1996) Laboratoryevaluation of three visible light-cured resinous liners Journalof Dentistry 24(3) 223-231.
Leinfelder KF (1988) Current developments in posterior com-posite resins Advanced Dental Research 2(1) 115-121.
Leinfelder KF (1995) Posterior composite resins: The materialsand their clinical performance Journal of the AmericanDental Association 126(5) 663-664, 667-668, 671-672 passim.
Leinfelder KF, Ratz GM & Nash RW (1998) A report on a newcondensable composite resin Compendium 19(3) 230-237.
Lutz F (1996) State of the art of tooth-colored restorativesOperative Dentistry 21(6) 237-48.
Lutz F, Krejci I & Oldenburg TR (1986) Elimination of polymer-ization stresses at the margins of posterior composite resinrestorations: A new restorative technique QuintessenceInternational 17(12) 777-784
Nakabayashi N & Saimi Y (1996) Bonding to intact dentineJournal of Dental Research 75(9) 1706-1715.
Õilo G (1992) Biodegradation of dental composites/glass-ionomercements Advanced Dental Research 6 50-54 Review.
Opdam NJ, Roeters JJ, Peters TC, Burgersdijk RC & Teunis M(1996) Cavity wall adaptation and voids in adhesive Class Iresin composite restorations Dental Materials 12(4) 230-235.
Payne JH (1999) The marginal seal of Class II restorations:Flowable composite resin compared to injectable glassionomer Journal of Clinical Pediatric Dentistry 23(2) 123-130.
Perry R, Kugel G & Leinfelder K (1999) One-year clinical evalu-ation of Surefil™ packable composite Compendium 20(6) 544-553.
Sidhu SK, Sherriff M & Watson TF (1999) Failure of resin-mod-ified glass ionomers subjected to shear loading Journal ofDentistry 27(5) 373-381.
Spangberg LS, Acierno TG & Yongbum CHA B (1989) Influenceof entrapped air on the accuracy of leakage studies using dyepenetration methods Journal of Endodontics 15(11) 548-551.
Suzuki M, Jordan RE & Boksman L (1985) Posterior compositeresin restorative-clinical considerations p 455 In Vanherle G& Smith DC (eds) Posterior Composite Resin DentalRestorative Materials St Paul 3M Co Peter Szulc PublishingCo, Netherlands, 1985.
Swift EJ, Triolo PT Jr, Barkmeier WW, Bird JL & Bounds SJ(1996) Effect of low-viscosity resins on the performance ofdental adhesives American Journal of Dentistry 9(3) 100-104.
Dow
nloaded from http://m
eridian.allenpress.com/operative-dentistry/article-pdf/26/2/1/1819280/1559-2863-26-2-1.pdf by guest on 17 July 2022

200 Operative Dentistry
Tjan AH, Bergh BH & Lidner C (1992) Effect of various incre-mental techniques on the marginal adaptation of Class IIcomposite resin restorations Journal of Prosthetic Dentistry67(1) 62-66.
Ulusu T, Oztas N & Tulunoglu O (1996) Comparison of the effectof insertion techniques of a resin composite on dentinal adap-
tation of two visible light-cured bases: Direct evaluation versusa replica technique Quintessence International 27(1) 63-68.
Versluis A, Tantbirojn D & Douglas WH (1998) Do dental com-posites always shrink toward the light? Journal of DentalResearch 77(6) 1435-1445.
Dow
nloaded from http://m
eridian.allenpress.com/operative-dentistry/article-pdf/26/2/1/1819280/1559-2863-26-2-1.pdf by guest on 17 July 2022

©Operative Dentistry, 2001, 26, 201-207
SUMMARY
Pulp tissue reactions to four commonly used den-tal cements were histo-pathologically evaluatedby placing the cements on exposed monkey dentalpulp followed by a surface-sealed adhesiverestoration. Evaluations were done at 3 or 5, and30 and 90 days after operation. No serious inflam-matory reaction of the pulp, such as necrosis orabscess formation, was observed. However, theconventional dental cements showed irritatingeffects on the exposed monkey dental pulp with-out bacterial contamination. Reactions ofexposed dental pulp beneath the dental cementsdiffered depending on the materials used.
INTRODUCTION
Dental cements have been widely used in conservativedentistry for 70 years. Clinical experience indicates thatdental cements placed in deep cavities without a protec-
tive sublining might damage the dental pulp, therefore,concern was directed at the acidity of the cement. Anumber of instances of post-operative sensitivity followingthe use of glass ionomer cements as luting agents forcrowns and bridges have been reported (Council onDental Materials, Instruments and Equipment, 1984).
Toxic components of various dental materials werereported as the main cause of inflammation and necrosis(Retief, Austin & Fatti, 1974). It has been suggested inrecent investigations by several researchers that thechemical toxicity of these materials, related to theiracidity, might not completely explain the harmfuleffects on the pulp and that micro-organisms mightalso be implicated. Bacterial infection through therestoration interface was the most causative factor ofpulp infection (Brännström & Nyborg, 1972). Bacterialmicro-organisms’ infiltration through marginal leakageis the greatest threat to the pulp, rather than the toxicityof the restorative materials. The dental pulp has anadequate healing potential, and some of the previouslyreported failures in pulp capping were due tomicroleakage and pulp infection (Cox, Bergenholtz &Fitzgerald, 1982). Therefore, to understand the role oftoxicity of dental materials, it is important to preventbacterial leakage in pulp tissues. The development ofan isolator with surgical facilities enabled studies to beconducted on germ-free rats, thus eliminating any pos-sibility of bacterial contamination (Kakehashi, Stanley& Fitzgerald, 1965). Adhesive resin was also used to pre-vent bacterial infiltration through marginal leakage.
Pulp Tissue Reaction toFour Dental Cements
H Sonoda • S InokoshiM Otsuki • J Tagami
Clinical Relevance
Protection of pulp is recommended in deep cavities to prevent post-cementation sensi-tivity, which may be caused by chemical irritation of the dental cements.
Tokyo Medical and Dental University, GraduateSchool, Department of Restorative Sciences,Cariology and Operative Dentistry, 1-5-45Yushima, Bunkyo-ku, Tokyo 113-8549, Japan
Hidekazu Sonoda, DDS, PhD, instructor
Shigehisa Inokoshi, DDS, PhD, honorary lecturer
Masayuki Otsuki, DDS, PhD, senior lecturer
Junji Tagami, DDS, PhD, professor and chair
Dow
nloaded from http://m
eridian.allenpress.com/operative-dentistry/article-pdf/26/2/1/1819280/1559-2863-26-2-1.pdf by guest on 17 July 2022

202 Operative Dentistry
Those resin composite restorations, etched and suc-cessfully sealed, failed to show bacterial growth byculture or staining methods (Inokoshi, Iwaku &Fusayama, 1982; Fujitani, 1986; Cox & Suzuki, 1994).
This study evaluated the chemical toxicity of commonlyused dental cements by placing them on exposed monkeydental pulp followed by a surface-sealed adhesiverestoration.
METHODS AND MATERIALS
Materials
Table 1 lists the materials, manufacturers and batchnumbers. Dycal, a Ca(OH)2 cement, was used as controlmaterial. The four dental cements used in this studywere glass ionomer, polycarboxylate, zinc oxide eugenoland zinc phosphate.
Methods
A total of 180 intact teeth of eight Japanese monkeys(Macaca Fuscata) were randomly distributed throughoutthe dentitions. The monkeys were placed under generalanesthesia by intramuscular injection of ketamine(Ketaral, Sankyo Co, Tokyo, Japan) 20 mg/kg and intra-venous injection of pentobarbital sodium (NembutalSodium Solution, Abbott Laboratories, North Chicago,USA) 10 mg/kg. A Class V cavity was prepared on thefacial surface of each tooth using a high-speed tapered
diamond bur (ISO #170, GC Co, Tokyo, Japan) underwater-spray coolant. The pulps were intentionallyexposed with a sterile round carbide bur (ISO #1,Shofu Inc, Kyoto, Japan) of 0.8 mm diameter. Localinfiltration anesthesia around the root apex wasapplied with 2% lidocaine (Xylocaine, Fujisawa Co,Osaka, Japan) containing 1: 80,000 epinephrine to con-trol hemorrhaging and exudation from the exposedpulp. The exposed area was irrigated immediatelyafter perforation with 3% H2O2 and 6% NaOCl toremove tooth debris, and all hemorrhaging was con-trolled (Katoh, Kidokoro & Kurosu, 1978). The exposedarea was carefully dried with a sterile cotton pellet andthe exposed pulp was capped with one of the five cap-ping materials.
The cavities were lined with a glass ionomer cement(Fuji I, GC Co), totally etched with 37% phosphoricacid and sealed with an adhesive resin composite(Clearfil Photo Bond and Photo Clearfil Bright,Kuraray Co, Osaka, Japan).
At 3 or 5, and 30 and 90 days after the operation themonkeys were sacrificed by intravenous injection ofthiopental sodium (Ravonal, Tanabe PharmaceuticalCo, Osaka, Japan), 250 mg/kg. The teeth were removedfrom the jawbones and immersed in 10% neutralbuffered formalin solution for one week. Before immer-sion, the mesial and distal approximal surfaces of the
Code Material Brand Content Setting Batch ManufacturerName Time No
DY Ca(OH)2 Dycal Base: Calcium phosphate, 1’00’’ 920519 Dentoply Caulk, cement Calcium Tungstate, Milford, DE, USA
Zinc Oxide,Glycol Salicylate
Catalyst:Calcium hydroxide,Zinc Oxide,Zinc Stearate,EthyltolueneSulfonamide
GI Glass Fuji I P: Fluoro-aluminosilicate glass 4’30’’ P: 310841 GC Co, TokyoPolyalkenoate L: Acrylic-maleic acid copolymer, L: 310841 JapanCement Polybasic carboxylic acid,
WaterP/L ratio = 1.8 (g/g)
PC Polycarboxylate LIVCARBO P: Zinc oxide, Magnesium oxide, 6’15’’ P: 300841 GC CoCement Polyacrylic acid powder, binder L: 300841
L: Polyacrylic acid, WaterP/ L ratio = 2.0 (g/g)
ZE Zinc Oxide EUGEDAIN P: Zinc oxide, Benzoic acid, 5’00” P:3063R SHOWA, Co,Eugenol Stearic acid magnesium, L:1059S Tokyo, JapanCement L: Rosin Clove oil, Rosin
P/L ratio = 5.0(gml)
ZP Zinc Phosphate Elite 100 P: Zinc oxide, Magnesium oxide 7’00’’ P: 271231 GC CoCement L: Phosphoric acid, Aluminum, L: 271231
WaterP/L ratio = 1.45 (g/ml)
Table 1: Restorative Materials Employed
Dow
nloaded from http://m
eridian.allenpress.com/operative-dentistry/article-pdf/26/2/1/1819280/1559-2863-26-2-1.pdf by guest on 17 July 2022

203Sonoda & Others: Pulpal Reaction to Four Dental Cements
teeth were reduced with a high-speed diamond bur underwater spray coolant until the pulp became almost visiblethrough the remaining dentin to facilitate the penetra-tion of the fixing solution. The teeth were demineral-ized with Plank-Rychlo’s decalcifying solution at 4° forfive days, neutralized with 5% sodium sulfate for sixhours and washed with running water for six hours.After removing the adhesive resin composite, the teethwere dehydrated and embedded in paraffin. Histo-pathological serial sections at 5 µm thickness of the cav-ities and pulp were prepared, obtaining approximately80 to 100 sections per cavity. These were stained withhematoxylin and eosin for routine histological eval-uation or with Taylor’s modification of Gram’s stainingtechnique for detecting micro-organisms (Taylor, 1966).
Histopathological changes of the pulp were analyzedon decalcified serial sections. The acute inflammatorycell infiltration and chronic inflammatory cell infiltra-tion were classified into four grades: none, slight, mod-erate and severe (Mjör & Tronstad, 1972). The dentinbridge formation was classified into five grades: none,initial dentin bridging, partial dentin bridging, almostcomplete dentin bridging and complete dentin bridging(Kitasako & others, 1998). The presence of bacteriaalong the cavity walls and floor was also evaluated. Thediameter of the exposed area and was measured oneach section. Among the 80 to 100 serial sections percavity, one section with the largest diameter of exposedarea was selected for assessment as a representativesection of the tooth.
Results of the pulpal responseswere statistically analyzed by theKruskal-Wallis one-way analysisof variance (Siegel & Castellan,1988) for differences among thefive groups at each time intervaland Fisher’s PLSD test for differ-ences between control and exper-imental groups at each timeinterval. One-way analysis ofvariance (ANOVA) was used todetermine significant differencesin the diameter of the exposedareas among the five groups ateach time interval.
RESULTS
Figure 1 and Table 2 summarizethe findings on the histologicalsections. All reactions wererestricted to directly beneath theexposure site. The diameter ofthe exposed areas generated inthis study ranged from 0.22 to1.56 mm (average is 0.68 mm).There were no statistically signif-
icant differences among the five groups for each timeinterval (f=1.68; df=14, 135; p=0.07).
Acute Inflammatory Cell Infiltration
After three or five days, group DY showed none-to-slight acute inflammatory cell infiltration. In thegroups of four dental cements, moderate-to-severe reac-tions were observed in 6-9 out of 10 cases. The reactionswere statistically significantly higher than that ofgroup DY (KW=21.8, p=0.0002).
After 30 days, group DY showed still none-to-slightreaction. Moderate-to-severe reactions observed atthree or five days subsided in groups GI, PC and ZP butstill persisted in group ZE. The reaction of group ZEwas statistically significantly higher than that of groupDY (KW=12.8, p=0.012).
After 90 days, no acute reaction was observed ingroup DY. Although one to three cases of slight-to-mod-erate reactions were observed in groups with four dentalcements, the other cases showed no acute reactions. Nostatistically significant difference in acute reactionoccurred among all groups.
Chronic Inflammatory Cell Infiltration
After three or five days, chronic inflammatory cell infil-tration was slight-to-moderate in all groups and notstatistically significant among them.
After 30 days, group DY showed slight reaction. Theother groups showed slight-to-moderate reactions com-
Figure 1. Pulpal responses of the five experimental groups. Vertical lines indicate that bar charts at bothends are statistically significantly different (Fisher’s PLSD test, p<0.05).
Dow
nloaded from http://m
eridian.allenpress.com/operative-dentistry/article-pdf/26/2/1/1819280/1559-2863-26-2-1.pdf by guest on 17 July 2022

204 Operative Dentistry
parable to those of the three or five days groups. No sta-tistical difference was found among all groups.
After 90 days, group DY showed none-to-slight reac-tion. Moderate-to-severe reaction was observed in 7-9out of 10 cases in groups ZE and ZP. Groups GI and PCshowed less reaction than groups ZE and ZP. GroupsZE and ZP showed statistically significantly higherincidence of chronic inflammatory cell infiltration thangroup DY (KW=22.4, p=0.0002).
Dentin Bridge Formation
After 30 days, group DY showed statistically signifi-cantly higher incidence of dentin bridge formation thanother groups (KW=17.3, p=0.0017). In group DY, itranged from almost-complete to complete in eight out of10 cases.
After 90 days, almost-complete to complete reactionwas observed in 8-9 out of 10 cases in groups DY and GI.Groups PC, ZE and ZP showed less formation thangroups DY and GI (KW=16.4, p=0.0025).
Bacterial Penetration
Bacterial penetration along the cavity walls/floors couldnot be detected in any cases of the 3 or 5, and 30- and 90-day groups.
DISCUSSION
In this study, dental cements were applied directly tothe exposed pulp and the cavities were sealed withglass-ionomer cement and adhesive composite resin.
By eliminating bacterial leakage, the actual chemicaltoxicity of the cements could be determined.
All four dental cements showed moderate-to-severeacute inflammation at three or five days, which wassignificantly greater than that of the Dycal-cappedgroup (control) (Figures 2a, b, c & d). These initial reac-tions subsided in three dental cements and persistedonly in the zinc oxide eugenol cement. These findingssuggested that the four dental cements used in thisstudy were chemical irritants, and the degree of irrita-tion depended on the materials used.
It has been reported that eugenol can cause pulpalreaction, occasionally with thrombosis and aggregationof both red and white blood cells (Brännström &Nyborg, 1976). Since no bacterial penetration wasobserved in the pulp tissue in this study, the pulpalreactions in the ZE group can probably be attributed tothe eugenol.
When a ZOE cement was placed directly onto theexposed pulp, chronic inflammation was maintained for21 days (Watts & others, 1985). Wilson and Batchelor(1970) reported that when a ZOE cement wasimmersed in water, eugenol was eluted, and there wasa continuous removal of eugenol from the cement.Prolonged chronic inflammation observed in the ZEgroup at 90 days seemed to be caused by the chemicalirritating effect of eugenol after setting (Figure 3d).
The liquids in the zinc phosphate and polycarboxylatecements reacted rapidly with the zinc oxide powder,
Time Intervals 3 or 5 Days 30 Days 90 DaysExperimental Groups DY GI PC ZE ZP DY GI PC ZE ZP DY GI PC ZE ZP# of Specimens 10 10 10 10 10 10 10 10 10 10 10 10 10 10 10
Acute Inflamation none 8 0 0 0 0 9 8 7 2 6 10 9 8 7 9Cell Infiltration slight 2 2 4 1 3 1 2 2 1 3 0 0 0 1 1
moderate 0 2 2 4 5 0 0 1 4 1 0 1 2 2 0severe 0 6 4 5 2 0 0 0 3 0 0 0 0 0 0
Chronic Inflamation none 1 0 0 0 0 0 1 0 1 2 6 2 1 0 0Cell Infiltration slight 7 6 7 5 7 10 6 6 4 3 4 6 7 1 3
moderate 2 4 3 4 3 0 3 4 4 5 0 2 1 8 5severe 0 0 0 1 0 0 0 0 1 0 0 0 1 1 2
Dentin Bridge none 0 0 0 0 0 1 6 7 6 6 0 0 0 0 0Formation initial 0 0 0 0 0 0 1 2 4 3 1 2 6 5 5
partial 0 0 0 0 0 1 3 1 0 1 0 0 1 3 3almost comlpete 0 0 0 0 0 3 0 0 0 0 4 6 3 2 2complete 0 0 0 0 0 5 0 0 0 0 5 2 0 0 0
Diameter of mean 0.76 0.68 0.58 0.65 0.65 0.71 0.68 0.70 0.61 0.57 0.67 0.80 0.67 0.62 0.85Exposed Area minimum 0.54 0.34 0.38 0.30 0.42 0.42 0.44 0.22 0.30 0.28 0.22 0.48 0.36 0.46 0.48(mm) maximum 0.94 1.00 0.74 0.96 0.94 0.86 0.96 0.96 0.74 0.90 0.96 0.94 0.98 0.80 1.56
Table 2: Results of the Histopathological Findings
Dow
nloaded from http://m
eridian.allenpress.com/operative-dentistry/article-pdf/26/2/1/1819280/1559-2863-26-2-1.pdf by guest on 17 July 2022
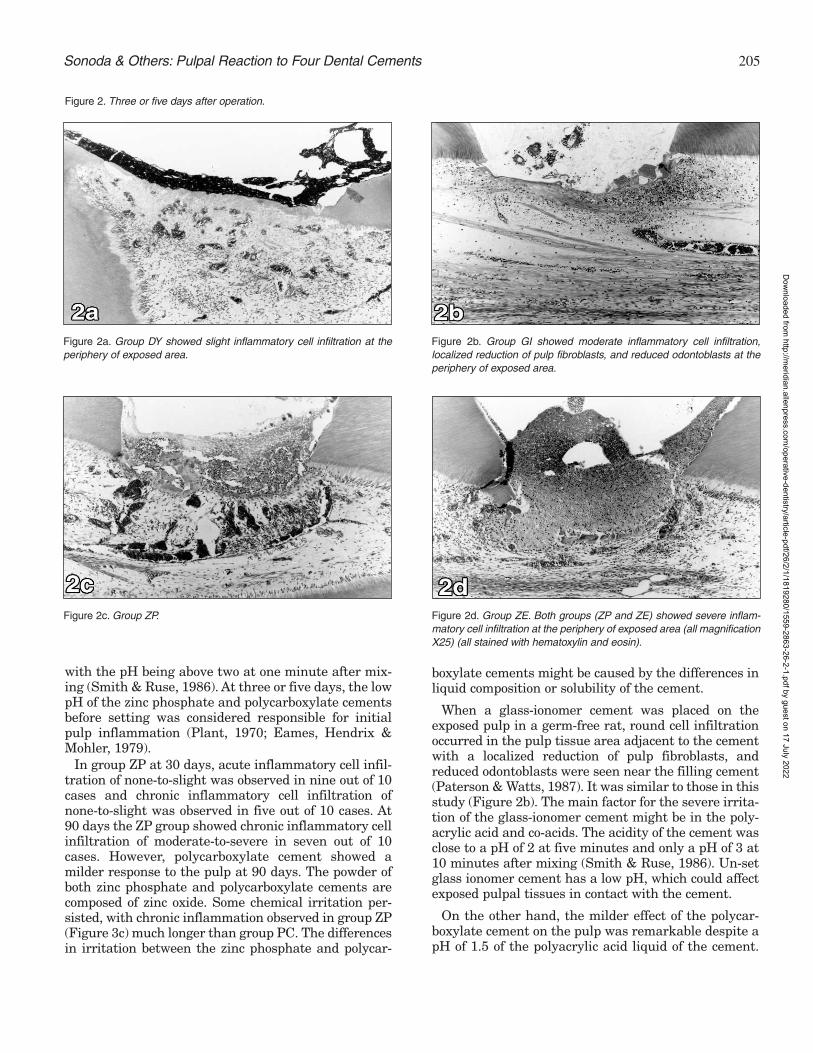
205Sonoda & Others: Pulpal Reaction to Four Dental Cements
with the pH being above two at one minute after mix-ing (Smith & Ruse, 1986). At three or five days, the lowpH of the zinc phosphate and polycarboxylate cementsbefore setting was considered responsible for initialpulp inflammation (Plant, 1970; Eames, Hendrix &Mohler, 1979).
In group ZP at 30 days, acute inflammatory cell infil-tration of none-to-slight was observed in nine out of 10cases and chronic inflammatory cell infiltration ofnone-to-slight was observed in five out of 10 cases. At90 days the ZP group showed chronic inflammatory cellinfiltration of moderate-to-severe in seven out of 10cases. However, polycarboxylate cement showed amilder response to the pulp at 90 days. The powder ofboth zinc phosphate and polycarboxylate cements arecomposed of zinc oxide. Some chemical irritation per-sisted, with chronic inflammation observed in group ZP(Figure 3c) much longer than group PC. The differencesin irritation between the zinc phosphate and polycar-
boxylate cements might be caused by the differences inliquid composition or solubility of the cement.
When a glass-ionomer cement was placed on theexposed pulp in a germ-free rat, round cell infiltrationoccurred in the pulp tissue area adjacent to the cementwith a localized reduction of pulp fibroblasts, andreduced odontoblasts were seen near the filling cement(Paterson & Watts, 1987). It was similar to those in thisstudy (Figure 2b). The main factor for the severe irrita-tion of the glass-ionomer cement might be in the poly-acrylic acid and co-acids. The acidity of the cement wasclose to a pH of 2 at five minutes and only a pH of 3 at10 minutes after mixing (Smith & Ruse, 1986). Un-setglass ionomer cement has a low pH, which could affectexposed pulpal tissues in contact with the cement.
On the other hand, the milder effect of the polycar-boxylate cement on the pulp was remarkable despite apH of 1.5 of the polyacrylic acid liquid of the cement.
Figure 2a. Group DY showed slight inflammatory cell infiltration at theperiphery of exposed area.
Figure 2b. Group GI showed moderate inflammatory cell infiltration,localized reduction of pulp fibroblasts, and reduced odontoblasts at theperiphery of exposed area.
Figure 2. Three or five days after operation.
Figure 2c. Group ZP. Figure 2d. Group ZE. Both groups (ZP and ZE) showed severe inflam-matory cell infiltration at the periphery of exposed area (all magnificationX25) (all stained with hematoxylin and eosin).
Dow
nloaded from http://m
eridian.allenpress.com/operative-dentistry/article-pdf/26/2/1/1819280/1559-2863-26-2-1.pdf by guest on 17 July 2022
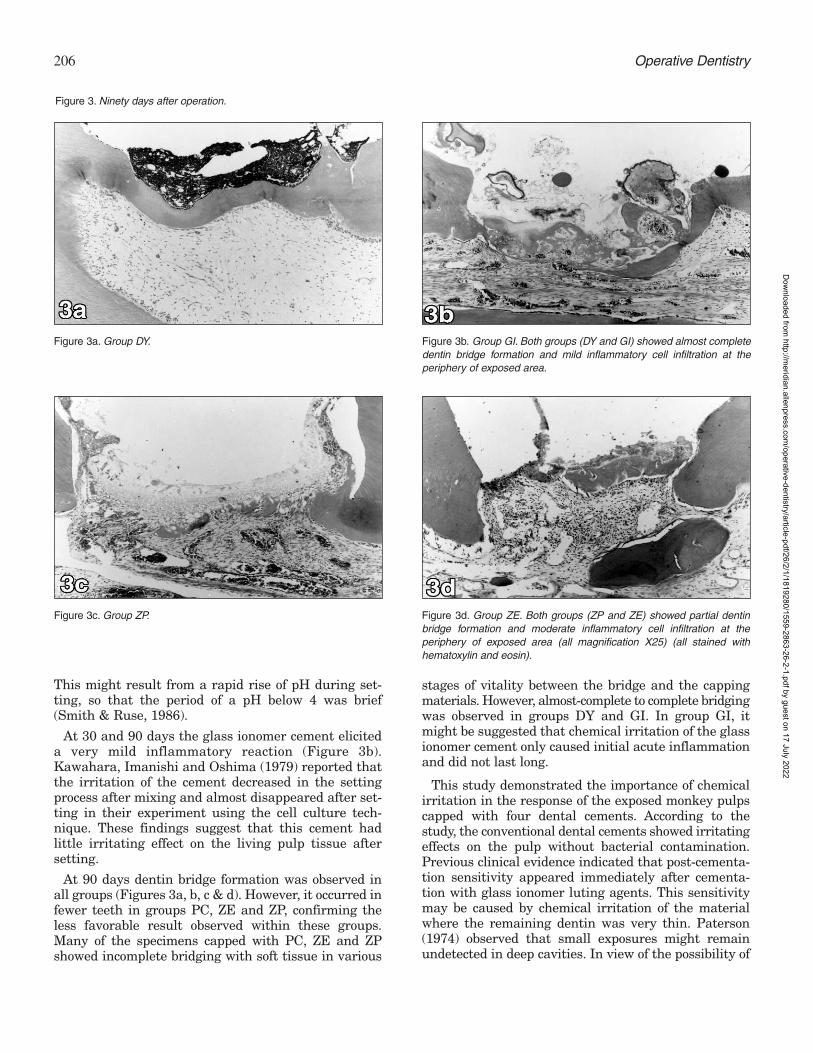
206 Operative Dentistry
This might result from a rapid rise of pH during set-ting, so that the period of a pH below 4 was brief(Smith & Ruse, 1986).
At 30 and 90 days the glass ionomer cement eliciteda very mild inflammatory reaction (Figure 3b).Kawahara, Imanishi and Oshima (1979) reported thatthe irritation of the cement decreased in the settingprocess after mixing and almost disappeared after set-ting in their experiment using the cell culture tech-nique. These findings suggest that this cement hadlittle irritating effect on the living pulp tissue aftersetting.
At 90 days dentin bridge formation was observed inall groups (Figures 3a, b, c & d). However, it occurred infewer teeth in groups PC, ZE and ZP, confirming theless favorable result observed within these groups.Many of the specimens capped with PC, ZE and ZPshowed incomplete bridging with soft tissue in various
stages of vitality between the bridge and the cappingmaterials. However, almost-complete to complete bridgingwas observed in groups DY and GI. In group GI, itmight be suggested that chemical irritation of the glassionomer cement only caused initial acute inflammationand did not last long.
This study demonstrated the importance of chemicalirritation in the response of the exposed monkey pulpscapped with four dental cements. According to thestudy, the conventional dental cements showed irritatingeffects on the pulp without bacterial contamination.Previous clinical evidence indicated that post-cementa-tion sensitivity appeared immediately after cementa-tion with glass ionomer luting agents. This sensitivitymay be caused by chemical irritation of the materialwhere the remaining dentin was very thin. Paterson(1974) observed that small exposures might remainundetected in deep cavities. In view of the possibility of
Figure 3a. Group DY. Figure 3b. Group GI. Both groups (DY and GI) showed almost completedentin bridge formation and mild inflammatory cell infiltration at theperiphery of exposed area.
Figure 3. Ninety days after operation.
Figure 3c. Group ZP. Figure 3d. Group ZE. Both groups (ZP and ZE) showed partial dentinbridge formation and moderate inflammatory cell infiltration at theperiphery of exposed area (all magnification X25) (all stained withhematoxylin and eosin).
Dow
nloaded from http://m
eridian.allenpress.com/operative-dentistry/article-pdf/26/2/1/1819280/1559-2863-26-2-1.pdf by guest on 17 July 2022

207
an undetected exposure, protection of the pulp fromirritants should be recommended in deep cavities.
CONCLUSIONS
• The four commonly used dental cements testedcaused moderate-to-severe acute inflammation atthree or five days when placed directly on theexposed dental pulp of monkeys.
• The irritation by the cements tested appears to bechemically mediated since the restorations weresealed and no bacterial leakage was detected.
• Calcium hydroxide (control) and glass ionomercement produced almost-complete to complete dentinbridging in 90 days.
Acknowledgments
The authors thank Dr Partricia N R Pereira for her helpful advice inpreparing this manuscript.
(Received 4 April 2000)
References
Brännström M & Nyborg H (1972) Pulpal reaction to compositeresin restorations Journal of Prosthetic Dentistry 27(2) 181-189.
Brännström M & Nyborg H (1976) Pulp reaction to a temporaryzinc oxide/eugenol cement Journal of Prosthetic Dentistry 35(2)185-191.
Council on Dental Materials, Instruments, and Equipment(1984) Reported sensitivity to glass ionomer luting cementsJournal of the American Dental Association 109(3) 476.
Cox CF, Bergenholtz G, Fitzgerald M, Heys DR, Heys RJ, AveryJK & Baker JA (1982) Capping of the dental pulp mechanicallyexposed to the oral microflora—a five week observation ofwound healing in the monkey Journal of Oral Pathology 11(4)327-339.
Cox CF & Suzuki S (1994) Re-evaluating pulp protection:Calcium hydroxide liners vs cohesive hybridization Journal ofthe American Dental Association 125(7) 823-831.
Eames WB, Hendrix K & Mohler HC (1979) Pulpal response inrhesus monkeys to cementation agents and cleaners Journalof the American Dental Association 98(1) 40-45.
Fujitani M (1986) Effects of acid-etching, marginal microleakage,and adaptation to dentinal wall on the dental pulp in adhesivecomposite restorations Japanese Journal of ConservativeDentistry 28 229-254.
Inokoshi S, Iwaku M & Fusayama T (1982) Pulpal response to anew adhesive restorative resin Journal of Dental Research61(8) 1014-1019.
Kakehashi S, Stanley HR & Fitzgerald RJ (1966) The effects ofsurgical exposures of dental pulps in germ-free and conven-tional laboratory rats Journal—Southern California DentalAssociation 34(9) 449-451.
Katoh M, Kidokoro S & Kurosu K (1978) A study on the amputa-tion of pulp using sodium hydrochloride (NaOCl) JapaneseJournal of Pediatric Dentistry 16 107-116.
Kawahara H, Imanishi Y & Oshima H (1979) Biological evalua-tion on glass ionomer cement Journal of Dental Research 58(5)1080-1086.
Kitasako Y, Inokoshi S, Fujitani M, Otsuki M & Tagami J (1998)Short-term reaction of exposed monkey pulp beneath adhesiveresins Operative Dentistry 23(6) 308-317.
Mjör IA & Tronstad L (1972) Experimentally induced pulpitisOral Surgery, Oral Medicine, Oral Pathology 34(1) 102-108.
Paterson RC (1974) Management of the deep cavity BritishDental Journal 137(6) 150-152.
Paterson RC & Watts A (1987) Toxicity to the pulp of a glass-ionomer cement British Dental Journal 162(3) 110-112.
Plant CG (1970) The effect of polycarboxylate cement on the dentalpulp British Dental Journal 129(9) 424-426.
Retief DH, Austin JC & Fatti LP (1974) Pulpal response to phos-phoric acid Journal of Oral Pathology 3(3) 114-122.
Siegel S & Castellan NJ Jr (1988) Nonparametric Statistics forthe Behavioral Science, 2nd edition, New York: McGraw-Hill pp206-216.
Smith DC & Ruse ND (1986) Acidity of glass ionomer cementsduring setting and its relation to pulp sensitivity Journal ofthe American Dental Association 112(5) 654-657.
Taylor RD (1966) Modification of the Brown and Brenn gramstain for the differential staining of Gram-positive and Gram-negative bacteria in tissue sections American Journal ofClinical Pathology 46(4) 472-474.
Watts A, Paterson RC, Gillespie J & Kelly J (1985) Pulp responseto a zinc oxide eugenol cement Journal of Dental Research 64325.
Wilson AD & Batchelor RF (1970) Zinc oxide-eugenol cements: IIStudy of erosion and disintegration Journal of DentalResearch 49(3) 593-598.
Sonoda & Others: Pulpal Reaction to Four Dental Cements
Dow
nloaded from http://m
eridian.allenpress.com/operative-dentistry/article-pdf/26/2/1/1819280/1559-2863-26-2-1.pdf by guest on 17 July 2022

ABSTRACT
Pre-impregnated fiber reinforced composites(FRC) can be used chairside for splinting andimmediate tooth replacement. These materialsmay provide a more predictable long-term resultthan previous adhesive techniques employingcomposite reinforcement because of theirimproved mechanical properties. This articledescribes a technique using pre-impregnatedFRC for the immediate replacement of anextracted tooth using the crown of the extractedtooth as the pontic.
INTRODUCTION
The use of a natural tooth crown as a pontic is a tech-nique that can be performed for immediate toothreplacement in situations involving traumatic toothloss or extractions due to periodontal complications(Ibsen, 1973; Antonson, 1980; Strassler, 1995). Thetechnique involves removing the root and residual pulp
tissue from the extracted or avulsed tooth and attachingthe crown to the abutment teeth with particulate com-posite via an acid etch technique. This approach is oftenconsidered a temporary phase of tooth replacementuntil healing of the extraction site is achieved, but insome cases the patient/clinician may desire a long-termresult. The weak link in this technique is usually theparticulate composite joint/connector between the ponticand the abutment teeth. When these natural tooth pon-tics fail, it usually results from a cohesive fracture withinthe composite joint/connector (Jensen & Meiers, 1984).To provide additional reinforcement of this joint, theuse of either polyethylene fiber (Strassler, 1995) orresin pre-impregnated fiber reinforced composite(Meiers & others, 1998) has been suggested. The prop-erties of resin pre-impregnated fiber reinforced com-posite (FRC) significantly improve the mechanicalproperties of particulate composites (Golberg &Burstone, 1992; Freilich & others, 1997; Goldberg &others, 1998; Freilich & others, 1999a) and may allowthis technique to be considered more of a long-termtooth replacement for those patients not desiring aremovable acrylic partial denture and who, because ofthe periodontal prognosis of abutment teeth or forfinancial or medical reasons, cannot have a more tradi-tional fixed bridge or single tooth implant.
This article describes and illustrates a techniqueusing a commercially available resin pre-impregnatedFRC which allows for the efficient and predictableplacement of a chairside fixed bridge using the patient’s
©Operative Dentistry, 2001, 26, 208-213
Clinical Technique/Case Report
Fabricating ANatural Tooth Pontic Bridge
Using a Pre-ImpregnatedFiber-Reinforced
Composite Technique
JC Meiers • MA Freilich
University of Connecticut School of DentalMedicine, Department of Prosthodontics andOperative Dentistry, 263 Farmington Ave,Farmington, CT 06030-1615
Jonathan C Meiers, DMD, MS, associate professor,division head for Operative Dentistry
Martin A Freilich, DDS, associate professor
Dow
nloaded from http://m
eridian.allenpress.com/operative-dentistry/article-pdf/26/2/1/1819280/1559-2863-26-2-1.pdf by guest on 17 July 2022
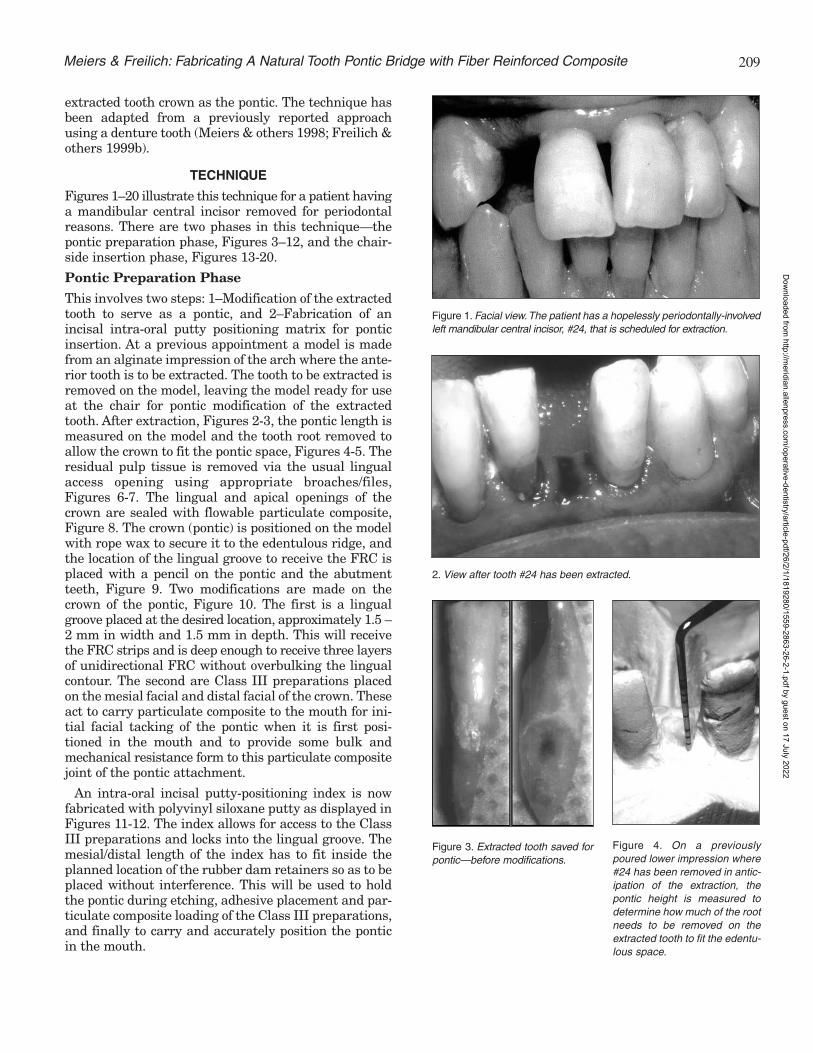
209
extracted tooth crown as the pontic. The technique hasbeen adapted from a previously reported approachusing a denture tooth (Meiers & others 1998; Freilich &others 1999b).
TECHNIQUE
Figures 1–20 illustrate this technique for a patient havinga mandibular central incisor removed for periodontalreasons. There are two phases in this technique—thepontic preparation phase, Figures 3–12, and the chair-side insertion phase, Figures 13-20.
Pontic Preparation Phase
This involves two steps: 1–Modification of the extractedtooth to serve as a pontic, and 2–Fabrication of anincisal intra-oral putty positioning matrix for ponticinsertion. At a previous appointment a model is madefrom an alginate impression of the arch where the ante-rior tooth is to be extracted. The tooth to be extracted isremoved on the model, leaving the model ready for useat the chair for pontic modification of the extractedtooth. After extraction, Figures 2-3, the pontic length ismeasured on the model and the tooth root removed toallow the crown to fit the pontic space, Figures 4-5. Theresidual pulp tissue is removed via the usual lingualaccess opening using appropriate broaches/files,Figures 6-7. The lingual and apical openings of thecrown are sealed with flowable particulate composite,Figure 8. The crown (pontic) is positioned on the modelwith rope wax to secure it to the edentulous ridge, andthe location of the lingual groove to receive the FRC isplaced with a pencil on the pontic and the abutmentteeth, Figure 9. Two modifications are made on thecrown of the pontic, Figure 10. The first is a lingualgroove placed at the desired location, approximately 1.5 –2 mm in width and 1.5 mm in depth. This will receivethe FRC strips and is deep enough to receive three layersof unidirectional FRC without overbulking the lingualcontour. The second are Class III preparations placedon the mesial facial and distal facial of the crown. Theseact to carry particulate composite to the mouth for ini-tial facial tacking of the pontic when it is first posi-tioned in the mouth and to provide some bulk andmechanical resistance form to this particulate compositejoint of the pontic attachment.
An intra-oral incisal putty-positioning index is nowfabricated with polyvinyl siloxane putty as displayed inFigures 11-12. The index allows for access to the ClassIII preparations and locks into the lingual groove. Themesial/distal length of the index has to fit inside theplanned location of the rubber dam retainers so as to beplaced without interference. This will be used to holdthe pontic during etching, adhesive placement and par-ticulate composite loading of the Class III preparations,and finally to carry and accurately position the ponticin the mouth.
Figure 1. Facial view.The patient has a hopelessly periodontally-involvedleft mandibular central incisor, #24, that is scheduled for extraction.
2. View after tooth #24 has been extracted.
Figure 3. Extracted tooth saved forpontic—before modifications.
Figure 4. On a previouslypoured lower impression where#24 has been removed in antic-ipation of the extraction, thepontic height is measured todetermine how much of the rootneeds to be removed on theextracted tooth to fit the edentu-lous space.
Meiers & Freilich: Fabricating A Natural Tooth Pontic Bridge with Fiber Reinforced Composite
Dow
nloaded from http://m
eridian.allenpress.com/operative-dentistry/article-pdf/26/2/1/1819280/1559-2863-26-2-1.pdf by guest on 17 July 2022

210 Operative Dentistry
Figure 5. Facial and lateral views of the modifiedextracted tooth to be used as the pontic.
Figure 6. Access opening beingprepared on the lingual of thepontic crown to permit removal ofthe pulp tissue.
Figure 7. Endodontic file being inserted into root canal, exit-ing out of the apex of the pontic, removing pulp tissue.
Figure 8. Crown pontic showing the lingual access opening and apicalforamen sealed with composite resin (arrows).
Figure 9. Pontic crown positioned on the modified stone model showingthe prepared lingual groove for the placement of the reinforcing pre-impregnated FRC. The groove was placed to coincide with the intendedlocation of the lingual grooves to be placed on the adjacent abutmentteeth (pencil lines shown on model).
Figure 10. Modified pontic crown showing the two internal retentive fea-tures (arrows). The lingual groove is deep enough to allow three thick-nesses which will measure 1.2 mm of FRC material.The Class III prepa-rations on the proximal surfaces permit mechanical retention of compos-ite placed prior to oral placement of the pontic and allow labial VLC ofthe pontic to “tack” it into position prior to lingual FRC placement.
Figure 11. The intra-oral putty incisal positioning matrix is fabricated andin place on the stone model. The Class III preparations are left exposedto permit access to the composite resin to be contained in these areasfor VLC polymerization. The proper fabrication of this positioning matrixis a critical part of this technique.
Dow
nloaded from http://m
eridian.allenpress.com/operative-dentistry/article-pdf/26/2/1/1819280/1559-2863-26-2-1.pdf by guest on 17 July 2022

211
CHAIRSIDE INSERTION PHASE
The patient has a rubber dam applied and the pontic iscarried to the mouth via the positioning index to checkon proper alignment. If accurate, the Class III prepara-tions of the pontic and the interproximals of the abut-ment teeth adjacent to the edentulous ridge are etched,adhesive applied and visible light cured. Flowable par-ticulate composite is applied to the pontic Class IIIpreparations in slight excess and the pontic is posi-tioned in the mouth via the positioning index, Figure13. The excess particulate composite is removed andthe pontic tacked into position by visible light curingfrom the facial. The index is removed and the ponticevaluated for position, Figures 14-15. If incorrect, thepontic can now be removed by fracturing the adhesivejoint and the composite removed with the pontic repo-sitioned again. If correct, the lingual grooves for theFRC are placed on the abutment teeth. These arealigned with the existing groove in the pontic andplaced about 1.5 mm in depth, with their lateral exten-sion short of the mid-lingual aspect of the tooth, Figure15. The lingual groove is measured and three FRCstrips cut to this length. The lingual groove is etched,adhesive applied and visible light cured, then a thinlayer of flowable particulate composite is placed on thepulpal floor to act as a recipient bed to hold the initiallayer of FRC. The precut strips of unidirectional FRC(Spint-It, Jeneric/Pentron) are removed from theirsheets, Figure 16, placed and condensed into the par-ticulate composite bed in the base of the lingual groove,Figure 17, and visible light cured. The three layers ofFRC should not extend beyond the margins of the lin-gual groove. The air-inhibited layer of the pre-impreg-nated FRC strips allows for maximum cross-linkingwithin the adhesive, particulate composite, FRCassembly. A final layer of particulate composite is added
12. Lateral view of the intra-oral putty incisal-positioning matrix shownholding the modified pontic crown. The lingual groove helps lock thetooth into the matrix so it can be held securely during pontic manipula-tion and placement in the mouth. Notice the detail of the adjacent teethlingual surfaces in the positioning matrix.
13. The pontic is shown in position in the mouth, with the particulatecomposite resin held in the Class III preparations visible. The excess isremoved and the facial is VLC to hold the pontic in position allowing theremoval of the positioning matrix.
Figure 14. The positioning matrix is removed and the pontic is securelyheld in place by the interproximal particulate composite resin. The ponticshould be placed precisely as planned on the stone model.
Figure 15. Lingual view of the secured pontic. The abutment tooth FRCgrooves are placed to align with the previously placed pontic groove.
Meiers & Freilich: Fabricating A Natural Tooth Pontic Bridge with Fiber Reinforced Composite
Dow
nloaded from http://m
eridian.allenpress.com/operative-dentistry/article-pdf/26/2/1/1819280/1559-2863-26-2-1.pdf by guest on 17 July 2022

to the FRC assembly to ensure the glass fibers withinthe FRC are protected against oral exposure and toblend the lingual groove with the lingual contours ofthe abutment teeth, Figure 18. The rubber dam isremoved and occlusion is checked and adjusted, asrequired, Figures 19-20.
SUMMARY
A chairside natural tooth bridge technique using a com-mercially available chairside resin pre-impregnatedFRC has been presented. The described techniquetakes about one hour of chair time. It provides a timely,esthetic and cost effective method for single toothreplacement which has the potential for long-termdurability because of the mechanical properties of theFRC reinforcement at the critical proximal joints. Non-resin pre-impregnated polyethylene fiber, that is,Ribbond (Ribbond, Inc) or Connect (Kerr, Inc), couldalso be used as a joint reinforcement material, though
212 Operative Dentistry
Figure 16. A pre-impregnated strip of unidirectional FRC (Splint-It‘,Jeneric/Pentron) is removed for placement in the lingual groove. Noticethe “wet” appearance due to the resin matrix, which imbeds the glassfibers.
Figure 17. The lingual FRC groove is shown with the bed of particulatecomposite having received its first layer of pre-impregnated FRC(arrows). The FRC is condensed into the base of the groove to allow forthe placement of additional FRC layers.
Figure 18. Lingual view of finished FRC natural tooth pontic bridge. Thedashed line outlines the extent of the lingual groove. The lingual surfaceshould be contoured to exactly reproduce the original contours of theteeth.
Figure 19. Facial view of FRC natural tooth pontic bridge.
20. Facial view with maxillary teeth in occlusion with the bridge.
Dow
nloaded from http://m
eridian.allenpress.com/operative-dentistry/article-pdf/26/2/1/1819280/1559-2863-26-2-1.pdf by guest on 17 July 2022

213
the mechanical properties of these chairside resinimpregnated materials are not as good as the pre-impregnated glass fiber products (Goldberg & others,1998; Freilich & others, 1999a).
The patient in the illustrated case wanted this to behis “final bridge,” so the use of intra-coronal slots max-imizing FRC volume without lingual bulk were used.The disadvantage to this approach is if the ponticneeds to be removed due to joint failure, the patienthas had the abutment teeth irreversibly modified withsmall lingual grooves. Another alternative would be tonot place lingual grooves on the abutment teeth but tolay the FRC on the etched, unprepared lingual sur-faces of the abutment teeth. This would permitremoval of the pontic at a later date, if desired, with-out irreversible preparation damage to the abutmentteeth. The disadvantage to this approach would be theadded bulk on the lingual and the more difficult place-ment of the FRC since it would have to made to adaptto the contour change between the slot of the ponticonto the full lingual contours of the abutment teeth.
(Received 15 May 2000)
References
Antonson DE (1980) Immediate temporary bridge using anextracted tooth Dental Survey 56(1) 22-25.
Freilich MA, Karmaker AC, Burstone CJ & Goldberg AJ (1997)Flexure strength and handling characteristics of fiber-reinforcedcomposites used in prosthodontics Journal of Dental Research(Abstract 1361) 76 184.
Freilich MA, Meiers JC, Duncan JP & Goldberg AJ (1999a) Fiber-Reinforced Composites in Clinical Dentistry ChicagoQuintessence Chap 2.
Freilich MA, Meiers JC, Duncan JP & Goldberg AJ (1999b) Fiber-Reinforced Composites in Clinical Dentistry ChicagoQuintessence Chap 4.
Goldberg AJ & Burstone CJ (1992) The use of continuous fiberreinforcement in dentistry Dental Materials 8(3) 197-202.
Goldberg AJ, Freilich MA, Hauser KA & Audi JH (1998) Flexureproperties and fiber architecture of commercial fiber reinforcedcomposites Journal of Dental Research (Abstract 967) 77 226.
Jensen ME & Meiers JC (1984) Resin-bonded retainers ClinicalDentistry 4 Philadelphia Harper and Row Chapter 38.
Ibsen RL (1973) Fixed prosthetics with a natural crown ponticusing adhesive composite Case History Journal of the SouthernCalifornia Dental Association 41(2) 100-102.
Meiers JC, Duncan JP, Freilich MA & Goldberg AJ (1998)Preimpregnated, fiber-reinforced prostheses Part II Directapplications: Splints and fixed partial dentures QuintessenceInternational 29(12) 761-768.
Strassler HE (1995) Aesthetic management of traumatized anteriorteeth Dental Clinics of North America 39(1) 181-202.
Meiers & Freilich: Fabricating A Natural Tooth Pontic Bridge with Fiber Reinforced Composite
Dow
nloaded from http://m
eridian.allenpress.com/operative-dentistry/article-pdf/26/2/1/1819280/1559-2863-26-2-1.pdf by guest on 17 July 2022

214 Operative Dentistry
Awards
The Academy of Operative Dentistry Award ofExcellence is given to recognize outstanding con-tribution to the discipline of operative dentistry
in the areas of service to the Academy, teaching of oper-ative dentistry and promotion of excellence in operativedentistry at a national/international level. Dr RichardMcCoy certainly qualifies in all areas.
Dr McCoy has been a member of this Academy sinceits inception and has actively participated in all aspectsof its growth, including serving as President in 1993.He assumed the editorship of Operative Dentistry in1995 and, over the next five years, increased the quali-ty, content and subscription base of our journal makingit the premier publication in our discipline. Dr McCoy’smemberships in other professional organizationsinclude the American Dental Association, InternationalAssociation for Dental Research, American Academy ofGold Foil Operators, American Association of DentalSchools and the American Academy of RestorativeDentistry.
Dr McCoy enjoyed a distinguished Navy career atduty stations from Sasebo, Japan to London, England.During his military service he received advanced train-ing earning both a Certificate of Postgraduate Study inGeneral Dentistry from the Naval Dental School,Bethesda Maryland, and an MS degree in RestorativeDentistry/Applied Gnathology from Loma LindaUniversity School of Dentistry. He also acquired a lovefor teaching and a dedication to excellence that stilldrive him today.
Dr McCoy’s teaching activities began in the NavyDental Corps as both an Instructor in OperativeDentistry and Occlusion and then as Chairman andDirector of those areas at the National Naval DentalCenter. After his retirement in 1988, he did not disap-
pear into the sunset, butchose to spend his time inthe lab and clinic teachingyoung minds how to live,learn and work towardtheir chosen profession. Hejoined the faculty atNorthwestern UniversityDental School where heserved as Professor andChair, Department ofRestorative Dentistry. In1992 he returned to hisalma mater, the Universityof Washington School ofDentistry, as Director of theDivision of Operative Dentistry. Dr McCoy recentlyadded the title of Interim Chair for the Department ofRestorative Dentistry.
Dr McCoy’s commitment to excellence and service isreflected in all the activities mentioned and reinforcedby his research and publication efforts. These includenumerous articles and contributions to two textbooks,which he co-authored with Dr Lloyd Baum. It is, how-ever, the love, appreciation and respect from his stu-dents and colleagues that give the best measure of theman. One must wonder how he still finds time to be acaring, supportive family man, world-class fishermanand outstanding cook.
For his friendship, his dedication and example, theAcademy of Operative Dentistry proudly presents the2001 Award of Excellence to Dr Richard B McCoy.
Lloyd Baum
Academy of Operative Dentistry
Award of ExcellenceDr Richard B McCoy
Richard B McCoy
Dow
nloaded from http://m
eridian.allenpress.com/operative-dentistry/article-pdf/26/2/1/1819280/1559-2863-26-2-1.pdf by guest on 17 July 2022

215
The 2001 HollenbackMemorial Prize isawarded to Dr
Richard D Norman. DrNorman received his ABdegree from FranklinCollege and his DDS andMSD degrees from IndianaUniversity. While a studentat Indiana University, hestarted his research withDr Ralph Phillips andProfessor Marjorie Swartzon the solubility of cementsand the influence of various
materials on the uptake and retention of fluoride byenamel.
Additional studies were conducted on mechanicalproperties of materials, the effect of materials onplaque accumulation, contact angles of materialsapplied to enamel and the clinical behavior of restora-tive materials. These later studies were in cooperationwith others: Dr John Osborne and Drs Margaret andNairn Wilson, as examples. In addition to his research,Dr Norman has served on the Oral Biology andMedicine Study Section of the National Institutes ofHealth, the Dental Panel for the FDI, the ResearchCommittee of the John Cochran VeteransAdministration Hospital and the Council on DentalMaterials and Devices. He has also been active on sev-eral Test Construction committees for the AmericanDental Association and was Chairman for more than 25years of Group III, MD 156, American NationalStandards Institute. He has served on numerous com-mittees of the IADR and as President of the DentalMaterials Group of that organization.
Dr Norman taught in the Dental MaterialsDepartment at Indiana University for 20 years. Heserved as Chairman of Restorative Dentistry, Directorof Research and currently serves as Research Professor
at Southern Illinois University. He has taught as anadjunct professor at Fairleigh Dickenson Universityand Washington University, St Louis. He was Directorof Dental Clinical Research at Johnson and Johnson.
Dr Norman lives in Alton, Illinois, with Joan, his wifeof 50 years. They have two daughters, Beverly andElizabeth. The Academy is pleased and honored topresent the Hollenback Memorial Prize for 2001 to DrRichard D Norman.
Ivar A Mjör
Academy of Operative Dentistry
Hollenback Memorial PrizeDr Richard D Norman
Richard D Norman
George Hollenback
Dow
nloaded from http://m
eridian.allenpress.com/operative-dentistry/article-pdf/26/2/1/1819280/1559-2863-26-2-1.pdf by guest on 17 July 2022

Departments
r
Please submit your own clinical tips and techniques toshare with your colleagues. Send “pearls” and/or com-ments on this section via fax (317) 278-4900 or e-mailto: [email protected].
THE MODIFICATION OF A #12SURGICAL BLADE TO TRIM
COMPOSITE RESIN RESTORATIONSContributed by:
Dr Randall M PohjolaMedical College of Georgia School of Dentistry
Department of Oral Rehabilitation, Augusta, GA
There are many instruments available to trim and con-tour composite restorations. Often the interproximalareas are the most difficult to reach and treat. A #12blade (not a #12B) on a surgical handle is a favorite formany operators, but the length of the cutting edge istoo long for the intended purpose. To make the bladesafer and easier to use, remove the cutting edge fromthe base of the blade within 2-3 mm of the tip. Use anybur on the high speed handpiece. This alteration willallow the use of a palm-thumb grip for greater controland more force. It will also reduce the chance of lacer-ating the operator’s thumb or the patient’s gingiva duringthe removal of resin flash.
University of Pennsylvania—Assistant orAssociate Professor
The Department of General Restorative Dentistry,University of Pennsylvania, School of Dental Medicine,invites applications for a full-time tenure track or clini-cian educator track position available at the assistant orassociate professor level. Responsibilities include devel-opment and direction of the Division of Operative andAesthetic Dentistry; predoctoral preclinical and clinicalteaching; research and service. Clinical practice withinthe University is available and encouraged. Preferencewill be given to candidates who have completed anadvanced education program in Operative/ RestorativeDentistry or Materials Science and who have previousteaching and research experience. The successful candi-date must possess or be eligible for a Pennsylvania dentallicense. The position is available effective July 1, 2001.Applications should be received by April 30, 2001.Women and minority candidates are encouraged toapply. Send a letter of interest and curriculum vitae toDr Gerald Weintraub, Chairperson, Department ofGeneral Restorative Dentistry, University ofPennsylvania School of Dental Medicine, 4001 SpruceStreet, Philadelphia, PA 19104-6003. The University isan Affirmative Action, Equal Opportunity Employer.
University of Iowa
The University of Iowa’s College of Dentistry is conductinga search to fill a full-time tenure track faculty position inthe Department of Operative Dentistry. Major responsi-bilities include teaching operative dentistry to predoc-toral/postdoctoral students, research and intramural prac-tice. The position will be available July 1, 2001; screeningbegins immediately. Applicants must have: DDS/DMDfrom an ADA-accredited institution or a foreign dentaldegree with certification or a Masters degree in opera-tive dentistry from an ADA-accredited institution.Desirable qualifications include teaching experience inoperative dentistry; background in clinical esthetic den-tistry; dental research training or experience; clinicalpractice experience. Academic rank/salary are commen-surate with qualifications/experience. Submit CV andthree letters of recommendation to Dr Daniel Boyer, 229Dental Science Building South, College of Dentistry,University of Iowa, Iowa City, IA 52242. The Universityof Iowa is an affirmative action/equal opportunityemployer; women/minorities are encouraged to apply.
216 Operative Dentistry
Figure 1. Cutting edge being removed to within 2-3 mm of the tip.
Figure 2. Palm-thumb grip.
Operative Pearls
Classifieds:Faculty Positions
Dow
nloaded from http://m
eridian.allenpress.com/operative-dentistry/article-pdf/26/2/1/1819280/1559-2863-26-2-1.pdf by guest on 17 July 2022

These Dental Manufacturers have joined Operative Dentistry in our commitment to publish quality dental literature in a timely manner. We thank them for their support.
SOUTHERN DENTAL INDUSTRIES
555555551VCX:LAR N~TH AMERICA, INC.55555555 IVCX::LAR • VIV,A[)ENT • WILLI/WIS
[): CAULK Bringing Science to the Art of Dentistryn•
1nruLTRADENT
SYBRON DENTAL SPECIALTIES
Degussa-Ney Degussa Dental Group
Please view the Corporate Sponsors Page at our website (http://www.jopdent.org) for direct links to these companies.
Dow
nloaded from http://m
eridian.allenpress.com/operative-dentistry/article-pdf/26/2/1/1819280/1559-2863-26-2-1.pdf by guest on 17 July 2022

MARCH-APRIL 2001 • VOLUME 26 • NUMBER 2 • 113-216
©OPERATIVE DENTISTRY, Inc.
GUEST EDITORIAL
Operative Dentistry-The Past, Present and Future Henry A St Germain, Jr .. ... . ... .. . . ... . .. .... .. . .. . .... ... .. .. .. . ............... ...... . .. . .... 113
CLINICAL RESEARCH
Clinical Evaluation of a Polyacid-Modified Resin Composite in Class III Cavities: One Year Results M Demirci • M Ur,;ok . . .. . .. ..... ..... . .. . . ........ .. .... . . . ... . .... . .. ... .. . . . ... . . ........ .... 115
LABORATORY RESEARCH
Microleakage of Packable Composite Resins JC Meiers • R Kazemi • CD Meier ..... . ... .......... . ..... . . ... .. .. .. . .. . .. . . ... . . .. ... . .... .. .. 121
Bond Strength of Polyacid-Modified Resins Using a New One-Step Adhesive System H Oberlander • K-H Friedl • G Schmalz . . ... .. . . ..... . .. . . ... . . ... . . ...... .. . ..... . ...... . .. .. . . 127
Influence of Contact Stress on OCA Wear of Composite Restoratives AUJ Yap • CL Chew • SH Teoh • LFKL Ong ... .... . . .... . . . .. . .. . . .... .. ... . ........ ... ... . . .... 134
Three-Body Abrasive Wear of Composite Restoratives AUJ Yap • SH Teoh • KB Tan . . . ..... . . . .... . . . .... . . . .... . .. . .. .. . . . . .. . . . . .. . . .... .. . . .. . .. 145
Wear Assessment of High Viscosity and Conventional Composite Restorative Materials WW Barkmeier • MA Latta •TM Wilwerding • SM Blake . .... .. .. .. . . .. . .. .. .. . .... . ..... . ...... . .. 152
Composite-to-Dentin Bond Strength, Micromorphology of the Bonded Dentin Interface and Marginal Adaptation of Class II Composite Resin Restorations Using Self-Etching Primers-M Hannig • K-J Reinhardt • B Bott . . ... 157
Color Stability of Ionomer and Resin Composite Restoratives MA Vargas • HL Kirchner •AM Diaz-Arnold • VL Beck .. . ..... .. .... .. . . .. .. .. . .. .. .. .. ... . . . .... . . . . 166
Microleakage of"One Bottle" Dentin Adhesives AAAl-Ehaideb • H Mohammed .... ... ... . .. .. ...... . . .... . ......... ... . . . . . . . .. .......... .... ... 172
Determination of the Minimum Irradiance Required for Adequate Polymerization of a Hybrid and a Microfill Composite---DL Leonard • DG Charlton • HR Roberts • T J Hilton •A Zionic . . ...... . ... . . .. .. .... 176
Pulpal Temperature Change with Visible Light-Curing- C Porko • E-L Hietala .. .. . . . .. ..... . .... . . ..... . ... . 181
Colorimetric and Roughness Changes of Ceramic Blocks by Polishing and Glazing BH Cho • SJ Heo • CG Chang • HH Son • HC Kwon • CM Um .... .. . . . .... ...... .. . . ... ..... . . .. . ... . 186
Microleakage and Internal Voids in Class II Composite Restorations with Flowable Composite Linings S -FChuang • J-KLiu • Y-TJin ........... . .. . . .... ... .. . . ....... ... ...... .. ....... . ..... . . .. ... 193
Pulp Tissue Reaction to Four Dental Cements,---H Sonoda • S Inokoshi • M Otsuki • J Tagami . .. .. . . .. . .. . . .. . 201
CLINICAL TECHNIQUE/CASE REPORT
Fabricating a Natural Tooth Pontic Bridge Using a Pre-Impregnated Fiber-Reinforced Composite Technique JC Meiers • MA Freilich ... . . .. ... ... . ... . ... . . . ... . . .. ... ... . .. . .... . ... . ........ .. .. ........ .. 208
AWARDS
AOD Award of Excellence .. . ... . . . .... . .. . ..... . .. ... ... .. .. . .. . ... . .. . . .. . . .. . ... . . .. .. . ..... .. ... 214
AOD Hollenback Memorial Prize . ... .. . .. .. .. . . . . .. ...... . . . . .... . .. ... . ...... . ..... . . .. .. . . ... . .. . . 215
DEPARTMENTS
Operative Pearls . . . ... . .... .. . . .... .. . .. . . .. .. .... . . ... . .. .. ... .. . .... . . . .• .. .. .. . ..... . .. . . ... . .. 216
Classifieds . . . . . .... ... . . ... . .. .. ......... . ... ... . . . . ...... ... . . ... . ..... . .. . .. . .... . .. .. . ... . . ... 216
10-9385 Operative Dentistry Indiana University School of Dentistry, Rm. S411 1121 West Michigan Street Indianapolis, IN 46202-5186 USA
Periodicals
Dow
nloaded from http://m
eridian.allenpress.com/operative-dentistry/article-pdf/26/2/1/1819280/1559-2863-26-2-1.pdf by guest on 17 July 2022