October 5, 2017 - Environmental Defense Fund
133
October 5, 2017 Submitted via http://www.regulations.gov Re: Request for Comment on Reconsideration of the Final Determination of the Mid-Term Evaluation of Greenhouse Gas Emissions Standards for Model Year 2022–2025 Light-Duty Vehicles; Request for Comment on Model Year 2021 Greenhouse Gas Emissions Standards (August 21, 2017); EPA–HQ–OAR–2015–0827 On behalf of our millions of members across the country, Environmental Defense Fund together with the California-based NGOs, CEERT (The Center for Energy Efficiency and Renewable Technologies) and the Clean Power Campaign respectfully submit the following comments on the Environmental Protection Agency’s Request for Comment on Reconsideration of the Final Determination of the Mid-Term Evaluation of Greenhouse Gas Emissions Standards for Model Year 2022–2025 Light-Duty Vehicles; Request for Comment on Model Year 2021 Greenhouse Gas Emissions Standards. 1 EDF is a non-partisan, non-governmental environmental organization representing over two million members nationwide. Since 1967, EDF has linked law, policy, science, and economics to create innovative, equitable, and cost-effective solutions to today’s most pressing environmental problems. EDF pursues initiatives at the state and national levels designed to protect human health and the environment. Among these initiatives, EDF has worked to reduce climate- 1 82 Fed. Reg. 39,551 (Aug. 21, 2017) [hereinafter EPA 2017 Request for Comment]. 2 Pursuant to the judicial review provisions of the Clean Air Act, a court reviewing EPA’s GHG emission standards may reverse the action if it is found to be arbitrary, capricious, an abuse of discretion, or otherwise not in accordance
-
Upload
khangminh22 -
Category
Documents
-
view
3 -
download
0
Transcript of October 5, 2017 - Environmental Defense Fund
October 5, 2017
Submitted via http://www.regulations.gov Re: Request for Comment on Reconsideration of the Final Determination of the Mid-Term Evaluation of Greenhouse Gas Emissions Standards for Model Year 2022–2025 Light-Duty Vehicles; Request for Comment on Model Year 2021 Greenhouse Gas Emissions Standards (August 21, 2017); EPA–HQ–OAR–2015–0827 On behalf of our millions of members across the country, Environmental Defense Fund together with the California-based NGOs, CEERT (The Center for Energy Efficiency and Renewable Technologies) and the Clean Power Campaign respectfully submit the following comments on the Environmental Protection Agency’s Request for Comment on Reconsideration of the Final Determination of the Mid-Term Evaluation of Greenhouse Gas Emissions Standards for Model Year 2022–2025 Light-Duty Vehicles; Request for Comment on Model Year 2021 Greenhouse Gas Emissions Standards.1 EDF is a non-partisan, non-governmental environmental organization representing over two million members nationwide. Since 1967, EDF has linked law, policy, science, and economics to create innovative, equitable, and cost-effective solutions to today’s most pressing environmental problems. EDF pursues initiatives at the state and national levels designed to protect human health and the environment. Among these initiatives, EDF has worked to reduce climate-
1 82 Fed. Reg. 39,551 (Aug. 21, 2017) [hereinafter EPA 2017 Request for Comment]. 2 Pursuant to the judicial review provisions of the Clean Air Act, a court reviewing EPA’s GHG emission standards may reverse the action if it is found to be arbitrary, capricious, an abuse of discretion, or otherwise not in accordance
2
destabilizing and health-harming emissions from the transportation sector and improve vehicle fuel economy. Based in Sacramento, CEERT is a unique coalition of key environmental organizations and companies devoted to promoting, developing, and providing clean energy options, including clean transportation, energy efficiency, renewable supply-side resources, and demand-side resources. CEERT also pursues the policy goals of fighting climate change, improving air quality and energy independence and security in the electric generation and transportation sectors in California and the West through reduced dependence on fossil fuels and greater efficiency in energy use and increased reliance on renewable resources. Also based in Sacramento, for over two decades the Clean Power Campaign (CPC) has led the fight for clean energy and worked to give the public interest a seat at every table where important decisions are being made about energy, whether that be with the electrical utilities, fossil-fuel companies, the manufacturers of cars and trucks, construction equipment or others. The CPC fights for stronger laws protecting public health by regulating the emission of climate and toxic air pollution. The CPC also advocate for policies and programs geared toward sustainable, renewable resources that reduce the use of dirty fuels, require greater energy efficiency in appliances, vehicles, and buildings, and to generate more power from clean and renewable resources. EPA’s announcement that it is reconsidering the January 2017 Final Determination is deeply concerning because it ignores the successful track record of fuel economy and greenhouse gas standards, in which health protection, consumer savings and job creation have gone hand in hand. Equally concerning, the review fundamentally misapprehends and misconstrues EPA’s proper role, statutory mandate, and expertise—as the agency with core responsibility for protecting the health and welfare of all Americans by reducing harmful pollution. In light of the robust technical record and other data supporting the January 2017 Final Determination, as well EPA’s statutory responsibility to protect human health and the environment, the adoption of any standards less stringent than the current standards would be arbitrary and unlawful.2 Indeed, the extensive empirical record demonstrates that greater reductions are achievable and cost-effective, and that limiting vehicle emissions is vital for public health. Our comments emphasize that:
2 Pursuant to the judicial review provisions of the Clean Air Act, a court reviewing EPA’s GHG emission standards may reverse the action if it is found to be arbitrary, capricious, an abuse of discretion, or otherwise not in accordance with law. 42 U.S.C. § 7607.
3
• The existing record firmly supports EPA’s final determination that the existing MY2022-2025 standards remain “appropriate” under Clean Air Act Section 202(a)(1) and that, if anything, they should be strengthened.
• If EPA reconsiders this determination, it must consider new evidence that further underscores the feasibility and cost-effectiveness of the existing standards.
• EPA may not set aside this determination on the basis of reasoning and factors that subvert EPA’s statutory purpose under Section 202 to protect human health and welfare from dangerous pollution.
• It would be arbitrary and capricious and contrary to statute for EPA to set aside its technical expertise and capabilities and defer to the National Highway Transportation Safety Agency, which has a wholly distinct statutory mandate and less relevant expertise.
• EPA must follow proper procedures if it reconsiders its final determination, including those enumerated in the mid-term evaluation regulations.
• The existing standards save consumers money and provide enormous net benefits. • EPA’s existing, rigorous deliberations already covered the additional factors listed in
EPA’s reconsideration notice and properly concluded that they offered no basis to set aside the existing standards.
4
I. EPA’s Actions Must Be Consistent with Its Unique Clean Air Act Duties to Protect Public Health and Welfare and With Basic Administrative Law Requirements
a. Purpose of Section 202 is to reduce emissions; EPA has authority to project availability of technology with lead time
The purpose of Section 202 of the Clean Air Act is to safeguard public health and welfare by reducing pollutant emissions from motor vehicles. Similarly, the Clean Air Act’s purpose is the “reduction or elimination” of pollutants at the source.3 Section 202(a)(1) mandates that the EPA Administrator “shall” promulgate “standards applicable to the emission of any air pollutant” from new motor vehicles and engines, which “cause, or contribute to, air pollution which may reasonably be anticipated to endanger public health or welfare.”4 Section 202(a)(2) empowers EPA to set emissions standards based on projections of future technology, providing that regulations “shall take effect after such period as the Administrator finds necessary to permit the development and application of the requisite technology.”5 Congress imposed this mandate in the 1965 CAA amendment, assigning the agency the responsibility to adopt forward-looking motor vehicle emissions standards in light of, as expressed in a House Report, “the fact that current and future research and experience can be expected to provide the basis for improving and refining pollution control programs and standards.”6 The report went on to state that “standards should reflect the best judgment of the technical experts, and there is need to permit such improvements to be made as rapidly as the state of the art permits.”7 The legislative history of the subsequent CAA amendments of 1970 and 1977 further emphasized that Congress “expected [EPA] to press for the development and application of improved technology rather than be limited by that which exists today.”8 Section 202 delegates to EPA the responsibility to issue motor vehicle emissions standards that can be achieved by technologies that may still be in development at the time of promulgation, but that the agency projects will be available by the model years in which the standards apply.9 3 Section 101(a)(3). 4 42 U.S.C. § 7521(a)(1); see also Coal. for Responsible Regulation, Inc. v. Envtl. Prot. Agency, 684 F.3d 102, 126 (D.C. Cir. 2012) (“If EPA makes a finding of endangerment, the Clean Air Act requires the [a]gency to regulate emissions of the deleterious pollutant from new motor vehicles.” (quoting Mass. v. Envtl. Prot. Agency, 549 U.S. 497, 533 (2007)). 5 42 U.S.C. § 7521(a)(2). 6 H. Rep. No. 89-899, 111 Cong. Rec. 3608, 3616 (1965). 7 Id. at 3,622. 8 Natural Res. Def. Council, Inc. v. Envtl. Prot. Agency, 655 F.2d 318, 328 (D.C. Cir. 1981) (quoting S. Rep. No. 1196, 91st Cong., 2d Sess. 24 (1970); H. Rep. No. 294, 95th Cong., 1st Sess. 273 (1977)). 9 See 42 U.S.C. § 7521(a); Natural Res. Def. Council, Inc., 655 F.2d at 328.
5
Emissions control technologies that automakers have developed since 2012, and are already utilizing today, confirm that EPA’s projections were correct and even conservative: the technologies to achieve the MY2022-2025 standards are currently available, and at lower cost than was projected in 2012.10 As discussed in detail below, additional technologies are now available that will further decrease costs and reduce pollution in the MY2022-2025 timeframe. Thus, the light-duty GHG emissions standards first promulgated in 2012 and reaffirmed by the Midterm Evaluation and January 2017 Final Determination are unquestionably “appropriate” within the meaning of section 202(a)(2) and 40 C.F.R. section 1818-12(h).
b. EPA Has a Mandatory Legal Duty to Exercise its Own Expertise and
Judgment and Reach an Independent Decision EPA has a legal obligation to exercise its own technical and scientific expertise in developing an empirical and factual basis for determining the appropriate emission standards under section 202(a). Based on this empirical and factual record, EPA must exercise its independent judgment in determining the appropriate emissions standard under section 202(a)(1).
This duty is mandated by section 202(a)(1) of the Clean Air Act, which states: “The Administrator shall by regulation prescribe. . . standards applicable to the emission of any air pollutant from any class or classes of new motor vehicles or new motor vehicle engines, which in his judgment cause, or contribute to, air pollution which may reasonably be anticipated to endanger public health or welfare” (emphasis added). Use of the verb “shall” vests a mandatory, non-discretionary duty in EPA to act, a duty that is explicitly entrusted to EPA’s Administrator.11 EPA is an administrative agency that is separate and apart from NHTSA. EPA has separate and different statutory authority, obligations, and mission. EPA’s statutory obligation under section 202 of the Clean Air Act is to protect the public health and welfare, separate from and unchanged by NHTSA’s statutory obligations. Put simply, NHTSA is not charged with protecting public health and the environment; its mandate does not stem from a finding that greenhouse gas emissions endanger the public health and welfare, and vehicular emissions of that air pollutant contribute to the endangerment. As the Supreme Court stated: “that DOT sets mileage standards in no way licenses EPA to shirk its environmental responsibilities. EPA has been charged with
10 ARB, “CARB finds vehicle standards are achievable and cost-effective” (March 24, 2017), available at https://www.arb.ca.gov/newsrel/newsrelease.php?id=908. Implementation of the MY2012-16 standards has resulted in the overwhelming majority of automakers over complying in past years, and achieving the standards at lower cost than expected. As discussed at length below, updated data and modeling on the MY2022-2025 standards confirms EPA and ARB’s conclusions that more options, at lower cost, are available to achieve the targets than anticipated in EPA’s final rule. 11 Coal. for Responsible Regulation v. Envtl. Prot. Agency, 684 F. 3d 102, 126 (D.C. Cir. 2012).
6
protecting the public’s ‘health’ and ‘welfare,’ a statutory obligation wholly independent of DOT’s mandate to promote energy efficiency.”12
Moreover, “[j]ust as EPA lacks authority to refuse to regulate on the grounds of NHTSA’s regulatory authority, EPA cannot defer regulation on that basis”13 and “[EPA is not] required to treat NHTSA’s . . . regulations as establishing the baseline for the [section 202(a) standards].”14 Indeed, although NHTSA is obligated by statute to consider the EPA standards in determining what standards are maximum feasible,15 EPA is under no such obligation.16 Moreover, NHTSA has no authority whatsoever in the MTE process, which is exclusive to EPA.17 EPA must exercise its independent authority separate and apart from NHTSA’s exercise of its authority.
i. EPA has an accomplished history of relevant expertise In carrying out this mandatory duty, EPA must exercise its own independent engineering and scientific judgment and expertise—which surpasses any comparable NHTSA capabilities in relevant areas. EPA is the federal agency with the most in-house automotive technical expertise, located at its vehicle laboratory. EPA’s Office of Transportation and Air Quality has a long history of developing leading vehicular emission standards. Findings from an independent review by the Government Accounting Office underscore EPA’s comparative technical advantage:
The difference in the extent of new research that NHTSA and EPA conducted for this rulemaking likely results from differences in resources available to the agencies in the recent past. As we mentioned previously, from fiscal years 1996 to 2001—about 6 years—NHTSA was prohibited from using appropriated funds to change CAFE standards. According to NHTSA, the agency lost staff with expertise in this area as a result and did not begin to hire additional automotive engineers until summer 2009. By comparison, EPA has been able to develop and maintain automotive engineering
12 Mass. v. Envtl. Prot. Agency, 549 U.S. 497, 532 (2007) (internal citations omitted). 13 Coal. for Responsible Regulation v. Envtl. Prot. Agency, 684 F. 3d at 127. 14 Id. (noting further that “the [section 202(a) standards] provid[e] benefits above and beyond those resulting from NHTSA’s fuel economy standards”). 15 49 U.S.C. § 32902(f). 16 Coal. for Responsible Regulation v. Envtl. Prot. Agency, 684 F. 3d at 127. 17 40 C.F.R. § 86.1818-12(h) (“Mid-term evaluation of standards. No later than April 1, 2018, the Administrator shall determine whether the standards established in paragraph (c) of this section for the 2022 through 2025 model years are appropriate under section 202(a) of the Clean Air Act, in light of the record then before the Administrator . . . If the Administrator determines they are not appropriate, the Administrator shall initiate a rulemaking to revise the standards, to be either more or less stringent as appropriate.”). In this regard, it is troubling that the notice announcing reconsideration of the Final Determination is a joint notice with NHTSA, when NHTSA is without authority in issues involving the MTE. The Notice fails to indicate that NHTSA’s participation in this comment period is in any way an exercise of its separate authority, such as a NHTSA rulemaking to adopt binding CAFE standards for MY2022-2025.
7
expertise. This expertise has proved helpful in setting GHG emissions standards for automobiles. For example, EPA has been home to the National Vehicle and Fuel Emissions Laboratory since 1971, and in the early 1990s, it expanded its activities to conduct research and development of technologies used to reduce emissions, which are often marketed and licensed to the automobile industry. Although NHTSA brings safety expertise to CAFE standards, which has been a concern with raising CAFE standards in the past, the agency’s primary mission and expertise is in vehicle safety, not vehicle power train design and the impact of vehicle emissions on the environment. Thus NHTSA cannot be expected to have the same level of in-house expertise related to vehicle power train design and environmental issues as EPA.18
EPA has a long history of how it develops a strong technical and scientific basis for setting emissions standards under section 202(a). This includes extensive technical and engineering work conducted directly by EPA, as well as detailed investigations conducted by national labs, academic researchers, industry experts and contractors under EPA’s oversight. As just one example of this body of expertise, Appendix D includes a review of all of the peer-reviewed publications relevant to the mid-term evaluation that were authored by EPA or NHTSA.19 This review demonstrates that EPA is responsible for a substantially greater number of recent peer-reviewed publications as compared to NHTSA. For example, reports authored by EPA staff include modeling and validation of several relevant component technologies, examination of opportunities available with improvements to existing engines, simulations using EPA’s ALPHA model, and other analyses that directly bolster EPA’s technical understanding relevant to this rulemaking. NHTSA’s body of work, by comparison, does not demonstrate the same level of detailed examinations of key rulemaking technical considerations. EPA has comprehensively and diligently exercised its expertise in this manner in the original rulemaking and in the Midterm Evaluation to date and must continue to do so. EPA staff performed the technical analyses that led to the current standards and which informs the Midterm Evaluation.20 Ten thousand pages of analysis and multiple peer-reviewed studies either authored by EPA or by contractors working under close supervision of EPA staff underlie the Midterm Evaluation Final Determination.21 EPA benchmarked more than 20 of the most advanced
18 Government Accounting Office, Vehicle Fuel Economy: NHTSA’s and EPA’s Partnership for Setting Fuel Economy and Greenhouse Gas Emission Standards Improved Analysis and Should be Maintained, GAO 10-336, 23-24 (2010) (emphasis added), available at http://www.gao.gov/assets/310/301194.pdf. 19 The compilation reflects peer-reviewed publications that were included in the Draft Technical Assessment Report and its appendices, Proposed Determination and its Technical Support Document, Final Determination, and EPA and NHTSA’s webpages listing peer-review publications relevant to the midterm evaluation. 20 See generally Draft Technical Assistance Report: Midterm Evaluation of Light-Duty Vehicle Greenhouse Gas Emission Standards and Corporate Average Fuel Economy Standards for Model Years 2022-2025 (July 27, 2016) at 2-2 to 2-3 [hereinafter “Draft TAR”]. 21 Id.
8
vehicles, engines, and transmissions as part of that analysis.22 These data provided inputs and validation for EPA’s vehicle simulation model, the Advanced Light-Duty Powertrain and Hybrid Analysis model (ALPHA).23 EPA’s cost analysis is informed by state-of-the-art cost teardown studies (conducted with the engineering firm FEV).24 In assessing issues relating to consumer impacts and technology acceptance, EPA initiated research, including a project exploring automotive reviews of newly-introduced fuel economy technologies, a comprehensive review of the academic literature on consumer willingness to pay for vehicle attributes, and endeavored (unsuccessfully — like all others’ efforts) to develop a reliable consumer choice model capable of making rational and reasonable quantitative predictions.25 EPA also developed sophisticated modeling tools, both ALPHA for full vehicle simulation, and improvements to its Optimization Model for reducing Emissions of Greenhouse gases from Automobiles (OMEGA).26 Relatedly, the independent GAO report (noted above) examined EPA and NHTSA’s collaboration in the course of issuing MY2012 to 2016 standards and found the same trend of greater expertise and contributions from EPA. This independent report documented and underscored EPA’s greater contributions in the context of this rulemaking—noting that, “EPA contributed research in time to provide analysis for the proposed rule. It also contributed funding to a greater degree [as compared to NHTSA]. . . . EPA conducted or contracted for three peer-reviewed studies to support the rulemaking and the modeling efforts,” research that “provided the analysis of both CAFE and GHG standards with updated information and data.”27 In contrast, “[a]lthough NHTSA contributed research to the rulemaking process, it faced challenges in doing so.”28 EPA’s duty is to continue to use its own technical and scientific expertise in developing GHG standards under the CAA. EPA may not defer to, or de facto delegate the exercise of its technical or other expertise to, another agency such as NHTSA. EPA is the “agency charged by Congress with the initial responsibility of making, evaluating, and acting upon … facts.”29 EPA must actively exercise its technical and scientific expertise and independent judgment to satisfy that obligation. Anything less is an unlawful abdication of EPA’s statutory responsibilities.
22 Draft TAR at 2-2. 23 Draft TAR at 2-3. 24 Id. 25 Id. 26 Id. 27 Government Accounting Office, Vehicle Fuel Economy: NHTSA’s and EPA’s Partnership for Setting Fuel Economy and Greenhouse Gas Emission Standards Improved Analysis and Should be Maintained, GAO 10-336, 23 (2010), available at http://www.gao.gov/assets/310/301194.pdf. 28 Id. at 21. 29 Deutsch v. United States Atomic Energy Commission, 401 F.2d 404, 407 (D.C. Cir. 1968).
9
EPA’s exercise of its independent judgment and technical and scientific expertise must not only encompass and rationally consider all of the substantial existing record, and all of EPA’s past analysis and studies, but also all of the tools used in that analysis. In this regard, consistent with recommendations of the National Academy of Sciences (2015)30, the Midterm Evaluation made extensive use of sophisticated analytic tools and methodologies. These include use of EPA’s vehicle simulation model ALPHA to simulate the effectiveness of individual technologies and technologies in combination, and EPA vehicle teardown studies to estimate technology cost. EPA has also used its peer-reviewed OMEGA model to make reasonable estimates of how manufacturers could add technologies to vehicles in order to meet a fleet-wide CO2 standard. EPA should rely on its own technical and scientific expertise and the extensive record to date. At the least, any decision not to use these well-documented, peer-reviewed, NAS-recommended analytic tools and their inputs would be arbitrary and capricious given the advantages of the OMEGA model and EPA’s work with that model in fulfilling EPA’s statutory obligations and the capacity and experience of EPA staff in this arena.31 EPA clearly has the authority to evaluate, consider, and if appropriate rely on technical and scientific information developed by outside parties or other agencies, such as NHTSA or DOE. However, EPA is required first and foremost to exercise its own expertise and knowledge, and not defer or delegate this exercise of expertise to other parties. Similarly, EPA clearly can coordinate and work with NHTSA, where the goal of such coordination and work is to further EPA’s independent exercise of its own expertise, judgment, and statutory authority. EPA has no authority to defer or avoid exercising its own technical and scientific expertise and judgment. Section 202(a)(1) and (2), clearly delegate to EPA, and EPA alone, the authority and obligation to set federal standards to address air pollution from vehicles. EPA’s decisions here must be justified under section 202(a) of the Clean Air Act, not principles outside of it.32 Thus, in the MTE reconsideration and any subsequent GHG rulemaking, EPA must continue to exercise its own technical and scientific expertise in developing a factual basis for determining the appropriate emission standards under section 202(a), and on this factual basis, EPA must exercise its independent judgment and expertise in determining the appropriate emissions standards under the Clean Air Act, as it has to date.
30 National Research Council, “Cost, Effectiveness, and Deployment of Fuel Economy Technologies for Light-Duty Vehicles,” Washington D.C: The National Academies Press, https://doi.org/10.17226/21744. 31 See U.S. Telecom Ass'n v. FCC, 359 F.3d 554, 565 (D.C. Cir. 2004). 32 Mass. v. Envtl. Prot. Agency, 549 U.S. at 532 (decisions under section 202(a)(1) cannot be based on reasons divorced from statutory text); see also Ctr. For Biological Diversity v. NHTSA, 538 F.3d 1172 (9th Cir. 2008) (agencies may exercise discretion when weighing statutorily prescribed factors only “as long as [the agency]’s balancing does not undermine the fundamental purpose” of the statute). As noted above, although NHTSA is obligated to consider EPA GHG standards in determining what CAFE standards are maximum feasible, there is no parallel obligation for EPA to consider CAFE standards.
10
c. CAFE (Volpe) Modeling Approach is not appropriate for EPA use and does not fulfill EPA’s duty to exercise its independent judgement and expertise
The Draft TAR indicated that even though the agencies worked collaboratively “in an array of areas” during the development of the report, the “EPA GHG and NHTSA CAFE assessments were done independently.”33 The Draft TAR further notes that, “independent and parallel analysis can provide complementary results.”34 This was also the case for the Phase 1 and Phase 2 GHG and fuel economy rulemakings. Each agency utilized different modeling techniques in their respective analysis and in some cases different data sources. In both of these rules and in the Draft TAR, both Agencies have consistently relied on their own modeling approaches and have attempted to align inputs. It would, however, be arbitrary for EPA to abandon the model designed for the purpose of fulfilling EPA’s statutory obligations under Section 202 and the agency staff’s many years of expertise in emission-reducing technologies and with the OMEGA model in favor of a model designed for a different purpose and with which the EPA staff have little expertise. To do so would constitute a failure to exercise EPA’s independent judgment and expertise as required by the statute and Congress’s delegation of authority to EPA to address air pollution from vehicles. The OMEGA model was originally developed as part of EPA’s Phase 1 (MY2012-2016) GHG rulemaking and was used to develop, test and justify its choice of standards finalized in that rule. EPA has continued to refine and improve the OMEGA model as it developed the Phase 2 (MY2017-2025) GHG rulemaking and conducted the Midterm Evaluation of the MY2022-2025 standards. The OMEGA model was specifically designed as a tool to aid EPA in carrying out its statutory obligations under the Clean Air Act to set GHG standards by determining the cost of compliance and the most cost effective technology pathways to achieve potential GHG standards. On the other hand, the Compliance and Effects Model (commonly referred to as the “CAFE (Volpe) model”) was developed to help NHTSA carrying out its statutory obligations under the Energy Policy and Conservation Act (EPCA). NHTSA indicated in the MY2012-2016 CAFE rulemaking that the CAFE model was “developed specifically to support NHTSA’s CAFE rulemakings” and incorporates a number of features and “engineering constraints” that are not appropriate for use by EPA in setting GHG standards and more specifically in its effort to reconsider the Final Determination for the Midterm Evaluation.35
33 Draft TAR at ES-6. 34 Draft TAR at ES-6. 35 Phase 1 Light-Duty Vehicle GHG and CAFE Standards Final Rule, 75 Fed. Reg. 25,324, 25,597, 25,572-81 (May 7, 2010).
11
Important statutory constraints that are built into the CAFE modeling approach that are either inconsistent with or irrelevant for EPA’s analysis include:
a. Standards can only be set for 5 years in the future b. Cannot consider electric vehicles or any other alternative fuel vehicles in the
standard-setting process c. Limits on credit transfers between an automaker’s car and truck fleets d. Must allow fines in lieu of compliance, and assumes that future automaker use of
fines in the future will be the same as in the past e. Cannot consider off-cycle credits for technologies that improve real world fuel
economy (and greenhouse gas emission reductions), but which are not reflected in the city and highway testing
f. Cannot address non-CO2 greenhouse gases such as CH4, N2O, and HFCs g. Must base standards on city and highway tests only h. Considers a gallon of gasoline to be equivalent to a gallon of diesel, even though
diesel contains more energy and carbon per gallon These constraints in the model appropriately reflect legal constraints specific to NHTSA.36 However, they are inappropriate in EPA’s section 202(a)(1) and (2) determinations, as the Clean Air Act does not reflect any of these constraints nor assumptions, such as the possibility of paying fines in lieu of compliance or equivalence of gasoline and diesel. Meanwhile, EPA’s modeling framework was tailored to support Section 202 rulemaking under the Clean Air Act and can therefore provide a credible and science-based projection of the most cost-effective pathways for reducing greenhouse gas emissions, consistent with EPA’s statutory authority as articulated in Section 202. There is also a key overarching difference in the architecture of the models where the CAFE modeling approach appropriately matches NHTSA’s statutory authority – but is inapt for EPA. The CAFE model attempts to simulate for each manufacturer, by year, their refresh and redesign cadence across their vehicle platforms and then predict a manufacturer’s technology deployment decision- making process for each platform.37 But under the Clean Air Act, EPA is not required to demonstrate that standards are set at the maximum feasible level year-by-year, as EPCA requires for NHTSA. The EPCA requirements drive the design of the CAFE model, in that a
36 See 49 U.S.C. § 32902(b)(3)(B) (standards for a maximum of five model years); 49 U.S.C. § 32902(h)(1) (cannot consider electrified or alternative fuel vehicles in CAFE standard-setting); 49 U.S.C. § 32902(h)(3) (cannot consider trading between car and truck fleets in CAFE standard setting); 49 U.S.C. § 32904(c) (city and highway test mandated); 49 U.S.C. § 32912(b) (fines in lieu of compliance). 37 See 49 U.S.C. § 32902(b)(2); 2017 and Later Model Year Light-Duty Vehicle GHG and CAFE Standards, 77 Fed. Reg. 62,624, 63,008, n. 1112 (Oct. 15, 2012) (EPCA requires that NHTSA make a year-by-year determination of the appropriate level of stringency and then set the standard at that level; NHTSA has “long interpreted this statutory language to require year-by-year assessment of manufacturer capabilities”).
12
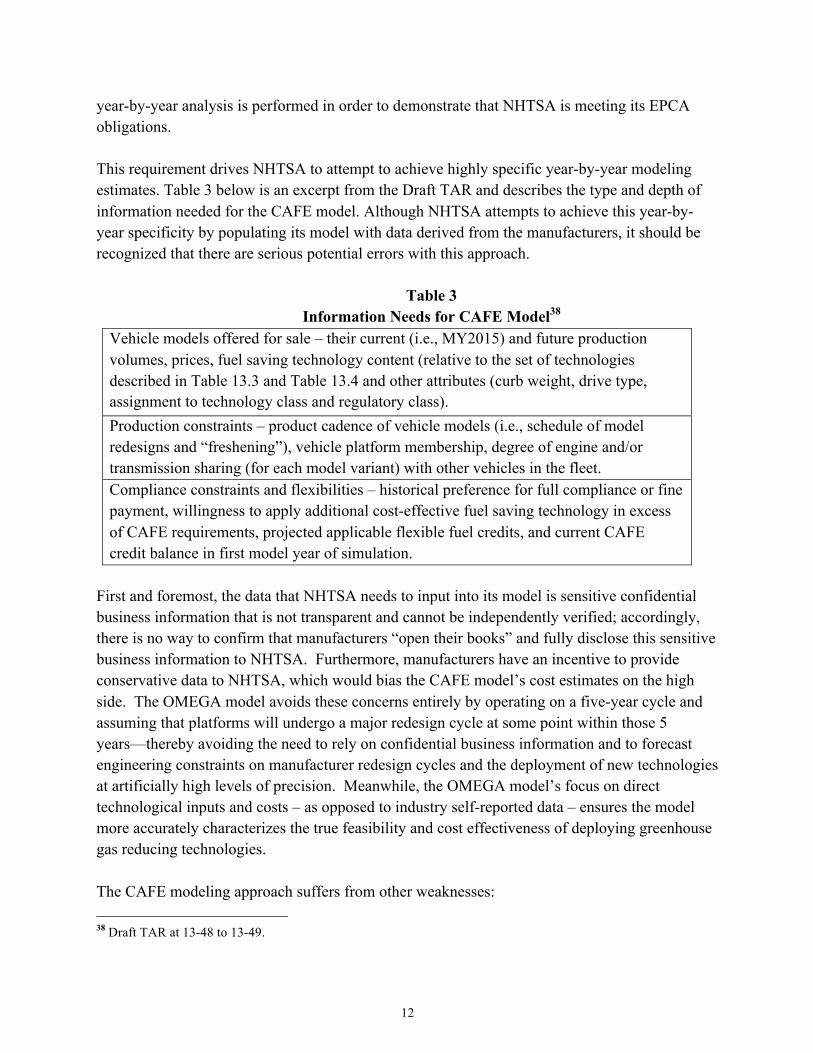
year-by-year analysis is performed in order to demonstrate that NHTSA is meeting its EPCA obligations. This requirement drives NHTSA to attempt to achieve highly specific year-by-year modeling estimates. Table 3 below is an excerpt from the Draft TAR and describes the type and depth of information needed for the CAFE model. Although NHTSA attempts to achieve this year-by-year specificity by populating its model with data derived from the manufacturers, it should be recognized that there are serious potential errors with this approach.
Table 3 Information Needs for CAFE Model38
Vehicle models offered for sale – their current (i.e., MY2015) and future production volumes, prices, fuel saving technology content (relative to the set of technologies described in Table 13.3 and Table 13.4 and other attributes (curb weight, drive type, assignment to technology class and regulatory class). Production constraints – product cadence of vehicle models (i.e., schedule of model redesigns and “freshening”), vehicle platform membership, degree of engine and/or transmission sharing (for each model variant) with other vehicles in the fleet. Compliance constraints and flexibilities – historical preference for full compliance or fine payment, willingness to apply additional cost-effective fuel saving technology in excess of CAFE requirements, projected applicable flexible fuel credits, and current CAFE credit balance in first model year of simulation.
First and foremost, the data that NHTSA needs to input into its model is sensitive confidential business information that is not transparent and cannot be independently verified; accordingly, there is no way to confirm that manufacturers “open their books” and fully disclose this sensitive business information to NHTSA. Furthermore, manufacturers have an incentive to provide conservative data to NHTSA, which would bias the CAFE model’s cost estimates on the high side. The OMEGA model avoids these concerns entirely by operating on a five-year cycle and assuming that platforms will undergo a major redesign cycle at some point within those 5 years—thereby avoiding the need to rely on confidential business information and to forecast engineering constraints on manufacturer redesign cycles and the deployment of new technologies at artificially high levels of precision. Meanwhile, the OMEGA model’s focus on direct technological inputs and costs – as opposed to industry self-reported data – ensures the model more accurately characterizes the true feasibility and cost effectiveness of deploying greenhouse gas reducing technologies. The CAFE modeling approach suffers from other weaknesses: 38 Draft TAR at 13-48 to 13-49.
13
- The National Academy of Sciences recommends the use of full vehicle simulation modeling as the best approach to project the overall technology GHG reducing effectiveness when combining multiple technologies. Over time, EPA has evolved to the use of full vehicle simulation modeling. The CAFE Model still relies only on partial simulation modeling, also relying on “synergies look up tables” which are based on a set of simplistic assumptions.39
- The single most important data inputs to both the OMEGA and CAFE models are engine and transmission maps. EPA generates state-of-the-art engine and transmission maps from benchmarking some of the most efficient vehicles in the world at its National Vehicle and Fuel Emissions Laboratory in Ann Arbor, MI. NHTSA does not operate a laboratory (in fact, the data for NHTSA’s CAFE compliance is primarily generated at EPA/NVFEL)40 and has to rely on the literature for its engine and transmission maps. In practice, this has led to the use of outdated maps in the CAFE Model.
- The National Academy of Sciences recommends the use of cost “tear down” studies as the best way to project the cost of future technologies.41 EPA has funded many cost tear down studies. NHTSA has relied on literature that is not based on tear down studies.
There are also issues of proper notice relating to use of analytic tools here. Should EPA abandon its own modeling tools and use the NHTSA Volpe model as its predictive tool, or rely on the Autonomie model, then section 307(d)(3) of the Act requires EPA to provide adequate notice on all aspects of the model (including its methodology and algorithms, and choice of inputs) such that the model results are replicable by a third party. This degree of requisite transparency already exists for the OMEGA model, which EPA has made publicly available on its website and fully described its methodology and algorithms in the federal register.42 In contrast, the adequacy and transparency of NHTSA’s documentation to date is insufficient to allow effective replication, and the Autonomie model is not even publicly available (as documented in the comments of the American Council for an Energy Efficient Economy (ACEEE).43 The inescapable fact is that both models were developed to allow each Agency to carry out its obligations under their respective statutes. This is, of course, appropriate, but the upshot is that
39 “Cost, Effectiveness, and Deployment of Fuel Economy Technologies for Light-Duty Vehicles,” National Research Council, 2015. 40 This reflects the statutory requirement that EPA, not NHTSA, measure and verify compliance with CAFE standards. 49 U.S.C. § 32904(a). 41 “Cost, Effectiveness, and Deployment of Fuel Economy Technologies for Light-Duty Vehicles,” National Research Council, 2015. 43 See ACEEE Comments to the Environmental Protection Agency and the National Highway Traffic Safety Administration on the Technical Assessment Report; Docket ID No. EPA-HQ-OAR- 2015-0827 and/or Docket No. NHTSA-2016-0068, available at http://aceee.org/sites/default/files/comments-on-tar-epa-092616.pdf. 43 See ACEEE Comments to the Environmental Protection Agency and the National Highway Traffic Safety Administration on the Technical Assessment Report; Docket ID No. EPA-HQ-OAR- 2015-0827 and/or Docket No. NHTSA-2016-0068, available at http://aceee.org/sites/default/files/comments-on-tar-epa-092616.pdf.
14
the Volpe model approach does not align with EPA’s statutory authority. EPA’s use of the CAFE modeling approach would thus be inappropriate, and would call into question EPA’s exercise of its own independent judgment and expertise. Moreover, to the extent EPA would base any conclusions on such a constrained model, the determination would be arbitrary and illegal because EPA would be basing a conclusion on factors — non-Clean Air Act constraints — which are outside EPA’s Clean Air Act mandate.
d. The context of this rulemaking heightens EPA’s duty to explain any change in course.
In any rulemaking, an agency must support all of its decisions by reasoned explanation, comprehensively examining the relevant data and clearly articulating a well-reasoned and complete explanation for its action.44 Where an agency reverses its position, its decision must also be rigorously supported,45 including a “rational connection between the facts found and the choice made.”46 As the basis for reversing course, the agencies may not offer a justification “that runs counter to the evidence before the agency, or is so implausible that it could not be ascribed to a difference in view or the product of agency expertise.”47 In particular, the Supreme Court has emphasized that more detailed explanations may be necessary in the case of rules that involve “serious reliance interests.”48 In this case, automakers and suppliers have themselves underscored the lead-times necessary in this context. Commenters have expressed serious concerns about jeopardizing reasonable reliance interests in investments in advanced technology and the supporting research, development, and hiring.49 Moreover, local air quality jurisdictions and regulations across the country may rely on federal vehicle standards
44 See Motor Vehicle Mfrs. Ass'n v. State Farm Mut. Auto. Ins. Co., 463 U.S. 29, 43-44 (1983). 45 FCC v. Fox Television Stations, Inc., 556 U.S. 502, 515 (2009); Motor Vehicle Mfrs. Ass'n v. State Farm Mut. Auto. Ins. Co., 463 U.S. 29 (1983). 46 State Farm, 463 U.S. at 43 (citation omitted). 47 Id. 48 FCC, 556 U.S. at 515; see also Encino Motorcars, LLC v. Navarro, 136 S. Ct. 2117, 2126 (2016); Nalco Co. v. EPA, 786 F. Supp. 2d 177, 186 (D.C.C. 2011). 49 See Public Testimony of Manufacturers Emission Control Association and Motor & Equipment Manufacturers Association (September 6, 2017), available at https://www.mema.org/sites/default/files/resource/MEMA%20Testimony%20EPA%20MTE%20Sept%206%202017.pdf; Abby Smith, “Automakers, Parts Suppliers at Odds Over EPA Emissions Standards”, Bloomberg News (Sept. 6, 2017), available at https://www.bna.com/automakers-parts-suppliers-n73014464219/(quoting a supplier trade association representative noting that members’ employment plans “have been contingent on compliance with the new” EPA and NHTSA standards); Aluminum Association press release, “Aluminum Industry Requests Regulatory Certainty from EPA Regulators During Public Hearing” (September 6, 2017), available at http://www.aluminum.org/news/aluminum-industry-requests-regulatory-certainty-epa-regulators-during-public-hearing (quoting company Chairman Ganesh Panneer noting “Aluminum is a key enabler in helping automakers meet national fuel efficiency and emissions goals,” and “aluminum companies need predictability and consistency in the regulatory conditions under which they operate.”).
15
as part of complex, multi-step deliberations and planning to achieve air quality goals, such as nitrogen oxides reductions in California.50 EPA must take heed of the Supreme Court’s exhortation that under such circumstances, agencies must provide “a more detailed justification” than what is required for a new regulation created on a blank slate.51 If EPA were to make new or different factual findings to support a new policy, where those findings contradict the prior record, it must also provide “a more detailed justification” in demonstrating that the change is reasoned.52 An agency may not “disregard contrary or inconvenient factual determinations that it made in the past, any more than it can ignore inconvenient facts when it writes on a blank slate.”53 In particular, more detailed explanations would be necessary here if a new final determination relies on “factual findings that contradict those which underlay. . . prior policy.”54 No judicial deference is provided to an agency’s purported exercise of its technical expertise when that explanation lacks coherence.55
e. Any Revision of the January 2017 Final Determination Would Have to Comply with the Procedural and Substantive Regulatory Standards Governing the Midterm Evaluation.
EPA has expressed its intention to “reconsider” its Final Determination of the Midterm Evaluation of the 2022-25 emission standards. But EPA has not proposed to repeal the regulatory framework governing the Mid-Term Evaluation itself. And that framework imposes
50 See J. Jared Snyder, NYS Department of Environmental Conservation Comments on Midterm Evaluation of MY2022-2025 Light-duty Vehicle Greenhouse Gas Emissions Standards, available at https://www.regulations.gov/document?D=EPA-HQ-OAR-2015-0827-6197 (“In New York, DEC is tasked with mitigating the effects of climate change and has the obligation to regulate and mitigate GHG emissions from mobile sources to safeguard the health of State residents and protect the State's environment. . . Implementation of stringent but achievable mobile source emissions standards is essential to protect human health and the environment.”); Northeast States for Coordinated Air Use Management, Comments on Midterm Evaluation of MY2022-2025 Light-duty Vehicle Greenhouse Gas Emissions Standards, available at https://www.regulations.gov/document?D=EPA-HQ-OAR-2015-0827-6168 (“Given the serious challenges our states face in meeting their medium-and long-term GHG reduction goals, and considering that technologies are available today to provide even greater improvements than called for in the regulation, we will continue to look for opportunities to encourage the deployment of ever more efficient vehicles.”). 51 FCC, 556 U.S. at 515-16. 52 FCC, 556 U.S. at 515 (When an agency’s “new policy rests upon factual findings that contradict those which underlay its prior policy,” the agency must “provide a more detailed justification than what would suffice for a new policy created on a blank slate.”). 53 Id. at 537 (Kennedy, J. concurring). 54 Id. at 515. 55 Tripoli Rocketry Ass’n v. BATFE, 437 F. 3d 75, 77 (D.C. Cir. 2006) (“The problem in this case is that ATFE’s explanation for its determination that APCP deflagrates lacks any coherence. We therefore owe no deference to ATFE’s purported expertise because we cannot discern it.”); Coburn v. McHugh, 679 F. 3d 924, 926, 934 (D.C. Cir. 2012) (“Because the ABCMR’s decisions are largely incomprehensible on these points, they are unworthy of any deference.”); see also Haselwander v. McHugh, 774 F. 3d 990, 996 (D.C. Cir. 2014); Global Tel*Link v. FCC, 859 F.3d 39, 56 (D.C. Cir. 2017).
16
significant constraints upon EPA’s reconsideration – constraints that must be honored if the reconsideration is to be lawful. First, if EPA does intend to issue a revised Final Determination that differs from the one issued in January 2017, it must first issue a Proposed Determination and afford the public a meaningful opportunity to comment on it. This was, of course, the process that EPA properly followed in 2016 – issuing a Proposed Determination on November 30, 2016, and allowing a 30-day period for public comment. The Final Determination is an important agency decision that must conform to specified statutory and regulatory factors – basic administrative law principles of fair notice and public participation would in any event require providing the public an opportunity for input on EPA’s proposed decision. The need for publication of a proposal with meaningful opportunity for public comment is all the greater if EPA is going to introduce new policy factors and rely upon new information. At the least, the process afforded previously must be provided this time around. Second, and similarly, EPA must allow for public comment on any proposed technical findings and determinations that EPA may seek to rely upon in a revised Final Determination that are additional to or different from those contained in the Draft TAR (which was, of course, was published with opportunity for public comment). The regulations governing the Midterm Evaluation process contemplate and require the prior publication by EPA of the proposed technical basis for EPA’s determination; they require that a TAR be published for public review and comment in advance of the public determination. Under those regulations, a draft TAR must be issued months before any final determination.56 These requirements make clear that with respect to any “issues relevant to the standard for the 2022 through 2025 model years,”57 EPA must publish any technical findings in proposed form and allow for public input on them before relying upon them to support a Final Determination. For EPA to rely upon technical findings, determinations or judgments that it had not previously published and invited commented on would be starkly inconsistent with the process contemplated in the Midterm Evaluation regulations that EPA purports to be following. Therefore, if EPA intends to rely upon any technical determinations additional to or different from those in the Draft TAR (one which, notably, EPA has expressly not reopened for comment),58 it must publish any such determination in proposed form and allow public comment on it prior to relying on it as support for any revised Final Determination. Any
56 40 C.F.R. § 86.1818–12(h)(2)(ii) (“No later than November 15, 2017, the Administrator shall issue a draft Technical Assessment Report addressing issues relevant to the standards for the 2022 through 2025 model years.”). EPA is required to invite consider public comment on that draft. 40 C.F.R. § 86.1818–12(h)(2)(ii). 57 40 C.F.R. § 86.1818–12(h)(2)(ii). 58 82 Fed. Reg. at 38,553.
17
shortcutting of this proposal-and-public-comment process would be an unlawful departure from the process established in the regulations. Finally, the Midterm Evaluation was never intended to be an opportunity to revise standards that are well supported by the record and consistent with the statute. The regulations establishing of the Midterm Evaluation establish a procedure whereby EPA may change the MY2022-25 standards that were developed in the comprehensive, multi-year rulemaking on the books only if the agency determines that those standards are no longer “appropriate under section 202(a) of the Clean Air Act, in light of the record before the Administrator.”59 The regulations did not call for EPA to commence a rulemaking de novo, as if the existing standards and records did not exist; instead, they call for a change in the standards only if there is some reason why the existing standards are no longer “appropriate” under the statute. This means not just that, in order to determine that a change in the established regulatory is warranted, EPA must clearly identify how the existing standards are not appropriate under the statute. As we emphasize throughout in these comments, on the record before it, EPA could not reasonably determine that the existing standards are not “appropriate under section 202(a) of the Clean Air Act, in light of the record before the Administrator,” such that the standards may be weakened. Indeed, it is a measure of EPA’s own recognition of the thoroughness of the process it has already completed that EPA expressly declines to reopen the Draft TAR for public comment.60 On the record before EPA (including the unchallenged TAR), there is no basis for finding either that the 2022-25 standards are in any way inconsistent with the Act or unsupported by the record. The only conceivable change that could be justified now is to strengthen the standards, based upon evidence that greater emissions reductions are readily available at modest cost, and that the underlying environmental hazards are ever more grave. If EPA follows the Midterm Evaluation standards and procedures that were developed in 2012 with broad support of stakeholders, it cannot weaken these standards.
II. The existing record overwhelmingly supports the conclusion that the current standards are achievable and appropriate; even more rigorous standards are feasible; and, if anything, the MY2022-2025 standards should be strengthened.
In 2010, EPA, NHTSA, and the California Air Resources Board (CARB) finalized the first-ever integrated GHG and fuel economy standards for light-duty vehicles, and in 2012, these same agencies jointly released the historic Phase 2 program that set tailpipe GHG emissions standards for light-duty vehicles that EPA estimated at the time would in effect double the fleet average fuel economy of passenger cars and trucks by 2025. The combined program is estimated to cut 6
59 40 C.F.R. § 86.1818–12 (h). 60 82 Fed. Reg. at 38553/col. 1.
18
billion metric tons of climate pollution over the lifetime of the vehicles sold in MYs 2012-2025 – more than the total amount of carbon dioxide emitted by the United States in 2010.61 As a consequence, and besides yielding other benefits, the National Program is projected to save families over a trillion dollars in fuel costs and reduce America’s dependence on oil by more than 2 million barrels per day in 2025.62 At the time of the final rule, the State of California and thirteen auto companies representing over 90 percent of U.S. vehicle sales announced support for the program.63 The program also received strong support from a broad base of stakeholders that included environmental and consumer groups, the United Automobile Workers, veterans’ groups, state and local governments, and nearly 300,000 private citizens.64 In its October 15, 2012 final rule, EPA committed to conduct a midterm evaluation (MTE) of the MY2022-2025 light-duty standards.65 The MTE’s purpose was to evaluate the MY2022-2025 standards in light of subsequent technological developments reflected in the current record before the Agency. EPA committed “to make a final decision, by April 1, 2018” to affirm or adjust the standards as appropriate.66 In July 2016, EPA, together with NHTSA and California’s Air Resources Board (CARB), issued a Draft Technical Assessment Report (TAR) as the first step in EPA’s MTE process.67 As stated in the 2012 final rule, the Draft TAR was intended to be the primary basis for EPA’s appropriateness determination, and to inform NHTSA’s rulemaking to finalize MY2022-2025 standards. Subsequent to issuing the Draft TAR, EPA issued a Proposed Determination for comment as part of the Midterm Evaluation of the MY2022-2025 standards, as required under 40 C.F.R. § 86.1818-12(h).68 On January 12, 2017, EPA issued an adjudicatory Final Determination that found that the MY2022-2025 light-duty GHG standards are “appropriate under section 202(a)(1) of the Clean Air Act.”69 This adjudicatory Final
61 “EPA and NHTSA Set Standards to Reduce Greenhouse Gases and Improve Fuel Economy for Model Years 2017-2025 Cars and Light Trucks” at 3 (Aug. 2012), EPA-420-F-12-051, available at https://nepis.epa.gov/Exe/ZyPDF.cgi/P100EZ7C.PDF?Dockey=P100EZ7C.PDF [hereinafter EPA Regulatory Announcement]. 62 Id. 63 Id. at 2. 64 Id. 65 2017 and Later Model Year Light-Duty Vehicle Greenhouse Gas Emissions and Corporate Average Fuel Economy Standards; Final Rule, 77 Fed. Reg. 62,624, 62,652 (Oct. 15, 2012) [hereinafter 2012 Final Rule]; 40 CFR section 86.1818-12 (h). 66 2012 Final Rule, 77 Fed. Reg. at 62,652. 67 EPA, NHTSA, & California Air Resources Board, Draft Technical Assessment Report: Midterm Evaluation of Light-Duty Vehicle Greenhouse Gas Emission Standards and Corporate Average Fuel Economy Standards for Model Years 2022-2025, at ES-2 (July 2016) [hereinafter Draft TAR]. 68 Proposed Determination on the Appropriateness of the Model Year 2022-2025 Light-Duty Vehicle Greenhouse Gas Emissions Standards under the Midterm Evaluation at ES-1 (Nov. 2016) [hereinafter Proposed Determination]; see also Notice of Availability for Proposed Determination, 81 Fed. Reg. 87,927 (Dec. 6, 2016); 2012 Final Rule, 77 Fed. Reg. 62,624. 69 EPA, Final Determination on the Appropriateness of the Model Year 2022-2025 Light-Duty Vehicle Greenhouse Gas Emissions Standards under the Midterm Evaluation (Jan. 2017) [hereinafter Final Determination]; see also Regulations for Emissions from Vehicles and Engines, The Midterm Evaluation Process, available at
19
Determination concluded EPA’s Midterm Evaluation of the standards as required in the regulations. After completing the MTE process, which included multiple opportunities for comment, and notwithstanding the compelling record supporting the reaffirmation of the MY2022-2025 standards, EPA announced in March 2017 that it was going to reconsider the Final Determination of the Midterm Evaluation.70 This action was in response to pressure the auto industry brought to bear on the White House and EPA’s Administrator Scott Pruitt. In a February 10, 2017 letter, the CEOs from 16 auto companies urged President Trump to “reinstate” the Midterm review of the GHG rules through MY 2025 because they believed the previous administration “truncated the process for the Midterm Review.”71 The letter did not provide any substantive reason for reopening the MTE other than the automakers objected to the timing of the Final Determination. Subsequent to this letter, the Alliance of Automobile Manufacturers (Alliance), representing twelve leading auto manufacturers, and the Association of Global Automakers (Global Automakers), representing 12 foreign auto manufacturers, each sent EPA Administrator Scott Pruitt a letter on February 21, 2017 requesting that EPA “withdraw the Final Determination.”72 The link to the February 21, 2017 Auto Alliance letter is prominently posted on EPA’s website for the midterm evaluation, right under the link to the Federal Register notice.73 Both letters took issue with EPA’s timeline and raised a number of procedural concerns, but did not provide any new data or information relevant to EPA’s Final Determination. On March 22, 2017, EPA and NHTSA issued a Notice of Intention to Reconsider the Final Determination.74 As its rationale for reopening the MTE, EPA indicated that, “it is appropriate to reconsider its Final Determination in order to allow additional consultation and coordination with NHTSA.”75 In other public statements, agency and administration officials have indicated that a focus on economic health and job creation has motivated the decision to reopen the review of the
https://www.epa.gov/regulations-emissions-vehicles-and-engines/midterm-evaluation-light-duty-vehicle-greenhouse-gas (last visited Oct. 3, 2017). 70 Notice of Intention To Reconsider the Final Determination of the Mid-Term Evaluation of Greenhouse Gas Emissions Standards for Model Year 2022-2025 Light Duty Vehicles, 82 Fed. Reg. 14,671 (Mar. 22, 2017) [hereinafter NOI]. 71 See Ryan Beene, Auto CEOs Ask Trump to Revisit Obama-era Fuel Efficiency Rules, BLOOMBERG (Feb. 11, 2017) available at https://www.bloomberg.com/news/articles/2017-02-11/auto-ceos-ask-trump-to-revisit-obama-era-fuel-efficiency-rules (last visited Oct. 3, 2017). 72 Letter, Auto Alliance to EPA Administrator G. Scott Pruitt, (Feb. 21, 2017), available at https://autoalliance.org/wp-content/uploads/2017/02/Letter-to-EPA-Admin.-Pruitt-Feb.-21-2016-Signed.pdf; Letter, Global Automakers to EPA Administrator G. Scott Pruitt, (Feb. 21, 2017), available at https://www.globalautomakers.org/system/files/document/attachments/2017-02-21_request_to_withdraw_final_determination.pdf. 73 See EPA website at: https://www.epa.gov/regulations-emissions-vehicles-and-engines/midterm-evaluation-light-duty-vehicle-greenhouse-gas 74 NOI, 82 Fed. Reg. at 14,672. 75 Id.
20
standards.76 The agencies’ NOI also comes amidst a broader review, initiated by the President, designed to identify and repeal health and environmental protections that are deemed to impact domestic fossil fuel production.77 The decision to reopen the MTE based on these considerations is without merit and should be withdrawn. In light of the robust technical record and other data supporting the Final Determination, as well the agencies’ statutory responsibilities to protect human health and enhance energy efficiency of motor vehicles, the adoption of any standards less stringent than the current standards would be arbitrary and unlawful.78 Indeed, as we summarize below, the extensive record demonstrates that even greater reductions are achievable and cost-effective. Reconsideration is not warranted by the record, but if EPA is to reconsider its final determination, the agency must consider options to strengthen the standards.
a. The record overwhelmingly supports a determination that the MY2022-25 standards are technically achievable and cost-effective
As outlined above, EPA, NHTSA, and CARB jointly conducted a multi-year mid-term review of the MY 2022-2025 standards, amassing a robust record, including examination of technical and economic analyses, meetings with stakeholders, and consideration of hundreds of thousands of public comments. The resulting Draft TAR, on which EPA’s Final Determination is based, reflects the findings and conclusions of all three agencies. And those findings are clear: the 2022-2025 standards are technically achievable and cost effective, and can be met without adverse economic impacts. Indeed, the monetized fuel cost savings alone far exceed the cost of control technologies, so that the standards’ benefits far exceed their costs, even without considering their many fold environmental and energy security benefits. The Draft TAR, examined a wide range of factors, including technology advancements, the penetration of more fuel-efficient technologies in the marketplace, consumer acceptance of these technologies, trends in fuel prices and the vehicle fleet, employment impacts, and others. Even
76 See, e.g., Remarks of President Trump at the American Center for Mobility, WASH. POST (Mar. 15, 2017) (suggesting a review is necessary to determine “[i]f the standards threaten auto jobs”), available at https://www.washingtonpost.com/video/politics/president-trumps-full-speech-in-ypsilanti-mich/2017/03/15/86765dd2-09b3-11e7-bd19-fd3afa0f7e2a_video.html (last visited Oct. 3, 2017). 77 See Exec. Order No. 13783, Promoting Energy Independence and Economic Growth (Mar. 28, 2017), available at https://www.whitehouse.gov/the-press-office/2017/03/28/presidential-executive-order-promoting-energy-independence-and-economi-1 (last visited Oct. 3, 2017). 78 Pursuant to the judicial review provisions of the Clean Air Act, a court reviewing EPA’s GHG emission standards may reverse the action if it is found to be arbitrary, capricious, an abuse of discretion, or otherwise not in accordance with law. 42 U.S.C. § 7607; see also Nat'l Petrochemical & Refiners Ass'n v. Envtl. Prot. Agency, 287 F.3d 1130, 1135 (D.C. Cir. 2002). Similarly, NHTSA’s CAFE standards are subject to the Administrative Procedure Act, which authorizes a reviewing court to hold unlawful an agency action found to be arbitrary, capricious, an abuse of discretion, or otherwise not in accordance with law. 5 U.S.C. § 706.
21
though EPA and NHTSA performed independent analyses in the Draft TAR, both agencies reached the same conclusions:79
- “A wider range of technologies exist for manufacturers to use to meet the MY2022-2025 standards, and at costs that are similar or lower, than those projected in the 2012 rule”;
- “Advanced gasoline vehicle technologies will continue to be the predominant technologies, with modest levels of strong hybridization and very low levels of full electrification (plug-in vehicles) needed to meet the standards.”
These conclusions were based on analyses that reflect the agencies’ most current assessment of the feasibility of the 2025 standards. Based on NHTSA and EPA’s analyses, there is no question that the auto industry is bringing new technologies to the market at a quicker pace and at lower cost than the agencies projected in the 2012 rulemaking for MY2017-2025: “manufacturers are adopting fuel economy technologies at unprecedented rates. Car makers and suppliers have developed far more innovative technologies to improve fuel economy and reduce GHG emissions than anticipated just a few years ago.”80 This has occurred while the industry has experienced an unprecedented period of growth – 2016 marked the seventh year in a row that car sales in the US set an all-time sales record.81 The analyses indicate that the costs for complying with the MY2022-2025 standards are lower than the agencies’ estimates in the 2012 rulemaking for MY2017-2025. EPA’s primary analysis shows MY2025 compliance costs (incremental to MY2021) significantly lower than those projected in the final rule ($252 lower for cars and $197 lower for trucks).82 NHTSA’s analysis shows similar downward trends in compliance costs.83 The agencies also concluded in the Draft TAR that the availability of the individual technologies needed to comply with the future standards are “generally consistent” with those projected in the final rulemaking.84 The agencies did, however, find that several new technologies and developments in the Draft TAR were neither foreseen nor included in the analysis supporting the 2012 rulemaking for MY2017-2025.85 Examples of these technologies include the application of
79 Draft TAR, at ES-2. 80 EPA, Regulations for Emissions from Vehicles and Engines, Highlights from the Draft TAR, available at https://www.epa.gov/regulations-emissions-vehicles-and-engines/midterm-evaluation-light-duty-vehicle-greenhouse-gas (last visited Oct. 3, 2017). 81 Ahiza Garcia, Car Sales Set Another U.S. Record, CNN (Jan.4, 2017) available at http://money.cnn.com/2017/01/04/news/companies/car-sales-2016/index.html (last visited Oct. 3, 2017). 82 See Draft TAR at ES-9; 77 Fed. Reg. at 62,665. 83 Id. 84 Draft TAR, 5-1. 85 Id.
22
direct injection Atkinson Cycle engines to non-hybrids,86 greater penetration of continuously variable transmissions (CVT), and greater use of diesel engines. The agencies concluded that these additional technologies contribute to lower cost compliance pathways.87 In its Proposed Determination and accompanying Technical Support Document (TSD), EPA considered over 200,000 public comments from individuals and about 90 organizations on the Draft TAR, as well as extensive additional studies conducted by the agency and others.88 As a result, EPA updated technology costs, effectiveness, modeling, consumer impacts, and other aspects of its analysis supporting the Proposed Determination.89 The robust analyses supporting the Proposed — and Final — Determination are comprehensive, and definitively confirm the conclusions reached in the Draft TAR. In fact, the primary analysis shows per-vehicle compliance costs to be significantly lower than those projected in the 2012 final rule and slightly less than those included in the Draft TAR.90 The Proposed Determination continued to show, as did the Draft TAR, that auto manufacturers and suppliers are developing and deploying low emitting and fuel efficient technologies at a much faster rate than was forecast in the 2012 final rule. Furthermore, the Proposed Determination concluded that the MY2022-2025 standards are feasible, will achieve significant GHG emissions reductions, will deliver significant benefits to consumers, and that the auto manufacturers are meeting the standards more quickly than required—all during a time when the industry is thriving.91 As mentioned above, former EPA Administrator Gina McCarthy finalized a determination to maintain the current GHG emissions standards for MY2022-2025 vehicles on January 12, 2017. This Final Determination found that automakers are well positioned to meet the standards at lower costs than previously estimated. The Administrator concluded, based on the record in front of her, that “the success of the industry to date in achieving seven years of record sales while producing large variety of vehicles that meet or exceed the standards reflects the fact that the development and deployment of advanced technology conventional gasoline engines has happened consistent with a robust vehicle market, more rapidly than we predicted, and at cost
86 Although NHTSA unaccountably appeared to ignore this technology in its analysis. See Draft TAR at Table ES-3 (NHTSA projects less than 1% penetration of higher compression ratio engines as a pathway to meet MY 2025 standards); Draft TAR at 13-62 (high compression rate engines projected at 0% for most manufacturers, including FCA and Ford, which have either already deployed such engines in their light duty vehicle fleets or announced plans to do so). 87 See Proposed Determination at ES-3. 88 Proposed Determination at ES-1. 89 See generally Proposed Determination; EPA, “Proposed Determination on the Appropriateness of the Model Year 2022-2025 Light-Duty Vehicle Greenhouse Gas Emissions Standards under the Midterm Evaluation: Technical Support Document,” (Nov. 2016) [hereinafter TSD]. 90 Proposed Determination at ES-4; 77 Fed. Reg. at 62,665. 91 Proposed Determination at ES-7.
23
that are comparable or slightly lower than we predicted.”92 The Administrator chose to “retain the current standards to provide regulatory certainty for the auto industry despite a technical record that suggests the standards could be made more stringent.”93 Not only are manufacturers adding innovative low emitting and efficiency technologies at unprecedented rates, but these improvements have come while other metrics of vehicle performance have continued to improve, including acceleration times and durability.94 For MY2016, there were already over 100 car, SUV, and pickup versions on the market meeting MY2020 or later GHG emission standards.95 New technologies are being utilized that allow a number of individual vehicle models to meet standards all the way out to 2025—an extraordinary nine model years in advance.96 In EPA’s 2016 Fuel Economy Trends Report, it estimated that “17% of projected MY2016 vehicle production already meets or exceeds the MY2020 CO2 emissions targets.”97 This over-compliance has resulted in most manufacturers accruing large credit balances that could be used in future years. Seventeen of twenty manufacturers (representing 99% of MY2015 sales) carried a positive credit balance into MY2016.98 We conducted an analysis to assess how many years these credits could facilitate future compliance if manufacturers did nothing more to improve GHG emission levels of their vehicles beyond MY2015 levels. This analysis is illustrative and intended to demonstrate how manufacturers’ investments in technologies to reduce greenhouse gas emissions has created substantial credits that only further underscores the feasibility of complying with the MY2022-2025 standards. The underlying data used in this study can be found in EPA’s “Greenhouse Gas Emission Standards for Light-Duty Vehicles: Manufacturer Performance report for the 2015 Model Year” and a detailed description of our methodology can be found in Attachment A. Our analysis found that banked credits alone – holding fleet greenhouse gas performance static beyond 2015 – are sufficient to allow full compliance through the 2018 model year with a significant balance remaining (42 million megatons of GHG credits) that could be used in the 2019 model year. 92 McCarthy, Gina, EPA Administrator to Stakeholders, January 12, 2017. Available at: https://www.epa.gov/sites/production/files/2017-01/documents/mte-stakeholder-letter-2017-01-12.pdf (last visited October 4, 2017). 93 EPA, Regulations for Emissions from Vehicles and Engines, Previous Steps in the Midterm Evaluation Process, https://19january2017snapshot.epa.gov/regulations-emissions-vehicles-and-engines/midterm-evaluation-light-duty-vehicle-greenhouse-gas-ghg_.html (last visited Oct. 3, 2017). 94 Proposed Determination, A-48-49, A-71. 95 Final Determination, 23. 96 EPA, Light-Duty Automotive Technology, Carbon Dioxide Emissions, and Fuel Economy Trends: 1975 through 2016, at ES-10 (Nov. 2016), available at https://www.epa.gov/sites/production/files/2016-11/documents/420s16001.pdf (last visited Oct. 3, 2017) [hereinafter 2016 Fuel Economy Trends Report]. 97 Id. 98 GHG Emission Standards for Light-Duty Vehicles: Manufacturer Performance report for the 2015 Model Year,” EPA-420-R-16-014, (November 2016) at 69.
24
We maintain that the extensive record summarized above strongly supports, at minimum, maintaining the MY2022-2025 standards included in the 2012 final rule. The Draft TAR and Final Determination firmly and convincingly provided the basis to reaffirm the MY2022-2025 GHG standards We agree and support EPA’s January 2017 Final Determination that the current MY2022-2025 standards remain appropriate and that no changes are warranted. We also agree with EPA’s assessment that “the current record, including the current state of technology and the pace of technology development and implementation, could support a decision to adopt more stringent standards for 2022-2025.”99
b. EPA Must Consider the Recent Studies and New Data Released Since EPA Published Its Final Determination in January 2017
In addition to the extensive record already before EPA, there have been numerous studies and new data made available subsequent to the EPA’s January 12, 2017 Final Determination. This new information demonstrates that even more stringent standards than those reflected in the October 2012 Final Rule are feasible and highly-cost effective. The reports listed below are directly relevant to EPA’s deliberations and EPA must carefully evaluate and consider this new information in its reconsideration of the Final Determination of the Midterm Evaluation of the MY2022-2025 GHG standards:
1. Lutsey, Nic et.al., “Efficiency Technology and Cost Assessment for the U.S. 2025-2030 Light-Duty Vehicles,” International Council on Clean Transportation (Mar. 2017), available at http://theicct.org/US-2030-technology-cost-assessment One of the objectives of this report, authored by the International Council on Clean Transportation (ICCT), was to update the midterm regulatory analysis for new MY2025 light-duty vehicles. ICCT’s analysis considered the latest research literature, simulation modeling, and industry developments on technology efficiency and costs. One of the study’s key findings was that “previous costs of compliance have been greatly overestimated” in both the Draft TAR and Final Determination. The study concludes that “state-of-the-art engineering studies and emerging supplier technology developments indicate that costs for lightweighting, direct injection, and cooled exhaust gas recirculation will be reduced by hundreds of dollars, and electric vehicles will drop by thousands of dollars per vehicle by 2025.” Specifically, ICCT estimated the per vehicle compliance technology cost relative to the 2021 standards at $551 compared to EPA’s Final Determination estimate of $875 and NHTSA’s Draft TAR estimate of $1245. This report adds to the already substantial record demonstrating that more stringent standards deserve serious consideration.
99 Proposed Determination at ES-7.
25
2. T. Cackette and R. Rykowski, “Technical Assessment of CO2 Emission Reductions
for Passenger Vehicles in the Post-2025 Timeframe,” (Feb. 2017), available at https://www.edf.org/sites/default/files/content/final_public_white_paper_post_2026_co2_reductions2.27_clean.pdf Although the main thrust of this report was to determine achievable CO2 emissions reductions and fuel economy levels in the 2030 timeframe, the authors also examined how much more CO2 reduction could be achieved when relying only on currently available conventional technologies. The authors used the latest public version of EPA’s OMEGA model (Version 1.4.56 and Pre-Processors made available by EPA in November 2016) and found that conventional technologies such as mild hybrids, Atkinson and Miller cycle engines “are projected to be underutilized in meeting the 2025 standard.” This report reinforces the conclusion that more stringent CO2 and fuel economy standards are achievable at reasonable cost by 2025.
3. CARB, “California’s Advanced Clean Cars Midterm Review,” (Jan. 18, 2017),
available at https://www.arb.ca.gov/msprog/acc/acc-mtr.htm This report presents CARB’s technical analysis for the midterm review of the MY2022-2025 standards. Based on its technical review, CARB concluded that “Compliance with the current national GHG standards for model years 2022-2025 will result in equivalent or greater GHG benefits (at the same or lower cost to manufacturers) than originally projected for California and accordingly, consistent with the U.S. EPA Final Determination, changes to the stringency of the national or California GHG standards are not necessary or warranted.” The conclusion California drew from its midterm review is consistent with every major analysis of the cost-effective feasibility of the MY2022-2025 standards, including the 2012 Final Rule, the Draft TAR, the January 2017 Final Determination, and numerous independent studies. This assessment and the previous reports must be carefully considered by EPA in its deliberations.
In addition to the reports listed above, EPA has indicated publicly that it is continuing in-house test programs and studies that will inform its reconsideration efforts. EPA staff, in a recent presentation at a Car Training Institute (CTI) Symposium in Novi, Michigan on May 17, 2017, summarized an extensive amount of new work underway involving evaluation of advanced powertrains, modeling updates and improvements, cost teardown studies, and consumer
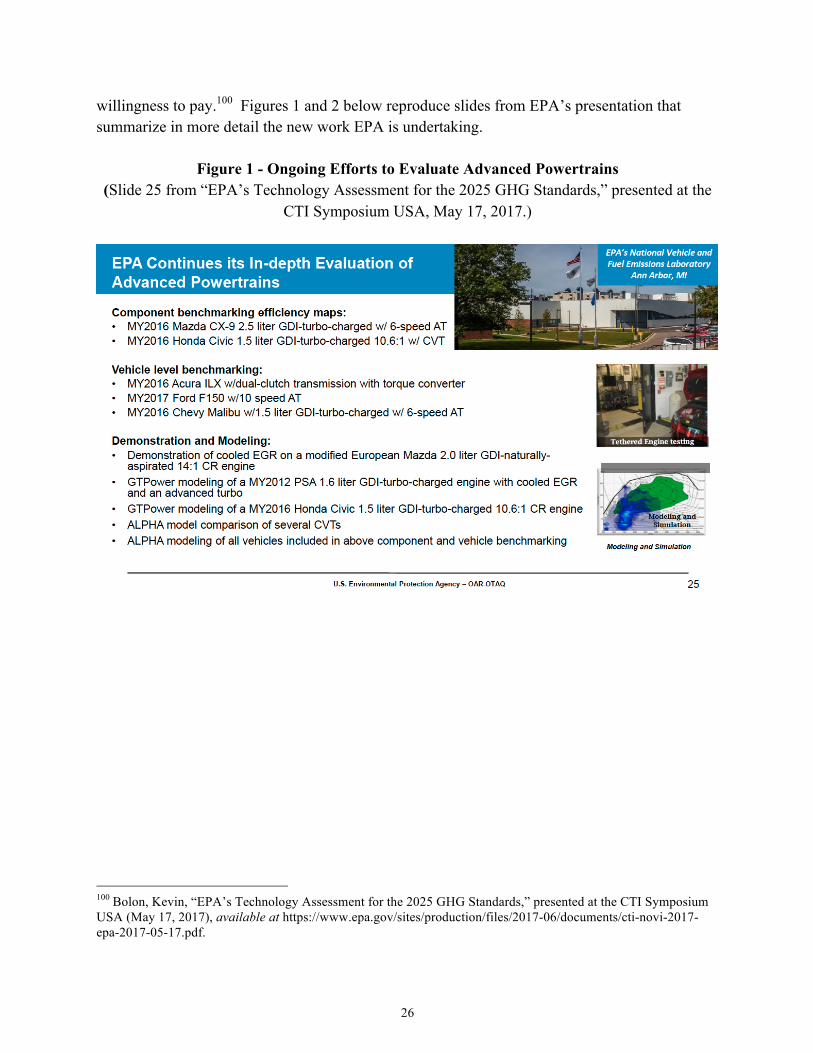
26
willingness to pay.100 Figures 1 and 2 below reproduce slides from EPA’s presentation that summarize in more detail the new work EPA is undertaking.
Figure 1 - Ongoing Efforts to Evaluate Advanced Powertrains (Slide 25 from “EPA’s Technology Assessment for the 2025 GHG Standards,” presented at the
CTI Symposium USA, May 17, 2017.)
100 Bolon, Kevin, “EPA’s Technology Assessment for the 2025 GHG Standards,” presented at the CTI Symposium USA (May 17, 2017), available at https://www.epa.gov/sites/production/files/2017-06/documents/cti-novi-2017-epa-2017-05-17.pdf.
27
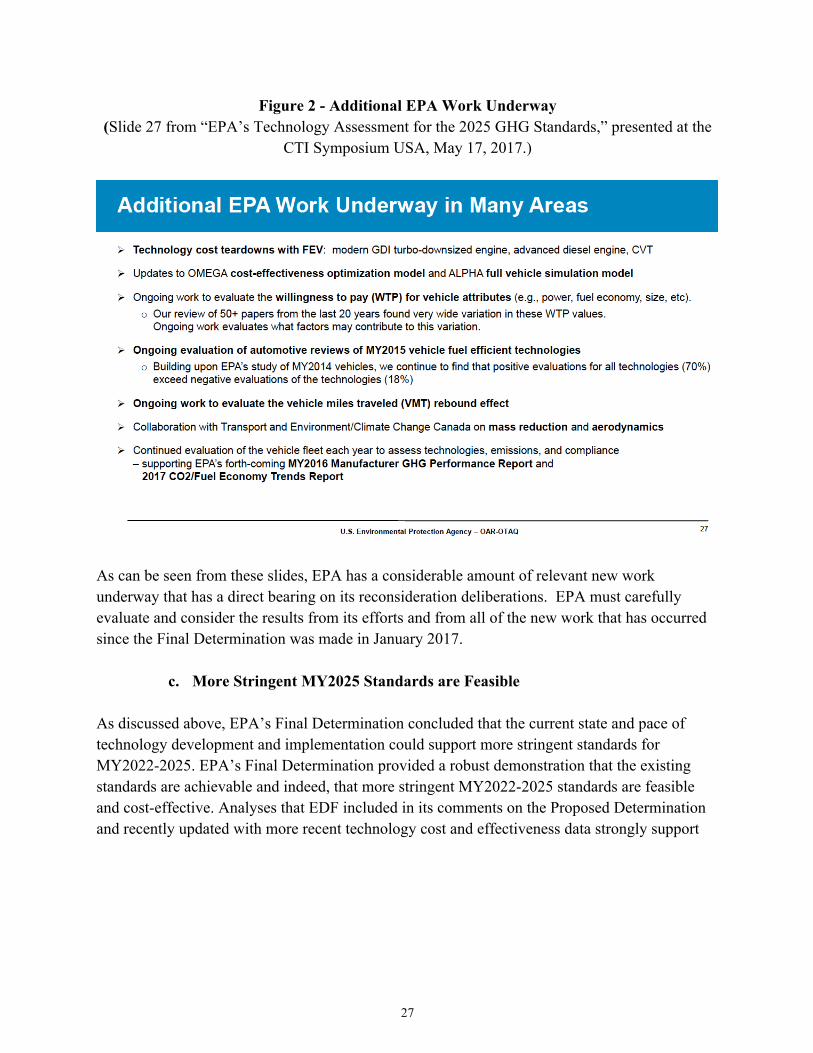
Figure 2 - Additional EPA Work Underway (Slide 27 from “EPA’s Technology Assessment for the 2025 GHG Standards,” presented at the
CTI Symposium USA, May 17, 2017.)
As can be seen from these slides, EPA has a considerable amount of relevant new work underway that has a direct bearing on its reconsideration deliberations. EPA must carefully evaluate and consider the results from its efforts and from all of the new work that has occurred since the Final Determination was made in January 2017.
c. More Stringent MY2025 Standards are Feasible As discussed above, EPA’s Final Determination concluded that the current state and pace of technology development and implementation could support more stringent standards for MY2022-2025. EPA’s Final Determination provided a robust demonstration that the existing standards are achievable and indeed, that more stringent MY2022-2025 standards are feasible and cost-effective. Analyses that EDF included in its comments on the Proposed Determination and recently updated with more recent technology cost and effectiveness data strongly support
28
these conclusions.101 Therefore, if the Agency reopens the Final Determination it must consider strengthening the standards for MY2022-2025. EDF contracted an analysis of 4 scenarios that are 10, 20, 30, and 40 g/mi more stringent than the current MY2025 target (173 g/mi) in order to ascertain the technology and cost implications of setting more stringent standards for MY2025.102 For this analysis, we used the most recent docketed version of the OMEGA model and retained the same inputs and constraints that EPA used for the primary analysis in the Proposed and Final Determination and its Technical Support Document.103 The results of our analysis clearly demonstrate that the compliance pathways for these more stringent levels are cost effective and similar to those in EPA’s analysis of the current MY2022-2025 standards. Notably, EPA’s conclusion that “[a]dvanced gasoline vehicle technologies will continue to be the predominant technologies, with modest levels of strong hybridization and very low levels of full electrification (plug-in vehicles) needed to meet the standards” also holds true for the more stringent levels evaluated above.104 The results also showed that the costs for meeting these more stringent scenarios are substantially outweighed by the lifetime fuel saving benefits to the consumer. This analysis clearly supports the conclusion that more stringent GHG emission standards are justified under the criteria guiding the midterm evaluation.105 Subsequent to the completion of the January 2017 Final Determination, EDF updated this analysis to reflect the results of a recent ICCT report that reassessed progress in the development of several light-duty fuel efficient technologies such as gasoline direct injection, cooled exhaust gas recirculation (EGR), cylinder deactivation, naturally aspirated Atkinson high compression ratio engines, turbocharged Atkinson (or Miller cycle) engines, electrically boosted turbocharging, weight reduction, diesel engines and electric vehicles. The ICCT report concluded that the technology costs used by EPA in the Draft TAR and Final Determination were “greatly overestimated.”106 Our latest analysis incorporates the cost and effectiveness projections made by ICCT into EPA’s OMEGA model and assesses the potential impact of these projections on manufacturer compliance with the EPA GHG standards in MY2025. A detailed
101 Comments by Environmental Defense Fund on Proposed Determination on the Appropriateness of the Model Year 2022-2025 Light-Duty Vehicle Greenhouse Gas Standards Under the Midterm Evaluation, at 10-15 (Dec. 30, 2016). 102 Id. 103 Id. at 10-15. 104 Draft TAR at ES-2. 105 Comments by Environmental Defense Fund on Proposed Determination on the Appropriateness of the Model Year 2022-2025 Light-Duty Vehicle Greenhouse Gas Standards Under the Midterm Evaluation, at 10-14 and Attachment A (Dec. 30, 2016). 106 Lutsey, Nic et.al., “Efficiency Technology and Cost Assessment for the U.S. 2025-2030 Light-Duty Vehicles,” International Council on Clean Transportation, at iv (Mar. 2017), available at http://theicct.org/US-2030-technology-cost-assessment.
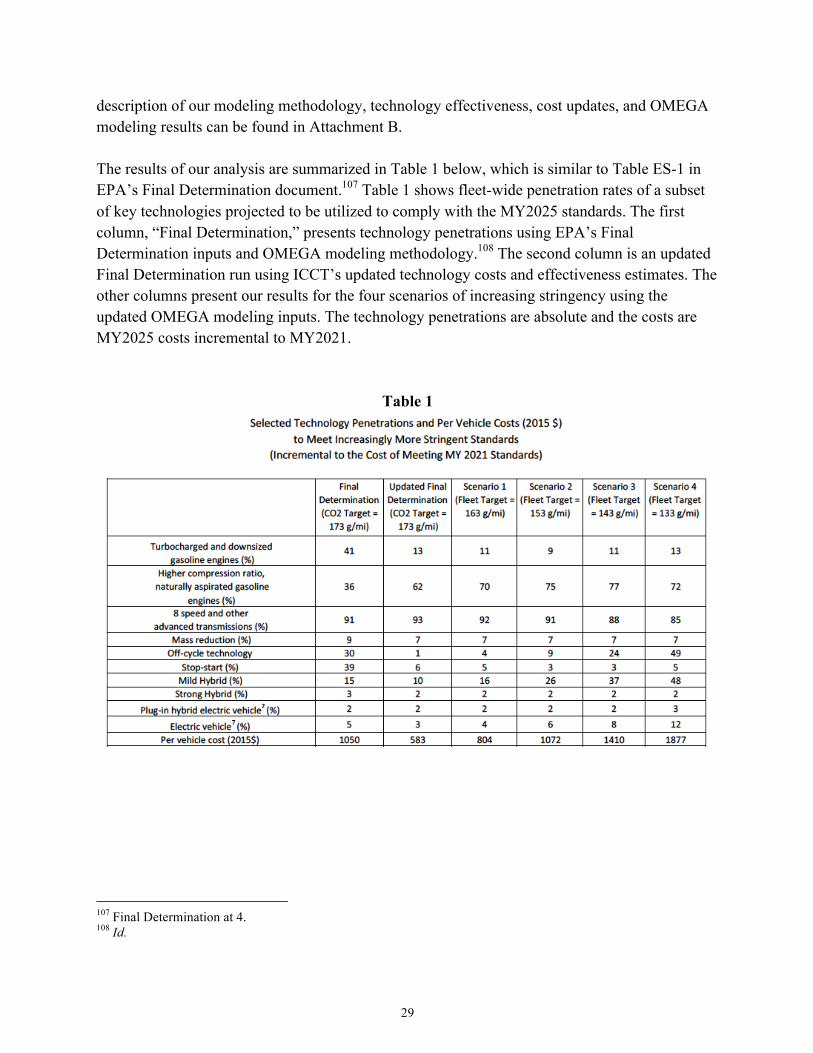
29
description of our modeling methodology, technology effectiveness, cost updates, and OMEGA modeling results can be found in Attachment B. The results of our analysis are summarized in Table 1 below, which is similar to Table ES-1 in EPA’s Final Determination document.107 Table 1 shows fleet-wide penetration rates of a subset of key technologies projected to be utilized to comply with the MY2025 standards. The first column, “Final Determination,” presents technology penetrations using EPA’s Final Determination inputs and OMEGA modeling methodology.108 The second column is an updated Final Determination run using ICCT’s updated technology costs and effectiveness estimates. The other columns present our results for the four scenarios of increasing stringency using the updated OMEGA modeling inputs. The technology penetrations are absolute and the costs are MY2025 costs incremental to MY2021.
Table 1
107 Final Determination at 4. 108 Id.
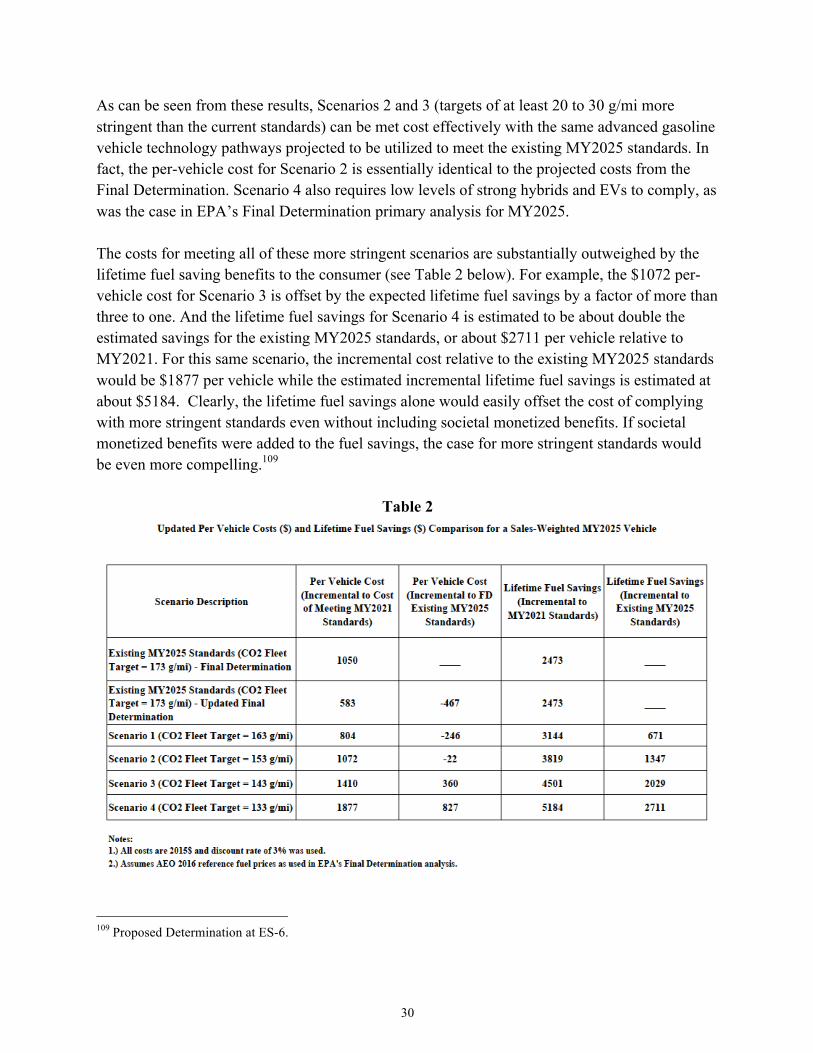
30
As can be seen from these results, Scenarios 2 and 3 (targets of at least 20 to 30 g/mi more stringent than the current standards) can be met cost effectively with the same advanced gasoline vehicle technology pathways projected to be utilized to meet the existing MY2025 standards. In fact, the per-vehicle cost for Scenario 2 is essentially identical to the projected costs from the Final Determination. Scenario 4 also requires low levels of strong hybrids and EVs to comply, as was the case in EPA’s Final Determination primary analysis for MY2025. The costs for meeting all of these more stringent scenarios are substantially outweighed by the lifetime fuel saving benefits to the consumer (see Table 2 below). For example, the $1072 per-vehicle cost for Scenario 3 is offset by the expected lifetime fuel savings by a factor of more than three to one. And the lifetime fuel savings for Scenario 4 is estimated to be about double the estimated savings for the existing MY2025 standards, or about $2711 per vehicle relative to MY2021. For this same scenario, the incremental cost relative to the existing MY2025 standards would be $1877 per vehicle while the estimated incremental lifetime fuel savings is estimated at about $5184. Clearly, the lifetime fuel savings alone would easily offset the cost of complying with more stringent standards even without including societal monetized benefits. If societal monetized benefits were added to the fuel savings, the case for more stringent standards would be even more compelling.109
Table 2
109 Proposed Determination at ES-6.
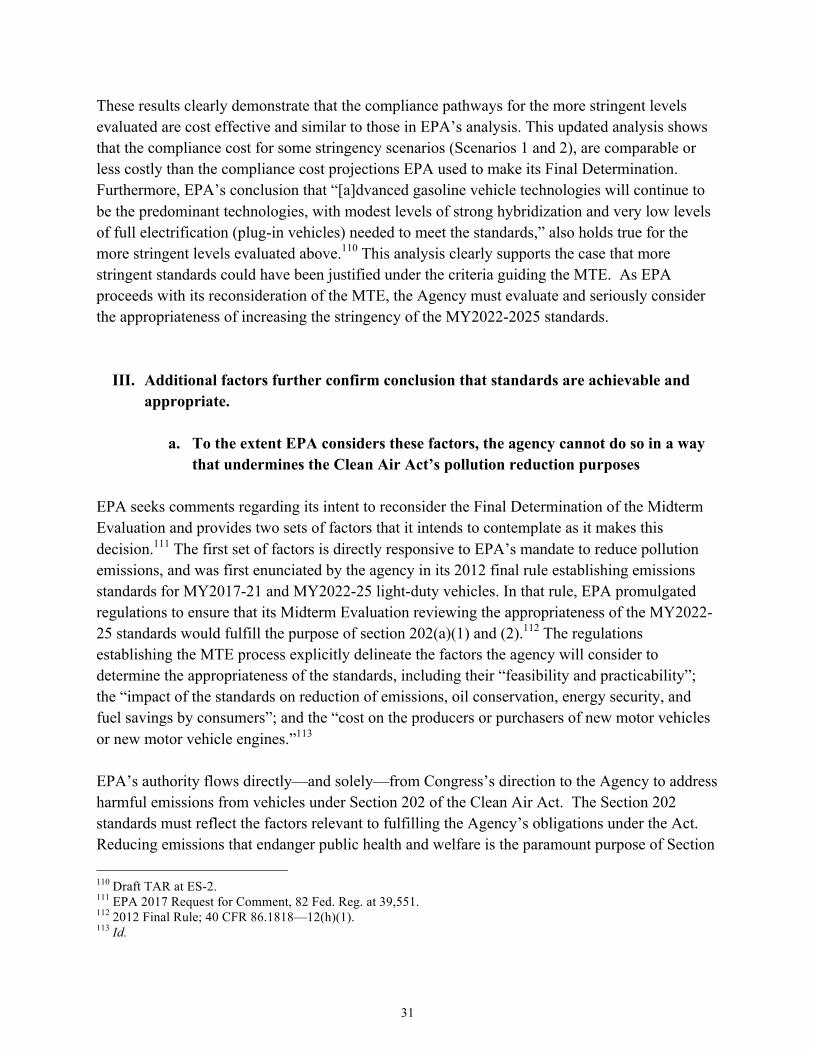
31
These results clearly demonstrate that the compliance pathways for the more stringent levels evaluated are cost effective and similar to those in EPA’s analysis. This updated analysis shows that the compliance cost for some stringency scenarios (Scenarios 1 and 2), are comparable or less costly than the compliance cost projections EPA used to make its Final Determination. Furthermore, EPA’s conclusion that “[a]dvanced gasoline vehicle technologies will continue to be the predominant technologies, with modest levels of strong hybridization and very low levels of full electrification (plug-in vehicles) needed to meet the standards,” also holds true for the more stringent levels evaluated above.110 This analysis clearly supports the case that more stringent standards could have been justified under the criteria guiding the MTE. As EPA proceeds with its reconsideration of the MTE, the Agency must evaluate and seriously consider the appropriateness of increasing the stringency of the MY2022-2025 standards.
III. Additional factors further confirm conclusion that standards are achievable and appropriate.
a. To the extent EPA considers these factors, the agency cannot do so in a way
that undermines the Clean Air Act’s pollution reduction purposes EPA seeks comments regarding its intent to reconsider the Final Determination of the Midterm Evaluation and provides two sets of factors that it intends to contemplate as it makes this decision.111 The first set of factors is directly responsive to EPA’s mandate to reduce pollution emissions, and was first enunciated by the agency in its 2012 final rule establishing emissions standards for MY2017-21 and MY2022-25 light-duty vehicles. In that rule, EPA promulgated regulations to ensure that its Midterm Evaluation reviewing the appropriateness of the MY2022-25 standards would fulfill the purpose of section 202(a)(1) and (2).112 The regulations establishing the MTE process explicitly delineate the factors the agency will consider to determine the appropriateness of the standards, including their “feasibility and practicability”; the “impact of the standards on reduction of emissions, oil conservation, energy security, and fuel savings by consumers”; and the “cost on the producers or purchasers of new motor vehicles or new motor vehicle engines.”113 EPA’s authority flows directly—and solely—from Congress’s direction to the Agency to address harmful emissions from vehicles under Section 202 of the Clean Air Act. The Section 202 standards must reflect the factors relevant to fulfilling the Agency’s obligations under the Act. Reducing emissions that endanger public health and welfare is the paramount purpose of Section 110 Draft TAR at ES-2. 111 EPA 2017 Request for Comment, 82 Fed. Reg. at 39,551. 112 2012 Final Rule; 40 CFR 86.1818—12(h)(1). 113 Id.
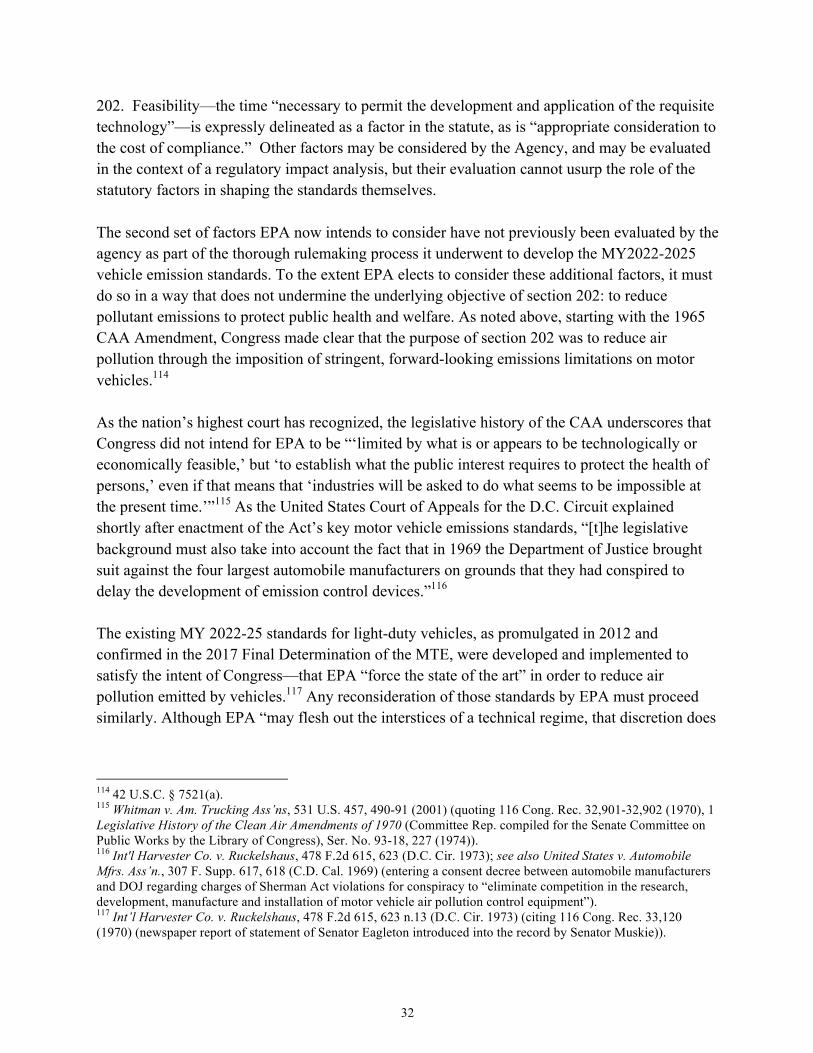
32
202. Feasibility—the time “necessary to permit the development and application of the requisite technology”—is expressly delineated as a factor in the statute, as is “appropriate consideration to the cost of compliance.” Other factors may be considered by the Agency, and may be evaluated in the context of a regulatory impact analysis, but their evaluation cannot usurp the role of the statutory factors in shaping the standards themselves. The second set of factors EPA now intends to consider have not previously been evaluated by the agency as part of the thorough rulemaking process it underwent to develop the MY2022-2025 vehicle emission standards. To the extent EPA elects to consider these additional factors, it must do so in a way that does not undermine the underlying objective of section 202: to reduce pollutant emissions to protect public health and welfare. As noted above, starting with the 1965 CAA Amendment, Congress made clear that the purpose of section 202 was to reduce air pollution through the imposition of stringent, forward-looking emissions limitations on motor vehicles.114 As the nation’s highest court has recognized, the legislative history of the CAA underscores that Congress did not intend for EPA to be “‘limited by what is or appears to be technologically or economically feasible,’ but ‘to establish what the public interest requires to protect the health of persons,’ even if that means that ‘industries will be asked to do what seems to be impossible at the present time.’”115 As the United States Court of Appeals for the D.C. Circuit explained shortly after enactment of the Act’s key motor vehicle emissions standards, “[t]he legislative background must also take into account the fact that in 1969 the Department of Justice brought suit against the four largest automobile manufacturers on grounds that they had conspired to delay the development of emission control devices.”116 The existing MY 2022-25 standards for light-duty vehicles, as promulgated in 2012 and confirmed in the 2017 Final Determination of the MTE, were developed and implemented to satisfy the intent of Congress—that EPA “force the state of the art” in order to reduce air pollution emitted by vehicles.117 Any reconsideration of those standards by EPA must proceed similarly. Although EPA “may flesh out the interstices of a technical regime, that discretion does
114 42 U.S.C. § 7521(a). 115 Whitman v. Am. Trucking Ass’ns, 531 U.S. 457, 490-91 (2001) (quoting 116 Cong. Rec. 32,901-32,902 (1970), 1 Legislative History of the Clean Air Amendments of 1970 (Committee Rep. compiled for the Senate Committee on Public Works by the Library of Congress), Ser. No. 93-18, 227 (1974)). 116 Int'l Harvester Co. v. Ruckelshaus, 478 F.2d 615, 623 (D.C. Cir. 1973); see also United States v. Automobile Mfrs. Ass’n., 307 F. Supp. 617, 618 (C.D. Cal. 1969) (entering a consent decree between automobile manufacturers and DOJ regarding charges of Sherman Act violations for conspiracy to “eliminate competition in the research, development, manufacture and installation of motor vehicle air pollution control equipment”). 117 Int’l Harvester Co. v. Ruckelshaus, 478 F.2d 615, 623 n.13 (D.C. Cir. 1973) (citing 116 Cong. Rec. 33,120 (1970) (newspaper report of statement of Senator Eagleton introduced into the record by Senator Muskie)).
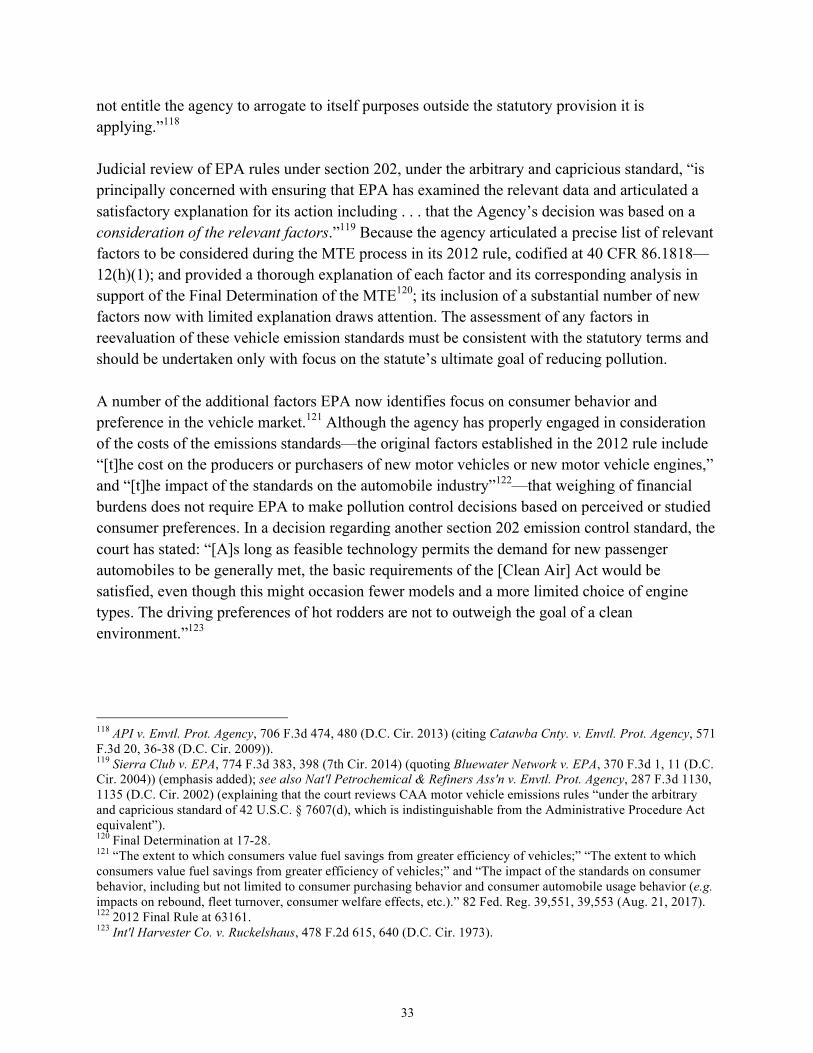
33
not entitle the agency to arrogate to itself purposes outside the statutory provision it is applying.”118 Judicial review of EPA rules under section 202, under the arbitrary and capricious standard, “is principally concerned with ensuring that EPA has examined the relevant data and articulated a satisfactory explanation for its action including . . . that the Agency’s decision was based on a consideration of the relevant factors.”119 Because the agency articulated a precise list of relevant factors to be considered during the MTE process in its 2012 rule, codified at 40 CFR 86.1818—12(h)(1); and provided a thorough explanation of each factor and its corresponding analysis in support of the Final Determination of the MTE120; its inclusion of a substantial number of new factors now with limited explanation draws attention. The assessment of any factors in reevaluation of these vehicle emission standards must be consistent with the statutory terms and should be undertaken only with focus on the statute’s ultimate goal of reducing pollution. A number of the additional factors EPA now identifies focus on consumer behavior and preference in the vehicle market.121 Although the agency has properly engaged in consideration of the costs of the emissions standards—the original factors established in the 2012 rule include “[t]he cost on the producers or purchasers of new motor vehicles or new motor vehicle engines,” and “[t]he impact of the standards on the automobile industry”122—that weighing of financial burdens does not require EPA to make pollution control decisions based on perceived or studied consumer preferences. In a decision regarding another section 202 emission control standard, the court has stated: “[A]s long as feasible technology permits the demand for new passenger automobiles to be generally met, the basic requirements of the [Clean Air] Act would be satisfied, even though this might occasion fewer models and a more limited choice of engine types. The driving preferences of hot rodders are not to outweigh the goal of a clean environment.”123
118 API v. Envtl. Prot. Agency, 706 F.3d 474, 480 (D.C. Cir. 2013) (citing Catawba Cnty. v. Envtl. Prot. Agency, 571 F.3d 20, 36-38 (D.C. Cir. 2009)). 119 Sierra Club v. EPA, 774 F.3d 383, 398 (7th Cir. 2014) (quoting Bluewater Network v. EPA, 370 F.3d 1, 11 (D.C. Cir. 2004)) (emphasis added); see also Nat'l Petrochemical & Refiners Ass'n v. Envtl. Prot. Agency, 287 F.3d 1130, 1135 (D.C. Cir. 2002) (explaining that the court reviews CAA motor vehicle emissions rules “under the arbitrary and capricious standard of 42 U.S.C. § 7607(d), which is indistinguishable from the Administrative Procedure Act equivalent”). 120 Final Determination at 17-28. 121 “The extent to which consumers value fuel savings from greater efficiency of vehicles;” “The extent to which consumers value fuel savings from greater efficiency of vehicles;” and “The impact of the standards on consumer behavior, including but not limited to consumer purchasing behavior and consumer automobile usage behavior (e.g. impacts on rebound, fleet turnover, consumer welfare effects, etc.).” 82 Fed. Reg. 39,551, 39,553 (Aug. 21, 2017). 122 2012 Final Rule at 63161. 123 Int'l Harvester Co. v. Ruckelshaus, 478 F.2d 615, 640 (D.C. Cir. 1973).
34
A newly-identified factor in EPA’s request for comment is “[t]he availability of realistic technological concepts for improving efficiency in automobiles that consumers demand.”124 As discussed previously, the purpose of section 202 is not to develop standards based on unknowable predictions of vehicle popularity—it is to require automakers to decrease the emissions of the vehicles they offer on the market in order to address air pollution that endangers public health and welfare. Like other core Clean Air Act provisions, Section 202 is designed to protect third parties from the harms caused by polluting activities. That central thrust may not be diluted by resort to uncertain and manipulable claims asserting consumer preferences for relatively high-polluting cars. Another of the new factors on which EPA invited comment is: “The ability for OEMs to incorporate fuel saving technologies, including those with ‘negative costs,’ absent the standards.”125 Section 202 of the CAA mandates that EPA develop and implement vehicle standards for the “emission of any air pollutant” which causes or contributes to “air pollution, which may reasonably be anticipated to endanger public health or welfare.”126 Since greenhouse gases fit within the CAA definition of air pollutant, EPA must promulgate emission standards accordingly.127 The ability or willingness of an auto manufacturer to voluntarily incorporate technologies that reduce greenhouse gases in the absence of regulation—although, of course, encouraging—is not relevant to the appropriateness of EPA’s MY2022-25 emission standards for light-duty vehicles.
b. EPA’s existing, well-documented findings on consumer behavior support the appropriateness of MY2022-2025 standards
EPA comprehensively addressed relevant issues relating to consumer acceptance of fuel economy and GHG reduction technologies in the draft TAR, Proposed Determination, and January 2017 Final Determination. Issues there addressed include effects of the standards on vehicle sales, consumer response to the standards, impacts of the standards on vehicle affordability, and evidence — or lack thereof — of adverse effects on consumer welfare. As EPA recognized, its standards lead to substantial savings for consumers. Just one of the compelling findings with respect to consumer benefits was that families that purchase a new vehicle in 2025 are expected to save a net $1,650 over the lifetime of that vehicle compared to a vehicle just 3 years older—and possibly much more.128 Families purchasing on credit would
124 EPA 2017 Request for Comment, 82 Fed. Reg. at 39,551, 39,553. 125 EPA 2017 Request for Comment, 82 Fed. Reg. at 39,553. 126 42 U.S.C. § 7521(a)(1). 127 See Massachusetts v. EPA, 549 U.S. 497, 528 (2007). 128 Proposed Determination at E-6.

35
expect to see immediate payback: the increased load cost attributable to control technologies would be more than offset in the first year by fuel savings.129 Meanwhile, the agency concluded that there is “little, if any, evidence that consumers have experienced adverse effects from the standards.”130 Likewise, the agency did not find “any evidence that the technologies used to meet the standards have imposed ‘hidden costs’ in the form of adverse effects on other vehicle attributes.”131 Nor did EPA identify “significant effects on vehicle affordability.”132 Given the ten years of lead-time provided to achieve the MY 2022-2025 standards, EPA reasonably expected “that any effects of the standards on the vehicle market will be small relative to market responses to broader macroeconomic conditions.”133 As with all other aspects of the Final Determination, there is no evidence that there have been any changes in facts or circumstances that would justify a change of position.
Reasoned decision making requires that EPA acknowledge and comprehensively take into account and discuss its existing, well-documented and reasoned findings regarding consumer acceptance, in which case it should reach the identical conclusion: there is no evidence on this issue that would justify a finding that the MY 2022-2025 standards are inappropriate.
i. EPA standards save consumers money Strong fuel economy and GHG standards for passenger cars benefit consumers by saving them money at the pump. Because of the savings, consumers are demanding more efficient models and automakers are delivering them. And more efficient models in the new car market leads to more efficient options in the used car market, helping low-income families save money on fuel as well.
The current light-duty vehicle standards are already saving consumers money at the pump. For example, each F-150 bought in 2015 will use about 180 fewer gallons of gas a year than prior models, and will save its owner eight trips to the gas station and $300 to $700 per year, depending on the price of fuel.134
And the 2022-2025 standards will provide even greater savings – allowing families who purchase a new vehicle in 2025 to save a net $1,650 over the lifetime of that vehicle compared to
129 Proposed Determination at E-6. 130 Proposed Determination at 27. 131 Proposed Determination at A-27. 132 Proposed Determination at 28. 133 Final Determination at 25; see also Proposed Determination at 51-52. 134 BlueGreen Alliance, Combating Climate Change 426,000 Pickup Trucks At a Time, (June 2016) available at https://www.bluegreenalliance.org/resources/combating-climate-change-426000-pickup-trucks-at-a-time/ (last accessed Oct. 4, 2017).
36
a vehicle just 3 years older.135 Further, the savings could double depending on future oil prices. And the nearly 86 percent of Americans who finance their vehicles with a 5-year loan are expected to realize the cost savings within the first year.136 Over the life of the entire Clean Cars program, the fuel cost savings to American families and businesses will add up to $1.7 trillion,137 which is more than double the funds injected into the economy by the American Recovery and Reinvestment Act (aka, the stimulus package).138 When businesses reduce fuel costs, it allows them to invest more money and create more jobs in local communities.
Because of these fuel cost savings, consumers continue to rate fuel economy as one of their top criteria when shopping for a new car139 – 81 percent said they support the Clean Car standards.140 And consumers have more choices in fuel-efficient models across the fleet today (see Figure 3 below). There are more than twice as many SUV models that achieve 25 mpg or more in MY 2016 than there were in MY 2011. The number of car models, where at least one variant has a combined city/highway label fuel economy of at least 30 mpg, has grown from 39 models in MY 2011 to more than 70 models in MY2016. There are 18 MY2016 pickup and minivan/van models for which at least one variant of the model has a combined city/highway label fuel economy rating of 20 mpg or more.141
135 Proposed Determination at E-6. 136 Id. 137 EPA Regulatory Announcement. 138 Congressional Budget Office, Estimated Impact of the American Recovery and Reinvestment Act on Employment and Economic Output from October 2011 Through December 2011 (Feb. 2011) available at http://www.cbo.gov/sites/default/files/cbofiles/attachments/02-22-ARRA.pdf (last accessed Oct. 4, 2017). 139Despite Cheap Gas, Fuel Efficiency Still a Primary Concern, JD Power (Jan. 14, 2015) available at http://www.jdpower.com/press-releases/2015-us-avoider-study (last accessed Oct. 4, 2017). 140 Jack Gillis et al., Automakers Are on the Road to Meeting Fuel Efficiency Standards: An Analysis of Automaker Progress in Meeting 2025 Fuel Efficiency Requirements and A Look At Consumer Attitudes Towards Fuel Efficiency, Consumer Federation of America, (April 25, 2016) available at http://consumerfed.org/wp-content/uploads/2016/04/2016-Fuel-Economy-Report-April-25-2016.pdf (last accessed Oct. 4, 2017). 141 EPA, Light-Duty Automotive Technology, Carbon Dioxide Emissions, and Fuel Economy Trends: 1975–2015 (Dec. 2015) available at https://www3.epa.gov/otaq/fetrends-complete.htm https://www.epa.gov/sites/production/files/2016-11/documents/420s16001.pdf (last accessed Oct 3, 2017) [hereinafter EPA 2015 Trends Report].
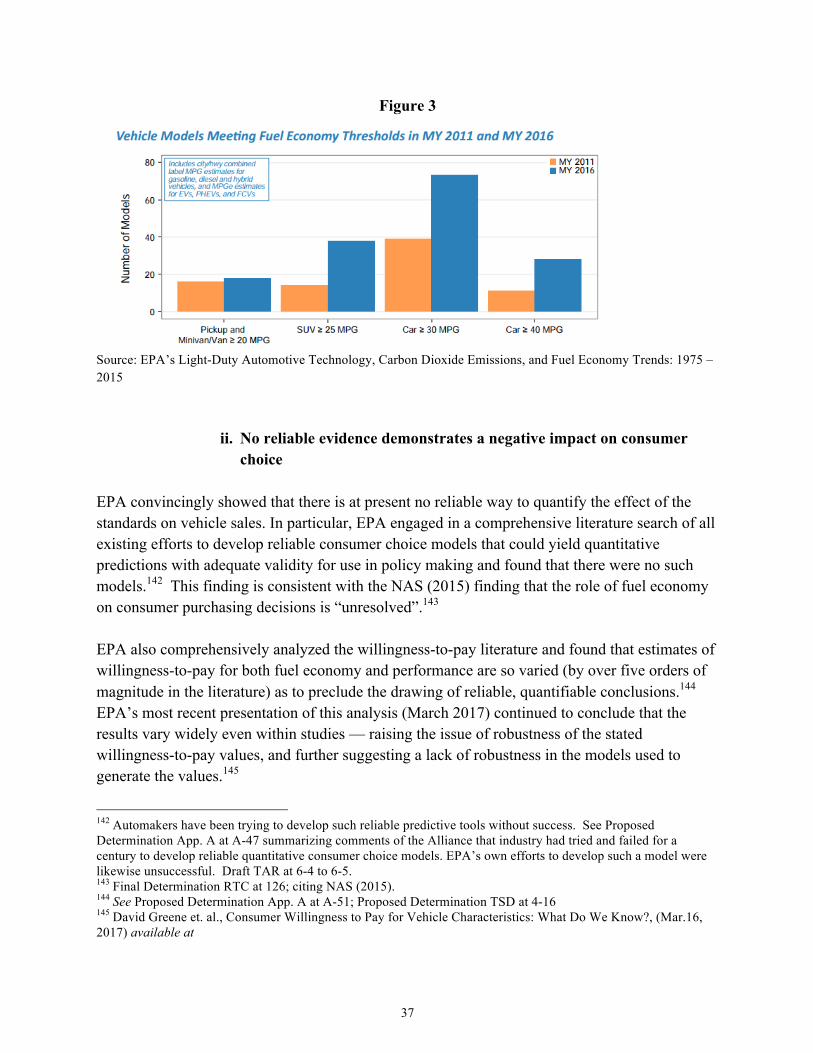
37
Figure 3
Source: EPA’s Light-Duty Automotive Technology, Carbon Dioxide Emissions, and Fuel Economy Trends: 1975 – 2015
ii. No reliable evidence demonstrates a negative impact on consumer
choice EPA convincingly showed that there is at present no reliable way to quantify the effect of the standards on vehicle sales. In particular, EPA engaged in a comprehensive literature search of all existing efforts to develop reliable consumer choice models that could yield quantitative predictions with adequate validity for use in policy making and found that there were no such models.142 This finding is consistent with the NAS (2015) finding that the role of fuel economy on consumer purchasing decisions is “unresolved”.143 EPA also comprehensively analyzed the willingness-to-pay literature and found that estimates of willingness-to-pay for both fuel economy and performance are so varied (by over five orders of magnitude in the literature) as to preclude the drawing of reliable, quantifiable conclusions.144 EPA’s most recent presentation of this analysis (March 2017) continued to conclude that the results vary widely even within studies — raising the issue of robustness of the stated willingness-to-pay values, and further suggesting a lack of robustness in the models used to generate the values.145
142 Automakers have been trying to develop such reliable predictive tools without success. See Proposed Determination App. A at A-47 summarizing comments of the Alliance that industry had tried and failed for a century to develop reliable quantitative consumer choice models. EPA’s own efforts to develop such a model were likewise unsuccessful. Draft TAR at 6-4 to 6-5. 143 Final Determination RTC at 126; citing NAS (2015). 144 See Proposed Determination App. A at A-51; Proposed Determination TSD at 4-16 145 David Greene et. al., Consumer Willingness to Pay for Vehicle Characteristics: What Do We Know?, (Mar.16, 2017) available at
38
EPA found no evidence of consumer acceptance issues for conventional, non-electrified technologies, which form the overwhelming majority of the compliance path posited convincingly by EPA for the MY 2022-2025 standards.146 There also is evidence of increased consumer acceptance of electrification based strategies (strong hybrid, PHEV, and BEV vehicles),147 but because the Final Determination is not premised on compliance pathways necessitating any significant production of such electrified vehicles, the issue of acceptance of a significantly broader use of electrification is not pertinent to the reasonableness of EPA’s finding of standard appropriateness. That said, the flood of announcements from major manufacturers — Ford and GM being the latest — of plans to electrify either some or all of their light-duty fleets strongly suggests that manufacturers believe there will be broad consumer acceptance of the technology, and do not view the technology as generating consumer resistance.148 EPA concluded that to date there is no evidence that the standards have had a negative impact on light-duty vehicle sales.149 This is consistent with market trends—where industry has just experienced seven successive years of greatest sales ever.150 In addition, new vehicle prices have remained flat in recent years after adjusting for inflation and quality.151 Because the record shows no evidence of any impediment to sales, EPA reasonably concluded that there was no reliable way to make reasoned quantitative estimates of the effect of the standards on fleet turnover.152 Some commenters suggest that the “energy paradox” or “efficiency gap”— consumers’ failure to adopt efficiency technologies notwithstanding these technologies net financial benefits—must mean that there are some hidden cost that are preventing adoption, which EPA failed to account for. But there are multiple potential reasons for the energy paradox that do not require hypothesizing an unidentified hidden, countervailing cost, as EPA has reasonably noted. These reasons include, on the consumer side: lack of adequate information necessary to estimate the value of future fuel savings; mistaken valuation or uncertainty in calculating future fuel savings; a focus on attributes conveying visible status rather than invisible efficiency; and (pre-standards), a lack of available fuel efficient options among vehicles (like SUVs) having other desirable attributes.153 On the producer side, reasons for the efficiency gap include hesitation to be a first
https://benefitcostanalysis.org/sites/default/files/public/C3.1%20Helfand%20et%20al%20WTP%20for%20veh%20char%2020170323.pdf (last accessed Oct. 4, 2017). 146 Draft TAR p. 6-13; Proposed Determination App. A at A-56. 147 Proposed Determination, App. A at A-63 to A-65. 148 For example see https://www.eenews.net/greenwire/stories/1060062413/feed (last visited October 4, 2017). 149 Proposed Determination App. A at A-27. 150 Garcia, Car Sales Set Another U.S. Record, supra note 81. 151Final Determination RTC at 136. 152 Final Determination RTC at 137. 153 Draft TAR at 6-6; 77 Fed. Reg. at 62,914.
39
mover in investing in a new technology; the related desire of manufacturers to wait until a technology is further along the learning curve; and another related desire of manufacturers to work on the same technologies at the same time to benefit from the arising research synergies.154 The agency’s notice suggests that the EPA is reconsidering the issue of “consumer welfare effects, etc.”155 The record again reflects the copious, reasoned consideration EPA has already given this issue. The agency concluded that it had found no evidence of a so-called hidden cost to the standards.156 It is clear that consumers value fuel economy, although estimates of how much vary widely.157 The NAS reached the same conclusion that the range of potential values for consumer willingness to pay for fuel economy is so varied as to preclude easy generalizations as to how much.158 EPA already included in its cost estimates the cost of holding all vehicle attributes, including performance, constant in the presence of the added GHG reduction technologies.159 Beyond this already accounted for cost, there is no evidence that the standards have had, or will have, an adverse effect on other vehicle attributes.160 Most importantly—as discussed above—fuel savings far exceed increased expenditures for the emission control technology, so there is a direct, positive welfare benefit to consumers of new light duty vehicles.
iii. The vehicle standards have no discernable negative effect on vehicle affordability
EPA also closely examined the impacts of the standards on vehicle affordability. EPA found, with ample record support, that the standards did not have discernible negative impacts on lower-income households, on the used vehicle market, did not limit access to credit, and had not decreased availability of low-priced vehicles.161 In particular, lower-income households are more affected by prices of used rather than new vehicles, and, although any effect of the standards on used vehicle prices is swamped by macro-economic factors, the payback period for price increases reflecting GHG emission reduction technology is less than for new vehicles given the depreciated price of a used vehicle but the constant performance of the emission reduction technology.162 In addition, used car market prices have remained flat.163 Consumer loans for
154 Draft TAR at 6-7. As noted below, one benefit of the standards is to eliminate these producer-side issues. 155 82 Fed. Reg. at 39,553. 156 Final Determination RTC at 127. 157 Final Determination RTC at 124. 158 See Final Determination RTC at 126; NAS (2015) at 318. 159 Final Determination RTC at 129; Proposed Determination App. A at A-49 and A-50. 160 Proposed Determination App. A section B.1.4. 161 See generally Proposed Determination TSD at sec. 4.3.3. 162 Proposed Determination TSD at 4-49 and 4-47; Proposed Determination, App. A at A-79. 163 Proposed Determination TSD at Fig. 4-26.
40
new vehicles remain widely available, and importantly, if consumers were to buy a new vehicle with standard five-year financing, the payback period (with gasoline at pre-hurricane Harvey prices) would be less than one year.164
Strong fuel economy and GHG standards indeed provide a strong co-benefit to used-vehicle purchasers by providing them with more efficient choices. When fuel prices become suppressed, new vehicle purchases can skew towards less efficient vehicles, and when fuel prices are high they tend to purchase relatively more fuel-efficient vehicles. This pattern has important consequences for the used vehicle market, where the supply of each model and vintage is largely determined by the past choices of new-vehicle purchasers, and the supply of a particular used vehicle model is essentially inelastic. That is, the choices of today’s new-vehicle purchasers will determine which vehicles are available to tomorrow’s used vehicle purchasers, and determine the fuel economy of the fleet for many years after the original purchase date. Strong fuel economy and GHG standards lead automakers to offer more diverse sets of products, including more efficient models,165 which will have the co-benefit of increasing the supply of fuel-efficient used vehicles available for purchase. To the extent that low-income consumers are more likely to purchase a used vehicle, more efficient used vehicle choices will help save low-income families more money at the pump.
iv. EPA fully accounted for vehicle performance Other commenters argued that there was a specific hidden consumer welfare cost to the standards in the form of decreased performance. Notwithstanding that EPA already estimated the cost of holding performance in its cost estimates for the MY2022-2025 standards166, this argument contends that there would be still more performance added but for the standards, and that this lost performance is a consumer welfare loss not accounted for in the agency’s cost estimates. The asserted engineering basis for this argument is that there is a necessary tradeoff between fuel economy/GHG emission reduction and performance (acceleration in particular). Some of the commenters supported their arguments by pointing to consumer willingness to pay studies, maintaining that these studies show a greater willingness of consumers to pay for increased performance than for fuel economy, confirming a hidden cost to the standards not reflected in EPA’s cost estimates. The record convincingly refutes these arguments. Most particularly, the historic tradeoff between performance and fuel economy is far less likely to hold for advanced technology
164 Proposed Determination TSD at 4-50. 165 Meghan R. Busse et. al., Who is Exposed to Gas Prices? How Gasoline Prices Affect Automobile Manufacturers and Dealerships, 14 QUANTITATIVE MARKETING & ECONOMICS, 41-96 (Mar. 2016) available at https://dspace.mit.edu/handle/1721.1/103416 (last accessed Oct. 3, 2017). 166 See , e.g. Proposed Determination App. A at A-58.
41
engines.167 EPA’s reasoned conclusion is that “the assumption in the previous research that the tradeoffs among acceleration, fuel economy, and weight are constant does not appear to accurately represent the new technologies, and in fact may substantially overestimate the magnitude of the performance-fuel economy tradeoff.”168 Thus, “fuel economy and other vehicle attributes are not mutually exclusive, so there is no necessary tradeoff between fuel economy and other vehicle attributes.”169 And EPA has already included the cost of preserving both.170 The studies submitted to the record purporting to show a hidden cost of foregone increased performance reflected older engine technologies, and so failed to account for these highly relevant technology distinctions.171
v. Industry’s cited studies have been comprehensively refuted EPA, as well as many commenters, also showed that the report of the Center for Automotive Research (CAR), which was relied upon in comments of many manufacturers and the National Automobile Dealers Association and which makes quantified predictions of MY 2025 standards on sales and industry employment, was deeply flawed and not credible. Among other things, the CAR report bases predictions on a 25-year old study reflecting unreformed CAFE and therefore assumed a compliance strategy of changing sales mix without changing vehicle content, assumed arbitrary price increases for vehicles well beyond credible bounds because it was not based on any technology-based analysis, and erroneously assumed that average price of vehicles is based only on historic trends and not market forces.172 Earlier comments that EDF already submitted detail many of the same deficiencies, and several additional ones, including an improper regression analysis, failure to provide evidence of model validation, and an improper comparison of elasticity of volume expenditures with respect to price and sales volume with respect to price.173 We hereby incorporate those comments in full (See Attachment E).
167 See, in particular, Proposed Determination TSD at 2-248 and 2-249 showing that gasoline direct-injection engines and turbo downsized engines have much flatter trade off curves than the older, port-fueled engines. 168 Proposed Determination, App. A, at 4-6. 169 Final Determination RTC at 127. 170 Id. 171 A recent paper addressing this issue, Leard, Linn, and Zhou, “How Much Do Consumers Value Fuel Economy and Performance” (2017) likewise assumes that there is a necessary tradeoff between fuel economy improvement and performance, basing this conclusion on Knittel (2011) and Klier and Linn (2016) which studies did not account for the difference in more advanced engine technologies and performance. See Proposed Determination App. A at 4-6. In addition, Leard et al. (2017) acknowledges that their analysis omits any valuation of standard-based innovation. Id. at 27. 172 Final Determination RTC at 126-127; Proposed Determination TSD at 4-17 to 4-18. 173 EDF Supplemental Comments submitted to EPA and NHTSA on the Proposed Determination in response to “Corrections and clarifications to the various references to the Center for Automotive Research’s The Potential Effects of the 2017-2025 EPA/NHTSA GHG/Fuel Economy mandates on the U.S. Economy” as found on pp. A-41 through A-42; A-80 and A-87 and the Technical Support Document, pp. 4-17 through 4-20.” (Submitted Jan. 11, 2017) to Docket EPA-HQ-OAR-2015-0827.
42
Another study sponsored by the Alliance of Automobile Manufacturers, conducted by a group of authors at Indiana University (hereafter “IU study”), found net economic long-run benefits from a combination of state and federal vehicle efficiency, greenhouse gas, and zero emissions vehicle (ZEV) programs. Yet despite these findings, the authors made a case for weakening vehicle standards based on their estimates of negative vehicle sales and short-term job losses.174 A recent critique by Synapse Energy Economics found that modest corrections to the IU study’s data and methodology would lead to the opposite conclusion – strong economic gains and favorable cost-benefit ratios, from existing vehicle standards. For example, the IU study overestimates the value of car loan interest rates, uses inconsistent discount rates that are far higher than the standard, and completely fails to account for the benefits of greenhouse gas reductions despite the rule being a GHG-reducing policy.175 Adjusting for these errors, the IU study should have concluded that the light-duty GHG standards will lead to strong economic gains.
vi. The record demonstrates that the standards have important non-monetized benefits
The GHG standards have important benefits that are not included as monetized benefits in EPA’s analysis. These include technology innovations that would not occur in the absence of the standards.176 The standards remove several producer-side disincentives — fear of being a first mover, waiting for technologies to benefit from others’ learning by doing, and synergistic common research efforts — which contribute to market failures and underinvestment in efficient technologies.177 The rule’s incentive to generate credits also contributes to the burst of innovation that marked the advent of the light-duty GHG standards.178 These innovations have been accompanied by collateral benefits for consumers in many instances, among them improved braking and handling (mass reduction), greater corrosion resistance (mass reduction), improved launch feel from advanced transmissions, greater passenger comfort from reduced cabin warm-up times (head-integrated exhaust manifolds), and better lighting intensity and direction for headlights (LED headlights).179 There are also very important additional benefits of the standards that are not monetized as such in EPA’s analysis, such as increased global competitiveness due to the on-going incentive to innovate created by the standards, and
174 Sanjay Carley, Denvil Duncan, John D. Graham, Saba Siddiki, and Nikolaos Zirogiannis, “A Macroeconomic Study of Federal and State Automotive Regulations”, Indiana University School of Public and Environmental Affairs, March 2017. Automotive industry sponsorship is recognized in the acknowledgments on the study’s title page. Minor corrections to some calculations, released by the authors after the March 2017 publication, do not affect their overall conclusions. 175 Comments submitted to the Docket by Synapse Energy Economics, Inc on October 4th, 2017. 176 See generally Draft TAR sec. 4.1.3. 177 Proposed Determination, App. A, at A-39. 178 Proposed Determination TSD at 4-9. 179 Proposed Determination TSD at 4-11- 4-12.
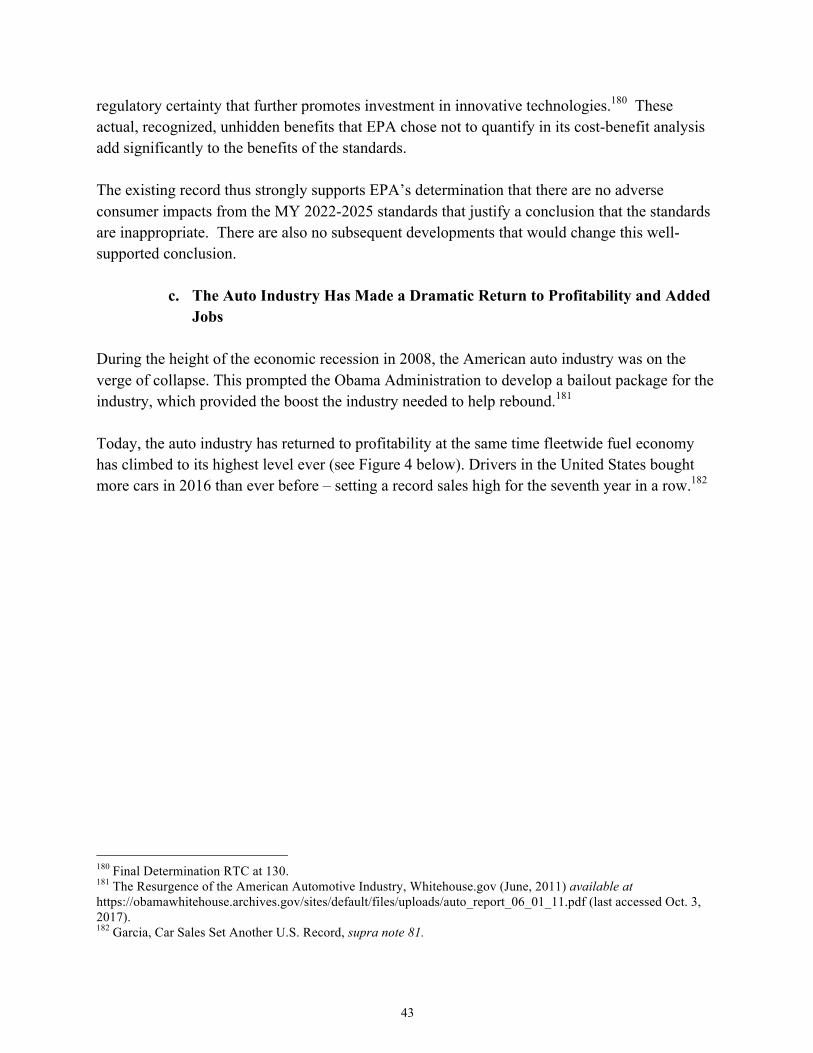
43
regulatory certainty that further promotes investment in innovative technologies.180 These actual, recognized, unhidden benefits that EPA chose not to quantify in its cost-benefit analysis add significantly to the benefits of the standards.
The existing record thus strongly supports EPA’s determination that there are no adverse consumer impacts from the MY 2022-2025 standards that justify a conclusion that the standards are inappropriate. There are also no subsequent developments that would change this well-supported conclusion.
c. The Auto Industry Has Made a Dramatic Return to Profitability and Added Jobs
During the height of the economic recession in 2008, the American auto industry was on the verge of collapse. This prompted the Obama Administration to develop a bailout package for the industry, which provided the boost the industry needed to help rebound.181 Today, the auto industry has returned to profitability at the same time fleetwide fuel economy has climbed to its highest level ever (see Figure 4 below). Drivers in the United States bought more cars in 2016 than ever before – setting a record sales high for the seventh year in a row.182
180 Final Determination RTC at 130. 181 The Resurgence of the American Automotive Industry, Whitehouse.gov (June, 2011) available at https://obamawhitehouse.archives.gov/sites/default/files/uploads/auto_report_06_01_11.pdf (last accessed Oct. 3, 2017). 182 Garcia, Car Sales Set Another U.S. Record, supra note 81.
44
Figure 4
Source: Created by EDF from data available from Wards Auto183 and the EPA Fuel Economy Trends Report184
During its return to profitability the auto industry also added jobs. Since the recession, overall job growth in the industry has been strong, aiding a recovery of domestic manufacturing as a whole. The U.S. auto industry has added nearly 700,000 direct jobs since the low point of the recession in mid-2009 – and these jobs support several million indirect jobs throughout the economy.185 The growth in direct jobs includes more than 300,000 added jobs in motor vehicle and parts manufacturing and 380,000 added jobs at auto dealers.186 This brings total manufacturing employment in the industry to 930,000 – representing nearly 50 percent growth since 2009, and bringing employment at auto and parts dealers to 2 million, which is its highest level ever. Indeed, auto-manufacturing jobs accounted for 40 percent of all net jobs added in U.S. manufacturing since the recession.187 183 See Data Center, WARD’S AUTO, available at http://www.WardsAuto.com/data-center (last visited Oct. 4, 2017) (including datasets on U.S. light vehicle sales). 184 See 2016 Fuel Economy Trends Report, supra n.96. 185 BlueGreen Alliance, Supplying Ingenuity II: U.S. Suppliers of Key Clean, Fuel-Efficient Vehicle Technologies, at 5 (May 2017), available at https://www.bluegreenalliance.org/resources/supplying-ingenuity-ii-u-s-suppliers-of-key-clean-fuel-efficient-vehicle-technologies/ (citing underlying data from U.S. Bureau of Labor Statistics, https://www.bls.gov/iag/tgs/iagauto.htm). 186 Id.; BlueGreen Alliance, Backgrounder: Sound Vehicle Standards & Policies Drive Strong Job Growth (June 2016), available at https://www.bluegreenalliance.org/resources/sound-vehicle-standards-policies-drive-strong-job-growth/ (last accessed Oct. 3, 2017). 187 Id.
45
A recent study by the BlueGreen Alliance found that nationwide, there are over 1,200 facilities in 48 states specifically building the technology that increases fuel economy and cuts emissions.188 And those facilities support hundreds of thousands of manufacturing jobs – including nearly 100,000 in Michigan and Ohio alone.189 For example, Ford’s F-150, one of the best-selling pickup trucks in America, has led to additional jobs across the automotive supply chain. Ford reports that the MY2015 F-150 is more powerful than earlier models.190 It also gets an average of 21 percent better fuel economy and uses 17 percent less fuel compared to 2010 models that were built before the current standards took effect.191 The fuel economy savings from just the new F-150s sold since 2011 save 5 million barrels of oil a year and cut carbon emissions by 2.3 million metric tons.192 As part of achieving the first phase in fuel economy standards, Ford developed and deployed a number of new technologies, including its “EcoBoost” line of redesigned engines. And for the second phase of standards Ford is using innovative design and materials—advanced high-strength steels and high-strength military-grade aluminum—to make its F-150 lighter and stronger. Emissions gains have also come from suppliers of more efficient components, like advanced electrical steering (EPS) systems. An analysis by the BlueGreen Alliance summarized some of the jobs that Ford has supported through its innovation in the F-150.193
• Cleveland, Ohio: Ford’s Engine Plant No. 1 employs 1,600 people • Saginaw County, Michigan: Nexteer, supplier of EPS system, employs 5,000 people,
largest employer in the county, after coming back from bankruptcy. • Alcoa, Tennessee: Alcoa, aluminum producer, invested $275 million and added 200 jobs
to expand its rolling mill. • Davenport, Iowa: Alcoa, invested $300 million in facility where the aluminum is further
customized to facilitate bonding between aluminum components. • Dearborn, Michigan and Kansas City: Ford’s Truck Plant and Assembly plant, invested
$1.1 billion and added 900 workers before any aluminum body trucks could roll off the line. Kansas City Assembly, represented by United Autoworkers (UAW) Local 249, currently employs 6,450 hourly employees, the highest ever since the plant opened in 1951.
188 BlueGreen Alliance, Supplying Ingenuity II, supra n.185, at 4. 189 Id. 190 BlueGreen Alliance, Combating Climate Change, supra n.134. 191 Id. 192 Id. 193 Id.

46
• Cleveland, Ohio: ArcelorMittal, steel mill, employs 1,900 people today after being mothballed in 2009.
There are also numerous other signs of economic health in the auto industry. The granting of patents by the United States Patent and Trademark Office (PTO) is often cited as a measure of inventive economic activity. The Clean Energy Patent Growth Index (CEPGI), published quarterly by the Cleantech Group at Heslin Rothenberg Farley & Mesiti P.C. provides an indication of the trend of innovative activity in the Clean Energy sector from 2002 to the present. The CEPGI tracks the granting of U.S. patents for the following sub-components: Solar, Wind, Hybrid/Electric Vehicles, Fuel Cells, Hydroelectric, Tidal/Wave, Geothermal, Biomass/Biofuels and other clean renewable energy. In 2015, Hybrid/Electric Vehicle (HEV) technologies grew more than all others with a 30 percent increase in patents over 2014. HEV technologies were granted nearly 700 patents and fuel cell technologies were awarded more than 800 patents. The majority of these patents were granted to large automakers, including Toyota, GM, Honda and Ford.194 Exports are also up. Factories in the US exported 2.1 million cars in 2015 – the highest number ever. About half of those went to Canada and Mexico, with other exports going to Asia and the Middle East.195 In fact, Honda is shipping more models out of the country than it imports.196 And some automakers are expanding production to meet greater demand abroad. Finally, there is broad support for rigorous greenhouse gas standards by the labor community. Here are some quotes in support of the Phase 2 standards: • “Finally, we urge the incoming Trump Administration and the 115th Congress to maintain
our nation’s commitment to improving fuel efficiency and reducing emissions. The basic structure and design of the One National Program was carefully constructed by a wide array of stakeholders and should be kept intact and not dramatically altered. We cannot afford to go back to the drawing board. Our competitors around the globe are working to strengthen environmental standards and it would be counterproductive to enact policies that provide disincentives for investing in advanced technologies and improving efficiency. History has taught us that a diverse fleet is essential for strong export sales and keeping jobs in the United States. Efficiency and emission standards can and must continue to be a win-win for the environment, working families, domestic manufacturing and the overall economy. The
194 Clean Energy Patent Growth Index (CEPGI) - 2015 Year in Review, CLEANTECH GROUP AT HRFM (Oct. 31, 2016), available at http://www.cepgi.com/2016/10/cepgi_2015_year_in_review.html (last accessed Oct. 4, 2017). 195 Christina Rogers, U.S. Car Exports Top 2 Million, WALL STREET JOURNAL (Feb. 5, 2015) available at https://www.wsj.com/articles/u-s-car-exports-top-2-million-1423174695 (last accessed October 4, 2017). 196 See Jeffrey N. Ross, “Honda is first Japanese carmaker to be a net-exporter from US,” AUTOBLOG (Jan. 29, 2014), available at http://www.autoblog.com/2014/01/29/honda-first-japanese-carmaker-net-exporter-from-us.
47
need to address climate change is real and urgent. We must act to protect our future and the future of our children and grandchildren. There is no scientific debate on the connection between fossil fuel consumption, rising carbon dioxide levels in the earth’s atmosphere, and climate change. Climate change is real and we ignore it at our own peril. The need for a comprehensive strategy to address climate change could not be clearer and we all have responsibility to act.” - United Auto Workers197
• “These new standards will help propel the auto industry forward by giving American
families long-term relief from volatile fuel prices. Lowering the total cost of driving will make automobiles more affordable and expand the market for new vehicles.” “The standards will also provide certainty for manufacturers in planning their investments and creating jobs in the auto industry as they add more fuel-saving technology to their vehicles. Bringing this additional content to market requires more engineers and more factory workers, expanding employment in the industry.” - Bob King, President, United Auto Workers198
• “America’s landmark fuel economy standards are working. These well-crafted standards,
working hand-in-hand with sound manufacturing policy, have shown that the nation can lead in combating climate change while rebuilding American jobs and manufacturing. These environmental and economic objectives remain critical. These standards have helped to deeply reduce carbon emissions, saved consumers money and fuel, and spurred innovation and investment across all types of vehicles and components—creating job growth and developing a more robust and innovative supply chain across the industry.” - BlueGreen Alliance199
• At a September 2017 public hearing United Steel Workers leaders urged EPA to retain strong
fuel economy standards for model year 2022-2025 light-duty cars, trucks, and SUVs to protect the jobs of thousands of Ohio workers building components for today’s rapidly innovating auto industry:
o “As president of Local 2, I represent workers building cutting-edge technologies that are helping to make our light-duty cars, trucks, and SUVs cleaner than ever. We are part of a much larger group of workers that have benefitted from these clean car standards.” Jack Hefner, President of USW Local 2 represents members in Akron at Maxion Wheels, Goodyear, and other automotive industry suppliers.200
197 https://www.regulations.gov/document?D=EPA-HQ-OAR-2015-0827-6155 198 http://region1a.uaw.org/index.cfm?action=article&articleID=941098a7-2e56-4a4c-b494-f1ef04aad585 199 https://www.bluegreenalliance.org/the-latest/bluegreen-alliance-welcomes-release-of-technical-assessment-report/ 200 https://www.bluegreenalliance.org/the-latest/congressman-ryan-joined-usw-leaders-in-akron-to-discuss-their-upcoming-testimony-in-washington-dc-on-keeping-fuel-economy-standards-and-ohio-manufacturing-strong/
48
o “Today’s fuel economy standards are proof that sound regulations can go hand in hand with making manufacturing thrive. Ohio and auto sector are proving you can build jobs while cutting pollution and enhancing energy security.” Dan Boone, President of USW Local 979 represents members at the ArcelorMittal plant in Cleveland, one of most innovative and productive steel mills in the world that makes lighter, stronger steel primarily for cleaner vehicles.201
d. Clean car standards will continue to benefit and protect automakers, parts suppliers and workers
In addition to the current robust economic health of the auto industry, there is also strong evidence that automakers and their parts suppliers will continue to make profits under the future Clean Car standards and will be better safeguarded against fuel price shocks. And market stability translates into employment stability for American autoworkers. In a 2016 analysis, Ceres forecast automaker pretax profits under 5 different fuel price scenarios under the recently affirmed 2022-2025 standards. They concluded that the top 3 U.S. manufacturers (Ford, GM and Chrysler) will be profitable under the current standards in all fuel price scenarios in the study, including the “very low” price scenario. They also found that U.S. automakers will be able to fully recover their compliance costs at any fuel price above the Energy Information Administration’s long term forecasted “low price”.202 Suppliers too stand to gain from the 2022-2025 standards. Suppliers make up a significantly larger portion of the U.S. economy and of U.S. employment than do the automakers. In April 2016, automakers employed 214,700 people in the U.S., while makers of auto parts employed 564,100 – or 2.6 times as many. Stronger standards lead to increased supplier revenue because as much as 80 percent of automaker compliance investments are paid to suppliers of fuel-saving technologies. And the regulatory certainty of maintaining the current standards is especially valuable to the suppliers making the majority of fuel-saving technology investments in research, development, and production capacity.203 In addition to supporting industry profits, studies have shown that fuel efficiency standards insulate the auto market from fuel price shocks – and that market stability translates into
201 Id. 202 Baum, Alan & Dan Luria, ANALYST BRIEF: Economic Implications of the Current National Program v. a Weakened National Program in 2022-2025 for Detroit Three Automakers and Tier One Suppliers, CERES (Jun. 27, 2016), available at https://www.ceres.org/resources/reports/economic-implications-current-national-program-v-weakened-national-program-2022. 203 Id.
49
employment stability. In a marketplace without standards, not all manufacturers produce fuel-efficient models. For example, the U.S. automakers relied heavily on less efficient vehicle lines before the Clean Car standards began in 2012. When fuel prices spike in the absence of fuel economy standards, more fuel-efficient vehicles are in greater demand, shifting demand across manufacturers and disrupting sales and employment. Recent peer-reviewed research suggests that fuel-economy and GHG standards have led U.S. automakers to offer more diverse sets of products that are competitive under a wider range of fuel prices, making them better positioned to manage significant fuel price swings.204 For autoworkers and parts manufacturing workers, strong standards safeguard the industry against negative impacts associated with unanticipated changes in the price of fuel, which could otherwise lead to layoffs and lost wages. To evaluate whether the current fuel economy and GHG standards are a cost effective hedge (i.e. a correctly priced insurance policy) against future fuel price spikes, Ceres estimated the net losses of weakened standards in the event of a price spike. The analysis concluded that profits by the three largest U.S. automakers (Ford, GM and Chrysler) from U.S. new vehicle sales would plummet more than $1 billion per year in response to fuel price shocks without the Clean Cars program.205 And because as much as 80 percent of automaker compliance costs are paid to suppliers of fuel-saving technologies, suppliers could lose up to $1.42 billion in the case of a fuel price shock. 206 This could put many American jobs at risk. Alternatively, Ceres also concluded that the U.S. automakers stand to make significant profits under the Clean Cars program, even with low fuel prices, as discussed above.207
e. Clean car standards help ensure that automakers retain their global competiveness
The Clean Car standards are essential to ensuring that the resurgence for U.S. automakers endures, and that American autoworkers have a strong position in the years ahead. The strong fuel economy and GHG standards have led U.S. automakers to offer a more diverse and more efficient set of vehicles. As a result, their fleets will remain attractive to consumers in the years ahead, even if fuel prices spike again.208 Strong fuel economy and GHG standards are essential if the American auto sector is going to keep pace with global trends. Many other nations have adopted fuel economy and GHG emissions standards through 2025 that will drive improved passenger vehicle efficiency in line with the U.S., while some nations are planning to go farther faster. This includes a range of
204 Busse et al., supra n. 165. 205 Baum et al., supra n.202. 206 Id. 207 Id. 208 Busse et. al., supra n. 165.
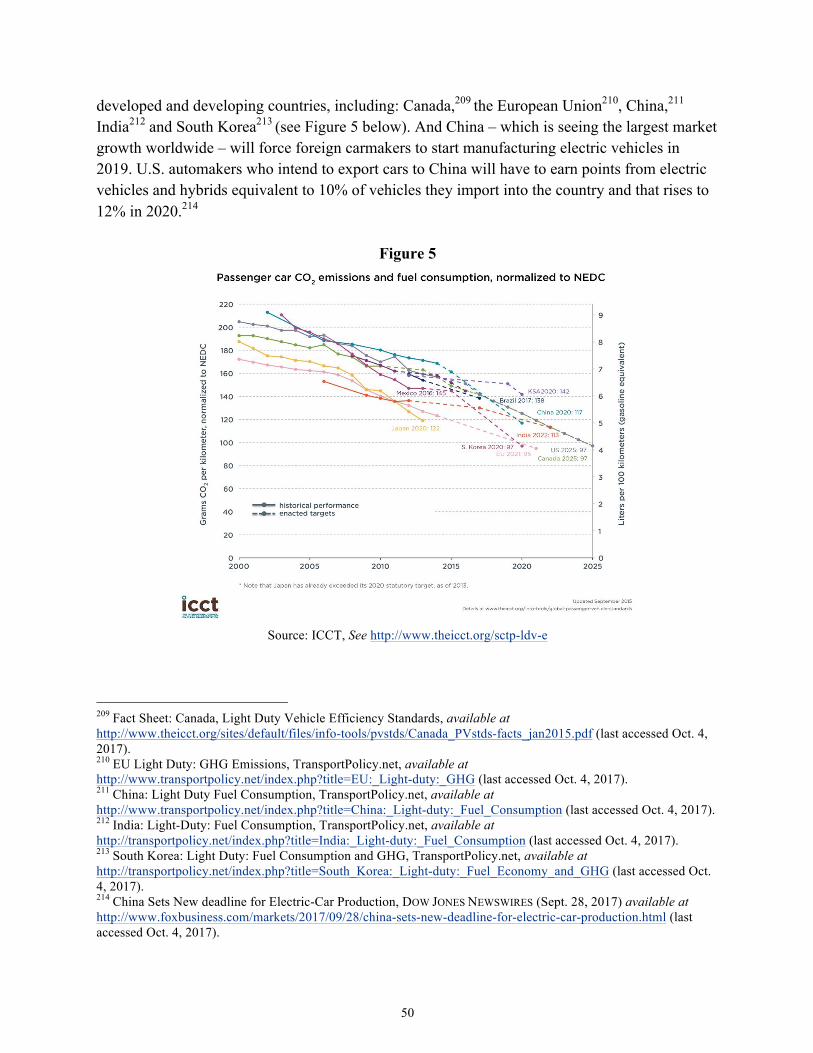
50
developed and developing countries, including: Canada,209 the European Union210, China,211 India212 and South Korea213 (see Figure 5 below). And China – which is seeing the largest market growth worldwide – will force foreign carmakers to start manufacturing electric vehicles in 2019. U.S. automakers who intend to export cars to China will have to earn points from electric vehicles and hybrids equivalent to 10% of vehicles they import into the country and that rises to 12% in 2020.214
Figure 5
Source: ICCT, See http://www.theicct.org/sctp-ldv-e
209 Fact Sheet: Canada, Light Duty Vehicle Efficiency Standards, available at http://www.theicct.org/sites/default/files/info-tools/pvstds/Canada_PVstds-facts_jan2015.pdf (last accessed Oct. 4, 2017). 210 EU Light Duty: GHG Emissions, TransportPolicy.net, available at http://www.transportpolicy.net/index.php?title=EU:_Light-duty:_GHG (last accessed Oct. 4, 2017). 211 China: Light Duty Fuel Consumption, TransportPolicy.net, available at http://www.transportpolicy.net/index.php?title=China:_Light-duty:_Fuel_Consumption (last accessed Oct. 4, 2017). 212 India: Light-Duty: Fuel Consumption, TransportPolicy.net, available at http://transportpolicy.net/index.php?title=India:_Light-duty:_Fuel_Consumption (last accessed Oct. 4, 2017). 213 South Korea: Light Duty: Fuel Consumption and GHG, TransportPolicy.net, available at http://transportpolicy.net/index.php?title=South_Korea:_Light-duty:_Fuel_Economy_and_GHG (last accessed Oct. 4, 2017). 214 China Sets New deadline for Electric-Car Production, DOW JONES NEWSWIRES (Sept. 28, 2017) available at http://www.foxbusiness.com/markets/2017/09/28/china-sets-new-deadline-for-electric-car-production.html (last accessed Oct. 4, 2017).

51
Looking past 2025, many nations have made commitments to fully phase out the combustion engine over the next couple of decades. Britain and France announced that they would end the sale of gas and diesel-powered vehicles by 2040.215 Scotland pledged to phase out new petrol and diesel cars and vans by 2032, eight years ahead of the UK target.216 India is making a vow to start selling only electric cars by 2030. The government's National Electric Mobility Mission Plan wants annual sales of electric and hybrid cars to hit 6 million to 7 million by 2020.217 Norway set a target that all new passenger cars and vans sold in 2025 should be zero-emission vehicles. The country is considered a leader in this area. About 40% of all cars sold in the country last year were electric or hybrid vehicles.218 Austria, China, Denmark, Germany, Ireland, Japan, the Netherlands, Portugal, Korea and Spain have set official targets for electric car sales.219 Any backtracking on the current 2025 standards would therefore risk leaving U.S. manufacturers behind.
IV. EPA must fully account for non-GHG benefits All of EPA and NHTSA’s recent joint GHG and fuel efficiency actions affecting light-duty and heavy-duty vehicles will also deliver important non-GHG co-benefits by reducing harmful criteria pollutants including volatile organic compounds (VOC), oxides of nitrogen (NOx), fine particulate matter (PM2.5) and sulfur oxides (SOx), as well as deadly air toxics—even beyond what is required from the parallel 2017-2025 California LEV3/US EPA Tier 3 standards. These reductions will save lives in communities across the nation as well as help states and local communities who rely on contributions from these federal programs to reach air quality attainment goals. Both NHTSA and EPA completed a careful assessment of co-benefits in the previous Phase 1 and Phase 2 joint rules and must do so for any future action. EPA has requested comment on the appropriateness of the MY2021 standards.220 As discussed at length below, EDF strongly opposes any reconsideration of the appropriateness of the MY 2021 standards as they are not at all part of the midterm evaluation. 215 Stephen Castle, Britain to Ban New Diesel and Gas Cars by 2040, N.Y. TIMES (July 26, 2017) available at https://www.nytimes.com/2017/07/26/world/europe/uk-diesel-petrol-emissions.html (last accessed Oct. 4, 2017). 216 Shehab Khan, Scotland to 'Phase Out' New Petrol and Diesel Cars by 2032, INDEPENDENT.UK, (Sept. 5, 2017) available at http://www.independent.co.uk/news/uk/politics/scotland-petrol-diesel-cars-phase-out-ban-2032-nicola-sturgeon-snp-environment-air-pollution-a7930781.html (last accessed Oct. 4, 2017). 217 Jackie Wattles, India to Sell Only Electric Cars by 2030, CNN.com (June 3, 2017) available at http://money.cnn.com/2017/06/03/technology/future/india-electric-cars/index.html?iid=EL (last accessed Oct. 4, 2017). 218 Alanna Petroff, These Countries Want to Ditch Gas and Diesel Cars (July 26, 2017) available at http://money.cnn.com/2017/07/26/autos/countries-that-are-banning-gas-cars-for-electric/index.html (last accessed Oct. 4, 2017). 219 Id.; IEA, Global EV Outlook (2017) see https://www.iea.org/publications/freepublications/publication/global-ev-outlook-2017.html (last visited October 4, 2017). 220 EPA Request for Comment, 82 Fed. Reg. at 39,553.
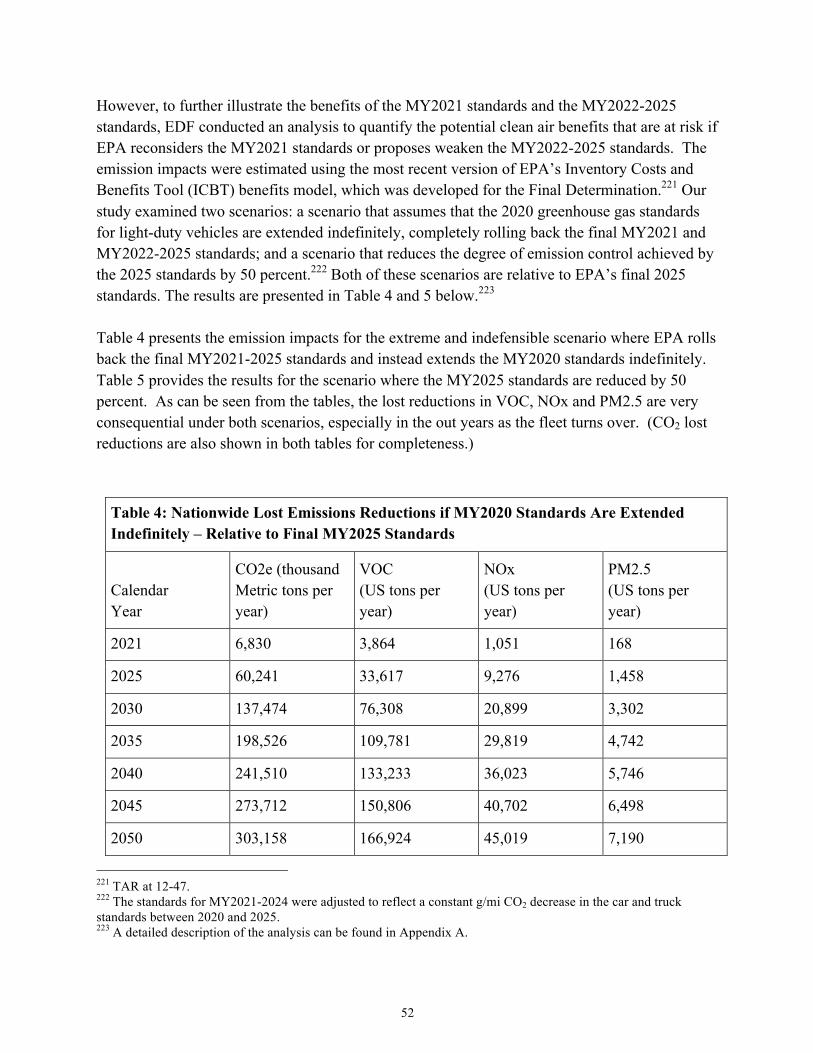
52
However, to further illustrate the benefits of the MY2021 standards and the MY2022-2025 standards, EDF conducted an analysis to quantify the potential clean air benefits that are at risk if EPA reconsiders the MY2021 standards or proposes weaken the MY2022-2025 standards. The emission impacts were estimated using the most recent version of EPA’s Inventory Costs and Benefits Tool (ICBT) benefits model, which was developed for the Final Determination.221 Our study examined two scenarios: a scenario that assumes that the 2020 greenhouse gas standards for light-duty vehicles are extended indefinitely, completely rolling back the final MY2021 and MY2022-2025 standards; and a scenario that reduces the degree of emission control achieved by the 2025 standards by 50 percent.222 Both of these scenarios are relative to EPA’s final 2025 standards. The results are presented in Table 4 and 5 below.223 Table 4 presents the emission impacts for the extreme and indefensible scenario where EPA rolls back the final MY2021-2025 standards and instead extends the MY2020 standards indefinitely. Table 5 provides the results for the scenario where the MY2025 standards are reduced by 50 percent. As can be seen from the tables, the lost reductions in VOC, NOx and PM2.5 are very consequential under both scenarios, especially in the out years as the fleet turns over. (CO2 lost reductions are also shown in both tables for completeness.)
Table 4: Nationwide Lost Emissions Reductions if MY2020 Standards Are Extended Indefinitely – Relative to Final MY2025 Standards
Calendar Year
CO2e (thousand Metric tons per year)
VOC (US tons per year)
NOx (US tons per year)
PM2.5 (US tons per year)
2021 6,830 3,864 1,051 168
2025 60,241 33,617 9,276 1,458
2030 137,474 76,308 20,899 3,302
2035 198,526 109,781 29,819 4,742
2040 241,510 133,233 36,023 5,746
2045 273,712 150,806 40,702 6,498
2050 303,158 166,924 45,019 7,190
221 TAR at 12-47. 222 The standards for MY2021-2024 were adjusted to reflect a constant g/mi CO2 decrease in the car and truck standards between 2020 and 2025. 223 A detailed description of the analysis can be found in Appendix A.
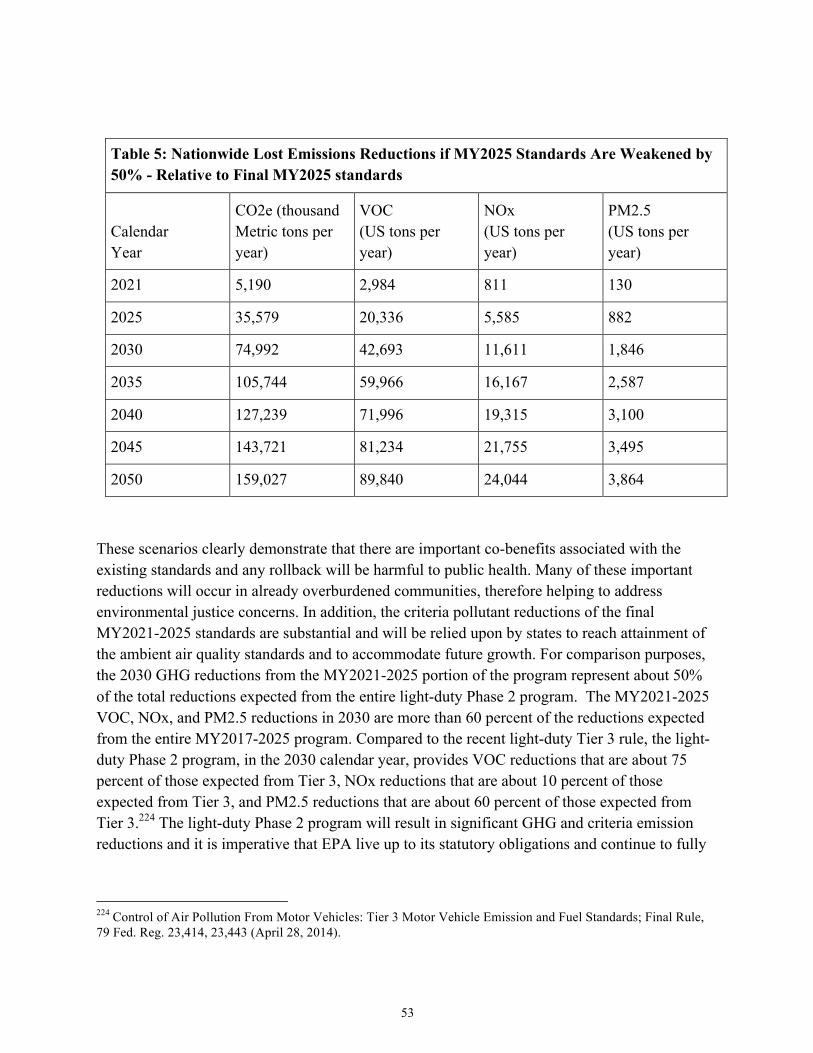
53
Table 5: Nationwide Lost Emissions Reductions if MY2025 Standards Are Weakened by 50% - Relative to Final MY2025 standards
Calendar Year
CO2e (thousand Metric tons per year)
VOC (US tons per year)
NOx (US tons per year)
PM2.5 (US tons per year)
2021 5,190 2,984 811 130
2025 35,579 20,336 5,585 882
2030 74,992 42,693 11,611 1,846
2035 105,744 59,966 16,167 2,587
2040 127,239 71,996 19,315 3,100
2045 143,721 81,234 21,755 3,495
2050 159,027 89,840 24,044 3,864
These scenarios clearly demonstrate that there are important co-benefits associated with the existing standards and any rollback will be harmful to public health. Many of these important reductions will occur in already overburdened communities, therefore helping to address environmental justice concerns. In addition, the criteria pollutant reductions of the final MY2021-2025 standards are substantial and will be relied upon by states to reach attainment of the ambient air quality standards and to accommodate future growth. For comparison purposes, the 2030 GHG reductions from the MY2021-2025 portion of the program represent about 50% of the total reductions expected from the entire light-duty Phase 2 program. The MY2021-2025 VOC, NOx, and PM2.5 reductions in 2030 are more than 60 percent of the reductions expected from the entire MY2017-2025 program. Compared to the recent light-duty Tier 3 rule, the light-duty Phase 2 program, in the 2030 calendar year, provides VOC reductions that are about 75 percent of those expected from Tier 3, NOx reductions that are about 10 percent of those expected from Tier 3, and PM2.5 reductions that are about 60 percent of those expected from Tier 3.224 The light-duty Phase 2 program will result in significant GHG and criteria emission reductions and it is imperative that EPA live up to its statutory obligations and continue to fully
224 Control of Air Pollution From Motor Vehicles: Tier 3 Motor Vehicle Emission and Fuel Standards; Final Rule, 79 Fed. Reg. 23,414, 23,443 (April 28, 2014).
54
account for the climate pollution impacts and criteria emission health and welfare benefits as it proceeds with its reconsideration of the Final Determination.
V. EPA should consider a lower rebound effect value and include the welfare benefits of the rebound effect
a. EPA should consider a lower rebound effect value
In the 2012 Final Rule for MY2017-2025 standards, the Agencies based the rebound effect value on existing studies and literature and concluded that a 10 percent value was appropriate.225 During the 2016 Midterm Evaluation, EPA conducted another thorough review of the available literature, including numerous new studies and reviews published since 2012.226 Based on this new information, EPA determined that the 10 percent rebound effect value continues to be appropriate. EPA found the body of literature that uses U.S. state- and national-level data, collected over a time period where fuel vehicle fuel efficiency increases, to be the most applicable new work. Based on these new studies, EPA concluded that while there is a wide range of estimates for both the historical magnitude of the rebound effect and its projected future value, there is evidence that the rebound effect is likely declining over time. Taking that into consideration, EPA still determined that the 10 percent rebound value is appropriate because it lies at the bottom of the range of estimates for historical rebound effect and lies at the upper end of the range of estimates for the future rebound effect reported in the newer studies.227 EPA clearly notes, the 10 percent value “was not derived from a single point estimate from a particular study, but instead represents a reasonable compromise between historical estimates of the rebound effect and forecasts of its projected future value, based on an updated review of the literature on this topic.”228 A number of studies cited by EPA also concluded that vehicle use is related more to fuel price than vehicle efficiency, and the rebound effect may therefore be overstated. In other words, vehicle owners will drive more as fuel prices drop, not because they have a more efficient vehicle. These results, together with the conclusion that the rebound effect is likely declining
225 77 Fed. Reg. 62,624, 62,716, 62,924 (Oct. 15, 2012) (2017 and Later Model Year Light-Duty Vehicle Greenhouse Gas Emissions and Corporate Average Fuel Economy Standards) (referring to the recent work and literature on the rebound effect including Small and Van Dender (2007), Sorell and Dimitropoulos (2007), and Greene (2012)). 226 U.S. Environmental Protection Agency (EPA), Proposed Determination on the Appropriateness of the Model Year 2022-2025 Light-Duty Vehicle Greenhouse Gas Emissions Standards under the Midterm Evaluation: Technical Support Document (2016), at 3-19–3-21. 227 Id. at 3-20. 228 Id. at 3-21.
55
over time, supports EPA considering a rebound effect value lower than 10 percent during any new evaluation of the MY2022-2025 standards.
b. EPA should include welfare benefits of rebound effect To the extent EPA retain some positive rebound value, it is important to estimate the beneficial impacts of that rebound effect. As discussed in a 2014 Resources for the Future discussion paper on “The Rebound Effect and Energy Efficiency Policy,” rebound often has a misconceived ‘evil’ connotation because policymakers tend to focus solely on energy minimization (in this case, fuel consumption reduction) and ignore welfare maximization.229 However, this does not capture the entire impact of rebound because any time a consumer changes his or her behavior (for example, by buying a more efficient car), it means that there is some inherent welfare benefit to that consumer (relative to no change in behavior). It is therefore important that “[r]ather than consider[ing] the rebound effect as a deterrent from passing energy efficiency policies, policymakers should include these welfare gains in the tally of benefits of a policy.”230 EPA correctly accounted for these benefits in the Heavy-duty Phase 2 Greenhouse Gas and Fuel Economy Program and we urge EPA to estimate the benefits of increased travel associated with rebound driving during any reexamination of the light-duty standards.231
VI. EPA must not reevaluate MY2021 standards
EPA is requesting comment on whether the greenhouse gas standards for MY2021 are appropriate.232 Reconsidering the MY2021 standards, which are not at all part of the midterm evaluation but instead final under both EPA and NHTSA’s final 2012 rulemakings, is wholly inconsistent with the record. Thirteen auto companies representing over 90 percent of U.S. vehicle sales sent commitment letters to both EPA’s Administrator and the Secretary of DOT that expressed, in detail, their support for the proposal and adoption of the MY2017-2025 fuel economy and GHG standards.233 The automakers and others supported the MY2017-2021 standards fully. While a midterm review was agreed upon as a procedural component of the MY2022-2025 standards, no such provision was made for the MY2017-2021 standards. Nowhere in the rulemaking record is there a mention that a review of the appropriateness of the MY2021 standards would or could be part of EPA’s midterm review.234 An unplanned review of the MY2021 standards it is not justified by 229 Gillingham, et al., The Rebound Effect and Energy Efficiency Policy, Resources for the Future Discussion Paper, 2014 RFF DP 14-39, forthcoming in the Review of Environmental Economics and Policy, (in press). 230 Id. 231 80 Fed. Reg. (July 13, 2015) at 40474. 232 EPA 2017 Request for Comment, 82 Fed. Reg. at 39,553. 233 EPA Regulatory Announcement at 2. 234 2012 Final Rule, 77 Fed. Reg. at 62,628, 62,652, & 62,785.
56
the record and would also harmfully disadvantage the companies that have wisely and appropriately invested for compliance, in reliance on the 2012 final rule. Moreover, the existing record is extensive and rigorous and firmly supports maintaining or strengthening EPA’s standards for MY2022-2025 as well as MY2021. As we detail elsewhere in these comments, technologies that will support compliance are being introduced faster and at lower cost than expected. Neither the auto manufacturers nor the agencies—nor any other parties—have publicly raised any concerns regarding the feasibility of the MY2021 standards during the 2012 rulemaking or during the midterm evaluation process. In fact, automakers are already developing plans for introduction of compliant MY2021 vehicles, as their introduction could occur as early as January 2020. It is inexplicable that EPA has raised MY2021 in the context of the midterm evaluation process. There is no justification for revisiting the feasibility of the MY2021 standards. EPA has provided no rationale for questioning the appropriateness of the MY2021 standards, and should abandon any reconsideration of these standards.
VII. Conclusion The existing record firmly supports EPA’s final determination that the existing MY2022-2025 standards remain “appropriate” under Clean Air Act Section 202(a)(1) and that, if anything, they should be strengthened. We appreciate the opportunity to submit these comments. Respectfully submitted, Alice Henderson, Attorney Chet France, Consultant Hilary Sinnamon, Consultant Erin Murphy, Legal Fellow Martha Roberts, Senior Attorney Peter Zalzal, Special Projects Director and Lead Attorney Rachel Fullmer, Legal Fellow Surbhi Sarang, Legal Fellow Emily Rosenblum, Intern Environmental Defense Fund John Shears Research Coordinator,
57
The Center for Energy Efficiency and Renewable Technologies V. John White Legislative Director, The Clean Power Campaign
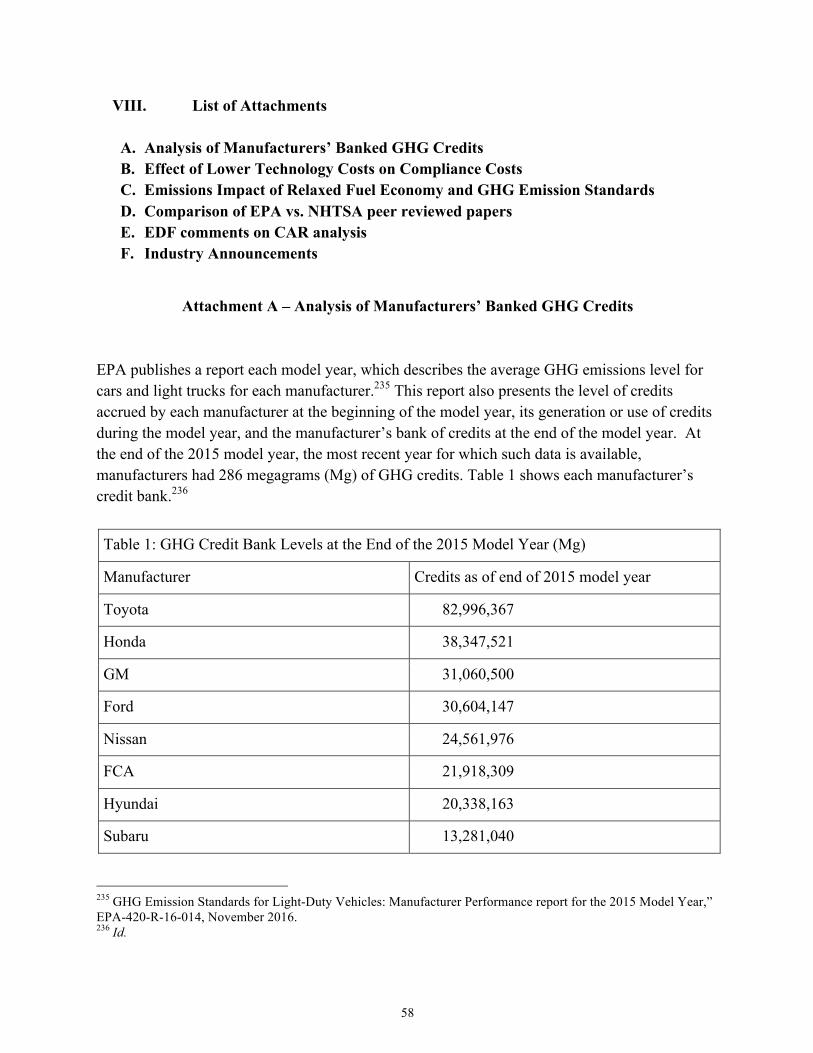
58
VIII. List of Attachments
A. Analysis of Manufacturers’ Banked GHG Credits B. Effect of Lower Technology Costs on Compliance Costs C. Emissions Impact of Relaxed Fuel Economy and GHG Emission Standards D. Comparison of EPA vs. NHTSA peer reviewed papers E. EDF comments on CAR analysis F. Industry Announcements
Attachment A – Analysis of Manufacturers’ Banked GHG Credits EPA publishes a report each model year, which describes the average GHG emissions level for cars and light trucks for each manufacturer.235 This report also presents the level of credits accrued by each manufacturer at the beginning of the model year, its generation or use of credits during the model year, and the manufacturer’s bank of credits at the end of the model year. At the end of the 2015 model year, the most recent year for which such data is available, manufacturers had 286 megagrams (Mg) of GHG credits. Table 1 shows each manufacturer’s credit bank.236
Table 1: GHG Credit Bank Levels at the End of the 2015 Model Year (Mg)
Manufacturer Credits as of end of 2015 model year
Toyota 82,996,367
Honda 38,347,521
GM 31,060,500
Ford 30,604,147
Nissan 24,561,976
FCA 21,918,309
Hyundai 20,338,163
Subaru 13,281,040
235 GHG Emission Standards for Light-Duty Vehicles: Manufacturer Performance report for the 2015 Model Year,” EPA-420-R-16-014, November 2016. 236 Id.
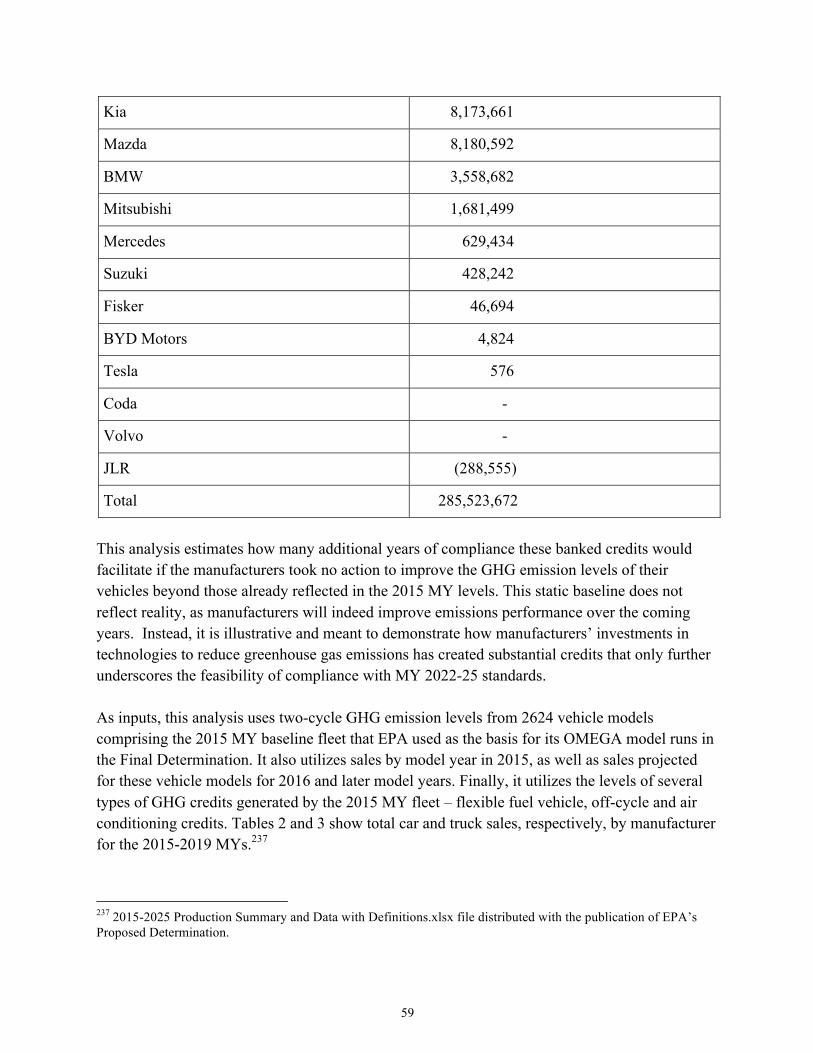
59
Kia 8,173,661
Mazda 8,180,592
BMW 3,558,682
Mitsubishi 1,681,499
Mercedes 629,434
Suzuki 428,242
Fisker 46,694
BYD Motors 4,824
Tesla 576
Coda -
Volvo -
JLR (288,555)
Total 285,523,672
This analysis estimates how many additional years of compliance these banked credits would facilitate if the manufacturers took no action to improve the GHG emission levels of their vehicles beyond those already reflected in the 2015 MY levels. This static baseline does not reflect reality, as manufacturers will indeed improve emissions performance over the coming years. Instead, it is illustrative and meant to demonstrate how manufacturers’ investments in technologies to reduce greenhouse gas emissions has created substantial credits that only further underscores the feasibility of compliance with MY 2022-25 standards. As inputs, this analysis uses two-cycle GHG emission levels from 2624 vehicle models comprising the 2015 MY baseline fleet that EPA used as the basis for its OMEGA model runs in the Final Determination. It also utilizes sales by model year in 2015, as well as sales projected for these vehicle models for 2016 and later model years. Finally, it utilizes the levels of several types of GHG credits generated by the 2015 MY fleet – flexible fuel vehicle, off-cycle and air conditioning credits. Tables 2 and 3 show total car and truck sales, respectively, by manufacturer for the 2015-2019 MYs.237
237 2015-2025 Production Summary and Data with Definitions.xlsx file distributed with the publication of EPA’s Proposed Determination.
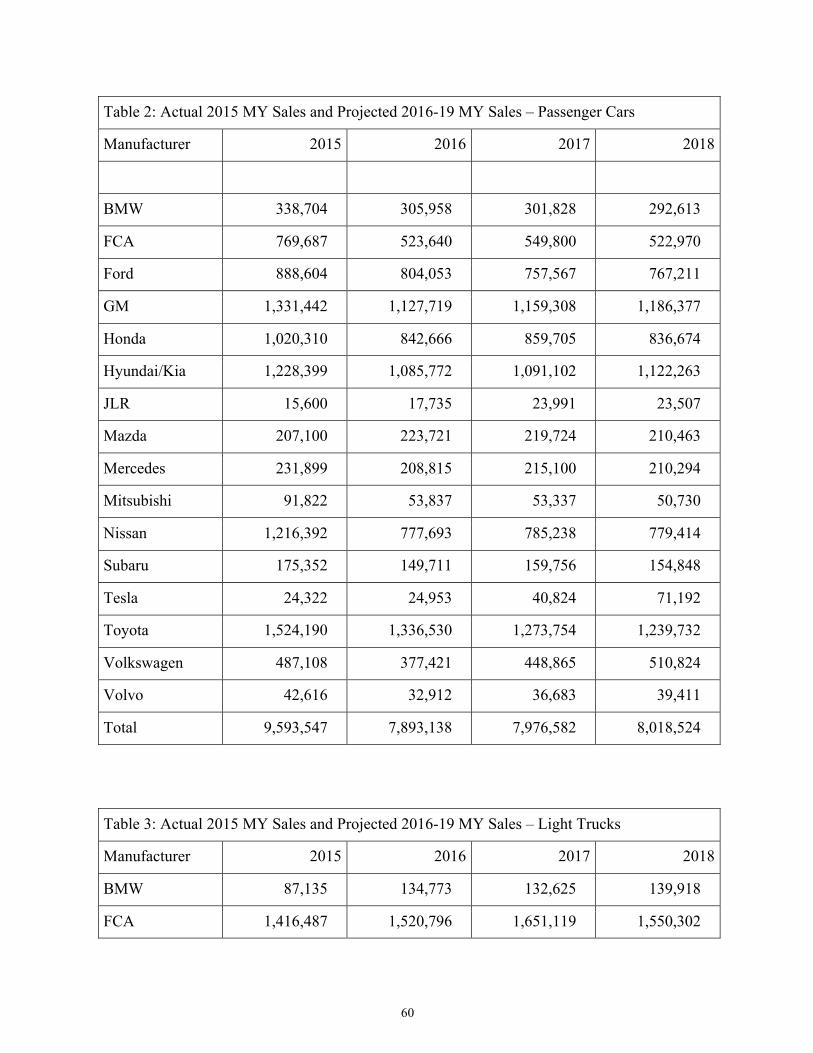
60
Table 2: Actual 2015 MY Sales and Projected 2016-19 MY Sales – Passenger Cars
Manufacturer 2015 2016 2017 2018
BMW 338,704 305,958 301,828 292,613
FCA 769,687 523,640 549,800 522,970
Ford 888,604 804,053 757,567 767,211
GM 1,331,442 1,127,719 1,159,308 1,186,377
Honda 1,020,310 842,666 859,705 836,674
Hyundai/Kia 1,228,399 1,085,772 1,091,102 1,122,263
JLR 15,600 17,735 23,991 23,507
Mazda 207,100 223,721 219,724 210,463
Mercedes 231,899 208,815 215,100 210,294
Mitsubishi 91,822 53,837 53,337 50,730
Nissan 1,216,392 777,693 785,238 779,414
Subaru 175,352 149,711 159,756 154,848
Tesla 24,322 24,953 40,824 71,192
Toyota 1,524,190 1,336,530 1,273,754 1,239,732
Volkswagen 487,108 377,421 448,865 510,824
Volvo 42,616 32,912 36,683 39,411
Total 9,593,547 7,893,138 7,976,582 8,018,524
Table 3: Actual 2015 MY Sales and Projected 2016-19 MY Sales – Light Trucks
Manufacturer 2015 2016 2017 2018
BMW 87,135 134,773 132,625 139,918
FCA 1,416,487 1,520,796 1,651,119 1,550,302
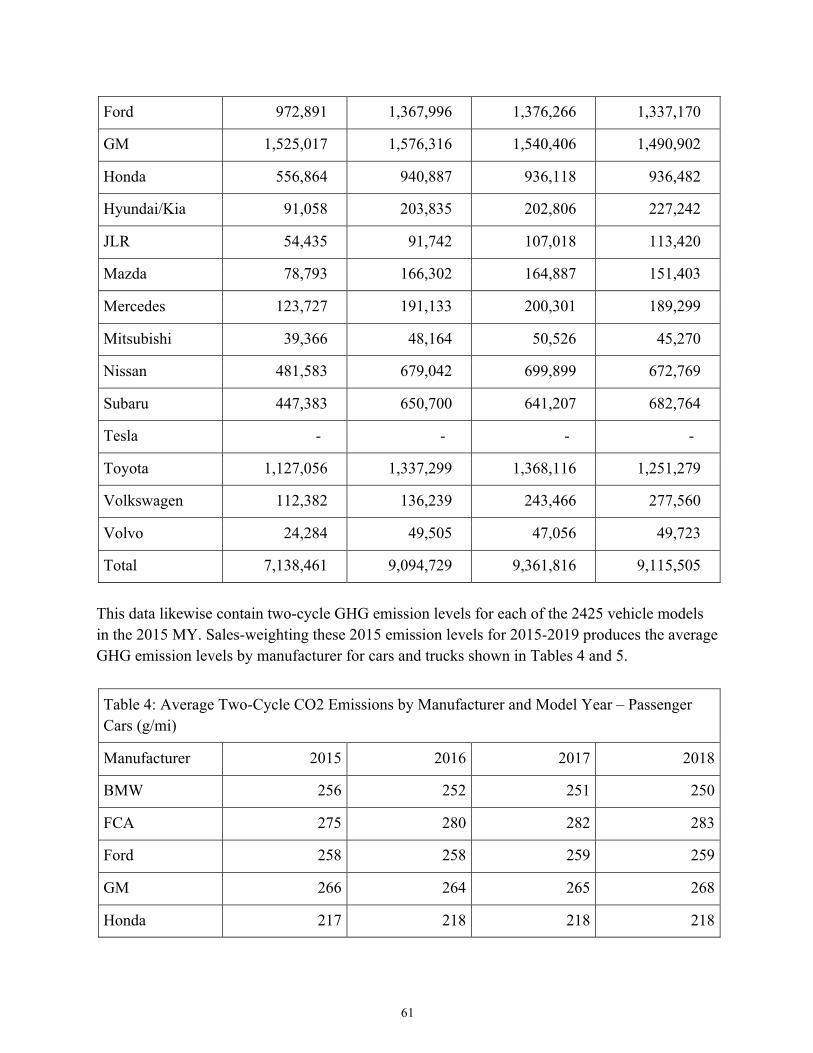
61
Ford 972,891 1,367,996 1,376,266 1,337,170
GM 1,525,017 1,576,316 1,540,406 1,490,902
Honda 556,864 940,887 936,118 936,482
Hyundai/Kia 91,058 203,835 202,806 227,242
JLR 54,435 91,742 107,018 113,420
Mazda 78,793 166,302 164,887 151,403
Mercedes 123,727 191,133 200,301 189,299
Mitsubishi 39,366 48,164 50,526 45,270
Nissan 481,583 679,042 699,899 672,769
Subaru 447,383 650,700 641,207 682,764
Tesla - - - -
Toyota 1,127,056 1,337,299 1,368,116 1,251,279
Volkswagen 112,382 136,239 243,466 277,560
Volvo 24,284 49,505 47,056 49,723
Total 7,138,461 9,094,729 9,361,816 9,115,505
This data likewise contain two-cycle GHG emission levels for each of the 2425 vehicle models in the 2015 MY. Sales-weighting these 2015 emission levels for 2015-2019 produces the average GHG emission levels by manufacturer for cars and trucks shown in Tables 4 and 5.
Table 4: Average Two-Cycle CO2 Emissions by Manufacturer and Model Year – Passenger Cars (g/mi)
Manufacturer 2015 2016 2017 2018
BMW 256 252 251 250
FCA 275 280 282 283
Ford 258 258 259 259
GM 266 264 265 268
Honda 217 218 218 218
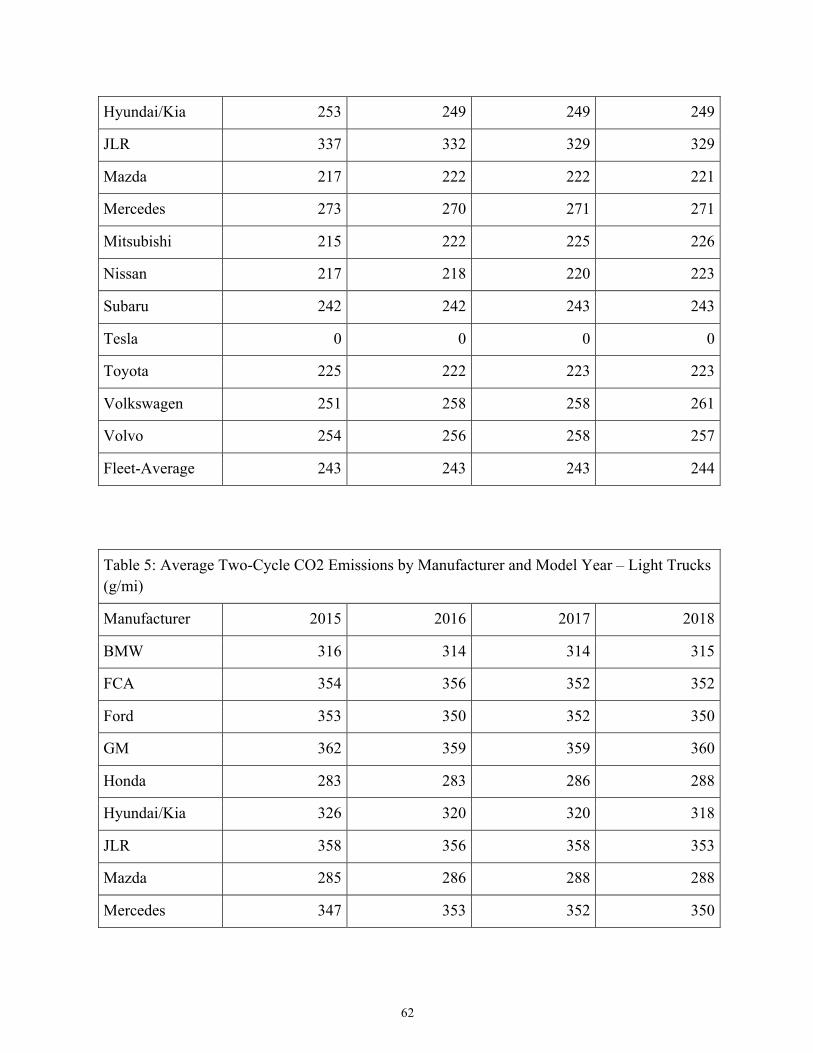
62
Hyundai/Kia 253 249 249 249
JLR 337 332 329 329
Mazda 217 222 222 221
Mercedes 273 270 271 271
Mitsubishi 215 222 225 226
Nissan 217 218 220 223
Subaru 242 242 243 243
Tesla 0 0 0 0
Toyota 225 222 223 223
Volkswagen 251 258 258 261
Volvo 254 256 258 257
Fleet-Average 243 243 243 244
Table 5: Average Two-Cycle CO2 Emissions by Manufacturer and Model Year – Light Trucks (g/mi)
Manufacturer 2015 2016 2017 2018
BMW 316 314 314 315
FCA 354 356 352 352
Ford 353 350 352 350
GM 362 359 359 360
Honda 283 283 286 288
Hyundai/Kia 326 320 320 318
JLR 358 356 358 353
Mazda 285 286 288 288
Mercedes 347 353 352 350
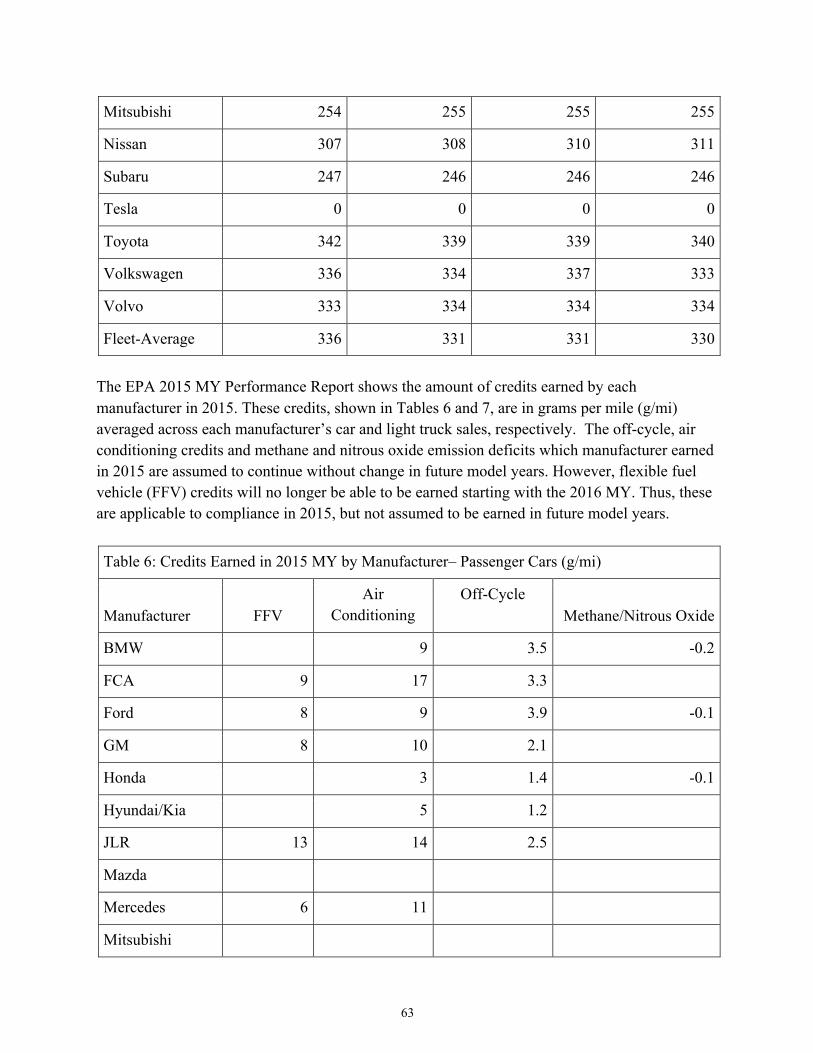
63
Mitsubishi 254 255 255 255
Nissan 307 308 310 311
Subaru 247 246 246 246
Tesla 0 0 0 0
Toyota 342 339 339 340
Volkswagen 336 334 337 333
Volvo 333 334 334 334
Fleet-Average 336 331 331 330
The EPA 2015 MY Performance Report shows the amount of credits earned by each manufacturer in 2015. These credits, shown in Tables 6 and 7, are in grams per mile (g/mi) averaged across each manufacturer’s car and light truck sales, respectively. The off-cycle, air conditioning credits and methane and nitrous oxide emission deficits which manufacturer earned in 2015 are assumed to continue without change in future model years. However, flexible fuel vehicle (FFV) credits will no longer be able to be earned starting with the 2016 MY. Thus, these are applicable to compliance in 2015, but not assumed to be earned in future model years.
Table 6: Credits Earned in 2015 MY by Manufacturer– Passenger Cars (g/mi)
Manufacturer FFV Air
Conditioning Off-Cycle
Methane/Nitrous Oxide
BMW 9 3.5 -0.2
FCA 9 17 3.3
Ford 8 9 3.9 -0.1
GM 8 10 2.1
Honda 3 1.4 -0.1
Hyundai/Kia 5 1.2
JLR 13 14 2.5
Mazda
Mercedes 6 11
Mitsubishi
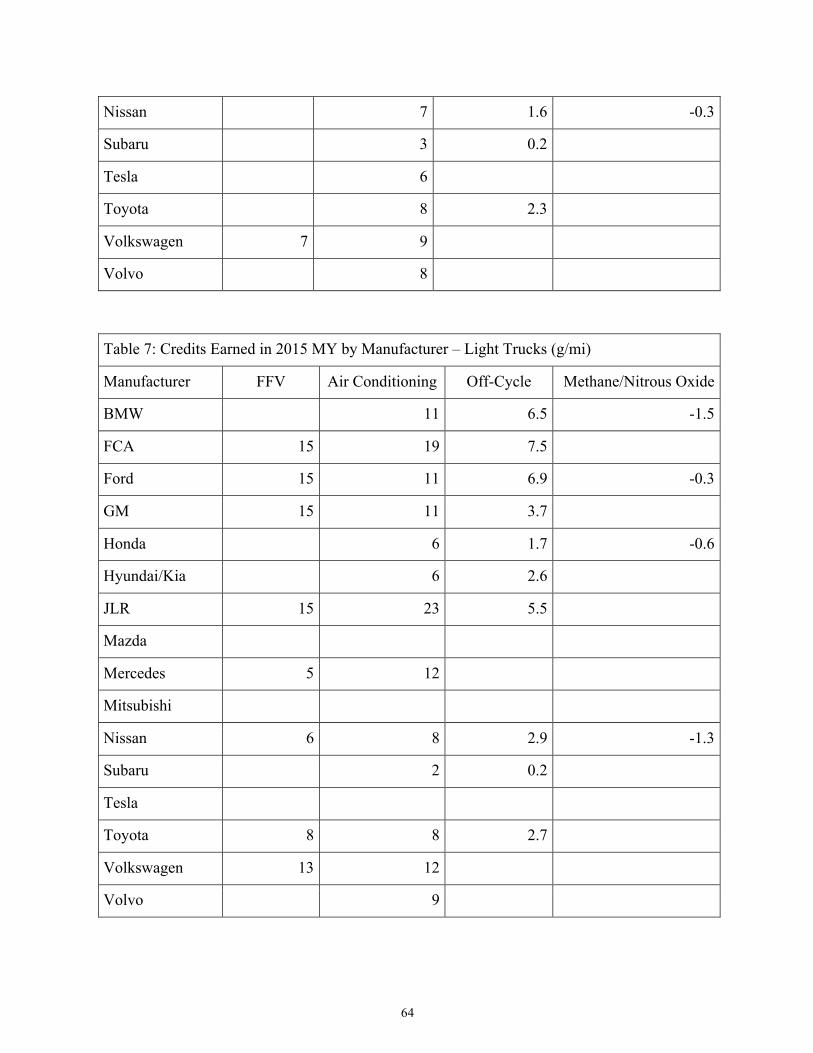
64
Nissan 7 1.6 -0.3
Subaru 3 0.2
Tesla 6
Toyota 8 2.3
Volkswagen 7 9
Volvo 8
Table 7: Credits Earned in 2015 MY by Manufacturer – Light Trucks (g/mi)
Manufacturer FFV Air Conditioning Off-Cycle Methane/Nitrous Oxide
BMW 11 6.5 -1.5
FCA 15 19 7.5
Ford 15 11 6.9 -0.3
GM 15 11 3.7
Honda 6 1.7 -0.6
Hyundai/Kia 6 2.6
JLR 15 23 5.5
Mazda
Mercedes 5 12
Mitsubishi
Nissan 6 8 2.9 -1.3
Subaru 2 0.2
Tesla
Toyota 8 8 2.7
Volkswagen 13 12
Volvo 9
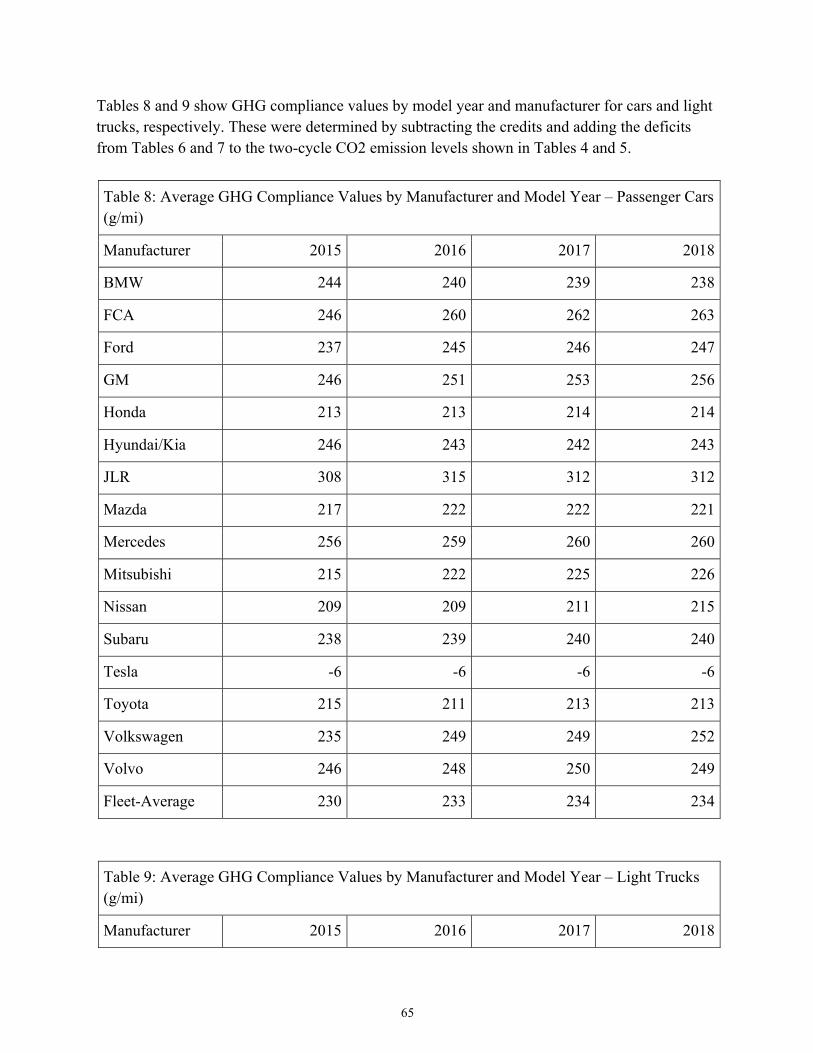
65
Tables 8 and 9 show GHG compliance values by model year and manufacturer for cars and light trucks, respectively. These were determined by subtracting the credits and adding the deficits from Tables 6 and 7 to the two-cycle CO2 emission levels shown in Tables 4 and 5.
Table 8: Average GHG Compliance Values by Manufacturer and Model Year – Passenger Cars (g/mi)
Manufacturer 2015 2016 2017 2018
BMW 244 240 239 238
FCA 246 260 262 263
Ford 237 245 246 247
GM 246 251 253 256
Honda 213 213 214 214
Hyundai/Kia 246 243 242 243
JLR 308 315 312 312
Mazda 217 222 222 221
Mercedes 256 259 260 260
Mitsubishi 215 222 225 226
Nissan 209 209 211 215
Subaru 238 239 240 240
Tesla -6 -6 -6 -6
Toyota 215 211 213 213
Volkswagen 235 249 249 252
Volvo 246 248 250 249
Fleet-Average 230 233 234 234
Table 9: Average GHG Compliance Values by Manufacturer and Model Year – Light Trucks (g/mi)
Manufacturer 2015 2016 2017 2018
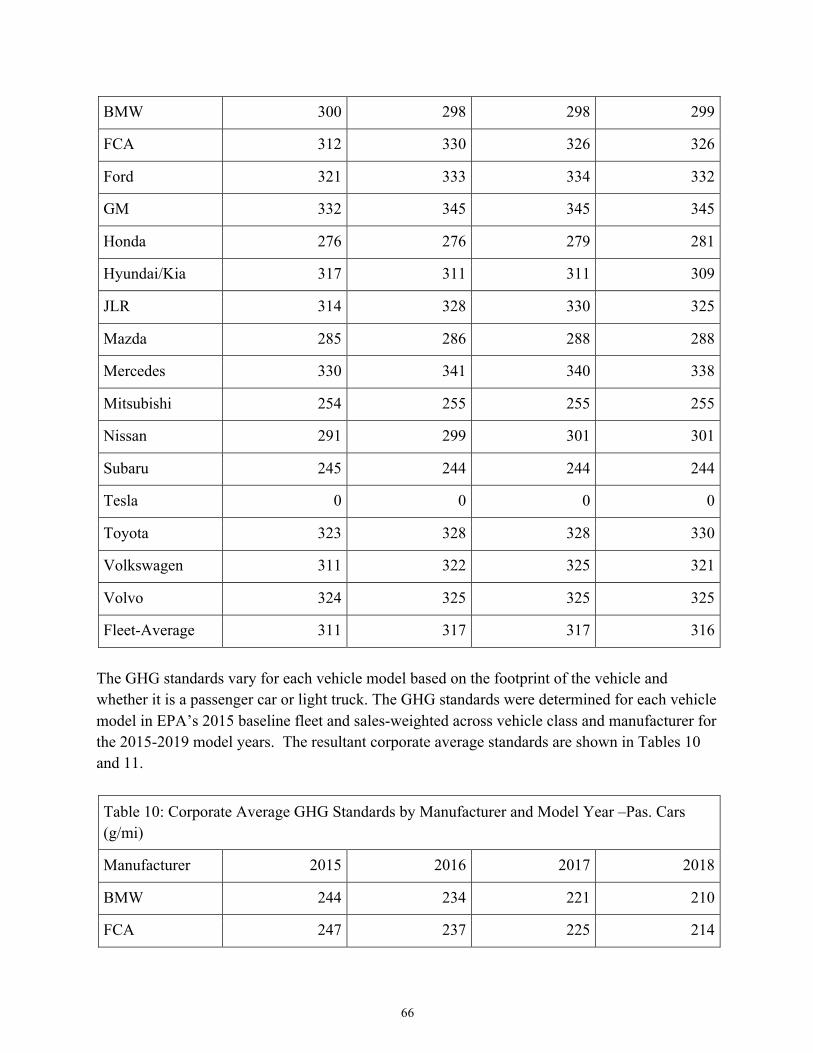
66
BMW 300 298 298 299
FCA 312 330 326 326
Ford 321 333 334 332
GM 332 345 345 345
Honda 276 276 279 281
Hyundai/Kia 317 311 311 309
JLR 314 328 330 325
Mazda 285 286 288 288
Mercedes 330 341 340 338
Mitsubishi 254 255 255 255
Nissan 291 299 301 301
Subaru 245 244 244 244
Tesla 0 0 0 0
Toyota 323 328 328 330
Volkswagen 311 322 325 321
Volvo 324 325 325 325
Fleet-Average 311 317 317 316
The GHG standards vary for each vehicle model based on the footprint of the vehicle and whether it is a passenger car or light truck. The GHG standards were determined for each vehicle model in EPA’s 2015 baseline fleet and sales-weighted across vehicle class and manufacturer for the 2015-2019 model years. The resultant corporate average standards are shown in Tables 10 and 11.
Table 10: Corporate Average GHG Standards by Manufacturer and Model Year –Pas. Cars (g/mi)
Manufacturer 2015 2016 2017 2018
BMW 244 234 221 210
FCA 247 237 225 214
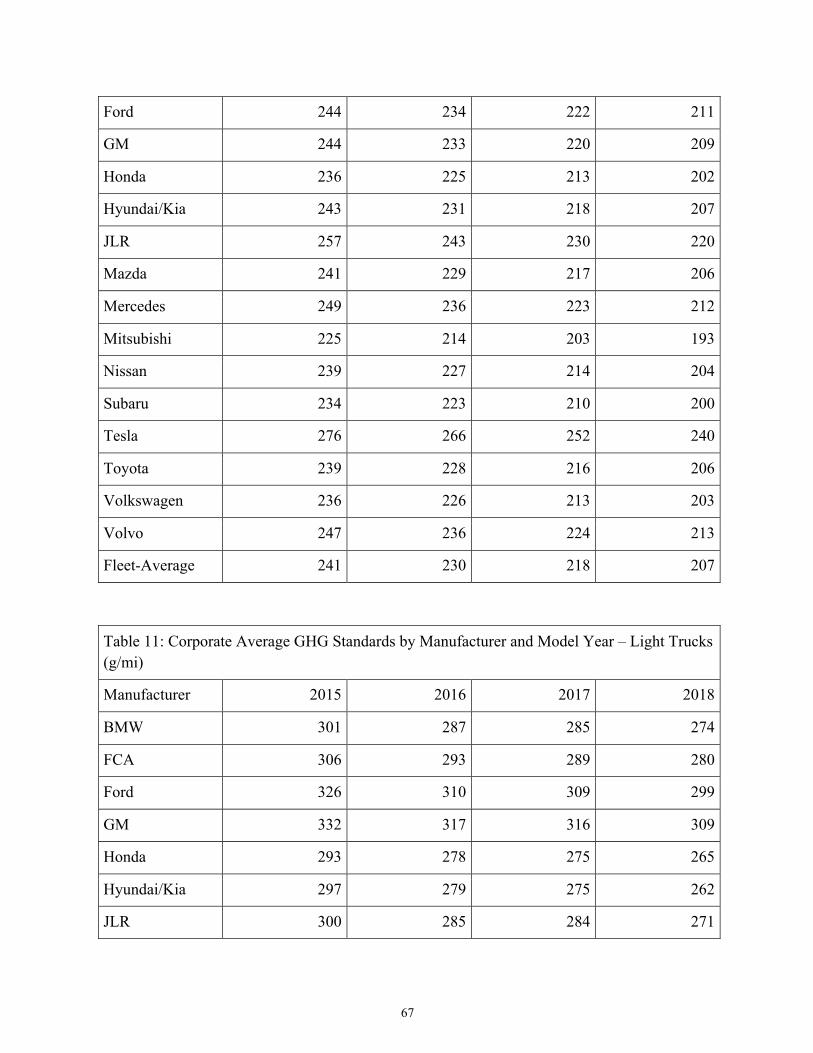
67
Ford 244 234 222 211
GM 244 233 220 209
Honda 236 225 213 202
Hyundai/Kia 243 231 218 207
JLR 257 243 230 220
Mazda 241 229 217 206
Mercedes 249 236 223 212
Mitsubishi 225 214 203 193
Nissan 239 227 214 204
Subaru 234 223 210 200
Tesla 276 266 252 240
Toyota 239 228 216 206
Volkswagen 236 226 213 203
Volvo 247 236 224 213
Fleet-Average 241 230 218 207
Table 11: Corporate Average GHG Standards by Manufacturer and Model Year – Light Trucks (g/mi)
Manufacturer 2015 2016 2017 2018
BMW 301 287 285 274
FCA 306 293 289 280
Ford 326 310 309 299
GM 332 317 316 309
Honda 293 278 275 265
Hyundai/Kia 297 279 275 262
JLR 300 285 284 271
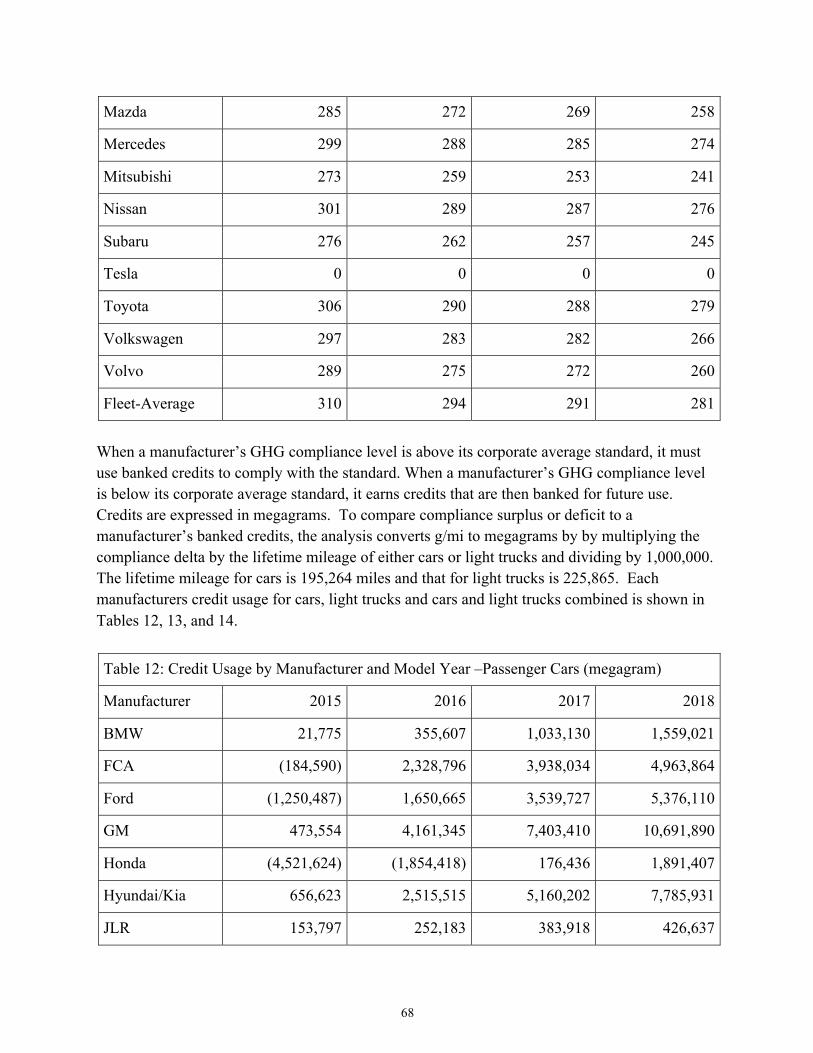
68
Mazda 285 272 269 258
Mercedes 299 288 285 274
Mitsubishi 273 259 253 241
Nissan 301 289 287 276
Subaru 276 262 257 245
Tesla 0 0 0 0
Toyota 306 290 288 279
Volkswagen 297 283 282 266
Volvo 289 275 272 260
Fleet-Average 310 294 291 281
When a manufacturer’s GHG compliance level is above its corporate average standard, it must use banked credits to comply with the standard. When a manufacturer’s GHG compliance level is below its corporate average standard, it earns credits that are then banked for future use. Credits are expressed in megagrams. To compare compliance surplus or deficit to a manufacturer’s banked credits, the analysis converts g/mi to megagrams by by multiplying the compliance delta by the lifetime mileage of either cars or light trucks and dividing by 1,000,000. The lifetime mileage for cars is 195,264 miles and that for light trucks is 225,865. Each manufacturers credit usage for cars, light trucks and cars and light trucks combined is shown in Tables 12, 13, and 14.
Table 12: Credit Usage by Manufacturer and Model Year –Passenger Cars (megagram)
Manufacturer 2015 2016 2017 2018
BMW 21,775 355,607 1,033,130 1,559,021
FCA (184,590) 2,328,796 3,938,034 4,963,864
Ford (1,250,487) 1,650,665 3,539,727 5,376,110
GM 473,554 4,161,345 7,403,410 10,691,890
Honda (4,521,624) (1,854,418) 176,436 1,891,407
Hyundai/Kia 656,623 2,515,515 5,160,202 7,785,931
JLR 153,797 252,183 383,918 426,637
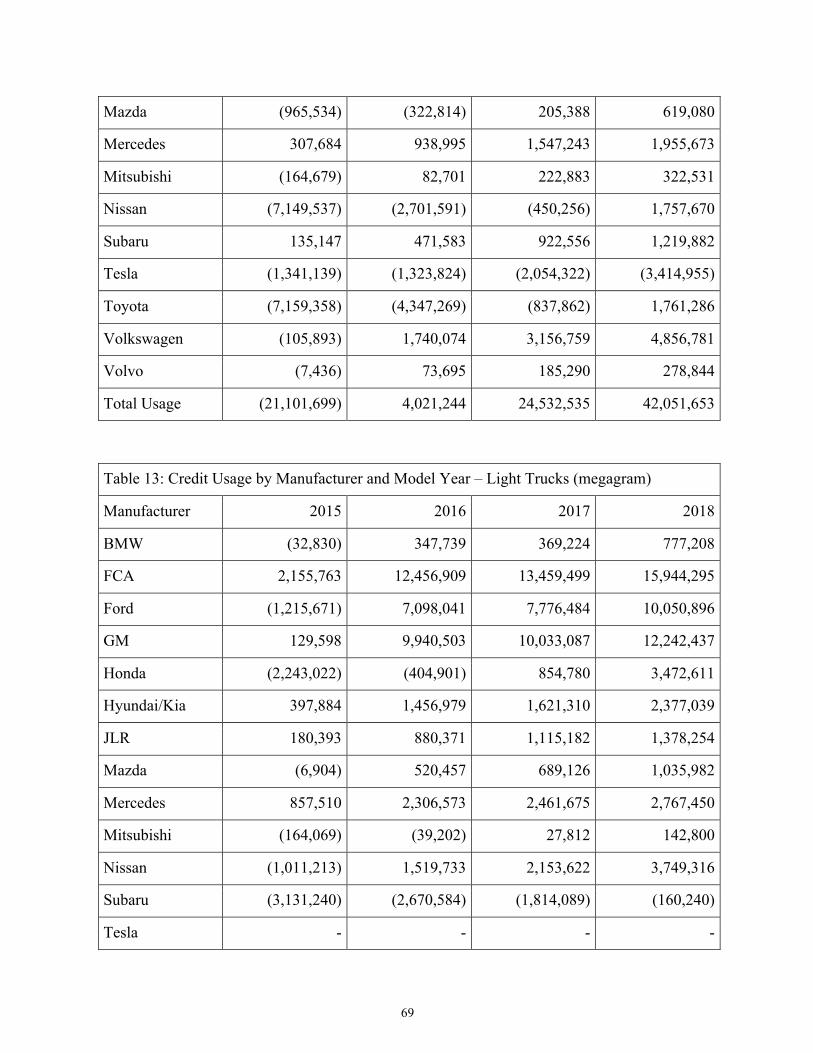
69
Mazda (965,534) (322,814) 205,388 619,080
Mercedes 307,684 938,995 1,547,243 1,955,673
Mitsubishi (164,679) 82,701 222,883 322,531
Nissan (7,149,537) (2,701,591) (450,256) 1,757,670
Subaru 135,147 471,583 922,556 1,219,882
Tesla (1,341,139) (1,323,824) (2,054,322) (3,414,955)
Toyota (7,159,358) (4,347,269) (837,862) 1,761,286
Volkswagen (105,893) 1,740,074 3,156,759 4,856,781
Volvo (7,436) 73,695 185,290 278,844
Total Usage (21,101,699) 4,021,244 24,532,535 42,051,653
Table 13: Credit Usage by Manufacturer and Model Year – Light Trucks (megagram)
Manufacturer 2015 2016 2017 2018
BMW (32,830) 347,739 369,224 777,208
FCA 2,155,763 12,456,909 13,459,499 15,944,295
Ford (1,215,671) 7,098,041 7,776,484 10,050,896
GM 129,598 9,940,503 10,033,087 12,242,437
Honda (2,243,022) (404,901) 854,780 3,472,611
Hyundai/Kia 397,884 1,456,979 1,621,310 2,377,039
JLR 180,393 880,371 1,115,182 1,378,254
Mazda (6,904) 520,457 689,126 1,035,982
Mercedes 857,510 2,306,573 2,461,675 2,767,450
Mitsubishi (164,069) (39,202) 27,812 142,800
Nissan (1,011,213) 1,519,733 2,153,622 3,749,316
Subaru (3,131,240) (2,670,584) (1,814,089) (160,240)
Tesla - - - -
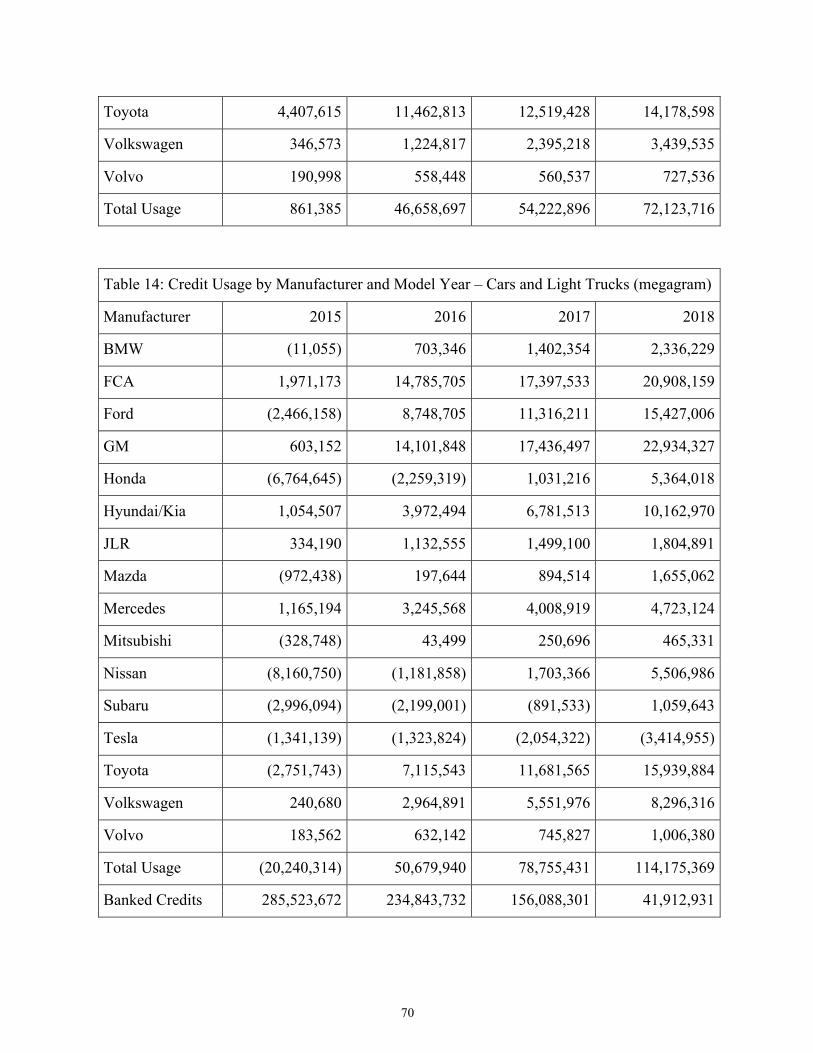
70
Toyota 4,407,615 11,462,813 12,519,428 14,178,598
Volkswagen 346,573 1,224,817 2,395,218 3,439,535
Volvo 190,998 558,448 560,537 727,536
Total Usage 861,385 46,658,697 54,222,896 72,123,716
Table 14: Credit Usage by Manufacturer and Model Year – Cars and Light Trucks (megagram)
Manufacturer 2015 2016 2017 2018
BMW (11,055) 703,346 1,402,354 2,336,229
FCA 1,971,173 14,785,705 17,397,533 20,908,159
Ford (2,466,158) 8,748,705 11,316,211 15,427,006
GM 603,152 14,101,848 17,436,497 22,934,327
Honda (6,764,645) (2,259,319) 1,031,216 5,364,018
Hyundai/Kia 1,054,507 3,972,494 6,781,513 10,162,970
JLR 334,190 1,132,555 1,499,100 1,804,891
Mazda (972,438) 197,644 894,514 1,655,062
Mercedes 1,165,194 3,245,568 4,008,919 4,723,124
Mitsubishi (328,748) 43,499 250,696 465,331
Nissan (8,160,750) (1,181,858) 1,703,366 5,506,986
Subaru (2,996,094) (2,199,001) (891,533) 1,059,643
Tesla (1,341,139) (1,323,824) (2,054,322) (3,414,955)
Toyota (2,751,743) 7,115,543 11,681,565 15,939,884
Volkswagen 240,680 2,964,891 5,551,976 8,296,316
Volvo 183,562 632,142 745,827 1,006,380
Total Usage (20,240,314) 50,679,940 78,755,431 114,175,369
Banked Credits 285,523,672 234,843,732 156,088,301 41,912,931

71
The final line of Table 14 shows the running total of credits in the manufacturers’ banks at the end of each model year. It starts at the end of 2015 with the total shown in Table 1 above. Because of our assumed static baseline, which, as described above is done for illustrative purposes only, the fleet as a whole uses banked credits in each subsequent year to facilitate compliance. Even in this unrealistic scenario, the banked credits are sufficient to entirely facilitate compliance through the 2018 model year and enable some compliance in the 2019 model year.
72
Attachment B - Effect of Recent Technology Costs and Technology Effectiveness Estimates on Compliance with EPA’s MY2025 GHG Standards
The International Council on Clean Transportation (ICCT) recently surveyed progress in the development of several technologies, which improve the fuel efficiency of light-duty vehicles.238 These included gasoline direct injection, cooled exhaust gas recirculation (EGR), cylinder deactivation, naturally aspirated Atkinson high compression ratio engines, turbocharged Atkinson (or Miller cycle) engines, electrically boosted turbocharging, weight reduction, diesel engines and electric vehicles. Some of these technologies play a large role in EPA’s analyses supporting the Final Determination (FD). Others play a more minor role, at least under the cost and effectiveness projections used by EPA. This analysis incorporates the more recent cost and effectiveness projections made by ICCT into EPA’s OMEGA model to assess the potential impact these updated values have on manufacturer compliance with the EPA GHG standards in 2025. For additional context, we also use the updated ICCT values to assess compliance with the 2021 standards in 2025, as well as several sets of standards more stringent than the 2025 standards. The description of our analysis is presented below and is divided into three main sections. The first section describes the differences between ICCT’s projections of the cost of technology and the latest EPA projections made in support of the Final Determination. This section also describes the process used to incorporate ICCTs projected costs into the input files used by EPA’s OMEGA model. The second section does the same thing with respect to ICCT’s projected effectiveness for these technologies. The third and final section describes the impacts of the ICCT cost and effectiveness projections on manufacturer compliance with the various GHG standards in 2025 using the OMEGA model. We also quantify the fuel savings associated with each set of standards for comparison with compliance costs.
I. ICCT Technology Costs
All ICCT technology costs and efficiency estimates apply to the year 2025. With one exception, the ICCT technology cost estimates are at the level of direct manufacturing costs (DMC). Unless otherwise specified, indirect costs associated with the ICCT direct manufacturing costs are derived using EPA’s methodology, which provides that indirect costs are a specified function of direct manufacturing costs. The one exception pertains to the cost of vehicle weight reduction. In this case, ICCT suggested no modification to EPA’s direct manufacturing costs, but suggested 238 Lutsey, Nic, Dan Meszler, Aaron Isenstadt, John German and Josh Miller, “Efficiency Technology and Cost Assessment for U.S. 2020-2025 Light-Duty Vehicles”, ICCT, March 2017.
73
that EPA’s indirect cost multipliers be modified. The process ICCT used is more fully described in the weight reduction discussion, below. For clarity, any reference to “cost” in this section will be to direct manufacturing costs, unless otherwise specified. The “costs” referred in the final section, Section III, describing the results of OMEGA modeling are total costs to manufacturers and include indirect costs.
EPA’s base estimates of technology cost, learning factors and indirect cost multipliers are contained in the OMEGA_TechCosts_Inputs.xlsx spreadsheet. The most recent version of this spreadsheet was the one developed to support the OMEGA modeling for the Final Determination. These basic elements of technology cost projection are then combined by the OMEGA_TechCosts python script to produce estimates of total technology costs for various model years. These total costs are contained in an OMEGA_TechCosts_8405 spreadsheet. Because we are focused on technology costs for one year, 2025, there was no need to modify EPA’s learning factors, which pertain to the change in technology over time. However, we did consider these learning factors, since EPA estimates a base technology cost applicable in a particular model year and adjusts this cost using learning factors for other model years. The base model year usually comes from the timing of the source of the cost estimate and is generally not the 2025 model year. Because the same learning factors are used to adjust the EPA and ICCT costs, a specified difference between the EPA and ICCT costs in 2025 (e.g., 25%) means that there will also be a 25% difference between the EPA and ICCT costs in the base year, and vice versa. Thus, the first step in this adjustment process was to determine the percentage change between the EPA and ICCT cost estimates in 2025. The second step was to adjust EPA’s base cost estimate by this same percentage. The final step was to enter this modified cost into the OMEGA_TechCosts_Inputs.xlsx spreadsheet. The specific EPA and ICCT cost estimates for 2025 and the resultant adjusted base costs are discussed for each technology below. When ICCT refers to EPA cost estimates, these are the DMCs contained in EPA’s “OMEGA_TechCosts_8405.xlsx” spreadsheet for the 2025 model year.
A. Gasoline Direct Injection
ICCT estimates that the cost of converting a port fuel injected gasoline (PFI) engine to direct injection (GDI) will be $91-185 compared to EPA’s projection of $196-356. The lower end of the range pertains to three and four cylinder engines, while the upper end pertains to eight cylinder engines. EPA’s cost for six cylinder engines fall in between the other two costs, though nearer those for the eight cylinder engine. ICCT does not provide a cost estimate for six cylinder engines. Table 1 shows these figures, as well as the EPA’s base costs for the year 2012. The final column in Table 1 shows the adjusted base year GDI cost consistent with the ICCT costs for 2025. They
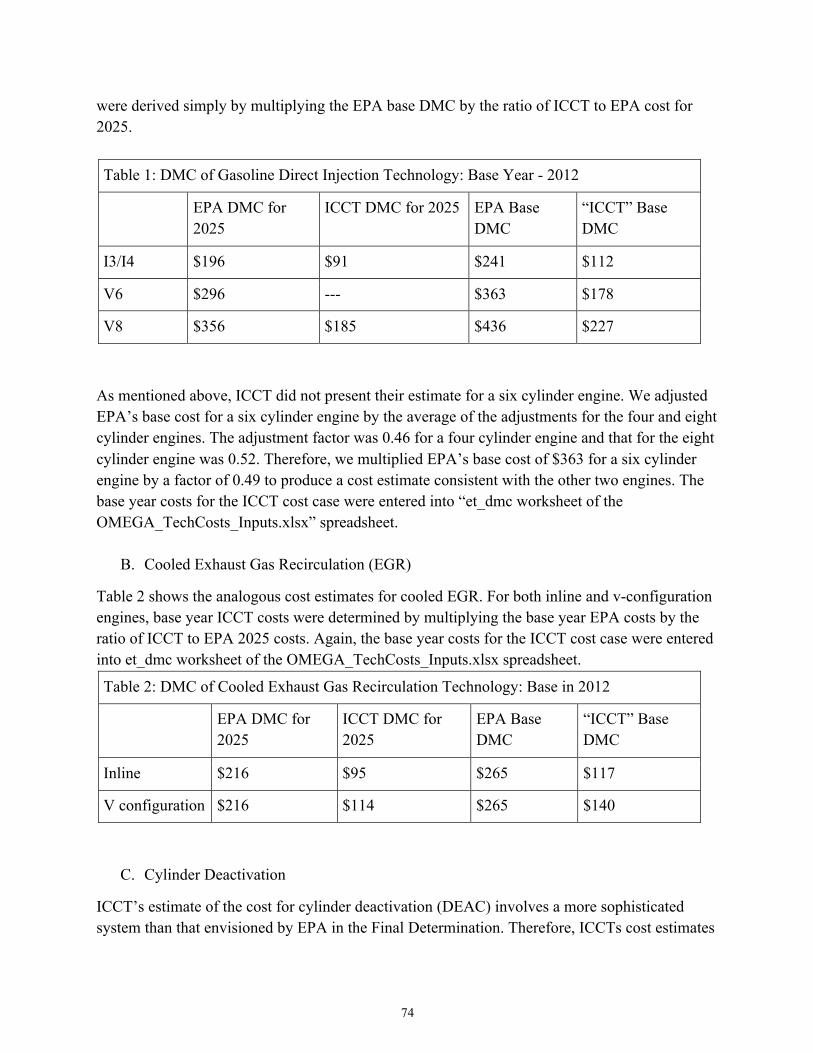
74
were derived simply by multiplying the EPA base DMC by the ratio of ICCT to EPA cost for 2025.
Table 1: DMC of Gasoline Direct Injection Technology: Base Year - 2012
EPA DMC for 2025
ICCT DMC for 2025 EPA Base DMC
“ICCT” Base DMC
I3/I4 $196 $91 $241 $112
V6 $296 --- $363 $178
V8 $356 $185 $436 $227
As mentioned above, ICCT did not present their estimate for a six cylinder engine. We adjusted EPA’s base cost for a six cylinder engine by the average of the adjustments for the four and eight cylinder engines. The adjustment factor was 0.46 for a four cylinder engine and that for the eight cylinder engine was 0.52. Therefore, we multiplied EPA’s base cost of $363 for a six cylinder engine by a factor of 0.49 to produce a cost estimate consistent with the other two engines. The base year costs for the ICCT cost case were entered into “et_dmc worksheet of the OMEGA_TechCosts_Inputs.xlsx” spreadsheet.
B. Cooled Exhaust Gas Recirculation (EGR)
Table 2 shows the analogous cost estimates for cooled EGR. For both inline and v-configuration engines, base year ICCT costs were determined by multiplying the base year EPA costs by the ratio of ICCT to EPA 2025 costs. Again, the base year costs for the ICCT cost case were entered into et_dmc worksheet of the OMEGA_TechCosts_Inputs.xlsx spreadsheet.
Table 2: DMC of Cooled Exhaust Gas Recirculation Technology: Base in 2012
EPA DMC for 2025
ICCT DMC for 2025
EPA Base DMC
“ICCT” Base DMC
Inline $216 $95 $265 $117
V configuration $216 $114 $265 $140
C. Cylinder Deactivation
ICCT’s estimate of the cost for cylinder deactivation (DEAC) involves a more sophisticated system than that envisioned by EPA in the Final Determination. Therefore, ICCTs cost estimates
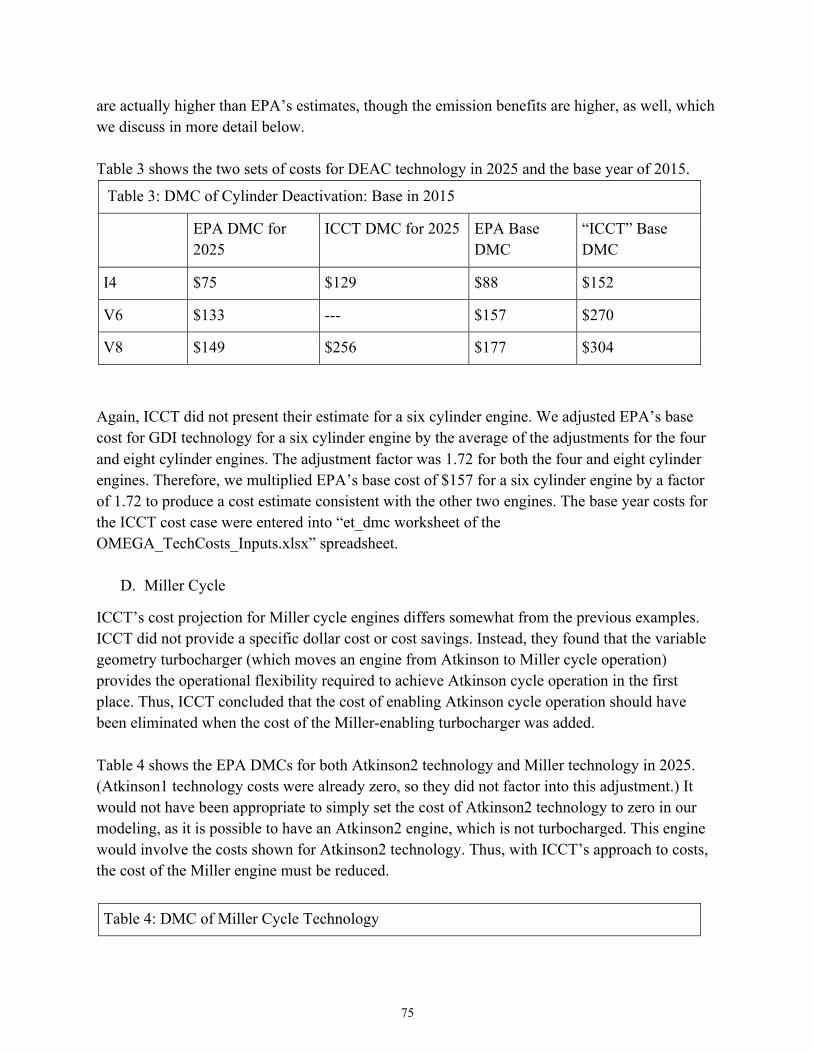
75
are actually higher than EPA’s estimates, though the emission benefits are higher, as well, which we discuss in more detail below. Table 3 shows the two sets of costs for DEAC technology in 2025 and the base year of 2015.
Table 3: DMC of Cylinder Deactivation: Base in 2015
EPA DMC for 2025
ICCT DMC for 2025 EPA Base DMC
“ICCT” Base DMC
I4 $75 $129 $88 $152
V6 $133 --- $157 $270
V8 $149 $256 $177 $304
Again, ICCT did not present their estimate for a six cylinder engine. We adjusted EPA’s base cost for GDI technology for a six cylinder engine by the average of the adjustments for the four and eight cylinder engines. The adjustment factor was 1.72 for both the four and eight cylinder engines. Therefore, we multiplied EPA’s base cost of $157 for a six cylinder engine by a factor of 1.72 to produce a cost estimate consistent with the other two engines. The base year costs for the ICCT cost case were entered into “et_dmc worksheet of the OMEGA_TechCosts_Inputs.xlsx” spreadsheet.
D. Miller Cycle
ICCT’s cost projection for Miller cycle engines differs somewhat from the previous examples. ICCT did not provide a specific dollar cost or cost savings. Instead, they found that the variable geometry turbocharger (which moves an engine from Atkinson to Miller cycle operation) provides the operational flexibility required to achieve Atkinson cycle operation in the first place. Thus, ICCT concluded that the cost of enabling Atkinson cycle operation should have been eliminated when the cost of the Miller-enabling turbocharger was added. Table 4 shows the EPA DMCs for both Atkinson2 technology and Miller technology in 2025. (Atkinson1 technology costs were already zero, so they did not factor into this adjustment.) It would not have been appropriate to simply set the cost of Atkinson2 technology to zero in our modeling, as it is possible to have an Atkinson2 engine, which is not turbocharged. This engine would involve the costs shown for Atkinson2 technology. Thus, with ICCT’s approach to costs, the cost of the Miller engine must be reduced.
Table 4: DMC of Miller Cycle Technology
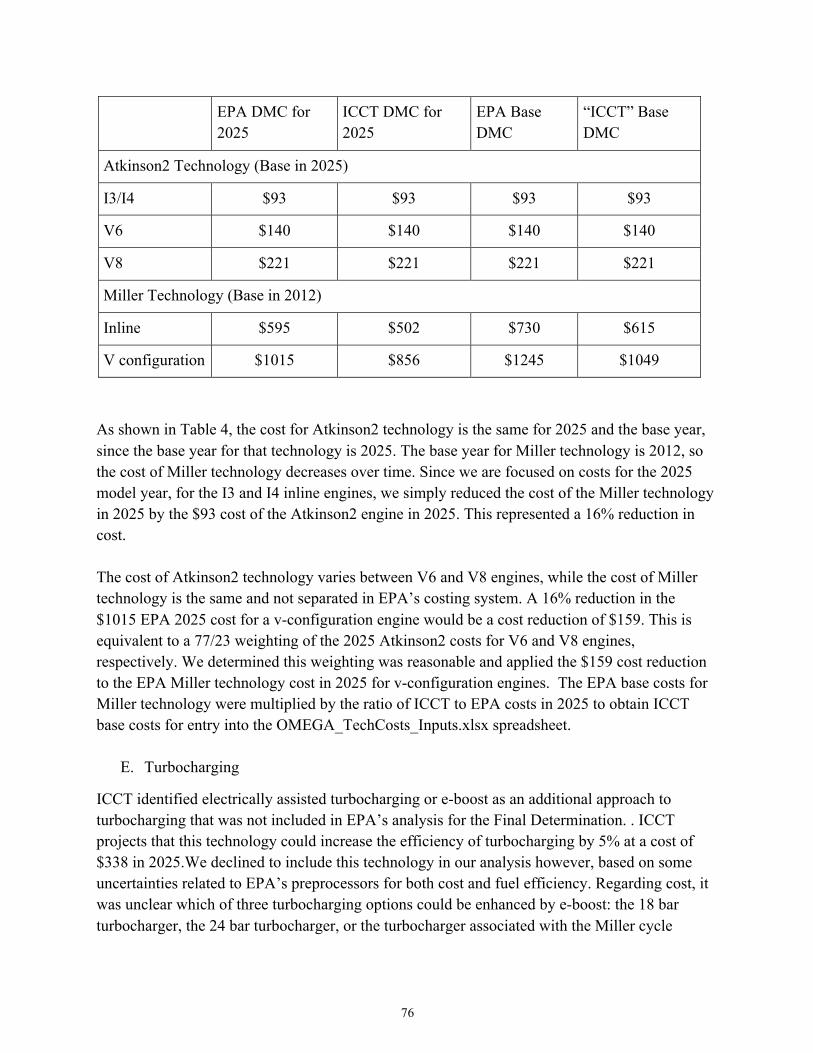
76
EPA DMC for 2025
ICCT DMC for 2025
EPA Base DMC
“ICCT” Base DMC
Atkinson2 Technology (Base in 2025)
I3/I4 $93 $93 $93 $93
V6 $140 $140 $140 $140
V8 $221 $221 $221 $221
Miller Technology (Base in 2012)
Inline $595 $502 $730 $615
V configuration $1015 $856 $1245 $1049
As shown in Table 4, the cost for Atkinson2 technology is the same for 2025 and the base year, since the base year for that technology is 2025. The base year for Miller technology is 2012, so the cost of Miller technology decreases over time. Since we are focused on costs for the 2025 model year, for the I3 and I4 inline engines, we simply reduced the cost of the Miller technology in 2025 by the $93 cost of the Atkinson2 engine in 2025. This represented a 16% reduction in cost. The cost of Atkinson2 technology varies between V6 and V8 engines, while the cost of Miller technology is the same and not separated in EPA’s costing system. A 16% reduction in the $1015 EPA 2025 cost for a v-configuration engine would be a cost reduction of $159. This is equivalent to a 77/23 weighting of the 2025 Atkinson2 costs for V6 and V8 engines, respectively. We determined this weighting was reasonable and applied the $159 cost reduction to the EPA Miller technology cost in 2025 for v-configuration engines. The EPA base costs for Miller technology were multiplied by the ratio of ICCT to EPA costs in 2025 to obtain ICCT base costs for entry into the OMEGA_TechCosts_Inputs.xlsx spreadsheet.
E. Turbocharging
ICCT identified electrically assisted turbocharging or e-boost as an additional approach to turbocharging that was not included in EPA’s analysis for the Final Determination. . ICCT projects that this technology could increase the efficiency of turbocharging by 5% at a cost of $338 in 2025.We declined to include this technology in our analysis however, based on some uncertainties related to EPA’s preprocessors for both cost and fuel efficiency. Regarding cost, it was unclear which of three turbocharging options could be enhanced by e-boost: the 18 bar turbocharger, the 24 bar turbocharger, or the turbocharger associated with the Miller cycle
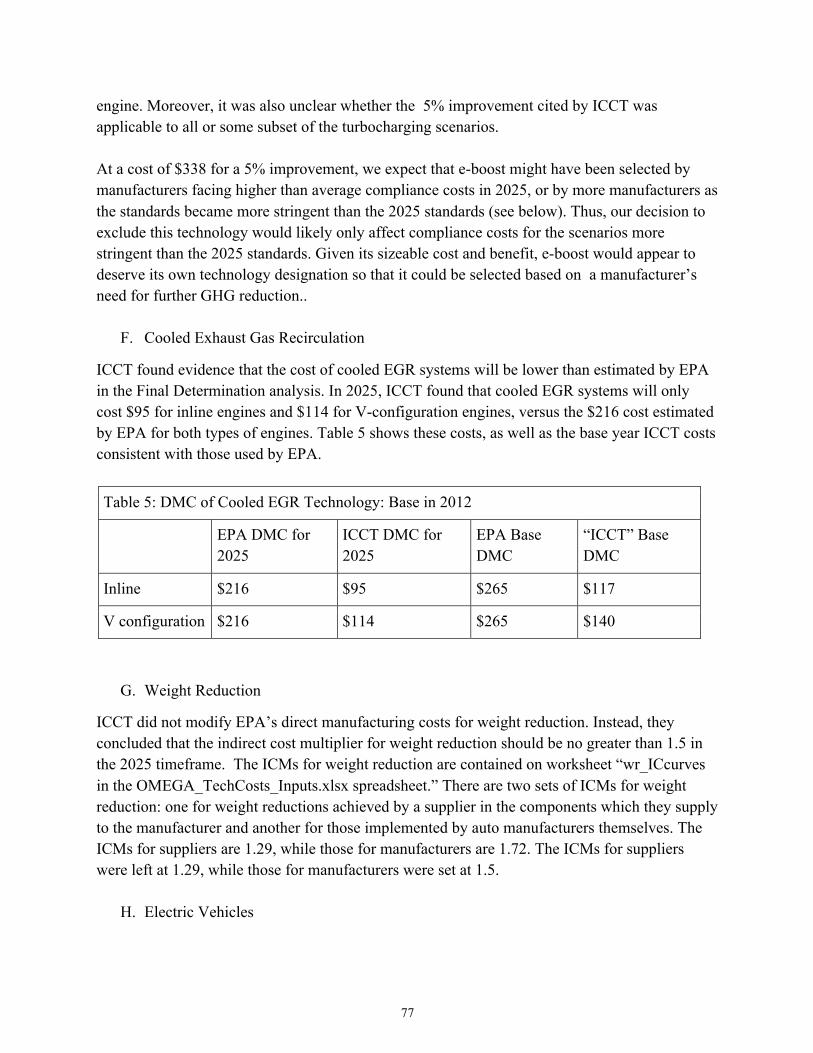
77
engine. Moreover, it was also unclear whether the 5% improvement cited by ICCT was applicable to all or some subset of the turbocharging scenarios. At a cost of $338 for a 5% improvement, we expect that e-boost might have been selected by manufacturers facing higher than average compliance costs in 2025, or by more manufacturers as the standards became more stringent than the 2025 standards (see below). Thus, our decision to exclude this technology would likely only affect compliance costs for the scenarios more stringent than the 2025 standards. Given its sizeable cost and benefit, e-boost would appear to deserve its own technology designation so that it could be selected based on a manufacturer’s need for further GHG reduction..
F. Cooled Exhaust Gas Recirculation
ICCT found evidence that the cost of cooled EGR systems will be lower than estimated by EPA in the Final Determination analysis. In 2025, ICCT found that cooled EGR systems will only cost $95 for inline engines and $114 for V-configuration engines, versus the $216 cost estimated by EPA for both types of engines. Table 5 shows these costs, as well as the base year ICCT costs consistent with those used by EPA.
Table 5: DMC of Cooled EGR Technology: Base in 2012
EPA DMC for 2025
ICCT DMC for 2025
EPA Base DMC
“ICCT” Base DMC
Inline $216 $95 $265 $117
V configuration $216 $114 $265 $140
G. Weight Reduction
ICCT did not modify EPA’s direct manufacturing costs for weight reduction. Instead, they concluded that the indirect cost multiplier for weight reduction should be no greater than 1.5 in the 2025 timeframe. The ICMs for weight reduction are contained on worksheet “wr_ICcurves in the OMEGA_TechCosts_Inputs.xlsx spreadsheet.” There are two sets of ICMs for weight reduction: one for weight reductions achieved by a supplier in the components which they supply to the manufacturer and another for those implemented by auto manufacturers themselves. The ICMs for suppliers are 1.29, while those for manufacturers are 1.72. The ICMs for suppliers were left at 1.29, while those for manufacturers were set at 1.5.
H. Electric Vehicles
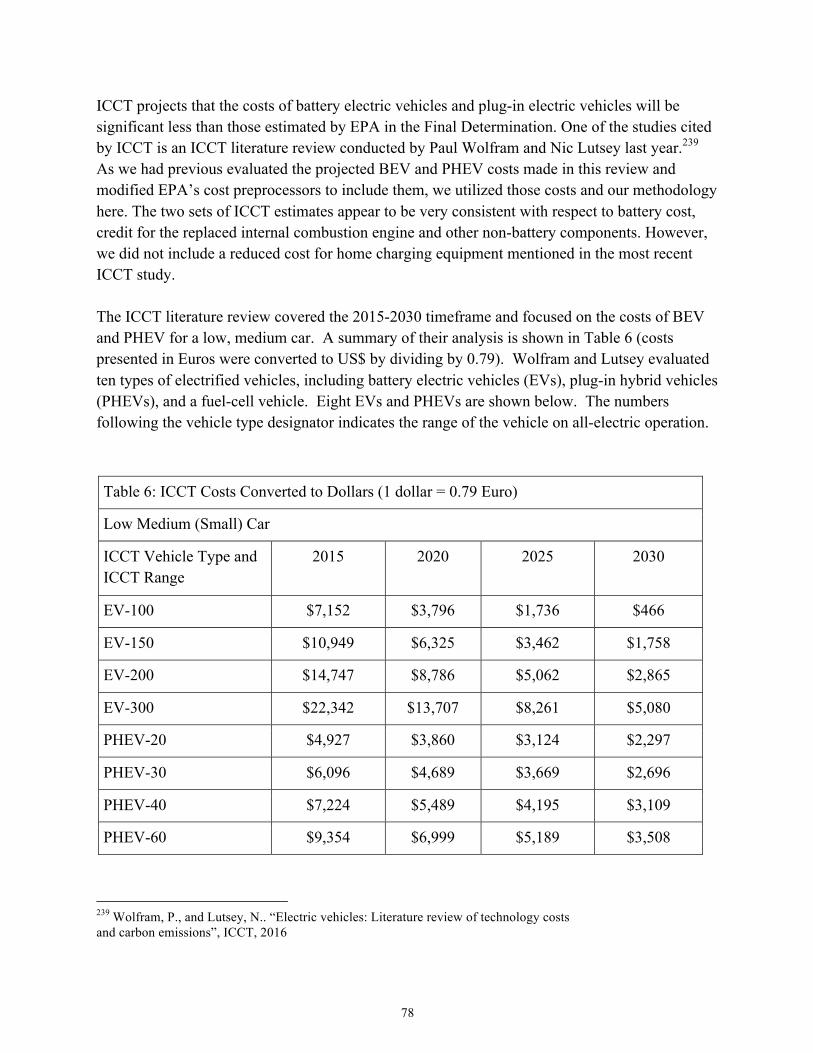
78
ICCT projects that the costs of battery electric vehicles and plug-in electric vehicles will be significant less than those estimated by EPA in the Final Determination. One of the studies cited by ICCT is an ICCT literature review conducted by Paul Wolfram and Nic Lutsey last year.239 As we had previous evaluated the projected BEV and PHEV costs made in this review and modified EPA’s cost preprocessors to include them, we utilized those costs and our methodology here. The two sets of ICCT estimates appear to be very consistent with respect to battery cost, credit for the replaced internal combustion engine and other non-battery components. However, we did not include a reduced cost for home charging equipment mentioned in the most recent ICCT study. The ICCT literature review covered the 2015-2030 timeframe and focused on the costs of BEV and PHEV for a low, medium car. A summary of their analysis is shown in Table 6 (costs presented in Euros were converted to US$ by dividing by 0.79). Wolfram and Lutsey evaluated ten types of electrified vehicles, including battery electric vehicles (EVs), plug-in hybrid vehicles (PHEVs), and a fuel-cell vehicle. Eight EVs and PHEVs are shown below. The numbers following the vehicle type designator indicates the range of the vehicle on all-electric operation.
Table 6: ICCT Costs Converted to Dollars (1 dollar = 0.79 Euro)
Low Medium (Small) Car
ICCT Vehicle Type and ICCT Range
2015 2020 2025 2030
EV-100 $7,152 $3,796 $1,736 $466
EV-150 $10,949 $6,325 $3,462 $1,758
EV-200 $14,747 $8,786 $5,062 $2,865
EV-300 $22,342 $13,707 $8,261 $5,080
PHEV-20 $4,927 $3,860 $3,124 $2,297
PHEV-30 $6,096 $4,689 $3,669 $2,696
PHEV-40 $7,224 $5,489 $4,195 $3,109
PHEV-60 $9,354 $6,999 $5,189 $3,508
239 Wolfram, P., and Lutsey, N.. “Electric vehicles: Literature review of technology costs and carbon emissions”, ICCT, 2016
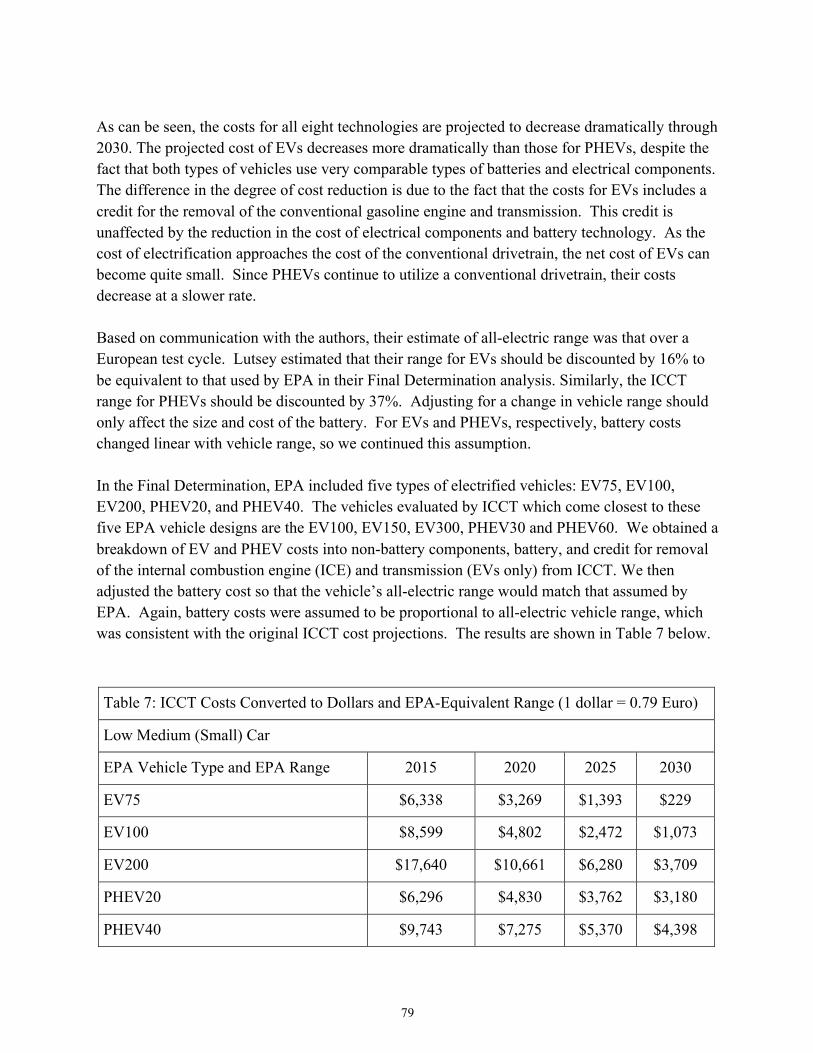
79
As can be seen, the costs for all eight technologies are projected to decrease dramatically through 2030. The projected cost of EVs decreases more dramatically than those for PHEVs, despite the fact that both types of vehicles use very comparable types of batteries and electrical components. The difference in the degree of cost reduction is due to the fact that the costs for EVs includes a credit for the removal of the conventional gasoline engine and transmission. This credit is unaffected by the reduction in the cost of electrical components and battery technology. As the cost of electrification approaches the cost of the conventional drivetrain, the net cost of EVs can become quite small. Since PHEVs continue to utilize a conventional drivetrain, their costs decrease at a slower rate. Based on communication with the authors, their estimate of all-electric range was that over a European test cycle. Lutsey estimated that their range for EVs should be discounted by 16% to be equivalent to that used by EPA in their Final Determination analysis. Similarly, the ICCT range for PHEVs should be discounted by 37%. Adjusting for a change in vehicle range should only affect the size and cost of the battery. For EVs and PHEVs, respectively, battery costs changed linear with vehicle range, so we continued this assumption. In the Final Determination, EPA included five types of electrified vehicles: EV75, EV100, EV200, PHEV20, and PHEV40. The vehicles evaluated by ICCT which come closest to these five EPA vehicle designs are the EV100, EV150, EV300, PHEV30 and PHEV60. We obtained a breakdown of EV and PHEV costs into non-battery components, battery, and credit for removal of the internal combustion engine (ICE) and transmission (EVs only) from ICCT. We then adjusted the battery cost so that the vehicle’s all-electric range would match that assumed by EPA. Again, battery costs were assumed to be proportional to all-electric vehicle range, which was consistent with the original ICCT cost projections. The results are shown in Table 7 below.
Table 7: ICCT Costs Converted to Dollars and EPA-Equivalent Range (1 dollar = 0.79 Euro)
Low Medium (Small) Car
EPA Vehicle Type and EPA Range 2015 2020 2025 2030
EV75 $6,338 $3,269 $1,393 $229
EV100 $8,599 $4,802 $2,472 $1,073
EV200 $17,640 $10,661 $6,280 $3,709
PHEV20 $6,296 $4,830 $3,762 $3,180
PHEV40 $9,743 $7,275 $5,370 $4,398
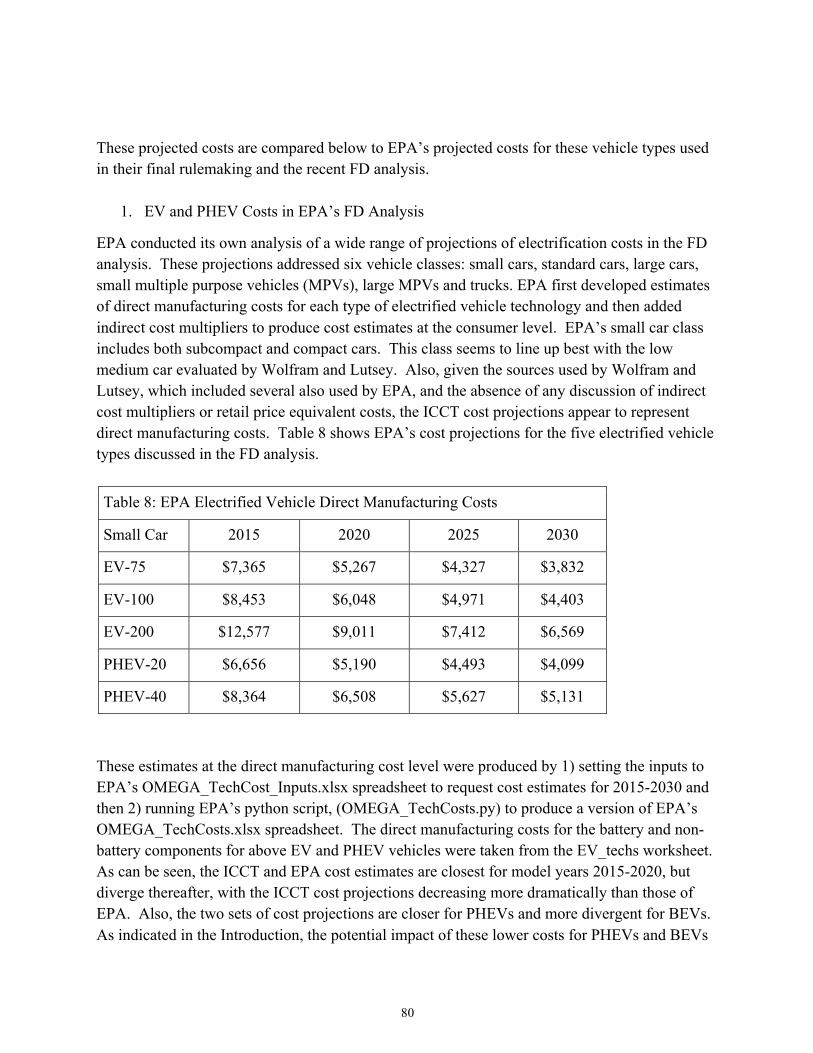
80
These projected costs are compared below to EPA’s projected costs for these vehicle types used in their final rulemaking and the recent FD analysis.
1. EV and PHEV Costs in EPA’s FD Analysis
EPA conducted its own analysis of a wide range of projections of electrification costs in the FD analysis. These projections addressed six vehicle classes: small cars, standard cars, large cars, small multiple purpose vehicles (MPVs), large MPVs and trucks. EPA first developed estimates of direct manufacturing costs for each type of electrified vehicle technology and then added indirect cost multipliers to produce cost estimates at the consumer level. EPA’s small car class includes both subcompact and compact cars. This class seems to line up best with the low medium car evaluated by Wolfram and Lutsey. Also, given the sources used by Wolfram and Lutsey, which included several also used by EPA, and the absence of any discussion of indirect cost multipliers or retail price equivalent costs, the ICCT cost projections appear to represent direct manufacturing costs. Table 8 shows EPA’s cost projections for the five electrified vehicle types discussed in the FD analysis.
Table 8: EPA Electrified Vehicle Direct Manufacturing Costs
Small Car 2015 2020 2025 2030
EV-75 $7,365 $5,267 $4,327 $3,832
EV-100 $8,453 $6,048 $4,971 $4,403
EV-200 $12,577 $9,011 $7,412 $6,569
PHEV-20 $6,656 $5,190 $4,493 $4,099
PHEV-40 $8,364 $6,508 $5,627 $5,131
These estimates at the direct manufacturing cost level were produced by 1) setting the inputs to EPA’s OMEGA_TechCost_Inputs.xlsx spreadsheet to request cost estimates for 2015-2030 and then 2) running EPA’s python script, (OMEGA_TechCosts.py) to produce a version of EPA’s OMEGA_TechCosts.xlsx spreadsheet. The direct manufacturing costs for the battery and non-battery components for above EV and PHEV vehicles were taken from the EV_techs worksheet. As can be seen, the ICCT and EPA cost estimates are closest for model years 2015-2020, but diverge thereafter, with the ICCT cost projections decreasing more dramatically than those of EPA. Also, the two sets of cost projections are closer for PHEVs and more divergent for BEVs. As indicated in the Introduction, the potential impact of these lower costs for PHEVs and BEVs
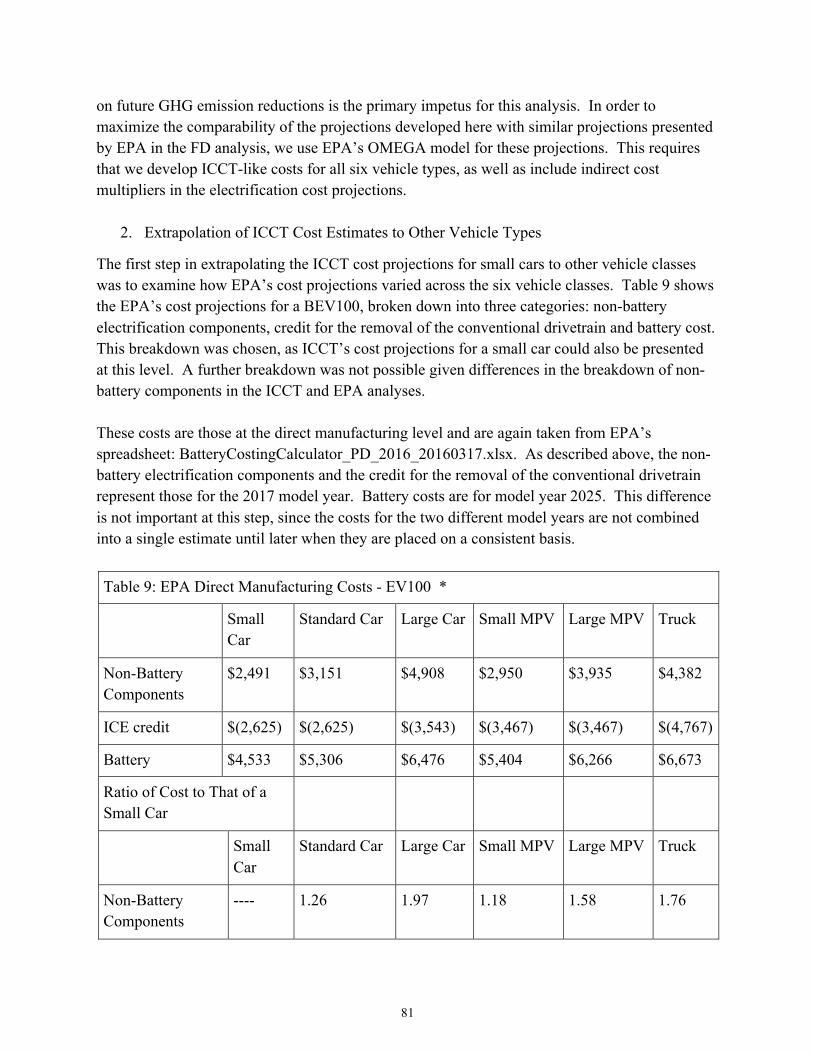
81
on future GHG emission reductions is the primary impetus for this analysis. In order to maximize the comparability of the projections developed here with similar projections presented by EPA in the FD analysis, we use EPA’s OMEGA model for these projections. This requires that we develop ICCT-like costs for all six vehicle types, as well as include indirect cost multipliers in the electrification cost projections.
2. Extrapolation of ICCT Cost Estimates to Other Vehicle Types
The first step in extrapolating the ICCT cost projections for small cars to other vehicle classes was to examine how EPA’s cost projections varied across the six vehicle classes. Table 9 shows the EPA’s cost projections for a BEV100, broken down into three categories: non-battery electrification components, credit for the removal of the conventional drivetrain and battery cost. This breakdown was chosen, as ICCT’s cost projections for a small car could also be presented at this level. A further breakdown was not possible given differences in the breakdown of non-battery components in the ICCT and EPA analyses. These costs are those at the direct manufacturing level and are again taken from EPA’s spreadsheet: BatteryCostingCalculator_PD_2016_20160317.xlsx. As described above, the non-battery electrification components and the credit for the removal of the conventional drivetrain represent those for the 2017 model year. Battery costs are for model year 2025. This difference is not important at this step, since the costs for the two different model years are not combined into a single estimate until later when they are placed on a consistent basis.
Table 9: EPA Direct Manufacturing Costs - EV100 *
Small Car
Standard Car Large Car Small MPV Large MPV Truck
Non-Battery Components
$2,491 $3,151 $4,908 $2,950 $3,935 $4,382
ICE credit $(2,625) $(2,625) $(3,543) $(3,467) $(3,467) $(4,767)
Battery $4,533 $5,306 $6,476 $5,404 $6,266 $6,673
Ratio of Cost to That of a Small Car
Small Car
Standard Car Large Car Small MPV Large MPV Truck
Non-Battery Components
---- 1.26 1.97 1.18 1.58 1.76
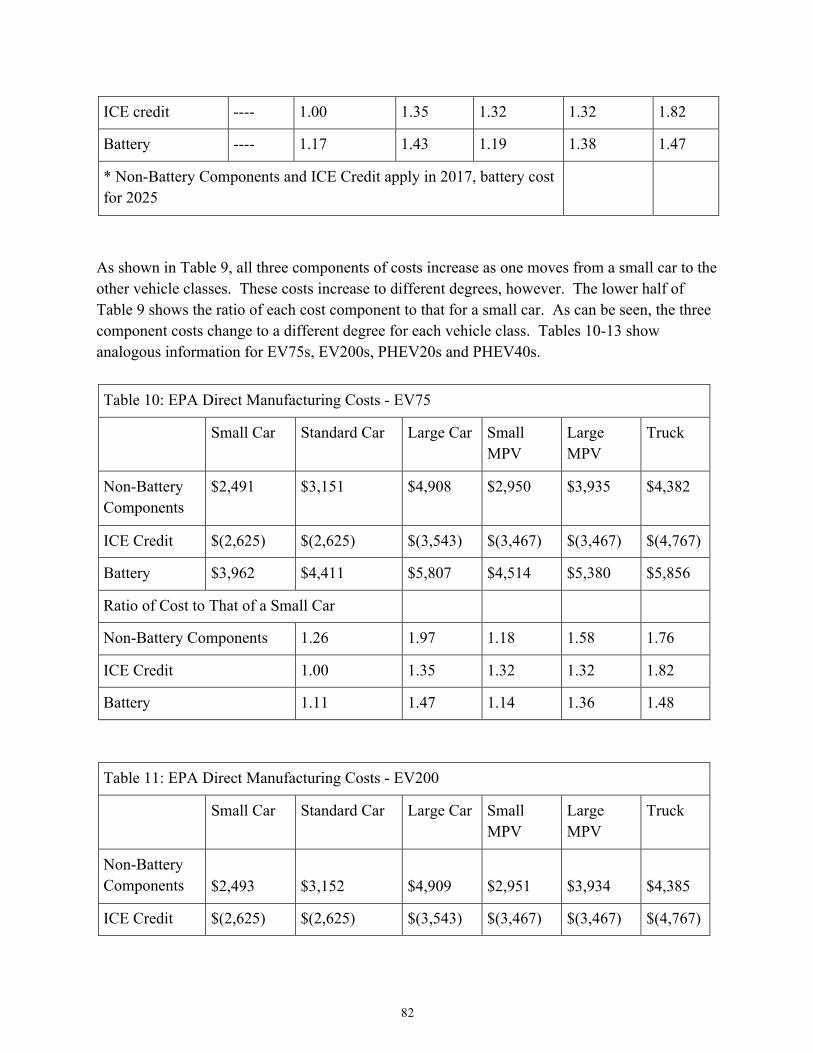
82
ICE credit ---- 1.00 1.35 1.32 1.32 1.82
Battery ---- 1.17 1.43 1.19 1.38 1.47
* Non-Battery Components and ICE Credit apply in 2017, battery cost for 2025
As shown in Table 9, all three components of costs increase as one moves from a small car to the other vehicle classes. These costs increase to different degrees, however. The lower half of Table 9 shows the ratio of each cost component to that for a small car. As can be seen, the three component costs change to a different degree for each vehicle class. Tables 10-13 show analogous information for EV75s, EV200s, PHEV20s and PHEV40s.
Table 10: EPA Direct Manufacturing Costs - EV75
Small Car Standard Car Large Car Small MPV
Large MPV
Truck
Non-Battery Components
$2,491 $3,151 $4,908 $2,950 $3,935 $4,382
ICE Credit $(2,625) $(2,625) $(3,543) $(3,467) $(3,467) $(4,767)
Battery $3,962 $4,411 $5,807 $4,514 $5,380 $5,856
Ratio of Cost to That of a Small Car
Non-Battery Components 1.26 1.97 1.18 1.58 1.76
ICE Credit 1.00 1.35 1.32 1.32 1.82
Battery 1.11 1.47 1.14 1.36 1.48
Table 11: EPA Direct Manufacturing Costs - EV200
Small Car Standard Car Large Car Small MPV
Large MPV
Truck
Non-Battery Components $2,493 $3,152 $4,909 $2,951 $3,934 $4,385
ICE Credit $(2,625) $(2,625) $(3,543) $(3,467) $(3,467) $(4,767)
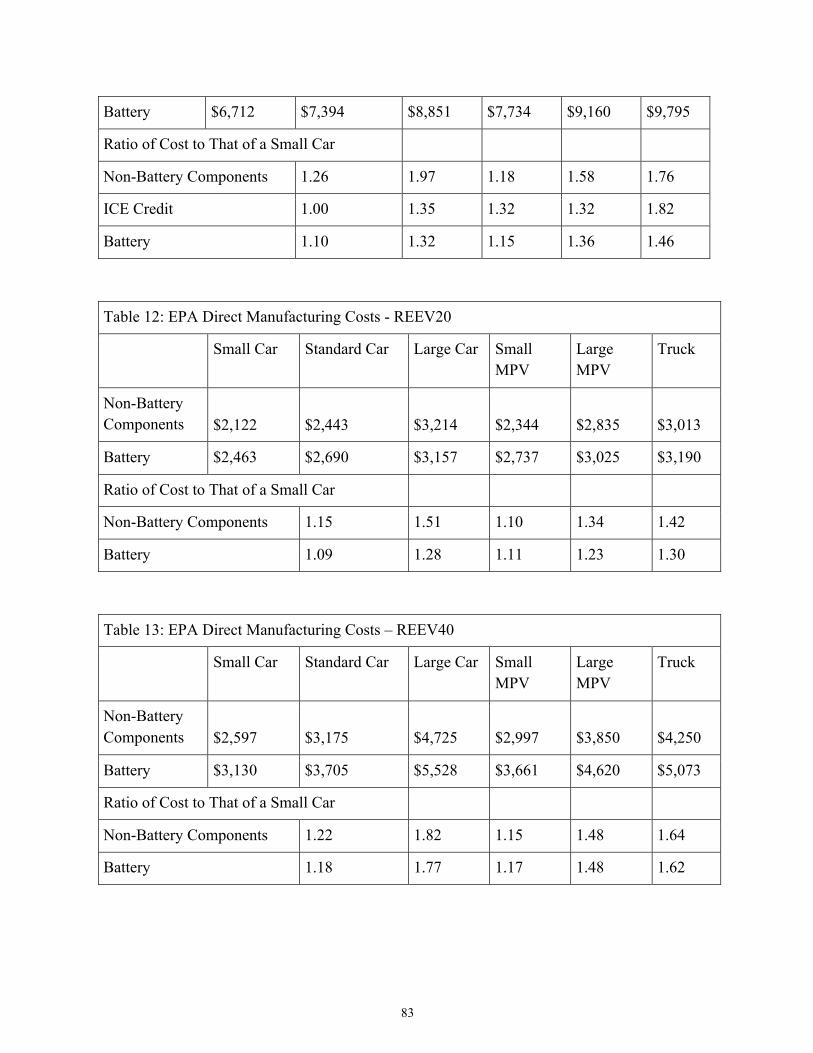
83
Battery $6,712 $7,394 $8,851 $7,734 $9,160 $9,795
Ratio of Cost to That of a Small Car
Non-Battery Components 1.26 1.97 1.18 1.58 1.76
ICE Credit 1.00 1.35 1.32 1.32 1.82
Battery 1.10 1.32 1.15 1.36 1.46
Table 12: EPA Direct Manufacturing Costs - REEV20
Small Car Standard Car Large Car Small MPV
Large MPV
Truck
Non-Battery Components $2,122 $2,443 $3,214 $2,344 $2,835 $3,013
Battery $2,463 $2,690 $3,157 $2,737 $3,025 $3,190
Ratio of Cost to That of a Small Car
Non-Battery Components 1.15 1.51 1.10 1.34 1.42
Battery 1.09 1.28 1.11 1.23 1.30
Table 13: EPA Direct Manufacturing Costs – REEV40
Small Car Standard Car Large Car Small MPV
Large MPV
Truck
Non-Battery Components $2,597 $3,175 $4,725 $2,997 $3,850 $4,250
Battery $3,130 $3,705 $5,528 $3,661 $4,620 $5,073
Ratio of Cost to That of a Small Car
Non-Battery Components 1.22 1.82 1.15 1.48 1.64
Battery 1.18 1.77 1.17 1.48 1.62
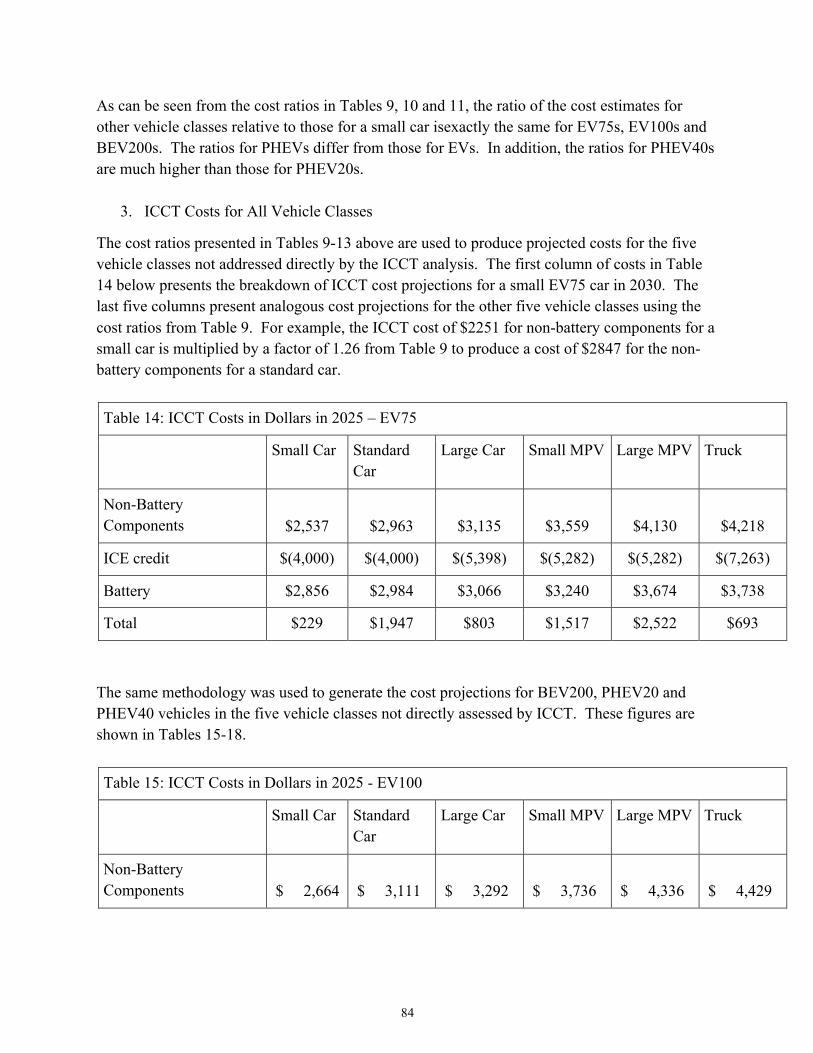
84
As can be seen from the cost ratios in Tables 9, 10 and 11, the ratio of the cost estimates for other vehicle classes relative to those for a small car isexactly the same for EV75s, EV100s and BEV200s. The ratios for PHEVs differ from those for EVs. In addition, the ratios for PHEV40s are much higher than those for PHEV20s.
3. ICCT Costs for All Vehicle Classes
The cost ratios presented in Tables 9-13 above are used to produce projected costs for the five vehicle classes not addressed directly by the ICCT analysis. The first column of costs in Table 14 below presents the breakdown of ICCT cost projections for a small EV75 car in 2030. The last five columns present analogous cost projections for the other five vehicle classes using the cost ratios from Table 9. For example, the ICCT cost of $2251 for non-battery components for a small car is multiplied by a factor of 1.26 from Table 9 to produce a cost of $2847 for the non-battery components for a standard car.
Table 14: ICCT Costs in Dollars in 2025 – EV75
Small Car Standard Car
Large Car Small MPV Large MPV Truck
Non-Battery Components $2,537 $2,963 $3,135 $3,559 $4,130 $4,218
ICE credit $(4,000) $(4,000) $(5,398) $(5,282) $(5,282) $(7,263)
Battery $2,856 $2,984 $3,066 $3,240 $3,674 $3,738
Total $229 $1,947 $803 $1,517 $2,522 $693
The same methodology was used to generate the cost projections for BEV200, PHEV20 and PHEV40 vehicles in the five vehicle classes not directly assessed by ICCT. These figures are shown in Tables 15-18.
Table 15: ICCT Costs in Dollars in 2025 - EV100
Small Car Standard Car
Large Car Small MPV Large MPV Truck
Non-Battery Components $ 2,664 $ 3,111 $ 3,292 $ 3,736 $ 4,336 $ 4,429
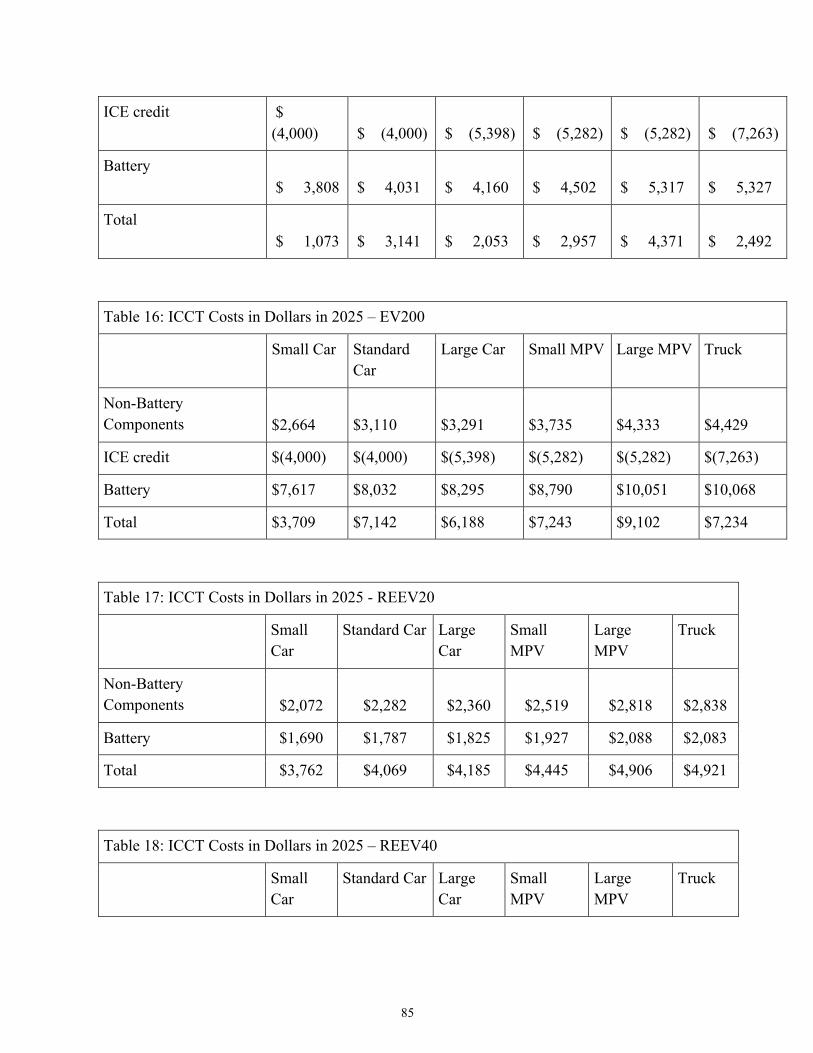
85
ICE credit $ (4,000) $ (4,000) $ (5,398) $ (5,282) $ (5,282) $ (7,263)
Battery $ 3,808 $ 4,031 $ 4,160 $ 4,502 $ 5,317 $ 5,327
Total $ 1,073 $ 3,141 $ 2,053 $ 2,957 $ 4,371 $ 2,492
Table 16: ICCT Costs in Dollars in 2025 – EV200
Small Car Standard Car
Large Car Small MPV Large MPV Truck
Non-Battery Components $2,664 $3,110 $3,291 $3,735 $4,333 $4,429
ICE credit $(4,000) $(4,000) $(5,398) $(5,282) $(5,282) $(7,263)
Battery $7,617 $8,032 $8,295 $8,790 $10,051 $10,068
Total $3,709 $7,142 $6,188 $7,243 $9,102 $7,234
Table 17: ICCT Costs in Dollars in 2025 - REEV20
Small Car
Standard Car Large Car
Small MPV
Large MPV
Truck
Non-Battery Components $2,072 $2,282 $2,360 $2,519 $2,818 $2,838
Battery $1,690 $1,787 $1,825 $1,927 $2,088 $2,083
Total $3,762 $4,069 $4,185 $4,445 $4,906 $4,921
Table 18: ICCT Costs in Dollars in 2025 – REEV40
Small Car
Standard Car Large Car
Small MPV
Large MPV
Truck
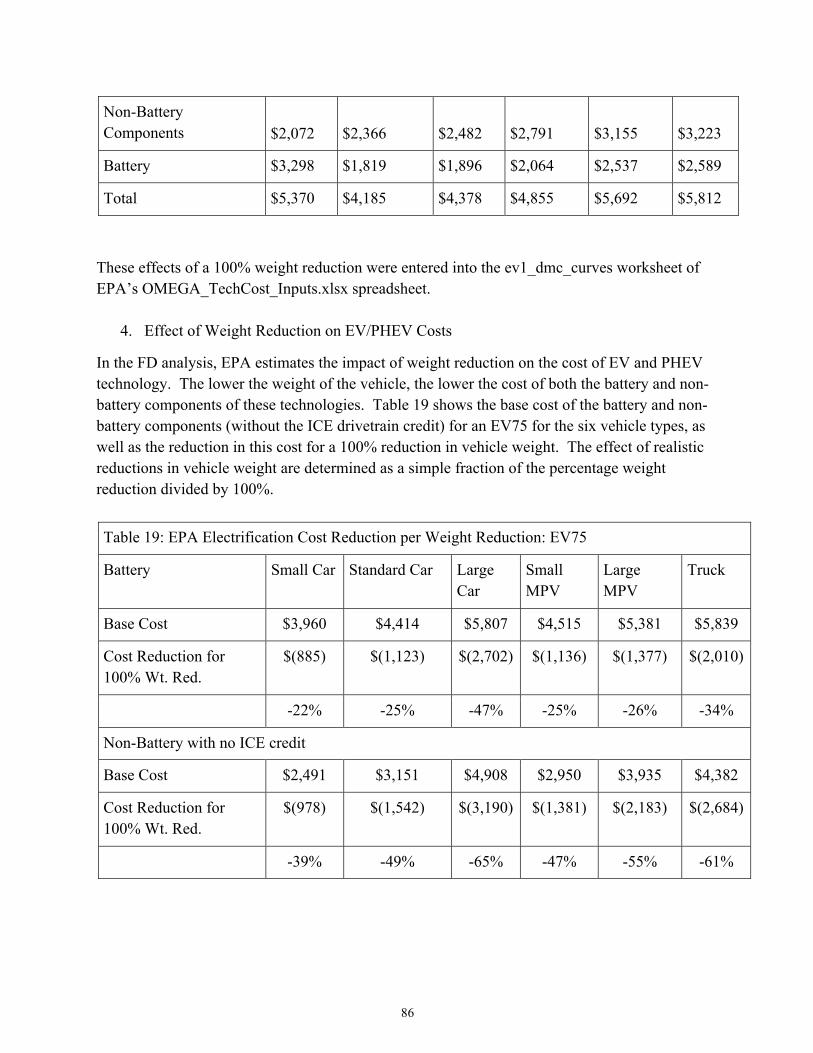
86
Non-Battery Components $2,072 $2,366 $2,482 $2,791 $3,155 $3,223
Battery $3,298 $1,819 $1,896 $2,064 $2,537 $2,589
Total $5,370 $4,185 $4,378 $4,855 $5,692 $5,812
These effects of a 100% weight reduction were entered into the ev1_dmc_curves worksheet of EPA’s OMEGA_TechCost_Inputs.xlsx spreadsheet.
4. Effect of Weight Reduction on EV/PHEV Costs
In the FD analysis, EPA estimates the impact of weight reduction on the cost of EV and PHEV technology. The lower the weight of the vehicle, the lower the cost of both the battery and non-battery components of these technologies. Table 19 shows the base cost of the battery and non-battery components (without the ICE drivetrain credit) for an EV75 for the six vehicle types, as well as the reduction in this cost for a 100% reduction in vehicle weight. The effect of realistic reductions in vehicle weight are determined as a simple fraction of the percentage weight reduction divided by 100%.
Table 19: EPA Electrification Cost Reduction per Weight Reduction: EV75
Battery Small Car Standard Car Large Car
Small MPV
Large MPV
Truck
Base Cost $3,960 $4,414 $5,807 $4,515 $5,381 $5,839
Cost Reduction for 100% Wt. Red.
$(885) $(1,123) $(2,702) $(1,136) $(1,377) $(2,010)
-22% -25% -47% -25% -26% -34%
Non-Battery with no ICE credit
Base Cost $2,491 $3,151 $4,908 $2,950 $3,935 $4,382
Cost Reduction for 100% Wt. Red.
$(978) $(1,542) $(3,190) $(1,381) $(2,183) $(2,684)
-39% -49% -65% -47% -55% -61%
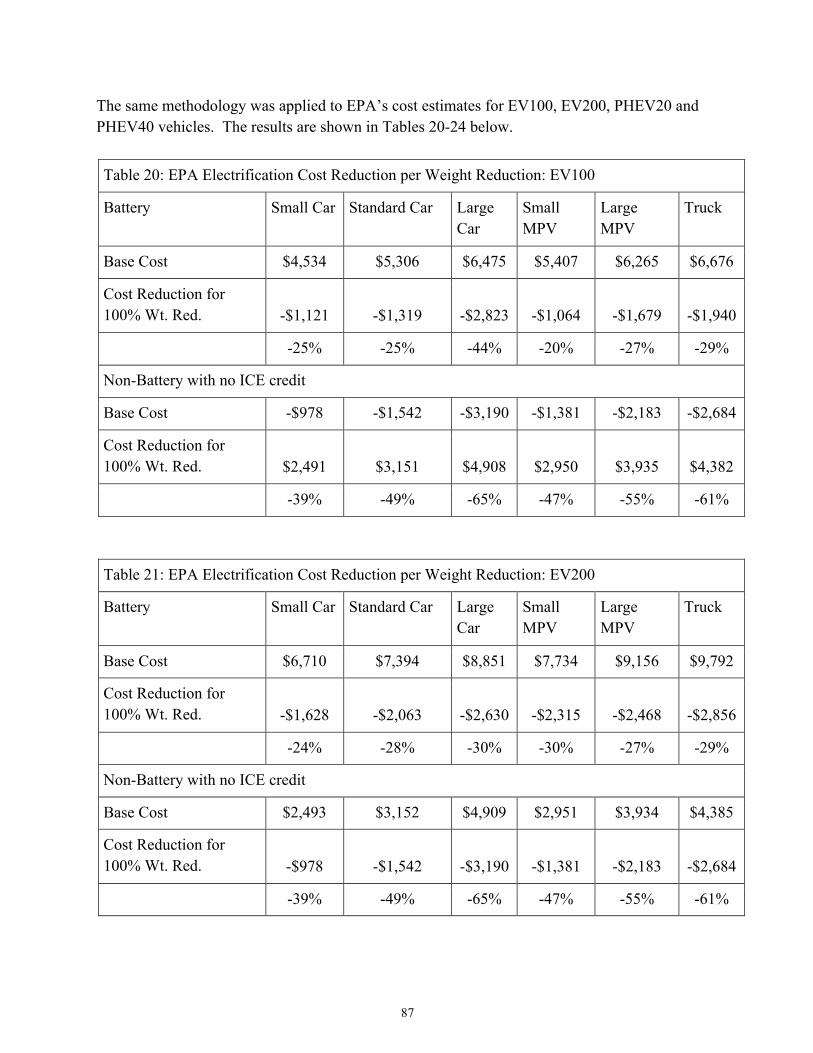
87
The same methodology was applied to EPA’s cost estimates for EV100, EV200, PHEV20 and PHEV40 vehicles. The results are shown in Tables 20-24 below.
Table 20: EPA Electrification Cost Reduction per Weight Reduction: EV100
Battery Small Car Standard Car Large Car
Small MPV
Large MPV
Truck
Base Cost $4,534 $5,306 $6,475 $5,407 $6,265 $6,676
Cost Reduction for 100% Wt. Red. -$1,121 -$1,319 -$2,823 -$1,064 -$1,679 -$1,940
-25% -25% -44% -20% -27% -29%
Non-Battery with no ICE credit
Base Cost -$978 -$1,542 -$3,190 -$1,381 -$2,183 -$2,684
Cost Reduction for 100% Wt. Red. $2,491 $3,151 $4,908 $2,950 $3,935 $4,382
-39% -49% -65% -47% -55% -61%
Table 21: EPA Electrification Cost Reduction per Weight Reduction: EV200
Battery Small Car Standard Car Large Car
Small MPV
Large MPV
Truck
Base Cost $6,710 $7,394 $8,851 $7,734 $9,156 $9,792
Cost Reduction for 100% Wt. Red. -$1,628 -$2,063 -$2,630 -$2,315 -$2,468 -$2,856
-24% -28% -30% -30% -27% -29%
Non-Battery with no ICE credit
Base Cost $2,493 $3,152 $4,909 $2,951 $3,934 $4,385
Cost Reduction for 100% Wt. Red. -$978 -$1,542 -$3,190 -$1,381 -$2,183 -$2,684
-39% -49% -65% -47% -55% -61%
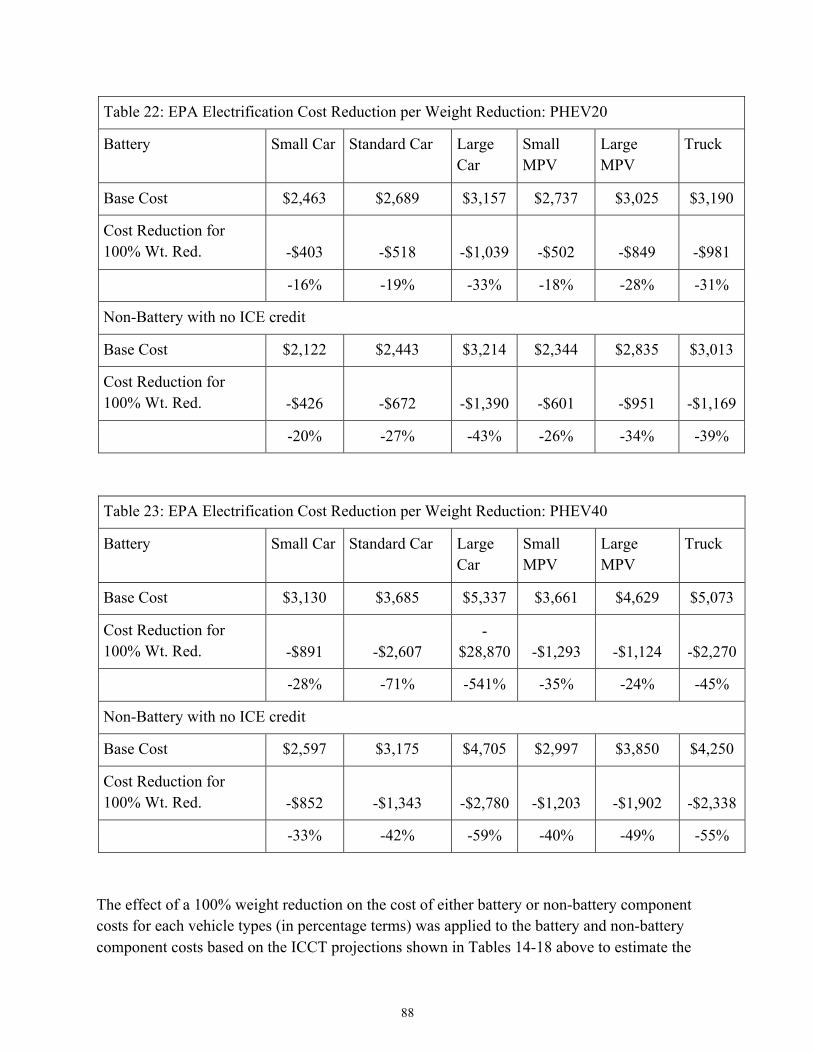
88
Table 22: EPA Electrification Cost Reduction per Weight Reduction: PHEV20
Battery Small Car Standard Car Large Car
Small MPV
Large MPV
Truck
Base Cost $2,463 $2,689 $3,157 $2,737 $3,025 $3,190
Cost Reduction for 100% Wt. Red. -$403 -$518 -$1,039 -$502 -$849 -$981
-16% -19% -33% -18% -28% -31%
Non-Battery with no ICE credit
Base Cost $2,122 $2,443 $3,214 $2,344 $2,835 $3,013
Cost Reduction for 100% Wt. Red. -$426 -$672 -$1,390 -$601 -$951 -$1,169
-20% -27% -43% -26% -34% -39%
Table 23: EPA Electrification Cost Reduction per Weight Reduction: PHEV40
Battery Small Car Standard Car Large Car
Small MPV
Large MPV
Truck
Base Cost $3,130 $3,685 $5,337 $3,661 $4,629 $5,073
Cost Reduction for 100% Wt. Red. -$891 -$2,607
-$28,870 -$1,293 -$1,124 -$2,270
-28% -71% -541% -35% -24% -45%
Non-Battery with no ICE credit
Base Cost $2,597 $3,175 $4,705 $2,997 $3,850 $4,250
Cost Reduction for 100% Wt. Red. -$852 -$1,343 -$2,780 -$1,203 -$1,902 -$2,338
-33% -42% -59% -40% -49% -55%
The effect of a 100% weight reduction on the cost of either battery or non-battery component costs for each vehicle types (in percentage terms) was applied to the battery and non-battery component costs based on the ICCT projections shown in Tables 14-18 above to estimate the
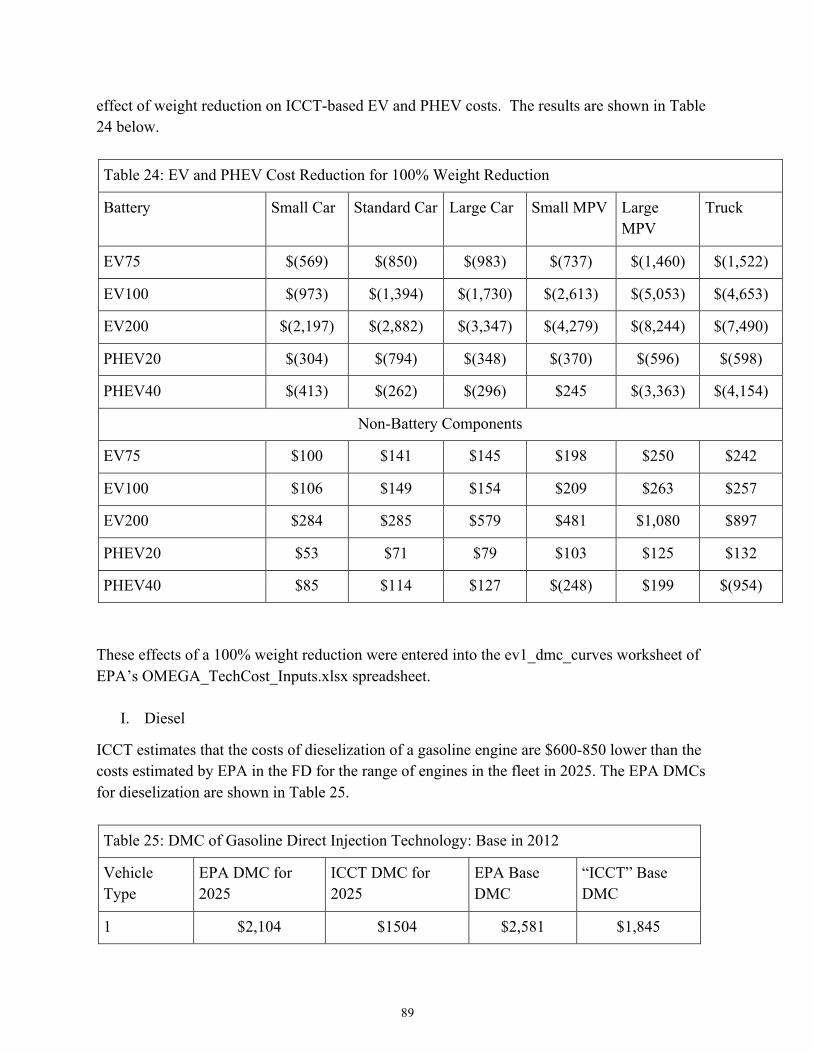
89
effect of weight reduction on ICCT-based EV and PHEV costs. The results are shown in Table 24 below.
Table 24: EV and PHEV Cost Reduction for 100% Weight Reduction
Battery Small Car Standard Car Large Car Small MPV Large MPV
Truck
EV75 $(569) $(850) $(983) $(737) $(1,460) $(1,522)
EV100 $(973) $(1,394) $(1,730) $(2,613) $(5,053) $(4,653)
EV200 $(2,197) $(2,882) $(3,347) $(4,279) $(8,244) $(7,490)
PHEV20 $(304) $(794) $(348) $(370) $(596) $(598)
PHEV40 $(413) $(262) $(296) $245 $(3,363) $(4,154)
Non-Battery Components
EV75 $100 $141 $145 $198 $250 $242
EV100 $106 $149 $154 $209 $263 $257
EV200 $284 $285 $579 $481 $1,080 $897
PHEV20 $53 $71 $79 $103 $125 $132
PHEV40 $85 $114 $127 $(248) $199 $(954)
These effects of a 100% weight reduction were entered into the ev1_dmc_curves worksheet of EPA’s OMEGA_TechCost_Inputs.xlsx spreadsheet.
I. Diesel
ICCT estimates that the costs of dieselization of a gasoline engine are $600-850 lower than the costs estimated by EPA in the FD for the range of engines in the fleet in 2025. The EPA DMCs for dieselization are shown in Table 25.
Table 25: DMC of Gasoline Direct Injection Technology: Base in 2012
Vehicle Type
EPA DMC for 2025
ICCT DMC for 2025
EPA Base DMC
“ICCT” Base DMC
1 $2,104 $1504 $2,581 $1,845
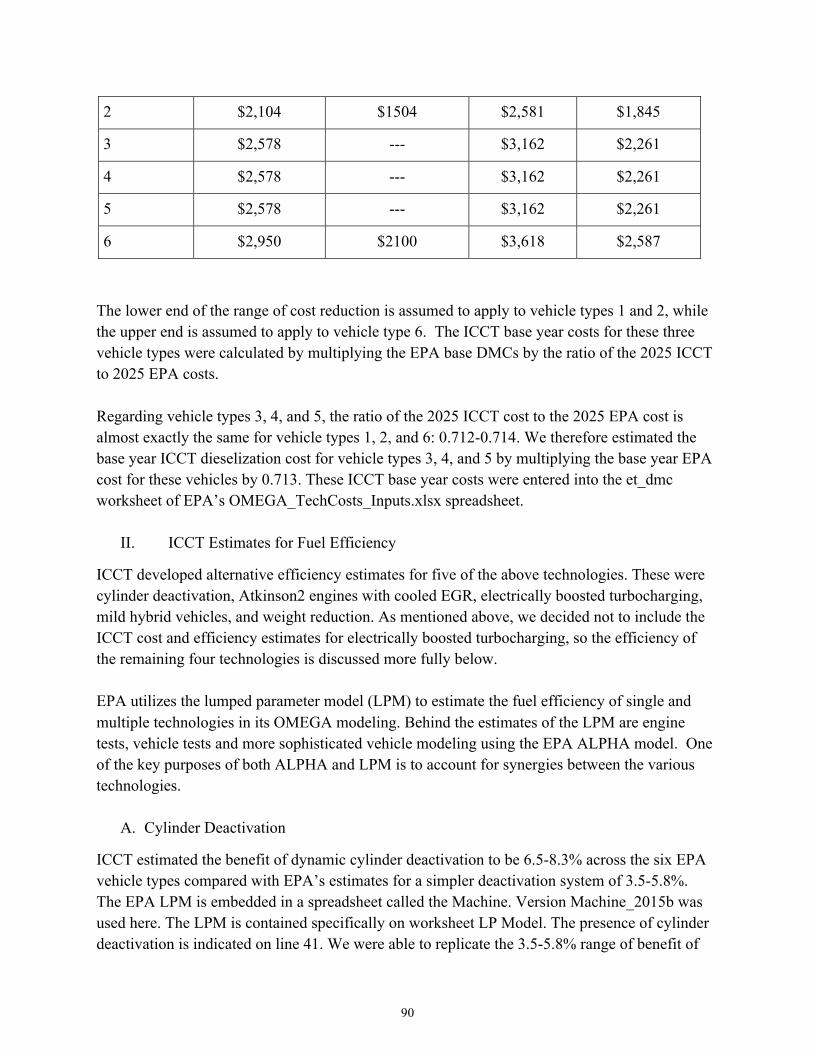
90
2 $2,104 $1504 $2,581 $1,845
3 $2,578 --- $3,162 $2,261
4 $2,578 --- $3,162 $2,261
5 $2,578 --- $3,162 $2,261
6 $2,950 $2100 $3,618 $2,587
The lower end of the range of cost reduction is assumed to apply to vehicle types 1 and 2, while the upper end is assumed to apply to vehicle type 6. The ICCT base year costs for these three vehicle types were calculated by multiplying the EPA base DMCs by the ratio of the 2025 ICCT to 2025 EPA costs. Regarding vehicle types 3, 4, and 5, the ratio of the 2025 ICCT cost to the 2025 EPA cost is almost exactly the same for vehicle types 1, 2, and 6: 0.712-0.714. We therefore estimated the base year ICCT dieselization cost for vehicle types 3, 4, and 5 by multiplying the base year EPA cost for these vehicles by 0.713. These ICCT base year costs were entered into the et_dmc worksheet of EPA’s OMEGA_TechCosts_Inputs.xlsx spreadsheet.
II. ICCT Estimates for Fuel Efficiency
ICCT developed alternative efficiency estimates for five of the above technologies. These were cylinder deactivation, Atkinson2 engines with cooled EGR, electrically boosted turbocharging, mild hybrid vehicles, and weight reduction. As mentioned above, we decided not to include the ICCT cost and efficiency estimates for electrically boosted turbocharging, so the efficiency of the remaining four technologies is discussed more fully below. EPA utilizes the lumped parameter model (LPM) to estimate the fuel efficiency of single and multiple technologies in its OMEGA modeling. Behind the estimates of the LPM are engine tests, vehicle tests and more sophisticated vehicle modeling using the EPA ALPHA model. One of the key purposes of both ALPHA and LPM is to account for synergies between the various technologies.
A. Cylinder Deactivation
ICCT estimated the benefit of dynamic cylinder deactivation to be 6.5-8.3% across the six EPA vehicle types compared with EPA’s estimates for a simpler deactivation system of 3.5-5.8%. The EPA LPM is embedded in a spreadsheet called the Machine. Version Machine_2015b was used here. The LPM is contained specifically on worksheet LP Model. The presence of cylinder deactivation is indicated on line 41. We were able to replicate the 3.5-5.8% range of benefit of
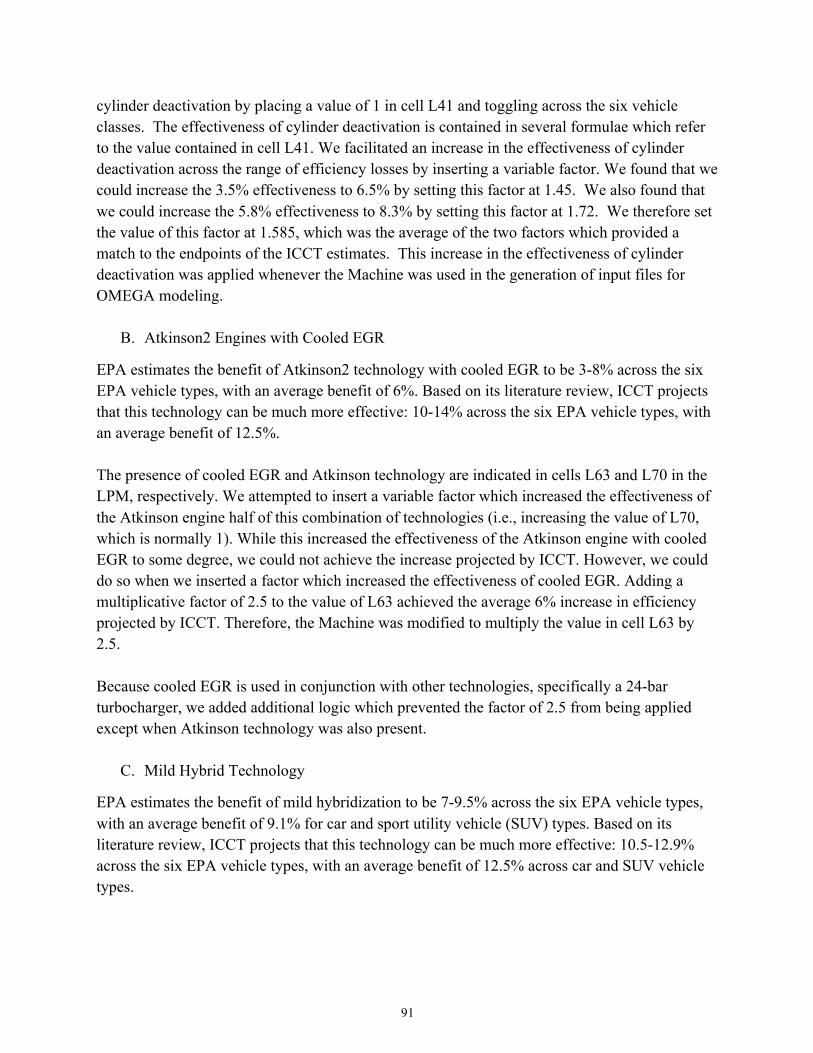
91
cylinder deactivation by placing a value of 1 in cell L41 and toggling across the six vehicle classes. The effectiveness of cylinder deactivation is contained in several formulae which refer to the value contained in cell L41. We facilitated an increase in the effectiveness of cylinder deactivation across the range of efficiency losses by inserting a variable factor. We found that we could increase the 3.5% effectiveness to 6.5% by setting this factor at 1.45. We also found that we could increase the 5.8% effectiveness to 8.3% by setting this factor at 1.72. We therefore set the value of this factor at 1.585, which was the average of the two factors which provided a match to the endpoints of the ICCT estimates. This increase in the effectiveness of cylinder deactivation was applied whenever the Machine was used in the generation of input files for OMEGA modeling.
B. Atkinson2 Engines with Cooled EGR
EPA estimates the benefit of Atkinson2 technology with cooled EGR to be 3-8% across the six EPA vehicle types, with an average benefit of 6%. Based on its literature review, ICCT projects that this technology can be much more effective: 10-14% across the six EPA vehicle types, with an average benefit of 12.5%. The presence of cooled EGR and Atkinson technology are indicated in cells L63 and L70 in the LPM, respectively. We attempted to insert a variable factor which increased the effectiveness of the Atkinson engine half of this combination of technologies (i.e., increasing the value of L70, which is normally 1). While this increased the effectiveness of the Atkinson engine with cooled EGR to some degree, we could not achieve the increase projected by ICCT. However, we could do so when we inserted a factor which increased the effectiveness of cooled EGR. Adding a multiplicative factor of 2.5 to the value of L63 achieved the average 6% increase in efficiency projected by ICCT. Therefore, the Machine was modified to multiply the value in cell L63 by 2.5. Because cooled EGR is used in conjunction with other technologies, specifically a 24-bar turbocharger, we added additional logic which prevented the factor of 2.5 from being applied except when Atkinson technology was also present.
C. Mild Hybrid Technology
EPA estimates the benefit of mild hybridization to be 7-9.5% across the six EPA vehicle types, with an average benefit of 9.1% for car and sport utility vehicle (SUV) types. Based on its literature review, ICCT projects that this technology can be much more effective: 10.5-12.9% across the six EPA vehicle types, with an average benefit of 12.5% across car and SUV vehicle types.
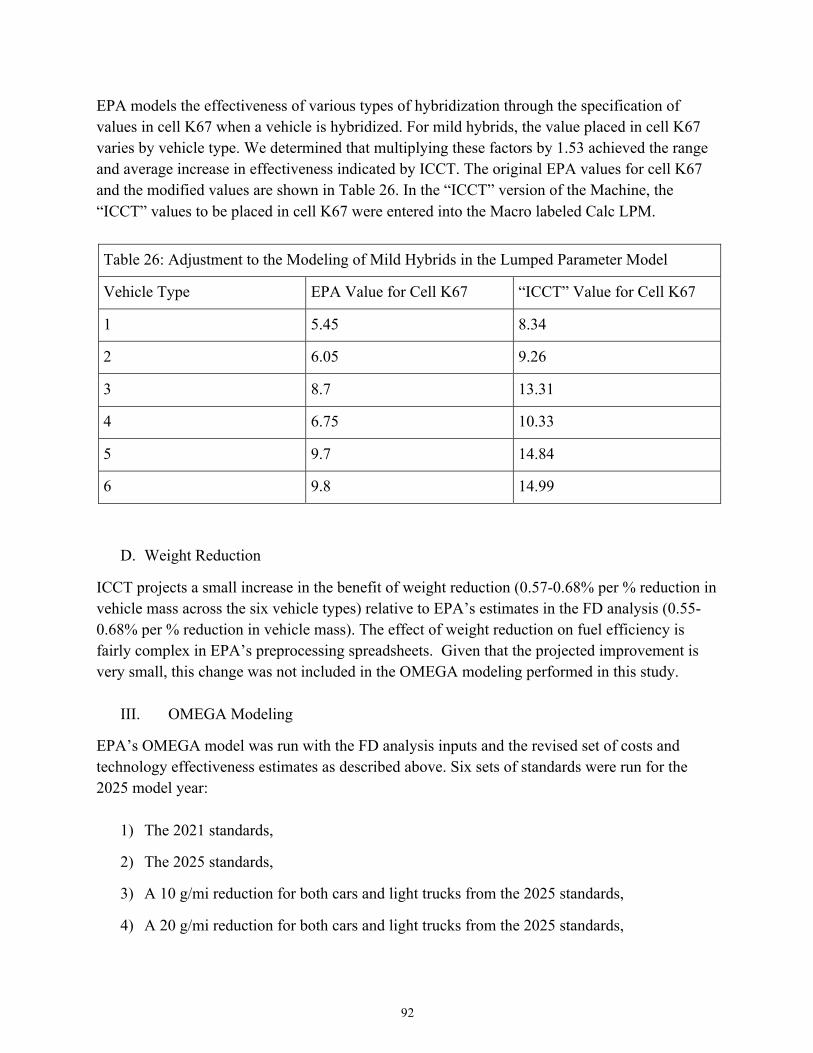
92
EPA models the effectiveness of various types of hybridization through the specification of values in cell K67 when a vehicle is hybridized. For mild hybrids, the value placed in cell K67 varies by vehicle type. We determined that multiplying these factors by 1.53 achieved the range and average increase in effectiveness indicated by ICCT. The original EPA values for cell K67 and the modified values are shown in Table 26. In the “ICCT” version of the Machine, the “ICCT” values to be placed in cell K67 were entered into the Macro labeled Calc LPM.
Table 26: Adjustment to the Modeling of Mild Hybrids in the Lumped Parameter Model
Vehicle Type EPA Value for Cell K67 “ICCT” Value for Cell K67
1 5.45 8.34
2 6.05 9.26
3 8.7 13.31
4 6.75 10.33
5 9.7 14.84
6 9.8 14.99
D. Weight Reduction
ICCT projects a small increase in the benefit of weight reduction (0.57-0.68% per % reduction in vehicle mass across the six vehicle types) relative to EPA’s estimates in the FD analysis (0.55-0.68% per % reduction in vehicle mass). The effect of weight reduction on fuel efficiency is fairly complex in EPA’s preprocessing spreadsheets. Given that the projected improvement is very small, this change was not included in the OMEGA modeling performed in this study.
III. OMEGA Modeling
EPA’s OMEGA model was run with the FD analysis inputs and the revised set of costs and technology effectiveness estimates as described above. Six sets of standards were run for the 2025 model year:
1) The 2021 standards,
2) The 2025 standards,
3) A 10 g/mi reduction for both cars and light trucks from the 2025 standards,
4) A 20 g/mi reduction for both cars and light trucks from the 2025 standards,
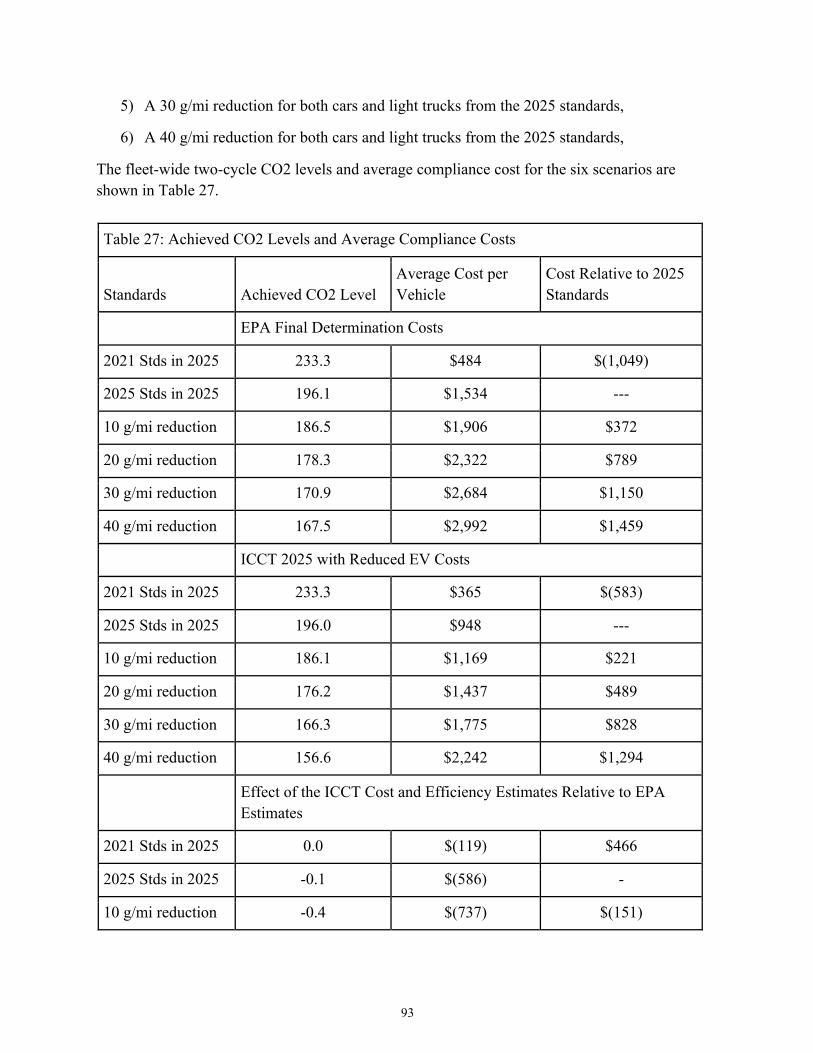
93
5) A 30 g/mi reduction for both cars and light trucks from the 2025 standards,
6) A 40 g/mi reduction for both cars and light trucks from the 2025 standards,
The fleet-wide two-cycle CO2 levels and average compliance cost for the six scenarios are shown in Table 27.
Table 27: Achieved CO2 Levels and Average Compliance Costs
Standards Achieved CO2 Level Average Cost per Vehicle
Cost Relative to 2025 Standards
EPA Final Determination Costs
2021 Stds in 2025 233.3 $484 $(1,049)
2025 Stds in 2025 196.1 $1,534 ---
10 g/mi reduction 186.5 $1,906 $372
20 g/mi reduction 178.3 $2,322 $789
30 g/mi reduction 170.9 $2,684 $1,150
40 g/mi reduction 167.5 $2,992 $1,459
ICCT 2025 with Reduced EV Costs
2021 Stds in 2025 233.3 $365 $(583)
2025 Stds in 2025 196.0 $948 ---
10 g/mi reduction 186.1 $1,169 $221
20 g/mi reduction 176.2 $1,437 $489
30 g/mi reduction 166.3 $1,775 $828
40 g/mi reduction 156.6 $2,242 $1,294
Effect of the ICCT Cost and Efficiency Estimates Relative to EPA Estimates
2021 Stds in 2025 0.0 $(119) $466
2025 Stds in 2025 -0.1 $(586) -
10 g/mi reduction -0.4 $(737) $(151)
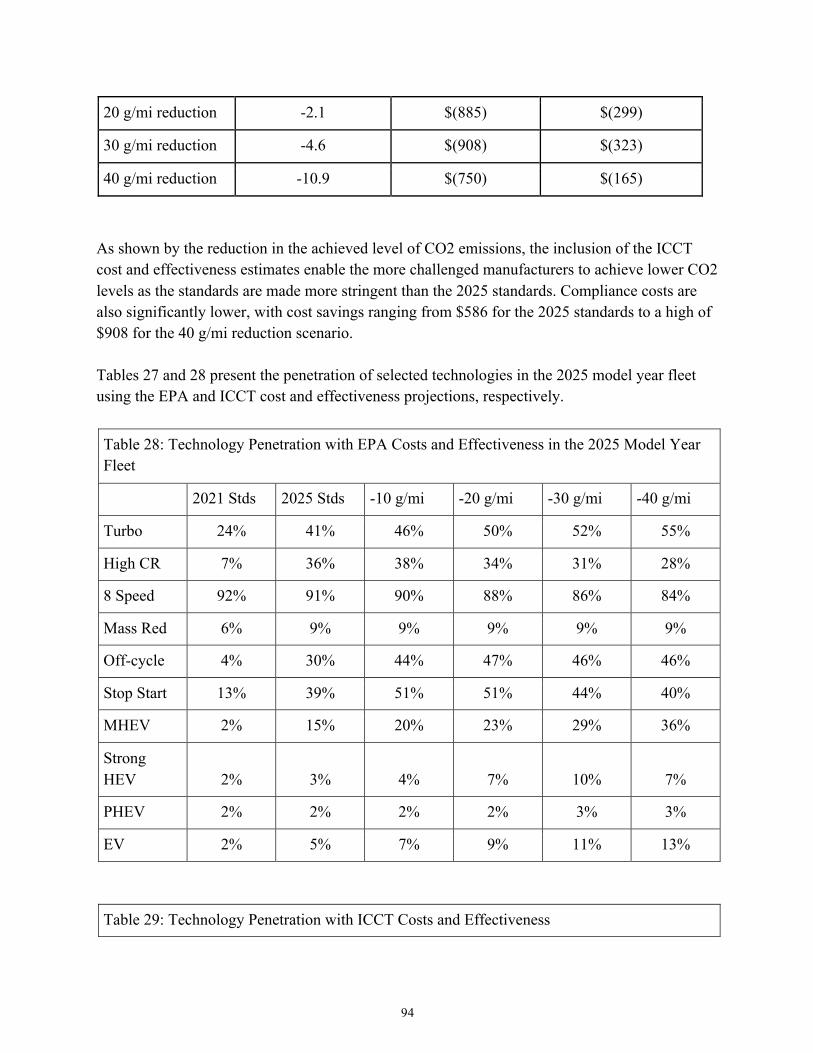
94
20 g/mi reduction -2.1 $(885) $(299)
30 g/mi reduction -4.6 $(908) $(323)
40 g/mi reduction -10.9 $(750) $(165)
As shown by the reduction in the achieved level of CO2 emissions, the inclusion of the ICCT cost and effectiveness estimates enable the more challenged manufacturers to achieve lower CO2 levels as the standards are made more stringent than the 2025 standards. Compliance costs are also significantly lower, with cost savings ranging from $586 for the 2025 standards to a high of $908 for the 40 g/mi reduction scenario. Tables 27 and 28 present the penetration of selected technologies in the 2025 model year fleet using the EPA and ICCT cost and effectiveness projections, respectively.
Table 28: Technology Penetration with EPA Costs and Effectiveness in the 2025 Model Year Fleet
2021 Stds 2025 Stds -10 g/mi -20 g/mi -30 g/mi -40 g/mi
Turbo 24% 41% 46% 50% 52% 55%
High CR 7% 36% 38% 34% 31% 28%
8 Speed 92% 91% 90% 88% 86% 84%
Mass Red 6% 9% 9% 9% 9% 9%
Off-cycle 4% 30% 44% 47% 46% 46%
Stop Start 13% 39% 51% 51% 44% 40%
MHEV 2% 15% 20% 23% 29% 36%
Strong HEV 2% 3% 4% 7% 10% 7%
PHEV 2% 2% 2% 2% 3% 3%
EV 2% 5% 7% 9% 11% 13%
Table 29: Technology Penetration with ICCT Costs and Effectiveness
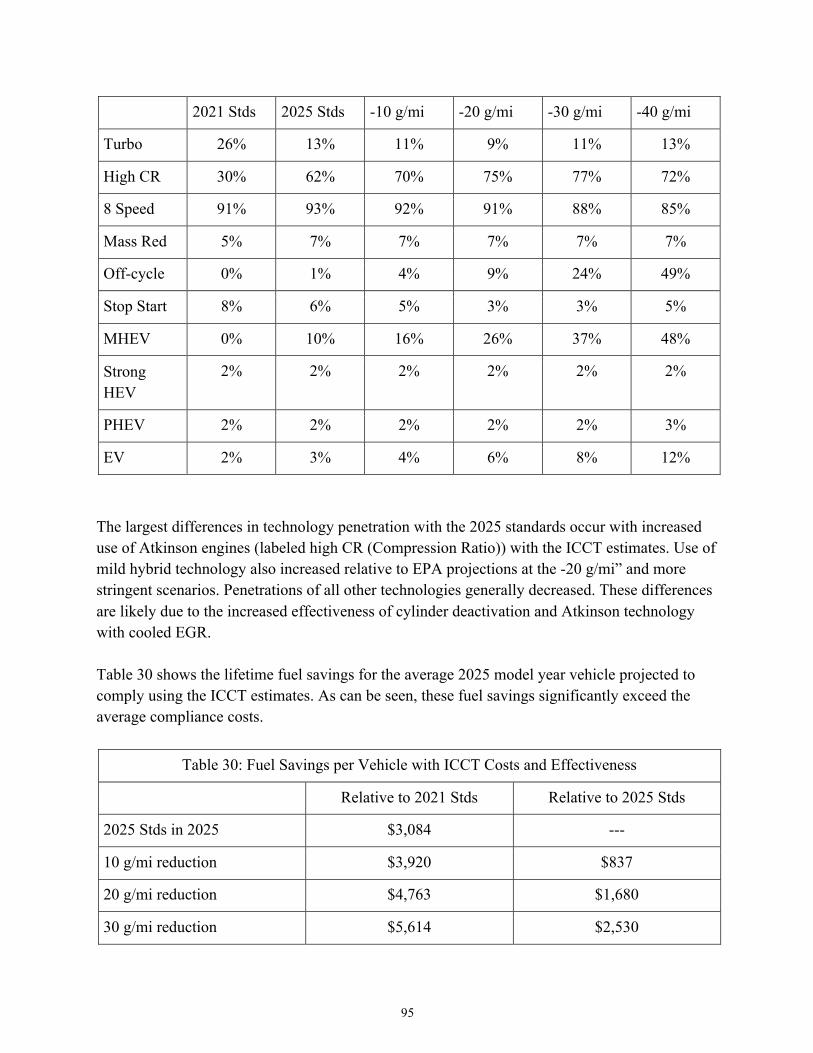
95
2021 Stds 2025 Stds -10 g/mi -20 g/mi -30 g/mi -40 g/mi
Turbo 26% 13% 11% 9% 11% 13%
High CR 30% 62% 70% 75% 77% 72%
8 Speed 91% 93% 92% 91% 88% 85%
Mass Red 5% 7% 7% 7% 7% 7%
Off-cycle 0% 1% 4% 9% 24% 49%
Stop Start 8% 6% 5% 3% 3% 5%
MHEV 0% 10% 16% 26% 37% 48%
Strong HEV
2% 2% 2% 2% 2% 2%
PHEV 2% 2% 2% 2% 2% 3%
EV 2% 3% 4% 6% 8% 12%
The largest differences in technology penetration with the 2025 standards occur with increased use of Atkinson engines (labeled high CR (Compression Ratio)) with the ICCT estimates. Use of mild hybrid technology also increased relative to EPA projections at the -20 g/mi” and more stringent scenarios. Penetrations of all other technologies generally decreased. These differences are likely due to the increased effectiveness of cylinder deactivation and Atkinson technology with cooled EGR. Table 30 shows the lifetime fuel savings for the average 2025 model year vehicle projected to comply using the ICCT estimates. As can be seen, these fuel savings significantly exceed the average compliance costs.
Table 30: Fuel Savings per Vehicle with ICCT Costs and Effectiveness
Relative to 2021 Stds Relative to 2025 Stds
2025 Stds in 2025 $3,084 ---
10 g/mi reduction $3,920 $837
20 g/mi reduction $4,763 $1,680
30 g/mi reduction $5,614 $2,530
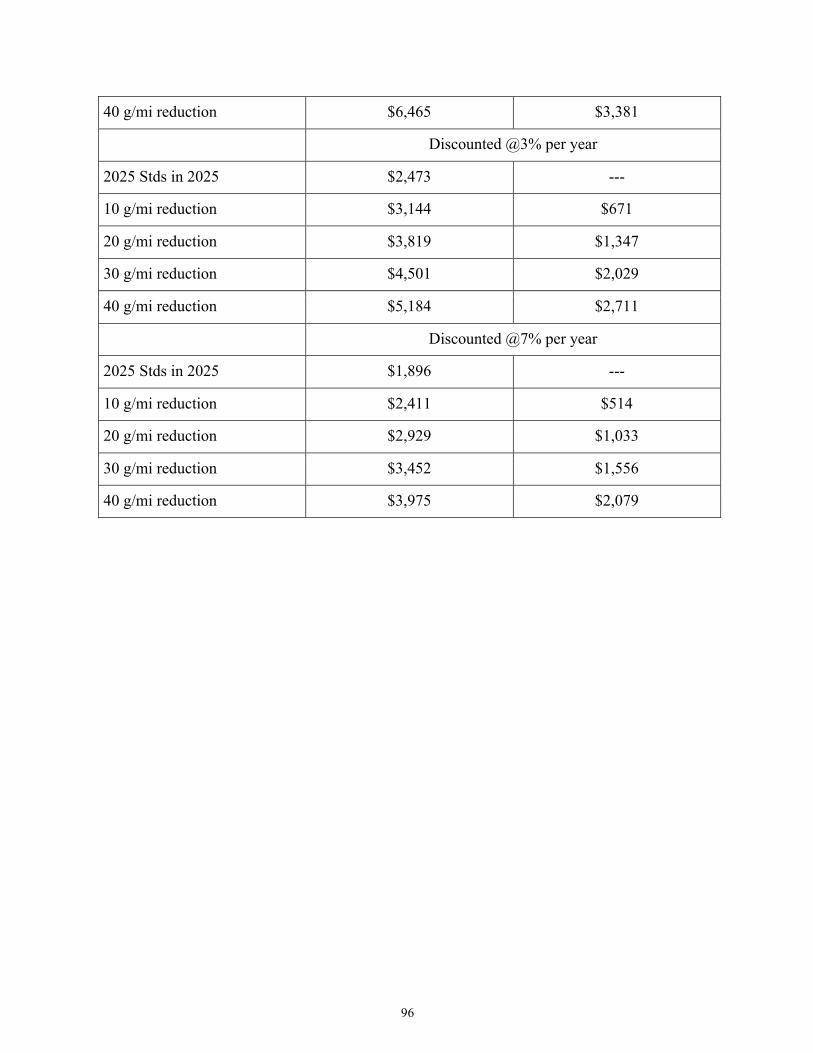
96
40 g/mi reduction $6,465 $3,381
Discounted @3% per year
2025 Stds in 2025 $2,473 ---
10 g/mi reduction $3,144 $671
20 g/mi reduction $3,819 $1,347
30 g/mi reduction $4,501 $2,029
40 g/mi reduction $5,184 $2,711
Discounted @7% per year
2025 Stds in 2025 $1,896 ---
10 g/mi reduction $2,411 $514
20 g/mi reduction $2,929 $1,033
30 g/mi reduction $3,452 $1,556
40 g/mi reduction $3,975 $2,079
97
Attachment C – Emissions Impact of Relaxed Fuel Economy and GHG Emission Standards
EPA and NHTSA have indicated that they may be re-evaluating the level of the GHG and fuel economy standards for the 2021 model year as part of their respective efforts related to reviewing and setting MY 2022-2025 standards. 240 EPA’s reconsideration of the Final Determination and NHTSA’s upcoming rule actions have the potential to affect the levels of the 2021-2025 GHG emission standards already promulgated by EPA. To further illustrate the benefits of the MY2021 standards and the MY2022-2025 standards, EDF conducted an analysis to quantify the potential clean air benefits that are at risk if EPA reconsiders the MY2021 standards or takes action to weaken the MY2022-2025 standards. The CO2 emission impacts are primarily due to the weakening of the fuel economy and GHG emission standards. Additional CO2 emission impacts are associated with the increased level of gasoline production. The criteria emission impacts are due primarily to the increased level of gasoline production, as the applicable vehicle emission standards for criteria pollutants would be unaffected. However, increased fuel economy reduces the cost of driving, which is projected to marginally increase the demand for driving (i.e., VMT). Increased VMT increases CO2 and criteria emissions. Weakening future GHG (and fuel economy) standards from those already promulgated will increase the cost of driving, therefore reducing the projected increase in VMT and vehicular emissions accordingly. The emission impacts were estimated using the most recent version of EPA’s ICBT benefits model, which was developed for the recent Final Determination regarding the review of the 2025 GHG standards. As the focus of this study was solely emissions, and not economic impacts, only two inputs to the ICBT model needed to be adjusted: CO2 emission targets for 2021-2025 and vehicular electricity usage.
As mentioned above, two scenarios were developed to bracket the potential emissions impacts.241 The first scenario assumed that the 2020 standards were extended indefinitely. The second scenario reduced the degree of emission control achieved by the 2025 standards by 50%. The intermediate standards applicable in the 2021-24 model years were adjusted to reflect a constant g/mi CO2 decrease in the car and truck standards between 2020 and 2025, respectively. The CO2 standards as currently promulgated and the two weakened scenarios for passenger cars and light trucks are shown in Tables 1 and 2.
Table 1: GHG Emission Standards for Passenger Cars (g/mi)
240 EPA Request for Comment, 82 Fed. Reg. at 39,553. 241 Both of these two scenarios are presented solely for the basis of comparison, as they each reflect extreme and indefensible approaches.
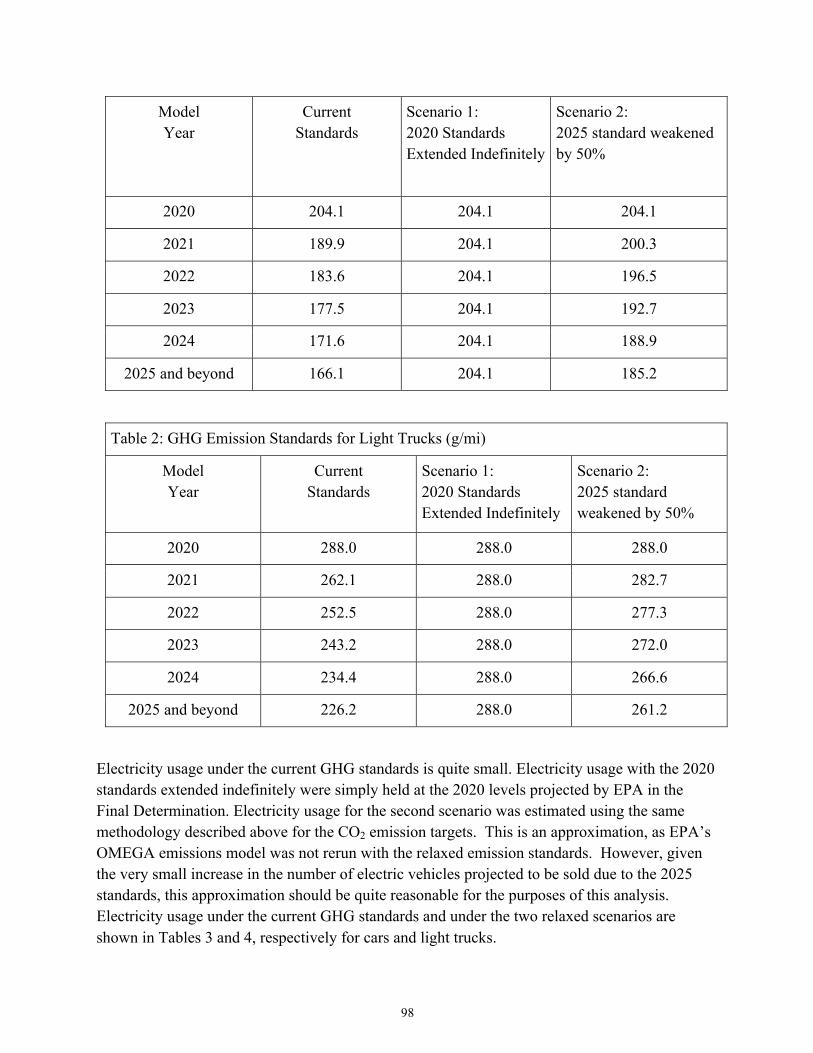
98
Model Year
Current Standards
Scenario 1: 2020 Standards Extended Indefinitely
Scenario 2: 2025 standard weakened by 50%
2020 204.1 204.1 204.1
2021 189.9 204.1 200.3
2022 183.6 204.1 196.5
2023 177.5 204.1 192.7
2024 171.6 204.1 188.9
2025 and beyond 166.1 204.1 185.2
Table 2: GHG Emission Standards for Light Trucks (g/mi)
Model Year
Current Standards
Scenario 1: 2020 Standards Extended Indefinitely
Scenario 2: 2025 standard weakened by 50%
2020 288.0 288.0 288.0
2021 262.1 288.0 282.7
2022 252.5 288.0 277.3
2023 243.2 288.0 272.0
2024 234.4 288.0 266.6
2025 and beyond 226.2 288.0 261.2
Electricity usage under the current GHG standards is quite small. Electricity usage with the 2020 standards extended indefinitely were simply held at the 2020 levels projected by EPA in the Final Determination. Electricity usage for the second scenario was estimated using the same methodology described above for the CO2 emission targets. This is an approximation, as EPA’s OMEGA emissions model was not rerun with the relaxed emission standards. However, given the very small increase in the number of electric vehicles projected to be sold due to the 2025 standards, this approximation should be quite reasonable for the purposes of this analysis. Electricity usage under the current GHG standards and under the two relaxed scenarios are shown in Tables 3 and 4, respectively for cars and light trucks.
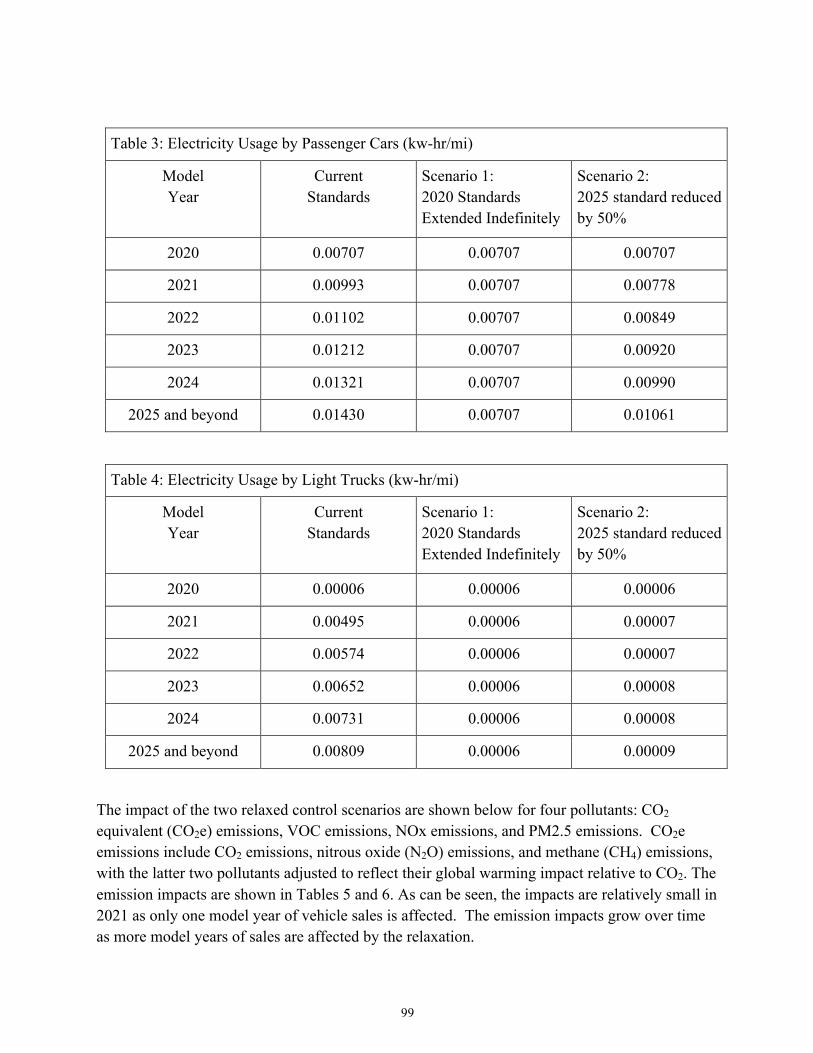
99
Table 3: Electricity Usage by Passenger Cars (kw-hr/mi)
Model Year
Current Standards
Scenario 1: 2020 Standards Extended Indefinitely
Scenario 2: 2025 standard reduced by 50%
2020 0.00707 0.00707 0.00707
2021 0.00993 0.00707 0.00778
2022 0.01102 0.00707 0.00849
2023 0.01212 0.00707 0.00920
2024 0.01321 0.00707 0.00990
2025 and beyond 0.01430 0.00707 0.01061
Table 4: Electricity Usage by Light Trucks (kw-hr/mi)
Model Year
Current Standards
Scenario 1: 2020 Standards Extended Indefinitely
Scenario 2: 2025 standard reduced by 50%
2020 0.00006 0.00006 0.00006
2021 0.00495 0.00006 0.00007
2022 0.00574 0.00006 0.00007
2023 0.00652 0.00006 0.00008
2024 0.00731 0.00006 0.00008
2025 and beyond 0.00809 0.00006 0.00009
The impact of the two relaxed control scenarios are shown below for four pollutants: CO2 equivalent (CO2e) emissions, VOC emissions, NOx emissions, and PM2.5 emissions. CO2e emissions include CO2 emissions, nitrous oxide (N2O) emissions, and methane (CH4) emissions, with the latter two pollutants adjusted to reflect their global warming impact relative to CO2. The emission impacts are shown in Tables 5 and 6. As can be seen, the impacts are relatively small in 2021 as only one model year of vehicle sales is affected. The emission impacts grow over time as more model years of sales are affected by the relaxation.
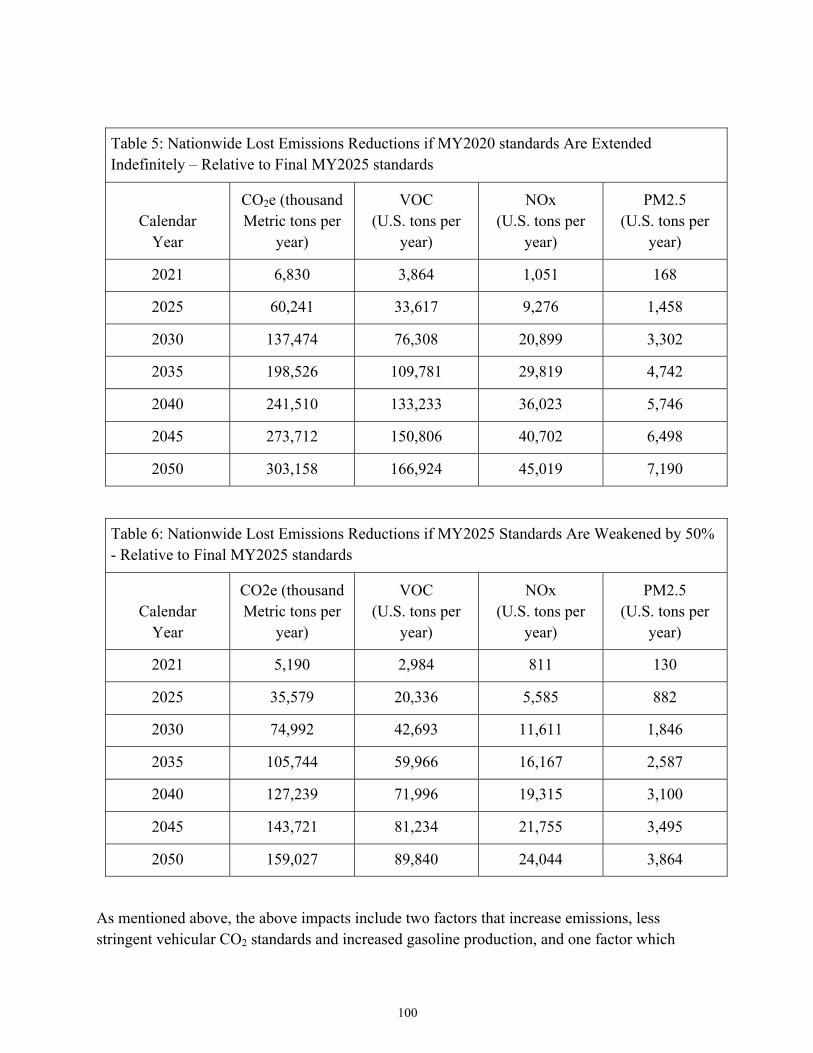
100
Table 5: Nationwide Lost Emissions Reductions if MY2020 standards Are Extended Indefinitely – Relative to Final MY2025 standards
Calendar Year
CO2e (thousand Metric tons per
year)
VOC (U.S. tons per
year)
NOx (U.S. tons per
year)
PM2.5 (U.S. tons per
year)
2021 6,830 3,864 1,051 168
2025 60,241 33,617 9,276 1,458
2030 137,474 76,308 20,899 3,302
2035 198,526 109,781 29,819 4,742
2040 241,510 133,233 36,023 5,746
2045 273,712 150,806 40,702 6,498
2050 303,158 166,924 45,019 7,190
Table 6: Nationwide Lost Emissions Reductions if MY2025 Standards Are Weakened by 50% - Relative to Final MY2025 standards
Calendar Year
CO2e (thousand Metric tons per
year)
VOC (U.S. tons per
year)
NOx (U.S. tons per
year)
PM2.5 (U.S. tons per
year)
2021 5,190 2,984 811 130
2025 35,579 20,336 5,585 882
2030 74,992 42,693 11,611 1,846
2035 105,744 59,966 16,167 2,587
2040 127,239 71,996 19,315 3,100
2045 143,721 81,234 21,755 3,495
2050 159,027 89,840 24,044 3,864
As mentioned above, the above impacts include two factors that increase emissions, less stringent vehicular CO2 standards and increased gasoline production, and one factor which

101
reduces emissions, lower VMT due to higher driving costs. The impact of the two factors which increase emissions far outweigh the impact of lower VMT. Tables 7 and 8 show the decreased levels of emissions from the VMT rebound effect. Please note that the figures shown are reductions in emissions, not increases, as is the case in Tables 5 and 6. (Please note that the impacts presented in Tables 5 and 6 do include the VMT impacts presented in Tables 7 and 8.)
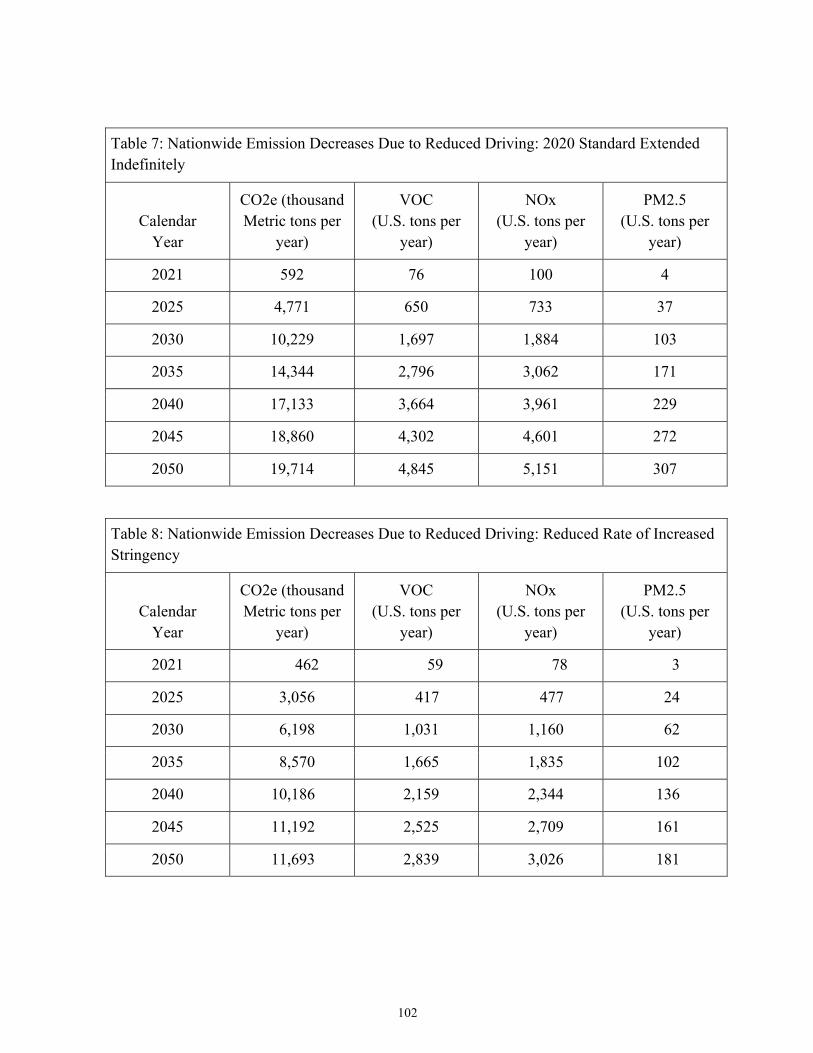
102
Table 7: Nationwide Emission Decreases Due to Reduced Driving: 2020 Standard Extended Indefinitely
Calendar Year
CO2e (thousand Metric tons per
year)
VOC (U.S. tons per
year)
NOx (U.S. tons per
year)
PM2.5 (U.S. tons per
year)
2021 592 76 100 4
2025 4,771 650 733 37
2030 10,229 1,697 1,884 103
2035 14,344 2,796 3,062 171
2040 17,133 3,664 3,961 229
2045 18,860 4,302 4,601 272
2050 19,714 4,845 5,151 307
Table 8: Nationwide Emission Decreases Due to Reduced Driving: Reduced Rate of Increased Stringency
Calendar Year
CO2e (thousand Metric tons per
year)
VOC (U.S. tons per
year)
NOx (U.S. tons per
year)
PM2.5 (U.S. tons per
year)
2021 462 59 78 3
2025 3,056 417 477 24
2030 6,198 1,031 1,160 62
2035 8,570 1,665 1,835 102
2040 10,186 2,159 2,344 136
2045 11,192 2,525 2,709 161
2050 11,693 2,839 3,026 181
103
Attachment D - Comparison of EPA and NHTSA Peer Reviewed Papers
Summary: The following tables include peer reviewed studies relevant to the midterm evaluation that were performed by, published by, and/or contracted with the Environmental Protection Agency (EPA) and the National Highway Safety Administration (NHTSA), and/or the two agencies’ employees. The studies were identified by reviewing the Draft Technical Assessment Report and its appendices, supporting documents for the proposed and final determination, EPA’s webpage listing its peer review publications relevant to the midterm evaluation,242 and NHTSA’s webpage listing its peer reviewed publications relevant to the midterm evaluation.243 The tables include the study’s title, authors, publication numbers and information, links to the study and peer review process information, as well as date. Studies are shaded to indicate different characteristics:
• No highlighting: performed by agency employees and published by an external source. • Turquoise: funded, contracted or sponsored by the agency and published by the agency. • Orange: performed by the agency and/or agency employees and published by the agency. • Yellow: contracted or sponsored by the agency and published by an external source.
Peer Reviewed Studies: EPA
Study Authors Publication Process/Link Date
Developing the AC17 Efficiency Test for Mobile Air Conditioners
Fred Sciance, Brian Nelson, Mahmoud Yassine, Angelo Patti, Leela Rao
SAE Technical Paper 2013-01-0569
Link to study: http://papers.sae.org/2013-01-0569/ Link to information about the peer review process of the source: http://papers.sae.org/ (“SAE Technical Papers are written and peer-reviewed by experts in the automotive, aerospace, and
4/8/13
242 Available at https://www.epa.gov/regulations-emissions-vehicles-and-engines/midterm-evaluation-light-duty-vehicle-greenhouse-gas#TAR. 243 Note that the webpage’s link to the relevant peer review studies did not work, but I looked through the webpage itself found at https://one.nhtsa.gov/Laws-&-Regulations/CAFE-%E2%80%93-Fuel-Economy/ci.ld%E2%80%93cafe%E2%80%93midterm%E2%80%93evaluation%E2%80%932022%E2%80%9325.print#publications.
104
commercial vehicle industries.”)
Maneuver-Based Battery-in-the-Loop Testing-Bringing Reality to Lab
Oguz H. Dagci, Nicolas Pereira, Jeff Cherry
SAE Int. J. Alt. Power., SAE Technical Paper 2013-01-0157
Link to study: http://papers.sae.org/2013-01-0157/ Link to information about the peer review process of the source: http://subs.sae.org/e-journal-08/ (The SAE International Journal of Alternative Powertrains provides a forum for peer-reviewed scholarly publication of original research and review papers that address challenges and present opportunities in alternative and electric powertrains and propulsion technology.”)
4/8/13
Development of Advanced Light-Duty Powertrain and Hybrid Analysis Tool
Byungho Lee, SoDuk Lee, Jeff Cherry, Anthony Neam, James Sanchez, Ed Nam
SAE Technical Paper 2013-01-0808
Link to study: http://papers.sae.org/2013-01-0808/ Link to information about the peer review process of the source: http://papers.sae.org/ (“SAE Technical Papers are written and peer-reviewed by experts in the automotive, aerospace, and commercial vehicle industries.”)
4/8/13
Modeling and Validation of Power-Split and P2 Parallel Hybrid Electric Vehicles
SoDuk Lee, Byungho Lee, Joseph McDonald, L. James Sanchez, Edward Nam
SAE Technical Paper 2013-01-1470
Link to study: http://papers.sae.org/2013-01-1470/ Link to information about the peer review process of the source: http://papers.sae.org/ (“SAE Technical Papers are written and peer-reviewed by experts in the automotive, aerospace, and commercial vehicle industries.”)
4/8/13
105
Modeling and Validation of Lithium-Ion Automotive Battery Packs
SoDuk Lee, Byungho Lee, Joseph McDonald, Edward Nam
SAE Technical Paper 2013-01-1539
Link to study: http://papers.sae.org/2013-01-1539/ Link to information about the peer review process of the source: http://papers.sae.org/ (“SAE Technical Papers are written and peer-reviewed by experts in the automotive, aerospace, and commercial vehicle industries.”)
4/8/13
Cost-Effectiveness of a Lightweight Design for 2017-2020: An Assessment of a Midsize Crossover Utility Vehicle
Cheryl Caffrey, Kevin Bolon, Hugh Harries, Greg Kolwich, Robert Johnston, Tim Shaw
SAE Technical Paper 2013-01-0656
Link to study: http://papers.sae.org/2013-01-0656/ Link to information about the peer review process of the source: http://papers.sae.org/ (“SAE Technical Papers are written and peer-reviewed by experts in the automotive, aerospace, and commercial vehicle industries.”)
4/8/13
Potential Fuel Economy Improvements from the Implementation of cEGR and CDA on an Atkinson Cycle Engine
Charles Schenck and Paul Dekraker
SAE Technical Paper 2017-01-1016
Link to study: https://www.epa.gov/sites/production/files/2017-06/documents/sae-2017-01-1016-potential-fuel-economy-improvements-cegr-and-cda-on-atkinson-engine.pdf The (note - the bottom of the last page of the document provides information about the peer review process, “Engineering Meetings Board has approved this paper for publication. It has successfully completed SAE's peer review process under the supervision of the session organizer. This process requires a minimum of three (3) reviews by industry experts.”)
3/28/17
106
Modeling and Validation of 12V Lead-Acid Battery for Stop-Start Technology
SoDuk Lee, Jeff Cherry, Michael Safoutin, Joseph McDonald
SAE Technical Paper 2017-01-1211
Link to study: https://www.epa.gov/sites/production/files/2017-06/documents/sae-2017-01-1211-modeling-validation-of-12v-lead-acid-battery-for-stop-start-technology.pdf (note - the bottom of the last page of the document provides information about the peer review process, “The Engineering Meetings Board has approved this paper for publication. It has successfully completed SAE's peer review process under the supervision of the session organizer. This process requires a minimum of three (3) reviews by industry experts.”)
3/28/17
Fleet-Level Modeling of Real World Factors Influencing Greenhouse Gas Emission Simulation in ALPHA
Paul Dekraker, John Kargul, Andrew Moskalik, Kevin Newman, Mark Doorlag, and Daniel Barba
SAE Int. J. Fuels Lubr. 10(1):2017
Link to study: https://www.epa.gov/sites/production/files/2017-06/documents/sae-2017-01-0899-fleet-level-modeling-real-world-factors-influencing-greenhouse-gas-emission-simulation-in-alpha.pdf Link to information about peer review process: http://subs.sae.org/e-journal-04/
3/28/17
Characterizing Factors Influencing SI Engine Transient Fuel Consumption for Vehicle Simulation in ALPHA
Paul Dekraker, Mark Stuhldreher, Youngki Kim
SAE Int. J. Engines, SAE Technical Paper 2017-01-0533
Link to study: https://www.epa.gov/sites/production/files/2017-06/documents/sae-2017-01-0533-characterizing-factors-influencing-si-engine-transient-fuel-consumption-alpha.pdf Link to peer review information: http://subs.sae.org/e-journal-03/ (SAE International Journal of Engines is a scholarly, peer-reviewed research journal dedicated to internal combustion engine science and engineering.”)
3/28/17
107
The Energy Efficiency Gap in EPA’s Benefit-Cost Analysis of Vehicle Greenhouse Gas Regulations: A Case Study
Gloria Helfand and Reid Dorsey-Palmateer
Journal of Benefit-Cost Analysis, Cambridge University Press
Link to study: https://www.cambridge.org/core/journals/journal-of-benefit-cost-analysis/article/energy-efficiency-gap-in-epas-benefitcost-analysis-of-vehicle-greenhouse-gas-regulations-a-case-study/21A55026616C7C17496A56783F64FA3D
7/10/15
Air Flow Optimization and Calibration in High-Compression Ratio Naturally Aspirated SI Engines with Cooled-EGR
SoDuk Lee, Charles Schenk, and Joseph McDonald
SAE Technical Paper 2016-01-0565
Link to study: https://www.epa.gov/sites/production/files/2016-10/documents/2016-01-0565-air-flow-optim-calib-nat-asp-eng_0.pdf (“The Engineering Meetings Board has approved this paper for publication. It has successfully completed SAE's peer review process under the supervision of the session organizer. This process requires a minimum of three (3) reviews by industry experts.”)
4/5/16
Cost-Effectiveness of a Lightweight Design for 2020-2025: An Assessment of a Light-Duty Pickup Truck
Cheryl Caffrey, Kevin Bolon, Greg Kolwich, Robert Johnston, Timothy Shaw
SAE Technical Paper 2015-01-0559
Link to study: https://www.epa.gov/sites/production/files/2016-10/documents/2015-01-0559_0.pdf (“The Engineering Meetings Board has approved this paper for publication. It has successfully completed SAE's peer review process under the supervision of the session organizer. This process requires a minimum of three (3) reviews by industry experts.”) Additionally, the study was funded by EPA but also received financial contributions from the International Council on Clean Transportation (ICCT), and technical support by the Aluminum Association. FEV North America, Inc subcontracted with EDAG, Inc. and Munro and Associates, Inc. FEV, EDAG and Munro teams worked on the study. EDAG team also included vehicle instrumentation and data gathering for the vehicle for use in NVH, CAE, durability and vehicle
4/14/15
108
dynamics analyses.
Analysis of Technology Adoption Rates in New Vehicles
Aaron Hula, Jeffrey Alson, Amy Bunker, and Kevin Bolon
SAE Technical Paper 2014-01-0781
Link to study: https://www.epa.gov/sites/production/files/2016-10/documents/2014-01-0781_0.pdf (“The Engineering Meetings Board has approved this paper for publication. It has successfully completed SAE's peer review process under the supervision of the session organizer. This process requires a minimum of three (3) reviews by industry experts.”)
4/1/14
Estimating GHG Reduction from Combinations of Current Best-Available and Future Powertrain and Vehicle Technologies for a Midsized Car Using EPA’s ALPHA Model
John Kargul, Andrew Moskalik, Daniel Barba, Kevin Newman, and Paul Dekraker
SAE Technical Paper 2016-01-0910
Link to study: https://www.epa.gov/sites/production/files/2016-10/documents/2016-01-0910-estimate-ghg-red-using-alpha_0.pdf (“The Engineering Meetings Board has approved this paper for publication. It has successfully completed SAE's peer review process under the supervision of the session organizer. This process requires a minimum of three (3) reviews by industry experts.”)
4/5/16
109
Modeling of a Conventional Mid-Size Car with CVT Using ALPHA and Comparable Powertrain Technologies
Kevin A. Newman, Mark Doorlag, and Daniel Barba
SAE Technical Paper 2016-01-1141
Link to study: https://www.epa.gov/sites/production/files/2016-10/documents/2016-01-1141-model-mid-size-car-w-cvt-using-alpha_0.pdf (“The Engineering Meetings Board has approved this paper for publication. It has successfully completed SAE's peer review process under the supervision of the session organizer. This process requires a minimum of three (3) reviews by industry experts.”)
4/5/16
Modeling the Effects of Transmission Gear Count, Ratio Progression, and Final Drive Ratio on Fuel Economy and Performance Using ALPHA
Kevin A. Newman and Paul Dekraker
SAE Technical Paper 2016-01-1143
Link to study: https://www.epa.gov/sites/production/files/2016-10/documents/2016-01-1143-model-trans-gear-count-ratio-prog-final-drive-ratio-using-alpha_0.pdf (“The Engineering Meetings Board has approved this paper for publication. It has successfully completed SAE's peer review process under the supervision of the session organizer. This process requires a minimum of three (3) reviews by industry experts.”)
4/5/16
Development and Testing of an Automatic Transmission Shift Schedule Algorithm for Vehicle Simulation
Kevin Newman, John Kargul, and Daniel Barba
SAE Int. J. Engines 8(3):2015
Link to study: https://www.epa.gov/sites/production/files/2016-10/documents/2015-01-1142_0.pdf Link to information about peer review process: http://subs.sae.org/e-journal-03/ (“SAE International Journal of Engines is a scholarly, peer-reviewed research journal dedicated to internal combustion engine science and engineering.”)
6/15
110
Benchmarking and Modeling of a Conventional Mid-Size Car Using ALPHA
Kevin Newman, John Kargul, and Daniel Barba
SAE Technical Paper 2015-01-1140
Link to study: https://www.epa.gov/sites/production/files/2016-10/documents/2015-01-1140_0.pdf (“The Engineering Meetings Board has approved this paper for publication. It has successfully completed SAE's peer review process under the supervision of the session organizer. This process requires a minimum of three (3) reviews by industry experts.” Additionally, GM’s Global Energy Analysis, Execution and Tools team and GM's Public Policy Center team met with EPA to discuss technical work associated with the near final draft of this SAE paper.)
4/14/15
Fuel Efficiency Mapping of a 2014 6-Cylinder GM EcoTec 4.3L Engine with Cylinder Deactivation
Mark Stuhldreher SAE Technical Paper 2016-01-0662
Link to study: https://www.epa.gov/sites/production/files/2016-10/documents/2016-01-0662-fuel-eff-map-2014-6cyl-gm-eco-tec-4.3l-eng-cyl-deac_0.pdf (“The Engineering Meetings Board has approved this paper for publication. It has successfully completed SAE's peer review process under the supervision of the session organizer. This process requires a minimum of three (3) reviews by industry experts.”)
4/5/16
Benchmarking and Hardware-in-the-Loop Operation of a 2014 MAZDA SkyActiv 2.0L 13:1 Compression Ratio Engine
Benjamin Ellies, Charles Schenk, and Paul Dekraker
SAE Technical Paper 2016-01-1007
Link to study: https://www.epa.gov/sites/production/files/2016-10/documents/2016-01-1007-benchmark-hil-operat-2014-mazda-skyactiv-2.0l.pdf (“The Engineering Meetings Board has approved this paper for publication. It has successfully completed SAE's peer review process under the supervision of the session organizer. This process requires a minimum of three (3) reviews by industry experts.”)
4/5/16
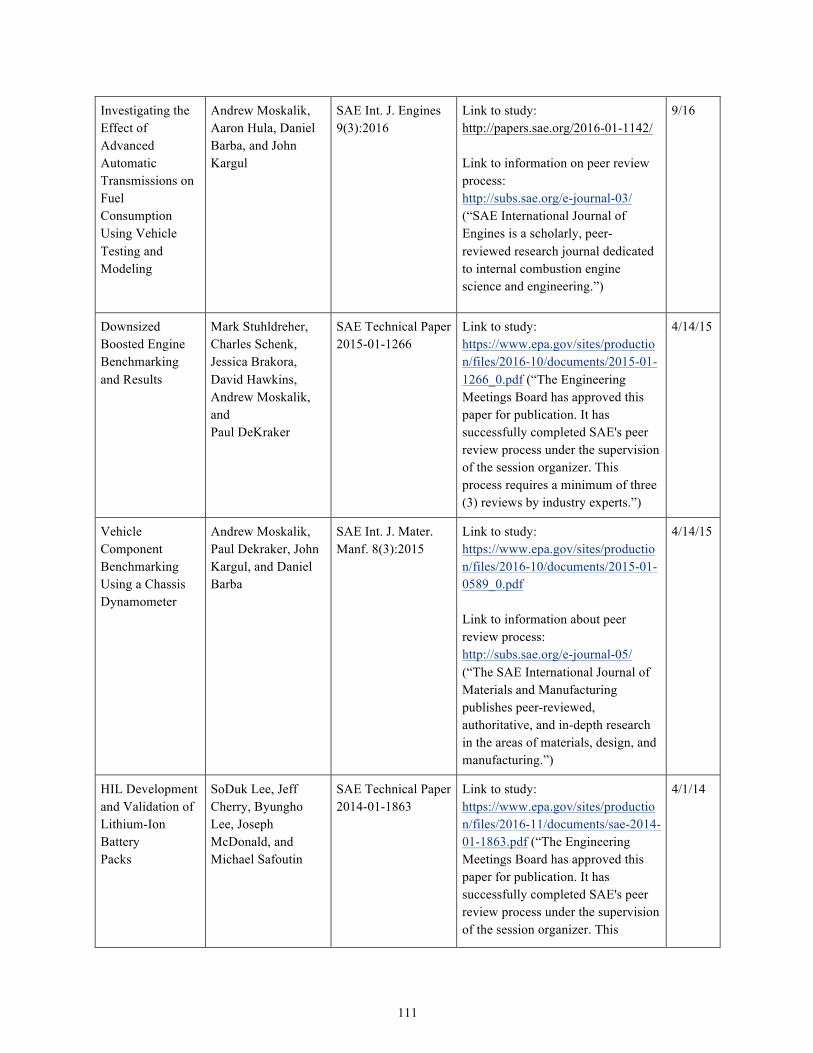
111
Investigating the Effect of Advanced Automatic Transmissions on Fuel Consumption Using Vehicle Testing and Modeling
Andrew Moskalik, Aaron Hula, Daniel Barba, and John Kargul
SAE Int. J. Engines 9(3):2016
Link to study: http://papers.sae.org/2016-01-1142/ Link to information on peer review process: http://subs.sae.org/e-journal-03/ (“SAE International Journal of Engines is a scholarly, peer-reviewed research journal dedicated to internal combustion engine science and engineering.”)
9/16
Downsized Boosted Engine Benchmarking and Results
Mark Stuhldreher, Charles Schenk, Jessica Brakora, David Hawkins, Andrew Moskalik, and Paul DeKraker
SAE Technical Paper 2015-01-1266
Link to study: https://www.epa.gov/sites/production/files/2016-10/documents/2015-01-1266_0.pdf (“The Engineering Meetings Board has approved this paper for publication. It has successfully completed SAE's peer review process under the supervision of the session organizer. This process requires a minimum of three (3) reviews by industry experts.”)
4/14/15
Vehicle Component Benchmarking Using a Chassis Dynamometer
Andrew Moskalik, Paul Dekraker, John Kargul, and Daniel Barba
SAE Int. J. Mater. Manf. 8(3):2015
Link to study: https://www.epa.gov/sites/production/files/2016-10/documents/2015-01-0589_0.pdf Link to information about peer review process: http://subs.sae.org/e-journal-05/ (“The SAE International Journal of Materials and Manufacturing publishes peer-reviewed, authoritative, and in-depth research in the areas of materials, design, and manufacturing.”)
4/14/15
HIL Development and Validation of Lithium-Ion Battery Packs
SoDuk Lee, Jeff Cherry, Byungho Lee, Joseph McDonald, and Michael Safoutin
SAE Technical Paper 2014-01-1863
Link to study: https://www.epa.gov/sites/production/files/2016-11/documents/sae-2014-01-1863.pdf (“The Engineering Meetings Board has approved this paper for publication. It has successfully completed SAE's peer review process under the supervision of the session organizer. This
4/1/14
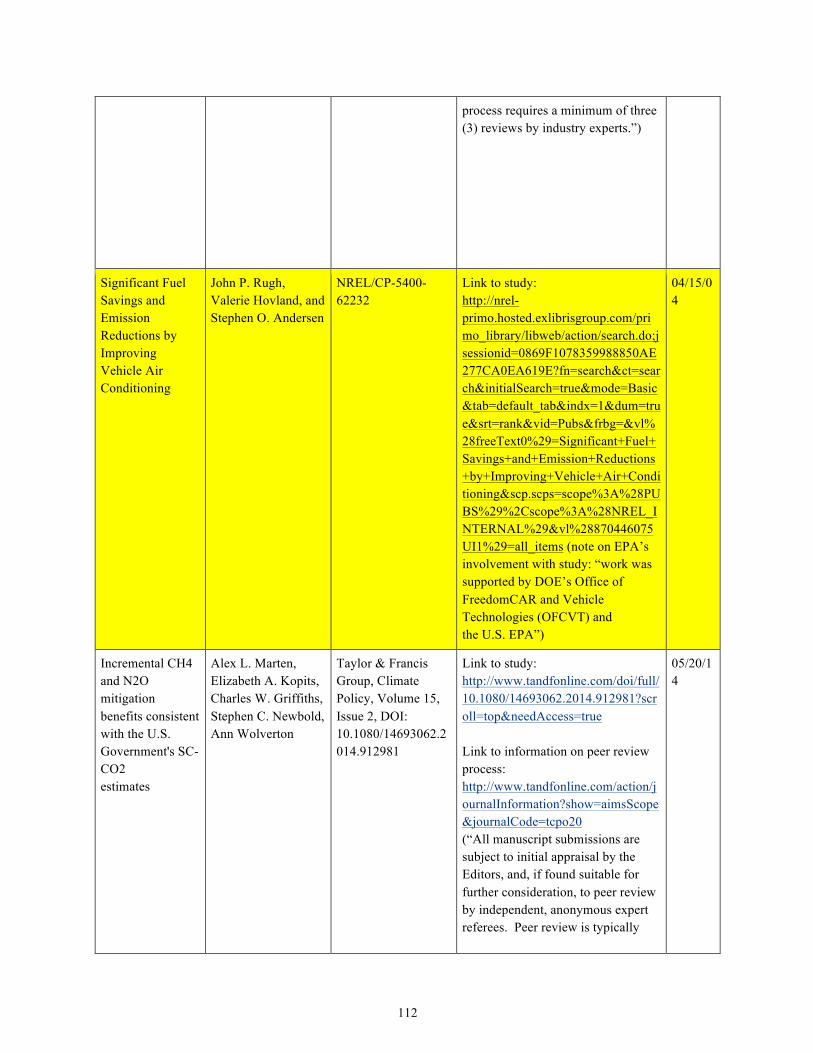
112
process requires a minimum of three (3) reviews by industry experts.”)
Significant Fuel Savings and Emission Reductions by Improving Vehicle Air Conditioning
John P. Rugh, Valerie Hovland, and Stephen O. Andersen
NREL/CP-5400-62232
Link to study: http://nrel-primo.hosted.exlibrisgroup.com/primo_library/libweb/action/search.do;jsessionid=0869F1078359988850AE277CA0EA619E?fn=search&ct=search&initialSearch=true&mode=Basic&tab=default_tab&indx=1&dum=true&srt=rank&vid=Pubs&frbg=&vl%28freeText0%29=Significant+Fuel+Savings+and+Emission+Reductions+by+Improving+Vehicle+Air+Conditioning&scp.scps=scope%3A%28PUBS%29%2Cscope%3A%28NREL_INTERNAL%29&vl%28870446075UI1%29=all_items (note on EPA’s involvement with study: “work was supported by DOE’s Office of FreedomCAR and Vehicle Technologies (OFCVT) and the U.S. EPA”)
04/15/04
Incremental CH4 and N2O mitigation benefits consistent with the U.S. Government's SC-CO2 estimates
Alex L. Marten, Elizabeth A. Kopits, Charles W. Griffiths, Stephen C. Newbold, Ann Wolverton
Taylor & Francis Group, Climate Policy, Volume 15, Issue 2, DOI: 10.1080/14693062.2014.912981
Link to study: http://www.tandfonline.com/doi/full/10.1080/14693062.2014.912981?scroll=top&needAccess=true Link to information on peer review process: http://www.tandfonline.com/action/journalInformation?show=aimsScope&journalCode=tcpo20 (“All manuscript submissions are subject to initial appraisal by the Editors, and, if found suitable for further consideration, to peer review by independent, anonymous expert referees. Peer review is typically
05/20/14
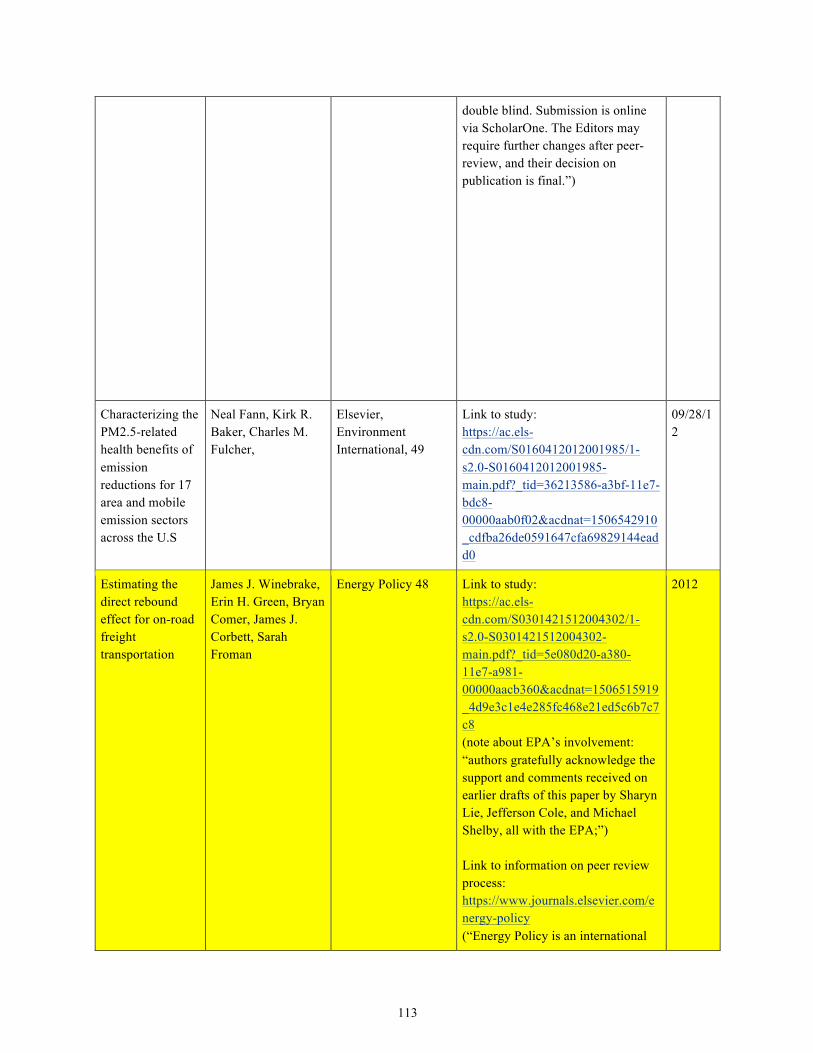
113
double blind. Submission is online via ScholarOne. The Editors may require further changes after peer-review, and their decision on publication is final.”)
Characterizing the PM2.5-related health benefits of emission reductions for 17 area and mobile emission sectors across the U.S
Neal Fann, Kirk R. Baker, Charles M. Fulcher,
Elsevier, Environment International, 49
Link to study: https://ac.els-cdn.com/S0160412012001985/1-s2.0-S0160412012001985-main.pdf?_tid=36213586-a3bf-11e7-bdc8-00000aab0f02&acdnat=1506542910_cdfba26de0591647cfa69829144eadd0
09/28/12
Estimating the direct rebound effect for on-road freight transportation
James J. Winebrake, Erin H. Green, Bryan Comer, James J. Corbett, Sarah Froman
Energy Policy 48 Link to study: https://ac.els-cdn.com/S0301421512004302/1-s2.0-S0301421512004302-main.pdf?_tid=5e080d20-a380-11e7-a981-00000aacb360&acdnat=1506515919_4d9e3c1e4e285fc468e21ed5c6b7c7c8 (note about EPA’s involvement: “authors gratefully acknowledge the support and comments received on earlier drafts of this paper by Sharyn Lie, Jefferson Cole, and Michael Shelby, all with the EPA;”) Link to information on peer review process: https://www.journals.elsevier.com/energy-policy (“Energy Policy is an international
2012
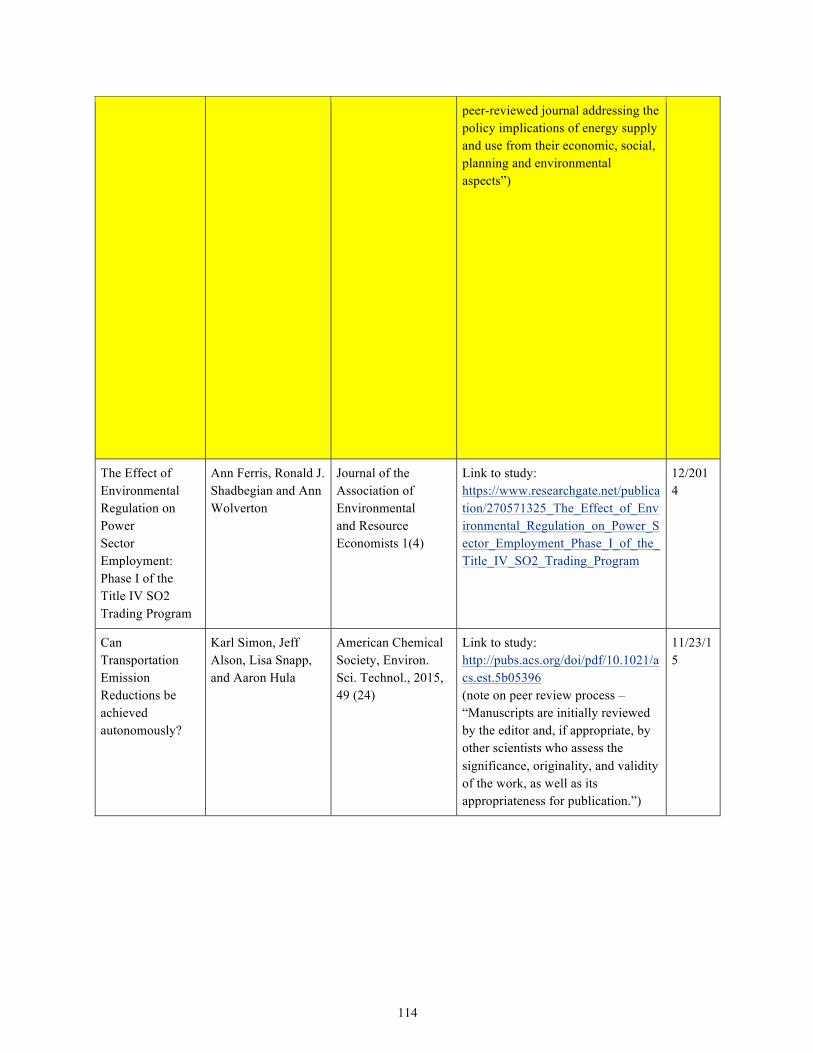
114
peer-reviewed journal addressing the policy implications of energy supply and use from their economic, social, planning and environmental aspects”)
The Effect of Environmental Regulation on Power Sector Employment: Phase I of the Title IV SO2 Trading Program
Ann Ferris, Ronald J. Shadbegian and Ann Wolverton
Journal of the Association of Environmental and Resource Economists 1(4)
Link to study: https://www.researchgate.net/publication/270571325_The_Effect_of_Environmental_Regulation_on_Power_Sector_Employment_Phase_I_of_the_Title_IV_SO2_Trading_Program
12/2014
Can Transportation Emission Reductions be achieved autonomously?
Karl Simon, Jeff Alson, Lisa Snapp, and Aaron Hula
American Chemical Society, Environ. Sci. Technol., 2015, 49 (24)
Link to study: http://pubs.acs.org/doi/pdf/10.1021/acs.est.5b05396 (note on peer review process – “Manuscripts are initially reviewed by the editor and, if appropriate, by other scientists who assess the significance, originality, and validity of the work, as well as its appropriateness for publication.”)
11/23/15
115
Effect of Current and SOC on Round-Trip Energy Efficiency of Lithium-Iron Phosphate (LiFePO4) Battery Pack
Michael Safoutin, Jeff Cherry, Joseph McDonald, SoDuk Lee
SAE Technical Paper 2015-01-1186
Link to study: http://papers.sae.org/2015-01-1186/ Link to information about the peer review process of the source: http://papers.sae.org/ (“SAE Technical Papers are written and peer-reviewed by experts in the automotive, aerospace, and commercial vehicle industries.”)
4/14/15
Critical factors affecting life cycle assessments of material choice for vehicle mass reduction
Troy Hottle, Cheryl Caffrey, Joseph McDonald, Rebecca Dodder
Transportation Research Part D 56 (2017) 241-257
Link to study: https://ac.els-cdn.com/S1361920916309142/1-s2.0-S1361920916309142-main.pdf?_tid=77bb726a-a912-11e7-b4e8-00000aab0f27&acdnat=1507128424_223c93c19aa92019503e402afb5c951c
08/2017
Ultrafine Particle Metrics and Research Considerations: Review of the 2015 UFP Workshop
Richard W. Baldauf, Robert B. Devlin, Peter Gehr, Robert Giannelli, Beth Hassett-Sipple, Heejung Jung, Giorgio Martini, Joseph McDonald, Jason D. Sacks, and Katherine Walker
International Journal of Environmental Research and Public Health, Volume 13, Issue 11
Link to paper: https://www.ncbi.nlm.nih.gov/pmc/articles/PMC5129264/ Link to information about the peer review process of the source: http://www.mdpi.com/journal/ijerph/about (“International Journal of Environmental Research and Public Health (IJERPH) (ISSN 1660-4601) is a peer-reviewed scientific journal that publishes original articles, critical reviews, research notes, and short communications in the interdisciplinary area of environmental health sciences and public health.”) (note about paper – this is a conference report from an EPA sponsored workshop)
28/10/16
116
Modeling the Cost and Performance of Lithium-Ion Batteries for Electric-Drive Vehicles
Argonne National Laboratory Chemical Sciences and Engineering Division
Prepared for EPA under Contract No.: DE-AC02-06CH11357
Link to report: https://permanent.access.gpo.gov/gpo42158/ZyPDF.pdf Link to peer review of the report: https://nepis.epa.gov/Exe/ZyNET.exe/P100F17H.txt?ZyActionD=ZyDocument&Client=EPA&Index=2011%20Thru%202015&Docs=&Query=&Time=&EndTime=&SearchMethod=1&TocRestrict=n&Toc=&TocEntry=&QField=&QFieldYear=&QFieldMonth=&QFieldDay=&UseQField=&IntQFieldOp=0&ExtQFieldOp=0&XmlQuery=&File=D%3A%5CZYFILES%5CINDEX%20DATA%5C11THRU15%5CTXT%5C00000005%5CP100F17H.txt&User=ANONYMOUS&Password=anonymous&SortMethod=h%7C-&MaximumDocuments=1&FuzzyDegree=0&ImageQuality=r75g8/r75g8/x150y150g16/i425&Display=hpfr&DefSeekPage=x&SearchBack=ZyActionL&Back=ZyActionS&BackDesc=Results%20page&MaximumPages=1&ZyEntry=5
08/2012
Computer Simulation of Light-Duty Vehicle Technologies for Greenhouse Gas Emission Reduction in the 2020-2025 Timeframe
Prepared by Ricardo, Inc. and Systems Research and Applications Corporation (SRA), under EPA Contract No. EP-C-11-007, Work Assignment No. 0-12
EPA Report No.: EPA-420-R-11-021
Link to study: https://nepis.epa.gov/Exe/ZyPDF.cgi/P100D57R.PDF?Dockey=P100D57R.PDF Link to peer review response document/description: https://nepis.epa.gov/Exe/ZyPDF.cgi/P100D5BX.PDF?Dockey=P100D5BX.PDF
12/2011
The Rebound Effect from Fuel Efficiency Standards: Measurement and Projection to 2035
Kenneth A. Small and Kent Hymel; prepared under EPA Contract No. EP-W-08-018, Work Assignment No. 4-5
EPA Report No.: EPA-420-R-15-012
Link to study: https://nepis.epa.gov/Exe/ZyPDF.cgi/P100N11T.PDF?Dockey=P100N11T.PDF Link to peer review response document/description: https://nepis.epa.gov/Exe/ZyPDF.cgi/P100N141.PDF?Dockey=P100N14
07/2015
117
1.PDF
Inventory of U.S. Greenhouse Gas Emissions and Sinks: 1990 – 2014
EPA EPA Report No.: EPA 430-R-16-002
Link to study: https://www.epa.gov/sites/production/files/2016-04/documents/us-ghg-inventory-2016-main-text.pdf (note – the study/report describes the review the it underwent on the third page of the document under the header “Acknowledgements” but does not state that it went through a formal peer review process)
04/15/16
Searching for Hidden Costs: A Technology-Based Approach to the Energy Efficiency Gap in Light-Duty Vehicles
Jean-Marie Revelt, Gloria Helfand, Lawrence Reichle, Kevin Bolon, Michael McWilliams, Mandy Sha, Amanda Smith, Robert Beach
EPA Document No.: EPA-420-D-15-010 Elsevier, Energy Policy Publication No.: Energy Policy Volume 98
Link to EPA presentation/document: https://www.epa.gov/sites/production/files/2016-10/documents/search-hidden-costs-te3-2015-11-03.pdf Link to publication in Energy Policy Journal: http://ac.els-cdn.com/S0301421516304803/1-s2.0-S0301421516304803-main.pdf?_tid=3fb9e300-9cb1-11e7-be57-00000aacb360&acdnat=1505767255_a845ed8fdf224afd244c0e1d4228778a (note – Jean-Marie Revelt is not listed as an author in this publication; additionally, under “Acknowledgements” it states that “RTI International conducted the content analysis under EPA contract EP-C-11-045, WA 3-01”; additionally, NHTSA commented on the study) Link to information about Energy Policy’s peer review process: https://www.journals.elsevier.com/e
EPA Document Date: 2015, Energy Policy Date: 9/14/16
118
nergy-policy (“Energy Policy is an international peer-reviewed journal addressing the policy implications of energy supply and use from their economic, social, planning and environmental aspects”)
Testing a Model of Consumer Vehicle Purchases
Gloria Helfand, Changzheng Liu, Marie Donahue, Jacqueline Doremus, Ari Kahan, and Michael Shelby
EPA Report No.: EPA-420-D-15-011
Link to study: https://nepis.epa.gov/Exe/ZyPDF.cgi/P100NNOZ.PDF?Dockey=P100NNOZ.PDF (note – this is a draft of the study, and does not appear to have gone under a peer review process, but the following link suggests that it has been submitted to the Transportation Research Journal, an Elsevier publication: https://cfpub.epa.gov/si/si_public_record_report.cfm?dirEntryId=309537)
12/2015
119
Light-Duty Automotive Technology, Carbon Dioxide Emissions, and Fuel Economy Trends: 1975 Through 2014
Jeff Alson, Aaron Hula, and Amy Bunker
EPA Report No.: EPA- 420-R-14-023a
Link to study/report: https://nepis.epa.gov/Exe/ZyPDF.cgi/P100LQ9M.PDF?Dockey=P100LQ9M.PDF (note – the study/report describes the review the it underwent (NHTSA reviewed and commented on the report) at the end of the document under the header “Authors and Acknowledgements” but does not state that it went through a formal peer review process)
10/2014
Light-Duty Automotive Technology, Carbon Dioxide Emissions, and Fuel Economy Trends: 1975 through 2015
Jeff Alson, Aaron Hula, and Amy Bunker
EPA Report No.: EPA-420-R-15-001
Link to study/report: https://nepis.epa.gov/Exe/ZyPdf.cgi?Dockey=P100O5P6.pdf (note – the study/report describes the review the it underwent (NHTSA reviewed and commented on the report) at the end of the document under the header “Authors and Acknowledgements” but does not state that it went through a formal peer review process) Additional link to other documents related to the study: https://www.epa.gov/fuel-economy-trends/download-co2-and-fuel-economy-trends-report-1975-2015
12/2015
Light-Duty Automotive Technology, Carbon Dioxide Emissions, and Fuel Economy Trends: 1975 Through 2016
Jeff Alson, Aaron Hula, Amy Bunker, and Andrea Maguire
EPA Report No.: EPA-420-R-16-010
Link to study/report: https://www.epa.gov/sites/production/files/2016-11/documents/420r16010.pdf (note – the study/report describes the review the it underwent (NHTSA reviewed and commented on the report) at the end of the document under the header “Authors and Acknowledgements” but does not state that it went through a formal peer review process)
11/2016
120
How Consumers Value Fuel Economy: A Literature Review
David Greene; EPA contracted with RTI International to conduct peer review of literature survey conducted by Greene
EPA Report No.: EPA-420-R-10-008 EPA Contract No.: DE-AC05-00OR22725
Link to study: https://nepis.epa.gov/Exe/ZyPDF.cgi/P1006V0O.PDF?Dockey=P1006V0O.PDF Link to peer review response document/description: https://nepis.epa.gov/Exe/ZyPDF.cgi/P1006WFR.PDF?Dockey=P1006WFR.PDF
03/2010
Light Duty Technology Cost Analysis, Power-Split and P2 Hybrid Electric Vehicle Case Studies
FEV, Inc. EPA Report No.: FEV07-069-303 EPA Contract No.: EP-C-07-069, Work Assignment No. 3-3
Link to study: https://nepis.epa.gov/Exe/ZyPDF.cgi/P100EG1R.PDF?Dockey=P100EG1R.PDF Link to peer review response documents/description: https://nepis.epa.gov/Exe/ZyPDF.cgi/P100CVJS.PDF?Dockey=P100CVJS.PDF https://nepis.epa.gov/Exe/ZyPDF.cgi/P100CVM8.PDF?Dockey=P100CVM8.PDF
10/10/11
Light-Duty Vehicle Mass Reduction and Cost Analysis -- Midsize Crossover Utility Vehicle
FEV, Inc. EPA Report No.: EPA-420-R-12-026 EPA Contract No.: EP-C-12-014, Work Assignment No. 0-3
Link to study: https://nepis.epa.gov/Exe/ZyPDF.cgi/P100EWVL.PDF?Dockey=P100EWVL.PDF Link to peer review response document/description: https://nepis.epa.gov/Exe/ZyPDF.cgi/P100EW1M.PDF?Dockey=P100EW1M.PDF
08/2012
Mass Reduction and Cost Analysis - Light Duty Pickup Truck Model years 2020-2025
FEV North America, Inc.
EPA Report No.: EPA-420-R-15-006 EPA Contract No.: EP-C-12-014 WA3-03
Link to study: https://nepis.epa.gov/Exe/ZyPDF.cgi/P100MS0E.PDF?Dockey=P100MS0E.PDF (note – information about peer review process is on page 967)
06/08/15
121
Automobile Industry Retail Price Equivalent and Indirect Cost Multipliers
RTI International and Transportation Research Institute, University of Michigan
EPA Report No.: EPA-420-R-09-003 RTI Project Number 0211577.002.004
Link to study: https://nepis.epa.gov/Exe/ZyNET.exe/P100AGJ1.txt?ZyActionD=ZyDocument&Client=EPA&Index=2006%20Thru%202010&Docs=&Query=&Time=&EndTime=&SearchMethod=1&TocRestrict=n&Toc=&TocEntry=&QField=&QFieldYear=&QFieldMonth=&QFieldDay=&UseQField=&IntQFieldOp=0&ExtQFieldOp=0&XmlQuery=&File=D%3A%5CZYFILES%5CINDEX%20DATA%5C06THRU10%5CTXT%5C00000025%5CP100AGJ1.txt&User=ANONYMOUS&Password=anonymous&SortMethod=h%7C-&MaximumDocuments=1&FuzzyDegree=0&ImageQuality=r75g8/r75g8/x150y150g16/i425&Display=hpfr&DefSeekPage=x&SearchBack=ZyActionL&Back=ZyActionS&BackDesc=Results%20page&MaximumPages=1&ZyEntry=2 (note – information about peer review process is found on the second page of the document)
02/2009
Using indirect cost multipliers to estimate the total cost of adding new technology in the automobile industry
Alex Rogozhin, Michael Gallaher, Gloria Helfand, Walter McManus
Elsevier, International Journal of Production Economics 124
Link to study: https://ac.els-cdn.com/S0925527309004344/1-s2.0-S0925527309004344-main.pdf?_tid=14e4c294-a45e-11e7-9768-00000aab0f6c&acdnat=1506611144_1c4c1bc75b28791762b6e7b686983a6a (note – paper is based on a study conducted by RTI International for the U.S. Environmental Protection
3/12/2009
122
Agency)
Consumer Vehicle Choice Model Documentation
Oak Ridge National Laboratory
EPA Report No.: EPA-420-B-12-052 EPA Contract No.: DE-AC05-000R22725
Link to study: https://nepis.epa.gov/Exe/ZyNET.exe/P100EZ37.TXT?ZyActionD=ZyDocument&Client=EPA&Index=2011+Thru+2015&Docs=&Query=&Time=&EndTime=&SearchMethod=1&TocRestrict=n&Toc=&TocEntry=&QField=&QFieldYear=&QFieldMonth=&QFieldDay=&IntQFieldOp=0&ExtQFieldOp=0&XmlQuery=&File=D%3A%5Czyfiles%5CIndex%20Data%5C11thru15%5CTxt%5C00000005%5CP100EZ37.txt&User=ANONYMOUS&Password=anonymous&SortMethod=h%7C-&MaximumDocuments=1&FuzzyDegree=0&ImageQuality=r75g8/r75g8/x150y150g16/i425&Display=hpfr&DefSeekPage=x&SearchBack=ZyActionL&Back=ZyActionS&BackDesc=Results%20page&MaximumPages=1&ZyEntry=1&SeekPage=x&ZyPURL
08/2012
The Energy Paradox and the Diffusion Conservation Technology
Adam B. Jaffe, Robert N. Stavins
Elsevier, Resource and Energy Economics 16(2)
Link to study: https://ac.els-cdn.com/0928765594900019/1-s2.0-0928765594900019-main.pdf?_tid=c9b5fef2-a2bc-11e7-9d6b-00000aab0f01&acdnat=1506431918_b14a803ebc0c6d36562a78a820c21450; (note – study received funding from EPA)
1994
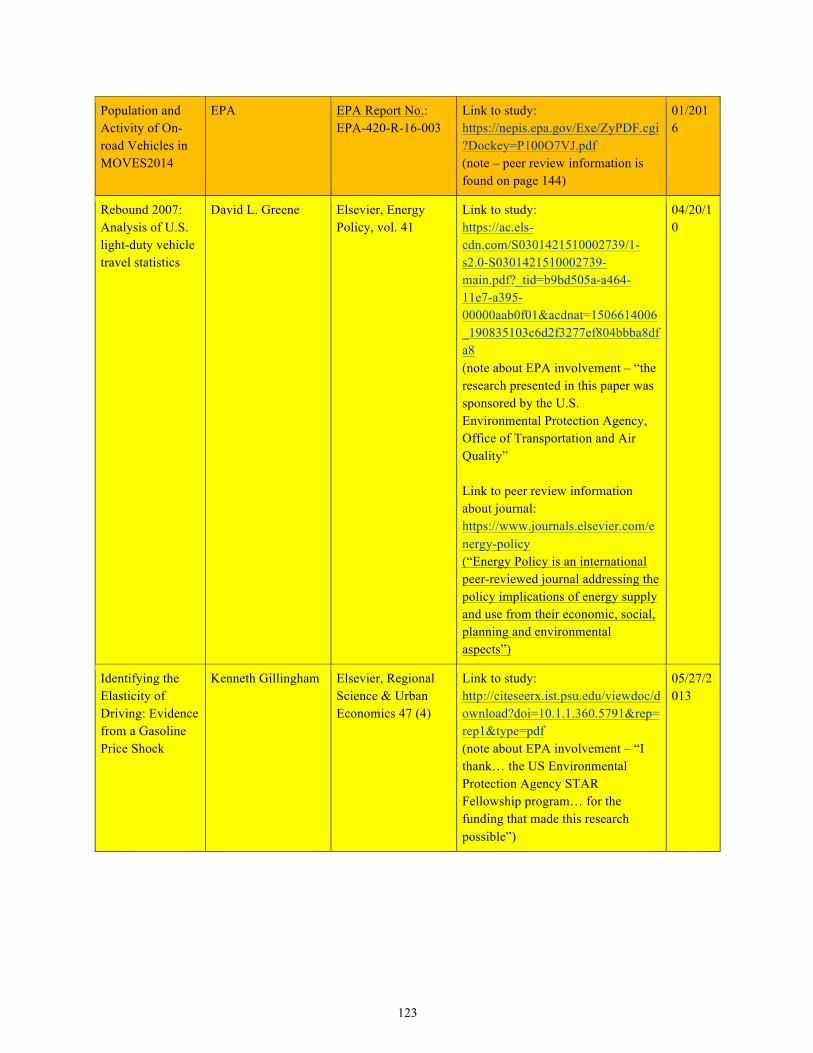
123
Population and Activity of On-road Vehicles in MOVES2014
EPA EPA Report No.: EPA-420-R-16-003
Link to study: https://nepis.epa.gov/Exe/ZyPDF.cgi?Dockey=P100O7VJ.pdf (note – peer review information is found on page 144)
01/2016
Rebound 2007: Analysis of U.S. light-duty vehicle travel statistics
David L. Greene Elsevier, Energy Policy, vol. 41
Link to study: https://ac.els-cdn.com/S0301421510002739/1-s2.0-S0301421510002739-main.pdf?_tid=b9bd505a-a464-11e7-a395-00000aab0f01&acdnat=1506614006_190835103c6d2f3277ef804bbba8dfa8 (note about EPA involvement – “the research presented in this paper was sponsored by the U.S. Environmental Protection Agency, Office of Transportation and Air Quality” Link to peer review information about journal: https://www.journals.elsevier.com/energy-policy (“Energy Policy is an international peer-reviewed journal addressing the policy implications of energy supply and use from their economic, social, planning and environmental aspects”)
04/20/10
Identifying the Elasticity of Driving: Evidence from a Gasoline Price Shock
Kenneth Gillingham Elsevier, Regional Science & Urban Economics 47 (4)
Link to study: http://citeseerx.ist.psu.edu/viewdoc/download?doi=10.1.1.360.5791&rep=rep1&type=pdf (note about EPA involvement – “I thank… the US Environmental Protection Agency STAR Fellowship program… for the funding that made this research possible”)
05/27/2013
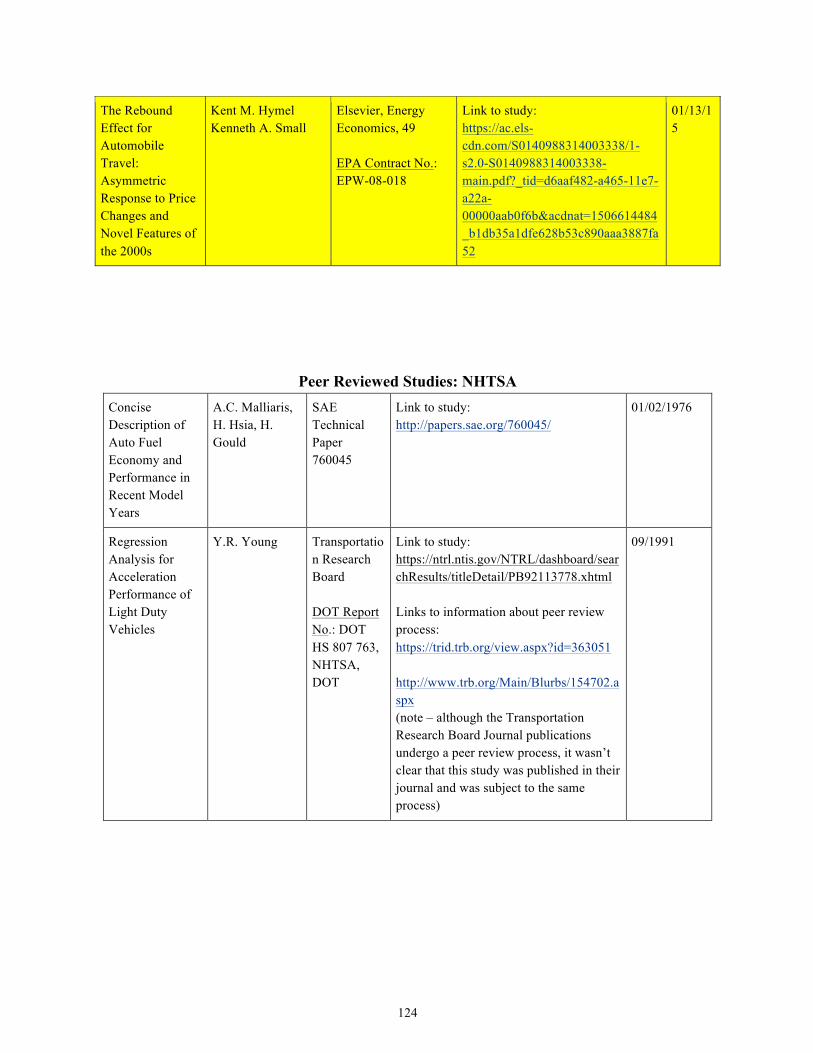
124
The Rebound Effect for Automobile Travel: Asymmetric Response to Price Changes and Novel Features of the 2000s
Kent M. Hymel Kenneth A. Small
Elsevier, Energy Economics, 49 EPA Contract No.: EPW-08-018
Link to study: https://ac.els-cdn.com/S0140988314003338/1-s2.0-S0140988314003338-main.pdf?_tid=d6aaf482-a465-11e7-a22a-00000aab0f6b&acdnat=1506614484_b1db35a1dfe628b53c890aaa3887fa52
01/13/15
Peer Reviewed Studies: NHTSA Concise Description of Auto Fuel Economy and Performance in Recent Model Years
A.C. Malliaris, H. Hsia, H. Gould
SAE Technical Paper 760045
Link to study: http://papers.sae.org/760045/
01/02/1976
Regression Analysis for Acceleration Performance of Light Duty Vehicles
Y.R. Young Transportation Research Board DOT Report No.: DOT HS 807 763, NHTSA, DOT
Link to study: https://ntrl.ntis.gov/NTRL/dashboard/searchResults/titleDetail/PB92113778.xhtml Links to information about peer review process: https://trid.trb.org/view.aspx?id=363051 http://www.trb.org/Main/Blurbs/154702.aspx (note – although the Transportation Research Board Journal publications undergo a peer review process, it wasn’t clear that this study was published in their journal and was subject to the same process)
09/1991
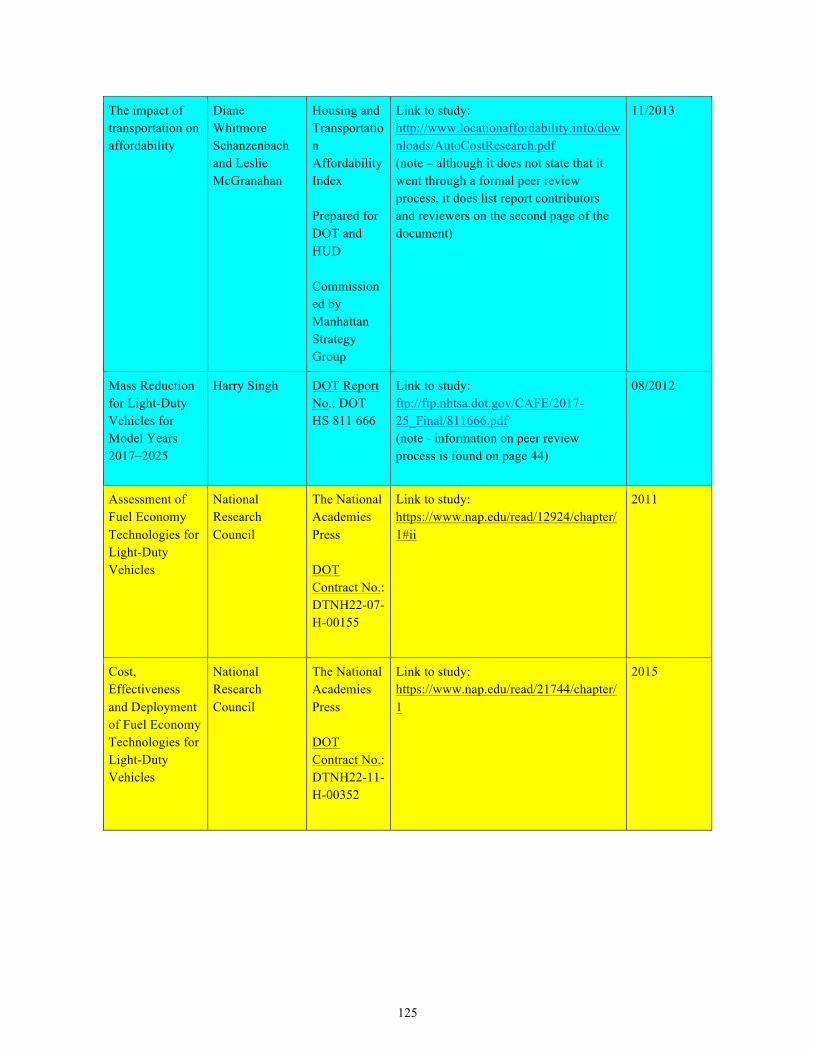
125
The impact of transportation on affordability
Diane Whitmore Schanzenbach and Leslie McGranahan
Housing and Transportation Affordability Index Prepared for DOT and HUD Commissioned by Manhattan Strategy Group
Link to study: http://www.locationaffordability.info/downloads/AutoCostResearch.pdf (note – although it does not state that it went through a formal peer review process, it does list report contributors and reviewers on the second page of the document)
11/2013
Mass Reduction for Light-Duty Vehicles for Model Years 2017–2025
Harry Singh DOT Report No.: DOT HS 811 666
Link to study: ftp://ftp.nhtsa.dot.gov/CAFE/2017-25_Final/811666.pdf (note - information on peer review process is found on page 44)
08/2012
Assessment of Fuel Economy Technologies for Light-Duty Vehicles
National Research Council
The National Academies Press DOT Contract No.: DTNH22-07-H-00155
Link to study: https://www.nap.edu/read/12924/chapter/1#ii
2011
Cost, Effectiveness and Deployment of Fuel Economy Technologies for Light-Duty Vehicles
National Research Council
The National Academies Press DOT Contract No.: DTNH22-11-H-00352
Link to study: https://www.nap.edu/read/21744/chapter/1
2015
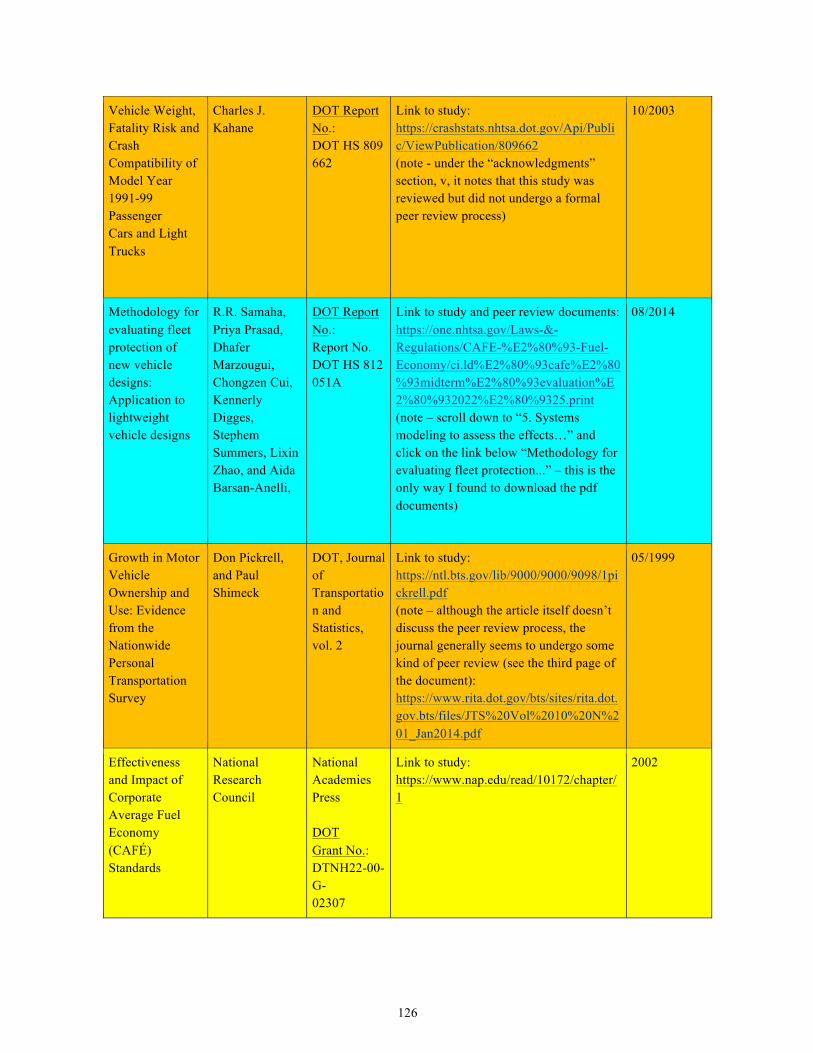
126
Vehicle Weight, Fatality Risk and Crash Compatibility of Model Year 1991-99 Passenger Cars and Light Trucks
Charles J. Kahane
DOT Report No.: DOT HS 809 662
Link to study: https://crashstats.nhtsa.dot.gov/Api/Public/ViewPublication/809662 (note - under the “acknowledgments” section, v, it notes that this study was reviewed but did not undergo a formal peer review process)
10/2003
Methodology for evaluating fleet protection of new vehicle designs: Application to lightweight vehicle designs
R.R. Samaha, Priya Prasad, Dhafer Marzougui, Chongzen Cui, Kennerly Digges, Stephem Summers, Lixin Zhao, and Aida Barsan-Anelli,
DOT Report No.: Report No. DOT HS 812 051A
Link to study and peer review documents: https://one.nhtsa.gov/Laws-&-Regulations/CAFE-%E2%80%93-Fuel-Economy/ci.ld%E2%80%93cafe%E2%80%93midterm%E2%80%93evaluation%E2%80%932022%E2%80%9325.print (note – scroll down to “5. Systems modeling to assess the effects…” and click on the link below “Methodology for evaluating fleet protection...” – this is the only way I found to download the pdf documents)
08/2014
Growth in Motor Vehicle Ownership and Use: Evidence from the Nationwide Personal Transportation Survey
Don Pickrell, and Paul Shimeck
DOT, Journal of Transportation and Statistics, vol. 2
Link to study: https://ntl.bts.gov/lib/9000/9000/9098/1pickrell.pdf (note – although the article itself doesn’t discuss the peer review process, the journal generally seems to undergo some kind of peer review (see the third page of the document): https://www.rita.dot.gov/bts/sites/rita.dot.gov.bts/files/JTS%20Vol%2010%20N%201_Jan2014.pdf
05/1999
Effectiveness and Impact of Corporate Average Fuel Economy (CAFÉ) Standards
National Research Council
National Academies Press DOT Grant No.: DTNH22-00-G- 02307
Link to study: https://www.nap.edu/read/10172/chapter/1
2002
127
Attachment E – EDF comments on CAR analysis
January 11, 2017 Ms. Gina McCarthy Administrator Environmental Protection Agency Office of the Administrator, 1101A 1200 Pennsylvania Avenue, NW Washington, DC 20460 Mr. Christopher Lieske Office of Transportation and Air Quality Assessment and Standards Environmental Protection Agency 2000 Traverwood Drive Ann Arbor, MI 48105 Submitted electronically to: www.regulations.gov Docket ID Number: EPA-HQ-OAR-2015-0827 Reference: Proposed Determination on the Appropriateness of the Model Year 2022-2025 Light-Duty Vehicle Greenhouse Gas Emissions Standards under the Midterm Evaluation Subject: Response to “Corrections and clarifications to the various references to the Center for Automotive Research’s The Potential Effects of the 2017-2025 EPA/NHTSA GHG/Fuel Economy mandates on the U.S. Economy as found on pp. A-41 through A-42; A-80 and A-87 and the Technical Support Document, pp. 4-17 through 4-20.” Dear Administrator McCarthy and Mr. Lieske: This submission responds to comments by Dr. Jay Baron of the Center for Automotive Research (CAR), in which he defends the use of the CAR report, The Potential Effects of the 2017-2025 EPA/NHTSA GHG/Fuel Economy mandates on the U.S. Economy (the Report), as input into the review process of the Model Year 2022-2025 Light-Duty Vehicle Greenhouse Gas Emissions Standards under the Midterm Evaluation. In particular, Dr. Baron’s response (the Response) does not adequately address EPA’s critiques of the Report. Accordingly, we support EPA’s conclusion that the Report’s estimates on sales and employment impacts of the emissions and fuel economy standards are based on materially flawed analysis and thus EPA must not give it weight in the review process.
128
We first respond to the four corrections and clarifications that Dr. Baron presents in his defense of the Report, and go on to note the additional flaws in the analysis which are not addressed in the Response. 1. CAR’s fuel efficiency costs are overestimated, and the costs are unclear if in real dollars or in nominal dollars as gasoline price is real dollars but the expenditures are nominal dollars. The Response has not succeeded in providing any rationale for using its own cost estimates over those of EPA. The Response claims that estimates of the costs required to move from MY2017 to MY2025 fuel efficiency standards used in the Report, $2000, $4000 and $6000 (2015 dollars), are “not derived or based off of a 1991 study as the EPA reports.” However, the Response does not give an alternative source for the cost estimates. In particular, the Response does not address EPA’s critique that the cost estimates are not based on any technology analyses. These cost estimates provide the foundation of the Report - the complete lack of clarity around the derivation of the cost estimates thus invalidates any conclusions of the Report. As further evidence that the Report’s cost estimates are invalid, the $2000-6000 (2015 dollars) range is significantly higher than EPA’s central cost estimate of $1287 (2013 dollars, equivalent to $1309 in 2015 dollars), which estimate is based on technology costs.244 The Response notes that the Report’s fuel efficiency cost scenarios are estimates of the per-vehicle cost to consumers, rather than to vehicle manufacturers, and thus cannot be directly compared to EPA’s cost estimates. The Report uses a 1.84245 retail price equivalence factor. However, contrary to the Response’s suggestion, and as clearly stated in the Draft TAR, EPA’s cost estimates do include either an Indirect Cost Multiplier or a Retail Price Equivalent, and thus are directly comparable. EPA’s central cost estimate, $1309, uses an Indirect Cost Multiplier; use of a Retail Price Equivalent increases that cost estimate to $1560.246 Thus, EPA’s original point holds—even the 244 The Response incorrectly cites EPA’s cost estimates as $894 - $1,245. However, as stated on page ES-8 of the Draft Technical Assessment Report (TAR), these costs refer to “the average per-vehicle costs of meeting the MY2025 standards (incremental to the costs already incurred to meet the MY2021 standard).” (Emphasis added.) Since the Report’s cost estimates are for moving from MY2017 to MY2025 standards, these costs are not directly comparable to EPA’s $894-$1,245 range. As clearly stated on page 4-17 of EPA’s Technical Support Document, the correct comparison cost is $1,287, taken from Table 12.44, p. 12-35 in the Draft TAR. Table 12.44 clearly states that the cost to go from MY 2016 standards to MY 2025 standards is $1287 (equal to the cost of bringing the fleet from MY2014 to MY2025 standards minus the cost of bringing the fleet from MY2014 to MY2016 standards; $1565 - $279). 245 The Response incorrectly cites its own Report, claiming to use a 1.86 retail equivalence factor where in fact the Report uses a 1.84 retail equivalence factor (page 15, CAR, The Potential Effects of the 2017-2025 EPA/NHTSA/Fuel Economy Mandates on the U.S. Economy). 246 The notes for Table 12.44, p. 12-35 in the Draft TAR point to Table 12.97 on p. 12-81 as the origin of the $1565 cost estimate. Table 12.97 gives a low estimate of $1565 and a high estimate of $1818 for the fleet per-vehicle average cost of moving from MY2014 to MY2025 standards. The notes state that the low estimate refers to an estimate which uses an indirect cost multiplier, and the high estimate refers to an estimate which uses a retail price equivalent. Subtracting the $279 for moving from MY2014 to MY2016 fuel efficiency requirements, and converting from 2013 dollars to 2015 dollars yields the range cited in the main text; $1309-$1566.
129
Report’s low price impact scenario of $2000 is over 25% higher than EPA’s highest cost estimate. EPA should not, as the Response requests, “reference the CAR employment impact resulting from a $2,000 vehicle price increase,” as those estimates would be based on flawed assumptions and analysis, and would almost certainly be overstated. In response to EPA’s critique that the Report is inconsistent throughout the Report in its use of dollar-year, CAR defends its use of nominal vs. real dollars in one particular instance. However, the lack of clarity and consistency around dollar-years is endemic throughout the Report. For instance, in Table 4 of the Report, fuel efficiency costs are stated in 2015 dollars, whereas gas prices (and thus savings due to fuel efficiency) are listed in 2010 dollars, which slightly biases results towards a higher Net Cost. 2. CAR used an undiscounted payback period of 3-years of the fuel savings instead of a discounted 5-year or lifetime fuel savings value. The Response claims that discount rate studies were cited but not incorporated into the payback period which the Report used, because those studies did not include compounding periods. Thus, including them would require assumptions about compounding periods which could lead to a wide range of results. We would argue that the uncertainty inherent in the discount rate for fuel efficiency, as well as in the payback period for fuel efficiency, is important to incorporate into any model which aims to determine the effect of fuel efficiency standards. Choosing just one payback period creates false certainty around the results. Moreover, in this particular case, including the full range of discount rates (and the full range of assumptions as to compounding periods) would likely increase the value of fuel savings to consumers. Neither the Report nor the Response, in our view, sufficiently supports the choice to use a single payback period of 3 years throughout the analysis. 3. Econometric models appear to produce contradictory results of vehicle price effects on vehicle demand. The CAR report uses two distinct econometric models to study the impact of vehicle prices on expenditures. One is used to estimate the elasticity of expenditures with respect to prices; the other is used to project baseline vehicle expenditures. These models use different data and different independent variables. The two models produce opposite results of the effect of price on expenditures.
130
The Response explains that the reason for the discrepancy in the coefficients on the two price variables, is that the first model uses real term data, whereas the second model uses nominal term data (because real vehicle prices discount technology costs which consumers may not perceive). In the second model, the positive relationship between price and expenditures is due, according to the Response, to inflation. This Response is admitting an omitted variable (inflation, or time trend) which, along with other problems described further below, invalidates the results of the model. If the co-efficient on price in the second model is picking up the effect of other drivers, this calls into question the validity of the entire model. In addition, neither the Report nor the Response provide any reason for estimating two models of the same dependent variable (vehicle expenditures) with different sets of independent variables. One cannot simply pick and choose which variables to include as drivers in regression analysis, without apparent rationale. 4. CAR’s employment impact analysis does not take substitution effect (new technologies, new material, and new processing) into account. The Response claims that, since the Report estimates the own-price elasticity of total revenue (effect of changing price on revenue), they actually are including substitution and labor for new technologies in their employment estimate. However, The Report does not show how it reached its estimates of auto industry jobs per vehicle produced, additional jobs per additional auto industry job, or additional jobs per dealer employment. In addition, EPA disagrees with the use of the ‘multiplier’ approach towards estimating employment impacts in the context of the U.S. economy. EPA suggests that the primary effect of regulation when unemployment is low is to move jobs between sectors, rather than create a net gain or loss. In addition, the process for determining employment within the auto industry (forecasting a production/employment index based solely on past trends with no empirical model) seems flawed. Additional shortcomings of the Report which the Response does not address:
- The Report estimates the elasticity of vehicle expenditures with respect to price, and compares that with elasticities of sales volume with respect to price in the literature. However, these two elasticities are not directly comparable; in order to be comparable you would have to add ‘1’ to CAR’s elasticity of vehicle expenditures (which is price x quantity). If this is done, then the Report’s estimated elasticity is significantly larger in absolute value than estimates in the literature, and not smaller as the Report inaccurately states. This means that the Report estimates a higher impact on expenditures, and thus a higher impact on vehicles sold, than would be estimated if demand elasticities from the literature were used.
131
- Both econometric models have expenditures as the dependent variable and price as an independent variable. Since price and expenditures (price x quantity) are not independent, these models violate the necessary assumptions of a linear regression model. Neither model captures the potential adjustment margin of vehicle type, and potentially conflates changing product mix with changes in vehicle sales. In addition, some of the independent variables used in the model are likely to be related, potentially biasing the results. The Report does not show any robustness tests or alternative specifications, and provides little to no evidence of the validity of their model.
In conclusion, the Response reveals a lack of basic understanding both of EPA’s original analysis in their Draft Technical Assessment Report, and of EPA’s critiques to the Report in the Proposed Determination and the Technical Support Document. The “corrections and clarifications” in the Response in no way address the significant shortcomings of the Report which EPA identified and described. Accordingly, EPA should not give weight to CAR’s seriously flawed analysis in carrying out this review. Respectfully submitted for the Record, Katherine Rittenhouse Economic Analyst Matthew Zaragoza Watkins High Meadows Senior Economist
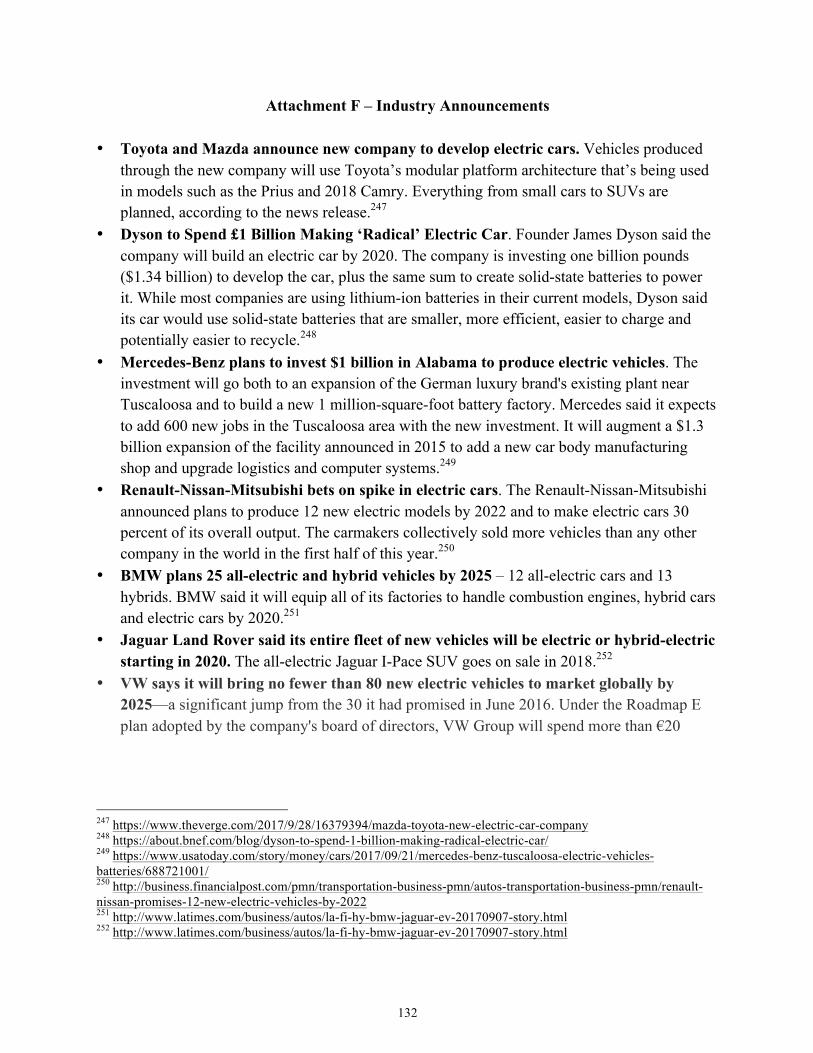
132
Attachment F – Industry Announcements • Toyota and Mazda announce new company to develop electric cars. Vehicles produced
through the new company will use Toyota’s modular platform architecture that’s being used in models such as the Prius and 2018 Camry. Everything from small cars to SUVs are planned, according to the news release.247
• Dyson to Spend £1 Billion Making ‘Radical’ Electric Car. Founder James Dyson said the company will build an electric car by 2020. The company is investing one billion pounds ($1.34 billion) to develop the car, plus the same sum to create solid-state batteries to power it. While most companies are using lithium-ion batteries in their current models, Dyson said its car would use solid-state batteries that are smaller, more efficient, easier to charge and potentially easier to recycle.248
• Mercedes-Benz plans to invest $1 billion in Alabama to produce electric vehicles. The investment will go both to an expansion of the German luxury brand's existing plant near Tuscaloosa and to build a new 1 million-square-foot battery factory. Mercedes said it expects to add 600 new jobs in the Tuscaloosa area with the new investment. It will augment a $1.3 billion expansion of the facility announced in 2015 to add a new car body manufacturing shop and upgrade logistics and computer systems.249
• Renault-Nissan-Mitsubishi bets on spike in electric cars. The Renault-Nissan-Mitsubishi announced plans to produce 12 new electric models by 2022 and to make electric cars 30 percent of its overall output. The carmakers collectively sold more vehicles than any other company in the world in the first half of this year.250
• BMW plans 25 all-electric and hybrid vehicles by 2025 – 12 all-electric cars and 13 hybrids. BMW said it will equip all of its factories to handle combustion engines, hybrid cars and electric cars by 2020.251
• Jaguar Land Rover said its entire fleet of new vehicles will be electric or hybrid-electric starting in 2020. The all-electric Jaguar I-Pace SUV goes on sale in 2018.252
• VW says it will bring no fewer than 80 new electric vehicles to market globally by 2025—a significant jump from the 30 it had promised in June 2016. Under the Roadmap E plan adopted by the company's board of directors, VW Group will spend more than €20
247 https://www.theverge.com/2017/9/28/16379394/mazda-toyota-new-electric-car-company 248 https://about.bnef.com/blog/dyson-to-spend-1-billion-making-radical-electric-car/ 249 https://www.usatoday.com/story/money/cars/2017/09/21/mercedes-benz-tuscaloosa-electric-vehicles-batteries/688721001/ 250 http://business.financialpost.com/pmn/transportation-business-pmn/autos-transportation-business-pmn/renault-nissan-promises-12-new-electric-vehicles-by-2022 251 http://www.latimes.com/business/autos/la-fi-hy-bmw-jaguar-ev-20170907-story.html 252 http://www.latimes.com/business/autos/la-fi-hy-bmw-jaguar-ev-20170907-story.html
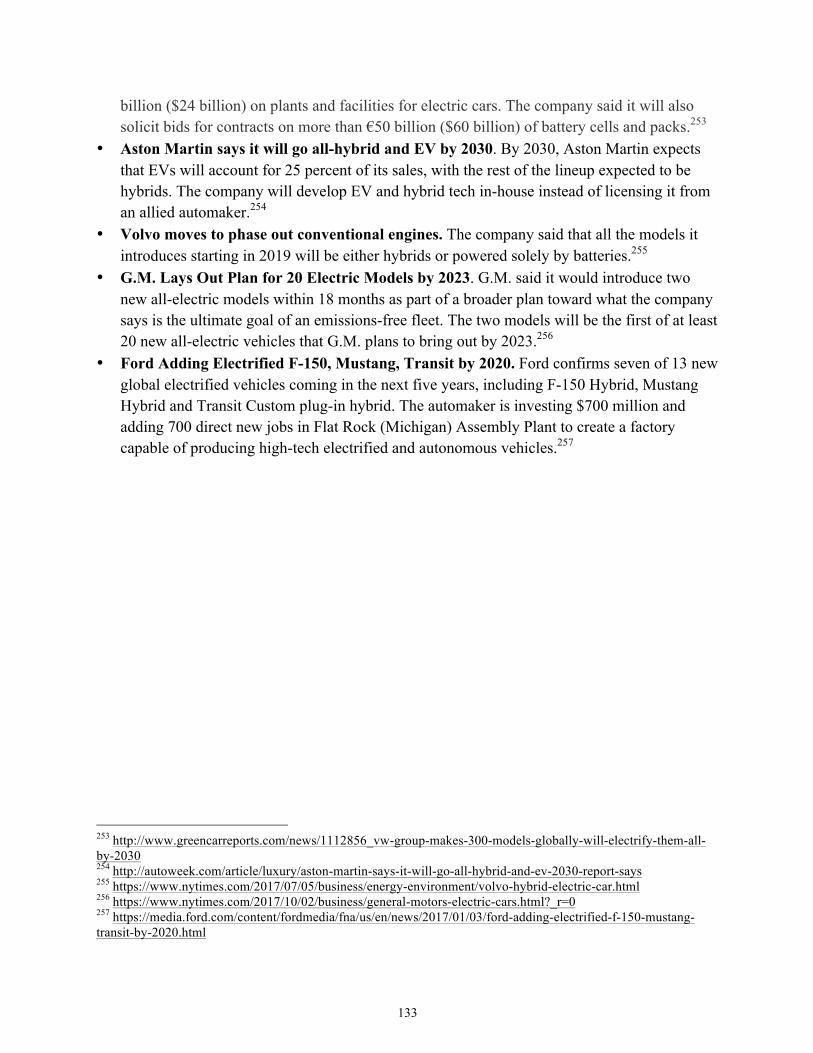
133
billion ($24 billion) on plants and facilities for electric cars. The company said it will also solicit bids for contracts on more than €50 billion ($60 billion) of battery cells and packs.253
• Aston Martin says it will go all-hybrid and EV by 2030. By 2030, Aston Martin expects that EVs will account for 25 percent of its sales, with the rest of the lineup expected to be hybrids. The company will develop EV and hybrid tech in-house instead of licensing it from an allied automaker.254
• Volvo moves to phase out conventional engines. The company said that all the models it introduces starting in 2019 will be either hybrids or powered solely by batteries.255
• G.M. Lays Out Plan for 20 Electric Models by 2023. G.M. said it would introduce two new all-electric models within 18 months as part of a broader plan toward what the company says is the ultimate goal of an emissions-free fleet. The two models will be the first of at least 20 new all-electric vehicles that G.M. plans to bring out by 2023.256
• Ford Adding Electrified F-150, Mustang, Transit by 2020. Ford confirms seven of 13 new global electrified vehicles coming in the next five years, including F-150 Hybrid, Mustang Hybrid and Transit Custom plug-in hybrid. The automaker is investing $700 million and adding 700 direct new jobs in Flat Rock (Michigan) Assembly Plant to create a factory capable of producing high-tech electrified and autonomous vehicles.257
253 http://www.greencarreports.com/news/1112856_vw-group-makes-300-models-globally-will-electrify-them-all-by-2030 254 http://autoweek.com/article/luxury/aston-martin-says-it-will-go-all-hybrid-and-ev-2030-report-says 255 https://www.nytimes.com/2017/07/05/business/energy-environment/volvo-hybrid-electric-car.html 256 https://www.nytimes.com/2017/10/02/business/general-motors-electric-cars.html?_r=0 257 https://media.ford.com/content/fordmedia/fna/us/en/news/2017/01/03/ford-adding-electrified-f-150-mustang-transit-by-2020.html