Oceanographic Data for the Pacific Northwest Coast from Washington to Northern California: Results...
29
1 Oceanographic Data for the Pacific Northwest Coast from Washington to Northern California: Results from an Undergraduate Research Cruise Noah L. Halvorsen, James E. Gawel, Cheryl L. Greengrove University of Washington, Tacoma, Interdisciplinary Arts and Sciences Program, 1900 Commerce St., Campus Box 358436, Tacoma, WA 98402 Abstract In the summer of 2002, as part of an undergraduate course offered by the University of Washington, Tacoma, in an educational partnership with the Sea Education Association of Woods Hole, Massachusetts, physical, chemical, and biological data were collected along a cruise track from the Puget Sound to San Francisco Bay aboard the SSV Robert C. Seamans. Continuous sea surface data were collected using a flow-through system, while current magnitude and direction were measured by ADCP. In addition, CTD casts were conducted at various locations along the longitudinal cruise track, and nutrient, chlorophyll-a, and oxygen concentrations were measured. The data collected show (1) evidence of upwelling along the Northern California coast, (2) the signature of the Columbia River plume, (3) the location of the California Current, (4) an eddy south of Cape Mendocino, and (5) evidence of the California Undercurrent. Results from this cruise are compared to historical data. Introduction The Pacific Ocean is the deepest ocean on earth. The surface area of the Pacific Ocean is thirty percent of the total surface area of the planet and forty percent of the total area of the oceans (Tchernia, 1980). The physical and chemical characteristics of Pacific coastal waters are primarily determined by large-scale ocean circulation patterns (Sverdrup et al., 1942). The North Pacific Current approaches the west coast at ~45°N and splits. A small part of the flow turns north along the coast of northern Washington, British Columbia and Alaska as part of the Alaskan Gyre System, and the larger portion turns southward to form the California Current System, the eastern branch of the North Pacific gyre (Horner et al., 1997; Hickey, 1989). The California Current System is made up of three currents, the California Current, the Davidson Current, and the California Undercurrent (Figure 1). The Davidson Current and the California Undercurrent both bring warmer, saltier, low oxygen, equatorial water from low to high latitudes. The California Current brings low temperature, low salinity, high oxygen subarctic water from high to low latitudes (Horner
-
Upload
independent -
Category
Documents
-
view
0 -
download
0
Transcript of Oceanographic Data for the Pacific Northwest Coast from Washington to Northern California: Results...
1
Oceanographic Data for the Pacific Northwest Coast from Washington to Northern California: Results from an Undergraduate Research Cruise Noah L. Halvorsen, James E. Gawel, Cheryl L. Greengrove University of Washington, Tacoma, Interdisciplinary Arts and Sciences Program, 1900 Commerce St., Campus Box 358436, Tacoma, WA 98402 Abstract In the summer of 2002, as part of an undergraduate course offered by the University of Washington, Tacoma, in an educational partnership with the Sea Education Association of Woods Hole, Massachusetts, physical, chemical, and biological data were collected along a cruise track from the Puget Sound to San Francisco Bay aboard the SSV Robert C. Seamans. Continuous sea surface data were collected using a flow-through system, while current magnitude and direction were measured by ADCP. In addition, CTD casts were conducted at various locations along the longitudinal cruise track, and nutrient, chlorophyll-a, and oxygen concentrations were measured. The data collected show (1) evidence of upwelling along the Northern California coast, (2) the signature of the Columbia River plume, (3) the location of the California Current, (4) an eddy south of Cape Mendocino, and (5) evidence of the California Undercurrent. Results from this cruise are compared to historical data. Introduction The Pacific Ocean is the deepest ocean on earth. The surface area of the Pacific
Ocean is thirty percent of the total surface area of the planet and forty percent of the total
area of the oceans (Tchernia, 1980). The physical and chemical characteristics of Pacific
coastal waters are primarily determined by large-scale ocean circulation patterns
(Sverdrup et al., 1942). The North Pacific Current approaches the west coast at ~45°N
and splits. A small part of the flow turns north along the coast of northern Washington,
British Columbia and Alaska as part of the Alaskan Gyre System, and the larger portion
turns southward to form the California Current System, the eastern branch of the North
Pacific gyre (Horner et al., 1997; Hickey, 1989).
The California Current System is made up of three currents, the California
Current, the Davidson Current, and the California Undercurrent (Figure 1). The
Davidson Current and the California Undercurrent both bring warmer, saltier, low
oxygen, equatorial water from low to high latitudes. The California Current brings low
temperature, low salinity, high oxygen subarctic water from high to low latitudes (Horner

2
et al., 1997). In summer, the surface expression of the cooler California Current appears
warmer than cold coastal upwelled water along the coast of Washington, Oregon, and
Northern California. Once past San Francisco, this current is visible as a cold current on
its way south to connect with the North Equatorial Current close to the equator (Hickey,
1989; Pinet, 1996).
The California Current has a seasonal change in strength and position due to
changes in wind forces. Storms dominate Pacific Northwest coastal waters in winter and
the equatorward flowing California Current moves off shore. In winter, there is a broad
poleward flowing current called the Davidson Current at the surface along most of the
coast of Washington, Oregon, and northern California. Winds predominantly blow from
the north or northwest during the summer months off the North American west coast,
which leads to coastal upwelling. Both the equatorward surface current and the poleward
undercurrent seem to be strongest in the season when the local wind stress is mostly
favorable for upwelling (Huyer et al., 1989). During the upwelling season, in spring and
summer, there is a narrow, near shore poleward countercurrent that appears on the
surface off northern California whenever upwelling-favorable winds weaken. This
current is believed to be the surfacing of the poleward flowing California Undercurrent.
The California Undercurrent is partly driven by the alongshore pressure gradient set up
by the strong equatorward wind stress, and is typically found along the upper slope of the
continental shelf from northern California to Washington centered around 200 m (Huyer
et al., 1989). The California Undercurrent can be detected as an anomalously salty and
slightly warmer water mass using CTD data.

3
Figure 1: The current system of equatorward and poleward flows off the Pacific Northwest Coast (Howe et al., 2003).
Productivity in the Northeastern Pacific Ocean off the shore of western Canada
and the United States requires the presence of nutrients. The macronutrients nitrogen,
phosphorus, and silica are particularly crucial for primary production. Phytoplankton
require nitrogen, primarily in the form of nitrate, to manufacture amino acids, DNA, and
RNA. Phosphorus, in the form of phosphate, is needed to produce phospholipids and
ATP. Diatoms form their frustules, or outer shells, by utilizing silica obtained in the form
of silicate (Pinet, 1996). Phytoplankton are the foundation of all oceanic food chains.
4
Nutrient levels in the ocean directly impact the dynamics affecting the interrelationship
between phytoplankton and zooplankton and the fish that feed on them.
Because nutrient levels are continuously low in the photic zone, the ocean, for the
most part, is unproductive. The exceptions to this are the shallow waters of the
continental shelves fed by rivers and the upwelling regions (Pinet, 1996). One of the
objectives of this project was to determine the distribution of nutrients available for
primary productivity in the northeast Pacific Ocean off the coasts of Washington,
Oregon, and northern California. Nutrient concentrations along with water temperature
and salinity can indicate the presence of upwelling and river inputs such as the Columbia
River plume. Nutrient, temperature, and salinity data were examined for evidence of an
El Niño event and to see if there was an increase or decrease in near surface nutrient
availability between the El Niño and the non El Niño years by comparing with historical
data.
Material & Methods
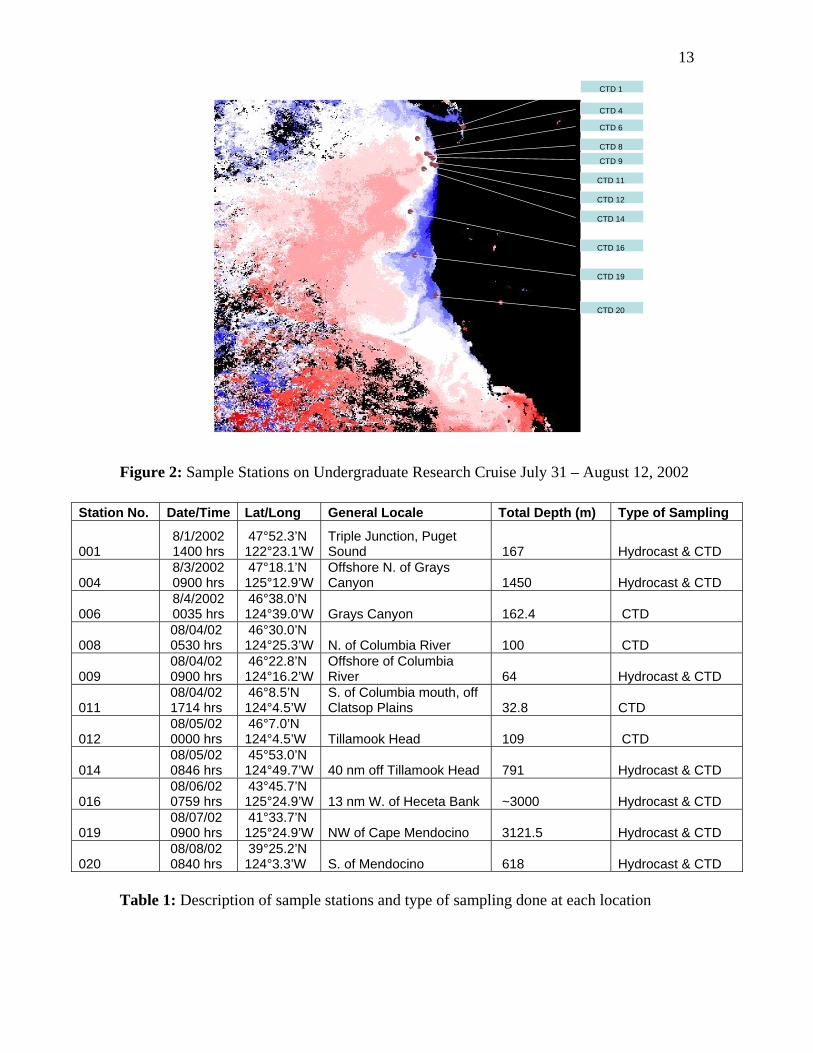
Data were collected on a 13-day cruise (July 31 to August 12, 2002) aboard the
SSV Robert C. Seamans along a Pacific Northwest coast longitudinal transect from
Washington to Northern California. Eleven hydrographic stations were sampled along
this longitudinal transect (Figure 2 & Table 1). These sites were chosen in order to
compare the water properties associated with different oceanic regimes such as the
Columbia River Plume, coastal upwelling, and the California Current System.
Vertical profiles of temperature and salinity were collected with a Seabird CTD
(conductivity-temperature-depth recorder) along with twelve discrete water samples from
various depths at each station. Water samples were analyzed for nitrogen, phosphorus,
5
silicate, dissolved oxygen and chlorophyll. Bathymetric information acquired by the
CHIRP system was used to determine the target depth of the cast and the automatic firing
depth for the Niskin bottles.
Surface seawater was pumped continuously to measure surface temperature and
salinity using a Sea Bird Thermosalinograph. Underway Acoustic Doppler current
profiles were also collected continuously. Water samples were collected from the flow
through system at the time of hydrocasts to be analyzed for surface chlorophyll-a,
dissolved oxygen, nitrate, phosphate, and silicate.
Dissolved oxygen concentrations were determined using the Winkler Titration
method (Carpenter, 1965). Nitrate concentrations were determined via cadmium
reduction method onboard the ship (Parsons et al., 1984). Phosphate concentrations were
determined using the ascorbic acid method (Parsons et al., 1984). Silicate concentrations
were determined using the Silicomolybdate method (Parsons et al., 1984). Oxygen
samples were analyzed shipboard and the nutrient analyses were performed by the UW
Marine Chemistry Laboratory in Seattle, Washington after the cruise.
Comparative historical data was taken from the World Ocean Database (2001)
(NOAA, 2003) and the Oceanographic Profile Database produced by the National
Oceanographic Data Center (NOAA, 2003). Comparative graphs were produced on the
Ocean Data View program to show changes over time at site locations (Alfred Wegener
Institute, 2003). All historical comparison stations were within a 20 nautical mile radius
of cruise hydrocast locations.
6
UResults & Discussion
UColumbia River Plume
Salinity in the coastal region of the eastern North Pacific is strongly affected by
precipitation and runoff. The Columbia River discharge is responsible for 77% of the
total drainage into the Pacific between San Francisco Bay and the Strait of Juan de Fuca
(Hickey, 1989). Earlier studies of this region indicate the existence of a seasonal
variation in the direction of the Columbia River Plume. In fall and winter, the plume
follows the dominant currents northward, whereas in spring and summer, the plume
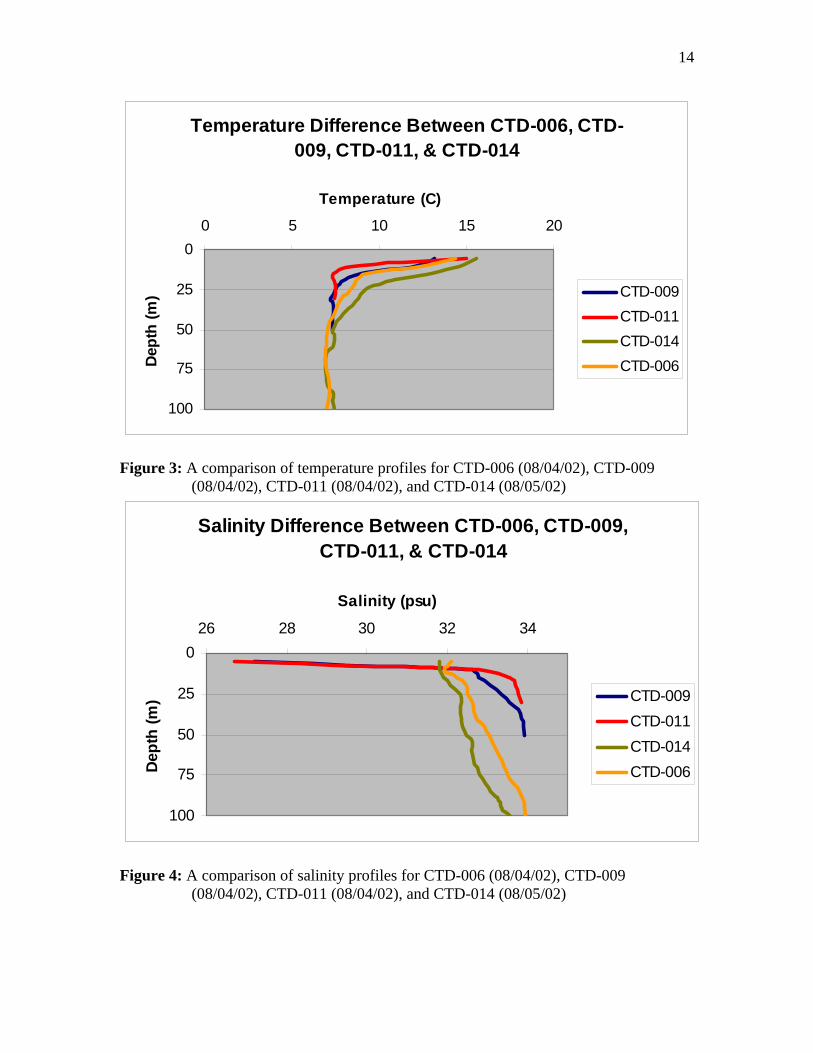
travels to the south (Strub et al., 1987). Six stations were positioned around the area of
the Columbia River to document plume location. Station 6 furthest north at Grays
Canyon and station 14 furthest south, forty nautical miles off Tillamook Head, bracket
the plume region. Stations 9 and 11, taken directly in the plume at the mouth of the
Columbia River, showed higher temperatures and lower salinities in a mixed layer of
approximately ten meters (Figure 3 and 4). Data from stations 6 and 14 are more
indicative of general coastal shelf profiles (Figure 3 and 4). Evidence of the plume was
not found in the other two shelf stations.
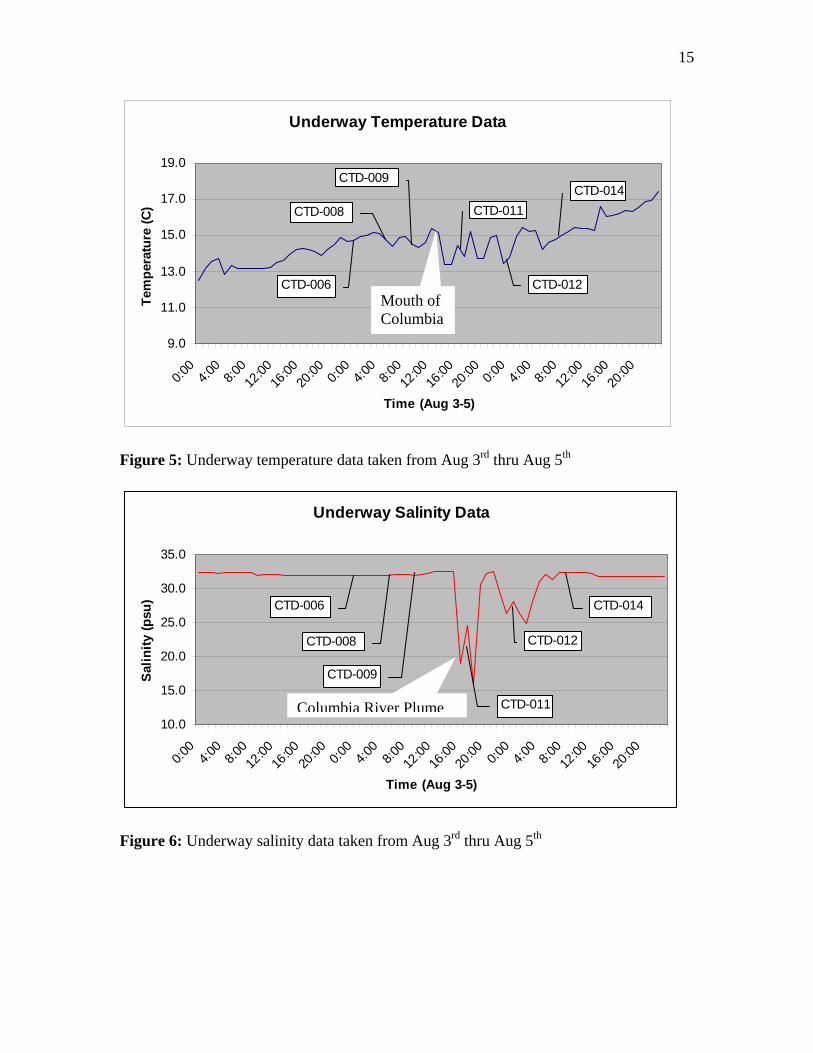
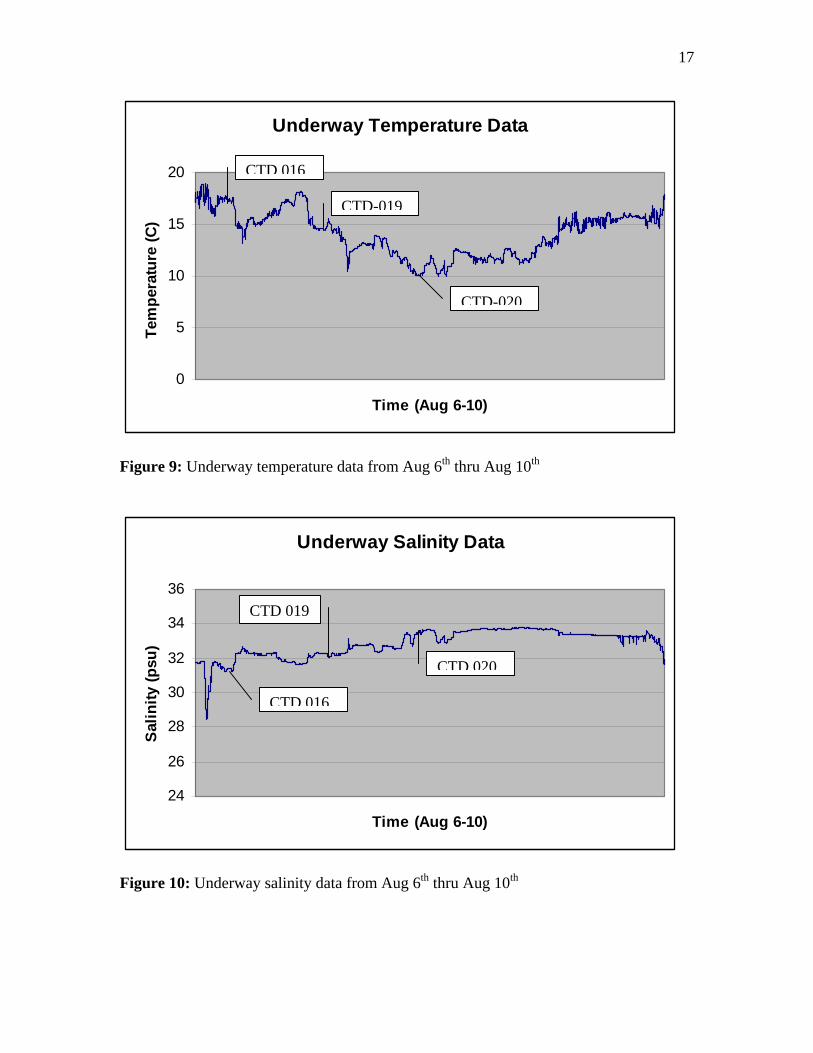
Since the plume and its velocity field respond within hours to changes in wind
speed and direction (Fiedler and Laurs, 1990), a continuous underway surface profile of
water properties in this area is necessary to fully map the extent of the plume. The
underway data for this sampling period shows increased temperatures and a decrease in
salinity south of the Columbia River mouth which is consistent with previous results
7
from summer surveys (Figure 5 and 6). The underway salinity data shows two dips in the
salinity graph in figure 6 suggesting that we traveled through two filaments of the fresh
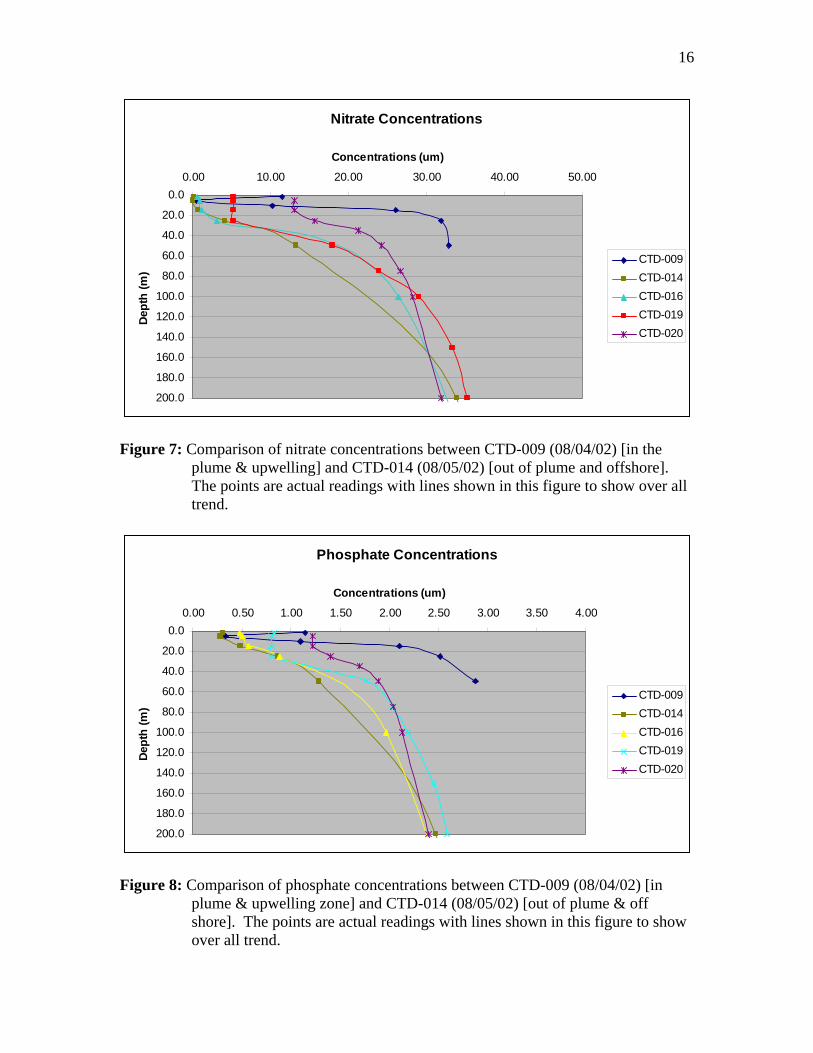
water plume. The analysis of the nutrient data also suggests that evidence of the river
outflow is strongest right at the mouth of the river. Near surface nitrates and phosphates
were both found in greater concentrations at station 9, in the plume, than offshore stations
14, 16, and 19 (Figures 7 and 8).
Upwelling
It has been suggested by an earlier study performed by Duxbury and McGary
(1968) that the turbulence of the Columbia River along with the strong costal upwelling
that occurs on the Oregon coast in the late summer provides a surface flow dynamic
churning up deeper water at the moth of the river. Cold, salty, nutrient rich upwelled
water appears underneath the plume at station 9, which seems to support this earlier study
(Figure 7, 8, 11, 12).
California Current
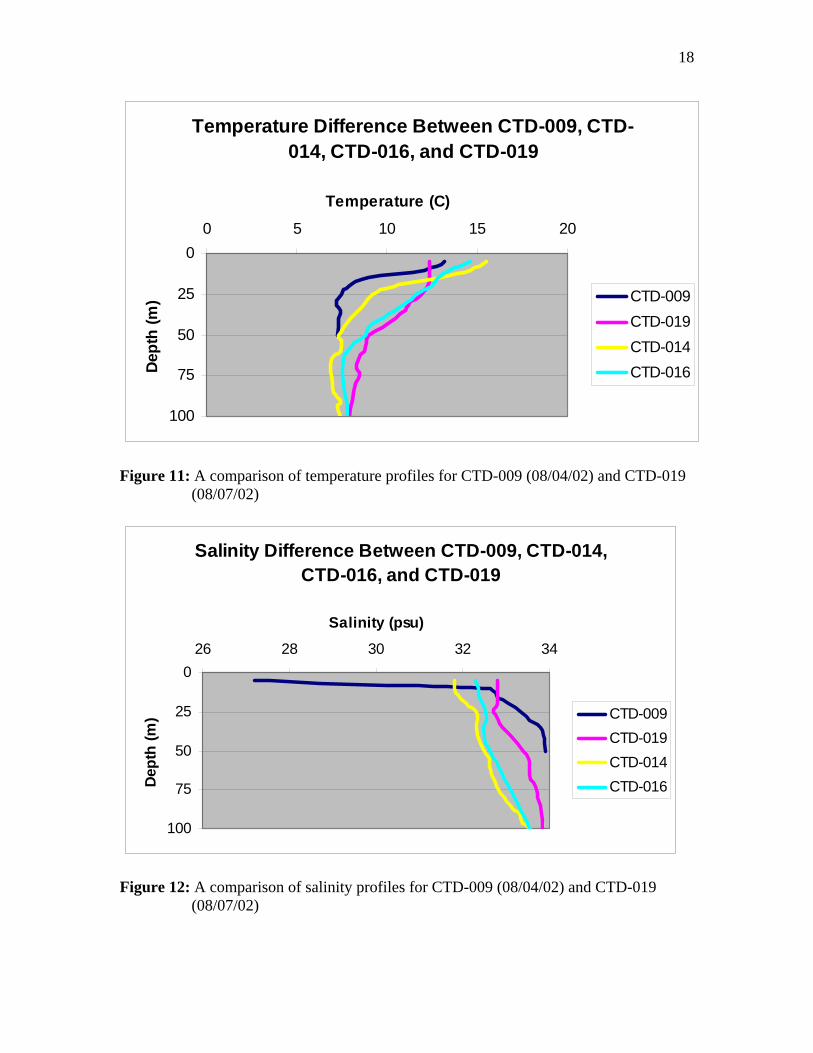
South of the Columbia River Plume, four CTD stations (14, 16, 19, and 20) were
examined for evidence of the California Current, Undercurrent or coastal upwelling
activity. ADCP was used to see if there was any evidence of the California Current in
surface waters. Offshore stations 14, 16, and 19 had lower salinities and higher
temperatures than station 9, in the plume, below ten meters. This suggests the presence
of the California Current at these offshore stations. Stations 14 and 16 appear to have the
strongest temperature and salinity signal associated with the California Current. The
location of the California Current is consistent with the sea surface temperature satellite
image in figure 2 and ADCP data from this region (Figure 13 and 14). During El Niño

8
events the equatorward flow in the California Current is expected to be anomalously
weak and during La Niña events, the California Current is anomalously strong (Hickey,
1989). With this limited data set we briefly encountered the California Current but were
unable to fully determine its strength or extent.
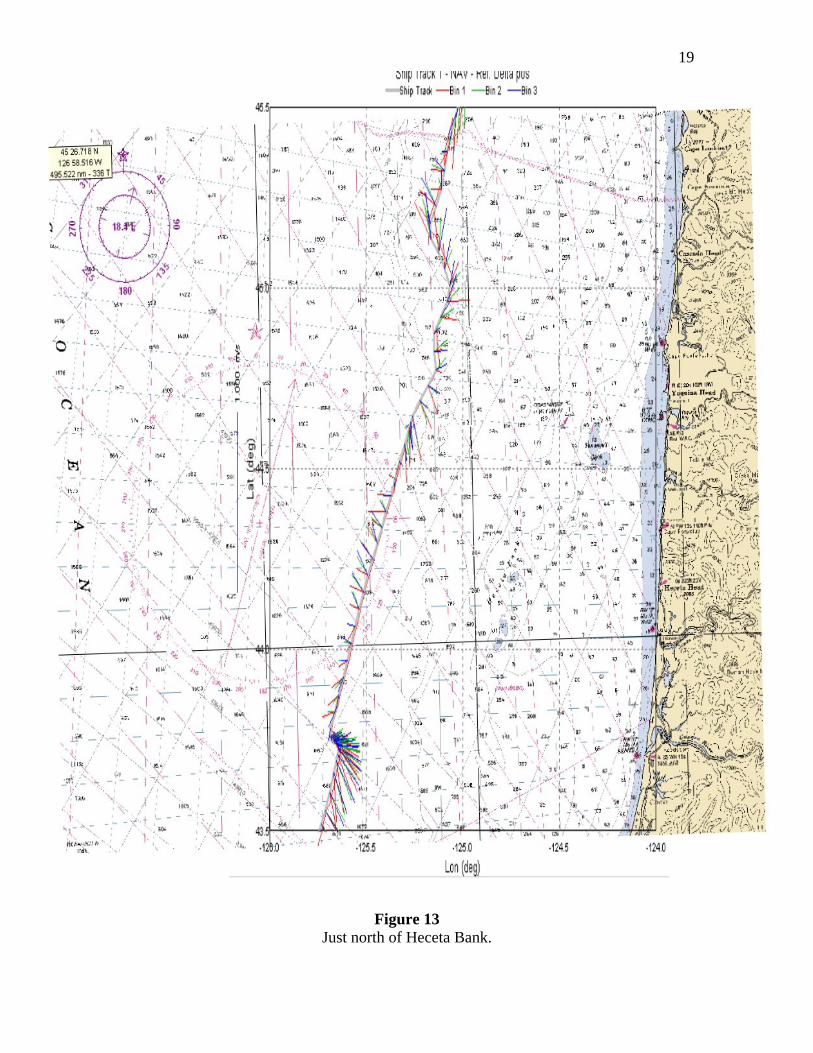
The strongest evidence for the California Current came from the ADCP (Figures
13, 14, 15 and 16). The ADCP showed evidence of the California Current just north of
the Heceta Bank around 43° 7’ N, until just north of Cape Mendocino, where our course
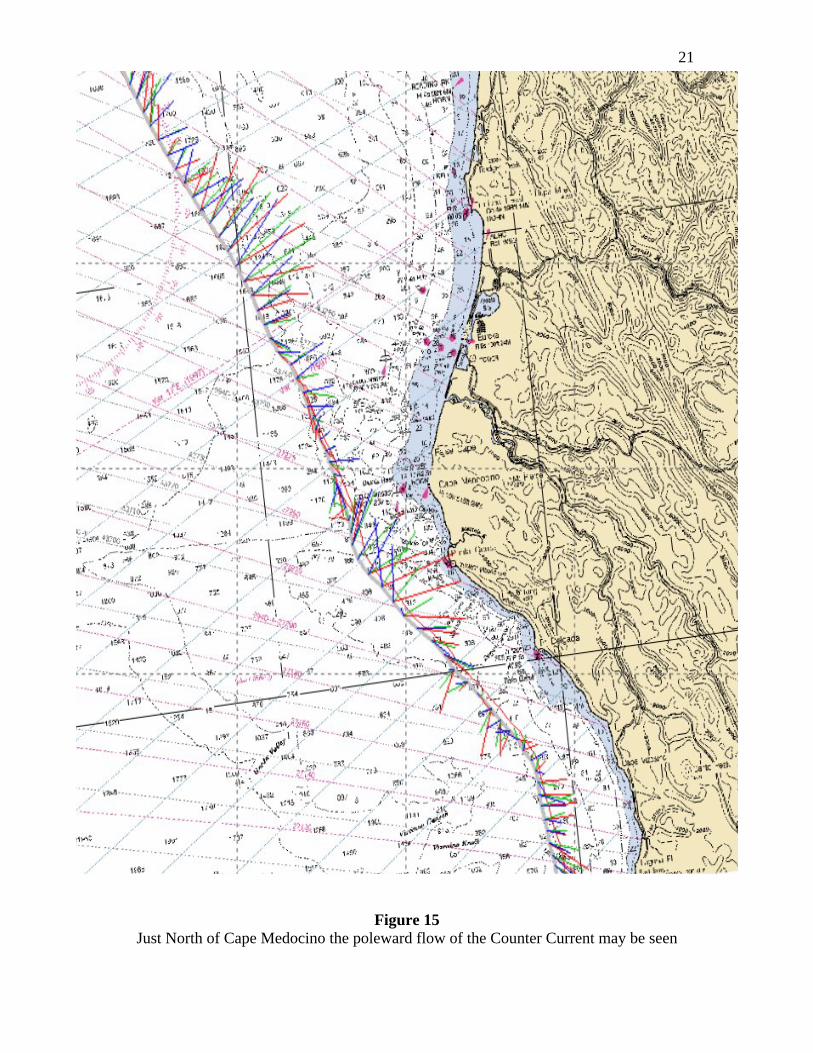
took us closer to land (Figure 15 and 16). As we moved onto the shelf, there was a
change in current flow at 41° 6’ N from an equatorward flow to a poleward flow. While
this might be evidence for the countercurrent, this flow appears to be too far offshore for
this current and the flow reversal may be due to a meander in the California Current.
Unfortunately, not enough data was collected to adequately determine the full surface
velocity field.
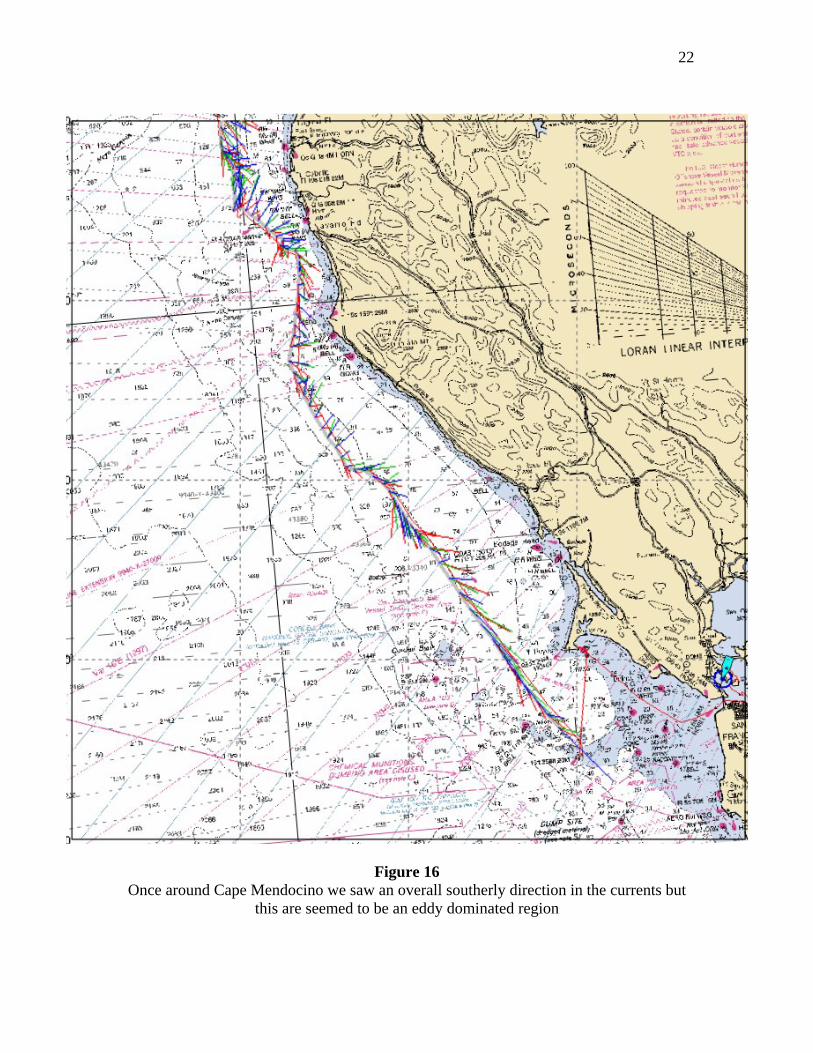
Reversal of flows around Cape Mendocino are indicative of eddies often found
here (Figures 15 and 16). Eddies in this region are thought to be generated by sharp
bathymetry (Mendocino Escarpment) and coastline changes around Cape Mendocino
(Bray & Greengrove, 1993). Once around Cape Mendocino there was no evidence of
consistent equatorward flow, just a series of eddies or filaments that were captured in the
ADCP data. This is most likely due to the fact that we were near shore where headlands
tend to generate eddies and the California Current was further offshore.
We collected data from one near shore station (20) south of Cape Mendocino and
just north of Point Arena with a dominant poleward flow. This CTD station shows
9
evidence of the warmer temperature higher salinity California Undercurrent in a
comparative T-S plot (Figure 28).
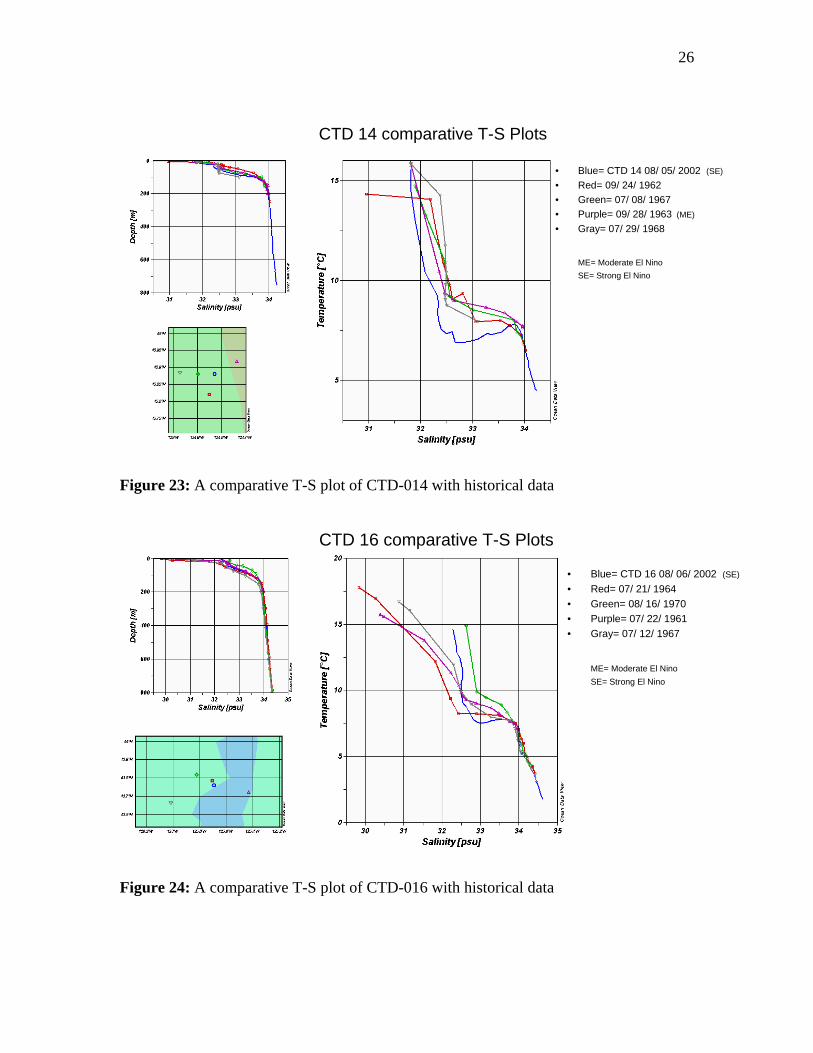
At stations 14 and 16 (Figures 23 and 24) an unexplained phenomenon was
observed in our data. A body of anomalously cold, fresh water that is low in oxygen was
observed around 100 m. This anomaly was also seen by other researchers along the coast
of Oregon and Washington during the summer of 2002. This anomaly resulted in benthic
biological organism stress and die off as well as some fish kills due to low oxygen during
the time it was observed (Strub, 2004 and Schwing et al., 2004).
Comparisons with Historical Data
When comparing our CTD stations with historical data from locations within a 20
nm radius, our temperatures were on average lower than the historical data (Figures 17,
19, 21, 22, 23, 24, 26, and 28). Comparisons of our data with historical data did not show
any nutrient or temperature-salinity differences between El Niño and non El Niño years
over this time frame (Figures 18, 20, 25, 27, and 29).
Conclusion
The Columbia River Plume was found to move southward over the shelf during
August of 2002 which is consistent with historical data. Evidence of upwelling was
found on the shelf beneath the plume in cold saline nutrient rich waters. The California
Current was observed briefly offshore along the Oregon coast. Eddies and the
Undercurrent were found at Cape Mendocino and south to Point Arena near shore. The
August 2002 CTD data appears cooler than historical data for the same region and there
appears to be no difference in water property data from El Niño to La Niña years.
10
Oceanographic data for the Pacific Northwest coast from Washington to Northern
California is important for understanding the physical, chemical, and biological factors
affecting local fisheries and for constructing models for effective fisheries management.
However, current comprehensive large-scale alongshore oceanographic data for the
Pacific Northwest coast is minimal. Therefore, regular continuous sampling cruises
along this coast would add greatly to the knowledge of local ocean conditions and aid in
decision-making for addressing fisheries concerns.
Acknowledgments
I would like to thank Dr. Cheryl Greengrove, Dr. Jim Gawel and the SEA Education
Association for working so hard to give us this oceanographic fieldwork opportunity. I
would also like to acknowledge the work of my fellow students in making this research
project a successful experience and a true team effort. I would also like to give a special
thanks to Dr. Cheryl Greengrove for putting in those extra hours with me to finally
complete this paper.
11
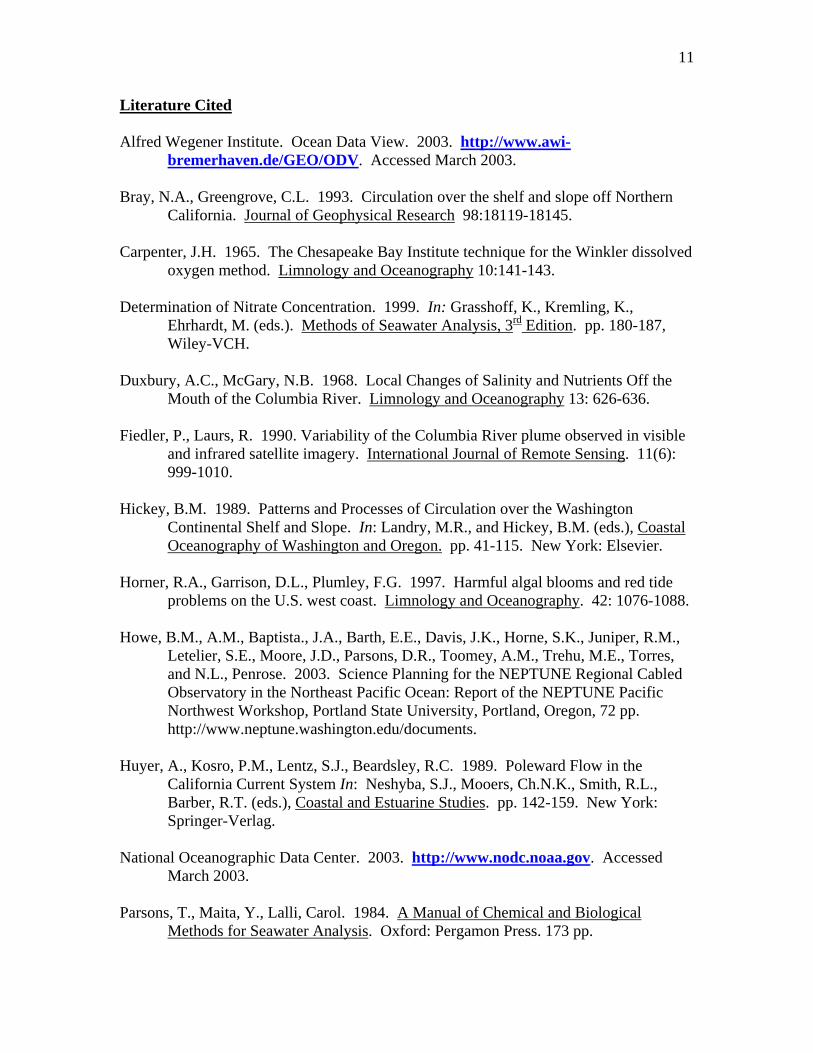
Literature Cited
Alfred Wegener Institute. Ocean Data View. 2003. http://www.awi-bremerhaven.de/GEO/ODV. Accessed March 2003.
Bray, N.A., Greengrove, C.L. 1993. Circulation over the shelf and slope off Northern
California. Journal of Geophysical Research 98:18119-18145. Carpenter, J.H. 1965. The Chesapeake Bay Institute technique for the Winkler dissolved
oxygen method. Limnology and Oceanography 10:141-143. Determination of Nitrate Concentration. 1999. In: Grasshoff, K., Kremling, K.,
Ehrhardt, M. (eds.). Methods of Seawater Analysis, 3rd Edition. pp. 180-187, Wiley-VCH.
Duxbury, A.C., McGary, N.B. 1968. Local Changes of Salinity and Nutrients Off the
Mouth of the Columbia River. Limnology and Oceanography 13: 626-636. Fiedler, P., Laurs, R. 1990. Variability of the Columbia River plume observed in visible
and infrared satellite imagery. International Journal of Remote Sensing. 11(6): 999-1010.
Hickey, B.M. 1989. Patterns and Processes of Circulation over the Washington
Continental Shelf and Slope. In: Landry, M.R., and Hickey, B.M. (eds.), Coastal Oceanography of Washington and Oregon. pp. 41-115. New York: Elsevier.
Horner, R.A., Garrison, D.L., Plumley, F.G. 1997. Harmful algal blooms and red tide
problems on the U.S. west coast. Limnology and Oceanography. 42: 1076-1088. Howe, B.M., A.M., Baptista., J.A., Barth, E.E., Davis, J.K., Horne, S.K., Juniper, R.M.,
Letelier, S.E., Moore, J.D., Parsons, D.R., Toomey, A.M., Trehu, M.E., Torres, and N.L., Penrose. 2003. Science Planning for the NEPTUNE Regional Cabled Observatory in the Northeast Pacific Ocean: Report of the NEPTUNE Pacific Northwest Workshop, Portland State University, Portland, Oregon, 72 pp. http://www.neptune.washington.edu/documents.
Huyer, A., Kosro, P.M., Lentz, S.J., Beardsley, R.C. 1989. Poleward Flow in the
California Current System In: Neshyba, S.J., Mooers, Ch.N.K., Smith, R.L., Barber, R.T. (eds.), Coastal and Estuarine Studies. pp. 142-159. New York: Springer-Verlag.
National Oceanographic Data Center. 2003. http://www.nodc.noaa.gov. Accessed
March 2003. Parsons, T., Maita, Y., Lalli, Carol. 1984. A Manual of Chemical and Biological
Methods for Seawater Analysis. Oxford: Pergamon Press. 173 pp.

12
Pinet, P.R. 1996. Invitation to Oceanography. Minneapolis: West Publishing
Company. Schwing, F.B., R. Mendelssohn and S.J., Bogard. Changes in Seasonal Coastal Upwelling in the Canary and California Current System. Ocean Sciences Meeting
Portland. January 2004. Strub, P. A Review of Results Concerning GLOBEC NEP Hypotheses in the California Current. Ocean Sciences Meeting Portland. January 2004. Strub, P.T., Allen, J.S., Huyer, A., Smith, R.L. 1987. Seasonal Cycles of Currents,
Temperatures, Winds and Sea Level Over the Northeast Pacific Continental Shelf: 35° N to 48° N. Journal of Geophysical Research 92: 1507-1526.
Sverdrup, H.U., Johnson, M.W., Fleming, R.H. 1942. The Oceans their physics,
chemistry, and general biology. Prentice-Hall, Inc. Englewood Cliffs, N.J. pp. 723.
Tchernia, P. 1980. Descriptive Regional Oceanography. Pergamon Press. Oxford pp.
253. World Ocean Database. 2001.
http://www.nodc.noaa.gov/OC5/WOD01/data2001.html. Accessed March 2003.
13
CTD 20
CTD 19
CTD 16
CTD 14
CTD 12
CTD 11
CTD 9
CTD 8
CTD 6
CTD 1
CTD 4
Figure 2: Sample Stations on Undergraduate Research Cruise July 31 – August 12, 2002
Station No. Date/Time Lat/Long General Locale Total Depth (m) Type of Sampling
001 8/1/2002 1400 hrs
47°52.3’N 122°23.1’W
Triple Junction, Puget Sound 167 Hydrocast & CTD
004 8/3/2002 0900 hrs
47°18.1’N 125°12.9’W
Offshore N. of Grays Canyon 1450 Hydrocast & CTD
006 8/4/2002 0035 hrs
46°38.0’N 124°39.0’W Grays Canyon 162.4 CTD
008 08/04/02 0530 hrs
46°30.0’N 124°25.3’W N. of Columbia River 100 CTD
009 08/04/02 0900 hrs
46°22.8’N 124°16.2’W
Offshore of Columbia River 64 Hydrocast & CTD
011 08/04/02 1714 hrs
46°8.5’N 124°4.5’W
S. of Columbia mouth, off Clatsop Plains 32.8 CTD
012 08/05/02 0000 hrs
46°7.0’N 124°4.5’W Tillamook Head 109 CTD
014 08/05/02 0846 hrs
45°53.0’N 124°49.7’W 40 nm off Tillamook Head 791 Hydrocast & CTD
016 08/06/02 0759 hrs
43°45.7’N 125°24.9’W 13 nm W. of Heceta Bank ~3000 Hydrocast & CTD
019 08/07/02 0900 hrs
41°33.7’N 125°24.9’W NW of Cape Mendocino 3121.5 Hydrocast & CTD
020 08/08/02 0840 hrs
39°25.2’N 124°3.3’W S. of Mendocino 618 Hydrocast & CTD
Table 1: Description of sample stations and type of sampling done at each location
14
Temperature Difference Between CTD-006, CTD-009, CTD-011, & CTD-014
0
25
50
75
100
0 5 10 15 20
Temperature (C)
Dep
th (m
) CTD-009CTD-011CTD-014CTD-006
Figure 3: A comparison of temperature profiles for CTD-006 (08/04/02), CTD-009 (08/04/02), CTD-011 (08/04/02), and CTD-014 (08/05/02)
Salinity Difference Between CTD-006, CTD-009, CTD-011, & CTD-014
0
25
50
75
100
26 28 30 32 34
Salinity (psu)
Dept
h (m
) CTD-009CTD-011CTD-014CTD-006
Figure 4: A comparison of salinity profiles for CTD-006 (08/04/02), CTD-009 (08/04/02), CTD-011 (08/04/02), and CTD-014 (08/05/02)
15
Underway Temperature Data
9.0
11.0
13.0
15.0
17.0
19.0
0:00
4:00
8:00
12:00
16:00
20:00 0:0
04:0
08:0
012
:0016
:0020
:00 0:00
4:00
8:00
12:00
16:00
20:00
Time (Aug 3-5)
Tem
pera
ture
(C) CTD-011
CTD-012
CTD-009
CTD-008
CTD-006
CTD-014
Mouth of Columbia
Figure 5: Underway temperature data taken from Aug 3rd thru Aug 5th
Underway Salinity Data
10.0
15.0
20.0
25.0
30.0
35.0
0:00
4:00
8:00
12:00
16:00
20:00 0:0
04:0
08:0
012
:0016
:0020
:00 0:00
4:00
8:00
12:00
16:00
20:00
Time (Aug 3-5)
Salin
ity (p
su) CTD-006
CTD-008
CTD-009
CTD-011
CTD-012
CTD-014
Columbia River Plume
Figure 6: Underway salinity data taken from Aug 3rd thru Aug 5th
16
Nitrate Concentrations
0.0
20.0
40.0
60.0
80.0
100.0
120.0
140.0
160.0
180.0
200.0
0.00 10.00 20.00 30.00 40.00 50.00
Concentrations (um)De
pth
(m)
CTD-009CTD-014CTD-016CTD-019CTD-020
Figure 7: Comparison of nitrate concentrations between CTD-009 (08/04/02) [in the plume & upwelling] and CTD-014 (08/05/02) [out of plume and offshore]. The points are actual readings with lines shown in this figure to show over all trend.
Phosphate Concentrations
0.0
20.0
40.0
60.0
80.0
100.0
120.0
140.0
160.0
180.0
200.0
0.00 0.50 1.00 1.50 2.00 2.50 3.00 3.50 4.00
Concentrations (um)
Dept
h (m
)
CTD-009CTD-014CTD-016CTD-019CTD-020
Figure 8: Comparison of phosphate concentrations between CTD-009 (08/04/02) [in plume & upwelling zone] and CTD-014 (08/05/02) [out of plume & off shore]. The points are actual readings with lines shown in this figure to show over all trend.
17
Underway Temperature Data
0
5
10
15
20
Time (Aug 6-10)
Tem
pera
ture
(C)
CTD-019
CTD 016
CTD-020
Figure 9: Underway temperature data from Aug 6th thru Aug 10th
Underway Salinity Data
24
26
28
30
32
34
36
Time (Aug 6-10)
Salin
ity (p
su)
CTD 019
CTD 020
CTD 016
Figure 10: Underway salinity data from Aug 6th thru Aug 10th
18
Temperature Difference Between CTD-009, CTD-014, CTD-016, and CTD-019
0
25
50
75
100
0 5 10 15 20
Temperature (C)
Dept
h (m
) CTD-009CTD-019CTD-014CTD-016
Figure 11: A comparison of temperature profiles for CTD-009 (08/04/02) and CTD-019 (08/07/02)
Salinity Difference Between CTD-009, CTD-014, CTD-016, and CTD-019
0
25
50
75
100
26 28 30 32 34
Salinity (psu)
Dept
h (m
) CTD-009CTD-019CTD-014CTD-016
Figure 12: A comparison of salinity profiles for CTD-009 (08/04/02) and CTD-019 (08/07/02)
19
Figure 13
Just north of Heceta Bank.

20
Figure 14 Evidence of the California Current shown by the ADCP
21
Figure 15 Just North of Cape Medocino the poleward flow of the Counter Current may be seen
22
Figure 16
Once around Cape Mendocino we saw an overall southerly direction in the currents but this are seemed to be an eddy dominated region

23
CTD 4 comparative T-S Plots
• Blue= CTD 4 08/ 03/ 2002 (SE)
• Red= 08/ 01/ 1961• Green= 08/ 31/ 1971• Purple= 08/ 24/ 1950
ME= Moderate El NinoSE= Strong El Nino
Figure 17: A comparative T-S plot of CTD-004 with historical data
CTD 4 comparative nutrient plots
• Blue= CTD 4 08/ 03/ 2002 (SE)
• Red= 09/ 07/ 1985• Green= 09/ 07/ 1985• Purple= 09/ 07/ 1985
ME= Moderate El NinoSE= Strong El Nino
Figure 18: A comparative nutrient plot of CTD-004 and historical data
24
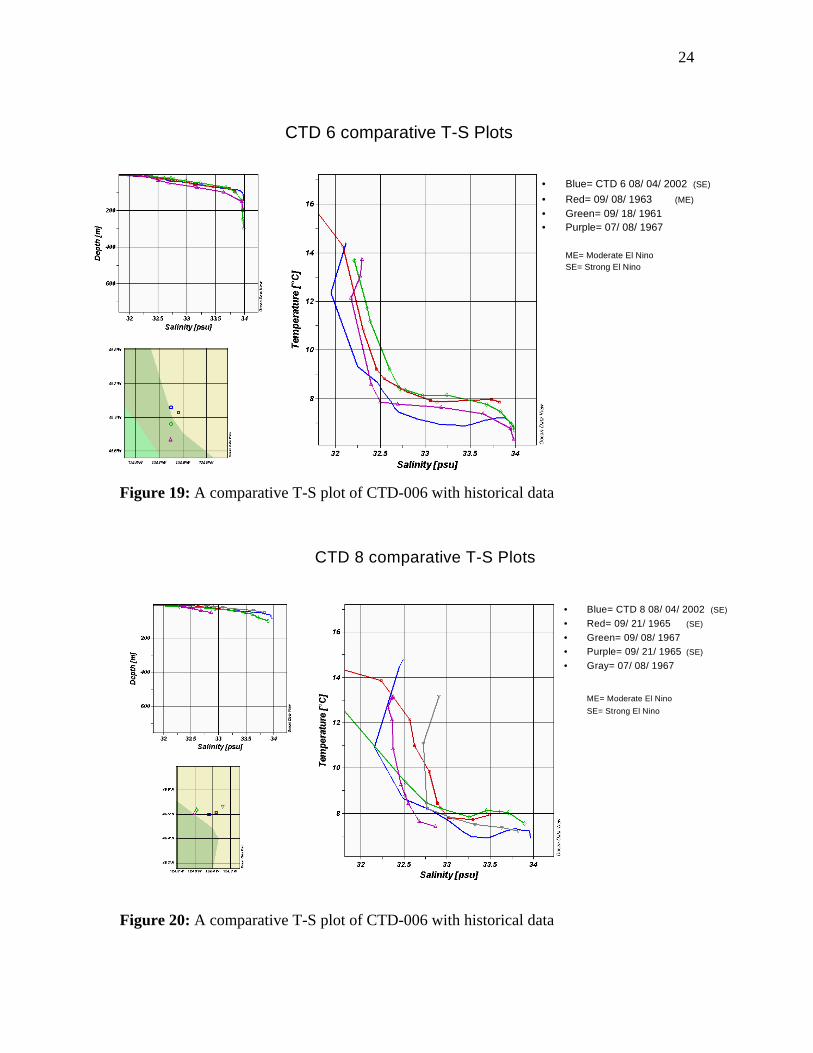
CTD 6 comparative T-S Plots
• Blue= CTD 6 08/ 04/ 2002 (SE)
• Red= 09/ 08/ 1963 (ME)• Green= 09/ 18/ 1961• Purple= 07/ 08/ 1967
ME= Moderate El NinoSE= Strong El Nino
Figure 19: A comparative T-S plot of CTD-006 with historical data
CTD 8 comparative T-S Plots
• Blue= CTD 8 08/ 04/ 2002 (SE)
• Red= 09/ 21/ 1965 (SE)
• Green= 09/ 08/ 1967• Purple= 09/ 21/ 1965 (SE)
• Gray= 07/ 08/ 1967
ME= Moderate El NinoSE= Strong El Nino
Figure 20: A comparative T-S plot of CTD-006 with historical data
25
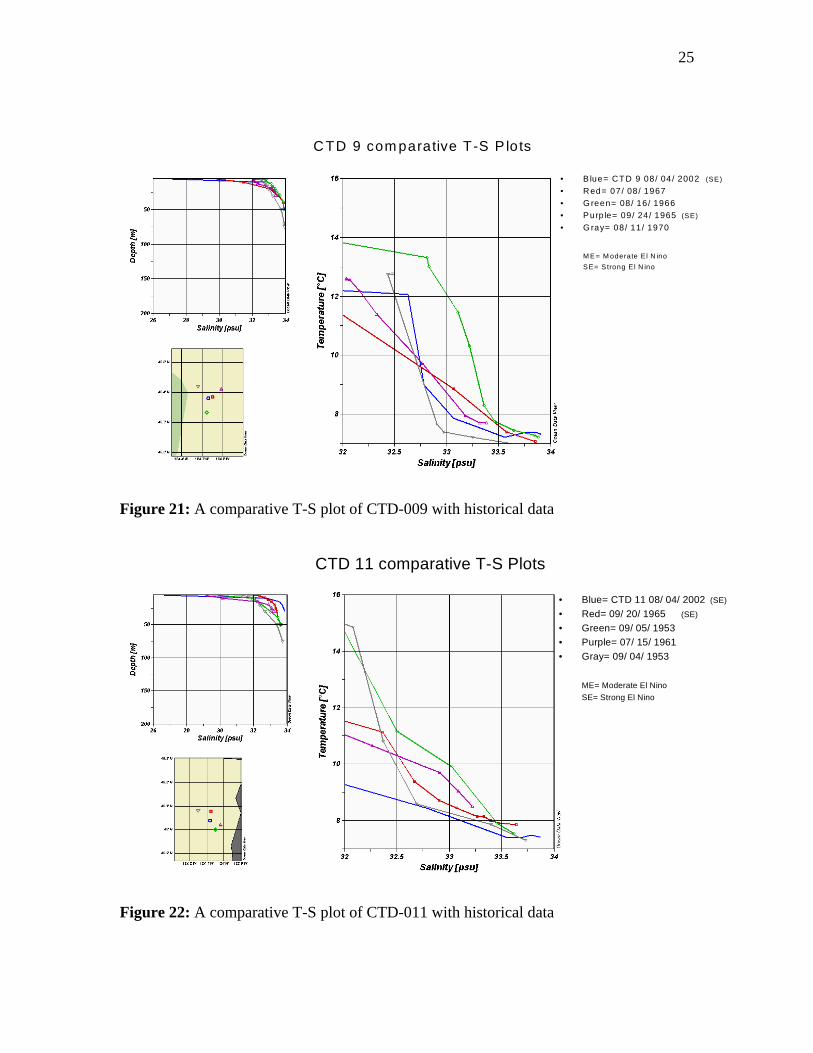
CTD 9 com parative T-S P lots
• B lue= CTD 9 08/ 04/ 2002 (SE)
• Red= 07/ 08/ 1967• G reen= 08/ 16/ 1966• Purp le= 09/ 24/ 1965 (SE)
• G ray= 08/ 11/ 1970
M E= M oderate E l N inoSE= S trong E l N ino
Figure 21: A comparative T-S plot of CTD-009 with historical data
CTD 11 comparative T-S Plots
• Blue= CTD 11 08/ 04/ 2002 (SE)
• Red= 09/ 20/ 1965 (SE)
• Green= 09/ 05/ 1953• Purple= 07/ 15/ 1961• Gray= 09/ 04/ 1953
ME= Moderate El NinoSE= Strong El Nino
Figure 22: A comparative T-S plot of CTD-011 with historical data
26
CTD 14 comparative T-S Plots
• Blue= CTD 14 08/ 05/ 2002 (SE)
• Red= 09/ 24/ 1962• Green= 07/ 08/ 1967• Purple= 09/ 28/ 1963 (ME)
• Gray= 07/ 29/ 1968
ME= Moderate El NinoSE= Strong El Nino
Figure 23: A comparative T-S plot of CTD-014 with historical data
CTD 16 comparative T-S Plots
• Blue= CTD 16 08/ 06/ 2002 (SE)
• Red= 07/ 21/ 1964• Green= 08/ 16/ 1970• Purple= 07/ 22/ 1961• Gray= 07/ 12/ 1967
ME= Moderate El NinoSE= Strong El Nino
Figure 24: A comparative T-S plot of CTD-016 with historical data
27
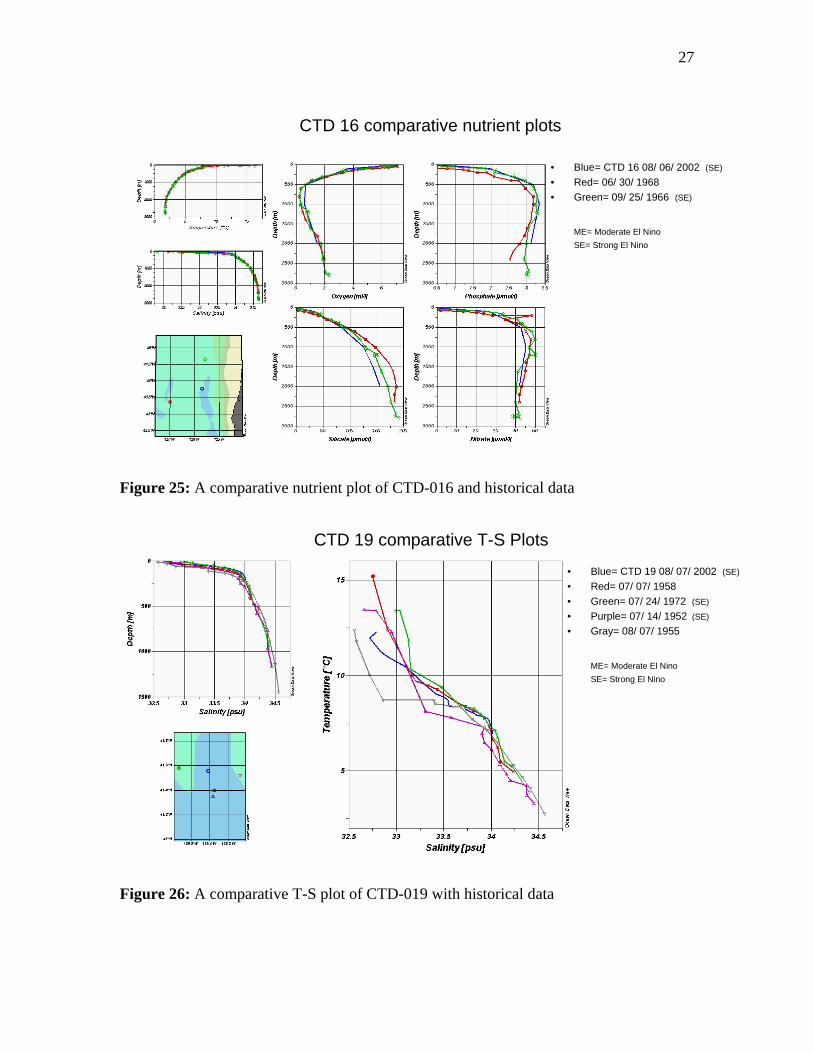
CTD 16 comparative nutrient plots
• Blue= CTD 16 08/ 06/ 2002 (SE)
• Red= 06/ 30/ 1968• Green= 09/ 25/ 1966 (SE)
ME= Moderate El NinoSE= Strong El Nino
Figure 25: A comparative nutrient plot of CTD-016 and historical data
CTD 19 comparative T-S Plots
• Blue= CTD 19 08/ 07/ 2002 (SE)
• Red= 07/ 07/ 1958• Green= 07/ 24/ 1972 (SE)
• Purple= 07/ 14/ 1952 (SE)
• Gray= 08/ 07/ 1955
ME= Moderate El NinoSE= Strong El Nino
Figure 26: A comparative T-S plot of CTD-019 with historical data

28
CTD 19 comparative nutrient plots
• Blue= CTD 19 08/ 07/ 2002 (SE)
• Red= 08/ 07/ 1955• Green= 01/ 08/ 1966 (SE)
ME= Moderate El NinoSE= Strong El Nino
Figure 27: A comparative nutrient plot of CTD-019 and historical data
CTD 20 comparative T-S Plots
• Blue= CTD 20 08/ 08/ 2002 (SE)
• Red= 07/ 10/ 1986• Green= 07/ 10/ 1986• Purple= 05/ 01/ 1987
ME= Moderate El NinoSE= Strong El Nino
Figure 28: A comparative T-S plot of CTD-020 with historical data
29
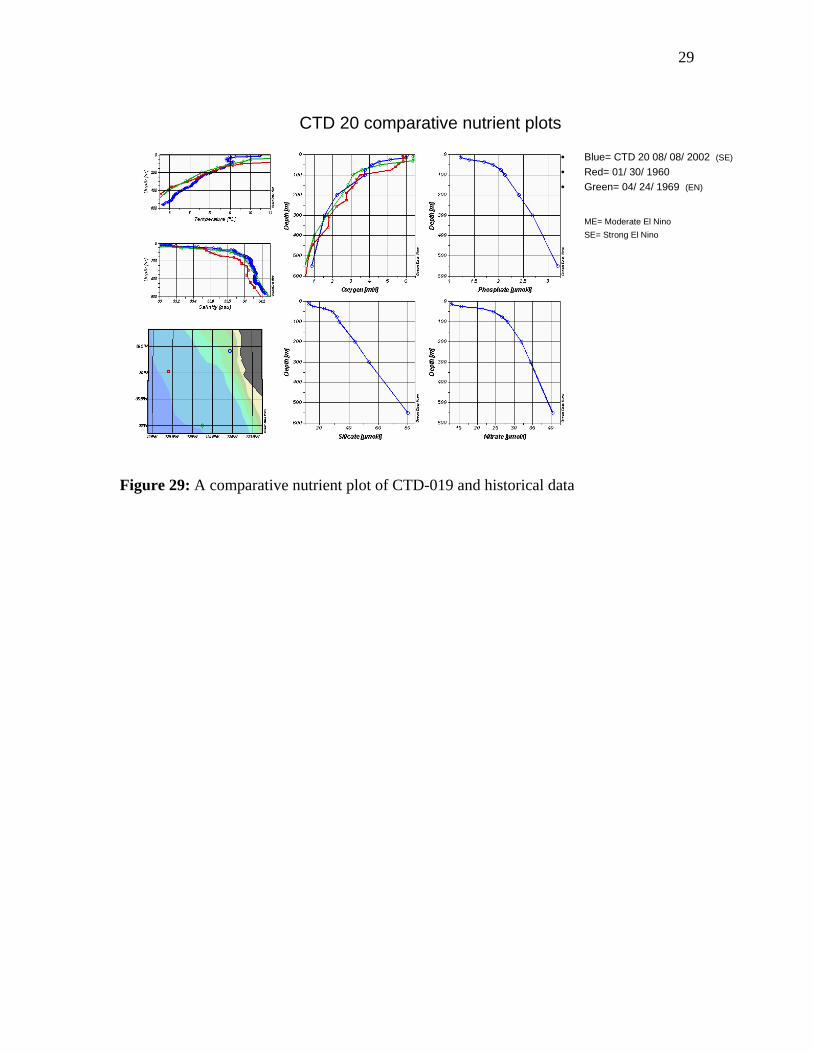
CTD 20 comparative nutrient plots
• Blue= CTD 20 08/ 08/ 2002 (SE)
• Red= 01/ 30/ 1960• Green= 04/ 24/ 1969 (EN)
ME= Moderate El NinoSE= Strong El Nino
Figure 29: A comparative nutrient plot of CTD-019 and historical data