Observations of infragravity period oscillations in a small marina
11
Observations of infragravity period oscillations in a small marina Darshani T. Thotagamuwage n , Charitha B. Pattiaratchi School of Civil, Environmental and Mining Engineering & UWA Oceans Institute, The University of Western Australia, 35 Stirling Highway, Crawley, Western Australia 6009, Australia article info Article history: Received 8 October 2013 Accepted 2 July 2014 Keywords: Harbours Oscillations Australia Water levels Wave groups Seiches abstract We measured water levels in Two Rocks Marina, Western Australia, to investigate infragravity-period (25–300 s) oscillations and their forcing mechanisms. Spectral analyses identified four dominant oscillations in the infragravity band, which were generated through excitation of the marina’s natural periods. The oscillations were present at all times, independent of the offshore conditions, indicating that they were forced by a continuous external energy source. The spectral energy of the oscillations increased by 50 times during storm events (higher incident wave heights), in comparison to calm events (lower incident wave heights). Wave heights of oscillations within the marina were strongly correlated with offshore incident swell wave heights and reached maximum of 0.5 m. The groupiness factor of swell waves around the marina was 0.6–0.85. Bound infragravity waves associated with swell wave groups were identified as potential forcing mechanism of infragravity-period oscillations within the marina. The bound infragravity waves have broad frequency spectrum without dominant periods matched the marina’s natural periods however, bound infragravity waves of periods in the proximity of the marina NOPs were adequate to generate oscillations at the NOPs of the marina. Frequencies of the oscillations were independent of the forcing frequency, and determined by the marina's geometry. & 2014 Elsevier Ltd. All rights reserved. 1. Introduction Infragravity period waves are surface gravity waves with periods between 25 and 300 s (frequencies between 0.003– 0.04 Hz) and wave lengths between 100 m and 10 km (Rabinovich, 2009). Infragravity waves are generated, mainly through nonlinear interactions of wind generated waves. The propagation of infragravity waves towards coastal areas, which contain, for example, harbours and lagoons, can excite oscillations within these water bodies. Resonance, when the period of incident infragravity waves is close to natural oscillation periods (NOPs) of the water basin, generates higher amplitude oscillations causing undesirable water motions. Such conditions interrupt berthing operations, further resulting in harbour downtime followed by economic losses (McComb et al., 2005; Van der Molen et al., 2006; Rabinovich, 2009; Uzaki et al., 2010). Very long-period incident waves such as tsunamis (Gilmour, 1990; Hinwood and McLean, 2013), waves originated from atmo- spheric pressure disturbances (Vilibic and Mihanovic´, 2003; De Jong and Battjes, 2004; Uzaki et al., 2005; Pattiaratchi and Wijeratne, 2014), and internal waves (Rabinovich, 2009), can cause significantly high amplitude oscillations followed by extensive damage to harbour operations. Very long-waves can affect only large harbours because their NOPs are generally longer than 10 min, which matches the very long-period wave band. In contrast, very long-period waves cannot excite NOPs of small harbours (where the surface water area is about 1 km 2 and the depth is about 5–10 m) because, their NOPs are shorter than the very long- period wave band (Okihiro and Guza, 1996). On the other hand, NOPs of small harbours cannot be directly excited by short waves either because short wave periods are typically less than 25 s. However, infragravity waves can excite NOPs of small harbours because their NOPs are in the similar range of the infragravity wave periods (Wu and Liu, 1990). Various harbours and ports around the world, such as Port of Sines Portugal (Gierlevsen et al., 2001), Port of Long Beach California (Kofoed- Hansen et al., 2005), Hualian harbour Taiwan (Chen et al., 2004) experience frequent oscillations in the infragravity period band, excited by short waves (Rabinovich, 2009). Bowers (1977); Mei and Agnon (1989), and Wu and Liu (1990) carried out theoretical and laboratory experiments to study the influence of incident short waves on infragravity period harbour oscillations. These studies found that bound infragravity waves (associated with regular swell wave groups), and free infragravity waves (generated by breaking of swell wave groups) can excite NOPs of harbours in the infragravity period band. Field observa- tions at few harbours, [Esperance harbour in Australia (Morison and Imberger, 1992), Barbers Point harbour in Hawaii (Okihiro et Contents lists available at ScienceDirect journal homepage: www.elsevier.com/locate/oceaneng Ocean Engineering http://dx.doi.org/10.1016/j.oceaneng.2014.07.003 0029-8018/& 2014 Elsevier Ltd. All rights reserved. n Corresponding author. Tel.: þ61 8 6488 8121; fax: þ61 8 6488 1015. E-mail address: [email protected] (D.T. Thotagamuwage). Ocean Engineering 88 (2014) 435–445
Transcript of Observations of infragravity period oscillations in a small marina

Observations of infragravity period oscillations in a small marina
Darshani T. Thotagamuwage n, Charitha B. PattiaratchiSchool of Civil, Environmental and Mining Engineering & UWA Oceans Institute, The University of Western Australia, 35 Stirling Highway, Crawley,Western Australia 6009, Australia
a r t i c l e i n f o
Article history:Received 8 October 2013Accepted 2 July 2014
Keywords:HarboursOscillationsAustraliaWater levelsWave groupsSeiches
a b s t r a c t
We measured water levels in Two Rocks Marina, Western Australia, to investigate infragravity-period(25–300 s) oscillations and their forcing mechanisms. Spectral analyses identified four dominantoscillations in the infragravity band, which were generated through excitation of the marina’s naturalperiods. The oscillations were present at all times, independent of the offshore conditions, indicatingthat they were forced by a continuous external energy source. The spectral energy of the oscillationsincreased by �50 times during storm events (higher incident wave heights), in comparison to calmevents (lower incident wave heights). Wave heights of oscillations within the marina were stronglycorrelated with offshore incident swell wave heights and reached maximum of 0.5 m. The groupinessfactor of swell waves around the marina was 0.6–0.85. Bound infragravity waves associated with swellwave groups were identified as potential forcing mechanism of infragravity-period oscillations withinthe marina. The bound infragravity waves have broad frequency spectrum without dominant periodsmatched the marina’s natural periods however, bound infragravity waves of periods in the proximity ofthe marina NOPs were adequate to generate oscillations at the NOPs of the marina. Frequencies of theoscillations were independent of the forcing frequency, and determined by the marina's geometry.
& 2014 Elsevier Ltd. All rights reserved.
1. Introduction
Infragravity period waves are surface gravity waves withperiods between 25 and 300 s (frequencies between 0.003–0.04 Hz) and wave lengths between 100 m and 10 km(Rabinovich, 2009). Infragravity waves are generated, mainlythrough nonlinear interactions of wind generated waves. Thepropagation of infragravity waves towards coastal areas, whichcontain, for example, harbours and lagoons, can excite oscillationswithin these water bodies. Resonance, when the period of incidentinfragravity waves is close to natural oscillation periods (NOPs) ofthe water basin, generates higher amplitude oscillations causingundesirable water motions. Such conditions interrupt berthingoperations, further resulting in harbour downtime followed byeconomic losses (McComb et al., 2005; Van der Molen et al., 2006;Rabinovich, 2009; Uzaki et al., 2010).
Very long-period incident waves such as tsunamis (Gilmour,1990; Hinwood and McLean, 2013), waves originated from atmo-spheric pressure disturbances (Vilibic and Mihanovic´, 2003; DeJong and Battjes, 2004; Uzaki et al., 2005; Pattiaratchi andWijeratne, 2014), and internal waves (Rabinovich, 2009), can causesignificantly high amplitude oscillations followed by extensive
damage to harbour operations. Very long-waves can affect onlylarge harbours because their NOPs are generally longer than10 min, which matches the very long-period wave band. Incontrast, very long-period waves cannot excite NOPs of smallharbours (where the surface water area is about 1 km2 andthe depth is about 5–10 m) because, their NOPs are shorter thanthe very long- period wave band (Okihiro and Guza, 1996). On theother hand, NOPs of small harbours cannot be directly excited byshort waves either because short wave periods are typically lessthan 25 s. However, infragravity waves can excite NOPs of smallharbours because their NOPs are in the similar range of theinfragravity wave periods (Wu and Liu, 1990). Various harboursand ports around the world, such as Port of Sines Portugal(Gierlevsen et al., 2001), Port of Long Beach California (Kofoed-Hansen et al., 2005), Hualian harbour Taiwan (Chen et al., 2004)experience frequent oscillations in the infragravity period band,excited by short waves (Rabinovich, 2009).
Bowers (1977); Mei and Agnon (1989), and Wu and Liu (1990)carried out theoretical and laboratory experiments to study theinfluence of incident short waves on infragravity period harbouroscillations. These studies found that bound infragravity waves(associated with regular swell wave groups), and free infragravitywaves (generated by breaking of swell wave groups) can exciteNOPs of harbours in the infragravity period band. Field observa-tions at few harbours, [Esperance harbour in Australia (Morisonand Imberger, 1992), Barbers Point harbour in Hawaii (Okihiro et
Contents lists available at ScienceDirect
journal homepage: www.elsevier.com/locate/oceaneng
Ocean Engineering
http://dx.doi.org/10.1016/j.oceaneng.2014.07.0030029-8018/& 2014 Elsevier Ltd. All rights reserved.
n Corresponding author. Tel.: þ61 8 6488 8121; fax: þ61 8 6488 1015.E-mail address: [email protected] (D.T. Thotagamuwage).
Ocean Engineering 88 (2014) 435–445

al., 1993; Harkins and Briggs, 1995; Okihiro and Guza, 1996),Marina di Carrarra in Italy (Bellotti and Franco, 2011) and Port ofFerrol in Spain (López et al., 2012)], have subsequently confirmedthose findings by showing strong correlation between infragravitywaves inside the harbour and swell waves outside the harbour.
For both bound and free infragravity waves, the primary energysource is the narrow banded regular and uni-directional swellwaves (Harkins and Briggs, 1995; Okihiro and Guza, 1996). How-ever, sea surface elevation spectra are not always regular andnarrow banded. They are characterized by broad banded wind-induced short waves (Mei and Agnon, 1989; De Girolamo, 1996;Chen and Mei, 2006), which are directional and irregular, espe-cially during storm events. Infragravity wave actions dramaticallyincrease during storm events (Nakamura and Katoh, 1993) andhence dominate the wave energy spectra in the surf zone (Holmanet al., 1978; Holman, 1981). Jeong et al. (1997) studied oscillationsin Muko harbour Korea, and showed that infragravity waves insidethe harbour were strongly excited during storm events.
Excessive water level oscillations occasionally occur in TwoRocks Marina during local storm events, interrupting berthingoperations (Shane Lindsay, personal communication, Oct 2011).Gwynne (1993), found existence of infragravity period oscillationsin the marina, and further showed that these oscillations corre-lated with offshore swell waves. We used measured water leveldata to investigate the oscillation problem in Two Rocks Marinawith the aims of identifying (1) dominant oscillation periods in themarina and their relation to the marina's NOPs; (2) differentevents of marina response to different offshore wave conditions;
and (3) potential forcing mechanisms of marina's oscillations. Thisstudy contributes for marina management in planning futuremodifications to minimize disturbance due to infragravity periodoscillations.
1.1. Study site
Two Rocks Marina, located in south-west Australia (Fig. 1) has asurface water area of �0.15 km2 with a length and width of 650 mand 260 m respectively. The average water depth of the marina is�3.5 m to mean sea level (MSL). The marina has two basins,which provide berthing facilities for about 125 small vessels. Thenorth basin is long and narrow and the south basin is approxi-mately circular (Fig. 1b). Having comprised two linked basins, themarina geometry probably permits for complex oscillation pat-terns. Oscillations in harbours and bays with similar geometrieshave been studied by few authors (Lee and Raichlen, 1972; Luickand Hinwood, 2008; Asano et al., 2010). In such harbour geome-tries, single basin or coupled basin modes or their combinationcould appear by supper positioning of the individual basinresponses to generate the resultant response of the entire harboursystem.
The coastal region of Western Australia experiences about 30storms a year, with associated mean offshore Hs values of morethan 4 m (Lemm et al., 1999). Two submerged reef systems arelocated parallel to the coastline at distances of �3.2 and 4.7 kmoffshore from the shoreline respectively. The crest level of the reefsystems varies 4–7 m below MSL. These reef systems act as
-10
-8
N
500 m
-32.10
-32.00
-31.90
-31.80
-31.70
-31.60
-31.50
-31.40
-31.30
Waverider Buoy
Rottnest Island
115.40
10 km
Western AustraliaStudy area
Two Rocks
115.50 115.60 115.70
Fig. 1. Two Rocks Marina: (a) map of study area showing the locations of Two Rocks and the offshore waverider buoy near Rottnest Island. (b) Instrument stations. Pressuresensors deployed at NB, MJ and BR (marked with black dots).
D.T. Thotagamuwage, C.B. Pattiaratchi / Ocean Engineering 88 (2014) 435–445436

obstructions to the incoming swell waves (Masselink andPattiaratchi, 2001) by attenuating the wave height �80% inshorerelative to outside the reef (Gallop et al., 2012). The neighbouringcoastline is characterized by dissipative sandy beaches (Gwynne,1993).
This region mainly experiences diurnal, microtidal conditionsand has a mean tidal range of �0.5–0.8 m (Pattiaratchi and Eliot,2008; Pattiaratchi, 2011). It also experiences a sea level variabilityof �0.20 m at different time scales from nodal tides (18.6-yearcycle), seasonal and inter-annual variability, and continental shelfseiches (�2–4 h).
2. Data and methods
We deployed three bottom-mounted pressure sensors (RBRTWR-2050 tide and wave recorders) in the marina at NB, MJ, andBR at depths of 1.2 m, 3.2 m, and 2.0 m MSL, respectively (Fig. 1b).The accuracy of the pressure sensor for depth measurements is0.05% of full scale (20 m). The sensors were configured to measurethe water depths continuously at one-second intervals and thusthe minimum resolvable period of oscillations that could measurewas two seconds (Hegge and Masselink, 1996). The sensorsmeasured water levels in two periods: 37 days from 12th Octoberto 17th November 2011 and 16 days from 25th August to 9thSeptember 2012.
The sensors at NB in the north basin and at BR at the boat rampwere placed at the marina boundaries to measure the maximumvertical water displacements. The sensor at MJ was in front of themain jetty, which was closer to the marina entrance and exposedto incoming (swell) waves through the entrance. Offshore waveswere measured over the same duration as in the marina by adirectional wave rider buoy (RDW47) deployed at a depth of 48 mnear Rottnest Island (Fig. 1a), which is well outside the submergedreef system.
For this study, we used Merian's formula (Pugh, 1987) toestimate NOPs in the marina along different axes. Several otheradvanced and complex methods (Tolkova and Power, 2011; Bellottiet al., 2012) are available for this purpose however, we assumedthat the values estimated by Merian's formula are sufficient forcomparing it with the values obtained from field measurements.
The width of marina entrance is much less than the marinawidth, having a ratio of �0.17, and therefore it was assumed thatthe marina acted as a closed basin (Van Rijn, 1990). For a closedrectangular basin with uniform depth, the NOP is given byMerian's formula;
Tn ¼ 2Ln
ffiffiffiffiffiffiffigH
p ð1Þ
where L is the harbour length, H is the average harbour depth, andg is the acceleration due to gravity. The mode number n is apositive integer, which equals the number of nodal points. Theperiod at the fundamental mode is given by n¼1, and the periodsat the higher harmonic modes are given by integers n41. NOPs ofthe marina along the main axes were calculated according toMerian's formula.
We derived the water levels for the three instrument stationsby de-trending and zero-centering the water depth records. Inaddition to the time series analysis, the water level data weresubjected to spectral analysis (Bendat and Piersol, 1986) to identifythe distribution of spectral density in the frequency domain.Fourier transforms were used to construct time–frequency plotsfrom the auto-spectra and were used to identify the temporalchanges in the spectral energy distribution. Time series of 2048points were used to estimate power spectra using the ‘Welch’method (Little and Shure, 1988) using Fast Fourier Transform (FFT)
method. A 50% overlap (i.e. 1024 points) was used to calculatesubsequent auto-spectra. High pass and low pass filters usingFourier techniques were applied to water level time series toextract oscillation bands in the marina. High pass cut-off frequen-cies were set to 0.0125, 0.0055, 0.0033 Hz and, low pass cut-offfrequencies were set to 0.025, 0.0125, and 0.0055 Hz. These cut-offfrequencies were decided by the troughs and peaks of the spectraldensity distribution in the frequency domain. The Nyquist fre-quency, which is the half of the sampling frequency, was 0.5 Hz.
The time series of Hs were obtained for each oscillation band by
Hs ¼ 4ffiffiffiffiffiffiffim0
p ð2Þwhere m0 is the second order moment of each auto-spectrum(Holthuijsen, 2007). Correlation coefficients of Hs were calculatedbetween the oscillation bands in the marina and offshore swelland sea waves.
Wave groupiness analysis was carried out for the data set at MJ.The incident short waves were confined into the range of 0.04–0.125 Hz and the wave groupiness factors were calculated accord-ing to the method proposed by List (1991).
3. Results
The NOPs at the fundamental mode in the marina, estimatedusing the Eq. (1), were in the range of the infragravity band withperiod between 25 and 300 s (Table 1). These values were used tocompare with the periods of the dominant frequency peaks in thepower density spectra for the three instrument stations.
The time series of unfiltered surface water levels measured atthe north basin (NB) of the marina show the water level variationthroughout the period (Fig. 2). It was varied in a range of �1 mwhile superimposing with the diurnal tidal cycle.
3.1. Power density spectra of water levels
The power density spectra for the three instrument stationsincluded several dominant frequency peaks (Fig. 3). Towards thehigh frequency end (40.04 Hz), the spectral energy was lowbecause the breakwaters blocked most of the incoming shortperiod waves. However, a comparatively high peak at 18 s wasvisible at MJ, which indicated uninterrupted swell wave penetra-tion into the marina. In the infragravity frequency band (0.003–0.04 Hz), we observed distinct, narrow-banded peaks of relativelyhigh spectral energy. These peaks occurred at almost the samefrequencies at all three instrument stations, with different energylevels, indicating spatial variation of infragravity wave energywithin the marina.
The two significant peaks at the tidal frequency are the diurnaland semi-diurnal components and in this diurnal tidal environ-ment (Pattiaratchi and Eliot, 2008), the diurnal peak is higher than
Table 1Estimated and measured natural oscillation periods (NOPs) at thefundamental mode.
Axis Estimated NOP MeasuredNOP
Closed basinn¼1
Open basinn¼0
Marina long axis(entrance–BR)
222 s 227 s
Open basin mode(entrance-NB)
226 s
Marina short axis (NB–B) 117 s 124 sNorth basin 68 s 61 sSouth basin 96 s 98 s
D.T. Thotagamuwage, C.B. Pattiaratchi / Ocean Engineering 88 (2014) 435–445 437

the semi-diurnal peak. A relatively higher peak occurred at13.5 min. We calculated the period at fundamental mode betweenthe marina and the offshore submerged primary reef which islocated at a distance of 4.7 km from the marina and at an averagedepth of 12 m. It is 14.3 min, and is close to the peak shown at13.5 min in the spectrum. Therefore, this 13.5 min oscillation canbe decided as governed by the offshore reef system, and as pointedout by Bellotti et al. (2012), edge waves trapped by the offshoresubmerged reefs may be responsible for this 13.5 min oscillations.However, these very long period oscillations (13.5 min, 12 h and24 h), present at all 3 stations with very similar spectral energies(Fig. 3), were not considered in further analysis as they wereoutside the potential infragravity period oscillations withinmarina scale.
Four distinct peaks are visible at 61, 98, 124 and 227 s withinthe infragravity band, underlining that the energy in the marinawere concentrated at these periods. Of the three instrumentstations, the power density spectrum at NB showed the highestenergy at 61, 124, and 227 s, mainly because the elongated shapeof the north basin provided conditions for energy accumulationwithin the basin. In contrast, the energy at 98 s at NB was lowerthan the energy at the other three periods, and the highest energyat 98 s was recorded at BR in the south basin. Because of itslocation in the north basin, NB was less affected by the water levelchanges occuring at BR in the south basin. Therefore, oscillationsat 98 s were not strongly excited in the north basin.
The four dominant peaks in the energy spectra can be com-pared with the estimated NOPs of the marina. Unless otherwiseindicated, all modes described here are the closed-basin modes.
I. The peak at 227 s is closer to the estimated period along thenorth–south (N–S) axis of the marina (222 s in Table 1), withthe anti-nodes at BR and at the entrance, and the nodal point
at the centre of the marina. The overall spectral energy wasconsiderably low in this mode. Further, the energy at MJ wasagain slightly less than that at BR possibly because MJ was notlocated at a potential anti-node. In contrast, NB recorded thehighest energy at 227 s, which is �10 times higher than theenergy at BR and MJ, indicating that, there is another strongoscillation mode with the anti-node at NB. For open-basinmode along NB and the entrance, the estimated period is 226 s.Therefore, 227 s period recorded at NB may be the zerothmode of the open-basin with the node at the entrance and theanti-node at NB. The occurrence of a node and an anti-node atthe same location (here it is at the entrance) in the sameoscillatory period is somewhat impossible. However, this co-existance may be possible here because the energy of theoscillations along N–S axis of the marina is �10 times lowerthan the energy at NB, making a desirable energy exchangebetween these two modes.
II. The peak at 124 s is in the proximity of the estimated periodalong NB and B (117 s in Table 1). The spectral energies of NB,BR and MJ were approximately the same. Eventhough MJ wasslightly away from the anti-node at B, corresponding to theoscillations along NB and B, MJ was close enough to be affectedby the water level fluctuations at B. The anti-node at BR withsimilar spectral energy indicated that there exists anotheroscillation mode possibly between BR and B, where the twooscillations (NB–B and BR–B) share the same anti-node at B.
III. The peak at 98 s is very close to the estimated period in thesouth basin (96 s in Table 1), therefore, the highest spectralenergy was recorded at BR in the south basin. Water levels atNB and MJ were also excited with �5 times lower spectralenergy than that at BR.
IV. A pronounced peak occurred at the 61 s at NB, which is closerto the estimated period in the north basin (68 s in Table 1).Here, the west boundary of the north basin was delineated by aline parallel to the east boundary, ranging from the top leftcorner of the main jetty to the north breakwater.
The common observation is that, all these four IG periodoscillations are in the closer limits of the estimated NOPs of themarina. It suggests that the measured oscillations have beengenerated through the excitation of the marina's NOPs, whichwere strongly governed by the geometry of the marina.
In addition to the above four dominant peaks, the powerdensity spectrum at BR comprised five consecutive peaksappeared between 18 and 98 s. None of these peaks at BR matchedthe estimated NOPs are shown in Table 1.
3.2. Time series analysis in different bands
Filtered water levels in the infragravity band (25–300 s) at allstations indicated strong oscillations and variability in amplitudeduring the data collection period from 12th October to 17th
12/10 17/10 22/10 27/10 01/11 06/11 11/11 16/11−1
−0.5
0
0.5
1
Days in 2011
Wat
er le
vel (
m)
Fig. 2. Time series of surface water levels at north basin (NB) in the marina.
10-5 10-4 10-3 10-2 10-1
10-4
10-2
100
102
Frequency (Hz)
18s
13.5min
12h
24h
61s
98s
124s
227s
MJBRNB
95%
Spe
ctra
l Den
sity
(m2 /
Hz)
Fig. 3. Power density spectra at instrument stations MJ, BR, and NB showing thedominant frequency peaks (2011 data).
D.T. Thotagamuwage, C.B. Pattiaratchi / Ocean Engineering 88 (2014) 435–445438

November 2011 (Fig. 4a). The patterns were similar at all threeinstrument stations; therefore only the time series plots for NB areshown in Fig. 4. Higher amplitude water levels (40.1 m) occurredduring 13–17 October 2011 (maxima to 0.3 m), 7–9 November2011, and on 15th November 2011 (maxima to 0.2 m). Loweramplitude water levels (o0.1 m) occurred during 24–28 October2011 and 1–6 November 2011. It should be noted that the range ofinfragravity water levels during 13–17 October 2011 were equiva-lent to the local diurnal tidal range of �0.6 m (Pattiaratchi, 2011).
The time–frequency plot at NB (Fig. 4b) indicated concentrationof spectral energy (410�1 m2/Hz) at periods 61, 124, and 227 s;however, the line at 98 s was less dominant as described in Section3.1. The time–frequency plot at MJ (Fig. 5) also showed theconcentration of spectral energy (410�1 m2/Hz) at 98, 124, and227 s. The line at 61 s, which we identified as the NOP of the northbasin, was less dominant here, because MJ was less sensitive to thewater level changes occurring at NB. Higher spectral energy bands
were also present at 8, 14, and 18 s, indicating swell wavepenetration through the entrance (as mentioned in Section 3.1).The spectral energy bands at 8 and 14 s were almost continuousthrough the recording period, whereas the band at 18 s mostlyappeared during the episodes of higher amplitude water levels inthe infragravity band.
Presence of the spectral energy bands at 61, 98, 124, and 227 sat both NB and MJ suggested that the oscillations at these peakperiods occurred continuously from 12th October to 17th Novem-ber 2011. The continuous presence of oscillations at these periods(61, 98, 124, and 277 s) was also identified in the data collectedfrom 25th August to 9th September in 2012 (not shown). Thetime–frequency plots indicated that oscillations at the naturalperiods were excited continuously in the marina, independent ofthe time frame of the data collection. This indicates that there is acontinuous external source of energy which is able to energisethese oscillations within the marina. The spectral energy of the
Fig. 4. Time series plots at North Basin (NB): (a) surface water levels of the infragravity band (25–300 s); (b) frequency (in log scale) and energy of the water levels. Colourbar indicates the spectral energy in m2/Hz. Periods corresponding to dominant periods are identified in the centre; (c) significant wave height (Hs) of the total, swell wavesand the three IG bands; (d) Hs at Rottnest (offshore).
D.T. Thotagamuwage, C.B. Pattiaratchi / Ocean Engineering 88 (2014) 435–445 439
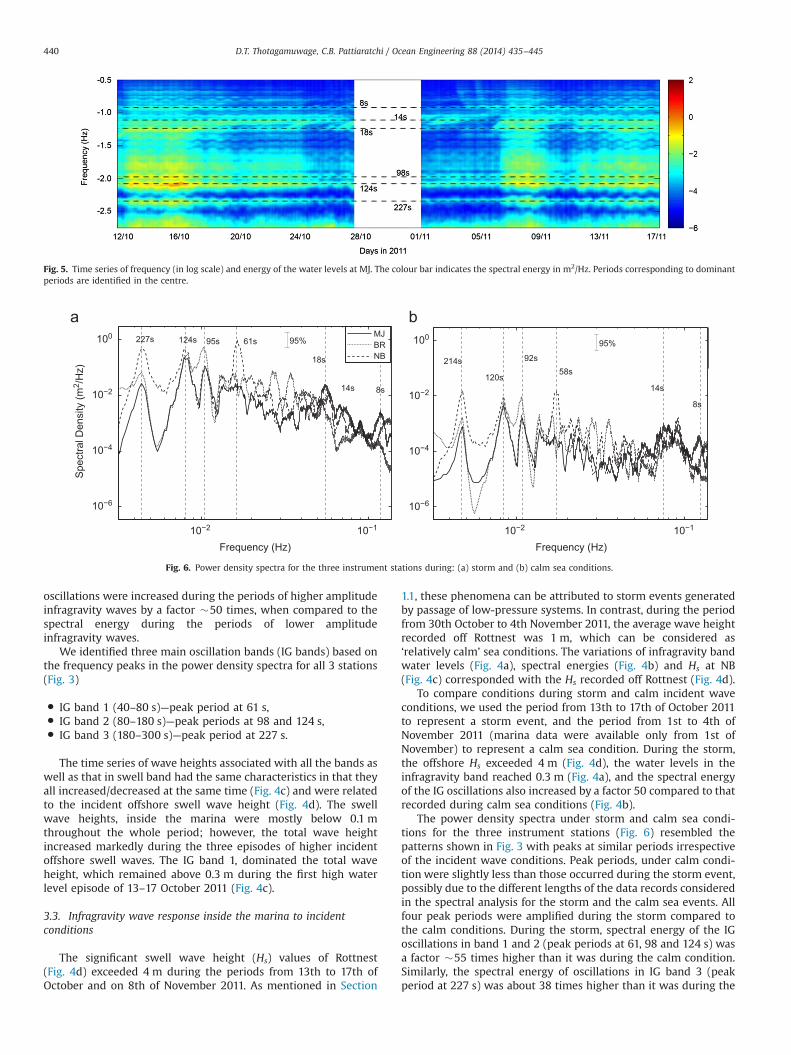
oscillations were increased during the periods of higher amplitudeinfragravity waves by a factor �50 times, when compared to thespectral energy during the periods of lower amplitudeinfragravity waves.
We identified three main oscillation bands (IG bands) based onthe frequency peaks in the power density spectra for all 3 stations(Fig. 3)
� IG band 1 (40–80 s)—peak period at 61 s,� IG band 2 (80–180 s)—peak periods at 98 and 124 s,� IG band 3 (180–300 s)—peak period at 227 s.
The time series of wave heights associated with all the bands aswell as that in swell band had the same characteristics in that theyall increased/decreased at the same time (Fig. 4c) and were relatedto the incident offshore swell wave height (Fig. 4d). The swellwave heights, inside the marina were mostly below 0.1 mthroughout the whole period; however, the total wave heightincreased markedly during the three episodes of higher incidentoffshore swell waves. The IG band 1, dominated the total waveheight, which remained above 0.3 m during the first high waterlevel episode of 13–17 October 2011 (Fig. 4c).
3.3. Infragravity wave response inside the marina to incidentconditions
The significant swell wave height (Hs) values of Rottnest(Fig. 4d) exceeded 4 m during the periods from 13th to 17th ofOctober and on 8th of November 2011. As mentioned in Section
1.1, these phenomena can be attributed to storm events generatedby passage of low-pressure systems. In contrast, during the periodfrom 30th October to 4th November 2011, the average wave heightrecorded off Rottnest was 1 m, which can be considered as‘relatively calm’ sea conditions. The variations of infragravity bandwater levels (Fig. 4a), spectral energies (Fig. 4b) and Hs at NB(Fig. 4c) corresponded with the Hs recorded off Rottnest (Fig. 4d).
To compare conditions during storm and calm incident waveconditions, we used the period from 13th to 17th of October 2011to represent a storm event, and the period from 1st to 4th ofNovember 2011 (marina data were available only from 1st ofNovember) to represent a calm sea condition. During the storm,the offshore Hs exceeded 4 m (Fig. 4d), the water levels in theinfragravity band reached 0.3 m (Fig. 4a), and the spectral energyof the IG oscillations also increased by a factor 50 compared to thatrecorded during calm sea conditions (Fig. 4b).
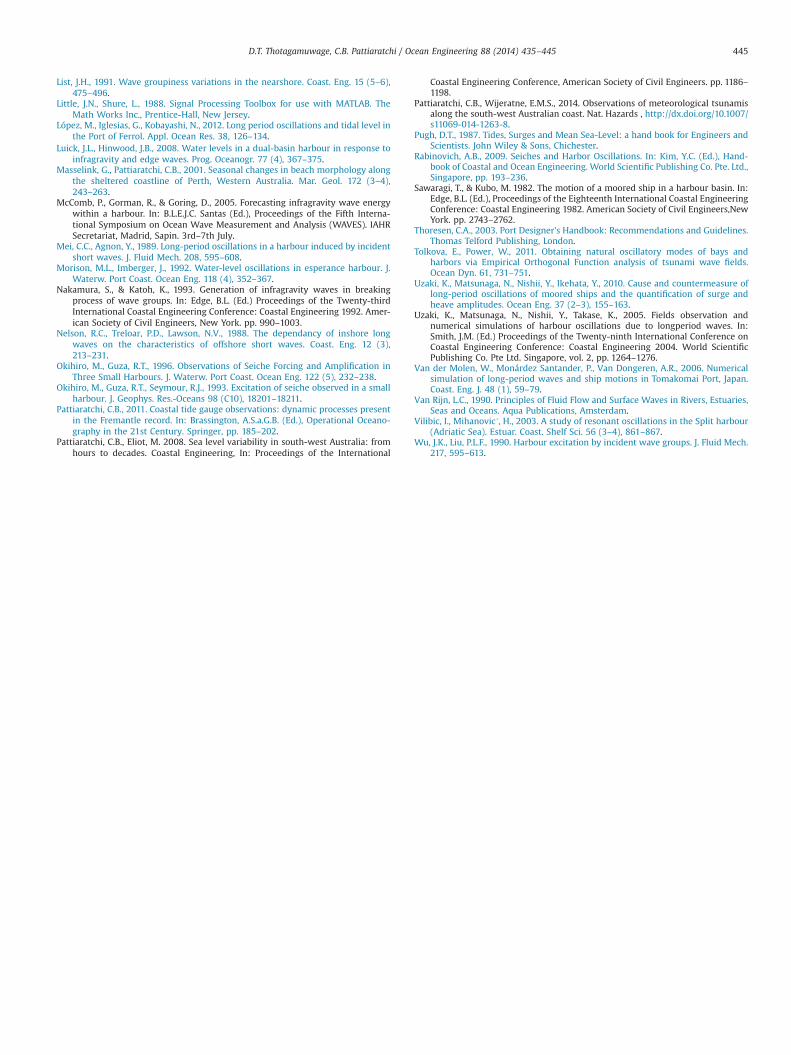
The power density spectra under storm and calm sea condi-tions for the three instrument stations (Fig. 6) resembled thepatterns shown in Fig. 3 with peaks at similar periods irrespectiveof the incident wave conditions. Peak periods, under calm condi-tion were slightly less than those occurred during the storm event,possibly due to the different lengths of the data records consideredin the spectral analysis for the storm and the calm sea events. Allfour peak periods were amplified during the storm compared tothe calm conditions. During the storm, spectral energy of the IGoscillations in band 1 and 2 (peak periods at 61, 98 and 124 s) wasa factor �55 times higher than it was during the calm condition.Similarly, the spectral energy of oscillations in IG band 3 (peakperiod at 227 s) was about 38 times higher than it was during the
Fig. 5. Time series of frequency (in log scale) and energy of the water levels at MJ. The colour bar indicates the spectral energy in m2/Hz. Periods corresponding to dominantperiods are identified in the centre.
10−2 10−1
10−6
10−4
10−2
100
Spe
ctra
l Den
sity
(m2 /
Hz)
Frequency (Hz)
61s 95s 124s
18s
8s 14s
227s MJBRNB
10−2 10−1
10−6
10−4
10−2
100
58s92s
120s
214s
14s
8s
Frequency (Hz)
95% 95%
Fig. 6. Power density spectra for the three instrument stations during: (a) storm and (b) calm sea conditions.
D.T. Thotagamuwage, C.B. Pattiaratchi / Ocean Engineering 88 (2014) 435–445440

calm sea conditions. These results indicated that the spectralenergy of the oscillations in higher IG frequency band (40–180 s,including the IG band 1 (40–80 s) and IG band 2 (80–180 s)) wasamplified compared to the spectral energy of the oscillations inthe low frequency IG band (IG band 3 (180–300 s)) during thestorm event.
We calculated the correlation coefficients of spectral energybetween the oscillations at NB (three IG bands at NB) and the swellwaves at MJ (Fig. 7). All three IG bands have similar pattern acrossthe swell periods (8–25 s) however, IG band 3 showed slightdeviation from the other two. The correlation coefficients of theIG bands were above 0.9 and 0.8 at swell waves with periods of18.6 and 14.7 s respectively. In the power density spectra diagram(Fig. 6), a peak is visible around 14 s in both storm and calm
conditions, and another peak is around 18 s in storm condition.The observations of both Figs. 6 and 7 suggested that marinaoscillations were mostly associated with swell waves of �14 s;and during storms, swell waves of �18 s enhanced the energy ofthe oscillations.
We also calculated the correlation coefficients of Hs betweenthe marina's oscillations (three IG bands at NB) and the offshorewaves at Rottnest Island (Fig. 8). The correlation coefficient valuesof Hs indicated that the marina's oscillations correlated withoffshore swell waves (correlation coefficients 40.8 in Fig. 8a–c)than with offshore sea waves (correlation coefficients o0.45 inFig. 8d–f).
3.4. Wave grouping characteristics
We analysed grouping characteristics of the swell waves in themarina (at MJ) for the storm and calm sea events. The groupinessfactor (GF was calculated), based on the method given by List(1991) for each data set comprising of 2048 points of the waterlevel time series in the swell wave band. The GF of two instanta-neous data sets for the storm event was 0.6558 and it was 0.7648for the calm sea event (Fig. 9). However, the GF was highlydepended on the data set selected, and therefore did not showclear difference of GF values between the storm and the calmevents.
The GF at MJ for the whole data collection period in 2011indicated that the GF ranged between 0.6 and 0.85, without anysignificant difference in the GF values between storm and calmevents (Fig. 10). However, the high values of the groupiness factor(0.6–0.85) are an indication of swell wave groupiness and there-fore, the presence of bound infragravity waves.
Spectral analysis of the positive values of the envelope timeseries of the water levels at MJ in the swell wave band indicatedthat the wave group periods were highly variable and indicated awide spectral energy band (not shown) in the range 50–450 s.There were no peak periods that matched the marina’s NOPs. Thisindicated that the period of the infragravity waves associated with
8 10 12 14 16 18 20 22 240.2
0.3
0.4
0.5
0.6
0.7
0.8
0.9
118.6s
14.7s
Cor
rela
tion
coef
ficie
nt
Swell period (s)
IG band 1 (40−80s)IG band 2 (80−180s)IG band 3 (180−300s)
Fig. 7. Correlation coefficients of energy between the oscillations at NB (three IGbands at NB) and the swell waves at MJ.
0 2 40
0.1
0.2
0.3
0.4
Hs Swell at Rottnest (m)
Hs
IG b
and
1 (m
)
0 2 40
0.1
0.2
0.3
0.4
Hs
IG b
and
2 (m
)
0 2 40
0.1
0.2
0.3
0.4
Hs
IG b
and
3 (m
)
0 1 2 30
0.1
0.2
0.3
0.4
Hs Sea at Rottnest (m)
Hs
IG b
and
1 (m
)
0 1 2 30
0.1
0.2
0.3
0.4
Hs
IG b
and
2 (m
)
0 1 2 30
0.1
0.2
0.3
0.4
Hs
IG b
and
3 (m
)
0.9023
3228.00178.0
4283.08244.0 0.3066
Fig. 8. Correlation coefficient of the significant wave height (Hs) between marina oscillations (three IG bands at NB) and the swell waves (a, b, c) and the sea waves (d, e, f) atRottnest Island.
D.T. Thotagamuwage, C.B. Pattiaratchi / Ocean Engineering 88 (2014) 435–445 441

the groups of incoming swell waves into the marina did notcontain dominant periods that matched the marina's NOPs.
3.5. Occurrence of peak oscillation periods
The total significant wave heights if marina oscillations havebeen amplified during the storms (Fig. 4c) reaching a maximum of0.5 m in the first storm episode. For safe operations within marinait has been recommended that significant wave height (Hs) of theswell waves to be o0.15 m (Thoresen, 2003). Analysis of the swelland IG band time series at NB (Fig. 4c) indicated that IG band 1(40–80 s), dominated the total Hs. Similarly, the Hs in the IG band 2(80–180 s) dominated the total Hs at BR and MJ (not shown). If weused 0.15 m as the threshold value for the total Hs in the marina forsafe operations, the measured total Hs at NB exceeded the thresh-old Hs 38% of the time, and the total Hs at BR exceeded thethreshold Hs 30% of the time, over the whole data collection periodin 2011.
Analysis of the occurrence of the oscillation periods across themarina (Fig. 11) revealed that at NB, 80% of the peak periodsoccurred in the IG band 1 (40–80 s), whilst at BR, 88% of the peakperiods occurred in the IG band 2 (80–180 s).
4. Discussion
4.1. Oscillations in the marina
In the time series of measured water level records, obtainedwithin the Marina, we identified four dominant peaks in theinfragravity band at 61, 98, 124, and 227 s, which correspondedwith the estimated NOPs of the marina (Table 1). Therefore, wecan conclude that the four dominant infragravity period oscilla-tions were generated due to the excitation of the marina's NOPs.The marina has complex oscillation modes mainly because thewater-ward projected main jetty divides the marina into twobasins. The oscillations include both closed basin and openedbasin modes. None of the dominant oscillation modes acts asindividual mode, and they mutually communicate among them toreach equilibrium within the particular frequency band. Harbourswith irregular geometries and linked basins generate combina-tions of closed and open basin modes, and single and linked basinmodes (Lee and Raichlen, 1972; Luick and Hinwood, 2008). Suchsituations demands numerical solutions to decide modal shapes.In this study at Two Rocks Marina, field measurements clearlyidentify the dominant oscillation periods and also facilitate esti-mating modal shapes to a certain extent however, numerical
0 200 400 600 800 1000 1200 1400 1600 1800 2000−0.05
0
0.05
Sur
face
ele
vatio
n (m
) GF=0.6558
16/10/2011 6:00:00 hr
0 200 400 600 800 1000 1200 1400 1600 1800 2000−0.05
0
0.05
Sur
face
ele
vatio
n (m
) GF=0.7648
02/11/2011 14:00:00 hr
Number of points
Fig. 9. Instantaneous water level time series of the swell waves at MJ during the (a) storm and (b) calm sea event. The envelope of the water level extremes is shown indash line.
12/10 16/10 20/10 24/10 28/10 01/11 05/11 09/11 13/11 17/110.5
0.55
0.6
0.65
0.7
0.75
0.8
0.85
0.9
Days in 2011
Gro
upin
ess
fact
or
Fig. 10. Time series of the groupiness factor at MJ for the whole data collection period.
D.T. Thotagamuwage, C.B. Pattiaratchi / Ocean Engineering 88 (2014) 435–445442

model analysis is needed to correctly understand the influence ofmarina geometry on oscillation modes.
The infragravity period oscillations occurred continuously in themarina during the both data collection periods in 2011 and 2012.Gwynne (1993) carried out field study in Two Rocks Marina fromMayto July in 1993, and found continuous presence of two dominant peaksaround 60 and 200 s. Collectively, all three data records; Gwynne'sdata record and our two records in 2011 and 2012; span sevenmonths(May–November), although the data were measured in different years.The data sets showed the infragravity period oscillations were con-tinuously present in the marina over seven months of the year. Thecontinuous presence of these oscillations in the marina means thatthere is an external force, which continuously supplies energy to set-up these oscillations.
Pugh (1987) suggested that water bodies with irregular shapescould produce several NOPs, including lateral and longitudinalmodes, thus complex oscillation patterns may exist in the marinabecause of the marina's irregular geometric shape. Merian’sformula describes the NOP for a rectangular water body withuniform depth. Due to its limitations in applying to water bodieswith irregular shapes and varying depths, it is not possible toderive all the potential oscillation modes, only the oscillationmodes along the main axes. Therefore, the five frequency peaksin the power density spectrum at BR observed in Fig. 3, may havebeen the result of oscillations along another axes in the southbasin due to its near-circular or elliptical shape (Rabinovich, 2009).
4.2. Influence of incident waves
We found that when the Hs recorded off Rottnest exceeded 4 mduring a storm, the amplitudes of the oscillations in the marinaincreased to 40.3 m equivalent to the tidal range in the region(Fig. 4a). The spectral energy of the oscillations also increasedabout 50 fold, which raised the total Hs in the marina to 0.5 m(Fig. 4c).
The results further showed a strong correlation (correlationcoefficient 40.8) between Hs of the offshore incident swell wavesand Hs of the oscillations in the IG band inside the marina (Fig. 8).This strong correlation persisted during both storm and calmperiods, hence indicated that the IG oscillations inside the marinawere driven by offshore swell waves. These findings agreed with
those of Jeong et al. (1997) in their study on harbour oscillationsduring storms in Muko Harbour, Korea. They found peaks ofconsiderable magnitude in the frequency spectra around 1–5 min, which were bound infragravity waves and their harmonicsinside the harbour. They also found a strong relationship betweeninfragravity waves in the harbour and storm waves. Similar tothese observations, during swell wave periods, Okihiro et al.(1993), Okihiro and Guza (1996) and López et al. (2012) alsoidentified ocean swells as the primary energy source for harbouroscillations in the infragravity band.
Our results have demonstrated that the marina oscillationswere mostly associated with swell waves of �14 s; and duringstorms, swell waves of �18 s enhanced the energy of the oscilla-tions approximately by 50 times. Okihiro and Guza (1996) alsofound similar results during their study at Kahului harbour inHawaii. They observed infragravity energy in the harbour asso-ciated with long-period swell waves (with periods �20 s) wasabout 10 times more than the infragravity energy associated withshort-period swell waves (with periods �10 s).
The marina site showed relatively high swell wave groupingcharacteristics, with a GF of 0.6–0.85. The results showed theperiodicity of the bound infragravity waves associated with swellwave groups varied over a wide range, similar to the observationsmade by Nelson et al. (1988), and Morison and Imberger (1992).The Western Australian offshore wave climate is swell-dominatedwith mean peak period of 14 s (Bosserelle et al., 2012). Such swell-dominated and high swell wave grouping environment enhancesthe generation of bound infragravity waves (Elgar et al., 1992;Herbers et al., 1995). Bound infragravity waves around the marinasite can excite marina's NOPs even if the infragravity band do notshow peak periods match marina's NOPs. Similar to this observa-tion, Okihiro and Guza (1996), in Kahului harbour study, foundthat the oscillation spectrum in the harbour was characterized bypeaks corresponding to the frequencies of resonant standingwaves, even though the energy spectrum observed outside theharbour was relatively smooth.
We propose that bound infragravity waves, generated throughswell wave grouping, continuously forced oscillations within themarina. Under forced oscillation conditions, the frequency ofexternal force determines the frequency of oscillations in a system(Van Rijn, 1990). External forces can easily excite oscillations at the
40 60 80 100 120 140 160 1800
10
20
30
40
50
60
70
Per
cent
age
occu
renc
e
Peak period (s)40 60 80 100 120 140 160 180
0
10
20
30
40
50
60
70
Peak period (s)
Fig. 11. Percentage occurrence of peak oscillation periods in the IG bands 1 and 2 for (a) NB and (b) BR.
D.T. Thotagamuwage, C.B. Pattiaratchi / Ocean Engineering 88 (2014) 435–445 443

natural periods of a system because the natural periods providethe minimum resistance against oscillations, and the oscillationscan persist considerably longer time (Rabinovich, 2009). However,in Two Rocks marina, even though the oscillations are forced, thedominant frequencies of oscillations were governed by the geo-metric configuration of the marina and hence independent of theincident wave period.
Open-ocean waves, incident at the entrance of a harbour,normally consist of a broad frequency spectrum that spans theresponse of the harbour from resonantly generated eigen freemodes to non-resonantly forced oscillations at other frequencies(Rabinovich, 2009). The latter part describes the oscillations forcedby frequencies, which are not close to the NOPs of the harbour. Ourresults describe a similar situation of forcing the marina oscilla-tions by infragravity band with no peak periods matched themarina NOPs (relatively smooth energy spectrum). However,bound infragravity waves of periods in the proximity of the marinaNOPs were adequate to generate oscillations at the NOPs of themarina.
4.3. Marina efficiency
The significant wave height (Hs) of the swell waves was wellwithin the limit of the recommended Hs for a marina (o0.15 m)(Thoresen, 2003). However, the measured total Hs at NB exceededthe recommended Hs over 38% of the entire duration, and at BR itwas 30% of the entire duration (Fig. 4c) due to the dominance ofthe IG band wave heights. The results further revealed that theoccurrence of the oscillations in IG band 1 (40–80 s) and IG band 2(80–180 s) were 80% and 88%, respectively (Fig. 11). These infra-gravity period oscillations of high wave heights and high percen-tage of occurrence can cause vessels to undergo excessive long-period motions, such as rotational yaw and linear surge and sway,which can further limit marina operations (Sawaragi and Kubo,1982; Morison and Imberger, 1992). Therefore, countermeasuresare needed to minimise the infragravity period oscillations in themarina for better berthing operations.
5. Conclusions
We measured and analysed surface water levels at threelocations inside Two Rocks Marina to study the infragravity periodoscillations within the marina and to examine their response todifferent offshore incident wave conditions. The four dominantinfragravity period oscillations identified within the marina weregenerated through the excitation of the marina NOPs whichgoverned by the geometry of the marina. The oscillations weredriven by offshore swell waves, and the energy of the oscillationswas significantly amplified during storm events.
The oscillations inside the marina were present all the time andwere forced by an external energy source. It can be concluded thatbound infragravity waves, associated with swell wave groupsaround the marina site were the main forcing of the naturaloscillation periods in the marina. Even though the oscillationswere externally forced, frequencies of the oscillations did notdepend on the external forcing frequency.
The incident infragravity waves consisted of a wide frequencyspectrum without any dominant frequencies close to the marinaNOPs however, capable of generating oscillations at NOPs of themarina.
The study revealed that the marina has a complex nature ofoscillation modes mainly because of its dual basin geometry. Fieldmeasurements identified the main oscillation periods however,further numerical model analysis is needed explaining modalshapes due to the dual basin effect of the marina.
Acknowledgements
We are grateful to the Department of Transport WesternAustralia for providing the wave buoy data at Rottnest. This studywas funded through the UIS and SIRF scholarships of the Uni-versity of Western Australia.
References
Asano, T., Yamashiro, T., Kakinuma, T. 2010. Field observations of seiche events in aT-shape bay of Kami-Koshiki Island, Japan. In: Proceedings of the 32ndInternational Conference of Coastal Engineering. (ASCE) , Shanghai, China.pp. 1–12 ⟨http://journals.tdl.org/ICCE/article/view/985⟩.
Bellotti, G., Briganti, R., Beltrami, G.M., 2012. The combined role of bay and shelfmodes in tsunami amplification along the coast. J. Geophys. Res., 117, http://dx.doi.org/10.1029/2012JC008061.
Bellotti, G., Briganti, R., Beltrami, G.M., Franco, L., 2012. Modal analysis of semi-enclosed basins. Coast. Eng. 64, 16–25.
Bellotti, G., Franco, L., 2011. Measurement of long waves at the harbor of Marina diCarrara, Italy. Ocean Dyn. 61 (12), 2051–2059.
Bendat, J.S., Piersol, A.G., 1986. Random Data: Analysis and Measurement Proce-dures, 2nd ed. John Wiley & Sons, New York.
Bosserelle, C., Pattiaratchi, C., Haigh, I., 2012. Inter-annual variability and longer-term changes in the wave climate of Western Australia between 1970 and 2009.Ocean Dyn. 62 (1), 63–76.
Bowers, E.C., 1977. Harbour resonance due to set-down beneath wave groups. J.Fluid Mech. 79 (1), 71–92.
Chen, G.-Y., Chien, C.-C., Su, C.-H., Tseng, H.-M., 2004. Resonance Induced By EdgeWaves In Hua-Lien Harbor. J. Oceanogr. 60 (6), 1035–1043.
Chen, M.-Y., & Mei, C.-C. (2006). Long-period oscillations in a harbour excited bybroad-banded random sea waves. In: Proceedings of the Conference of GlobalChinese Scholars on Hydrodynamics. J. Hydrodyn., vol. 18, 3, pp. 3–8.
De Girolamo, P., 1996. An experiment on harbour resonance induced by incidentregular waves and irregular short waves. Coast. Eng. 27 (1–2), 47–66.
De Jong, M.P.C., Battjes, J.A., 2004. Seiche characteristics of Rotterdam Harbour.Coast. Eng. 51 (5–6), 373–386.
Elgar, S., Herbers, T.H.C., Okihiro, M., Oltman-Shay, J., Guza, R.T., 1992. Observationsof infragravity waves. J. Geophys. Res.-Oceans 97 (C10), 15573–15577.
Gallop, S.L., Verspecht, F., Pattiaratchi, C.B., 2012. Sea breezes drive currents on theinner continental shelf off southwest Western Australia. Ocean Dyn. 62,569–583.
Gierlevsen, T., Hebsgaard, M., Kirkegaard, J., 2001. Wave disturbance modelling inthe Port of Sines, Portugal – with special emphasis on long period oscillations.In: Shankar, N.J., Toh, A.C., Lin, P. (Eds.), Proceedings of the Inaugural Interna-tional Conference on Port and Maritime R&D and Technology, NationalUniversity of Singapore, Singapore, 29–31 October.
Gilmour, A.E., 1990. Response of Wellington harbour to the tsunamis of 1960 and1964. N. Z. J. Mar. Freshw. Res. 24 (2), 229–231.
Gwynne, K., 1993. Seaching in two rocks marina (Honors Thesis). Department ofEnvironmental Engineering, The University of Western Australia, Perth,Western Australia.
Harkins, G.S., Briggs, M.J., 1995. Resonant forcing of harbours by infragravity waves.In: Edge, B.L. (Ed.), Proceedings of the Twenty-fourth International CoastalEngineering Conference: Coastal Engineering 1994. American Society of CivilEngineers, New York. pp. 806–820.
Hegge, B.J., Masselink, G., 1996. Spectral analysis of geomorphic time series: auto-spectrum. Earth Surf. Process. Landf. 21 (11), 1021–1040.
Herbers, T.H.C., Elgar, S., Guza, R.T., 1995. Generation and propagation of infra-gravity waves. J. Geophys. Res.-Oceans 100 (C12), 24863–24872.
Hinwood, J.B., McLean, E.J., 2013. Effects of the March 2011 Japanese Tsunami inbays and estuaries of SE Australia. Pure Appl. Geophys. 170 (6–8), 1207–1227.
Holman, R.A., 1981. Infragravity energy in the surf zone. J.f Geophys. Res.-Oceans 86(C7), 6442–6450.
Holman, R.A., Huntly, D.A., Bowen, A.J. (1978). Infragravity waves in stormconditions. In: Edge, B.L. (Ed.), Proceedings of the Sixteenth InternationalCoastal Engineering Conference: Coastal Engineering, 1978. American Societyof Civil Engineers, New York. pp. 268–284
Holthuijsen, L.H., 2007. Waves in Oceanic and Coastal Waters. Cambridge UniversityPress, New York.
Jeong, W.M., Chae, J.W., Park, W.S., Jung, K.T. 1997. Field measurements andnumerical modelling of harbour oscillations during storm waves. In: Edge, B.L. (Ed.), Proceedings of the Twenty-fifth International Coastal EngineeringConference: Coastal Engineering 1996. American Society of Civil Engineers,New York. pp. 1268–1279.
Kofoed-Hansen, H., Kerper, D.R., Sørensen, O.R., Kirkegaard, J. 2005. Simulation oflong wave agitation in ports and harbours using a time-domain boussinesqmodel. In: Proceedings of the Fifth International Symposium on Ocean WaveMeasurement and Analysis (WAVES). IAHR Secretariat, Madrid, Spain.
Lee, J.J., Raichlen, F., 1972. Oscillations in harbors with connected basins. J. Waterw.Harb. Coast. Eng. 98, 311–332.
Lemm, A., Hegge, B.J., Masselink, G., 1999. Offshore wave climate, Perth (WesternAustralia): 1994–1996. Mar. Freshw. Res. 50 (2), 95–102.
D.T. Thotagamuwage, C.B. Pattiaratchi / Ocean Engineering 88 (2014) 435–445444
List, J.H., 1991. Wave groupiness variations in the nearshore. Coast. Eng. 15 (5–6),475–496.
Little, J.N., Shure, L., 1988. Signal Processing Toolbox for use with MATLAB. TheMath Works Inc., Prentice-Hall, New Jersey.
López, M., Iglesias, G., Kobayashi, N., 2012. Long period oscillations and tidal level inthe Port of Ferrol. Appl. Ocean Res. 38, 126–134.
Luick, J.L., Hinwood, J.B., 2008. Water levels in a dual-basin harbour in response toinfragravity and edge waves. Prog. Oceanogr. 77 (4), 367–375.
Masselink, G., Pattiaratchi, C.B., 2001. Seasonal changes in beach morphology alongthe sheltered coastline of Perth, Western Australia. Mar. Geol. 172 (3–4),243–263.
McComb, P., Gorman, R., & Goring, D., 2005. Forecasting infragravity wave energywithin a harbour. In: B.L.E.J.C. Santas (Ed.), Proceedings of the Fifth Interna-tional Symposium on Ocean Wave Measurement and Analysis (WAVES). IAHRSecretariat, Madrid, Sapin. 3rd–7th July.
Mei, C.C., Agnon, Y., 1989. Long-period oscillations in a harbour induced by incidentshort waves. J. Fluid Mech. 208, 595–608.
Morison, M.L., Imberger, J., 1992. Water-level oscillations in esperance harbour. J.Waterw. Port Coast. Ocean Eng. 118 (4), 352–367.
Nakamura, S., & Katoh, K., 1993. Generation of infragravity waves in breakingprocess of wave groups. In: Edge, B.L. (Ed.) Proceedings of the Twenty-thirdInternational Coastal Engineering Conference: Coastal Engineering 1992. Amer-ican Society of Civil Engineers, New York. pp. 990–1003.
Nelson, R.C., Treloar, P.D., Lawson, N.V., 1988. The dependancy of inshore longwaves on the characteristics of offshore short waves. Coast. Eng. 12 (3),213–231.
Okihiro, M., Guza, R.T., 1996. Observations of Seiche Forcing and Amplification inThree Small Harbours. J. Waterw. Port Coast. Ocean Eng. 122 (5), 232–238.
Okihiro, M., Guza, R.T., Seymour, R.J., 1993. Excitation of seiche observed in a smallharbour. J. Geophys. Res.-Oceans 98 (C10), 18201–18211.
Pattiaratchi, C.B., 2011. Coastal tide gauge observations: dynamic processes presentin the Fremantle record. In: Brassington, A.S.a.G.B. (Ed.), Operational Oceano-graphy in the 21st Century. Springer, pp. 185–202.
Pattiaratchi, C.B., Eliot, M. 2008. Sea level variability in south-west Australia: fromhours to decades. Coastal Engineering, In: Proceedings of the International
Coastal Engineering Conference, American Society of Civil Engineers. pp. 1186–1198.
Pattiaratchi, C.B., Wijeratne, E.M.S., 2014. Observations of meteorological tsunamisalong the south-west Australian coast. Nat. Hazards , http://dx.doi.org/10.1007/s11069-014-1263-8.
Pugh, D.T., 1987. Tides, Surges and Mean Sea-Level: a hand book for Engineers andScientists. John Wiley & Sons, Chichester.
Rabinovich, A.B., 2009. Seiches and Harbor Oscillations. In: Kim, Y.C. (Ed.), Hand-book of Coastal and Ocean Engineering. World Scientific Publishing Co. Pte. Ltd.,Singapore, pp. 193–236.
Sawaragi, T., & Kubo, M. 1982. The motion of a moored ship in a harbour basin. In:Edge, B.L. (Ed.), Proceedings of the Eighteenth International Coastal EngineeringConference: Coastal Engineering 1982. American Society of Civil Engineers,NewYork. pp. 2743–2762.
Thoresen, C.A., 2003. Port Designer's Handbook: Recommendations and Guidelines.Thomas Telford Publishing, London.
Tolkova, E., Power, W., 2011. Obtaining natural oscillatory modes of bays andharbors via Empirical Orthogonal Function analysis of tsunami wave fields.Ocean Dyn. 61, 731–751.
Uzaki, K., Matsunaga, N., Nishii, Y., Ikehata, Y., 2010. Cause and countermeasure oflong-period oscillations of moored ships and the quantification of surge andheave amplitudes. Ocean Eng. 37 (2–3), 155–163.
Uzaki, K., Matsunaga, N., Nishii, Y., Takase, K., 2005. Fields observation andnumerical simulations of harbour oscillations due to longperiod waves. In:Smith, J.M. (Ed.) Proceedings of the Twenty-ninth International Conference onCoastal Engineering Conference: Coastal Engineering 2004. World ScientificPublishing Co. Pte Ltd. Singapore, vol. 2, pp. 1264–1276.
Van der Molen, W., Monárdez Santander, P., Van Dongeren, A.R., 2006. Numericalsimulation of long-period waves and ship motions in Tomakomai Port, Japan.Coast. Eng. J. 48 (1), 59–79.
Van Rijn, L.C., 1990. Principles of Fluid Flow and Surface Waves in Rivers, Estuaries,Seas and Oceans. Aqua Publications, Amsterdam.
Vilibic, I., Mihanovic´, H., 2003. A study of resonant oscillations in the Split harbour(Adriatic Sea). Estuar. Coast. Shelf Sci. 56 (3–4), 861–867.
Wu, J.K., Liu, P.L.F., 1990. Harbour excitation by incident wave groups. J. Fluid Mech.217, 595–613.
D.T. Thotagamuwage, C.B. Pattiaratchi / Ocean Engineering 88 (2014) 435–445 445