Observation of the proton aurora with IMAGE FUV imager and simultaneous ion flux in situ...
10
Observation of the proton aurora with IMAGE FUV imager and simultaneous ion flux in situ measurements J.-C. Ge ´rard, 1 B. Hubert, 1 M. Meurant, 1 V. I. Shematovich, 2 D. V. Bisikalo, 2 H. Frey, 3 S. Mende, 3 G. R. Gladstone, 4 and C. W. Carlson 3 Abstract. The far ultraviolet cameras on board the IMAGE satellite images the aurora in three different spectral regions. One of the channels of the spectrographic imager SI12 observes the Doppler-shifted Lyman a emission of precipitating protons. It makes it possible to spectrally discriminate between the proton and electron FUV aurora and to globally map the energetic protons. Its response depends on the auroral Lyman a line shape which reflects the characteristics of the proton pitch angle and energy distributions. We illustrate the dependence of the SI12 count rate on the characteristic energy of the proton precipitation and the viewing geometry. Simultaneous in situ observations of the precipitated protons have been collected during a FAST satellite pass when IMAGE was observing the global north polar region. The premidnight region located at the equatorward boundary of the oval is dominated by proton precipitation with a mean energy E = 7 keV which is separated from the electron component. The prenoon crossing exhibits a softer proton energy spectrum with E = 0.9 keV. The measured proton energy distribution is used as an input to a Monte Carlo model to calculate the expected SI12 signal along the magnetic footprint of the satellite orbit. If the different spatial resolution of the two types of measurements is accounted for, a good quantitative agreement is found with the IMAGE observations. Similarly, ion flux measurements collected on board the Defense Meteorological Satellite Program F15 satellite during an overflight in the postmidnight sector provide good agreement with the SI12 observations at the footprint aurora. The comparisons confirm the reliability of the FUV IMAGE cameras to remotely discriminate between the electron and the proton precipitations. The vertical emission rate profiles of the N 2 Lyman-Birge-Hopfield and O I (1356 A ˚ ) emissions are calculated in the proton- dominated premidnight region. It is shown that the protons and the electrons produce FUV emissions with contributions peaking at different altitudes. Excitation by secondary electrons dominates the production of both emissions. 1. Introduction Auroral precipitations from the magnetosphere mainly consist of electrons and protons with a small fraction of other ions. As protons penetrate the atmosphere, they are progressively slowed down by elastic and inelastic collisions with major neutral con- stituents. During some of these collisions the proton captures an electron, leaving a fast hydrogen atom, possibly in an excited state. If the excited hydrogen atoms move toward the ground-based observer, the photon is emitted with a Doppler shift from the line center at rest. The observed line profile is the result of the integration of the contributions of all velocity vector projections on the line of sight. The spectral characteristics of its optical emission and its morphology were extensively studied from the ground as summarized by Eather [1967]. The ground neutral hydrogen (HI) auroral emissions are characterized by the presence of a broad wing extending to the blue, a less extended red wing, and a Doppler shift of the line peak. The magnetic zenith profiles for H a and H b peak at a Doppler shift corresponding to a field- aligned proton velocity of 300 km s 1 . The blue wing (approach- ing H atoms for a ground-based observer) extends to 2000 km s 1 . Little variation is observed in the line profile with the auroral brightness or latitude, except in the daytime polar cusp where narrower line profiles are usually observed [Lorentzen et al., 1998]. The morphology of the proton aurora has been studied with instruments observing the weak hydrogen Balmer emissions, the only known signature detectable from the ground that can be unambiguously associated with proton precipitation. The electron and proton aurorae show distinct morphological features, although no global view of the proton aurora has been obtained so far. Systematic studies of proton aurora have been carried out using a chain of meridian spectrographs and photometers [Montbriand, 1971; Vallance-Jones et al., 1982; Samson et al., 1992] or airborne observations [Eather and Mende, 1971]. It was found that the proton aurora was usually accompanied by diffuse electron pre- cipitation. A few attempts have been made to simultaneously measure the HI Balmer line profile from the ground and the precipitated proton energy spectrum. Galperin et al. [1976] com- pared in situ measurements of pitch angle distributions at different energies with auroral emission. Soraas et al. [1994] and Synnes et al. [1998] calculated the hydrogen line profiles for an arbitrary angle to the magnetic field. Lorentzen et al. [1998] used NOAA 12 satellite measurements of the incoming auroral proton fluxes to calculate the resulting H a profile and compared it with ground- based observations in the dayside cusp region. They obtained a good match between the observed and calculated emission profiles. JOURNAL OF GEOPHYSICAL RESEARCH, VOL. 106, NO. A12, PAGES 28939– 28948, DECEMBER 2001 1 Laboratoire de Physique Atmosphe ´rique et Plane ´taire, Universite ´ de Lie `ge, Belgium. 2 Institute of Astronomy, Russian Academy of Sciences, Moscow, Russia. 3 Space Science Laboratory, University of California, Berkeley, California, USA. 4 Southwest Research Institute, San Antonio, Texas, USA. Copyright 2001 by the American Geophysical Union. Paper number 2001JA900119. 0148-0227/01/2001JA900119$09.00 28939
-
Upload
independent -
Category
Documents
-
view
1 -
download
0
Transcript of Observation of the proton aurora with IMAGE FUV imager and simultaneous ion flux in situ...
Observation of the proton aurora with IMAGE FUV imager
and simultaneous ion flux in situ measurements
J.-C. Gerard,1 B. Hubert,1 M. Meurant,1 V. I. Shematovich,2 D. V. Bisikalo,2 H. Frey,3
S. Mende,3 G. R. Gladstone,4 and C. W. Carlson3
Abstract. The far ultraviolet cameras on board the IMAGE satellite images the aurora in threedifferent spectral regions. One of the channels of the spectrographic imager SI12 observes theDoppler-shifted Lyman a emission of precipitating protons. It makes it possible to spectrallydiscriminate between the proton and electron FUV aurora and to globally map the energeticprotons. Its response depends on the auroral Lyman a line shape which reflects the characteristicsof the proton pitch angle and energy distributions. We illustrate the dependence of the SI12 countrate on the characteristic energy of the proton precipitation and the viewing geometry.Simultaneous in situ observations of the precipitated protons have been collected during a FASTsatellite pass when IMAGE was observing the global north polar region. The premidnight regionlocated at the equatorward boundary of the oval is dominated by proton precipitation with a meanenergy E� = 7 keV which is separated from the electron component. The prenoon crossing exhibitsa softer proton energy spectrum withE� = 0.9 keV. The measured proton energy distribution is usedas an input to a Monte Carlo model to calculate the expected SI12 signal along the magneticfootprint of the satellite orbit. If the different spatial resolution of the two types of measurements isaccounted for, a good quantitative agreement is found with the IMAGE observations. Similarly, ionflux measurements collected on board the Defense Meteorological Satellite Program F15 satelliteduring an overflight in the postmidnight sector provide good agreement with the SI12 observationsat the footprint aurora. The comparisons confirm the reliability of the FUV IMAGE cameras toremotely discriminate between the electron and the proton precipitations. The vertical emission rateprofiles of the N2 Lyman-Birge-Hopfield and O I (1356 A) emissions are calculated in the proton-dominated premidnight region. It is shown that the protons and the electrons produce FUVemissions with contributions peaking at different altitudes. Excitation by secondary electronsdominates the production of both emissions.
1. Introduction
Auroral precipitations from the magnetosphere mainly consist ofelectrons and protons with a small fraction of other ions. Asprotons penetrate the atmosphere, they are progressively sloweddown by elastic and inelastic collisions with major neutral con-stituents. During some of these collisions the proton captures anelectron, leaving a fast hydrogen atom, possibly in an excited state.If the excited hydrogen atoms move toward the ground-basedobserver, the photon is emitted with a Doppler shift from the linecenter at rest. The observed line profile is the result of theintegration of the contributions of all velocity vector projectionson the line of sight. The spectral characteristics of its opticalemission and its morphology were extensively studied from theground as summarized by Eather [1967]. The ground neutralhydrogen (HI) auroral emissions are characterized by the presenceof a broad wing extending to the blue, a less extended red wing,
and a Doppler shift of the line peak. The magnetic zenith profilesfor Ha and Hb peak at a Doppler shift corresponding to a field-aligned proton velocity of �300 km s�1. The blue wing (approach-ing H atoms for a ground-based observer) extends to �2000 kms�1. Little variation is observed in the line profile with the auroralbrightness or latitude, except in the daytime polar cusp wherenarrower line profiles are usually observed [Lorentzen et al., 1998].The morphology of the proton aurora has been studied with
instruments observing the weak hydrogen Balmer emissions, theonly known signature detectable from the ground that can beunambiguously associated with proton precipitation. The electronand proton aurorae show distinct morphological features, althoughno global view of the proton aurora has been obtained so far.Systematic studies of proton aurora have been carried out using achain of meridian spectrographs and photometers [Montbriand,1971; Vallance-Jones et al., 1982; Samson et al., 1992] or airborneobservations [Eather and Mende, 1971]. It was found that theproton aurora was usually accompanied by diffuse electron pre-cipitation. A few attempts have been made to simultaneouslymeasure the HI Balmer line profile from the ground and theprecipitated proton energy spectrum. Galperin et al. [1976] com-pared in situ measurements of pitch angle distributions at differentenergies with auroral emission. Soraas et al. [1994] and Synnes etal. [1998] calculated the hydrogen line profiles for an arbitraryangle to the magnetic field. Lorentzen et al. [1998] used NOAA 12satellite measurements of the incoming auroral proton fluxes tocalculate the resulting Ha profile and compared it with ground-based observations in the dayside cusp region. They obtained agood match between the observed and calculated emission profiles.
JOURNAL OF GEOPHYSICAL RESEARCH, VOL. 106, NO. A12, PAGES 28939–28948, DECEMBER 2001
1Laboratoire de Physique Atmospherique et Planetaire, Universite deLiege, Belgium.
2Institute of Astronomy, Russian Academy of Sciences, Moscow,Russia.
3Space Science Laboratory, University of California, Berkeley,California, USA.
4Southwest Research Institute, San Antonio, Texas, USA.
Copyright 2001 by the American Geophysical Union.
Paper number 2001JA900119.0148-0227/01/2001JA900119$09.00
28939
Hubert et al. [2001] calculated the distribution of the Lyman a (Lya) and other FUV emission rates expected from the statistical ionprecipitation distribution obtained by Hardy et al. [1989] from alarge sample of proton measurements from DMSP satellites. Theyshowed that the Ly a spatial distribution generally matches the ionprecipitation pattern, although the efficiency of Ly a drops as theproton energy increases. Gerard et al. [2000] presented Ly a lineprofiles calculated with a direct Monte Carlo method and showedthe importance of a stochastic treatment of the collisional angularscattering on the line profile.Spacecraft-based observations of proton aurora were restricted to
in situ satellite particle detection, and, until the launch of theImager for Magnetopause-to-Aurora Global Exploration (IMAGE)satellite, no capability for remote sensing of the global protonaurora existed. Doppler-shifted auroral Ly a emission wasobserved by Ishimoto et al. [1989] using nadir FUV satellitespectroscopy. The line peaks were shifted toward longer wave-lengths from the rest wavelength, and the line width was largerthan the geocoronal midlatitude contribution. The inferred protonenergy flux was consistent with statistical proton precipitationfluxes derived from satellite in situ observations. However, theproton-induced aurora had not been observed so far from a globalperspective.With the launch of the IMAGE satellite in March 2000, the FUV
instrument fills this gap and provides the capabilities to simulta-neously observe the aurora in three spectral bands: a broadbandregion extending from 1350 to 1700 A (Wideband Imaging Cam-era(WIC)), a 50-A passband centered on the O I (1356 A) feature(SI13), and a narrow band system with a peak sensitivity at 1218 A(SI12). Early results from the FUV were described by Burch et al.[2001], Mende et al. [2001], and Frey et al. [2001]. However, noquantitative comparison was made between in situ measurements ofproton precipitation and the resulting SI12 observations.In this study, we concentrate on the proton auroral spectro-
graphic imager SI12. We first describe its sensitivity response tothe characteristic of the incident proton beam. Next, we describemeasurements comparing in situ ion measurements with parallelobservations from IMAGE on the same magnetic field line. Wethen discuss the reliability and limitations of this new sensor toremotely sense proton precipitations.
2. Lyman aaaa Line Profile and SI12 Response
The spectrographic imager SI12 is designed to measure thebrightness of the Doppler-shifted Ly a auroral emission andmonitor the global scale proton precipitation. The IMAGE SI12has a grill system to reject the geocoronal Ly a emission at1215.6 A and allow a fraction of the broad auroral Ly a lineprofile [Mende et al., 2000a, 2000b]. Since this emission isemitted by excited fast H atoms, the line profile for a givenobservation geometry depends on the energy spectrum of theincident auroral protons and their pitch angle distribution. Inaddition, the response of the SI12 instrument with its multiplepassbands depends on the Ly a line profile. The shape of thisprofile is influenced by the orientation of the line of sight withrespect to the magnetic field lines. Ideally, one would like toobtain a direct relationship between the observed instrumentalcount rate and the precipitated proton energy flux. However, thecomplexity of the atmospheric and instrumental processesinvolved make it necessary to simulate the SI12 response for arange of parameters describing the proton precipitation and thegeometry of observations. The effects of the proton characteristicenergy and pitch angle distribution were analyzed with a MonteCarlo direct simulation model.
2.1. Lyman aaaa Model Calculations
The proton energy transport code is described in detail byGerard et al. [2000]. It is based on the direct Monte Carlo method
[Shematovich et al., 1994; Marov et al., 1997], which is astochastic implementation of the solution of the Boltzmann equa-tions for the H+-H beam. In the thermosphere the protons exchangecharge with the ambient constituents and generate a population offast H atoms which, in turn, may be converted back to energeticprotons. More specifically, the interactions of energetic protons Hf
+
with the main thermospheric constituents are described by thefollowing processes:
Hþf þM�!Hþ
f 0 þM ð�Þ ð1aÞ
Hþf þM�!Hþ
f 0 þMþ þ e ð1bÞ
Hþf þM�!H
ð�Þf 0 þMþ; ð1cÞ
where M denotes N2, O2, or O.These processes correspond to momentum and energy transfer in
elastic and inelastic collisions (1a), ionization of target particles(1b), and charge transfer (1c). The fast hydrogen atoms Hf furtherinteract with the atmosphere, transferring their momentum andkinetic energy by elastic and inelastic collisions, ionization, andstripping processes:
Hf þM�!Hð�Þf 0 þM ð2aÞ
Hf þM�!Hð�Þf 0 þMþ þ e ð2bÞ
Hf þM�!Hþf 0 þM þ e: ð2cÞ
A fraction of the Hf 0ð�Þ fast hydrogen atoms is produced in the
H(2p) state by processes (1c), (2a), and (2b) and radiates Ly aphotons. The Monte Carlo proton aurora code includes a detailedcalculation of all collisional processes for both species and sto-chastically simulates the pitch angle redistribution of the simulatedparticles. These fast H atoms bear the signature of the protoncharacteristics before the electron-stripping collision. As excited Hatoms move away from the down-viewing satellite, the Ly aphoton is emitted with a Doppler shift to the red side of theunshifted line center. The observed line profile is the result of theintegration of the contributions of all velocity vectors projected onthe line of sight.Simulations showed that the total line brightness is not simply
proportional to the proton energy flux. The Ly a yield per unitprecipitated energy flux drops as the characteristic proton energyincreases [Strickland et al., 1993; Hubert et al., 2001]. Themaximum Doppler red shift is 1.77
ffiffiffiffi
Ep
A, where E (in keV) isthe initial proton energy. For a distributed energy spectrum theline shape depends on the spectral parameters describing theinitial proton energy as discussed by Gerard et al. [2000]. Theirstudy showed that the wavelength of the line peak, whichcorresponds to the most probable value of the velocity projec-tion for the emitting atoms, is nearly independent of thecharacteristic energy above �5 keV. The proton pitch angledistribution also plays a role, and field-aligned precipitationproduces a narrower line profile than a hemispherically isotropicproton distribution. Finally, the orientation of the instrument isalso important as the projection of the fast H atom velocityalong the line of sight is different if observations are madealong (parallel velocity) or perpendicular to the field lines(gyromotion).
2.2. SI12 Response to Lyman aaaa Line Profile
We now examine how these factors affect the IMAGE FUVSI12 response to the auroral Ly a emission. Figure 1a shows theSI12 response curve together with the Ly a line shape calcu-lated for a nadir observation of a proton aurora. In this example,the initial protons have a kappa energy distribution with a
28940 GERARD ET AL.: IMAGE LY a AURORA COMPARISON WITH IN SITU MEASUREMENTS
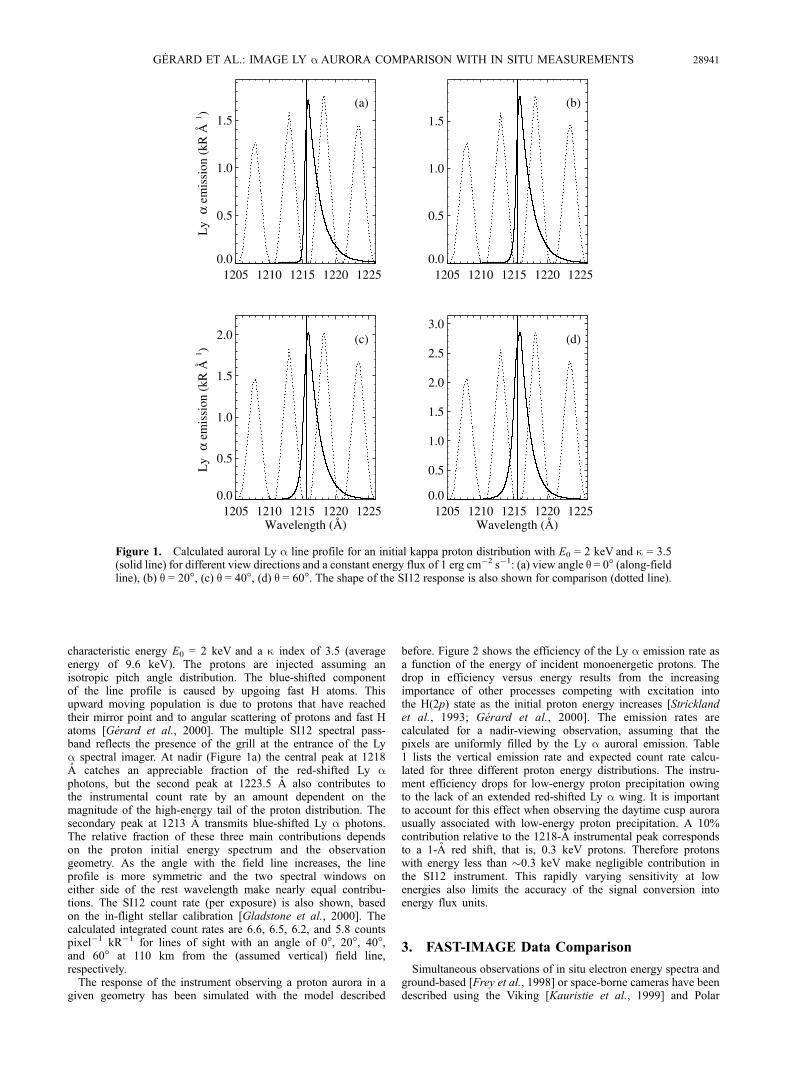
characteristic energy E0 = 2 keV and a k index of 3.5 (averageenergy of 9.6 keV). The protons are injected assuming anisotropic pitch angle distribution. The blue-shifted componentof the line profile is caused by upgoing fast H atoms. Thisupward moving population is due to protons that have reachedtheir mirror point and to angular scattering of protons and fast Hatoms [Gerard et al., 2000]. The multiple SI12 spectral pass-band reflects the presence of the grill at the entrance of the Lya spectral imager. At nadir (Figure 1a) the central peak at 1218A catches an appreciable fraction of the red-shifted Ly aphotons, but the second peak at 1223.5 A also contributes tothe instrumental count rate by an amount dependent on themagnitude of the high-energy tail of the proton distribution. Thesecondary peak at 1213 A transmits blue-shifted Ly a photons.The relative fraction of these three main contributions dependson the proton initial energy spectrum and the observationgeometry. As the angle with the field line increases, the lineprofile is more symmetric and the two spectral windows oneither side of the rest wavelength make nearly equal contribu-tions. The SI12 count rate (per exposure) is also shown, basedon the in-flight stellar calibration [Gladstone et al., 2000]. Thecalculated integrated count rates are 6.6, 6.5, 6.2, and 5.8 countspixel�1 kR�1 for lines of sight with an angle of 0�, 20�, 40�,and 60� at 110 km from the (assumed vertical) field line,respectively.The response of the instrument observing a proton aurora in a
given geometry has been simulated with the model described
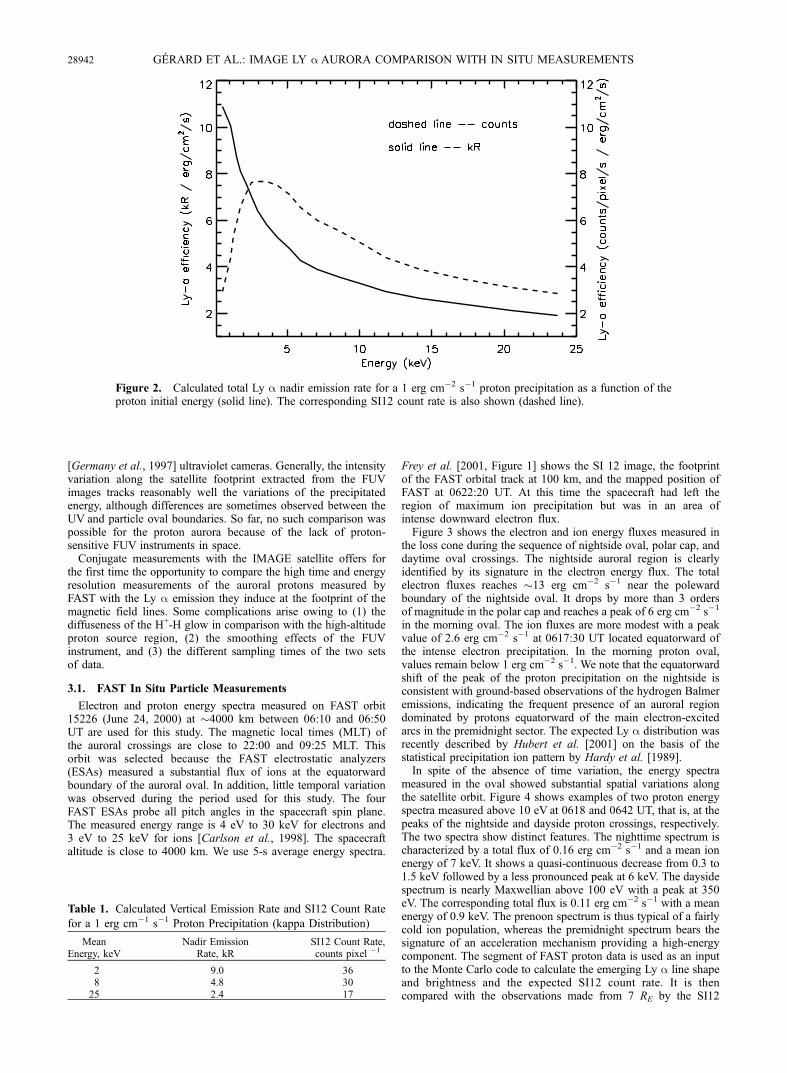
before. Figure 2 shows the efficiency of the Ly a emission rate asa function of the energy of incident monoenergetic protons. Thedrop in efficiency versus energy results from the increasingimportance of other processes competing with excitation intothe H(2p) state as the initial proton energy increases [Stricklandet al., 1993; Gerard et al., 2000]. The emission rates arecalculated for a nadir-viewing observation, assuming that thepixels are uniformly filled by the Ly a auroral emission. Table1 lists the vertical emission rate and expected count rate calcu-lated for three different proton energy distributions. The instru-ment efficiency drops for low-energy proton precipitation owingto the lack of an extended red-shifted Ly a wing. It is importantto account for this effect when observing the daytime cusp aurorausually associated with low-energy proton precipitation. A 10%contribution relative to the 1218-A instrumental peak correspondsto a 1-A red shift, that is, 0.3 keV protons. Therefore protonswith energy less than �0.3 keV make negligible contribution inthe SI12 instrument. This rapidly varying sensitivity at lowenergies also limits the accuracy of the signal conversion intoenergy flux units.
3. FAST-IMAGE Data Comparison
Simultaneous observations of in situ electron energy spectra andground-based [Frey et al., 1998] or space-borne cameras have beendescribed using the Viking [Kauristie et al., 1999] and Polar
1205 1210 1215 1220 12250.0
0.5
1.0
1.5
Ly
α em
issi
on (
kR Å
1 )
(a)
1205 1210 1215 1220 12250.0
0.5
1.0
1.5
(b)
1205 1210 1215 1220 1225Wavelength (Å)
0.0
0.5
1.0
1.5
2.0
Ly
α em
issi
on (
kR Å
1 )
(c)
1205 1210 1215 1220 1225Wavelength (Å)
0.0
0.5
1.0
1.5
2.0
2.5
3.0(d)
Figure 1. Calculated auroral Ly a line profile for an initial kappa proton distribution with E0 = 2 keV and k = 3.5(solid line) for different view directions and a constant energy flux of 1 erg cm�2 s�1: (a) view angle q = 0� (along-fieldline), (b) q = 20�, (c) q = 40�, (d) q = 60�. The shape of the SI12 response is also shown for comparison (dotted line).
GERARD ET AL.: IMAGE LY a AURORA COMPARISON WITH IN SITU MEASUREMENTS 28941
[Germany et al., 1997] ultraviolet cameras. Generally, the intensityvariation along the satellite footprint extracted from the FUVimages tracks reasonably well the variations of the precipitatedenergy, although differences are sometimes observed between theUV and particle oval boundaries. So far, no such comparison waspossible for the proton aurora because of the lack of proton-sensitive FUV instruments in space.Conjugate measurements with the IMAGE satellite offers for
the first time the opportunity to compare the high time and energyresolution measurements of the auroral protons measured byFAST with the Ly a emission they induce at the footprint of themagnetic field lines. Some complications arise owing to (1) thediffuseness of the H+-H glow in comparison with the high-altitudeproton source region, (2) the smoothing effects of the FUVinstrument, and (3) the different sampling times of the two setsof data.
3.1. FAST In Situ Particle Measurements
Electron and proton energy spectra measured on FAST orbit15226 (June 24, 2000) at �4000 km between 06:10 and 06:50UT are used for this study. The magnetic local times (MLT) ofthe auroral crossings are close to 22:00 and 09:25 MLT. Thisorbit was selected because the FAST electrostatic analyzers(ESAs) measured a substantial flux of ions at the equatorwardboundary of the auroral oval. In addition, little temporal variationwas observed during the period used for this study. The fourFAST ESAs probe all pitch angles in the spacecraft spin plane.The measured energy range is 4 eV to 30 keV for electrons and3 eV to 25 keV for ions [Carlson et al., 1998]. The spacecraftaltitude is close to 4000 km. We use 5-s average energy spectra.
Frey et al. [2001, Figure 1] shows the SI 12 image, the footprintof the FAST orbital track at 100 km, and the mapped position ofFAST at 0622:20 UT. At this time the spacecraft had left theregion of maximum ion precipitation but was in an area ofintense downward electron flux.Figure 3 shows the electron and ion energy fluxes measured in
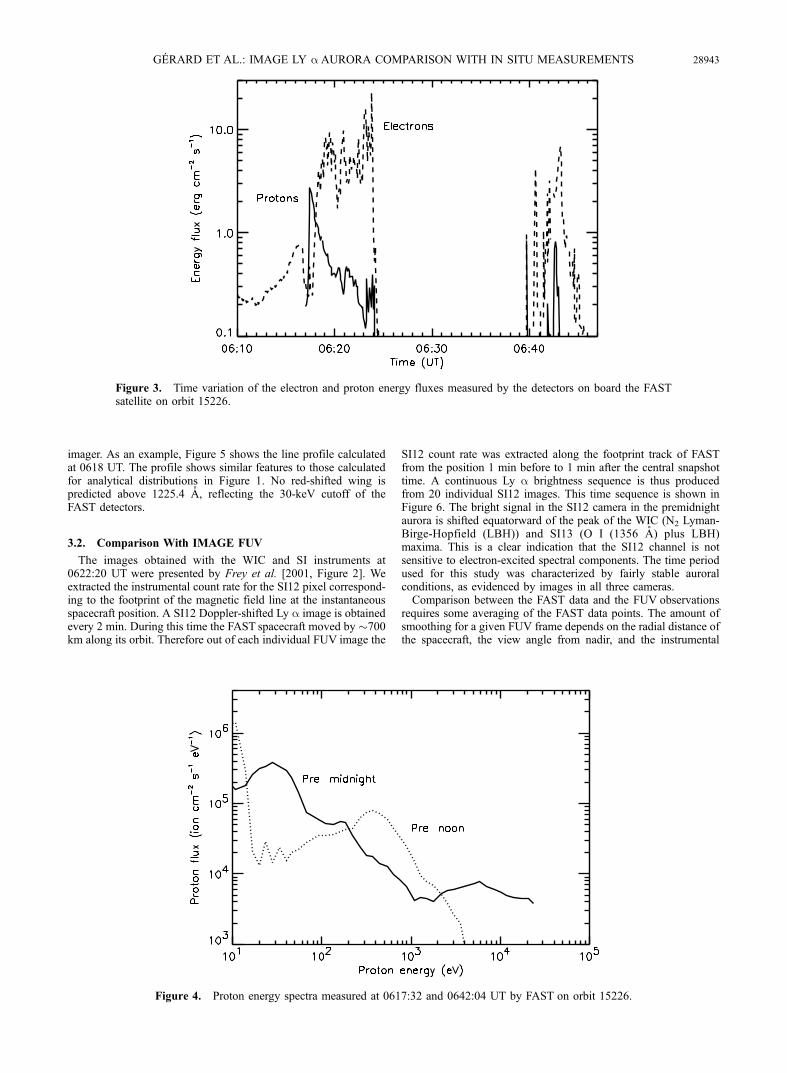
the loss cone during the sequence of nightside oval, polar cap, anddaytime oval crossings. The nightside auroral region is clearlyidentified by its signature in the electron energy flux. The totalelectron fluxes reaches �13 erg cm�2 s�1 near the polewardboundary of the nightside oval. It drops by more than 3 ordersof magnitude in the polar cap and reaches a peak of 6 erg cm�2 s�1
in the morning oval. The ion fluxes are more modest with a peakvalue of 2.6 erg cm�2 s�1 at 0617:30 UT located equatorward ofthe intense electron precipitation. In the morning proton oval,values remain below 1 erg cm�2 s�1. We note that the equatorwardshift of the peak of the proton precipitation on the nightside isconsistent with ground-based observations of the hydrogen Balmeremissions, indicating the frequent presence of an auroral regiondominated by protons equatorward of the main electron-excitedarcs in the premidnight sector. The expected Ly a distribution wasrecently described by Hubert et al. [2001] on the basis of thestatistical precipitation ion pattern by Hardy et al. [1989].In spite of the absence of time variation, the energy spectra
measured in the oval showed substantial spatial variations alongthe satellite orbit. Figure 4 shows examples of two proton energyspectra measured above 10 eV at 0618 and 0642 UT, that is, at thepeaks of the nightside and dayside proton crossings, respectively.The two spectra show distinct features. The nighttime spectrum ischaracterized by a total flux of 0.16 erg cm�2 s�1 and a mean ionenergy of 7 keV. It shows a quasi-continuous decrease from 0.3 to1.5 keV followed by a less pronounced peak at 6 keV. The daysidespectrum is nearly Maxwellian above 100 eV with a peak at 350eV. The corresponding total flux is 0.11 erg cm�2 s�1 with a meanenergy of 0.9 keV. The prenoon spectrum is thus typical of a fairlycold ion population, whereas the premidnight spectrum bears thesignature of an acceleration mechanism providing a high-energycomponent. The segment of FAST proton data is used as an inputto the Monte Carlo code to calculate the emerging Ly a line shapeand brightness and the expected SI12 count rate. It is thencompared with the observations made from 7 RE by the SI12
Figure 2. Calculated total Ly a nadir emission rate for a 1 erg cm�2 s�1 proton precipitation as a function of theproton initial energy (solid line). The corresponding SI12 count rate is also shown (dashed line).
Table 1. Calculated Vertical Emission Rate and SI12 Count Rate
for a 1 erg cm�1 s�1 Proton Precipitation (kappa Distribution)
MeanEnergy, keV
Nadir EmissionRate, kR
SI12 Count Rate,counts pixel �1
2 9.0 368 4.8 3025 2.4 17
28942 GERARD ET AL.: IMAGE LY a AURORA COMPARISON WITH IN SITU MEASUREMENTS
imager. As an example, Figure 5 shows the line profile calculatedat 0618 UT. The profile shows similar features to those calculatedfor analytical distributions in Figure 1. No red-shifted wing ispredicted above 1225.4 A, reflecting the 30-keV cutoff of theFAST detectors.
3.2. Comparison With IMAGE FUV
The images obtained with the WIC and SI instruments at0622:20 UT were presented by Frey et al. [2001, Figure 2]. Weextracted the instrumental count rate for the SI12 pixel correspond-ing to the footprint of the magnetic field line at the instantaneousspacecraft position. A SI12 Doppler-shifted Ly a image is obtainedevery 2 min. During this time the FAST spacecraft moved by �700km along its orbit. Therefore out of each individual FUV image the
SI12 count rate was extracted along the footprint track of FASTfrom the position 1 min before to 1 min after the central snapshottime. A continuous Ly a brightness sequence is thus producedfrom 20 individual SI12 images. This time sequence is shown inFigure 6. The bright signal in the SI12 camera in the premidnightaurora is shifted equatorward of the peak of the WIC (N2 Lyman-Birge-Hopfield (LBH)) and SI13 (O I (1356 A) plus LBH)maxima. This is a clear indication that the SI12 channel is notsensitive to electron-excited spectral components. The time periodused for this study was characterized by fairly stable auroralconditions, as evidenced by images in all three cameras.Comparison between the FAST data and the FUV observations
requires some averaging of the FAST data points. The amount ofsmoothing for a given FUV frame depends on the radial distance ofthe spacecraft, the view angle from nadir, and the instrumental
Figure 4. Proton energy spectra measured at 0617:32 and 0642:04 UT by FAST on orbit 15226.
Figure 3. Time variation of the electron and proton energy fluxes measured by the detectors on board the FASTsatellite on orbit 15226.
GERARD ET AL.: IMAGE LY a AURORA COMPARISON WITH IN SITU MEASUREMENTS 28943
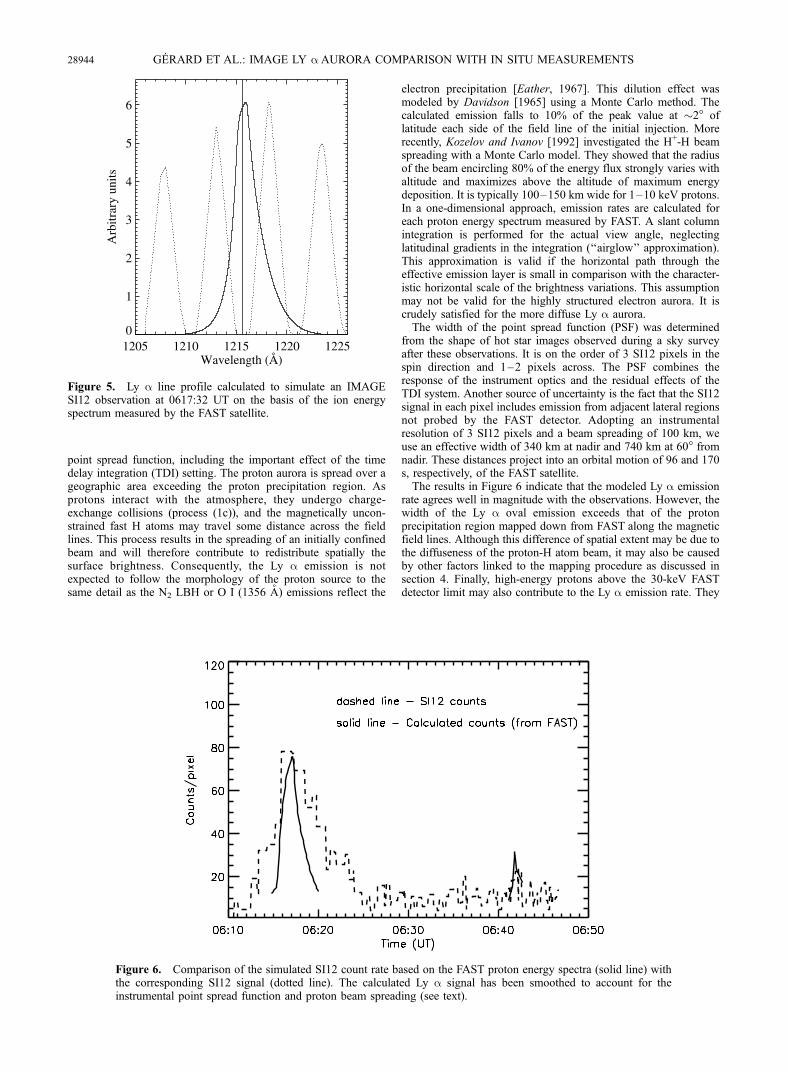
point spread function, including the important effect of the timedelay integration (TDI) setting. The proton aurora is spread over ageographic area exceeding the proton precipitation region. Asprotons interact with the atmosphere, they undergo charge-exchange collisions (process (1c)), and the magnetically uncon-strained fast H atoms may travel some distance across the fieldlines. This process results in the spreading of an initially confinedbeam and will therefore contribute to redistribute spatially thesurface brightness. Consequently, the Ly a emission is notexpected to follow the morphology of the proton source to thesame detail as the N2 LBH or O I (1356 A) emissions reflect the
electron precipitation [Eather, 1967]. This dilution effect wasmodeled by Davidson [1965] using a Monte Carlo method. Thecalculated emission falls to 10% of the peak value at �2� oflatitude each side of the field line of the initial injection. Morerecently, Kozelov and Ivanov [1992] investigated the H+-H beamspreading with a Monte Carlo model. They showed that the radiusof the beam encircling 80% of the energy flux strongly varies withaltitude and maximizes above the altitude of maximum energydeposition. It is typically 100–150 km wide for 1–10 keV protons.In a one-dimensional approach, emission rates are calculated foreach proton energy spectrum measured by FAST. A slant columnintegration is performed for the actual view angle, neglectinglatitudinal gradients in the integration (‘‘airglow’’ approximation).This approximation is valid if the horizontal path through theeffective emission layer is small in comparison with the character-istic horizontal scale of the brightness variations. This assumptionmay not be valid for the highly structured electron aurora. It iscrudely satisfied for the more diffuse Ly a aurora.The width of the point spread function (PSF) was determined
from the shape of hot star images observed during a sky surveyafter these observations. It is on the order of 3 SI12 pixels in thespin direction and 1–2 pixels across. The PSF combines theresponse of the instrument optics and the residual effects of theTDI system. Another source of uncertainty is the fact that the SI12signal in each pixel includes emission from adjacent lateral regionsnot probed by the FAST detector. Adopting an instrumentalresolution of 3 SI12 pixels and a beam spreading of 100 km, weuse an effective width of 340 km at nadir and 740 km at 60� fromnadir. These distances project into an orbital motion of 96 and 170s, respectively, of the FAST satellite.The results in Figure 6 indicate that the modeled Ly a emission
rate agrees well in magnitude with the observations. However, thewidth of the Ly a oval emission exceeds that of the protonprecipitation region mapped down from FAST along the magneticfield lines. Although this difference of spatial extent may be due tothe diffuseness of the proton-H atom beam, it may also be causedby other factors linked to the mapping procedure as discussed insection 4. Finally, high-energy protons above the 30-keV FASTdetector limit may also contribute to the Ly a emission rate. They
Figure 6. Comparison of the simulated SI12 count rate based on the FAST proton energy spectra (solid line) withthe corresponding SI12 signal (dotted line). The calculated Ly a signal has been smoothed to account for theinstrumental point spread function and proton beam spreading (see text).
1205 1210 1215 1220 1225Wavelength (Å)
0
1
2
3
4
5
6A
rbitr
ary
units
Figure 5. Ly a line profile calculated to simulate an IMAGESI12 observation at 0617:32 UT on the basis of the ion energyspectrum measured by the FAST satellite.
28944 GERARD ET AL.: IMAGE LY a AURORA COMPARISON WITH IN SITU MEASUREMENTS
were not accounted for in these simulations. As may be deducedfrom the shape of the proton spectra, a fraction of the proton energyflux between 0617 and 0618 UT has been underestimated duringthis period. The Ly a calculated intensity is therefore a lower limitduring this time period.
4. DMSP-IMAGE Comparison
As an independent check of the consistency between in situ ionmeasurements and SI12 images, we analyzed parallel observationsduring a Defense Meteorological Satellite Program (DMSP) satel-lite crossing of the premidnight oval. The measurements weremade with the DMSP F15 satellite on December 3, 2000, as the
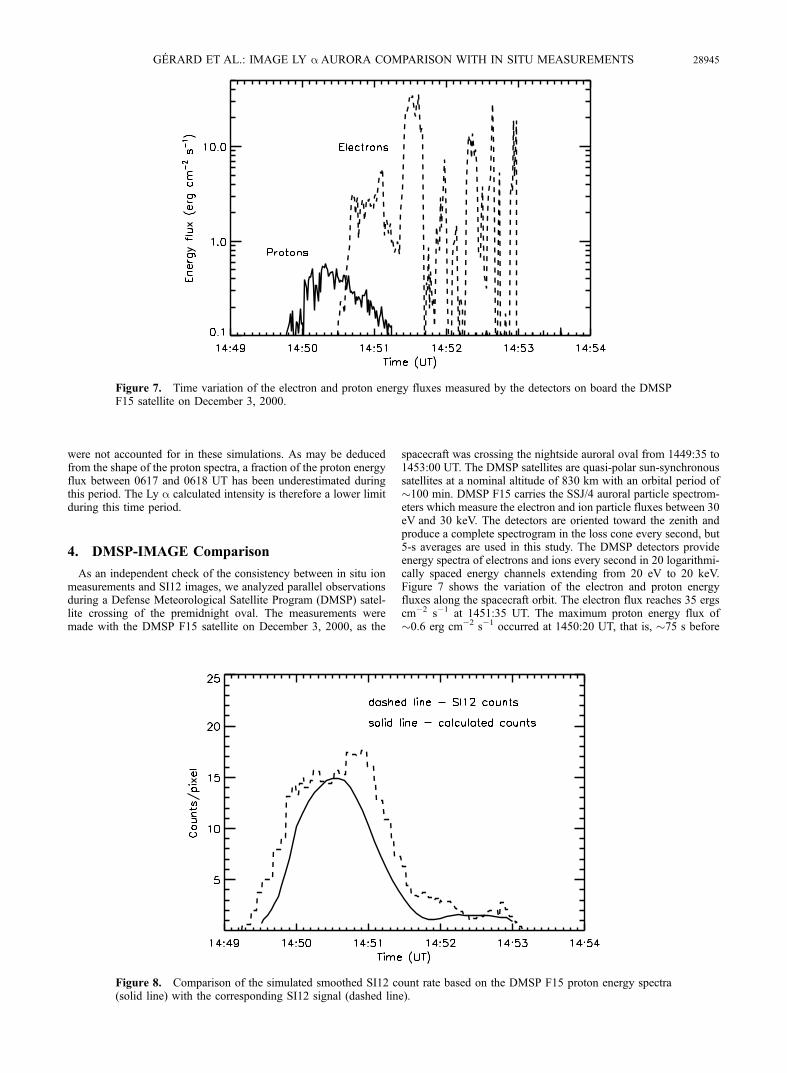
spacecraft was crossing the nightside auroral oval from 1449:35 to1453:00 UT. The DMSP satellites are quasi-polar sun-synchronoussatellites at a nominal altitude of 830 km with an orbital period of�100 min. DMSP F15 carries the SSJ/4 auroral particle spectrom-eters which measure the electron and ion particle fluxes between 30eV and 30 keV. The detectors are oriented toward the zenith andproduce a complete spectrogram in the loss cone every second, but5-s averages are used in this study. The DMSP detectors provideenergy spectra of electrons and ions every second in 20 logarithmi-cally spaced energy channels extending from 20 eV to 20 keV.Figure 7 shows the variation of the electron and proton energyfluxes along the spacecraft orbit. The electron flux reaches 35 ergscm�2 s�1 at 1451:35 UT. The maximum proton energy flux of�0.6 erg cm�2 s�1 occurred at 1450:20 UT, that is, �75 s before
Figure 7. Time variation of the electron and proton energy fluxes measured by the detectors on board the DMSPF15 satellite on December 3, 2000.
Figure 8. Comparison of the simulated smoothed SI12 count rate based on the DMSP F15 proton energy spectra(solid line) with the corresponding SI12 signal (dashed line).
GERARD ET AL.: IMAGE LY a AURORA COMPARISON WITH IN SITU MEASUREMENTS 28945
the electron flux peak. This maximum is located at 64�N magneticlatitude (MLAT) and 20:40 MLT. A secondary peak less than �0.1erg cm�2 s�1 observed at 1452:40 UT, poleward of the maximumelectron energy precipitation, is not seen in Figure 7. A substantialfraction of the proton energy is deposited equatorward of theelectron auroral precipitation.Figure 8 shows the intensity variation along the DMSP satellite
footprint extracted from the SI12 images between 1449 and 1454UT following the procedure described before. For comparison, thepredicted SI12 count rate is also shown, following smoothing over100 s. The overall agreement between the calculated and observedcount rate is excellent. The model calculation of the SI12 signalshows a peak at 1450:55 UT, �24 s after (and 0.3� poleward of )the calculated maximum count rate. The ion energy spectra
indicate that from 1449:40 to 1450:40 UT the proton averageenergy exceeded 15 keV, and a fraction of the proton energy fluxwas carried by protons with energies in excess of the 20-keVdetector limit. However, as seen in Figure 2, the efficiency of thesehigh-energy protons makes only a relatively small contribution tothe observed SI12 count rate. It was not accounted for here.
5. Other FUV Emissions
The auroral ionosphere is usually submitted to both electron andproton bombardment. Previous theoretical work has described thecombined effect of electron and proton precipitation on FUVemissions [Strickland et al., 1993; Hubert et al., 2001]. However
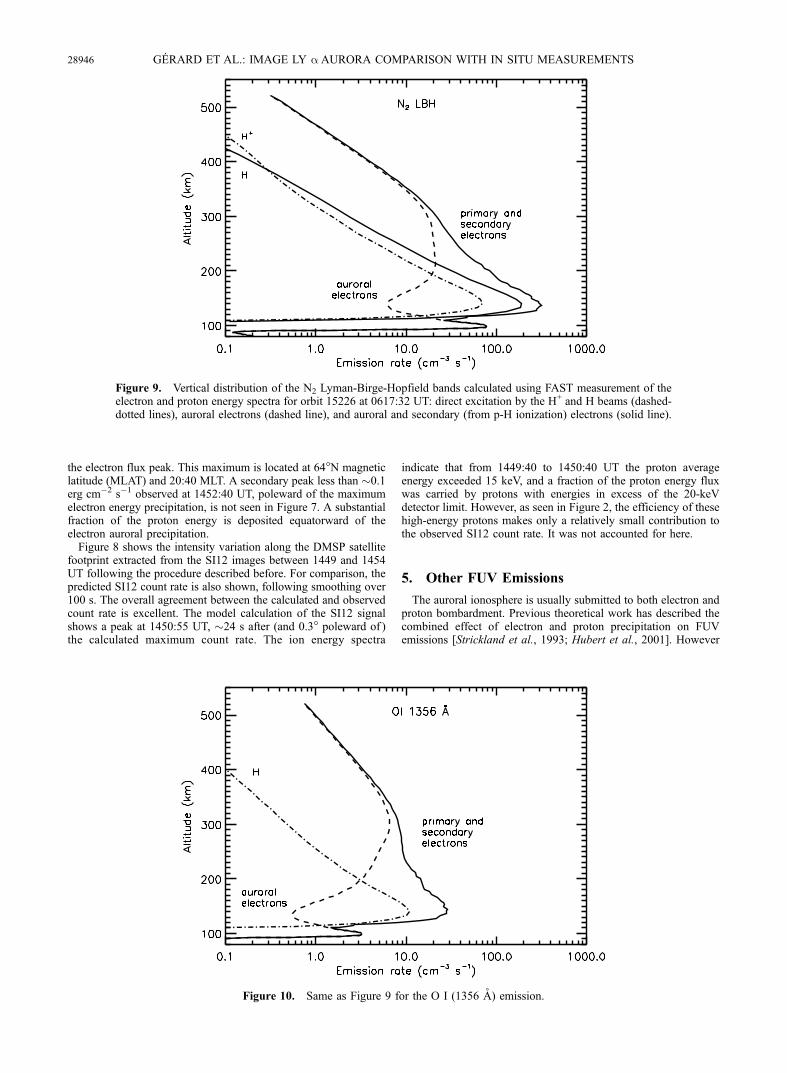
Figure 9. Vertical distribution of the N2 Lyman-Birge-Hopfield bands calculated using FAST measurement of theelectron and proton energy spectra for orbit 15226 at 0617:32 UT: direct excitation by the H+ and H beams (dashed-dotted lines), auroral electrons (dashed line), and auroral and secondary (from p-H ionization) electrons (solid line).
Figure 10. Same as Figure 9 for the O I (1356 A) emission.
28946 GERARD ET AL.: IMAGE LY a AURORA COMPARISON WITH IN SITU MEASUREMENTS
these simulations were based on theoretical energy flux distribu-tions derived from statistical particle precipitation models. Thesecalculations showed that at certain local times and latitudes, FUVemissions may be predominantly excited by protons. We use thesimultaneously measured energy spectra of both electrons andprotons to illustrate this important point. The FAST measurementsalong orbit 15226 described in section 3.1 indicate that protonsdominate the total energy flux at the equatorward boundary of thepremidnight oval (Figure 3).We examine the production of two important FUVemissions also
measured with the IMAGE satellite: the N2 LBH bands and the O I(1356 A) at 0618 UT, the time of the highest proton energy fluxprecipitation. Figure 9 shows the vertical distribution of the LBHproduction rate by primary auroral electrons, proton impact, andfast H atom impact. The primary electrons produce a double-peakedemission rate distribution with a first maximum at 200 km,associated with the soft electron component and the main peak at98 km due to the higher-energy component. The direct contributionof the H+ and H impact shows a single peak at 138 kmassociated with the quasi Maxwellian proton energy distributionmeasured by FAST (Figure 4). The total excitation rate includesthe contributions of the primary auroral electrons, the H+ and Hcomponents, and the secondary electrons generated by theproton and H atom ionizing collisions. Figure 9 shows that atthe main peak the LBH excitation is dominated by the protonprecipitation. More specifically, the secondary electrons due toionization by H-H+ dominate the direct proton contributionwhich, in turn, exceeds the primary electrons component.Similar conclusions for the O I (1356 A) may be drawn fromFigure 10. The main peak at 140 km is dominated by thecontribution of the secondary electrons produced by ionizationdue to proton impact. No direct contribution from collision withprotons are included owing to the lack of experimental crosssection.
6. Discussion and Conclusions
The agreement between the calculated Ly a emission rate andthe SI12 observations may be considered as quite good, consider-ing all sources of uncertainties and errors. These include calibra-tions of both the SI12 camera and the FAST or DMSP detectors,mapping of the footprint of the magnetic field lines using theInternational Geomagnetic Reference Field model, and the space-craft pointing information, uncertainties in the model cross sectionsand in the Mass Spectrometer Incoherent Scatter atmosphericmodel. High-energy protons above the 30-keV limit of the detec-tors on both satellites may also add to the Ly a high-energy linewing and to the SI12 count rate. In addition, it is assumed that noprocess affects the proton isotropy in the loss cone and the protonenergy distribution between the FAST orbit and the region of Ly aemission, that is, �4000 km lower.As mentioned in section 3.2, our one-dimensional approach also
limits the accuracy of evaluation of the beam spreading width andthe line of sight integration. Nevertheless, the agreement obtained inthis comparison validates our modeling approach and the instru-ment calibration. It also confirms the efficiency of the SI12 imageron board IMAGE to remotely probe the proton aurora in aquantitative way. The differences in widths between the protonand the Ly a premidnight ovals may stem from instrumental orphysical reasons. The particle detectors sample a very small volumein comparison with the size of the point spread function of the Ly acamera observing near IMAGE apogee. Also, the detectors sampleonly along the orbital track, whereas SI12 integrated over a two-dimensional area including structures perpendicular to the orbit andthus not observed by FAST or DMSP. Finally, the lateral spreadingof the fast H atoms may exceed the values used for our smoothingfunction. A physical process affecting the proton precipitation in theionosphere between 4000 and 150 km cannot be excluded. Upwardfield-aligned currents have been associated with downstreaming
fluxes of protons which accelerate the ionospheric protons belowthe FAST satellite at 4000 km.We also confirm, on the basis of the two data sets, that the
proton aurora, which is frequently observed equatorward of thepremidnight electron aurora, produces oxygen and N2 FUVemissions in excess of the electron component. It is shown thata complex vertical distribution of emission rate may result fromthe combined electron-proton precipitation. The existence ofdouble-peaked structures as described in section 5 clearly compli-cates the FUV remote-sensing analysis in the absence of simulta-neous particle measurements. In this case, uncertainties in theconversion of instrumental signals into proton precipitated fluxesmay be evaluated on the basis of the table and figures given in thisstudy.The direct comparison between in situ proton fluxes and SI12
was discussed in detail in this study. However, the inverse problemof the determination of the proton flux properties from FUVobservations is more complex. The Doppler-shifted Ly a line isthe only clear signature of energetic proton precipitation. Theauroral protons and their cascades of secondary electrons exciteother FUVemissions, excluding the N2 Lyman-Birge-Hopfield andthe O I (1356 A) features. These emissions are imaged synchro-nously with SI12 by the WIC and SI13 cameras, respectively.However, the three simultaneous images cannot provide the fourunknown quantities fe, Ee, fp and Ep (total energy fluxes andaverage energies of electrons and protons, respectively) and anassumption has to be made on one of them. Protons generally makesmaller contributions than electrons [Hardy et al., 1989]. Thereforea reasonable guess is generally made on the average proton energy.Use of Table 1 and Figure 2 makes it then possible to calculate fp
and to subtract the proton contribution from the WIC and SI13signals. It is thus generally not possible to determine the protoncharacteristic energy except in regions dominated by auroral protonprecipitation.
Acknowledgments. J. C. G. is supported by the Belgian National Fundfor Scientific Research (FNRS). This work was funded by the PRODEXprogram of the European Space Agency (ESA), the Belgian Fund forCollective Fundamental Research (grant FRFC 97-2.4569.97), and theRussian Foundation for Basic Research (RFBR grant 99-02-17620).Hiroshi Matsumoto thanks M. Nakamura and R. Fujii for their assistance
in evaluating this paper.
ReferencesBurch, J. L., et al., Views of Earth’s magnetosphere with the IMAGEsatellite, Science, 291, 619, 2001.
Carlson, C. W., R. F. Pfaff, and J. G. Watszin, The Fast Auroral Snapshot(FAST) mission, Geophys. Res. Lett., 25, 2013, 1998.
Davidson, G. T., Expected spatial distribution of low-energy protons pre-cipitated in the auroral zone, J. Geophys. Res., 70, 1061, 1965.
Eather, R. H., Auroral proton precipitation and hydrogen emissions, Rev.Geophys., 5, 207, 1967.
Eather, R. H., and S. B. Mende, Airborne observations of auroral precipita-tion patterns, J. Geophys. Res., 76, 1746, 1971.
Frey, H. U., G. Haerendel, J. H. Clemmons, M. H. Boehm, J. Vogt, O. H.Bauer, D. D. Wallis, L. Blomberg, and H. Luhr, Freja and ground-basedanalysis of inverted-V events, J. Geophys. Res., 103, 4303, 1998.
Frey, H. U., S. B. Mende, C. W. Carlson, J.-C. Gerard, B. Hubert, J. Spann,R. Gladstone, and T. J. Immel, The electron and proton aurora as seen byIMAGE FUV and FAST, Geophys. Res. Lett., 28, 1135, 2001.
Galperin, Y. I., R. A. Kovrazhkin, Y. N. Ponomarev, J. Crasnier, and J. A.Sadaud, Pitch angle distribution of auroral protons, Ann. Geophys., 32,109, 1976.
Germany, G. A., G. K. Parks, M. Brittnacher, J. Cumnock, D. Lummerz-heim, J. F. Spann, L. Chen, P. G. Richards, and F. J. Rich, Remotedetermination of auroral energy characteristics during substorm activity,Geophys. Res. Lett., 24, 995, 1997.
Gerard, J. C., B. Hubert, D. V. Bisikalo, and V. I. Shematovich, A model ofthe Lyman a line profile in the proton aurora, J. Geophys. Res., 105,15,795, 2000.
Gladstone, R. G., et al., Stellar calibration of the WIC and SI imagers andthe GEO photometer on IMAGE/FUV, Eos Trans. AGU, 81(48), SM72A-06, 2000.
GERARD ET AL.: IMAGE LY a AURORA COMPARISON WITH IN SITU MEASUREMENTS 28947

Hardy, D. A., M. S. Gussenhoven, and D. Brautigam, A statistical model ofauroral ion precipitation, J. Geophys. Res., 94, 370, 1989.
Hubert, B., J.-C. Gerard, D. V. Bisikalo, V. I. Shematovich, and S. C.Solomon, The role of proton precipitation in the excitation of auroralFUV emissions, J. Geophys. Res., 106, 2001.
Ishimoto, M., C. I. Meng, G. R. Romick, and R. E. Huffman, Doppler shiftof auroral Lyman a observed from a satellite, Geophys. Res. Lett., 16,143, 1989.
Kauristie, K., J. Weygand, T. I. Pulkkinen, J. S. Murphree, and P. T. Newell,Size of the auroral oval: UVovals and precipitation boundaries compared,J. Geophys. Res., 104, 2321, 1999.
Kozelov, B. V., and V. E. Ivanov, Monte-Carlo calculation of proton-hydro-gen atom transport in N2, Planet. Space Sci., 40, 1503, 1992.
Lorentzen, D. A., F. Sigernes, and C. S. Deehr, Modeling and observationsof dayside auroral hydrogen emission Doppler profiles, J. Geophys. Res.,103, 17,479, 1998.
Marov, M. Y., V. I. Shematovich, D. V. Bisikalo, and J.-C. Gerard, None-quilibrium Processes in Planetary and Cometary Atmospheres: Theoryand Applications, Kluwer Acad., Norwell, Mass., 1997.
Mende, S. B., et al., Far ultraviolet imaging from the IMAGE spacecraft, 1,System design, Space Sci. Rev., 91, 243, 2000a.
Mende, S. B., et al., Far ultraviolet imaging from the IMAGE spacecraft, 3,Spectral imaging of Lyman alpha and OI 135.6 nm, Space Sci. Rev., 91,287, 2000b.
Mende, S. B., H. U. Frey, M. Lampton, J.-C. Gerard, B. Hubert, S. Fuselier,G. R. Gladstone, and J. L. Burch, Global observations of protonand electron auroras in a substorm, Geophys. Res. Lett., 28, 1139,2001.
Montbriand, L. E., The proton aurora and auroral substorm, in RadiatingAtmosphere, edited by B. M. McCormac, p. 366, D. Reidel, Norwell,Mass., 1971.
Samson, J. C., L. R. Lyon, P. T. Newell, F. Creutzberg, and B. Xu, Protonaurora and substorm intensification, Geophys. Res. Lett., 19, 2167,1992.
Shematovich, V. I., D. V. Bisikalo, and J.-C. Gerard, A kinetic model of the
formation of the hot oxygen geocorona, 1, Quiet geomagnetic conditions,J. Geophys. Res., 99, 217, 1994.
Soraas, F., K. Maseide, P. Turheim, and K. Aarsnes, Doppler-shifted auroralHb emission: A comparison between observations and calculation, Ann.Geophys., 12, 1052, 1994.
Strickland, D. J., R. E. Daniell, Jr., J. R. Jasperse, and B. Basu, Transport-theoretic model for the electron-proton-hydrogen atom aurora, 2, Modelresults, J. Geophys. Res., 98, 21,533, 1993.
Synnes, S. A., F. Soraas, and J. P. Hansen, Monte-Carlo simulations ofproton aurora, J. Atmos. Sol.-Terr. Phys., 60, 1695, 1998.
Vallance-Jones, A., F. Creutzberg, R. L. Gattinger, and F. A. Harris, Auroralstudies with a chain of meridian scanning photometers, 1, Observationsof proton and electron aurora in magnetospheric substorms, J. Geophys.Res., 87, 4489, 1982.
�����������D. V. Bisikalo and V. I. Shematovich, Institute of Astronomy, Russian
Academy of Sciences, 48 Pjatnistkaja Street, Moscow, Russia. ([email protected], [email protected])C. W. Carlson, H. Frey, and S. Mende, Space Sciences Laboratory,
University of California, Centennial Drive at Grizzly Peak Boulevard,Berkeley, CA 94720-7450, USA. ([email protected]; [email protected]; [email protected])J.-C. Gerard, B. Hubert, and M. Meurant, Laboratoire de Physique
Atmospherique et Planetaire, Institut d’Astrophysique et de Geophysique, 5avenue de Cointe, B-4000 Liege, Belgium. ([email protected];[email protected])G. R. Gladstone, Southwest Research Institute, 6220 Culebra Road, San
Antonio, TX 78228-0510, USA. ([email protected])
(Received March 3, 2001; revised August 9, 2001;accepted August 9, 2001.)
28948 GERARD ET AL.: IMAGE LY a AURORA COMPARISON WITH IN SITU MEASUREMENTS