The Eighteenth Century: An Age of Enlightenment - Auburn ...
Upload
khangminh22Category
view
0download
0
li
A ;-Z-Z

SUMMARY AND CONCLUSIONS
The primary objectives of this study were to determine theconsumption statistics of fish by species, the seasonality ofdemand and supply, the price-size relationship of fish, and theeconomic impact of rice-fish culture in Central Luzon.
The market study indicated that the quantity and qualityof fish available in the region varied widely between provinces.The overall quantity of fish available in 1977 wasapproximately 81,716 tons (metric), slightly higher than thearea's 1976 reported production. Annual per capita consump-tion was 18.9 kilograms, which approximated previousestimates.
Fish were more readily available in areas close to sources ofsupply, and these areas had greatest sales. Bulacan andPampanga provinces, regions with coastal areas and widefishpond areas, reported the most sales. Both quantity andquality declined noticeably as fish moved inland from thecoastal provinces. Fish in the inland provinces of Nueva Ecijaand Tarlac were poor in quality, yet the prices werecomparable to those in the coastal provinces. If alternativeswere available, the quality of marine fish in the inlandprovinces would be unacceptable.
Interprovincial shipments of fish occurred in CentralLuzon. However, substantial quantities of fish were importedfrom outside the region. Bataan essentially produced all thefish sold in the province. Zambales had near equality betweenfish production and fish availability. The present studyidentified an inflow of low quality marine fish into the regionand an outflow of high quality marine and freshwater fish tothe greater Manila area.
Although supply variations were obvious, it was difficult todetermine which species of fish were low or high in supply atdifferent times of the year. Within-month variations in somespecies appeared to be greater than seasonal variations.Insufficient supply of fish was most noticeable duringDecember, January, and February.
More than 50 percent of the fish sold weighed 100 grams orless, the size range postulated for rice-fish culture. While pricedifferentials existed between species of fish, there was morevariation in prices between different sizes of fish of the sametype.
Study of the economic feasibility of rice-fish culture in theregion indicated that net returns of P2,870.00 ($283.00) perhectare can be expected. Rice production is the main source ofincome of farmers in Central Luzon, and there is not asufficient incentive to shift rice production. Therefore, fishproduction would be secondary to rice production in arice-fish culture system. Fish grown simultaneously with ricedo not decrease rice yield. Thus, fish will serve as an additionalsource of income. Nevertheless, the present marketing systemwill create impediments for the sale of fish from rice paddies.
CONTENTS
PageSUMMARY AND CONCLUSIONS.................................................................... 2GENERAL BACKGROUND OF STUDY............................................................ 3
Previous R esearch .............................................................................. 3Basic Facts About Central Luzon .................................................... 4Fish M arketing in Central Luzon .................................................... 5
M ETHODOLOGY .......................................................................................... 6Selection of Sample.............................................-------------------------------6Classification of Fish Types.............................................................. 6Information Obtained ............................................------------------------------ 7D ata A nalysis........................................................................................7
RESULTS AND DISCUSSION.......................................................................... 7Fish Availability in Central Luzon ...................---------------------........................ 7Price and Sales Trends-------------- ......................................---------------...................... 9Projected Demand for Fish in Central Luzon ............................ 12
ECONOMIC FEASIBILITY OF RICE-FISH CULTURE------------------ ..................................-12Description of Rice-Fish Culture Methods-------------- ..................................-13Labor Requirements .........................................------------------------------... 13The Enterprise Budget .........................................----------------------------... 14Economic Impact...........................................--------------------------------...15
LITERATURE CITED.........................................-------------------------------------------17
A PPENDIX A .............................................................................................. 18Sam ple M arkets ................................................................................ 18
APPENDIX B ..................................--------------------------------------- 18APPENDIX C........................................--------------------------------------...20
Estimation Procedure ...................................-----------------------------.... 20APPENDIX D ..................................................--------------------------------------..... 20
Questionnaire Used in Study .......................................................... 20
PUBLISHED 3/79-1M
COVER PHOTO. Fish vendors in small markets sometimes operateoutside of the physical market structure.
Information contained herein is available to all without regardto race, color, or national origin.

Fish Marketing in Central Luzon, Philippines*
R. C. SEVILLEJA and E. W. McCOY**
ONE OF THE IMPORTANT problems facing the Philip-pines is the need for increased food production to meetdemands of the country's fast-growing population. Consump-tion of food exceeds the total annual supply from domesticsources. In terms of per capita consumption, Filipinos eatfood at a rate below the standard nutritional requirement (25).
Filipinos are generally rice- and fish-eating people. Thegovernment, in efforts to increase domestic food supply, hasinstituted several programs to boost production in the rice andfish industries. One of these is the Masagana 99 program,which was launched to help the many small rice farmers whodominate the industry. Coupled with this was a massiveinfrastructure development program that included roadbuilding and construction of irrigation facilities. The recentlycompleted Pantabangan Dam is expected to provideyear-round irrigation service to 500,000 hectares of rice farmsin Central Luzon by 1985 (30).
The government also launched positive measures gearedtowards the further development and exploitation of itsfishery and aquatic resources. Among the measures taken weredevelopment of deep-sea fishing, fishpond expansion, technicalassistance to fishermen, development of fishery resource-basedcottage industries, fish-stocking programs to replenish thestock of depleted lakes and rivers, and a vigorous campaignagainst illegal fishing, over-exploitation, and pollution(8,14,20).
Renewed interest in freshwater fish production has beengenerated with the resurrection of an ancient fish culturetechnique. A method of culturing fish in rice paddies has beendeveloped by researchers at the Central Luzon StateUniversity. Field trials have shown that substantial quantitiesof fish can be produced without significantly reducing riceyield. Initial results show that a fish harvest of 200 to 300kilograms per hectare can be attained (1,6,9).
This publication is a report of attempts to determine thefish consumption statistics for fish by species, to look into theseasonality of demand and supply, to examine price-size
*This report is derived from the unpublished master of sciencethesis (1978) of R. C. Sevilleja, "Fish Marketing in Central Luzon,Philippines," Auburn University, Auburn, Alabama, and presented as acontributing part of Project AID/ea-180.
**Graduate Research Assistant and Associate Professor, respec-tively, Department of Fisheries and Allied Aquacultures andDepartment of Agricultural Economics and Rural Sociology.
relationship, and to determine the economic impact ofrice-fish culture in Central Luzon. Secondary objectivesincluded determination of seller's perception of price andquantity change over time and size composition of the existingfish supply in the region.
GENERAL.BACKGROUND OF STUDY
The Philippine Government has instituted a long-rangeprogram to accelerate the integrated development of thefisheries industry. According to the Expanded Fish ProductionProgram of the Bureau of Fisheries and Aquatic Resources, thetarget for fish production increases is set at a yearly incrementof 6.6 percent (27).
One problem that besets Philippine fisheries is theinadequate marketing system of the industry (14). Included inthe developmental strategy of the Integrated FisheriesDevelopmental Plan is the improvement of the marketing anddistribution system and development of local and foreignmarkets (8).
Any attempt to improve the industry must be viewed froma total production-marketing context which calls for anin-depth examination of the present marketing system, itscapacity to handle increased volume of production, i.e. itsconduct and performance, or, in short, its efficiency (23).
In general, food production in the Philippines is steadilyincreasing. Domestic production provided most of the foodconsumed in 1974 (16). However, fish importations stillcomprise some 12 percent of the total fish consumption (25).Projected demand for fish products is expected to reach about2 million tons by 1982 (8).
Previous Research
Several studies have been conducted regarding fishmarketing in the Philippines in general. Guerrero and Darrah(11) prepared a comprehensive nationwide marketing reporton milkfish, including detailed descriptions of producer andmiddlemen practices and information about marketingchannels, margins, and geographic flow. A study on projectedmilkfish consumption and production was also done (12).Hopkins (13) did a survey on marketing practices andproblems of municipal fishermen around Panguil Bay inMindanao.
Because of the close proximity of Central Luzon to the

greater Manila area, a considerable amount of fish produced inthe Central Luzon area moved to the greater Manila area.Medina and Guerrero (19) indicated that 71 percent of thetilapia and 67 percent of the carp sold in Manila came fromprovinces in Central Luzon. On the other hand, fish were alsotransported into the region. A study by Navera and Librero(23) of the Navotas Fish Market indicated that about 29percent of the fish from that market were sold in unspecifiednorthern provinces. A report by the Philippine Fish MarketingAuthority (26) also indicated that 20 percent of the portunloadings went outside of metro Manila. Approximately 6.4percent of the total unloadings went to provinces in CentralLuzon. Substantial quantities of smoked and dried fish werealso transported into the region (19,20).
Basic Facts About Central Luzon
Central Luzon is composed of six provinces: Bataan,Bulacan, Nueva Ecija, Pampanga, Tarlac, and Zambales. Theregion has a combined area of about 18,000 square kilometers(5) and an estimated population of 4,321,000, table 1.
TABLE 1. POPULATION IN CENTRAL LUZON, BY PROVINCE, 1977
Province PopulationThousands
Bataan ........ 262Bulacan 1,042Nueva Ecija 940Pampanga -1,032Tarlac 634Zambales 411
TOTAL 4,321
SOURCE: National Census and Statistics Office.
Immediately to the south of the region is the greater Manilaarea with a population exceeding that of Central Luzon. Tothe north is the province of Pangasinan, which has somecoastal areas. Northeast of the region is the inlandmountainous province of Nueva Vizcaya. To the west is theChina Sea, where most of the marine fish are caught, figure 1.
The region derives its fish produce from three principalsources-commercial fishing vessels, municipal (shallow waterinshore) fisheries, and inland fisheries. The provinces ofBataan, Pampanga, and Zambales have coastal areas with bothcommercial and municipal catch. All provinces have some areadevoted to fishponds. The region has a total of 52,307hectares of fishponds, table 2, representing about 30 percentof the national total (4). The largest areas of fishpond cultureare found within the provinces of Bulacan and Pampanga.Most of the fish ponds in Nueva Ecija are eithernon-operational or seasonal (10).
Commercial fishing, fishing done by licensed vessels over 3
TABLE 2. ESTIMATED NUMBER OF FISHERMEN AND AREA OF
FISHPONDS IN CENTRAL LUZON, BY PROVINCE, 1976
Province Number of Area offishermen fishponds
HectaresBataan.... 8,720 3,703Bulacan .......... ............... 4,670 17,256Nueva Ecija 612Pampanga 3,3251 29,545Tarlac 306Zambales 2,361 885
TOTAL- 19,076 52,3071 Partial count.SOURCE: 1976 Statistical Yearbook, Bureau of Fisheries and
Aquatic Resources, Region III.
t of fsh prof thei
0 Philippine
Cl) cv 6
--- NUEVAX- ECIJA4
____11c,
____ 4,3A
- - - -- --- -- - - - IAquatic Resources, Region III.
..,
A .
Lb
A*
LEFT: Small fishermen use motorized dugout canoes (bancas) in their fishing operations. RIGHT: Cast nets are a popular means of fishing.
Brackishwater ponds, swamplands, lakes, rivers, streams,irrigation canals, and rice paddies provide the main sources forthis sector. The chief freshwater areas are found in the Bulacanand Pampanga rivers and Candaba Swamp in Pampangaprovince. The estimated total fish production in Central Luzonaccording to source and province is shown in table 3.
Per capita production of fish for the region was about 17.2kilograms in 1976. Per capita consumption of fish in the areaamounted to 17.0 kilograms according to a 1975 study (28),but dropped to 14.2 kilograms per capita the following year(2).
Central Luzon is called the rice bowl of the Philippines. Itproduces nearly one-quarter of the nation's total rice, butsupplies 40 percent of the rice required by the food deficitareas of the country (15). There are over 300.000 hectares ofirrigated rice land in the region, table 4. Average farm size isslightly less than 3 hectares (16,26).
The region has a type A climate characterized by a long dryseason (about 5 to 6 months) and a pronounced wet seasonduring May to October (15). Most of Central Luzon receivesless than 200 centimeters of rain annually (5). However, farmshaving adequate irrigation facilities can grow two crops of riceannually.
TABLE 4. IiiGATI) ANI) TOTAL RICE ItECTARAGE IN CEN-IIALLizoN, iY PiOVINCE, 1977
Piovince
BataanBulaean
Nueva EcijaPalipanga.Taila.Zamlnales
TfTAL
I rrigated
ltctares14,24081,020
122,14057,80040,00012,470
:127,670
Total
Hectares19,409
123,441251,90080,60096.97524.016
596,341S()tRCI: National Food aw .riculture Council.
Fish Marketing in Central Luzon
There is no systematic marketing of fish products in CentralLuzon. Marketing is carried out entirely by private enterpriseor individual brokers without any administrative policies orgovernmental supervision. The system is characterized by toomany middlemen, large quantities of low-quahty fish sold,extreme fluctuations in supply, and poor and inadequatelanding and unloading facilities in the markets (14,23).
Marketing operations vary in different landing places.Wholesale transactions of fresh fish take place at night orduring the early hours of the morning. The fish are landed onthe beach and sold to brokers or individuals.
There are two main marketing practices used in the region:(1) auction sales, and (2) the "suki" system. When sold byopen bidding or auction through private brokers, thefishermen or brokers have no option but to sell to the highestbidder. In most of the small landing sites, the prevailingauction sales practice is by "whisper bidding" or "secretbidding." Also widely used at small landing sites is a cultural,personal, and financial relationship called "suki" system.Under this arrangement, the fisherman or fish farmer is assuredof a market for fish and assured of credit. In return, thefisherman, wholesaler, or retailer is obligated to transactbusiness only with the individual granting credit. In bothpractices, the honor system of selling without receipts is done.Oftentimes, sales are based on non-economic considerations,such as honesty and integrity of the buyer. The system hasgiven rise to the incidence of bad debts beyond controllableproportions. Under present conditions, however, these twopractices offer the quickest way of disposing of the fish catch.
Fish movement under the present marketing systemindicates that fish pass through many channels before reachingthe final consumer. This means that most of the profits offishing go into the hands of brokers instead of fishermen. It isestimated that more than 80 percent of the profits go tobrokers, leaving less than 20 percent to the fishermen (14).
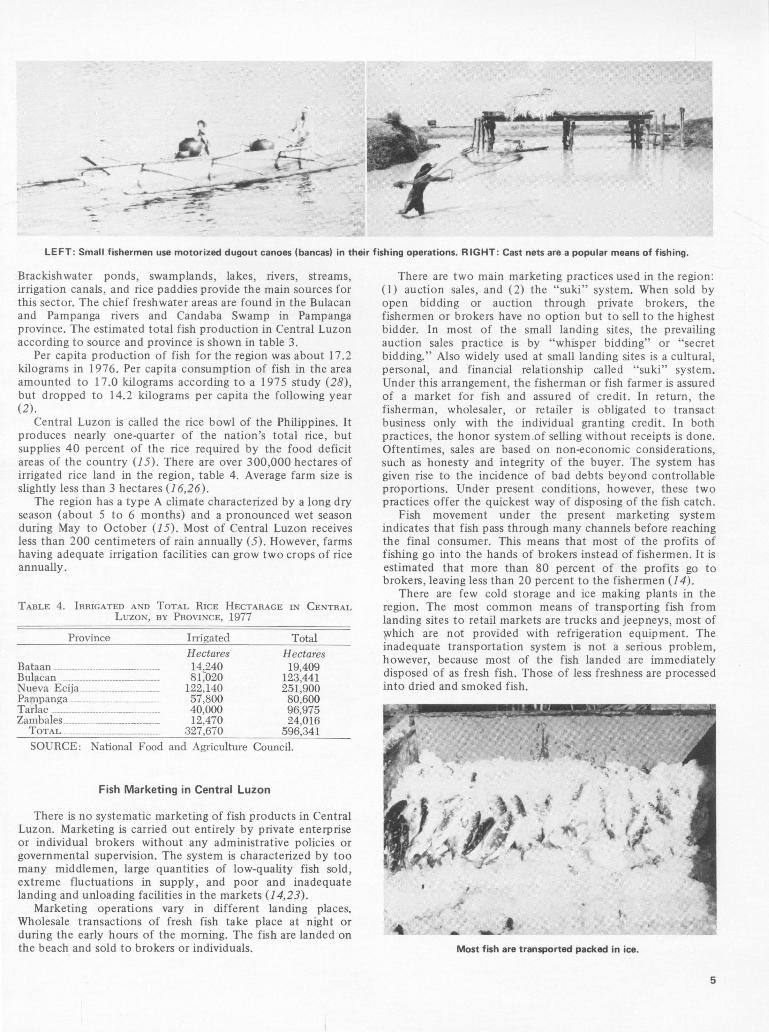
There are few cold storage and ice making plants in theregion. The most common means of transporting fish fromlanding sites to retail markets are trucks and jeepneys, most ofwhich are not provided with refrigeration equipment. Theinadequate transportation system is not a serious problem,however, because most of the fish landed are immediatelydisposed of as fresh fish. Those of less ireshness are processedinto dried and smoked fish.
A
Most fish are transported packed in ice.

r
Among the most popular means of transporting fish to the market are jeepneys and tricycles.
METHODOLOGY
Selection of Sample
Each province in Central Luzon is subdivided intomunicipalities, which are further subdivided into several"barangays." Each municipality has at least one daily marketwhere fish are sold.
The Bureau of Fisheries and Aquatic Resources, Region III,in Central Luzon, provided information on the number ofmarkets and the estimated maximum number of sellers in eachmarket within the region. With these estimates as bases, thesample size was established. For sample sizes less than 1,000,more than 50 percent of the population must be sampled forvalid parameter estimates (17).
Dual sampling was done to serve the purpose of the study.The number of markets to be sampled was established andthe number of sellers in each market was determined. Arandomization procedure was used in the selection of markets.All markets within a province were listed in alphabeticalorder, and a list of random numbers was assigned to the listof markets. Time efficiency was a major factor in completingthe survey because of the geographical location of the munici-palities within the region. Thus, the number of marketsselected was a function of the number of interviewers and theamount of time available to complete the survey.
A separate sampling procedure was established forcollecting a random sample of market sellers. For markets with10 or fewer sellers, all were interviewed. For markets withmore than 10 sellers, but not exceeding 20 in number, 50percent or more of the sellers were interviewed depending onthe number of interviewers assigned to the market. In the caseof markets with 21 to 30 sellers, no less than 10 vendors, butnot more than 50 percent, were sampled. For very largemarkets, 10 percent of the sellers were interviewed. In someinstances all sellers present were interviewed, although thenumber of sellers at other times was reported to be more than10. The sampling procedure was designed to yield 10 percentof the sellers in at least 50 percent of the markets withinCentral Luzon.
There were two kinds of fish sellers in the markets sampled,identified according to the type of stall they used: those whohave permanent stalls and those who occupy temporary placesin the market. Sellers with permanent stalls were arranged in
rows in one section of the physical market structure. Sampleswere selected at intervals of five going clockwise starting froma pre-determined corner of the market and from within a rowindicated by the last digit of the license plate from a randomlyselected passing vehicle. Retailers without permanent stallswere randomly picked since they stay at different places in themarket.
In large markets, sellers occupy tiled permanent stalls with runningwater.
Classification of Fish Types
For survey purposes, the species of fish sold in the marketswere classified into first, second, and third class marine fish;first, second, and third class freshwater fish; crustaceans; andothers. Brackishwater milkfish or "bangus" (Chanos chanos)and mullet or "banak" (Mlugil sp.) were included in first classmarine fish, while tilapia ( Tilapia sp.) from brackishwaterponds were classified as second class freshwater fish. Amongthe more important commercial fishes included in theclassification were mackerel or "alumahan" (Rastrelliger sp.)and snapper or "maya-maya" (Lutianus sp.), which were
Q

classified as first class marine fish. Second class marine fishincluded slipmouth or "sap-sap" (Leiognathus sp.), nemipteridor "besugo" (Nemapterus japonicus), and sardines or"tamban" (Sardinella sp.). The bulk of third class marine fishwas composed of round scad or "galonggong" (Decapterusrusselli), caesio or "dalagang-bukid" (Caesio sp.), and anchovyor "dilis" (Thrissocles sp.). Freshwater species included catfishor "hito" (Clarias macrocephalus and Clarias batrachus),gourami (Trichogaster pectoralis), and carps which wereclassified as first, second, and third class, respectively. Thecomplete classifications are listed in Appendix B.
Information Obtained
The sample sellers were questioned regarding their fishmarketing activities. Information on daily sales and prices,sources of fish, availability of fish, and price differentiationwere obtained following the format of the questionnaire,Appendix D.
Quantities and prices were recorded in kilograms and pesos(P)l per kilogram, respectively. When fish were sold by theunit, string, or pile, weights were estimated in kilograms andprices were converted to pesos per kilogram.
Information on sales and prices the previous year and 5years ago was also obtained to determine sellers' perception ofprice and quantity changes over time. Observations on sanitaryconditions and fish quality were likewise recorded.
Data Analysis
Daily sales data were collected from each sample seller bytype and size of fish. All sales data for a particular provincewere initially aggregated. Average daily sales by province, bytype and size of fish, were computed by dividing the aggregateby the number of sample sellers. Total sales per day werecomputed by multiplying the average daily sales by the averagenumber of dealers per market and the total number of marketsin a particular province.
Price data for individual fish species were combined to forman average price for each particular fish type and size. Averageweighted price was then computed based on the average priceand proportional sales for specific fish types and sizes.
Estimated per capita sales were computed by dividing totalsales by total population for each province. A more detailedexplanation of the procedure followed in data analysis isexplained in Appendix C. Procedures for sampling, datagathering, pre-testing, data handling, and analysis are discussedby McCoy and Hopkins (17).
RESULTS AND DISCUSSION
A total of 724 fish sellers was interviewed in 77 markets inCentral Luzon, table 5. The markets visited varied in size,selling conditions, number of market days, and number ofdays fish was available. In larger markets, sellers occupied tiledpermanent stalls with running water and operated 7 days aweek. Many of the markets visited had fish available daily,with additional sellers present during market days. Others hadfish available only on market days. The physical sellingconditions were generally unsanitary in the smaller markets,and sellers sometimes operated outside the physical marketstructure. The markets sampled are listed in Appendix A andshown by location in figure 2.
S7.50 pesos = $1.00.
Province of Nuevo Vizcoya
Rin IProvince of Pongosinn
0 0
Corregidor Isiall
FIG. 2. Region III, Central Luzon.
TABLE 5. NUMBER OF MARKET AREAS, MARKETS SAMPLEDCJA
TAR LAC
* 0
ZANUMBLER OF RETAILERS AND RETAILERS SAMPLED,PAMBY PROVINCE, CENTANGAL LUZON, 1977
Total Markets Total RetailersProvince markets sampled retailers sampled
No. No. No. No.Bataan 12 9 960 93Bulacan 24 8 792 72
Nueva Ecija 29 20 1,044 160BULACAN
Pampanga ........ 21 15 1,134 145Tarlac------------......17 11 901 106
IeZambales----- -14 14 602 148
TOTAL .117 77 5,433 724
Fish Availability in Central Luzon
Of 2,177 species of fish known to inhabit Philippine waters,only a few more than 100 are of economic value ascommercial fish varieties (25). For purposes of this study, thespecies considered were classified into different groups,according to the listing in Appendix B.
Daily Sales
Daily sales of fish in Central Luzon ranged from about 17.9
tons in Zambales province to approximately 78.3 tons inBulacan province, table 6. The majority of sales in every
province was first class marine fish. Most freshwater fish were
BataanRegion9601)
Bulacangidor8 792n72
sold in the inland provinces of Nueva Ecija, Tarlac, andPampanga, and the bulk of these were tilapia, a second class
fish.
The total quantity of fish available by province is shown in
table 7. Approximately 81,716 tons of fish were available inAE,1977, about 7,000 tons more than the reported 1976 harvest
from the region (3). The distribution of fish availability among
provinces was markedlya different from the distribution of
market sapedrlalrs smpe
Bailysaes----- sh-n---nt-l-Luon-raged1frm9abot017.
Bulacan provice--t----6-The--jorit of4sles7i2ever
Nueva i theinlan- pro-nce-of Neva2EijaTarla1 anPamnpanga, andthe-b---ofthesewere ilap,14 ecod145 s
The iotlhqAvaily ishyavileablbyuponcishonn
tabl 27 Apeximeslyf81sh716wntonhofbithilippevatbers,
1977y aboutw7m000 thnsmo00tantreoenomic aueast
frommtea ivrigo 3Tetist5.Fpribtnossavalabituymong
sprovinescwsdered wrlasiiit different grmtedsribups, o
production, according to the type of fish, table 8.

TABLE 6. DAILY SALES OF FiSiI, By TYPE AND PBOVINCE,CENTRAL LUZON, NOV\ii3E -DE E\IBEB, 1977
Class of Sales by provinceClasasam Ti acZofaefish Bataan Bulacan Nue\a Par- Tarlac Zan/alesEcija __pand.a_
Kg Kg Kg Kg Kg KgMarine
1st2nd3rd
TOTAL
13.383.504.58
21.46Freshwater
Ist 0.2nd 4.3rd 0.
TOTAL 5.Crustaceans 3.Others 4.
TOTAL 7.(GILAND TOI'AL 34.Dealers/i mar-
ket, av. 80No. of markets 12Total sales
per day 32,
0289241534245819
26.132.37
11.8240.32
0.392.711.364.461.082.123.20
47.98
1:3.17 19.612.95 7.977.47 4.68
23.59 32.26
1.7710.370.54
12.681.263.594.85
41.12
.3.434.88:3.64
11.951.284.565.84
50.05
13.223.589.13
25.93
2.276.360.569.190.954.905.85
40.97
16.333.602.40
22.33
0.081.96(.132.170764.435.19
29.69
68 36 54 53 4:324 29 21 17 14
822 78,303 42,929 56,756 36,913 17,873
TABLE 7. TOTAL QUANTITY OF FISH SALES IN CENTRAL LUZON,BY PROVINCE, 1977
Province
BataanBulacanNueva EcijaPanmpanga ....TarlacZambales
TOTAL -......
Classof fish Bataan
Daily sales
Tons
32.878.342.956.736.917.9
265.5
Market (lays
DaysV
306349290301250314
Sales by province
Bulacan NuevaEcija
Tons TonsMarine
1st2nd3rd
Freshwater
1st2nd3rd
Crusta-ceans
OthersTOTAL
3,9281,0271,345
14,8821,3506,732
Pam-panga
Tarlac Zanibales
Tons Tons Tons
3,98589:32,260
6,6872,7181,596
6 222 5:36 1,1691,435 1,544 3,137 1,664
70 755 163 1,241
9801,245
10,036
6151,207
27,327
3811,086
12,441
4361,555
17,066
2,977806
2,056
5111,432
126
2141,1039,225
Tons
3,091682454
15371
25
144839
5,621
Per Capita Availability
Overall per capita fish availability for Central Luzon wasapproximately 18.9 kilograms, table 9. This estimate wassomewhat higher than the quantity reported by NFACconsumption studies and substantially below the amountreported by NORCONSULT (24). As could be expected, areasclose to a supply of fish had greater sales. Bataan, a coastalprovince, had the highest per capita availability, 38.3kilograms. Bulacan province, which has some coastal areas anda large area of fishponds, was next with 26.2 kilograms. NuevaEcija, an inland province, reported the least per capita sales,13.2 kilograms.
Total sales
Tons
10,03627,32712,44117,0669,2255,621
81,716
TOP: Milkfish or "bangus" (Chanos chanos) is the most popular com-mercial fish. BOTTOM: Tilapia comprise most of the freshwater fishsold in the markets.
Zambales, a coastal province, was an exception to thepattern. Sellers indicated a portion of the fish was shipped intothe area. In general, the transshipments were equalized bysales, and the quantity handled by area markets nearly equaledthe quantity harvested in the province. Municipalities inZambales province were isolated from each other by poor roadconditions, thus the number of fishermen, non-market, ordirect -from-fishermen purchases may have been higher in theprovince. Nearly all sellers purchased directly from fishermenor fishermen's wives. No outside province brokers wereencountered in Zambales, and few province brokers wereidentified.
The estimated per capita availability of fish in the region isfar below the 1976 NEDA-BFAR goal of 34.3 kilograms percapita. Even with equalized distribution of the surplus fishfrom Bataan province, per capita availability would still beshort of the goal. If population remains constant, approxi-mately 66,000 and 96,000 tons of additional fish must besupplied to meet the NEDA-BFAR and the integratedFisheries Development Plan goals, respectively.
TABLE 9. POPULATION, EsTIATED SALES AND PER CAPITA SALESIN CENTRAL LUZON, BY PROVINCE, 1977
Province
BataanBulacanNueva EcijaPainpangaTarlacZanbales
TOTAL
Population Estimated Averagesales sales per
capitaThousands Tons Kilograms
262 10,036 38.31,042 27,327 26.2
940 12,441 13.21,0,32 17,066 16.5
634 9,225 1-1.5411 5,621 13.6
4,321 81,716 18.9
TABLE 8. TOTAL QUANTITY OF Fisir SALES, BY TYPE ANDPROVINCE, CENTRAL LUZON, 1977

TABLE 10. SOURCE OF FISH, By TYPE AND PROVINCE, CENTRAL LUZON, 1977
CasBataan Bulacan Nueva Ecija Panipanga Tarlac ZaribalesWP1 WCL OCL WP WCL OCL WP WCL OCL WP WCL OCL WP WCL OCL WP WCL OCLPet. Pct. Pet. Pct. Pct. Pet. Pet. Pct. Pct. Pet. Pet. Pet. Pet. Pet. Pet. Pet. Pet. Pet.
Marine1st--- --- -2nd----- -3rd ------
Freshwater1st ------2nd----- -3rd ------
Crustaceans-Others
977992
10096
10010098
044
00000
3174
04002
588
17
10063757533
1538
9
012252517
2"75474
02500
50
000
865561
034
594151
142517394
415949
020226162
685953
9376948132
1897
5126
1628
143240
21203
40WP within province, WCL- within Central Luzon, and (JUL outside Central Luzon.
000
7844170
50
635455
2232505617
374645
024334433
708276
6720505787
264
10
3380505787
41414
00000
Availability of Fish by Source of Supply
Supply of fish either came from sources within theprovince, within Central Luzon, or from outside the region.No marine fish sources are available in Nueva Ecija and Tarlacprovinces. Sellers reported that of the total first class marinefish sold in these provinces, 41 and 37 percent, respectively,were purchased from sources outside of Central Luzon, table10. The rest were supplied by sources from other provinceswithin Central Luzon, primarily from Guagua in Pampangaand Malolos in Bulacan provinces. In contrast, essentially all ofthe sales in Bataan were from within-province harvest. In addi-tion, approximately 9,000 tons of fish were transported toother provinces.
Most of the freshwater fish were produced within theprovinces, with a substantial quantity coming from inter-provincial shipments. Data from BEAR indicated thatapproximately 308 tons of inland fish were produced in Nueva
Ecija province during 1976 (3). Dealers reported 2,654 tonswere purchased from sources within the province. The BFARstatistics understated actual production by a factor of eight forthe province.
Bataan, Nueva Ecija, and Tarlac provinces represent theextremes in fish marketing in Central Luzon. Bataan had anoversupply of fish while Nueva Ecija and Tarlac imported mostof the fish sold in the area. Zambales, a coastal province likeBataan, has near equality between fish production and fishavailability. Both Bulacan and Pampanga, with limited coastalareas, are net importers of fish. The amount of fish availableby type, source of supply, and province is listed in table 11.
Price and Sales Trends
Several factors were thought to influence prices of fish inCentral Luzon. Among them were size of fish, class, andseason.
TABLE 11. AMOUNT OF Fisi AVAILABLE ACCORDING To LOCATION OF SOURCE, TYPE, AND PROVINCE, CENTRAL LUZON, 1977
Class
Marine1st ---------2nd -------- -3rd --- -- -- --
Freshwater1st-- --------2nd -------- -3rd --- ---- --
Crustaceans----Others------ --TOTAL-------
BataanWP1. WCL OCL TotalTons Tons Tons Tons
3,810 0 118 3,928811 41 175 1,027
1,237 54 54 1 ,345
6 0 0 61,378 0 57 1,435
70 0 0 70980 0 0 980
1,220 0 25 1,2459,512 95 429 10,036
PampangaWP WCL OCL TotalTons Tons Tons Tons
BulacanWP WCL OCLTons Tons Tons
8,632108
1,144
2,232 4018513 729606 4,982
222 0 0973 185 386581 194 0461 154 0398 205 604
12,519 4,089 10,719Tarlac
WP WCL OCLTons Tons Tons
TotalTons
14,8821,3506,732
2221,544
775615
1,20727,327
000
4611,725
990
3692,654
Total WPTons Tons
2,35366
1,153
1,634527
1,107
75 0784 62828 36
149 23243 674
4,949 4,838Zambales
WCL OCLTons Tons
Marine1st ------------------ 4 ,5472nd ----------------- 1,6043rd ---------------- -- 846
Freshwater1st ------------------ 1,0872nd ------------------ 1,2643rd -------------- 1,167
Crustaceans ------------ 353O thers ---------------- 498
TIOTAL -------------- 11,366'WP within province, WCL
1,204244112
936870638
59 23200 200
74 070 13
435 6222,398 3,302=within Central
6,6872,7181,596
1,1691,6641,241
4361,555
17,066
000
39963021
0
1,601Luzon, and OCL
1,876435
1,131
112458
63120188
4,383
1,101371925
0344
4294
3643,241
2,977559
2,1056
5111,432
126214
1,1039,225
outside Central Luzon.
Nueva EcijaWP WCL OCL Total
Tons Tons Tons Tons
3,985893
2,260
5363,137
163381
1,08612,441
2,164559345
107412.582
7303,976.5
8042745
5297
12.562
1091,361.5
TotalTons
3,091682454
15371
25144839
5,621
1239664
00000
283

TABLE 12. AMOUNT OF FISH SOLD, BY TYPE., SIZE, AND PROVINCE, CENTRAL LUZON, 1977
Bataan Bul acanSize group (number per kg) Size group (number per kg)
>1 0 5-9 2-4 < 1 Total >1 0 5-9 2-4 < 1 TotalTons Tons Tons Tons Tons Tons Tons Tons Tons Tons
1,787 672 9621,020 0 7
944 401 0
01,317
16859
1,0727,015
6118
210
321,250
000
12135
1,125Pampanga
50700
00
330
106646
Marine1st--- --- -2nd----- -3rd ------
Freshwater1st--- -- --
'2nd ------3rd
Crustaceans-Others -----
TOTAL----
Marine1st------ -2nd----- -3rd ------
Freshwater1st--- --- -2nd----- -3rd ----- -
Crustaceans -Others_.----
TOTAL
2,4812,672
555
73511142
710402808
95505
2,56146
597
318406387
23742
5,080
1,4440
179
1015
137115
1,882
2010
265
15111
700
599
3,981,0271,345
61,435
70980
1,24510,036
kg)To talTons
6,6872,7181,596
1,1691.6641,241
4361,555
17,06
1,2951,3033,689
10,47747
2,100
0 222990 554167 0443 43637 94
8,524 13,537
3,1100
943
000
12951
4,233Trarlac
000
00
6080
4251,033
14,8821,3506,732
2221,544
775615
1,20727,327
Size group (number per kg)>10 5-9 2-4 <1 TotalTons Tons Tons Tons Tons
1,173771
1,468
2331.395
123206
1,0046,373
1,31935
423
21437
08
992,135
485 00 0
101 64
640300
653
00000
64
2,97806
2,056
5111,432
126214
1,1039,225
Nueva EcijaSize group
>1 0 5-9Tons Tons
1,765714
1,587
3792,742
152288982
8)609
1,734107621
139382
59188
3, 167
(number per
2-4 <1Tons Tons
4827252
181362
16661
Zambales
400
000004
Size group (number per>10 5-9 2-4 <1Tons Tons Tons Tons
1,641621301
836218
139561
3,651
3001689
3971
121546
3562725
4004
47463
7941839
0000
110961
Size Classification
As previously mentioned, the fish species considered forthis study were preclassified into seven groups according to thesystem used by NORCONSULT. However, these classificationswere seldom used by BEAR or the sellers. Fish classificationsnormally indicate buyer preference and size of fish; however,the system used did not indicate these relationships. A qualitystandard scheme was introduced by the Philippine FishMarketing Authority (PEMA) which was not available at thetime the study was made (24). The standards are:Grade I live fishGrade II fish and slightly fresh fish (iced or chilled)Grade III slightly spoiled fishGrade IV unfit for consumption
According to this standard, all fish in Bataan and Zambalesprovinces would be in grades I and I1. Fish in Bulacan andPampanga would be in grades I, II, and III. Over 50 percent of
the fish in Nueva Ecija and Tarlac would be classified in gradesIII and IV. In smaller markets, the proportion of fish in GradeIV would be as high as 50 percent.
There were four size groups considered for this study: (1)10 or more fish per kilogram, (2) 5 to 9 fish per kilogram, (3)2 to 4 fish perkilogram, and (4) 1 or less fish per kilogram.
More than 50 percent of all the fish sold in central Luzonwere less than 100 grams in size, table 12. Sellers from Bulacanprovince reported more fish sales of the second size group(5 to 9 fish per kilogram) than in any other province. InBataan, Nueva Ecija, and Tarlac provinces, approximately 70percent of the fish sold belonged to the first size group.
Price - Size Relationship
Prices were influenced by size and class of fish. Fish pricesin the markets varied more between two sizes of fish in thesame class than between two classes of fish of the same size.For example, in Nueva Ecija province, 100-gram fish sold for
TABLE 13. TOTAL QUANTITY AND AvERAGE PURCHASE PRICE PER KILOGRAM OF FISH SOLDIN NUEvA ECIJA PROVINCE, BY SIZE AND TYPE, 1977
Type of fish>1 Number of fish per kilogramToa>05-9 2-4 <1Toa
Mt. fP/kg m. t. J'/kg mt. ,P/kg Mt. ,P/kg mt. ,P/kgMarine
1st - ------------------------------------- 1,07 7.30 1,765 6.90 493 8.95 41 8.00 4,106 7.352nd--------------------------------- 846 5.50 127 7.90 85 7.00 ---- 1,058 5.903rd --------------------------------- 1,481 5.90 592 9.50 42 8.40 -- 2,115 6.95
Freshwater1st ---------------------------------- 265 7.65 97 7.80 11 6.65 ----- 373 7.652nd --------------------------------- 2,706 5.40 373 6.75 31 3.00 --- 3,110 5.503rd --------------------------------- 115 5.70 5 4.00 4 5.00 ----- 124 5.60
Crustaceans----------------------------- 233 13.90 75 10.20 3 40.00 -- 311 13.25Other ---------------------------------- 1,120 6.60 99 6.40 25 10.65 -- -- 1,244 6.65
TOTAL ------------------------------- 8,573 6.35 3,133 7.50 694 8.55 41 8.00 12,441 6.75
10
Class
Size group (number per>1 0 5-9 2-4 < 1Tons Tons Tons Tons
kg)TotalTons
3,985893
2,260
5363,137
163381
1,085612,44
kg)TotalTons
3,091682454
15371
25144839
5,621
,,
- 7 ---~111

TABLE 14. TOTAL QUANTITY AND AVERAGE PURCHASE PRICE PER KILOGRAM OF FISH SOLD, BY TYPE AND PROVINCE, CENTRAL LUZON, 1977
Class Bataan Bulacan Nueva Ecija Pampanga Tarlac ZambalesAmt. p/kg Amt. n/kg Amt. n/kg Amt. n/kg Amt. n/kg Amt. '/kg
Tons Tons Tons Tons Tons TonsMarine
1st----------------- 3,928 8.35 14,882 6.45 3,985 7.35 6,687 8.05 2,977 7.60 3,091 6.802nd................ 1,027 5.75 1,359 12.40 893 5.90 2,718 7.15 806 5.00 682 5.053rd ------------- 1,345 6.45 6,732 5.45 2,260 6.90 1,596 9.00 2,056 6.20 454 5.50
Freshwater1st -6 5.50 222 9.00 536 7.65 1,169 8.40 511 8.75 15 6.552nd ------------- 1,435 5.90 1,544 3.15 3,137 5.50 1,664 5.25 1,432 4.45 371 4.953rd --------------- . 70 6.00 775 3.90 163 5.60 1,241 5.90 126 4.55 25 5.50
Crustaceans 980 12.10 615 14.75 381 13.15 436 11.65 214 14.25 144 12.05Others ------------ 1,245 7.15 1,207 5.45 1,086 6.65 1,555 6.60 1,103 6.15 839 4.80
TOTAL-------------- 10,036 7.65 27,327 6.35 12,441 6.80 17,066 7.55 9,925 6.60 5,621 6.20
~1.15 per kilogram less than 200-gram fish and P2.20 per available from September through January, while other specieskilogram less than 500-gram fish, table 13. were most abundant during November and December. Within
In general, Nueva Ecija and Tarlac provinces have higher months, variations in some species may be greater thanprices regardless of fish size, table 14. Even more visible is the seasonal variation. For marine species, weather conditionsprice-quality differential between provinces. With movement strongly influence the catch. During the rainy season,inland from the coastal provinces, the quality of fish especially during the months of September and October, a lownoticeably declined. In general, the majority of the fish in supply of capture fish is experienced because of the incidencerural markets in Nueva Ecija and Tarlac would be classified as of storms and general unfavorable conditions for fishing (27).grades III and IV according to PFMAstandards, yet prices for An insufficient supply of fish was most noticeable duringthese fish are comparable or higher than prices for first class December, January, and February. Consequently, thesefish in the coastal markets. Because of the scarcity of high months correspond to the period of highest prices. Severalquality marine fish in Nueva Ecija province, for example, third other factors also influence this situation. Many farmersclass marine fish, mostly round scad ("galonggong"), harvest their fish prior to the rainy months for fear of totalcommand a higher price than freshwater tilapia and carp, loss from floods, which is fairly common. Finally, there iswhich are much better in quality. The average price of fish by stimulated buying during the Christmas season (December andtype, size, and province is listed in table 15. January).
Seasonality of Supply Seller's Perception of Market Changes
The overall variation in supply for all types of fish is listed One of the objectives of this study was to determine thein table 16. In general, certain species of fish were least seller's perception of price and quantity changes over time.
TABLE 15. AVERAGE PRICE OF FISH, BY TYPE, SIZE, AND PROVINCE, CENTRAL LUZON
Bataan Bulacan Nueva Ecija
Class Size group (number per kg) Size group (number per kg) Size group (number per kg)
>10 5-9 2-4 <1 >10 5-9 2-4 <1 >10 5-9 2-4 <1
P P P P P P P PMarine
1st----------------- 7.35 8.30 8.10 12.60 4.65 6.60 6.60 7.30 6.90 8.95 8.002nd 5.70 12.00 12.60 7.00 5.50 7.90 7.00 --3rd 6.20 7.00 .. 4.80 6.35 6.00 5.85 9.50 8.40
Freshwater1st..... 9.00 ... . 7.65 7.80 6.652nd 6.00 5.00 1.80 5.50 .. 5.35 6.75 3.00 --3rd 4.00 6.00 7.00 3.50 4.00 5.70 4.00 5.00
Crustaceans 11.40 17.00 17.00 12.00 8.00 13.90 10.20 40.00Others 6.90 9.00 7.20 9.00 7.70 6.00 1.00 2.50 6.60 6.40 10.65
Pampanga Tarlac ZambalesSize group (number per kg) Size group (number per kg) Size group (number per kg)
>10 5-9 2-4 <1 >10 5-9 2-4 <1 >10 5-9 2-4 <1
Marine1st 7.70 9.10 6.90 7.75 8.40 7.00 7.35 . 6.60 7.90 7.60 6.402nd 7.20 4.00 4.90 7.80 5.00 7.00 6.00 4.503rd 6.20 6.90 6.70 21.00 5.80 7.00 7.50 8.00 5.30 7.15 4.00 4.25
Freshwater1st 8.50 5.50 4.90 8.50 10.45 7.20 7.80 6.00 7.00 7.252nd 4.65 6.55 5.00 7.00 4.50 3.00 4.90 7.003rd 5.90 6.60 4.25 4.00 4.50 6.00 5.70 5.00
Crustaceans 11.55 12.00 14.00 14.10 18.00 .... 12.10 8.00 11.00Others 6.20 7.00 6.00 6.35 3.90 4.60 5.80 5.90 4.45
11

TABLE 16. PROPORTION OF SELLERS REPORTING VARIATIONS IN
SUPPLY OF FISH BY MONTH, CENTRAL LUZON, 1977
Month
JanuaryFebruaryMarchAprilMayJune -------- -J u ly --------------------AugustSeptemberOctoberNovemberDecember
LeastavailablePercent
9866666798
1014
Dealers reporting
Most Insufficientabundant supply
Percent Percent6 141 129 69 66 410 6
9 67 64 87 6
14 818 17
TABLE 17. PROPORTION OF SELLERS RESPONDING YES TO
SELECTED MARKETING QUESTIONS, CENTRAL LUZON, 1977
QuestionBataa
Pet.Does quantity
vary? 95Can you get de-
sired quantity? 70Can you get the
size you want? 36Could you sell more
if available? .... 51
Responding yes, by province
n Bula- Nueva Pam- Tarlaccan Ecija panga
Pct. Pct. Pct. Pct.
Zam-balesPct.
83 78 96 95 93
75 88 51 64 46
41 65 51 36 59
57 62 32 70 51
The sample vendors were asked about their marketingactivities during the previous year and 5 years ago. Generalquestions regarding the availability of fish by size, species,price, and other factors were asked, table 17. Certainanomalies appear in the data. In Nueva Ecija province, forexample, 88 percent of the sellers received the quantitydesired and 65 percent received the size of fish desired;however, 62 percent said they could sell more fish if available.The lower volume sellers said they were unable to financelarger volumes of fish with the brokers. Thus, while they couldsell more fish, the present marketing system entailed too muchrisk for them to increase volume.
The sellers' perception of change over time in Nueva Ecijaprovince indicated an increase in marine and freshwaterspecies, except first class freshwater fish, during the last year,table 18. The total quantity available remained essentially thesame, with shifts in other classifications. Over a 5-year period,only first class freshwater fish decreased in availability.
The prices of fish have not remained constant inrelationship to the change in quantity. Only crustaceans havedecreased in price over the time period. Second classfreshwater fish, primarily tilapia, increased in quantity nearly100 percent; however, price increased nearly 225 percent. Aportion of the increase can be attributed to inflation; however,some portion must be due to an increased awareness in qualityfactors. The freshwater fish in Nueva Ecija are of higherquality than marine species.
Projected Demand for Fish in Central Luzon
Simple projections of market demand in the region werecalculated to provide estimates of the quantities of fish whichconsumers will be willing to purchase within a relatively shorttime. The projections were based on estimated consumption of
fish and expected changes in population. Possible changes inincome were not considered. It was assumed that all otherfactors will remain constant.
An estimated 4,321,000 people lived in Central Luzon in1977. Based on expected growth in population and presenttrend in migration, the population will increase toapproximately 4,889,000 by 1980 and 5,308,000 by 1982.
Based on consumption studies, per capita consumption offish in the region was estimated at 17.0 kilograms. Marketdemand for fish is projected to be 83,113 tons in 1980 and90,236 tons in 1982, table 19.
If the NEDA-BFAR goal of 34.3 kilograms is to be met, anadditional 85,942 and 100,280 tons of fish must be suppliedin 1980 and 1982, respectively, table 20.
ECONOMIC FEASIBILITY OF RICE-FISH CULTURE
For farms with adequate irrigation facilities, two or threecrops of rice can be planted annually. Irrigated land also offersthe option of concurrent production of rice and fish. Thisoption offers potential for Central Luzon, which had over300,000 hectares of irrigated rice land in 1977.
Information on the culture of fish concurrent with rice isstill limited. Experiments at Central Luzon State Universityhave shown that up to approximately 5 tons of rice and 200
TABLE 18. SELLERS' PERCEPTIONS OF QUANTITY AND PRICE
CHANGES AS A PERCENTAGE OF PRESENT, FOR SELECTEDTYPES OF FISH IN NUEVA ECIJA PROVINCE,
CENTRAL LUZON, 1977
Present Change from the presentTypePre Last year 5 years agoQuantity Price/kg
Quantity Price Quantity Price
Tons P Pct. Pct. Pct. Pct.Marine
1st2nd .3rd
3,985893
2,260
7.355.906.90
Freshwater1st 536 7.652nd-------- 3,137 5.503rd 163 5.60
Crustaceans---- 381 13.15Other 1,086 6.65
Total quantity 12,441 tons
1008886
797076
131 8580 8076 10094 126
216 8012,906 tons
774773
422440
200 1650 2622 1080 10072 60
8,676 tons
TABLE 19. PROJECTION OF MARKET DEMAND FOR FISH IN
CENTRAL LUZON IN 1980 AND 1982
PerYear Population capita Estimated Projected Additional
con- supply demand needsumption
Kg Tons Tons Tons1977 --- 4,321,000 17.0 81,716--1980 ... 4,889,000 17.0 83,113 1,3971982 --- 5,308,000 17.0 90,236 8,520
TABLE 20. PROJECTION OF MARKET DEMAND FOR FISH IN
CENTRAL LuzON IN 1980 AND 1982 (BASED ONNEDA-BFAR GOAL)
PerYear Population capita Estimated Projected Additional
con- supply demand needsumption
Kg Tons Tons Tons1977 .. 4,321,000 34.3 81,7161980 --- 4,889,000 34.3 167,693 85,9771982 --- 5,308,000 34.3 182,064 100,348
12

kilograms of fish per hectare can be attained. Little data areavailable from farm results. A conservative estimate ofexpected costs and returns has been derived where neither thehighest nor the lowest values for production and costs wereused.
Description of Rice-Fish Culture Methods
The primary input requirements for rice-fish culture arefingerlings, labor, and a stable water supply. Traditional riceculture practices are followed, except for the use of insecticideand a modified land preparation technique.
It is important to have a paddy soil with high clay contentto ensure minimum water seepage. Dikes are constructedhigher and stronger than the conventional rice paddy dike tokeep morc water without leaking.
Trenches are built along the sides, all around, or across thepaddy. These serve as a refuge for fish when the water gets toolow and as passageways when the fish wish to move around thepaddy. When the water level is lowered during harvest, the fishwill collect in these trenches. This makes recovery of fisheasier. Wire screens at water inlets are needed to prevent theentry of wild fish into the paddy and at water outlets toprevent the escape of cultured fish.
The fish commonly used in rice-fish culture are commoncarp (Cyprinus carpio) and monosex tilapia (Tilapia sp.). Thestocking rate depends on the size and kind of fish used, but
"I INV
- 4
t
500 to 1,000 common carp fingerlings or 3,000 to 5,000tilapia fingerlings per hect are are considered sufficient.
Seedbed preparation and basal and topdressing fertilizer(urea) appilcations should be done without concern for thefish. Weeds can be controlled by mechanical or hand weedingmethods. The use of herbicides such as 2-4D) IPE formulationsdoes not harm the fish.
Depending on the species and kind of fingerlings stocked,the fish will average 100 grams in weight at harvest. Fish arecommonly harvested by draining the rice paddy before riceharvest. Carefully screening the water outlets will prevent fishloss. Should the farmer choose to hold the tubh for a longergrowth period, the fish can be kept in the trenches while therice is being harvested, If there is sufficient water, it ispractical to plant a second rice crop.
Labor Requirements
Total labor required per hectare of rice-fish culture is 76.61man-days, table 2 1. Rice production alone requires an averageof 70.51 man-days (3]). Because of the less effective areadevoted to rice in rice-fish culture, less labor is required forfarm operations common to both rice-fish and rice production.However, the construction of trenches and drainage canals,cleaning and repairing dikes, and stocking and harvesting offish increase labor requirements for rice-fish culture.
Labor costs were computed based on 8 hours per man-dayat r 1. 25 per hour. Total labor costs amount to P766. 10. Costs
- - o
'VTrenches built along the sides of the rice paddy facilitate easier harvesting of fish. They also serve as refuge for fish when the water level gets low.

TABLE 21. LABOR REQUIREMENTS AND VALUE PER HECTARE OFRICE-FISH CULTURE, BY TYPE OF FARM OPERATION,
CENTRAL LUZON
Operation Man-days Value*Pesos
Seedbed preparation:Plowing 2.00 20.00Care of seedlings 7.25 72.50Preparation of seedlings 2.90 29.00
Land preparation:Plowing 2.34 23.40Harrowing 3.42 34.20Construction of trenches
and drainage canals 10.00 100.00Clearing/repairing dikes 4.57 45.70Transplanting 16.87 168.70Stocking -0.63 6.30Fertilizing 1.20 12.00Weeding 2.00 20.00Harvesting
R ice-------------------------- - 16.50 165.00Fish .... 0.83 8.30
Threshing, cleaning, and packaging-- 6.10 61.00TOTAL 76.61 766.10* Based on 8 hours per man-day at 1.25 per hour.
for construction, transplanting, and harvesting account for56.6 percent of the total.
The Enterprise Budget
The example budget, a modification of a rice enterprisebudget, shows little variation from a rice production budget.Yields were based on results of experiments and field trialsconducted at the Central Luzon State University. The kindand amount of inputs were based on generally acceptedcultural and management practices. For a more realistic budgetanalysis, prices should reflect current local prices and generalprice trends. Since the latest information on prices was notavailable, 1975 price quotations were used.
Capital Investment
The example budget was derived for a farm already devotedto rice production, thus some investment in farm building andequipment had been made previously. Additional investment isneeded once the farm is modified for rice-fish culture. Beforeproduction of fish in the same paddy is possible, newinvestment items, such as construction of trenches anddrainage canals, drainage structures, nets, harvesting buckets,and wire screens, are needed. Table 22 has an itemized listingof the investments needed per hectare of rice-fish culture. Thetotal capital requirement is p9,590.00, of which land alonecomprised 83 percent.
Capital items are defined as units which have useful lifelonger than one production period. Such items are divided intotwo groups: depreciable and non-depreciable. Some capitalinvestments, those associated with real property and withoutan estimated life, do not depreciate. Depreciable items have adeterminable life. They include items directly associated withfish production, such as nets, wire screens, and harvestingbuckets. Total capital for depreciable items is p 1,010.00.
Budget analysis requires computation of fixed costsassociated with capital. Depreciation is a technique used tospread the cost of certain capital items over the expecteduseful life of the item (7). In the example budget, alldepreciation was calculated using the straight line method. Theannual depreciation expense is equal to the difference between
TABLE 22. AVERAGE CAPITAL INVESTMENT PER HECTARE OFRICE-FISH CULTURE, CENTRAL LUZON
Item
Non-depreciable items:Land--Construction of trenches
and drainage canals ...Work animalsOther animals
SubtotalDepreciable items:
Drainage structures .....Tractor (hand)PumpTools and equipment ....NetsHarvesting buckets
(banyera) ---Wire screensFarm building
SubtotalTOTAL CAPITAL INVESTMENTCost:
DepreciationInterest on average
capital investment* ...Land taxTOTAL
Yearlife
10151055
55
10
Value Depreciation
Pesos
8,000.00
100.00450.00
30.008,580.00
40.00350.00250.00190.0025.00
50.0030.0075.00
1,010.009,590.00
118.83
628.955.00
752.78
Pesos
4.0023.3325.0038.005.00
10.006.007.50
118.83
* Based on 7 percent of average capital investment, except con-struction.
the cost minus the salvage value divided by the expected usefullife. Salvage value is what the item would be worth at the endof its useful life. It was assumed that all depreciable items havezero salvage value. Total depreciation expense is P 118.83,table 22.
A measurement of average capital is needed when preparinga standard budget analysis without a specified productionperiod. Average capital is the sum of non-depreciable itemsplus one-half of the value of depreciable items (18). Intereston capital investment represents either the amount the farmerwould have to pay if he borrowed the money or the amounthe would give up if he used his own funds. Including land tax,total ownership cost amounted to P752.78.
Cost and Returns
Costs and returns per hectare of rice-fish culture are listedin table 23. The analysis is for one production period only.
Costs are divided into cash and non-cash variable costs,fixed costs, and labor costs. Variable costs are those thatchange according to the specified level of production. Of cashvariable costs of P878.69, fingerling expenses comprise 40percent of the total. Non-cash variable costs include landlordshare of the rice produce, harvester/thresher share, seed,Samahang Nayon contribution, and irrigation fee. A landlord'sshare of the rice harvest usually is based on the amount ofproduction. Under normal harvest conditions, the owner ofthe land expects to receive, on the average, 11 cavans of rice.The harvester/thresher share is 10 percent of the riceproduced. Samahang Nayon contribution is a forced saving bythe farmer to the local cooperative. This is termed as theBarrio Guarantee Fund, which serves as a source of funds topay insurance premiums of farmers, guarantees payment forloans, and capitalization of full-pledged cooperatives (14).
Net returns represent the difference between total costs andtotal returns. On a production basis, P2,869.77 was availablefrom a hectare of rice-fish culture. The system had a 31.95percent return on average capital.
14

TABLE 23. COSTS AND RETURNS PER HECTARE OF
RICE-FISH CULTURETABLE 24. PARTIAL BUDGET FOR TESTING PROFITABILITY OF
INTRODUCING FISH PER HECTARE OF RICE FARM
Item
Receipts:Threshed palay ...Marketable tilapia_
Unit Quantity
cavan 95.00kilograms 200.00
Expenses:I. Variable costs:
A. CashSeed cavanFingerlings(monosex tilapia)---- eachFertilizer ............ bagsInsecticide ---------- quartHerbicide s--------- kilogramsInterest/ fees/ loans ......FoodSamahang Nayon .........Fuel and oil a.......Repairs man-dayTransportation --------------Irrigation fee .......Rent
SubtotalB. Non-cash
Landlord share------ cavanHarvester/thresher
share cavanSeed cavanSamahang Nayon---- cavanIrrigation fee-------- cavan
SubtotalInterest on operating
capital ( 8% ) -------TOTAL VARIABLE COST ....
II. Fixed costs:DepreciationInterest on average
investment (7%except construction) -
Land taxTOTAL FIXED COSTS .......
III. Labor costs:Seedbed preparation
Plowing man-dayCare of seedlings---- man-daySeedling preparation man-day
Land preparationPlowing man-dayHarrowing man-dayConstruction of
trenches anddrainage canals---- man-day
Cleaning/repairing dikes man-dayTransplanting man-dayStocking man-dayFertilizing man-dayWeeding man-dayHarvestingRice ---------------- m an-day
Fish ...... man-dayThreshing, cleaning,
and packaging man-dayTOTAL LABOR COSTS ....
TOTAL EXPENSES
NET RETURNS ---------
PERCENTAGE RETURN ONAVERAGE INVESTMENT__
5,0(
RatePesos
57.506.00
Value
Pesos
5,462.501,200.00
0.40 57.50 23.00
90.00 0.07 350.003.70 64.87 240.021.00 22.40 22.403.75 4.71 17.66
50.0060.00
5.0010.00
1.75 10.00 17.5015.0030.0038.11
878.69
11.00
9.501.000.380.75
2.007.252.90
2.343.42
10.004.57
16.870.631.202.00
16.500.83
6.10
57.50
57.5057.5057.5057.50
10.0010.0010.00
10.0010.00
10.0010.0010.0010.0010.0010.00
10.0010.00
10.00
632.50
546.2557.5021.8543.12
1,301.22
93.942,273.85
Item
1. Additional receiptsa. Marketable tilapia (200 kilograms at p6.00/kg)
2. Reduced costsa. Fertilizer (0.41 bag at f64.87/bag)b. Insecticide (0.74 quart at 22.40/quart) ....c. Herbicide (1.16 kilograms at p4.71/kg)d. Seed (0.15 cavan at t57.50/cavan)e . O th e rs* . . . . . . . . . . . . . . . . . . . . . . . . . . . . . . . .
S u b to tal . . . . . . . . . . . . . . . . . . . . . . . . . . . . . . . .3.
4.
Total creditsAdditional costsa. Labor (6.10 man-days at p10.00/man-day) .b. Fingerlings (5,000 monosex tilapia fingerlings
at (0.07 each) ...c. Drainage structuresd. Netse . W i r e s c r e e n s . ..... .... .... .... ..... .... .... ..... .... ..... .... ..... ...f. Harvesting buckets-_g. Irrigation feeh. Repairs (1.12 man-days at P10.00/man-day)i. Depreciationj. Others
Subtotal
5. Reduced receiptsa. Threshed palay (5 cavans at t57.50/cavan)
Value
Pesos
1,200.00
26.6016.585.468.62
99.47156.73
1,356.73
61.00
350.0040.0025.0080.0050.0011.8511.2013.3828.87
621.30
287.50
6. Total debits 908.807. Change in net income 447.93
* Include landlord's share and harvester/thresher share.
in costs and returns brought about by the introduction of the118.83 new enterprise.
Expected additional receipts from a hectare of rice-fish
628.95 culture come from the expected fish yield of 200 kilograms5.00 valued at P 1,200.00, item 1, table 24. Reduced costs include
752.78 fertilizer, insecticide, herbicide, seed, and others. Theseamount to P 156.73, item 2. This would involve total credits ofr 1,356.73, item 3.
20.00 Additional cost items include labor of 6.10 man-days72.50 valued at P61.00, fingerlings valued at P350.00, and other29.00 items directly related to fish production (nets, wire screens,
23.40 harvesting buckets, irrigation fee, repairs, and depreciation).34.20 Total additional costs amount to P621.30, item 4.
In the culture of fish in rice paddies, the effective areadevoted to rice is slightly lessened. As a result, the rice yield is
100.00 expected to decrease by 5 cavans. Total value of reduced45.70168.70 receipts is p287.50, item 5. The additional costs plus reduced
6.30 receipts amount to P908.80, item 6.12.00 The difference or change in net income is P447.93, item 7.20.00 This indicates that the introduction of fish in a hectare of rice
16 00 farm is profitable.8.30
61.00766.10
3,792.732,869.77
31.95
Partial Budget
The introduction of fish in rice paddies requires several, butminimal, changes in the farm business organization. Thismeans that the farm structure is not entirely revamped. Apartial budget was developed to estimate the possible changes
Economic Impact
Farmers depend largely on rice production as their meansof livelihood. Any consideration of rice-fish culture would beon the basis of fish production being secondary to riceproduction. Although the return from fish will not providesufficient incentive to shift rice production, growing fishsimultaneously with rice does not significantly decrease riceyield. Thus, it will serve as an additional source of income.
The average size farm in Central Luzon is slightly less than3 hectares. With an expected fish yield of 200 kilograms perhectare, the average farm will produce 600 kilograms of fishper rice crop if the entire hectarage is devoted to rice-fishculture.
15

Most rice farms are subdivided into segments, called pad-dies, encompassing about 2,500 square meters or smaller inarea. Due to custom, disease problems, and other factors, therice is planted at the same time. Harvest, then, also occurssimultaneously. Rice is planted and harvested paddy by paddy,with the harvest period extending over a period of 6 weeks to2 months. Under these conditions, the 600 kilograms of fishwould not be simultaneously available, but would becomeavailable in units of 40 to 60 kilograms per week during theharvest period.
Substantial quantities of the fish produced from ricepaddies would undoubtedly be consumed by the farm family.This would improve the diet of the family members, and at thesame time slightly lessen the demand for fish in the localmarkets. In addition, any excess supply of fish could be soldor traded to other farm families, further reducing the demandin local market places.
Marine fish in the inland provinces are not as readilyavailable as in the coastal provinces. More than 50 percent ofthe marine fish available in the inland provinces, especially inNueva Ecija and Tarlac, are poor in quality, yet they sellalmost the same or even higher than those in the coastalprovinces. The fish from the rice paddies can directlysubstitute for the low quality fish now available. Rice fish thenwill serve to fill both a quality and a quantity gap in themarket in rural inland areas.
The adoption of rice-fish culture may be a slow process.While the extension program in the region is well established,the degree of acceptance of the new technology will dependon the degree of conflict with existing systems. The ricemarketing system in Central Luzon is well organized, but fishmarketing is not. At the time of planting, farmers are assuredof a place to sell their rice crop. No certainty exists for the saleof fish.
16

LITERATURE CITED
(1) ARCE, RODOLFO G., E. A. LOPEZ, AND A. C. FERMIN. 1977.Culture of Common Carp and Nile Tilapia at Three Stock-ing Densities. Central Luzon State University, mimeo.
(2) AVIGUETERO, E. F., et al. 1976. Regional Consumption Pat-terns for Major Foods. National Food and Agriculture Coun-cil, 76-27.
(3) BFAR. 1977. 1976 Statistical Yearbook-BFAR Region III.Bureau of Fisheries and Aquatic Resources Region III, SanFernando, Pampanga, Philippines.
(4) . ...... 1975. 1974 Fisheries Statistics of the Philippines.Fishery Economics and Information. Bureau of Fisheries andAquatic Resources, Manila, Philippines.
(5) BURLEY, T. M. 1973. The Philippines, an Economic andSocial Geography. C. Bell and Sons, Ltd., London.
(6) COCHE, A. G. 1967. Fish Culture in Rice Fields, a World-wide Synthesis. Hydrobiologia 30: 1-44.
(7) CRAWFORD, K. W. AND E. W. McCoY. 1977. Budgeting forSelected Aquacultural Enterprises. Auburn Univ. (Ala.) Agr.Exp. Sta. Bull. 495, Auburn, Ala.
(8) FIDC. 1977. Integrated Fisheries Development Plan-Execu-tive Summary. Fisheries Industrial Development Council.
(9) GROVER, J. H. 1976. Rice-Fish Culture and the Green Revo-lution. FAO Technical Conference on Aquaculture. Foodand Agriculture Organization of the United Nations, Rome,Italy.
(10) ---...... 1978. Personal Communication. FishpondSituation in Nueva Ecija. Auburn Univ., Auburn, Ala.
(11) GUERRERO, C. V. AND L. B. DARRAH. 1975. Bangus Mar-keting, 1974. Special Studies Division, Philippines Depart-ment of Agriculture Pub. 75-2.
(12) -, et al. 1974. Bangus: A Look Ahead. Mar-keting Research Unit. NFAC, DANR, Diliman, Quezon City,Philippines.
(13) HOPKINs, M. L. AND E. W. McCoy. 1976. Marketing ofFisheries Products by Municipal Fishermen in Panguil Bay,Philippines. International Center for Aquaculture, AuburnUniv. Fisheries Research and Development Series 11, Au-burn, Ala.
(14) HUANG, H. C. 1974. Feasibility of Fishermen's Cooperativesin the Philippines. Department of Local Governments andCommunity Development, Manila, Philippines.
(15) HUKE, R. E. 1963. Shadows of the Land: an EconomicGeography of the Philippines. Bookmark, Inc., Manila, Phil-ippines.
(16) INTERNATIONAL BANK FOR RECONSTRUCTION AND DEVELOP-
MENT. 1976. The Philippines: Priorities and Prospects forDevelopment. World Bank, Washington, D.C.
(17) McCoy, E. W. AND M. L. HOPKINS. 1978. Method of Con-ducting a Marketing Survey. Manuscript to be published.Department of Agricultural Economics. Auburn Univ. (Ala.)Agr. Exp. Sta., Auburn, Ala.
(18) ------- AND J. E. BOUTWELL. 1977. Preparation ofFinancial Budget for Fish Production, Catfish Production inAreas with Level Land and Adequate Ground Water. Au-burn University (Ala.) Agr. Exp. Sta. Cir. 233, Auburn, Ala.
(19) MEDINA, P. M. AND C. V. GUERRERO. 1976. Retailers' Ex-periences with Tilapia and Carp. National Food and Agri-culture Council, 76-11.
(20) -- - , et. al. 1976. Processing and Marketing ofSmoked Fish, Part I: Central Luzon. National Food andAgriculture Council, 76-2.
(21) NATIONAL CENSUS AND STATISTICS OFFICE. 1974. 1971 Cen-sus of Agriculture (Bataan, Bulacan, Nueva Ecija, Pampanga,Tarlac, Zambales). Manila, Philippines.
(2 2 ) . . . . . . . . . . . . . . . . . . . . . . . . ... . . . . . . . . . . 19 7 4 . C en su s ofPopulation and Housing (Bataan, Bulacan, Nueva Ecija,Pampanga, Tarlac, Zambales). Final Report, Manila, Philip-pines.
(23) NAVERA, E. R. AND A. R. LIBRERO. 1976. The NAFILMA:Market Structure and Marketing Costs and Margins. Insti-tute of Agricultural Development and Administration, UPLB.Staff Paper Series, No. 2.
(24) NORCONSULT. 1975. Philippine Fish Marketing and Dis-tribution Study (7 volumes). Bureau of Fisheries and Aqua-tic Resources, DNR.
(25) PHILIPPINES DEPARTMENT OF COMMERCE AND INDUSTRY.
1966. The Philippines, a Handbook of Economic Facts andGeneral Information, Manila, Philippines.
(26) PFMA. 1976. Fish Marketing News Bulletin. PhilippinesFish Marketing Authority. Vol. 1, No. 1.
(27) PHILIPPINE FISHERIES COMMISSION. 1976. Expanded FishProduction Program, FY 1974-75. Department of Agricul-ture, Manila, Philippines.
(28) SANTOS, C. L., et. al. 1975. Regional Consumption Patternsfor Major Foods. National Food and Agriculture Council,75-28.
(29) VENTURA, RODOLFO F. 1977. Feasibility Analysis of Pro-ducing Bangus, Chanos chanos (Forskal) for a Farm Situa-tion in the Philippines. Unpublished Master's Thesis. Au-burn Univ., Auburn, Ala.
(30) WATER RESOURCE TASK FORCE, PHILIPPINES. 1969. Improv-ing Irrigation Facilities through Groundwater Development.Food and Agricultural Organization of the United Nations,Rome, Italy.
(31) -. 1977. Costsand Returns of Producing Palay in Central Luzon. CentralLuzon State University, Munoz, Nueva Ecija.
17

APPENDIX A
Sample Markets
Provinc4Bataan
e MunicipalityHermosaMarivelesLimayOrionBalangaAbucaySamalOraniDinalupihan
BaliwagMalolos (Atlag)BalagtasBocaueSan IldefonsoPlaridelBulacanSan Miguel
GuimbaRizalCapanTalaveraSan IsidroSan Jose CityCabiaoSta. RosaMuniozCabanatuan CityLlaneraCabaldonLaurJaenCuyapoNampicuanZaragosaTalugtogAliagaBongabong
APPENDIX B
CLASSIFICATION OF SPECIES IN CENTRAL LUZON
Marine
English name I
Freshwat
Local name English name
Grouper lapu-lapu(Epinephelus sp.)
Cavalla talakitok(Caranx sp. )
Mackerel alumahan;hasa-hasa;tangigue
(Rastrelliger sp.)Tuna tuna
(Thunnus thynnus)Snapper maya-maya
( Lutianus sp. )Pompano pompano
(Caranx sp.)Bonito tulingan
(Euthynus yaito )Mullet alugasin, banak
(Mugil sp.)
er Brackishwater
Local name English name Local name
Catfish hito(Glarias macrocephalus)
(Clarias batrachus)Mudfish dalag
(Channa striatus)
millcfish bangus(Chanos chanos)
Continued
18
Retailers6
252270
2701033
24067
5010
60
204020
2623672825343520437430465049524338473855
B ulac an
Nueva Ecija
Class
First class
Sample3
1815101476
119
93
95
1215589
1477
13796
109
159
279444536453
160
ProvincePampanga
Tarlac
Zambales
S.N/GAS.
ASlFB(
S.
S,Bc
S,
S,
S.S
I
Municipality Retailersta. Ana 274lagalang 25vlacabebe 104abalacat 104inalin 54an Simon 104lexico 8Yuagua 210rngeles City 303an Luis 20ipalit 45to. Tomas 10florida Blanca 213acolor 22,andaba 20
7ictoria 18,oncepcion 70,amiling 100)aniqui 30an Clemente 124foncada 78Aayantoc 29ta. Ignacia 54;erona 98,a Paz 50Farlac 65
an Felipe 463otolan 18'abangan 23an Narcisco 57an Antonio 35ubic 60an Marcelino 78ba 20,astillejos 28)longapo 85ta. Cruz 34.andelaria 20alawig 174lasinloc 49
Sample1097
111053
1025
711
69
1012
1451313126897338
24106
1379
148
12101312121356
14148
--~, -~--

CLASSIFICATION OF SPECIES IN CENTRAL LJZON (Continued)
Marine FreshwaterEnglish name Local name English name Local name
Class
Second class
Third class
Others
Brackishwater
English name Local name
Slipmouth sap-sap(Leiognathus sp.)
Nemnipterid besugo(Nemapterus japonicus)
Sardines tamban; tunsoy(Sardinella sp.)
Herring saliniasi; dilat(Dussumiera acuta)
(Dussumiera hasselti)(Ilisha hoeveni)(Ilisha dichoa)
Siganid samaral; malaga(Theutis sp. )
Caesio dalagang-bukid(Caesio sp. )
Round scad galoaggong(Decapterus russelli)
Big-eyed scad matang-baka(Selar boops)
(Selar crernenophthalmus)Anchovy dilis
(Thrissodes sp.)
Lizard fish kalaso(Trachinocephalus myops)
(Saurida tumbil)Sea bass apahap
(Lates calcalifer)Crevalle salay-salay
( Caraux sp. )Halfbeak buguing
(Hemiramphus sp.)Flying fish borador; tirong
(Cypselurus oligolepis)Parrot fish mulmul; loro
(Scarus sp.)Whiting asohos
(Sillago sihama)Surgeon fish labahita; tarian
(Acanthurus bleekei)Stingray page
(Dasystis sp.)Hairtail balila
( Trichiurus haumela)Sword fish espada
(Xiphias gladius)Coat fish saramulyete
( Upensides suiphureus)Striped barracuda torcillo
(Sphyraena obtusata)Porgy (Sparw9 berda)
Cuttle fishesa) squid pusit
(Sepioteuthis lessoniana)(S. sepicidea)
b) octopus nugitaRock fish kubalencorral fishbabayutemabalakitmayobyobkandanganlamok
ShrimpsCrabs
crustaceans
Tilapia tilapia( Tilapia sp. )
Gourami gorami( Trichogaster pectolaris)
White goby biyang-puti; buktu(Glossogobius giurus)
Carp CD karpa(Cyprinus carpic)
(Hypophthalmichthys molitrix)
Theraponid ayungin; babansi(Therapon plumbeus)
19
'"rc~U~

APPENDIX C
Estimation Procedure
The questionnaire used in this study was designed to yieldinformation on each aspect of the marketing activities fromindividual sample sellers, so the data had to be expanded toprovincial level. The sample data gathered were statisticallyvalid and, therefore, are justified estimators or populationparameters.
Estimation methods for this study were done using theprocedure formulated by McCoy (12). Expansion of dailyquantity of fish sold was done using the following formula:
Qt = 1XijXij = Mj(SijXij)
where:Qt = total quantity of fish soldXij = quantity of fish of the ith species sold in the jth
provinceMj = number of markets in the jth provinceSij = number of sellers of the ith species in the jth provinceXij = average quantity sold of the ith species in the jth
province
Estimation of total quantity of fish sold on an annual basiswas done by multiplying the total daily sales by the adjustednumber of market days. The adjustment in the number ofmarket days was necessary to avoid overestimation of thequantity of fish available. In most of the markets surveyed,fish was available every day; however, more sellers werepresent during "market days." In some markets, the quantity
of fish available was essentially the same daily, but in othersfish was available only on "market days." For marketsreporting a large number of sellers, the quantity tends to beoverestimated since sellers not present during the surveytended to handle less fish.
The total number of dealers and the average dealers permarket listed in tables 5 and 6 were representative of thenumbers during market days. The adjusted number of marketdays was computed using this formula:
adjusted number of market days = INiDiDi
where:Ni = number of market days in the ith marketDi = number of dealers in the ith market
Quantity composition of fish available according to specieswas computed based on total daily sales. The average dailyquantity sold for each species was converted as a percentage oftotal daily sales. The amount was then multiplied by theadjusted number of market days to obtain the quantity of fishavailable by species on a yearly basis.
Size composition of the existing supply was determinedbased on the average daily amount of fish sold. The dailyquantity of fish available, according to size for each species,was converted into a percentage. This was quantified into totalkilograms based on the annual amount of fish available forspecies of fish.
APPENDIX D
Questionnaire Used in Study
Fish Marketing SurveyDistrict III, Central Luzon
Retailer Questionnaire
rrovinceMunicipality
Distance to market source by typeType
Marine
BarangayName of MarketDistance to Manila
Source
BrackishwaterFreshwaterHow long have you sold fish?
What type of stall do you use? (check)permanenttemporary
3. How many days per week is the market open?
4. How many days per week is fish available in the market?
5. How many hours per day are fish available?
6. Do you clean the fish for the buyers? If yes, how? (check)scaled _ _
beheadedgutted
Is there a charge for this service? How much?
beheaded and guttedslicedother (specify)
Continued
Interviewer
1.2.
Distance
20
Fish Marketing Survey

Questionnaire, Continued(For questions 7-11, fill in Table 1)
7. What type (s) of fish do you sell? In what form do you sell them?8. About how many kg. of fish do you sell per day during this time of year? (If by piece or pile, interviewer estimates number
of pieces per kilo or number of kilos per pile.)9. Does the type of fish you sell vary by time of year? If yes, when and what type do you sell at other times of
the year?10. Does the quantity you sell of each species vary by time of year? If yes, what and when is the least amount
of each species sold? (When the species is available) What and when is the most amount of each species sold?11. Can you always get the quantity of each species of fish you want to sell? If no, when and what species can
you not get enough of?(For questions 12-17, fill in Table 2)12. What sizes of fish do you sell?13. Do you have any problems getting the sizes of fish you want to sell? If yes, when, what species and what sizes
do you have difficulty in receiving?14. Does the price you pay for fish vary by species and size? If yes, list price in the table.15. Does the price you pay for fish vary by time of year? If yes, list the price and time for both lowest and highest
price in the table.16. Do you often have fish leftover at the end of the day? If yes, which fish? (Check species and size on table)
What do you do with these fish?If no, could you sell more fish if they were available? If yes, what species and sizes would you prefer to have?About how many more kilos of each species can you sell per day?
Species size kg
17. Do you sell any fish to other retailers or ambulent vendors? If yes, how many retailers and vendors do yousell to? How many kilos do you sell to other dealers? (List by size and species on table)
18. Considering only the species and sizes of fish you sell, can you tell me of any changes that have occurred during the last5 years (ask specific headings in Table 3).
19. Where do you get your fish? (List by species in Table 4 - be specific).20. What charges do you have to pay to sell fish here? (List charges by type).
a.b.
21. Are there any changes or improvements you would like to see made in the market? (List down).
Table 1Information on Sales
Period available2 InsufficientSpecies Fr 1 kg or time supply time________________Code Formpieces/day least time most months supply time
kg/day months kg/day months
1 Fresh, dried, smoked, etc.
21

Table 2Species Code (Key to previous table)
Number perkilo
10 or more
No. or kg.
Difficulty
Price
lowest price
time
highest price
time
left over
resale
5-9
No. or kg.
Difficulty
Price
lowest price
time
highest price
time
left over
resale
2-4
No. or kg.
Difficulty
Price
lowest price
time
highest price
time
left over
resale
1 or less
No. or kg. ____
Difficulty ___ ______
22

Table 3Sales Change Over Time
Kilos sold Weekly sales Average price Weekly sales Average priceSpecies' Code last week/ Price paid last year paid per kilo 5 years ago paid per kilo
daily average per kilo daily average last year daily average 5 years ago
1Key number to species sold by vender.
Table 4Source of Fish
Species' Code Dealer Quantity Source Location Transportation
Key number to species sold by vender.
23

Copyright © 2022 FDOKUMEN