Prenatal nutritional supplementation and autism spectrum ...
Upload
independentCategory
view
0download
0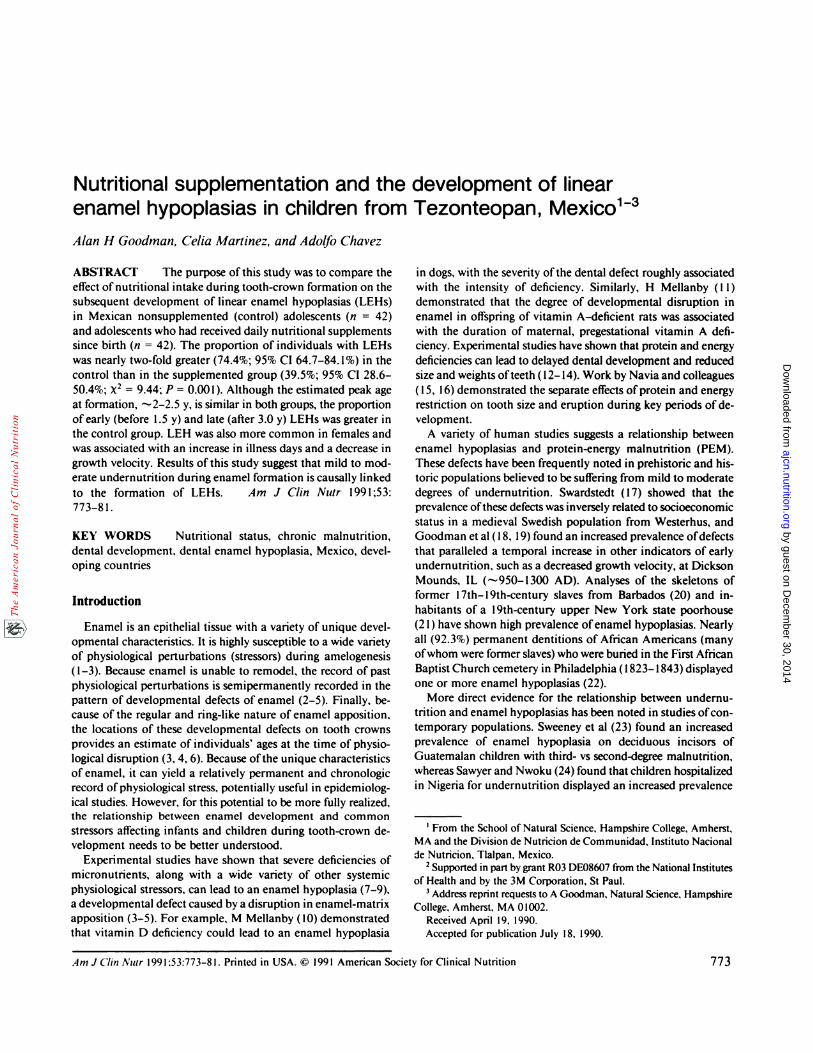
Am J (Yin Nuir 1991:53:773-81. Printed in USA. © 1991 American Society for Clinical Nutrition 773
Nutritional supplementation and the development of linearenamel hypoplasias in children from Tezonteopan, Mexico�3
Alan H Goodman, Celia Martinez, and Adolfo Chavez
ABSTRACT The purpose of this study was to compare the
effect ofnutritional intake during tooth-crown formation on the
subsequent development of linear enamel hypoplasias (LEHs)
in Mexican nonsupplemented (control) adolescents (n = 42)and adolescents who had received daily nutritional supplements
since birth (n = 42). The proportion of individuals with LEHs
was nearly two-fold greater (74.4%; 95% CI 64.7-84. 1%) in the
control than in the supplemented group (39.5%; 95% CI 28.6-50.4%; X2 = 9.44; P = 0.001). Although the estimated peak age
at formation, ‘�2-2.5 y, is similar in both groups, the proportion
ofearly (before 1.5 y) and late (after 3.0 y) LEHs was greater in
the control group. LEH was also more common in females and
was associated with an increase in illness days and a decrease in
growth velocity. Results of this study suggest that mild to mod-
crate undernutrition during enamel formation is causally linked
to the formation of LEHs. Am J Clin Nuir 1991 ;53:
773-81.
KEY WORDS Nutritional status, chronic malnutrition,
dental development, dental enamel hypoplasia, Mexico, devel-
oping countries
Introduction
Enamel is an epithelial tissue with a variety of unique devel-
opmental characteristics. It is highly susceptible to a wide variety
of physiological perturbations (stressors) during amelogenesis
( 1-3). Because enamel is unable to remodel, the record of past
physiological perturbations is semipermanently recorded in the
pattern of developmental defects of enamel (2-5). Finally, be-
cause of the regular and ring-like nature of enamel apposition,
the locations of these developmental defects on tooth crowns
provides an estimate of individuals’ ages at the time of physio-
logical disruption (3, 4, 6). Because ofthe unique characteristics
of enamel, it can yield a relatively permanent and chronologic
record ofphysiological stress, potentially useful in epidemiolog-
ical studies. However, for this potential to be more fully realized,
the relationship between enamel development and common
stressors affecting infants and children during tooth-crown de-
velopment needs to be better understood.
Experimental studies have shown that severe deficiencies of
micronutrients, along with a wide variety of other systemic
physiological stressors, can lead to an enamel hypoplasia (7-9),
a developmental defect caused by a disruption in enamel-matrix
apposition (3-5). For example, M Mellanby (10) demonstrated
that vitamin D deficiency could lead to an enamel hypoplasia
in dogs, with the severity ofthe dental defect roughly associated
with the intensity of deficiency. Similarly, H Mellanby ( 1 1)
demonstrated that the degree of developmental disruption in
enamel in offspring of vitamin A-deficient rats was associated
with the duration of maternal, pregestational vitamin A defi-
ciency. Experimental studies have shown that protein and energy
deficiencies can lead to delayed dental development and reduced
size and weights ofteeth (12-14). Work by Navia and colleagues
(1 5, 16) demonstrated the separate effects of protein and energy
restriction on tooth size and eruption during key periods of de-
velopment.
A variety of human studies suggests a relationship between
enamel hypoplasias and protein-energy malnutrition (PEM).
These defects have been frequently noted in prehistoric and his-
toric populations believed to be suffering from mild to moderate
degrees of undernutrition. Swardstedt (17) showed that the
prevalence ofthese defects was inversely related to socioeconomic
status in a medieval Swedish population from Westerhus, and
Goodman et al ( 1 8, 19) found an increased prevalence of defects
that paralleled a temporal increase in other indicators of early
undernutrition, such as a decreased growth velocity, at Dickson
Mounds, IL (‘-950-1300 AD). Analyses of the skeletons of
former 17th-l9th-century slaves from Barbados (20) and in-
habitants of a 19th-century upper New York state poorhouse
(2 1) have shown high prevalence ofenamel hypoplasias. Nearly
all (92.3%) permanent dentitions of African Americans (many
ofwhom were former slaves) who were buried in the First African
Baptist Church cemetery in Philadelphia (1823-1843) displayed
one or more enamel hypoplasias (22).
More direct evidence for the relationship between undernu-
trition and enamel hypoplasias has been noted in studies of con-
temporary populations. Sweeney et al (23) found an increased
prevalence of enamel hypoplasia on deciduous incisors of
Guatemalan children with third- vs second-degree malnutrition,
whereas Sawyer and Nwoku (24) found that children hospitalized
in Nigeria for undernutrition displayed an increased prevalence
I From the School of Natural Science, Hampshire College, Amherst,MA and the Division de Nutricion de Communidad, Instituto Nacional
de Nutricion, Tlalpan, Mexico.2 Supported in part by grant R03 DEO8607 from the National Institutes
of Health and by the 3M Corporation, St Paul.3 Address reprint requests to A Goodman, Natural Science, Hampshire
College, Amherst, MA 01002.Received April 19, 1990.Accepted for publication July 18, 1990.
by guest on Decem
ber 30, 2014ajcn.nutrition.org
Dow
nloaded from
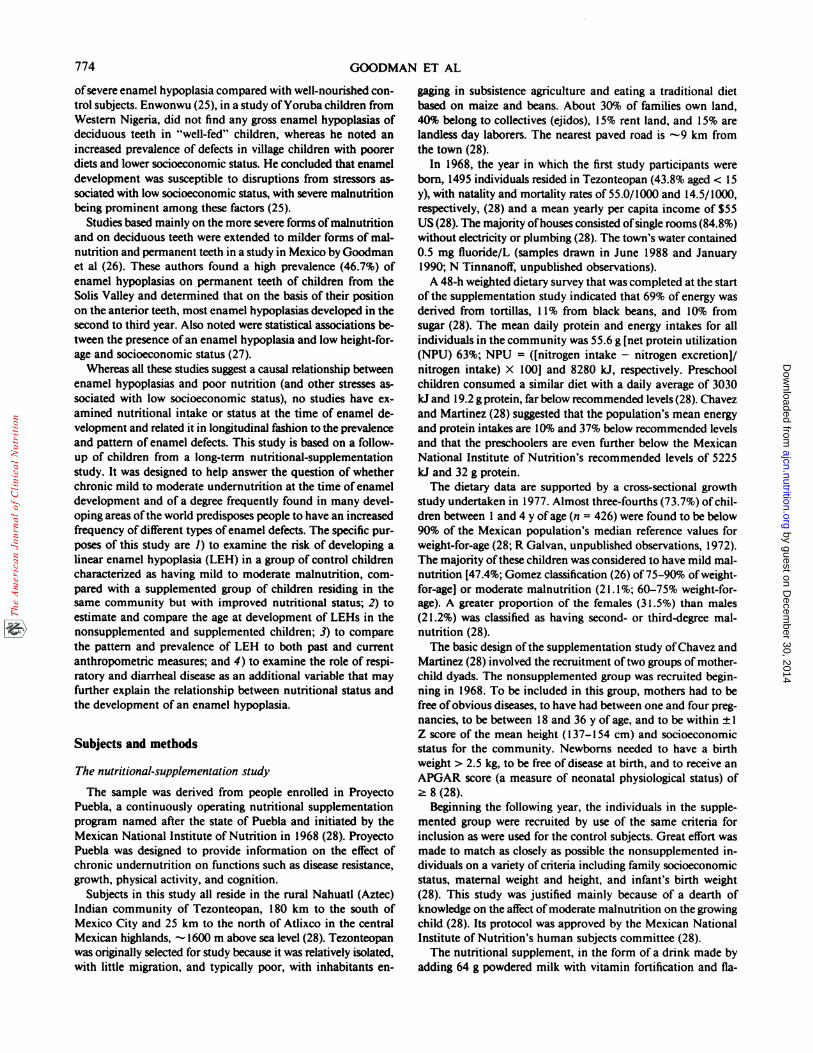
774 GOODMAN ET AL
ofsevere enamel hypoplasia compared with well-nourished con-
trol subjects. Enwonwu (25), in a study ofYoruba children from
Western Nigeria, did not find any gross enamel hypoplasias ofdeciduous teeth in “well-fed” children, whereas he noted an
increased prevalence of defects in village children with poorer
diets and lower socioeconomic status. He concluded that enameldevelopment was susceptible to disruptions from stressors as-
sociated with low socioeconomic status, with severe malnutritionbeing prominent among these factors (25).
Studies based mainly on the more severe forms of malnutrition
and on deciduous teeth were extended to milder forms of mal-nutrition and permanent teeth in a study in Mexico by Goodman
et al (26). These authors found a high prevalence (46.7%) ofenamel hypoplasias on permanent teeth of children from the
Solis Valley and determined that on the basis of their position
on the anterior teeth, most enamel hypoplasias developed in thesecond to third year. Also noted were statistical associations be-tween the presence ofan enamel hypoplasia and low height-for-age and socioeconomic status (27).
Whereas all these studies suggest a causal relationship betweenenamel hypoplasias and poor nutrition (and other stresses as-
sociated with low socioeconomic status), no studies have cx-
amined nutritional intake or status at the time of enamel de-vclopment and related it in longitudinal fashion to the prevalence
and pattern of enamel defects. This study is based on a follow-up of children from a long-term nutritional-supplementation
study. It was designed to help answer the question of whetherchronic mild to moderate undernutrition at the time of enamel
development and of a degree frequently found in many devel-
oping areas ofthe world predisposes people to have an increased
frequency ofdifferent types ofenamel defects. The specific pur-
poses of this study are 1) to examine the risk of developing a
linear enamel hypoplasia (LEH) in a group of control children
characterized as having mild to moderate malnutrition, corn-
pared with a supplemented group of children residing in thesame community but with improved nutritional status; 2) toestimate and compare the age at development of LEHs in the
nonsupplemented and supplemented children; 3) to comparethe pattern and prevalence of LEH to both past and currentanthropometric measures; and 4) to examine the role of respi-ratory and diarrheal disease as an additional variable that mayfurther explain the relationship between nutritional status andthe development of an enamel hypoplasia.
Subjects and methods
The nutritional-supplementation study
The sample was derived from people enrolled in ProyectoPuebla, a continuously operating nutritional supplementationprogram named after the state of Puebla and initiated by theMexican National Institute of Nutrition in 1968 (28). ProyectoPuebla was designed to provide information on the effect ofchronic undernutrition on functions such as disease resistance,
growth, physical activity, and cognition.
Subjects in this study all reside in the rural Nahuatl (Aztec)
Indian community of Tezonteopan, 180 km to the south ofMexico City and 25 km to the north of Atlixco in the central
Mexican highlands, �‘ 1600 m above sea level (28). Tezonteopanwas originally selected for study because it was relatively isolated,
with little migration, and typically poor, with inhabitants en-
gaging in subsistence agriculture and eating a traditional diet
based on maize and beans. About 30% of families own land,
40% belong to collectives (ejidos), 15% rent land, and 15% are
landless day laborers. The nearest paved road is ‘��-9 km from
the town (28).In 1968, the year in which the first study participants were
born, 1495 individuals resided in Tezonteopan (43.8% aged < 15
y), with natality and mortality rates of55.0/1000 and 14.5/1000,respectively, (28) and a mean yearly per capita income of $55
US(28). The majority ofhouses consisted ofsingle rooms (84.8%)
without electricity or plumbing (28). The town’s water contained
0.5 mg fluoride/L (samples drawn in June 1988 and January
1990; N Tinnanoff, unpublished observations).
A 48-h weighted dietary survey that was completed at the startof the supplementation study indicated that 69% of energy wasderived from tortillas, 1 1% from black beans, and 10% from
sugar (28). The mean daily protein and energy intakes for all
individuals in the community was 55.6 g [net protein utilization(NPU) 63%; NPU = ([nitrogen intake - nitrogen excretionj/
nitrogen intake) X lOOJ and 8280 Id, respectively. Preschool
children consumed a similar diet with a daily average of 3030Id and 19.2 g protein, far below recommended levels(28). Chavez
and Martinez (28) suggested that the population’s mean energyand protein intakes are 10% and 37% below recommended levels
and that the preschoolers are even further below the Mexican
National Institute of Nutrition’s recommended levels of 5225
Id and 32 g protein.
The dietary data are supported by a cross-sectional growth
study undertaken in 1977. Almost three-fourths (73.7%) of chil-
dren between 1 and 4 y ofage (n = 426) were found to be below
90% of the Mexican population’s median reference values forweight-for-age (28; R Galvan, unpublished observations, 1972).
The majority ofthesc children was considered to have mild mal-nutrition [47.4%; Gorncz classification (26) of75-90% of weight-
for-age] or moderate malnutrition (2 1 . 1%; 60-75% weight-for-
age). A greater proportion of the females (3 1 .5%) than males(21 .2%) was classified as having second- or third-degree mal-
nutrition (28).
The basic design ofthe supplementation study ofChavez and
Martinez (28) involved the recruitment oftwo groups of mother-
child dyads. The nonsupplemented group was recruited begin-
fling in 1968. To be included in this group, mothers had to befree ofobvious diseases, to have had between one and four preg-nancies, to be between 18 and 36 y of age, and to be within ± I
Z score of the mean height (137-154 cm) and socioeconomicstatus for the community. Newborns needed to have a birth
weight > 2.5 kg, to be free ofdisease at birth, and to receive an
APGAR score (a measure of neonatal physiological status) of
� 8 (28).
Beginning the following year, the individuals in the supple-
mented group were recruited by use of the same criteria forinclusion as were used for the control subjects. Great effort was
made to match as closely as possible the nonsupplemented in-dividuals on a variety ofcritcria including family socioeconomic
status, maternal weight and height, and infant’s birth weight
(28). This study was justified mainly because of a dearth of
knowledge on the affect ofmoderate malnutrition on the growingchild (28). Its protocol was approved by the Mexican National
Institute of Nutrition’s human subjects committee (28).
The nutritional supplement, in the form of a drink made byadding 64 g powdered milk with vitamin fortification and fla-
by guest on Decem
ber 30, 2014ajcn.nutrition.org
Dow
nloaded from
UNDERNUTRITION AND ENAMEL HYPOPLASIAS 775
voring to 180 mL water, was given daily ad libitum after the
first missed menstruation. Supplements were given to the mother
during pregnancy and lactation and, thereafter, to the infant.
The amount consumed was monitored and recorded (28). The
milk was low fat (1.5%) during pregnancy and whole during
lactation (LV Schlaepfer, unpublished observations, 1986). The
supplement contributed a mean extra 9 1 5 Id and 2 1 .6 g protein/
d during pregnancy and 1330 Id and 17.7 g protein/d during
lactation. The vitamin fortification contributed an extra daily
dose of 100 000 IU vitamin A, 20 mg thiamin, 10 mg ribo-
flavin, 200 mg nicotinamide, 100 mg ascorbic acid, and 20 000
IU vitamin D (28; LV Schlaepfer, unpublished observations,
1986).
After ‘-4 mo the supplement was given directly to the child
in the form of a bottle of reconstituted powdered whole milk
(180 mL) and commercial semisolid baby foods. Later, sand-
wiches and glasses of low-fat milk were given to the children
(28). The supplement given directly to the infants and children
roughly contributed an extra 1254 Id and an extra 20 g protein/
d (28; LV Schlaepfer, unpublished observations, 1986). Sup-
plementation has continued into adolescence; however, the
amount consumed has decreased mainly because ofthe inconve-
nience of having to ingest the supplement at the Tezonteopan
clinic.
Previous studies showed that the nutritional supplement had
a profound effect on such things as growth, activity levels, and
percent of days ill (28-3 1 ; LV Schlaepfer, unpublished obser-
vations, 1986). Physical activity was greatly increased in the
supplemented group after the first year of life (28, 29). The in-
cidence of parasitic and diarrheal diseases before 3 y of age was
30% greater in the nonsupplemented group, and the nonsup-
plemented group suffered from nearly twice the number of days
ill because of increased duration of illness (28, 30). Differences
in growth between groups were profound. Height differed by
nearly 10 cm at 2 y of age (28, 3 1 ; LV Schlaepfer, unpublished
observations, 1986).
The dental study
The field recording ofenamel defects was undertaken in June
1988. All available study participants who were aged � 10 y (1
age 15.5 y) came to the clinic for a dental cleaning and exami-
nation for developmental defects of enamel. A total of 84 in-
dividuals were examined, equally divided between the supple-
mented (n = 42; 2 1 male, 2 1 female) and nonsupplemented (n
= 42; 2 1 male, 2 1 female) groups. On the basis of research in
Solis, Mexico (26), we expected a LEH prevalence of �-60% in
the control subjects and determined that a 20% decrease due to
the supplement would be statistically detectible with a statistical-
power measure of �-0.70.
Dental-enamel defects were recorded by type and location on
the labial surfaces of all 12 anterior, permanent teeth. The re-
cording ofdefect type followed the epidemiological standard for
classification of developmental defects of dental enamel (DDE
index) of the Federation Dentaire International (32). Previous
studies in Mexico and elsewhere found this classification method
high reliable (26, 33-35). The recorder was always blind to
whether an individual received nutritional supplements. The
protocol for this dental follow-up study was approved by the
human subject committees of both the Mexican National In-
stitute of Nutrition and Hampshire College.
Five types ofdefects were found: three types ofdental opacities
(demarcated opacities, diffuse opacities with fine lines, and diffuse
opacities without lines) and two types of quantitative defects
[pits-type hypoplasias and horizontal-line, or groove, hypoplasias
(LEHs)J. LEHs were most often thin, horizontal bands of de-
creased enamel thickness, occasionally involving an area of to-
tally missing enamel (combined FDI types 4 and 6). This paper
only concerns LEH-type defects, which have been focused on
the most in previous studies and are most likely to be due to
systemic stressors such as undernutrition (2-4, 17-27).
After identification ofdefect types, all defects were drawn ontoa tooth diagram to reflect their size and location (26). Missing
teeth and areas of incomplete eruption or attrition were also
noted on the tooth diagram. From these data, chronologies of
defects were constructed by developmental ages at formation.
By following the dental-development standard of Massler et al
(36), incisor tooth crowns were divided into equal-width, half-
year-long development zones and canine tooth crowns were di-
vided into equal-width, year-long developmental zones. For cx-
ample, the maxillary central incisor crown, which develops be-
tween birth and age 4.5 y, was divided into nine zones (birth-
0.5 y, 0.5-1.0 y . . . 4.0-4.5 y) starting at the incisal edge
and ending at the cemento-enamel line (26). The methodol-
ogy for estimating the location of a defect on tooth crowns
was shown to be highly repeatable (interobserver agreement
88.9%) in previous studies in Mexico by the same observer
(AHG; 26).Replicas of the upper (maxillary) teeth were made to provide
a permanent record ofthe field observations. Two-stage impres-
sions (casts), involving a base and wash layer, were made with
vinyl polysiloxane. Dental replicas were made with super-hard
resin, poured in four to six layers. Each pour was subject to a
brief (3-5-mm) vacuum to remove bubbles and allowed to
harden over a 24-h period. Reliability of the field assessment of
LEH was estimated by comparison with an assessment by the
same observer (AHG) of 100 randomly selected anterior teeth
(10% sample) from the completed dental casts.
After all dental observations were completed, data were oh-
tamed regarding which subjects were in the supplement and
control groups, and growth and illness data on a subsample were
collected. The growth data include height, weight, and head cir-
cumference at 6-mo intervals from birth to 2 y (n = 22), andheight, weight, and head circumference at the time of dental
study (n = 78). The illness data include the number ofdays ill
per 3-mo period from upper-respiratory and gastrointestinal
(diarrhea.l) illnesses from birth to 6 y (n = 22). Statistical analyses
ofthe prevalence and chronological distribution ofLEHs in the
supplemented and control groups, as well as associations between
LEH and illness and anthropometric measurements, were carried
out by use of SPSS-X software (37).
Because teeth develop during different periods (36) and vary
in their susceptibility to developmental disruption (1, 3, 26, 38),
data are first presented on the prevalence of LEH by tooth be-
tween the supplemented and nonsupplemented groups. Second,
a summarized prevalence of developmental disruption is pre-
sented by combining data from antimeres (contralateral teeth)
and other sets of teeth. Third, the chronology of LEH in the
supplemented and control group is presented and compared for
the maxillary central incisors, the most hypoplastic teeth. Finally,
we present results of analyses of the relationship between
by guest on Decem
ber 30, 2014ajcn.nutrition.org
Dow
nloaded from
776 GOODMAN ET AL
LEH and past and present anthropometric status and past
illnesses.
Results
Reliability
Ofthe 100 buccal tooth surfaces examined on casts, 34 cases
of LEH were observed, compared with an original assessment
of 31 cases of LEH in the field. Twenty-seven times a defect was
recorded in both the field and on the casts, yielding a proportionof specific agreement of 0.83. A LEH was not found in either
the field or on the casts in the remaining 62 cases, yielding anoverall proportion of observed agreement of 0.89 (39). TheKappa statistic (K), a measure of agreement, yielded a value of0.75 (SE of K = 0. 12; Z = 6.25, P < 0.001). Landis and Koch(40) suggest that values > 0.75 represent excellent agreement.
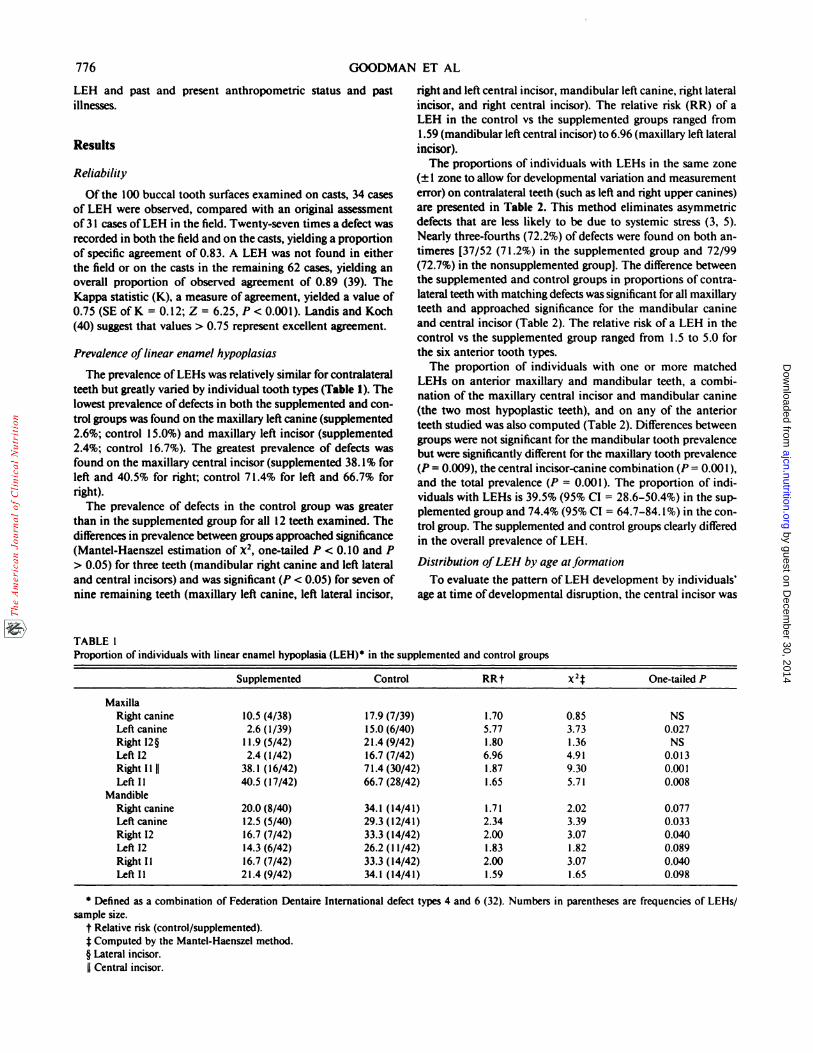
Prevalence oflinear enamel hypoplasias
The prevalence of LEHs was relatively similar for contralateralteeth but greatly varied by individual tooth types (Table I). Thelowest prevalence ofdefects in both the supplemented and con-trol groups was found on the maxillary left canine (supplemented2.6%; control 15.0%) and maxillary left incisor (supplemented
2.4%; control 16.7%). The greatest prevalence of defects was
found on the maxillary central incisor (supplemented 38. 1% forleft and 40.5% for right; control 7 1.4% for left and 66.7% forright).
The prevalence of defects in the control group was greaterthan in the supplemented group for all 12 teeth examined. The
differences in prevalence between groups approached significance
(Mantcl-Haenszel estimation of X2, one-tailed P < 0.10 and P> 0.05) for three teeth (mandibular right canine and left lateraland central incisors) and was significant (P < 0.05) for seven ofnine remaining teeth (maxillary left canine, left lateral incisor,
TABLE 1
right and left central incisor, mandibular left canine, right lateral
incisor, and right central incisor). The relative risk (RR) of aLEH in the control vs the supplemented groups ranged from
1.59 (mandibular left central incisor) to 6.96 (maxillary left lateralincisor).
The proportions of individuals with LEHs in the same zone
(± 1 zone to allow for developmental variation and measurementerror) on contralateral teeth (such as left and right upper canines)are presented in Table 2. This method eliminates asymmetricdefects that are less likely to be due to systemic stress (3, 5).Nearly three-fourths (72.2%) of defects were found on both an-
timeres [37/52 (7 1.2%) in the supplemented group and 72/99
(72.7%) in the nonsupplemented group]. The difference between
the supplemented and control groups in proportions of contra-lateral teeth with matching defects was significant for all maxillary
teeth and approached significance for the mandibular canine
and central incisor (Table 2). The relative risk of a LEH in thecontrol vs the supplemented group ranged from 1.5 to 5.0 forthe six anterior tooth types.
The proportion of individuals with one or more matchedLEHs on anterior maxillary and mandibular teeth, a combi-
nation of the maxillary central incisor and mandibular canine(the two most hypoplastic teeth), and on any of the anteriorteeth studied was also computed (Table 2). Differences between
groups were not significant for the mandibular tooth prevalencebut were significantly different for the maxillary tooth prevalence(P = 0.009), the central incisor-canine combination (P = 0.001),
and the total prevalence (P = 0.001). The proportion of mdi-
viduals with LEHs is 39.5% (95% CI = 28.6-50.4%) in the sup-
plemented group and 74.4% (95% CI = 64.7-84. 1%) in the con-
trol group. The supplemented and control groups clearly differed
in the overall prevalence of LEH.
Distribution oJLEH by age at formation
To evaluate the pattern of LEH development by individuals’age at time ofdevelopmental disruption, the central incisor was
Proportion of individuals wit h linear enamel hypoplasia (LEH) in the supplement ed and control groups
Supplemented Control RRt x2f One-tailed P
MaxillaRight canine 10.5 (4/38) 17.9 (7/39) 1.70 0.85 NSLeft canine 2.6 (1/39) 15.0 (6/40) 5.77 3.73 0.027
RightI2� 11.9(5/42) 21.4(9/42) 1.80 1.36 NS
Left 12 2.4 (1/42) 16.7 (7/42) 6.96 4.91 0.0 13RightIlil 38.1(16/42) 71.4(30/42) 1.87 9.30 0.001
Left Ii 40.5 (17/42) 66.7 (28/42) 1.65 5.71 0.008Mandible
Right canine 20.0 (8/40) 34.1 (14/41) 1.71 2.02 0.077
Left canine 12.5 (5/40) 29.3 (12/41) 2.34 3.39 0.033Right 12 16.7 (7/42) 33.3 (14/42) 2.00 3.07 0.040
Left 12 14.3 (6/42) 26.2 (1 1/42) 1.83 1.82 0.089
Right Ii 16.7 (7/42) 33.3 (14/42) 2.00 3.07 0.040
Left Il 21.4 (9/42) 34.1 (14/41) 1.59 1.65 0.098
* Defined as a combination of Federation Dentaire International defect types 4 and 6 (32). Numbers in parentheses are frequencies of LEHs/
sample size.
t Relative risk (control/supplemented).f Computed by the Mantel-Haenszel method.§ Lateral incisor.
II Central incisor.
by guest on Decem
ber 30, 2014ajcn.nutrition.org
Dow
nloaded from
* Numbers in parentheses are frequencies of LEHs/sample size.
UNDERNUTRITION AND ENAMEL HYPOPLASIAS 777
TABLE 2Proportion of LEHs matched on antimeres and combined for anterior maxillary and anterior mandibular teeth, upper central incisor and
lower canine (CI combination), and all anterior teeth in the supplemented and control groups*
Supplemented Control RR x2 One-tailed P
MaxillaCanine 2.6 (1/38) 15.4 (6/39) 5.92 3.74 0.026
12 2.4 (1/42) 1 1.9 (5/42) 4.96 2.84 0.046Ii 33.3 (14/42) 66.7 (28/42) 2.00 9.22 0.001Total maxilla 36.8 (14/38) 64.1 (25.39) 1.74 5.65 0.009
Mandible
Canine 12.5 (5/40) 26.8 (1 1/41) 2.14 2.59 0.05412 14.3 (6/42) 21.4 (9/42) 1.50 0.72 NS
Ii 16.7(7/42) 31.7(13/41) 1.90 2.54 0.056
Total mandible 20.0 (8/40) 31.7 (13/41) 1.59 1.43 NS
CI combinationt 40.0 (16/40) 73.2 (30/41) 1.83 8.97 0.001Any combination 39.5 (15/38) 74.4 (29/39) 1.88 9.44 0.001
* Numbers in parentheses are frequencies of LEHs/sample size.
t Maxillary central incisors and mandibular canine.
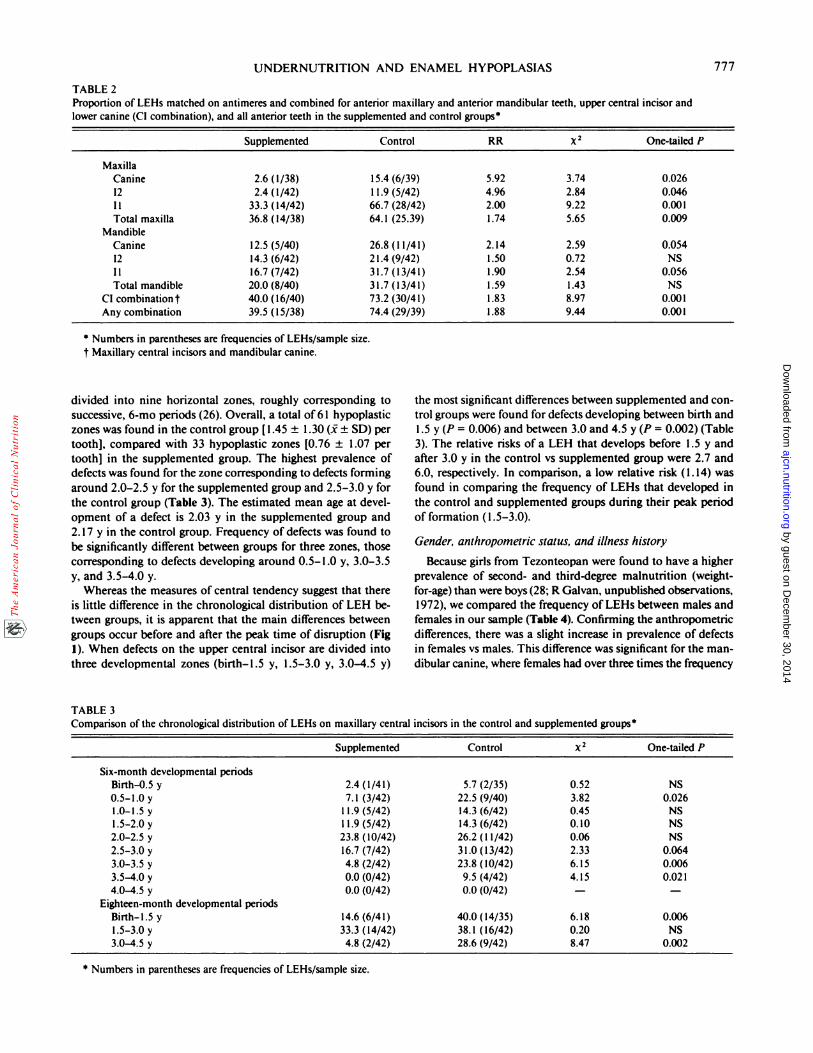
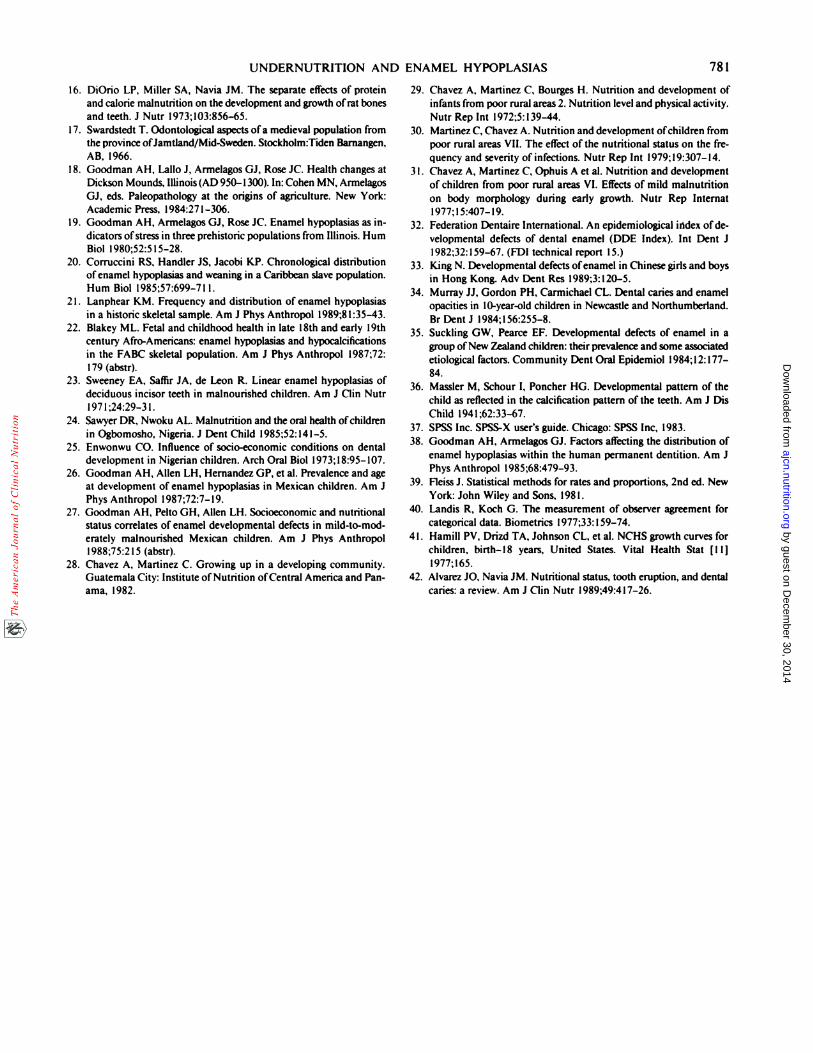
divided into nine horizontal zones, roughly corresponding to the most significant differences between supplemented and con-
successive, 6-mo periods (26). Overall, a total of6 1 hypoplastic trol groups were found for defects developing between birth and
zones was found in the control group [1 .45 ± 1 .30 (1 ± SD) per 1 .5 y (P 0.006) and between 3.0 and 4.5 y (P 0.002) (Table
tooth], compared with 33 hypoplastic zones [0.76 ± 1 .07 per 3). The relative risks of a LEH that develops before 1 .5 y and
tooth] in the supplemented group. The highest prevalence of after 3.0 y in the control vs supplemented group were 2.7 and
defects was found for the zone corresponding to defects forming 6.0, respectively. In comparison, a low relative risk (1 .14) was
around 2.0-2.5 y for the supplemented group and 2.5-3.0 y for found in comparing the frequency of LEHs that developed in
the control group (Table 3). The estimated mean age at devel- the control and supplemented groups during their peak period
opment of a defect is 2.03 y in the supplemented group and of formation (1.5-3.0).
2. 17 y in the control group. Frequency of defects was found to
be significantly different between groups for three zones, those Gender, anthropometric status, and illness history
corresponding to defects developing around 0.5- 1 .0 y, 3.0-3.5 Because girls from Tezonteopan were found to have a higher
y, and 3.5-4.0 y. prevalence of second- and third-degree malnutrition (weight-
Whereas the measures of central tendency suggest that there for-age) than were boys (28; R Galvan, unpublished observations,is little difference in the chronological distribution of LEH be- 1972), we compared the frequency of LEHs between males and
tween groups, it is apparent that the main differences between females in our sample (Table 4). Confirming the anthropometric
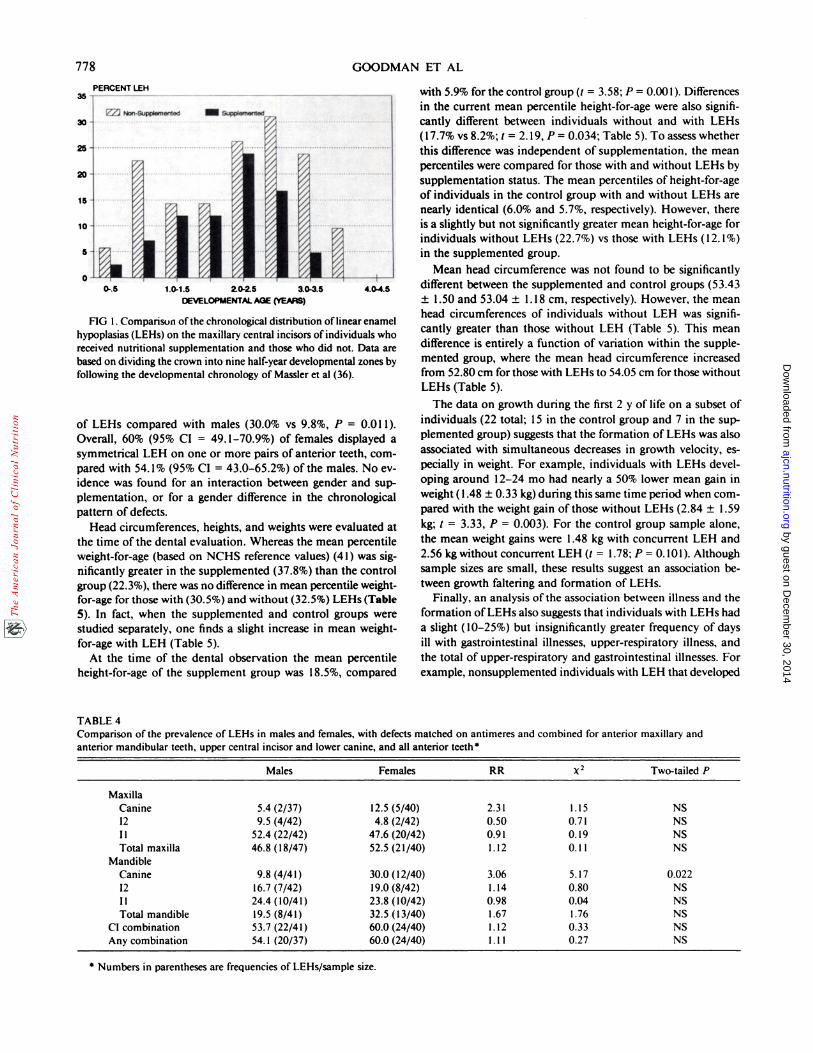
groups occur before and after the peak time of disruption (Fig differences, there was a slight increase in prevalence of defects1). When defects on the upper central incisor are divided into in females vs males. This difference was significant for the man-
three developmental zones (birth-1.5 y, 1.5-3.0 y, 3.0-4.5 y) dibular canine, where females had over three times the frequency
TABLE 3Comparison of the chronological distribution of LEHs on maxillary central incisors in the control and supplemented groups*
Supplemented Control 2 One-tailed P
Six-month developmental periodsBirth-0.5 y 2.4 (1/41) 5.7 (2/35) 0.52 NS
0.5-1.0 y 7.1 (3/42) 22.5 (9/40) 3.82 0.026l.O-l.Sy 11.9(5/42) 14.3(6/42) 0.45 NS
1.5-2.0 y 1 1.9 (5/42) 14.3 (6/42) 0.10 NS2.O-2.Sy 23.8(10/42) 26.2(11/42) 0.06 NS
2.5-3.0 y 16.7 (7/42) 31.0 (13/42) 2.33 0.064
3.0-3.5 y 4.8 (2/42) 23.8 (10/42) 6.15 0.0063.5-4.0 y 0.0 (0/42) 9.5 (4/42) 4.15 0.021
4.0-4.5 y 0.0 (0/42) 0.0 (0/42) - -
Eighteen-month developmental periodsBirth-l.5 y 14.6 (6/41) 40.0 (14/35) 6.18 0.0061.5-3.0 y 33.3 (14/42) 38.1 (16/42) 0.20 NS3.0-4.5 y 4.8 (2/42) 28.6 (9/42) 8.47 0.002
by guest on Decem
ber 30, 2014ajcn.nutrition.org
Dow
nloaded from
1.0.1.5 2.0.2.5 ao.asOEVELOPMENTM.. AGE (YEARS)
778 GOODMAN ET AL
* Numbers in parentheses are frequencies of LEHs/sample size.
PERCENT LEH
FIG 1 . Comparison ofthe chronological distribution oflinear enamel
hypoplasias (LEHs) on the maxillary central incisors ofindividuals whoreceived nutritional supplementation and those who did not. Data are
based on dividing the crown into nine half-year developmental zones by
following the developmental chronology of Massler et al (36).
of LEHs compared with males (30.0% vs 9.8%, P = 0.01 1).
Overall, 60% (95% CI = 49. 1-70.9%) of females displayed a
symmetrical LEH on one or more pairs of anterior teeth, corn-
pared with 54. 1% (95% CI = 43.0-65.2%) of the males. No cv-
idence was found for an interaction between gender and sup-
plementation, or for a gender difference in the chronological
pattern of defects.
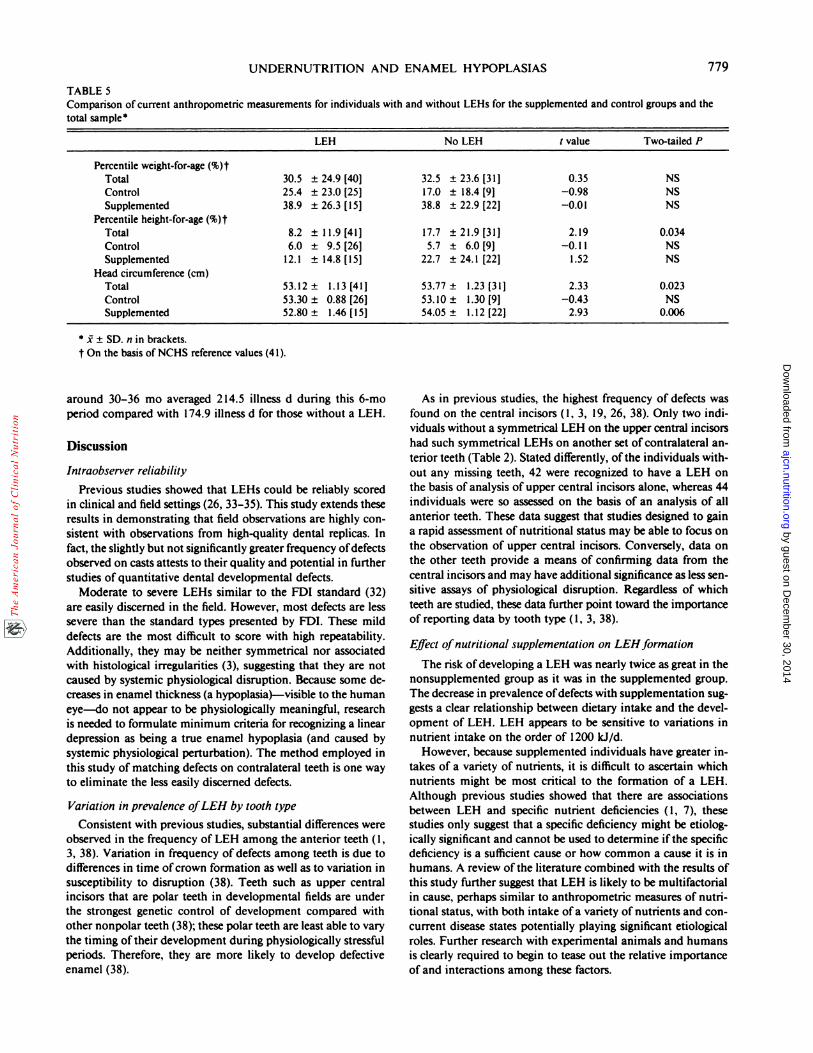
Head circumferences, heights, and weights were evaluated at
the time ofthe dental evaluation. Whereas the mean percentile
weight-for-age (based on NCHS reference values) (41) was sig-
nificantly greater in the supplemented (37.8%) than the control
group (22.3%), there was no difference in mean percentile weight-
for-age for those with (30.5%) and without (32.5%) LEHs (Table
5). In fact, when the supplemented and control groups were
studied separately, one finds a slight increase in mean weight-
for-age with LEH (Table 5).
At the time of the dental observation the mean percentile
height-for-age of the supplement group was 18.5%, compared
TABLE 4
with 5.9% for the control group (t = 3.58; P = 0.001). Differences
in the current mean percentile height-for-age were also signifi-
cantly different between individuals without and with LEHs
(17.7% vs 8.2%; t 2. 19, P = 0.034; Table 5). To assess whether
this difference was independent of supplementation, the mean
percentiles were compared for those with and without LEHs by
supplementation status. The mean percentiles of height-for-age
of individuals in the control group with and without LEHs are
nearly identical (6.0% and 5.7%, respectively). However, there
is a slightly but not significantly greater mean height-for-age for
individuals without LEHs (22.7%) vs those with LEHs (12.1%)
in the supplemented group.
Mean head circumference was not found to be significantly
different between the supplemented and control groups (53.43
± 1.50 and 53.04 ± 1 . 18 cm, respectively). However, the mean
head circumferences of individuals without LEH was signifi-
cantly greater than those without LEH (Table 5). This mean
difference is entirely a function of variation within the supple-
mented group, where the mean head circumference increased
from 52.80 cm for those with LEHs to 54.05 cm for those without
LEHs (Table 5).
The data on growth during the first 2 y of life on a subset of
individuals (22 total; 15 in the control group and 7 in the sup-
plemented group) suggests that the formation of LEHs was also
associated with simultaneous decreases in growth velocity, es-
pecially in weight. For example, individuals with LEHs devel-
oping around 1 2-24 mo had nearly a 50% lower mean gain in
weight (1.48 ± 0.33 kg) during this same time period when corn-
pared with the weight gain ofthose without LEHs (2.84 ± 1.59
kg; t = 3.33, P = 0.003). For the control group sample alone,
the mean weight gains were 1 .48 kg with concurrent LEH and
2.56 kg without concurrent LEH (t = 1 .78; P = 0. 10 1). Although
sample sizes are small, these results suggest an association be-
tween growth faltering and formation of LEHs.
Finally, an analysis ofthe association between illness and the
formation ofLEHs also suggests that individuals with LEHs had
a slight (10-25%) but insignificantly greater frequency of days
ill with gastrointestinal illnesses, upper-respiratory illness, and
the total of upper-respiratory and gastrointestinal illnesses. For
example, nonsupplemented individuals with LEH that developed
Comparison of the prevalence of LEHs in males and females, with defects matched on antimeres and combined for anterior maxillary andanterior mandibular teeth, upper central incisor and lower canine, and all anterior teeth �
Males Females RR x2 Two-tailed P
Maxilla
Canine 5.4(2/37) 12.5(5/40) 2.31 1.15 NS
12 9.5(4/42) 4.8(2/42) 0.50 0.71 NS
I I 52.4 (22/42) 47.6 (20/42) 0.9 1 0. 1 9 NS
Total maxilla 46.8 (18/47) 52.5 (21/40) 1.12 0.1 1 NS
Mandible
Canine 9.8 (4/41) 30.0 (12/40) 3.06 5.17 0.022
12 16.7 (7/42) 19.0 (8/42) 1.14 0.80 NS
Ii 24.4 (10/41) 23.8 (10/42) 0.98 0.04 NSTotal mandible 19.5 (8/41) 32.5 (13/40) 1.67 1.76 NS
CI combination 53.7 (22/4 1) 60.0 (24/40) 1 . 1 2 0.33 NS
Any combination 54. 1 (20/37) 60.0 (24/40) 1 . 1 1 0.27 NS
by guest on Decem
ber 30, 2014ajcn.nutrition.org
Dow
nloaded from
UNDERNUTRITION AND ENAMEL HYPOPLASIAS 779
enamel (38).
TABLE 5Comparison of current anthropometric measurements for individuals with and without LEHs for the supplemented and control groups and the
total sample
LEH No LEH t value Two-tailed P
Percentile weight-for-age (%)tTotal 30.5 ± 24.9 [40] 32.5 ± 23.6 [31] 0.35 NS
Control 25.4 ± 23.0 [25] 17.0 ± 18.4 [91 -0.98 NS
Supplemented 38.9 ± 26.3 [15] 38.8 ± 22.9 [22] -0.01 NS
Percentile height-for-age (%)tTotal 8.2 ± ll.9[41] 17.7 ±2l.9[31J 2.19 0.034
Control 6.0 ± 9.5 [26] 5.7 ± 6.0 [9] -0. 1 1 NS
Supplemented 12.1 ± 14.8 [15] 22.7 ± 24.1 [22] 1.52 NS
Head circumference (cm)Total 53.12± l.l3[41] 53.77± l.23[3l] 2.33 0.023
Control 53.30 ± 0.88 [26] 53.10 ± 1.30 [9] -0.43 NSSupplemented 52.80 ± 1.46 [15] 54.05 ± 1.12 [22J 2.93 0.006
S � � SD. n in brackets.
t On the basis of NCHS reference values (41).
around 30-36 mo averaged 214.5 illness d during this 6-moperiod compared with 174.9 illness d for those without a LEH.
Discussion
Intraobserver reliability
Previous studies showed that LEHs could be reliably scored
in clinical and field settings (26, 33-35). This study extends theseresults in demonstrating that field observations are highly con-
sistent with observations from high-quality dental replicas. Infact, the slightly but not significantly greater frequency of defects
observed on casts attests to their quality and potential in further
studies of quantitative dental developmental defects.
Moderate to severe LEHs similar to the FDI standard (32)
are easily discerned in the field. However, most defects are less
severe than the standard types presented by FDI. These mild
defects are the most difficult to score with high repeatability.Additionally, they may be neither symmetrical nor associated
with histological irregularities (3), suggesting that they are not
caused by systemic physiological disruption. Because some de-creases in enamel thickness (a hypoplasia)-visible to the human
eye-do not appear to be physiologically meaningful, researchis needed to formulate minimum criteria for recognizing a linear
depression as being a true enamel hypoplasia (and caused by
systemic physiological perturbation). The method employed in
this study of matching defects on contralateral teeth is one way
to eliminate the less easily discerned defects.
Variation in prevalence ofLEH by tooth type
Consistent with previous studies, substantial differences were
observed in the frequency of LEH among the anterior teeth (1,
3, 38). Variation in frequency of defects among teeth is due to
differences in time ofcrown formation as well as to variation insusceptibility to disruption (38). Teeth such as upper central
incisors that are polar teeth in developmental fields are under
the strongest genetic control of development compared with
other nonpolar teeth (38); these polar teeth are least able to vary
the timing oftheir development during physiologically stressful
periods. Therefore, they are more likely to develop defective
As in previous studies, the highest frequency of defects was
found on the central incisors (1, 3, 19, 26, 38). Only two mdi-
viduals without a symmetrical LEH on the upper central incisorshad such symmetrical LEHs on another set of contralateral an-
terior teeth (Table 2). Stated differently, ofthe individuals with-
out any missing teeth, 42 were recognized to have a LEH on
the basis of analysis of upper central incisors alone, whereas 44
individuals were so assessed on the basis of an analysis of all
anterior teeth. These data suggest that studies designed to gain
a rapid assessment of nutritional status may be able to focus on
the observation of upper central incisors. Conversely, data on
the other teeth provide a means of confirming data from the
central incisors and may have additional significance as less sen-
sitive assays of physiological disruption. Regardless of which
teeth are studied, these data further point toward the importance
of reporting data by tooth type (1, 3, 38).
Effect ofnutritional supplementation on LEH formation
The risk ofdcveloping a LEH was nearly twice as great in the
nonsupplemented group as it was in the supplemented group.The decrease in prevalence ofdefects with supplementation sug-
gests a clear relationship between dietary intake and the devel-opment of LEH. LEH appears to be sensitive to variations in
nutrient intake on the order of 1200 kJ/d.
However, because supplemented individuals have greater in-
takes of a variety of nutrients, it is difficult to ascertain which
nutrients might be most critical to the formation of a LEH.
Although previous studies showed that there are associations
between LEH and specific nutrient deficiencies (1, 7), these
studies only suggest that a specific deficiency might be etiolog-
ically significant and cannot be used to determine ifthe specific
deficiency is a sufficient cause or how common a cause it is in
humans. A review ofthe literature combined with the results ofthis study further suggest that LEH is likely to be multifactorial
in cause, perhaps similar to anthropometric measures of nutri-tional status, with both intake ofa variety of nutrients and con-
current disease states potentially playing significant etiological
roles. Further research with experimental animals and humansis clearly required to begin to tease out the relative importance
of and interactions among these factors.
by guest on Decem
ber 30, 2014ajcn.nutrition.org
Dow
nloaded from
780 GOODMAN ET AL
Developmental ages at LEH development
The estimated peak age at formation of a LEH on the upper
central incisor is ---24-36 mo developmental age in both groups,
with a slightly earlier mean age at formation (2.03-2.17 y) in
the supplemented vs the control groups. This small mean dif-
ference in developmental age may be somewhat less than theactual difference in chronological age because developmental
timing may be relatively delayed in the control group individuals
with poorer nutritional status (42). Whereas poor nutritional
status can significantly delay eruption times, less is known of its
effect on the timing of matrix formation. It is, however, likelyto be less significant, especially for a highly canalized tooth.
The peak age at formation ofa LEH in both groups is similar
to that found in another study in Mexico (26) and in a number
ofstudies ofprehistoric and historical populations (3). This peakalso follows closely after the median age at completion of weaning
(“-20-24 mo) in this community (28) and is congruent with the
age at which the incidence of illness is greatest (28, 30).
The greatest relative difference in frequency of LEH betweensupplemented and control groups occurs before I .5 y and after3.0 y, or before and after weaning and the time ofgreatest illness.It is as if all children are at great risk of LEH immediately after
weaning, but the supplemented individuals are afforded greaterprotection before and after weaning. These data also support
the hypothesis that common respiratory and gastrointestinal ill-nesses are an immediate cause of LEH, especially in individualswith compromised nutritional status.
Male-ftmale differences, anthropometry. illness, and LEH
A variety of epidemiological studies has shown that LEH is
more common in males than females and vice-versa (3). In thisstudy, slightly more females than males had one or more LEHs
(60.0-54. 1%). These results are consistent with a previous study
in the Mexican highlands (26) and the greater proportion of
females with moderate to severe undernutrition in Tezonteo-pan (28).
The variation in association between LEH and both current
and past anthropometric measures is explicable in terms of crit-ical periods of development and catch-up potential of the an-
thropometric measures. The fact that there is no associationbetween LEH and current weight-for-age is likely due to theability of children to catch up in weight growth. Conversely,
LEH developing earlier in life is associated with adolescent headcircumference (Table 5). Because head circumference is rapidlyincreasing during the time ofenamel formation, one might expect
that a permanent decrease in mean head circumference is as-sociated with LEH. Finally, a decrease in weight velocity between
2 and 3 y is associated with a concurrently developing LEH,
although, as noted above, this relationship does not carry throughto weight at the time of dental examination. This paradoxicalrelationship is likely due to the sensitivity of weight to physio-logical disruption. When a stressor is virulent enough to cause
a LEH, it may also lead to a decrease in weight gain.Both upper-respiratory and gastrointestinal illnesses were
moderately associated with the development ofa LEH. The po-tential importance ofillness is indirectly suggested by the above-
noted commonality in peak ages at incidence ofillness and peakages at formation of LEH. However, the role of illness in theetiology of LU-I needs to be further explored.
In summary, the prevalence of LEH was shown to be reducedin a population after nutritional supplementation during the
time ofenamel development. This longitudinal study confirms
results from previous studies that examined the relationship be-
tween current nutritional status and the previous formation ofenamel defects. Associations between LEH and both growth ye-locity at the time of defect formation and current nutritional
status further support the view that mild to moderate under-
nutrition is a main cause of LEH.
The peak age at formation ofenamel defects, -�24-36 mo, is
also the age at which weaning has been completed and illness
reaches its greatest incidence. The web of potential interactionsinvolving socioeconomic conditions, feeding patterns, dietary
intake, and illness patterns suggests that all of these variablesneed to be examined in concert if one is to better understandthe causal relationship between nutritional status and LEH. Be-
cause of enamel’s ability to provide a chronological record ofpast physiological perturbations, LEH may prove to be a unique
indicator of nutritional status. U
We thank Keith Dobney, Debra Martin, Homero Martinez, andLorena Chapparro for assistance in the collection of the dental data andArlene Perry and Yin-Chai Cheah for data management. We especially
wish to acknowledge the efforts of the people of Tezonteopan who have
contributed so unfailingly to Proyecto Puebla.
References
1 . Cutress TW, Suckling GW. The assessment of non-carious defectsofenamel. Int Dent I 1982;32:l 17-22.
2. Kreshover SI. Metabolic disturbance in tooth formation. Ann NY
AcadSci 1960;85:l61-7.3. Goodman AH, Rose JC. The assessment of systemic physiological
perturbations from developmental defects of enamel and histologicalstructures. Yearbook of physical anthropology I 990;3:59- I 10.
4. Sarnat BG, Schour I. Enamel hypoplasias (chronic enamel aplasia)in relationship to systemic diseases: a chronological, morphological
and etiological classification. I Am Dent Assoc 194 l;28:l989-2000.5. Suckling G. Developmental defects ofenamel-historical and pres-
ent-day perspectives of their pathogenesis. Adv Dent Res 1989;3:87-94.
6. Goodman AH, Armelagos GJ, Rose JC. The chronological distri-bution of enamel hypoplasias from prehistoric Dickson Moundspopulations. Am I Phys Anthropol l984;65:259-66.
7. Jontell M, Linde A. Nutritional aspects on tooth formation. WorldRev Nutr Diet l986;48:l 14-36.
8. Jenkins GN. The physiology and biochemistry of the mouth. 2nd
ed. Oxford, England: Blackwell, 1978.9. Navia JM. Nutrition in dental development and disease. In: Winick
M, ed. Nutrition pre and postnatal development. New York: Plenum,1979:333-62.
10. Mellanby M. Diet and the teeth: an experimental study. Part I: dentalstructure in dogs. London: His Majesty’s Stationery Office, 1929.[Medical Research Council special report series no. 140.]
1 1. Mellanby H. The effect of maternal dietary deficiency of vitamin A
on dental tissues in rats. J Dent Res 194 1;20:489-509.
12. Tonge CH, McCance R. Normal development ofthejaws and teethin pigs, and the delay and malocclusion produced by calorie defi-
ciencies.I Anat l973;l 15:1-22.
I 3. Holloway P1, Shaw JH, Sweeney EA. Effects of various sucrose:casein ratios in purified diets on the teeth and supporting structures
ofrats. Arch Oral Biol 1961:3:185-200.14. Shaw JH, Griffith D. Dental abnormalities in rats attributable to
protein deficiency during reproduction. J Nutr l963;80: 123-41.1 5. Aponte-Merced L, Navia JM. Pre-eruptive protein-energy malnu-
trition and acid solubility of rat molar enamel surfaces. Arch Oral
Biol l980;25:70l-5.
by guest on Decem
ber 30, 2014ajcn.nutrition.org
Dow
nloaded from
UNDERNUTRITION AND ENAMEL HYPOPLASIAS 781
16. DiOrio LP, Miller SA, Navia JM. The separate effects of proteinand calorie malnutrition on the development and growth ofrat bones
and teeth. I Nutr l973;103:856-65.17. Swardstedt T. Odontological aspects ofa medieval population from
the province oflamtland/Mid-Sweden. Stockholm:Tiden Barnangen,AB, 1966.
18. Goodman AH, Lallo I, Armelagos GJ, Rose IC. Health changes atDickson Mounds, Illinois(AD 950-1 300). In: Cohen MN, Armelagos
GJ, eds. Paleopathology at the origins of agriculture. New York:Academic Press, 1984:271-306.
19. Goodman AH, Armelagos GI, Rose IC. Enamel hypoplasias as in-
dicators ofstress in three prehistoric populations from Illinois. HumBiol 1980;52:5 I 5-28.
20. Corruccini RS, Handler iS, Jacobi KP. Chronological distributionofenamel hypoplasias and weaning in a Caribbean slave population.
Hum Biol 1985;57:699-71 I.21. Lanphear KM. Frequency and distribution of enamel hypoplasias
in a historic skeletal sample. Am I Phys Anthropol l989;8l:35-43.22. Blakey ML. Fetal and childhood health in late 18th and early 19th
century Afro-Americans: enamel hypoplasias and hypocalcificationsin the FABC skeletal population. Am J Phys Anthropol l987;72:
I 79 (abstr).23. Sweeney EA, Saffir IA, de Leon R. Linear enamel hypoplasias of
deciduous incisor teeth in malnourished children. Am I Clin Nutr197 l;24:29-3 1.
24. Sawyer DR. Nwoku AL. Malnutrition and the oral health of childrenin Ogbomosho, Nigeria. I Dent Child 1985;52:l4l-5.
25. Enwonwu CO. Influence of socio-economic conditions on dental
development in Nigerian children. Arch Oral Biol l973;l8:95-107.26. Goodman AH, Allen LH, Hernandez GP, et al. Prevalence and age
at development of enamel hypoplasias in Mexican children. Am IPhys Anthropol 1987;72:7-19.
27. Goodman AH, Pelto GH, Allen LH. Socioeconomic and nutritionalstatus correlates of enamel developmental defects in mild-to-mod-erately malnourished Mexican children. Am I Phys Anthropol1988;75:215 (abstr).
28. Chavez A, Martinez C. Growing up in a developing community.Guatemala City: Institute ofNutrition ofCentral America and Pan-ama, 1982.
29. Chavez A, Martinez C, Bourges H. Nutrition and development ofinfants from poor rural areas 2. Nutrition level and physical activity.
Nutr Rep Int l972;5:139-44.
30. Martinez C, Chavez A. Nutrition and development ofchildren from
poor rural areas VII. The effect of the nutritional status on the fre-
quency and severity of infections. Nutr Rep mt 1979;l9:307-l4.
31. Chavez A, Martinez C, Ophuis A et al. Nutrition and development
of children from poor rural areas VI. Effects of mild malnutrition
on body morphology during early growth. Nutr Rep Internat1977; 15:407-19.
32. Federation Dentaire International. An epidemiological ii�dex of de-
velopmental defects of dental enamel (DDE Index). mt Dent I1982;32:l59-67. (FDI technical report 15.)
33. King N. Developmental defects ofenamel in Chinese girls and boysin Hong Kong. Adv Dent Res 1989;3:l20-5.
34. Murray II, Gordon PH, Carmichael CL. Dental caries and enamelopacities in 10-year-old children in Newcastle and Northumberland.
Br Dent I l984;l56:255-8.
35. Suckling GW, Pearce EF. Developmental defects of enamel in a
group ofNew Zealand children: their prevalence and some associated
etiological factors. Community Dent Oral Epidemiol l984;12:177-
84.
36. Massler M, Schour I, Poncher HG. Developmental pattern of the
child as reflected in the calcification pattern of the teeth. Am I Dis
Child l941;62:33-67.37. SPSS Inc. SPSS-X user’s guide. Chicago: SPSS Inc. 1983.
38. Goodman AH, Armelagos GI. Factors affecting the distribution ofenamel hypoplasias within the human permanent dentition. Am IPhys Anthropol 1985;68:479-93.
39. Fleiss I. Statistical methods for rates and proportions, 2nd ed. New
York: John Wiley and Sons, 1981.
40. Landis R, Koch G. The measurement of observer agreement for
categorical data. Biometrics l977;33:l59-74.
41. Hamill PV, Drizd TA, Johnson CL, et al. NCHS growth curves forchildren, birth-18 years, United States. Vital Health Stat [I 1]
1977; 165.
42. Alvarez JO, Navia JM. Nutritional status, tooth eruption, and dental
caries: a review. Am I Clin Nutr 1989;49:417-26.
by guest on Decem
ber 30, 2014ajcn.nutrition.org
Dow
nloaded from
Copyright © 2022 FDOKUMEN