Numerical simulation of particle migration in asymmetric bifurcation channel
10
J. Non-Newtonian Fluid Mech. 166 (2011) 42–51 Contents lists available at ScienceDirect Journal of Non-Newtonian Fluid Mechanics journal homepage: www.elsevier.com/locate/jnnfm Numerical simulation of particle migration in asymmetric bifurcation channel G.M. Yezaz Ahmed 1 , Anugrah Singh ∗ Department of Chemical Engineering, Indian Institute of Technology Guwahati, Guwahati 781039, India article info Article history: Received 1 March 2010 Received in revised form 8 October 2010 Accepted 11 October 2010 Keywords: Shear induced migration Diffusive flux model Numerical simulation Suspension flow Bifurcation channel abstract In this work we provide numerical validation of the particle migration during flow of concentrated suspension in asymmetric T-junction bifurcation channel observed in a recent experiment [1]. The math- ematical models developed to explain particle migration phenomenon basically fall into two categories, namely, suspension balance model and diffusive flux model. These models have been successfully applied to explain migration behavior in several two-dimensional flows. However, many processes often involve flow in complex 3D geometries. In this work we have carried out numerical simulation of concentrated suspension flow in 3D bifurcation geometry using the diffusive flux model. The simulation method was validated with available experimental and theoretical results for channel flow. After validation of the method we have applied the simulation technique to study the flow of concentrated suspensions through an asymmetric T-junction bifurcation composed of rectangular channels. It is observed that in the span- wise direction inhomogeneous concentration distribution that develops upstream persists throughout the inlet and downstream channels. Due to the migration of particles near the bifurcation section there is almost equal partitioning of flow in the two downstream branches. The detailed comparison of numerical simulation results is made with the experimental data. © 2010 Elsevier B.V. All rights reserved. 1. Introduction The flow of suspensions such as slurries, composites, and pastes has great industrial relevance in processing of products. Shear- induced migration of particles in suspension flow is important in variety of scientific and engineering applications. The continuum models used to explain the particle-migration phenomena basically fall into two categories, the diffusive flux model by Phillips et al. [2] and the suspension balance model by Nott and Brady [3]. These models have achieved some level of success in predicting qualita- tive features of the migration process and quantitative steady-state velocity and concentration profiles in various flow situations. Par- ticle scale simulation method such as Stokesian dynamics [4] has also been used to evaluate microstructure and rheology of con- centrated suspensions. However, these simulations are limited to only few thousand particles due to large computational power and memory requirements. On the other hand continuum models allow simulation of realistic macroscopic problem in large systems which are of considerable practical interest. Based on the scaling arguments of Leighton and Acrivos [5], the diffusive flux model of Phillips et al. [2] assumes that particle migra- tion flux is driven by local particle–particle interaction frequency and viscosity variation. The particle migration flux represents the ∗ Corresponding author. Tel.: +91 3612582259; fax: +91 3612582259. E-mail addresses: [email protected], [email protected] (A. Singh). 1 Present address: NCB Bhawan, Old Bombay Road, Hyderabad 500008, India. movement of particle phase relative to the bulk suspension and is proportional to the local shear rate gradient. The diffusive flux model successfully explains migration in channel and pipe flow but fails in cone-and-plate and parallel plate torsional flows. This is attributed to the assumption of isotropic behavior of interac- tion induced flux in the original diffusive flux model. A number of studies have extended the diffusive flux model to more gener- alized applications to general conditions [6–9]. The diffusive flux model has been extensively tested in Couette flow [10,11], and has been widely used in numerical simulations of suspensions flow in various geometries [6,7,11]. The suspension balance model proposed by Nott and Brady [3] is based on conservation of mass and momentum for suspension phase as well as particle phase. The particle phase transport equa- tions are derived by averaging the mass and momentum conserva- tion equations over the particle phase. The suspension phase and particle phase transport equations incorporate constitutive model for the suspension and particle stresses based on rheological the- ory and experiments. This model provides a non-local description of suspension behavior in terms of particle’s velocity fluctuations. Nott and Brady [3] proposed a form of particle phase stress with an isotropic particle phase pressure while Morris and Boulay [13] illustrated the importance of anisotropy and normal stress differ- ence effects for predictions of migration in curvilinear flows. This model has been recently used by Miller and Morris [14] to sim- ulate suspension flow employing finite volume technique. Miller et al. [15] have presented a frame-invariant formulation of the sus- pension balance model for general geometries. Their method does 0377-0257/$ – see front matter © 2010 Elsevier B.V. All rights reserved. doi:10.1016/j.jnnfm.2010.10.004
Transcript of Numerical simulation of particle migration in asymmetric bifurcation channel

N
GD
a
ARRA
KSDNSB
1
hivmfamtvtacomsa
dta
0d
J. Non-Newtonian Fluid Mech. 166 (2011) 42–51
Contents lists available at ScienceDirect
Journal of Non-Newtonian Fluid Mechanics
journa l homepage: www.e lsev ier .com/ locate / jnnfm
umerical simulation of particle migration in asymmetric bifurcation channel
.M. Yezaz Ahmed1, Anugrah Singh ∗
epartment of Chemical Engineering, Indian Institute of Technology Guwahati, Guwahati 781039, India
r t i c l e i n f o
rticle history:eceived 1 March 2010eceived in revised form 8 October 2010ccepted 11 October 2010
eywords:hear induced migration
a b s t r a c t
In this work we provide numerical validation of the particle migration during flow of concentratedsuspension in asymmetric T-junction bifurcation channel observed in a recent experiment [1]. The math-ematical models developed to explain particle migration phenomenon basically fall into two categories,namely, suspension balance model and diffusive flux model. These models have been successfully appliedto explain migration behavior in several two-dimensional flows. However, many processes often involveflow in complex 3D geometries. In this work we have carried out numerical simulation of concentratedsuspension flow in 3D bifurcation geometry using the diffusive flux model. The simulation method was
iffusive flux modelumerical simulationuspension flowifurcation channel
validated with available experimental and theoretical results for channel flow. After validation of themethod we have applied the simulation technique to study the flow of concentrated suspensions throughan asymmetric T-junction bifurcation composed of rectangular channels. It is observed that in the span-wise direction inhomogeneous concentration distribution that develops upstream persists throughoutthe inlet and downstream channels. Due to the migration of particles near the bifurcation section there is
of floe wit
almost equal partitioningsimulation results is mad
. Introduction
The flow of suspensions such as slurries, composites, and pastesas great industrial relevance in processing of products. Shear-
nduced migration of particles in suspension flow is important inariety of scientific and engineering applications. The continuumodels used to explain the particle-migration phenomena basically
all into two categories, the diffusive flux model by Phillips et al. [2]nd the suspension balance model by Nott and Brady [3]. Theseodels have achieved some level of success in predicting qualita-
ive features of the migration process and quantitative steady-stateelocity and concentration profiles in various flow situations. Par-icle scale simulation method such as Stokesian dynamics [4] haslso been used to evaluate microstructure and rheology of con-entrated suspensions. However, these simulations are limited tonly few thousand particles due to large computational power andemory requirements. On the other hand continuum models allow
imulation of realistic macroscopic problem in large systems whichre of considerable practical interest.
Based on the scaling arguments of Leighton and Acrivos [5], theiffusive flux model of Phillips et al. [2] assumes that particle migra-ion flux is driven by local particle–particle interaction frequencynd viscosity variation. The particle migration flux represents the
∗ Corresponding author. Tel.: +91 3612582259; fax: +91 3612582259.E-mail addresses: [email protected], [email protected] (A. Singh).
1 Present address: NCB Bhawan, Old Bombay Road, Hyderabad 500008, India.
377-0257/$ – see front matter © 2010 Elsevier B.V. All rights reserved.oi:10.1016/j.jnnfm.2010.10.004
w in the two downstream branches. The detailed comparison of numericalh the experimental data.
© 2010 Elsevier B.V. All rights reserved.
movement of particle phase relative to the bulk suspension andis proportional to the local shear rate gradient. The diffusive fluxmodel successfully explains migration in channel and pipe flowbut fails in cone-and-plate and parallel plate torsional flows. Thisis attributed to the assumption of isotropic behavior of interac-tion induced flux in the original diffusive flux model. A numberof studies have extended the diffusive flux model to more gener-alized applications to general conditions [6–9]. The diffusive fluxmodel has been extensively tested in Couette flow [10,11], and hasbeen widely used in numerical simulations of suspensions flow invarious geometries [6,7,11].
The suspension balance model proposed by Nott and Brady [3]is based on conservation of mass and momentum for suspensionphase as well as particle phase. The particle phase transport equa-tions are derived by averaging the mass and momentum conserva-tion equations over the particle phase. The suspension phase andparticle phase transport equations incorporate constitutive modelfor the suspension and particle stresses based on rheological the-ory and experiments. This model provides a non-local descriptionof suspension behavior in terms of particle’s velocity fluctuations.
Nott and Brady [3] proposed a form of particle phase stress withan isotropic particle phase pressure while Morris and Boulay [13]illustrated the importance of anisotropy and normal stress differ-
ence effects for predictions of migration in curvilinear flows. Thismodel has been recently used by Miller and Morris [14] to sim-ulate suspension flow employing finite volume technique. Milleret al. [15] have presented a frame-invariant formulation of the sus-pension balance model for general geometries. Their method does
Newto
nspadectεTtaM
fltLu[iaplMpooRt[ottewmnflHa[Tfk
tcchotifmmbitbto‘trcj
G.M. Yezaz Ahmed, A. Singh / J. Non-
ot require solution of additional transport equation for suspen-ion temperature (which accounts the fluctuational motions of thearticles) to describe the non-local suspension stresses. They havelso reported that considering the particulate phase as continuum,ifficulty may arise at points where the shear rate approaches zero,.g., at the centerline of channel or pipe. The fluctuations in particleoncentration alter the viscosity and hence the shear rate at pointso either side of the centerline which depend upon the parameter= a/B, where, a is particle radius and B is half width of the channel.o avoid this difficulty a small but constant non-local contributiono the local shear rate is added. This is a simplification of the spatialveraging approach of shear rate over a finite volume suggested byorris and Boulay [13].We have also used the non-local description of stress in diffusive
ux model where shear-gradients drive the migration in horizon-al channel or pipe flows. The diffusive flux model as proposed byeighton and Acrivos [5] was only applicable to simple planar andnidirectional flows. The extension of this model by Phillips et al.2] to more complex flows also implicitly assumes that migrations isotropic. The suspension balance model provides a more unifiedpproach for particle migration with the inclusion of anisotropicarticle stresses and hence successfully explains migration in curvi-
inear flows. The suspension balance model in the form outlined byorris and Boulay [13] with non-local shear rate concept [14,15]
rovides simple implementation that can overcome the limitationsf diffusive flux model in certain situations. Another limitationf diffusive flux model is its application to Brownian suspension.ecent experimental studies have established particle migration inhe concentrated as well as dilute regime in Brownian suspensions16–18]. Since there are no experimental data on the measurementf normal stresses in Brownian suspensions, Frank et al. [16] usinghe theoretical prediction of normal stresses [19,20] have extendedhe suspension balance model for Brownian suspensions. Brownt al. [18] have reported good agreement of the simulation resultsith their experimental measurements of shear-induced particleigration in Brownian suspensions using nuclear magnetic reso-
ance technique. Kang et al. [21] have attempted to include particleux resulting from Brownian diffusion in the diffusive flux model.owever this model requires several empirical parameters whichre not available for Brownian suspensions. Therefore Kang et al.21] presented only qualitative prediction of migration behavior.he suspension under investigation in our study is non-Brownianor which the empirical parameters of diffusive flux model are wellnown.
Both suspension balance and diffusive flux model can be appliedo the numerical simulation of general flows. This can be thenoupled with the flow simulation to obtain the non-uniform con-entration distribution in 2D and 3D geometries. Several studiesave confirmed that for rectilinear channel flow the predictionsf diffusive flux model closely matches the experimental data. Forhe bifurcation channel of rectangular cross-section the anisotropys not expected to significantly alter the particle migration. Thusor simplicity of implementation, we have chosen diffusive flux
odel in our present study. In this work we have studied particleigration in rectangular bifurcation geometry which is motivated
y the recent experimental work of Xi and Shapley [1]. Such flowsn bifurcation channels have relevant applications in biological andechnological processes, such as laminar flow of blood in humanlood vessels. In biomedical application the artificial valves needo be designed taking into consideration of proper distributionf blood cells in different branches. In another application called
plasma skimming’ which is a separation technique, the blood flowshrough a network of precisely controlled microfluidic bifurcationsesulting into the separation of red blood cells and white bloodells. It also has application in the administration of drugs at vesselunctions [22]. This approach can also be applied in other processes
nian Fluid Mech. 166 (2011) 42–51 43
where cell screening effects can be exploited [23–25]. Thus, in thebranched systems it is important to find out bulk suspension par-titioning and the particle partitioning in the daughter branchesdownstream of the channel inlet.
In one study Krogh [26] observed that blood cells are not dis-tributed in the same proportion as volumetric blood flow. They haveattributed this discrepancy to the non-uniform upstream distribu-tion of blood cells. Recently, Roberts and Olbricht [27] observed thatin a rectangular channel bifurcation, the partitioning of particles isdifferent from the partitioning of fluid. In a Y-junction bifurcation,particles preferentially enter the downstream branch receiving thegreater volumetric flow rate. There have been several mathematicalmodels developed to understand this partitioning and compute thecell distribution at bifurcations [28–30]. These models all assumethat red blood cells follow streamlines at the junction and requireknowledge of the velocity profile, the cell concentration profile andthe dividing streamline surface. For a bifurcation comprising of cir-cular tube branches Rong and Carr [31] found that the dividingsurface shape is a function of the ratio of branch diameters andthe fractional flow splits at the junction. In most of these studieswith dilute concentration the particles are comparable in size tothe channel width or tube diameter.
In contrast, bifurcation flows of small particles (in comparisonto the channel width) are less studied through experiments andnumerical simulations as noted by Xi and Shapley [1]. They haveperformed experimental measurements of velocity and concentra-tion profile in an asymmetric bifurcation channel flow using thetechnique of nuclear magnetic resonance imaging. Their experi-ments were performed for channel half width to particle size ratioof 35. The concentration and velocity profiles were measured forbulk particle volume fraction of 0.4 and 0.5. They have examinedthe suspension partitioning in the downstream branches by varyingthe volumetric flow rate.
We have studied the suspension flow in an asymmetric T-junction bifurcation though the numerical simulations using thediffusive flux model. The parameters of the simulation are sameas in the experiments of Xi and Shapley [1]. In Section 2 wepresent the CFD model formulation and simulation method. Prob-lem description of bifurcation channel is presented is Section 3which is followed by results and discussion in Section 4.
2. Diffusive flux model description
2.1. Governing equations
The suspension is considered as continuum fluid whose viscos-ity depends on the particle fraction. The steady state continuity andmomentum conservation equations for the suspension are given as,
∇ · (�u) = 0, (1)
∇ · (�uu) = −∇p + ∇ · �. (2)
In the diffusive flux model, an additional diffusion equation issolved to predict the particle migration. The steady state particleconservation equation is,
∇ · (�u�) = −∇ · Nt. (3)
In the above equations u is the bulk suspension velocity and �is the particle volume fraction, � is the density of suspension and pis the suspension pressure. Here Nt is the total diffusive flux (to be
described later) and � denotes the stress tensor which is modeledas generalized Newtonian fluid and it has the following constitutiveform,� = �(�)E. (4)
4 Newto
sfs
�
mtomf
N
a
N
T
mpfvpcp
ε
wtHitevoP
2
cma[bbat
∇w
dsg
S
c
4 G.M. Yezaz Ahmed, A. Singh / J. Non-
In the above equation �(�) is the effective viscosity of suspen-ion and E is the rate of strain tensor. The Kreiger correlation of theollowing form is used to model the effective viscosity of suspen-ion,
(�) = �0
(1 − �
�m
)−1.82
. (5)
Here, �0 is the viscosity of pure suspending fluid and �m is theaximum flowing volume fraction of particles and we have chosen
his to be 0.68 in all calculations. In this study we consider theriginal model of Phillips et al. [2] where Nt constitutes only of twoechanisms. The particle flux due to spatially varying interacting
requency which is given as,
C = −�Kca2(�2∇�̇ + �̇�∇�), (6)
nd the viscosity gradient-induced migration flux,
� = −�K�a2�̇�2 1�
∂�
∂�(∇�). (7)
hus, Nt = NC + N�. (8)
Diffusion coefficients Kc and K� are empirical constants deter-ined experimentally. As discussed by Tetlow et al. [11], better
redictions can be made with the diffusive flux models if the dif-usivity coefficients, Kc and K� are chosen as functions of the localolume concentrations. In a recent study, Ingber et al. [32] incor-orated modifications in the diffusive flux model. The diffusionoefficients are modelled as linear functions of the nonlinearityarameter (εNL) defined as,
NL =a∣∣∇�̇
∣∣�̇ + �̇NL
, (9)
here a is the particle radius and �̇NL is the non-local contributiono the shear rate (�̇) originally proposed by Miller and Morris [14].owever, this modification in itself leads to essentially cubic scal-
ng of migration on the particle radius which is somewhat largerhan one found in experiments. To reduce the scaling to matchxperimental results in the wide-gap Couette, Ingber et al. imposedelocity slip boundary conditions at the wall. This was not done inur numerical simulations rather the constant values chosen byhillips et al. [2] were used, namely, Kc = 0.41 and K� = 0.62.
.2. Numerical method
To solve the above set of equations we have used a commer-ial software package Fluent, which is based on the finite volumeethod (FVM). The FVM method has been successfully used by Fang
nd Phan-Thien [12] for diffusive flux model. Miller and Morris14] and Miller et al. [15] have used FVM method for suspensionalance model. The general purpose FVM solvers such as Fluent,esides solving continuity and momentum equation can also solvedditional scalar transport equation. The steady state general scalarransport equation is given as,
· (�u�) = ∇ · ( ∇�) + S�, (10)
here is the diffusion coefficient and S� is the source term.To the particle conservation equation which is not in the stan-
ard form for Fluent, we set the right-hand-side terms of Eq. (3) asum of the diffusion term and source term. These terms which areiven below are then modeled through user defined subroutines.
2 2 1 d�
= �K�a �̇�� d�, (11)
� = ∇ · (NC). (12)
As mentioned earlier the diffusive flux model encounters diffi-ulties in regions where the average local shear rate approaches
nian Fluid Mech. 166 (2011) 42–51
zero since the shear-induced diffusivity scales linearly with theshear rate. In the pressure driven flows in channel or pipe the shearrate is zero at the center, which makes the diffusivity in our for-mulation to be zero there. This leads to numerical instability andconvergence problems as � → �m. To avoid this we have used thenon-local stress concept of Miller and Morris [14] where a smallbut constant non-local contribution depending on particle size isadded to the local shear rate. This reflects the fact that the RMS of�̇ is larger than the mean shear rate, owing to fluctuations result-ing from finite size of the particles of radius a. Thus the non-localcontribution depending on the mean shear rate and particle size is,
�̇NL = as(ε)�̇s. (13)
In the above equation, �̇s = umax/B, where umax is the centerlinevelocity. We have chosen the parameter, as(ε) = ε2, where ε = a/Bfor a channel of half width B. The finite �̇NL values satisfy �̇NL ��̇ except where �̇ → 0, giving the model the required effect ofimproving results near the centerline.
The governing equations (mass, momentum, and additionalscalar transport equation) are solved with segregated, iterativemultigrid solver in Fluent 6.1. The SIMPLE scheme was employedfor the pressure–velocity coupling. The second order accurate dis-cretization schemes were used for all the equations.
2.3. Validation of simulation method
Before simulating the bifurcation problem, the numericalmethod was validated by performing two-dimensional steady statesimulation in a channel and the results were compared with theanalytical solution given by Phillips et al. [2] and experimental dataof Lyon and Leal [33].
The length required to reach steady configuration of suspensionflow was calculated by formula given by Nott and Brady [3],[
L
B
]ss
∼ 112d(�)
[B
a
]2. (14)
The function d(�) accounts for the effect of particle concentrationon the shear-induced coefficient of diffusion. Leighton and Acrivos[34] and more recently Chapman [35] have found that,
d(�) = 13
�2(
1 + 12
e8.8�)
. (15)
The boundary conditions for suspension flow in 2D channel are,
1. At inlet, average velocity and particle volume fraction �bulk isspecified.
2. At walls, no slip boundary condition is applied and particle fluxis taken to be zero.
3. At outlet, a fully developed outflow condition is applied.
For the 2D simulations the relative particle-size (B/a) was takento be 18 which is same as in the experiments of Lyon and Leal[33] for channel flow. The computational domain was discretizedinto 70,000 finite volume cells. We have carried out simulationsfor the same flow rate as taken in the experiments of Lyon andLeal [33]. Comparisons of the CFD model predictions with exper-iments and analytical solution for bulk concentrations �bulk = 0.3and �bulk = 0.4 in planar Poiseuille flow are shown in Figs. 1 and 2respectively. The velocity is normalized with maximum velocityVmax of a parabolic profile for Newtonian fluid with the same vol-umetric flow rate. The velocity profile is in close agreement with
the analytical solution given by Phillips et al. [2]. The suspensionvelocity profiles are blunted in comparison with Newtonian veloc-ity profile. The concentration profile also shows good agreementwith the experiments. We also notice that the non-local formula-tion is able to remove the sharp cusp observed in the analytical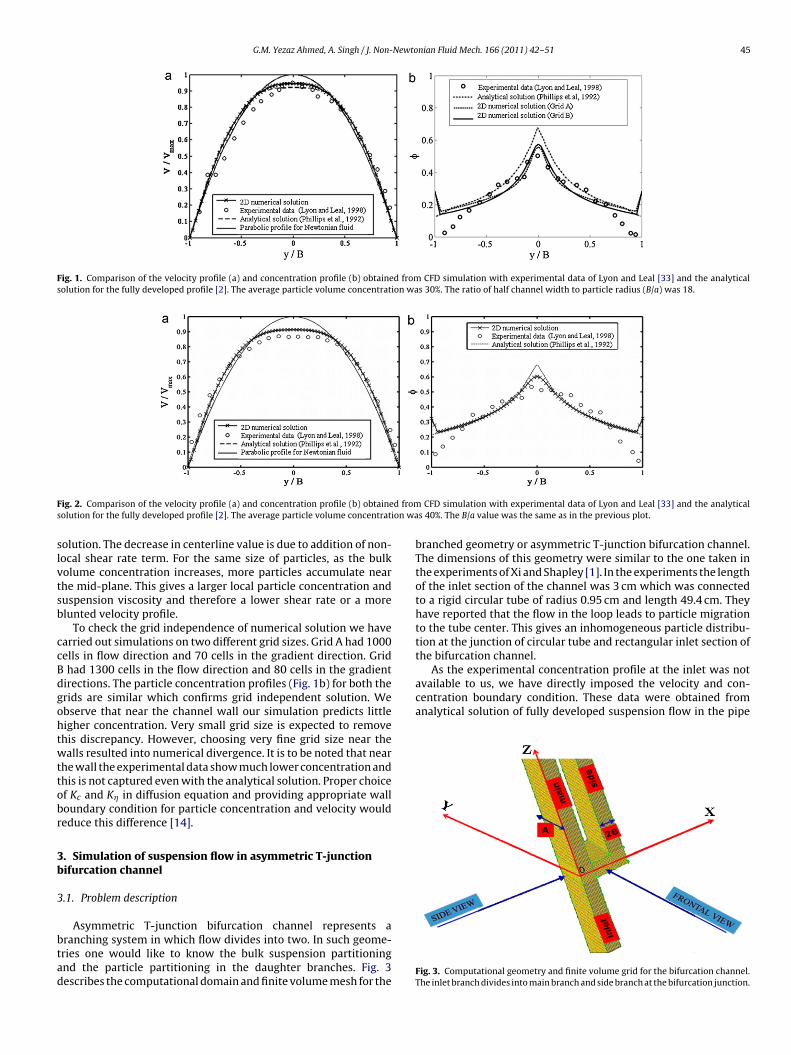
G.M. Yezaz Ahmed, A. Singh / J. Non-Newtonian Fluid Mech. 166 (2011) 42–51 45
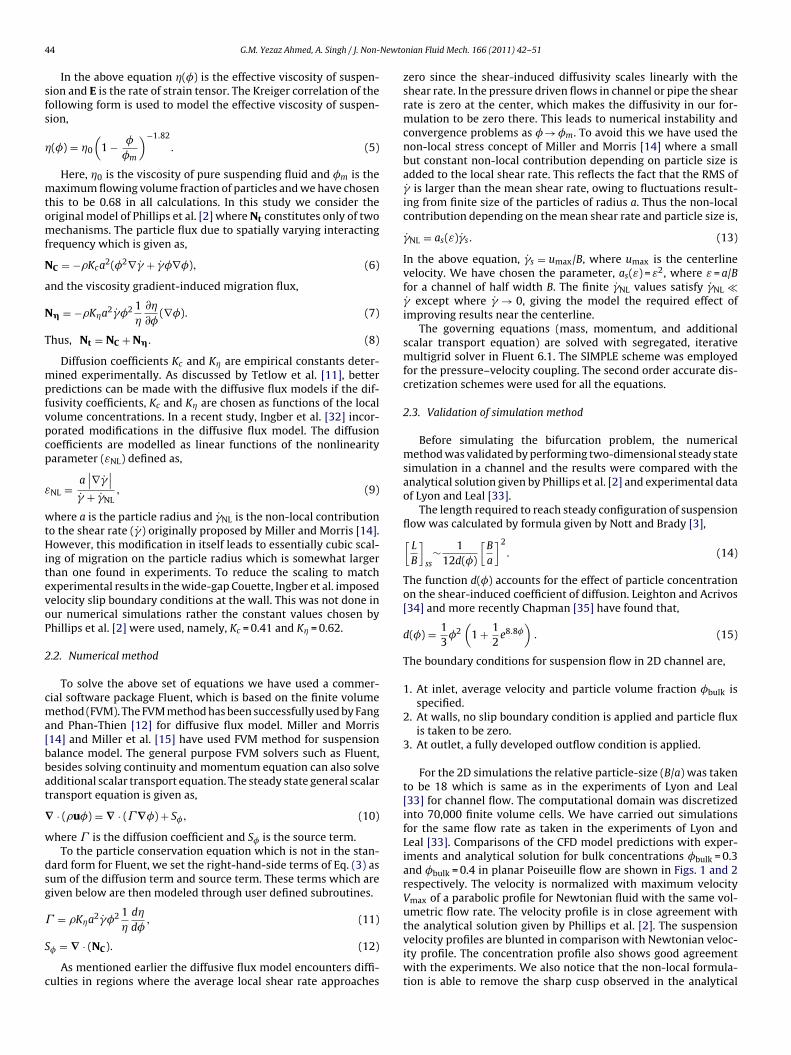
Fig. 1. Comparison of the velocity profile (a) and concentration profile (b) obtained from CFD simulation with experimental data of Lyon and Leal [33] and the analyticalsolution for the fully developed profile [2]. The average particle volume concentration was 30%. The ratio of half channel width to particle radius (B/a) was 18.
F d froms ion wa
slvtsb
ccBdgohtwttobr
3b
3
btad
As the experimental concentration profile at the inlet was notavailable to us, we have directly imposed the velocity and con-centration boundary condition. These data were obtained fromanalytical solution of fully developed suspension flow in the pipe
ig. 2. Comparison of the velocity profile (a) and concentration profile (b) obtaineolution for the fully developed profile [2]. The average particle volume concentrat
olution. The decrease in centerline value is due to addition of non-ocal shear rate term. For the same size of particles, as the bulkolume concentration increases, more particles accumulate nearhe mid-plane. This gives a larger local particle concentration anduspension viscosity and therefore a lower shear rate or a morelunted velocity profile.
To check the grid independence of numerical solution we havearried out simulations on two different grid sizes. Grid A had 1000ells in flow direction and 70 cells in the gradient direction. Gridhad 1300 cells in the flow direction and 80 cells in the gradient
irections. The particle concentration profiles (Fig. 1b) for both therids are similar which confirms grid independent solution. Webserve that near the channel wall our simulation predicts littleigher concentration. Very small grid size is expected to removehis discrepancy. However, choosing very fine grid size near thealls resulted into numerical divergence. It is to be noted that near
he wall the experimental data show much lower concentration andhis is not captured even with the analytical solution. Proper choicef Kc and K� in diffusion equation and providing appropriate walloundary condition for particle concentration and velocity wouldeduce this difference [14].
. Simulation of suspension flow in asymmetric T-junctionifurcation channel
.1. Problem description
Asymmetric T-junction bifurcation channel represents aranching system in which flow divides into two. In such geome-ries one would like to know the bulk suspension partitioningnd the particle partitioning in the daughter branches. Fig. 3escribes the computational domain and finite volume mesh for the
CFD simulation with experimental data of Lyon and Leal [33] and the analyticals 40%. The B/a value was the same as in the previous plot.
branched geometry or asymmetric T-junction bifurcation channel.The dimensions of this geometry were similar to the one taken inthe experiments of Xi and Shapley [1]. In the experiments the lengthof the inlet section of the channel was 3 cm which was connectedto a rigid circular tube of radius 0.95 cm and length 49.4 cm. Theyhave reported that the flow in the loop leads to particle migrationto the tube center. This gives an inhomogeneous particle distribu-tion at the junction of circular tube and rectangular inlet section ofthe bifurcation channel.
Fig. 3. Computational geometry and finite volume grid for the bifurcation channel.The inlet branch divides into main branch and side branch at the bifurcation junction.

46 G.M. Yezaz Ahmed, A. Singh / J. Non-Newtonian Fluid Mech. 166 (2011) 42–51
F om sim3
[eTsfl
3
ltbg
1
2
3
Ra0thhcdpTpWi
4
4
cflvafx
the front view.The side view for main and side branch shows a different pattern
marked by two peaks. The two peaks are located near the walls anda valley in observed in the centerline along the z axis. The maximumvelocity in the two downstream branches is peaked towards the
Fig. 5. Velocity contour planes for Newtonian fluid (a–c) and suspensions (d–f) of
ig. 4. Lateral (a) and spanwise (b) velocity profiles for 40% suspension obtained fr53,280 cells. The flow rate was 102.1 ml/min.
2]. The inlet branch length and downstream branches lengths arextended by the required steady state length estimated by Eq. (14).he inlet section had a length of 20 cm and the lengths of down-tream branches were 10 cm respectively. All other dimensions andow parameters taken were same as in the experiments.
.2. Geometry and boundary conditions
The bifurcation geometry constitutes of one inlet and two out-ets. The downstream branch after the bifurcation which followshe inlet branch is called as main branch and the other bifurcatedranch is called as side branch.The boundary conditions for thiseometry are,
. At the inlet velocity and particle concentration distribution hasbeen assigned as discussed in previous section. This was obtainedfrom the analytical solution [2] for tube flow with �bulk = 0.4.
. At the channel walls, no slip boundary condition is applied andparticle flux is taken to be zero.
. At the channel outlets, fully developed outflow condition forboth velocity and particle concentration was applied.
Simulation were performed for different flow rates and the floweynolds number based on the half width of the channel (B), aver-ge velocity and bulk viscosity of suspension varied from 0.046 to.569. For all the simulations the relative particle-size (B/a) wasaken to be 35. To confirm the grid independent computations weave carried out one simulation on two different grid sizes. Grid Aad 160,500 whereas grid B had 353,280 hexahedral finite volumeells. Fig. 4 shows that the velocity profiles in lateral and span-wiseirections are similar for both the grids. The particle concentrationrofile (not shown here) also showed similar grid independence.herefore in all further simulation results presented here the com-utational domain was discretized into 160,500 finite volume cells.e have carried out simulations for the same flow rates as taken
n the experiments of Xi and Shapley [1].
. Results and discussion
.1. Velocity field
The contour planes of velocity magnitude are shown in Fig. 5. Foromparison we have presented the contour planes for Newtonian
uid flow and the suspension flow. Fig. 5a and d shows the frontiew in the x–z plane at the centerline (y = A/2) for Newtonian fluidnd suspension respectively. Fig. 5b and e is corresponding plotsor the side view (y–z) plane in the centerline of the main branch at= 1.5 mm. The corresponding side view for the side branch is givenulations on two different grid sizes. Grid A had 160,500 cells whereas Grid B had
in Fig. 5c and f for the Newtonian fluid and suspension respectively.It can be observed that the Newtonian fluid shows nearly parabolicprofile across the narrow dimension (x) and the mostly flat profilealong the wider dimension (y). However for suspension flow weobserve blunted velocity profile in the inlet and main branch for
average particle concentration 40%. Figures (a) and (d) show the front view in x–zplane at the centerline (y = A/2). Figures (b) and (e) are for the side view (y–z) planeat x = 1.5 mm for main branch and figures (c) and (f) show the side view (y–z) planefor the side branch at x = 8.5 mm. The flow rate for the simulation with Newtonianfluid was 20.18 ml/min and for the suspension flow it was 102.1 ml/min. The velocityunit in the contour plot is in cm/s.
G.M. Yezaz Ahmed, A. Singh / J. Non-Newtonian Fluid Mech. 166 (2011) 42–51 47
F anch fw
oflbisd
ibiazvbapso
v
Fsfl
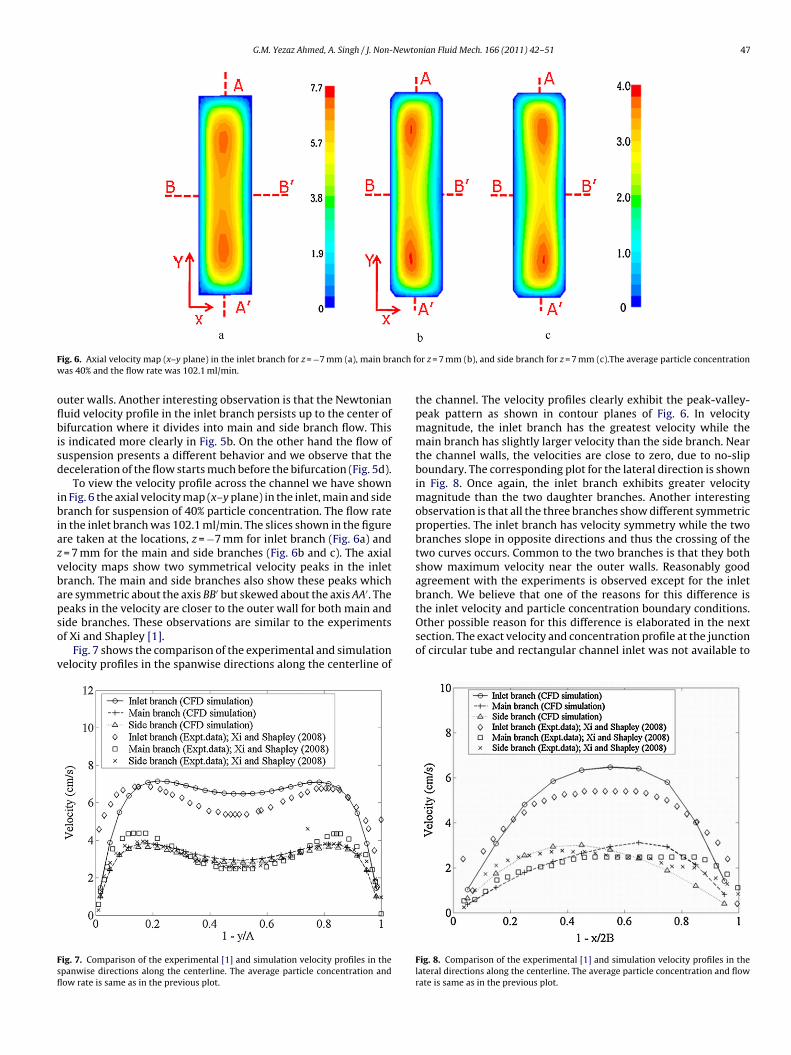
ig. 6. Axial velocity map (x–y plane) in the inlet branch for z = −7 mm (a), main bras 40% and the flow rate was 102.1 ml/min.
uter walls. Another interesting observation is that the Newtonianuid velocity profile in the inlet branch persists up to the center ofifurcation where it divides into main and side branch flow. This
s indicated more clearly in Fig. 5b. On the other hand the flow ofuspension presents a different behavior and we observe that theeceleration of the flow starts much before the bifurcation (Fig. 5d).
To view the velocity profile across the channel we have shownn Fig. 6 the axial velocity map (x–y plane) in the inlet, main and sideranch for suspension of 40% particle concentration. The flow rate
n the inlet branch was 102.1 ml/min. The slices shown in the figurere taken at the locations, z = −7 mm for inlet branch (Fig. 6a) and= 7 mm for the main and side branches (Fig. 6b and c). The axialelocity maps show two symmetrical velocity peaks in the inletranch. The main and side branches also show these peaks whichre symmetric about the axis BB′ but skewed about the axis AA′. The
eaks in the velocity are closer to the outer wall for both main andide branches. These observations are similar to the experimentsf Xi and Shapley [1].Fig. 7 shows the comparison of the experimental and simulationelocity profiles in the spanwise directions along the centerline of
ig. 7. Comparison of the experimental [1] and simulation velocity profiles in thepanwise directions along the centerline. The average particle concentration andow rate is same as in the previous plot.
or z = 7 mm (b), and side branch for z = 7 mm (c).The average particle concentration
the channel. The velocity profiles clearly exhibit the peak-valley-peak pattern as shown in contour planes of Fig. 6. In velocitymagnitude, the inlet branch has the greatest velocity while themain branch has slightly larger velocity than the side branch. Nearthe channel walls, the velocities are close to zero, due to no-slipboundary. The corresponding plot for the lateral direction is shownin Fig. 8. Once again, the inlet branch exhibits greater velocitymagnitude than the two daughter branches. Another interestingobservation is that all the three branches show different symmetricproperties. The inlet branch has velocity symmetry while the twobranches slope in opposite directions and thus the crossing of thetwo curves occurs. Common to the two branches is that they bothshow maximum velocity near the outer walls. Reasonably goodagreement with the experiments is observed except for the inletbranch. We believe that one of the reasons for this difference is
the inlet velocity and particle concentration boundary conditions.Other possible reason for this difference is elaborated in the nextsection. The exact velocity and concentration profile at the junctionof circular tube and rectangular channel inlet was not available toFig. 8. Comparison of the experimental [1] and simulation velocity profiles in thelateral directions along the centerline. The average particle concentration and flowrate is same as in the previous plot.
48 G.M. Yezaz Ahmed, A. Singh / J. Non-Newtonian Fluid Mech. 166 (2011) 42–51
Fcd
uaattOe
braoststesifl
tbiflbiso
4
in
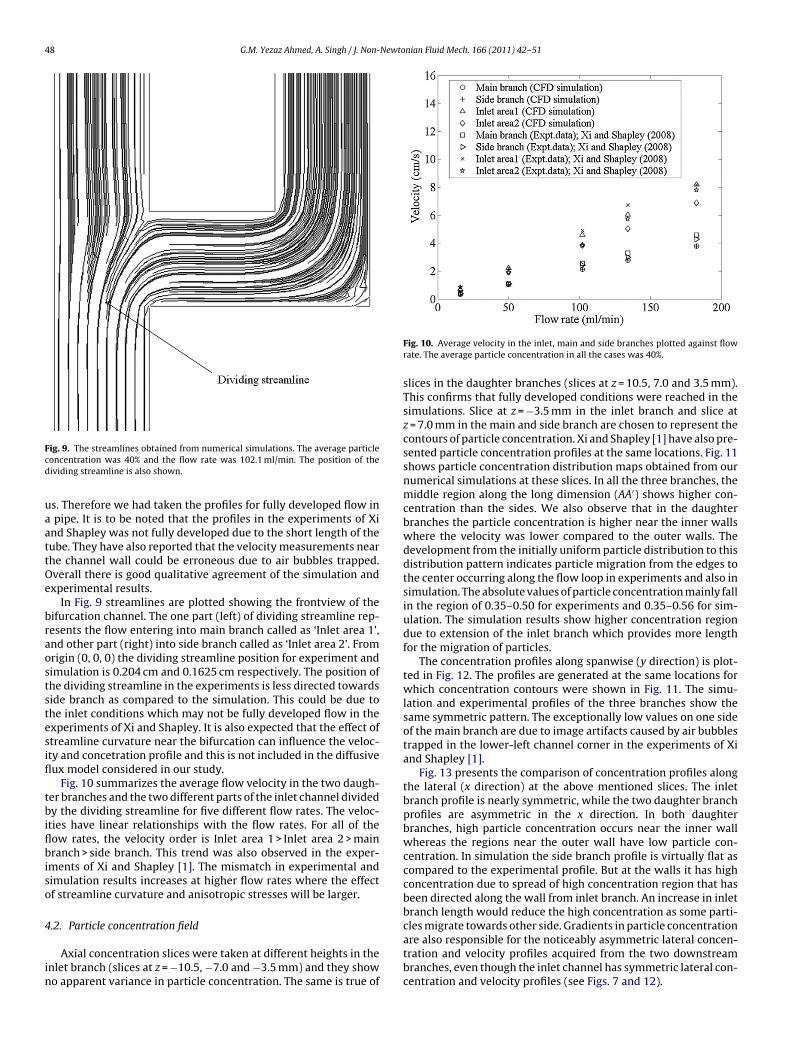
ig. 9. The streamlines obtained from numerical simulations. The average particleoncentration was 40% and the flow rate was 102.1 ml/min. The position of theividing streamline is also shown.
s. Therefore we had taken the profiles for fully developed flow inpipe. It is to be noted that the profiles in the experiments of Xi
nd Shapley was not fully developed due to the short length of theube. They have also reported that the velocity measurements nearhe channel wall could be erroneous due to air bubbles trapped.verall there is good qualitative agreement of the simulation andxperimental results.
In Fig. 9 streamlines are plotted showing the frontview of theifurcation channel. The one part (left) of dividing streamline rep-esents the flow entering into main branch called as ‘Inlet area 1’,nd other part (right) into side branch called as ‘Inlet area 2’. Fromrigin (0, 0, 0) the dividing streamline position for experiment andimulation is 0.204 cm and 0.1625 cm respectively. The position ofhe dividing streamline in the experiments is less directed towardside branch as compared to the simulation. This could be due tohe inlet conditions which may not be fully developed flow in thexperiments of Xi and Shapley. It is also expected that the effect oftreamline curvature near the bifurcation can influence the veloc-ty and concetration profile and this is not included in the diffusiveux model considered in our study.
Fig. 10 summarizes the average flow velocity in the two daugh-er branches and the two different parts of the inlet channel dividedy the dividing streamline for five different flow rates. The veloc-
ties have linear relationships with the flow rates. For all of theow rates, the velocity order is Inlet area 1 > Inlet area 2 > mainranch > side branch. This trend was also observed in the exper-
ments of Xi and Shapley [1]. The mismatch in experimental andimulation results increases at higher flow rates where the effectf streamline curvature and anisotropic stresses will be larger.
.2. Particle concentration field
Axial concentration slices were taken at different heights in thenlet branch (slices at z = −10.5, −7.0 and −3.5 mm) and they showo apparent variance in particle concentration. The same is true of
Fig. 10. Average velocity in the inlet, main and side branches plotted against flowrate. The average particle concentration in all the cases was 40%.
slices in the daughter branches (slices at z = 10.5, 7.0 and 3.5 mm).This confirms that fully developed conditions were reached in thesimulations. Slice at z = −3.5 mm in the inlet branch and slice atz = 7.0 mm in the main and side branch are chosen to represent thecontours of particle concentration. Xi and Shapley [1] have also pre-sented particle concentration profiles at the same locations. Fig. 11shows particle concentration distribution maps obtained from ournumerical simulations at these slices. In all the three branches, themiddle region along the long dimension (AA′) shows higher con-centration than the sides. We also observe that in the daughterbranches the particle concentration is higher near the inner wallswhere the velocity was lower compared to the outer walls. Thedevelopment from the initially uniform particle distribution to thisdistribution pattern indicates particle migration from the edges tothe center occurring along the flow loop in experiments and also insimulation. The absolute values of particle concentration mainly fallin the region of 0.35–0.50 for experiments and 0.35–0.56 for sim-ulation. The simulation results show higher concentration regiondue to extension of the inlet branch which provides more lengthfor the migration of particles.
The concentration profiles along spanwise (y direction) is plot-ted in Fig. 12. The profiles are generated at the same locations forwhich concentration contours were shown in Fig. 11. The simu-lation and experimental profiles of the three branches show thesame symmetric pattern. The exceptionally low values on one sideof the main branch are due to image artifacts caused by air bubblestrapped in the lower-left channel corner in the experiments of Xiand Shapley [1].
Fig. 13 presents the comparison of concentration profiles alongthe lateral (x direction) at the above mentioned slices. The inletbranch profile is nearly symmetric, while the two daughter branchprofiles are asymmetric in the x direction. In both daughterbranches, high particle concentration occurs near the inner wallwhereas the regions near the outer wall have low particle con-centration. In simulation the side branch profile is virtually flat ascompared to the experimental profile. But at the walls it has highconcentration due to spread of high concentration region that hasbeen directed along the wall from inlet branch. An increase in inletbranch length would reduce the high concentration as some parti-
cles migrate towards other side. Gradients in particle concentrationare also responsible for the noticeably asymmetric lateral concen-tration and velocity profiles acquired from the two downstreambranches, even though the inlet channel has symmetric lateral con-centration and velocity profiles (see Figs. 7 and 12).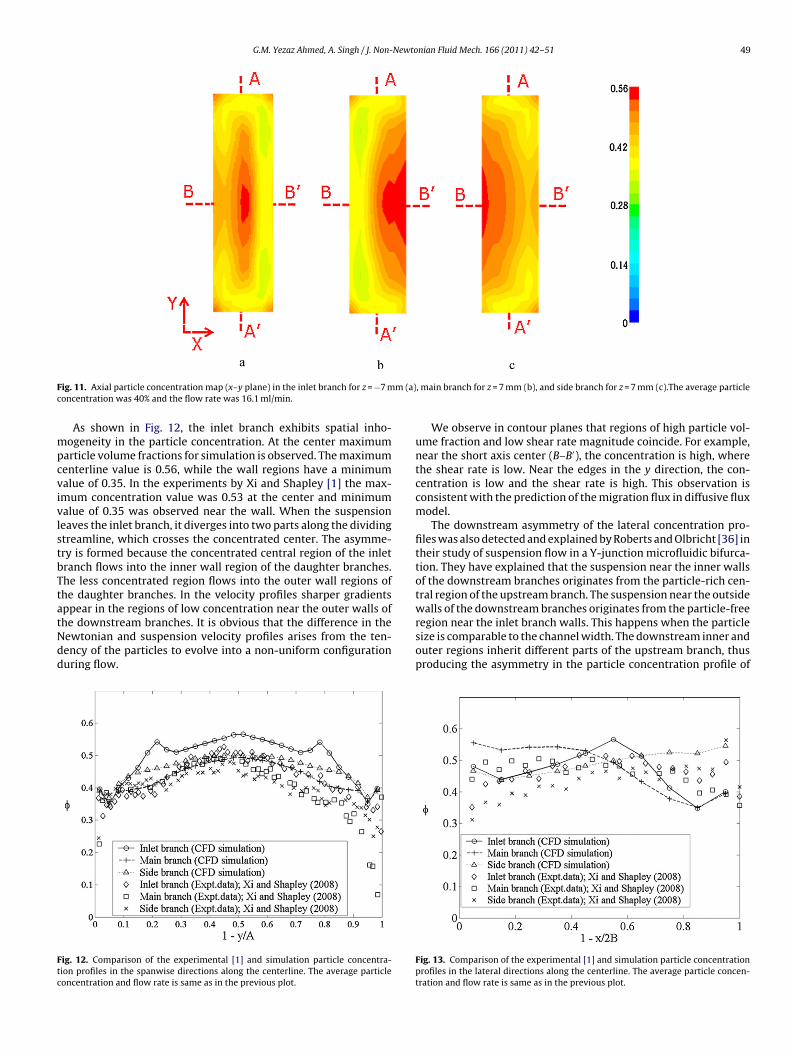
G.M. Yezaz Ahmed, A. Singh / J. Non-Newtonian Fluid Mech. 166 (2011) 42–51 49
F m (a)c
mpcvivlstbTtatNdd
Ftc
ig. 11. Axial particle concentration map (x–y plane) in the inlet branch for z = −7 moncentration was 40% and the flow rate was 16.1 ml/min.
As shown in Fig. 12, the inlet branch exhibits spatial inho-ogeneity in the particle concentration. At the center maximum
article volume fractions for simulation is observed. The maximumenterline value is 0.56, while the wall regions have a minimumalue of 0.35. In the experiments by Xi and Shapley [1] the max-mum concentration value was 0.53 at the center and minimumalue of 0.35 was observed near the wall. When the suspensioneaves the inlet branch, it diverges into two parts along the dividingtreamline, which crosses the concentrated center. The asymme-ry is formed because the concentrated central region of the inletranch flows into the inner wall region of the daughter branches.he less concentrated region flows into the outer wall regions ofhe daughter branches. In the velocity profiles sharper gradients
ppear in the regions of low concentration near the outer walls ofhe downstream branches. It is obvious that the difference in theewtonian and suspension velocity profiles arises from the ten-ency of the particles to evolve into a non-uniform configurationuring flow.ig. 12. Comparison of the experimental [1] and simulation particle concentra-ion profiles in the spanwise directions along the centerline. The average particleoncentration and flow rate is same as in the previous plot.
, main branch for z = 7 mm (b), and side branch for z = 7 mm (c).The average particle
We observe in contour planes that regions of high particle vol-ume fraction and low shear rate magnitude coincide. For example,near the short axis center (B–B′), the concentration is high, wherethe shear rate is low. Near the edges in the y direction, the con-centration is low and the shear rate is high. This observation isconsistent with the prediction of the migration flux in diffusive fluxmodel.
The downstream asymmetry of the lateral concentration pro-files was also detected and explained by Roberts and Olbricht [36] intheir study of suspension flow in a Y-junction microfluidic bifurca-tion. They have explained that the suspension near the inner wallsof the downstream branches originates from the particle-rich cen-tral region of the upstream branch. The suspension near the outsidewalls of the downstream branches originates from the particle-free
region near the inlet branch walls. This happens when the particlesize is comparable to the channel width. The downstream inner andouter regions inherit different parts of the upstream branch, thusproducing the asymmetry in the particle concentration profile ofFig. 13. Comparison of the experimental [1] and simulation particle concentrationprofiles in the lateral directions along the centerline. The average particle concen-tration and flow rate is same as in the previous plot.

50 G.M. Yezaz Ahmed, A. Singh / J. Non-Newtonian Fluid Mech. 166 (2011) 42–51
Fc
tX(
tabssenid
tfltttccgpicnfleccefsi
sdtcentsi
much smaller compared to the channel width the particle–particle
ig. 14. Particle flux in each branch plotted against flow rate. The average particleoncentration was 40%.
he daughter channels. Our numerical study and experiments ofi and Shapley [1] shows similar results even for small particles
compared to the channel width) for concentrated suspensions.Fig. 14 shows the comparison of the particle fluxes through the
wo daughter branches and in the two different parts (Inlet area 1nd Inlet area 2) of the inlet branch at different flow rates. It cane seen that the particle flux increases linearly with the suspen-ion flow rate. Simulations clearly follow the experiments and themall quantitative difference is attributed due to somewhat differ-nt inlet profiles as well as effect of anisotropic stresses that areot included in the model. There is a noticeably greater difference
n the particle fluxes through Inlet areas 1 and 2 compared to theifference between the main branch and side branch.
As shown in Fig. 9, the Inlet area 1 > Inlet area 2 as this indicateshat a higher average concentration and higher particle flux wouldow through the main branch compared to the side branch. In con-rast, we observe nearly equal particle distribution between thewo daughter branches. Clearly, the particles have drifted acrosshe streamlines. When compared with the straight section of thehannel, near the bifurcation section the diffusive flux due to con-entration gradient is expected to be higher than the flux due toradient in shear stress. This imbalance in two fluxes causes thearticles to migrate to the right of the dividing streamlines thereby
ncreasing the concentration of the side branch. The average parti-le concentration values in the various branches lie in a relativelyarrow range and do not show significant dependence on the actualow rates. Although the overall flow rate does not seem to have anffect on the final particle concentration, a pattern emerges whenomparison is made between the different branches. The averageoncentration values in the branches in descending order are forxperiments: �Inlet area 1 > �main branch > �side branch > �Inlet area 2 andor simulations: �side branch > �Inlet area 2 > �Inlet area 1 > �main branch. Ithows that spreading effect at the bifurcation is more pronouncedn the simulations.
The simulation results show that the Inlet area 2 and theide branch have high averages due to high concentration regionirected along the wall. Thus some more length is needed so aso allow particles to migrate from Inlet area 2 to Inlet area 1. Thisonfirms that the experiments were not for a fully developed flowntering the inlet branch of the bifurcation channel. It is to be
oted that any curvature in the geometry leads to additional migra-ion due to the anisotropy of the shear induced diffusive flux. Thetreamline is indeed curved at the bifurcation junction as observedn Fig. 9. This could be another reason for small mismatch betweenFig. 15. Comparison of the simulation and experimental data for side branch frac-tions of the inlet area, particle flux and flow rate. The average particle concentrationwas 40%.
simulation and experimental results. The B/a value in the experi-ments and simulations was large enough so that the magnitude ofsecondary currents which leads to additional particle migration isexpected to be low. Ramchandran and Leighton [37] predict thateven in such situations the impact of secondary flow on concentra-tion distribution resulting from second normal stress differencescan be significant. The suspension balance model which includesnormal stress differences [13] may provide closer agreement withthe experimental observations.
It can be observed in Fig. 15 that nearly equal partitioning ofparticles occurs between the two downstream branches. The sidebranch to main branch ratio for the overall suspension flow rateand the particle flux both lies around 0.5. This is also evident fromFig. 11 where the concentration contour maps of the two daughterbranches almost overlap. Again we observe good qualitative agree-ment between the simulation and experiments at low flow rates.The mismatch at higher flow rates could be due to the anisotropicstresses and for the fact that fully developed flow was not reachedin the experiments.
5. Conclusions
We have used the diffusive flux model of Phillips et al. [2]to carry out CFD simulation of suspension flow in an asymmet-ric T-junction bifurcation channel. Through the conservative finitevolume method we are able to demonstrate the close agreementbetween the simulation and experimental results of Xi and Shapley[1]. Qualitatively (perhaps quantitatively) the effect of non-uniformconcentration distribution including the detailed concentrationand velocity profiles in each branch, the position of the dividingstream surface, and the partitioning of the particles between thedownstream branches has been captured well by numerical simu-lation.
Similar to the experimental observations we also observed inour simulations that the concentration distributions are almostequally partitioned between the two downstream branches. Thisindicates that the migration of particles across the dividing stream-lines occurs at the bifurcation section. Since the particles are
interactions cannot produce equal partitioning of the high parti-cle concentration region at the bifurcation junction. It is the bulkmigration of particles resulting from gradient in particle concen-tration and shear rate which produces nearly equal particle flux in

Newto
binqolwwt
A
S
R
[
[
[
[
[
[
[
[
[
[
[
[
[
[
[
[
[
[
[
[
[
[
[
[
[
[
G.M. Yezaz Ahmed, A. Singh / J. Non-
oth the branches even if the channel is asymmetric. The spread-ng of the flowing layers at bifurcation junction is well captured byumerical simulation and the results are in qualitative and perhapsuantitative agreement with the experimental data. The migrationf particles changes the concentration and velocity profiles and theateral asymmetry in the velocity profile persists even in the span
ise direction. The inlet area fraction decreases with the flow ratehereas the particle flux and the inlet flow rate fraction entering
he side branch are nearly independent of flow rate.
cknowledgment
The authors acknowledge funding from DST through the projectR/S3/CE/38/2006.
eferences
[1] C. Xi, N.C. Shapley, Flows of concentrated suspensions through an asymmetricbifurcation, J. Rheol. 52 (2008) 625–647.
[2] R.J. Phillips, R.C. Armstrong, R.A. Brown, A.L. Graham, J.R. Abbott, A constitutiveequation for concentrated suspension that accounts for shear-induced particlemigration, Phys. Fluids A 4 (1992) 30–40.
[3] P.R. Nott, J.F. Brady, Pressure-driven flow of suspensions: simulation and the-ory, J. Fluid Mech. 275 (1994) 157–199.
[4] J.F. Brady, G. Bossis, Stokesian dynamics, Ann. Rev. Fluid Mech. 20 (1988)111–157.
[5] D.T. Leighton Jr., A. Acrivos, The shear-induced migration of particles in con-centrated suspension, J. Fluid Mech. 181 (1987) 415–439.
[6] K. Zhang, A. Acrivos, Viscous resuspension in fully developed laminar pipeflows, Int. J. Multiphase Flow 20 (1994) 579–591.
[7] S.R. Subia, M.S. Ingber, L.A. Mondy, S.A. Altobelli, A.L. Graham, Modeling of con-centrated suspensions using a continuum constitutive equation, J. Fluid Mech.373 (1998) 193–219.
[8] R.R. Rao, L.A. Mondy, T.A. Baer, S.A. Altobelli, T.S. Stephens, NMR measure-ments and simulations of particle migration in non-Newtonian fluids, Chem.Eng. Commun. 89 (2002) 1–22.
[9] Z. Fang, A.A. Mammoli, J.F. Brady, M.S. Ingber, L.A. Mondy, A.L. Graham, Flow-aligned tensor models for suspension flows, Int. J. Multiphase Flow 28 (2002)137–166.
10] S.A. Altobelli, R.C. Givler, E. Fukushima, Velocity and concentration measure-ments of suspensions by nuclear magnetic resonance imaging, J. Rheol. 35(1991) 721–734.
11] N. Tetlow, A.L. Graham, M.S. Ingber, S.R. Subia, L.A. Mondy, Particle migrationin a Couette apparatus: experiment and modeling, J. Rheol. 42 (1998) 307–327.
12] Z. Fang, N. Phan-Thien, Numerical simulation of particle migration in concen-trated suspensions by a finite volume method, J. Non-Newtonian Fluid Mech.
58 (1995) 67–81.13] J.F. Morris, F. Boulay, Curvilinear flows of noncolloidal suspensions: the role ofnormal stresses, J. Rheol. 43 (1999) 1213–1237.
14] R.M Miller, J.F. Morris, Normal stress-driven migration and axial developmentin pressure-driven flow of concentrated suspensions, J. Non-Newtonian FluidMech. 135 (2006) 149–165.
[
[
nian Fluid Mech. 166 (2011) 42–51 51
15] R.M. Miller, J.P. Singh, J.F. Morris, Suspension flow modeling for general geome-tries, Chem. Eng. Sci. 64 (2009) 4597–4610.
16] M. Frank, D. Anderson, E.R. Weeks, J.F. Morris, Particle migration in pres-sure driven flow of a Brownian suspension, J. Fluid Mech. 493 (2003) 363–378.
17] D. Semwogerere, J.F. Morris, E.R. Weeks, Development of particle migrationin pressure-driven flow of a Brownian suspension, J. Fluid Mech. 581 (2007)437–451.
18] J.R. Brown, E.O. Fridjonsson, J.D. Seymour, S.L. Codd, Nuclear magneticresonance measurement of shear-induced particle migration in Brownian sus-pensions, Phys. Fluids 21 (2009), 093301-1:9.
19] J.F. Brady, The rheological behavior of concentrated colloidal dispersions, J.Chem. Phys. 99 (1993) 567–581.
20] J.F. Brady, M.A. Vicic, Normal stresses in colloidal dispersions, J. Rheol. 39 (1995)545–566.
21] H.U. Kang, W. Kim, S.H. Kim, Effect of particle migration on the heat transfer ofnanofluid, Korea-Australia Rheol. J. 19 (2007) 99–107.
22] R.L. Dedrick, Arterial drug infusion: pharmacokinetic problems and pitfalls, J.Natl. Cancer Inst. 80 (1988) 84–89.
23] E.F. Leonard, A.C. West, N.C. Shapley, M.U. Larsen, Dialysis without membranes:how and why? Blood Purif. 22 (2004) 92–100.
24] M. Faivre, M. Abkarian, K. Bickraj, H.A. Stone, Geometrical focusing of cells ina microfluidic device: an approach to separate blood plasma, Biorheology 43(2006) 147–159.
25] R.D. Jaggi, R. Sandoz, C.S. Effenhauser, Microfluidic depletion of red blood cellsfrom whole blood in high-aspect-ratio microchannels, Microfluid. Nanofluid. 3(2007) 47–53.
26] A. Krogh, Studies on the physiology of capillaries: II. The reactions to local stim-uli of the blood-vessels in the skin and web of the frog, J. Physiol. (Lond.) 55(1921) 412–422.
27] B.W. Roberts, W.L. Olbricht, Flow-induced particulate separations, AIChE J. 49(2003) 2842–2849.
28] G.W. Schmid-Schonbein, R. Skalak, S. Usami, S. Chien, Cell distribution in cap-illary networks, Microvasc. Res. 19 (1980) 18–44.
29] J. Perkkio, R. Keskinen, Hematocrit reduction in bifurcations due to plasmaskimming, Bull. Math. Biol. 45 (1983) 41–50.
30] B.M. Fenton, R.R. Carr, G.R. Cokelet, Nonuniform red cell distribution in 20 to100 micrometers bifurcations, Microvasc. Res. 29 (1985) 103–126.
31] F.W. Rong, R.R. Carr, Dye studies on flow through branching tubes, Microvasc.Res. 39 (1990) 186–202.
32] M.S. Ingber, A.L. Graham, L.A. Mondy, Z. Fang, An improved constitutive modelfor concentrated suspensions accounting shear-induced particle migrationrate dependence on particle radius, Int. J. Multiphase Flow 35 (2009) 270–276.
33] M.K. Lyon, L.G. Leal, An experimental study of the motion of concentrated sus-pensions in two-dimensional channel flow. Part 1. Monodisperse system, J.Fluid Mech. 363 (1998) 25–56.
34] D.T. Leighton Jr., A. Acrivos, Measurement of shear-induced self-diffusionin concentrated suspensions of spheres, J. Fluid Mech. 177 (1987) 109–131.
35] B.K. Chapman, Shear induced migration phenomena in concentrated suspen-
sions, Ph.D. Thesis, University of Notre Dame, 1990.36] B.W. Roberts, W.L. Olbricht, The distribution of freely suspended particles atmicrofluidic bifurcations, AIChE J. 52 (2006) 199–206.
37] A. Ramchandran, D.T. Leighton, Viscous resuspension in a tube: the impact ofsecondary flows resulting from second normal stress differences, Phys. Fluids19 (2007), 053301-1:15.