Numeracy Item Signature Study: A Theoretically Derived Basis Technical Report 25
40
Technical Report 25, April 2002 1 Numeracy Item Signature Study: A Theoretically Derived Basis Technical Report 25 Gill Thomas & Andrew Tagg Dunedin College of Education Derek Holton University of Otago Gavin T L Brown University of Auckland Items used in the first calibration of the asTTle numeracy assessment were classified in an item signature study to establish their relevant characteristics. A group of expert teachers determined item properties on a two-thirds majority basis. Properties assigned included cognitive processing, curriculum level, achievement objectives, and processes, and considerateness of text and diagrams. Agreement among teachers was very high in all categories, ranging from 99% for text considerateness to 76% for level/position within level, with an overall percentage agreement of 92%. Table of Contents Mathematics In The New Zealand Curriculum.2 Progressions ...................................................... 3 Big Ideas of Mathematics ................................. 4 The higher level big ideas of mathematics .... 4 The big ideas of the content of mathematics .5 Summarising the big ideas of mathematics...6 Curriculum Map ................................................ 7 Item Signatures ................................................. 8 Curriculum Level; ......................................... 8 Considerateness of Text and Diagram .......... 9 Characteristics of text ............................... 9 SOLO Taxonomy; ........................................ 10 Year 7, Paper 1, Question 20 .................. 11 Year 5, Paper 1, Question 15 .................. 11 Curriculum Area (Processes & Content) .... 11 Sample Coding of Items.................................. 12 Year 7, Paper 1, Question 21 .................. 12 Methodology ................................................... 13 Findings........................................................... 14 Curriculum Level/Position Within Level..... 14 Text Considerateness .................................. 14 Diagram considerateness ............................ 14 SOLO taxonomy .......................................... 14 Curriculum processes ................................. 15 Curriculum content ..................................... 15 Level of agreement ...................................... 15 Summary of Findings ...................................... 17 Characteristics of Items .............................. 17 Level of Agreement ..................................... 18 Recommendations ....................................... 18 References ....................................................... 18 Appendix 1: asTTle Curriculum Map (Revised) ........................................................................ 20 Appendix 2: Mathematical Big Ideas Comparison ..................................................... 25 Appendix 3: MiNZC Curriculum Achievement Objectives Levels 2-4 ..................................... 30 Appendix 4 ...................................................... 36 Appendix 5...................................................... 40 The School of Education, University of Auckland has been contracted by the Ministry of Education to develop literacy and numeracy assessment tools for use with students in Years 5 to 7, both in English and in Maori. The Assessment Tools for Teaching and Learning Project (asTTle) has produced a bank of approximately 650 numeracy assessment items prior to the writing of this report. The items developed relate directly to the mathematics curriculum, to current teaching and learning practices, and are suitable for use in 40-minute paper and pencil format. The items were calibrated on a national representative sample
-
Upload
independent -
Category
Documents
-
view
4 -
download
0
Transcript of Numeracy Item Signature Study: A Theoretically Derived Basis Technical Report 25

Technical Report 25, April 2002
1
Numeracy Item Signature Study: A Theoretically Derived Basis Technical Report 25
Gill Thomas & Andrew Tagg Dunedin College of Education
Derek Holton
University of Otago
Gavin T L Brown University of Auckland
Items used in the first calibration of the asTTle numeracy assessment were classified in an item signature study to establish their relevant characteristics. A group of expert teachers determined item properties on a two-thirds majority basis. Properties assigned included cognitive processing, curriculum level, achievement objectives, and processes, and considerateness of text and diagrams. Agreement among teachers was very high in all categories, ranging from 99% for text considerateness to 76% for level/position within level, with an overall percentage agreement of 92%.
Table of Contents
Mathematics In The New Zealand Curriculum.2 Progressions ......................................................3 Big Ideas of Mathematics .................................4
The higher level big ideas of mathematics....4 The big ideas of the content of mathematics .5 Summarising the big ideas of mathematics...6
Curriculum Map................................................7 Item Signatures .................................................8
Curriculum Level; .........................................8 Considerateness of Text and Diagram..........9
Characteristics of text ...............................9 SOLO Taxonomy;........................................10
Year 7, Paper 1, Question 20 ..................11 Year 5, Paper 1, Question 15 ..................11
Curriculum Area (Processes & Content)....11 Sample Coding of Items..................................12
Year 7, Paper 1, Question 21 ..................12 Methodology ...................................................13 Findings...........................................................14
Curriculum Level/Position Within Level.....14 Text Considerateness ..................................14 Diagram considerateness............................14 SOLO taxonomy ..........................................14 Curriculum processes .................................15 Curriculum content .....................................15 Level of agreement ......................................15
Summary of Findings......................................17
Characteristics of Items ..............................17 Level of Agreement .....................................18 Recommendations .......................................18
References.......................................................18 Appendix 1: asTTle Curriculum Map (Revised)........................................................................20 Appendix 2: Mathematical Big Ideas Comparison.....................................................25 Appendix 3: MiNZC Curriculum Achievement Objectives Levels 2-4 .....................................30 Appendix 4......................................................36 Appendix 5......................................................40
The School of Education, University of
Auckland has been contracted by the Ministry of Education to develop literacy and numeracy assessment tools for use with students in Years 5 to 7, both in English and in Maori. The Assessment Tools for Teaching and Learning Project (asTTle) has produced a bank of approximately 650 numeracy assessment items prior to the writing of this report. The items developed relate directly to the mathematics curriculum, to current teaching and learning practices, and are suitable for use in 40-minute paper and pencil format. The items were calibrated on a national representative sample

Thomas, Tagg, Holton & Brown
2
of just over 9,000 Year 5 to 7 students in November, 2001.
This report aims to provide a basis for the map between the curriculum document, Mathematics in the New Zealand Curriculum, and items developed for the asTTle project. It may be used to confirm the characteristics of the bank’s items, determine that some items are inappropriate, and indicate whether some valued characteristics are not represented in the current items.
Mathematics In The New Zealand Curriculum
Mathematics in the New Zealand Curriculum (MiNZC) was gazetted in 1993. It covers the 13 years of schooling from New Entrant children to the end of secondary school (aged 17 years). This was the first curriculum in New Zealand to cover all the years of schooling. It was followed over a period of
nearly 10 years by curricula in the other subject areas.
MiNZC is organised in two ways, by strands across the subject and by levels within strands. The strands are a convenient way to divide the mathematics that is taught in school. There are six strands. These are, in MiNZC order, mathematical processes; number; measurement; geometry; algebra; and statistics. The last five of these were represented in previous curricula, however the first, mathematical processes, appeared for the first time in this curriculum. This strand covers three areas that are an important part of all mathematics and especially the other strands of the curriculum. These three areas are problem solving; developing logic and reasoning; and communicating mathematical ideas. Their relationship to the other strands is shown in the interwoven diagram of Figure 1 (Ministry of Education, 1992, p. 23).
Figure 1. Integrated Strands in the Mathematics Curriculum
Mathematical processes represent the higher cognitive skills of mathematics. These are areas of the subject that are hard if not impossible to do in isolation from the other, essentially, content strands. Problem solving involves identifying appropriate content of the subject and using this to solve non-routine problems. As it is not possible to know all of the problems that people are likely to come across, it is not possible to pre-learn the skills that will eventually solve them. Hence problem solving involves intuition and previous experience. There are a series of heuristic strategies that can assist in problem solving, however, and these can be practiced and learnt.
Logic and reasoning are fundamental to all mathematics (and indeed to all human thought). It is important for students to understand the
reasoning used in the subject so that they can present their solutions in a formally correct manner and also so that they can understand the thought processes of others. Such written and verbal interactions rely heavily on communication.
The content strands are relatively straightforward in that these content areas are what is usually expected of mathematics in school.
Technical Report 25: Numeracy Item Signature
3
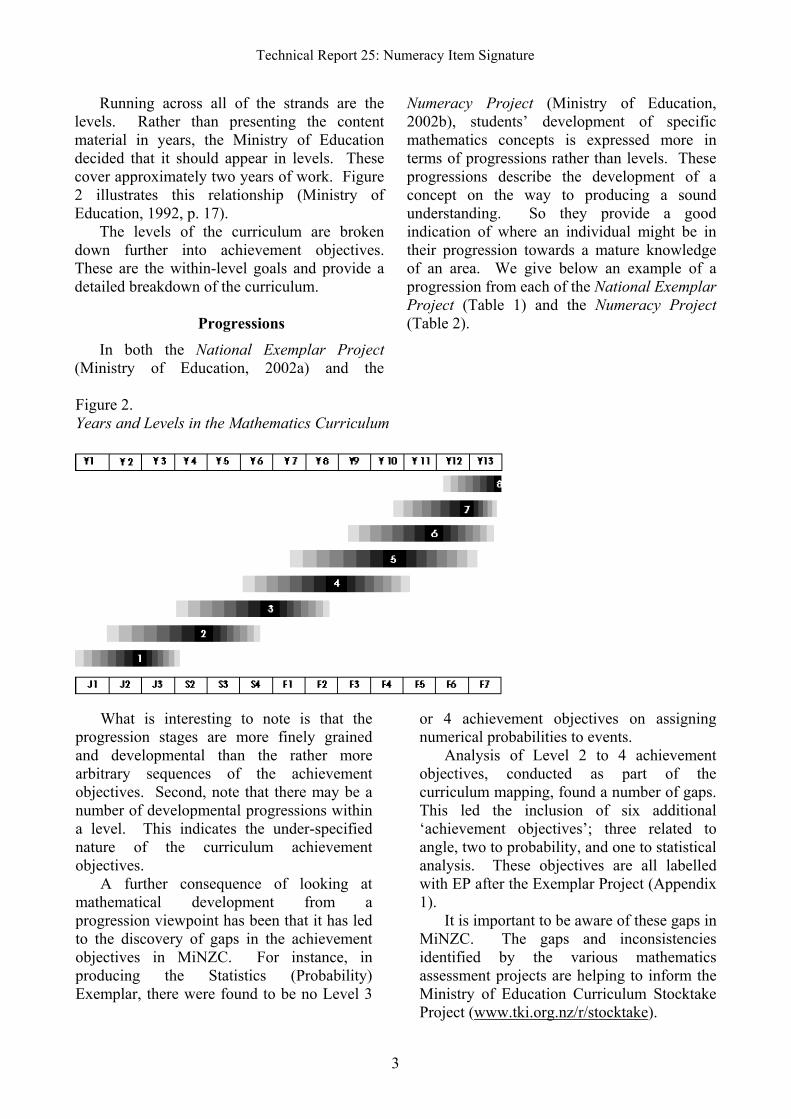
Running across all of the strands are the levels. Rather than presenting the content material in years, the Ministry of Education decided that it should appear in levels. These cover approximately two years of work. Figure 2 illustrates this relationship (Ministry of Education, 1992, p. 17).
The levels of the curriculum are broken down further into achievement objectives. These are the within-level goals and provide a detailed breakdown of the curriculum.
Progressions In both the National Exemplar Project
(Ministry of Education, 2002a) and the
Numeracy Project (Ministry of Education, 2002b), students’ development of specific mathematics concepts is expressed more in terms of progressions rather than levels. These progressions describe the development of a concept on the way to producing a sound understanding. So they provide a good indication of where an individual might be in their progression towards a mature knowledge of an area. We give below an example of a progression from each of the National Exemplar Project (Table 1) and the Numeracy Project (Table 2).
Figure 2. Years and Levels in the Mathematics Curriculum
What is interesting to note is that the
progression stages are more finely grained and developmental than the rather more arbitrary sequences of the achievement objectives. Second, note that there may be a number of developmental progressions within a level. This indicates the under-specified nature of the curriculum achievement objectives.
A further consequence of looking at mathematical development from a progression viewpoint has been that it has led to the discovery of gaps in the achievement objectives in MiNZC. For instance, in producing the Statistics (Probability) Exemplar, there were found to be no Level 3
or 4 achievement objectives on assigning numerical probabilities to events.
Analysis of Level 2 to 4 achievement objectives, conducted as part of the curriculum mapping, found a number of gaps. This led the inclusion of six additional ‘achievement objectives’; three related to angle, two to probability, and one to statistical analysis. These objectives are all labelled with EP after the Exemplar Project (Appendix 1).
It is important to be aware of these gaps in MiNZC. The gaps and inconsistencies identified by the various mathematics assessment projects are helping to inform the Ministry of Education Curriculum Stocktake Project (www.tki.org.nz/r/stocktake).

Thomas, Tagg, Holton & Brown
4
Table 1. Progression – Exemplar Project, Measurement
Progression stage
MiNZC level
Description
Direct comparison
1 Directly compares objects to determine relative size
Indirect comparison
1 Uses a third object to compare the size of two given objects
Non-standard units
1 Repeated use of a non-standard unit to measure objects
Standard units 2 Uses a standard measuring device
Reasoned measurement/ Applied measurement
3 Can decide which measurement is the best from a range of options Can find the measurement of an object which can not be measured directly (e.g., Calculate volume given dimensions)
Table 2. Progression – Numeracy Project, Measurement Progression
stage MiNZC level
Description
1 to 1 counting
1 Able to count an unstructured set of items
Count from one
1 Counts from 1 using materials to solve addition or subtraction problems
Advanced counting
1 Counts on or back to solve addition or subtraction problems
Early additive part-whole
2 Uses a part-whole strategy to solve addition or subtraction problems
Advanced additive
3 Uses a range of part-whole strategies to solve addition or subtraction problems
Advanced multiplicative
4 Uses a range of part-whole strategies to solve problems involving multiplication or division
Advanced proportional
4 Uses a range of part-whole strategies to solve problems involving fractions or proportions
Big Ideas of Mathematics
The development of the item signatures was based on an understanding of the most important concepts, or ‘big ideas’ of mathematics. It is important to realise, as signalled by MiNZC, that there is more to mathematics than the curriculum strands of number, algebra, measurement, geometry, and statistics. The strands are the building blocks of mathematics but they do not represent the underlying and unifying principles of mathematics. There are three higher-level ideas that form the basis of the practice of mathematics.
The higher level big ideas of mathematics
The first of these ‘higher level’ big ideas is that there is no mathematics without a problem to be solved. Applying a range of

Technical Report 25: Numeracy Item Signature
5
mathematical problem solving techniques to mathematical and real life problems is the raison d'etre of mathematics (Polya, 1973; Holton, 1998).
The second higher-level idea is finding patterns (Holton, 1993). This is not only noticing that a string of shapes is coloured alternatively red and blue or that in a sequence of numbers the next one is obtained by doubling the previous one, but also knowing theorems and algorithms. Pythagoras’ Theorem about right-angled triangles shows a pattern that all right-angled triangles share, namely that the square of the length of the hypotenuse is equal to the sum of the squares of the lengths of the other two sides. Algorithms too are patterns because they again show that the same thing works for a certain range of objects. For instance, the standard algorithms for adding 3-digit numbers show that all 3-digit numbers can be added in the same way. There is a pattern to these algorithms of addition.
The third higher-level idea is that of communication. Mathematicians only truly know that they have established worthwhile knowledge when they communicate their 'proof' for peer review (Lakatos, 1976). Once accepted by the community there is hardly ever any controversy over the result. The knowledge is now deemed true. So, in mathematics there is rarely the degree of controversy that there can be in other subjects where findings are not quite so conclusive. Furthermore, a student learns mathematics through the process of communication, for example in discussion with teachers or peers (NCTM, 1989). Communication not only passes on mathematical knowledge but also fosters clarification of understanding and meaning.
Historically, improved means of communication has been a stimulus for progressive improvement of mathematical knowledge. In the case of algebraic notation, mathematics in the Middle Ages had been extremely cumbersome as communication had been through words only. The shorthand of algebra facilitates understanding by cutting away irrelevances and by emphasising
generalisations. It also makes reasoning simpler since once expressed algebraically the rules of mathematics can be applied and consequently reduce cognitive demand (Stacey & MacGregor, 1999). Diagrams provide an important visual alternative for communicating abstract or complex data (Ministry of Education, 1992).
One way of looking at these three ideas is to think of problem solving as how we ‘do’ mathematics, patterns as how we ‘see’ mathematics, and communication as how we ‘tell’ others about the mathematics. It is important to note, as in the case of the interwoven nature of objectives and processes in the MiNZC, that the three 'big' ideas are not independent of each other. In many situations, finding a pattern and communicating that pattern are essential elements of solving problems. The big ideas of the content of mathematics
The content ideas we have listed are algebra, geometry, measurement, number, probability, and using data (statistics ‘proper’). Two of these content ideas we feel are of more importance than the other five. Certainly in the primary school, number has more importance than the others in that it pervades them all. Each of the other ideas is reliant to some extent on number and number is the first area of mathematics where the higher-level ideas of solving problems, pattern, and communication are met. However, as students develop mathematically, algebra begins to take over from number and it plays a much more important role by the end of secondary school. This is recognised in MiNZC as there is no Number past Level 6 and most of algebra up to and including Level 4 could reasonably be placed in the number strand.
Note that these content ideas do not correspond precisely to the strands of the curriculum, we believe that probability and using data are sufficiently distinct to be considered as different ideas.

Thomas, Tagg, Holton & Brown
6
Summarising the big ideas of mathematics
We have identified 10 ‘big ideas’ of mathematics. Solving problems, communication, and pattern are higher-level ideas in mathematics and link across all of the seven content ideas (Table 3). Each of these higher cognitive ideas interacts and influences the content areas, and can be applied to any
area of the subject. We have tried to show the greater importance of number and algebra by giving them their own section. These, with the other five content ideas, are the actual topics that are likely to be taught in a classroom setting, and through which all of the big ideas will be learned.

Technical Report 25: Numeracy Item Signature
7
Table 3. Big Ideas in Mathematics Type of idea Idea Description
Problem solving An understanding that mathematics is about solving real problems: Relating concepts or procedures to one another. Applying mathematical processes to familiar and unfamiliar problems in a mathematical context and in daily life. Developing new mathematics.
Patterns Realise that mathematics is an activity requiring the determining, representation and application of patterns.
Higher level idea
Communication A sense of communicating mathematics, including: Using mathematical language. Using symbols and notation.
Number A sense of number including: Being aware of the ways it is represented and the quantities for which it stands. Calculating using appropriate methods for a given situation. Alertness to the reasonableness of results.
Integrated content idea
Algebra A sense of algebra, including: Using algebraic expressions. Algebraic manipulation.
Probability A sense of probability, including: Estimating probabilities. Calculating theoretical and experimental probabilities. Using probabilities for prediction.
Using data Develop the ability to collect and organise statistical data in a variety of ways, and to interpret data from a variety of sources.
Measurement A sense of measurement, including: A knowledge and understanding of systems of measurement. Ability to choose appropriately and use a variety of measuring instruments. Ability to make and use estimates of measurement.
Content idea
Geometry A sense of geometry, including: Recognising and being able to describe, classify, draw, and make use of geometric shapes and objects. Recognising the occurrence of geometric shapes in the environment.
To show that the big ideas are considered to
be important elsewhere, we have linked them to the New Zealand Curriculum, The Australian National statement, the National Council of Teachers of Mathematics ‘Standards’, the TIMSS1 Assessment Frameworks and Specifications 2003, and the asTTle curriculum map (Appendix 2). What is apparent is the strong similarities across nations and the strong support in the MiNZC for the Big Ideas discussed above.
This view of the big ideas of mathematics provides the theoretical basis for the selection of major categories for the curriculum content category of the item signatures.
1 Trends in Mathematics and Science Study.
Curriculum Map Ell (2001) analysed the Mathematics in the
New Zealand Curriculum document and mapped the strands and achievement objectives of levels 2 to 4 into eight major categories and 13 key themes. An independent expert advisory panel revised this draft map prior to the item signature study research. Discussion of the big ideas and underlying patterns resulted in re-labelling and restructuring the mathematics content achievement objectives in the Ell curriculum map into 8 categories and 20 key themes (Table 4). It is worth noting that parallel themes in geometry and number were created that emphasise alternately identifying properties and operation. Achievement objectives appear under both categories but are
Thomas, Tagg, Holton & Brown
8
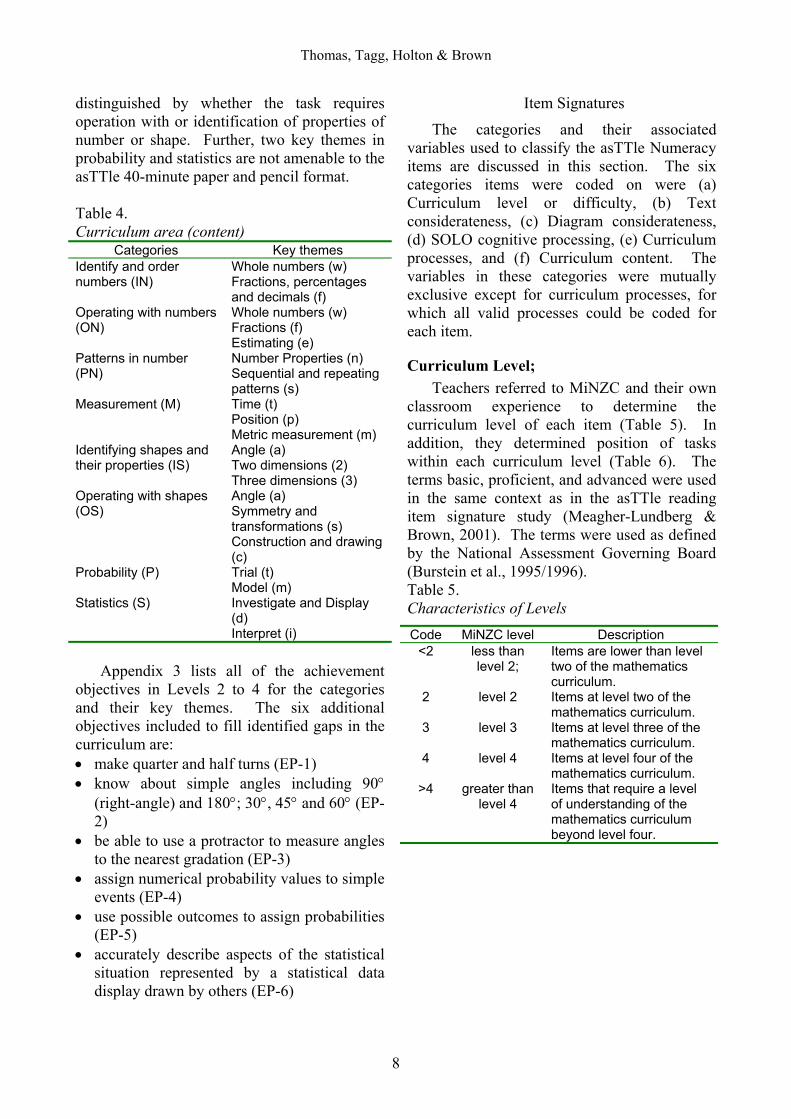
distinguished by whether the task requires operation with or identification of properties of number or shape. Further, two key themes in probability and statistics are not amenable to the asTTle 40-minute paper and pencil format.
Table 4. Curriculum area (content)
Categories Key themes Identify and order numbers (IN)
Whole numbers (w) Fractions, percentages and decimals (f)
Operating with numbers (ON)
Whole numbers (w) Fractions (f) Estimating (e)
Patterns in number (PN)
Number Properties (n) Sequential and repeating patterns (s)
Measurement (M) Time (t) Position (p) Metric measurement (m)
Identifying shapes and their properties (IS)
Angle (a) Two dimensions (2) Three dimensions (3)
Operating with shapes (OS)
Angle (a) Symmetry and transformations (s) Construction and drawing (c)
Probability (P) Trial (t) Model (m)
Statistics (S) Investigate and Display (d) Interpret (i)
Appendix 3 lists all of the achievement
objectives in Levels 2 to 4 for the categories and their key themes. The six additional objectives included to fill identified gaps in the curriculum are: • make quarter and half turns (EP-1) • know about simple angles including 90°
(right-angle) and 180°; 30°, 45° and 60° (EP-2)
• be able to use a protractor to measure angles to the nearest gradation (EP-3)
• assign numerical probability values to simple events (EP-4)
• use possible outcomes to assign probabilities (EP-5)
• accurately describe aspects of the statistical situation represented by a statistical data display drawn by others (EP-6)
Item Signatures
The categories and their associated variables used to classify the asTTle Numeracy items are discussed in this section. The six categories items were coded on were (a) Curriculum level or difficulty, (b) Text considerateness, (c) Diagram considerateness, (d) SOLO cognitive processing, (e) Curriculum processes, and (f) Curriculum content. The variables in these categories were mutually exclusive except for curriculum processes, for which all valid processes could be coded for each item.
Curriculum Level; Teachers referred to MiNZC and their own
classroom experience to determine the curriculum level of each item (Table 5). In addition, they determined position of tasks within each curriculum level (Table 6). The terms basic, proficient, and advanced were used in the same context as in the asTTle reading item signature study (Meagher-Lundberg & Brown, 2001). The terms were used as defined by the National Assessment Governing Board (Burstein et al., 1995/1996). Table 5. Characteristics of Levels Code MiNZC level Description
<2 less than level 2;
Items are lower than level two of the mathematics curriculum.
2 level 2 Items at level two of the mathematics curriculum.
3 level 3 Items at level three of the mathematics curriculum.
4 level 4 Items at level four of the mathematics curriculum.
>4 greater than level 4
Items that require a level of understanding of the mathematics curriculum beyond level four.

Technical Report 25: Numeracy Item Signature
9
Table 6. Characteristics of Sub-Levels Code Position
within level
Description
Bas basic Items that require partial mastery of knowledge and skills that are fundamental for proficient work at the level.
Pro proficient Items that are simple applications of the knowledge and skills of the given level.
Adv advanced Items that are difficult applications of the knowledge and skills at this level.
Considerateness of Text and Diagram The definitions for text considerateness
were adapted from those used in the asTTle reading signature study to make them appropriate for a mathematics context. Unlike the Reading Item Signatures we have not broken the categories into two – one for text and one for items – as there are no texts being used here. We have, however, included categories that involve the reading of the items as this may have some bearing on the students’ ability to complete the items. Although students did read texts in completing the asTTle papers, it is of value to know if the language and settings used in the items are difficult or not. Hence we defined the four classifications to be used in the item signature (Table 7).
Table 7. Characteristics of text Code Text Description
nwp non-word problem
Items that contain no words or a simple direct question or instruction.
wps word problem – straightforward language
These items require the reader to extract some information from the words. Most students at the given level should readily understand these items.
wpc word problem – complex language
These items require the reader to extract some information from the words. They require a considerable knowledge of the English language.
wpn word problem – non-considerate
The words and/or structure of these items get in the way of finding out if the student understands the mathematics of the problem. They may be confusingly or ambiguously structured or have unnecessary words.
The definitions for diagram considerateness
were adapted and expanded from the definitions for illustration considerateness used in the asTTle reading signature study to make them appropriate for a mathematics context. In addition to words, numeracy items may well have pictures or diagrams that enable the problem to be articulated clearly. Table 8 shows the categories used in the item signature.

Thomas, Tagg, Holton & Brown
10
Table 8. Characteristics of diagrams/illustrations Code Illustration /
diagram Description
nid No illustration / diagram
Text only items, or items with a basic diagram provided as an answer space (e.g., clock face).
ild illustration for decoration only
Items with illustrations that provide no information related to the problem but do not make the problem more difficult to interpret.
ilc illustration – considerate
Items which contain illustrations whose meaning is clear and which are helpful and/or necessary to explaining the problem.
iln illustration – non-considerate
Items which contain illustrations related to the problem but which are difficult to understand or ambiguous, and make the problem more difficult.
dgc diagram – considerate
Items that contain an illustration of a technical nature such as a graph, a pie chart, etc. The meaning of the diagram is clear and is necessary to explaining the problem in the item.
dgn diagram – non-considerate
Items that contain an illustration of a technical nature such as a graph, a pie chart, etc. The diagram may be related to the problem but does not make it easier to solve or understand.
SOLO Taxonomy; The SOLO cognitive processing taxonomy
by Biggs and Collis (1982) has been used in the same context as in the asTTle reading item signature study. The SOLO taxonomy is well known but we first give some indication of the meaning of each level (Hattie and Purdie, 1998).
In the pre-structural stage, there is preliminary preparation, but the task itself is not attacked in an appropriate way. A unistructural
task requires one aspect of a task to be picked up or understood serially, with no relationship of facts or ideas. Multistructural tasks use two or more aspects that are picked up or understood serially, but still without relationships. Relational tasks integrate several aspects so that the whole has a coherent structure and meaning. Extended Abstract tasks generalise to a coherent whole at a higher level of abstraction. Table 9. Solo Categories in Mathematics
Code Level Description uni Uni-struc-
tural These items require the knowledge of only one piece of information, obtained directly from the problem.
mul Multi-structural
These items require knowledge of more than one piece of information, each used separately, or two or more distinct steps, with no integration of the ideas.
rel Relational These items require the integration of more than one piece of knowledge. Here at least two separate ideas are required that, working together, will solve the problem. The general principle behind the problem may need to be understood.
ext Extended Abstract
These items require some higher level of abstraction. The items require the student to go beyond the information provided and deduce a more general rule or proof.
As the SOLO taxonomy is being used here
to classify item potential rather than students’ work, the first level is inappropriate. We will therefore only use four of the taxonomy in the item signature (Table 9). We illustrate these aspects of the SOLO taxonomy with reference to Figures 3 and 4.

Technical Report 25: Numeracy Item Signature
11
Figure 3. Year 7, Paper 1, Question 20
Part (a) of Figure 3 only requires a
multistructural response, to answer correctly the student could draw the five house version of the pattern, and count the sticks. The fact that a relational response (deduce that consecutive terms are increasing by 4) could have been used is irrelevant as it is not required to answer the question.
Part (ai) has been added to illustrate an item that requires a relational response. It is not feasible to draw out the 53 houses required to answer this question. Therefore a correct answer to this question implies that the student understands and applies the principle that each successive house adds 4 more sticks.
Part (b) requires an extended abstract response, the student must extend their understanding beyond the information given in the question, and provide a generalisation.
Figure 4. Year 5, Paper 1, Question 15 15. Place =, >, or < to make each number sentence true. (a) 4 + 2 ____ 6 × 1 (b) 12 _____ 9 (c) 5 × 3 _____ 15 + 5
Part (b) of Figure 4 clearly requires only a unistructural response, the two numbers, 12 and 9 are to be compared, 12 is the greater. Part (a) requires a multistructural response, the 4 and the 2 must be added, the 6 and the 1 must be multiplied and a comparison must be made, they are equivalent.
Part (c) may elicit a relational response - if the student recognises that on one side five multiplied by three equals 15 and that the other side has 15 with more added, then they are recognising the principle behind comparison. But the task does not require more than a multistructural response, the 5 and the 3 may be multiplied, the 15 and the 5 added and a comparison made.
Curriculum Area (Processes & Content) In mathematics, processes are more about
the approaches to teaching and learning a topic, rather than about the ways of using the knowledge. Put more simply, students need to engage in the processes in order to learn the content. Because of this, processes in mathematics are very difficult to assess in a written test. Items were coded on the basis of explicit use of a process in order to reach the answer. The three relevant strands of the curriculum will act as the delineators of the categories here (Table 10).
20.
Houses Sticks 1 5 2 9
(a) How many sticks are there for 5 houses? ______ (ai) If 52 houses require 209 sticks, how many sticks do you need to be able to make 53 houses? ______ (b) Make up a rule to count how many sticks are needed for any number of houses. ____________________________________________________________________

Thomas, Tagg, Holton & Brown
12
Table 10. Curriculum area (processes) Code Strand Definition
p Problem Solving
Items that require the student to use a problem solving strategy. For these items the method of solution is not provided in the question.
l Logic and Reasoning
Items that require the student to interpret information, follow a chain of reasoning, or make conjectures in a mathematical context.
c Communicating Mathematical Ideas
Items that require the student to use their own language and/or mathematical language and diagrams to explain mathematical ideas. More than a simple numerical answer is required here, the student is asked either to give an explanation or complete a diagram.
0 No Process Required
These items may be a simple knowledge question, or may have sufficient support given within the question to negate the need for use of a process.
Items could be coded as requiring one or
more process, or they could be coded as 0, no process required. If the item could be correctly answered without the use of a process then the process was not coded.
The curriculum content achievement objectives were taken from the MiNZC document and assigned to the categories outlined in Table 4. The achievement objectives have been placed in sequence to make it easier to assign items. To code an item’s curriculum content the initial letter(s) of the category and key theme (Table 4) are given, followed by the achievement objective (AO) code. For example M-p-m3-2 would refer to measurement, position AO M3-2. Only the category coded is actually used in the results, but the key themes and achievement objectives were included to inform later discussions.
Sample Coding of Items
Two sample items have been chosen to demonstrate coding (Figures 5 and 6). Figure 5. Year 7, Paper 1, Question 21
Curriculum Level 4 Position within Curriculum Level bas Text Considerateness nwp Diagram Considerateness dgc SOLO Taxonomy uni Curriculum Area (Processes) nil Curriculum Area (Content) M-p-g4-5
Technical Report 25: Numeracy Item Signature
13
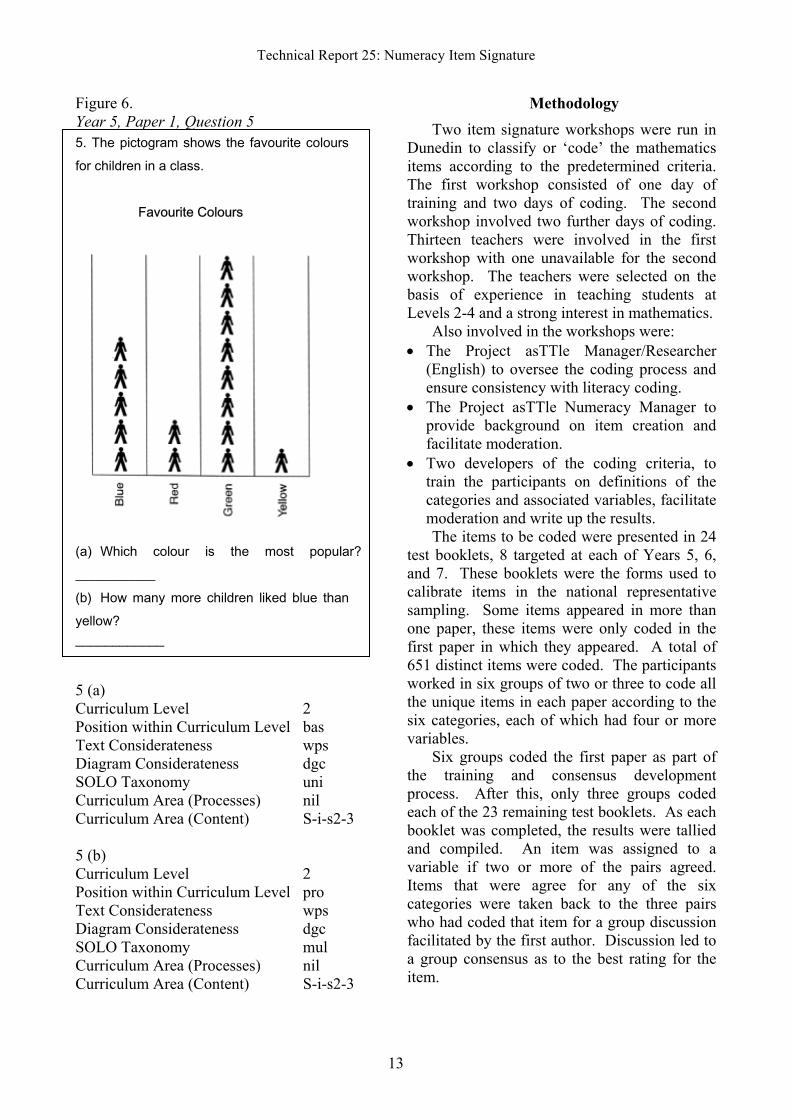
Figure 6. Year 5, Paper 1, Question 5 5. The pictogram shows the favourite colours for children in a class. Favourite Colours
(a) Which colour is the most popular? ____________
(b) How many more children liked blue than yellow? ____________ 5 (a) Curriculum Level 2 Position within Curriculum Level bas Text Considerateness wps Diagram Considerateness dgc SOLO Taxonomy uni Curriculum Area (Processes) nil Curriculum Area (Content) S-i-s2-3 5 (b) Curriculum Level 2 Position within Curriculum Level pro Text Considerateness wps Diagram Considerateness dgc SOLO Taxonomy mul Curriculum Area (Processes) nil Curriculum Area (Content) S-i-s2-3
Methodology Two item signature workshops were run in
Dunedin to classify or ‘code’ the mathematics items according to the predetermined criteria. The first workshop consisted of one day of training and two days of coding. The second workshop involved two further days of coding. Thirteen teachers were involved in the first workshop with one unavailable for the second workshop. The teachers were selected on the basis of experience in teaching students at Levels 2-4 and a strong interest in mathematics.
Also involved in the workshops were: • The Project asTTle Manager/Researcher
(English) to oversee the coding process and ensure consistency with literacy coding.
• The Project asTTle Numeracy Manager to provide background on item creation and facilitate moderation.
• Two developers of the coding criteria, to train the participants on definitions of the categories and associated variables, facilitate moderation and write up the results. The items to be coded were presented in 24
test booklets, 8 targeted at each of Years 5, 6, and 7. These booklets were the forms used to calibrate items in the national representative sampling. Some items appeared in more than one paper, these items were only coded in the first paper in which they appeared. A total of 651 distinct items were coded. The participants worked in six groups of two or three to code all the unique items in each paper according to the six categories, each of which had four or more variables.
Six groups coded the first paper as part of the training and consensus development process. After this, only three groups coded each of the 23 remaining test booklets. As each booklet was completed, the results were tallied and compiled. An item was assigned to a variable if two or more of the pairs agreed. Items that were agree for any of the six categories were taken back to the three pairs who had coded that item for a group discussion facilitated by the first author. Discussion led to a group consensus as to the best rating for the item.
Thomas, Tagg, Holton & Brown
14
Findings
Curriculum Level/Position Within Level
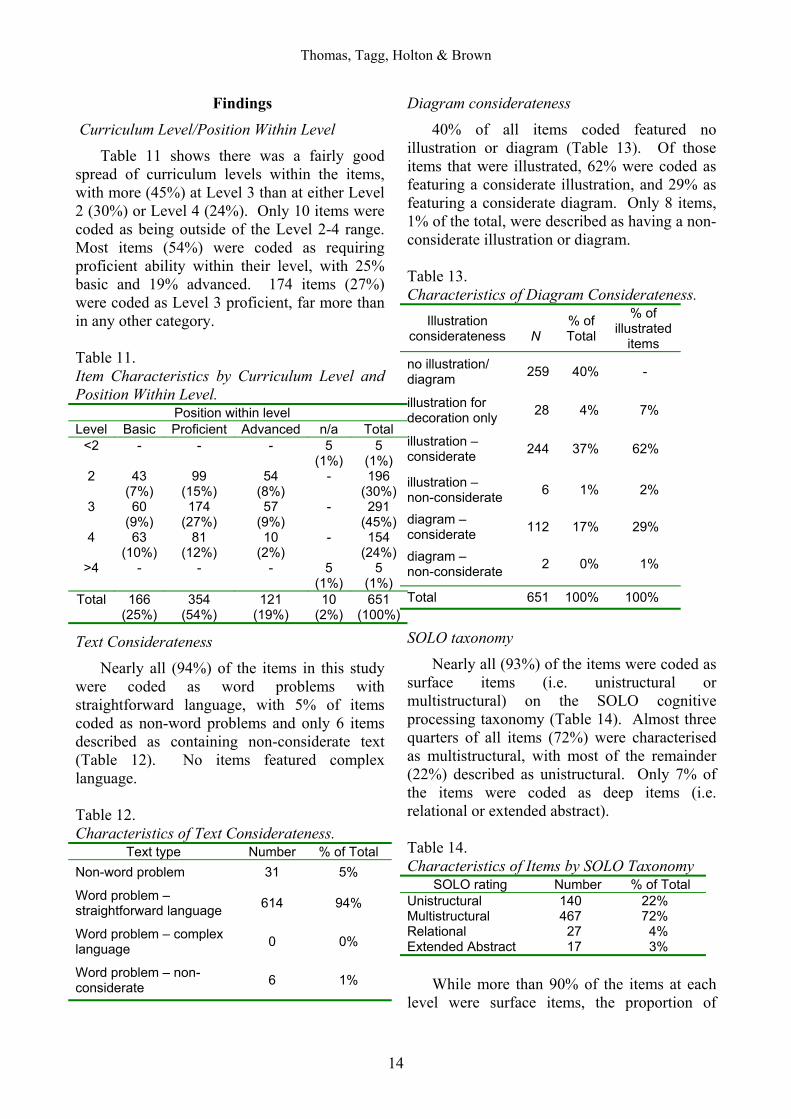
Table 11 shows there was a fairly good spread of curriculum levels within the items, with more (45%) at Level 3 than at either Level 2 (30%) or Level 4 (24%). Only 10 items were coded as being outside of the Level 2-4 range. Most items (54%) were coded as requiring proficient ability within their level, with 25% basic and 19% advanced. 174 items (27%) were coded as Level 3 proficient, far more than in any other category. Table 11. Item Characteristics by Curriculum Level and Position Within Level.
Position within level Level Basic Proficient Advanced n/a Total
<2 - - - 5 (1%)
5 (1%)
2 43 (7%)
99 (15%)
54 (8%)
- 196 (30%)
3 60 (9%)
174 (27%)
57 (9%)
- 291 (45%)
4 63 (10%)
81 (12%)
10 (2%)
- 154 (24%)
>4 - - - 5 (1%)
5 (1%)
Total 166 (25%)
354 (54%)
121 (19%)
10 (2%)
651 (100%)
Text Considerateness
Nearly all (94%) of the items in this study were coded as word problems with straightforward language, with 5% of items coded as non-word problems and only 6 items described as containing non-considerate text (Table 12). No items featured complex language. Table 12. Characteristics of Text Considerateness.
Text type Number % of Total Non-word problem 31 5%
Word problem – straightforward language 614 94%
Word problem – complex language 0 0%
Word problem – non-considerate 6 1%
Diagram considerateness
40% of all items coded featured no illustration or diagram (Table 13). Of those items that were illustrated, 62% were coded as featuring a considerate illustration, and 29% as featuring a considerate diagram. Only 8 items, 1% of the total, were described as having a non-considerate illustration or diagram. Table 13. Characteristics of Diagram Considerateness.
Illustration considerateness
N
% of Total
% of illustrated
items no illustration/ diagram 259 40% -
illustration for decoration only 28 4% 7%
illustration – considerate 244 37% 62%
illustration – non-considerate 6 1% 2%
diagram – considerate 112 17% 29%
diagram – non-considerate 2 0% 1%
Total 651 100% 100%
SOLO taxonomy
Nearly all (93%) of the items were coded as surface items (i.e. unistructural or multistructural) on the SOLO cognitive processing taxonomy (Table 14). Almost three quarters of all items (72%) were characterised as multistructural, with most of the remainder (22%) described as unistructural. Only 7% of the items were coded as deep items (i.e. relational or extended abstract). Table 14. Characteristics of Items by SOLO Taxonomy
SOLO rating Number % of Total Unistructural 140 22% Multistructural 467 72% Relational 27 4% Extended Abstract 17 3%
While more than 90% of the items at each level were surface items, the proportion of

Technical Report 25: Numeracy Item Signature
15
unistructural items decreases as the level of the items increases (Table 15). Over a third (36%) of Level 2 items are unistructural, compared to 19% at Level 3 and only 9% at Level 4. 131 (85%) of the 154 items at level 4 were coded as multistructural. Table 15 Item Characteristics by Level and SOLO Rating
SOLO rating Level Uni Multi Relati
onal Ext. Abs.
Total
<2 2 (40)
3 (60)
5 (100)
2 70 (36)
120 (61)
1 (1)
5 (3)
196 (100)
3 54 (19)
209 (72)
19 (7) 9 (3) 291 (100)
4 14 (9)
131 (85)
6 (4)
3 (2)
154 (100)
>4 4 (80)
1 (20)
5 (100)
Total 140 (22)
467 (72)
27 (4)
17 (3)
651 (100)
Note. Percentages in brackets Curriculum processes
Almost all (92%) of items were coded as requiring none of the processes (Table 16). An ability to communicate mathematical ideas was required for 6% of items, these were mainly items which asked for a justification of an answer. 13 items (2%) required logic and reasoning and only 3 (<1%) the use of problem solving techniques. Table 16. Characteristics of Curriculum Processes.
Strand Number % of Total Problem solving 3 0% Logic & Reasoning 13 2% Communication 41 6% None 599 92%
Curriculum content
Every curriculum content category was represented at each level (Table 17). The highest proportions in the number (12%, 23%, and 10%), measurement (19%), and statistics (15%) categories. The two shapes categories (7% each), and probability (6%) were
comparatively underrepresented. In most categories there were more Level 3 items than either of the other levels, the exceptions being operating with number and operating with shapes, which had more at Level 2, and patterns in number, which had more at Level 4. Table 17. Item Characteristics by Level and Curriculum Content.
Level Category <2 2 3 4 >4 Total
Identify and order numbers
-
13 (2)
46 (7)
19 (3)
-
78 (12)
Operating with numbers
-
67 (10)
56 (9)
28 (4)
- 151 (23)
Patterns in number -
12 (2)
23 (4)
27 (4)
- 62 (10)
Measurement -
43 (7)
60 (9)
20 (3)
- 123 (19)
Identifying shapes -
3 (0)
26 (4)
17 (3)
- 46 (7)
Operating with shapes
-
17 (3)
15 (2)
14 (2)
- 46 (7)
Probability -
7 (1)
21 (3)
8 (1)
- 36 (6)
Statistics -
34 (5)
44 (7)
21 (3)
- 99 (15)
NIL 5 (1)
-
-
-
5 (1)
10 (2)
Total 5 (1)
196 (30)
291 (45)
154 (24)
5 (1)
651 (100)
Note. Percentages in brackets
Level of agreement
A number of measures of agreement were calculated, including percentage of agreed decisions, dependability index for all ratings, and agreement between developers and item signature study raters.
The numbers of cases where there was not initially two out of three agreement were tallied for each paper. Detailed tables can be found in Appendix 4. There were 320 instances of lack of agreement spread over the 3,906 rating decisions for 651 items and six categories (Table 18). Nearly half of them (157, or 49%) were in the level/position within level category, with a further 99 (31%) in the curriculum content category. These were the two categories with the greatest number of variables (11 for level and 116 for content).

Thomas, Tagg, Holton & Brown
16
Percentage agreement was very high in all categories, ranging from 99% for text considerateness to 76% for level/position within level. The overall percentage agreement was 92%.
Table 18 Number of Lack of Agreements and Percentage Agreement for all Categories
Category # of Lack of Agreement
% agreement
Level 157 76 Text 7 99 Diagram 28 96 SOLO 19 97 Process 10 98 Content 99 85
Total 320 92
For the level/position within level and SOLO categories the dependability of coder scoring was measured using the Brennan and Kane Dependability Index.
The Brennan and Kane Dependability Index (φ) is calculated by obtaining the between-subjects effects error mean square, and dividing it by the sum of the absolute error variance of the set of ratings and itself (1). Values greater than .80 are considered dependable (Shavelson & Webb, 1991).
φ = σ2p / (σ2
p + σ2ABS) (1)
Results for averaged dependability across 651 items are presented in Table 19. Note that SPSS limits the number of items per calculation to 99 and so these results are averaged across seven iterations. The dependability of the coders was very good (0.879) for the level/position within level category, and exceptional (0.922) for SOLO. The dependability index clearly exceeded the requisite 0.8 to show dependability in both cases.
Table 19. Calculation of the Brennan and Kane Dependability Index (φ) – Results of the Calculations
Category σ2i σ2
p σ2pi,e σ2
ABS φ
Level position 12.390 3.317 1.211 0.151 0.879SOLO 0.665 0.174 0.615 0.014 0.922
Another approach to the consistency of coding was to compare the intended curriculum level and strand of each item to the coded curriculum level and strand for each item. Over three quarters (76%) of items were coded to the same level of the curriculum as they were written for (Table 20). Of the 155 items that were not coded to the same level they were written to 89 (57%) were coded one level lower, 49 (32%) were coded one level higher, and only 17 (11%) were coded two levels away from their intended level. Table 20. Comparison of Writer Levels and Coded Levels
Coded Level Writer Level <2 2 3 4 >4 Total
2 4 (2)
155(81)
26 (14)
6 (3)
0 (0)
191 (100)
3 1 (0)
32(12)
212 (80)
19 (7)
1 (0)
265 (100)
4 0 (0)
9(5)
53 (27)
129 (66)
4 (2)
195 (100)
Total 5 (1)
196(30)
291 (45)
154 (24)
5 (1)
651 (100)
Note. Percentages in brackets
Of the 651 items, 602 (92%) were coded to the same strand of the curriculum as they had been written for (Table 21). Of the 49 that were coded to a different strand, 10 were not coded to a strand because they were outside the Level 2-4 range targeted. With the exception of Algebra, at least 94% of items written for any specific strand were assigned to the same strand in the item signature study. 16% of items written for Algebra were coded as Number items. This illustrates the strong link between Algebra and Number at the lower levels of the curriculum.

Technical Report 25: Numeracy Item Signature
17
Table 21. Comparison of Writer Strands and Coded Strands
Coded Strand Intended Strand Algebra Geometry Measurement Number Statistics NIL Total
Algebra 79 1 16 5 1 102 (77) (1) (16) (5) (1) (100) Geometry 102 3 2 2 109 (94) (3) (2) (2) (100) Measurement 120 4 1 2 127 (94) (3) (1) (2) (100) Number 7 171 3 181 (4) (94) (2) (100) Statistics 1 2 127 2 132 (1) (2) (96) (2) (100) Total 80 104 131 191 135 10 651 (12) (16) (20) (29) (21) (2) (100) Note. Percentages in brackets
Summary of Findings
Characteristics of Items
A total of 651 items were analysed and assigned to values for each of six categories deemed important to the completion of mathematics tasks. • Curriculum Level/Position Within Level
45% of items were coded at Level 3, 30% at Level 2 and 24% at Level 4. Only 10 items were coded as being outside of the Level 2-4 range. 54% of all items were coded as requiring proficient ability within their level, with 25% basic and 19% advanced. 174 items (27%) were coded as Level 3 proficient, far more than in any other category.
• Text Considerateness Nearly all (94%) of the items in this study were coded as word problems with straightforward language, with 5% of items coded as non-word problems and only 6 items described as containing non-considerate text. No items featured complex language.
• Diagram considerateness 40% of all items coded featured no illustration or diagram. Of those items that were illustrated, 62% were coded as featuring a considerate illustration, and 29%
as featuring a considerate diagram. Only 8 items, 1% of the total, were described as having a non-considerate illustration or diagram.
• SOLO taxonomy Nearly all (93%) of the items were coded as surface items (i.e. unistructural or multistructural). Almost three quarters of all items (72%) were characterised as multistructural. Only 7% of the items were coded as deep items (i.e. relational or extended abstract). While more than 90% of the items at each level were considered surface items, the proportion of unistructural items decreases as the level of the items increases.
• Curriculum processes 92% of items were coded as requiring none of the processes. An ability to communicate mathematical ideas was required for 6% of items, these were mainly items which asked for a justification of an assertion. 13 items (2%) required logic and reasoning and only 3 (<1%) the use of problem solving techniques.
• Curriculum content Every curriculum content category was represented at each level, with the highest proportions in the number (12%, 23%, and 10%), measurement (19%) and statistics (15%) categories. The two shapes

Thomas, Tagg, Holton & Brown
18
categories (7% each), and probability (6%) were comparatively underrepresented.
Level of Agreement
The level of inter-rater agreement was very high in all categories, ranging from 99% for text considerateness to 76% for level/position within level. The overall percentage agreement was 92%. Rater scoring measured using the Brennan and Kane Dependability Index clearly exceeded the 0.80 threshold for this index.
Recommendations
The results of the coding workshops have identified some key gaps in the item bank. Specifically, there are only 10 items (<2%) rated as Level 4 advanced and only 43 items (7%) at Level 2 basic. There are several curriculum categories with very few items, most notably in Probability, where there are only 7 items at Level 2 and 8 items at Level 4. More items should be written so that there are at least 50 items at each curriculum level, and at least 20 items at each level within each content category to offer adequate coverage within the bank.
The majority (72%) of all items were coded as multistructural on the SOLO taxonomy, with very few (7%) coded as either relational or extended abstract. There is some question as to the reason for this and further investigation and possible recoding of this feature of the items is required (See appendix 5 for resolution of this issue).
References
Australian Educational Council (1990). A national statement on mathematics for Australian schools. Carlton, Vic.: Curriculum Corporation.
Biggs. J. & Collis, K. (1982). Evaluating the quality of learning – the SOLO taxonomy (1st ed.) New York: Academic Press.
Burstein, L, Koretz, D., Linn, R., Sugrue, B., Novak, J., Baker, E., & Harris, E. (1995/1996). Describing performance standards: Validity of the 1992 National assessment of educational progress achievement level descriptors as
characterisations of mathematics performance. Educational Assessment 3(1), 9-51.
Ell, F. (2001). Mathematics in the New Zealand Curriculum – a concept map of the curriculum document. Technical Report 11, Project asTTle, University of Auckland.
Hattie, J., & Purdie, N. (1998). The power of the SOLO model to address fundamental measurement issues. In B. Dart & G. Boulton-Lewis (Eds.). Learning and teaching in higher education. (pp. 145-176). Melbourne: ACER.
Holton, D. (1993). What mathematicians do and why it is important in the classroom. set: Research for teachers (1), item 10.
Holton, D. (1998). Lighting mathematical fires. Carlton, Vic: Curriculum Corporation
International Association for the Evaluation of Educational Achievement (2001). TIMSS assessment frameworks and specifications 2003. Boston: International Study Centre, Lynch School of Education, Boston College.
Lakatos, I. (1977). Proofs and refutations: The logic of mathematical discovery. Cambridge: Cambridge University Press.
Meagher-Lundberg, P. & Brown, G. (2001). Item signature study: Report on the characteristics of reading texts and items from calibration 1. Technical Report 12, Project asTTle, University of Auckland.
Ministry of Education, (1992). Mathematics in the New Zealand Curriculum. Wellington: Learning Media.
Ministry of Education, (2002a). National Exemplar Project. Wellington: Learning Media.
Ministry of Education, (2002b). Numeracy Project, Book 1, The Number Framework. Wellington: Learning Media.
National Council of Teachers of Mathematics (1989). Curriculum and evaluation standards for school mathematics. Reston, Va.: NCTM.
Polya, G. (1973). How to solve it. Princeton, NJ: Princeton University Press.

Technical Report 25: Numeracy Item Signature
19
Shavelson, R. J., & Webb, N. M. (1991). Generalizability Theory. A Primer. Newbury Park, CA: Sage.
Stacey, K. & MacGregor, M. (1999). Taking the algebraic thinking out of algebra. Mathematics Education Research Journal 11(1), 24-38.
Technical Report 25, April 2002
20
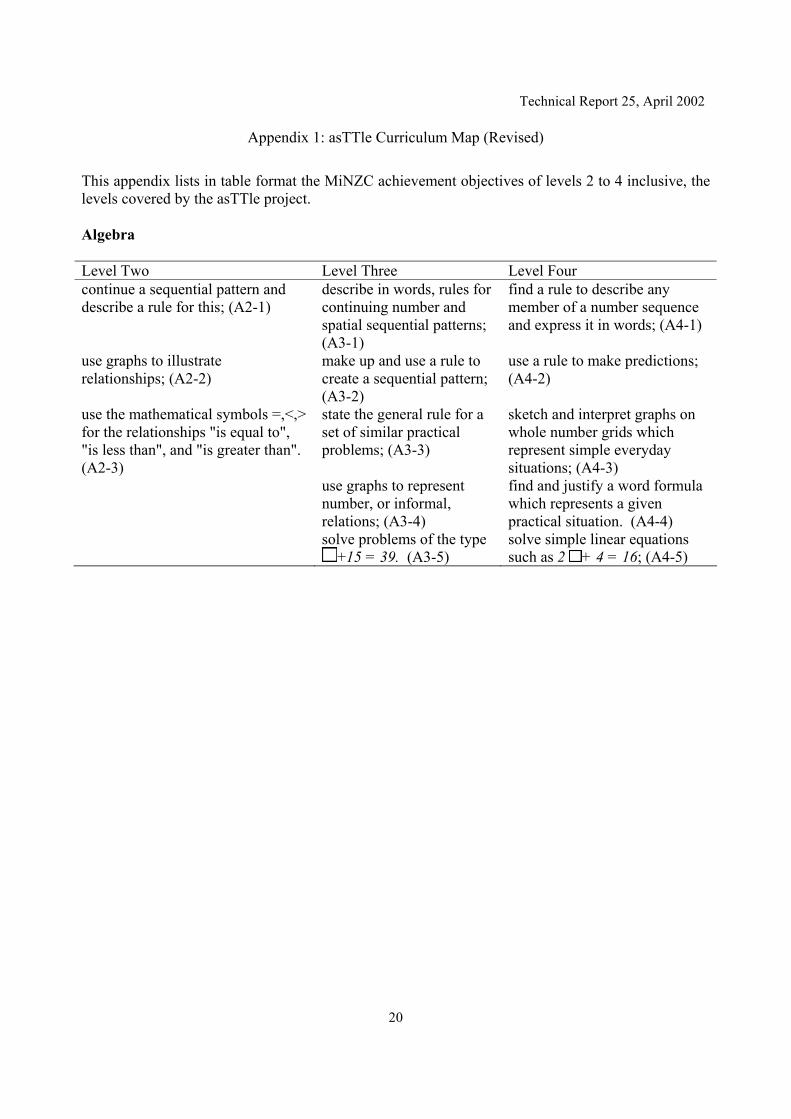
Appendix 1: asTTle Curriculum Map (Revised)
This appendix lists in table format the MiNZC achievement objectives of levels 2 to 4 inclusive, the levels covered by the asTTle project. Algebra Level Two Level Three Level Four continue a sequential pattern and describe a rule for this; (A2-1)
describe in words, rules for continuing number and spatial sequential patterns; (A3-1)
find a rule to describe any member of a number sequence and express it in words; (A4-1)
use graphs to illustrate relationships; (A2-2)
make up and use a rule to create a sequential pattern; (A3-2)
use a rule to make predictions; (A4-2)
use the mathematical symbols =,<,> for the relationships "is equal to", "is less than", and "is greater than". (A2-3)
state the general rule for a set of similar practical problems; (A3-3)
sketch and interpret graphs on whole number grids which represent simple everyday situations; (A4-3)
use graphs to represent number, or informal, relations; (A3-4)
find and justify a word formula which represents a given practical situation. (A4-4)
solve problems of the type +15 = 39. (A3-5)
solve simple linear equations such as 2 + 4 = 16; (A4-5)

Technical Report 25: Numeracy Item Signature
21
Geometry Level Two Level Three Level Four make, name, and describe, using their own language and the language of geometry, everyday shapes and objects; (G2-1)
describe the features of 2-dimensional and 3-dimensional objects, using the language of geometry; (G3-1)
construct triangles and circles, using appropriate drawing instruments; (G4-1)
describe and interpret position, using the language of direction and distance; (G2-2)
design and make containers to specified requirements; (G3-2)
design the net and make a simple polyhedron to specified dimensions; (G4-2)
create and talk about geometric patterns which repeat (show translation), or which have rotational or reflection symmetry; (G2-3)
model and describe 3-dimensional objects illustrated by diagrams or pictures; (G3-3)
make a model of a solid object from diagrams which show views from the top, front, side, and back; (G4-3)
make clockwise and anticlockwise turns. (G2-4)
draw pictures of simple 3-dimensional objects; (G3-4)
draw diagrams of solid objects made from cubes; (G4-4)
draw and interpret simple scale maps; (G3-5)
specify location, using bearings or grid references; (G4-5)
describe patterns in terms of reflection and rotational symmetry, and translations; (G3-6)
apply the symmetries of regular polygons; (G4-6)
design and make a pattern which involves translation, reflection, or rotation; (G3-7)
describe the reflection or rotational symmetry of a figure or object; (G4-7)
enlarge, on grid paper, simple shapes to a specified scale. (G3-8)
enlarge and reduce a 2-dimensional shape and identify the invariant properties. (G4-8)

Thomas, Tagg, Holton & Brown
22
Measurement Level Two Level Three Level Four carry out practical measuring tasks, using appropriate metric units for length, mass, and capacity; (M2-1)
demonstrate knowledge of the basic units of length, mass, area, volume (capacity), and temperature by making reasonable estimates; (M3-1)
carry out measuring tasks involving reading scales to the nearest gradation; (M4-1)
give change for sums of money; (M2-2)
perform measuring tasks, using a range of units and scales; (M3-2)
calculate perimeters of circles, rectangles, and triangles, areas of rectangles, and volumes of cuboids from measurements of length; (M4-2)
represent a sum of money by two or more different combinations of notes and coins; (M2-3)
read and interpret everyday statements involving time; (M3-3)
read and construct a variety of scales, timetables, and charts; (M4-3)
read time and know the units of time &; minute, hour, day, week, month, and year. (M2-4)
show analogue time as digital time, and vice versa. (M3-4)
design and use a simple scale to measure qualitative data; (M4-4)
perform calculations with time, including 24-hour clock times. (M4-5)

Technical Report 25: Numeracy Item Signature
23
Number Level Two Level Three Level Four read any 3-digit whole number; (N2-1)
explain the meaning of the digits in any whole number; (N3-1)
explain the meaning of negative numbers; (N4-1)
explain the meaning of the digits in 2- or 3-digit whole numbers; (N2-2)
explain the meaning of the digits in decimal numbers with up to 3 decimal places; (N3-2)
explain the meaning and evaluate powers of whole numbers; (N4-2)
order any set of three or more whole numbers (up to 99); (N2-3)
order decimals with up to 3 decimal places; (N3-3)
find fractions equivalent to one given; (N4-3)
write and solve comparison problems; (N2-4)
make sensible estimates and check the reasonableness of answers; (N3-4)
express a fraction as a decimal, and vice versa; (N4-4)
write and solve story problems which involve halves, quarters, thirds, and fifths; (N2-5)
recall the basic multiplication facts; (N3-5)
express a decimal as a percentage, and vice versa; (N4-5)
make sensible estimates and check the reasonableness of answers; (N2-6)
write and solve problems which involve whole numbers and decimals and which require a choice of one or more of the four arithmetic operations; (N3-6)
express quantities as fractions or percentages of a whole. (N4-6)
recall the basic addition and subtraction facts; (N2-7)
solve practical problems which require finding fractions of whole number and decimal amounts. (N3-7)
make sensible estimates and check the reasonableness of answers; (N4-7)
mentally perform calculations involving addition and subtraction; (N2-8)
write and solve problems involving decimal multiplication and division; (N4-8)
demonstrate the ability to use the multiplication facts; (N2-9)
find a given fraction or percentage of a quantity; (N4-9)
write and solve story problems which involve whole numbers, using addition, subtraction, multiplication, or division; (N2-10)
explain satisfactory algorithms for addition, subtraction, and multiplication; (N4-10)
write and solve story problems which require a choice of any combination of the four arithmetic operations. (N2-11)
demonstrate knowledge of the conventions for order of operations. (N4-11)

Thomas, Tagg, Holton & Brown
24
Statistics Level Two Level Three Level Four collect and display category data and whole number data in pictograms, tally charts, and bar charts, as appropriate; (S2-1)
plan a statistical investigation of an assertion about a situation; (S3-1)
plan a statistical investigation arising from the consideration of an issue or an experiment of interest; (S4-1)
talk about the features of their own data displays; (S2-2)
collect and display discrete numeric data in stem-and-leaf graphs, dot plots, and strip graphs, as appropriate. (S3-2)
collect appropriate data; (S4-2)
make sensible statements about the situation represented by a statistical data display drawn by others; (S2-3)
use their own language to talk about the distinctive features, such as outliers and clusters, in their own and others' data displays; (S3-3)
choose and construct quality data displays (frequency tables, bar charts, and histograms) to communicate significant features in measurement data; (S4-3)
compare familiar or imaginary, but related, events and order them on a scale from least likely to most likely. (S2-4)
make sensible statements about an assertion on the basis of the evidence of a statistical investigation. (S3-4)
collect and display time-series data. (S4-4)
use a systematic approach to count a set of possible outcomes; (S3-5)
report the distinctive features (outliers, clusters, and shape of data distribution) of data displays; (S4-5)
predict the likelihood of outcomes on the basis of a set of observations. (S3-6)
evaluate others' interpretations of data displays; (S4-6)
make statements about implications and possible actions consistent with the results of a statistical investigation; (S4-7)
estimate the relative frequencies of events and mark them on a scale; (S4-8)
find all possible outcomes for a sequence of events, using tree diagrams; (S4-9)

Technical Report 25, April 2002
25
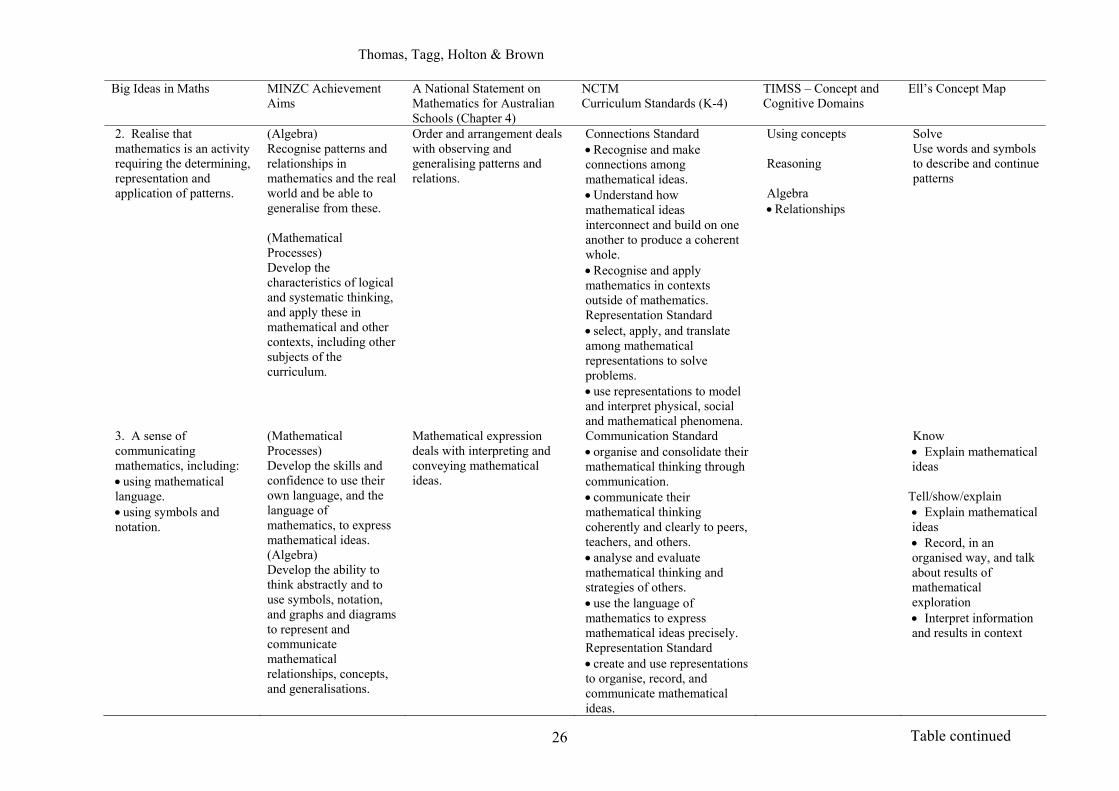
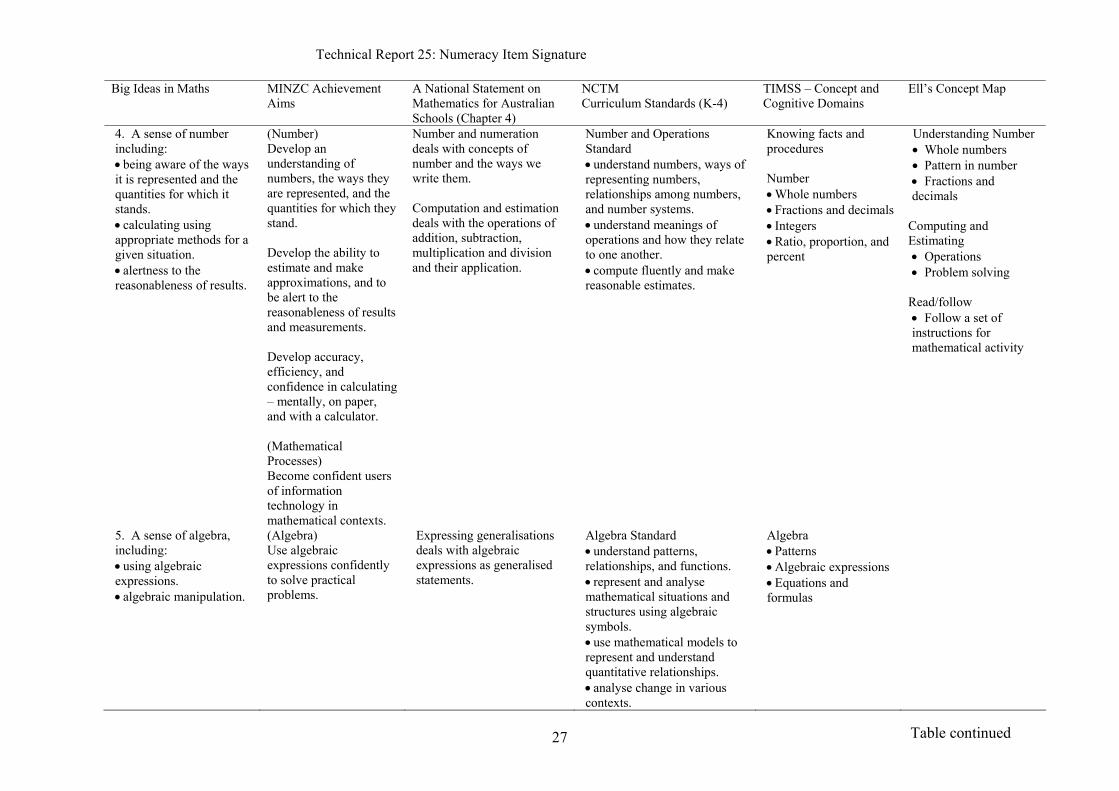
Appendix 2: Mathematical Big Ideas Comparison
This appendix links the big ideas of mathematics to the New Zealand Curriculum, The Australian National statement, the National Council of Teachers of Mathematics ‘Standards’, the TIMSS2 Assessment Frameworks and Specifications 2003, and asTTle curriculum map (technical report 11).
Big Ideas in Maths MINZC Achievement Aims
A National Statement on Mathematics for Australian Schools (Chapter 4)
NCTM Curriculum Standards (K-4)
TIMSS – Concept and Cognitive Domains
Ell’s Concept Map
1. An understanding that mathematics is about solving real problems: • relating concepts or procedures to one another. • applying mathematical processes to familiar and unfamiliar problems in a mathematical context and in daily life. • developing new mathematics.
(Mathematical Processes) Develop flexibility and creativity in applying mathematical ideas and techniques to unfamiliar problems arising in everyday life, and develop the ability to reflect critically on the methods they have chosen. Develop the skills of presentation and critical appraisal of a mathematical argument or calculation, use mathematics to explore or conjecture, and learn from mistakes as well as successes.
Appreciations deals with the development of an appreciation of the nature, power and scope of mathematical activity. Mathematical modelling deals with the more general processes by which ‘real world’ phenomena are represented in order that mathematics may be applied to them. Applying mathematics deals with choosing and using standard mathematical techniques in situations in which mathematics may be useful. Problem-solving strategies deals with a range of strategies for problem posing and solving.
Problem Solving Standard • build new mathematical knowledge through problem solving. • solve problems that arise in other contexts. • apply and adapt a variety of appropriate strategies to solve problems. • monitor and reflect on the process of mathematical problem solving. Reasoning and Proof Standard • recognise reasoning and proof as fundamental aspects of mathematics. • make and investigate mathematical conjectures. • develop and evaluate mathematical arguments and proofs. • select and use various types of reasoning and methods of proof.
Solving routine problems Reasoning Using concepts
Pose/write/create/design • Pose questions for mathematical exploration • Devise a set of instructions Model/make/carry out • Devise and use problem solving strategies • Use equipment appropriately
2 Trends in Mathematics and Science Study.
Table continued
Thomas, Tagg, Holton & Brown
26
Big Ideas in Maths MINZC Achievement
Aims A National Statement on Mathematics for Australian Schools (Chapter 4)
NCTM Curriculum Standards (K-4)
TIMSS – Concept and Cognitive Domains
Ell’s Concept Map
2. Realise that mathematics is an activity requiring the determining, representation and application of patterns.
(Algebra) Recognise patterns and relationships in mathematics and the real world and be able to generalise from these. (Mathematical Processes) Develop the characteristics of logical and systematic thinking, and apply these in mathematical and other contexts, including other subjects of the curriculum.
Order and arrangement deals with observing and generalising patterns and relations.
Connections Standard • Recognise and make connections among mathematical ideas. • Understand how mathematical ideas interconnect and build on one another to produce a coherent whole. • Recognise and apply mathematics in contexts outside of mathematics. Representation Standard • select, apply, and translate among mathematical representations to solve problems. • use representations to model and interpret physical, social and mathematical phenomena.
Using concepts Reasoning Algebra • Relationships
Solve Use words and symbols to describe and continue patterns
3. A sense of communicating mathematics, including: • using mathematical language. • using symbols and notation.
(Mathematical Processes) Develop the skills and confidence to use their own language, and the language of mathematics, to express mathematical ideas. (Algebra) Develop the ability to think abstractly and to use symbols, notation, and graphs and diagrams to represent and communicate mathematical relationships, concepts, and generalisations.
Mathematical expression deals with interpreting and conveying mathematical ideas.
Communication Standard • organise and consolidate their mathematical thinking through communication. • communicate their mathematical thinking coherently and clearly to peers, teachers, and others. • analyse and evaluate mathematical thinking and strategies of others. • use the language of mathematics to express mathematical ideas precisely. Representation Standard • create and use representations to organise, record, and communicate mathematical ideas.
Know • Explain mathematical ideas
Tell/show/explain • Explain mathematical ideas • Record, in an organised way, and talk about results of mathematical exploration • Interpret information and results in context
Table continued
Technical Report 25: Numeracy Item Signature
27
Big Ideas in Maths MINZC Achievement
Aims A National Statement on Mathematics for Australian Schools (Chapter 4)
NCTM Curriculum Standards (K-4)
TIMSS – Concept and Cognitive Domains
Ell’s Concept Map
4. A sense of number including: • being aware of the ways it is represented and the quantities for which it stands. • calculating using appropriate methods for a given situation. • alertness to the reasonableness of results.
(Number) Develop an understanding of numbers, the ways they are represented, and the quantities for which they stand. Develop the ability to estimate and make approximations, and to be alert to the reasonableness of results and measurements. Develop accuracy, efficiency, and confidence in calculating – mentally, on paper, and with a calculator. (Mathematical Processes) Become confident users of information technology in mathematical contexts.
Number and numeration deals with concepts of number and the ways we write them. Computation and estimation deals with the operations of addition, subtraction, multiplication and division and their application.
Number and Operations Standard • understand numbers, ways of representing numbers, relationships among numbers, and number systems. • understand meanings of operations and how they relate to one another. • compute fluently and make reasonable estimates.
Knowing facts and procedures Number • Whole numbers • Fractions and decimals • Integers • Ratio, proportion, and percent
Understanding Number • Whole numbers • Pattern in number • Fractions and decimals
Computing and Estimating • Operations • Problem solving
Read/follow • Follow a set of instructions for mathematical activity
5. A sense of algebra, including: • using algebraic expressions. • algebraic manipulation.
(Algebra) Use algebraic expressions confidently to solve practical problems.
Expressing generalisations deals with algebraic expressions as generalised statements.
Algebra Standard • understand patterns, relationships, and functions. • represent and analyse mathematical situations and structures using algebraic symbols. • use mathematical models to represent and understand quantitative relationships. • analyse change in various contexts.
Algebra • Patterns • Algebraic expressions • Equations and formulas
Table continued
Thomas, Tagg, Holton & Brown
28
Big Ideas in Maths MINZC Achievement
Aims A National Statement on Mathematics for Australian Schools (Chapter 4)
NCTM Curriculum Standards (K-4)
TIMSS – Concept and Cognitive Domains
Ell’s Concept Map
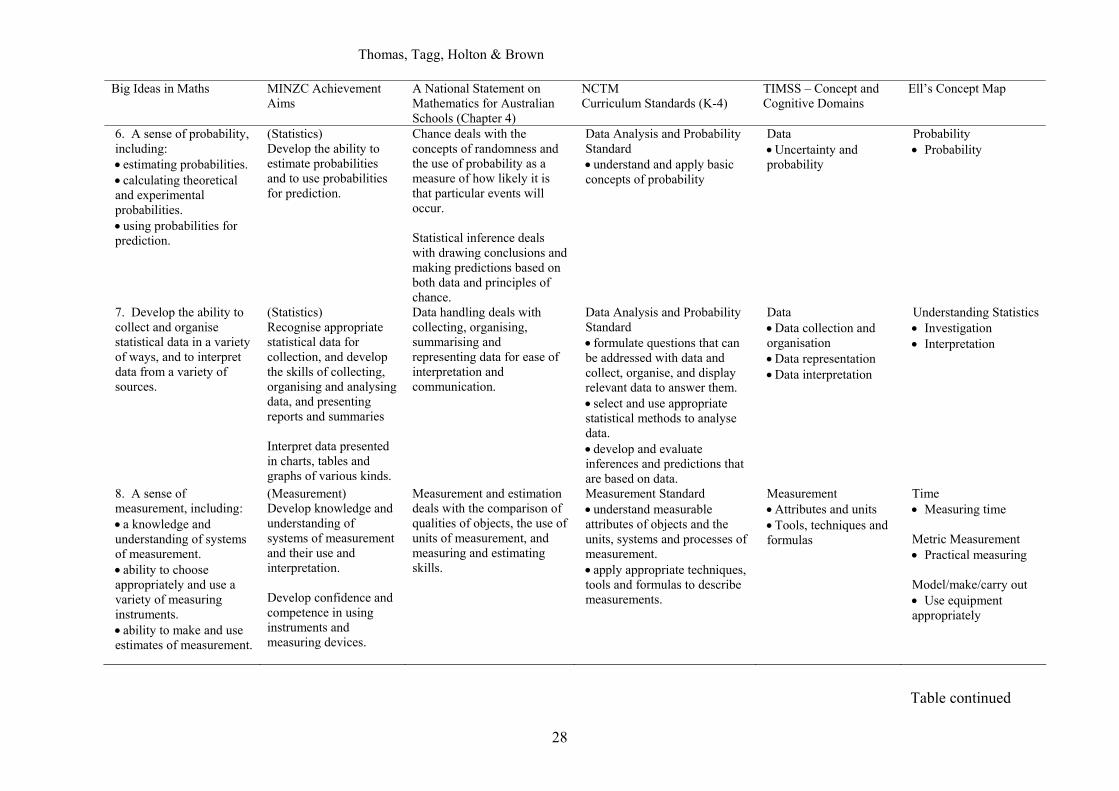
6. A sense of probability, including: • estimating probabilities. • calculating theoretical and experimental probabilities. • using probabilities for prediction.
(Statistics) Develop the ability to estimate probabilities and to use probabilities for prediction.
Chance deals with the concepts of randomness and the use of probability as a measure of how likely it is that particular events will occur. Statistical inference deals with drawing conclusions and making predictions based on both data and principles of chance.
Data Analysis and Probability Standard • understand and apply basic concepts of probability
Data • Uncertainty and probability
Probability • Probability
7. Develop the ability to collect and organise statistical data in a variety of ways, and to interpret data from a variety of sources.
(Statistics) Recognise appropriate statistical data for collection, and develop the skills of collecting, organising and analysing data, and presenting reports and summaries Interpret data presented in charts, tables and graphs of various kinds.
Data handling deals with collecting, organising, summarising and representing data for ease of interpretation and communication.
Data Analysis and Probability Standard • formulate questions that can be addressed with data and collect, organise, and display relevant data to answer them. • select and use appropriate statistical methods to analyse data. • develop and evaluate inferences and predictions that are based on data.
Data • Data collection and organisation • Data representation • Data interpretation
Understanding Statistics • Investigation • Interpretation
8. A sense of measurement, including: • a knowledge and understanding of systems of measurement. • ability to choose appropriately and use a variety of measuring instruments. • ability to make and use estimates of measurement.
(Measurement) Develop knowledge and understanding of systems of measurement and their use and interpretation. Develop confidence and competence in using instruments and measuring devices.
Measurement and estimation deals with the comparison of qualities of objects, the use of units of measurement, and measuring and estimating skills.
Measurement Standard • understand measurable attributes of objects and the units, systems and processes of measurement. • apply appropriate techniques, tools and formulas to describe measurements.
Measurement • Attributes and units • Tools, techniques and formulas
Time • Measuring time Metric Measurement • Practical measuring Model/make/carry out • Use equipment appropriately
Table continued

Technical Report 25: Numeracy Item Signature
29
Big Ideas in Maths MINZC Achievement
Aims A National Statement on Mathematics for Australian Schools (Chapter 4)
NCTM Curriculum Standards (K-4)
TIMSS – Concept and Cognitive Domains
Ell’s Concept Map
9. A sense of geometry, including: • recognising and being able to describe, classify, draw, and make use of geometric shapes and objects. • recognising the occurrence of geometric shapes in the environment.
(Geometry) Gain a knowledge of geometric relations in two and three dimensions, and recognise and appreciate their occurrence in the environment. Develop spatial awareness and the ability to recognise and make use of the geometric properties and symmetries of everyday objects.
Shape and structure deals with the properties of two- and three-dimensional objects and the relationship between shape, structure and function. Transformation and symmetry deals with the mathematical equivalent of changes of position, orientation, size and shape, and with symmetries in shape and arrangement.
Geometry Standard • analyse characteristics and properties of two- and three-dimensional geometric shapes and develop mathematical arguments about geometric relationships. • specify locations and describe spatial relationships using coordinate geometry and other representational systems • apply transformations and use symmetry to analyse mathematical situations. • use visualisation, spatial reasoning, and geometric modelling to solve problems.
Geometry • Lines and angles • Two and three-dimensional shapes • Congruence and similarity • Locations and spatial relationships • Symmetry and transformations
Space and Shape • Shape • Position Transformation and Symmetry • Transformation and Symmetry Solve • Classify objects

Technical Report 25, April 2002
30
Appendix 3: MiNZC Curriculum Achievement Objectives Levels 2-4
This appendix lists in table format the MiNZC achievement objectives of levels 2 to 4 inclusive, the levels covered by the asTTle project, divided into the categories and key themes for item coding. Identify and order numbers Level 2 Level 3 Level 4
Whole numbers read any 3-digit whole number (N2-1)
explain the meaning of the digits in 2- or 3-digit whole numbers (N2-2)
explain the meaning of the digits in any whole number (N3-1)
explain the meaning of negative numbers (N4-1)
order any set of three or more whole numbers (up to 99) (N2-3)
explain the meaning and evaluate powers of whole numbers (N4-2)
represent a sum of money by two or more different combinations of notes and coins (M2-3) 3
Fractions, percentages and decimals
write and solve story problems which involve halves, quarters, thirds, and fifths (N2-5)
explain the meaning of the digits in decimal numbers with up to 3 decimal places (N3-2)
order decimals with up to three decimal places (N3-3)
3 In practice money is taught as a whole number activity.
Technical Report 25: Numeracy Item Signature
31
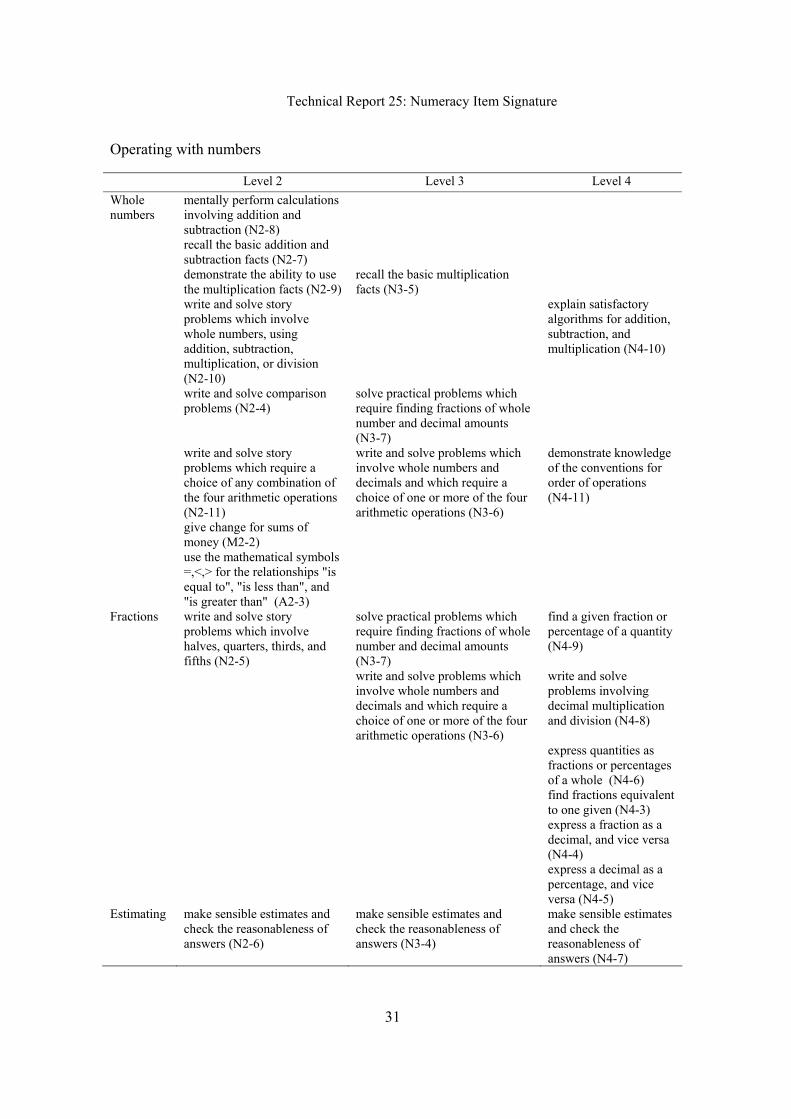
Operating with numbers Level 2 Level 3 Level 4 Whole numbers
mentally perform calculations involving addition and subtraction (N2-8)
recall the basic addition and subtraction facts (N2-7)
demonstrate the ability to use the multiplication facts (N2-9)
recall the basic multiplication facts (N3-5)
write and solve story problems which involve whole numbers, using addition, subtraction, multiplication, or division (N2-10)
explain satisfactory algorithms for addition, subtraction, and multiplication (N4-10)
write and solve comparison problems (N2-4)
solve practical problems which require finding fractions of whole number and decimal amounts (N3-7)
write and solve story problems which require a choice of any combination of the four arithmetic operations (N2-11)
write and solve problems which involve whole numbers and decimals and which require a choice of one or more of the four arithmetic operations (N3-6)
demonstrate knowledge of the conventions for order of operations (N4-11)
give change for sums of money (M2-2)
use the mathematical symbols =,<,> for the relationships "is equal to", "is less than", and "is greater than" (A2-3)
Fractions write and solve story problems which involve halves, quarters, thirds, and fifths (N2-5)
solve practical problems which require finding fractions of whole number and decimal amounts (N3-7)
find a given fraction or percentage of a quantity (N4-9)
write and solve problems which involve whole numbers and decimals and which require a choice of one or more of the four arithmetic operations (N3-6)
write and solve problems involving decimal multiplication and division (N4-8)
express quantities as fractions or percentages of a whole (N4-6)
find fractions equivalent to one given (N4-3)
express a fraction as a decimal, and vice versa (N4-4)
express a decimal as a percentage, and vice versa (N4-5)
Estimating make sensible estimates and check the reasonableness of answers (N2-6)
make sensible estimates and check the reasonableness of answers (N3-4)
make sensible estimates and check the reasonableness of answers (N4-7)

Thomas, Tagg, Holton & Brown
32
Patterns in number Level 2 Level 3 Level 4
Number Properties
solve problems of the type +15 = 39 (A3-5)
solve simple linear equations such as 2 + 4 = 16 (A4-5)
demonstrate knowledge of the conventions for order of operations (N4-11)
Sequential and repeating patterns
continue a sequential pattern and describe a rule for this (A2-1)
describe in words, rules for continuing number and spatial sequential patterns (A3-1)
find a rule to describe any member of a number sequence and express it in words (A4-1)
make up and use a rule to create a sequential pattern (A3-2)
use a rule to make predictions (A4-2)
state the general rule for a set of similar practical problems (A3-3)
find and justify a word formula which represents a given practical situation (A4-4)
use graphs to illustrate relationships (A2-2)
use graphs to represent number, or informal, relations (A3-4)
sketch and interpret graphs on whole number grids which represent simple everyday situations (A4-3)
Measurement Level 2 Level 3 Level 4 Time read time and know the
units of time & minute, hour, day, week, month, and year (M2-4)
read and interpret everyday statements involving time (M3-3)
perform calculations with time, including 24-hour clock times (M4-5)
show analogue time as digital time, and vice versa (M3-4)
read and construct a variety of scales, timetables, and charts (M4-3)
Position describe and interpret position, using the language of direction and distance (G2-2)
draw and interpret simple scale maps (G3-5)
specify location, using bearings or grid references (G4-5)
Metric measurement
carry out practical measuring tasks, using appropriate metric units for length, mass, and capacity (M2-1)
perform measuring tasks, using a range of units and scales (M3-2)
carry out measuring tasks involving reading scales to the nearest gradation (M4-1)
demonstrate knowledge of the basic units of length, mass, area, volume (capacity), and temperature by making reasonable estimates (M3-1)

Technical Report 25: Numeracy Item Signature
33
Identifying shapes and their properties Level 2 Level 3 Level 4 Angle make clockwise and
anticlockwise turns (G2-4) know about simple angles including 90° (right-angle) and 180°; 30°, 45° and 60° (EP-2)
be able to use a protractor to measure angles to the nearest gradation (EP-3)
make quarter and half turns (EP-1)4
Two dimensions
make, name, and describe, using their own language and the language of geometry, everyday shapes and objects (G2-1)
describe the features of 2-dimensional and 3-dimensional objects, using the language of geometry (G3-1)
calculate perimeters of circles, rectangles, and triangles, areas of rectangles, and volumes of cuboids from measurements of length (M4-2)
describe patterns in terms of reflection and rotational symmetry, and translations (G3-6)
describe the reflection or rotational symmetry of a figure or object (G4-7)
Three dimensions
make, name, and describe, using their own language and the language of geometry, everyday shapes and objects (G2-1)
describe the features of 2-dimensional and 3-dimensional objects, using the language of geometry (G3-1)
calculate perimeters of circles, rectangles, and triangles, areas of rectangles, and volumes of cuboids from measurements of length (M4-2)
describe the reflection or rotational symmetry of a figure or object (G4-7)
4 Five extra achievement objectives have been included as a result of findings by the Exemplar Project; they are labelled EP-1 through EP-5.
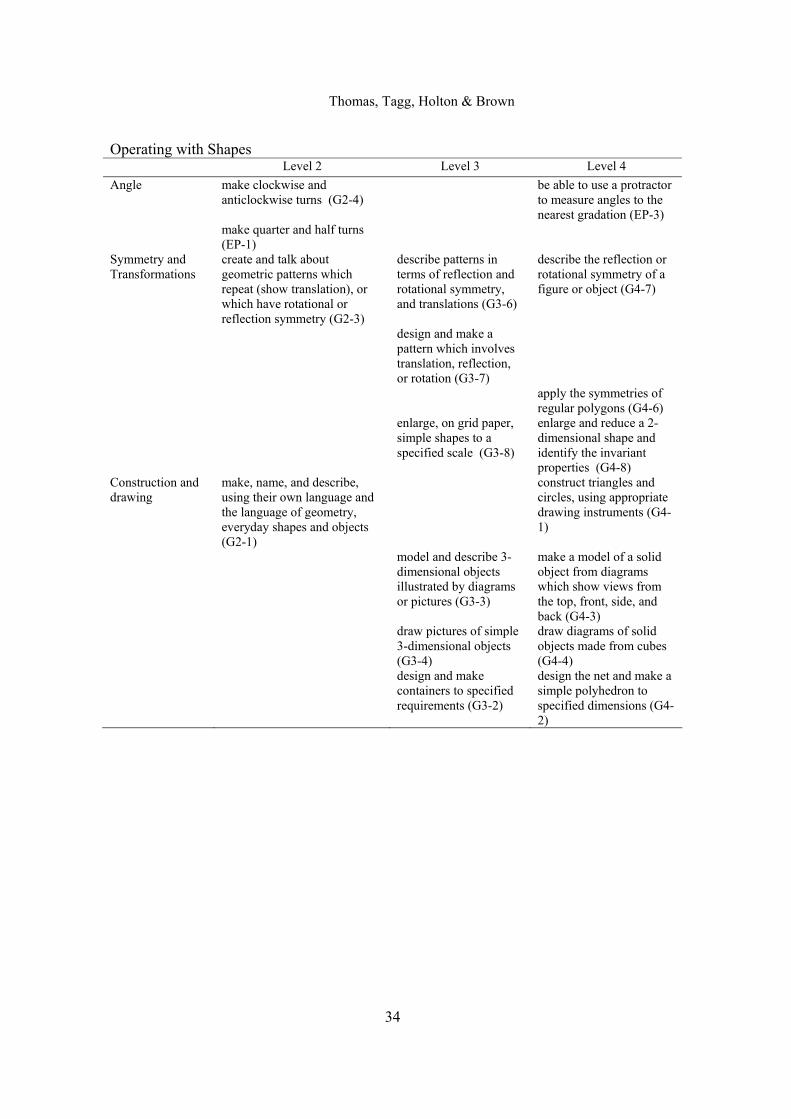
Thomas, Tagg, Holton & Brown
34
Operating with Shapes Level 2 Level 3 Level 4 Angle make clockwise and
anticlockwise turns (G2-4)
be able to use a protractor to measure angles to the nearest gradation (EP-3)
make quarter and half turns (EP-1)
Symmetry and Transformations
create and talk about geometric patterns which repeat (show translation), or which have rotational or reflection symmetry (G2-3)
describe patterns in terms of reflection and rotational symmetry, and translations (G3-6)
describe the reflection or rotational symmetry of a figure or object (G4-7)
design and make a pattern which involves translation, reflection, or rotation (G3-7)
apply the symmetries of regular polygons (G4-6)
enlarge, on grid paper, simple shapes to a specified scale (G3-8)
enlarge and reduce a 2-dimensional shape and identify the invariant properties (G4-8)
Construction and drawing
make, name, and describe, using their own language and the language of geometry, everyday shapes and objects (G2-1)
construct triangles and circles, using appropriate drawing instruments (G4-1)
model and describe 3-dimensional objects illustrated by diagrams or pictures (G3-3)
make a model of a solid object from diagrams which show views from the top, front, side, and back (G4-3)
draw pictures of simple 3-dimensional objects (G3-4)
draw diagrams of solid objects made from cubes (G4-4)
design and make containers to specified requirements (G3-2)
design the net and make a simple polyhedron to specified dimensions (G4-2)
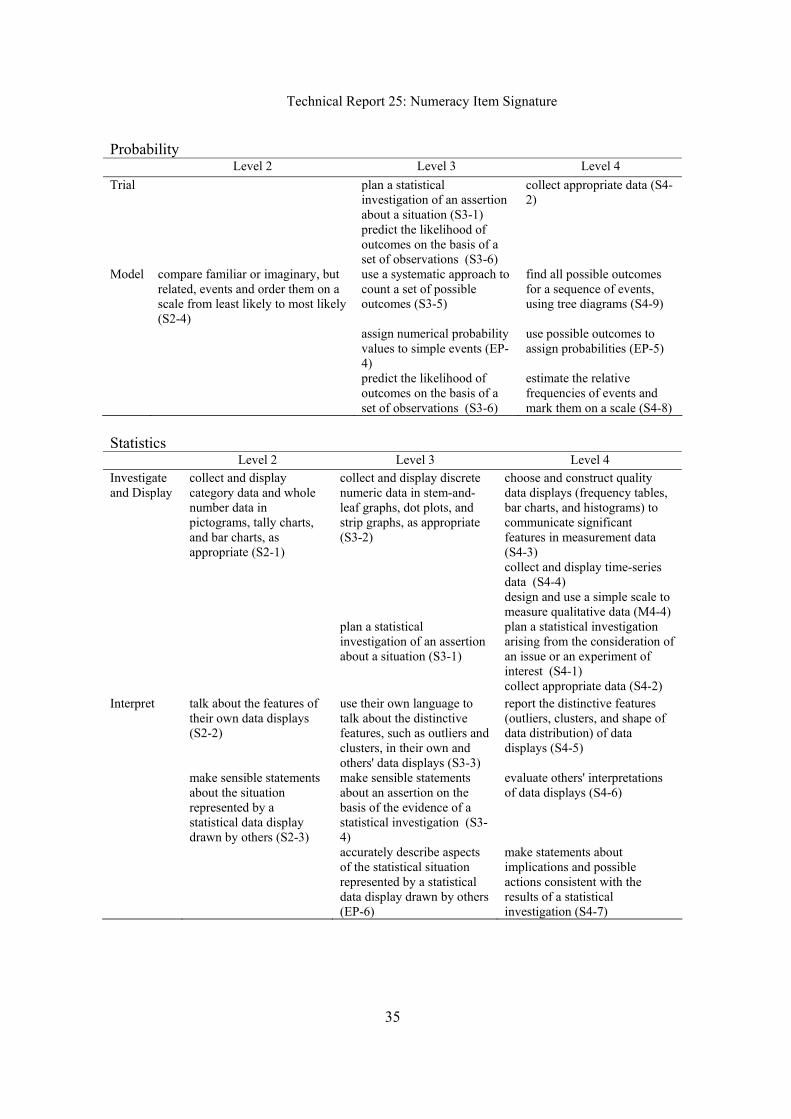
Technical Report 25: Numeracy Item Signature
35
Probability Level 2 Level 3 Level 4 Trial plan a statistical
investigation of an assertion about a situation (S3-1)
collect appropriate data (S4-2)
predict the likelihood of outcomes on the basis of a set of observations (S3-6)
Model compare familiar or imaginary, but related, events and order them on a scale from least likely to most likely (S2-4)
use a systematic approach to count a set of possible outcomes (S3-5)
find all possible outcomes for a sequence of events, using tree diagrams (S4-9)
assign numerical probability values to simple events (EP-4)
use possible outcomes to assign probabilities (EP-5)
predict the likelihood of outcomes on the basis of a set of observations (S3-6)
estimate the relative frequencies of events and mark them on a scale (S4-8)
Statistics Level 2 Level 3 Level 4 Investigate and Display
collect and display category data and whole number data in pictograms, tally charts, and bar charts, as appropriate (S2-1)
collect and display discrete numeric data in stem-and-leaf graphs, dot plots, and strip graphs, as appropriate (S3-2)
choose and construct quality data displays (frequency tables, bar charts, and histograms) to communicate significant features in measurement data (S4-3)
collect and display time-series data (S4-4)
design and use a simple scale to measure qualitative data (M4-4)
plan a statistical investigation of an assertion about a situation (S3-1)
plan a statistical investigation arising from the consideration of an issue or an experiment of interest (S4-1)
collect appropriate data (S4-2) Interpret talk about the features of
their own data displays (S2-2)
use their own language to talk about the distinctive features, such as outliers and clusters, in their own and others' data displays (S3-3)
report the distinctive features (outliers, clusters, and shape of data distribution) of data displays (S4-5)
make sensible statements about the situation represented by a statistical data display drawn by others (S2-3)
make sensible statements about an assertion on the basis of the evidence of a statistical investigation (S3-4)
evaluate others' interpretations of data displays (S4-6)
accurately describe aspects of the statistical situation represented by a statistical data display drawn by others (EP-6)
make statements about implications and possible actions consistent with the results of a statistical investigation (S4-7)

Thomas, Tagg, Holton & Brown
36
Appendix 4 Number and percentage of items at each level/position within level Level Number % <2 5 1% 2 Basic 43 7% 2 Proficient 99 15% 2 Advanced 54 8% 3 Basic 60 9% 3 Proficient 174 27% 3 Advanced 57 9% 4 Basic 63 10% 4 Proficient 81 12% 4 Advanced 10 2% >4 5 1% SOLO rating and level/position within level of items SOLO Rating Level Unistructural Multistructural Relational Extended
Abstract Total
<2 2 (40%) 3 (60%) 5 (100%) 2 Basic 29 (67%) 14 (33%) 43 (100%) 2 Proficient 32 (32%) 63 (63%) 4 (4%) 99 (100%) 2 Advanced 9 (17%) 43 (80%) 1 (2%) 1 (2%) 54 (100%) 3 Basic 20 (33%) 38 (63%) 1 (2%) 1 (2%) 60 (100%) 3 Proficient 32 (18%) 126 (72%) 10 (6%) 6 (3%) 174 (100%) 3 Advanced 2 (4%) 45 (79%) 8 (14%) 2 (4%) 57 (100%) 4 Basic 11 (17%) 52 (83%) 63 (100%) 4 Proficient 3 (4%) 71 (88%) 4 (5%) 3 (4%) 81 (100%) 4 Advanced 8 (80%) 2 (20%) 10 (100%) >4 4 (80%) 1 (20%) 5 (100%) Total 140 (22%) 467 (72%) 27 (4%) 17 (3%) 651 (100%)

Technical Report 25: Numeracy Item Signature
37
Number of disagreements in each paper by category
# Disagreements
Paper Level Text Diagram SOLO Process ContentTotal
Disagreements
# Items
5 5 4 1 1 1 4 11 35 5 6 8 1 5 14 33 5 7 9 1 2 1 1 8 22 40 5/A 19 2 6 3 2 10 42 44 5 B 5 1 2 8 21 5 C 12 3 1 10 26 30 5 D 7 5 12 27 5 E 6 1 3 10 24 6 5 4 1 1 1 7 14 35 6 6 5 1 7 13 37 6 7 7 1 4 12 33 6/A 5 1 1 2 4 13 36 6 B 6 6 16 6 C 9 1 3 13 23 6 D 2 1 3 15 6 E 9 2 3 1 5 20 28 7 5 6 3 1 4 14 29 7 6 10 5 2 2 4 23 32 7 7 11 1 10 22 32 7/A 5 1 2 8 25 7 B 1 1 8 7 C 2 2 1 5 15 7 D 2 2 19 7 E 3 1 2 6 14
Total 157 7 28 19 10 99 320 651

Thomas, Tagg, Holton & Brown
38
Percentage agreement for each paper by category % Agreement
Paper Level Text Diagram SOLO Process Content Paper 5 5 89% 100% 97% 97% 97% 89% 95% 5 6 76% 100% 100% 97% 100% 85% 93% 5 7 78% 98% 95% 98% 98% 80% 91% 5/A 57% 95% 86% 93% 95% 77% 84% 5 B 76% 100% 95% 90% 100% 100% 94% 5 C 60% 90% 100% 97% 100% 67% 86% 5 D 74% 100% 100% 100% 100% 81% 93% 5 E 75% 100% 100% 96% 100% 88% 93% 6 5 89% 100% 97% 97% 97% 80% 93% 6 6 86% 97% 100% 100% 100% 81% 94% 6 7 79% 100% 97% 100% 100% 88% 94% 6/A 86% 100% 97% 97% 94% 89% 94% 6 B 63% 100% 100% 100% 100% 100% 94% 6 C 61% 100% 96% 100% 100% 87% 91% 6 D 87% 100% 100% 100% 100% 93% 97% 6 E 68% 100% 93% 89% 96% 82% 88% 7 5 79% 100% 90% 97% 100% 86% 92% 7 6 69% 100% 84% 94% 94% 88% 88% 7 7 66% 100% 97% 100% 100% 69% 89% 7/A 80% 100% 96% 100% 100% 92% 95% 7 B 88% 100% 100% 100% 100% 100% 98% 7 C 87% 100% 87% 100% 100% 93% 94% 7 D 89% 100% 100% 100% 100% 100% 98% 7 E 79% 100% 100% 93% 100% 86% 93%
Total 76% 99% 96% 97% 98% 85% 92%

Technical Report 25: Numeracy Item Signature
39
Intended strand/sub-strand versus coded strand for all items Coded strand Intendedstrand Algebra Geometry Measurement Number Statistics NIL Total AE 43 1 16 1 61 AP 36 5 41 GS 77 3 2 2 84 GT 25 25 MC 45 4 1 50 MM 75 2 77 NC 5 69 74 NN 2 102 3 107 SI 1 43 2 46 SP 1 34 35 SS 1 50 51 Total 80 104 131 191 135 10 651

Thomas, Tagg, Holton & Brown
40
Appendix 5. Resolution of SOLO assignments Subsequent to this study, a separate discussion among the report authors and the asTTle team about the SOLO taxonomy definitions and how they applied to mathematics was undertaken. A set of multi-structural questions was examined independently by three of the authors and the asTTle Project Director. Upon comparison of results, it was found that the teachers had been overly conservative in identifying tasks that required use of relationships; instead they had treated too many relational items as sequential or serial use of a series of known mathematical steps. The discussion led to the insight that what would have been serial or sequential application of known steps for adult teachers would not have been identical for children working within the curriculum level for which the item was intended or designed. Thus, an teacher of mathematics may use a series of known or given steps to solve a problem, but children learning mathematics would not be expected to have the same known or given steps and thus would need to make use of the embedded relationship in the given material in order to solve a mathematical task. As a result of this conclusion, it was decided to revise all the multistructural items. The first author (a mathematics education expert) and the last author (an assessment specialist) were joined by an independent international mathematics assessment expert to review the SOLO categorisation of the 467 multistructural tasks in light of the refined understanding of outlined above. Items were reassigned only upon consensus of the panel. In addition, 121 new items were added through a subsequent trial giving a grand total of 772 items
SOLO Category Number Original Number Revised Surface Unistructural
140
172
Multistructural 467 332 Deep Relational
27
236
Extended Abstract 17 32 Total 651 772 As a result of reclassification 35% of asTTle V2 items are deep in the SOLO taxonomy as opposed to the 7% beforehand.