Ntalianis_whole_thesis.pdf - Open Access Repository
339
THE ROLE OF FINANCIAL EDUCATION IN A CHOICE OF FUND SUPERANNUATION SYSTEM by Michael Ntalianis Bachelor of Business Footscray Institute of Technology Master of Business Victoria University Submitted in Fulfilment of the Requirements for the Degree of Doctor of Philosophy University of Tasmania September 2009
-
Upload
khangminh22 -
Category
Documents
-
view
0 -
download
0
Transcript of Ntalianis_whole_thesis.pdf - Open Access Repository

THE ROLE OF FINANCIAL EDUCATION IN A CHOICE
OF FUND SUPERANNUATION SYSTEM
by
Michael Ntalianis
Bachelor of Business Footscray Institute of Technology
Master of Business Victoria University
Submitted in Fulfilment of the Requirements for the Degree
of Doctor of Philosophy
University of Tasmania
September 2009

ii
Statement of Originality
I declare that the thesis contains no material which has been accepted for a
degree or diploma by the University or any other institution, except by way of
background information and duly acknowledged in the thesis, and to the best of
my knowledge and belief no material previously published or written by another
person except where due acknowledgement is made in the text of the thesis, nor
does the thesis contain any material that infringes copyright.
Signed ____________________________________
Michael Ntalianis
Date ______________________________________
Statement on Authority of Access
This thesis may be made available for loan. Copying is permitted in accordance
with the Copyright Act 1968.
Signed _____________________________________
Michael Ntalianis
Date _______________________________________
iii
Abstract
The primary objectives of this thesis were to evaluate whether superannuation fund
provided educational resources provide superannuation defined contribution fund
members with the required information to assist them in making informed choices
regarding their superannuation investment funds; and to determine the importance
users place on this information for their overall superannuation investment decision
making. It was also an objective to determine which educational resources were not
being used by defined contribution fund members and why members failed to use
them. The importance placed by defined contribution fund members on other non-
superannuation fund financial education resources for superannuation decisions was
also investigated.
The study was motivated by the growing literature that suggests that individuals fail
to conform to rational economic behaviour when it comes to saving for retirement.
The literature shows that many individuals lack the capacity or willpower to
adequately plan or execute a retirement savings plan. Individual behavioural traits
such as inertia, procrastination and heuristics, lead to behaviour that was inconsistent
with the economic retirement savings model (life-cycle model). It was found in the
literature that workers exposed to financial education were more likely to save and
have a better retirement savings plan. The review of the literature shows that the
educational seminar, website, written communications and financial counselling were
all effective educational resources that changed an individual’s retirement savings and
investment behaviour.
To address the research objectives, a web-based questionnaire survey was
electronically mailed to a cross-section of university staff purposively chosen from 26
universities across Australia. Both academics and non-academics were represented in
the sample. The survey yielded a response rate of 30.1 percent. The responses to the
questionnaire indicated that a large majority of respondents considered the
superannuation fund provided educational resources to be important for their
superannuation financial decision making. It was shown that the superannuation fund
written communications were the most used educational resource and that financial
counselling was the least used. The respondents believed they were being informed on
superannuation matters when they utilised the superannuation fund provided
educational resources. A lack of time and a lack of motivation were factors that
received most agreement from respondents as reasons for not utilising the
superannuation fund educational resources. Friends and colleagues were also found to
be an important information resource when it came to a respondent’s superannuation
decision making.
Statistical inferences drawn from the data indicated that certain demographic groups
were less likely to utilise both the superannuation fund provided resources and other
non–superannuation fund educational resources. Females, younger individuals, those
with low superannuation balances or low knowledge of financial matters were the key
groups identified as less likely to utilise the educational information offered to them
by the superannuation fund and from other sources.

iv
ACKNOWLEDGEMENTS
I must first acknowledge our Lord Jesus Christ who provided me with both the mental
strength and willpower that was required to complete this PhD.
Special thanks must also be extended to my supervisors Professor Victoria Wise and
Professor Bob Clift. Their exceptional support and guidance throughout the PhD
process was remarkable. They were always generous with their time and always
provided timely; and constructive feedback on my work. I was inspired by their
respectful approach to supervision which will never be forgotten. Thank-you and God
bless you.
Thanks also to Segu Zuhair a consultant to my PhD who provided much of his time
during critical times of my research.
I would also like to thank the Faculty of Business Victoria University for the study
leave and the University of Tasmania for their financial and administrative support
that they provided to me.
My wife Paula and my children Mary and Peter are the inspiration of my life. Without
their presence and support these achievements would have less meaning. Their
encouragement and love during the difficult periods are cherished within my heart. I
love them and I thank them.
During my PhD studies my father and father-in-law both passed away. Their
influence on my character was profound. They continuously demonstrated a great
work ethic with a deep expression of love for their families. It is unfortunate that they
are not with us to witness this achievement, but I am sure their inspiration will live on
and continue to touch their children and grandchildren.
Last but not least I would like to thank my mother and mother-in-law. Without their
love and care none of this would be possible. They live and sacrifice for their
families. Their loving support throughout the years is a reason why I achieved what I
have and without them life would not be the same.

v
TABLE OF CONTENTS
Statement of Originality ii
Statement on Authority of Access ii
Abstract iii
Acknowledgments iv
Table of Contents v
List of Tables xi
List of Figures xv
List of Diagrams xv
List of Abbreviations xvi
Chapter 1: Introduction 1
1.1 Background to the Research 1
1.2 Research Problems and Objectives 3
1.3 The Justification for the Research 5
1.4 Scope of the Study 7
1.5 Methodology 8
1.6 Outline of the Thesis 10
Chapter 2: An Overview of the Australian Superannuation
Framework 12
2.1 Introduction 12
2.2 Australia’s Retirement Income System 12
2.3 The Australian Aged Pension 13
2.3.1 Poverty Measures and the Aged Pension 14
2.4 Implications of Australia’s Ageing Population 15
2.5 Superannuation in Australia 17
2.5.1 Superannuation Co-contribution 18
2.5.2 Choice of Fund 20
2.5.3 Lost Superannuation Accounts 22
2.5.4 Superannuation Clearing House 23
2.6 Composition and Size of Australia’s Superannuation Industry 24
2.6.1 Superannuation Fund Benefit Structures 25
2.6.2 Financial Performance of the Superannuation Industry 28
2.6.3 Impact of the Global Financial Crisis 28
2.7 Regulation of the Superannuation Industry 30
2.8 Taxation of Superannuation 33
2.9 Adequacy of Superannuation Savings 37
2.9.1 Measuring Adequacy 39
2.9.2 Recent Data on Retirement and Superannuation 40

vi
2.9.3 Implications of Inadequate Retirement Savings 41
2.10 Retirement Plans in the United States 42
2.11 Summary 44
Chapter 3 Literature Review 47
3.1 Introduction 47
3.2 The Life-Cycle Model 47
3.3 Behavioural Implications 49
3.3.1 Bounded Rationality 51
3.3.1.1 Implication of Financial Literacy for Retirement Saving 52
3.3.2 Bounded Self-Control in Retirement Saving 54
3.3.3 Inertia and Procrastination in Saving Choices 56
3.3.4 Portfolio Theory 58
3.3.5 Naïve Diversification and Heuristics 59
3.3.6 Reliance on Past Performance 62
3.3.7 Endorsement Effect 63
3.3.8 Familiarity Bias in Investment Choice 63
3.3.9 Framing and Default Choices 64
3.3.10 Choice Overload 66
3.3.11 Peer Effects on Choice 68
3.3.12 Prospect Theory 68
3.3.12.1 Myopic Loss Aversion and Over-confidence 69
3.4 A Theoretical Framework for Superannuation Fund Choice 70
3.5 Financial Education 74
3.5.1 Implications of Financial Education on Behaviour 75
3.5.2 Workplace Financial Education 78
3.5.3 Educational Training Workshops and Seminars 82
3.5.3.1 Impact of Educational Seminars and Workshops on
Participation and Contribution to Retirement Plans 82
3.5.3.2 The Influence of Educational Seminars and
Workshops on Retirement Savings Intentions 83
3.5.3.3 Educational Seminars and Workshops on
Asset Allocation Decisions 85
3.5.4 Employer and Fund Manager Sponsored Financial
Communications 87
3.5.5 Utilisation and Importance of Employer and Fund
Manager Sponsored Information 89
3.5.6 Combining Financial Education and Advice 92
3.5.7 Preferred Sources of Financial Information 93
3.6 Resource Usage in Retirement Savings Decisions: Australian Evidence 94
3.7 Theoretical Framework for the Research 95
3.8 The Research Model 99
3.9 Summary 101
Chapter 4 Research Methodology 102
4.1 Introduction 102
vii
4.1.1 Review of Objectives 102
4.2 Research Paradigms 103
4.2.1 Deductive and Inductive Theory 103
4.2.2 Quantitative and Qualitative Research Methods 104
4.3 Research Design and Methodology 106
4.3.1 Experimental Design 106
4.3.2 Longitudinal Design 106
4.3.3 Case Study 107
4.3.4 Comparative Study 107
4.4 Research Method Used in this Study 107
4.4.1 Types of Surveys 109
4.4.1.1 Mail Questionnaire 109
4.4.1.2 Electronic Questionnaire 110
4.4.1.3 Telephone Interview 111
4.4.1.4 Personal Interview 112
4.4.2 Strengths and Weaknesses of Survey Research 112
4.5 Administering the Survey 113
4.5.1 Phase 1: Selecting the Type of Survey 113
4.5.1.1 Population and Accessibility Issues 114
4.5.1.2 Sampling Issues 114
4.5.1.3 Question Issues 114
4.5.1.4 Content Issues 115
4.5.1.5 Bias Issues 115
4.5.1.6 Administrative Issues 115
4.5.1.7 Selection of the Web-based Survey Approach 116
4.5.2 Phase II: Constructing the Questionnaire 116
4.5.2.1 Questionnaire Layout 117
4.5.2.2 Question Content 119
4.5.2.3 Response Format 120
4.5.2.4 Question Format 122
4.5.2.5 Order of Questions 124
4.5.3 Phase III: Writing the Questionnaire 125
4.5.3.1 The Educational Seminar Questions 126
4.5.3.2 The Superannuation Fund Sponsored Website Questions 126
4.5.3.3 The Written Communications Questions 126
4.5.3.4 The Financial Counsellor Questions 127
4.5.3.5 The Importance of Other Sources of Education Questions 127
4.5.3.6 The Demographic (Background) Questions 128
4.5.3.7 Pilot Test 129
4.5.3.8 Administration of the Survey 130
4.5.4 Phase IV: Selecting the Sample 133
4.5.4.1 Defining the Population and Sample Frame 134
4.5.4.2 Selecting the Sample 134
4.5.4.3 Sample Size 135
4.5.4.4 Implications for Sampling Errors and Bias 136
4.5.4.5 Non-response Bias 137
4.5.5 Phase V: Measurement Issues 137
4.5.5.1 Validity 138
4.5.5.2 Reliability 141
4.5.6 Phase VI: Determining the Results 143
viii
4.6 Summary 144
Chapter 5 Quantitative Data Analysis I: Descriptive Statistics 145
5.1 Introduction 145
5.2 Preparing Data for Analysis 145
5.3 Response Rate and Reliability Analysis of Measurement Scales 146
5.4 Analysis of Frequency: Respondent Background and Demographics 148
5.4.1 Respondents’ Characteristics 149
5.5 Analysis of Frequency, Central Tendency and Variation of Sources
of Financial Education 156
5.5.1 Educational Seminar 157
5.5.1.2 Usefulness of the Educational Seminar 158
5.5.1.3 Reasons for the Failure to Attend Educational Seminars 163
5.5.2 Superannuation Fund Website 165
5.5.2.1 Usefulness of Superannuation Fund Website Information 166
5.5.2.2 Importance Placed on Superannuation Fund Website
Information 171
5.5.2.3 Failure to Access Superannuation Fund Website 173
5.5.3 Superannuation Fund Written Communications 175
5.5.3.1 The Importance of Superannuation Fund Provided Written
Communications 176
5.5.3.2 Reasons for the Failure to Read Superannuation Fund
Written Communications 180
5.5.4 Superannuation Fund Provided Financial Counsellor 182
5.5.4.1 Usefulness of the Financial Counsellor 183
5.5.4.2 Reasons for the Failure to Use Superannuation Fund
Provided Financial Counselling 187
5.5.5 Other Sources of Superannuation Fund Educational Information 190
5.5.5.1 Newspaper Publications 190
5.5.5.2 Financial Magazines 191
5.5.5.3 Radio and Television 192
5.5.5.4 Personal Financial Adviser or Planner 193
5.5.5.5 Friends and Colleagues 194
5.6 Summary 195
Chapter 6 Quantitative Data Analysis II: Inferential Statistics and
Cross Tabulations 198
6.1 Introduction 198
6.2 Tests of Significance 199
6.3 Tests for Differences in Means for Demographic and Background
Groups 200
6.3.1 T-Tests for Differences in Means for Dichotomous Independent
Groups 200
6.3.1.1 Differences between Males and Females 201
6.3.1.2 Differences between those with Employment History and
those without Employment History in Investment and
Finance 202

ix
6.3.1.3 Differences between those with Formal Educational
Training and those without Formal Educational Training
in Investment and Finance 203
6.3.1.4 Differences between those with Little or No Knowledge
and those with Moderate or Substantial Knowledge in
Investment Matters 205
6.3.1.5 Differences between Academics and Non-Academics 206
6.3.2 Analysis of Variance (ANOVA) F-Test in Means for Independent
Groups 207
6.3.2.1 Differences between Groups Based on Age 208
6.3.2.2 Differences between Groups Based on Education 209
6.3.2.3 Differences between Groups Based on Attitude Towards
Investment Risk 211
6.3.2.4 Differences between Groups Based on Dollar Balance in
Superannuation Account 211
6.4 Chi-square Tests of Independence for Differences in Responses of
Independent Demographic and Background Groups 212
6.4.1 Differences between Groups with Respect to Attending the
Educational Seminar 213
6.4.2 Differences between Groups with Respect to Accessing the
Superannuation Fund Website 216
6.4.3 Differences between Groups with Respect to Reading the
Superannuation Fund Written Communications 221
6.4.4 Differences between Groups with Respect to Obtaining Financial
Advice from the Superannuation Fund Financial Counsellor 225
6.4.5 Chi-square Tests Relating to Other Non-superannuation Fund
Sources of Education 227
6.4.5.1 Differences between Groups in Respect of the Importance
Placed on Newspaper Publications 228
6.4.5.2 Differences between Groups in Respect of the Importance
Placed on Financial Magazines 231
6.4.5.3 Differences between Groups in Respect of the Importance
Placed on Radio and Television 236
6.4.5.4 Differences between Groups in Respect of the Importance
Placed on Personal Financial Adviser or Planner 237
6.4.5.5 Differences between Groups with Respect to the Importance
Placed on Friends and Colleagues 242
6.5 Summary 245
Chapter 7 Summary and Conclusions 247
7.1 Introduction 247
7.2 Review of the Thesis 248
7.3 Major Findings 250
7.3.1 Educational Seminar 251
7.3.2 Superannuation Fund Website 252
7.3.3 Superannuation Fund Written Communications 253

x
7.3.4 Superannuation Fund Provided Financial Counsellor 254
7.3.5 Implications for the Educational Model 255
7.3.6 Reasons Why Superannuation Fund Members Fail to Access
Educational Resources 256
7.3.7 Other Sources of Superannuation Fund Educational Information 257
7.3.8 Group Differences in Mean Responses 258
7.3.9 Group Differences in Accessing Superannuation Fund Provided
Educational Resources 259
7.3.10 Group Differences in Respect of the Importance Placed on Non-
Superannuation Fund Sources of Financial Education 261
7.4 Contributions of the Research 263
7.5 Implications of the Study 264
7.6 Limitations of the Study 265
7.7 Further Research 266
Appendices 268
Appendix 1 Questionnaire 269
Appendix 2 Information Sheet and Covering Letter 290
Appendix 3 Ethics Approval Letter from University of Tasmania 293
Appendix 4 Details of Sample 296
Bibliography 300

xi
Tables
Table 2.1 Definitions of Superannuation Fund Types 24
Table 2.2 The Australian Superannuation Industry at December 2008 25
Table 2.3 Distribution by Benefit Structure 27
Table 2.4 Preservation Ages by Date of Birth 34
Table 2.5 Tax Treatment of Superannuation Member Benefit - Taxed
Element 34
Table 2.6 Tax Treatment of Superannuation Member Benefit - Untaxed
Element 35
Table 2.7 Sources of Funding for 401(k) and all Other Plans 43
Table 3.1 Research Questions and the Review of the Literature 97
Table 4.1 Comparison of the Positivist and Phenomenological Paradigms 105
Table 4.2 Strengths and Weaknesses of Survey Research 113
Table 5.1 Response Rate Calculation 146
Table 5.2 The Reliability Analysis Scale (Cronbach alpha) 147
Table 5.3 Gender 149
Table 5.4 Age 149
Table 5.5 Level of Qualification 150
Table 5.6 Employed in a Job Related to Finance, Investment Analysis,
Sharemarket Investing or Financial Planning 151
Table 5.7 Formal Educational Training in Finance, Investment, Sharemarket
Investing or Financial Planning 151
Table 5.8 Knowledge in Finance and Investment Matters 152
Table 5.9 Attitude Towards Investment Risk 153
Table 5.10 Area of Employment 154
Table 5.11 Dollar Balance in Superannuation Account 155
Table 5.12 Attendance at an Educational Seminar 157
Table 5.13 Instruction and Information Usefulness of the Educational
Seminar 159
Table 5.14 The Importance Placed on the Educational Seminar for
Superannuation Decision Making 161
Table 5.15 How Often are the Educational Seminars Accessed? 162
Table 5.16 Reasons Respondents Fail to Attend Educational Seminars 164
Table 5.17 Previous Access to the Superannuation Fund Website 165
Table 5.18 Information Usefulness in the Superannuation Fund Website 167
Table 5.19 The Importance Placed on the Superannuation Fund Website
for Superannuation Decision Making 169
Table 5.20 How Often is the Superannuation Fund Website Accessed? 170
Table 5.21 Importance of Superannuation Fund Website Information 172
Table 5.22 Reasons Respondents Fail to Access the Superannuation
Fund Website 174
Table 5.23 Read the Superannuation Fund Provided Written
Communications 175
Table 5.24 Importance of Superannuation Fund Written Communications 177
Table 5.25 The Importance Placed on Written Communications for
Superannuation Decision Making 178
Table 5.26 How Often are the Written Communications Read? 179
Table 5.27 Reasons Respondents Fail to Read Superannuation Fund
Provided Written Communications 181

xii
Table 5.28 Used the Superannuation Fund Provided Financial Counsellor 182
Table 5.29 Importance of Superannuation Fund Provided Financial
Counselling 184
Table 5.30 The Importance Placed on Financial Counselling for
Superannuation Decision Making 185
Table 5.31 Frequency of Use of Financial Counselling 186
Table 5.32 Reasons Respondents Fail to use the Superannuation Fund Provided
Financial Counselling 189
Table 5.33 The Importance Placed on Newspaper Publications for
Superannuation Education Needs 190
Table 5.34 The Importance Placed on Financial Magazines for
Superannuation Education Needs 191
Table 5.35 The Importance Placed on Radio and Television for
Superannuation Education Needs 192
Table 5.36 The Importance Placed on Personal Financial Adviser or Planner
for Superannuation Education Needs 193
Table 5.37 The Importance Placed on Friends and Colleagues for
Superannuation Education Needs 194
Table 6.1 Mean and Variance Differences to Educational Sources with
Respect to Gender 202
Table 6.2 Mean and Variance Differences to Educational Sources with
Respect to Employment History in Investment and Finance 203
Table 6.3 Mean and Variance Differences to Educational Sources with
Respect to Formal Educational Training in Investment and
Finance 204
Table 6.4 Mean and Variance Differences to Educational Sources with
Respect to those with Little or No Knowledge and those with
Moderate or Substantial Knowledge in Investment Matters 205
Table 6.5 Mean and Variance Differences to Educational Sources
with Respect to Academics and Non-academics 207
Table 6.6 Mean Differences to Educational Sources with Respect to Age 209
Table 6.7 Mean Differences to Educational Sources with Respect to
Education 210
Table 6.8 The Results of the Fisher’s Least Significance Difference
Tests (LSD) for Educational Level 210
Table 6.9 Mean Differences to Educational Sources with Respect to
Investment Attitude Towards Risk 211
Table 6.10 Mean Differences to Educational Sources with Respect to
Balance in Superannuation Account 212
Table 6.11 Cross-tabulation of Seminar Attendance by Gender 214
Table 6.12 Cross-tabulation of Seminar Attendance by Age 214
Table 6.13 Cross-tabulation of Seminar Attendance by Knowledge of
Finance and Investment Matters 215
Table 6.14 Cross-tabulation of Seminar Attendance by Area of Employment 215
Table 6.15 Cross-tabulation of Seminar Attendance by Superannuation
Account Balance 216
Table 6.16 Cross-tabulation of Accessing Superannuation Fund Website by
Gender 217
Table 6.17 Cross-tabulation of Accessing Superannuation Fund Website by
Employment History in Investment and Finance 218

xiii
Table 6.18 Cross-tabulation of Accessing Superannuation Fund Website by
Educational Training in Investment and Finance 218
Table 6.19 Cross-tabulation of Accessing Superannuation Fund Website by
Knowledge of Finance and Investment Matters 219
Table 6.20 Cross-tabulation of Accessing Superannuation Fund Website by
Attitude to Investment Risk 220
Table 6.21 Cross-tabulation of Accessing Superannuation Fund Website by
Superannuation Account Balance 221
Table 6.22 Cross-tabulation of Reading Superannuation Fund Written
Communications by Gender 222
Table 6.23 Cross-tabulation of Reading Superannuation Fund Written
Communications by Educational Training in Investment
and Finance 222
Table 6.24 Cross-tabulation of Reading Superannuation Fund Written
Communications by Knowledge of Finance and Investment
Matters 223
Table 6.25 Cross-tabulation of Reading Superannuation Fund Written
Communications by Attitude to Investment Risk 224
Table 6.26 Cross-tabulation of Reading Superannuation Fund Written
Communications by Superannuation Account Balance 225
Table 6.27 Cross-tabulation of Obtaining Advice from Financial
Counsellor by Age 226
Table 6.28 Cross-tabulation of Obtaining Advice from a Financial
Counsellor by Superannuation Account Balance 227
Table 6.29 Cross-tabulation of Importance Placed on Newspaper
Publications by Gender 228
Table 6.30 Cross-tabulation of Importance Placed on Newspaper
Publications by Qualification 229
Table 6.31 Cross-tabulation of Importance Placed on Newspaper
Publications by Knowledge in Finance and Investment Matters 230
Table 6.32 Cross-tabulation of Importance Placed on Newspaper
Publications by Attitude to Investment Risk 231
Table 6.33 Cross-tabulation of Importance Placed on Newspaper
Publications by Superannuation Account Balance 231
Table 6.34 Cross-tabulation of Importance Placed on Financial Magazines
by Gender 232
Table 6.35 Cross-tabulation of Importance Placed on Financial Magazines
by Qualification 233
Table 6.36 Cross-tabulation of Importance Placed on Financial Magazines
by Previous Employment in Finance and Investment 233
Table 6.37 Cross-tabulation of Importance Placed on Financial Magazines
by Educational Training in Finance and Investment 234
Table 6.38 Cross-tabulation of Importance Placed on Financial Magazines
by Knowledge in Finance and Investment Matters 235
Table 6.39 Cross-tabulation of Importance Placed on Financial Magazines
by Area of Employment 235
Table 6.40 Cross-tabulation of Importance Placed on Financial Magazines
by Superannuation Account Balance 236
Table 6.41 Cross-tabulation of Importance Placed on Radio and Television
by Attitude to Investment Risk 237
xiv
Table 6.42 Cross-tabulation of Importance Placed on Personal Financial
Adviser or Planner by Gender 238
Table 6.43 Cross-tabulation of Importance Placed on Personal Financial
Adviser or Planner by Qualification 239
Table 6.44 Cross-tabulation of Importance Placed on Personal Financial
Adviser or Planner by Educational Training in Finance and
Investment 240
Table 6.45 Cross-tabulation of Importance Placed on Personal Financial
Adviser or Planner by Knowledge in Finance and Investment
Matters 241
Table 6.46 Cross-tabulation of Importance Placed on Personal Financial
Adviser or Planner by Area of Employment 241
Table 6.47 Cross-tabulation of Importance Placed on Personal Financial
Adviser or Planner by Superannuation Account Balance 242
Table 6.48 Cross-tabulation of Importance Placed on Friends and Colleagues
by Educational Training in Finance and Investment 243
Table 6.49 Cross-tabulation of Importance Placed on Friends and Colleagues
by Knowledge in Finance and Investment Matters 244
Table 6.50 Cross-tabulation of Importance Placed on Friends and Colleagues
by Superannuation Account Balance 244
Table 7.1 Educational Seminar Research Questions and Findings 251
Table 7.2 Superannuation Website Research Questions and Findings 252
Table 7.3 Superannuation Fund Written Communications Research
Questions and Findings 253
Table 7.4 Educational Seminar Research Questions and Findings 254
Table 7.5 Research Questions and Findings on Reasons for the Failure to
Utilise Educational Resources 256
Table 7.6 Research Question and Findings on the Importance Placed on
Non-superannuation Fund Provided Educational Resources 257
Table 7.7 Research Questions and Findings on the Group Differences in
Mean Responses 258
Table 7.8 Research Question and Findings on Group Differences in the Use
of Superannuation Fund Provided Educational Resources 259
Table 7.9 Research Questions and Findings on the Group Differences in the
Importance Placed on Non-superannuation Educational
Resources 261

xv
Figures
3.1 Superannuation Choice Framework 71
3.2 Tools for Achieving Adequate Retirement Income 77
3.3 Theoretical Framework for the Research 96
3.4 The Research Model for Superannuation Education 100
Diagrams
5.1 A Comparison of the Frequency of Use of Educational
Information Sources 187

xvi
List of Abbreviations
ABS Australian Bureau of Statistics
AFSL Australian Financial Services Licence
AIST Australian Institute of Superannuation Trustees
ALP American Life Panel
ANOVA Analysis of Variance
APRA Australian Prudential Regulation Authority
ASIC Australian Securities and Investment Commission
ASFA The Association of Superannuation Funds of Australia
ATO Australian Taxation Office
AWA Australian Workplace Agreement
AWOTE Average Weekly Ordinary Time Earnings
CEDA Committee for Economic Development of Australia
CEO Chief Executive Officer
EBRI Employee Benefit Research Institute
FaHCSIA Department of Families, Housing, Community Services and
Indigenous Affairs
FSR Act Financial Services Reform Act 2002
GDP Gross Domestic Product
HESTA Health Employees Superannuation Trust Australia
HSD Honestly Significant Difference
LMR Lost Members Register
LSD Least Significance Difference
MCIC Metro Chicago Information Centre
MPT Modern Portfolio Theory
MTAWE Male Total Average Weekly Earnings
OECD Organisation for Economic Co-operation and Development
PSS Commonwealth Public Sector Superannuation Scheme
PPA Pension Protect Act
RBL Reasonable Benefits Limit
ROA Return on Assets
RSA Retirement Savings Accounts
SCT Superannuation Complaints Tribunal
SD Standard Deviation
SEARS Survey on Employment Arrangements, Retirement and Superannuation
SG The Superannuation Guarantee (Administration) Act 1992
SIS Act Superannuation Industry (Supervision) Act 1993
SMSF Self-Managed Superannuation Funds
SSAU Australian Superannuation Scheme for Australian Universities
TIAA-CREF Teachers Insurance and Annuity Association, College Retirement
Equities Fund
US United States

1
Chapter One
Introduction
1.1 Background to the Research
As a result of declining mortality and fertility rates in OECD (Organisation for
Economic Co-operation and Development) countries the population is ageing. In
Australia, it is projected that life expectancy will increase to 86 years for men and 90
years for women by the year 2047 (The Treasury 2007). The implications are that
there will be a decrease in the ratio between working age Australians and retirees.
This is expected to lead to higher government spending and a reduction in Gross
Domestic Product (GDP) (The Treasury 2007) and compromise the living standards
of Australians (Committee for Economic Development of Australia (CEDA) 2004).
Given an ageing population, adequate retirement funding is of increasing importance
to individuals who will experience longer periods in retirement. At present, a means
tested government provided age pension, superannuation and voluntary savings
underpin Australia’s retirement system. The subject of ensuring adequate retirement
income has attracted increasing attention around the developed world in recent years
(OECD 2005; 2008a). There is also growing survey evidence, both in Australia and
the United States, which shows that individuals are not adequately preparing or saving
for their retirement (ANZ A.C.Nielsen 2005; ANOP Research Services 2006;
Helman, Greenwald, VanDerhei & Copeland 2008).
In 1992 the Australian government introduced a compulsory employer superannuation
system where employers are required to contribute to their employees’ superannuation
fund. Superannuation represents a form of saving where money is set aside by the
worker and/or the employer and invested for each employee’s retirement benefit. The
Treasury (2002) in the first Intergenerational Report identified superannuation as one
structure that can counter the impact of an ageing population. When first introduced,
the Australian superannuation guarantee system required minimum employer annual
contributions of three percent which was progressively increased to its current level of
nine percent. Recently, superannuation stakeholder groups have suggested that a

2
further increase in the contribution rate is necessary to ensure individuals derive
sufficient superannuation savings for retirement.
In 2008 superannuation assets in Australia were reported to be in excess of $1 trillion
(APRA 2009a). A report from the Australian Bureau of Statistics (ABS) (2008)
indicates that 91 percent of employed people have superannuation coverage.
However, there is still considerable doubt about whether Australians will have
sufficient balances in their superannuation accounts to support them adequately in
retirement (Clare 2008a). CEDA (2004) also suggests that many Australians will find
that their level of savings will be inadequate for retirement.
Another important development in superannuation fund (referred to as pension funds
in some countries) arrangements in the OECD countries is the shift from defined
benefit to defined contribution (accumulation) funds (OECD 2005). This shift is
especially important in Australia where a majority of superannuation fund members
have defined benefits (APRA 2009b). A defined benefit fund uses a formula for
calculating the member’s retirement benefit, which is specified in terms of years of
employment and average salary level prior to retirement. Under defined contribution
funds each member has their own account where contributions and investment
earnings are added and fees deducted. The balance in the account represents the funds
available for retirement funding. Therefore, with defined contribution funds the
member bears the investment risk, whereas with defined benefits this risk is carried by
the fund. The OECD (2006, p. 1) acknowledges that:
…the responsibility and risk for financial decisions that will have a major impact on
an individual’s future life, notably pensions, are being shifted increasingly to workers
and away from government and employers.
The OECD (2006, p. 3) advises governments that: “future retirees should be made
aware of the need to assess the financial adequacy of their current public and private
pensions schemes”. Of significance is the increasing responsibility of individuals to
provide for their own retirement. The OECD (2005, p. 11) expects that:

3
An increasing number of workers will have to rely on defined contributions pensions and
their personal savings to finance their retirement as governments begin scaling back the
benefits of state-supported social security programmes and as the number of employers
offering benefits plans decreases.
1.2 Research Problems and Objectives
The objectives in this research are to evaluate a financial education model to
determine whether it provides superannuation defined contribution fund members
with the required information resources to assist them in making informed choices
regarding their superannuation investment funds; and to determine the importance
users place on this information for their overall superannuation investment decision
making. The resolution of these research problems requires an evaluation of the role
financial education plays in providing advice, information and instruction to
superannuation fund members about their superannuation savings and investment
strategy.
Moreover, the research will determine which parts of superannuation fund provided
financial education are not being used by defined contribution fund members; and the
reasons members are not utilising these particular aspects of education. It will also
determine the importance placed by superannuation fund members on other non-
superannuation fund provided financial education for their decision making.
Research indicates that employers and fund managers use educational resources such
as seminars and workshops, written communication, websites and financial
counselling to educate employees about retirement saving (Bernheim 1998; Ernst &
Young LLP Human Capital 2004; Krajnak, Burns & Natchek 2008). It has also been
shown that these educational resources can influence an individual’s retirement saving
intentions and behaviour (Clark & Schieber 1998; Lusardi 2003; Muller 2003; Nyce
2005). In this study, investor attitude towards the level and adequacy of financial
information and education provided by superannuation funds for their retirement
savings is investigated.

4
The Australian federal government has legislated to allow superannuation fund
members a choice of which fund they join and the ability to switch to other funds.
Superannuation defined contribution fund members also have investment choice
within the fund so that they can choose where to place their funds from a menu of
available investment options. Therefore, the level and adequacy of information
provided by superannuation funds to members making investment choices needs to be
determined. Whether members exercising choice use the information supplied, and
whether this contributes to them being informed on superannuation issues also needs
to be determined. An outcome of this study is the specification of a superannuation
educational model (refer Chapter 3, Figure 3.4) which meets the requirements of
defined contribution fund users for information, instruction, and advice. Further
investigation has been undertaken to determine the reasons why superannuation fund
members fail to use certain components of the educational resources provided by the
superannuation fund, and the importance they place on non-superannuation fund
provided educational resources for their decision making. The literature review
showed that individuals have a preference for receiving information on financial
issues through television, radio, magazines, and newspapers (Hilgert, Hogarth &
Beverly 2003), and further, they rely on financial advice from friends and colleagues
for making retirement saving decisions (as found by Benartzi & Thaler 1999; Duflo &
Saez 2002).
In order to achieve the research objectives, it has been necessary to:
• determine the level of use of the various superannuation fund provided
educational resources;
• determine whether the superannuation fund provided educational resources are
meeting the users’ expectations for information, instruction and advice;
• determine how individual users rate these educational resources for their
superannuation investment decision making;

5
• determine the reasons investors fail to use the superannuation fund provided
educational resources;
• evaluate the importance placed by users on these educational resources for
their overall decision making on superannuation matters; and,
• determine how frequently the superannuation fund educational resources are
accessed by members.
1.3 The Justification for the Research
Economic theory assumes that individuals will exhibit rational behaviour when it
comes to saving for retirement (Modigliani & Brumberg 1954). This economic (life-
cycle) theory assumes that individuals will accumulate sufficient wealth to allow them
to enjoy an expected standard of living in retirement. However, behavioural research
evidence suggests that many individuals will exhibit irrational behaviour when it
comes to saving for their retirement and will fail to plan and save adequately for it
(Belsky & Gilovich 2000). It is suggested that individuals generally lack the mental
capability and willpower required to plan and save for retirement (Mullainathan &
Thaler 2000). This is reinforced by a recent survey (AXA 2008) on retirement that
found that almost 50 percent of Australians were not prepared for their retirement.
Therefore, assessing and improving the level of financial literacy among Australian
workers who are choosing to make investment decisions for their superannuation have
emerged as important issues.
The OECD (2006) emphasises the importance of financial literacy in assisting
individuals to save adequately for their retirement income. Research indicates that as
an individual’s financial knowledge increases so will their ability to better plan and
save for their retirement (Lusardi 2005). Surveys conducted by the Australian and the
New Zealand Banking Corporation (ANZ A.C.Neilson 2005; ANZ 2008) and Mercer
(2006) found that a significant number of Australians had a low awareness of
superannuation issues.

6
The federal government and Australia’s major banks have all emphasised the
importance of consumer financial literacy. In 2003 the Australian government
established a national consumer and financial literacy ‘Taskforce’ to develop a
national strategy to raise levels of financial literacy in Australia. As part of its terms
of reference, the Taskforce was asked to consider the issues of “enhancing awareness
of the importance of saving and better communicating the need for a focus on
retirement savings” and to consider “the availability of financial information and
education to maximise superannuation and retirement savings” (The Treasury 2003).
An OECD report (OECD 2005) on improving financial literacy emphasised the need
for and potential benefits of financial education for retirement savings, while an ANZ
A.C. Nielsen survey (2005, p. 3) indicated that “a minority of those surveyed had
calculated how much they needed to save for retirement”.
Some studies have shown that financially educated consumers are more likely to save
and to save more than their less financially literate counterparts (Bayer, Bernheim &
Scholz 1996; Clark & Schieber 1998; Lusardi 2005; Clark et al. 2006). An OECD
July policy brief (OECD 2006) further supports the notion that financially educated
individuals are more likely to save and, furthermore, to challenge financial service
providers to provide products that meet their investment needs. The OECD report
identifies the complexity of financial products and markets as factors making
financial education increasingly important. Another OECD report (2008a, p. 119)
states that:
Financial education can contribute to the well-being of workers in retirement by
providing them with information and skills to make wise investment choices with
both their pension plans and any individual savings plans.
This study contributes significantly to knowledge, as there is a gap in the research
evaluating the adequacy and effectiveness of financial information and education for
superannuation saving in an Australian context. The majority of research in Australia
has been largely confined to surveys seeking to identify levels of financial and
superannuation literacy (ANZ A.C.Neilson 2005; ANZ 2008). Other Australian
research has been driven more by why investors fail to make active superannuation
choices, why they find these choices difficult, the role of a default fund option (Clark-

7
Murphy, Kristoferson & Gerrans 2002; Brown, Gallery & Gallery 2002; Gallery,
Gallery & Brown 2004), and the extent to which superannuation fund provided
educational resources were used to make a decision on whether or not to switch from
a defined benefit fund to a defined contribution fund and the importance they played
in this decision (Clark-Murphy & Gerrans 2001).
This study extends previous research in Australia by determining whether
superannuation fund provided information and education is adequately structured and
communicated to meet the needs of individuals exercising investment choice so that
they can make appropriate financial decisions for their retirement funding. The
importance of this matter is reinforced by an OECD report (OECD 2005) titled:
‘Improving Financial Literacy’ where it is stated that “there is much more to do and
learn about financial education programmes and how to make them better” (p. 16).
1.4 Scope of the Study
An Australian university industry superannuation fund is the source for data
collection in this study. Other categories of funds such as retail and wholesale funds
were considered but gaining access to the required data was problematic.
The focus in this study is on superannuation fund members who are part of a defined
contribution plan and have made, and may again in the future, make investment
decisions involving the allocation of their accumulated savings to various investment
plans offered by the superannuation fund, an action described as ‘within fund choice’.
The retirement wealth of these members is directly influenced by the investment
choices they make. Therefore, informed investment choice is of vital importance and
strongly linked to their financial understanding of the alternative investment choices.
It is not within the parameters of this study to capture those superannuation investors
who are pursuing passive choice by opting for a defined benefit at retirement. Their
wealth outcome is based on a formula which encompasses, as previously noted, their
average salary and years of employment. In a defined benefit plan the members’
8
investment allocation decisions and the investment risks are the responsibility of the
fund.
It is the distinction between defined benefits and defined contribution plans that
emphasises the importance of financial education to those superannuation investors
who are exposed to the investment risks that flow from their investment choices. It is
for this reason that financial education is of vital importance to these investors.
Without appropriate financial knowledge they may lack the prerequisite skills for
ensuring that they make the informed choices necessary to produce the financial
outcomes necessary for their retirement.
1.5 Methodology
The aim in this study is to examine the attitudes of superannuation defined
contribution fund members about the educational resources provided to them by their
superannuation fund. A survey approach was adopted to obtain the data necessary to
address the research questions. The survey approach to research is regarded as the
best method for gathering data from large unobservable populations (Babbie 2008).
Because of the geographical dispersion of the sample an electronically mailed
questionnaire (web-based survey) was used to ascertain members’ perceptions of the
benefit of educational information in enabling them to make informed decisions
regarding their superannuation. The decision to use an electronic questionnaire was
made after consideration of both the advantages and disadvantages of different survey
types. This decision process was guided by the Trochim (2006) framework (see
Chapter 4: Section 4.5.1).
The sample was drawn from an Australia-wide university sector and was specifically
targeted to those superannuation fund members who had a defined contribution fund.
The sample comprised 5000 staff from 27 Australian universities. Defined
contribution fund members were chosen as they actively participate in the investment
decision making process by nominating where their funds will be invested from a list
of available investment options.

9
Five-point rating scales were used in the questionnaire to allow for the measurement
of agreement (attitude), intensity and frequency to responses from prepared
statements and questions. A Likert scale was used to measure the respondents’
strength of agreement to a statement; frequency scales were used to determine how
often respondents accessed each educational resource provided by the superannuation
fund; and intensity scales were used to determine the importance respondents placed
on educational information.
The questionnaire was divided into six parts, namely: demographic and background
questions; educational seminar; superannuation fund website; superannuation fund
written communications; superannuation fund provided financial counselling; and,
other sources of educational information and superannuation fund account balance.
Information collected in the questionnaires was used to test whether four variables:
financial education seminars; web-based education information; written
communications; and, personal financial counselling lead to a perception of informed
decision making by superannuation fund members, and to validate the theoretical
model.
Prior to final administration, the questionnaire was tested on a group of university
staff to ensure that the layout, sequencing and wording of questions were appropriate
and easily understood, and to also test for reliability and validity. Feedback from
testing the questionnaire led to some minor changes to question format, sequence,
order, and layout. A researcher must also ensure that the survey instrument is reliable
and valid. A reliable survey will yield consistent responses from the questions asked,
whereas, a valid survey measures what it is actually supposed to measure. Measures
were adopted to ensure that the survey instrument was both reliable and valid (see
Chapter 4: Section 4.5.5).
The data collected were analysed using the statistical analysis software Statistical
Package for Social Sciences (SPSS) Version 14.0. The data were subjected to
parametric and non-parametric tests where appropriate, including analysis of variance
(ANOVA).

10
1.6 Outline of the Thesis
The thesis is organised into seven chapters. The present chapter provides a
background to the study, the objectives, the justification for the research, the scope of
the study and an overview of the research methodology.
Chapter Two provides an overview of the Australian superannuation framework. It
also incorporates discussion on the Australian retirement system, implications of an
ageing population, the mechanics of the choice of fund superannuation system, the
composition and size of the superannuation system, regulation and taxation of the
system, and an assessment of the adequacy of superannuation savings.
Chapter Three provides an outline of the life-cycle model, and the implications of the
behavioural finance theories and the literature on the life-cycle model for retirement
saving is assessed. A theoretical framework for superannuation fund choice is
introduced and the importance of financial education for retirement savings is
discussed. A review of the literature is conducted to evaluate the relevance of
financial education for planning and saving for retirement. Also in this chapter, the
theoretical framework for the research and the research model for superannuation
education are determined, and research questions are developed.
Chapter Four focuses on the methodology used to examine the impact of financial
education in a choice of fund superannuation system. The chapter initially provides a
discussion of the paradigm and methodology for the research. Justification for
administering an electronic mail questionnaire is then provided. Details are provided
on the construction and the administration of the questionnaire. There is also
discussion on how the sample was chosen and how measurement issues relating to
validity and reliability were considered and addressed.
The descriptive results of the study are reported in Chapter Five. The statistical
techniques used were frequencies, mean (measure of central tendency) and standard
deviation (measure of dispersion). The results obtained from the statistical analysis
were then used to answer the research questions. Further results were also reported on

11
the Cronbach alpha for reliability of survey measurement scales, and the response rate
to the survey was provided.
The inferential statistical results are reported in Chapter Six. Tests of significance are
discussed and a significance level chosen. Analysis of variance and chi-square tests of
independence are used to determine whether demographic and background group
responses to variables differed from one another.
Chapter Seven presents a summary of the overall study and highlights the findings.
Furthermore, a number of recommendations and suggestions for further research are
provided and the limitations of the study are discussed.

12
Chapter Two
An Overview of the Australian Superannuation Framework
2.1 Introduction
The provision of retirement income has become a challenge for governments across
the world. The population is ageing as a result of lower mortality and fertility rates.
An ageing population will place financial stress on government budgets, as spending
on welfare increases, which will be further compounded by a proportional reduction
in working age taxpayers. In 1992 the Australian government introduced a
compulsory superannuation charge on employers to assist employees to save for their
retirement. Even though savings in superannuation have increased significantly over
the years, a number of Australians will have insufficient savings to fund fully their
retirement. Harding (2005, p. 2-3) suggests that:
In essence, the poorest one-half of 50 to 64 year olds have almost no wealth to help
sustain them through the decades of retirement that lie ahead of them.
More recent changes by the government to the superannuation framework such as a
simplification of the superannuation system, government co-contribution, choice of
fund, assistance with finding lost superannuation accounts, and superannuation tax
incentives, have emphasised the importance the government places on superannuation
as a mechanism supporting future generations of Australians in retirement. The
discussion that follows is aimed at providing a review of Australia’s retirement
income system with a particular focus on superannuation.
2.2 Australia’s Retirement Income System
Australia has a three-pillar approach to providing retirement income. The three pillars
that currently underpin Australia’s retirement system are as follows: a means tested
government provided age pension; a system of compulsory superannuation for

13
employees provided by the employer at a minimum prescribed level; and voluntary
savings, including both superannuation and non-superannuation savings. The World
Bank has broadly endorsed Australia’s three-pillar approach to providing retirement
incomes (The Treasury 2004). A World Bank Report (World Bank 1994) advocated a
three-pillar system comprising a publicly tax-funded pension, a compulsory privately
managed and funded retirement benefit scheme, and a voluntary savings component
as the third pillar. It has been stated that even though the Australian retirement income
system may possess some defects, it has become something of a role model for
developing countries (Clare 2008b). A recent government commissioned report
(Harmer Report 2009) on Australia’s retirement system has recommended that the
existing three-pillar system should be retained.
2.3 The Australian Aged Pension
The first pillar of the retirement income system in Australia, the aged pension,
provides a guaranteed means tested income. A World Bank Report prepared by
Holzmann and Hinz (2005, p. 6) recommends that:
The primary goals of a pension system should be to provide adequate, affordable,
sustainable, and robust retirement income, while seeking to implement welfare-
improving schemes in a manner appropriate to the individual country.
The Australian aged pension is funded directly from government revenue and is
payable to eligible recipients. Around 75 percent of Australians who have reached the
eligible pension age receive a government pension (Department of Families, Housing,
Community Services and Indigenous Affairs (FaHCSIA) 2008a). Currently,
Australian resident males are eligible to receive the aged pension if their income and
assets are below a certain amount and they are aged 65 or over. Resident females are
also subject to the same income and assets tests; qualifying age varies between 63 and
65 years based on the year of birth, but will ultimately become 65. As part of its 2009-
2010 budget measures the Australian government plans to increase progressively the
eligible pension age to 67 by the year 2023. The annual aged pension in February
2009 was $14,614.60 for a single person and a combined $24,414.00 for a couple,

14
with further possible benefits such as utilities allowance, pharmaceutical allowance,
telephone allowance, and rent assistance subject to eligibility (Centrelink 2009). In
1997 the government legislated to ensure that the maximum single rate of pension is
at least 25 percent of ‘Male Total Average Weekly Earnings’ (MTAWE) (FaHCSIA
2008a). The Association of Superannuation Funds of Australia (ASFA) Policy
Principles indicate that there is broad political and community support in Australia for
an aged pension funded out of general revenue (Clare 2008b). As part of its 2009-10
budget measures and in line with the Harmer Report (2009) recommendations the
Australian government has announced an increase in the single aged pension of up to
$32.49 a week and $10.14 extra a week for couples.
2.3.1 Poverty Measures and the Aged Pension
The Melbourne Institute of Applied Economic and Social Research (2009) poverty
line measures for the September quarter 2008, is $453.95 per week ($23,605.40
annually) for pension couples and $320.47 per week ($16,664.44 annually) for a
single aged pensioner. A comparison with the pension payment figures above suggest
that aged pensions are not far from the poverty line. Another comparison of the aged
pension with a traditional poverty benchmark of 50 percent of median income
presents a similar picture (Clare 2008b). However, it is important to note that these
poverty measures represent an Australian, not an international standard. In a recent
annual survey conducted by McNair Ingenuity Research (2008) on behalf of ASFA,
respondents indicated that on average an amount of $49,118 per annum in retirement
income for couples was required in order to maintain an adequate lifestyle. Based on
these comparisons the McNair survey group would not be able to maintain an
adequate lifestyle on the aged pension. FaHCSIA (2008a) reports that many
pensioners rely on income support for long periods and that most pensioners have low
incomes. Therefore, to generate the retirement income required to support an adequate
lifestyle, wealth will need to be created with either superannuation and/or voluntary
savings.
In May 2008 the Minister for FaHCSIA commissioned an investigation by Dr Jeff
Harmer (Secretary FaHCSIA), into measures to strengthen the financial security of

15
seniors, carers, and people with a disability, including a review of the aged pension.
The Pension Review is part of the Government’s wider enquiry into Australia’s future
tax system and is chaired by the Secretary to the Treasurer, Dr Ken Henry. The
Pension Review has three key terms of reference (FaHCSIA 2008b):
• the appropriate levels of income support and allowances;
• the frequency of payments; and,
• the structure and payment of concessions or other entitlements.
The Association of Superannuation Funds of Australia (ASFA) (2009a, p. 1)
suggested that the Harmer pension review “needs to demonstrate how the
Government can achieve a balance between providing a safety net through the aged
pension and encouraging people to self-fund their retirement”. The Harmer pension
review report released by FaHCSIA on 12 May 2009 developed 30 findings across
five major areas. The report made recommendations such as increasing the pension
rate, increasing the pension qualifying age, better indexation arrangements for
pensions and, less complexity and better support for those over the pension age
seeking to participate in the workforce (Harmer 2009).
2.4 Implications of Australia’s Ageing Population
The second Intergenerational Report (The Treasury 2007) explains that Australia, like
other OECD countries, is experiencing an ageing of its population driven by declining
mortality rates. The Intergenerational Report projects future mortality rates to fall by
2047, with life expectancy to increase to 86 years for men and 90 years for women:
about 25 percent of the population is projected to be aged 65 and over, almost
doubling the current proportion. The number of people aged 55 to 64 is projected to
increase by nearly 50 percent, over the next 40 years. The Report acknowledges the
recent increase in the fertility rate, but suggests that it is still significantly below the
replacement rate. The most commonly used indicators of population ageing are the
proportion of the population aged 65 and over (FaHCSIA 2004). Another common
measure of population ageing is the dependency ratio which is used to measure the

16
people aged 65 and over compared to the population of working age (15-64)
(FaHCSIA 2004). Harding (2005, p. 1) explains that:
In 1960 there were about 7.3 working age Australians to help support each retiree
aged 65 years and over. By 2040 there are forecast to be only 2.4 working age
Australians for each retiree aged 65 and over.
According to the second Intergenerational Report (The Treasury 2007) there are
currently 5 people of working age to support every person aged 65 or over, and this is
expected to fall to 2.4 by 2047. Many of the concerns surrounding the issue of an
ageing population are of an economic nature (Drabsch 2004). As a result of an ageing
population the second Intergenerational Report (The Treasury 2007) estimates that by
2046-47, the gap between spending and revenue will grow to 3.5 percent of GDP. It is
also reported that over the next 40 years, the ageing of the population is projected to
slow economic growth. The impact of higher government spending and slowing GDP
is predicted to send the Federal Government budget into deficit and higher taxes may
have to be imposed on future generations of taxpayers. CEDA (2004, p. 1) suggests:
The ageing of Australia’s demographics has taken on greater public policy
significance, as it presents major challenges about how Australia should address the
economic, fiscal and social impacts, including the impact on the future growth in
living standards of Australians.
Earlier, the first Intergenerational Report (The Treasury 2002) identified the
superannuation system as one of the structures that is in place that can counter the
impact of an ageing population. The Australian government has sought to reduce
future economic pressure resulting from an ageing population by encouraging the
Australian public to save for retirement through mechanisms such as compulsory
employer superannuation contributions, taxation incentives and superannuation co-
contributions. Alliance Strategic Research (2008) suggested that because of the
economic importance of superannuation savings there is considerable input into
policy decisions from the finance and economic sectors and that the superannuation
portfolio is placed in Treasury, rather than in the Department of Families, Housing,
Community and Indigenous Affairs which has the responsibility for pensions.
17
Therefore, the second and third pillars of Australia’s retirement income system,
(superannuation; voluntary savings), will play a vital role in future in providing
retirement income for a substantial proportion of the population and it will also
provide a counter-balance against future government expenditure.
2.5 Superannuation in Australia
Superannuation as a form of savings has existed for more than a century in Australia
and for the majority of this time was only applied to a small segment of the working
population such as white collar workers, public servants, members of the defence
force, and employees in the finance sector. The introduction of a formalised employee
superannuation scheme occurred in 1986 when industrial agreements were reached to
provide for a three percent employee contribution paid into an industry fund. As a
consequence, superannuation coverage increased from 40 percent of employees to 79
percent in the following four-year period (APRA 2007). However, coverage was
limited only to those covered by an industrial award. APRA (2007, p. 3) states that
this award based system had a number of problems including:
• nearly one-third of private sector employees remained uncovered by 1991;
• not all employees who were entitled to award superannuation received it, in
part because compliance could not be enforced through a laborious case
mounted with the Conciliation and Arbitration Commission;
• award superannuation as a universal entitlement did not effectively take into
account the significant number of employees who already had some
superannuation rights as part of their employment; and,
• the three percent award was too small to provide a significant improvement in
retirement incomes for many employees.
The second pillar of Australia’s retirement system, compulsory superannuation, was
not adopted until 1 July 1992. The new system was known as the Superannuation
Guarantee (SG). The SG was enforceable through the Commonwealth’s taxation
powers under The Superannuation Guarantee (Administration) Act 1992. The SG

18
commenced with employer contributions set at three percent of salary. The employer
contribution rate was increased over a ten-year phase to a maximum rate on 1 July
2002 of nine percent. The SG has to be paid if an employee earns $450 (pre-tax) or
more per month and is aged between 18 and 70 and works full-time, part-time or on a
casual basis. An employer must also pay the SG if an employee is under the age of 18,
is paid $450 (pre-tax) or more per month, and works more than 30 hours in a week
either full-time, part-time or on a casual basis (Australian Taxation Office (ATO)
2008).
The SG is enforced by the ATO. As the SG is governed by Commonwealth powers it
provides for:
• a major extension of superannuation coverage to employees not already
covered by superannuation;
• an efficient method of encouraging employers to comply with the obligation to
make contributions on behalf of their employees; and,
• a mechanism by which the level of employer superannuation support could be
increased over time, consistent with the Government’s retirement income
policy objectives and the economy’s capacity to pay. (APRA 2007, p. 4)
2.5.1 Superannuation Co-contribution
The superannuation co-contribution was introduced from 1 July 2003 to assist low
and middle income earners to save for their retirement. The co-contribution is made
by the government to an individual’s superannuation account. The government
contributes up to $1.50 for every dollar of personal superannuation contributions
made from after tax income, up to the current maximum of $1,500 per year of income.
The maximum entitlement of $1,500 is reduced by five cents for every dollar that is
earned over $30,342 up to $60,342. Australian Taxation Office (ATO 2009a) rules
provide that from 1 July 2008, a person is eligible for the co-contribution if:
19
• they make a personal contribution by 30 June each year into a complying
superannuation fund or retirement savings account;
• their total income is less than $60,342 (indexed to changes in average wages);
• 10% or more of their total income is from eligible employment, running a
business or a combination of both;
• they are less than 71 years old at the end of the year of income;
• they do not hold an eligible temporary resident visa at any time during the
year; and,
• they lodge an income tax return.
As part of its 2009-10 budgetary measures the Australian Government announced that
as of 1 July 2009 it will reduce its matching of superannuation contributions by
workers earning less than $60,342 from $1.50 for every dollar contributed to $1.00 for
every dollar contributed for the years 2009-10, 2010-11 and 2011-12 income years
and, a matching rate of 125 percent for the 2012-13 and 2013-14 years. Beyond this
period the matching rate will revert to 150 percent.
Nielson (2005) found that the co-contribution scheme delivered a number of benefits,
particularly to women and the baby boomer age group. He found that 63 percent of
the beneficiaries of the co-contribution were women, and 47 percent were aged
between 46 and 65. It is acknowledged by Neilson (2005) that this benefit alone will
not alleviate the problem of small superannuation balances of low income earners. A
recent survey of three industry funds was conducted by the Australian Institute of
Superannuation Trustees (AIST 2008). Their funds data showed that over the three
years surveyed (2004-2007) participation in the co-contribution scheme increased
from 6.1 to 9.9 percent. However, based on income levels, they estimated that 56
percent of the survey groups were within the eligible income range. The survey
findings are summarised as follows (AIST 2008a, p. 1):
• apathy and affordability are the major barriers to participation;
• participation is skewed heavily to older workers;
• household income and dependents are key factors in participation;
• co-contribution scheme is effective in changing savings behaviour;

20
• high levels of awareness of the scheme generally;
• women are likely to participate and have higher awareness; and,
• better access to advice from superannuation funds required to convert positive
disposition into action.
The research identified that the scheme failed to benefit many young families and
those on low incomes. Those with young families or low incomes might lack the
disposable income required to contribute to the scheme. The main beneficiaries of the
scheme were older people with disposable income. It also shows that participation in
the scheme is impacted by individual apathy. The recommendations of the AIST
report (2008a, p. 1) are as follows:
• split the co-contribution scheme into $500 direct subsidy for very low income
workers, and retain the existing scheme on a dollar-for-dollar basis for low
and middle income earners;
• raise the phase-out range to $35,000-$75,000 income levels;
• further research required to target specific groups in awareness campaigns;
and,
• government and superannuation industry to develop cost-effective limited
advice channels to improve conversion of positive disposition into action.
2.5.2 Choice of Fund
The SG legislation makes no specific provision in regard to which fund employers
should make their mandatory contributions, only that it should be a ‘complying fund’
for the purposes of the Superannuation Industry (Supervision) Act 1993 (see also
Section 2.7). For administrative simplicity it was common for employers to pay the
entire superannuation contribution into the relevant industry fund (APRA 2007).
Legislation was first introduced in 1997 and then passed in 2004 allowing ‘choice’ of
superannuation fund. Beal and Delpachitra (2004, p. 128) comment that:

21
The issue of choice, and especially informed choice, has been widely acknowledged
as vitally important to the success of the superannuation policy.
The Superannuation Guarantee (Administration) Amendment Regulations 2005 that
came into effect on 1 July 2005 generally allowed employees to nominate any
complying fund into which the employer must pay their superannuation guarantee
contributions. Trustees of the fund were also required to transfer any ‘superannuation
accumulation withdrawal benefit’ to another fund on the request of a member. The
ASFA Research Centre estimates claimed that after 1 July 2005 some 5.7 million
Australians had the statutory right to choose their fund (Clare 2005). ATO rules (ATO
2009b) provide that a person will not be eligible to make a choice of fund if:
• their superannuation is paid under a state award or industrial agreement;
• their superannuation is paid under certain workplace agreements including an
Australian Workplace Agreement (AWA) (although choice can also be
provided under these awards and agreements); and,
• they are in a particular type of defined benefit fund or they have already
reached a certain level of benefit in that superannuation fund.
Some federal and state public sector employees are also excluded from choice of
superannuation.
The 2006 ANOP Survey commissioned by ASFA found that only four percent of their
sample actually exercised a conscious act of choosing a fund. A recent survey
conducted by McNair Ingenuity Research (2008) on behalf of ASFA found that eight
percent of respondents indicated that they had changed superannuation funds in the
last 12 months. Gunasingham and Zavone (2005, p. 4) claimed the following benefits
for the introduction of greater choice:
• consumers will win sovereignty over their superannuation;
• increased competition will lead to downward pressure on fees and charges;
and,
• competition will drive innovation.

22
2.5.3 Lost Superannuation Accounts
Senator Nick Sherry, Minister for Superannuation and Corporate Law, recently
announced that the total of lost member superannuation accounts listed on the Lost
Members Register (LMR) rose from 6.1 million accounts on 30 June 2007 to 6.4
million accounts at 30 June 2008 (Sherry 2009). The amount of lost superannuation
increased from $11.9 billion in superannuation assets on 30 June 2007 to $12.9 billion
on 30 June 2008, representing an increase of 8.4 percent. The Treasury (2008a)
acknowledges that the growth in the number of lost accounts on the LMR is mainly
due to a lack of engagement by many members with their superannuation. Lost
superannuation may result in circumstances where members fail to rollover their
benefits from one superannuation fund to another, change jobs, change their name or
fail to contact their fund when they change residence. Certain individuals may also
lack an awareness of their superannuation accounts. The Treasury (2008a, p. 15)
suggest that:
Given the small balances of many of these accounts there is little incentive for
members to stay in contact with their fund or to complete the paperwork for the
release or transfer of these benefits.
Bateman (2008) notes that significant costs associated with lost superannuation
accounts are borne by individuals, superannuation funds and government. Individuals
will retire with less saving. Superannuation funds will have to deal with the
administrative costs associated with lost accounts, such as, mandatory reporting. The
government also bears the costs of maintaining the administrative structure for lost
accounts, and higher pension payments may also result in lower superannuation
savings. Therefore, superannuation fund member education on the benefits of
retirement savings may invoke both interest and ownership of these lost accounts.
Under the current legislation, The Superannuation (Unclaimed Money and Lost
Members) Act 1999, superannuation funds are required to report (semi-annually) the
details of member accounts considered lost, to the ATO. The ATO keeps a list of
names of people who have been reported by their superannuation funds as lost. The
register includes details of lost members for accounts held by: superannuation funds;
23
approved deposit funds; eligible rollover funds; and retirement savings account (RSA)
providers. A person’s name may appear on this list when the superannuation fund is
unable to make contact or no contributions have been received from the person in the
last five years. Monies from a lost account are not transferred to the ATO; instead the
account remains with the superannuation fund and is invested by it or it may be
transferred to an eligible rollover fund. The ATO has set up an internet-based tool,
SuperSeeker, that will assist a person looking for lost superannuation that instantly
provides a person with possible matches. SuperSeeker searches the LMR and the
ATO’s other records to find possible matches for the lost superannuation. When
searching for lost superannuation through SuperSeeker, the person needs to provide
their name, date of birth and tax file number. The ATO also provides SuperMatch, an
electronic commerce interface designed to provide tax agents, financial advisers,
financial planners and accountants with access to the LMR. This system allows a
search to be conducted on behalf of a person. If a balance of a lost account contains
less than $200, a person may be able to withdraw it from the fund tax-free. It is also
an aim of the ATO to make it easier to find and transfer lost superannuation in future
(The Treasury 2008a). Furthermore, the government has announced that from 1 July
2010, superannuation funds will be required to transfer to the ATO as unclaimed
monies, those accounts with balances less than $200 and those accounts that have
been inactive for a period of five years and have insufficient information to identify
the owner of the account (Corrs Chambers Westgarth 2009).
2.5.4 Superannuation Clearing House
In the 2008-09 budget, the government announced that it would provide $16 million
over a three-year period to establish a superannuation clearing house facility. The
Treasury (2008a, p. 3) suggests that:
The measure is designed to reduce the red tape and compliance costs for business
associated with meeting their superannuation obligations.
The Treasury (2008a, p. 3) notes that: the superannuation clearing house facility will
be:

24
• optional for employers;
• it will be contracted to the private sector, manage employers’ obligations
under superannuation choice; and,
• be available free to small businesses with less than 20 employees.
However, consultation with industry will have to occur before the measures are
implemented.
2.6 Composition and Size of Australia’s Superannuation Industry
APRA recognises five superannuation fund types. These include corporate funds,
industry funds, public sector funds, retail funds, and small funds. The APRA (2007,
pp. 46-49) definitions are summarised in Table 2.1.
Table 2.1 Definitions of Superannuation Fund Types
Type of Fund Definition of Superannuation Fund Types
Corporate Corporate funds are established for the benefit of a particular entity
or a group of related entities, with joint member and employer
control
Industry Provide for employees working in the same industry
Public Sector Provide benefits for Government employees or are schemes
established by a Commonwealth, State or Territory law
Retail Offer superannuation products to the public on a commercial basis*
Small These funds have less than five members and are either regulated by
APRA or the ATO
*APRA classifies all Eligible Rollover Funds (EFRs) and Approved Deposit Funds (ADFs) in
the retail category.
The current structure of the Australian superannuation industry is summarised in
Table 2.2. Total superannuation assets are reported to be in excess of $1 trillion,
representing more than 100% of GDP. The highest level of assets is concentrated in
self-managed superannuation funds ($326.4 billion), followed by retail funds with
$297.1 billion in assets. Even though the corporate sector has the highest number of

25
funds (199) it has relatively fewer assets ($53.6 billion) when compared to other
major fund types. There is a proliferation of small superannuation funds: there are
401,366 self-managed funds and another 4,433 small APRA regulated funds. The
Table also identifies 66 industry funds and 40 public sector funds. Both the industry
funds and retail funds have significant levels of assets ($181.1 and $149.4 billion,
respectively).
Table 2.2 The Australian Superannuation Industry at December 2008
Fund Type Assets ($ billion) Number of Funds
Corporate 53.6 199
Industry 181.1 66
Public Sector 149.4 40
Retail 297.1 169
Sub-total 681.3 474
Small APRA Funds 2.6 4,433
Single-Member ADFs 0.1 120
Self-managed Super Fundsa
326.4 401,366
Balance of Life Office Statutory
Funds
43.2
Total 1,053.5. 406,479
a Estimated data on self-managed superannuation funds are provided by the ATO.
Source: APRA (2009a, p. 7) Quarterly Superannuation Statistics, December 2008.
2.6.1 Superannuation Fund Benefit Structures
In Australia, defined benefit, defined contribution (accumulation), and hybrid are the
main types of benefit structures used in superannuation funds. In a defined benefit
fund the member’s benefit is calculated using a formula that takes into account the
years of service with an employer and the level of salary near retirement; and the
superannuation fund bears all the investment risks. The defined contribution
(accumulation) fund allocates benefits to members based on the investment
performance of the fund assets. Returns to members will therefore fluctuate with

26
investment market performance; thus, fund members bear all investment risks. A
hybrid fund has a combination of both defined benefit and defined contribution
members. The traditional plan in Australia was defined benefits, but there has been a
substantial move away from defined benefit plans towards accumulation plans (Ross
& Wills 2002). In the 1980s approximately 80 percent of superannuation fund
members belonged to defined benefit plans (Bateman 2008). Recent data from APRA
(2009b) indicate that only around two percent of members now belong to defined
benefit plans, almost 60 percent belong to defined contribution (accumulation) funds
and a further 38 percent are in hybrid funds (refer to Table 2.3). Bateman (2008, p.
11) suggests that:
This is largely because the superannuation guarantee is specified in terms of a defined
contribution and while defined benefits can comply the regulations are more onerous.
As well, employer sponsors are opting to shift the administrative burden associated
with superannuation to commercial funds and to shift the investment risks back to
fund members.
As indicated in Table 2.3, the majority of superannuation assets are in accumulation
funds ($712.4 billion) and hybrid funds ($357.5 billion). The defined benefit plans
hold a total of $64.3 billion from total superannuation assets of $1.13 trillion. There is
also a substantial number of accumulation funds (393,910) representing 99.95 percent
of the total number of superannuation funds. This trend, involving a move away from
defined benefit to accumulation funds, has also been very strong in the United States
(Ross & Wills 2002). However, this is not the case in Canada and the United
Kingdom where the large majority of assets and members is concentrated in defined
benefit funds (Broadbent, Palumbo & Woodman 2006).
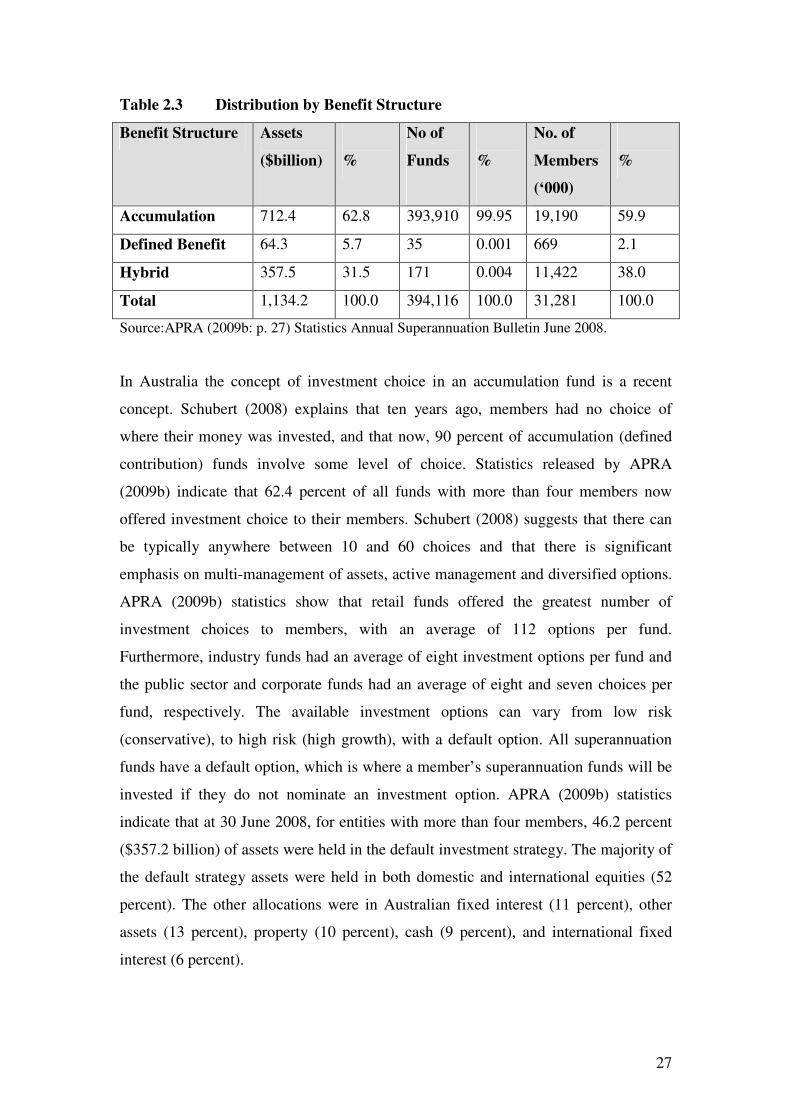
27
Table 2.3 Distribution by Benefit Structure
Benefit Structure Assets
($billion)
%
No of
Funds
%
No. of
Members
(‘000)
%
Accumulation 712.4 62.8 393,910 99.95 19,190 59.9
Defined Benefit 64.3 5.7 35 0.001 669 2.1
Hybrid 357.5 31.5 171 0.004 11,422 38.0
Total 1,134.2 100.0 394,116 100.0 31,281 100.0
Source:APRA (2009b: p. 27) Statistics Annual Superannuation Bulletin June 2008.
In Australia the concept of investment choice in an accumulation fund is a recent
concept. Schubert (2008) explains that ten years ago, members had no choice of
where their money was invested, and that now, 90 percent of accumulation (defined
contribution) funds involve some level of choice. Statistics released by APRA
(2009b) indicate that 62.4 percent of all funds with more than four members now
offered investment choice to their members. Schubert (2008) suggests that there can
be typically anywhere between 10 and 60 choices and that there is significant
emphasis on multi-management of assets, active management and diversified options.
APRA (2009b) statistics show that retail funds offered the greatest number of
investment choices to members, with an average of 112 options per fund.
Furthermore, industry funds had an average of eight investment options per fund and
the public sector and corporate funds had an average of eight and seven choices per
fund, respectively. The available investment options can vary from low risk
(conservative), to high risk (high growth), with a default option. All superannuation
funds have a default option, which is where a member’s superannuation funds will be
invested if they do not nominate an investment option. APRA (2009b) statistics
indicate that at 30 June 2008, for entities with more than four members, 46.2 percent
($357.2 billion) of assets were held in the default investment strategy. The majority of
the default strategy assets were held in both domestic and international equities (52
percent). The other allocations were in Australian fixed interest (11 percent), other
assets (13 percent), property (10 percent), cash (9 percent), and international fixed
interest (6 percent).

28
In Australia, a large number of superannuation fund members in accumulation funds
are exposed to the investment risks associated with investment choices. These
investment risks will impact on members’ returns and will ultimately determine the
amount of any retirement benefit. It is, therefore, crucial that the risk/return
relationships are properly understood and managed by investors.
2.6.2 Financial Performance of the Superannuation Industry
APRA (2009b) recently released superannuation data which show that superannuation
assets have grown from $518.1 billion in 2002 to $1,170.4 billion in 2008
representing an annual increase of 14.5 percent. There was a significant increase in
assets held in all fund sectors (industry, public sector, retail, small funds) except for
the corporate sector. The APRA report also reported investment performance for the
period 1999-2008 for the various sector funds with over four members. The arithmetic
mean Return on Assets (ROA) for all funds during this period was 5.2 percent.
However, there was significant variation in returns over this period with the highest
annual return of 13.3 percent for the year ended 30 June 1998, and the lowest a
negative 7.8 percent in the year ended 30 June 2008. The lowest performing sector
was retail with an average 10-year ROA of 4.1 percent and the best performing was
the public sector with an average 10-year ROA of 6.3 percent, followed by the
corporate sector (6.2 percent) and the industry sector (5.7). Statistics released by
APRA (2009b) for the year ended 30 June 2008 show that the ROA for all
superannuation funds with more than four members was negative 7.8 percent.
Corporate funds had the lowest overall ROA with negative 5.3 percent, followed by
the public sector funds with negative 5.7 percent, industry sector funds with negative
5.9 percent and retail funds with negative 10.3 percent.
2.6.3 Impact of the Global Financial Crisis
The impact of the global financial crisis on investment markets and on the recent
performance of superannuation funds has been quite severe. Super Ratings (2009)
data indicate that the latest benchmark annualised returns to 31 January 2009 for the

29
Australian shares index is negative 26.65 percent and for the high growth index it is
negative 22.56 percent. Super Rating’s data also indicate negative returns for the
property index (-25.2) and the balanced index (-15.1). The OECD (2008b) reports that
pension funds in the OECD had declined by about US $3.3 trillion from December
2007 to October 2008, representing nearly a 20 percent decrease over that period.
This indicates that poor investment performance of superannuation funds is
widespread, impacting investment values around the world. AIST (2008b, p. 6) report
that “superannuation funds face an increasing probability of another negative year for
investment options with higher exposure to growth assets”. In February 2009,
representatives of the Superannuation Stakeholder Group in Australia prepared a joint
communiqué on superannuation in the context of the global financial crisis. They
acknowledged the severe impact of the crisis on the Australian share market and
remarked that this was not the first time the market had experienced a significant
downturn. The Superannuation Stakeholder Group (2009, p. 4) emphasise that:
Even though many superannuation funds have experienced poor returns over the last
12 months, over the last 5 years superannuation funds have delivered strong results.
Superannuation continues to be a worthwhile investment over the long-term.
The immediate impact is on those who are retired and living off their investment
income and those older workers (baby boomers) on the verge of retirement. Many
retired persons have witnessed a dramatic fall in their income and investments. This
has recently placed more demand on the aged pension as more retirees become
eligible for payments as a result of either falling asset values or lower income (or
both). Others looking to retire in the near future are contemplating delaying their
retirement and continuing to work because of the losses they have recently incurred in
their superannuation accounts. ABC News (2009) reports that research firm TNS has
found that in Australia 44 percent of baby boomers are postponing their retirement
because of the global financial crisis. The OECD (2008b, p. 2) has reported that “the
impact of the financial crisis for people who belong to defined contribution funds
depends on their investment choice and the member’s age”. Baby boomers with high
exposure to equity investment are the most affected.
30
The financial crisis has highlighted the need for superannuation fund members to
understand that negative returns occur and usually have a relatively short-term impact
and that superannuation funds have a long-term investment goal and investment
performance should be judged on this basis. The OECD (2008b, p. 2) emphasises that:
…in the context of the financial crisis and the rapid growth of defined contribution
plans, effective financial education programmes and information disclosure have
become more important to the well-functioning of the private pension system.
As a result of negative sentiment there have been increasing levels of superannuation
fund members switching from growth and balanced options to cash (AIST 2008b).
The superannuation fund members who have chosen to make the switch to more
conservative investment options are at risk of missing higher positive returns when
the markets ultimately recover. A superannuation education framework is necessary
to ensure that individuals become informed on investment matters relating to their
superannuation. It is therefore important to assess the existing framework and the
mechanisms by which superannuation fund members become informed on these
matters.
2.7 Regulation of the Superannuation Industry
Superannuation funds are principally regulated under the Superannuation Industry
(Supervision) (SIS) Act 1993. This Act comprises all the regulations that a complying
superannuation fund must follow. It sets out the basic duties and responsibilities of
trustees, the disclosure and regulatory reporting requirements and the roles performed
by auditors and actuaries. APRA together with the Australian Securities and
Investment Commission (ASIC) are charged with the primary responsibility for
supervising the superannuation system through the administration of the SIS Act
1993. APRA, as prudential regulator, is responsible for supervising the banking,
insurance and superannuation sectors of the financial services industry: ASIC is
responsible for market integrity, disclosure and other consumer protection issues
across the financial services industry. Only regulated superannuation funds are
governed by the SIS Act. Superannuation funds must apply to become a regulated

31
fund, and in return for complying with the Act the funds receive certain tax
concessions. The SIS Act was amended in 1999 to provide the ATO with powers to
regulate Self-managed Superannuation Funds (SMSFs). SMSFs are a category of
small superannuation fund which have fewer than five members. The ATO is also
responsible for the taxation of superannuation funds.
The Superannuation Safety Amendment Act 2004 introduced major changes affecting
APRA regulated superannuation funds including:
• trustees were required to be licensed by APRA by 30 June 2006 if they wished
to remain as trustees of APRA-regulated superannuation entities;
• a mandatory risk management framework would apply for both the trustee and
the funds under trusteeship; and,
• the introduction of new operating standards covering fitness and propriety,
adequacy of resources and outsourcing (APRA, 2007, p. 8).
From 1 July 2004, trustees of Registrable Superannuation Entities (RSE) have been
required to hold a Registrable Superannuation Entity Licence (RSE Licence) issued
by APRA. Public offer entities had a transition period of two years from 1 July 2004
to 30 June 2006 within which to obtain an RSE licence and register their RSE. In
addition, all RSE must be registered with APRA prior to commencing operations.
Trustees must first be granted an RSE Licence before being able to register as an
RSE. Trustees of self-managed superannuation funds are regulated by the ATO and
public superannuation schemes are exempt. The SIS Act contains rules that impose
minimum requirements on trustees and are deemed to form part of the trust deed of
every regulated fund. The ATO (2007, p. 10) summarise the duties imposed by the
SIS Act as follows:
• act honestly in all matters concerning the fund;
• exercise the same degree of care, skill and diligence as an ordinary prudent
person in managing the fund;
• act in the best interest of all fund beneficiaries;
• keep the money and assets of the fund separate from other personal assets;
32
• retain control over the fund;
• develop and implement an investment strategy;
• not enter into contracts or behave in a way that hinders trustees from
performing or exercising their functions or powers; and,
• allow members access to certain information.
If a trustee fails to comply with the SIS Act regulations then regulatory penalties and
sanctions may be imposed. If a trustee is prosecuted and is found guilty of either a
civil or criminal offence under the civil penalty provision, the maximum penalties that
may apply under Part 21 of the SIS Act are $220,000 or five years imprisonment (or
both).
Moreover, the Financial Services Reform Act 2001 (FSR Act) was designed to
provide standardisation within the financial services industry. The FSR Act requires
superannuation fund trustees to have an Australian Financial Services Licence
(AFSL) if they are providing financial advice or are a trustee of a public offer
superannuation fund. Those employed by the fund manager to assist in investment
decision making are also required to hold an AFSL to perform their job.
Superannuation fund compliance with the FSR Act is monitored by ASIC.
Furthermore, the Superannuation Complaints Tribunal (SCT) was established by the
Commonwealth Government to deal with complaints about superannuation, annuity
policies and Retirement Savings Accounts (RSA). The aim of the SCT is to provide
an economical, quick and effective way to resolve certain complaints relating to
superannuation. It is available to current and former fund members and their
beneficiaries and the SCT levies no fees or charges to lodge a complaint. The
legislation under which the SCT is established and operates is known as the
Superannuation (Resolution of Complaints) Act 1993.

33
2.8 Taxation of Superannuation
The taxation applying to superannuation contributions, income and retirement benefits
was simplified from the 1 July 2007 with the introduction of revised superannuation
measures. ‘Concessional contributions’ are able to be made by an employer for the
employee and are taxed at 15 percent when they go into the superannuation fund
account. These concessional contributions include superannuation guarantee
payments, other employer-based contributions on behalf of the employee including
employee salary sacrifice contributions, or any other contributions for which a claim
for an income tax deduction is made. Salary sacrifice is an arrangement between the
employer and employee to pay a portion of the employee’s before-tax salary into a
superannuation account. A person is eligible to make superannuation contributions if
they are under 65 years of age, or they are between 65 and 74 and can meet the work
test of 40 hours work over 30 consecutive days during the financial year in which the
contributions were made. Up to $50,000 of concessional contributions can be made to
a superannuation account each year. The current transitional arrangements allow
contributions up to $100,000 each year until 30 June 2012 if a person is aged 50 or
over. Any person turning 50 during the transitional period can still make use of the
$100,000 cap for any remaining years until 2012. Any contributions made over the
concessional rate are subject to additional tax of 31.5 percent; and, a person can make
up to $150,000 a year in non-concessional contributions. The assessable income of a
complying superannuation fund’s earnings is taxed at a rate of 15 percent, and
taxation paid by superannuation funds can be further reduced by the use of imputation
credits. In the 2009-10 federal budget it was announced that there will be a reduction
in the concessional contributions cap from $50,000 to $25,000 for people aged under
50. Furthermore, during the transitional period to 30 June 2012 there will also be a
reduction in the concessional contributions cap from $100,000 to $50,000 per annum
for people aged 50 or over.
From 1 July 2007 superannuation benefits have generally contained only two
components: a tax-free component – taxed in the superannuation fund; and a taxable
component – untaxed in the superannuation fund. This implies that superannuation
benefits will be paid tax-free if they are received from a taxed source and the person is
aged 60 or over. Most superannuation fund members are most likely to draw their
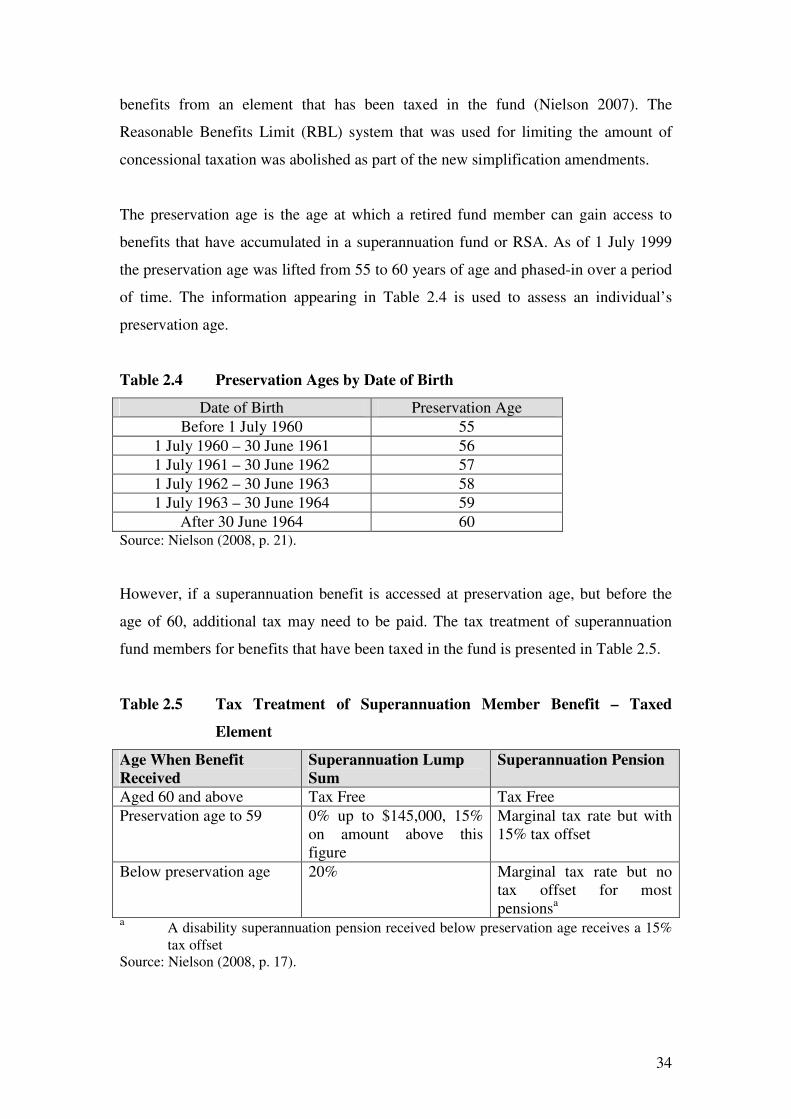
34
benefits from an element that has been taxed in the fund (Nielson 2007). The
Reasonable Benefits Limit (RBL) system that was used for limiting the amount of
concessional taxation was abolished as part of the new simplification amendments.
The preservation age is the age at which a retired fund member can gain access to
benefits that have accumulated in a superannuation fund or RSA. As of 1 July 1999
the preservation age was lifted from 55 to 60 years of age and phased-in over a period
of time. The information appearing in Table 2.4 is used to assess an individual’s
preservation age.
Table 2.4 Preservation Ages by Date of Birth
Date of Birth Preservation Age
Before 1 July 1960 55
1 July 1960 – 30 June 1961 56
1 July 1961 – 30 June 1962 57
1 July 1962 – 30 June 1963 58
1 July 1963 – 30 June 1964 59
After 30 June 1964 60 Source: Nielson (2008, p. 21).
However, if a superannuation benefit is accessed at preservation age, but before the
age of 60, additional tax may need to be paid. The tax treatment of superannuation
fund members for benefits that have been taxed in the fund is presented in Table 2.5.
Table 2.5 Tax Treatment of Superannuation Member Benefit – Taxed
Element
Age When Benefit
Received
Superannuation Lump
Sum
Superannuation Pension
Aged 60 and above Tax Free Tax Free
Preservation age to 59 0% up to $145,000, 15%
on amount above this
figure
Marginal tax rate but with
15% tax offset
Below preservation age 20% Marginal tax rate but no
tax offset for most
pensionsa
a A disability superannuation pension received below preservation age receives a 15%
tax offset
Source: Nielson (2008, p. 17).
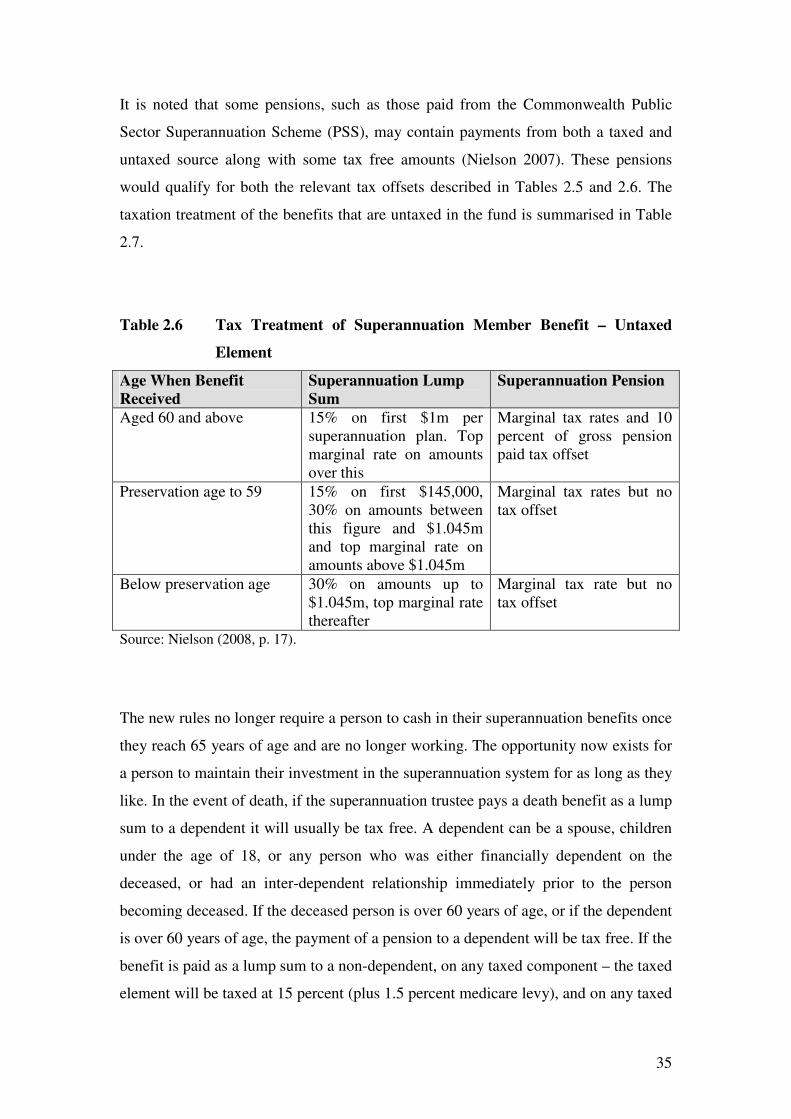
35
It is noted that some pensions, such as those paid from the Commonwealth Public
Sector Superannuation Scheme (PSS), may contain payments from both a taxed and
untaxed source along with some tax free amounts (Nielson 2007). These pensions
would qualify for both the relevant tax offsets described in Tables 2.5 and 2.6. The
taxation treatment of the benefits that are untaxed in the fund is summarised in Table
2.7.
Table 2.6 Tax Treatment of Superannuation Member Benefit – Untaxed
Element
Age When Benefit
Received
Superannuation Lump
Sum
Superannuation Pension
Aged 60 and above 15% on first $1m per
superannuation plan. Top
marginal rate on amounts
over this
Marginal tax rates and 10
percent of gross pension
paid tax offset
Preservation age to 59 15% on first $145,000,
30% on amounts between
this figure and $1.045m
and top marginal rate on
amounts above $1.045m
Marginal tax rates but no
tax offset
Below preservation age 30% on amounts up to
$1.045m, top marginal rate
thereafter
Marginal tax rate but no
tax offset
Source: Nielson (2008, p. 17).
The new rules no longer require a person to cash in their superannuation benefits once
they reach 65 years of age and are no longer working. The opportunity now exists for
a person to maintain their investment in the superannuation system for as long as they
like. In the event of death, if the superannuation trustee pays a death benefit as a lump
sum to a dependent it will usually be tax free. A dependent can be a spouse, children
under the age of 18, or any person who was either financially dependent on the
deceased, or had an inter-dependent relationship immediately prior to the person
becoming deceased. If the deceased person is over 60 years of age, or if the dependent
is over 60 years of age, the payment of a pension to a dependent will be tax free. If the
benefit is paid as a lump sum to a non-dependent, on any taxed component – the taxed
element will be taxed at 15 percent (plus 1.5 percent medicare levy), and on any taxed

36
component – the untaxed element will be taxed at 30 percent (plus 1.5 percent
medicare levy). From 1 July 2007, superannuation fund trustees have generally not
been able to pay a death benefit pension to a person who is not a dependent.
Access to preserved superannuation benefits can occur before a person reaches the
preservation age on compassionate grounds, severe financial hardship and as a result
of permanent incapacity. From 1 July 2007 a person who has reached preservation age
may access their superannuation benefits in the form of an income stream. The
income stream received does not have to be repaid into the superannuation fund
account. From 1 July 2002, temporary residents who permanently depart Australia
have been able to gain access to their superannuation. However, any taxable
component attracts 30 percent withholding tax and 40 percent withholding tax is
payable on any untaxed component.
In May 2008 the Australian Government announced the Review of Australia’s Future
Tax System (Henry Review) and in August 2008 The Treasury (2008b) released a
discussion paper entitled ‘Architecture of Australia’s Tax and Transfer System’,
which was followed by a call for public submissions. As part of its terms of reference
the review panel has been asked to consider enhancing the taxation of savings, assets
and investments. The full review of the Australian taxation system is due at the end of
2009. ASFA’s (2009b) submission to the Henry Review (responding in regards to
superannuation taxation), recommends maintaining investment returns in retirement
tax free, and that the age at which superannuation becomes tax free be gradually
raised to 65. ASFA also made recommendations for improving equity of
superannuation tax for low and middle income earners, and suggested simplifying
capital gains tax rules on the sale of business to encourage the transfer of lump sums
to superannuation. Concurrent with the 2009-10 federal budget, the government
launched a report on the retirement system prepared as part of the review of
Australia’s Future Tax System. The main recommendation of the report was the
retention of the current system. The panel also found that the current superannuation
guarantee contribution rate is adequate and recommended that it to be maintained at
its current level of nine percent. It further recommended that the age at which
Australians can access their superannuation (the preservation age) should be gradually

37
increased to 67 years. The panel has deferred final recommendations on related issues
until the release of its full report in December 2009.
2.9 Adequacy of Superannuation Savings
An adequate superannuation-based retirement income for Australians was the
objective of introducing a compulsory superannuation contributions scheme. Nielson
(2006) suggests that the ability of the current retirement income system to produce an
adequate retirement income is in doubt. Clare (2008a, p. 4) states:
…current average balances are below those which the Commonwealth Treasury
projected at the time compulsory superannuation was introduced. The data also
indicate that there are a number of groups with relatively low levels of
superannuation who need further assistance and encouragement to save if they are to
achieve even a modest standard of living in retirement.
We can expect a continual growth in superannuation balances for many more years as
the private retirement income system matures. It is noted that the Australian
compulsory superannuation system is still relatively immature and that many
individuals have only had superannuation coverage since the introduction of the
Superannuation Guarantee in 1992 (Clare 2008a). The Superannuation Guarantee
only reached its maximum rate of nine percent in 2002 and as a result many still have
modest balances in their superannuation accounts. Clare (2008a, p. 7) suggests that:
With average retirement payouts in 2005-06 of the order of $136,000 for men and
only $63,000 for women it is clear that most retirees will need to substantially rely on
the Age Pension in their retirement.
Nielson (2006) acknowledges that small retirement payouts from superannuation are a
result of an immature superannuation system that will not reach its full potential until
2037 at best. In the year 2037 retirees will have accumulated superannuation
contributions at a rate of nine percent per annum for a 35-year period. The groups
identified as having the greatest risk of insufficient superannuation savings for

38
retirement are women, older baby boomers, low income workers, the long-term
unemployed, and long-term part-time workers (Nielson 2006). Retirement saving
under the compulsory superannuation system in Australia is dependent on an
individual employee’s years of employment and wage level. Women are generally at
a disadvantage under this system where continuous employment is often interrupted
by the commitments of having a family. Olsberg (2004, p. 164) reiterates this concern
and states that:
The fundamental problem is not having enough time or money in the paid workforce.
Women’s working patterns, their life long earnings and therefore, their capacity to
accumulate sufficient retirement savings, are crucially compromised by interruptions
to paid employment due to childbearing, child rearing and other family
responsibilities.
Baby boomers are usually defined as those born between 1946 and 1961 and who are
now aged between 48 and 63 (Hamilton & Hamilton 2006). The baby boomer
generation was 30-45 years old when the Superannuation Guarantee Charge was
introduced in 1992. The Superannuation Guarantee places this group in a position in
which they are unable to capture the full benefit of superannuation over their working
lives. Preston and Jefferson (2002) suggest that most female baby boomers will not be
in a position to fund their own retirement and will remain highly dependent on the
aged pension. Hamilton and Hamilton (2006) identified lower income baby boomers
as most at risk of having insufficient savings to fund retirement adequately. Their
research suggests that many high income baby boomers have significant wealth in
superannuation and in other assets and could retire early.
Low income workers, the long-term unemployed and part-time workers are also at a
disadvantage under the Australian Superannuation Guarantee. Low income leads to
lower employee superannuation contributions. No contributions are made during
periods of unemployment, and if these periods are prolonged superannuation will not
sufficiently accumulate to fund retirement. Similarly, part-time workers and casual
workers will derive relatively less employee superannuation contributions when
compared to those employed full-time. It is stated by Nielson (2006, p. 26) that “for

39
these groups the age pension will always be a major component of their retirement
income”.
2.9.1 Measuring Adequacy
In order to determine whether or not superannuation and other savings can adequately
fund a person’s retirement we must first develop a measure. Nielson (2006, p. 6)
provides the two following methods for defining an adequate retirement income:
• using a replacement rate, that is, the post-retirement income expressed as a
percentage of an individual’s pre-retirement income; or,
• using a budgetary standard, that is, measuring the adequacy of an individual’s
post-retirement income against what it may cost to live in particular locations.
Rothman and Bingham (2004) describe the replacement rate as a ratio of a person’s
income or spending power after retirement compared to the period just prior to
retirement. This figure is usually expressed as a percentage of the retiree’s pre-
retirement income (Nielson 2006). The Senate Select Committee (2002) on
Superannuation noted general agreement among superannuation industry
representatives that retirement income between 60 and 65 percent of pre-retirement
gross income was adequate. Stanford (2004) suggests that a replacement rate of 65
percent may give retirees who own their home a higher standard of living in
retirement than they experienced for the majority of their working lives. (Nielson
2006, p. 29) suggests that:
Reasons why a family may not have access to 65 percent of its gross salary available
for consumption include mortgage repayments, costs of raising children or rental
costs. With the exception of the last cost, these burdens are generally not part of a
retiree’s expenditure in retirement.
An example of the budgeting approach to measuring the adequacy of retirement
income has been developed by Westpac Banking Corporation and the Association of

40
Superannuation Funds of Australia (The Westpac-ASFA Retirement Standard). They
outline two standards of retirement income as follows (ASFA, 2007, p. 1):
• modest lifestyle in retirement (better than aged-pension, but still only able to
afford fairly basic activities); and,
• a comfortable retirement lifestyle (enabling an older, healthy retiree to have a
broad range of leisure activities and a good standard of living).
National figures released from ASFA (2008) for the December 2008 quarter on the
Westpac-ASFA retirement standard show that a couple living comfortably in
retirement needs to spend $50,561, while those couples seeking a modest but adequate
retirement need to spend $27,454 a year. Both these standards of living assume the
retirees own their home. Therefore, the aged pension would allow a retired couple a
modest but adequate standard of living. Rothman and Bingham (2004) found that the
current rate of SG contributions, combined with a sufficiently long period in the
workforce (more than 35 years), could produce sufficient balances for those on or
below Average Weekly Ordinary Time Earnings (AWOTE) to provide a replacement
income of between 60 and 78 percent of average salary over the last year of
employment.
2.9.2 Recent Data on Retirement and Superannuation
The income generated from superannuation and voluntary savings will vary from
person to person and will depend on savings either through a superannuation account
or other non-superannuation investment assets. As previously discussed in Section
2.3, Australia, through compulsory superannuation, has made significant changes to
prepare for the retirement of its ageing population. A recent Australian Bureau of
Statistics Survey (ABS 2008) on Employment Arrangements, Retirement and
Superannuation (SEARS) indicates that 91 percent of employed people had
superannuation coverage. Given widespread superannuation coverage within the
Australian population, it is important that people are adequately educated on
superannuation matters. The survey also found that people who have retired more

41
recently are less likely to have government aged pensions and allowances as their
main source of personal income. The survey attributes this fall in demand for the aged
pension to the increase in other income sources such as superannuation, annuities or
income-streams. Importantly, of all people aged 45 years and over who intend to
retire from the labour force, 43 percent reported that their expected main source of
income at retirement would be income from superannuation, an annuity, or an
allocated pension. However, present figures from SEARS indicate that only 21
percent of people aged 65 and over rely principally on superannuation or investment
income. A comparison to the previous SEARS survey conducted in 2000 shows that
people with superannuation balances over $100,000 increased from six percent to 15
percent, and people with balances of less than $10,000 decreased from 48 percent to
29 percent (ABS 2008). It is also important to note that in 2007 the mean balance for
males was $72,200 and $47,200 for females with accumulation accounts: for defined
benefit account holders, the mean balance for males and females was $120,700 and
$80,200, respectively. CEDA (2004) reports that many Australians will find that the
level of their savings will be inadequate in retirement. Some implications of
inadequate superannuation balances for retirement funding are addressed in the next
section.
2.9.3 Implications of Inadequate Retirement Savings
For financial reasons many of the baby boomer generation believe they will have to
continue to work up to and beyond the retirement age (Hamilton & Hamilton 2006).
Recent data from the SEARS survey indicate that 64 percent of all employed people
intend to retire between the age of 60 and 69, whereas 24 percent intend to retire aged
70 years or over (ABS 2008). These statistics indicate that there is still a substantial
number in the population who intend to work to retirement age and beyond. Other
policies that have been advocated by superannuation and industry commentators to
support superannuation savings further in Australia are summarised by Nielson (2006,
p. 7) as follows:
• increasing the superannuation guarantee rate from nine to between 12 and 15
percent of wages;

42
• reducing the tax rate on superannuation fund income (currently 15 percent on
superannuation fund tax-deductible contributions and overall fund earnings);
• requiring additional after-tax contributions to be made by employees; and
• requiring that some or all of a person’s superannuation benefits be converted
to a pension.
2.10 Retirement Plans in the United States
A substantial level of retirement plan research has been conducted in the US. Several
aspects of the US research are reviewed in-depth in Chapter Three. It is therefore
important to provide a brief summary of some aspects of the US retirement system
that will form part of the discussions in the next chapter.
The US has a three-tiered system supporting retirement income. It has a contributory
social security system where contributions are made by employer and employee. The
pension received depends on the period of participation, retirement age, and career
average earnings (Schubert 2008). The other tiers include a voluntary employer-
financed pension or defined contribution scheme and tax advantaged voluntary
savings. In 2007 the US had total accumulated assets in the private pension system of
US $17 trillion (OECD 2008b). Similar to Australia the US has two basic types of
retirement plans, defined benefit and defined contribution plans. Porterba, Venti and
Wise (2007) indicate that there has been a shift in savings patterns in the US away
from employer-managed defined benefit pensions to defined contribution retirement
savings plans largely controlled by employees. However, unlike in Australia,
employer contribution to defined contributions plans is not compulsory in the US. The
defined contribution system is regarded as complex with a substantial number of
available plans (Schubert 2008). The 401(k) plan is an employer-sponsored retirement
fund where the employer is responsible for the creation and design of the plan: it is a
defined contribution plan where employees sacrifice a percentage of their salary to
contribute to the plan. These plans were developed under section 401(k) of the US
Internal Revenue Code which allows employees to make before-tax contributions
from their salaries. This feature can be incorporated into most types of defined

43
contribution plans. For the purposes of this explanation the 401(k) plan will be
differentiated from other defined contribution plans. Mehra and Mishra (2007)
explain that 401(k) plans have become the choice of retirement vehicle over
traditional defined benefit plans. According to the Investment Company Institute
(2006), at the end of 2005, 401(k) plans contained approximately 47 million plan
participants with an accumulated holding of US $2.1 trillion in plan assets. This
represents more assets in 401(k) plans than in other defined contribution or defined
benefit plans (Mehra & Mishra 2007). A summary of sources of funding 401(k) and
all other plans is contained in Table 2.7.
Table 2.7 Sources of Funding for 401(k) and all Other Plans
Sources Of Funding 401(k) Plans All Plans except 401(k)
Employee Contributions The right to make
employee contributions is
a condition of plan
membership
Plans are usually non-
contributory
Employer Contributions Employer (matching)
contributions usually
depend on the employee
contribution. The
proportion of the employee
contribution matched by
the employer depends on
plan rules
Employers are expected to
contribute
For all plans, including 401(k) plans, there are maximum limits in employer
contributions. Source: OECD (2008b, p. 98).
The introduction of the Pension Protect Act (PPA) of 2006 encourages automatic
enrolment in 401(k) plans. Under the PPA, an employer can automatically enrol
employees in a 401(k) plan and set minimum contribution rates without the
employee’s approval: employees can opt out of the plan or elect to make changes. In
addition to automatic enrolment, an automatic escalation feature may also feature in a
401(k) plan allowing automatic increases in the contribution rate. VanDerhei (2007)
suggests increased accumulations will result from automatic escalation for low
income workers. Schubert (2008) makes the following comparisons of the US and
Australian retirement fund systems:
44
• Australia has near universal coverage whereas the US has voluntary
participation supplemented by auto-enrolment;
• Australia has a nine percent minimum contribution rate plus voluntary
incentives (co-contribution), whereas the US has voluntary contributions
supplemented by auto-escalation plus employer matching; and,
• Australia has balanced target risk investment defaults plus a practical
investment option menu range, whereas the US has a wide ranging investment
menu with new target maturity defaults (target maturity funds target the year
of retirement and the asset allocations change over the years towards
conservative as retirement nears).
Schubert (2008) also explains that Australia’s defined contribution system is funded,
market-based, and nearly universal and suggests that it is widely acknowledged as a
model for other countries.
2.11 Summary
An overview of the Australian superannuation framework was provided in this
chapter. Australia’s three-pillar approach to retirement income was noted to have
World Bank endorsement. The three pillars are composed of an aged pension,
compulsory superannuation and voluntary savings. The Australian aged pension is
funded by government revenue and provided to around 75 percent of Australians who
have satisfied eligibility criteria. The pension level was considered to be well below
the amount required to achieve an adequate lifestyle, and in close proximity to the
poverty line.
The implications of an ageing population on Australia’s retirement system were
discussed. The superannuation system was identified by the Intergenerational Report
(The Treasury 2007) as of importance in combating the economic impact of an ageing
population on government finances. The main features of Australia’s compulsory
superannuation system were described. The government’s co-contribution scheme
was also discussed. Further discussion occurred on the implications of allowing

45
superannuation fund members a choice of fund. Survey data indicated that only a
small percentage of superannuation fund members exercised their choice to move to
another fund. However, it was acknowledged that the choice of fund legislation could
have several beneficial effects.
The problems associated with lost superannuation accounts were highlighted and the
mechanisms available to individuals to search for lost superannuation were discussed.
There was further analysis of the composition and size of Australia’s superannuation
industry. Furthermore, defined benefits funds were contrasted against defined
contribution funds: the move towards defined contribution funds was also noted.
There was a review of the performance of the superannuation industry with particular
focus on the recent global financial crisis. It was emphasised that superannuation fund
members required more education on superannuation matters; that is, there needs to
be an appreciation of the long-term nature of superannuation investment and the
short-term risks that impact the performance of funds.
The regulatory framework was described with particular attention given to the SIS
Act and the role of APRA. The importance of other regulatory authorities such as
ASIC and the ATO was also noted. The impact of regulation on superannuation
trustees was discussed including the penalties they face for any criminal or civil
offences under the SIS Act. There was also a summary provided of the taxation of
superannuation funds noting that both superannuation contributions and income are
taxed at concessional rates.
The discussion on the adequacy of superannuation savings suggested that there were
several groups in the Australian community that do not have sufficient coverage in
superannuation to fund their retirement adequately. These groups were identified as
the low income baby boomers, women, and low income earners. A review of the
literature was undertaken to determine how to measure adequacy. It was found that
adequacy could be measured on several levels, that is, a modest-yet-adequate standard
of living in retirement, or a comfortable-affluent standard of living in retirement. Year
2007 (ABS 2007) data from SEARS indicated that a great majority of Australian

46
workers had superannuation coverage. However, many workers still have
superannuation balances that could not sustain them in retirement.
A brief discussion of the US retirement system was provided in the last section. It was
shown that the US is moving away from defined benefit plans towards defined
contribution plans. 401(k) plans were explained: these are voluntary defined
contribution plans sponsored by employers and have become the most prominent
retirement savings plans in the US. A brief comparison of the US and Australian
defined contribution plan structures, was also provided.

47
Chapter Three
Literature Review
3.1 Introduction
The purpose of the literature review is to develop a theoretical framework to analyse
the impact of financial education in a choice of fund superannuation system. The
behavioural finance models and their implications for retirement saving will be
explored. Bernstein (1996) states that the behavioural research evidence suggests
irrationality, inconsistency, and incompetence in the way people approach and arrive
at decisions and choices when faced with uncertainty. Financial education is
recognised as a potentially important avenue to improve the quality of financial
decision making (Duflo & Saez 2003). Therefore, the role financial education plays in
changing the behaviour of individuals towards retirement saving will be highlighted
and research questions will be developed.
3.2 The Life-Cycle Model
The life-cycle model (Modigliani & Brumberg 1954) assumes a “planned
consumption path” that reflects the allocation of life resources to consumption over an
individual’s life span. This model assumes that individuals will rationally plan their
consumption and savings needs over their lifetimes whilst taking into account the
interests of their heirs. According to the principles of the life-cycle model, individuals
will accumulate sufficient assets that will allow them to maintain their standard of
living in retirement. Mitchell and Utkus (2006, p. 83) argue that:
…on balance, the life-cycle theory is thought to do a reasonable job in explaining
patterns of household saving behaviour. Saving generally rises with income and age,
and is positively associated with education and total wealth. Young households
generally have more debt than assets, while prime-aged households do appear to

48
begin saving more and accumulating financial holdings. Finally, in retirement, people
do tend to consume portions of their financial assets as they age.
Aizcorbe, Kennickell and Moore (2003) provide evidence that supports the life-cycle
hypothesis, and from their analysis of 1998 and 2001 surveys of consumer finances
they found that (p. 6):
By age group, median and mean net worth show a “hump” pattern that generally
peaks in the 55-64 age group. This pattern reflects both life-cycle saving behaviour
and the lower expected total lifetime earnings of progressively older age groups.
The theory presumes that workers in their youth tend to be dis-savers, using borrowed
funds to support current consumption; in their middle-aged years individuals become
net savers and accumulate wealth through the purchase of assets to finance future
consumption requirements in retirement; and in retirement, portions of these assets
will then be used to meet consumption patterns (Mitchell & Utkus 2006).
However, a report compiled by the Organisation of Economic Co-operation and
Development (OECD 2005) “Improving Financial Literacy”, emphasises that
individuals generally lack an awareness of the importance of saving for retirement and
that a number of surveys conducted in different OECD countries identifies
discrepancies between assumed life-cycle theory and actual retirement saving
behaviour by individuals. Helman, Greenwald, VanDerhei and Copeland (2008)
report on the Employee Benefit Research Institute (EBRI) retirement confidence
survey 2008 conducted in the United States (US) which found that only 18 percent of
workers were very confident about having enough money to retire comfortably and
that 53 percent of workers or their spouses had not attempted to calculate how much
money they required for a comfortable retirement. Other evidence from this survey
indicated that savings levels amongst US workers were modest and that most workers
under-estimated their retirement needs.
In Australia, the ANZ A.C.Nielsen (2005) survey of 3,500 adults found that only 34
percent of respondents under 65 years of age with superannuation expected to live
about as comfortably in retirement as they are currently living. A survey of Australian

49
workers by ANOP Research Services (2006) identified that only 35 percent of
workers surveyed believed that their current savings would adequately fund their
retirement. They also found that the mean age planned for retirement had increased
from 59 years in 2001 to 61 years in 2006. They concluded that the identification of
inadequate retirement savings by Australians has lead to the expectation of later
retirement (ANOP Research Services 2006). The AXA Retirement Scope Survey
(AXA 2008) also shows that 49 percent of Australians are not prepared for their
retirement. These surveys provide tangible evidence that individual retirement saving
behaviour does not meet the expectations of the life-cycle model.
From the available evidence, it appears that both internationally and domestically a
significant number of individuals may not be adequately planning and saving for
retirement. Individual behaviour does not appear to accord with what is predicted by
the life-cycle model, and survey literature does not support what is theorised by the
life-cycle model as significant individual behaviour deviates from what is prescribed
by this model.
3.3 Behavioural Implications
Kahneman and Tversky (1979) used cognitive psychological techniques to explain a
number of documented anomalies in rational economic decision making. These
anomalies are researched in the field of behavioural finance. Loveridge (2008, p. 222)
describes behavioural economics as “the most recent addition to the fragmenting field
of economics”. Behavioural finance combines the two disciplines of psychology and
economics to explain why and how people make what seem to be irrational decisions
when they spend, invest, save and borrow money (Belsky & Gilovich 2000). Even
though some individuals have the cognitive skills to solve the retirement saving
problem, they are influenced by other behavioural factors that will limit their ability to
meet their retirement saving plan. Venti (2004) describes the impact of psychological
and behavioural influences as fundamentally irrelevant when it comes to the financial
decision of saving. However, Venti (2004, p. 3) does acknowledge their relevance in
the behavioural savings model by suggesting that:

50
…their importance in actual saving decisions suggest that policies designed with
psychological and behavioural factors in mind may help individuals who find it
difficult to save.
Modigliani and Brumberg’s (1954) life-cycle theory of saving has received
widespread criticism for its economic theorising and simplifying assumptions made in
order to model saving and consumption behaviour throughout an individual’s lifetime
(Shefrin & Thaler 1988). Thaler (1994, p. 186) proposes that:
If households are acting in accordance with the life cycle theory of saving, then
under-saving is impossible, so why do they need to have their psychology redressed?
And how does this psychology fit into the model?
Shefrin (2002) suggests that any successful retirement plan should recognise the need
to accomplish a series of key tasks. Shefrin (2002, p. 139) describes these tasks as
follows.
1. Identify financial needs during retirement.
2. Save an appropriate amount over time.
3. Select a portfolio of assets with a risk-return profile that is appropriate for
reaching the retirement goal.
4. Have procedures in place to prevent those assets from being consumed too
early.
These tasks assume that households can solve “multi-period dynamic maximisation
problems” (Thaler 1994). Behavioural finance presents three important ways in which
humans deviate from the standard economic model (Mullainathan & Thaler 2000).
1. Bounded rationality which reflects the limited cognitive abilities that constrain
human problem solving.
2. Bounded willpower that captures the fact that people sometimes make choices
that are not in their long-run interest.
3. Bounded self-interest incorporates the comforting fact that humans are often
willing to sacrifice their own interests to help others.

51
The behavioural influences of bounded rationality and bounded willpower will often
inhibit an individual’s capacity to be able to plan an optimal strategy to save for
retirement and then to execute the plan. The various behavioural factors that influence
the saving intentions and patterns of individual saving for retirement are now
discussed and their influence on financially educating individuals is evaluated.
3.3.1 Bounded Rationality
Shefrin (2002) identifies some main themes in behavioural finance and economics
that suggest people will not make decisions strictly on rational analyses (bounded
rationality and cognitive biases) and the way a problem or decision is presented to the
decision-maker will affect their action (decision framing). Mullainathan and Thaler
(2000, p. 9) suggest that:
…this standard life-cycle model of savings abstracts from both bounded rationality
and bounded willpower, yet saving for retirement is both a difficult cognitive problem
and a difficult self-control problem.
Mullainathan and Thaler (2000, p. 1) explain that “bounded rationality reflects the
limited cognitive abilities that constrain human problem solving”. While bounded
willpower, otherwise termed bounded self-control, refers to the concept that while
individuals may possess the appropriate intentions, they may lack the control or
willpower to instigate the changes required in their behaviour. Mitchell and Utkus
(2003) suggest that superficially the retirement saving problem is possibly an ideal
illustration of Simon’s (1957) concept of bounded rationality. Simon (1957) (in
Tiessen & Waterhouse 1983, p. 258) defined bounded rationality in the following
way:
The capacity of the human mind for formulating and solving complex problems is
very small compared with the size of the problems whose solution is required for
objectively rational behaviour in the real world.
52
Furthermore, Mitchell and Utkus (2003, p. 3) argue that:
…being good at retirement saving requires accurate estimates of uncertain future
processes including lifetime earnings, asset returns, tax rates, family and health status,
and longevity. In order to solve this problem, the human brain as a calculating
machine would need to have the capacity to solve much decades-long time value of
money problems, with massive uncertainties as to stochastic cash flows and their
timing.
Mullainathan and Thaler (2000, p. 1) concur that, “since saving for retirement
requires both complex calculations and willpower, behavioural factors are essential
elements of any complete descriptive theory”.
3.3.1.1 Implication of Financial Literacy for Retirement Saving
A lack of financial literacy is said to have important consequences when it comes to
planning and saving for retirement (Lusardi & Mitchell 2006). Fox, Bartholomae and
Lee (2005, p. 195) state that “financial literacy denotes one’s understanding and
knowledge of financial concepts and is crucial to effective consumer financial
decision making”. Hilgert, Hogart and Beverly (2003) demonstrated a strong link
between financial knowledge and financial behaviour. Hogarth and Hilgert (2002)
identified married couples, non-minority groups, the middle-aged, the more highly
educated, and those on higher incomes as more financially knowledgeable. Lusardi
and Mitchell (2006) identified older Americans as more financially illiterate and
women, minorities (disadvantaged), and those without a college degree were at risk of
displaying low financial knowledge. They also found that financial knowledge and
planning are inter-related. They suggest that individuals with more financial
knowledge are more likely to plan and those who do plan are more likely to rely on
formal planning processes.
The 2008 ANZ survey of adult financial literacy in Australia (ANZ 2008) found that
Australian adults are generally financially literate. However, it was found that certain
groups face particular challenges when it comes to money management and financial

53
products. These groups were identified as: the young (18-24 years); females; people
with a low level of education (year 10 and below); and those living in highest socio-
economic disadvantaged areas. Literacy scores were significantly higher for people
aged between 35-39 years, males, people with a university degree, people living in the
least socio-economic disadvantaged areas, upper white collar workers, and those with
annual household incomes of at least $150,000 per annum. When it came to
superannuation matters the ANZ survey (ANZ 2008) reported that a significant
proportion of people failed to read their superannuation statements and that people
had a low level of awareness of some advantages and risks of superannuation. Thirty-
one percent of those who read their annual superannuation statements found them
difficult to understand. The survey found that 25 percent of superannuation fund
members suggested that they did not receive or did not read their superannuation
statements.
An earlier literacy study of working Australians conducted by Mercer (2006) found
that Australians knew little about their own superannuation funds. It was also found
that 40 percent of working Australians did not know if their funds are largely invested
either in aggressive or conservative strategies. Mercer (2006) identified that working
Australians admit to having a poor knowledge of retirement issues, and when given a
short quiz on superannuation and retirement issues nearly two in three answered only
half (or less) of all questions correctly. Worthington (2008) suggests that Australians’
knowledge of superannuation is good in some areas and poor in others. He identifies a
poor level of knowledge when it comes to reading and understanding superannuation
statements, retirement planning, and knowledge of employer contributions.
Worthington (2008, p. 367) warns that “the lack of retirement planning is more
problematic, and could potentially cause the most severe adverse outcomes for fund
members”.
Beal and Delpachitra (2004), through a mailed survey, also found low knowledge of
superannuation matters by Australians. The survey required respondents to answer a
number of questions relating to superannuation. In line with a Commonwealth Brief
Guide, they considered the technical questions as ‘not difficult’ and assessed basic
knowledge to determine the very well informed. The survey was not administered
randomly, but to a target population in two suburbs of Brisbane (Australia). The

54
chosen suburbs had a relatively higher educated and income socio-demographic
group. Beal and Delpachitra (2004) thought that if this group exhibited low level
knowledge then the results could be generalised to the population. Only 21.7 percent
of respondents achieved an overall pass mark (50 percent) when answering the
questions. However, 36.1 percent indicated that they were at least ‘quite well
informed’ on superannuation matters. The authors put this down to over-confidence
about self-knowledge. The authors recommended that the government spend more
money on educating the community on superannuation.
Evidence from the US indicates that households with greater financial sophistication
are more likely to invest in risky asset markets which tend to produce higher long-
term investment growth, and to invest more efficiently (Calvert, Campbell & Sodini
2007). Furthermore, Lusardi and Mitchell (2007a) using Rand American Life Panel
(ALP) data established that those individuals displaying greater financial literacy were
more likely to plan for retirement. They also found that older, better educated, and
male respondents are more likely to be planners, as they exhibit higher levels of
financial knowledge. Lusardi and Mitchell (2008) used two sets of data (2004 and
1992) from the United States Health and Retirement Study and found that those
respondents who reported that they planned for retirement accumulated higher levels
of wealth. They identified a strong correlation between planning and financial literacy
and a strong association between planning and wealth. They also found that low
educated, low income and Black and Hispanic households were at risk of not
preparing adequately for their retirement. Therefore, the issue that a number of
individuals will lack the required knowledge to structure their retirement plan
adequately cannot be ignored. Behavioural finance theory describes several other
individual behavioural constraints that will also limit an individual’s capacity to save
for retirement. A discussion of these issues follows.
3.3.2 Bounded Self-Control in Retirement Saving
Even though some individuals have the cognitive abilities to solve retirement saving
problems they may lack the self-discipline required to follow through to achieve their
plan. Thaler and Shefrin (1981) describe this as ‘bounded self-control’ where

55
individuals try to save for retirement, but lack the willpower to execute their
intentions. Mitchell and Utkus (2003) describe saving for retirement as analogous to
other behaviour modification programs such as regular exercise and giving up
smoking. A lack of self-control will inhibit the life-cycle theory by preventing
households saving in the manner prescribed by the theory (Thaler 1994). Thaler
(1994, p. 187) also argues that:
Self-control problems can also distort behaviour away from that predicted by the life-
cycle model because some situations are more conducive to saving than others,
holding wealth, age and other relevant life-cycle parameters constant.
It is argued that most individuals are more tempted to satisfy current consumption
than save for future retirement needs (Shefrin 2002). Hyperbolic discounting is a
behavioural economic term used to refer to the preference people have to accept
smaller payoffs sooner rather than larger payoffs later (Liabson 1997). Liabson,
Repetto and Tobacman (1998) identified that individuals’ near-term discount rates are
much higher than their long-term discount rates. In time-value-of-money calculations,
the discount rate is assumed to be constant. Therefore, a dollar saved today would be
assumed to be worth exponentially more in the future. As hyperbolic discounters,
individuals apply higher discount rates to the near term and lower discount rates to the
future. The implications for an individual saving for retirement is that they will be
much more inclined to spend money now rather than to have a larger amount for
consumption in retirement. Mitchell and Utkus (2006, p. 84) suggest that:
Put simply, workers who are hyperbolic discounters place a lower value on future
benefits and overvalue the present. The application to retirement is clear: they over
consume today because of self-control problems when it comes to saving for
retirement.
Thaler and Benartzi (2004) suggest that once enrolled in a 401(k) plan individuals are
reluctant to increase their retirement savings if it means less take-home pay. Their
research on individual behaviour was used to design a programme (Save More
Tomorrow) that gave workers the option to save more now to increase total savings
later. The plan participants had to indicate that they wished to increase their savings

56
rate at regular pre-determined scheduled periods. Where the program was adopted,
and used in conjunction with an investment consultant providing advice, the
participating workers tripled their savings rates over a two-year period. The success of
this program stems from the recognition that individuals lack the self-control to
ensure that they take measures to ensure adequate retirement saving. In response to
the outcomes produced by the Save More Tomorrow program Mitchell and Utkus
(2003, p. 11) further confirm that “…it recognizes that individuals have self-control
problems and benefit from a pre-commitment device when it comes to retirement
savings”.
3.3.3 Inertia and Procrastination in Saving Choices
United States (US) evidence on automatic enrolment in a 401(k) plan has revealed an
anomaly about individuals and their saving behaviour relating to inertia and
procrastination in decision making. Mitchell and Utkus (2006, p. 85) claim that:
In the case of automatic enrolment, the benefit of higher plan participation rates
appeared to be offset by a profound level of inertia. Most participants remained at the
default savings and conservative investment choices set for them by their employer.
Once enrolled, participants made few active changes to the contribution rates or
investment mixes selected for them by their employer; instead they simply stayed
with their initial assignment.
Madrian and Shea (2001a) evaluated the saving behaviour of employees of a large,
publicly traded Fortune 500 company operating in the US health care and insurance
industry. Their two key findings established that employee participation in the
company’s 401(k) plan was significantly greater under the automatic enrolment
scheme and that a significant number of employees participating in this scheme retain
both the default contribution rate and fund allocation. These findings contrast with the
behaviour of those employees who were hired prior to automatic enrolment. Few of
the latter group of employees voluntarily chose the default options. From their results
Madrian and Shea (2001a, p. 1149), conclude that “This ‘default’ behaviour appears

57
to result from participant inertia and from employee perceptions of the default as
investment advice”.
Choi, Liabson, Madrian and Metrick (2002) studied the impact of automatic
enrolment in US 401(k) voluntary pension plans and provide further evidence that
employees will overwhelmingly accept automatic saving and fund enrolment defaults.
They suggest that employee asset allocation decisions are driven by the menu of
investment funds and they will often take the ‘path of least resistance’. That is, it is
easier to accept that default option rather than have to assess carefully the numerous
options available to them. Choi et al. (2002, p. 104) argue that:
Sophisticated employers should choose their plan defaults carefully, since these
defaults will strongly influence the retirement preparation of their employees.
Choi et al. (2002) further found that nearly all employees surveyed, who intended to
make changes to their pension plans as a result of an educational programme, failed to
commit to their intentions. They suggest that employees will often do what is easiest,
which may be nothing.
Gallery and Gallery (2005, p. 526) point to evidence of inertia and procrastination in
Australia and suggest “that many Australians have failed to take control of their
savings plans”. A financial literacy and retirement readiness study (Mercer 2006)
shows about half of working Australians have given some thought to retirement, but
made little, if any, preparations for it. Australian workers are given options to make
choice of fund and investment choice within the fund. Those workers who fail to
exercise any choice are automatically placed into a default investment option by their
employer. This may result in the selection of a poor performing default option.
Gallery and Gallery (2005, pp. 529-530) suggest that:
While choice offers the ability to select efficient long-term investment portfolios that
maximise retirement benefits, poor financial literacy, inadequate disclosure and
behavioural problems present significant policy challenges.
The Australian investment choice literature indicates a reluctance of superannuation
fund investors to exercise their choice to change funds. Fry, Heaney and McKeown
58
(2007) utilised data from a FinaMetrica Survey and found that few participants in the
survey indicated that they were likely to change their superannuation fund. A McNair
Ingenuity Research (2008) survey also found that from 750 respondents only eight
percent indicated that they had chosen to switch funds in the last 12 months.
Clark-Murphy and Gerrans (2001) reported on the choice that was offered to members
of the Australian Superannuation Scheme for Australian Universities (SSAU). The
members of the fund where given a one-off choice between remaining with the
existing defined benefit plan or moving to a defined contribution plan which provided
for a selection among four investment options. Only 33.3 percent of members chose
to move to the defined contribution plan. From the others, 31.6 percent remained in
the defined benefits by default (no action was taken) and 35.1 percent completed the
form electing to remain in their existing fund.
3.3.4 Portfolio Theory
The return and risk on an investment are said to be basic concepts in finance (Peirson,
Brown, Easton, Howard & Pinder 2006). The objective of an investor is to maximise
expected returns. Historical returns are commonly used to make estimates of future
returns (Jones, Shamsuddin & Naumann 2007). In investment theory, returns are
assessed against risk. Investment risk is the chance that the actual investment outcome
will differ from what was expected. Higher variation in possible expected investment
outcomes means greater uncertainty and therefore more risk. The goal in investment
is to maximise return whilst simultaneously minimising risk. This outcome is
achieved through investment diversification. That is, the inclusion of several different
investment assets in a portfolio is advantageous for investors as it enables a reduction
in investment risk (Frino, Chen, Hill, Comerton-Forde & Kelly 2006). Traditional
portfolio management is defined by Gitman, Joehnk, Juchau, Wheldon and Wright
(2004, p. 160) as:
…an approach to portfolio management that emphasises ‘balancing’ the portfolio by
assembling a wide variety of shares and/or bonds of companies from a broad range of
industries.

59
Markowitz (1952) first developed the theories which formed the basis of Modern
Portfolio Theory (MPT). This theory utilises statistical measures to develop a
portfolio plan that meets the risk profile of the investor. MPT encompasses several
technical aspects in the development of what is termed an ‘efficient portfolio’. An
efficient portfolio which is a sub-set of minimum variance (risk) portfolios, is an
optimal portfolio as it provides the best attainable trade-off between risk and return.
Frino et al. (2006) suggest that a rational investor would always choose a portfolio
that provides the highest return for a given level of risk or the lowest risk for a given
level of return. The specific efficient portfolio chosen by an investor will depend on
their risk preferences.
Under defined contribution plans individuals are partially responsible for their asset
allocation decisions. That is, the retirement (superannuation) fund will present a
number of investment fund choices from which individuals are then required to make
an asset allocation choice. The options presented are various asset funds provided by
the fund manager. The asset allocation decisions for each fund option are the
responsibility of the manager. However, the choice of which options and the
allocation amongst these choices are the decisions of the fund member. Finance
theory assumes that a rational investor will make investment choices within the fund
that will reflect their preference for risk and lead to efficient diversification.
3.3.5 Naïve Diversification and Heuristics
Benartzi and Thaler (2001) investigated diversification strategies as part of an
investor’s asset allocation decision. They found evidence to suggest that people use
‘rules of thumb’ to determine their asset allocations. This approach is also expressed
by the authors as a ‘diversification heuristic’ or ‘naive’ diversification. Shefrin (2002,
p. 14) describes heuristics as “…back of envelope calculations that come close to
providing the right answer” and warned that “…heuristics may involve bias, meaning
they may tend to be off target in a particular direction…”
Benartzi and Thaler (2001) showed that some investors follow the ‘1/n strategy’ in
that they divide their contributions evenly across the funds offered by the plan. They
60
argue that naïve diversification could be costly in that the portfolio may not be
efficient or it may not meet the risk profile of the individual. They further argue that
the 1/n strategy may still produce reasonable diversification outcomes but “it does not
assure sensible or coherent decision-making” (Benartzi & Thaler 2001, p. 96). They
also show that plan design has a significant influence on the asset allocation outcomes
of individuals. If the plan offers more bond funds and few equity options then the
investor will create a conservative portfolio. On the other hand, a higher number of
equity fund options will result in the investor’s portfolio being substantially more
aggressive. These outcomes may not necessarily suit the individual’s requirements.
For example, younger individuals may create a conservative portfolio when a more
aggressive approach might be required.
Liang and Weisbenner (2002) found that retirement plan characteristics strongly
influenced investment decisions by participants. They also found evidence to support
the concept of naïve diversification. More specifically, they were able to show that
when presented with more investment options, plan participants tend to follow the 1/n
rule.
In contrast to the above studies Huberman and Jiang (2006) draw their data set from
archives of individual records of 401(k) plans rather than aggregate-level data
analysis. Support was found for the 1/n heuristic, but this support was weaker when
more funds were offered to participants. The data revealed that participants mostly
used three to four funds in their plans, regardless of the number of fund choices
available. However, their evidence provided no support for framing effects. That is, a
higher level of equity fund options offered did not significantly influence participants
to have proportionally higher portfolio weightings in equity. The authors therefore
conclude from their results that investors do not deviate from “rational choice”. In
these circumstances rational choice is best described as consistency in behaviour
regardless of the amount and variation of fund options offered to participants.
However, the alternative conclusions put forward in this study were qualified where it
was stated by Huberman and Jiang (2006, p. 797) that it:
…may be a statement of the low power of the test, a statement that the data are not
suitable for the task, or a statement of the weakness of the alternative hypothesis.

61
Using multi-period data (panel data) of 401(k) plans from the US, Brown, Liang and
Weisbenner (2007) found that asset allocation decisions of participants were
influenced by both the number and mix of investments options made available to
them. Similar to the findings of Benartzi and Thaler (2001) their evidence suggests
that an additional equity fund option will result in an overall increase in participant
allocations to this asset class. This was also found to be the case for additional options
in other asset classes such as company stock, fixed income funds and balanced funds.
Brown, Liang and Weisbenner (2007, p. 2011) conclude that:
This strongly suggests that average participants are not optimally allocating their
portfolios according to standard finance theory predictions, but instead are following
naïve strategies that subject them to manipulation by non-binding changes in the
number and mix of investment options.
An Australian study by Gerrans, Clark-Murphy and Speelman (2006) examined
decisions by members of an industry superannuation fund (Health Employees
Superannuation Trust Australia (HESTA) for the period July 2003 to December 2004.
The superannuation fund offered members a total of 14 investment options. These
included six ready-made investment plans and eight single asset classes. The ready-
made plans were based on strategic asset class allocations and varied from funds
comprising shares only to more balanced funds. It was found that the majority of
choices involved only ready-made investment plans and that almost a quarter of the
members made a change to allocate their funds across more than one ready-made
investment plan. Gerrans et al. (2006, p. 14) suggest “a possibly naïve view of
diversification unless members are conscious of resulting asset allocation”.
The implications of financial behaviour when it comes to retirement savings decisions
was emphasised by Kahneman (2003, p. 1468) in his Nobel lecture where he refers to
the study of Benartzi and Thaler (2001) as part of a:
…growing literature of field research and field experiments that documents large and
systematic mistakes in some of the most consequential financial decisions that people
make, including choices of investments…

62
VanDerhei, Holden, Alonso and Copeland (2008) provide 2007 data indicating that
more recently employed individuals are investing their 401(k) assets in balanced
funds, including life-cycle funds. This increase in participation in balanced funds was
also evident among recently employed young workers. This provides evidence that
increasing numbers of workers in 401(k) plans may be seeking balance or
diversification within their investments.
McClatchey and VandenHul (2005) using a rolling period optimisation model, created
portfolios with the similar ex ante risk to a number of naïve 1/n strategies, to
determine whether optimisation could improve return performance. Their results
indicate that optimisation does outperform most naïve strategies and, based on asset
allocations and time to retirement, it improves an investor’s accumulated wealth by 2-
30 percent.
3.3.6 Reliance on Past Performance
Mitchell and Utkus (2006) suggest that investors rely on past performance and fail to
account for expected returns and risk. Behavioural implications relating to both
representative and availability heuristics are used to explain these phenomena (see
Tversky & Kahneman 1974). It is suggested that individuals view “patterns in a small
series of randomly drawn numbers and, when making decisions, they attempt to
impose some order or structure on the information that they see” (Mitchell & Utkus
2006, p. 89). The availability heuristic implies that decision makers rely on
knowledge that is readily available to them rather than examine other alternatives or
procedures. That is, individuals have the tendency to base their judgements on past
information. Investment plan data are a readily available source of information that
investors can access cheaply from websites and newsletters. Therefore, when faced
with difficult decisions, investors tend to rely on past performance.
3.3.7 Endorsement Effect
Liang and Weisbenner (2002) found evidence that pension fund participants will see
fewer investment options as an indicator to invest in their corporation’s stock, and the

63
default option as some sort of recommendation. Where employers provide a match
stock in their retirement scheme employees tend to more than match by contributing
an even larger share of their own contributions in company stock. These findings
support the conclusions of Benartzi (2001) and Madrian and Shea (2001a) who found
evidence that participants appear to interpret the match contribution and the default
option as investment advice. Benartzi (2001, p. 1752) termed this the “endorsement”
effect and suggested that “it is possible that employees interpret stock matches as an
endorsement or as implicit advice”. Through survey evidence, Benartzi (2001)
provided evidence that this effect may also apply to other investment alternatives. In
his survey respondents indicated that they would increase their own purchases of
stock if the employer matched contributions with international stock. Consistent with
the findings of Benartzi (2001), Brown, Liang and Wiesbenner (2007) found that
restrictions on company stock are perceived as investment advice and result in a move
away from equity to lower risk assets. However, VanDerhei, Holden, Alonso and
Copeland (2008) reference statistics that indicate that the share of 401(k) accounts
invested in company stock is falling and that in 2007 this stock constituted 10.6
percent of all 401(k) accounts. They also indicate that recently employed 401(k)
participants were less likely to hold employer stock.
3.3.8 Familiarity Bias in Investment Choice
There is a thought that people invest in the familiar while ignoring the principles of
portfolio theory. Employees in the US will often hold substantial levels of company
stock in their defined contribution plans. Huberman (2001, p. 677) suggests that:
…people look favourably upon stocks with which they are familiar and think of them
as more likely to deliver higher returns, at lower stock-specific risks. And this view
tilts portfolio weights towards familiar stocks.
However, holding company stock is said to be risky and costly as the employee is not
fully diversified and therefore expected returns on the portfolios are lower than
equally risky, but fully diversified, portfolios (Meulbroek 2005). Familiarity bias also
extends to individual bias towards domestic asset markets (home bias). It is claimed

64
that investors do not diversify enough internationally (Aggarwal 2004) and sub-
optimal diversification may therefore occur (Gunasinghan & Zavone 2005). A study
by Chan, Ng and Covrig (2007) of 26 mutual funds from 26 developed and
developing countries found evidence of disproportionate allocations towards domestic
shares. However, a study in Australia by, Gerrans, Gardner, Clark-Murphy and
Speelman (2006) concluded that members of a government employees’
superannuation fund appeared to make asset allocations that were in line with a
‘normal’ allocation to international equity.
3.3.9 Framing and Default Choices
It is argued that many individuals will deviate from predicted life-cycle behaviour in
that they can be easily influenced by how a decision is presented to them, or framed
(Mitchell & Utkus 2006). Shefrin (2002, p. 29) summarises the frame dependence as
“…the way people behave depends on the way that their decision problems are
framed”.
Superannuation fund members in defined contribution plans are usually presented
with a menu of investment options and asked to make a choice. Mitchell and Utkus
(2006, p. 87) argue that:
…menu design is a more powerful influence on participant decision-making than the
risk and return characteristics of the investment choices offered.
In the Benartzi and Thaler (2001) study it was reported that the array of funds offered
to plan participants can influence their asset allocations. Using a combination of
controlled experiments and information from a database that covered 170 retirement
savings plans their empirical evidence confirmed that the menu of funds offered
affects the resulting asset allocation. It was shown that if the retirement plan offers
relatively more fixed-income funds the participants were likely to invest more
conservatively. If the plan offered relatively more equity funds the participants were
more likely to invest aggressively. Benartzi and Thaler (2001, p. 96) concluded that:

65
While the diversification heuristic can produce a reasonable portfolio, it does not
assure sensible or coherent decision-making.
With automatic enrolment an employee is signed up by the employer for the
retirement plan at a given contribution rate. The employee maintains the right to
withdraw from the fund. Mitchell and Utkus (2006) suggest that if individuals are
faced with a difficult choice when automatically enrolled in a plan, they will simplify
the problem by accepting the available default option (a choice made by others). That
is, they will do nothing.
Choi, Liabson, Madrian and Metrick (2001) used administrative data from three large
US firms and analysed the data to determine the impact of automatic enrolment in
401(k) plans on participation rates, saving behaviour and asset accumulation. They
found that automatic enrolment had a dramatic impact on retirement saving
behaviour, but participants were generally anchored in a low default savings rate and
in a conservative default investment vehicle. It was shown that about 80 percent of
participants accepted both the default savings rate (2-3 percent) and the default
investment fund (a capital stable or money market fund). Gerrans, Clark-Murphy and
Speelman (2006) found that an Australian industry fund offering 14 investment
choices had over 60 percent of the fund assets held in the default strategy. The
evidence provides support for the notion that many participants in the defined
contribution plans will accept the default option. Choi et al. (2001) found that
automatic enrolment in 401(k) plans promotes wealth accumulation, but the low
default savings returns in the conservative default fund ‘undercut accumulation’.
In contrast to the US and Australian experiences, Engström and Westerberg (2003)
found that 67 percent of Swedish pension plan members chose their investment
portfolios. The authors suggest that this high participation in investment choice may
have been the result of an extensive information campaign, media attention, and
marketing efforts by the fund managers thus reducing the costs of individuals
becoming informed. In response to the Engstrom and Westerberg (2003) findings,
Orszag (2003) suggests that individuals may have more faith in privately managed
funds than the Swedish publicly managed default option pension fund and, therefore,
may elect to make investment choice to avoid automatic inclusion in the default

66
option. He suggests that Sweden has a long tradition of publicly managed pension
funds and individuals have had time to make an assessment of public versus private
management.
3.3.10 Choice Overload
Papke (2003) presented econometric evidence which showed that individuals
provided with investment choice in their defined contribution fund are more likely to
invest more in stocks, contribute more of their salary into the fund, and have more
invested in their accounts than those without investment choice. However, research in
the US by Iyengar, Jiang and Huberman (2004) found that too many options in
investment choice lead to what they term ‘choice overload’. That is, consumers are
less motivated to choose and less motivated to commit to that choice. They suggest
that too much choice leads to sub-optimal decision-making, as numerous choices
commit the consumer to significant time and effort in order to make an informed
comparison among the alternatives. They identified a choice between only two funds
as an optimal offering. It was also shown that as choices increased, participation rates
declined.
Agnew and Szykman (2005) used an experimental approach to determine the impact
of choice overload on participants solicited at a mid-sized university via campus mail,
email and flyers. A financial inducement of ten dollars was paid to all participants. A
point of differentiation to previous studies in this area is that each participant was
given a ten question financial literacy examination to determine the interaction of
knowledge on the manipulated variables of information display, the number of
investment choices and the similarity of those choices. The questions were adapted
from the John Hancock Financial Services Defined Contribution Plan Survey and
financial literacy examination used by Wilcox (2003) and Dwyer, Gilkeson and List
(2002). Consistent with these previous studies they found that many participants
exhibited a low level of financial literacy. The participants were then separated into
two groups on the basis of financial knowledge (above average/below average). When
presented with choices, those with above average financial knowledge reported less
choice overload. Plan design did not have any impact on choice overload for those

67
with less financial knowledge. An important finding was that respondents with lower
financial knowledge were more likely to opt for a default option. They are also more
likely to be overwhelmed by the investment decision they faced.
Clear evidence emerges that low financial literacy is likely to inhibit an individual’s
ability to exercise appropriate choice in investment decision-making for retirement
saving. Other pertinent results that emerge from the Agnew and Szykman (2005)
study is that the less educated, lower paid individuals and women tend to have less
knowledge of financial matters. Agnew and Szykman (2005, p. 69) signalled that:
It is daunting for plan sponsors to attempt to educate the most vulnerable participants,
and more research into new and innovative methods is needed.
Kamenica (2008) suggests that when presented with a large number of options an
individual is more likely to select the simpler alternatives (contextual inference
theory), that is, those options where the outcomes are more transparent to the decision
maker. Therefore, when faced with a large set of choices an individual is reluctant to
select an option that they do not fully understand (choice overload). Iyengar and
Kamenica (2007) tested the contextual inference theory as a possible explanation for
choice overload. They conducted two experiments by approaching individuals in the
street and seeking their participation. The first experiment indicated that the
participants were more likely to select a sure bet over ‘non-degenerate’ gambles. The
second experiment clarified that excessive choice will lead to a preference for the
simpler rather than more risky options. Iyengar and Kamenica (2007, p. 9) conluded
that:
Jointly, these experimental findings support the prediction of contextual inference
theory that increasing the size of the choice set strengthens the appeal of easier-to-
understand options.
In addition to the experiments, Iyengar and Kamenica (2007) utilised records of more
than 500,000 employees from 638 institutions and demonstrated that when faced with
more funds in a 401(k) plan, the greater was a person’s allocation to money market
and bond funds at the expense of equity funds. The implication is that individuals will

68
seek the easier-to-understand investments rather than the more risky options
(contextual inference theory).
3.3.11 Peer Effects on Choice
Benartzi and Thaler (2007) suggest that rational unsophisticated investors may seek
expert financial counselling. However, for a number of individuals they tend to seek
advice from their spouses and friends rather than from financial experts (Benartzi &
Thaler 1999). Duflo and Saez (2002) found peer effects play a role in retirement
savings decisions of employees of a large US university. The results provided
evidence that decisions taken in an individual’s peer group will influence both their
decision to participate and their choice of a mutual investment fund. Duflo and Saez
(2003) demonstrate how financial communications can influence not only an
individual’s behaviour, but also the behaviour of others in their work group. The
authors conducted an experiment using individual data on employees of a large US
university. A random sample of employees within a group of departments was offered
a financial incentive to attend an employee sponsored benefits information fair. In the
departments where financial incentives were offered it was found a significant
increase in attendance occurred from both those who were offered an incentive and
those who were not. They also found that individual enrolments in the retirement
funds increased substantially between five and 11 months after the fair for those
departments where the financial incentive was offered. They conclude that this
evidence provides support for a social network effect (peer effect) for retirement
saving decisions.
3.3.12 Prospect Theory
In retirement savings decisions, plan participants may not exhibit rational mean-
variance behaviour. Kahneman and Tversky (1979) proposed prospect theory as a
realistic alternative to expected utility theory. Expected utility theory states that the
investor will choose between risky investments by comparing their expected utility.
The calculation involves multiplying the utility values of possible outcomes by the
respective probabilities to determine a weighted (expected) outcome. Prospect theory

69
also describes how individuals make choices in situations where they have to decide
between a set of alternative risky investments. Their model is based on two distinctive
features. First, individuals measure losses and gains, but not total wealth (as
prescribed by expected utility theory). Second, individuals place more impact on
losses than on gains (given the same variation in absolute value). Kahneman and
Tversky (1979) also provide experimental evidence that when evaluating risky
gambles individuals report losses to be around 2.5 times more painful than an
equivalent gain. Prospect theory has potentially important implications for investment
behaviour (Mitchell & Utkus 2006). In prospect theory, investors are risk averse when
it comes to gains and risk seeking when it comes to losses. Investors tend to put more
value to a gain that is certain than a gain that is less certain, even when the expected
value of each is the same. Investors also endeavour to avoid a certain loss, even if it
means taking greater risk.
3.3.12.1 Myopic Loss Aversion and Over-confidence
Benartzi (2008, p. 1) describes myopic loss aversion as “the tendency of individuals
to focus on short-term losses, even if they have 20 or 30 years until retirement”. It is
suggested that many investors hold overly conservative portfolios because they focus
on the potential for short-term losses (Shefrin 2002). This aversion to loss is said to
lead to investors holding too little in equities and overweighting their portfolios
towards fixed-income securities (Shefrin 2002). A portfolio invested in cash or capital
stable assets is unlikely to provide the long-term growth that many individuals require
to fund their retirement. Benartzi (2008) in his comments presented to the United
States House Education and Labor Committee fears that the recent volatility in world
financial markets resulting from the global financial crisis could magnify the degree
of loss aversion that individuals display. Benartzi and Thaler (1999) found that the
subjects in their study were willing to invest up to 90 percent of their retirement funds
in stocks when they were shown distributions of long-term returns. Therefore, the way
in which information is framed to investors can have a strong influence on their
investment choice.

70
Shefrin (2002) suggests that over optimistic investors may select portfolios that are
overly aggressive. It is noted that in the field of investment, over-confidence leads to
sub-optimal behaviour that does not accord to the Markowitz (1952) mean-variance
theory (Mitchell & Utkus 2006). Mitchell and Utkus (2006, p. 90) further explain that
“overconfidence partly stems from a failure to understand the role of random chance
in determining the future”. Barber and Odean (2000) found that over-confidence
contributes to investors trading excessively which results in poor investment
performance. It was found that men are more confident than women and trade more
excessively (Barber & Odean 2001). Mitchell and Utkus (2006, p. 90) note:
Overconfidence also leads to insufficient portfolio diversification, as individuals put
too much faith in stocks they selected and underestimate their relationship with the
overall market.
3.4 A Theoretical Framework for Superannuation Fund Choice
Behavioural factors were identified by Brown, Gallery and Gallery (2002) as a major
reason why superannuation fund members failed to exercise choice. They suggest “the
nature and scope of appropriate member education is contingent on the capacity and
willingness of members to exercise choice” (Brown, Gallery & Gallery 2002, p. 85).
They propose the use of a universal default fund for all those members who are
unwilling or feel unable to exercise choice. The universal fund they propose would be
a government run national superannuation fund. The intention of introducing such a
fund is that it would alleviate the investment risks the members face when making
uninformed choice. They argue that “…there is responsibility on government to
facilitate passive choice by providing a fund that is secure and preserves
superannuation entitlements throughout working careers” (Brown, Gallery & Gallery
2002, p. 86). They also identified a superannuation choice framework that implies that
informed choice will not occur because of various endogenous and exogenous
constraints. Figure 3.1, adapted from Brown, Gallery and Gallery (2002, p. 74),
depicts this framework.
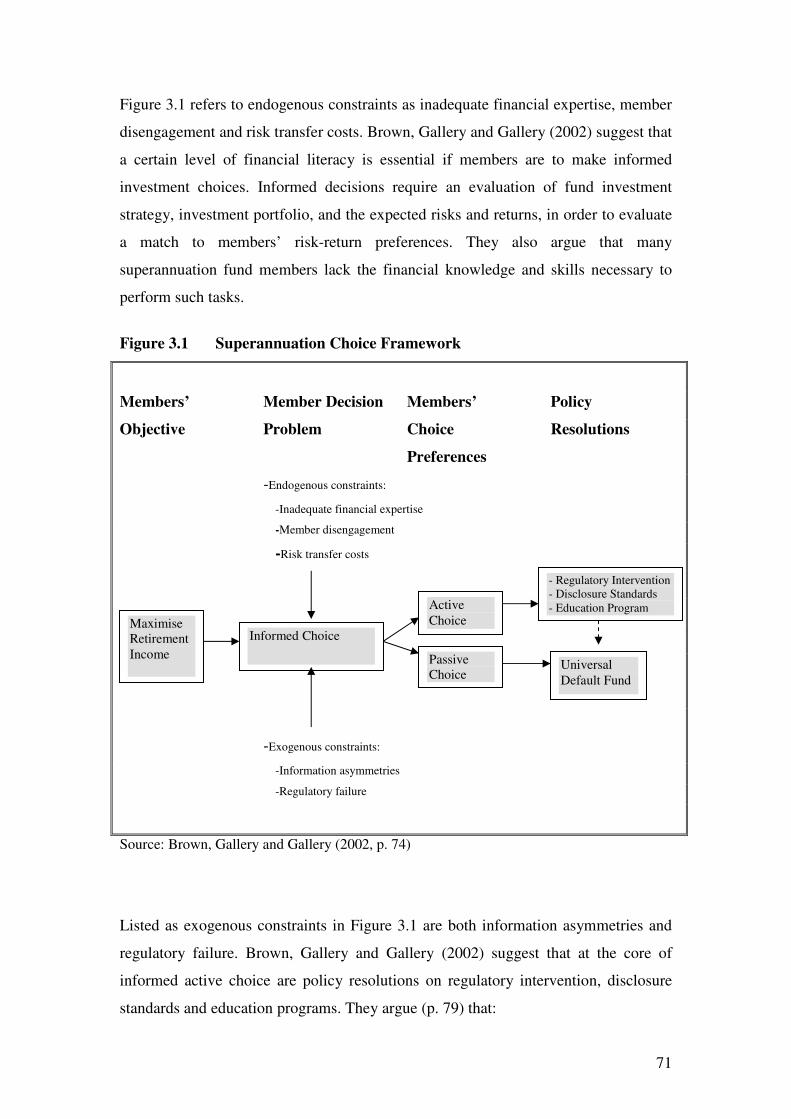
71
Figure 3.1 refers to endogenous constraints as inadequate financial expertise, member
disengagement and risk transfer costs. Brown, Gallery and Gallery (2002) suggest that
a certain level of financial literacy is essential if members are to make informed
investment choices. Informed decisions require an evaluation of fund investment
strategy, investment portfolio, and the expected risks and returns, in order to evaluate
a match to members’ risk-return preferences. They also argue that many
superannuation fund members lack the financial knowledge and skills necessary to
perform such tasks.
Figure 3.1 Superannuation Choice Framework
Members’ Member Decision Members’ Policy
Objective Problem Choice Resolutions
Preferences
-Endogenous constraints:
-Inadequate financial expertise
-Member disengagement
-Risk transfer costs
-Exogenous constraints:
-Information asymmetries
-Regulatory failure
Source: Brown, Gallery and Gallery (2002, p. 74)
Listed as exogenous constraints in Figure 3.1 are both information asymmetries and
regulatory failure. Brown, Gallery and Gallery (2002) suggest that at the core of
informed active choice are policy resolutions on regulatory intervention, disclosure
standards and education programs. They argue (p. 79) that:
Maximise
Retirement
Income
Informed Choice
Active
Choice
Passive
Choice
- Regulatory Intervention
- Disclosure Standards
- Education Program
Universal
Default Fund

72
Even if all the (endogenous) constraints could be effectively addressed the exogenous
constraints of information asymmetry arising from multiple agency problems remain
a pervasive problem confronting all employees in a choice environment. These
problems are compounded by regulatory failures in the extant regulatory regime.
A policy resolution listed in Figure 3.1 is a member education program. Brown,
Gallery and Gallery (2002, p. 86) argue that:
…education programs should be targeted to those members who are prepared to
actively engage in decisions regarding the management of their superannuation
savings.
The Brown et al. (2002) model also incorporates a default fund option. It has been
argued that it is justifiable for the government to run a default fund as it is obliged to
provide support to those members who are incapable or unwilling to manage their
own savings (Brown, Gallery & Gallery 2002; Brown, Gallery, Gallery & Guest
2004; Gallery & Gallery 2005). Brown, Gallery and Gallery (2002, p. 87), argue that:
In combination, a standardised disclosure regime, appropriate member education and
the option of a government-run default fund are more likely to lead to an environment
where informed choice is achievable…
Clark-Murphy, Kristofferson and Gerrans (2002) surveyed members of UniSuper
around the time of the formal introduction of the choice of fund legislation. Unisuper
is an industry superannuation fund that covers employees in Australian universities.
Clark-Murphy, Kristofferson and Gerrans (2002, p. 77) conclude that:
The issue of knowledge is significant since there is consistent evidence that
employees feel they are ill-informed about superannuation and may not be equipped
to make decisions required of them.
The Clark-Murphy, Kristofferson and Gerrans (2002) study reviewed demographic
influences on the extent to which respondents found the decision to stay with the
defined benefit fund or switch to a defined contribution (accumulation) plan difficult,
and why they found it difficult to make a choice between funds. The defined
contribution fund offered a choice from four different investment strategies varying

73
from low risk (conservative) to high risk (aggressive). They found that 31.6 per cent
of Unisuper members failed to respond to a request to make a choice of fund. Of those
who did respond, 51 percent chose to remain with their existing arrangements
(defined benefit fund), whilst the other 49 percent opted to move to a defined
contribution fund. Brown, Gallery and Gallery. (2002) argue that member
disengagement results from the individuals choosing to avoid having to make the
complex investment decisions necessary as part of active choice. Further results, from
the Clark-Murphy, Kristofferson and Gerrans (2002) statistical tests revealed that
gender and age were significant factors in identifying which employees will
experience difficulty with superannuation choice decisions. It was found that women
and younger respondents were more likely to find the superannuation choice decisions
more difficult.
Brown et al. (2004) surveyed a random sample of 620 academic staff from 14
Australian universities who were selected from staff from two Schools (Accounting
and Finance, Physical Science). They examined why the majority of Unisuper
members chose to remain in a defined benefit fund when offered the option of
transferring to a defined contribution fund. Their findings indicate risk transfer costs
played a key role in the majority of members rejecting the contribution fund choice.
Brown et al. (2004, p. 6) state that:
Becoming informed is costly, particularly in relation to complex superannuation
issues. Such costs include the time taken to acquire, read and interpret relevant fund
reports and other investment material, attend training sessions, and seeking
professional advice from financial experts or other information intermediaries. There
is also the risk and associated costs of making the wrong decision.
Brown et al. (2004) suggest a risk-return trade-off in the decision to stay with the
defined benefit plan or transfer to a defined contribution fund. A switch to the
contribution plan option could potentially provide higher returns but with less
certainty, whilst remaining in the existing defined benefit plan had a more certain
future outcome.

74
3.5 Financial Education
One aim in this study is to evaluate a financial education model to see whether it
provides superannuation fund members with the required knowledge to assist them in
making informed choices regarding their superannuation decisions. As part of this
process it is necessary to define the term ‘financial education’ as it may have many
different meanings in various contexts. Choi et al. (2002, p. 100) suggest:
The definition of what constitutes ‘financial education’ is also subject to
interpretation and is likely to vary from one respondent to another.
Fox, Bartholomae and Lee (2005, p. 195) state that:
Financial education can include any program that addresses the knowledge, attitudes,
and/or behaviour of an individual towards financial topics and concepts.
The definition used for the purpose of this study is a comprehensive and broad
definition of financial education provided by an OECD Report (OECD 2005, p. 26)
that defines financial education as:
The process by which financial consumers/investors improve their understanding of
financial products and concepts and, through information, instruction and/or objective
advice, develop the skills and confidence to become more aware of financial risks and
opportunities, to make informed choices, to know where to go for help, and to take
other effective actions to improve their financial well-being.
TheOECD further define information, instruction and advice as follows (OECD 2005,
p. 26):
• information involves providing consumers with facts, data and specific
knowledge to make them aware of financial opportunities, choices, and
consequences;

75
• instruction involves ensuring that individuals acquire the skills and ability to
understand financial terms and concepts, through the provision of training and
guidance; and,
• advice involves providing consumers with counsel about general financial
issues and products so that they can make the best use of the financial
information and instruction they have received.
The broadness of this definition is necessary to capture a myriad of educational
vehicles, materials and programs now provided to superannuation fund members by
superannuation funds.
3.5.1 Implications of Financial Education on Behaviour
The issue of financial education promoting greater retirement saving has received
widespread interest (OECD 2005). The provision of financial education to those who
lack adequate levels of financial literacy is one of the tools that have been utilised, in
various forms, to assist those making investment decisions. Hilgert, Hogarth and
Beverly (2003) concluded that increases in financial knowledge may lead to improved
financial management practices. It has been shown that as an individual’s financial
knowledge increases so will their ability to plan better and save for retirement
(Lusardi 2005; Lusardi & Mitchell 2007b; Hershey & Mowen 2000). Further, on this
issue Clark et al. (2006, p. 47) argue that:
A lack of financial education may cause workers to start saving too late in life to
realize their retirement goals. As a result they are unlikely to achieve an optimal
balance between current consumption while working and future consumption in
retirement. In addition, a lack of information concerning the risk-return distribution of
various investments might lead them to misallocate their retirement portfolios.
Research has been conducted to evaluate the influence of financial education in
changing individual savings behaviour and investment decision making for retirement
savings. The implications of this research support the premise that various types of
education programs do change the retirement saving intentions and behaviour of

76
individuals (Bayer, Bernhiem & Scholz 1996; Clark & Schieber 1998; Lusardi 2003;
Bernhiem & Garrett 2003; Muller 2003; Nyce 2005; Lusardi 2005; Kerry, Clayton &
Olynyk 2007; Clark et al. 2006). Maki (2004) argues that it is greater financial
knowledge gained through education programs that alters household decision making.
The importance of financial education was emphasised by Alan Greenspan (2002),
former head of the US Federal Reserve, and reported in a prepared statement, that:
Education can play a critical role by equipping consumers with the knowledge
required to make wise decisions when choosing among the myriad of financial
products and providers.
In Figure 3.2 ‘Tools for Achieving Adequate Retirement Income’ the OECD (2008a)
recommends that financial education should be complemented by regulation and other
approaches such as automatic enrolment. However, the OECD emphasises the
importance of financial education as a central tool in providing awareness,
information, instruction and advice in ensuring that adequate retirement income is
achieved. The OECD (2008a, p. 112) concludes that:
Surveys and experience show how financial education is urgently needed, and can
play an important role in helping workers achieve an adequate retirement income.
Content and delivery of financial education form an important element of the
education model presented in Figure 3.2. The OECD (2008a, p. 112 state that
“providers of financial education must ensure that the content and the mode of
delivery are appropriate for the target audience”. The current research will investigate
whether superannuation fund provided education is providing defined contribution
members with the resources necessary to make informed choices.
In this section it has been shown that the importance of financial education for
informed investment decision making is well documented in the literature. It has also
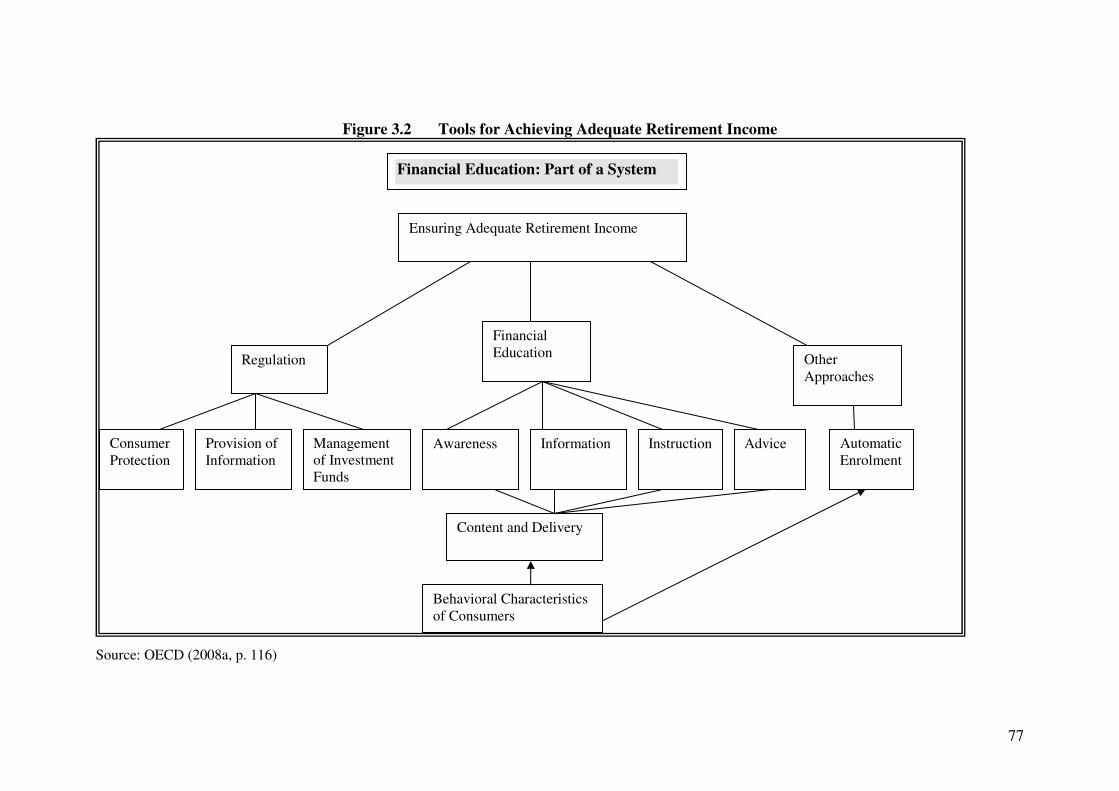
77
Figure 3.2 Tools for Achieving Adequate Retirement Income
Source: OECD (2008a, p. 116)
Financial Education: Part of a System
Regulation
Ensuring Adequate Retirement Income
Financial
Education Other
Approaches
Awareness Information Instruction Advice Consumer
Protection
Provision of
Information
Management
of Investment
Funds
Automatic
Enrolment
Content and Delivery
Behavioral Characteristics
of Consumers

78
been shown that individuals without appropriate financial knowledge and skills are
likely to lack the capacity to save adequately for their retirement needs. Therefore,
well directed and structured educational programs are required to eliminate individual
gaps in knowledge. This approach may lead to more informed decision making on
retirement savings issues. In the following sections a review of the structure and
relevance, and extent of financial education in the workplace, is presented.
3.5.2 Workplace Financial Education
A significant portion of retirement education programs in the US are based in the
workplace. This body of education is seen to be a response to the lack of both
financial literacy and saving initiatives of many individuals (Lusardi 2003) and from
the shift in retirement funding from defined benefit to defined contribution plans
(Arnone 2004). Under a defined contribution plan the individual assumes the
responsibility for making within-fund choice on asset allocation decisions. Clark et al.
(2006, p. 47) state that:
Recognising this lack of financial knowledge, some employers now offer financial
education programs for their employees.
A practical definition of employer-sponsored participation education is provided by
Arnone (2004, p. 1) as “…a program that helps employees develop skills to make
informed decisions and take action to improve their financial well-being”. Arnone
(2004, p. 1) incorporates the following key elements in his definition.
• Helps individuals based on their status as employees of an organisation.
• Provides recipients with skill development, which may include either new
competencies or the enhancement of existing competencies.
• Enables participants to make decisions about issues.
• Provides a basis of accurate, unbiased information for such decisions.
• Is action-orientated and thereby attempts to affect behaviour.
• Seeks the long-term result of improved financial well-being.

79
Garman (1997) argued that the main goal facing employers should be to provide
personal financial education that will lead to a change in employee behaviour and
motivate all of them to participate in retirement saving plans. Joo and Pauwels (2002)
found that employer-provided financial education had a positive effect on retirement
confidence. Kim, Kwon and Anderson (2006) also found evidence to support that
those who received workplace financial education and advice were more confident
about their retirement. Joo and Garman (1998) found a strong interest from clerical
workers for workplace financial education, particularly for retirement planning and
investing. Maki (2004) used cross-sectional household survey data from 200 survey
responses and suggests that workers exposed to financial education in the workplace
and school-based financial education will exhibit significant improvements in their
knowledge of investment returns and their retirement fund. There is also further
evidence to support that workplace education has an impact on the way workers plan
and invest for retirement (Bernheim & Garrett 2003). Support for this view is
provided by Clark et al. (2006, p. 48) who state:
The general conclusion of this limited literature is that financial education provided
by employers can increase retirement saving and potentially alter the investment
allocation of assets in retirement accounts.
Employers and retirement (superannuation) funds have adopted the use of various
educational approaches to financial education that include seminars, written mailed
communications, web-based material and access to sponsor-provided financial
counselling to enhance the financial literacy levels of individuals. Loibl and Hira
(2005) established that this self-directed employer-provided financial information has
a positive effect on employee financial management practices. The role of education
has been justified by Clark et al (2006, p. 51) who argue that:
If people preparing for retirement are not correctly informed of all the relevant factors
or are not completely knowledgeable of the nature of the retirement savings process,
it follows that they will not achieve their retirement objectives. If individuals acquire
new knowledge in some period of their working lives, they will re-solve the
optimization problem with the new parameter values.

80
Support for the use of financial education tools providing knowledge to investors who
are either not saving or inadequately saving for their retirement has gained
momentum. A US study (Clark et al. 2006) identified the lack of research on the
question of how education influences savings decisions. They found that, when
exposed to a financial education program, a significant proportion of respondents had
revised their retirement savings goals and planned to change their savings and
investments.
Further evidence on the importance of employer-based education is provided by
Bernheim and Garrett (2003). They examined the impact of financial education in the
workplace by surveying households. Their approach overcame a limitation of other
related studies that measured only the role of workplace financial education on
contributions to voluntary pension funds. Bernheim and Garrett (2003) examined the
relationship between financial education and total savings (including saving outside
the retirement plan). Through the analysis of data gathered from telephone interviews
they conclude that employer-based financial education significantly increases
retirement saving among low and moderate savers. However, the results do not
provide support for an increase in total savings levels of these respondents.
Whilst reinforcing the importance of financial education to successful retirement
planning, Clark et al. (2006) question the quality of programs offered by employers.
As noted by Mitchell and Schieber (1998, p. 11):
Pension educating is becoming increasingly important to sponsors of DC (defined
contribution) plans. Participants vary according to the types of information they need
and can process regarding investment risk, return and related issues. Examining
alternative approaches to pension education reveals that the way pension education is
presented can have a large impact on pension plan members’ investment behaviour.
The evidence clearly supports the notion that financial education does indeed lead to
higher retirement savings. Joo and Grable (2005) found that retirement confidence
survey respondents who had participated in financial education programs were more
likely to have a retirement savings program in place. Some questions emerge as to

81
how these programs can be best delivered to impact positively on behaviour (Mitchell
& Schieber 1998).
Bell and Lerman (2005) point to existing research and suggest that there is a
correlation between financial literacy and behaviour. Edminston and Gillet-Fisher
(2006, pp. 3-4) suggest that the financial literacy literature reflects two main themes
as follows:
The first is that good financial behaviors are positively associated with higher levels
of financial knowledge. The second is that financial knowledge and behavior are
positively influenced by exposure to financial education.
Using survey data from employees of the Federal Reserve Bank of Kansas City,
Edminston and Gillet-Fisher (2006) were able to demonstrate a relationship between
workplace financial education and financial knowledge and behaviour. Their findings
indicate that almost half of the respondents to their survey who possessed advanced or
intermediate knowledge had previous exposure to financial education while only a
small percentage of those exhibiting low knowledge had received this education.
Their conclusions suggest that it is more likely that an individual will possess
advanced or intermediate knowledge when exposed to financial education.
Using Rand (ALP) data, Lusardi and Mitchell (2007a) show that individuals exposed
to company-based financial education programs are more likely to display higher
levels of financial literacy. They establish that an improvement in financial literacy
from an employer-based financial education program will lead to workers planning
more for retirement. Further, Holland, Goodman and Stich (2008) in their analysis of
a workplace financial literacy program found that employer-provided financial
education programs positively influenced the participants’ financial well-being. They
also conclude from the literature that financial literacy in the workplace can increase
an employee’s ability to plan for retirement competently. Americk, Caplin and Leahy
(2003) show that those who have a higher propensity to plan may better control their
spending and, therefore, achieve their goal of wealth accumulation. A discussion of
the nature, format and importance of the types of financial information offered to
employees by employers or superannuation funds follows.

82
3.5.3 Educational Training Workshops and Seminars
Training courses in the form of workshops and seminars are often used to deliver
financial information about retirement investment planning. Such courses are often
targeted at specific groups of individuals and are usually focused on specific
retirement savings matters. The providers of this form of information range from
employers in the US to pension fund organisations in the Netherlands, and
independent retirement investment information services in Australia (OECD 2008a).
Evidence provided by Taylor-Carter, Cook and Weinberg (1997), who surveyed US
university staff exposed to a retirement seminar, indicated that they had enhanced
financial expectations of retirement. Hershey, Walsh, Brougham, Carter and Farrell
(1998) found that when 23 US university staff were exposed to a brief educational
training program, their knowledge of retirement financial matters was shown to
increase, but retirement investment decision making did not significantly improve.
However, evidence does exist that indicates individuals will change their behaviour
when exposed to training courses. In the following sections a review is presented of
the relevant literature on the influence these workshops and seminars have on
changing the behaviour of retirement fund members.
3.5.3.1 Impact of Educational Seminars and Workshops on Participation and
Contribution to Retirement Plans
Early examination of the impact of financial education in the workplace occurred in
the US and can be found in the work of Bayer, Bernheim and Scholz (1996): the focus
of their study was on employer-based retirement education. KPMG Peat Marwick
Retirement Benefits Survey (1993 and 1994) data were acquired and used for the
purpose of their research. The 1993 survey data were originally collected from a
random list of 1,100 employers from a list of both private and public employers in the
US with at least 200 employees. These same employers were used again in the 1994
survey. Bayer, Bernheim and Scholz. (1996) found that contributions to voluntary
savings (401(k)) plans are significantly higher when employers offer retirement
seminars and the effect was stronger for lower compensated employees. They also
found a strong correlation between saving behaviour and the frequency of seminars.

83
No statistical relationship was detected for the effect of written materials on voluntary
savings.
Kim, Garman and Quach (2005) surveyed 300 employees of a chemical producer in
the southeast of the US who were or were not participants in one or more employer-
provided financial education workshops. The survey yielded 178 useable responses
where 100 respondents (56 percent) had attended the workshop, and 78 (44 percent)
did not attend. The study examined the retirement savings of both the employee and
their spouse: it revealed that those who participated in the workshop were contributing
more money than those who did not participate. The results indicated no significant
differences between the respondents on the basis of age, education, financial stressors
and family size. However, gender, annual income and workplace financial education
were significant factors. As the sample was taken from a single production company it
may not be representative of all employees in the US and this limits the
generalisability of the findings.
3.5.3.2 The Influence of Educational Seminars and Workshops on Retirement
Savings Intentions
Kim, Bagwell and Garman (1998) evaluated workplace financial education of
employees situated in the corporate headquarters of a US advertising firm. They
administered a questionnaire after the conclusion of financial education seminars. The
participants rated the seminar positively and found it very beneficial and informative
in terms of providing financial education. Most of the participants anticipated a
change in their personal financial behaviour as a result of the seminar. It was noted
that a majority of respondents were voluntarily contributing to a 401(k) plan, and that
most respondents were interested in attending further seminars. The Kim, Bagwell
and Garman (1998) study also used rating scales to measure how respondents rated
the financial education seminar on issues such as presentation, content and
satisfaction and found a positive response on all measures. Most of the participants
reported that they would take some personal financial action as a result of the
educational seminar. The authors concluded that a single seminar does not satisfy all
the financial educational needs of individual employees.

84
However, Madrian and Shea (2001a) indicate that after being exposed to financial
education, many participants express their intention to start contributing to pensions
or to increase their contribution, but fail to do so in the near-term. Moreover, Madrian
and Shea (2001b) utilised administrative records of a company to determine the level
of participation and savings behaviour of individuals in a defined contribution 401(k)
plan prior to and after attending a retirement seminar. They found evidence to show
increased participation in the 401(k) plan among those who attended the seminar,
however, most of the seminar participants failed to make any changes to their savings
behaviour.
Lusardi (2005) used data from a US health and retirement study to examine the
financial position of older households. Their study claims to overcome some of the
reported shortcomings of previous research (Bayer, Bernheim & Scholtz 1996;
Bernheim & Garrett 2003) that ignored either personal information, pension plan
information, or total wealth information of workers. The data set used in Lusardi’s
(2005) research provided information on household characteristics and wealth
measures. The findings indicate that families close to retirement (50 years of age and
above) accumulated little or no wealth. These families were found to have
conservative portfolios of assets with only around 30 percent held in stocks. In
particular, those families with low level education failed to hold any high return
assets. Importantly and consistent with previous studies (Clark & Schieber 1998;
Kim, Bagwell & Garman 2005) it was found that financial seminars had significant
impact on retirement saving, especially for those who had low level education and
low wealth. Consistent with the findings of Bernheim and Garrett (2003), the Lusardi
(2005) study found that nearly all measures of retirement accumulation are greater
when respondents are offered employer-based financial education.
Clark et al. (2006) examined responses of individuals to financial education seminars
using data from three surveys of participants in seminars offered by Teachers
Insurance and Annuity Association, College Retirement Equities Fund (TIAA-CREF).
Their results support the educational value of the seminar and conclude that it can
produce significant changes in how individuals engage their retirement savings and
planning strategies. Their results indicate that a significant proportion of respondents
had revised their goals and planned to modify their savings and investments. They
85
stress the importance of financial knowledge as a necessary part of optimal
investment decision making. However, they question the quality of programs offered
by employers and emphasise the importance of financial education to the success of
retirement planning. Clark et al. (2006, p. 67) argue that:
Greater efforts by employers can provide the resources needed to assist workers in the
retirement planning and enable them to achieve their retirement objectives.
In Australia, Kerry, Clayton and Olynyk (2007) used a survey approach to interview
participants attending an Australian Superannuation Fund (ASF) retirement seminar.
The seminar covered issues on the adequacy of individual retirement plans, how much
members needed to accumulate in retirement saving during their working lives to
finance retirement, superannuation contribution rates and asset allocation decisions.
They used a two-survey approach where questionnaires were distributed before and
directly after the seminar. Post-seminar, the survey results identify that across the
sample there was a minimal change in the average retirement age and income goal.
They also show that after the seminar the confidence of members in achieving their
retirement goals showed significant movement, and only a slight change in attitude
towards investment risk was noted. For those who had previously made voluntary
contributions they signalled, after the seminar, an intention to increase such
contributions. Kerry, Clayton and Olynyk (2007, p. 84) also state that:
The primary focus of financial education should be to make the gap as narrow as
possible, that is, ensuring individuals have realistic retirement expectations and are
equipped with the requisite knowledge and skills to achieve those expectations.
3.5.3.3 Educational Seminars and Workshops on Asset Allocation Decisions
Muller (2003) utilised health and retirement study data (1992) from the US to
investigate asset allocation decisions of a sample of 1,107 participants who held a
defined contribution plan. Statistics indicated that 29 percent of participants attended
a retirement class, with 79 percent of these seminars conducted in the workplace. She
concluded that participating in a retirement seminar impacts on asset allocation
86
decisions for certain groups of individuals. It was found that retirement education
seminars substantially increased the percentage invested in equities for individuals
with a high aversion to risk. It was also found that those who were further away from
retirement (eight years or more), were more likely to invest more in equities than
those expecting to retire sooner.
Dolvin and Templeton (2006) used data gathered from a law firm in the US to analyse
the asset allocation decisions of all members of staff. This study reported decisions
made by employees at a single point in time rather than using survey data to
determine the future intentions and/or investment actions of seminar participants. In
this case the law firm changed its fund manager and all staff were required to restate
their asset allocations. Employees and their spouses were provided with opportunities
to attend a seminar on retirement investing. About 60 percent of the eligible staff
attended the seminar. Dolvin and Templeton (2006) found that staff who participated
in the seminar elected to hold more funds thus creating more diversified portfolios.
They also found employees were more conservative in their asset allocations after
attending the seminar. However, reducing risk through more conservative allocations
did not result in lower expected returns. It was implied that seminar participants were
able to create more efficient portfolios as a result of the financial education provided.
Therefore, they were able to reduce investment risk without sacrificing portfolio
return. They also found evidence of a naïve strategy to diversification with even
splitting across investment alternatives. It is also recognised that the results of the
study may not be broadly representative due to the small sample size. Dolvin and
Templeton (2006, p. 137) conclude that:
The overall evidence suggests that even the most basic education programs are
beneficial and aid plan participants in structuring more appropriate portfolios.
This discussion has shown that there is significant evidence to suggest that financial
education seminars do impact the way individuals plan and save for retirement.
Moreover, a more structured approach to financial education has the potential to
provide further efficiencies in saving behaviour. The implications of how education is
delivered and supported require further investigation to determine whether these
educational models meet the needs of superannuation fund members. In the next

87
section, an investigation of the content and implications of other communication
methods used to convey financial information to individuals is presented. This is
followed by a review of the extent to which this information is used.
3.5.4 Employer and Fund Manager Sponsored Financial Communications
Bernheim (1998) administered a short survey to pension/superannuation plan sponsors
attending a workshop on 401(k) plans. The surveys were mailed to the participants
prior to the conference to provide them with an opportunity to access any relevant
company documentation. Responses were received from around 40 companies
representing 20 percent of all companies attending the conference. Among these
respondents, 78 percent indicated that they offered education. Newsletters (69
percent) and other written materials (86 percent) were the most common forms of
employee communications followed by seminars (55 percent), one-on-one counselling
(38 percent), interactive software (21 percent) and participatory workshops (15
percent). It was also concluded that participation in 401(k) plans was greater on
average in firms that offered employee education, and that a high frequency in
employee education programs improved participation rates more than low frequency
programs.
The US accounting/auditing firm Ernst and Young commissioned a survey (Ernst &
Young LLP Human Capital Practice 2004) on the role that financial education
programs play in influencing participation in retirement plans. Their survey focused
on employer-sponsored education programs. It was found that providing employees
with brochure-type information was not sufficient to help employees navigate the
complex topic of retirement investments. They identified one-on-one counselling as
being more effective. The Ernst & Young LLP Human Capital Practice (2004, p. 4)
survey results state that:
…as pension programs place more decision-making responsibilities on employees,
financial education programs must also evolve concurrently to address this added
responsibility.

88
Ernst & Young LLP Human Capital Practice (2004) also found that written
communications such as brochures and newsletters were the most widely employer-
provided educational media, utilised by 91.9 percent of employers. Online
information, online retirement calculators and workshops were also used extensively
as educational tools to inform employees on retirement saving issues. Their evidence
shows that whilst group education had some impact, personal phone or in-person
counselling had a greater influence on employee investment behaviour. Their survey
results indicate that only 33.9 percent of employers offered phone counselling on
financial matters whilst 24.2 percent provided in-person counselling.
More recently Krajnak, Burns and Natchek (2008) cited an International Foundation
of Employee Benefits Plans survey of its employer members along with employer
members of the international society of certified employee benefit specialists in
January 2008. The survey received responses from 351 members, which included
corporations, public employers, professional service providers and multi-employer
benefit plans from both the US and Canada. The survey results indicate that 70
percent of employers offer some type of education program for their employees or
participants. The survey results also show that 77 percent of the survey participants
indicated that they offer retirement planning; 60 percent offer investment education;
39 percent offer financial planning and 28 percent offer investment advice
(respondents could select more than one answer).
The survey respondents further indicated that their organisations delivered their
retirement and financial planning information in the following ways: group meetings
with the plan provider was the most used (67 percent), followed by telephone
consultation services (56 percent), website information (55 percent), group retirement-
planning workshops (42 percent), financial counselling (39 percent) and newsletters
(38 percent). The results of the survey showed that more employees are using
electronic resources for financial planning initiatives. A large majority (84 percent) of
those employers who offered website access provided retirement income calculators.
The respondents also indicated that they offered non-interactive resources such as
information, articles, glossaries and resource lists on their websites.

89
Krajnak, Burns and Natchek (2008) also found that this education was provided to
almost all employee categories (executives, salaried employees, part-time and casual)
with 78 percent including spouses. Age and years from retirement were the main
eligibility requirements applied by some employers. Most employees (63 percent) had
no eligibility requirements for access to this financial education. A majority (72
percent) of employers offered these educational programs during normal working
hours. There was also a substantial reliance on outside providers in delivering the
education programs: the cost of the programs was generally covered by employers.
3.5.5 Utilisation and Importance of Employer and Fund Manager Sponsored
Information
The most frequently used way of providing retirement savings information is through
written communications such as brochures, magazines, newsletters, annual reports,
and websites (OECD 2008a). The information provided in written communications
and websites is intended to be more broad-based and does not, therefore, specifically
target any particular individual group. Clark and Schieber (1998) classified
communication material distributed to workers at three levels as part of their research
on factors affecting participation levels in 401(k) plans. The three level structure was
as follows: the first level communication consisted of plan enrolment forms and
periodic statements of account balances. At the next level, ‘employer
communications’, employees were provided with generic newsletters about their plans
prepared by consulting firms and investment managers that discussed investment
related issues on market and economic trends. The third level communications
provided more detailed information more specifically related to worker retirement
saving plans.
The Clark and Schieber (1998) study used cross-sectional data collected by global
human capital consulting firm Watson Wyatt. These data were collected by Watson
Wyatt from nineteen employer administrative records in 1994. The firms were not
chosen randomly, but rather on the basis that they were prepared to provide the
required data. Using a multivariate logit model, the researchers concluded that the
estimated effects of a firm providing both generic and specifically tailored

90
information could increase participation rates in these plans by 36 percent. It was
found that generic information along with forms and statements could increase the
participation rate by 15 percent while specifically prepared material on the company’s
own plan could increase the rate by 21 percent compared to only providing forms and
plan statements. Clark and Schieber (1998, p. 82) argue that:
Better communications by the company will improve the worker’s understanding of
the program and should lead to increased participation.
McCarthy and Turner (2000) used data from a 1990 survey of federal employees
regarding a savings plan for federal workers to determine the impact of written
communications on self-assessed financial knowledge. They provided econometric
evidence indicating that financial education had a positive impact on knowledge and
that increased financial knowledge leads to greater investment in equities within their
retirement plans. Clark-Murphy and Gerrans (2001) found that Australian university
superannuation fund members confronted with an option to change from a defined
benefit to a defined contribution plan relied mostly on written communications
(utilised by 87.8 percent of members). A much lower number of members (32
percent) accessed the website for their information requirements. They also found that
53 percent of respondents rated the written communications as the most important
source for their decision while only 3.5 percent rated the website as the most
important source.
Helman and Paladino (2004) reporting on the 14th
EBRI Retirement Confidence
survey indicated that those receiving educational materials or seminars from an
employer or work-related retirement plan provider were likely to have used the
material provided. It was found that written communications such as retirement
benefit statements, brochures, newsletters and magazines were used by a majority of
workers for their retirement educational needs. Seminars or group meetings were used
by 43 percent of workers followed by individual access to a financial planner and
workbooks and worksheets (41 percent). Online investment advice, other online
services and software programs were used much less. The materials rated most helpful
were individual access to a financial planner (23 percent), retirement benefit

91
statements (20 percent) and seminars or group meetings (20 percent). Helman and
Paladino (2004, p. 14) emphasise that:
Retirement educational materials and information can be effective in changing
people’s behaviour. Doing a retirement calculation and educational formats that allow
people to ask questions and/or are personalised may be most effective.
Nyce (2005) extended the research of Clark and Schieber (1998) with the use of more
recent plan administrative records and more extensive plan communication
information. The information was collected directly from employer sponsors by
Watson Wyatt between October 2001 and March 2001. The 401(k) plans in the data
set are from 48 firms covering 306,463 employees. Whilst this sample was not chosen
randomly, it was significantly larger then the sample data used in the Clark and
Schieber (1998) study. Nyce (2005, p. 4) defines employer-sponsored financial
information as:
…written communication about the basic 401(k) plan, and brochures or newsletters
highlighting general information about financial markets and the economy.
Nyce (2005) developed a four variable model from each firm’s 401(k) communication
program that included plan information, educational material, projection information
and the percentage of communication material that is internet-based. With the use of
multivariate regression models Nyce’s central finding shows that the financial
communications relating projections, education and web-intensity have a statistically
significant impact on employee participation in the retirement plan. More specifically,
web-based communications had the greatest impact on participation. It was also found
that more sophisticated web-based financial communications were much more likely
to increase participation rates for the average worker.
Loibl and Hira (2006) surveyed a randomly selected national sample of employees
from a US insurance company. The data were collected at the conclusion of a six-
month employer-sponsored financial education program. The education offered
included workshops and self-directed learning offerings at the workplace which
included financial planning software, financial planning websites and financial
92
planning publications. The education on financial planning was not specific to
retirement saving, but covered many areas on personal financial matters. They found
that the financial educational offerings in the workplace were used by employees and
were useful in improving financial knowledge. Family, friends and co-workers were
also found to play a role in initiating ‘self-directed’ financial learning. Further, it was
found that using newsletters, publications, and internet-based software influenced
reported financial and retirement knowledge.
The research considered in this section indicates that employer or plan-manager
sponsored educational material, web-based communications and projection
information is likely to impact statistically on participation rates. However, it is also
necessary to explore what aspects of this information are being utilised by investors
making investment choices, how it is contributing to their decision making, and
whether current financial education and information structures adequately support
informed decision making.
3.5.6 Combining Financial Education and Advice
The evidence pertaining to the impact of combining financial education with
investment advice is now examined. White-collar employees of an insurance company
located in three different mid-western states in the US were surveyed to gather their
opinions on financial education and more particularly the use of individual financial
advice (Kim & Garman 2003). These employees completed a survey questionnaire
prior to receiving a 90-minute financial educational seminar. Three months later a
follow-up post-assessment survey was also completed. In addition to the seminar a
free 30-minute personal individual financial advice session was provided. A month
after the financial advice session another questionnaire was completed. The results
suggest that financial advice combined with financial education led to a substantial
number of respondents indicating a greater understanding of financial issues and
financial decision making. A number of respondents indicated that they changed their
financial behaviour as a result of the program.

93
Ernst & Young LLP Human Capital Practice (2004) in their survey of US employers
found that when employers instituted telephone or ‘in-person’ counselling as part of
their financial education program they reported a significant change in participant
behaviour. They reported increases in 401(k) plan participation and contribution rates
in excess of 5 percent, and substantial asset allocation changes by employees in their
retirement plans.
In their survey of Australian university superannuation fund members, Clark-Murphy
and Gerrans (2001) found that only 11.3 percent of respondents utilised the sponsor
funded financial advice when it came to deciding whether or not to move to a defined
contribution fund. Therefore, when given an opportunity to combine other forms of
superannuation fund provided information with financial advice, a majority of
members failed to combine the information with advice.
3.5.7 Preferred Sources of Financial Information
Studies by Rhine and Toussiant-Comeau (2002) and Hilgert, Hogarth and Beverly
(2003) have used subjective evaluations to look at how consumers prefer to receive
information on financial issues. Rhine and Toussaint-Comeau (2002) reviewed data
collected by the Metro Chicago Information Centre (MCIC) from the Chicago
metropolitan area. The data were collected mainly by telephone interviews with some
face-to-face interviews. It was found that the preferred method of delivery for all
respondents was newspapers and magazines. The least preferred method of delivery
for the whole sample was radio programs. It was found that lower income, less
educated adults are less likely to select the internet as a tool to find information on
personal finance issues and prefer formal courses offered within their local
community. Low income and minority (disadvantaged) consumers were likely to
select radio programs as a means of receiving information on financial matters, whilst
older adults and minority groups had a preference for seminars.
Hilgert, Hogarth and Beverly (2003) used data from surveys of consumers conducted
by the University of Michigan. Overall, it was found that households preferred to
learn about money management through media sources (television, radio, magazines,
94
and newspapers), followed by informational videos and brochures. It was also found
that financially sophisticated consumers were more likely to prefer the internet when
compared to the less sophisticated consumers.
3.6 Resource Usage in Retirement Savings Decisions: Australian Evidence
Clark-Murphy and Gerrans (2001) surveyed members of a University superannuation
fund (formely known as the Superannuation Scheme for Australian Universities
SSAU) who were asked to choose between a defined benefit fund or one of four
investment defined contribution accounts. Prior to July 1998, all members had
benefits prescribed under a defined benefit fund. Between July 1988 and June 1999,
existing members were given the choice of continuing with defined benefits or
moving to a defined contribution plan. The investigation of the decision process of
SSAU members was conducted by mail-out questionnaire. A sample of 10,000
members was randomly generated from over 48,000 members in the fund. The
questionnaire was sent in October 1999 and a total of 2,407 responses was received
representing a response rate of 24 percent. Figures obtained from SSAU indicated that
31.6 percent of members did not return the form, and by default they remained in the
defined benefit plan. A further 33.3 percent chose to move to the defined contribution
fund and 35.1 percent chose to remain in the defined benefit plan. The questionnaire
sought information on the SSAU resources used by members in making their decision.
They found that the information pack mailed to members was the most used (87.8
percent) followed by the seminars run by SSAU on campus (47 percent), website (32
percent), modelling program on website (24.6 percent), and information provided by
the local SSAU representative (11.3 percent). Six percent of members indicated that
they used no resources. When rating the importance of these items to their decision,
respondents ranked the mailed information pack as most important (53 percent),
followed by the seminars (27 percent), website modelling program (11.1 percent),
local SSAU representative (4.2 percent), and the website (3.5 percent).
The questionnaire also asked members to identify what people they consulted in the
decision process. The most consulted people were work colleagues (48.9 percent)
followed by partners (46.1 percent), family and friends (18.1 percent), financial

95
planner (15.4 percent), and accountant (10.5 percent). A further 21.1 percent did not
consult with another person when making their decision. When asked to indicate the
most important persons consulted, work colleagues rated highest (31.6 percent),
followed by partner (30.8 percent), financial planner (17.7 percent), accountant (9
percent), and family and friends (7.5 percent).
The current study significantly extends the Clark-Murphy and Gerrans (2001) study as
this research reviews the extent to which informational resources are used for all
superannuation decisions and not just for a single decision (which was whether or not
to switch from a defined benefits plan to a defined contribution fund). This study
focuses exclusively on those who have chosen to be in a defined contribution fund
rather than all members of the superannuation fund. This study reviews whether the
educational resources model is leading to a perception of informed choice. Further, it
requires respondents to rate the contribution of educational resources to their
knowledge for superannuation decision making. Rating scales are used to measure
superannuation members’ perceptions of specific educational resources. Further, the
extent of failure to use the educational resources is identified and reasons why they
are not utilised are discovered. This study assesses the importance placed on other
non-superannuation provided resources (not just other persons) and measures the
importance placed by superannuation fund members on friends and colleagues,
financial newspapers, financial magazines, investment advice, and radio and
television.
3.7 Theoretical Framework for the Research
In Figure 3.3 an outline of the theoretical framework for the research is presented. The
theory suggests that the life-cycle permanent income hypothesis (Modigliani &
Brumberg 1954) represents the rational ideal for individuals saving for retirement
income. However, the behavioural model (Thaler 1994; Shefrin 2002) suggests that
full rational reality does not occur when individuals are making decisions for their
retirement savings. Educational programs for those individuals engaging in active
investment choice was a partial resolution specified by Brown, Gallery and Gallery
(2002) to achieve informed choice. The current study indicates that educational
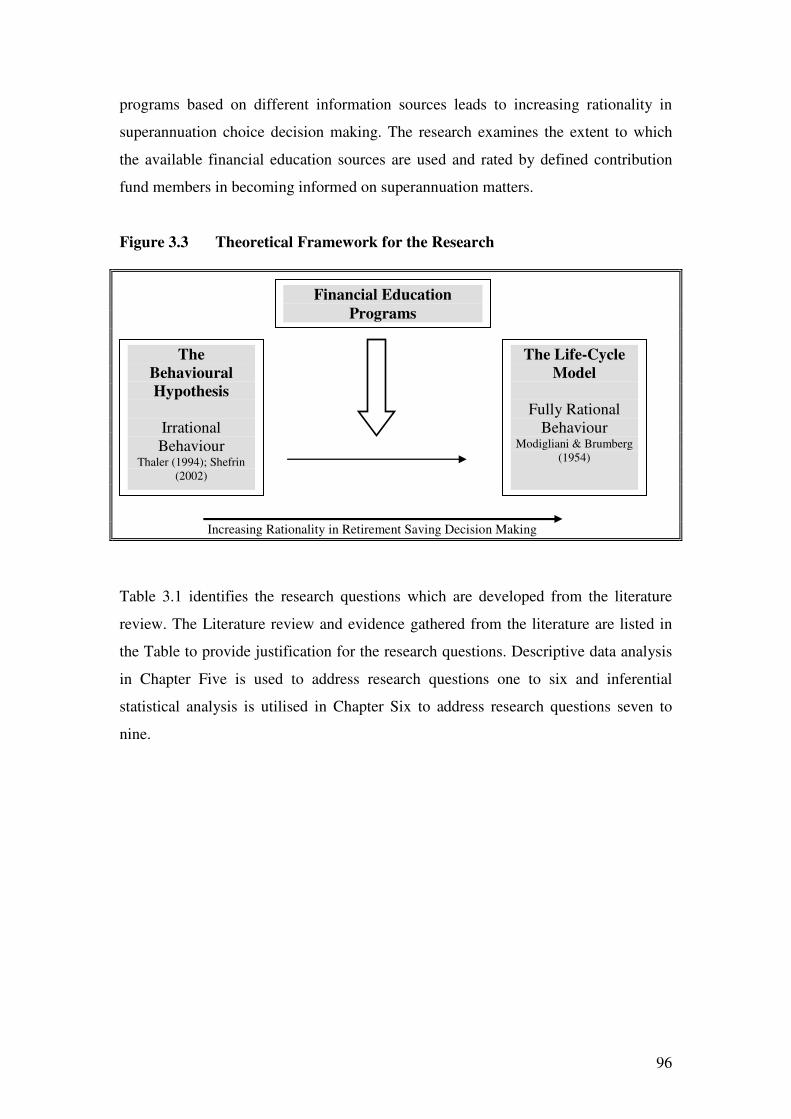
96
programs based on different information sources leads to increasing rationality in
superannuation choice decision making. The research examines the extent to which
the available financial education sources are used and rated by defined contribution
fund members in becoming informed on superannuation matters.
Figure 3.3 Theoretical Framework for the Research
Increasing Rationality in Retirement Saving Decision Making
Table 3.1 identifies the research questions which are developed from the literature
review. The Literature review and evidence gathered from the literature are listed in
the Table to provide justification for the research questions. Descriptive data analysis
in Chapter Five is used to address research questions one to six and inferential
statistical analysis is utilised in Chapter Six to address research questions seven to
nine.
The
Behavioural
Hypothesis
Irrational
Behaviour Thaler (1994); Shefrin
(2002)
The Life-Cycle
Model
Fully Rational
Behaviour Modigliani & Brumberg
(1954)
Financial Education
Programs

97
Table 3.1 Research Questions and the Review of the Literature
Research Questions Relating to Questionnaire Items Evidence from the Literature Literature Review
Question 1 What is the users’ perception of the presentation of
information in educational seminars?
Question 1A To what extent do the users feel they are informed by
the seminars?
Question 1B Do users place importance on the educational seminar
when it comes to their superannuation decision making?
Question 1C How frequently do users attend the educational
seminars?
Studies that found evidence that when
employees/members attend financial
education seminars or training courses it
influences their retirement investment and
savings behaviour.
Kim et al. (1998)
Clark-Murphy & Gerrans (2001)
Muller (2003)
Ernst & Young LLP HCP (2004)
Lusardi (2005)
Clark et al. (2006)
Kerry et al. (2007)
Dolvin & Templeton (2006)
Question 2 To what extent do users’ feel they are informed by the
range of sponsor provided web-based educational information?
Question 2A What importance is placed on sponsor provided web-
based educational information when it comes to the fund member’s
superannuation information requirements?
Question 2B Do users place importance in the information provided
on the superannuation fund website for their decision making?
Question 2C How frequently do users access the superannuation fund
provided website?
Studies that found evidence of
employee/member use of web-based
educational communications and investment
tools and that these resources influenced their
retirement saving and investment behaviour.
Clark-Murphy & Gerrans (2001)
Helman & Paladino (2004)
Nyce (2005)
Loibl & Hira (2006)
Question.3 To what extent do users feel they are informed by reading
the written communications provided by the superannuation fund?
Question.3A Do users place importance on superannuation provided
written communications for their decision making?
Question.3B How frequently do the users access the written
communications provided by the superannuation fund?
Studies that found the use of written
educational communication in retirement
saving decisions by employees/members and
that these resources influenced individual
retirement saving and investment behaviour.
Clark & Schieber (1998)
McCarthy & Turner (2000)
Clark-Murphy et al. (2001)
Helman & Paladino (2004)
Nyce (2005)
Loibl & Hira (2006)
Question 4 What is the users’ perception of the communication of
information provided by the financial counsellor?
Question 4A To what extent do users feel they are informed by
Studies that identified that financial advice
was used by employees/members and that this
advice influenced individual retirement
Clark-Murphy & Gerrans (2001)
Kim & Garman (2003)
Helman & Paladino (2004)
Ernst &Young LLP HCP (2004)
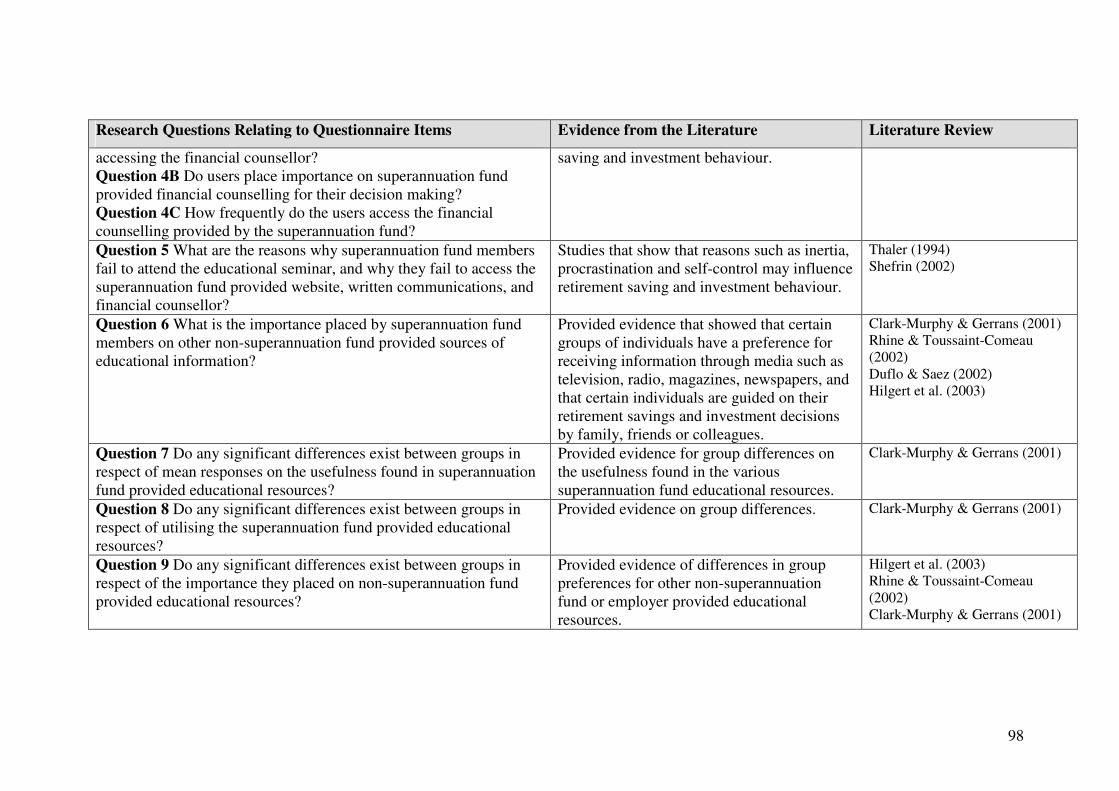
98
Research Questions Relating to Questionnaire Items Evidence from the Literature Literature Review
accessing the financial counsellor?
Question 4B Do users place importance on superannuation fund
provided financial counselling for their decision making?
Question 4C How frequently do the users access the financial
counselling provided by the superannuation fund?
saving and investment behaviour.
Question 5 What are the reasons why superannuation fund members
fail to attend the educational seminar, and why they fail to access the
superannuation fund provided website, written communications, and
financial counsellor?
Studies that show that reasons such as inertia,
procrastination and self-control may influence
retirement saving and investment behaviour.
Thaler (1994)
Shefrin (2002)
Question 6 What is the importance placed by superannuation fund
members on other non-superannuation fund provided sources of
educational information?
Provided evidence that showed that certain
groups of individuals have a preference for
receiving information through media such as
television, radio, magazines, newspapers, and
that certain individuals are guided on their
retirement savings and investment decisions
by family, friends or colleagues.
Clark-Murphy & Gerrans (2001)
Rhine & Toussaint-Comeau
(2002)
Duflo & Saez (2002)
Hilgert et al. (2003)
Question 7 Do any significant differences exist between groups in
respect of mean responses on the usefulness found in superannuation
fund provided educational resources?
Provided evidence for group differences on
the usefulness found in the various
superannuation fund educational resources.
Clark-Murphy & Gerrans (2001)
Question 8 Do any significant differences exist between groups in
respect of utilising the superannuation fund provided educational
resources?
Provided evidence on group differences. Clark-Murphy & Gerrans (2001)
Question 9 Do any significant differences exist between groups in
respect of the importance they placed on non-superannuation fund
provided educational resources?
Provided evidence of differences in group
preferences for other non-superannuation
fund or employer provided educational
resources.
Hilgert et al. (2003)
Rhine & Toussaint-Comeau
(2002)
Clark-Murphy & Gerrans (2001)
99
3.8 The Research Model
Figure 3.4 presents the research model for superannuation education developed in the
current research study. This research model is an extension of the theoretical
framework shown in Figure 3.3 where it was suggested that superannuation member
education leads to more rationality in investment decision making. In this research
Unisuper defined contribution fund members are asked to evaluate the educational
information provided by their superannuation fund (educational seminar, financial
counselling, website, and written communications), and the importance they place on
non-superannuation fund information, namely, friends and colleagues, financial
newspapers, financial magazines, advisers, and radio and television. The evaluation is
based on the financial education guidelines provided by the OECD (2005) that
suggest that financial education is a process by which financial consumers improve
their understanding of financial matters through information, instruction and/or
objective advice. The research literature indicates financial education impacts on how
individuals plan and save for retirement. The educational seminar, financial
counselling, website information and written communication were identified in the
literature as educational resources that changed individual retirement savings
behaviour. The evaluation provided by superannuation fund members of these
educational resources will determine whether superannuation fund members feel they
are being informed on superannuation fund matters.

100
Figure 3.4 The Research Model for Superannuation Education
Financial Education The process by which financial consumers/investors improve their understanding of financial products and
concepts and, through information, instruction and/or objective advice, develop the skills and confidence to
become more aware of financial risks and opportunities, to make informed choices, to know where to go for
help, and to take other effective actions to improve their financial well-being (OECD 2005, p. 26)
Superannuation
Fund Information
Providing More
Specific
Educational
Information
Superannuation
Fund Information
Providing More
Generic
Educational
Information
Other Non-
Superannuation
Fund Provided
Sources of
Educational
Information
Educational
Seminar
Financial
Counselling
Website
Information
Written
Communications
Includes information
from friends and
colleagues, financial
newspapers, financial
magazines, advisers
and radio and
television
Communication
and presentation
of specific
superannuation
information
Advice
providing
members with
counsel about
financial issues
Information
provided to
members on
superannuation
issues including
financial
calculators
Information
providing
members with
facts, data and
other knowledge
on superannuation
matters
INFORMED INVESTMENT CHOICE Informed decisions require an evaluation of funds’ investments strategy, investment portfolio, and the
expected risks and returns in order to evaluate a match to members’ risk-return preferences
(Clark-Murphy, Kristofferson & Gerrans 2002)
101
3.9 Summary
This chapter contains an overview of the life-cycle model and the behavioural finance
theories that assist in explaining why individual savings behaviour deviates from what
is predicted by this model. Survey evidence indicates a lack of confidence among
many individuals in that they will accumulate sufficient wealth for their years in
retirement. The behavioural implications such as bounded rationality and bounded
willpower are thought to be the main causes that limit an individual’s capacity to plan
and save adequately for their retirement. Bounded rationality assumes that individuals
will fail to make strictly rational decisions and, further, lack the willpower to execute
their intentions (bounded willpower). Individual behavioural traits, such as inertia,
procrastination and heuristics, lead to behaviour which in inconsistent with the life-
cycle model. Surveys show that there are several groups within the community that
have low levels of financial literacy that inhibit their planning and saving for
retirement. The literature suggests that those with higher levels of financial
knowledge are more likely to plan for retirement.
Research shows that a number of superannuation fund members find it difficult to
make decisions on how their savings should be managed, and often avoid having to
make decisions. It is argued that education programs should be targeted to those fund
members who are actively engaged in the management of their retirement saving. The
review also indicates that financial education can change an individual’s behaviour
towards their retirement planning and saving. It was shown that educational resources
provided by either the employer or superannuation fund, such as the educational
seminar, website, written communications and financial counselling are all considered
to be effective educational tools in changing a person’s retirement savings and
investment behaviour. The research framework for this study was also presented and
its link to the educational research model explained. The research questions were
developed and presented, together with references to relevant prior literature.

102
Chapter Four
Research Methodology
4.1 Introduction
In the previous chapter a set of research questions was developed that needs to be
addressed. Having decided upon the research questions the researcher needs to decide
how to go about finding answers to these questions. The path to establishing answers
to the research questions will constitute the research methodology. Research
methodology is a step-by-step approach to research enquiry that requires the
researcher to select the most appropriate methods and procedures. Kumar (2005, p.
16) suggests that:
At each operational step in the research process you are required to choose from a
multiplicity of methods, procedures and models of research methodology which will
help you to best achieve your objectives.
In this chapter the research methodology established to meet the research aims is
outlined. The adopted methodology is described and justified. Specific references are
made to how the sample was chosen. The chapter also includes a review of the
construction, layout and administration of the instruments used in the data collection
process. The issues of survey reliability and validity are discussed and ethical
considerations are also addressed.
4.1.1 Review of Objectives
The purpose of this research is to evaluate a financial education model to see whether
it provides superannuation accumulation fund members with the required resources to
assist them in making informed decisions regarding their superannuation investment
funds; and to determine the importance users place on this information for their
overall superannuation decision making. It is also intended to determine which parts
of the superannuation-provided education are not being used by superannuation
103
defined contribution fund members and the reasons they are not utilising these
particular aspects of education. The literature identified four forms of education
information that have an impact on a superannuation fund member’s decision making.
These are as follows:
• educational seminar;
• superannuation fund website;
• written communications from the superannuation fund; and,
• financial counselling provided by the superannuation fund.
In developing the methodology a set of questions has been developed that will allow
the measurement of variables in order to answer the research questions. The research
methods relating to this study are addressed in the following sections.
4.2 Research Paradigms
It is argued that theory building is the first stage in developing good explanations, and
theory testing is then used in an attempt to test the theory that was developed in the
theory construction phase (De Vaus 2002). Bryman (2004) suggests that it is useful to
think of the relationship between theory and research in terms of deductive and
inductive strategies.
4.2.1 Deductive and Inductive Theory
Both deductive and inductive thinking represent an important variation in social
research (Babbie 2008). The deductive approach to research involves a starting point
of theory testing. This approach adopts a set of testable propositions or research
questions and data are then collected and analysed either to support or reject the
theory. Therefore, this approach identifies the theory and then observations or
findings are used to establish the validity of the theory.

104
Deductive theory is said to represent the most common view of the nature of the
relationship between theory and social research (Bryman 2004). Given what is known
about a particular subject and its theoretical underpinnings, the researcher deduces a
hypothesis or hypotheses which are then subjected to empirical scrutiny. The
researcher also needs to specify how the data are to be collected in relation to the
concepts that make up the hypothesis (Bryman 2004).
The positivist (deductive) approach considers the purpose of theory is to generate
hypotheses (research questions) that can be tested and that will thereby allow
explanations of laws to be assessed. These research questions, relevant to the current
study were developed in the literature review chapter.
In contrast, the inductive approach uses data collection as its starting point. These data
are then analysed for any implications for propositions in theory construction. This
approach is also referred to as grounded theory (Glaser & Strauss, 1967; Strauss &
Corbin, 1994) as it is based on observation rather than speculation. It is referred to as
inductive reasoning as it involves starting with certain observations and then
developing the theory from the observations (De Vaus 2002).
4.2.2 Quantitative and Qualitative Research Methods
On methodological issues it is useful to distinguish between quantitative and
qualitative research. Quantitative research can be constructed as a research strategy
that emphasises quantification in the collection and analysis of data. Qualitative
research can be constructed as a research strategy that usually emphasises words
rather than quantification in the collection and analysis of the data (Bryman 2004;
Babbie 2008; Bouma & Ling 2004).
Quantitative research generally takes a deductive approach to research and
incorporates the positivist paradigm. It also takes the “view of social reality as an
external, objective reality” (Bryman, 2004, p. 19). In contrast, qualitative research
predominantly emphasises an inductive approach to research, rejects the positivists
view and, furthermore, “embodies a view of social reality as a constantly shifting

105
emergent property of individuals’ creation” (Bryman, 2004, p. 20). The term
‘interpretivism’ usually denotes the alternative to the positivist view. Phenomenology
is seen as one of the main intellectual traditions that has been responsible for the anti-
positivist position. The interpretivist heritage incorporates the phenomenological
tradition. Phenomenology is concerned with seeking to establish how individuals
make sense of the world around them; a contrast is provided in Table 4.1 between the
positivist and phenomenological paradigms.
Table 4.1 Comparison of the Positivist and Phenomenological Paradigms
Positivist Paradigm Phenomenological
Paradigm
Basic Beliefs: The world is external and
objective
The world is socially
constructed and subjective
Observer is independent Observer is part of what is
observed
Science is value free Science is driven by human
interests
Researcher should: Focus on facts Focus on meanings
Look for causality and
fundamental laws
Try to understand what is
happening
Reduce phenomena to
simplest elements
Look at the totality of each
situation
Formulate hypotheses and
then test them
Develop ideas through
induction from data
Preferred methods
include:
Operationalising concepts so
that they can be measured
Using multiple methods to
establish different views of
phenomena
Take large samples Small samples investigated in
depth or over time
Source: Easterby-Smith, Thorpe and Lowe (1991, p. 27).
The concept of research strategy was introduced to draw the distinction between
quantitative and qualitative research as different research strategies. The other key
decisions involve the choices surrounding the research design and research method.
106
4.3 Research Design and Methodology
The research paradigm entails the consideration of an inductive versus deductive and
quantitative versus qualitative approach. An appropriate research design needs to be
chosen so as to meet the aims of the research. The adoption of a specific research
design is guided by the literature and only after careful and structured consideration of
the various research methods. The research design provides the framework for
collecting and analysing data.
Research methods include approaches such as questionnaires, structured or semi-
structured interviews, observation and content analysis. The following is a summary
description of the major types of research design that can be used in the research
process in the social sciences.
4.3.1 Experimental Design
Experimental design involves quantitative comparisons between experimental and
control groups with regard to a dependent variable. The research usually extends over
time so that data can be collected at multiple stages. The independent variable is
manipulated to gauge any changes in the dependent variable. The aim of the research
is to determine if any differences exist between the groups. As an example, Rosenthal
and Jacobson (1968) used an experimental design in a social science setting to
conduct an experiment into whether teachers’ expectations of their students’ abilities
in fact influence the school performance of the latter.
4.3.2 Longitudinal Design
This design involves data collection at different points of time. This repeated
approach to collecting data is particularly useful in assessing trends and changes over
a period of time. Typically survey research on a sample on more than one occasion is
used to quantify the trends or changes. Content analysis is another technique that can
also used to analyse documents relating to different time periods. Qualitative
107
interviewing on more than one occasion or qualitative content analysis of documents
relating to different time periods is also used.
4.3.3 Case Study
The case study method usually involves the intensive study by observation or
interviewing of a single case. It is most commonly used as a qualitative measure.
Babbie (2008, p. 326) defines it as an “in-depth examination of a single instance of
some social phenomenon”. This method is often criticised as it provides limited
generalisability to the population. However, Bryman (2004, p. 48) argues that “some
of the best-known studies in sociology are based on this kind of design”.
4.3.4 Comparative Study
This type of research involves a direct comparison between two or more cases.
Surveys are commonly used to gather qualitative data for comparisons between cases.
Qualitative interviewing on two or more cases is also used in comparative studies.
These studies have often been used in a cross-cultural or cross-national format. For
example, Kelly and De Graaf (1997) used secondary analysis of survey evidence
collected in fifteen nations to examine the factors that have an impact upon
individuals’ religious beliefs. Another study by Crompton and Birkelund (2000)
comprised research using semi-structured interviews of comparable samples of male
and female bank managers in Norway and Britain to compare work/life balance.
However, this type of research is not solely confined to comparisons between nations
and can be applied to a variety of situations.
4.4 Research Method used in this Study
This study adopts a survey approach. Survey research is a frequently used mode of
observation in the social sciences. Surveys can be used for descriptive, explanatory
and exploratory purposes. Survey research is described as “probably the best method

108
available to the social researcher who is interested in collecting original data for
describing a population too large to observe directly” (Babbie 2008, p. 270). Surveys
are an effective vehicle for measuring peoples’ attitudes, beliefs, opinions,
motivations, and behaviour. Survey research is widely regarded as being inherently
quantitative and positivistic (De Vaus 2002).
The term ‘survey’ is defined by Bryman (2004, p. 43) as a:
Cross sectional design in relation to which data are collected predominantly by self-
completion questionnaire or by structured interview on more than one case and at a
single point in time in order to collect a body of quantitative or quantifiable data in
connection with two or more variables which are then examined to detect patterns of
relationship between variables.
The main advantage of the survey method is that it rarely requires a study of the
whole population. Random statistical samples are commonly drawn from a population
and inferences can then be made from the sample responses to the population.
Therefore, surveys provide an efficient and economical means of gathering and
analysing data about people’s attitudes and orientations. The contribution of survey
research to the methodology of the social sciences is emphasised by Kerlinger (1986,
p. 381) when he describes its most important contributions as:
…rigourous sampling procedures, the overall design and the implementation of the
design of studies, the unambiguous definition and specification of the research
problem, and the analysis and interpretation of data.
Weaknesses of survey research may commonly involve: a lack of depth in the survey
data; large investments of time and resources; sampling errors; inadequate
measurement that may produce unreliable and invalid results; and, non-response bias
(Kerlinger 1986). For the current study, the treatments of these issues are dealt within
this chapter.

109
4.4.1 Types of Surveys
Surveys can be broadly classified into three categories: mail and electronic
questionnaire, telephone interview, and personal interview; they are the most common
method of collecting survey data (De Vaus 2002). Each survey method has its place in
social research. After careful consideration of all the advantages and disadvantages
that each method offers, a well balanced choice needs to be made so as to meet the
requirements of the research.
4.4.1.1 Mail Questionnaire
Mail questionnaires are posted out to respondents who then answer questions by
completing the questionnaire personally and returning it by mail. Mail questionnaires
can be administered quickly and usually at a relatively lower cost than the other two
survey methods. This advantage is enhanced when the researcher is dealing with large
geographically dispersed samples, however, the questionnaires may take several
weeks before they are completed and returned. Another noted advantage is that there
is an absence of interviewer impact on answers provided by the respondent (David &
Sutton 2004). The respondent is in no way influenced by an interviewer when
completing the questionnaire. Studies have found that the presence of any interviewer
at all can produce biased responses (Groves, Fowler, Couper, Lepkowski, Singer &
Tourangeau 2004). Furthermore, as there is no interviewer present, there is no
variability in the order and way the questions are asked. Respondents also decide the
time and speed at which they respond to the questionnaire. This convenience may
further assist the response rate.
One of the limitations of the mail questionnaire method is the response rate. Generally
mail questionnaires will typically result in low response rates. It is suggested that the
main disadvantage of the mail survey is often the low response rate obtained (David
& Sutton 2004). Czaja and Blair (2005) caution that mail surveys are prone to
response bias because of low response rates, as a result, non-response may bias the
research results. Further, errors may arise as the researcher has no control over the
process as they do not get the opportunity to prompt or probe. Partially answered
110
questions are also more likely to occur than with other methods of data collection and
there is no control over who completes the questionnaire. Other concerns relate to
being unable to collect additional data and the fatigue factor experienced by
respondents answering long questionnaires (Bryman 2004).
4.4.1.2 Electronic Questionnaire
A recent variation of the mail-out questionnaire is the electronic mail questionnaire.
This can involve distributing the questionnaire as an attachment forming part of an
electronic mail (email). With this method the survey is formatted with either word
processor or with web-formatting language and attached to an email. The
questionnaire is answered and returned by email by the respondent. A more recent
alternative is to send an email with a hyperlink to a website containing the
questionnaire. This type of electronic survey is often described as a web-based survey.
Many studies have compared response rates on mail-out and web-based surveys, and
the results are mixed. A meta-analyses of thirty-nine study results published in the last
decade shows that mail surveys have higher response rates than web-surveys in
general (Shih & Fan 2008). Kaplowitz, Hadlock and Levine (2004) argue that web-
surveys can achieve similar response rates to a mailed questionnaire. Whereas,
Cobanoglu, Warde and Moreo (2001) found, that when respondents were given choice
between completing a mail or web-based survey, the web-based option produced a
higher response rate. Porter (2004, p. 9) suggests that there …“is difficulty in drawing
conclusions about response rates from such studies”.
One of the major sources of error in any survey is non-response (Archer 2007). Errors
relating to non-response result when not all of the potential respondents complete the
survey lead to non-response bias. Crawford, Couper and Lamias (2001) argue that
non-response represents the biggest challenge for web-based surveys. It is suggested
that an acceptable response rate for a mail questionnaire is above 50 percent
(Mangione 1995). However, response rates between five and ten percent are common
(Alreck & Settle 1985). Schonlau, Fricker and Elliot (2001) conducted a review of
web-based surveys and found they achieved response rates in the range of seven to 44

111
percent. A number of techniques have emerged in the literature that can be used to
maximise response rates for web-based and mail surveys (Dillman 2007; Ganassali
2008; Solomon 2001; Cook, Heath & Thompson 2000).
Most of the advantages and limitations of mail-out questionnaires also apply to
electronic questionnaires. However, electronic surveys can be administered at a
greater speed via the internet than mail-out questionnaires and may save time for the
researcher (Wright 2005). When completed and submitted, the responses to the
questionnaire are received immediately, either through a return email or a dedicated
data base. Furthermore, responses are also likely to be received much earlier as they
are returned electronically. Kwak and Radler (2002) found that a web-based survey
had significantly shorter turn-around time compared to a mail survey. Web-based
surveys are now relatively inexpensive and achieve satisfying response rates
compared to the classical mail-out questionnaire (Ganassali 2008). The use of
electronic questionnaires eliminates the need for paper and other costs such as
printing, postage and data entry (Llieva, Baron & Healey 2002).
4.4.1.3 Telephone Interview
Telephone interviews involve making telephone contact with a selected sample and
asking questions over the telephone. These interviews are usually administered from a
central location as conducting the interviews from a centralised location allows for
quality control and greater supervision of interviewers. When compared to personal
interviews this method is cheaper and also quicker to administer. The cost saving
arises from the fact that interviewers do not have to travel and thus the avoidance of
related costs. This method provides the opportunity to interview a geographically
dispersed sample more quickly. Moreover, better responses to embarrassing or
personal questions may be achieved without face-to-face contact (McMurray,
Spoonley, Pearson, Pace & Scott 2004). However, it is not possible to interview
people that are not contactable by telephone and further difficulty may also be
encountered when interviewing the hearing impaired. Frey (2004) claims that
telephone interviews are less sustainable in time compared to personal interviews. He
also claims that telephone interviews achieve slightly lower response rates when

112
compared with personal interviews. It is also difficult to use visual aids to assist
responses in a telephone interview, and the interviewer is not placed to observe and
therefore respond to facial or other signs of confusion or unease when asking a
question (Bryman 2004).
4.4.1.4 Personal Interview
The personal interview method involves the collection of data from a respondent often
using a face-to-face interview with a trained interviewer. Because of the face-to-face
contact the quality of the responses in interviews is superior to mail-out
questionnaires because of the depth and quality of data that can be collected. This
approach lends itself more to open-ended questions where more detailed information
can be gathered. The interviewer has the ability to provide explanations to questions
where necessary and to probe further if they deem it important. This approach also
provides the interviewer with the opportunity to use visual aids to assist with
responses. The personal interview is usually the most costly survey method, but it is
likely to produce a better response rate compared to other survey methods as
respondents are less likely to terminate a face-to-face interview. Disadvantages of this
method include a lack of anonymity which may cause some problems when dealing
with certain confidential or sensitive questioning. Furthermore, an interviewer may
introduce biases when questioning and subsequently influence responses.
4.4.2 Strengths and Weaknesses of Survey Research
Surveys, as with other data collection methods, have both strengths and weaknesses.
These need to be kept in mind in determining whether a survey is appropriate for the
research objectives. Drawing partly on Babbie (2008), Bryman (2004) and DeVaus
(2002), an overview was developed to summarise the strengths and weaknesses of
survey research. This overview is presented in Table 4.2.

113
Table 4.2 Strengths and Weaknesses of Survey Research
Strengths Weaknesses
Large samples are feasible Time consuming
Useful in describing characteristics of a
large population
Can have low response rates
Can be administered from a remote
location
The participants may have problems
recalling information
Reliability is strong Respondents may not answer truthfully
on controversial or threatening questions
Can be inexpensive The design is generally inflexible
Data are collected in a standardised
format
Is comparatively weak on validity
4.5 Administering the Survey
This section of the chapter is divided into six major sub-sections. In each sub-section
a major phase in the administration of the method in this thesis is referred to and
discussed.
4.5.1 Phase I: Selecting the Type of Survey
A vitally important aspect of the social research process is for the investigator to
select the most appropriate data collection method. In this investigation a web-based
questionnaire has been chosen as the most suitable method for the study. This
decision was made after careful consideration of the both the advantages and
disadvantages of the different survey approaches. De Vaus (2002, p. 127) suggests
that:
The choice of a survey method depends on the nature of the survey, the sample, time
and cost constraints, the importance of response rates and the types of questions.

114
As part of this decision process the Trochim (2006) framework was used in sections
4.5.1.1, 4.5.1.2, 4.5.1.3, 4.5.1.4, 4.5.1.5 and 4.5.1.6 to guide the decision. This
approach asks several questions to guide the researcher towards an appropriate
decision.
4.5.1.1 Population and Accessibility Issues
Population and accessibility issues How the issue was addressed
Can the population be enumerated? Yes, but the list was unavailable.
University websites were used to identify
the population.
Is the population literate? All university staff were expected to be
literate.
Are there language issues? The sample was expected to adequately
understand the English language.
Will the population co-operate? Prior research on university staff suggests
that adequate co-operation will occur.
What are the geographic restrictions? Dispersed across Australia.
4.5.1.2 Sampling Issues
Sampling Issues How the issue was addressed
Who are the respondents? Australian university staff belonging to
the Unisuper accumulation fund scheme.
Can respondents be contacted? Email details are available on publicly
available university websites. All
respondents are expected to have email
access.
Can all members of the population be
sampled?
Judgement (purposive) sampling used to
delineate the research sample.
Are response rates likely to be a problem? An acceptable response rate was
expected. Follow-up techniques were
used to enhance the response rate (two
reminder emails).
4.5.1.3 Question Issues
Question issues How the issue was addressed
What types of questions will be asked? Statements and closed-ended questions.
How complex will the questions be? Simple and understandable language.
Will screening questions be needed? Yes. The screening process will occur in
the letter to respondents.
Can question sequence be controlled? Yes.
Will lengthy questions be asked? No.
Will long response scales be used? Likert scaling was selected for use.

115
4.5.1.4 Content Issues
Content issues How the issue was addressed
Can respondents be expected to know
about the issue?
Respondents expected to be aware of
superannuation issues.
Will respondents need to consult records? No.
4.5.1.5 Bias Issues
Bias issues How the issue was addressed
Can social desirability be avoided? Mail-out and electronic questionnaires
can provide anonymity for the respondent
and therefore this concern is avoided.
Can interviewer distortion and subversion
be controlled?
As with face-to-face and telephone
surveys electronic questionnaires do not
suffer from this disadvantage.
Can false respondents be avoided? The survey was sent to individual email
addresses. Therefore it is unlikely that
another person would access and respond
to the survey.
4.5.1.6 Administrative Issues
Administrative issues How the issue was addressed
Costs The mail-out survey and especially the
electronic survey has the lowest cost of
all survey methods. Cost was an issue
that was considered in determining the
use of the electronic questionnaire.
Facilities The required technical facilities were
available to facilitate construction and
implementation of the survey instrument.
The survey monkey software was used in
the construction of the survey.
Time The electronic survey was favoured as it
allows for questionnaires to be received
immediately by respondents once sent
through the email system. It is also time
efficient for sending further reminders.
Furthermore, responses to the survey are
collected immediately through an
electronic data base managed by survey
monkey.
Personnel Unlike the face-to-face and telephone
interview surveys, the electronic
questionnaire is self-completed by
respondents without any interviewer
assistance. Therefore recruitment and
training of interviewers are avoided.

116
4.5.1.7 Selection of the Web-based Survey Approach
Due to the geographical dispersion of the sample and the public availability of staff
contact details a web-based survey approach was favoured. The sample comprised six
thousand university staff dispersed throughout Australia. The internet approach was
chosen over a mail survey as the web-based survey provided time savings, cost
savings and a suitable structure and layout for the questionnaire.
The questionnaire contained a number of contingency questions where the
respondents had to proceed directly to a specific section of the survey based on the
response to a question. The advantage of the web-based survey is that it allows the
designer of the survey to automatically direct respondents to a particular section of the
survey based on their response to filter questions. Further, consideration was given to
the likelihood that substantially all university staff would have access to a computer
and email and could therefore be contacted electronically. Importance was placed on
the fact that the survey data would be automatically placed in a database providing the
researcher with immediate access to responses as they were submitted. This meant
that survey responses would not have to be manually transferred from surveys when
received, thus avoiding transcription error and allowing for the immediate analysis of
the data.
4.5.2 Phase II: Constructing the Questionnaire
Once the researcher has established the questionnaire objectives and made a decision
on the type of questionnaire and the method of communication, the construction of the
questionnaire then follows. The way a questionnaire is designed is very important to
its success as a data capturing instrument (Brace 2004). Dillman (2007) links the
research objectives of reducing non-response and avoiding measurement error to
appropriate questionnaire design. It has been shown that a respondent-friendly
questionnaire design can provide increases in response rates (Dillman, Sinclair &
Clark 1993). This point is supported by Tourangeau, Rips and Rasinski (2000) who
suggest that the presentation of the questionnaire is one of the most important
variables affecting the response process.

117
Within the survey method literature there have been many contributions providing
some guidance on how to construct an effective questionnaire in order to achieve
appropriate responses (Bradburn & Sudman 1979; Sudman & Bradburn 1982;
Converse & Presser 1986; Dillman, 2007; Oppenheim 2001). Despite all this relevant
research concerning the impact of questionnaire design on response effects, there is no
definitive theoretical framework available to structure this knowledge (Ganassali
2008). However, there is still substantial guidance within the existing literature to
assist the researcher in maximising reliability, validity and efficiency within the
questionnaire design. The following discussion will focus on relevant design issues
such as questionnaire layout, question content, question format, response format, and
the order of questions.
4.5.2.1 Questionnaire Layout
For web-based questionnaires the author has to ensure that the layout on each screen
is easy to read, with sufficient space and clear information about navigation. The
questionnaire was administered on ‘Survey Monkey’ software. The software
facilitates the construction of a web-based survey using the various question types
considered necessary. The software also allows for the incorporation of an
introductory section that includes all the instructions on how to navigate through the
survey. In the instructions, the confidential nature of the survey was emphasised and
an assurance that all responses would remain anonymous was provided. An invitation
letter was included as part of the email and did not form part of the questionnaire
(refer to section 4.5.3.8 for more detail). When developing the questionnaire layout
the following factors were considered: appearance, length, instructions and the logical
flow of questions.
Appearance
The appearance of the questionnaire was guided by the survey monkey software.
Different options were provided on background colour, character font size and style.
118
A decision was made to adopt a light blue background colour as it accentuated the
information in a way that improved readability.
Length
There is a general belief that long questionnaires should be avoided. The reasoning is
that a long questionnaire will increase the burden on respondents and they will,
therefore, be reluctant to participate. For traditional paper-based mail-out surveys,
Dillman (2007) suggests that to obtain high response rates the questionnaire must be
perceived by the respondent as easy and fast to complete and visually appealing and
interesting. However, on the available evidence this assertion has little empirical
support (Yu & Cooper 1983; Bogen 1996) The findings on web-based surveys
produce no evidence that long questionnaires reduce response rates (Galesic 2002;
Archer 2007; Ganassali 2008). It is difficult to disentangle the impact of questionnaire
length from others factors such as the topic area, mode of administration, sample type
and format (DeVaus 2002), although continued support for the notion that shorter
questionnaires will increase response rates is still well supported in the research
literature (Bryman 2004). With this in mind a decision was made to keep the
questionnaire as short as possible while not compromising the research objectives.
Instructions
The instructions for completion of the questionnaire were divided into four parts, as
follows: general instructions; section instructions; question instructions; and, ‘go to’
instructions. In the initial phase of testing it was shown that these instructions were
clear, unambiguous and easily readable. The general instructions in the introduction
provided guidance on how to navigate through the electronic questionnaire. The
section instructions were designed to provide an introduction to and information about
the topic area and question instructions were included below the section instructions.
For example, ‘please click the appropriate box’ was a commonly used instruction
throughout the questionnaire. This process was further simplified by the use of closed-

119
end questions. ‘Go to’ instructions were also used and the respondents were
automatically directed to relevant sections after completing filter questions.
Vertical Flow
The flow of questions should follow a logical path commencing with general
questions and moving to the more detailed questions (Thomas 2004). In order that the
vertical flow of the questionnaire was not compromised, question items were
categorised by topic and response format in each section of the questionnaire. This
design ensured that the questions followed a logical flow that allowed the
questionnaire to be presented in a logical, vertical format. The background and
demographic questions were introduced first and followed by five parts dealing with
respectively: educational seminars; website information; written communications;
financial counselling; and other education.
With web-based surveys the vertical flow of the questionnaire is governed by screens
that appear in front of the respondent. The respondent is directed to each page of the
questionnaire by clicking the ‘next’ button on the bottom of each screen. The vertical
flow was enhanced by the use of filter questions that automatically directed
respondents to parts of the questionnaire that they were qualified to answer. This
allowed respondents to avoid certain sections without any disruption to the flow of the
questioning. Response boxes were vertically aligned and rating scales were presented
in a vertical aligned grid format. This allowed for a pattern of questioning that was
easy to follow and answer, and consistent.
4.5.2.2 Question Content
It has been shown that considerable attention should be given to developing clear,
unambiguous and useful questions (De Vaus 2002). In order to achieve this aim the
wording of questions is of fundamental importance. An essential component of
reliability and validity of survey results depends on how the questions are expressed
to the respondents. To be effective survey questions need to possess the following

120
three attributes: focus, brevity, and simplicity (Alreck & Settle 1985). Accordingly,
each question was designed to focus directly on a specific issue or topic, and
questions were brief and clear. These issues were addressed during the peer review
and pilot testing stages of the research. The language used in the questionnaire was
kept simple and familiar and unambiguous terms and double-barrelled and leading
questions were avoided.
4.5.2.3 Response Format
Another aspect of question construction is to decide on the response format. The
response format deals with how the answers are collected from the respondent.
Questions can be formatted as either open-ended (unstructured) or closed-ended
(structured). The issue relating to both open-ended and closed-ended questions in
survey questionnaires is well documented in the literature (see Sudman & Bradburn
1974; Schuman & Presser 1979; Schuman & Scott 1987; Bradburn, Sudman &
Wansink 2004; Weisberg 2005; Fink 2006).
Open-ended Format
With open-ended questions, the respondent is asked to provide their own answer to
the question. This type of question is commonly used for in-depth, qualitative
interviewing (Babbie 2008). This method of questioning allows the respondent to
answer in their own terms rather than picking an answer from a set of provided
alternatives. Under this format it is possible to generate unexpected responses,
allowing the researcher to gain a better appreciation of the respondent’s knowledge in
an area as little guidance is provided in the question. This format is also useful when
exploring new areas or where the researcher has limited knowledge. Open-ended
questions can also be used to gain information so as to generate fixed-choice format
questions.
Open-ended questions can present some problems for the researcher, as they require
greater effort from respondents when completing the questions. It is, therefore, argued
121
that open-ended questions have limited utility when used in the context of self-
administered questionnaires (De Vaus 2002). Responses are also very difficult to
code. The coding process entails reading through answers and then deriving themes
that can be used as the basis of coding.
Closed-ended Format
Closed-ended questions ask a question and then list the alternative answers from
which the respondent may choose. This approach requires the researcher to develop
alternative answers to each question. The participants may be required to provide
dichotomous answers such as male/female, or to select from multiple-choice options,
or to provide ranking scale response options.
It is argued that experienced researchers prefer the closed-ended approach whenever it
is feasible because it has a number of advantages (Alreck & Settle 1985) including
that it is easier to code and process answers from closed-ended questions. When these
structured items are used, the data are comparable among respondents. Therefore,
statistical data can be produced that allow for comparisons and contrasts to be made
on the answers provided by various individuals or sub-groups. The set of responses in
closed-ended questions may clarify the intended meaning of a question. Furthermore,
this question format does not discriminate against the less articulate respondents as it
allows questions to be answered without the need to write a response. A problem with
closed-ended questioning is that it may result in misleading information if an
inefficient range of alternative answers is provided. Another limitation of this format
is that it does not allow respondents to add any further information to their answers.
Therefore, the choice of open-ended or closed-ended questions depends on a number
of factors such as question content, method of administration, and availability of time.
Mail-out surveys are said to require almost exclusive use of closed-ended questions
(Hsu & Powers 2001; Bourque & Fielder 2003). Closed-ended questions are said to
be popular in survey research because they provide uniform responses that are more
easily processed than open-ended questions (Babbie 2008). It is suggested that
researchers should avoid the use of open-ended questions in mail questionnaires as

122
they are difficult to answer, code and analyse (Bourque & Fielder 2003). With this in
mind, it was considered appropriate to use closed-ended questions in the
questionnaire.
4.5.2.4 Question Format
The way that questions within a questionnaire are framed will influence the level of
measurement of a variable and how the data are subsequently analysed. The responses
received from the questions will yield data that are at an interval, ordinal, and nominal
level. Interval-level variables are ranked-ordered categories that are separated by
numerically equal distances. However, it is not always possible to use interval-level
variables as information may need to be collected using ordinal-level data where
categories can be ranked, but with no meaningful numeric interval between
categories. Nominal level variables have categories that cannot be rank ordered.
Generally, data that are measured at the interval level allows the use of more powerful
statistical techniques in the data analysis.
Rating scales were used in the questionnaire to allow for the measurement of the level
of agreement (attitude), evaluation and frequency. Agreement scales ask respondents
to indicate the extent to which they agree with a questionnaire item. Evaluation scales
require an evaluative rating of each item, and frequency asks for a judgement of how
many times something has happened. The process began with a clearly defined
construct which guided the subsequent scale development. Once developed, the scales
were used to measure respondents’ attitudes, evaluation and frequency of use of the
superannuation educational information provided to them by the superannuation fund.
Likert scales were chosen as an appropriate rating scale to measure respondents’
attitudes to financial education. Likert scales are popular with researchers because of
the power and simplicity of the format (Alreck & Settle 1985). These scales are used
to measure the extremity, intensity and direction of opinions. The Likert scale was
deemed appropriate as it facilitates the quantifiable measurement of an attitude and is
often used in multiple-item measures of attitude (Spector 1992). With this type of
scale, statements are provided and the respondents are asked to indicate the extent to

123
which they ‘agree’ or ‘disagree’ with the statement. The statements were organised as
a set of questions in a grid format. It is common for researchers to use the five-point
scale (see Proctor 1995; Bouma & Ling 2004; Babbie, 2008). Kervin (1992) suggests
that there is no point in utilising a large number of response categories for intensity
scales as respondents have difficulty in distinguishing a position in a scale with more
than six or seven ordered category descriptions. On this basis, a five-point scale was
used with the extreme alternatives set as ‘strongly disagree’ and ‘strongly agree’ and
centre neutral positions of ‘neither agree/or disagree’.
The Likert scale presents a number of advantages in that it provides a flexible
framework where item lines can consist of a few words or longer statements if
required. Depending on the characteristics of the population, the item wording can be
technical and sophisticated or more simple or rudimentary where respondents are then
able to complete the items very quickly and easily. The scale can be constructed
relatively quickly and easily and responses can be collected in a standardised format
from large samples. However, on the negative side respondents may intentionally or
unintentionally provide a dishonest response. They may also answer according to
what they feel is expected of them as participants. It can also take a substantial
amount of time to analyse the data collected from the participants.
Intensity scales were used to determine the importance placed by respondents on each
educational resource that was provided by the superannuation fund. These scales
were also used to rate the level of importance respondents placed on web-based
educational items provided to them by the superannuation fund. Evaluation scales
were used to determine the importance of other educational information resources not
provided by the superannuation fund. Frequency scales were used to determine how
often respondents accessed each educational resource provided by the superannuation
fund. These scales are similar to the Likert scale, but rather than measuring a
respondent’s strength of agreement to a statement, the frequency scale indicates how
often an action has been taken. The use of these scales was limited to four items in the
questionnaire. This (four item) question was targeted to those who indicated that they
had previously used a component of the superannuation fund provided education. The
scale contained four points and included the following rating items: ‘rarely’,

124
‘sometimes’, ‘often’, and ‘very often’. A ‘never’ category was unnecessary and
irrelevant to these respondents.
A multiple-choice format was used to gather background and demographic data. The
multiple-choice questions required a single response to each question. Using this
approach information was collected on gender, age, education, experience and
education in finance and investment and the dollar amount of wealth held within an
individual’s superannuation fund.
4.5.2.5 Order of Questions
It is suggested that the order in which the questionnaire items are presented can
impact on responses (Babbie 2008). It is usual to start with questions that respondents
will enjoy answering. These questions should be factual and easy to answer and
should set the stage for the kinds of questions that may follow. That is, these
questions must be relevant to the stated purpose of the survey. Alreck and Settle
(1985) recommend creating questionnaire sections that group items on the following
criteria: the items all relate to the same topic; the items contain similar content; the
items require the same scaling technique; and grouping by multiple criteria. Alreck
and Settle (1985) argue that this approach produces a logical sequence and a high
level of time and space economy.
The multiple criteria approach was adopted in this study as a guide to the sequencing
of questions and six category sections were developed. The first section was focused
on demographic and background information. It is usually recommended that any
demographic questions be left until the last section of the questionnaire (Thomas
2004; Bradburn, Sudman & Wansink 2004; Babbie 2008). However, as the
demographic and background questions were non-threatening and easy to answer it
was considered appropriate to place these in the first section.
The next four sections contained questions on the educational resources provided and
sponsored by the superannuation fund (educational seminar, superannuation fund

125
website, written communications and financial counsellor). In each of the four
sections filter questions were used to determine whether or not a particular resource of
education was used by the respondent. Both users and non-users were automatically
directed to different sections of the questionnaire where they were then directed to
answer a series of questions using intensity scales arranged in a grid format.
Therefore, each section contained questions that required the same scaling technique
and all questions related to the same topic. This structure allowed for one set of
instructions and one scale type to serve most of the questioning.
The final section of the questionnaire contained questions in which respondents were
asked to rate the importance of other information resources for their superannuation
education needs. This section contained four questions with a single set of instructions
to guide respondents. The final question asked respondents to indicate the dollar
balance they had in their superannuation fund. This question was considered to be the
most sensitive and, therefore, it was placed at the end of the questionnaire.
4.5.3 Phase III: Writing the Questionnaire
After careful consideration of all the issues discussed in the previous sections of this
chapter, the questionnaire was written in a way so as to gather all the required data in
a format that could address the research objectives. The questionnaire was designed
and written so that it could be completed in a short period by respondents and so that
data could be collected efficiently. It is important that the data are collected in a
format that enhances further quantitative analysis. To facilitate this, the survey was
initially written on a word processing document and then transferred on to an
electronic web-page. The electronic version of the survey can be viewed in Appendix
One. As mentioned previously in this chapter, survey monkey software was used to
write the electronic questionnaire.
126
4.5.3.1 The Educational Seminar Questions
This section focused on educational seminars delivered by representatives of the
Unisuper superannuation fund. The first question determined whether the respondent
had attended a seminar. Those who indicated they attended were then directed to a
section where they were given 11 statements relating to the seminar and were asked to
indicate the extent to which they agreed or disagreed with each statement. They were
also asked to rank the importance of the seminar to their educational needs and to
indicate how often they attended these seminars. Those who indicated they did not
attend a seminar were directed to another section, provided with nine statements as
possible explanations for why they did not attend, and asked to indicate the extent to
which they agreed or disagreed with each statement.
4.5.3.2 The Superannuation Fund Sponsored Website Questions
This section focused on the superannuation fund website. The first question
determined whether the respondent had accessed the website. Those who indicated
that they had accessed the site were directed to a section where they were given 12
statements relating to the website and were asked to indicate the extent to which they
agreed or disagreed with each statement. They were also asked to rank the importance
of the website to their educational needs and to indicate how often they accessed the
website. They were also given a further seven statements on website items and asked
to indicate the importance of these items for their educational requirements. Those
who indicated that they did not access the website were directed to another section
where they were provided with seven statements as possible explanations for why
they did not access the site, and asked to indicate the extent to which they agreed or
disagreed with each statement.
4.5.3.3 The Written Communications Questions
This section focused on the written communications mailed by the superannuation
fund. The first question determined whether the respondent had read these

127
communications. Those who indicated that they had read them were directed to a
section where they were given nine statements relating to the written communications
and were asked to indicate the extent to which they agreed or disagreed with each
statement. They were also asked to rank the importance of the written
communications to their educational requirements and to indicate how often they read
these communications. Those who indicated they did not attend a seminar were
directed to another section where they were provided with seven statements as
possible explanations for why they did not read the communications, and asked to
indicate the extent to which they agreed or disagreed with each statement.
4.5.3.4 The Financial Counsellor Questions
This section focused on the financial counselling service sponsored by the
superannuation fund. The first question determined whether the respondent had
obtained advice from the superannuation-fund-provided counsellor. Those who
indicated that they received advice were directed to a section where they were given
nine statements relating to the financial counselling and were asked to indicate the
extent to which they agreed or disagreed with each statement. They were also asked to
rank the importance of the financial counselling to their educational requirements and
to indicate how often they accessed a financial counsellor. Those who indicated that
they never accessed the financial counsellor were directed to another section where
they were provided with ten statements as possible explanations for why they did not
access the financial counsellor, and asked to indicate the extent to which they agreed
or disagreed with each statement.
4.5.3.5 The Importance of Other Sources of Education Questions
This question provided respondents with five other education resources as follows:
newspaper publications; financial magazines; radio/television; personal financial
adviser/planner; and friends /colleagues. The respondents were then asked to rate the
importance or each of these resources for their superannuation educational
requirements.
128
4.5.3.6 The Demographic (Background) Questions
Most questionnaires include demographic questions. Demographic questions are
placed in questionnaires to determine the profile of the respondents and how closely
the sample resembles the population. They are also used to divide the sample into sub-
groups (age, gender, education, employment area and employment history and
education in financial matters) to determine the impact of demographics on responses
to the other questions.
The first section of the questionnaire consisted of eight questions which focused
mainly on the respondent’s characteristics. The first three questions identified the
respondent’s gender, age and education. These factors had been found in the literature
review to have an influence on an individual’s superannuation decision making.
Questions four and five were used to determine whether the respondent had an
employment history or formal educational training in finance, investment analysis,
sharemarket investing or financial planning. These questions categorise the
respondents into two groups: one group having acquired financial knowledge through
education or employment; with a potentially less knowledgeable second group.
Question six required respondents to rate their knowledge of financial and investment
matters. This question allows an understanding of the self-perceived financial
knowledge of the respondents. In question seven, participants were asked to rate their
attitude towards investment risk. The final question was included to identify the
respondent’s area of employment as in the literature review employment was
identified as a factor influencing investment superannuation savings. The most
sensitive question was included as the last item on the questionnaire. In this question
respondents were asked to approximate the most recent dollar balance in their
superannuation account. The literature suggests that the amount in an individual’s
superannuation savings account will influence how active they will be in their
superannuation investment decision making. The inclusion of these demographic
questions allows for useful cross-sections of the questionnaire to be developed from
the various respondent demographic and background categories. This information can
be statistically tested to detect any significant relationship between a respondent’s
answers to a particular question with their demographic characteristics.
129
4.5.3.7 Pilot Test
Testing the questionnaire (piloting) before the final distribution is an essential
precaution in ensuring that questions are addressing the issues they are designed to
address. Piloting the questionnaire is therefore an integral part of the survey process.
Questionnaires have to be composed and tested, improved and then administered
(Oppenheim 2001). The two key tests for a questionnaire are reliability and validity
(Brace 2004). In addition, the questionnaire must also be tested to ensure that it
contains no errors.
The developed questionnaire was given to selected, knowledgeable staff within the
Faculty of Business and Law at Victoria University, Melbourne, Australia with a
written brief to evaluate certain aspects of the questionnaire. Some staff were asked to
comment on the layout and sequencing of questions, and whether the wording within
the questions was appropriate and easily understood. Feedback from this process led
to some minor changes in the layout of the questionnaire and the wording of
questions, and to the inclusion of four additional questions. These four questions were
added to acquire further information as to the level of importance the respondent’s
placed on each educational resource that they utilised. The questionnaire was also
given to staff with strong statistical skills and experience in the social sciences who
were asked to determine whether the selected statistical techniques could be
conducted from the format in which the data were captured. This test provided
confirmation that data collected from the questionnaire would be stored in an
appropriate format for relevant statistical testing. After completing this process the
survey was transferred into an electronic format and tested to ensure that it flowed in
the intended sequence. Several academic colleagues, who were familiar with
electronic surveys, assisted by completing the questionnaire. They confirmed that it
flowed as intended with no confusion. A few minor navigational instructions were
added to perfect the instrument.
The survey was then piloted at one university to a group of academic and non-
academic staff resembling the sample. An email was sent on 25 February 2008 with
an information sheet inviting recipients to participate in the survey. To encourage
feedback a reminder email was sent on 4 March 2008. The electronic version of the

130
survey was used and the feedback identified that it was working as intended. After
careful analysis and some verbal feedback only a few minor changes were made to
correct some spelling errors. The structure of the main sections of the survey was
otherwise retained in their original format.
4.5.3.8 Administration of the Survey
The administrative methods emloyed to stimulate the response rate are the covering
letter accompanying the questionnaire, follow-up efforts, sponsorship, and the
statement of confidentiality.
Cover Letter
The email cover letter is a factor that has been found to assist in increasing response
rates (Solomon 2001). It is suggested that deployment characteristics such as email
invitation are more critical to gaining a higher response rate than the presentation of
the questionnaire (Archer 2007). Manfreda and Vehovar (2002) found that almost all
potential respondents who accessed the first page of a web-based questionnaire either
completed or partially completed the questions. Therefore, getting the respondents to
proceed beyond the initial email letter can greatly improve response rates. The
literature provides guidance as to what should be included in the cover letter (Dillman
2007; De Vaus 2002). More specifically, Czaja and Blair (2005) suggest that the letter
should state the following: the purpose of the survey; the sponsor or collector of the
data; who should complete the questionnaire; why a response is important; the
importance of the research; an assurance of anonymity and confidentiality; and, when
to return the questionnaire.
The first email invitation was sent on 5 April 2008 to the sample population of 6000
with a hyperlink providing direct access to the survey for those who chose to respond
to the questionnaire. The email made it clear that responses were only sought from
those who belong to the university superannuation defined contribution fund and that
recipients should not complete the survey if they had a defined benefit plan or a plan
outside the university sector fund. Contact details were included for the researcher and
131
principal doctoral supervisor as well as the Human Research Ethics Committee
Network at the University of Tasmania. A University of Tasmania logo incorporating
the names of both the Faculty of Business and School of Accounting and Corporate
Governance was attached to the top of the email. The email contained all the
necessary ethical information regarding the survey and provided an assurance that
responses would be handled in complete confidentiality and that anonymity was
assured. It was also stated that ethical approval had been received for the study (refer
to Appendix Two for the details of the email invitation and information sheet).
Follow-up Efforts
One of the techniques used to increase response rates is the use of multiple contacts
with the potential respondents. Research in survey methods has shown that the most
important influence on response rates is the number of attempts made to contact the
sample population (Herberlein & Baumgartner 1978: Goyder 1982). This technique is
widely recommended and is considered a standard component of the methodology for
a survey (Porter 2004). Two meta-analyses studies found that persistence of the
contacts was a dominant factor affecting response rates in web surveys (Cook, Heath
& Thompson 2000; Manfreda & Vehovar 2002). It is argued that increasing the time
that the questionnaire is left open, with two reminders, may also significantly increase
response rates (Archer 2007).
Guided by the research a decision was made to send two reminder emails and to allow
approximately two weeks between reminders. The first reminder email and
information sheet was sent on 11 April 2008. A new web browser (collector) was
established and was included in the email. This new web browser allowed for the
differentiation of the initial replies from those received after the reminder was sent.
This email had an immediate impact and a substantial number of responses were
collected in the subsequent two-day period. A third and final email with a final
reminder message was sent on 24 April 2008. Once again a new web browser
(collector) was established and incorporated into the email in order to differentiate
late responders. The email again provided the same instructions and information sheet
132
and advised that the survey would close on 15 May 2008. Again, a substantial
response followed in the subsequent two-day period.
Sponsorship
Research shows that, generally, surveys sponsored by governmental or academic
organisations achieve higher response rates than those conducted by commercial
businesses (Porter 2004). Meta-analyses indicate that this difference can be in the
range of nine to 14 percentage points (Goyder 1982; Fox, Crask & Kim 1988). An
official electronic logo from the University of Tasmania was placed on the initial
contact email as mentioned previously, the logo identified the University of Tasmania,
the Faculty of Business and the School of Accounting and Corporate Governance. It
was revealed in the email that the study formed part of a Doctor of Philosophy degree
being undertaken at the University of Tasmania.
Statement of Confidentiality and Ethical Considerations
De Vaus (2002) identifies voluntary participation, informed consent, no harm,
confidentiality and anonymity, and privacy as five ethical responsibilities towards
survey participants. The study was considered minimal risk under the guidelines of
the Human Research Ethics Committee (Tasmania) Network. A minimal risk ethics
application was approved on 10 January 2008 (refer to Appendix Three for the letter
of approval). A risk assessment in the human research ethics application document
provided assurance that no ethical issues were present that could potentially lead to
discomfort or distress to the respondents and that the questions within the study posed
no harm to the respondents.
It is argued that a statement of confidentiality should be included with a survey to
encourage truthful responses and increase response rates (Dillman, Singer, Clark, &
Treat 1996; Singer, von Thurn, & Miller 1995). Porter (2004, p. 14) suggests that:

133
Providing an assurance of confidentiality to the respondent may lower the perceived
cost of their response being made public and should also foster a sense of trust…
In the study respondents were electronically mailed an invitation to participate and an
explanation of the survey together with a web browser where the questionnaire could
be located and completed. An information sheet was prepared and sent with the email.
It was emphasised within the information sheet that participation was voluntary and
that all individual responses would remain anonymous and that respondents’
confidentiality and privacy would be assured. The survey was structured in a way that
individual responses could not be identified. All electronic responses went to a central
database and no identifiable features were attached to any responses. An offer was
also made to answer any questions and both the principal supervisor’s and the
researcher’s contact details were provided. Following De Vaus (2002), it was
considered that completion and return of a questionnaire demonstrated informed
consent.
4.5.4 Phase IV: Selecting the Sample
One of the tasks in survey research is to identify the research population. The
population represents the total units from which the sample is selected. The sample
frame is a list of all the units from the population from which the sample is chosen.
The sample is a segment of the population chosen for investigation, and is often
derived from the sampling frame as it is not always possible or practical to involve the
entire population. For a sample to be representative, it must exhibit aggregate
characteristics that closely approximate those in the population (Babbie 2008). To
obtain a sample for this study the following issues were considered and procedures
undertaken: defining the population and sample frame; selecting the sample;
determining the sample size; implication of sampling errors and bias; and non-
response bias.
134
4.5.4.1 Defining the Population and Sample Frame
The first research task was the identification of the population. The population that is
relevant to this study is all superannuation defined contribution fund members. The
sample frame chosen for this study is Unisuper defined contribution fund members.
Under the current university-wide industry fund, university staff can belong to a
defined benefit superannuation plan or a defined contribution fund plan. They also
have the choice to move to other superannuation plans outside the university sector
fund. Statistics derived from the university sector superannuation fund reveal that
approximately 25 percent of members belong to the defined contribution fund and
around 75 percent have a defined benefit plan.
4.5.4.2 Selecting the Sample
Non-probability and probability sampling are the two broad types of sampling
methods referred to in the literature. Probability samples are considered more
representative when developing sample frames. That is, probability sampling ensures
that all the members of a population have an equal chance of being included in the
sample (DeVaus 2002). A non-probability sample is defined as “any technique in
which samples are selected in some way not suggested by probability theory” (Babbie
2008, p. 203).
In this study a non-probability sampling approach was adopted to meet the
requirements of the research. A non-probability sampling approach was adopted as it
was impractical to generate a probability sample. To generate a random sample the
co-operation of the superannuation fund management is required and several attempts
to gain their assistance were not successful. Efforts made to gain the fund manager’s
co-operation commenced with an initial telephone call to the Chief Executive
Officer’s (CEO’s) office followed by a detailed email explaining the purpose of the
research. A telephone conversation with the CEO resulted from the email and a more
detailed submission was made on the CEO’s recommendation. The submission
included the draft survey instrument and a detailed summary of the study together
with a supporting reference from the doctoral principal supervisor. After several

135
weeks the CEO responded by email denying access to the data base of members. As
access to the population was denied, and with limited time to establish further contact
with another fund, a purposive (judgement) sampling technique which is considered a
form of non-probability sampling, was adopted. This method uses judgement in
obtaining a representative sample through the inclusion of typical groups in the
sample (Kerlinger 1986), and proceeds on the basis of judgement.
The sample was chosen from 26 universities identified in Appendix Four and included
a cross-section of university staff. Particular effort was made to ensure that these
universities represented various geographical locations across Australia. More
specifically, steps were taken to ensure that rural and city-based university campuses
were included in the sample: this ensured geographical diversification. The sample
was then derived from the 26 chosen universities. Systematically, different
departments and faculties within each university were chosen to obtain a mix of
academic and non-academic university staff in the sample. Particular effort was made
to ensure the profiles of university staff included in the sample were representative.
That is, the sample was chosen from academics and non-academics. The non-
academics included staff from administration, library services, human resources,
information technology, finance and accounting, and building and grounds (Refer to
Appendix Four for more detailed information).
4.5.4.3 Sample Size
With non-probability samples no statistical inferences exist by estimating a sample
size as it is not possible to determine the probability of any particular participant
being selected for the sample (Ritter & Sue 2007). It is suggested that increases in
sample size reduce the non-representativeness associated with the use of judgement in
generating the sample (Kervin 1992). It is shown that sample sizes beyond 350
produce estimates of population mean and correlation that have less fluctuation and
more stability (Kervin 1992). Perry (1995) argues that as a rough rule of thumb,
doctoral quantitative research requires at least 350 respondents. Other guidelines that
have been suggested for determining a suitable sample size for non-probability
samples include samples of somewhere between 30 and 500 (Hill 1998) or 10% of the

136
parent population (Alreck & Settle 1985). Somekh and Lewin (2005) report that in
surveys, the sample should be sufficiently large so that any major sub-groups contain
at least 100 cases and minor sub-groups contain between 20 and 50.
It was decided to choose a sample of 6000 university staff to ensure that an adequate
sample of accumulation fund members was reached. However, only 25 percent of the
6000 sample would, statistically, belong to the defined contribution fund. Accordingly
it was expected that approximately 1500 (25% x 6000) of the sample would belong to
the university sector defined contribution fund. That is, one of every four surveys
sent would be received by a defined contribution fund member. From a potential
sample of 1500 it was considered that a sufficient number of responses would be
generated to produce appropriate quantitative analysis.
4.5.4.4 Implications for Sampling Errors and Bias
Sampling errors result from selecting a sample that is not representative of the
population as a whole. In a probability sample, it is possible to calculate a sampling
error. However, in non-probability sampling statistical means of estimating sampling
errors cannot be used. It is said that statistical estimates are valid only for samples
where every member of the population has an equal chance of selection (Sapsford
2007). It is argued that if the particulars of the sampling are made clear, then the
reader is in a position to make a judgement as to the extent to which the statistics are
relevant to the population (Sapsford 2007). This point is further reinforced by
Schofield (1996, pp. 99-100) who suggests that:
In preventing standard errors in circumstances such as this, researchers are in effect
saying: O.K, I know I haven’t got a random sample and so can’t estimate sampling
error. But this is the best I could do. It could be the case that it hasn’t mattered very
much, and thus I have calculated the standard errors and have used them in further
tests. My finding has support from the literature and looks useful. It’s up to you, dear
reader, to decide how much reliance you will place on it. Perhaps you’ll think that the
result is important and will be able to replicate it without the sampling difficulties
which I have had and have reported.

137
The availability of systematic forms of non-probability sampling, such as purposive
sampling, may not meet the statistical requirements of probability sampling, but may
nevertheless deliver robust samples (Jensen & Jensen 2002). The purposive sampling
method was adopted in this study to produce a judgement sample that is a fair (close)
representation of the Unisuper membership within the defined contribution fund. This
should be regarded as one limitation of the data where sampling error cannot be
strictly (theoretically) calculated from a non-probability sample. Statistical inferences
have been drawn from the analysis of the data and conclusions and recommendations
follow. However, only tentative generalisations can be made from data collected
from such a purposive sample.
4.5.4.5 Non-response Bias
The aim of survey research is to achieve an acceptable number of responses from the
chosen sample. This is rarely achieved in either mail or web-based surveys. The
problem then arises as to whether or not the responses received are in some way
different from those where there was no response. Non-response arises as a result of
the sample not being contactable, or simply refusing to take part in the survey
(Sapsford 2007): it may also result from unusable questionnaires. Non-response is
considered a problematic and important source of survey error (Fowler 2008). The
existence of non-response means that it may not be possible to assume that the
responses received are representative of the sample. To combat the impact of non-
response bias researchers should endeavour to maximise the response rate (Fowler
2008). The techniques used to maximise response rate in this study have been
discussed in Section 4.5.3.8.
4.5.5 Phase V: Measurement Issues
A major concern in the development of research methods is to ensure validity and
reliability of research data. A vital consideration in survey construction is the level of
reliability and validity of the responses that are obtained from the survey. It is said
that “reliability and validity are the two main psychometric characteristics of

138
measuring instruments” (Punch 2005, p. 98). When social researchers construct and
evaluate measurements they pay particular attention to validity and reliability. When
developing measurement scales there is a need to build reliability and validity
analyses into the pilot procedures (De Marrais & Lapan 2004). Therefore, a good
measurement technique should be both valid and reliable.
4.5.5.1 Validity
In this study, beyond defining constructs and developing scales, it was also necessary
to ensure that the scales used actually measured the concept being considered. A
survey is said to be valid only to the point that it measures what it is supposed to
measure. Punch (2005) argued that validity means whether the data collected
represent what we think they represent and the responses really measure the variables
that we think they measure. According to the Standards for Educational Standards and
Psychological Testing (The American Psychological Association 1985, p. 9), validity
is “the most important consideration in test evaluation”, and that validity deals with
the meaning of inferences drawn from test scores. Wright and Stone (1999, p. 167)
state that these “…standards emphasise that it is inferences that are validated and not
the test”. However, validation is seen as a difficult exercise when developing
measurement scales. Spector (1992, p. 46) describes the validation process as follows:
Validation of a scale is like the testing of a theory, in that its appropriateness cannot
be proven. Instead, evidence is collected to either support or refute validity. When a
sufficient amount of data supporting validity is amassed, the scale is (tentatively)
declared to be construct valid.
Internal validity refers to a characteristic of a study’s design. Writers on measurement
of internal validity usually distinguish between four different types, namely, face
validity, content validity, construct validity, and criterion-related validity (see Babbie
2008; Kervin 1992). It is suggested that confusion may surround the meaning of
validity as each type differs in meaning and method (Wright & Stone 1999). These
four types of validity are also described as not “…entirely satisfactory but…the best
we have” (De Vaus 2002, p. 53). With these validation concerns in mind, careful

139
efforts were taken, which are addressed in the next sections, to maximise the validity
of the questionnaire. The different types of validity and how these validity concerns
were addressed are now outlined in the context of this study.
Face Validity
A measure is said to have face validity if it appears that it is going to measure what it
is supposed to measure. Face validity can be established by asking relevant others
whether they believe the measures used in the test seem to cover the concept that is
the focus of the study. Bryman (2004, p. 73) describes face validity as an
“…essentially intuitive process”. It is therefore suggested that it is a subjective
validity measure as it only concerns whether a scale or index makes sense to an
outside observer (Yang & Miller 2007). In this study the questionnaire was provided
to a panel of colleagues who were asked to indicate whether or not they believed the
concept was captured in the items of the questionnaire. These colleagues had previous
experience in both designing and completing questionnaires in the social sciences.
They were also members of the superannuation fund which was the subject of the
investigation and were, therefore, familiar with the aspects of education provided by
the superannuation fund. Their feedback confirmed face validity of the instrument.
Content Validity
Content validity refers to the degree to which the sample of test items represents the
content that the test is designed to measure (Abrami, Cholmsky & Gordon 2001). That
is, do the measures used in the test adequately cover the defined construct of the
study. Therefore, content validity will ultimately depend on how we have defined the
concept that it is designed to test (De Vaus 2002). The concept was defined in the
literature review in Chapter Three and test items were developed to measure the
relevant aspects of superannuation fund sponsored financial education. The approach
of distributing the survey questions to colleagues that were members of the
superannuation fund was also aimed at confirming content validity. The sample of
superannuation fund members was authoritatively placed to assess whether the

140
constructs, as defined, were captured in the questionnaire. Content validation was also
reviewed during the pilot testing of the questionnaire (see section 4.5.3.7). Feedback
from these validation procedures instigated only minor modifications to the
questionnaire.
Construct Validity
Construct validity is concerned with the capacity of the measure to work well within
the theoretical demands of the researcher’s model (Sirkin 1995). Consequently, the
establishment of construct validity is said to be theory-driven (Yang & Miller, 2007).
Carmines and Zeller (1979, p. 23) suggested the following three steps in order to
establish construct validity: (1) specify the theoretical relationship between the
measured concepts; (2) examine the empirical relationships between the measures of
concepts; and (3) interpret the empirical evidence and demonstrate the extent to which
the theoretical relationship between the concepts is demonstrated by the measures.
These procedures are documented in Chapter Three where the theoretical concepts
were developed and their theoretical relationships established. For example, a
comprehensive OECD definition of financial education was adopted for the purpose
of this study (see Section 3.5). The forms of education that impact on an investor’s
decision-making were also identified in Chapter Three. Measurement scales were then
developed to answer the research questions developed in the literature review chapter.
Criterion-related Validity
Criterion validity refers to validating the measuring instrument against some form of
external criterion (Gliner & Morgan 2000). Criterion-related validity can be either
predictive or concurrent. Predictive validity is determined by the degree to which a
particular instrument can predict a future outcome. This requires not only
homogeneous groups for both studies, but also a substantial lapse in time so as to
repeat the test. Concurrent validity is determined by how closely an instrument
compares with a similar measure when completed simultaneously. Therefore, the key

141
to criterion validity is being able to find outside criteria that are measurable (Gliner &
Morgan 2000).
In the social sciences, criterion validation may create difficulties in situations where
no well established criteria exist to validate the new measures (De Vaus 2002; Babbie
2008). Further, criterion-related validity may not be applicable to all measurement
procedures in the social sciences, as not every abstract concept has an appropriate
criterion for assessing a measurement of it (Carmines & Zeller, 1979). As a new
measurement was used in this study, with no existing validated measurement, other
forms of validity were relied upon to establish the instrument.
External Validity
External validity refers to the extent to which the results of the research are
generalisable (Campbell & Stanley 1966). In this study, a purposive sampling method
(judgement sample) was adopted. The details relating to the selection of the sample
are contained in Section 4.5.4.2. Judgement drawn from knowledge of the university
sector was used to select the sample to be studied as this was the only practical way to
draw a sample. While it is not strictly possible to generalise from this sample to all
superannuation defined contribution fund members, it is likely that similar results
would be obtained from future similar studies within the superannuation industry.
4.5.5.2 Reliability
It was also critical that the measures adopted were reliable. Reliability is said to be of
particular importance when collecting data or using a survey instrument to gather data
(McMurray et al. 2004). If the measures are reliable we can depend on them.
Kerlinger (1986, p. 405) suggests the definition of reliability can be epitomised by
the question: “If we measure the same set of objects again and again with the same or
comparable measuring instrument, will we get the same or similar results?”. If we do,
our questions provide data with high reliability. Oppenheim (2001, p. 159) also
comments that “reliability means consistency”. Therefore, ideally, survey questions
142
will produce consistent responses. However, this will depend, in part, on whether the
questions can be answered consistently and straightforwardly, using the response
scales provided (Punch 2005). De Vaus (2002, p. 96) also warns that “ambiguous or
vague question wording may produce unreliable responses as respondents read the
question differently on different occasions”.
In contrast, reliability refers to problems in the accuracy of the measurement
instrument, whereas validity refers to the appropriateness of the measurement
instrument (Bouma & Ling 2004). A number of authors describe the difference
between reliability and validity using a bulls-eye target analogy (see Alreck & Settle
1985; Kerlinger 1986). These authors suggest that high validity means that questions
elicit responses that are close to or hit the bulls-eye, whereas reliable responses are
clustered in the same target area. Therefore, for responses to be both reliable and valid
they should all be clustered in close proximity of the bulls-eye. That is, the bulls-eye
represents the construct being measured and clustered responses signify a high level
of consistency in responses. It is, however, worth noting that a reliable measurement
is not necessarily a valid measurement: but, adequate reliability is a precondition to
validity (Oppenheim 2001).
The use of multiple questionnaire items to measure a single concept is a common
practice in the social sciences. Using multiple items to increase the internal reliability
of measurement is of particular importance when the concepts are difficult to measure
(Langbein & Felbinger 2006). The key to internal reliability is whether or not the
indicators that make up the scale are consistent. That is, do respondent’s scores on any
one indicator match closely to their scores on the other indicators? The stronger the
association is among the individual items and the more items there are that are
included, the higher the reliability index.
Cronbach’s alpha (Cronbach 1951) is the most commonly used type of coefficient for
establishing internal consistency reliability (see Sansone, Morf & Panter 2004);
Schutt, 2006; Leech, Barrett & Morgan. 2005). The Cronbach alpha is normally used
where several Likert-type items are summed to make a composite score. It is
calculated by correlating each item in the scale against every other item in the scale.
The Cronbach alpha is widely used, because it provides a measure of reliability that

143
can be obtained from a single administration of a questionnaire (Leech, Barrett &
Morgan 2005). The value of Cronbach’s alpha ranges between 0 and 1.0. The higher
the figure the more reliable is the scale. Some writers suggest that a Cronbach alpha
value of 0.80 or higher is a good indicator of reliability (Ruane 2004; Bryman & Bell
2007). Others have employed an alpha of 0.70 as a rule of thumb to indicate internal
reliability (DeVellis 2003; Nunally 1978; De Vaus 2002). Easterby-Smith, Thorpe
and Lowe (2002) claimed that for exploratory research reliability coefficients in the
order of 0.60 are acceptable. This identifies a variation in opinion on what researchers
believe is the most desirable alpha value to indicate internal reliability. The reliability
analysis scale (Cronbach Alpha) for data in the questionnaire is summarised in
Chapter Five, Section 5.3.
4.5.6 Phase VI: Determining the Results
When survey questionnaires are completed and returned, preparing them for analysis
is the next step. The mail-out survey usually needs to be pre-coded and the data
manually transferred on to a database. A web-based survey eliminates the need to
code a questionnaire, as it allows for immediate data collection into a database, thus
avoiding transcription errors and data processing time (Wright, 2005; Phelps, Fisher,
& Ellis 2007; Jansen, Spink & Taksa 2008). In this study all the results were returned
electronically to a database for immediate access. The data were numerically coded
and transferred on to an Excel spreadsheet where a number was assigned to each
response. As an example, single digit numbers were used for the rating scale
responses as follows: The number ‘1’ was assigned to ‘strongly disagree’ and the
number five to ‘strongly agree’ all the responses in between these two points were
coded ‘2’ for ‘disagree, ‘3’ for ‘neither agree or disagree’ and ‘4’ for ‘agree’. This
coding procedure was applied for all response formats throughout the questionnaire.
The analysis of the data is discussed in the next chapter.
144
4.6 Summary
In this chapter the research approach adopted in this study has been explained. The
chapter commenced with a review of the major objective of the project which is to
evaluate a financial education model to determine whether it provides superannuation
defined contribution fund members with the required educational resources to assist
them in making informed investment decisions regarding their superannuation funds.
In developing the research method, consideration was given to the main
superannuation fund provided educational resources that are available to members in
the Unisuper fund.
Next, relevant research paradigms were reviewed so as to develop a theoretical
position for the research. The common approaches to research methodology in the
literature were then analysed. On the basis of this analysis the survey approach was
deemed the most appropriate research method to be used in this study. The strengths
and weaknesses of the survey method were discussed. After careful consideration of
the sample and its geographical dispersion a decision was made to adopt a web-based
questionnaire to collect data.
The chapter was then divided into six major sub-sections in each of which a
discussion was conducted of different steps in the administration of the research
method. The phases were as follows: (1) selecting the type of survey; (2) constructing
the questionnaire; (3) writing the questionnaire; (4) selecting the sample; (5)
measurement issues; and, (6) approach to be taken in determining the results. Within
each step careful consideration was given to a number of issues such as questionnaire
layout, question content, question format, pilot testing, response rate, sample size, and
the validity and reliability of measures used in the questionnaire.
In the next chapter the data analysis used in this study and the statistical techniques
and tests that are used to answer the research questions are presented.

145
Chapter Five
Quantitative Data Analysis I: Descriptive Statistics
5.1 Introduction
Quantitative analysis may be used at a number of levels. Baxter, Hughes and Tight
(2006) prescribe four levels of analysis that include descriptive statistics, inferential
statistics, simple inter-relationships and multivariate analysis. Descriptive statistics
and simple inter-relationships are discussed in this chapter and further discussion on
inferential statistics occurs in the next chapter. The use of multivariate analysis is not
necessary or relevant in this study in order to address the research questions.
Descriptive statistics have a number of uses that include describing the characteristics
of the sample and the basic features of the data in the study; and addressing specific
research questions. Descriptive statistics provide simple summaries about the sample
and the measures, and form the basis of virtually every quantitative analysis of data
(Trochim 2006). Three forms of analysis are usually adopted in univariate descriptive
data analysis which includes frequency measure; measures of central tendency, and
measures of dispersion (Bryman 2004). These measures are employed in this study to
analyse the data and to further address the research questions. How the data were
prepared for analysis is discussed in the next section and this is followed by the
calculation of the response rate.
5.2 Preparing Data for Analysis
In section 4.5.6 of the previous chapter the need to prepare the returned questionnaires
for data analysis was discussed. With mail-out surveys the process usually requires
the researcher to pre-code items on the questionnaire. When questionnaires are
completed and returned the coded data need to be transferred on to a database. This
process can lead to transcription errors which can be avoided using a web-based
survey. With web-based surveys results are returned electronically to a database. The
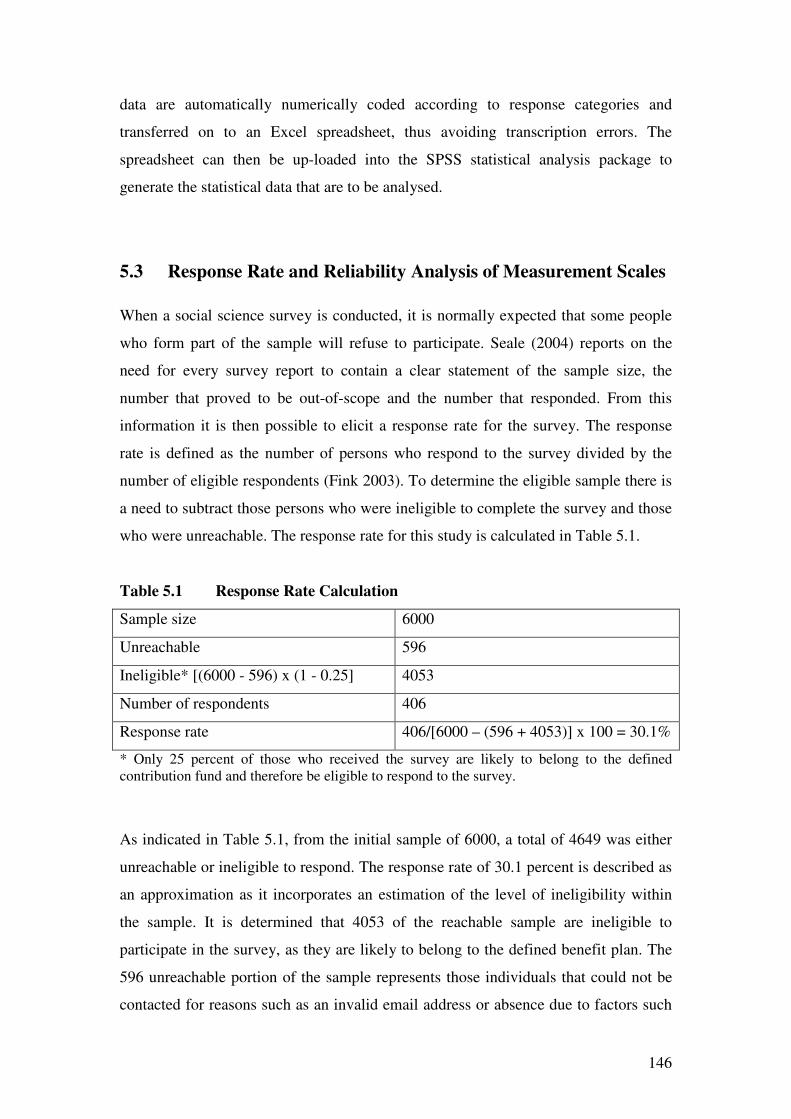
146
data are automatically numerically coded according to response categories and
transferred on to an Excel spreadsheet, thus avoiding transcription errors. The
spreadsheet can then be up-loaded into the SPSS statistical analysis package to
generate the statistical data that are to be analysed.
5.3 Response Rate and Reliability Analysis of Measurement Scales
When a social science survey is conducted, it is normally expected that some people
who form part of the sample will refuse to participate. Seale (2004) reports on the
need for every survey report to contain a clear statement of the sample size, the
number that proved to be out-of-scope and the number that responded. From this
information it is then possible to elicit a response rate for the survey. The response
rate is defined as the number of persons who respond to the survey divided by the
number of eligible respondents (Fink 2003). To determine the eligible sample there is
a need to subtract those persons who were ineligible to complete the survey and those
who were unreachable. The response rate for this study is calculated in Table 5.1.
Table 5.1 Response Rate Calculation
Sample size 6000
Unreachable 596
Ineligible* [(6000 - 596) x (1 - 0.25] 4053
Number of respondents 406
Response rate 406/[6000 – (596 + 4053)] x 100 = 30.1%
* Only 25 percent of those who received the survey are likely to belong to the defined
contribution fund and therefore be eligible to respond to the survey.
As indicated in Table 5.1, from the initial sample of 6000, a total of 4649 was either
unreachable or ineligible to respond. The response rate of 30.1 percent is described as
an approximation as it incorporates an estimation of the level of ineligibility within
the sample. It is determined that 4053 of the reachable sample are ineligible to
participate in the survey, as they are likely to belong to the defined benefit plan. The
596 unreachable portion of the sample represents those individuals that could not be
contacted for reasons such as an invalid email address or absence due to factors such
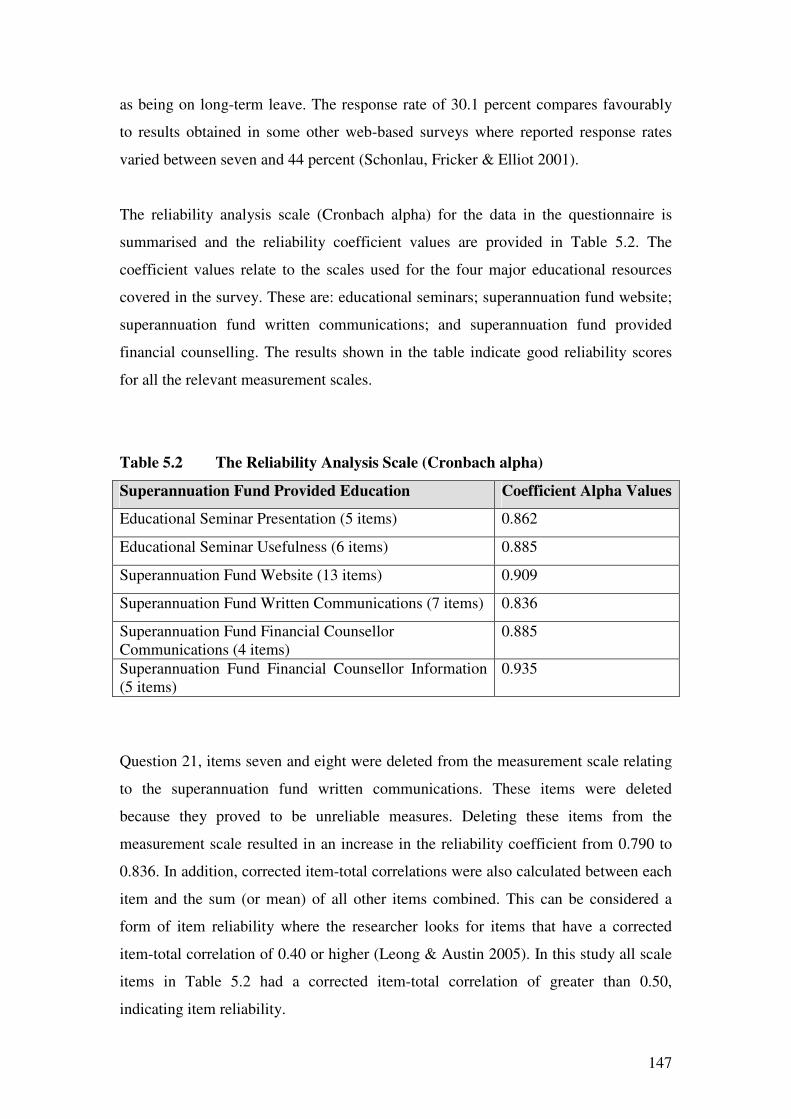
147
as being on long-term leave. The response rate of 30.1 percent compares favourably
to results obtained in some other web-based surveys where reported response rates
varied between seven and 44 percent (Schonlau, Fricker & Elliot 2001).
The reliability analysis scale (Cronbach alpha) for the data in the questionnaire is
summarised and the reliability coefficient values are provided in Table 5.2. The
coefficient values relate to the scales used for the four major educational resources
covered in the survey. These are: educational seminars; superannuation fund website;
superannuation fund written communications; and superannuation fund provided
financial counselling. The results shown in the table indicate good reliability scores
for all the relevant measurement scales.
Table 5.2 The Reliability Analysis Scale (Cronbach alpha)
Superannuation Fund Provided Education Coefficient Alpha Values
Educational Seminar Presentation (5 items) 0.862
Educational Seminar Usefulness (6 items) 0.885
Superannuation Fund Website (13 items) 0.909
Superannuation Fund Written Communications (7 items) 0.836
Superannuation Fund Financial Counsellor
Communications (4 items)
0.885
Superannuation Fund Financial Counsellor Information
(5 items)
0.935
Question 21, items seven and eight were deleted from the measurement scale relating
to the superannuation fund written communications. These items were deleted
because they proved to be unreliable measures. Deleting these items from the
measurement scale resulted in an increase in the reliability coefficient from 0.790 to
0.836. In addition, corrected item-total correlations were also calculated between each
item and the sum (or mean) of all other items combined. This can be considered a
form of item reliability where the researcher looks for items that have a corrected
item-total correlation of 0.40 or higher (Leong & Austin 2005). In this study all scale
items in Table 5.2 had a corrected item-total correlation of greater than 0.50,
indicating item reliability.
148
5.4 Analysis of Frequency: Respondent Background and
Demographics
A frequency distribution shows the number of observations falling into each of
several categories for a variable. Frequency distributions can be presented in a
number of formats including tables, bar charts, and pie charts. Frequency tables
provide the number of respondents belonging to each response category for the
variable in the question. The Table will usually show the actual number in each
category and the relative percentage falling into each category. De Vaus (2002, p.
212) explains that a “core part of univariate analysis is describing the distribution of
variables”. Given that all variables contain more than one category we can examine
the way responses are distributed across these categories. Leech, Barrett and Morgan
(2005, p. 12) suggest that “frequency distributions are critical to understanding our
use of measurement terms”. The following sections will examine frequency data in
relation to respondents’ background and demographics. There will also be further
examination of frequency data relating to the questions on the educational seminar,
superannuation fund website, superannuation fund written communications,
superannuation fund provided financial counsellor, and the importance of other
sources of superannuation information. All the tables in this chapter were developed
from the research.

149
5.4.1 Respondents’ Characteristics
As shown in Table 5.3, 46.7 percent of the respondents were male and 53.3 percent
female. The respondent gender characteristics are consistent with the Department of
Education, Employment and Workplace Relations (2007) Higher Education Statistics
Report, where the reported gender proportions in higher education is 47.2 percent
male and 52.8 percent female.
Table 5.3 Gender Gender Frequency Percent Cumulative
Percent
Male 185 46.7 46.7
Female 211 53.3 100.0
Total 396 100.0
The age group of respondents is shown in Table 5.4. The largest number of
respondents was in the 50-59 age bracket representing 32.4 percent of total responses;
the lowest responding group was in the 18-29 age bracket. It can also be noted that
58.1 percent of respondents are younger than 50. A majority of respondents is aged
between 40-59, and represent 60.4 percent of total respondents. The respondent age
demographics are also consistent with the university sector profile reported in the
Department of Education, Employment and Workplace Relations (2007) Higher
Education Statistics which identifies a similar distribution in age to the brackets
reflected by the respondents to this study.
Table 5.4 Age
Age Frequency Percent Cumulative
Percent
18-29 30 7.5 7.5
30-39 90 22.6 30.1
40-49 111 28.0 58.1
50-59 129 32.4 90.5
60+ 38 9.5 100.0
Total 398 100.0

150
The respondents’ qualification levels are presented in Table 5.5. It can be seen that
48.4 percent of respondents have a doctoral qualification and that a large majority
(86.6 percent) of respondents has qualifications at or above the undergraduate level. A
relatively small number of respondents have no qualification (4.8 percent). It was
expected that a large percentage of respondents would hold a doctoral qualification as
indicated in the Department of Education, Employment and Workplace Relations
(2007) Higher Education Statistics which shows that 62.3 percent of academic staff
hold a doctorate. It is also not surprising that a large majority of respondents is at least
educated to tertiary level, as a significant percentage of respondents are academics
and this level of qualification is consistent with academic appointments.
Table 5.5 Level of Qualification Qualification Frequency Percent Cumulative
Percent
Other 2 0.5 0.5
No Qualification 19 4.8 5.3
Post Secondary 32 8.1 13.4
Undergraduate 53 13.3 26.7
Postgraduate 99 24.9 51.6
Doctorate 192 48.4 100.0
Total 397 100.0
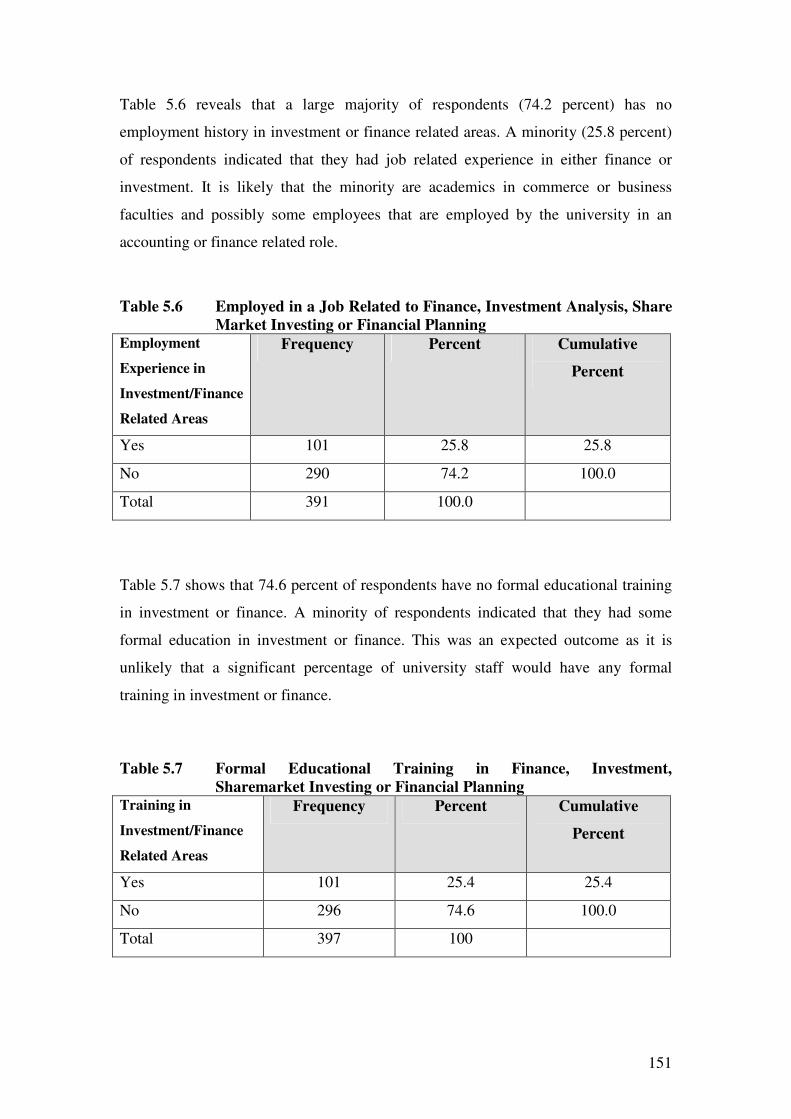
151
Table 5.6 reveals that a large majority of respondents (74.2 percent) has no
employment history in investment or finance related areas. A minority (25.8 percent)
of respondents indicated that they had job related experience in either finance or
investment. It is likely that the minority are academics in commerce or business
faculties and possibly some employees that are employed by the university in an
accounting or finance related role.
Table 5.6 Employed in a Job Related to Finance, Investment Analysis, Share
Market Investing or Financial Planning Employment
Experience in
Investment/Finance
Related Areas
Frequency Percent Cumulative
Percent
Yes 101 25.8 25.8
No 290 74.2 100.0
Total 391 100.0
Table 5.7 shows that 74.6 percent of respondents have no formal educational training
in investment or finance. A minority of respondents indicated that they had some
formal education in investment or finance. This was an expected outcome as it is
unlikely that a significant percentage of university staff would have any formal
training in investment or finance.
Table 5.7 Formal Educational Training in Finance, Investment,
Sharemarket Investing or Financial Planning Training in
Investment/Finance
Related Areas
Frequency Percent Cumulative
Percent
Yes 101 25.4 25.4
No 296 74.6 100.0
Total 397 100

152
Table 5.8 summarises the knowledge of respondents in regards to finance or
investment matters. A majority (56.5 percent) of respondents indicated that they had
either moderate or substantial knowledge in these matters. The other 43.5 percent of
respondents believe that they have either little or no knowledge in regards to finance
and investment matters. These findings are similar to the Kerry, Clayton and Olynyk
(2007) study that found 49 percent of superannuation fund members surveyed when
attending an educational seminar rated themselves as having no or weak, investment
knowledge whereas 51 percent rated themselves as having moderate or strong
knowledge.
Even though, as shown in Tables 5.6 and 5.7, most respondents had no work
experience or formal training in finance or investment, a majority of them believe that
they have moderate or substantial knowledge in these matters. This indicates clearly
that many respondents have acquired this knowledge through some form of the
educative process. Where these respondents acquired their knowledge is subject to
further investigation in this chapter.
Table 5.8 Knowledge in Finance and Investment Matters Knowledge in Investment
and Finance Matters
Frequency Percent Cumulative
Percent
No Knowledge 18 4.6 4.6
Little Knowledge 152 38.9 43.5
Moderate Knowledge 177 45.2 88.7
Substantial Knowledge 44 11.3 100.0
Total 391 100

153
Table 5.9 reports respondents’ attitudes towards investment risk. While the majority
(52.7 percent) of respondents has a conservative or moderately conservative attitude;
29.6 percent held either a moderately aggressive or aggressive attitude towards
investment risk. These findings are consistent with the Kerry, Clayton and Olynyk
(2007) study that found a majority (65 percent) of university superannuation fund
members, surveyed when attending an educational seminar, rated their attitude to
investment risk as conservative and a minority (35 percent) considered it to be
aggressive.
Table 5.9 Attitude Towards Investment Risk Attitude Towards
Investment Risk
Frequency Percent Cumulative
Percent
Conservative 60 15.2 15.2
Moderately Conservative 148 37.5 52.7
Neutral 70 17.7 70.4
Moderately Aggressive 109 27.6 98.0
Aggressive 8 2.0 100.0
Total 395 100

154
Respondents’ employment area is presented in Table 5.10. It shows that a majority of
respondents (69.2 percent) work as academics. The remaining respondents work in
services areas such as administration, library services, human resources, information
technology, building and grounds, and accounting and finance. This response
characteristic is notable given that there are more non-academics than academics in
the higher education sector. However, the number of responses from non-academics is
still large (30.8 percent). In further analysis, Table 5.10 is collapsed into two
categories: academic and non-academic respondents.
Table 5.10 Area of Employment Area of Employment Frequency Percent Cumulative
Percent
Academic 273 69.2 69.2
Administration 49 12.4 81.6
Library Services 15 3.8 85.4
Human Resources 14 3.6 89.0
Information Technology 10 2.5 91.5
Building and Grounds 1 0.3 91.8
Finance and Accounting 18 4.6 96.4
Other 14 3.6 100.0
Total 394 100.0
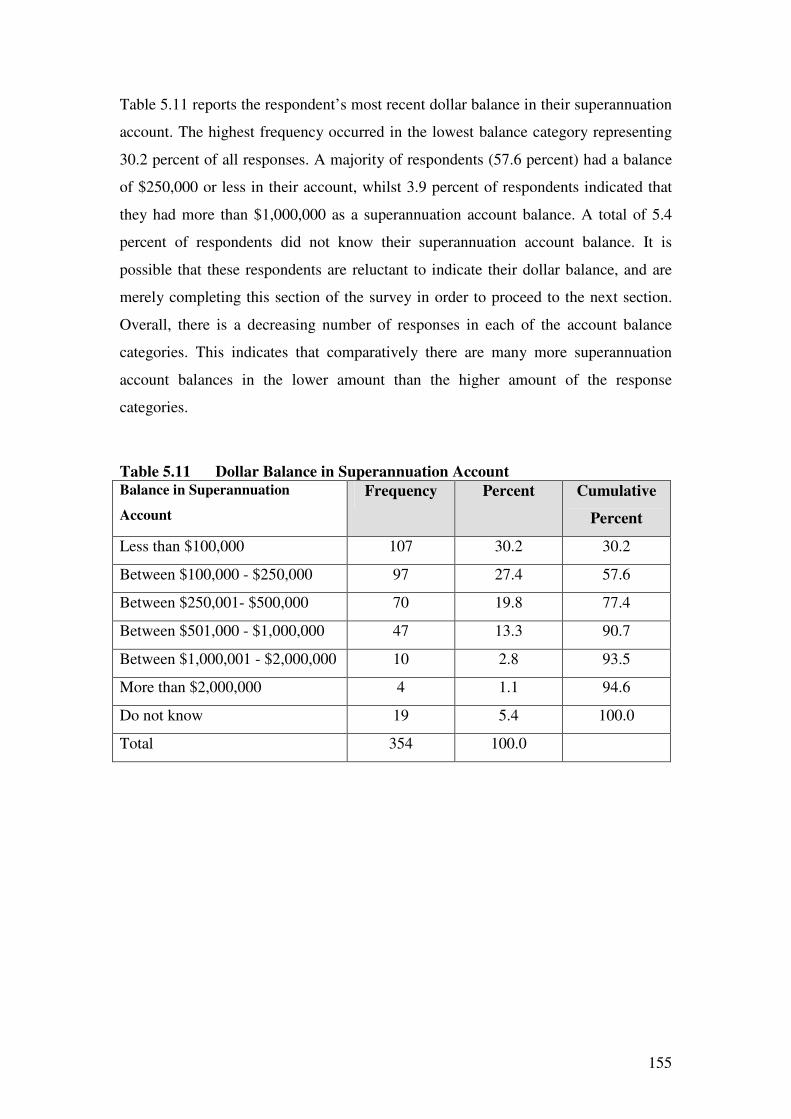
155
Table 5.11 reports the respondent’s most recent dollar balance in their superannuation
account. The highest frequency occurred in the lowest balance category representing
30.2 percent of all responses. A majority of respondents (57.6 percent) had a balance
of $250,000 or less in their account, whilst 3.9 percent of respondents indicated that
they had more than $1,000,000 as a superannuation account balance. A total of 5.4
percent of respondents did not know their superannuation account balance. It is
possible that these respondents are reluctant to indicate their dollar balance, and are
merely completing this section of the survey in order to proceed to the next section.
Overall, there is a decreasing number of responses in each of the account balance
categories. This indicates that comparatively there are many more superannuation
account balances in the lower amount than the higher amount of the response
categories.
Table 5.11 Dollar Balance in Superannuation Account Balance in Superannuation
Account
Frequency Percent Cumulative
Percent
Less than $100,000 107 30.2 30.2
Between $100,000 - $250,000 97 27.4 57.6
Between $250,001- $500,000 70 19.8 77.4
Between $501,000 - $1,000,000 47 13.3 90.7
Between $1,000,001 - $2,000,000 10 2.8 93.5
More than $2,000,000 4 1.1 94.6
Do not know 19 5.4 100.0
Total 354 100.0

156
5.5 Analysis of Frequency, Central Tendency and Variation of
Sources of Financial Education
Frequency data are used to evaluate the distribution of responses to the questions
relating to the superannuation fund provided financial education and other sources of
educational information. In addition to the frequency data, measures of central
tendency and variation are used to analyse the data further. There are three common
measures of central tendency; the mean, the mode and the median. The mode and the
median are used much less in research than the mean (Punch 2005). The mean is
calculated by adding all the scores together for cases within the data distribution and
then dividing by the number of cases. It is suggested that because the mean is widely
understood and used, it is preferable for use when describing what the average is for a
scale variable (Connolly 2007).
The standard deviation is described as the most common measure of variability
(Punch 2005). Standard deviation measures the deviation of the individual scores
from their mean. A measure of variation that is small indicates that the mean
accurately represents the population from which the data were collected (Somekh &
Lewin 2005). The standard deviation and mean are often reported together because
the standard deviation is an indication of how adequate the mean is as a summary
statistic for a set of data (Mertens 2005). Therefore, interpreting the standard
deviation together with the mean provides an understanding of the level of dispersion
within the scores of a distribution. If the distribution is normal or ‘bell shaped’, we
know that:
• about 68 percent of all cases fall within one standard deviation either side of
the mean;
• about 95 percent of all cases fall within two standard deviations either side of
the mean; and,
• about 99 percent of all cases fall within three standard deviations either side of
the mean.
Importantly, these figures will not vary significantly, even when the distribution is not
bell shaped (Punch 2005). The following analysis incorporates frequency data, the
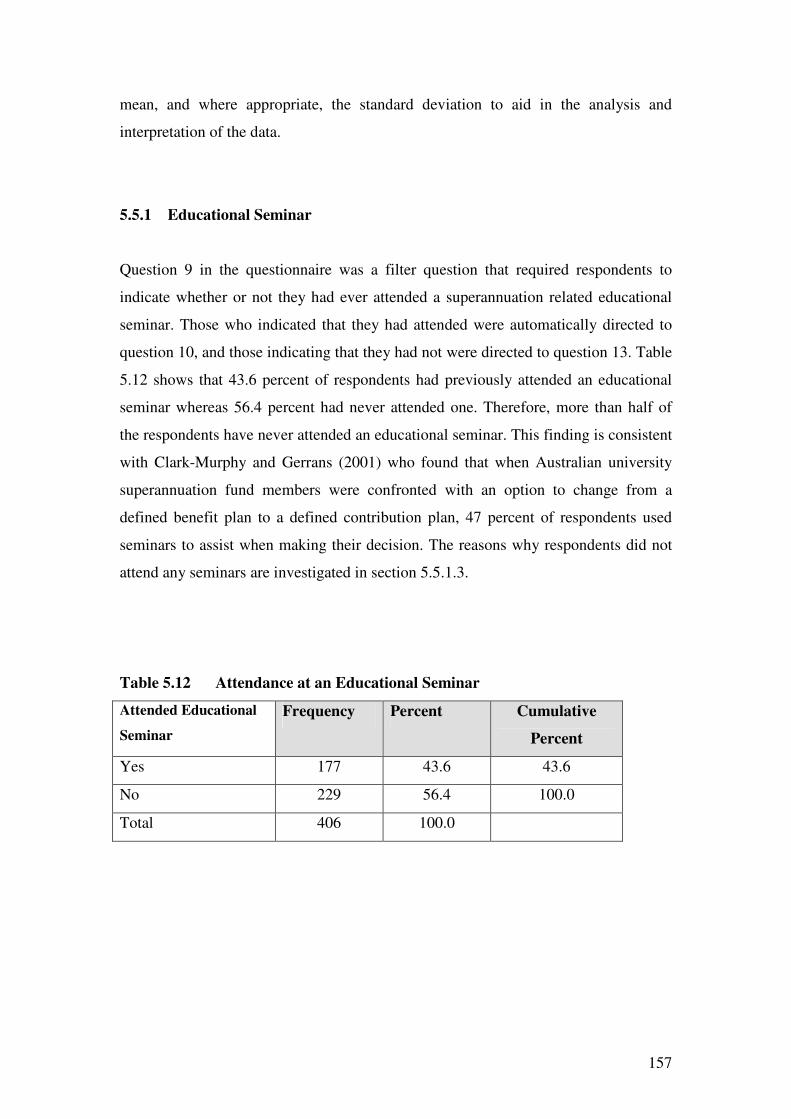
157
mean, and where appropriate, the standard deviation to aid in the analysis and
interpretation of the data.
5.5.1 Educational Seminar
Question 9 in the questionnaire was a filter question that required respondents to
indicate whether or not they had ever attended a superannuation related educational
seminar. Those who indicated that they had attended were automatically directed to
question 10, and those indicating that they had not were directed to question 13. Table
5.12 shows that 43.6 percent of respondents had previously attended an educational
seminar whereas 56.4 percent had never attended one. Therefore, more than half of
the respondents have never attended an educational seminar. This finding is consistent
with Clark-Murphy and Gerrans (2001) who found that when Australian university
superannuation fund members were confronted with an option to change from a
defined benefit plan to a defined contribution plan, 47 percent of respondents used
seminars to assist when making their decision. The reasons why respondents did not
attend any seminars are investigated in section 5.5.1.3.
Table 5.12 Attendance at an Educational Seminar
Attended Educational
Seminar
Frequency Percent Cumulative
Percent
Yes 177 43.6 43.6
No 229 56.4 100.0
Total 406 100.0
158
5.5.1.2 Usefulness of the Educational Seminar
Table 5.13 presents the results relating to the experiences of those respondents who
attended an educational seminar. The questions they answered related both to
instruction and the information presented. The first five items show that a substantial
majority of respondents either agreed or strongly agreed with the statements that the
seminars were well presented and provided relevant and understandable feedback.
Items six, seven and nine reveal that for a majority of respondents their expectations
for information were met on a particular topic. Item ten showed that a similar number
of respondents either agreed (31.9 percent) or disagreed (35 percent) on the issue that
the seminars provide a basis for continual information. This may be indicating that the
respondents view the seminar as an occasional information resource rather than a
continuing one.
The rating scores for each item scale were combined to provide a summated score
from which a rating average was derived. The summated mean for statement items
one through to five totalled 19.4 with a standard deviation of 3.37. The average rating
for these statement items is 3.88 with a standard deviation of 0.674. The overall mean
was calculated by dividing the summated means by the number of statement items.
The overall mean rating of 3.88 indicates that respondents have a positive perception
of the presentation of information in educational seminars. The standard deviation of
0.674 indicates low variation of individual responses from the overall mean. The
summated mean for statement items six through to eleven was 20.1 with a standard
deviation of 4.36. The overall mean rating for these statement items is 3.36 with a
standard deviation of 0.726. The overall mean shows that users generally feel they are
being informed by attending educational seminars. The standard deviation indicates
low variation in individual responses. These findings are consistent with Kim,
Bagwell and Garman (1998) who found that group or seminar training was positively
received by participants.

159
Table 5.13 Instruction and Information Usefulness of the Educational Seminar
Educational Seminar Statements Strongly
Disagree
Disagree Neither Agree
or Disagree
Agree Strongly
Agree
Frequency
Item
Question 10 N % N % N % N % N % N
%
Mean
_
X
1 The seminar was well presented 1 0.6 4 2.4 16 9.6 122 73.5 23 13.9 166 100.0 3.98
2 I was able to easily follow the material covered
in the seminar
1 0.6 8 4.8 19 11.3 107 64.1 32 19.2 167 100.0 3.96
3 The participants were encouraged to ask specific
questions
4 2.4 12 7.2 30 18.1 86 51.8 34 20.5 166 100.0 3.81
4 The presenters provided relevant feedback on
the specific questions they were asked
3 1.8 8 4.8 30 17.9 100 59.9 26 15.6 167 100.0 3.83
5 The presenters provided understandable
feedback on the specific questions asked
3 1.8 6 3.6 30 17.9 103 61.7 25 15.0 167 100.0 3.84
6 The issues covered in the seminar were
consistent with my expectations
2 1.2 11 6.6 32 19.1 103 61.7 19 11.4 167 100.0 3.75
7 The seminar adequately covered all the
necessary superannuation issues for me to gain
greater information on that particular topic
7 4.2 26 15.5 38 22.8 86 51.5 10 6 167 100.0 3.40
8 As a result of attending the seminar I am now
able to make an informed decision on the
specific superannuation issues addressed
4 2.4 27 16.3 57 34.3 75 45.2 3 1.8 166 100.0 3.28
9 Attending the seminar has provided me with a
better understanding of the superannuation
system
2 1.2 14 8.5 42 25.4 95 57.6 12 7.3 165 100.0 3.61
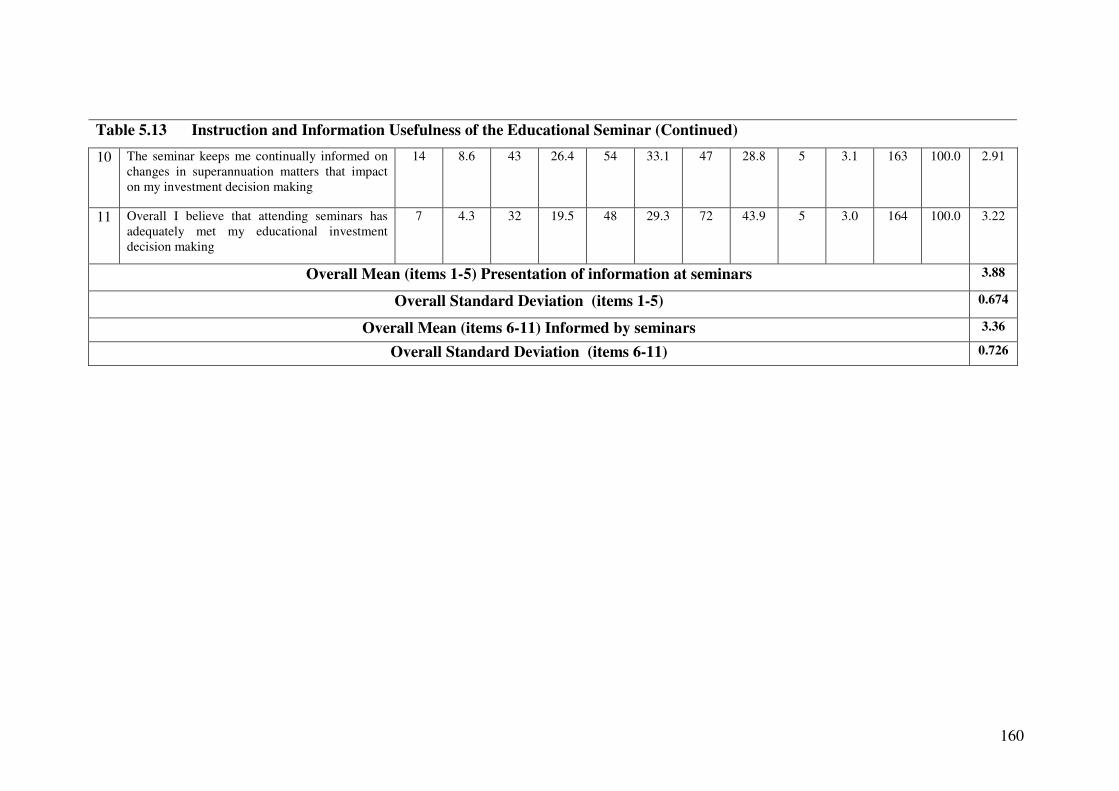
160
Table 5.13 Instruction and Information Usefulness of the Educational Seminar (Continued)
10 The seminar keeps me continually informed on
changes in superannuation matters that impact
on my investment decision making
14 8.6 43 26.4 54 33.1 47 28.8 5 3.1 163 100.0 2.91
11 Overall I believe that attending seminars has
adequately met my educational investment
decision making
7 4.3 32 19.5 48 29.3 72 43.9 5 3.0 164 100.0 3.22
Overall Mean (items 1-5) Presentation of information at seminars 3.88
Overall Standard Deviation (items 1-5) 0.674
Overall Mean (items 6-11) Informed by seminars 3.36
Overall Standard Deviation (items 6-11) 0.726

161
In Table 5.14 it can be seen that of those respondents who attended the seminar, a
substantial majority (77 percent) rated it as either important or very important in
regard to their superannuation decision making. A mean rating score of 3.81 reflects
the importance respondents placed on the educational seminar in keeping them
informed on superannuation issues for their decision making. This indicates strong
support for the importance placed by users on educational seminars in the
superannuation decision making process. In the current study 24.2 percent rated the
seminar as very important. This finding is consistent with Clark-Murphy and Gerrans
(2001) where 27 percent of respondents ranked the seminar as the most important
source of information used to make their decision as to whether to change from the
defined benefit plan to the defined contribution plan. Respondents in the current study
were not asked to rank the seminar against other superannuation fund educational
resources.
Table 5.14 The Importance Placed on the Educational Seminar for
Superannuation Decision Making
Importance Placed on the
Educational Seminar
Frequency Percent Cumulative
Percent
No Importance 3 1.9 1.9
Very Little Importance 26 16.1 18.0
No Opinion 8 5.0 23.0
Moderately Important 85 52.8 75.8
Very Important 39 24.2 100.0
Total 161 100.0
Mean 3.81

162
Respondents who indicated that they had attended an educational seminar were also
asked to indicate how often they attended educational seminars. Table 5.15 indicates
that 82.6 percent of respondents accessed the educational seminar either rarely or
sometimes. These results are reflected in the low mean rating score of 1.88. This
result may be due to the specific nature of the topics presented in the seminar. Many
respondents may only access the seminar where the seminar topic is of specific
interest to their decision making. Another explanation for this result may be that due
to the limited number of seminars offered to superannuation fund members
throughout the year they simply have no opportunity to attend.
Table 5.15 How Often are the Educational Seminars Accessed?
How Often are Educational
Seminars Accessed?
Frequency Percent Cumulative
Percent
Rarely 56 34.8 34.8
Sometimes 77 47.8 82.6
Often 20 12.4 95.0
Very Often 8 5.0 100.0
Total 161 100.0
Mean 1.88

163
5.5.1.3 Reasons for the Failure to Attend Educational Seminars
Question 13 was confined to those respondents who indicated in the filter question
that they had never attended an educational seminar. Table 5.16 outlines statements as
to why respondents may fail to attend educational seminars. A majority of
respondents (61.1 percent) did not agree with statement one that they had no
awareness of the seminar program as a reason for not attending. Therefore, the data
support the notion that there is considerable awareness amongst the respondents of the
program offered by the superannuation fund. A large percentage of respondents (46.5
percent) did not agree with statement two that they perceived no benefit from
attending the seminar: thus many respondents appreciate that there is a benefit from
attending the seminar. A majority of respondents (51.9 percent) disagreed with the
third statement that there is no relevance in the seminar topics to their investment
decision making. A substantial number of respondents (47.7 percent) did not agree
with statement four that they failed to attend because they already possess the required
knowledge. A slight majority of respondents (50.9 percent) also disagreed with
statement six that they fail to attend because of a lack of interest. The results support
the argument that many respondents have an interest in the seminar topics and also
see some relevance and benefit from attending the seminars.
Statements eight, nine, seven and five (respectively) provide the most important
reasons why respondents fail to attend seminars. A strong majority (67.4 percent) of
respondents agree with statement (eight) that they are busy and do not have the time
to attend. A majority (50.5 percent) agreed with statement nine that they obtain their
information from other sources; and many more respondents agreed (46.5 percent)
than disagreed (25.6 percent) with statement seven that they fail to attend because
they can utilise their time on more important issues. More respondents agreed (41
percent) than disagreed (36.4 percent) with statement five that they are not motivated
enough to attend the seminars. In summary, statement item eight being busy and not
having time to attend, produced the most agreement with a mean rating of 3.74. This
was followed by statement item nine obtaining information requirements from other
sources, with a mean rating of 3.35, and then statement item seven utilising time on
more important issues, with a mean rating of 3.27.

164
Table 5.16 Reasons Respondents Fail to Attend Educational Seminars
Educational Seminar Statements –
Reasons Respondents Fail to Attend
Strongly
Disagree
Disagree Neither Agree
or Disagree
Agree Strongly
Agree
Frequency
Item
Question 13 N % N % N % N % N % N
%
Mean
_
X
1 I had no awareness of the seminar program 45 20.8 87 40.3 19 8.8 38 17.6 27 12.5 216 100.0 2.61
2 I perceive no benefit from attending the seminar
program
17 7.9 83 38.6 68 31.7 39 18.1 8 3.7 215 100.0 2.71
3 I perceive no relevance of the seminar topic to
my superannuation decision making
17 7.9 95 44.0 58 26.8 40 18.5 6 2.8 216 100.0 2.64
4 I feel I already have the required knowledge to
make informed superannuation decisions
24 11.1 79 36.6 49 22.6 55 25.5 9 4.2 216 100.0 2.75
5 I am not motivated enough to attend the
seminars
15 6.9 64 29.5 49 22.6 64 29.5 25 11.5 217 100.0 3.09
6 I do not attend because of a lack of interest 27 12.5 83 38.4 52 24.1 41 19.0 13 6.0 216 100.0 2.68
7 I can utilise my time on more important issues 7 3.3 48 22.3 60 27.9 80 37.2 20 9.3 215 100.0 3.27
8 I am busy and do not have the time to attend 7 3.2 22 10.1 42 19.3 96 44.0 51 23.4 218 100.0 3.74
9 I obtain my information requirements from other
sources
9 4.1 38 17.4 61 28 88 40.4 22 10.1 218 100.0 3.35
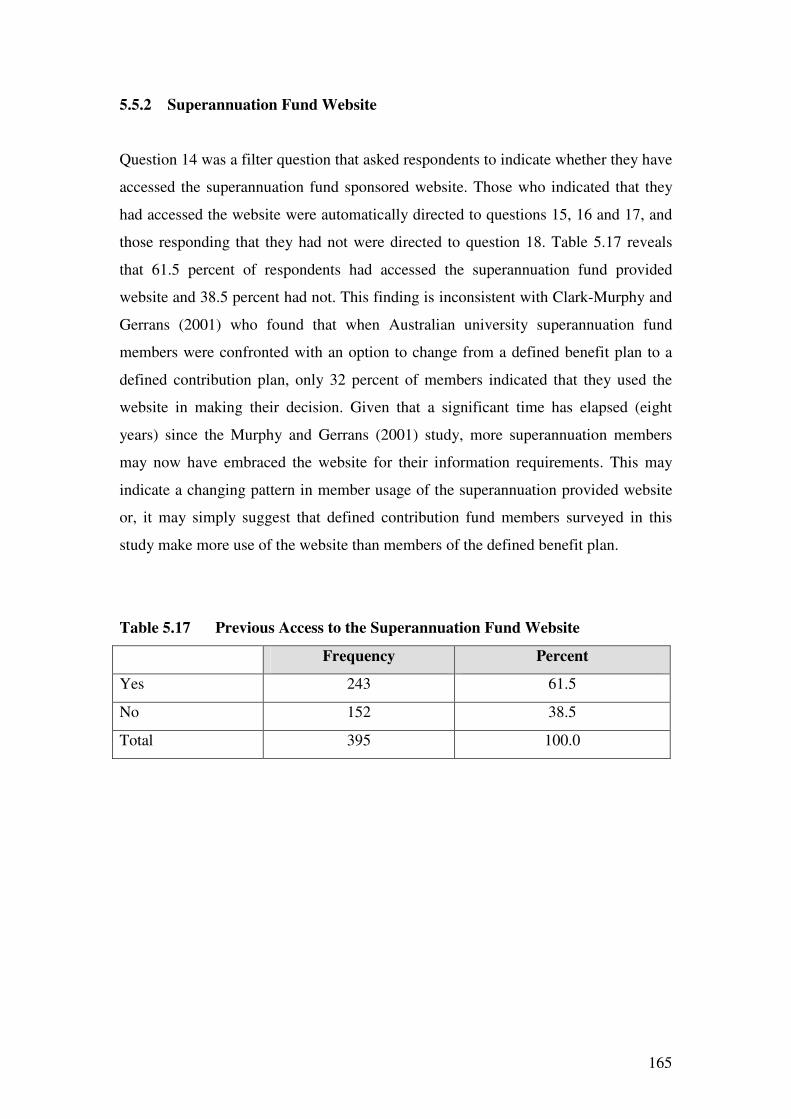
165
5.5.2 Superannuation Fund Website
Question 14 was a filter question that asked respondents to indicate whether they have
accessed the superannuation fund sponsored website. Those who indicated that they
had accessed the website were automatically directed to questions 15, 16 and 17, and
those responding that they had not were directed to question 18. Table 5.17 reveals
that 61.5 percent of respondents had accessed the superannuation fund provided
website and 38.5 percent had not. This finding is inconsistent with Clark-Murphy and
Gerrans (2001) who found that when Australian university superannuation fund
members were confronted with an option to change from a defined benefit plan to a
defined contribution plan, only 32 percent of members indicated that they used the
website in making their decision. Given that a significant time has elapsed (eight
years) since the Murphy and Gerrans (2001) study, more superannuation members
may now have embraced the website for their information requirements. This may
indicate a changing pattern in member usage of the superannuation provided website
or, it may simply suggest that defined contribution fund members surveyed in this
study make more use of the website than members of the defined benefit plan.
Table 5.17 Previous Access to the Superannuation Fund Website
Frequency Percent
Yes 243 61.5
No 152 38.5
Total 395 100.0

166
5.5.2.1 Usefulness of Superannuation Fund Website Information
This section was only answered by those respondents who indicated that they had
previously accessed the superannuation website (Question 15). Table 5.18 presents
the responses to the usefulness of educational information in the superannuation fund
website. A majority of respondents agreed with items one and three that the website
adequately informs them on what they require in savings to fund retirement, and the
adequacy of their current level of savings to meet this objective. In item two 40.4
percent of respondents agreed that the website assists them to make informed
decisions in respect of their retirement plan. Item four indicated that a majority of
respondents (51.6 percent) agreed that the website informed them on the impact of
their investment choices on their future superannuation savings. In items five and six
many more respondents agreed (41.6 and 33.1 percent) than disagreed (12.4 and 19.2
percent) that the website investment calculators provided useful information for both
the choice of investments and an investment plan. A majority of respondents agreed
with statement items seven, eight and nine (57.6, 69.8 and 50.7 percent) that the
website informs them on issues relating to both their investment choice risk and
return, and how their superannuation contributions are taxed.
More respondents agreed (41.2 and 39.8 percent) than disagreed (15.8 and 17.7
percent) with statement items ten and eleven that the website assisted them in
understanding the tax issues affecting their superannuation account. A large number
of respondents (46.8 percent) agreed with item twelve that the website assists them in
understanding the impact of salary sacrificing. More respondents agreed (47.3
percent) than disagreed (17.1 percent) that, overall the website adequately meets their
investment decision making requirements. The summated means for all 13 items is
43.6 with a standard deviation (SD) of 8.28. The overall mean rating for the 13
statement items is 3.35 with a SD of 0.636. The overall mean item rating indicates
that the respondents generally felt they were informed by the range of sponsor web-
based educational information. The SD (0.636) indicates that a substantial number of
the responses are positioned closely to the overall mean. This provides new evidence
about the usefulness of the website as an educational resource in informing defined
contribution fund members on superannuation related matters, and therefore assisting
them to make appropriate investment decisions.

167
Table 5.18 Information Usefulness in the Superannuation Fund Website
Superannuation Fund Website Statements Strongly
Disagree
Disagree Neither Agree
or Disagree
Agree Strongly
Agree
Frequency
Item
Question 15 N % N % N % N % N % N
%
Mean
_
X
1 The website informs me as to what I require in
savings to adequately fund my retirement
7 3.1 23 10.3 79 35.3 106 47.3 9 4.0 224 100.0 3.39
2 The website allows me to make informed
decisions when it comes to preparing an
investment plan to meet my superannuation
savings goal
5 2.2 32 14.2 97 43.2 84 37.3 7 3.1 225 100.0 3.25
3 The website allows me to make an informed
assessment as to the adequacy of my current
savings levels to meet my superannuation needs
6 2.7 23 10.2 91 40.4 97 43.1 8 3.6 225 100.0 3.35
4 The website informs me on how my investment
choices will impact on my future superannuation
savings
4 1.8 29 12.9 76 33.7 107 47.6 9 4 225 100.0 3.39
5 The web-based investment calculator provides
me with the information I require to determine
which investment choice will best meet my
superannuation savings need
3 1.3 25 11.1 104 46 81 35.8 13 5.8 226 100.0 3.34
6 The web-based investment calculator provided
me with the information I required to develop a
superannuation investment plan
5 2.2 38 17 107 47.7 66 29.5 8 3.6 224 100.0 3.15
7 The website informs me on the concept of risk
and how it applies to each investment choice
offered by the fund
6 2.7 24 10.7 65 29.0 120 53.6 9 4.0 224 100.0 3.46
8 The website informs me on the potential returns
produced by each investment choice offered by
the fund
4 1.8 15 6.8 48 21.6 133 59.9 22 9.9 222 100.0 3.69
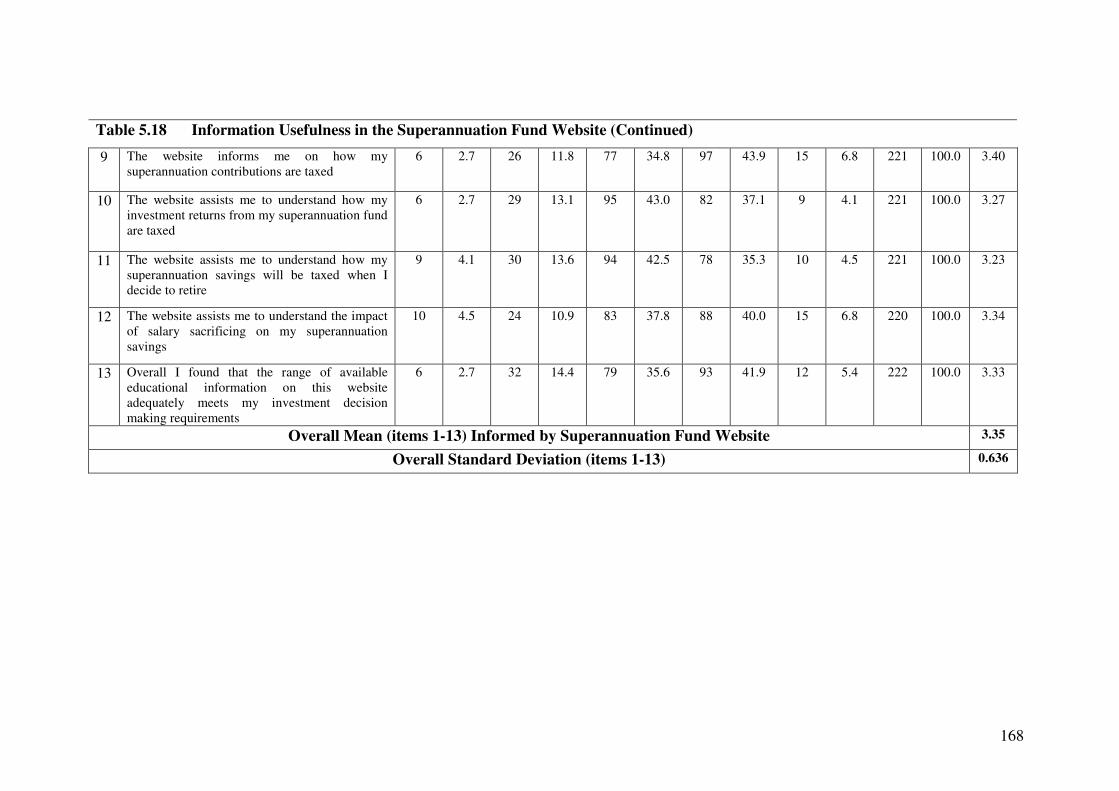
168
Table 5.18 Information Usefulness in the Superannuation Fund Website (Continued)
9 The website informs me on how my
superannuation contributions are taxed
6 2.7 26 11.8 77 34.8 97 43.9 15 6.8 221 100.0 3.40
10 The website assists me to understand how my
investment returns from my superannuation fund
are taxed
6 2.7 29 13.1 95 43.0 82 37.1 9 4.1 221 100.0 3.27
11 The website assists me to understand how my
superannuation savings will be taxed when I
decide to retire
9 4.1 30 13.6 94 42.5 78 35.3 10 4.5 221 100.0 3.23
12 The website assists me to understand the impact
of salary sacrificing on my superannuation
savings
10 4.5 24 10.9 83 37.8 88 40.0 15 6.8 220 100.0 3.34
13 Overall I found that the range of available
educational information on this website
adequately meets my investment decision
making requirements
6 2.7 32 14.4 79 35.6 93 41.9 12 5.4 222 100.0 3.33
Overall Mean (items 1-13) Informed by Superannuation Fund Website 3.35
Overall Standard Deviation (items 1-13) 0.636
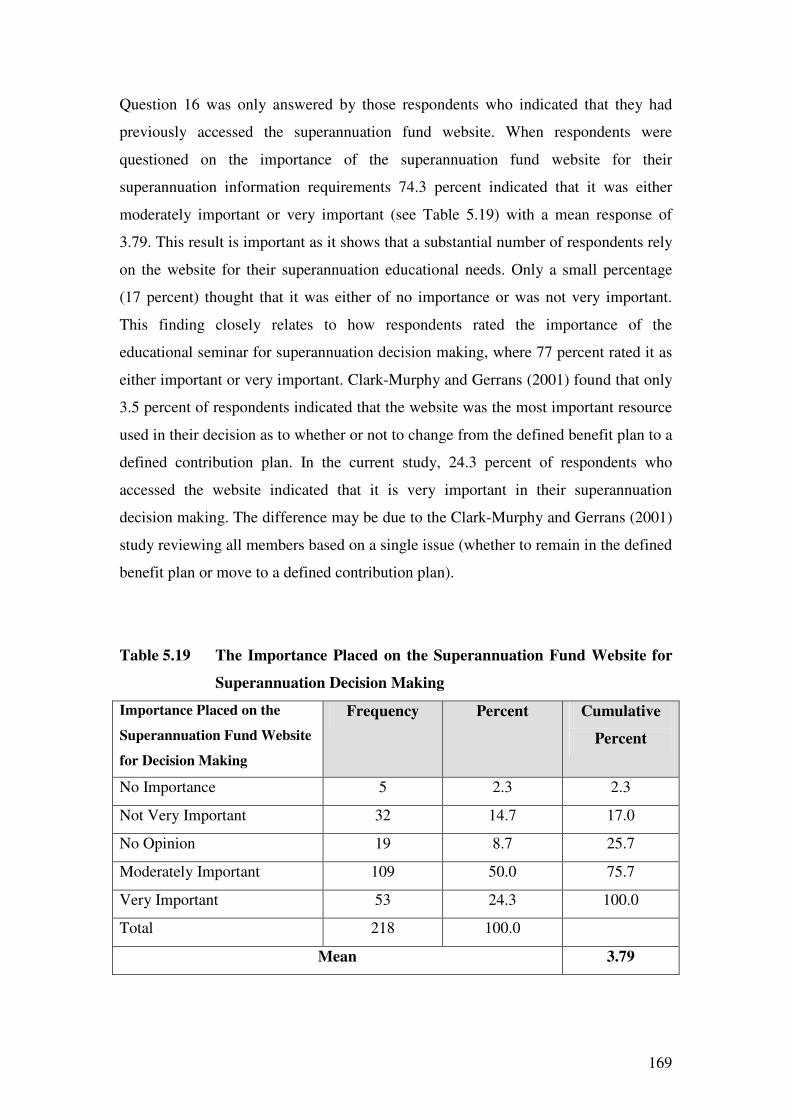
169
Question 16 was only answered by those respondents who indicated that they had
previously accessed the superannuation fund website. When respondents were
questioned on the importance of the superannuation fund website for their
superannuation information requirements 74.3 percent indicated that it was either
moderately important or very important (see Table 5.19) with a mean response of
3.79. This result is important as it shows that a substantial number of respondents rely
on the website for their superannuation educational needs. Only a small percentage
(17 percent) thought that it was either of no importance or was not very important.
This finding closely relates to how respondents rated the importance of the
educational seminar for superannuation decision making, where 77 percent rated it as
either important or very important. Clark-Murphy and Gerrans (2001) found that only
3.5 percent of respondents indicated that the website was the most important resource
used in their decision as to whether or not to change from the defined benefit plan to a
defined contribution plan. In the current study, 24.3 percent of respondents who
accessed the website indicated that it is very important in their superannuation
decision making. The difference may be due to the Clark-Murphy and Gerrans (2001)
study reviewing all members based on a single issue (whether to remain in the defined
benefit plan or move to a defined contribution plan).
Table 5.19 The Importance Placed on the Superannuation Fund Website for
Superannuation Decision Making
Importance Placed on the
Superannuation Fund Website
for Decision Making
Frequency Percent Cumulative
Percent
No Importance 5 2.3 2.3
Not Very Important 32 14.7 17.0
No Opinion 19 8.7 25.7
Moderately Important 109 50.0 75.7
Very Important 53 24.3 100.0
Total 218 100.0
Mean 3.79

170
Question 17 was only answered by those respondents who indicated that they had
previously accessed the superannuation fund website. Table 5.20 shows that 70.2
percent of respondents access the website only rarely or sometimes. This result is
reflected in the low mean rating of 2.03. As with the educational seminar, respondents
appear to perceive that regular attendance or access may not be necessary in obtaining
the required information to make an informed decision on superannuation issues.
However, 29.8 percent of the respondents did access the website either often or very
often. This indicates that almost one-third of respondents will regularly use the
website for their superannuation information requirements. This finding raises the
question why do they need to access the website so often? Regular access may be for
monitoring purposes which may be part of an aggressive investment approach. Those
accessing less often may be adopting a more conservative approach to their
investment decision making and may perceive the need to access the website only
occasionally for their information requirements.
Table 5.20 How Often is the Superannuation Fund Website Accessed?
How Often is the
Superannuation Fund
Website Accessed?
Frequency Percent Cumulative
Percent
Rarely 70 32.1 32.1
Sometimes 83 38.1 70.2
Often 53 24.3 94.5
Very Often 12 5.5 100.0
Total 218 100.0
Mean 2.03

171
5.5.2.2 Importance Placed on Superannuation Fund Website Information
The respondents who had previously accessed the website were asked to indicate the
importance that they placed on selected web-based items in respect of financial
education requirements for informed decision making. The results in Table 5.21 show
that respondents place considerable importance on items one, two and three with over
80 percent rating these items as either moderately important or very important. The
mean responses to these first three statements were 4.27, 4.22 and 4.18 further
indicating the strength of this response. The website items relate to the return
performance of the investment options offered by the fund; the characteristics of each
of the investment options in relation to potential returns; and the potential risks
associated with investing in each of those options. This is a significant finding as it
indicates how important some website information is in informing superannuation
fund members about the characteristics of the available investment choices.
A large majority (70.1 percent and 69.8 percent) of respondents also placed
considerable importance on items four and seven. These items relate to information on
recent news items on superannuation related issues, and on having access to financial
investment calculators. Smaller numbers, although still a majority of investors, ranked
items five, six and eight as important. These items related to accessing information on
the website in relation to personal financial planning advice, the availability of
seminars, and superannuation fund generated publications. It is notable that a majority
of respondents rated all the listed website items as important to their decision making.
This has important implications for the future educational content of superannuation
fund provided websites as these findings indicate that members place considerable
importance on the return performance and risks attached to the investment options
offered by the fund, along with investment calculators. Therefore, this type of
information should feature prominently in superannuation fund websites.
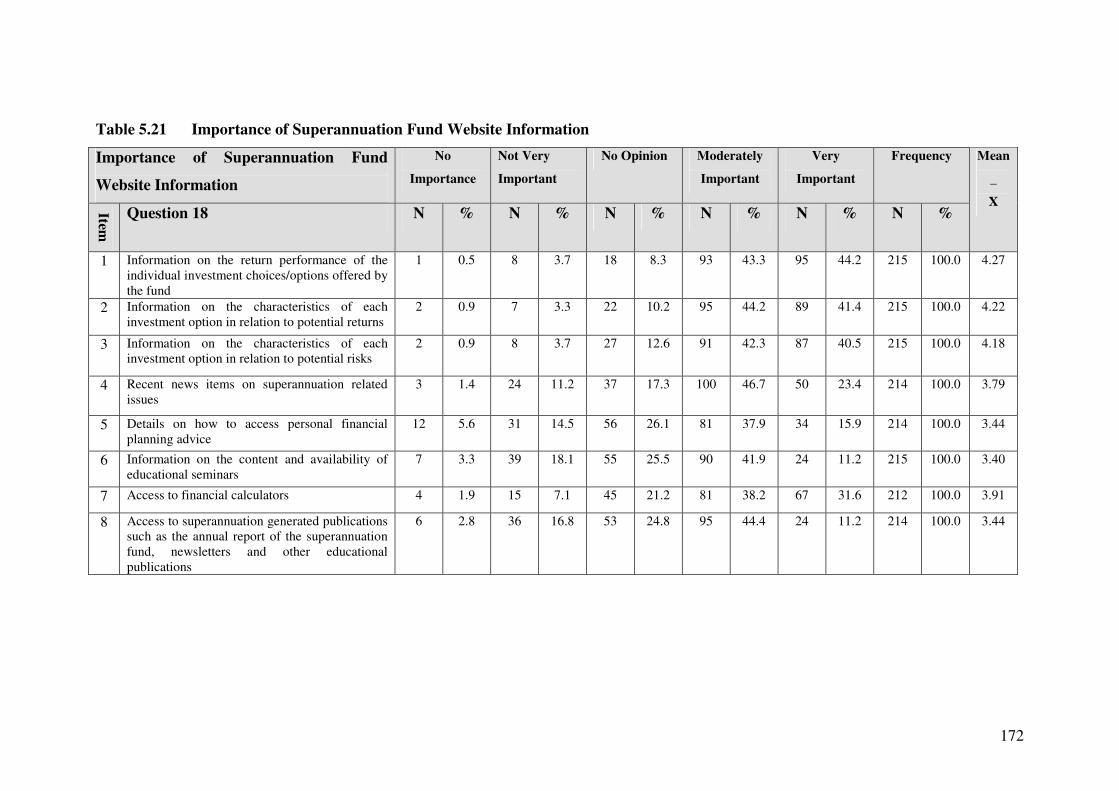
172
Table 5.21 Importance of Superannuation Fund Website Information
Importance of Superannuation Fund
Website Information
No
Importance
Not Very
Important
No Opinion Moderately
Important
Very
Important
Frequency
Item
Question 18 N % N % N % N % N % N
%
Mean
_
X
1 Information on the return performance of the
individual investment choices/options offered by
the fund
1 0.5 8 3.7 18 8.3 93 43.3 95 44.2 215 100.0 4.27
2 Information on the characteristics of each
investment option in relation to potential returns
2 0.9 7 3.3 22 10.2 95 44.2 89 41.4 215 100.0 4.22
3 Information on the characteristics of each
investment option in relation to potential risks
2 0.9 8 3.7 27 12.6 91 42.3 87 40.5 215 100.0 4.18
4 Recent news items on superannuation related
issues
3 1.4 24 11.2 37 17.3 100 46.7 50 23.4 214 100.0 3.79
5 Details on how to access personal financial
planning advice
12 5.6 31 14.5 56 26.1 81 37.9 34 15.9 214 100.0 3.44
6 Information on the content and availability of
educational seminars
7 3.3 39 18.1 55 25.5 90 41.9 24 11.2 215 100.0 3.40
7 Access to financial calculators 4 1.9 15 7.1 45 21.2 81 38.2 67 31.6 212 100.0 3.91
8 Access to superannuation generated publications
such as the annual report of the superannuation
fund, newsletters and other educational
publications
6 2.8 36 16.8 53 24.8 95 44.4 24 11.2 214 100.0 3.44

173
5.5.2.3 Failure to Access Superannuation Fund Website
This section was confined to those respondents who indicated in the filter question
that they had never accessed the superannuation fund provided website. Table 5.22
contains information on reasons respondents may not access the superannuation fund
website. There were only two items where a majority of respondents agreed as to the
reasons why they failed to access the website: in items seven and eight they indicated
they were too busy and did not have time, and that they obtained their information
from other sources. A lack of motivation was a reason that also received more
agreement (40.8 percent) than disagreement (32 percent). Of particular interest is that
a substantial majority (83.6 percent) did not agree that they lacked the necessary skills
to use the website, as this indicates a perception amongst the respondents that they
possess the necessary computer skills to navigate a website. Furthermore a majority of
respondents (53.7 percent) disagreed with the statement that they do not like using the
website for their information requirements. Statements such as ‘I perceive no benefit
from accessing the website’ and ‘I perceive no relevance of the information on the
website to my decision making’ received little agreement (27 and 22.4 percent).
It was interesting that 33.1 percent of respondents agreed that they had no awareness
of the website. This is a surprising result as the written communications from the
superannuation fund provide details of both the existence of the website and how to
gain access. There should also be a general expectation from members that such a
superannuation fund website would exist given that almost all large businesses and
organisations develop one. The reasons that received most agreement why
respondents do not access the website are as follows: not having time; obtaining
information from other sources; lack of motivation; and a lack of interest. This is
generally consistent with the reasons provided by respondents for not attending the
educational seminars where a lack of time; obtaining information from other sources;
and a lack of motivation received the most support.
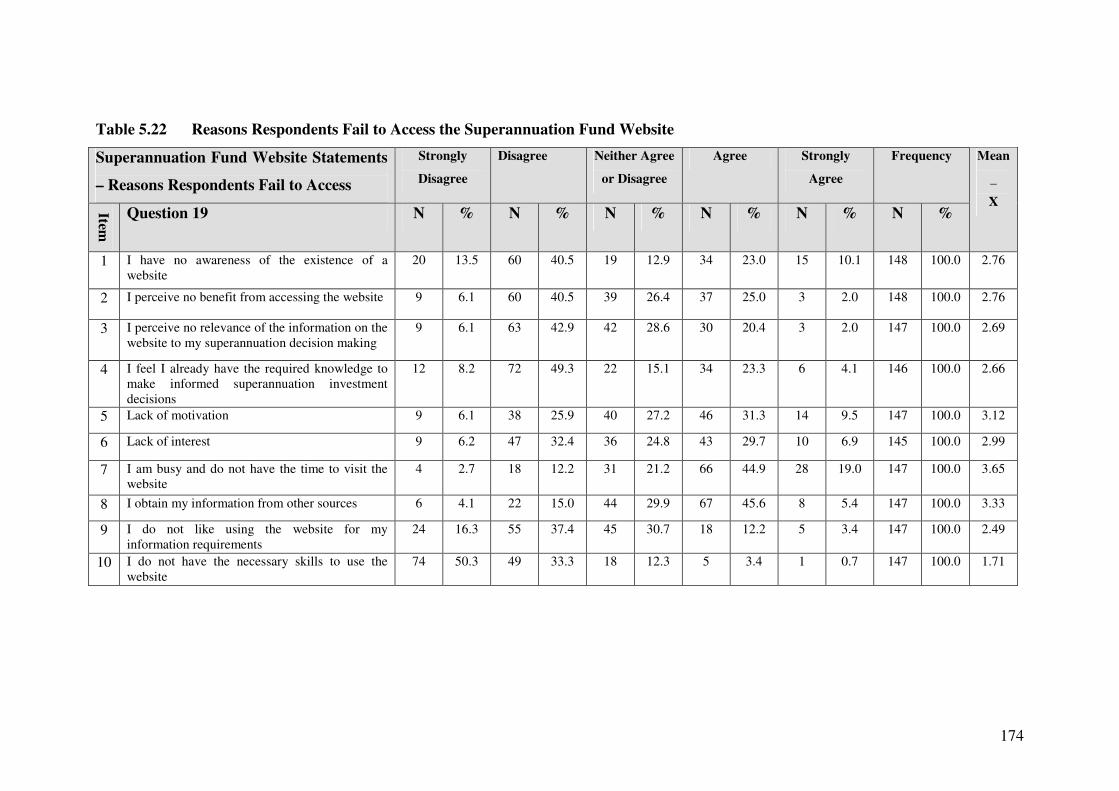
174
Table 5.22 Reasons Respondents Fail to Access the Superannuation Fund Website
Superannuation Fund Website Statements
– Reasons Respondents Fail to Access
Strongly
Disagree
Disagree Neither Agree
or Disagree
Agree Strongly
Agree
Frequency
Item
Question 19 N % N % N % N % N % N
%
Mean
_
X
1 I have no awareness of the existence of a
website
20 13.5 60 40.5 19 12.9 34 23.0 15 10.1 148 100.0 2.76
2 I perceive no benefit from accessing the website 9 6.1 60 40.5 39 26.4 37 25.0 3 2.0 148 100.0 2.76
3 I perceive no relevance of the information on the
website to my superannuation decision making
9 6.1 63 42.9 42 28.6 30 20.4 3 2.0 147 100.0 2.69
4 I feel I already have the required knowledge to
make informed superannuation investment
decisions
12 8.2 72 49.3 22 15.1 34 23.3 6 4.1 146 100.0 2.66
5 Lack of motivation 9 6.1 38 25.9 40 27.2 46 31.3 14 9.5 147 100.0 3.12
6 Lack of interest 9 6.2 47 32.4 36 24.8 43 29.7 10 6.9 145 100.0 2.99
7 I am busy and do not have the time to visit the
website
4 2.7 18 12.2 31 21.2 66 44.9 28 19.0 147 100.0 3.65
8 I obtain my information from other sources 6 4.1 22 15.0 44 29.9 67 45.6 8 5.4 147 100.0 3.33
9 I do not like using the website for my
information requirements
24 16.3 55 37.4 45 30.7 18 12.2 5 3.4 147 100.0 2.49
10 I do not have the necessary skills to use the
website
74 50.3 49 33.3 18 12.3 5 3.4 1 0.7 147 100.0 1.71

175
5.5.3 Superannuation Fund Written Communications
Question 20 was a filter question that asked respondents to indicate whether they have
read the written communications mailed to them by the superannuation fund. Those
who indicated that they have read the communications were automatically directed to
questions 21, 22 and 23, and those responding that they had not were directed to
question 24. Table 5.23 indicates that 69.5 percent of respondents read the
communications whilst 30.5 did not. Therefore, of all the educational options
available to respondents, the written communications were the most highly utilised.
These findings confirm a more extensive use of written communications when
compared to the other information resources provided by the superannuation fund.
The results obtained in this study confirm findings in the Clark-Murphy and Gerrans
(2001) study, where a substantial majority (87.8 percent) of respondents indicated that
they used the information pack, mailed by the university superannuation fund to its
members, to make their decision as to whether to change from the defined benefit plan
to a defined contribution plan. Also relevant in that study was that respondents ranked
these written communications as the most important information resource when it
came to making their decision.
Table 5.23 Read the Superannuation Fund Provided Written
Communications
Frequency Percent
Yes 257 69.5
No 113 30.5
Total 370 100.0
176
5.5.3.1 The Importance of Superannuation Fund Provided Written
Communications
Question 21 was only answered by those respondents who indicated that they read the
superannuation written communications. Table 5.24 reports on the importance placed
by respondents on written communications. Table 5.24 indicates that a majority of
respondents agreed with most statement items. In particular, the information that
informs superannuation fund members on the risks and returns of investment choices
detailed in statement items one, two and three received substantial support as
important matters in decision making. This is consistent with the outcomes from the
website information where similar results were obtained for these items (section
5.5.2.1). Respondents showed little agreement on item four (32.4 percent): this
suggests that the written communications do not inform well on the suitability of
current contributions in meeting adequate retirement savings levels. Many more
respondents agreed (47.4 percent) than disagreed (27.3 percent) with item five that the
written communications assist in making an informed choice in selecting appropriate
investment options. A slight majority (50.2 percent) of respondents agreed that the
written communications inform them on the educational and information services
offered by the superannuation fund. The majority of respondents (54.2 percent) also
agreed with statement seven that, overall, the written communications have informed
them in respect of their superannuation investment decision making.
The summated mean for statement items one through to seven is 24.22 with a standard
deviation of 4.55. The overall mean rating for these statement items is 3.46 with a
standard deviation of 0.650. An overall mean item rating of 3.46 indicates that the
respondents generally felt they were informed by the range of information in the
superannuation fund provided written communications. The standard deviation
(0.650) shows low variability of individual responses from the overall mean.
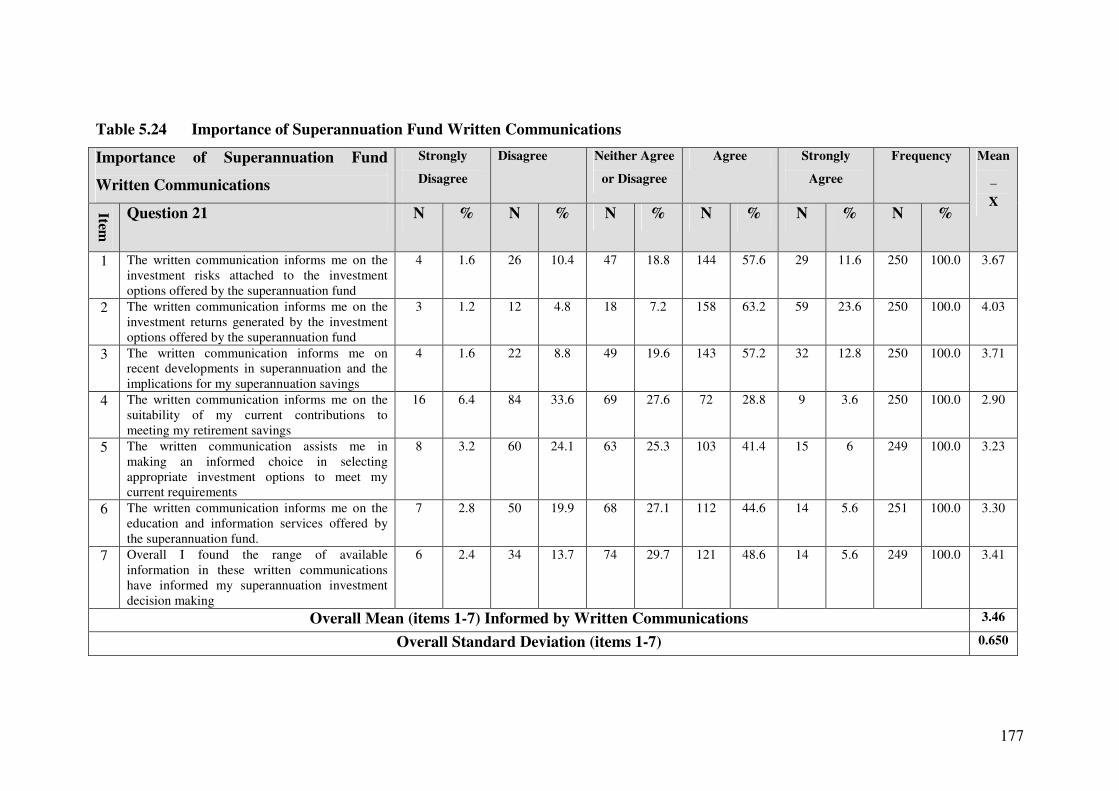
177
Table 5.24 Importance of Superannuation Fund Written Communications
Importance of Superannuation Fund
Written Communications
Strongly
Disagree
Disagree Neither Agree
or Disagree
Agree Strongly
Agree
Frequency
Item
Question 21 N % N % N % N % N % N
%
Mean
_
X
1 The written communication informs me on the
investment risks attached to the investment
options offered by the superannuation fund
4 1.6 26 10.4 47 18.8 144 57.6 29 11.6 250 100.0 3.67
2 The written communication informs me on the
investment returns generated by the investment
options offered by the superannuation fund
3 1.2 12 4.8 18 7.2 158 63.2 59 23.6 250 100.0 4.03
3 The written communication informs me on
recent developments in superannuation and the
implications for my superannuation savings
4 1.6 22 8.8 49 19.6 143 57.2 32 12.8 250 100.0 3.71
4 The written communication informs me on the
suitability of my current contributions to
meeting my retirement savings
16 6.4 84 33.6 69 27.6 72 28.8 9 3.6 250 100.0 2.90
5 The written communication assists me in
making an informed choice in selecting
appropriate investment options to meet my
current requirements
8 3.2 60 24.1 63 25.3 103 41.4 15 6 249 100.0 3.23
6 The written communication informs me on the
education and information services offered by
the superannuation fund.
7 2.8 50 19.9 68 27.1 112 44.6 14 5.6 251 100.0 3.30
7 Overall I found the range of available
information in these written communications
have informed my superannuation investment
decision making
6 2.4 34 13.7 74 29.7 121 48.6 14 5.6 249 100.0 3.41
Overall Mean (items 1-7) Informed by Written Communications 3.46
Overall Standard Deviation (items 1-7) 0.650

178
Those respondents who indicated that they read the superannuation fund mailed
written communications were then asked to rate the importance of this educational
resource. A substantial majority (84.4 percent) of respondents rated them as
important. As shown in Table 5.25, no respondents considered these written
communications to be of no importance. These results present a clear indication of the
importance placed by respondents on the written communications. These findings are
consistent with the results obtained in respect of the educational seminar (Table 5.14)
and superannuation website (Table 5.19), where a large majority of respondents
indicated the importance of these items to their information requirements. Based on
this evidence, it can be assumed that written communications, educational seminars
and the superannuation website represent important media for conveying investment
decision making information to superannuation fund members.
Table 5.25 The Importance Placed on Written Communications for
Superannuation Decision Making
Importance Placed on Written
Communications for Decision
Making
Frequency Percent Cumulative
Percent
No Importance 0 0.0 0.0
Not Very Important 26 10.7 10.7
No Opinion 12 4.9 15.6
Moderately Important 149 61.3 76.9
Very Important 56 23.1 100.0
Total 243 100.0
Mean 3.97

179
Question 23 was only answered by those respondents who indicated that they read the
superannuation written communications. Table 5.26 presents the results on how often
the respondents read superannuation written communications. It was found that 62
percent read them often or very often. Only a very small percentage (2.9) read them
rarely and 35.1 percent read them sometimes. This indicates that a majority of
respondents will often refer to these documents for their superannuation information
requirements. These results are in stark contrast with the results obtained for the
seminars (Table 5.15) and website (Table 5.20) where respondents indicated much
less frequent use of these educational tools: only 17.4 percent of respondents indicated
that they often utilised the seminars (Table 5.15), and 29.8 percent indicated that they
often accessed the website (Table 5.20). It is an important finding that respondents
rate the written communications relatively more importantly and utilise them more
frequently than the educational seminar and superannuation website.
Table 5.26 How Often are the Written Communications Read?
How Often are Written
Communications Read?
Frequency Percent Cumulative
Percent
Rarely 7 2.9 2.9
Sometimes 85 35.1 38.0
Often 111 45.9 83.9
Very Often 39 16.1 100.0
Total 242 100.0
Mean 2.75

180
5.5.3.2 Reasons for the Failure to Read Superannuation Fund Written
Communications
Those respondents who indicated that they did not read the written communications
were given a set of statements outlining a number of possible reasons explaining why
they do not read these communications (see Table 5.27). The majority of respondents
agreed with question 24 items two, three, four, five and six. Most respondents (72.9
percent) agreed with item five that they were not motivated to read the written
communications. Other statement items where considerable agreement was noted
were item three that the written material takes too long to read (69.1 percent), and
item two the length of the material provided (61.6 percent). Majority agreement (51.8
percent) was noted for item four where respondents perceived little relevance in the
material provided. Substantial agreement was provided for item six that suggested
respondents lacked interest in the written material (45.8 percent). The statements that
received the least amount of agreement were items one and seven: where 36.9 percent
of respondents agreed with statement item one that the material provided was too
difficult to understand. This implies that the information presented in the written
communications is not generally perceived as difficult to understand. Less agreement
(34.2 percent) was given for statement item seven that respondents obtained their
information from other sources.
This result is in contrast with the findings on educational seminars (section 5.5.1.3),
where a majority of respondents agreed that they did not attend seminars because they
obtained their information from other sources. To summarise, the main reasons for
respondents not reading the written communications were due to a lack of motivation;
perceiving it would take too long to read the material; the length of the material; and a
perception of a lack of relevance to decision making. Lack of motivation and time
constraints appear to be consistent themes as to why respondents fail to read written
communications, attend seminars (section 5.5.1.3), or access the superannuation fund
website (section 5.5.2.3).

181
Table 5.27 Reasons Respondents Fail to Read Superannuation Fund Provided Written Communications
Superannuation Fund Written
Communication Statements – Reasons
Respondents Fail to Read
Strongly
Disagree
Disagree Neither Agree
or Disagree
Agree Strongly
Agree
Frequency
Item
Question 24 N % N % N % N % N % N
%
Mean
_
X
1 I find the material is difficult to understand 5 4.5 23 20.7 42 37.9 30 27.0 11 9.9 111 100.0 3.17
2 The material provided is too lengthy 1 0.9 5 4.5 37 33.0 45 40.2 24 21.4 112 100.0 3.77
3 It takes too long to read through the material
provided
1 0.9 6 5.5 27 24.5 52 47.3 24 21.8 110 100.0 3.84
4 I perceive little relevance of the material
provided to my superannuation decision making
2 1.8 15 13.4 37 33.0 46 41.1 12 10.7 112 100.0 3.46
5 I am not motivated to read through the material
provided
2 1.8 4 3.6 24 21.7 54 48.6 27 24.3 111 100.0 3.90
6 I am not interested in the material provided 0 0.0 24 22.0 35 32.2 36 33.0 14 12.8 109 100.0 3.37
7 I obtain my information from other sources 5 4.5 20 18.0 48 43.3 27 24.3 11 9.9 111 100.0 3.17

182
5.5.4 Superannuation Fund Provided Financial Counsellor
Question 25 was a filter question that asked respondents to indicate whether they have
obtained financial advice from the superannuation fund provided financial counsellor.
Those who indicated that they received financial counselling were automatically
directed to questions 26, 27 and 28, and those responding they had not were directed
to question 29. Table 5.28 indicates that 19.9 percent of respondents obtained
financial advice from a counsellor whilst 80.1 percent did not. Therefore, of all the
educational options available to respondents, the superannuation fund provided
financial counselling service was the least utilised. These results are consistent with
findings in the Clark-Murphy and Gerrans (2001) study, where it was found that only
11.3 percent of respondents belonging to the Australian university superannuation
fund used the financial counsellor when deciding on whether to change from their
defined benefit fund to a defined contribution fund.
Table 5.28 Used the Superannuation Fund Provided Financial Counsellor
Used the Superannuation Fund
Provided Financial Counsellor
Frequency Percent
Yes 73 19.9
No 294 80.1
Total 367 100.0
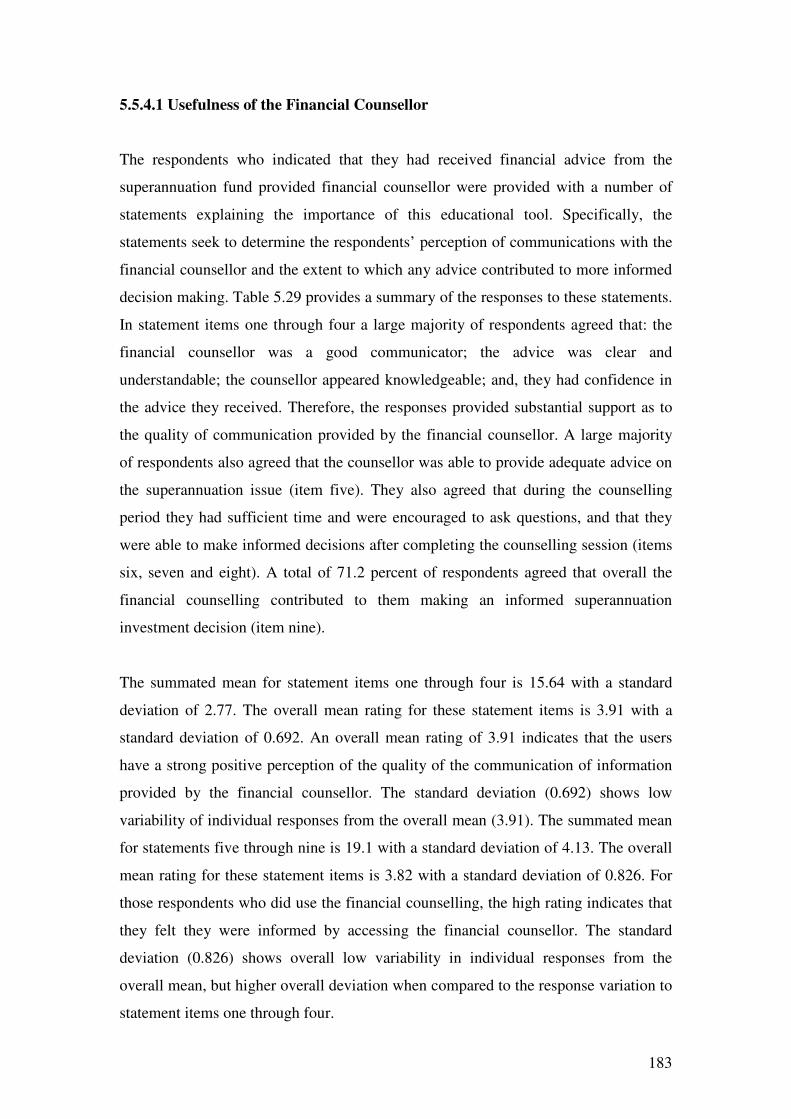
183
5.5.4.1 Usefulness of the Financial Counsellor
The respondents who indicated that they had received financial advice from the
superannuation fund provided financial counsellor were provided with a number of
statements explaining the importance of this educational tool. Specifically, the
statements seek to determine the respondents’ perception of communications with the
financial counsellor and the extent to which any advice contributed to more informed
decision making. Table 5.29 provides a summary of the responses to these statements.
In statement items one through four a large majority of respondents agreed that: the
financial counsellor was a good communicator; the advice was clear and
understandable; the counsellor appeared knowledgeable; and, they had confidence in
the advice they received. Therefore, the responses provided substantial support as to
the quality of communication provided by the financial counsellor. A large majority
of respondents also agreed that the counsellor was able to provide adequate advice on
the superannuation issue (item five). They also agreed that during the counselling
period they had sufficient time and were encouraged to ask questions, and that they
were able to make informed decisions after completing the counselling session (items
six, seven and eight). A total of 71.2 percent of respondents agreed that overall the
financial counselling contributed to them making an informed superannuation
investment decision (item nine).
The summated mean for statement items one through four is 15.64 with a standard
deviation of 2.77. The overall mean rating for these statement items is 3.91 with a
standard deviation of 0.692. An overall mean rating of 3.91 indicates that the users
have a strong positive perception of the quality of the communication of information
provided by the financial counsellor. The standard deviation (0.692) shows low
variability of individual responses from the overall mean (3.91). The summated mean
for statements five through nine is 19.1 with a standard deviation of 4.13. The overall
mean rating for these statement items is 3.82 with a standard deviation of 0.826. For
those respondents who did use the financial counselling, the high rating indicates that
they felt they were informed by accessing the financial counsellor. The standard
deviation (0.826) shows overall low variability in individual responses from the
overall mean, but higher overall deviation when compared to the response variation to
statement items one through four.
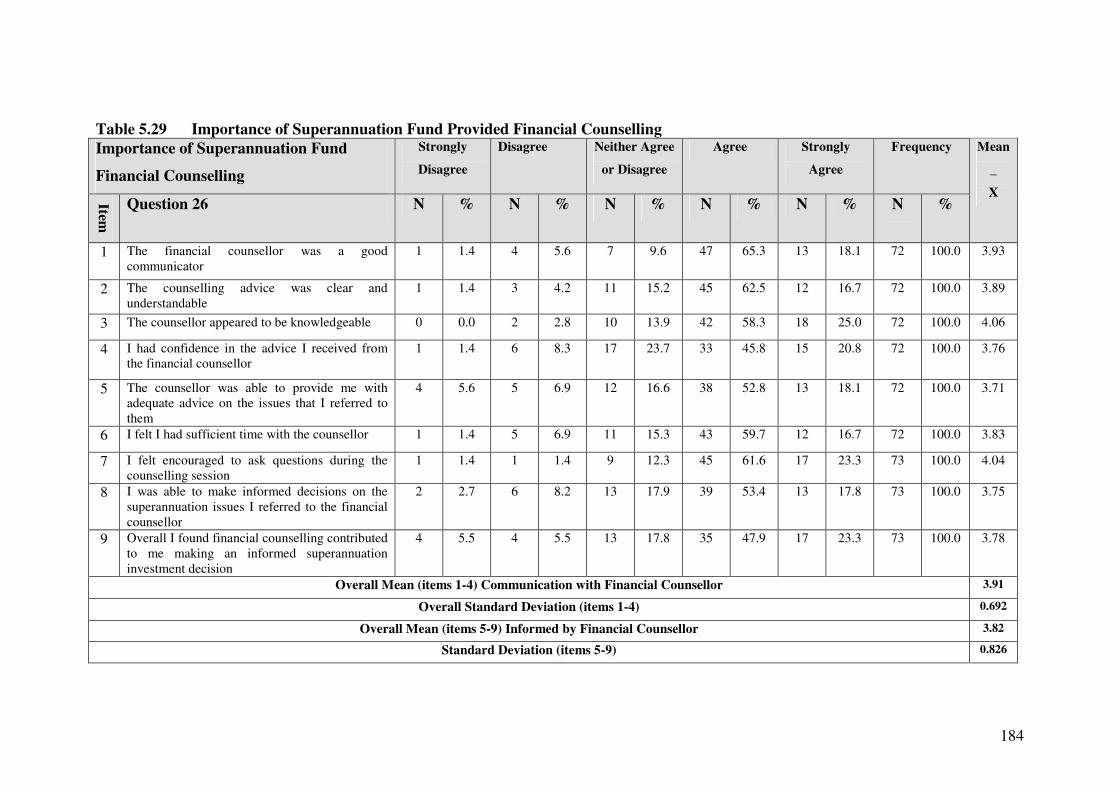
184
Table 5.29 Importance of Superannuation Fund Provided Financial Counselling
Importance of Superannuation Fund
Financial Counselling
Strongly
Disagree
Disagree Neither Agree
or Disagree
Agree Strongly
Agree
Frequency
Item
Question 26 N % N % N % N % N % N
%
Mean
_
X
1 The financial counsellor was a good
communicator
1 1.4 4 5.6 7 9.6 47 65.3 13 18.1 72 100.0 3.93
2 The counselling advice was clear and
understandable
1 1.4 3 4.2 11 15.2 45 62.5 12 16.7 72 100.0 3.89
3 The counsellor appeared to be knowledgeable 0 0.0 2 2.8 10 13.9 42 58.3 18 25.0 72 100.0 4.06
4 I had confidence in the advice I received from
the financial counsellor
1 1.4 6 8.3 17 23.7 33 45.8 15 20.8 72 100.0 3.76
5 The counsellor was able to provide me with
adequate advice on the issues that I referred to
them
4 5.6 5 6.9 12 16.6 38 52.8 13 18.1 72 100.0 3.71
6 I felt I had sufficient time with the counsellor 1 1.4 5 6.9 11 15.3 43 59.7 12 16.7 72 100.0 3.83
7 I felt encouraged to ask questions during the
counselling session
1 1.4 1 1.4 9 12.3 45 61.6 17 23.3 73 100.0 4.04
8 I was able to make informed decisions on the
superannuation issues I referred to the financial
counsellor
2 2.7 6 8.2 13 17.9 39 53.4 13 17.8 73 100.0 3.75
9 Overall I found financial counselling contributed
to me making an informed superannuation
investment decision
4 5.5 4 5.5 13 17.8 35 47.9 17 23.3 73 100.0 3.78
Overall Mean (items 1-4) Communication with Financial Counsellor 3.91
Overall Standard Deviation (items 1-4) 0.692
Overall Mean (items 5-9) Informed by Financial Counsellor 3.82
Standard Deviation (items 5-9) 0.826

185
The respondents that used a financial counsellor were asked to rate the importance of
the superannuation fund provided financial counsellor. Table 5.30 shows that a large
majority, 80.3 percent of respondents, indicated that they found the counselling
service either moderately important or very important. What was significant was that
43.7 percent of respondents rated the counselling as very important. Only 4.2 percent
of respondents found no importance in the financial counselling and 8.5 percent found
it not very important. These results are consistent with what was found in the
respondent rating for the educational seminar, superannuation fund website, and
superannuation fund provided written communications. With all educational
information resources examined, a majority of respondents found them to be either
moderately or very important.
Table 5.30 The Importance Placed on Financial Counselling for
Superannuation Decision Making
The Importance Placed on
Financial Counselling for Decision
Making
Frequency Percent Cumulative
Percent
No Importance 3 4.2 4.2
Not Very Important 6 8.5 12.7
No Opinion 5 7.0 19.7
Moderately Important 26 36.6 56.3
Very Important 31 43.7 100.0
Total 71 100.0
Mean 4.07
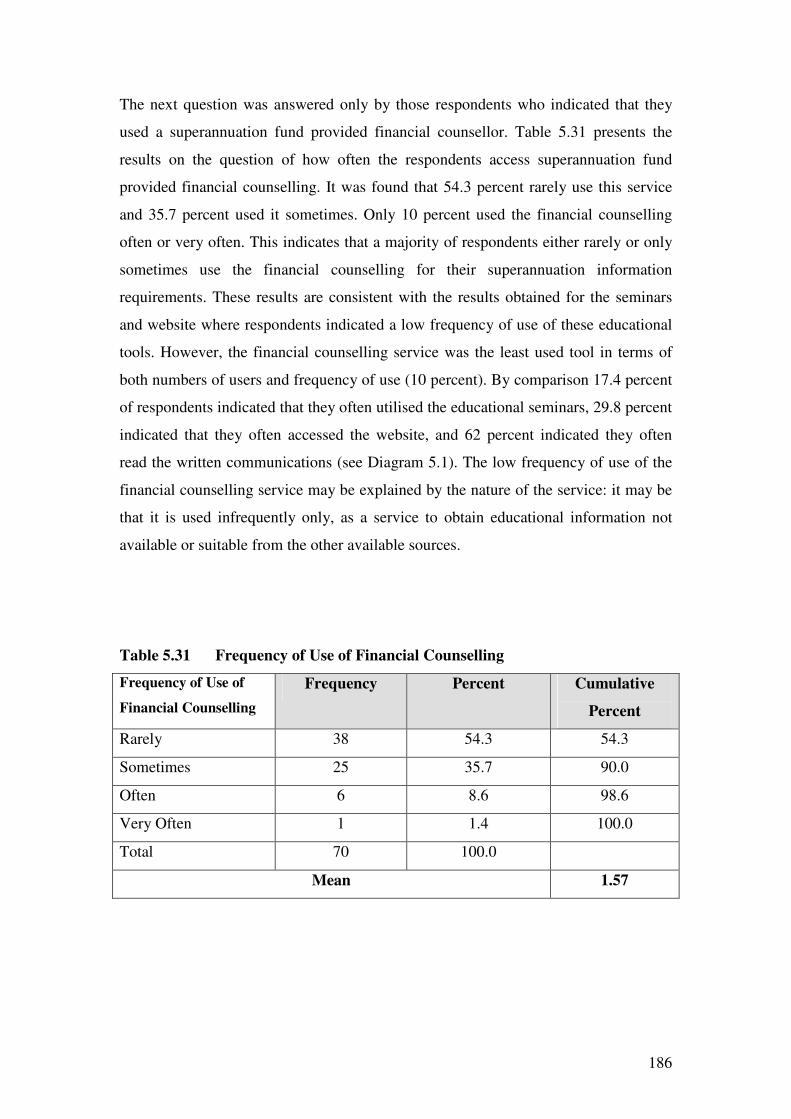
186
The next question was answered only by those respondents who indicated that they
used a superannuation fund provided financial counsellor. Table 5.31 presents the
results on the question of how often the respondents access superannuation fund
provided financial counselling. It was found that 54.3 percent rarely use this service
and 35.7 percent used it sometimes. Only 10 percent used the financial counselling
often or very often. This indicates that a majority of respondents either rarely or only
sometimes use the financial counselling for their superannuation information
requirements. These results are consistent with the results obtained for the seminars
and website where respondents indicated a low frequency of use of these educational
tools. However, the financial counselling service was the least used tool in terms of
both numbers of users and frequency of use (10 percent). By comparison 17.4 percent
of respondents indicated that they often utilised the educational seminars, 29.8 percent
indicated that they often accessed the website, and 62 percent indicated they often
read the written communications (see Diagram 5.1). The low frequency of use of the
financial counselling service may be explained by the nature of the service: it may be
that it is used infrequently only, as a service to obtain educational information not
available or suitable from the other available sources.
Table 5.31 Frequency of Use of Financial Counselling
Frequency of Use of
Financial Counselling
Frequency Percent Cumulative
Percent
Rarely 38 54.3 54.3
Sometimes 25 35.7 90.0
Often 6 8.6 98.6
Very Often 1 1.4 100.0
Total 70 100.0
Mean 1.57
187
Diagram 5.1 A Comparison of the Frequency of Use of Educational Information
Resources
10.0%
17.4%
29.8%
62.0%
0.0%
20.0%
40.0%
60.0%
80.0%
100.0%
Financial Counsellor Seminar Website Written
Communications
Used Often
5.5.4.2 Reasons for the Failure to Use Superannuation Fund Provided Financial
Counselling
Those respondents who indicated that they had not accessed the superannuation fund
provided financial counselling were given a set of statements outlining a number of
reasons as to why they did not use the service. They were asked to indicate the extent
to which they agreed or disagreed with each statement. Table 5.32 summarises the
responses to these statements. Majority agreement was provided for statement ten,
where 54.8 percent of respondents agreed that they obtained their information from
other sources. Similarly, items three, five and nine generated more agreement than
disagreement from the respondents. These statements showed that: many respondents
did not view it necessary to use the counselling; the other information provided was
sufficient for decision making; and they were busy and did not have time to speak to a
financial counsellor. Being busy and not having time are reasons that have
consistently received strong agreement as a reason for failing to utilise an educational
information resource (see sections 5.5.1.3; 5.5.2.3; and 5.5.3.2). There is also

188
evidence within the research findings that respondents generally agree that the use of
other information resources is an important reason for their failure to utilise specific
superannuation provided information (see sections 5.5.1.3 and 5.5.2.3). A majority of
respondents disagreed with statement items one, two, four, seven and eight. This
indicates that most respondents believe that they are aware of the counselling service,
and that they do not hold the belief that there is no benefit from using a financial
counsellor. Furthermore, a majority of respondents indicated they would not feel
uncomfortable speaking to a financial counsellor. They also indicated that they did not
lack confidence in the financial counselling service. Further, a lack of interest and
motivation were not reasons why a majority of respondents did not use the
counselling service.
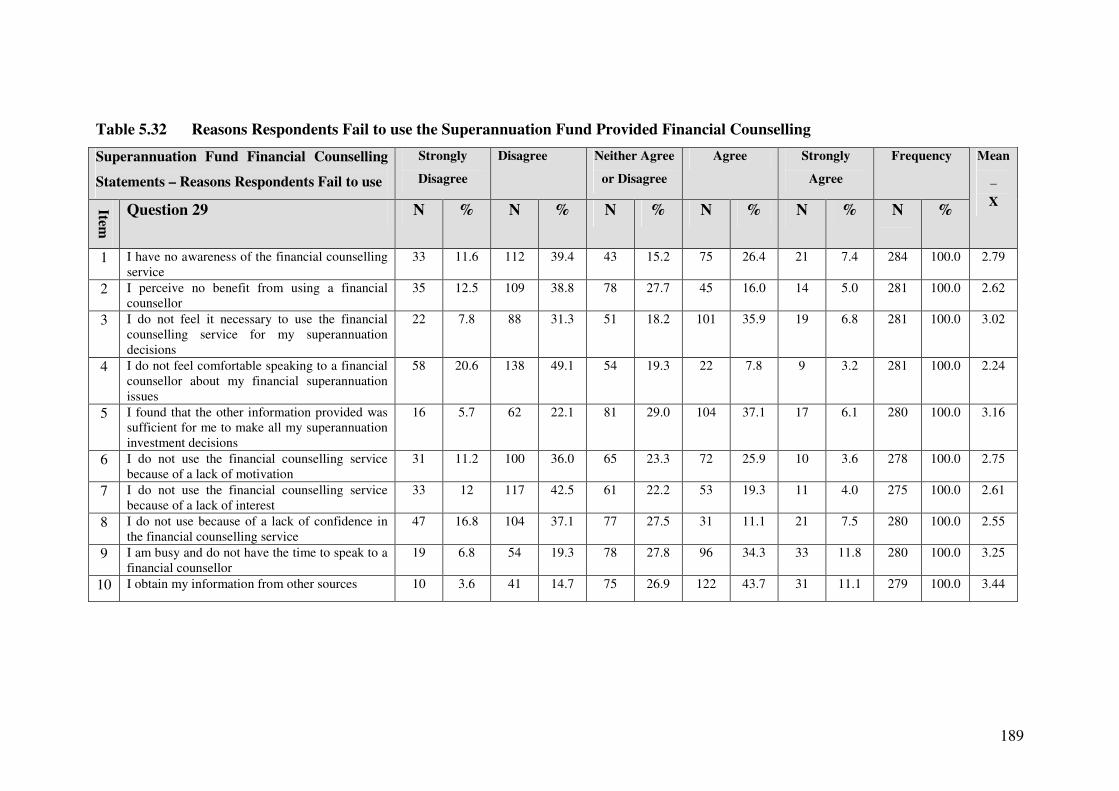
189
Table 5.32 Reasons Respondents Fail to use the Superannuation Fund Provided Financial Counselling
Superannuation Fund Financial Counselling
Statements – Reasons Respondents Fail to use
Strongly
Disagree
Disagree Neither Agree
or Disagree
Agree Strongly
Agree
Frequency
Item
Question 29 N % N % N % N % N % N
%
Mean
_
X
1 I have no awareness of the financial counselling
service
33 11.6 112 39.4 43 15.2 75 26.4 21 7.4 284 100.0 2.79
2 I perceive no benefit from using a financial
counsellor
35 12.5 109 38.8 78 27.7 45 16.0 14 5.0 281 100.0 2.62
3 I do not feel it necessary to use the financial
counselling service for my superannuation
decisions
22 7.8 88 31.3 51 18.2 101 35.9 19 6.8 281 100.0 3.02
4 I do not feel comfortable speaking to a financial
counsellor about my financial superannuation
issues
58 20.6 138 49.1 54 19.3 22 7.8 9 3.2 281 100.0 2.24
5 I found that the other information provided was
sufficient for me to make all my superannuation
investment decisions
16 5.7 62 22.1 81 29.0 104 37.1 17 6.1 280 100.0 3.16
6 I do not use the financial counselling service
because of a lack of motivation
31 11.2 100 36.0 65 23.3 72 25.9 10 3.6 278 100.0 2.75
7 I do not use the financial counselling service
because of a lack of interest
33 12 117 42.5 61 22.2 53 19.3 11 4.0 275 100.0 2.61
8 I do not use because of a lack of confidence in
the financial counselling service
47 16.8 104 37.1 77 27.5 31 11.1 21 7.5 280 100.0 2.55
9 I am busy and do not have the time to speak to a
financial counsellor
19 6.8 54 19.3 78 27.8 96 34.3 33 11.8 280 100.0 3.25
10 I obtain my information from other sources 10 3.6 41 14.7 75 26.9 122 43.7 31 11.1 279 100.0 3.44
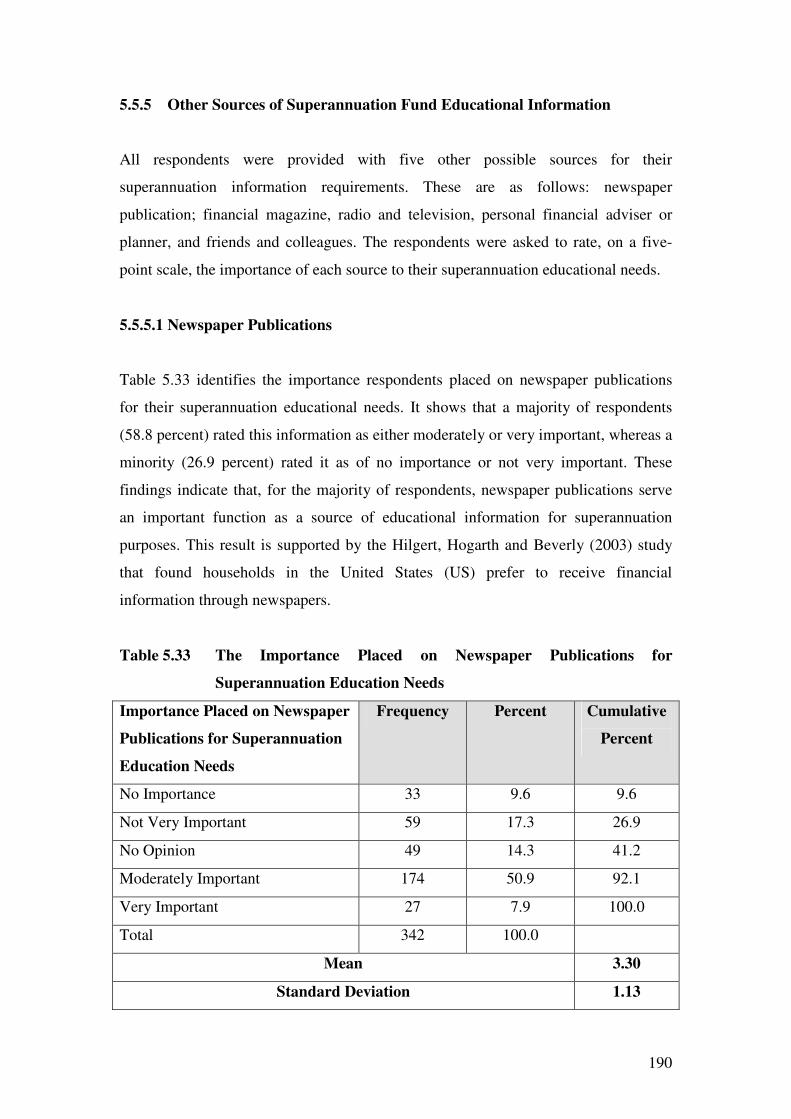
190
5.5.5 Other Sources of Superannuation Fund Educational Information
All respondents were provided with five other possible sources for their
superannuation information requirements. These are as follows: newspaper
publication; financial magazine, radio and television, personal financial adviser or
planner, and friends and colleagues. The respondents were asked to rate, on a five-
point scale, the importance of each source to their superannuation educational needs.
5.5.5.1 Newspaper Publications
Table 5.33 identifies the importance respondents placed on newspaper publications
for their superannuation educational needs. It shows that a majority of respondents
(58.8 percent) rated this information as either moderately or very important, whereas a
minority (26.9 percent) rated it as of no importance or not very important. These
findings indicate that, for the majority of respondents, newspaper publications serve
an important function as a source of educational information for superannuation
purposes. This result is supported by the Hilgert, Hogarth and Beverly (2003) study
that found households in the United States (US) prefer to receive financial
information through newspapers.
Table 5.33 The Importance Placed on Newspaper Publications for
Superannuation Education Needs
Importance Placed on Newspaper
Publications for Superannuation
Education Needs
Frequency Percent Cumulative
Percent
No Importance 33 9.6 9.6
Not Very Important 59 17.3 26.9
No Opinion 49 14.3 41.2
Moderately Important 174 50.9 92.1
Very Important 27 7.9 100.0
Total 342 100.0
Mean 3.30
Standard Deviation 1.13

191
5.5.5.2 Financial Magazines
Table 5.34 identifies the importance respondents placed on financial magazines for
their superannuation educational needs. It indicates that 46.3 percent of respondents
rated this information as either moderately or very important, whereas 34.8 percent
rated it as of no importance or not very important. These results indicate that many
respondents place little importance on financial magazines for their education
requirements. Hilgert, Hogarth and Beverly (2003) found that households in the US
had a preference to receive information through magazines. However, the information
presented in magazines is generalised in nature, and may explain why it did not
receive a higher mean rating for importance by respondents to this study.
Table 5.34 The Importance Placed on Financial Magazines for
Superannuation Education Needs
Importance Placed on Financial
Magazines for Superannuation
Education Needs
Frequency Percent Cumulative
Percent
No Importance 61 18.0 18.0
Not Very Important 57 16.8 34.8
No Opinion 64 18.9 53.7
Moderately Important 127 37.5 91.2
Very Important 30 8.8 100.0
Total 339 100.0
Mean 3.02
Standard Deviation 1.27

192
5.5.5.3 Radio and Television
Table 5.35 identifies the importance respondents placed on radio and television for
their superannuation educational needs. It shows that 38.9 percent of respondents
found this source to be either of no importance or of little importance, while 40.9
percent found this source to be either moderately or very important. The findings are
inconclusive, and tend to indicate that few respondents place high importance on radio
and television for their educational requirements.
Table 5.35 The Importance Placed on Radio and Television for
Superannuation Education Needs
Importance Placed on Radio and
Television for Superannuation
Education Needs
Frequency Percent Cumulative
Percent
No Importance 44 12.9 12.9
Not Very Important 89 26.0 38.9
No Opinion 69 20.2 59.1
Moderately Important 123 36.0 95.1
Very Important 17 4.9 100.0
Total 342 100.0
Mean 2.94
Standard Deviation 1.15

193
5.5.5.4 Personal Financial Adviser or Planner
Table 5.36 identifies the importance respondents placed on a personal financial
adviser or planner for their superannuation educational needs. It shows that 49 percent
of respondents rated this information as either moderately or very important.
Significantly, almost a quarter of respondents (23.3 percent) rate this source as very
important. In contrast, this result differs from those for newspaper publications,
financial magazines and, radio and television, where a much smaller percentage of
respondents rated those sources as very important. It is also noted that a minority of
respondents (28.6 percent) rated the personal financial adviser or planner as either of
no importance or not very important.
Table 5.36 The Importance Placed on Personal Financial Adviser or Planner
for Superannuation Education Needs
Importance Placed on Personal
Financial Adviser or Planner for
Superannuation Education Needs
Frequency Percent Cumulative
Percent
No Importance 47 13.9 13.9
Not Very Important 50 14.7 28.6
No Opinion 76 22.4 51.0
Moderately Important 87 25.7 76.7
Very Important 79 23.3 100.0
Total 339 100.0
Mean 3.30
Standard Deviation 1.34

194
5.5.5.5 Friends and Colleagues
Table 5.37 indicates that a majority of respondents (57.1 percent) rate friends or
colleagues as either moderately or very important sources for their superannuation
education. This indicates a substantial reliance on friends or colleagues when it comes
to obtaining information on superannuation matters. A small minority of respondents
(24.7 percent) rated this source as of no importance or not very important. This result
is consistent with the Clark-Murphy and Gerrans (2001) study that found 48.9 percent
of respondents consulted with work colleagues when deciding whether to change from
a defined benefit plan to a defined contribution plan. Duflo and Saez (2002) in their
US study also confirm the high importance placed by workers on their colleagues
when it came to participation and investment decisions in a retirement plan.
Table 5.37 The Importance Placed on Friends and Colleagues for
Superannuation Education Needs
Importance Placed on Friends and
Colleagues for Superannuation
Education Needs
Frequency Percent Cumulative
Percent
No Importance 32 9.4 9.4
Not Very Important 52 15.3 24.7
No Opinion 62 18.2 42.9
Moderately Important 163 48.0 90.9
Very Important 31 9.1 100.0
Total 340 100.0
Mean 3.32
Standard Deviation 1.12

195
5.6 Summary
This chapter contains a discussion of how the data were prepared for analysis. The use
of a web-based survey for data collection eliminated the need to manually transfer
data to a spreadsheet, thus avoiding transcriptions errors. The number of respondents
was 406 representing a survey response rate of 30.1 percent. The data collected were
analysed using the SPSS statistical analysis software. Where applicable, descriptive
statistics such as frequencies, percentages, central tendency and dispersion, were used
in analysing and presenting the results.
The responses to the demographic questions on gender, age and education were
representative of the university sector as indicated in section 5.4.1. It was also
revealed that the respondents’ attitude to risk and knowledge in financial matters
generally aligned to findings in other studies surveying members of the university
sector superannuation fund. The respondent superannuation account balances were
broadly representative of a range of values in the different categories. In regard to
employment, academics were more highly represented in the response count than non-
academics. However, it is not possible to determine from available information what
the membership split is for academics and non-academics for the university sector
superannuation defined contribution fund.
It was found that written communications was the most utilised information resource
followed by (in descending order) the superannuation fund website, educational
seminars, and financial counselling. These findings support previous research by
Clark-Murphy and Gerrans (2001), except in the current study website access was
found to be much more highly utilised as an information resource. For those
respondents indicating that they used these educational resources (seminars, website,
written communications and financial counselling), a large majority considered them
important for their superannuation financial decision making. Those who used these
educational resources indicated that they did not use them often, except for written
communications, which was often accessed by the majority of respondents.

196
The respondents who indicated that they utilised the educational resources were asked
to rate their usefulness on criteria such as instruction and information. Their
agreement or disagreement to these rating questions was presented and a mean
response was generated in order to address the research questions. A summated mean
was calculated for all question items for all the educational resources. All the
educational resources were, on average, rated highly by respondents. The financial
counselling service received the highest mean rating by users, followed by the
educational written communications, seminar, and superannuation website. This
indicates that the educational resources are generally informing users on
superannuation fund investment matters. Respondents also rated highly the
presentation of information at seminars and the communication with the financial
counsellor. A set of statements was also presented to those respondents that indicated
that they have accessed the superannuation website asking them to rate the importance
of certain website information. All the items received a high rating for importance, but
in particular website items relating to the return performance of investment choices,
expected future return performance of investment options, and risk characteristics
relating to the investment options.
Respondents who indicated that they did not use any of the educational resources
were directed to another section of the survey to determine the reasons why this was
the case. The results obtained from respondents indicated that a lack of time, a lack of
motivation, and obtaining information requirements from other sources were the main
factors for not utilising the information resources. Factors such as a lack of awareness,
a lack of interest, or not perceiving any benefit were not well supported as reasons for
not utilising the information resources.
The final section dealt with other non-superannuation fund provided sources of
information. All respondents were asked to rate the importance placed on these items
for their superannuation educational needs. Information obtained from friends and
colleagues was rated highest followed (in descending order) by newspaper
publications, personal financial adviser or planner, financial magazines, and radio and
television. It appears from the results to these questions that non-superannuation fund
sources of information also play an important role in informing superannuation fund
members on investment issues.

197
Overall the evidence acquired appears to support the need for both superannuation
fund and non-superannuation fund provided educational information in order to meet
members’ information requirements. The results also provide support for the capacity
of superannuation fund educational information resources to inform defined
contribution fund members through information, instruction, and advice, so that they
can make informed investment choice.

198
Chapter Six
Quantitative Data Analysis II: Inferential Statistics and
Cross Tabulations
6.1 Introduction
The descriptive data analysis discussed in the previous chapter was concerned with
summarising and presenting data in a tabular format so as to determine patterns and
relationships which are not apparent in the raw data. Descriptive statistics such as
frequency, mean, and standard deviation were calculated to assist in understanding the
usefulness of superannuation fund educational information which included seminars,
superannuation fund website, written communications received from the
superannuation fund, and superannuation fund provided financial counselling.
Information was gathered to determine the extent and frequency of use, by members,
of these educational resources and the importance that they place on this information
for their investment needs. Further analysis was performed to determine the degree to
which these educational resources contributed to members being more informed on
superannuation fund matters. Multiple factors were explored to determine the reasons
why educational resources were not being used by superannuation fund members.
Analysis was also performed to determine the importance members place on other
(non-superannuation fund) educational information.
Inferential statistics are usually distinguished from descriptive statistics. Descriptive
statistics are used to describe simply the features of the data. Inferential statistics are
used to try and infer from the sample data, the opinions of the population, or to make
judgements of the probability that an observed difference between groups of
respondents is dependable or whether it may have happened by mere chance in the
study (Trochim 2006). This is done by conducting tests for significance such as
ANOVA, and chi-square tests of independence to examine whether group responses
to variables significantly differ from one another. Significance tests are extremely
common in social research (Mohr 1993). In this chapter significance tests will be

199
applied to the descriptive data, which were discussed in the previous chapter, to
determine whether there are any substantial differences in the responses for the
different demographic and background groups. The next section in this chapter will be
a discussion on statistical significance and the selection and implications of a
significance level. This will be followed by a discussion on the significance tests
applied to the data, and an analysis of results will follow. All the Tables in this
chapter were developed from the research.
6.2 Tests of Significance
The process of using a test of statistical significance to generalise from a sample to a
population is known as statistical inference. Somekh and Lewin (2005, p. 227)
explain that:
The test of significance enables us to say how confident we are that the result
achieved from the analysis of data from the sample is a real result or if it is as a result
of chance.
To perform tests of significance we must first choose a significance level. Lewis et al.
2004 suggest that in practice it is common to set it at 1 percent, 5 percent, or 10
percent. The researcher can control the risk of committing an error by setting a more
stringent significance level (Connolly 2007). However, one of the consequences of
making the significance level more stringent is that it increases the risk of rejecting a
finding from the sample even though it may be truly representative of the population.
Therefore, the decision of where to set the statistical significance level involves a
trade-off between rejecting a research proposition when it is true or accepting it when
it is false (Connolly 2007). A decision was made to apply a 10 percent significance
level to all the statistical tests applied throughout this chapter. With all significant
findings the level of significance will be reported so that the reader can ascertain
whether the result was significant at the 1 percent, 5 percent, or 10 percent level. It is
concluded that by setting the level of significance at 10 percent this will moderate the
risk of rejecting a research proposition when it is true or accepting the research
proposition when it is false.
200
6.3. Tests for Differences in Means for Demographic and
Background Groups
To determine whether there is any statistical significance between the mean responses
of different groups the group means responses must be compared. The question then
asked is: are these differences between the means sufficiently large as to reflect real
population differences, or could the difference between the means simply be the result
of error? The process commences by assuming that any differences between group
means are a result of sampling error, and that the real difference between the group
means is effectively zero (De Vaus 2002). The t-test or F-test can be used to examine
whether group means significantly differ from each other. Both these tests have a
similar interpretation but deciding which one to select will depend in part on the
number of groups being compared (De Vaus 2002). The t-test compares two groups,
while the F-test compares the means of more than two groups. In the next section
significance will be tested using a dichotomous independent variable to identify
significant mean differences for the different demographic and background groups.
The t-test will be used to test for significance for groups with two demographic and
background categories. The assumption made is that the means of the demographic
group categories are equal. If there is a significant difference in the mean responses of
the group categories, then unequal mean responses are assumed.
6.3.1 T-Tests for Differences in Means for Dichotomous Independent Groups
The t-test assesses whether the means of two groups are statistically different from
each other. In most survey research it is appropriate to use the independent samples t-
test (De Vaus 2002). This analysis is appropriate whenever a comparison of the means
of two groups is required. The question the t-test addresses is whether the means are
statistically different (Trochim 2006). Differences in mean value may exist within a
single sample between different characteristics of the respondents. However, the
calculation of the t-test is different depending on whether the two independent groups
have equal or unequal mean variance.

201
The Levene’s test is used to determine whether the variance between two groups is
significantly different. If the Levene’s test is significant and equality of variance is not
assumed the t-test is used, otherwise the t-test is used where equal variances are
assumed. In this study differences may occur between: males and females; those with
and without previous employment history in investment and finance; those with and
without formal education in investment and finance; those who are knowledgeable
and those who are not knowledgeable in investment matters, and academic and non-
academic staff. In the following sections both the Levene’s test for equality of
variances, and the t-test results for equality of means will be analysed for the
dichotomous independent groups to test for significant differences in the means for
these groups.
6.3.1.1 Differences between Males and Females
Table 6.1 presents the results of the independent samples t-test that was conducted to
investigate whether there are significant differences in mean values and variances
between the mean responses of males and females to questions on the superannuation
fund provided educational information resources (seminars, website, written
communications, and financial counselling). The significance values of the Levene’s
test in Table 6.1 were insignificant in all cases, and so equality of variance is assumed
between males and females for all the listed educational items. Therefore, the normal
t-test based on equal variances has been used in all cases. The t-tests indicate no
significant differences in mean values between males and females for all the
educational resources. That is, the two groups (males and females) almost always had
the same perspective towards the educational information supplied by the
superannuation fund. The difference in mean responses is shown in the last column of
Table 6.1. A negative sign means that the mean values of the responses from males
was lower in value than the mean values obtained from females.

202
Table 6.1 Mean and Variance Differences to Educational Resources with
Respect to Gender
Levene’s Test for
Equality of
Variances
t-test for Equality
of Means
Sample
Group
Superannuation Fund
Educational
Information
F Sig t Sig (2-
tailed)
Differences in
Means
Seminar Presentation 0.764 0.383 0.980 0.328 0.3514
Informed by Seminar 0.101 0.751 0.882 0.379 0.4874
Informed by Website 1.547 0.215 0.764 0.446 0.6667
Informed by Written
Communications
1.482 0.225 1.076 0.283 0.4849
Communication by
Financial Counsellor
0.822 0.368 -0.547 0.586 -0.2294
Male /
Female
Informed by Financial
Counselling
0.760 0.386 0.537 0.593 0.3444
6.3.1.2 Differences between those with Employment History and those
without Employment History in Investment and Finance
Table 6.2 presents the results of the independent samples t-test that was conducted to
investigate whether there are significant differences in mean values and variances
between the mean responses of those with employment history and those without
employment history in the area of investment and finance, to questions on the
superannuation fund provided educational information resources. The values
produced using the Levene’s tests were insignificant in all cases, except for seminar
presentation and so equality of variance is assumed amongst the two groups for all the
listed educational items, but not for seminar presentation. Other than for seminar
presentation, the normal t-test based on equality in variance has been used. The t-tests
report no significant differences in mean values between the two groups in their rating
of superannuation fund educational resources, except for the mean rating of the
superannuation fund website. In this case those without any employment history in
investment and finance rated the educational information received on the

203
superannuation fund website more highly than those who had employment history in
this area. The difference in the means between the two groups was -1.5709 (refer
Table 6.2).
Table 6.2 Mean and Variance Differences to Educational Resources with
Respect to Employment History in Investment and Finance
Levene’s Test for
Equality of
Variances
t-test for Equality
of Means
Sample
Group
Superannuation
Fund Educational
Information
F Sig t Sig (2-
tailed)
Differences
in Means
Seminar Presentation 3.153 0.078* 1.223 0.224 0.4316
Informed by Seminar 0.785 0.377 -0.270 0.788 -0.1636
Informed by Website 0.169 0.681 -1.673 0.096* -1.5709
Informed by Written
Communications
0.108 0.743 0.305 0.760 0.1543
Communication by
Financial Counsellor
2.101 0.152 0.041 0.968 0.0205
Those with
and those
without
employment
history in
investment
and finance
Informed by
Financial Counselling
1.812 0.183 0.093 0.927 0.0714
* Significant at the 10 percent level
6.3.1.3 Differences between those with Formal Educational Training and
those without Formal Educational Training in Investment and
Finance
Table 6.3 presents the results of the independent samples t-test that was conducted to
investigate whether there are significant differences in mean values and variances
between the mean responses of those with formal educational training and those
without formal educational training in the area of investment and finance, to questions
on the superannuation fund provided educational information resources. The Levene’s
test was insignificant in all but one case (seminar presentation). For all the other

204
educational items, equality of variance is assumed amongst the two groups. Therefore,
the normal t-test based on equality in variance has been used in all cases, except for
the presentation of seminar information. The t-tests report insignificant differences in
mean values between the two groups in their rating of superannuation fund
educational sources, except for the mean ratings relating to the presentation of
seminar information and the superannuation fund website. Those with formal
education in investment and finance rated more highly the presentation of seminar
information than those without any educational training in finance and investment.
Those without educational training rated more highly the information received on the
superannuation fund website (consistent with previous finding) than those with
educational training. The difference in the means between the two groups was 0.6422
and -1.7276 respectively.
Table 6.3 Mean and Variance Differences to Educational Resources with
Respect to Formal Educational Training in Investment and
Finance
Levene’s Test for
Equality of
Variances
t-test for Equality
of Means
Sample
Group
Superannuation
Fund Educational
Information
F Sig t Sig (2-
tailed)
Differences
in Means
Seminar Presentation 2.891 0.091* 1.761 0.082* 0.6422
Informed by Seminar 0.079 0.779 0.340 0.734 0.2181
Informed by Website 1.517 0.219 -1.867 0.063* -1.7276
Informed by Written
Communications
2.191 0.140 -0.399 0.690 -0.1929
Communication by
Financial Counsellor
0.957 0.331 -1.184 0.241 -0.6000
Those with
and those
without
formal
educational
training in
investment
and finance
Informed by
Financial Counselling
1.445 0.233 -1.212 0.229 -0.9211
* Significant at the 10 percent level

205
6.3.1.4 Differences between those with Little or No Knowledge and those with
Moderate or Substantial Knowledge in Investment Matters
Table 6.4 presents the results of the independent samples t-test that was conducted to
investigate whether there are significant differences in mean values and variances
between the mean responses of those with little or no knowledge, and those with
moderate or substantial knowledge in investment matters, to questions on the
superannuation fund provided educational information resources (seminars, website,
written communications, and financial counselling).
Table 6.4 Mean and Variance Differences to Educational Resources with
respect to those with Little or No Knowledge and those with
Moderate or Substantial Knowledge in Investment Matters
Levene’s Test for
Equality of
Variances
t-test for Equality
of Means
Sample
Group
Superannuation
Fund Educational
Information
F Sig t Sig (2-
tailed)
Differences
in Means
Seminar Presentation 0.290 0.591 -1.215 0.226 -0.4604
Informed by Seminar 0.129 0.720 -1.408 0.161 -0.8165
Informed by Website 0.469 0.494 -0.694 0.488 -0.6436
Informed by Written
Communications
0.136 0.713 -1.032 0.303 -0.5014
Communication by
Financial Counsellor
2.689 0.106 -0.859 0.393 -0.3490
Those with
no or little
knowledge
and those
with
moderate or
substantial
knowledge
in
investment
matters
Informed by
Financial Counselling
1.909 0.172 -1.447 0.153 -0.9187
The values produced by the Levene’s test in Table 6.4 were insignificant in all cases,
indicating homogenous variances amongst the two groups for all the listed
educational items. Therefore, the normal t-test based on equal variances was used in
all cases. The t-tests report no significant differences in mean values for the two
groups for all the educational resources. That is, the two groups almost always had the

206
same perspective towards the educational information supplied by the superannuation
fund. The difference in mean responses is shown in the last column of Table 6.4. A
negative sign means that the mean values of the responses from males was lower than
the mean values obtained from females.
6.3.1.5 Differences between Academics and Non-Academics
The results of the independent samples t-test are presented in Table 6.5. This test was
used to investigate whether there were any significant differences in mean values and
variances between the mean responses of academics and non-academics to questions
on the superannuation fund provided educational information resources. The values
produced by the Levene’s tests were insignificant in three of six cases. Presentation of
seminar information, informed by seminar, and informed by the superannuation
website had a significant p-value and equal variances could not be assumed. For all
the other educational items (informed by written communications, communications by
financial counsellor, informed by financial counselling), equality of variance is
assumed amongst the two groups. Therefore, the normal t-test based on inequality in
variance has been used for the first three cases, and equality of variance for the last
three cases. The t-tests report insignificant differences in mean values between the
two groups in their mean ratings relating to communication of information by the
financial counsellor, and informed by financial counselling. For all the other items
significant differences were found. A review of mean differences shows that non-
academics’ mean rating for all these four educational items (presentation of seminar
information; informed by seminar; informed by superannuation website, and informed
by written communications) is substantially higher than academics.
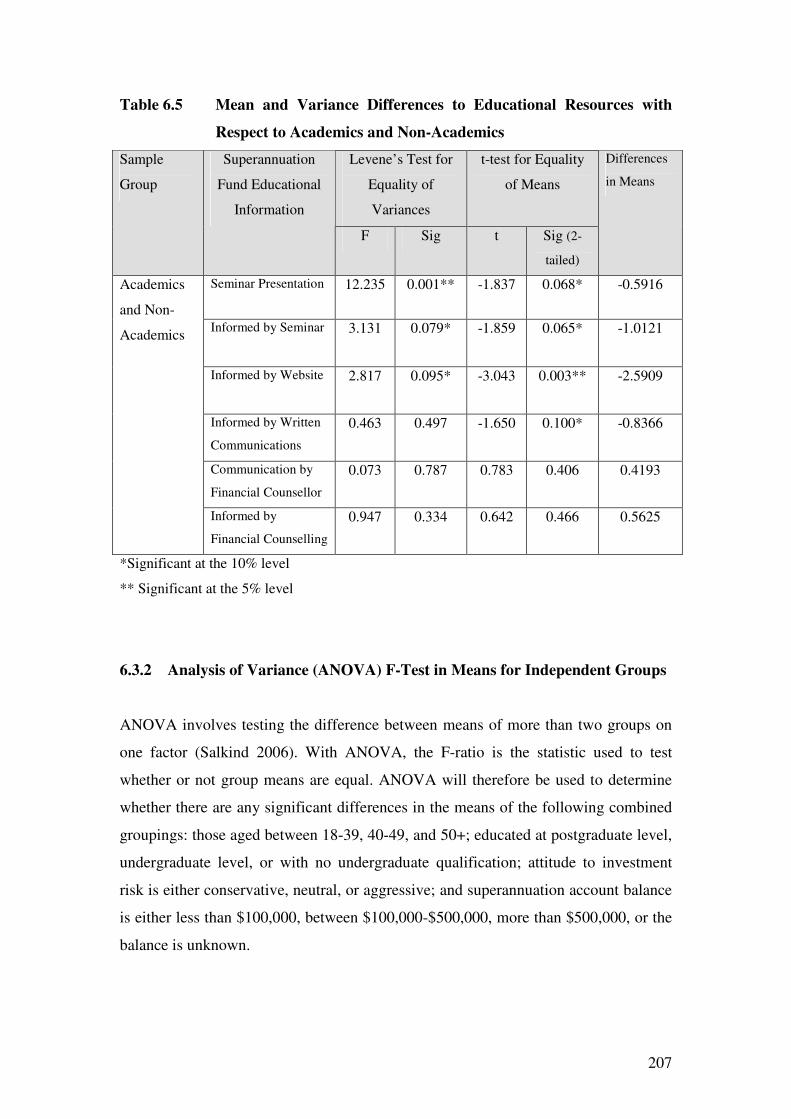
207
Table 6.5 Mean and Variance Differences to Educational Resources with
Respect to Academics and Non-Academics
Levene’s Test for
Equality of
Variances
t-test for Equality
of Means
Sample
Group
Superannuation
Fund Educational
Information
F Sig t Sig (2-
tailed)
Differences
in Means
Seminar Presentation 12.235 0.001** -1.837 0.068* -0.5916
Informed by Seminar 3.131 0.079* -1.859 0.065* -1.0121
Informed by Website 2.817 0.095* -3.043 0.003** -2.5909
Informed by Written
Communications
0.463 0.497 -1.650 0.100* -0.8366
Communication by
Financial Counsellor
0.073 0.787 0.783 0.406 0.4193
Academics
and Non-
Academics
Informed by
Financial Counselling
0.947 0.334 0.642 0.466 0.5625
*Significant at the 10% level
** Significant at the 5% level
6.3.2 Analysis of Variance (ANOVA) F-Test in Means for Independent Groups
ANOVA involves testing the difference between means of more than two groups on
one factor (Salkind 2006). With ANOVA, the F-ratio is the statistic used to test
whether or not group means are equal. ANOVA will therefore be used to determine
whether there are any significant differences in the means of the following combined
groupings: those aged between 18-39, 40-49, and 50+; educated at postgraduate level,
undergraduate level, or with no undergraduate qualification; attitude to investment
risk is either conservative, neutral, or aggressive; and superannuation account balance
is either less than $100,000, between $100,000-$500,000, more than $500,000, or the
balance is unknown.

208
Where the F-test statistic identifies a significant relationship, and there are more than
two groups, it will then be unclear where the differences among the group means lie.
In this case, Lomax (2007a) suggests that some multiple comparison procedure (post-
hoc tests) should be used to determine where the mean differences are in the groups.
However, these post-hoc tests should only be performed after overall significance has
been established (Bakeman & Robinson 2005). There are numerous post-hoc test
alternatives from which to choose. Morgan, Gliner and Harmon (2006) list the most
common post-hoc tests as: Fisher’s least significance difference test (LSD); Tuckey’s
honestly significant difference test (HSD); Newman-Keuls test, Scheffe’s test; and,
Dunnett’s test. The LSD post-hoc test is used in this research study to identify any
significant relationships that exist between the groups, and will follow from ANOVA
discussions. The category groups to be analysed in this section are all three-category
groups, except for superannuation account balances, which has four categories. The
LSD test is said to have precise control of the family-wise error rate (the probability
of rejecting a research proposition where it is true of the population when performing
multiple pair-wise tests) for three-category group situations (Lomax 2007b).
6.3.2.1 Differences Between Groups Based on Age
The results to the ANOVA F-tests are presented in Table 6.6. These tests are
conducted to investigate whether there are any significant differences in mean values
between those in the age categories 18-39, 40-49, and 50+. The F-test shows no
significant differences in mean values between the three groups in their ratings for all
superannuation fund educational information. That is, the three age groups have the
same perspective towards the educational information supplied by the superannuation
fund. As stated in the previous section, there is no need to proceed to the post-hoc
tests as no significant relationships were found.

209
Table 6.6 Mean Differences to Educational Resources with Respect to Age
Sample Group Superannuation Fund Educational
Information
F-Value Sig.
Seminar Presentation 2.059 0.131
Informed by Seminar 0.389 0.678
Informed by Website 1.367 0.257
Informed by Written Communications 1.570 0.210
Communication by Financial Counsellor 0.330 0.720
Age Categories:
18-39
40-49
50+
Informed by Financial Counselling 0.028 0.973
6.3.2.2 Differences Between Groups Based on Education
ANOVA F-tests were conducted to investigate whether there are any significant
differences in mean values between the mean responses of those educated at the
postgraduate level, undergraduate level, and those with no undergraduate
qualification, to questions on superannuation fund provided educational information
resources. The results presented in Table 6.7 show no significant differences in mean
values between the three groups in their ratings for all of the superannuation fund
educational information, except for informed by seminars, and informed by the
superannuation fund website. Therefore, the respondents in the three education level
categories have the same perspective towards seminar presentation, informed by
written communications, communication by financial counsellor, and informed by
financial counsellor. They had different perspectives on informed by seminar, and
informed by the superannuation fund website. The LSD post-hoc tests on these
significant educational resources are presented in Table 6.8. It shows that for the
educational information variable, informed by seminar, there was a significant mean
difference between the postgraduate-qualified and the no undergraduate qualification
groups. There was also a significant mean difference between the undergraduate-
qualified with the no undergraduate qualification groups. No significant mean
differences were found between the postgraduate qualified and the undergraduate
qualified groups. This indicates a significant mean difference between those educated
at the undergraduate level and above, and those having no undergraduate
qualification.

210
Table 6.7 Mean Differences to Educational Resources with Respect to
Education
Sample Group Superannuation Fund Educational
Information
F-Value Sig.
Seminar Presentation 0.314 0.731
Informed by Seminar 3.234 0.042*
Informed by Website 4.770 0.009*
Informed by Written Communications 0.601 0.549
Communication by Financial Counsellor 1.134 0.328
Education
Categories:
Postgraduate;
Undergraduate;
No
Undergraduate
qualification
Informed by Financial Counselling 0.482 0.620
*Significant at the 5% level
Table 6.8 The Results of the Fisher’s Least Significance Difference Tests
(LSD) for Educational Level
Superannuation Fund
Educational Information
with Significant F-Test
Education Level Inter Group
Relationships
Sig.
Postgraduate Undergraduate 0.040**
Postgraduate No Undergraduate 0.869
Informed by Seminar
Undergraduate No Undergraduate 0.076*
Postgraduate Undergraduate 0.375
Postgraduate No Undergraduate 0.003**
Informed by Website
Undergraduate No Undergraduate 0.086*
*Significant at the 10% level
** Significant at the 5% level
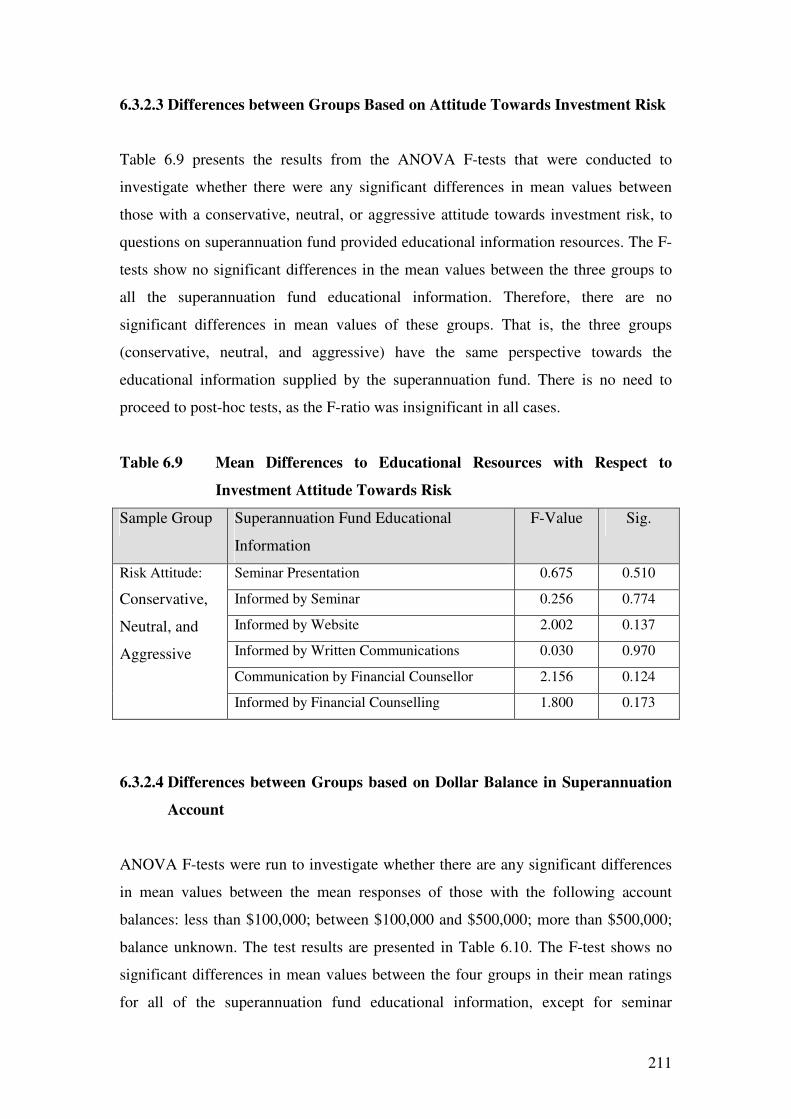
211
6.3.2.3 Differences between Groups Based on Attitude Towards Investment Risk
Table 6.9 presents the results from the ANOVA F-tests that were conducted to
investigate whether there were any significant differences in mean values between
those with a conservative, neutral, or aggressive attitude towards investment risk, to
questions on superannuation fund provided educational information resources. The F-
tests show no significant differences in the mean values between the three groups to
all the superannuation fund educational information. Therefore, there are no
significant differences in mean values of these groups. That is, the three groups
(conservative, neutral, and aggressive) have the same perspective towards the
educational information supplied by the superannuation fund. There is no need to
proceed to post-hoc tests, as the F-ratio was insignificant in all cases.
Table 6.9 Mean Differences to Educational Resources with Respect to
Investment Attitude Towards Risk
Sample Group Superannuation Fund Educational
Information
F-Value Sig.
Seminar Presentation 0.675 0.510
Informed by Seminar 0.256 0.774
Informed by Website 2.002 0.137
Informed by Written Communications 0.030 0.970
Communication by Financial Counsellor 2.156 0.124
Risk Attitude:
Conservative,
Neutral, and
Aggressive
Informed by Financial Counselling 1.800 0.173
6.3.2.4 Differences between Groups based on Dollar Balance in Superannuation
Account
ANOVA F-tests were run to investigate whether there are any significant differences
in mean values between the mean responses of those with the following account
balances: less than $100,000; between $100,000 and $500,000; more than $500,000;
balance unknown. The test results are presented in Table 6.10. The F-test shows no
significant differences in mean values between the four groups in their mean ratings
for all of the superannuation fund educational information, except for seminar

212
presentation. Therefore, the respondent groups with different account category
balances have the same perspective towards informed by seminar, informed by
website, informed by written communications, communication by financial
counsellor, and informed by financial counselling. The groups did however have a
different opinion on seminar presentation. In this case it is not possible to perform a
post-hoc test as one group (balance unknown) had fewer than two cases (one case).
Ignoring this single case, the mean values for the group categories for seminar
presentation, indicate that the group with a balance between $100,000 and $500,000
appears to have a relatively larger mean (13.821) than the other two groups:
<$100,000 group (13.133), and >$500,000 group (13.268).
Table 6.10 Mean Differences to Educational Resources with Respect to
Balance in Superannuation Account
Sample Group Superannuation Fund Educational
Information
F-Value Sig.
Seminar Presentation 2.247 0.085*
Informed by Seminar 0.468 0.705
Informed by Website 0.597 0.618
Informed by Written Communications 0.289 0.834
Communication by Financial Counsellor 1.488 0.226
Account Balances:
Below $100,000;
Between $100,000 and
$500,000;
More than $500,000;
Balance Unknown Informed by Financial Counselling 1.270 0.291
*Significant at the 10 percent level
6.4 Chi-square Tests of Independence for Differences in Responses of
Independent Demographic and Background Groups
The chi-square test for independence is said to be the most common type of statistical
significance test used by social researchers (David & Sutton. 2004; Williams 2003).
The chi-square test is applied to contingency tables that cross-tabulate the relationship
between variables. The Table consists of rows and columns where the column
represents the categories of one variable and the rows represent categories of another
variable. The intersection of the column and a row produces a cell which represents
cases having the attributes of the variables of that column and row. The chi-square

213
test is used to determine whether enough evidence exists from the data to conclude
that there is a significant statistical relationship between the two variables. David and
Sutton (2004) suggest that it allows the researcher to judge whether the observed
differences in the variables are real and not due to fluctuations that occur by chance.
The statistical significance of a chi-square is measured through a p-value. If this p-
value is below the designated significance level (10 percent for this research study),
then it is considered that no significant difference exists between the variables. It is
also important to note that with chi-square calculations no more than 20 percent of
frequency cells should contain an expected count of less than five, otherwise the result
may be deemed inaccurate. (Somekh & Lewin 2005). Any violations relating to the
requirement of a minimum expected count of five are reported in the SPSS output as
part of the chi-square calculation. No violations were expected, and none occurred. In
the sections to follow, comparisons are made by reviewing single question responses
to the superannuation fund provided educational information to establish any
significant differences with the various demographic and background groups. The
analysis also extends to the data relating to non-superannuation fund sources of
information to check for significant differences in the responses provided by the
demographic and background groups.
6.4.1 Differences between Groups with Respect to Attending the Educational
Seminar
Chi-square tests of independence were conducted to determine whether the
demographic or background group categories were statistically significant when it
came to attending the educational seminars. No significant relationships were found
for qualification level, previous employment history in investment and finance, formal
educational training in investment and finance, and attitude to risk. The following
analysis focuses on those groups where significant differences in response categories
were established.

214
Table 6.11 indicates statistical significance for gender and attending a seminar
(p=0.014), and shows that the probability of a male attending a seminar is greater than
a female attending. Table 6.11 shows that 49.2 percent of male respondents indicated
that they had attended a seminar, whereas only 37 percent of female respondents
indicated attending a seminar.
Table 6.11 Cross-tabulation of Seminar Attendance by Gender
Attended Seminar
Gender Yes No
Row Total
Male 91 94 185
49.2% 50.8% 100.0%
Female 78 133 211
37.0% 63.0% 100.0%
Total 169 227 396
Chi-square = 6.019 P = 0.014*
Table 6.12 indicates statistical significance for age and attending a seminar (p=0.000).
It is shows that the older, 50+ years group, is far more likely to attend a seminar than
either the 18-39 year or the 40-49 years age groups. It is also revealed that the 40-49
years age group is more likely to attend a seminar than the 18-39 age group. For the
18-39 year category only 24.2 percent indicated they had attended a seminar. In the
40-49 year age category 38.7 percent indicated that they had attended a seminar, and
in the 50+ years age category 58.7 percent indicated that they had attended a seminar.
Table 6.12 Cross-tabulation of Seminar Attendance by Age
Attended Seminar Age
Group Yes No
Row Total
18-39 Years 29 91 120
24.2% 75.8% 100.0%
40-49 Years 43 68 111
38.7% 61.3% 100.0%
50+ Years 98 69 167
58.7% 41.3% 100.0%
Total 170 228 398
Chi-square 34.991 p =0.000*
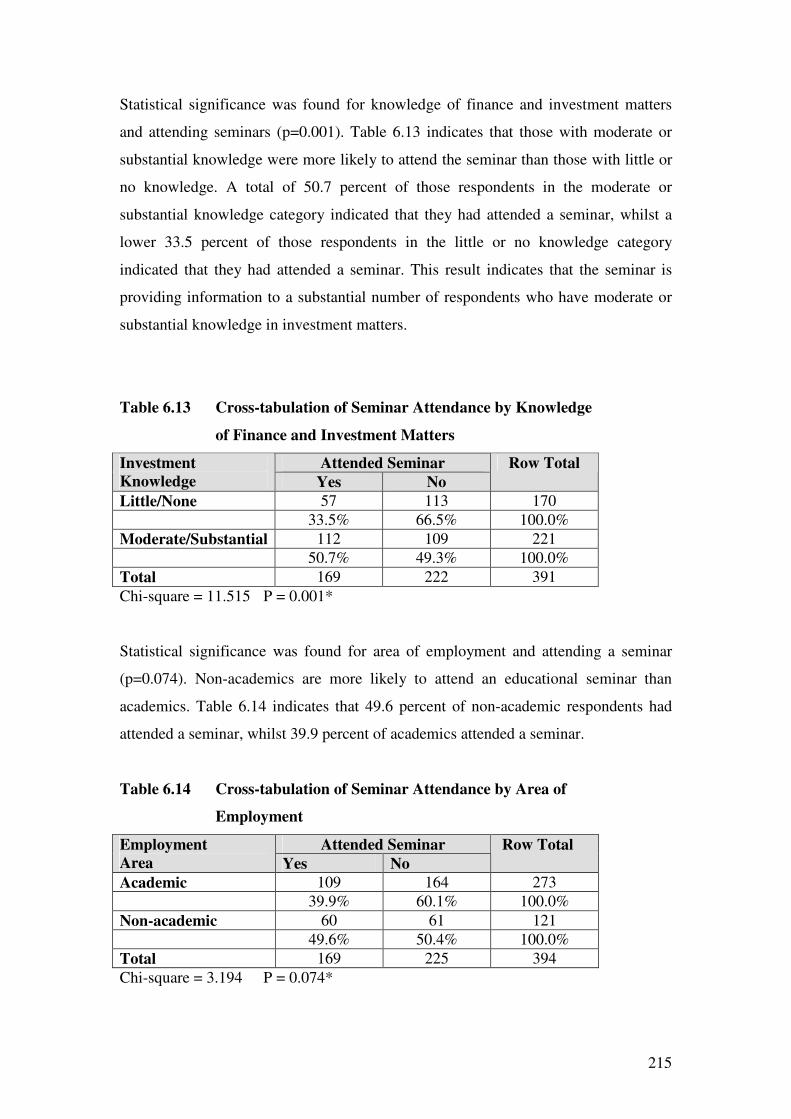
215
Statistical significance was found for knowledge of finance and investment matters
and attending seminars (p=0.001). Table 6.13 indicates that those with moderate or
substantial knowledge were more likely to attend the seminar than those with little or
no knowledge. A total of 50.7 percent of those respondents in the moderate or
substantial knowledge category indicated that they had attended a seminar, whilst a
lower 33.5 percent of those respondents in the little or no knowledge category
indicated that they had attended a seminar. This result indicates that the seminar is
providing information to a substantial number of respondents who have moderate or
substantial knowledge in investment matters.
Table 6.13 Cross-tabulation of Seminar Attendance by Knowledge
of Finance and Investment Matters
Attended Seminar Investment
Knowledge Yes No
Row Total
Little/None 57 113 170
33.5% 66.5% 100.0%
Moderate/Substantial 112 109 221
50.7% 49.3% 100.0%
Total 169 222 391
Chi-square = 11.515 P = 0.001*
Statistical significance was found for area of employment and attending a seminar
(p=0.074). Non-academics are more likely to attend an educational seminar than
academics. Table 6.14 indicates that 49.6 percent of non-academic respondents had
attended a seminar, whilst 39.9 percent of academics attended a seminar.
Table 6.14 Cross-tabulation of Seminar Attendance by Area of
Employment
Attended Seminar Employment
Area Yes No
Row Total
Academic 109 164 273
39.9% 60.1% 100.0%
Non-academic 60 61 121
49.6% 50.4% 100.0%
Total 169 225 394
Chi-square = 3.194 P = 0.074*

216
Table 6.15 identifies a significant finding for superannuation account balance and
attending an educational seminar (p =0.000). Those groups with more than $500,000
in their superannuation were more likely to attend a seminar than those with lower
balances. It also shows that the group with a balance less than $100,000, and the
balance unknown group are less likely to attend a seminar than the higher account
balance groups. Only 5.3 percent of the balance unknown group indicated attending a
seminar. The more than $500,000 account balance group had the highest attendance
percentage (67.2 percent) followed by the $100,000 to $500,000 group (46.1 percent),
and the less than $100,000 group (29.0 percent). The findings reveal that those with
higher account balances are much more likely to engage with the education provided
through a seminar than those with relatively smaller account balances.
Table 6.15 Cross-tabulation of Seminar Attendance by
Superannuation Account Balance
Attended Seminar Superannuation
Account Balance Yes No
Row Total
Less than $100,000 31 76 107
29.0% 71.0% 100.0%
$100,000 - $500,000 77 90 167
46.1% 53.9% 100.0%
More than $500,000 41 20 61
67.2% 32.8% 100.0%
Balance Unknown 1 18 19
5.3% 94.7% 100.0%
Total 150 204 354
Chi-square 34.953 p =0.000*
6.4.2 Differences between Groups with Respect to Accessing the
Superannuation Fund Website
Chi-square tests of independence were conducted to determine whether the
demographic or background group categories were statistically significant when it
came to accessing the superannuation fund website. No significant relationships were
found for age, qualification level, and area of employment. The following analysis

217
focuses on those groups where significant differences in response categories were
established.
Table 6.16 shows that statistical significance was found for gender and accessing the
superannuation fund website (p=0.011). The probability of a male accessing the
superannuation fund website is greater than a female accessing it. Table 6.16 shows
that 67.8 percent of male respondents indicated that they had accessed the website,
whereas 55.1 percent of female respondents indicated accessing the website. This is a
similar result to that found in section 6.4.1 where significantly more males attended a
superannuation seminar than females.
Table 6.16 Cross-tabulation of Accessing Superannuation Fund
Website by Gender
Website Access
Gender Yes No
Row Total
Male 124 59 183
67.8% 32.2% 100.0%
Female 113 92 205
55.1% 44.9% 100.0%
Total 237 151 388
Chi-square = 6.496 P = 0.011*
Table 6.17 indicates statistical significance for previous employment in investment
and finance and accessing the superannuation fund website (p=0.006). Those with
previous employment in investment and finance were more likely to access the
superannuation fund website than those without this employment history. Table 6.17
shows that 72.7 percent of those with previous employment in investment and finance
had accessed the superannuation website, whereas 57.0 percent of those without such
employment history accessed the website.

218
Table 6.17 Cross-tabulation of Accessing Superannuation Fund
Website by Employment History in Investment and
Finance
Website Access Employment History
In Investment and
Finance Yes No
Row Total
Yes 72 27 99
72.7% 27.3% 100.0%
No 162 122 284
57.0% 43.0% 100.0%
Total 234 149 383
Chi-square = 7.598 P = 0.006*
Table 6.18 indicates strong statistical significance for educational training in
investment and finance and accessing the superannuation fund website (p=0.013).
Those with educational training in investment and finance were more likely to access
the superannuation fund website than those without such training. The Table shows
that 71.3 percent of those with educational training in investment and finance had
accessed the superannuation website, whereas 57.3 percent of those without such
educational training accessed the website.
Table 6.18 Cross-tabulation of Accessing Superannuation Fund
Website by Educational Training in Investment and
Finance
Website Access Educational Training
In Investment and
Finance Yes No
Row Total
Yes 72 29 101
71.3% 28.7% 100.0%
No 165 123 288
57.3% 42.7% 100.0%
Total 237 152 389
Chi-square = 6.152 P = 0.013*
Statistical significance was found for those groups indicating different levels of
knowledge in finance and investment matters and accessing the superannuation fund
website (p=0.001). Table 6.19 reveals that those with moderate or substantial
knowledge were more likely to access the superannuation fund website than those
with little or no knowledge. A total of 67.7 percent of respondents in the moderate or
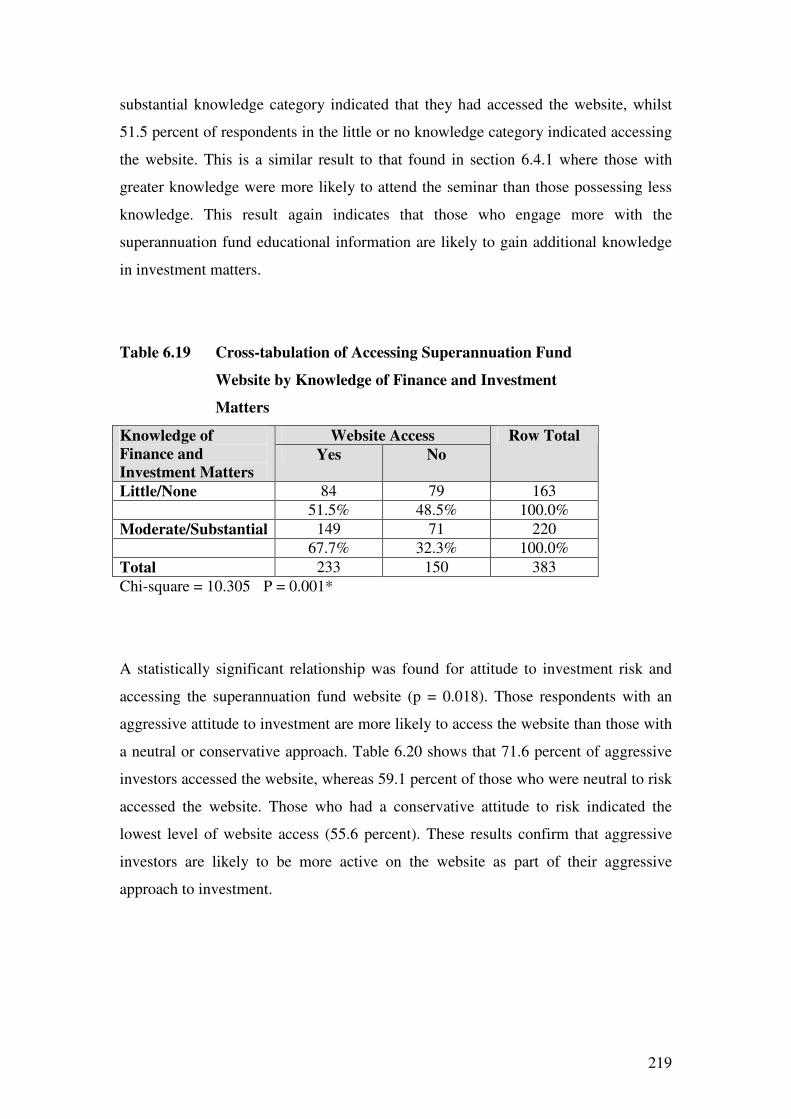
219
substantial knowledge category indicated that they had accessed the website, whilst
51.5 percent of respondents in the little or no knowledge category indicated accessing
the website. This is a similar result to that found in section 6.4.1 where those with
greater knowledge were more likely to attend the seminar than those possessing less
knowledge. This result again indicates that those who engage more with the
superannuation fund educational information are likely to gain additional knowledge
in investment matters.
Table 6.19 Cross-tabulation of Accessing Superannuation Fund
Website by Knowledge of Finance and Investment
Matters
Website Access Knowledge of
Finance and
Investment Matters Yes No
Row Total
Little/None 84 79 163
51.5% 48.5% 100.0%
Moderate/Substantial 149 71 220
67.7% 32.3% 100.0%
Total 233 150 383
Chi-square = 10.305 P = 0.001*
A statistically significant relationship was found for attitude to investment risk and
accessing the superannuation fund website (p = 0.018). Those respondents with an
aggressive attitude to investment are more likely to access the website than those with
a neutral or conservative approach. Table 6.20 shows that 71.6 percent of aggressive
investors accessed the website, whereas 59.1 percent of those who were neutral to risk
accessed the website. Those who had a conservative attitude to risk indicated the
lowest level of website access (55.6 percent). These results confirm that aggressive
investors are likely to be more active on the website as part of their aggressive
approach to investment.

220
Table 6.20 Cross-tabulation of Accessing Superannuation Fund
Website by Attitude to Investment Risk
Website Access Attitude to
Investment Risk Yes No
Row Total
Conservative 114 91 205
55.6% 44.4% 100.0%
Neutral 39 27 66
59.1% 40.9% 100.0%
Aggressive 83 33 116
71.6% 28.4% 100.0%
Total 236 151 387
Chi-square 8.032 p =0.018*
Table 6.21 identifies a statistically significant result for superannuation account
balance and accessing the website (p = 0.000). Those groups with more than $500,000
in their superannuation account were more likely to access the superannuation fund
website than those with lower balances. It also shows that the group with a balance
less than $100,000, and the balance unknown group are less likely to access the
website than the higher account balance groups. Only 31.6 percent of the balance
unknown group indicated that they had accessed the website. The group with more
than a $500,000 account balance had the highest level of website access (73.8
percent) followed by the $100,000 to $500,000 group (65.3 percent), and then the less
than $100,000 group (48.6 percent). The findings reveal a strong relationship between
superannuation account balance and accessing the website. That is, those with higher
account balances are more likely to engage the educational information than those
with relatively smaller account balances. This result supports the findings in section
6.4.1 regarding superannuation account balances and attendance at the educational
seminar, where similar patterns emerged.

221
Table 6.21 Cross-tabulation of Accessing Superannuation Fund
Website by Superannuation Account Balance
Website Access Superannuation
Account Balance Yes No
Row Total
Less than $100,000 52 55 107
48.6% 51.4% 100.0%
$100,000 - $500,000 109 58 167
65.3% 34.7% 100.0%
More than $500,000 45 16 61
73.8% 26.2% 100.0%
Balance Unknown 6 13 19
31.6% 68.4% 100.0%
Total 212 142 354
Chi-square 18.923 p =0.000*
6.4.3 Differences between Groups with Respect to Reading the Superannuation
Fund Written Communications
Chi-square tests of independence were conducted to determine whether the
demographic or background group categories were statistically significant when it
came to reading the superannuation fund written communications. No significant
relationships were found for age, qualification level, employment history in finance
and investment, and area of employment. The following analysis focuses on those
groups where significant differences in response categories were established.
Table 6.22 indicates statistical significance for gender (p=0.017). The probability of a
male reading the written communications is greater than a female reading them. Table
6.22 shows that 75.3 percent of male respondents indicated that they had read the
written communications, whereas, a lower, 63.7 percent of female respondents
indicated reading them. This is a similar result to that found in the previous two
sections 6.4.1 and 6.4.2 where significantly more males attended a superannuation
seminar and accessed the superannuation fund website than females.
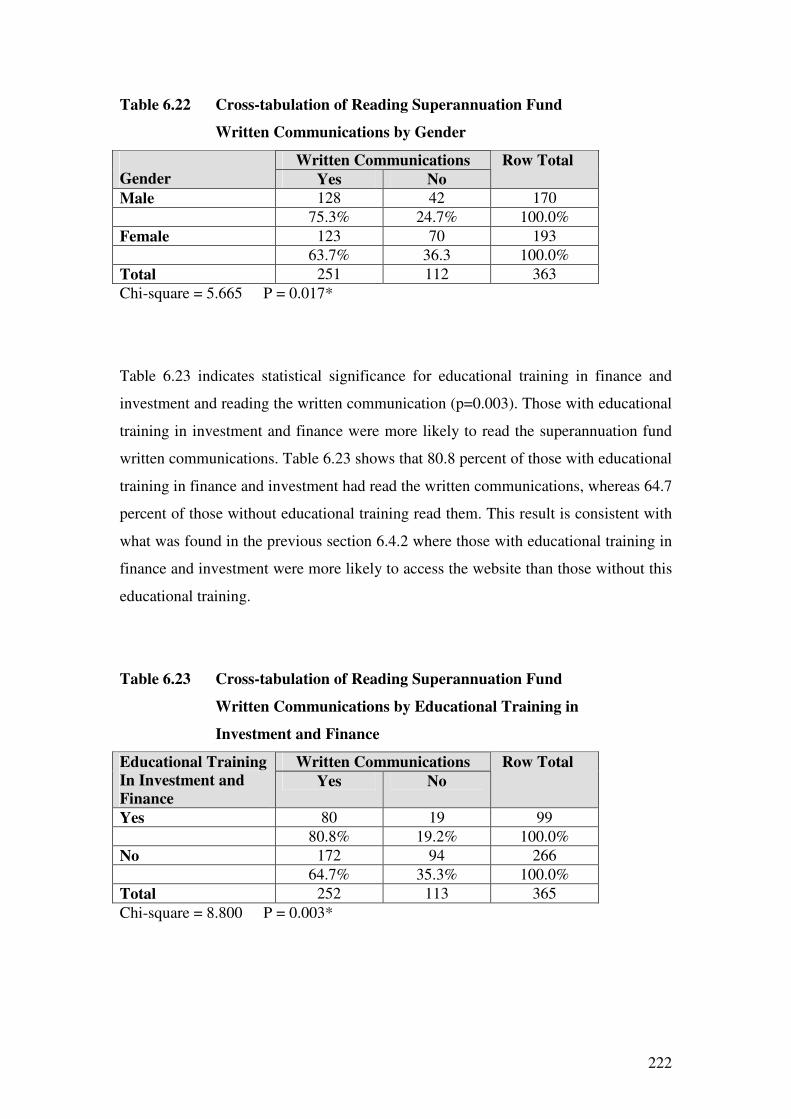
222
Table 6.22 Cross-tabulation of Reading Superannuation Fund
Written Communications by Gender
Written Communications
Gender Yes No
Row Total
Male 128 42 170
75.3% 24.7% 100.0%
Female 123 70 193
63.7% 36.3 100.0%
Total 251 112 363
Chi-square = 5.665 P = 0.017*
Table 6.23 indicates statistical significance for educational training in finance and
investment and reading the written communication (p=0.003). Those with educational
training in investment and finance were more likely to read the superannuation fund
written communications. Table 6.23 shows that 80.8 percent of those with educational
training in finance and investment had read the written communications, whereas 64.7
percent of those without educational training read them. This result is consistent with
what was found in the previous section 6.4.2 where those with educational training in
finance and investment were more likely to access the website than those without this
educational training.
Table 6.23 Cross-tabulation of Reading Superannuation Fund
Written Communications by Educational Training in
Investment and Finance
Written Communications Educational Training
In Investment and
Finance Yes No
Row Total
Yes 80 19 99
80.8% 19.2% 100.0%
No 172 94 266
64.7% 35.3% 100.0%
Total 252 113 365
Chi-square = 8.800 P = 0.003*

223
Statistical significance was found for those groups indicating different levels of
knowledge in finance and investment matters and reading the written communications
(p=0.000). Table 6.24 reveals that those with moderate or substantial knowledge were
more likely to read the superannuation fund written communications than those with
little or no knowledge. It is shown that 78.6 percent of those respondents in the
moderate or substantial knowledge category read the written communications,
whereas 55.7 percent of those respondents in the little or no knowledge category read
the communications. This is a similar result to that found in sections 6.4.1 and 6.4.2
where those with greater investment knowledge were more likely to attend the
seminar and access the website, than those possessing less knowledge. This result
again indicates that those who engage more with the superannuation fund educational
information are likely to perceive a gain in knowledge in superannuation investment
matters.
Table 6.24 Cross-tabulation of Reading Superannuation Fund
Written Communications by Knowledge of Finance
and Investment Matters
Written Communications Knowledge of
Finance and
Investment Matters Yes No
Row Total
Little/None 83 66 149
55.7% 44.3% 100.0%
Moderate/Substantial 165 45 210
78.6% 21.4% 100.0%
Total 248 111 359
Chi-square = 21.337 P = 0.000*

224
A statistically significant relationship was found for attitude to investment risk and
website access (p = 0.004). Those respondents with an aggressive attitude to
investment are more likely to access the website than those with a neutral or
conservative attitude. Table 6.25 shows that 81.1 percent of aggressive investors read
the written communications, whereas 66.1 percent of those who were neutral to risk
read them. The conservative attitude group had the lowest readership of the written
communications (63.2 percent). These results support the findings of the previous
section (6.4.2) where similar results were obtained in regards to accessing the website.
These results again confirm that aggressive investors are likely to read the written
communications as part of their active approach to investment.
Table 6.25 Cross-tabulation of Reading Superannuation Fund
Written Communications by Attitude to Investment
Risk
Written Communications Attitude to
Investment Risk Yes No
Row Total
Conservative 122 71 193
63.2% 36.8% 100.0%
Neutral 39 20 59
66.1% 33.9% 100.0%
Aggressive 90 21 111
81.1% 18.9% 100.0%
Total 251 112 363
Chi-square 10.853 p =0.004*
Table 6.26 identifies a significant result for superannuation account balance and
reading the written communications (p = 0.000). Those groups which have more than
$500,000 in their superannuation account were much more likely to read the
superannuation fund written communications than those with lower balances. Table
6.26 shows that the group with a balance less than $100,000, and the balance
unknown group are less likely to read the written communications than the higher
account balance groups. Only 21.1 percent of the balance unknown group indicated
that they read the written communications. The group with more than a $500,000
account balance had the highest level of respondents reading communications (78.7
percent) followed by the $100,000 to $500,000 group (76.0 percent) and the less than
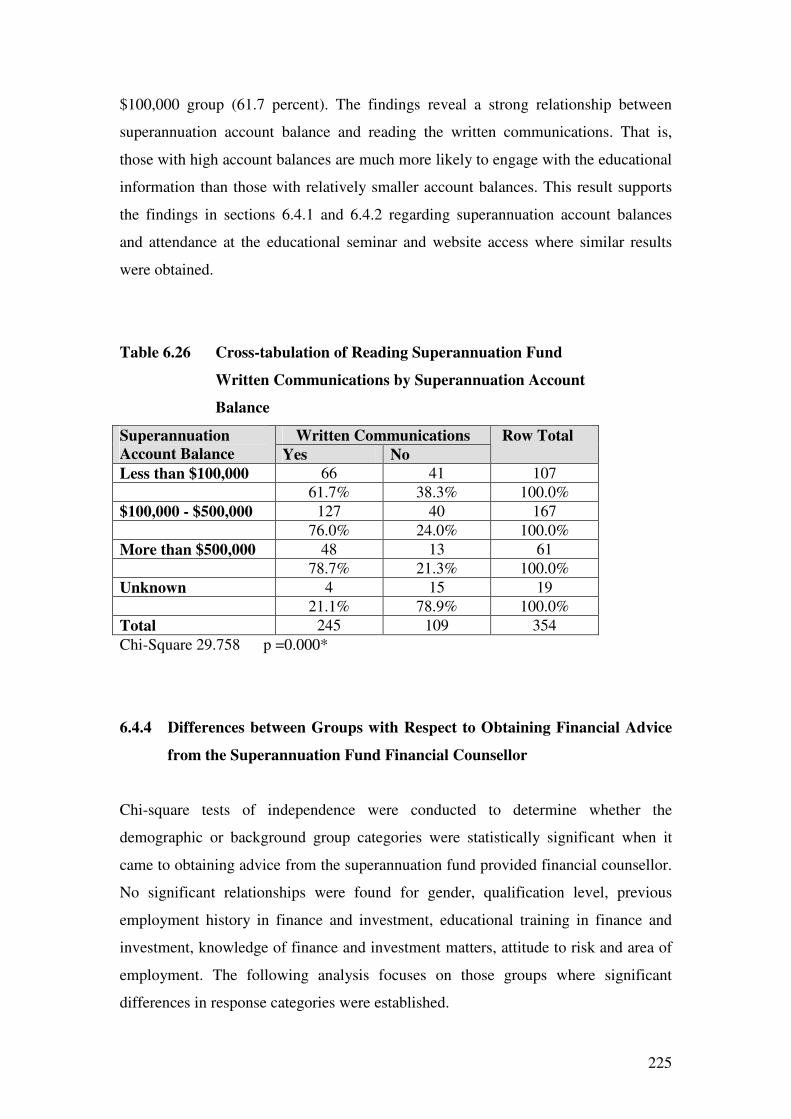
225
$100,000 group (61.7 percent). The findings reveal a strong relationship between
superannuation account balance and reading the written communications. That is,
those with high account balances are much more likely to engage with the educational
information than those with relatively smaller account balances. This result supports
the findings in sections 6.4.1 and 6.4.2 regarding superannuation account balances
and attendance at the educational seminar and website access where similar results
were obtained.
Table 6.26 Cross-tabulation of Reading Superannuation Fund
Written Communications by Superannuation Account
Balance
Written Communications Superannuation
Account Balance Yes No
Row Total
Less than $100,000 66 41 107
61.7% 38.3% 100.0%
$100,000 - $500,000 127 40 167
76.0% 24.0% 100.0%
More than $500,000 48 13 61
78.7% 21.3% 100.0%
Unknown 4 15 19
21.1% 78.9% 100.0%
Total 245 109 354
Chi-Square 29.758 p =0.000*
6.4.4 Differences between Groups with Respect to Obtaining Financial Advice
from the Superannuation Fund Financial Counsellor
Chi-square tests of independence were conducted to determine whether the
demographic or background group categories were statistically significant when it
came to obtaining advice from the superannuation fund provided financial counsellor.
No significant relationships were found for gender, qualification level, previous
employment history in finance and investment, educational training in finance and
investment, knowledge of finance and investment matters, attitude to risk and area of
employment. The following analysis focuses on those groups where significant
differences in response categories were established.
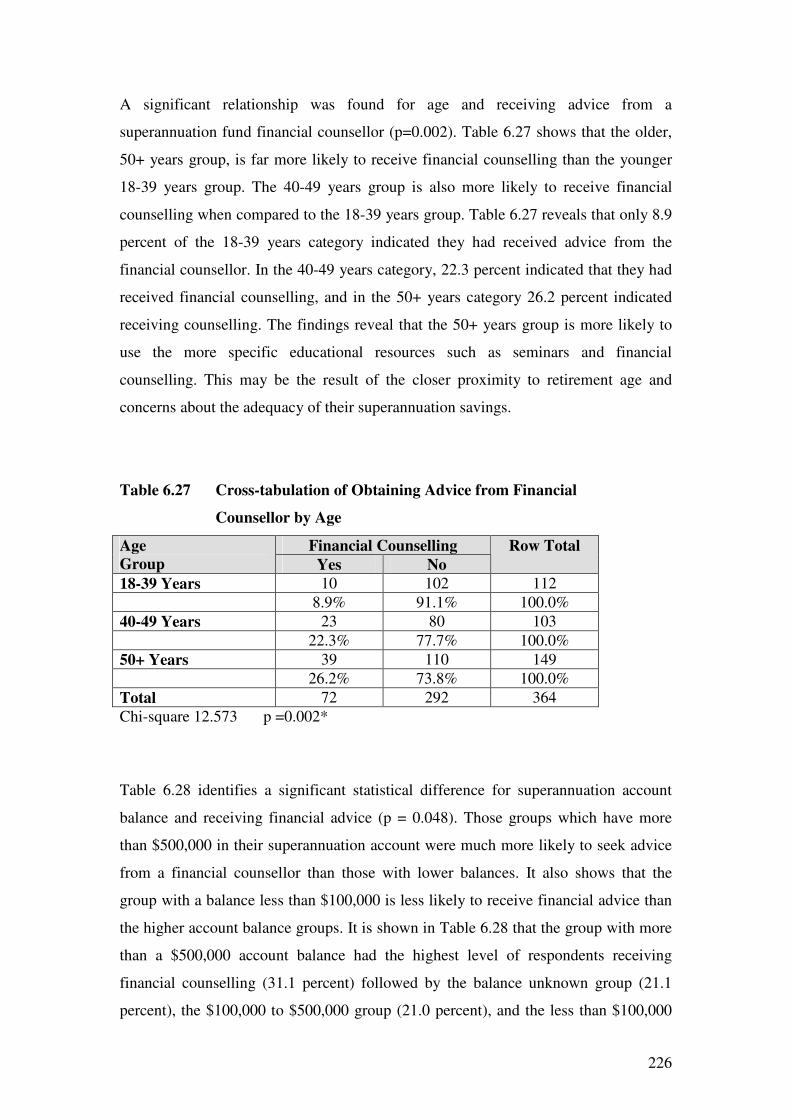
226
A significant relationship was found for age and receiving advice from a
superannuation fund financial counsellor (p=0.002). Table 6.27 shows that the older,
50+ years group, is far more likely to receive financial counselling than the younger
18-39 years group. The 40-49 years group is also more likely to receive financial
counselling when compared to the 18-39 years group. Table 6.27 reveals that only 8.9
percent of the 18-39 years category indicated they had received advice from the
financial counsellor. In the 40-49 years category, 22.3 percent indicated that they had
received financial counselling, and in the 50+ years category 26.2 percent indicated
receiving counselling. The findings reveal that the 50+ years group is more likely to
use the more specific educational resources such as seminars and financial
counselling. This may be the result of the closer proximity to retirement age and
concerns about the adequacy of their superannuation savings.
Table 6.27 Cross-tabulation of Obtaining Advice from Financial
Counsellor by Age
Financial Counselling Age
Group Yes No
Row Total
18-39 Years 10 102 112
8.9% 91.1% 100.0%
40-49 Years 23 80 103
22.3% 77.7% 100.0%
50+ Years 39 110 149
26.2% 73.8% 100.0%
Total 72 292 364
Chi-square 12.573 p =0.002*
Table 6.28 identifies a significant statistical difference for superannuation account
balance and receiving financial advice (p = 0.048). Those groups which have more
than $500,000 in their superannuation account were much more likely to seek advice
from a financial counsellor than those with lower balances. It also shows that the
group with a balance less than $100,000 is less likely to receive financial advice than
the higher account balance groups. It is shown in Table 6.28 that the group with more
than a $500,000 account balance had the highest level of respondents receiving
financial counselling (31.1 percent) followed by the balance unknown group (21.1
percent), the $100,000 to $500,000 group (21.0 percent), and the less than $100,000

227
group (13.1 percent). The findings reveal a strong relationship between
superannuation account balance and receiving financial counselling. That is, those
with high account balances are much more likely to engage with financial counselling
than those with relatively smaller account balances. This result supports the findings
in sections 6.4.1, 6.4.2 and 6.4.3 regarding superannuation account balances and
attendance at the educational seminar, website access, and reading written
communications, indicating a similar pattern of behaviour.
Table 6.28 Cross-tabulation of Obtaining Advice from a Financial
Counsellor by Superannuation Account Balance
Financial Counselling Superannuation
Account Balance Yes No
Row Total
Less than $100,000 14 93 107
13.1% 86.9% 100.0%
$100,000 - $500,000 35 132 167
21.0% 79.0% 100.0%
More than $500,000 19 42 61
31.1% 68.9% 100.0%
Balance Unknown 4 15 19
21.1% 78.9% 100.0%
Total 72 282 354
Chi-square 7.920 p =0.048*
6.4.5 Chi-square Tests Relating to Other Non-superannuation Fund Sources of
Education
This section contains a report on chi-square tests of independence to determine any
significant relationships between the demographic and background characteristics of
respondents against the importance they placed on other non-superannuation fund
educational resources. Data were gathered from the respondents on how they rate the
importance of newspaper publications, financial magazines, radio and television,
personal financial adviser or planner, and friends and colleagues, when it came to
their superannuation investment decision making. The descriptive results have been
reported in Chapter Five. In the following sections the significant findings in respect

228
of these other non-superannuation educational resources against the demographics
and background characteristics of respondents are analysed.
6.4.5.1 Differences Between Groups in Respect of the Importance Placed on
Newspaper Publications
Chi-square tests of independence were conducted to determine whether the
demographic or background group categories were statistically significant when it
came to the importance placed on newspaper publications by respondents for their
superannuation education requirements. No significant relationships were found for
age, previous employment history in finance and investment, educational training in
finance and investment, and area of employment. The following analysis focuses on
those groups where significant differences in response categories were established.
Table 6.29 indicates statistical significance for gender (p=0.002) and the importance
placed on newspaper publications. The probability of a male placing more importance
on newspaper publications for their superannuation education requirements is greater
than that for a female. Table 6.29 shows that 68.4 percent of male respondents
indicated that they found the newspaper publications important, whereas only 50.8
percent of female respondents rated them important for superannuation education.
Table 6.29 Cross-tabulation of Importance Placed on Newspaper Publications
by Gender
Newspaper Publications
Gender Little/No
Importance No Opinion Important
Row Total
Male 36 14 108 158
22.8% 8.8% 68.4% 100.0%
Female 55 35 93 183
30.1% 19.1% 50.8% 100.0%
Total 91 49 201 341
Chi-square = 12.320 P = 0.002*

229
Table 6.30 indicates statistical significance for qualification level and the importance
placed on newspaper publications (p=0.031). The probability of both those qualified
at the postgraduate and undergraduate level placing more importance on newspaper
publications for their superannuation education requirements is greater than those
without an undergraduate qualification. Table 6.30 shows that around 61 percent of
postgraduate and undergraduate qualified respondents indicated that they found the
newspaper publications important, whereas only 45.0 percent of respondents with no
undergraduate qualification rated them as important for their superannuation needs.
Table 6.30 Cross-tabulation of Importance Placed on Newspaper Publications
by Qualification
Newspaper Publications
Level of Qualification
Little/No
Importance No Opinion Important
Row Total
No Undergraduate 11 11 18 40
27.5% 27.5% 45.0% 100.0%
Undergraduate 8 9 27 44
18.2% 20.4% 61.4% 100.0%
Postgraduate 73 29 156 258
28.3% 11.2% 60.5% 100.0%
Total 92 49 201 342
Chi-square = 10.615 P = 0.031*
Statistical significance was found for those groups indicating different levels of
knowledge in finance and investment matters and the importance placed on
newspaper publications (p=0.001). Table 6.31 reveals that those with moderate or
substantial knowledge were more likely to place more importance on newspaper
publications for their superannuation education than those with little or no knowledge.
It is shown that 67.2 percent of those respondents in the moderate or substantial
knowledge category indicated that they found newspaper publications important,
whereas 47.1 percent of those respondents in the little or no knowledge category
indicated they found them of importance.

230
Table 6.31 Cross-tabulation of Importance Placed on Newspaper Publications
by Knowledge in Finance and Investment Matters
Newspaper Publications Knowledge in
Finance and
Investment Matters
Little/No
Importance No Opinion Important
Row Total
None or Little 47 26 65 138
34.1% 18.8% 47.1% 100.0%
Moderate/Substantial 45 20 133 198
22.7% 10.1% 67.2% 100.0%
Total 92 46 198 336
Chi-square = 13.909 P = 0.001*
A statistically significant relationship was found for attitude to investment risk and the
importance placed on newspaper publications (p = 0.024). Those respondents with an
aggressive attitude to investment risk were more likely to find newspaper publications
important for their superannuation education than those with a neutral or conservative
attitude. Table 6.32 indicates that 70.1 percent of aggressive investors found
newspaper publications important, whereas 61.8 percent of those who had a neutral
attitude to investment risk found them important. Those who had a conservative
attitude to risk placed less importance on newspaper publication (50.6 percent)
compared to the other two groups.
Table 6.32 Cross-tabulation of Importance Placed on Newspaper Publications
by Attitude to Investment Risk
Newspaper Publications Attitude to
Investment Risk
Little/No
Importance No Opinion Important
Row Total
Conservative 57 31 90 178
32.0% 17.4% 50.6% 100.0%
Neutral 15 6 34 55
27.3% 10.9% 61.8% 100.0%
Aggressive 20 12 75 107
18.7% 11.2% 70.1% 100.0%
Total 92 49 199 340
Chi-square = 11.209 P = 0.024*

231
A significant result was obtained for superannuation account balance, and the
importance placed on newspaper publications (p = 0.025). The group with more than
$500,000 in their superannuation account are more likely to find newspaper
publications more important for superannuation education requirements than those
with lower balances. The balance unknown group are the least likely to find
newspaper publications important for their superannuation education. Table 6.33
reveals that the group with an account balance of more than $500,000 found the most
importance in newspaper publications (72.7 percent) followed by the $100,000 to
$500,000 group (60.0 percent), and then the less than $100,000 group (52.4 percent).
The findings show a significant relationship between superannuation account balance
and the importance placed on newspaper publications.
Table 6.33 Cross-tabulation of Importance Placed on Newspaper Publications
by Superannuation Account Balance
Newspaper Publications Superannuation
Account Balance Little/No
Importance No Opinion Important
Row Total
Less than $100,000 26 23 54 103
25.2% 22.4% 52.4% 100.0%
$100,000 to $500,000 48 18 99 165
29.1% 10.9% 60.0% 100.0%
More than $500,000 9 6 40 55
16.4% 10.9% 72.7% 100.0%
Balance Unknown 8 2 8 18
44.4% 11.2% 44.4% 100.0%
Total 91 49 201 341
Chi-square = 14.458 P = 0.025*
6.4.5.2 Differences Between Groups in Respect of the Importance Placed on
Financial Magazines
Chi-square tests of independence were performed to establish whether any statistically
significant differences exist between the demographic or background groups on the
importance they place on financial magazines for their superannuation decisions. No
significant relationships were found for age, and attitude towards investment risk. The
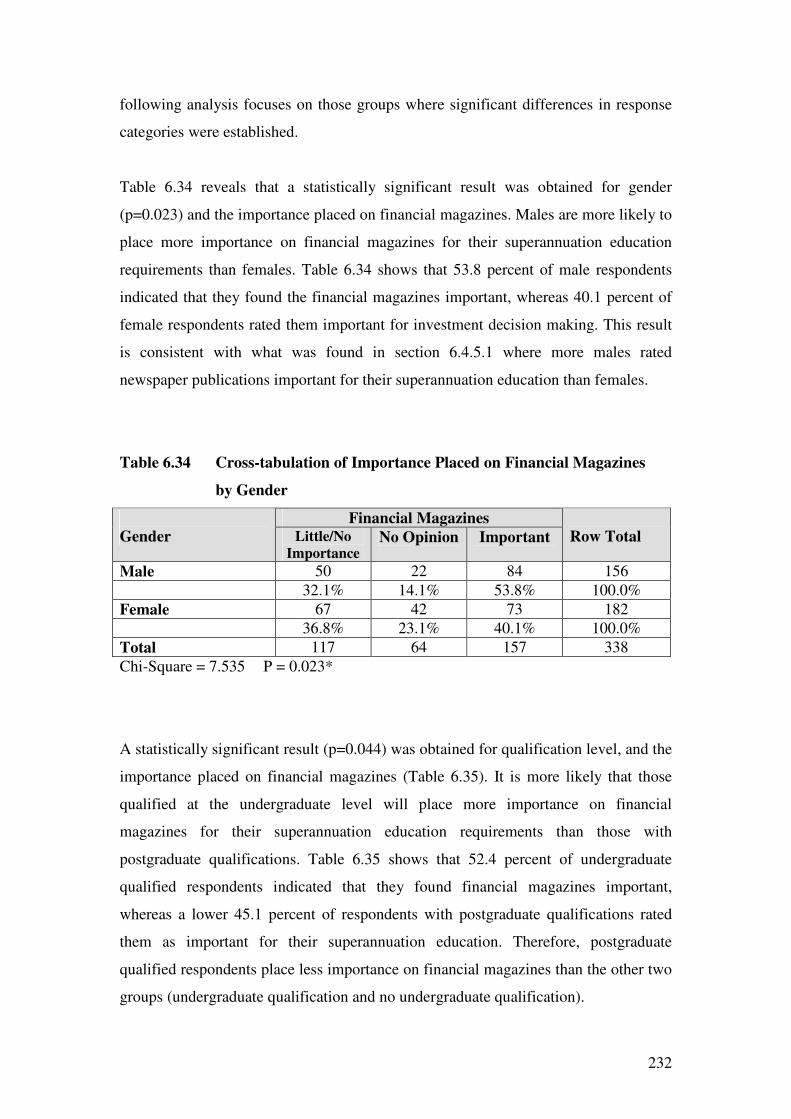
232
following analysis focuses on those groups where significant differences in response
categories were established.
Table 6.34 reveals that a statistically significant result was obtained for gender
(p=0.023) and the importance placed on financial magazines. Males are more likely to
place more importance on financial magazines for their superannuation education
requirements than females. Table 6.34 shows that 53.8 percent of male respondents
indicated that they found the financial magazines important, whereas 40.1 percent of
female respondents rated them important for investment decision making. This result
is consistent with what was found in section 6.4.5.1 where more males rated
newspaper publications important for their superannuation education than females.
Table 6.34 Cross-tabulation of Importance Placed on Financial Magazines
by Gender
Financial Magazines
Gender Little/No
Importance No Opinion Important
Row Total
Male 50 22 84 156
32.1% 14.1% 53.8% 100.0%
Female 67 42 73 182
36.8% 23.1% 40.1% 100.0%
Total 117 64 157 338
Chi-Square = 7.535 P = 0.023*
A statistically significant result (p=0.044) was obtained for qualification level, and the
importance placed on financial magazines (Table 6.35). It is more likely that those
qualified at the undergraduate level will place more importance on financial
magazines for their superannuation education requirements than those with
postgraduate qualifications. Table 6.35 shows that 52.4 percent of undergraduate
qualified respondents indicated that they found financial magazines important,
whereas a lower 45.1 percent of respondents with postgraduate qualifications rated
them as important for their superannuation education. Therefore, postgraduate
qualified respondents place less importance on financial magazines than the other two
groups (undergraduate qualification and no undergraduate qualification).

233
Table 6.35 Cross-tabulation of Importance Placed on Financial Magazines by
Qualification
Financial Magazines
Level of Qualification
Little/No
Importance No Opinion Important
Row Total
No Undergraduate 8 13 19 40
20.0% 32.5% 47.5% 100.0%
Undergraduate 11 9 22 42
26.2% 21.4% 52.4% 100.0%
Postgraduate 99 42 116 257
38.5% 16.4% 45.1% 100.0%
Total 118 64 157 339
Chi-square = 9.808 P = 0.044*
Table 6.36 indicates statistical significance for previous employment in investment
and finance, and the importance placed on financial magazines (p=0.000). Those with
employment history in investment and finance are more likely to find financial
magazines more important for superannuation education requirements than those
without employment history in investment and finance. Table 6.36 shows that 65.2
percent of those with previous employment history in investment and finance rated
financial magazines important for their superannuation education requirements,
whereas a much lower 39.8 percent of those without any such employment history
indicated importance of financial magazines.
Table 6.36 Cross-tabulation of Importance Placed on Financial Magazines
by Previous Employment in Finance and Investment
Financial Magazines Employment History
in Finance and
Investment
Little/No
Importance No Opinion Important
Row Total
Yes 16 15 58 89
18.0% 16.8% 65.2% 100.0%
No 100 47 97 244
41.0% 19.3% 39.8% 100.0%
Total 116 62 155 333
Chi-square = 19.161 P = 0.000*

234
Table 6.37 indicates statistical significance for educational training in investment and
finance and the importance placed on financial magazines (p=0.000). Those with
educational training in investment and finance are more likely to find financial
magazines more important for superannuation education requirements than those
without educational training in investment and finance. Table 6.37 shows that 62.0
percent of those with previous educational training in investment and finance placed
importance in financial magazines for their superannuation education requirements,
whereas 40.5 percent of those without any such educational training indicated
importance of financial magazines.
Table 6.37 Cross-tabulation of Importance Placed on Financial Magazines
by Educational Training in Finance and Investment
Financial Magazines Educational Training
in Finance and
Investment
Little/No
Importance No Opinion Important
Row Total
Yes 24 11 57 92
26.0% 12.0% 62.0% 100.0%
No 94 53 100 247
38.0% 21.5% 40.5% 100.0%
Total 118 64 157 339
Chi-square = 19.161 P = 0.000*
Statistical significance (p=0.000) was found for those groups indicating different
levels of knowledge in finance and investment matters, and the importance they
placed on financial magazines (Table 6.38). Those with moderate or substantial
knowledge were more likely to place more importance on financial magazines for
their superannuation education than those with little or no knowledge. Table 6.38
reveals that 57.4 percent of those respondents in the moderate or substantial
knowledge category indicated that they found financial magazines important, whereas
31.6 percent of those respondents in the little or no knowledge category indicated
finding importance.

235
Table 6.38 Cross-tabulation of Importance Placed on Financial Magazines by
Knowledge in Finance and Investment Matters
Financial Magazines Knowledge in
Finance and
Investment Matters
Little/No
Importance No Opinion Important
Row Total
None or Little 60 33 43 136
44.1% 24.3% 31.6% 100.0%
Moderate/Substantial 56 28 113 197
28.4% 14.2% 57.4% 100.0%
Total 116 61 156 333
Chi-square = 21.505 P = 0.000*
A statistically significant relationship (p = 0.019) was found for area of employment
and the importance placed on newspaper publications (Table 6.39). Non-academics
are more likely to find financial magazines important for their superannuation
education than academics. Table 6.39 indicates that 51.6 percent of non-academics
found financial magazines important, whereas 44.2 percent of academics found them
important. Academics therefore place less importance on financial magazines for
superannuation education compared to non-academics.
Table 6.39 Cross-tabulation of Importance Placed on Financial Magazines by
Area of Employment
Financial Magazines
Area of Employment
Little/No
Importance No Opinion Important
Row Total
Academic 94 40 106 240
39.1% 16.7% 44.2% 100.0%
Non-Academic 23 24 50 97
23.7% 24.7% 51.6% 100.0%
Total 117 64 156 337
Chi-square = 7.938 P = 0.019*
Table 6.40 reveals a significant result for superannuation account balance and the
importance placed on financial magazines (p = 0.018). Those groups which have more
than $500,000, between $100,000 and $500,000, and less than $100,000 in their
superannuation account were more likely to find financial magazines more important
for superannuation education requirements than the balance unknown group.

236
Therefore the group that indicated balance unknown are the least likely to find
financial magazines important for their superannuation education. Table 6.40 shows
that 49.1 percent of those with more than a $500,000 account balance and the
$100,000 to $500,000 group rate financial magazines as important to their
superannuation education, followed by the less than $100,000 group (46.1 percent).
Only 11.1 percent of the group that did not know their account balance rated financial
magazines as important.
Table 6.40 Cross-tabulation of Importance Placed on Financial Magazines by
Superannuation Account Balance
Financial Magazines Superannuation
Account Balance Little/No
Importance No Opinion Important
Row Total
Less than $100,000 29 26 47 102
28.4% 25.5% 46.1% 100.0%
$100,000 to $500,000 60 23 80 163
36.8% 14.1% 49.1% 100.0%
More than $500,000 19 9 27 55
34.5% 16.4% 49.1% 100.0%
Balance Unknown 10 6 2 18
55.6% 33.3% 11.1% 100.0%
Total 118 64 156 338
Chi-square = 15.270 P = 0.018*
6.4.5.3 Differences between Groups in Respect of the Importance Placed on
Radio and Television
Further statistical testing involving chi-square was used to determine whether the
demographic or background group category responses were significantly different
when it came to the importance that they place on radio and television for their
superannuation decisions. No significant relationships were found for gender, age,
qualifications, previous employment history in finance and investment, educational
training in finance and investment, knowledge of finance and investment matters, area
of employment, and superannuation account balance. The following analysis focuses
on those groups where significant differences in response categories were established.
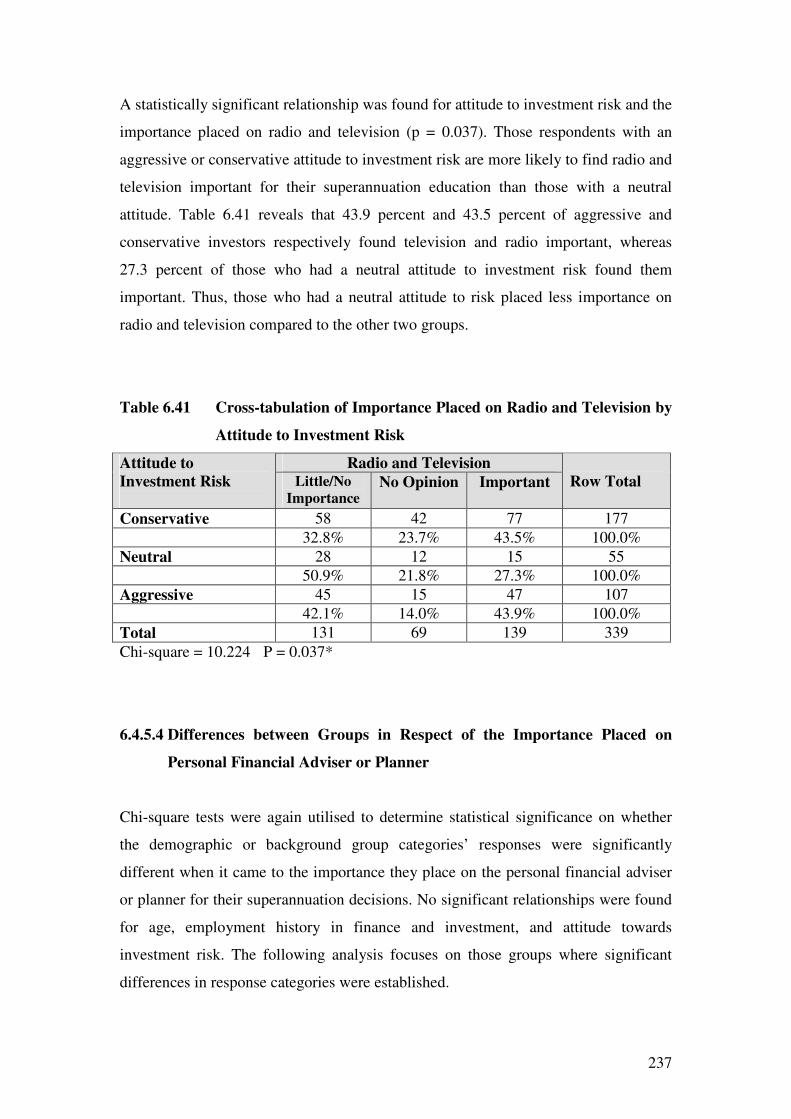
237
A statistically significant relationship was found for attitude to investment risk and the
importance placed on radio and television (p = 0.037). Those respondents with an
aggressive or conservative attitude to investment risk are more likely to find radio and
television important for their superannuation education than those with a neutral
attitude. Table 6.41 reveals that 43.9 percent and 43.5 percent of aggressive and
conservative investors respectively found television and radio important, whereas
27.3 percent of those who had a neutral attitude to investment risk found them
important. Thus, those who had a neutral attitude to risk placed less importance on
radio and television compared to the other two groups.
Table 6.41 Cross-tabulation of Importance Placed on Radio and Television by
Attitude to Investment Risk
Radio and Television Attitude to
Investment Risk
Little/No
Importance No Opinion Important
Row Total
Conservative 58 42 77 177
32.8% 23.7% 43.5% 100.0%
Neutral 28 12 15 55
50.9% 21.8% 27.3% 100.0%
Aggressive 45 15 47 107
42.1% 14.0% 43.9% 100.0%
Total 131 69 139 339
Chi-square = 10.224 P = 0.037*
6.4.5.4 Differences between Groups in Respect of the Importance Placed on
Personal Financial Adviser or Planner
Chi-square tests were again utilised to determine statistical significance on whether
the demographic or background group categories’ responses were significantly
different when it came to the importance they place on the personal financial adviser
or planner for their superannuation decisions. No significant relationships were found
for age, employment history in finance and investment, and attitude towards
investment risk. The following analysis focuses on those groups where significant
differences in response categories were established.
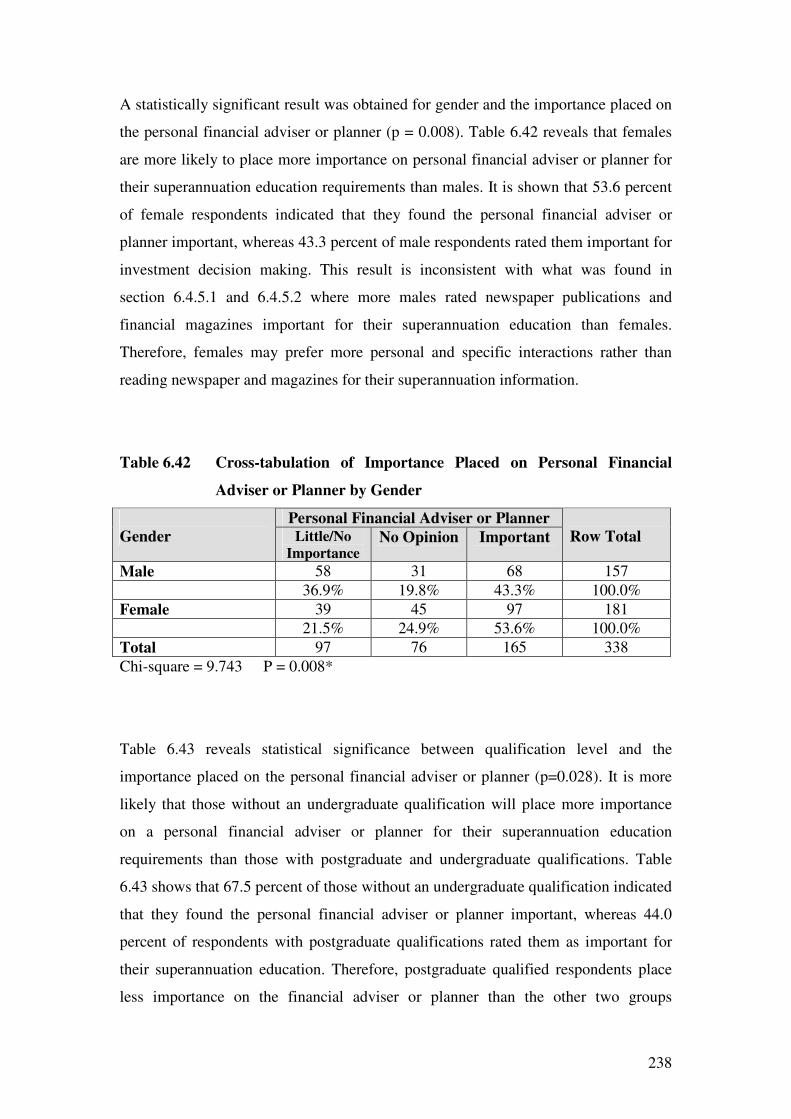
238
A statistically significant result was obtained for gender and the importance placed on
the personal financial adviser or planner (p = 0.008). Table 6.42 reveals that females
are more likely to place more importance on personal financial adviser or planner for
their superannuation education requirements than males. It is shown that 53.6 percent
of female respondents indicated that they found the personal financial adviser or
planner important, whereas 43.3 percent of male respondents rated them important for
investment decision making. This result is inconsistent with what was found in
section 6.4.5.1 and 6.4.5.2 where more males rated newspaper publications and
financial magazines important for their superannuation education than females.
Therefore, females may prefer more personal and specific interactions rather than
reading newspaper and magazines for their superannuation information.
Table 6.42 Cross-tabulation of Importance Placed on Personal Financial
Adviser or Planner by Gender
Personal Financial Adviser or Planner
Gender Little/No
Importance No Opinion Important
Row Total
Male 58 31 68 157
36.9% 19.8% 43.3% 100.0%
Female 39 45 97 181
21.5% 24.9% 53.6% 100.0%
Total 97 76 165 338
Chi-square = 9.743 P = 0.008*
Table 6.43 reveals statistical significance between qualification level and the
importance placed on the personal financial adviser or planner (p=0.028). It is more
likely that those without an undergraduate qualification will place more importance
on a personal financial adviser or planner for their superannuation education
requirements than those with postgraduate and undergraduate qualifications. Table
6.43 shows that 67.5 percent of those without an undergraduate qualification indicated
that they found the personal financial adviser or planner important, whereas 44.0
percent of respondents with postgraduate qualifications rated them as important for
their superannuation education. Therefore, postgraduate qualified respondents place
less importance on the financial adviser or planner than the other two groups

239
(undergraduate qualification and no undergraduate qualification). This evidence
reveals that the less educated respondents are more likely to find the financial adviser
or planner important to their superannuation needs than the more highly educated.
Table 6.43 Cross-tabulation of Importance Placed on Personal Financial
Adviser or Planner by Qualification
Personal Financial Adviser or Planner
Level of Qualification
Little/No
Importance No Opinion Important
Row Total
No Undergraduate 7 6 27 40
17.5% 15.0% 67.5% 100.0%
Undergraduate 9 7 26 42
21.4% 16.7% 61.9% 100.0%
Postgraduate 81 63 113 257
31.5% 24.5% 44.0% 100.0%
Total 97 76 166 339
Chi-Square = 10.899 P = 0.028*
Table 6.44 shows strong statistical significance for educational training in investment
and finance and the importance placed on the personal financial adviser or planner (p
=0.008). Those without educational training in investment and finance are more likely
to find the personal financial adviser or planner more important for superannuation
education requirements than those with educational training in investment and finance
Table 6.44 indicates that 53.4 percent of those without previous educational training
in investment and finance placed importance on a personal financial adviser or
planner for their superannuation education requirements, whereas 37.0 percent of
those with educational training in finance and investment indicated importance.
Consistent with previous findings on the financial adviser or planner, those
respondents with less finance and investment knowledge are more likely to rate this
educational resource as important.

240
Table 6.44 Cross-tabulation of Importance Placed on Personal Financial
Adviser or Planner by Educational Training in Finance and
Investment
Personal Financial Adviser or Planner Educational Training
in Finance and
Investment
Little/No
Importance No Opinion Important
Row Total
Yes 37 21 34 92
40.2% 22.8% 37.0% 100.0%
No 60 55 132 247
24.3% 22.3% 53.4% 100.0%
Total 97 76 166 339
Chi-square = 9.671 P = 0.008*
Statistical significance was shown in Table 6.45 for those groups indicating different
levels of knowledge in finance and investment matters and the lack of importance
they placed on the personal financial adviser or planner (p=0.077). The interpretation
here differs from previous discussions where statistical significance was found. In this
case, both groups had a similar opinion when it came to rating the personal financial
adviser or planner as important, but what was significant, was the difference between
the groups when they rated the personal financial adviser or planner as having little or
no importance. Table 6.45 reveals that those with moderate or substantial knowledge
were more likely to place little or no importance on personal financial adviser or
planner for their superannuation education than those with little or no knowledge. It is
shown in that 33.3 percent of those respondents in the moderate or substantial
knowledge category indicated little or no importance on the personal financial adviser
or planner for their educational needs, whereas 23.0 percent of those respondents with
little or no knowledge rated it to have little or no importance.
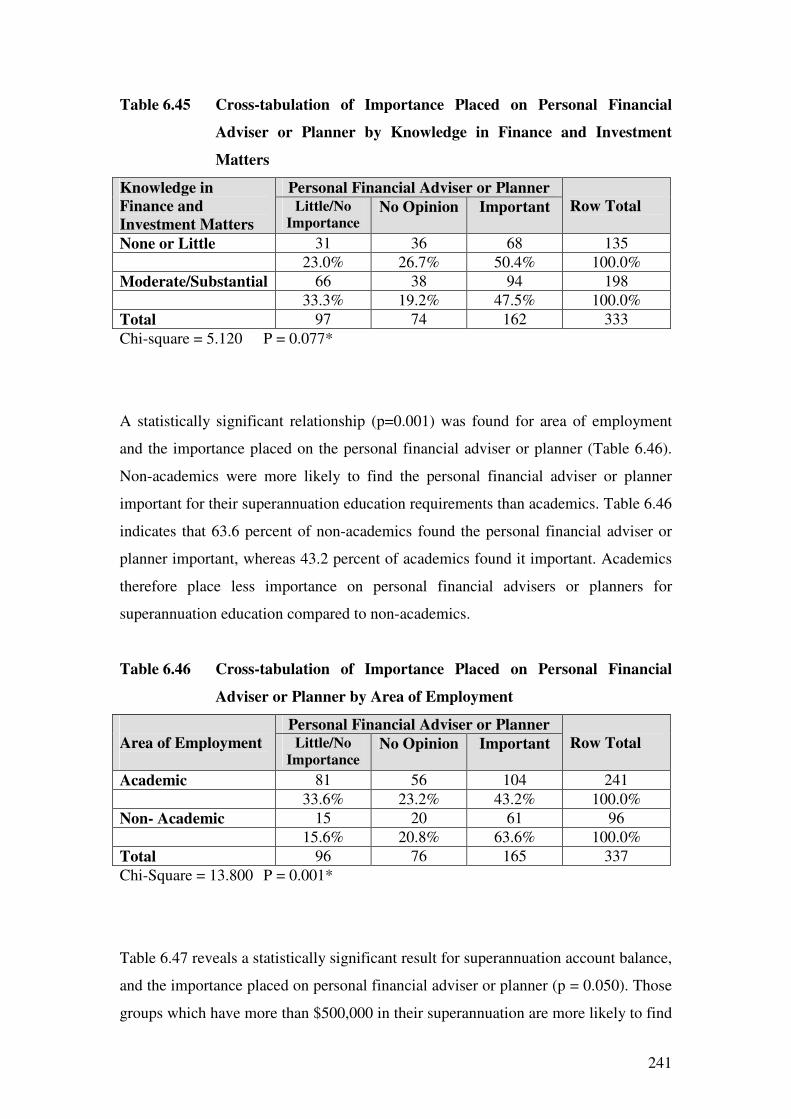
241
Table 6.45 Cross-tabulation of Importance Placed on Personal Financial
Adviser or Planner by Knowledge in Finance and Investment
Matters
Personal Financial Adviser or Planner Knowledge in
Finance and
Investment Matters
Little/No
Importance No Opinion Important
Row Total
None or Little 31 36 68 135
23.0% 26.7% 50.4% 100.0%
Moderate/Substantial 66 38 94 198
33.3% 19.2% 47.5% 100.0%
Total 97 74 162 333
Chi-square = 5.120 P = 0.077*
A statistically significant relationship (p=0.001) was found for area of employment
and the importance placed on the personal financial adviser or planner (Table 6.46).
Non-academics were more likely to find the personal financial adviser or planner
important for their superannuation education requirements than academics. Table 6.46
indicates that 63.6 percent of non-academics found the personal financial adviser or
planner important, whereas 43.2 percent of academics found it important. Academics
therefore place less importance on personal financial advisers or planners for
superannuation education compared to non-academics.
Table 6.46 Cross-tabulation of Importance Placed on Personal Financial
Adviser or Planner by Area of Employment
Personal Financial Adviser or Planner
Area of Employment
Little/No
Importance No Opinion Important
Row Total
Academic 81 56 104 241
33.6% 23.2% 43.2% 100.0%
Non- Academic 15 20 61 96
15.6% 20.8% 63.6% 100.0%
Total 96 76 165 337
Chi-Square = 13.800 P = 0.001*
Table 6.47 reveals a statistically significant result for superannuation account balance,
and the importance placed on personal financial adviser or planner (p = 0.050). Those
groups which have more than $500,000 in their superannuation are more likely to find

242
the personal financial adviser or planner important for their superannuation education
requirements than those with lower balances. The group that indicated they did not
know their balance are the least likely to find the personal financial adviser or planner
important for their superannuation education. Table 6.47 shows that the group with an
account balance of more than $500,000 found the most importance in the personal
financial adviser or planner (58.2 percent), followed by the less than $100,000 group
(49.5 percent), and then the $100,000 to $500,000 group (47.6 percent). Only 27.8
percent of the balance unknown group indicated importance for the personal financial
adviser or planner for their superannuation information requirements.
Table 6.47 Cross-tabulation of Importance Placed on Personal Financial
Adviser or Planner by Superannuation Account Balance
Personal Financial Adviser or Planner Superannuation
Account Balance Little/No
Importance No Opinion Important
Row Total
Less than $100,000 22 29 50 101
21.8% 28.7% 49.5% 100.0%
$100,000 to $500,000 50 36 78 164
30.4% 22.0% 47.6% 100.0%
More than $500,000 18 5 32 55
32.7% 9.1% 58.2% 100.0%
Balance Unknown 7 6 5 18
38.9% 33.3% 27.8% 100.0%
Total 97 76 165 338
Chi-Square = 12.605 P = 0.050*
6.4.5.5 Differences between Groups with Respect to the Importance Placed on
Friends and Colleagues
Tests of independence (Chi-square) were again utilised to establish whether any
statistically significant differences existed in the responses of the demographic or
background group categories when it came to the importance they placed on friends
and colleagues for their superannuation decisions. No significant relationships were
found for gender, age, qualifications, employment history in finance and investment,
attitude towards investment risk, and area of employment. The following analysis

243
focuses on those groups where significant differences in response categories were
established.
Table 6.48 indicates strong statistical significance for educational training in
investment and finance and the importance placed on friends and colleagues (p =
0.067). Those without educational training in investment and finance are more likely
to find friends and colleagues more important for their superannuation education
requirements than those with educational training in investment and finance. Table
6.48 indicates that 59.7 percent of those without previous educational training in
investment and finance placed importance on friends and colleagues for their
superannuation education requirements, whereas 50.0 percent of those with
educational training in finance and investment indicated importance for friends and
colleagues.
Table 6.48 Cross-tabulation of Importance Placed on Friends and Colleagues
by Educational Training in Finance and Investment
Friends and Colleagues Educational Training
in Finance and
Investment
Little/No
Importance No Opinion Important
Row Total
Yes 22 24 46 92
23.9% 26.1% 50.0% 100.0%
No 62 38 148 248
25.0% 15.3% 59.7% 100.0%
Total 84 62 194 340
Chi-square = 5.398 P = 0.067*
Statistical significance is revealed in Table 6.49 for those groups indicating different
levels of knowledge in finance and investment matters and the importance they placed
on the personal financial adviser or planner (p=0.091). Those with little or no
knowledge were more likely to place more importance on friends and colleagues for
their superannuation education than those with moderate or substantial knowledge.
Table 6.49 shows that 62.8 percent of those respondents with little or no knowledge
indicated friends and colleagues as important for their superannuation educational
needs, whereas 53.0 percent of those respondents with moderate or substantial
knowledge rated friends and colleagues to be important.

244
Table 6.49 Cross-tabulation of Importance Placed on Friends and Colleagues
by Knowledge in Finance and Investment Matters
Friends and Colleagues Knowledge in
Finance and
Investment Matters
Little/No
Importance No Opinion Important
Row Total
None or Little 26 25 86 137
19.0% 18.2% 62.8% 100.0%
Moderate/Substantial 58 35 105 198
29.3% 17.7% 53.0% 100.0%
Total 84 60 191 335
Chi-square = 4.799 P = 0.091*
A significant result (p=0.022) was obtained for superannuation account balance, and
the importance placed on friends and colleagues (Table 6.50). The group with an
account balance less than $100,000 are more likely to find friends and colleagues
more important for their superannuation education requirements than those with
higher account balances. Table 6.50 reveals that the group with the less than a
$100,000 account balance found by far the most importance in friends and colleagues
(70.9 percent), followed by the balance unknown group (55.6 percent). There was no
substantial difference between the other two groups on the importance they placed on
friends and colleagues.
Table 6.50 Cross-tabulation of Importance Placed on Friends or Colleagues
by Superannuation Account Balance
Friends and Colleagues Superannuation
Account Balance Little/No
Importance No Opinion Important
Row Total
Less than $100,000 13 17 73 103
12.6% 16.5% 70.9% 100.0%
$100,000 to $500,000 50 30 84 164
30.5% 18.3% 51.2% 100.0%
More than $500,000 16 12 26 54
29.6% 22.2% 48.2% 100.0%
Balance Unknown 5 3 10 18
27.8% 16.6% 55.6% 100.0%
Total 84 62 193 339
Chi-Square = 14.735 P = 0.022*
245
6.5 Summary
This chapter deals with statistical inferences that were drawn from the research data
analysed in Chapter Five. Tests of significance such as ANOVA and chi-square were
used to test for significant differences in the responses provided by different
demographic groups. Consideration was given to the chance of erroneous conclusions
being reached from the significance tests, and a decision was made to adopt a
significance level of 10 percent to produce a balance between rejecting a finding
when it is true and accepting a finding when it is false.
Analysis of Variance, t-tests and F-tests were used to establish any significant
differences in the mean responses of the various demographic groups to questions
relating to the experiences of those respondents who used the superannuation fund
provided educational information. Significant differences in mean responses to a
number of educational information sources were prominent for academics and non-
academics. A few significant results were obtained for differences in mean responses
for groups with different qualification levels, and those groups with and without
educational training in finance and investment. No significant results were obtained
for gender, age, perceived investment knowledge, and investment attitude to risk. It is
therefore of importance to note that non-academics were likely to feel more informed
by a number of educational resources than academics. Also important was that a
respondent’s level of education and whether they had any formal educational training
in investment and finance impacted on their perception of being informed by some of
the educational resources.
Chi-square tests of independence were then used to determine whether demographic
or background group categories were statistically significant when it came to
attending educational seminars, accessing the website, reading superannuation fund
provided written communications, and using the superannuation fund sponsored
financial counselling. The superannuation account balance, gender, and perceived
knowledge in investment and finance matters were the most significant factors when
it came to accessing the superannuation fund educational resources. Other
contributing significant factors were age, educational training in finance and

246
investment, and attitude towards investment risk. Level of qualification, area of
employment, and previous employment in finance and investment were of less
significance when it came to utilising the superannuation fund provided educational
information.
Further chi-square tests of independence were performed to determine any significant
relationships between the demographic and background characteristics of respondents
against the importance they placed on other non-superannuation fund educational
resources for their superannuation information requirements (newspaper publications,
financial magazines, radio and television, personal financial adviser or planner, and
friends and colleagues). The superannuation account balance, perceived knowledge in
investment matters, educational training in finance and investment, and level of
qualification produced the most significant results when it came to the level of
importance placed on this non-superannuation fund provided information. Only a few
significant results were obtained for attitude to risk, area of employment, and previous
employment in finance and investment and, and no significant results were obtained
for age.

247
Chapter Seven
Summary and Conclusions
7.1 Introduction
The purpose of this study was to evaluate a financial education model to see whether
it provides superannuation defined contribution fund members with the required
information and resources to enable them to make informed investment choices
regarding their superannuation investment funds and, further, to determine the
importance they placed on this information for their overall decision making. Using
the OECD (2005) definition of financial education, an evaluation was undertaken to
establish the role superannuation fund supplied financial education plays in providing
advice, information and instruction to fund members about their superannuation
savings and investment strategies. Furthermore, the research determined the extent to
which the superannuation fund educational resources were used by members and the
possible reasons explaining why they failed to use these resources. The investigation
also determined the importance superannuation fund members placed on non-
superannuation fund educational sources such as radio and television, financial
newspapers and magazines, friends and colleagues and financial planners or advisers,
for their superannuation decision making.
The study was motivated by the growing literature that suggests that a substantial
number of Australians lack adequate levels of financial literacy to structure a
retirement savings plan properly. Indeed, survey evidence suggests that many
Australians are not adequately saving for retirement and that a number of groups
within the community will not accumulate sufficient funds to provide them with a
comfortable retirement lifestyle. A review of the relevant literature confirmed that
many individuals fail to save for retirement in a rational way as prescribed by the
Modigliani and Brumberg (1954) economic life-cycle model. Numerous studies show
that many individuals exhibit irrational behaviour when it comes to planning and
saving for retirement. The literature review identified that exposure to financial
education programs can positively influence the planning and savings behaviour of

248
retirement fund members. Prior research also indicated that educational seminars or
workshops, written communications, website information and financial counselling
were all effective methods in communicating financial educational information to
individuals. The research model developed in Chapter Three (Figure 3.4),
incorporates these educational resources. Research data were gathered to determine
whether superannuation fund members thought they were being informed when they
accessed this generic and specific educational information.
A brief review of each chapter is provided in the next section. The major findings of
this study are presented in the third section of this chapter. The fourth and fifth
sections of this chapter cover the contributions and implications of the research. The
sixth section summarises the limitations of this study, and in the final section some
opportunities for future research are discussed.
7.2 Review of the Thesis
The background to the research, the research problems and objectives, the scope and
justification for the research and the research methodology were introduced in
Chapter One. An overview of the Australian superannuation framework was provided
in Chapter Two to inform the reader on specific issues shaping Australia’s retirement
income system and Australia’s superannuation system including its composition and
size. Regulation and taxation of the superannuation system were also discussed. A
consideration of the implications of Australia’s ageing population was provided and
the adequacy of Australian superannuation savings was assessed. Specific issues on
the financial performance of the superannuation industry were discussed with further
reference to the global financial crisis and the United States (US) defined contribution
retirement fund system.
The relevant literature was presented in Chapter Three. The theoretical life-cycle
model (Modigliani & Brumberg 1954) which assumes rational economic decision
making by individuals was described and evidence of its relevance to retirement
saving assessed. The behavioural research evidence indicates that individuals exhibit
irrational characteristics when it comes to saving and investing for their retirement.

249
The behavioural life-cycle theory suggests that individuals will deviate from the
standard economic model because they have limited cognitive abilities to solve the
multi-period retirement saving problems (branded ‘bounded rationality’) and further,
they lack the necessary willpower to execute a long-term retirement savings plan
(Shefrin 2002). Surveys indicate a low level of adult financial literacy in Australia
(ANZ 2008; Mercer 2006). It was suggested that those with more financial knowledge
are more likely to plan for retirement (Lusardi & Mitchell 2006). Inertia and
procrastination in decision making appear to be behavioural influences that inhibit the
retirement savings behaviour of individuals (Madrian & Shea 2001a; Choi et al. 2002;
Gallery & Gallery 2005). Other behavioural influences such as heuristics, decision
framing and loss aversion were also identified as behavioural influences that can
potentially inhibit rational decision making. A theoretical framework for
superannuation fund investment choice was introduced and summarised in Figure 3.1.
The framework depicts informed investor choice as a prerequisite to maximising
retirement income (Brown, Gallery & Gallery 2002). The framework also
recommends education programs as a policy resolution for those superannuation fund
members prepared to actively engage in decisions regarding their retirement savings.
Financial education was explained and the rationale for adopting the OECD (2005)
definition for the purpose of this study was presented. It was shown that different
types of financial education programs do change retirement savings behaviour (Bayer,
Bernheim & Scholz 1996; Clark & Schieber 1998; Lusardi 2005; Clark et al. 2006).
Educational seminars or workshops, written communications, website information
and financial counselling were all found to be effective educational tools in this
process. The research framework was then presented and the research model and
questions were developed.
The research methodology was introduced in Chapter Four. The research paradigm
was discussed and a quantitative survey approach was adopted to assemble data
necessary to address the research questions. After consideration of the main data
collection methods, the sample size, the geographically dispersed sample, and with
further guidance from the Trochim (2006) framework, a decision was made to use an
electronic questionnaire (web-based survey). A discussion of the process of
construction of the questionnaire, including layout, question content, response format,
question format and the order of questions was provided. Issues relating to how the
250
questionnaire was written, the pilot test and the administration of the survey were also
discussed. How the questionnaire was written, the pilot test, and administration of the
survey were also discussed. Various issues regarding the selection of the sample were
reviewed, and measurement issues impacting on the reliability and validity of the
survey were addressed.
The quantitative data analysis of the descriptive statistics was addressed in Chapter
Five and the quantitative data analysis of the inferential statistics was addressed in
Chapter Six. In the descriptive analysis chapter, demographic and background
information on the respondents was presented and discussed. In addition, frequency
distributions, means and standard deviations of responses to the rating measurement
scales for the various educational resources (educational seminar, website, written
communications and financial counselling) were presented along with the
respondents’ rating of reasons why they fail to use these resources. The importance
placed by respondents on non-superannuation fund educational information for their
investment decision making was also presented. In Chapter Six the inferential
analyses establishing any significant differences in the responses to questions from
the different demographic and background groups were presented. The implications
of the results found in Chapter Five and Chapter Six are discussed in the next section.
7.3 Major Findings
This study investigates the views, opinions and perceptions of superannuation fund
members in regard to the different elements of financial educational resources made
available to them through the superannuation fund and through other sources. Chapter
Five presented the descriptive analysis that addressed research questions one to six
which were detailed in Chapter Three (Table 3.1). The inferential statistical analysis
was reported in Chapter Six and the results relating to research questions seven to
nine were discussed.

251
7.3.1 Educational Seminar
Table 7.1 Educational Seminar Research Questions and Findings Question 1: What is the users’ perception of the presentation of information in educational
seminars?
The information was well communicated and presented.
Question 1A: To what extent do users feel they are informed by the seminars?
Users were being informed by the educational seminars.
Question 1B: Do users place importance on the educational seminar when it comes to their
superannuation decision making?
Users do place importance on the educational seminar for their superannuation
decisions.
Question 1C: How frequently do users attend the educational seminars?
Most users do not frequently attend educational seminars.
The results are summarised below.
Research questions 1, 1A, 1B and 1C presented in Table 7.1 relate to the
superannuation fund provided educational seminar. Educational seminars which cover
more specific superannuation issues are usually scheduled throughout the year and are
accessible by Unisuper superannuation fund members in their workplace. It was found
that 43.6 percent of respondents had previously attended an educational seminar. This
result is consistent with Clark-Murphy and Gerrans (2001) who found a similar
attendance level at educational seminars in their study of Australian university
superannuation fund members. Evidence provided by Helman and Paladino (2004)
also found similar attendance rates at retirement educational seminars by US workers.
The respondents in this study rated the presentation of information in seminars highly,
and the study results indicate agreement among most respondents that they were being
informed by the content presented in the seminars. These results are consistent with
the findings of Kim, Bagwell and Garman (1988) who reported a high rating of both
the presentation and content of a workplace seminar by US corporate employees. In
the current study it was found that a large majority of respondents who attended a
seminar rated it as important for their superannuation decision making. This is
consistent with the Clark-Murphy and Gerrans (2001) study where a substantial
number of respondents rated the seminar as the most important source of information
when making a superannuation related decision. While the current study found that
most respondents do not frequently attend seminars, the evidence compiled suggests

252
that those who do attend generally perceive that as a result they become informed
about superannuation issues. In light of these results, it is recommended that
superannuation fund managers broaden their seminar offerings to their members to
include a variety of superannuation topics targeting specific groups of members. This
should be done through a seminar awareness campaign that emphasises the
importance of the seminar information to those members who have a lack of
knowledge on superannuation matters.
7.3.2 Superannuation Fund Website
Table 7.2 Superannuation Website Research Questions and Findings Question 2: To what extent do users feel they are informed by the range of sponsor provided
web-based educational information?
Users were being informed by accessing the superannuation fund website.
Question 2A: What importance is placed on sponsor provided web-based educational
information when it comes to the fund member’s superannuation information requirements?
Recent and future return performance, the potential for investment risk and financial
calculators were rated by users as the most important website items.
Question 2B: Do users place importance on the information provided on the superannuation
fund website for their decision making?
Users do place importance on the superannuation fund website for their decision
making.
Question 2C: How frequently do users access the superannuation fund provided website?
Most users do not frequently access the superannuation fund website.
The results are summarised below.
Research questions 2, 2A, 2B and 2C presented in Table 7.2 relate to the
superannuation fund website. It was found that 61.5 percent of respondents had
previously accessed the website. This finding is not consistent with the findings of
Clark-Murphy and Gerrans (2001) and Helman and Paladino (2004) who found low
usage of online information from those receiving retirement savings educational
materials. The results in this study may be signalling a changing pattern in website
usage for the information requirements of superannuation fund members. The overall
mean rating of the website by respondents indicates that a majority of them agree that
they are being informed by the web-based educational information. Furthermore, a
large majority of respondents indicated that the website was important for their
superannuation decision making and provided support for Nyce’s (2005) findings that

253
web-based financial communications had a significant impact on US employee
participation in 401(k) plans, and that internet based software influenced retirement
knowledge (Loibl & Hira 2006). Website information on return performance,
expected future return performance and the potential risk of superannuation fund
offered investment options was rated as the most important website based financial
information. Financial calculators were also deemed by many respondents as an
important information resource. The evidence suggests that those members who do
access the website generally believe that they are being informed about
superannuation matters. It is therefore important that the superannuation fund make
members aware of both the existence and the importance of the educational resources
available on their website. The findings suggest that more needs to be done in this
regard.
7.3.3 Superannuation Fund Written Communications
Table 7.3 Superannuation Fund Written Communications Research
Questions and Findings Question 3: To what extent do users feel they are informed by reading the written
communications provided by the superannuation fund?
Users were being informed by reading the written communications.
Question 3A: Do users place importance on superannuation fund provided written
communications for their decision making?
Users do place importance on written communications for their superannuation
decisions.
Question 3B: How frequently do the users access the written communications provided by the
superannuation fund?
The written communications were used frequently by a majority of respondents and
were used much more frequently than the other educational resources.
The results are summarised below.
Research questions 3, 3A and 3B presented in Table 7.3 relate to superannuation fund
provided written communications. It was found that almost 70 percent of respondents
read the written communications. This result confirms the findings of Clark-Murphy
and Gerrans (2001) who found that a very large number of superannuation fund
members read the written communications before making a superannuation related
decision. In a US study Helman and Paladino (2004) also found that a majority of
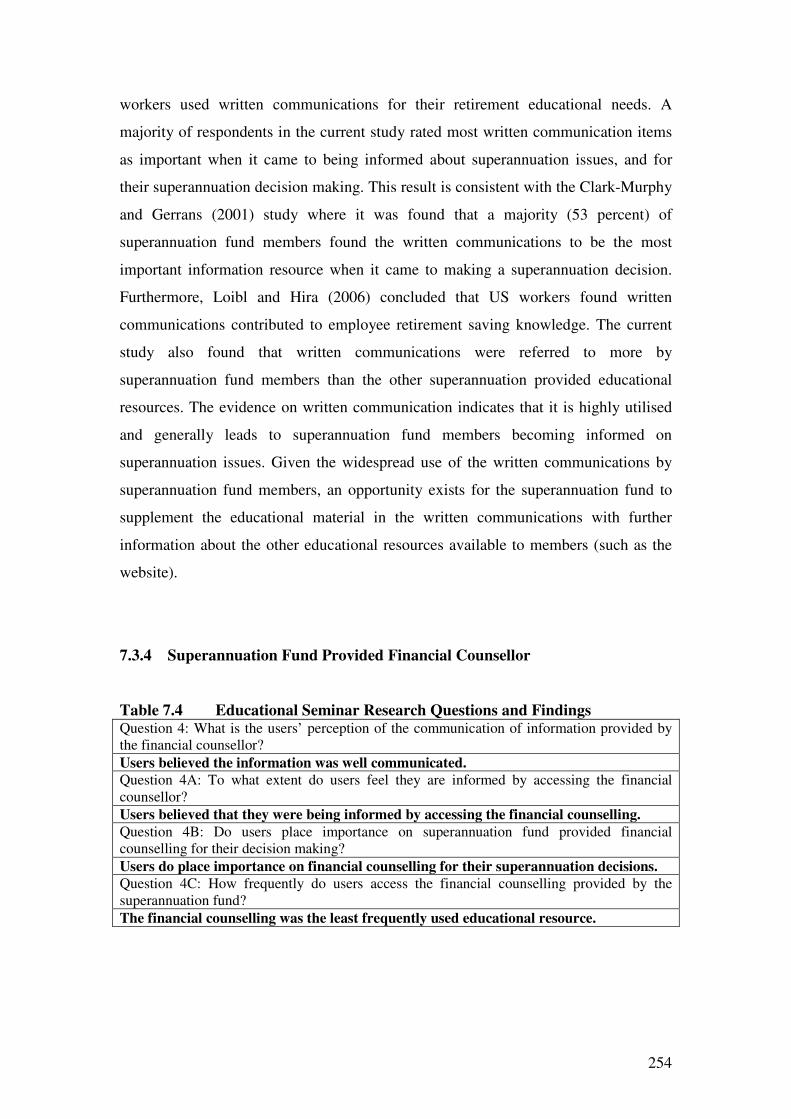
254
workers used written communications for their retirement educational needs. A
majority of respondents in the current study rated most written communication items
as important when it came to being informed about superannuation issues, and for
their superannuation decision making. This result is consistent with the Clark-Murphy
and Gerrans (2001) study where it was found that a majority (53 percent) of
superannuation fund members found the written communications to be the most
important information resource when it came to making a superannuation decision.
Furthermore, Loibl and Hira (2006) concluded that US workers found written
communications contributed to employee retirement saving knowledge. The current
study also found that written communications were referred to more by
superannuation fund members than the other superannuation provided educational
resources. The evidence on written communication indicates that it is highly utilised
and generally leads to superannuation fund members becoming informed on
superannuation issues. Given the widespread use of the written communications by
superannuation fund members, an opportunity exists for the superannuation fund to
supplement the educational material in the written communications with further
information about the other educational resources available to members (such as the
website).
7.3.4 Superannuation Fund Provided Financial Counsellor
Table 7.4 Educational Seminar Research Questions and Findings Question 4: What is the users’ perception of the communication of information provided by
the financial counsellor?
Users believed the information was well communicated.
Question 4A: To what extent do users feel they are informed by accessing the financial
counsellor?
Users believed that they were being informed by accessing the financial counselling.
Question 4B: Do users place importance on superannuation fund provided financial
counselling for their decision making?
Users do place importance on financial counselling for their superannuation decisions.
Question 4C: How frequently do users access the financial counselling provided by the
superannuation fund?
The financial counselling was the least frequently used educational resource.

255
The results are summarised below.
Research questions 4, 4A, 4B and 4C presented in Table 7.4 relate to the
superannuation fund provided financial counsellor. Almost 20 percent of respondents
indicated that they received superannuation fund provided financial counselling. This
result was consistent with Clark-Murphy and Gerrans (2001) who also found that a
low percentage of Australian university superannuation fund members consulted with
the superannuation fund representative when making a superannuation fund related
decision. However, in the US Helman and Paladino (2004) found a large number of
workers accessed an employer or retirement fund provided financial planner for their
retirement savings educational requirements.
When it came to rating the usefulness of the financial counselling, a large majority of
respondents to this question perceived the counsellor to be a good communicator of
information and the counsellor’s advice led respondents to being informed on
superannuation issues. A large percentage of those respondents (80.3 percent) using
the financial counselling service indicated that they placed importance on the
financial counselling for their decision making. This result is consistent with Helman
and Paladino (2005) who found that individual access by US workers to a financial
planner was rated as the most helpful resource when it came to improving their
knowledge of retirement savings issues. In the current study it was found that the
financial counselling service was the least used superannuation fund provided
educational resource. However, given the specific nature of the educational
information provided by the financial counsellor, those who access the resource
generally rate it highly and therefore it constitutes an important element of the
superannuation educational model.
7.3.5 Implications for the Educational Model
The findings in respect of users’ perceptions of the educational resources indicate that
the resources are generally informative on superannuation issues. However, not all the
resources are being used by all respondents. Written communications was the most
utilised educational resource followed by the superannuation fund website,
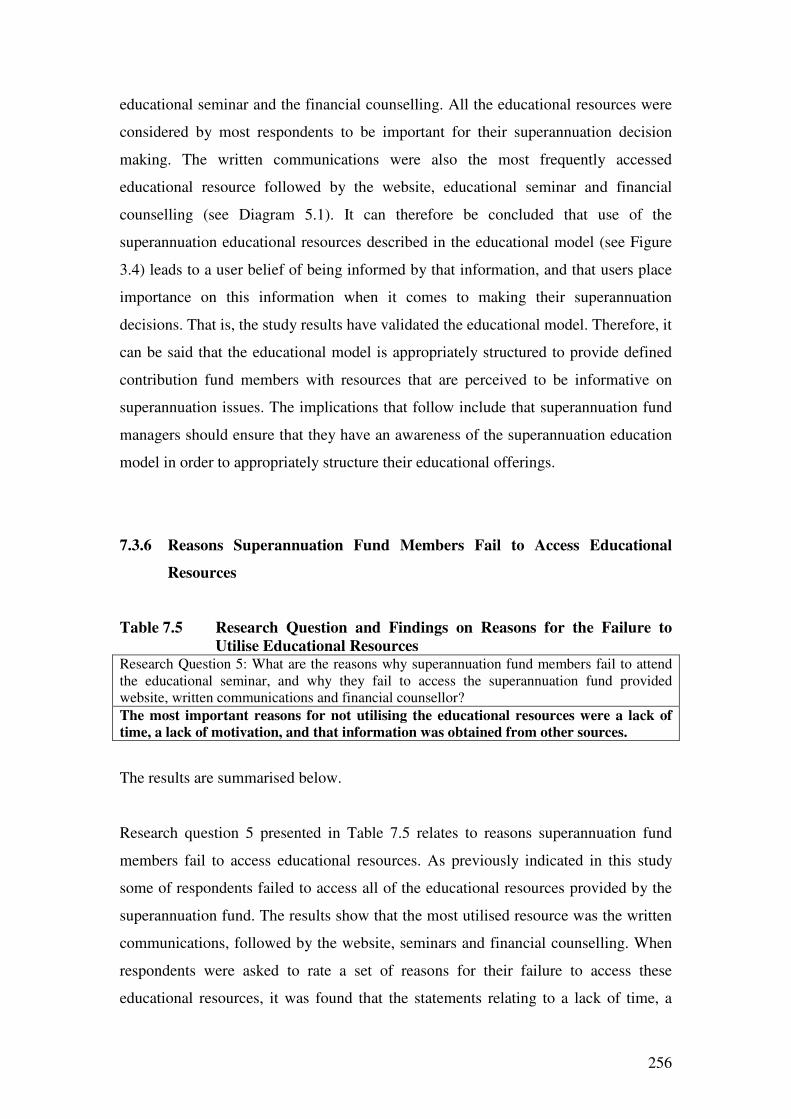
256
educational seminar and the financial counselling. All the educational resources were
considered by most respondents to be important for their superannuation decision
making. The written communications were also the most frequently accessed
educational resource followed by the website, educational seminar and financial
counselling (see Diagram 5.1). It can therefore be concluded that use of the
superannuation educational resources described in the educational model (see Figure
3.4) leads to a user belief of being informed by that information, and that users place
importance on this information when it comes to making their superannuation
decisions. That is, the study results have validated the educational model. Therefore, it
can be said that the educational model is appropriately structured to provide defined
contribution fund members with resources that are perceived to be informative on
superannuation issues. The implications that follow include that superannuation fund
managers should ensure that they have an awareness of the superannuation education
model in order to appropriately structure their educational offerings.
7.3.6 Reasons Superannuation Fund Members Fail to Access Educational
Resources
Table 7.5 Research Question and Findings on Reasons for the Failure to
Utilise Educational Resources Research Question 5: What are the reasons why superannuation fund members fail to attend
the educational seminar, and why they fail to access the superannuation fund provided
website, written communications and financial counsellor? The most important reasons for not utilising the educational resources were a lack of
time, a lack of motivation, and that information was obtained from other sources.
The results are summarised below.
Research question 5 presented in Table 7.5 relates to reasons superannuation fund
members fail to access educational resources. As previously indicated in this study
some of respondents failed to access all of the educational resources provided by the
superannuation fund. The results show that the most utilised resource was the written
communications, followed by the website, seminars and financial counselling. When
respondents were asked to rate a set of reasons for their failure to access these
educational resources, it was found that the statements relating to a lack of time, a

257
lack of motivation and to obtaining information from other sources received the most
agreement. In particular, a lack of motivation and not finding time to become
informed on superannuation matters are consistent with the behavioural literature on
inertia and procrastination (Gallery & Gallery 2005). However, it is reasonable to
expect that not all respondents will access all the superannuation provided resources
and may instead select alternative convenient or preferred resources to satisfy their
information needs.
7.3.7 Other Sources of Superannuation Fund Educational Information
Table 7.6 Research Question and Findings on the Importance Placed on
Non-superannuation Fund Provided Educational Resources Research Question 6: What is the importance placed by superannuation fund members on
other non-superannuation fund provided sources of educational information? Many respondents place importance on other non-superannuation fund provided
educational sources. Friends and colleagues were rated by respondents as the most
important source followed by newspaper publications, personal financial
planner/adviser, financial magazines, and radio and television.
The results are summarised below.
Research question 6 presented in Table 7.6 relates to the importance placed by
superannuation fund members on non-superannuation fund sources of educational
information. Five sources of information were investigated: newspaper publications;
financial magazines; radio and television; personal financial adviser or planner; and
friends and colleagues. Respondents rated information from friends and colleagues as
the most important resource for their educational needs followed by newspaper
publications, personal financial adviser or planner, financial magazines, and radio and
television. Clark-Murphy and Gerrans (2001) also found that a large percentage (49
percent) of the respondents to their study consulted with colleagues when making a
superannuation decision; and, Duflo and Saez (2002) confirmed that respondents
placed high importance on advice from their colleagues when it came to decisions on
retirement savings. Hilgert, Hogarth and Beverly (2003) found evidence that US
households prefer to receive financial information through newspaper publications.
This research evidence suggests that individuals utilise other non-superannuation fund

258
information sources and that they also place importance on this information for their
superannuation educational requirements. Accordingly, its inclusion in the
superannuation education model is justified as it provides another avenue for
superannuation fund members to become informed on superannuation matters.
7.3.8 Group Differences in Mean Responses
Table 7.7 Research Question and Findings on the Group Differences in
Mean Responses Research Question 7: Do any significant differences exist between groups in respect of mean
responses on the usefulness found in superannuation fund provided educational resources? Statistically significant differences were found for the following: those with and without
employment history in investment and finance; those with and without formal
educational training in investment and finance; academics and non-academics; and,
differing education level. Overall there were not many differences among group ratings
on the usefulness of the educational resources.
A summary of the results is provided below.
No statistically significant differences were found between males and females for
their mean ratings of the superannuation fund educational information. The only
statistically significant difference between the mean responses to the educational
items for those with and without employment history in investment and finance was
for being ‘informed by the website’. Those with employment history in investment
and finance rated the website more highly than those without such employment
experience. Statistically significant differences were also found in the mean responses
for seminar presentation and, informed by the website, for those groups with and
without formal educational training in investment and finance. The group with formal
educational training rated the seminar presentation more highly and the group without
this educational training rated the information received on the website more highly.
No statistically significant differences were found between the mean ratings of
educational items for those with little or no knowledge against those with moderate or
substantial knowledge in investment matters. Statistically significant results were
found between academics and non-academics for their mean responses to seminar

259
presentation, informed by seminar, informed by the website and informed by written
communications. Non-academics rated all of these items more highly than academics.
No statistically significant differences were found for mean responses based on age.
Significant differences were found with respect to education for mean responses to
both informed by seminar and, informed by website. There was a significant
difference in mean responses to informed by seminar between the postgraduate
qualified and the undergraduate qualified groups, and for mean responses for
informed by website between the postgraduate qualified and no undergraduate
qualification groups. No statistical differences were found for the mean responses for
the groups with different attitudes to risk; and, one statistically significant result was
obtained for the mean responses to seminar presentation between groups with
different superannuation account balances.
7.3.9 Group Differences in Accessing Superannuation Fund Provided
Educational Resources
Table 7.8 Research Question and Findings on Group Differences in the Use
of Superannuation Fund Provided Educational Resources Research Question 8: Do any significant differences exist between groups in respect of
utilising the superannuation fund provided educational resources? A significant finding was that males were more likely than females to engage with all
educational resources than except for financial counselling. Also those with higher
investment and finance knowledge and those with a more aggressive attitude to
investment risk were more likely to utilise more of the educational resources than those
with less knowledge. This was also the case for those with higher superannuation
account balances.
These findings provide important new evidence as to which groups of defined
contribution fund members are more likely to use the educational resources. A
summary of the results is provided below.
It was found that males were more likely to attend an educational seminar than
females and that older superannuation fund members were more likely to attend the
seminar than younger members. Statistical testing indicated that those with moderate
or substantial knowledge of finance and investment matters were more likely to attend

260
the seminar than those with little or no knowledge. Non-academics were more likely
to attend a seminar than academics, and those with higher account balances in their
superannuation accounts were also more likely to attend a seminar than those with
lower account balances.
Further tests of statistical independence indicated that males were more likely to
access the superannuation fund website than females; and those with employment
history in investment and finance were more likely to access the website than those
without such employment history. Those with educational training in investment and
finance were more likely to access the website than those without such training; and
those with moderate or substantial knowledge in investment matters were more likely
to access the website than those with little or no investment knowledge. Respondents
with an aggressive attitude to investment risk were also more likely to access the
website than those with a neutral or conservative approach, and those with higher
account balances in their superannuation account are more likely to access the website
than those with lower account balances.
Statistical testing showed that males are more likely to read the superannuation
written communications than females; and, those with educational training in
investment and finance were more likely to read the written communications than
those without such training. Those respondents with moderate or substantial
knowledge in investment matters were more likely to read the written
communications than those with little or no knowledge in these matters; and
respondents with an aggressive attitude to investment risk were more likely to read
the written communication than those with a neutral or conservative approach. It was
also found that respondents with high superannuation account balances were more
likely to read the written communications than those with relatively lower balances.
Further, statistical testing indicated that the older age groups are more likely to access
financial counselling than the younger age groups; and that those respondents with
higher superannuation account balances are more likely to receive financial
counselling than those with lower account balances.
The research identifies the following superannuation fund member groups as less
likely to engage with these educational resources: females, those with little or no

261
knowledge in finance and investment matters, younger age groups and those with low
superannuation balances. Accordingly, it is strongly recommended that educational
programs be specifically tailored and targeted to these groups so that they can receive
the appropriate education on superannuation matters. It is vital that these groups
receive educational information on superannuation issues given that the review of the
literature identified them as most at risk of not accumulating sufficient retirement
savings.
7.3.10 Group Differences in Respect of the Importance Placed on Non-
Superannuation Fund Educational Resources
Table 7.9 Research Question and Findings on the Group Differences in the
Importance Placed on Non-superannuation Educational Resources Research Question 9: Do any significant differences exist between groups in respect of the
importance they place on non-superannuation fund provided educational resources? The important findings were that females, those groups that are less educated and those
having a lower awareness of investment and finance matters were more likely to find the
financial planner/adviser and friends and colleagues more important to their
superannuation decisions. Males, the more highly educated, and those with greater
knowledge in investment and finance matters were more likely to find newspaper
publications and financial magazines more important to their superannuation decisions.
A summary of the results is provided below.
It was found that males were more likely to place greater importance on newspaper
publications for their superannuation education than females; and those with
postgraduate or undergraduate qualifications placed more importance on newspaper
publications for their superannuation education than those with no undergraduate
qualification. Those with moderate or substantial knowledge in investment matters
were more likely to place higher importance on newspaper publications than
respondents with little or no knowledge in these matters; and, those with an
aggressive attitude to investment risk were more likely to place more importance on
newspaper publications for their superannuation education than those with a neutral or
a conservative attitude to investment risk. Respondents with higher superannuation
account balances were also likely to place more importance on newspaper
publications for their superannuation education than those with lower balances.

262
Statistical testing indicated that males were more likely to place more importance on
financial magazines for their superannuation education than females; and, those with
postgraduate qualifications were less likely to place importance on financial
magazines for the superannuation education than those with undergraduate
qualifications. Further, those with an employment history in investment and finance
were more likely to find financial magazines important for their superannuation
education than those without such employment history; and, those with educational
training in finance and investment were more likely to find financial magazines
important for their superannuation education than those without this education. It was
also found that those with moderate or substantial knowledge in investment matters
were more likely to find financial magazines important for their superannuation
education than those with little or no knowledge in these matters; and, non-academics
were also likely to find financial magazines more important than academics.
Respondents that did not know their superannuation account balance were less likely
to find financial magazines important for their superannuation education than those
who knew their account balance. Only one statistically significant result was obtained
for importance placed by respondents on radio and television. It was found that both
those with a conservative and those with an aggressive attitude to investment risk
were more likely to find radio and television more important to their superannuation
education than those with a neutral attitude.
In respect of the financial adviser/planner it was found that females were more likely
to find the financial adviser/planner more important for their superannuation
education than males; and, those with an undergraduate or no undergraduate
qualification were more likely to find the financial adviser/planner important for their
superannuation education than those with a postgraduate qualification. It was found
that those without any educational training in investment and finance were more
likely to find the financial adviser/planner important for their superannuation
education than those with educational training; and, those with little or no knowledge
in finance and investment matters were more likely to find financial adviser/planner
important for their superannuation education than those with moderate or substantial
knowledge. Also, non-academics were likely to find the financial adviser/planner
more important for their superannuation education than academics; and, those with
the highest superannuation account balances were likely to find the financial

263
adviser/planner more important for their superannuation education than those with
lower account balances.
Further testing indicated that those without any educational training in finance and
investment were likely to find friends and colleagues more important for their
superannuation education than those with such training; and, those with little or no
knowledge in finance and investment matters were likely to find friends and
colleagues more important for their superannuation education than those with
moderate or substantial knowledge. Those respondents with the lowest
superannuation account balances were more likely to find friends and colleagues
important for their superannuation education when compared to those with higher
account balances.
7.4 Contributions of the Research
The main contribution of this study is the determination of whether superannuation
fund provided education is perceived by defined contribution fund members as
leading to more informed decision making in regard to their retirement savings. The
superannuation education model specified in this study describes the educational
resources that have been found to influence retirement fund members’ behaviour. The
results have validated the educational model, and have provided new evidence
indicating that superannuation fund members are using the educational resources
provided to them by their superannuation fund for information on their
superannuation. The study also provides further new evidence as to how important
these educational resources are to superannuation fund members’ overall
superannuation decision making, and how frequently these resources are utilised.
Moreover, new evidence was compiled to determine reasons why superannuation
fund members fail to use the educational resources; and, the importance placed by
defined contribution fund members on non-superannuation fund sources of
superannuation education. Additional evidence from inferential statistical testing
indicates which demographic groups are more likely to utilise the different
educational resources available to them, and the differences in how these groups rated

264
the resources for their superannuation information requirements. Furthermore,
evidence on the differences between demographic groups was established on the
importance these groups placed on non-superannuation fund educational sources.
Overall, this study takes a holistic approach as it provides evidence on the role the
major superannuation education resources and other non-superannuation fund
educational resources play in providing information to superannuation fund members.
7.5 Implications of the Study
This research identifies several groups of respondents who fail to engage with the
financial education provided to them when it comes to managing their
superannuation. Females, younger individuals, those with low superannuation
balances or low knowledge of finance and investment matters were the key groups
identified as less likely to utilise the educational information offered to them by the
superannuation fund. These results are consistent with the literature that continually
shows that women possess lower levels of financial knowledge than males and are
therefore less likely to adequately plan for retirement (Lusardi 2005; Lusardi &
Mitchell 2007a; ANZ 2008): and that females were more likely to find superannuation
decisions more difficult than males (Clark-Murphy and Gerrans.2001; Clark-Murphy,
Kristofferson & Gerrans 2002).
The implications that flow from this study include that by failing to utilise these
educational resources females are at higher risk of not adequately solving the
retirement savings problem and therefore not accumulating sufficient funds for
retirement. It is strongly recommended that females are specifically targeted by
governments and superannuation funds through both an awareness campaign and
education programs that are tailored specifically for this demographic group.
Younger adults were also identified as having low financial awareness when it came
to retirement savings (Lusardi & Mitchell 2006; ANZ 2008). It was acknowledged
that there are difficulties associated with getting young individuals to adequately
engage with their retirement savings because they perceive retirement to be something
that is far too distant to consider and therefore place less value on it (hyperbolic

265
discounting, see Chapter 3 section 3.3.2. The government has instigated a taskforce to
report on how education programs can better assist individuals in saving for
retirement and, through the Australian Taxation Office, it has also instigated a
program that allows individuals to search for any lost superannuation. However, more
needs to be done by relevant stakeholder groups to ensure that younger Australians
have an improving awareness of the importance of managing their superannuation.
More needs to be done to ensure that younger groups understand that they will
experience a less than comfortable retirement lifestyle if they do not generate the
necessary savings. The future benefits associated with the adequate management of
their superannuation funds throughout their working lives needs to be stressed to this
group.
Further, the government and the superannuation industry needs to pursue and inform
those less financially educated individuals on the need to plan for retirement with
specifically targeted information and educational programs. Similar to gender, and the
young, less financially literate individuals are at risk of not accumulating sufficient
retirement savings and so superannuation education needs to be more directly targeted
at better informing this group.
7.6 Limitations of the Study
This study contains several limitations that have been identified and discussed in
earlier chapters, and which are summarised in this section. A purposive (judgement)
sample was used to obtain responses. Purposive samples are not considered to be
random samples as the sample is selected from a researcher’s judgement as a
representation of a population. The researcher’s opinions of what constitutes a
representative sample are likely to introduce some bias into the process. However, a
carefully chosen purposive sample can be deemed to represent a population and,
therefore, the results obtained from the study can be generalised. Purposive sampling
was utilised in this study because generating a purely random sample was not
possible.

266
With electronically mailed questionnaire surveys, response rate is a matter that can
introduce response bias which may affect the reliability of the research data. Certain
procedures were implemented in this study in an effort to maximise the response rate
including ensuring that the questionnaire layout, wording and design was appropriate.
As part of the mitigation process, the questionnaire was tested prior to its final
administration. In addition, two reminder letters were sent and this resulted in an
increase in the final response rate to 30.1 percent. The response rate compares
favourably to the range of response rates achieved by electronic surveys (see section
4.4.1.2) and is deemed acceptable.
The results from this study have provided empirical evidence that superannuation
fund provided educational resources are perceived by superannuation defined
contribution fund members as generally contributing to them being more informed.
These results were obtained within the context of superannuation fund members in a
university industry fund and validity to members of other types of superannuation
funds remains to be tested in future research.
7.7 Further Research
This study used a survey approach to determine superannuation fund members’
perceptions of superannuation fund provided financial educational resources.
Therefore, this study assesses members’ perceptions of being informed. Future
research could focus on what, if any, measurable member benefits arise from decision
making resulting from exposure to the financial education resources considered in this
study.
An evaluation of the educational program investigated in this study (seminars,
website, written communications, and financial counselling) could also be undertaken
to see whether it accords with models of best practice. Although it was beyond the
scope of this study to examine the literature on adult education, this remains a fruitful
area for future study: research could be conducted to see how ‘best adult education’
principles can be applied to superannuation fund sponsored financial education to
achieve better learning outcomes for superannuation fund members. Saliterman and

267
Sheckley (2003) suggested that when research-based adult-learning principles are
applied to retirement savings information, those receiving the information were much
more likely to increase their retirement savings contributions.
There is a lack of research that focuses on how members of self-managed
superannuation funds acquire financial knowledge. There is a proliferation of such
funds in Australia (refer Table 2.2, Section 2.6) and targeting appropriate education to
these fund members is of future economic importance as inadequate superannuation
investment knowledge will inhibit the maximisation of retirement income for their
members. An investigation of the educational resources that members of self-
managed superannuation funds utilise as part of their decision making process is
therefore warranted, and the importance they place on educational information for
their decision making should also be investigated.

268
APPENDICES

269
APPENDIX ONE
QUESTIONNAIRE

270
1. Introduction Thank you for taking the time to complete the survey. Your feedback is greatly appreciated. This survey will take approximately 15 minutes to complete. It is important to note that your responses to the survey will be completely anonymous. In order to progress through this survey, please use the following navigation
links: -Click the Next >> button to continue to the next page. -Click the previous << button to return to the previous page. -Click the Submit >> button to submit your survey. If you have any questions, please contact Michael Ntalianis on (03) 99195048 or
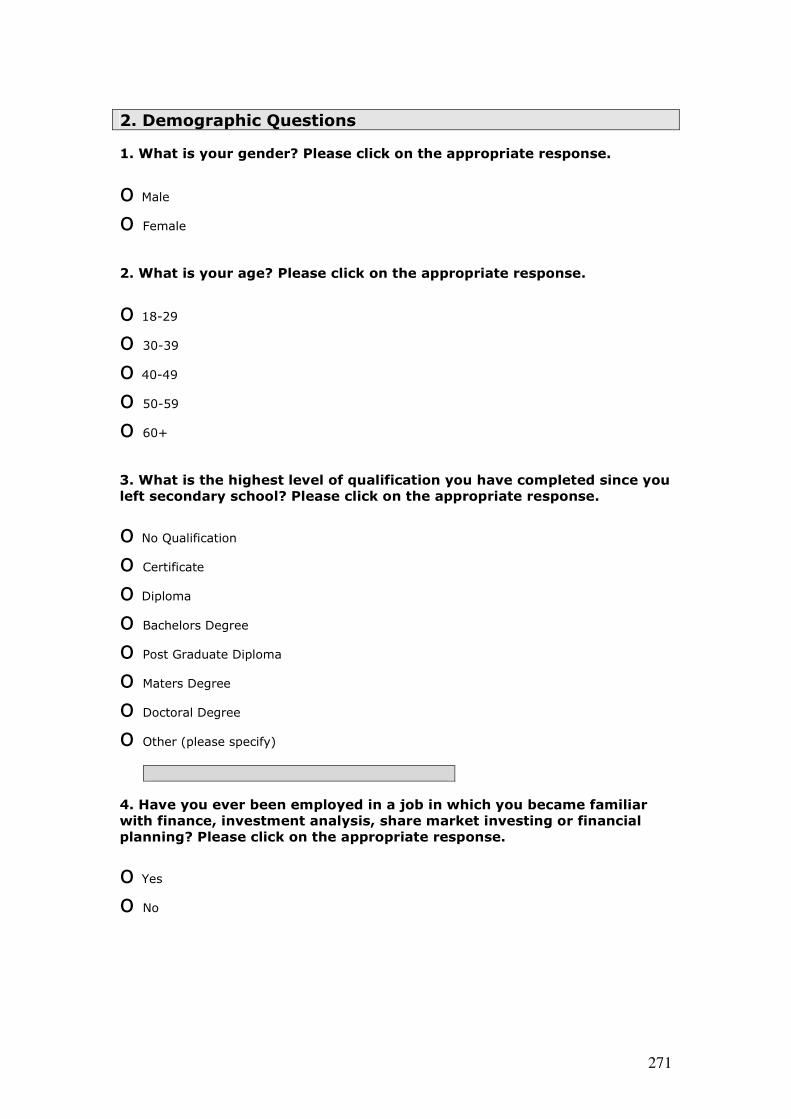
271
2. Demographic Questions
1. What is your gender? Please click on the appropriate response.
o Male o Female
2. What is your age? Please click on the appropriate response.
o 18-29 o 30-39
o 40-49 o 50-59 o 60+
3. What is the highest level of qualification you have completed since you
left secondary school? Please click on the appropriate response.
o No Qualification o Certificate o Diploma
o Bachelors Degree o Post Graduate Diploma o Maters Degree o Doctoral Degree
o Other (please specify)
4. Have you ever been employed in a job in which you became familiar
with finance, investment analysis, share market investing or financial
planning? Please click on the appropriate response.
o Yes o No

272
5. Have you ever had any formal educational training in finance,
investment, share market training or financial planning? Please click on
the appropriate response.
o Yes o No
6. How would you rate your knowledge of financial and investment
matters? Please click on the appropriate response.
o No knowledge o Little knowledge o Moderate knowledge o Substantial knowledge
7. How would you rate your attitude towards investment risk? Please
click on the appropriate response.
o Conservative o Moderately Conservative o Neutral
o Moderately Aggressive o Aggressive
8. How would you best describe your area of employment? Please click
on the appropriate response.
o Academic
o Administration o Library Services o Human Resources o Information Technology Services
o Building and Ground Maintenance o Finance and Accounting Services o Other (please specify)

273
3. Educational Seminars The following section asks you to consider your attendance in educational seminars.
9. Have you ever attended an educational seminar provided by your
superannuation fund? Please click on the appropriate response.
o Yes [Proceed to Question 10 by clicking on the next button] o No [Proceed to Question 13 by clicking on the next button]
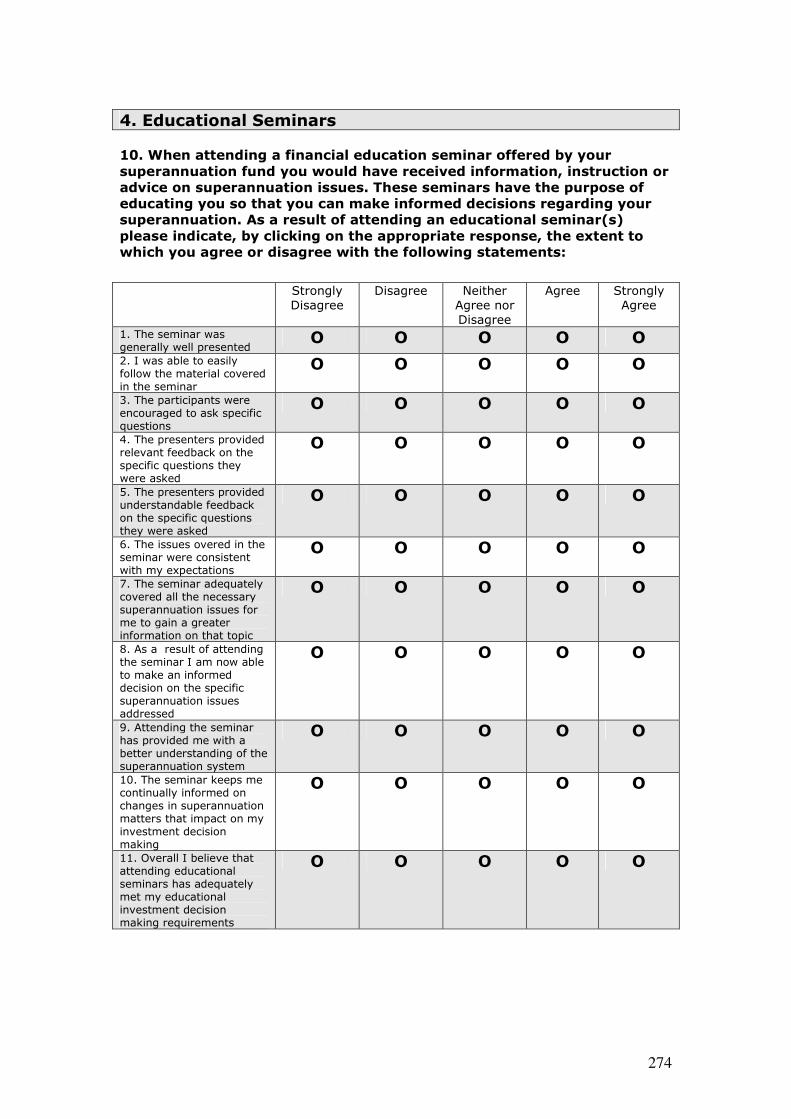
274
4. Educational Seminars
10. When attending a financial education seminar offered by your
superannuation fund you would have received information, instruction or
advice on superannuation issues. These seminars have the purpose of
educating you so that you can make informed decisions regarding your
superannuation. As a result of attending an educational seminar(s)
please indicate, by clicking on the appropriate response, the extent to
which you agree or disagree with the following statements:
Strongly Disagree
Disagree Neither Agree nor Disagree
Agree Strongly Agree
1. The seminar was generally well presented
O O O O O
2. I was able to easily follow the material covered in the seminar
O O O O O
3. The participants were encouraged to ask specific questions
O O O O O
4. The presenters provided relevant feedback on the specific questions they were asked
O O O O O
5. The presenters provided understandable feedback on the specific questions they were asked
O O O O O
6. The issues overed in the seminar were consistent with my expectations
O O O O O
7. The seminar adequately covered all the necessary superannuation issues for me to gain a greater information on that topic
O O O O O
8. As a result of attending the seminar I am now able to make an informed decision on the specific superannuation issues addressed
O O O O O
9. Attending the seminar has provided me with a better understanding of the superannuation system
O O O O O
10. The seminar keeps me continually informed on changes in superannuation matters that impact on my investment decision making
O O O O O
11. Overall I believe that attending educational seminars has adequately met my educational investment decision making requirements
O O O O O

275
11. How important is the educational seminar when it comes to your
superannuation information requirements? Please click the appropriate
option.
No Importance
Not Very Important
No Opinion Moderately Important
Very Important
Educational Seminar O O O O O
12. Please indicate how often you access your superannuation fund
provided educational seminars. Please click on the appropriate response.
Rarely Sometimes Often Very Often
Educational Seminar O O O O

276
5. Educational Seminars
13. You indicated that you did not attend any investment seminars.
Please indicate, by clicking on the appropriate response, the extent to
which you agree or disagree with the following statements as an
explanation for why you did not attend:
Strongly Disagree
Disagree Neither Agree nor Disagree
Agree Strongly Agree
1. I have no awareness of the seminar program
O O O O O
2. I perceive no benefit from attending the seminar program
O O O O O
3. I perceive no relevance of the seminar topic to my superannuation decision making
O O O O O
4. I feel I already have the required knowledge to make informed superannuation decisions
O O O O O
5. I am not motivated enough to attend the seminars
O O O O O
6. I do not attend because
of a lack of interest O O O O O
7. I can utilise my time in more important issues
O O O O O
8. I am busy and do not have time to attend
O O O O O
9. I obtain my information requirements from other sources
O O O O O

277
6. Superannuation Fund Website
14. Have you accessed your superannuation fund sponsored website?
Please click on the appropriate response.
o Yes [Proceed to Question 15 by clicking on the next button] o No [Proceed to Question 19 by clicking on the next button]

278
7. Superannuation Fund Website 15. The website provides educational information, instruction and/or
advice on issues relating to your superannuation. The intention for this
website is to educate you on superannuation related issues so that you
can make informed decisions regarding your investments. After
accessing this website please indicate, by clicking the appropriate
response, the extent to which you agree or disagree with the following
statements:
Strongly Disagree
Disagree Neither Agree nor
Disagree
Agree Strongly Agree
1. The website informs me as to what I require in savings to adequately fund my retirement
O O O O O
2. The website allows me to make informed decisions when it comes to preparing an investment plan to meet my superannuation savings goal
O O O O O
3. The website allows me to make an informed
assessment as to the adequacy of my current savings levels to meet my superannuation needs
O O O O O
4. The website informs me on how my investment choices will impact on my future superannuation savings
O O O O O
5. The web-based investment calculator provides me with the information I require to determine which investment choice will best meet my superannuation savings need
O O O O O
6. The web-based investment calculator provided me with the information I required to develop a superannuation
investment plan
O O O O O
7. The website informs me on the concept of risk and how it applies to each investment choice offered by the fund
O O O O O
8. The website informs me on the potential returns produced by each investment choice offered by the fund
O O O O O
9. The website informs me on how my superannuation contributions are taxed
O O O O O
10. The website assists me
to understand how my investment returns from my superannuation fund
O O O O O

279
are taxed
11. The website assists me to understand how my superannuation savings will be taxed when I decide to retire
O O O O O
12. The website assists me to understand the impact
of salary sacrificing on my superannuation savings
O O O O O
13. Overall I found that the range of available educational information on this website adequately meets my investment decision making requirements
O O O O O
16. How important is the superannuation fund provided website when it
comes to your superannuation information requirements? Please click
the appropriate option.
No Importance
Not Very Important
No Opinion Moderately Important
Very Important
Superannuation Fund Website
O O O O O
17. Please indicate how often you access your superannuation fund
provided website. Please click on the appropriate response.
Rarely Sometimes Often Very Often
Superannuation Fund Website
O O O O

280
8. Superannuation Fund Website 18. Please rate the importance of the following web-based items to your
financial education requirements for informed decision making. Please
indicate, by clicking on the appropriate response, the extent to which you
find the following items important:
No
Importance
Not Very
Important
No Opinion Moderately
Important
Very
Important 1. Information on the return performance of the individual investment choices/options offered by the fund
O O O O O
2. Information on the characteristics of each investment option in relation to potential returns
O O O O O
3. Information on the
characteristics of each investment option in relation to potential risks
O O O O O
4. Recent news items on superannuation related issues
O O O O O
5. Details on how to access personal financial planning advice
O O O O O
6. Information on the content and availability of educational seminars
O O O O O
7. Access to financial calculators
O O O O O
8. Access to superannuation generated publications such as the annual report of the superannuation fund, newsletters and other educational publications
O O O O O

281
9. Superannuation Fund Website
19. You indicated that you did not use the superannuation website.
Please indicate, by clicking on the appropriate response, the extent to
which you agree or disagree with the following statements as an
explanation for why you did not use this site:
Strongly Disagree
Disagree Neither Agree nor Disagree
Agree Strongly Agree
1. I have no awareness of the existence of a website
O O O O O
2. I perceive no benefit from accessing the website
O O O O O
3. I perceive no relevance of the information on the website to my superannuation decision making
O O O O O
4. I feel I already have the required knowledge to make informed superannuation investment decisions
O O O O O
5. Lack of motivation O O O O O 6. Lack of interest O O O O O 7. I am busy and do not have the time to visit the website
O O O O O
8. I obtain my information from other sources
O O O O O
9. I do not like using the website for my information
O O O O O
10. I do not have the necessary skills to use the website
O O O O O

282
10. Mailed Superannuation Fund Communications
20. Do you read the written communications (annual report to members
and newsletters) mailed to you by the superannuation fund? Please click
on the appropriate response.
o Yes [Proceed to Question 21 by clicking on the next button] o No [Proceed to Question 24 by clicking on the next button]

283
11. Mailed Superannuation Fund Communications 21. You indicated that you read the communications provided by your
superannuation fund manager. The material is a means by which the
superannuation fund directly communicates with you on matters relating
to your superannuation. These communications have the purpose of
educating you so that you are informed about your superannuation. As a
result of reading this material, please indicate, by clicking on the
appropriate response, the extent to which you agree or disagree with the
following statements:
Strongly Disagree
Disagree Neither Agree nor Disagree
Agree Strongly Agree
1. The written communication informs me on the investment risks attached to the investment options offered by the superannuation fund
O O O O O
2. The written
communication informs me on the investment returns generated by the investment options offered by the superannuation fund
O O O O O
3. The written communication informs me on recent developments in superannuation and the implications for my superannuation savings
O O O O O
4. The written communication informs me on the suitability of my current contributions to meeting my retirement savings requirements
O O O O O
5. The written communication assists me in making an informed choice in selecting appropriate investment
options to meet my current requirements
O O O O O
6. The written communication informs me on the education and information services offered by the superannuation fund
O O O O O
7. I usually read thoroughly all sections of the mailed communications
O O O O O
8. I usually read thoroughly only specific sections of the mailed communications
O O O O O
9. Overall I found the range of available information in these written communications have informed my superannuation investment
O O O O O

284
decision making
22. How important are the written communications mailed to you by the
superannuation fund? Please click the appropriate option.
No Importance
Not Very Important
No Opinion Moderately Important
Very Important
Written Communications O O O O O
23. Please indicate how often you read your superannuation written
communications. Please click on the appropriate response.
Rarely Sometimes Often Very Often
Written Communications O O O O
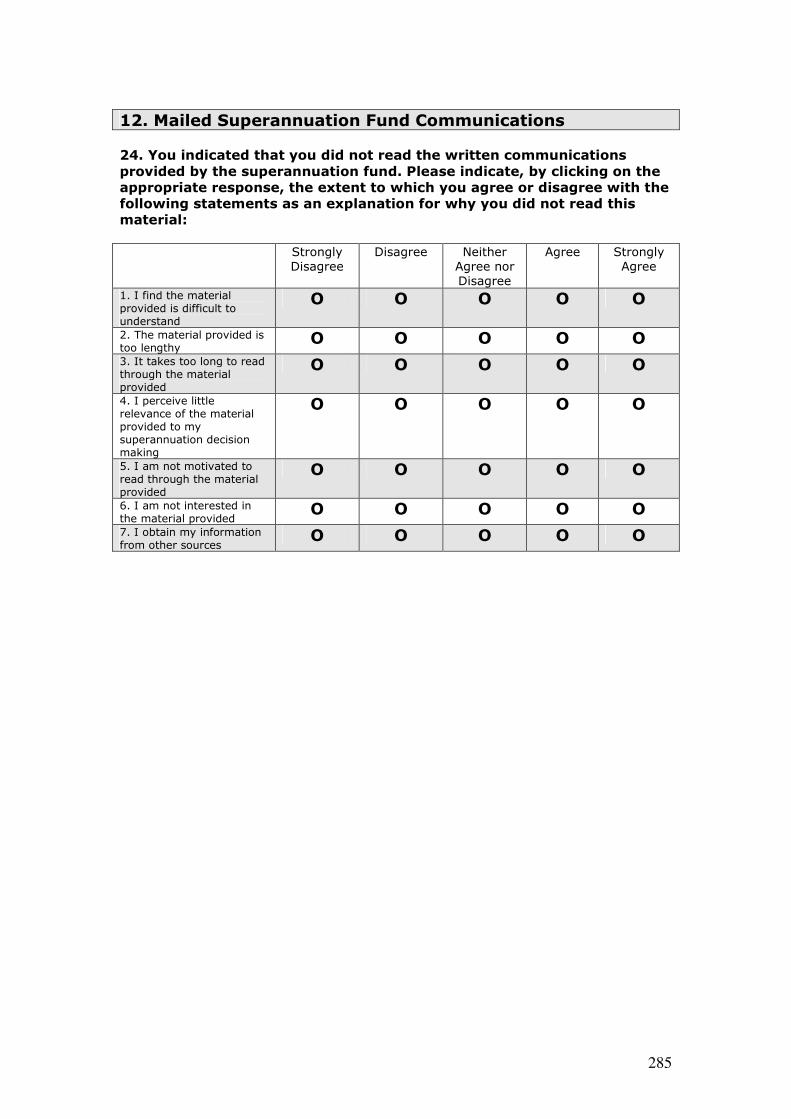
285
12. Mailed Superannuation Fund Communications
24. You indicated that you did not read the written communications
provided by the superannuation fund. Please indicate, by clicking on the
appropriate response, the extent to which you agree or disagree with the
following statements as an explanation for why you did not read this
material:
Strongly Disagree
Disagree Neither Agree nor Disagree
Agree Strongly Agree
1. I find the material provided is difficult to understand
O O O O O
2. The material provided is too lengthy
O O O O O
3. It takes too long to read through the material provided
O O O O O
4. I perceive little relevance of the material provided to my superannuation decision making
O O O O O
5. I am not motivated to read through the material provided
O O O O O
6. I am not interested in the material provided
O O O O O
7. I obtain my information from other sources
O O O O O

286
13. Financial Counsellor
25. Have you obtained financial advice from the superannuation provided
financial counsellor? Please click on the appropriate response.
o Yes [Proceed to Question 26 by clicking on the next button] o No [Proceed to Question 29 by clicking on the next button]
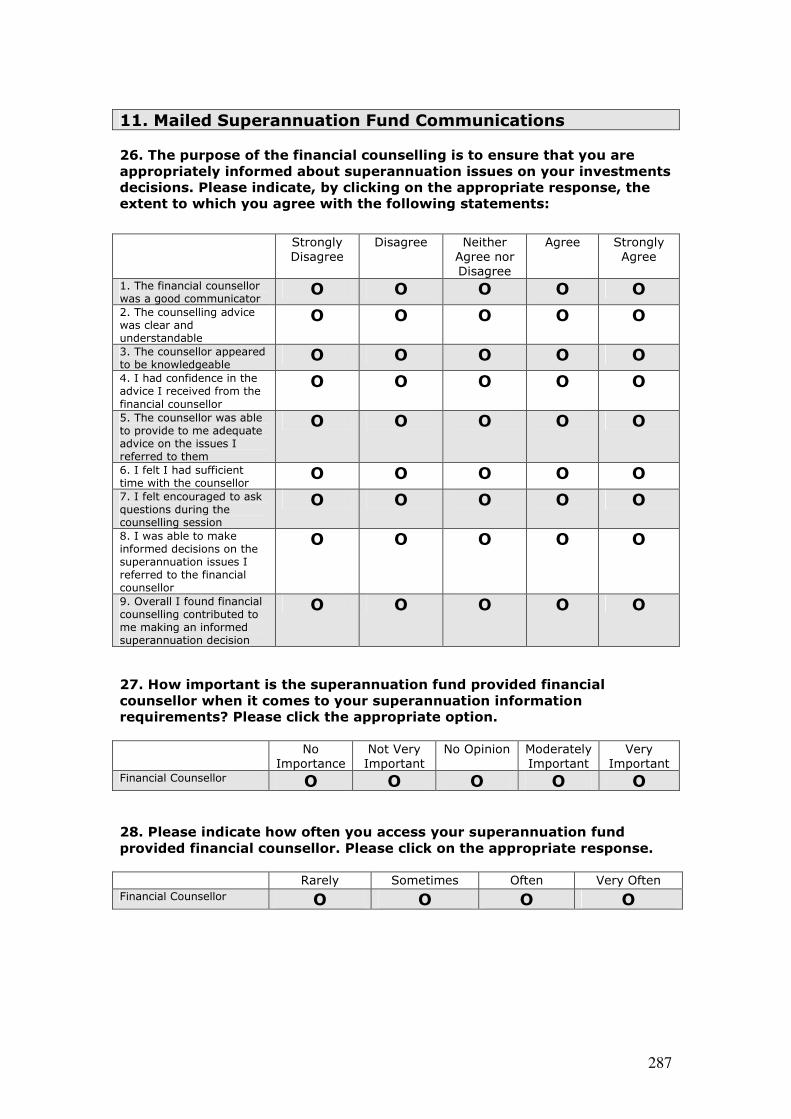
287
11. Mailed Superannuation Fund Communications 26. The purpose of the financial counselling is to ensure that you are
appropriately informed about superannuation issues on your investments
decisions. Please indicate, by clicking on the appropriate response, the
extent to which you agree with the following statements:
Strongly Disagree
Disagree Neither Agree nor Disagree
Agree Strongly Agree
1. The financial counsellor was a good communicator
O O O O O
2. The counselling advice was clear and understandable
O O O O O
3. The counsellor appeared to be knowledgeable
O O O O O
4. I had confidence in the advice I received from the
financial counsellor
O O O O O
5. The counsellor was able to provide to me adequate advice on the issues I referred to them
O O O O O
6. I felt I had sufficient time with the counsellor
O O O O O
7. I felt encouraged to ask questions during the counselling session
O O O O O
8. I was able to make informed decisions on the superannuation issues I referred to the financial counsellor
O O O O O
9. Overall I found financial counselling contributed to me making an informed superannuation decision
O O O O O
27. How important is the superannuation fund provided financial
counsellor when it comes to your superannuation information
requirements? Please click the appropriate option.
No Importance
Not Very Important
No Opinion Moderately Important
Very Important
Financial Counsellor O O O O O 28. Please indicate how often you access your superannuation fund
provided financial counsellor. Please click on the appropriate response.
Rarely Sometimes Often Very Often
Financial Counsellor O O O O
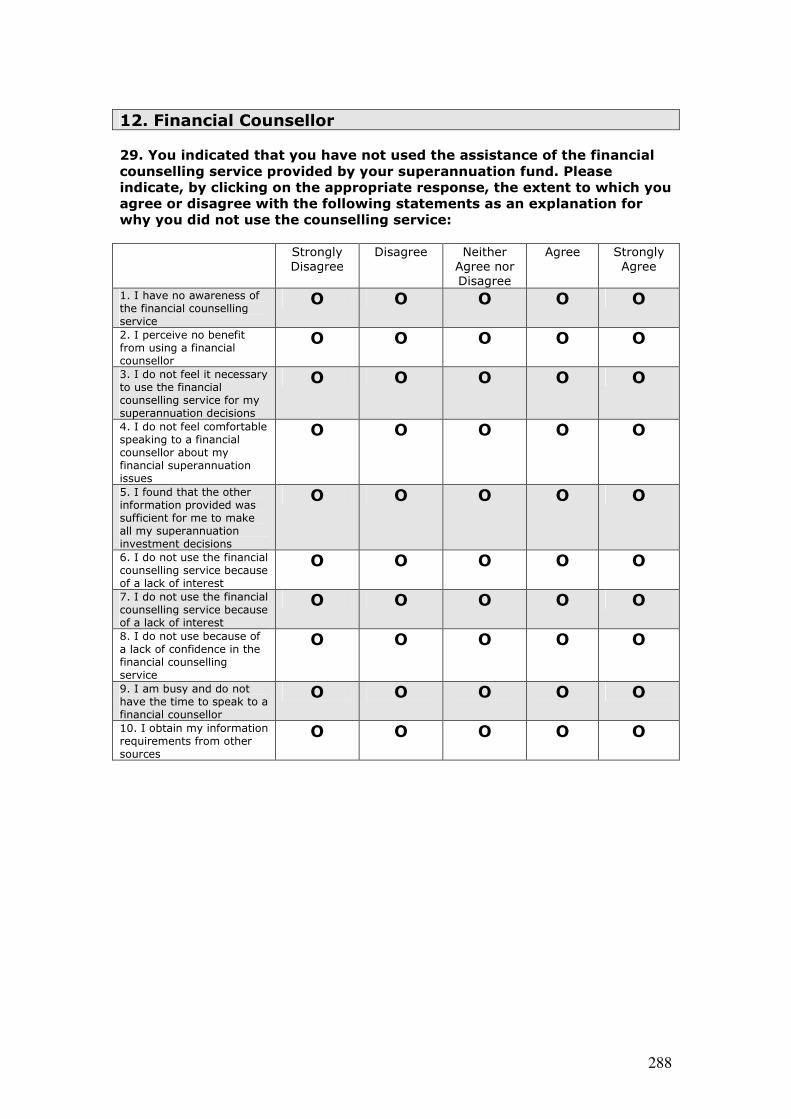
288
12. Financial Counsellor
29. You indicated that you have not used the assistance of the financial
counselling service provided by your superannuation fund. Please
indicate, by clicking on the appropriate response, the extent to which you
agree or disagree with the following statements as an explanation for
why you did not use the counselling service:
Strongly Disagree
Disagree Neither Agree nor Disagree
Agree Strongly Agree
1. I have no awareness of the financial counselling service
O O O O O
2. I perceive no benefit from using a financial counsellor
O O O O O
3. I do not feel it necessary to use the financial counselling service for my superannuation decisions
O O O O O
4. I do not feel comfortable speaking to a financial counsellor about my financial superannuation issues
O O O O O
5. I found that the other information provided was sufficient for me to make all my superannuation investment decisions
O O O O O
6. I do not use the financial counselling service because of a lack of interest
O O O O O
7. I do not use the financial counselling service because of a lack of interest
O O O O O
8. I do not use because of a lack of confidence in the financial counselling service
O O O O O
9. I am busy and do not have the time to speak to a financial counsellor
O O O O O
10. I obtain my information requirements from other sources
O O O O O
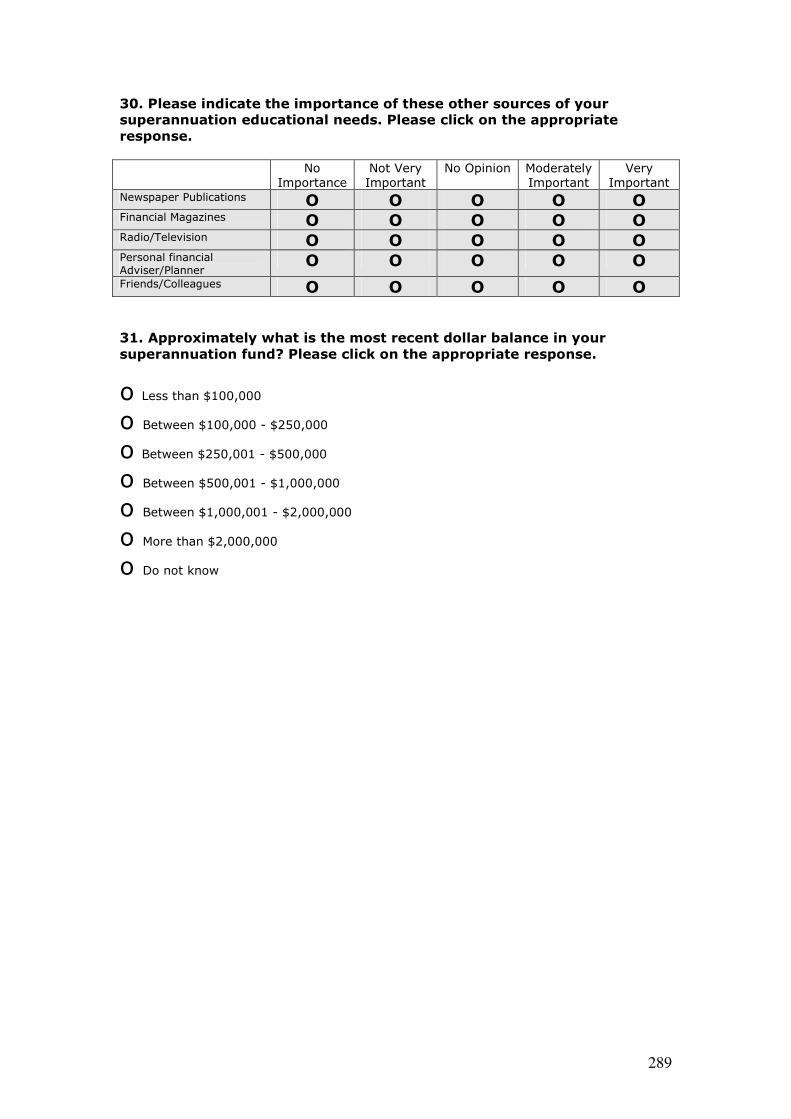
289
30. Please indicate the importance of these other sources of your
superannuation educational needs. Please click on the appropriate
response.
No Importance
Not Very Important
No Opinion Moderately Important
Very Important
Newspaper Publications O O O O O Financial Magazines O O O O O Radio/Television O O O O O Personal financial Adviser/Planner
O O O O O
Friends/Colleagues O O O O O
31. Approximately what is the most recent dollar balance in your
superannuation fund? Please click on the appropriate response.
o Less than $100,000 o Between $100,000 - $250,000
o Between $250,001 - $500,000 o Between $500,001 - $1,000,000 o Between $1,000,001 - $2,000,000
o More than $2,000,000 o Do not know

290
APPENDIX TWO
INFORMATION SHEET AND COVERING
LETTER

291
Invitation to participate in a survey about the role of financial
education in a choice of fund superannuation system.
Dear Colleague,
I would like to invite your participation in this survey as part of my
Doctor of Philosophy (Ph.D) degree’s research project, at the University
of Tasmania.
This study seeks only to survey members of the university sector
superannuation fund and who belong to the accumulation
superannuation plan (given an investment choice). If you are not a
member of university sector superannuation fund or you have a defined
benefit superannuation plan please ignore this survey.
It should take you approximately 15 minutes to complete this survey. To access the survey please click on the following link: http://www.surveymonkey.com/s.aspx?sm=FSqIrEWYXfcrdk83qc5wcQ_3d_3d Below is the information sheet for participants, which provides further details about the study and your privacy. I hope that you will take the time to participate in this study. Yours sincerely Michael Ntalianis
What is the study about?
The research project undertaken seeks to evaluate the role financial education plays in providing information, instruction and advice to superannuation fund members about their superannuation savings and

292
investment strategy. As a member of the University based accumulation fund you have the ability to exercise investment choice from the various investment options offered to you by your superannuation fund. It is particularly important to identify whether this financial education provided to you by the superannuation fund contributes to you being better informed about your superannuation investment decisions. Privacy and Confidentiality
To ensure the validity of results, a reply to the attached questionnaire would be greatly appreciated. While your cooperation in completing the questionnaire is valued, your participation is voluntary. It is important to note that the results from this survey will be used only in an aggregated form and therefore your anonymity and the confidentiality of your responses are assured. The completed questionnaire will be securely stored and available only to the supervisors and myself. The only people to have access to the details of the questionnaires are my supervisors, external examiners, University of Tasmania and myself. This project has been approved by the Human Research Ethics Committee of the University of Tasmania (Approval No: H9847). Nature and extent of your participation
The questionnaire includes questions seeking information about: Educational seminars; Superannuation fund sponsored websites; Superannuation fund written communications; and Superannuation provided financial counselling. It will take approximately 15 minutes to complete the questionnaire. Your decision to complete and submit the questionnaire is taken as consent that you have read the information on this information sheet and that you understand the procedures, that your questions have been answered to your satisfaction, that you understand that you don’t have to answer any question, and that you have voluntarily chosen to participate in this study. I thank you for taking the time to read the information sheet and I express a hope that you will be willing to participate in the study. Your participation would therefore be highly appreciated and I look forward to receiving your completed questionnaire. Should you have any queries regarding the project or questionnaire, please feel free to contact me on (03 9919 5048) or e-mail me at: [email protected] or my principal supervisor, Professor Victoria Wise, on e-mail: [email protected], or if you have any concerns of an ethical nature or complaints about the manner in which the project is conducted, you may contact the Executive Officer of the Human Research Ethics Committee (Tasmania) Network on (03 6226 7479) or [email protected].

293
APPENDIX THREE
Ethics Approval Letter from University of
Tasmania

294

295

296
APPENDIX FOUR
DETAILS OF SAMPLE
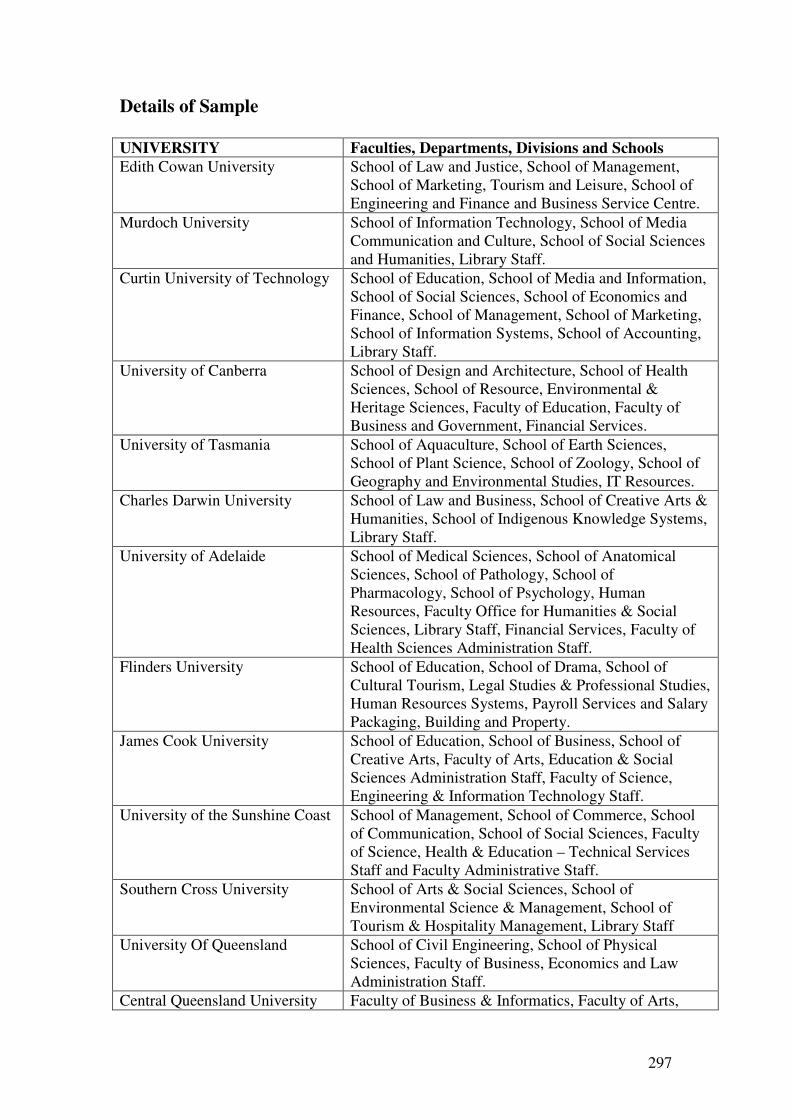
297
Details of Sample
UNIVERSITY Faculties, Departments, Divisions and Schools
Edith Cowan University School of Law and Justice, School of Management,
School of Marketing, Tourism and Leisure, School of
Engineering and Finance and Business Service Centre.
Murdoch University School of Information Technology, School of Media
Communication and Culture, School of Social Sciences
and Humanities, Library Staff.
Curtin University of Technology School of Education, School of Media and Information,
School of Social Sciences, School of Economics and
Finance, School of Management, School of Marketing,
School of Information Systems, School of Accounting,
Library Staff.
University of Canberra School of Design and Architecture, School of Health
Sciences, School of Resource, Environmental &
Heritage Sciences, Faculty of Education, Faculty of
Business and Government, Financial Services.
University of Tasmania School of Aquaculture, School of Earth Sciences,
School of Plant Science, School of Zoology, School of
Geography and Environmental Studies, IT Resources.
Charles Darwin University School of Law and Business, School of Creative Arts &
Humanities, School of Indigenous Knowledge Systems,
Library Staff.
University of Adelaide School of Medical Sciences, School of Anatomical
Sciences, School of Pathology, School of
Pharmacology, School of Psychology, Human
Resources, Faculty Office for Humanities & Social
Sciences, Library Staff, Financial Services, Faculty of
Health Sciences Administration Staff.
Flinders University School of Education, School of Drama, School of
Cultural Tourism, Legal Studies & Professional Studies,
Human Resources Systems, Payroll Services and Salary
Packaging, Building and Property.
James Cook University School of Education, School of Business, School of
Creative Arts, Faculty of Arts, Education & Social
Sciences Administration Staff, Faculty of Science,
Engineering & Information Technology Staff.
University of the Sunshine Coast School of Management, School of Commerce, School
of Communication, School of Social Sciences, Faculty
of Science, Health & Education – Technical Services
Staff and Faculty Administrative Staff.
Southern Cross University School of Arts & Social Sciences, School of
Environmental Science & Management, School of
Tourism & Hospitality Management, Library Staff
University Of Queensland School of Civil Engineering, School of Physical
Sciences, Faculty of Business, Economics and Law
Administration Staff.
Central Queensland University Faculty of Business & Informatics, Faculty of Arts,

298
Humanities & Education, Division of Human
Resources.
Griffith University School of Education & Professional Studies (Brisbane,
Logan and Gold Coast), Executive Services, Strategic
and Business Services, Remuneration and Benefits.
Victoria University School of Education, School of Human Movement,
Recreation & Performance, School of Tourism,
Hospitality & Marketing, School of Nursing and
Widwifery, Library staff, Centre for Integrated
Learning.
Deakin University School of Accounting, School of Economics & Finance,
Deakin Business School, School of Information
Systems, School of Management, School of Education,
School of Communication & Creative Arts, School of
International & Political Studies, Division of Student
Administration, Financial and Business Services
Division.
Melbourne University School of Accounting, School of Management &
Marketing, School of Culture and Communication,
School of Historical Studies, School of Culture and
Communication, Human Resources – Client Services.
Monash University Medical School - Gippsland, School of Nursing and
Midwifery, Victorian College of Pharmacy – Senior
Staff, Teaching and Research staff, Administrative staff,
Equity & Diversity Centre, Corporate Finance.
Latrobe University School of Communication Sciences, School of Social
Work & Social Policy, School of Occupational
Therapy, School of Accounting, School of Economics
& Finance, School of Management & Marketing,
Buildings & Grounds Division, Record Services,
School of Business – Administration.
University of Ballarat School of Human Movement and Sport Sciences –
Academic, Administrative & Technical Staff, Unisport
Staff, School of Business, Student Services, Science
and Engineering – Technical & Administration Staff,
Human Resources Staff.
Australian Catholic University School of Religious Education, School of Educational
Leadership, School of Psychology (Victoria & QLD).
University of New England School of Humanities, School of Arts, School of
Environmental and Rural Science, School of Business,
Economics & Public Policy, Research Services,
Marketing & Public Affairs.
Macquarie University Department of English, Department of Computing,
Department of Mathematics, Department of Electronic
Engineering, Department of Psychology, Office of
Financial Services
University of Wollongong School of Biological Sciences, School of Chemistry,
School of Earth & Environmental Sciences, School of
History & Politics, School of Social Sciences, Media &
Communication, Administration Personnel Services.

299
University of Technology
Sydney
School of Finance & Economics, School of Leisure,
Sport & Tourism, School of Management, School of
Marketing, School of Accounting, Faculty of Business –
Administration Staff.
University of NSW School of Law, School of Economics, School of
Education, School of Organisation & Management,
International Office.

300

300
Bibliography
ABC News 2009. ‘Credit Crunch Delays Baby Boomers’ Retirement,’ viewed 12
March 2009, <http://www.abc.net.au/news/stories/2009/03/022505244.htm.>
Abrami, P.C., Cholmsky, P., & Gordon, R. 2001, Statistical Analysis for the Social
Sciences: An Interactive Approach, Allyn and Bacon, Boston.
ABS Australian Bureau of Statistics 2008, Employment Arrangements, Retirement
and Superannuation, Australia, April to July 2007, Cat no. 6361.0, Australian
Government, Canberra.
ABS Australian Bureau of Statistics 2004, Australian Social Trends, Cat no. 4102.0,
Australian Governement, Canberra.
Aggarwal, R. 2004, ‘Persistant Puzzles in International Finance and Economics,’
Economic and Social Review, vol. 35, no. 3, pp. 241-250.
Agnew, J.R. & Szykman, L.R. 2005, ‘Asset Allocation and Information Overload:
The influence of Information Display, Asset Choice, and Investor Experience’,
Journal of Behavioural Finance, vol. 6, no. 2, pp. 57-70.
AIST Australian Institute of Superannuation Trustees 2008a, Co-Contribution Report,
April 2008, viewed 27 February 2009,
<http://aist.asn/Pages?polResAdv/documents/AISTcontsreport_highres.pdf>
AIST Australian Institute of Superannuation Trustees 2008b, Report on Financial
Crisis, AIST Background paper No 4, 15 October 2008, viewed 8 February 2009,
http://www.aist.asn.au/Pages/PolResAdv/documents/AISTResearch_ReportonFinanic
alCrisis.pdf
Aizcorbe, A. Kennickell, A. & Moore, K. 2003, ‘Recent Changes in U.S. Family
Finances: Evidence from 1998 and 2001 Survey of Consumer Finances’, Federal
Reserve Bulletin, January, pp. 1-32.
Alliance Strategic Research, 2008, Superannuation as a Social Policy – Retirement
Adequacy, viewed 25 February 2009,
<http://www.allianceresearch.com.au/docs/Superannuation_as_a_social_policy_Retir
ement_adequacy.pdf>
Alreck, P. L., & Settle, R.B. 1985, The Survey Research Handbook, Irwin,
Homewood, Illinois.
Americk, J., Caplin, A. & Leahy, J. 2003, ‘Wealth Accumulation and the Propensity
to Plan’, The Quarterly Journal of Economics, vol. 118, no. 3, pp. 1007-1047.
Ando, A. & Modigliani, F. 1963, ‘The Life-Cycle Hypothesis of Saving: Aggregate
Implications and Tests’, American Economic Review, no. 53, pp. 55-84.

301
ANOP Research Services. 2006, Consumer Attitudes and Plans in the Light of Recent
Government Policy Changes to Superannuation – 2006, ASFA Conference 2006:
Super-Going the Distance, Perth.
ANZ 2008, ANZ Survey of Adult Financial Literacy in Australia: Summary Report,
October 2008, viewed 16 January 2009,
<http://www.anz.com/Documents/AU/Aboutanz/AN_5654_Adult_Fin_Lit_Report_0
8_Web_Report_full.pdf>
ANZ A.C.Nielsen. 2005, ‘Adult Financial literacy, Personal Debt and Financial
Difficulty in Australia’- Summary Report, viewed on 8 August 2008,
<http://www.anz.com/aus/aboutanz/Community/Programs/pdf/ANZ_SumReport_FA.
pdf>
APRA Australian Prudential Regulation Authority 2009a, Quarterly Superannuation
Performance, December Quarter 2008, March, NSW, viewed 10 April 2009,
<http://www.apra.gov.au/Statistics/upload/December-2008-Quarterly-
Superannuation-Performance.pdf>
APRA Australian Prudential Regulation Authority 2009b, Statistics Annual
Superannuation Bulletin Year ended June 2008, March, NSW, viewed 10 April 2009,
<http://www.apra.gov.au/Statistics/upload/June-2008-Annual-Superannuation-
Bulletin-3.pdf>
APRA Australian Prudential Regulation Authority 2007, Insight – Celebrating 10
years of superannuation data collection 1996-2006, Issue 2, Special Edition, NSW.
Archer, T.M. 2007, ‘Characteristics Associated with Increasing the Response Rates of
Web-Based Surveys’, Vol. 12, No. 12, viewed 8 October,
<http://pareonline.net/getvn.asp?v=12&n=12>
Arnone, W.J. 2004, ‘Educating Pension Plan Participants’, Pension Research Council
Working Paper 2004-07, Pension Research Council, University of Pennsylvania,
Philidelphia.
ASFA Association of Superannuation Funds of Australia 2009a, Harmer Review –
Helping Australians Achieve Dignity in Retirement, viewed 3 March 2009,
<http://www.superannuation.asn.au/au/mr090227-2/default.aspx>
ASFA Association of Superannuation Funds of Australia 2009b, Henry Retirement
Income Consultation Paper, ASFA submission, February 2009, viewed 10 March
2009, <http://www.superannuation.asn.au/submissions/default.aspx>
ASFA Association Superannuation funds of Australia 2008, Food, Petrol and
Holidays Drive Up Retirement costs, viewed 17 February 2009,
<http://www.superannuation.asn.au/mr081209/defualt.aspx>
ASFA Association Superannuation Funds of Australia 2007, Planning and Saving
Now, viewed 4 March 2009, <http://www.superannuation.asn.au/consumers2-
1/default.aspx>
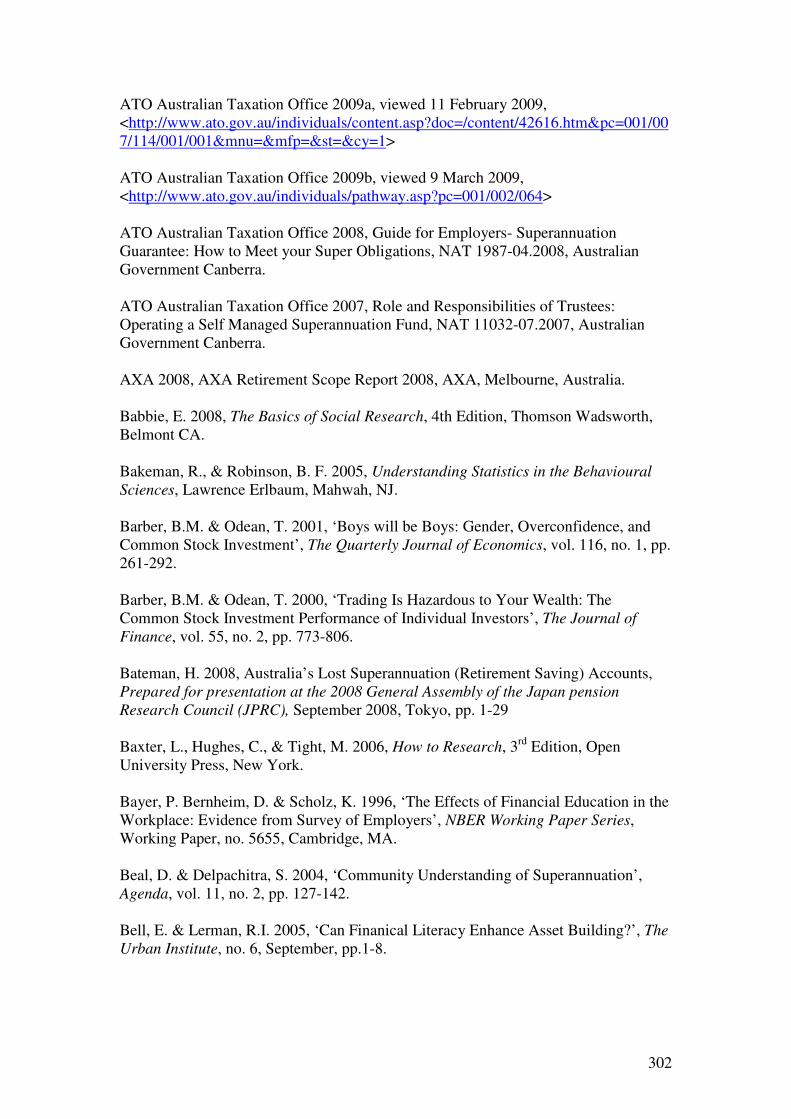
302
ATO Australian Taxation Office 2009a, viewed 11 February 2009,
<http://www.ato.gov.au/individuals/content.asp?doc=/content/42616.htm&pc=001/00
7/114/001/001&mnu=&mfp=&st=&cy=1>
ATO Australian Taxation Office 2009b, viewed 9 March 2009,
<http://www.ato.gov.au/individuals/pathway.asp?pc=001/002/064>
ATO Australian Taxation Office 2008, Guide for Employers- Superannuation
Guarantee: How to Meet your Super Obligations, NAT 1987-04.2008, Australian
Government Canberra.
ATO Australian Taxation Office 2007, Role and Responsibilities of Trustees:
Operating a Self Managed Superannuation Fund, NAT 11032-07.2007, Australian
Government Canberra.
AXA 2008, AXA Retirement Scope Report 2008, AXA, Melbourne, Australia.
Babbie, E. 2008, The Basics of Social Research, 4th Edition, Thomson Wadsworth,
Belmont CA.
Bakeman, R., & Robinson, B. F. 2005, Understanding Statistics in the Behavioural
Sciences, Lawrence Erlbaum, Mahwah, NJ.
Barber, B.M. & Odean, T. 2001, ‘Boys will be Boys: Gender, Overconfidence, and
Common Stock Investment’, The Quarterly Journal of Economics, vol. 116, no. 1, pp.
261-292.
Barber, B.M. & Odean, T. 2000, ‘Trading Is Hazardous to Your Wealth: The
Common Stock Investment Performance of Individual Investors’, The Journal of
Finance, vol. 55, no. 2, pp. 773-806.
Bateman, H. 2008, Australia’s Lost Superannuation (Retirement Saving) Accounts,
Prepared for presentation at the 2008 General Assembly of the Japan pension
Research Council (JPRC), September 2008, Tokyo, pp. 1-29
Baxter, L., Hughes, C., & Tight, M. 2006, How to Research, 3rd
Edition, Open
University Press, New York.
Bayer, P. Bernheim, D. & Scholz, K. 1996, ‘The Effects of Financial Education in the
Workplace: Evidence from Survey of Employers’, NBER Working Paper Series,
Working Paper, no. 5655, Cambridge, MA.
Beal, D. & Delpachitra, S. 2004, ‘Community Understanding of Superannuation’,
Agenda, vol. 11, no. 2, pp. 127-142.
Bell, E. & Lerman, R.I. 2005, ‘Can Finanical Literacy Enhance Asset Building?’, The
Urban Institute, no. 6, September, pp.1-8.

303
Belsky, G. & Gilovich, T. 2000, Why Smart People Make Big Money Mistakes and
How to Correct Them: Lessons From the New Science of Behavioral Economics,
Simon & Schuster, New York.
Benartzi, S. 2008, Behavioural Finance, the Market Crisis and Retirement Savings,
Comments Presented to the House Education and Labor Committee on October 22
2008, viewed 13 March 2009, <http://edlabor.house.gov/testimony/2008-10-22-
ShlomoBenartzi.pdf>
Benartzi, S. 2001, ‘Excessive Extrapolation and the Allocation of 401(k) Accounts to
company Stock”, The Journal of Finance, vol. 56, no. 5, pp. 1747-1764.
Benartzi, S & Thaler, R.H. 2007, ‘Heuristics and Biases in Retirement Savings
Behavior’, The Journal of Economic Perspectives, vol. 21, no. 3, pp. 81-104.
Benartzi, S & Thaler, R.H. 2001, ‘Naïve Diversification Strategies in Defined
Contribution Savings Plans’, The American Economic Review, vol. 91, no. 1, pp. 79-
98.
Benartzi, S & Thaler, R.H. 1999, ‘Risk Aversion or Myopia? Choices in Repeated
Gambles and Retirement Investment’, Management Science, vol. 45, no. 3, pp. 364-
381.
Bernheim, D.B. & Garrett, D.M. 2003, ‘The Effects of Financial Education in the
Workplace: Evidence from a Survey of Households’, Journal of Public Economics,
vol. 87, pp. 1487-1519.
Bernheim, D.B. (1998), ‘Financial Illiteracy, Education, and Retirement Saving’, in,
Living with Defined Contribution Pension, (eds.) O. Mitchell & S. Schieber,
University of Pennsylvania Press, Philidelphia.
Bernstein, P.L. 1996, Against the Gods, John Wiley & Sons Press, New York.
Bogen, K. 1996, ‘The Effect of Questionnaire Length on Response Rates – A Review
of the Literature’, Proceedings of the Survey Research Methods Section, American
Statistical Association, Alexandria, pp. 1020-1025.
Bourque, L.B. & Fielder, E.P. 2003, How to Conduct Self-Administered and Mail
Surveys, 2nd
Edition, SAGE Publishing, Thousands Oaks, CA.
Bouma, G.D. & Ling, R. 2004, The Research Process, 5th
Edition, Oxford University
Press, New York.
Bradburn, N.M., Sudman, S., & Wansink, B. 2004, Asking Questions: The Definitive
Guide to Questionnaire Design: For Market Research, Political Polls and Social and
Health Questionnaires, Jossey-Bass, San Francisco.
Bradburn, N.M. & Sudman, S. 1979, Improving Interview method and Questionnaire
Design, Jossey-Bass, San Francisco.
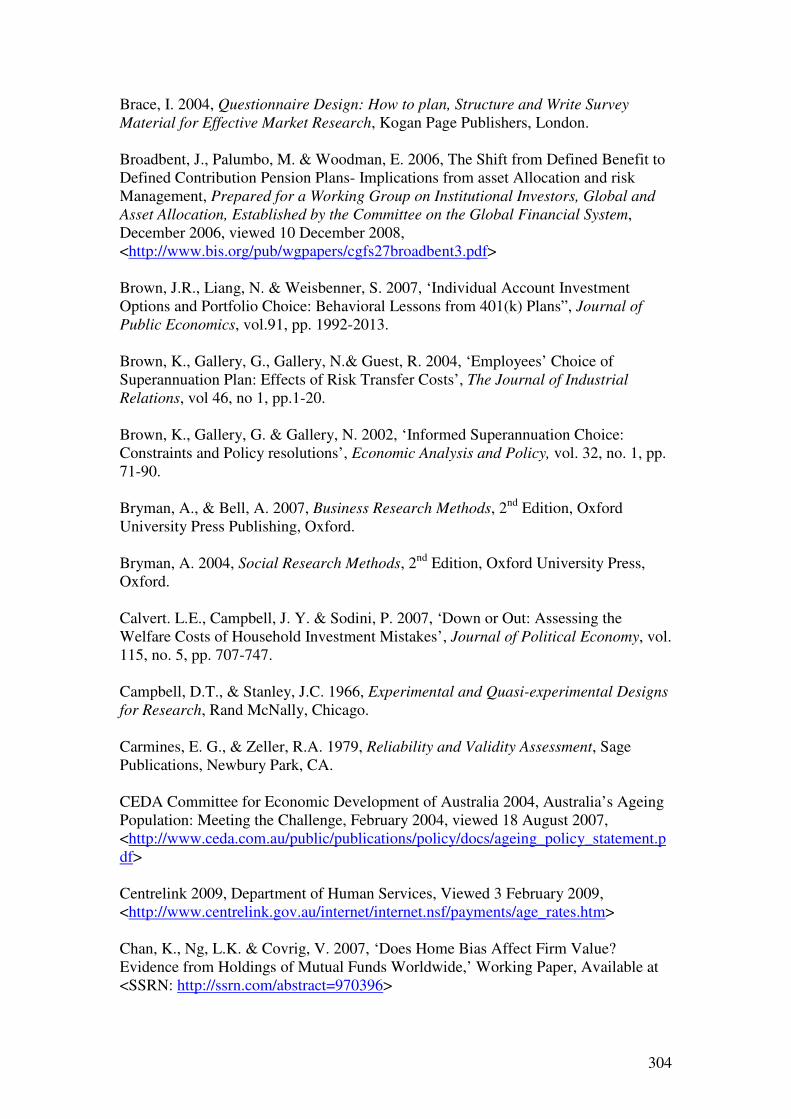
304
Brace, I. 2004, Questionnaire Design: How to plan, Structure and Write Survey
Material for Effective Market Research, Kogan Page Publishers, London.
Broadbent, J., Palumbo, M. & Woodman, E. 2006, The Shift from Defined Benefit to
Defined Contribution Pension Plans- Implications from asset Allocation and risk
Management, Prepared for a Working Group on Institutional Investors, Global and
Asset Allocation, Established by the Committee on the Global Financial System,
December 2006, viewed 10 December 2008,
<http://www.bis.org/pub/wgpapers/cgfs27broadbent3.pdf>
Brown, J.R., Liang, N. & Weisbenner, S. 2007, ‘Individual Account Investment
Options and Portfolio Choice: Behavioral Lessons from 401(k) Plans”, Journal of
Public Economics, vol.91, pp. 1992-2013.
Brown, K., Gallery, G., Gallery, N.& Guest, R. 2004, ‘Employees’ Choice of
Superannuation Plan: Effects of Risk Transfer Costs’, The Journal of Industrial
Relations, vol 46, no 1, pp.1-20.
Brown, K., Gallery, G. & Gallery, N. 2002, ‘Informed Superannuation Choice:
Constraints and Policy resolutions’, Economic Analysis and Policy, vol. 32, no. 1, pp.
71-90.
Bryman, A., & Bell, A. 2007, Business Research Methods, 2nd
Edition, Oxford
University Press Publishing, Oxford.
Bryman, A. 2004, Social Research Methods, 2nd
Edition, Oxford University Press,
Oxford.
Calvert. L.E., Campbell, J. Y. & Sodini, P. 2007, ‘Down or Out: Assessing the
Welfare Costs of Household Investment Mistakes’, Journal of Political Economy, vol.
115, no. 5, pp. 707-747.
Campbell, D.T., & Stanley, J.C. 1966, Experimental and Quasi-experimental Designs
for Research, Rand McNally, Chicago.
Carmines, E. G., & Zeller, R.A. 1979, Reliability and Validity Assessment, Sage
Publications, Newbury Park, CA.
CEDA Committee for Economic Development of Australia 2004, Australia’s Ageing
Population: Meeting the Challenge, February 2004, viewed 18 August 2007,
<http://www.ceda.com.au/public/publications/policy/docs/ageing_policy_statement.p
df>
Centrelink 2009, Department of Human Services, Viewed 3 February 2009,
<http://www.centrelink.gov.au/internet/internet.nsf/payments/age_rates.htm>
Chan, K., Ng, L.K. & Covrig, V. 2007, ‘Does Home Bias Affect Firm Value?
Evidence from Holdings of Mutual Funds Worldwide,’ Working Paper, Available at
<SSRN: http://ssrn.com/abstract=970396>

305
Choi, J.J. Liabson, D. Madrian, B. & Metrick, A. 2002, ‘Defined Contribution
Pensions Plan Rules, Participation Decisions, and The Path of Least Resistance’, Tax
Policy and the Economy, vol. 16, pp. 67-113.
Choi, J.J., Liabson, D., Madrian, B.& Metrick, A. 2001, ‘For Better or For Worse:
Default Effects and 401(k) Savings Behavior,’ NBER Working Paper Series, Working
Paper no. 8651, Cambridge, MA.
Clare, R 2008a, Retirement Savings Update, February, ASFA, Sydney, pp. 1-12.
Clare, R. 2008b, The Age Pension, Superannuation and Australian Retirement
Incomes, ASFA, Sydney, pp.1-29.
Clare, R. 2007, Are Retirement Savings on Track?, ASFA Research and Resource
Centre, June, 2007, Sydney, pp.1-19.
Clare, R. 2006, The Introduction of Choice of Superannuation Fund – Results to Date,
ASFA Research Centre, February 2006, Sydney, pp. 1-5.
Clare, R. 2005, Implications of Choice of Superannuation Fund Legislation for
Members, Employees and Funds, ASFA Research Centre, February 2005, Sydney,
pp.1-4.
Clark, L. R., d’Ambrosio, B. M., McDermed, A. A. & Sawant, K. 2003, ‘Retirement
Plans and Savings decisions: The Role of Information and Education’, Journal of
Pension Economics and Finance, vol. 5, no. 1, pp. 45-67.
Clark-Murphy, M. Kristofferson, I. & Gerrans, P. 2002, ‘What Makes Superannuation
Decisions Difficult’, International Journal of Business Studies, vol 10, no. 1, pp. 90-
112.
Clark-Murphy, M. & Gerrans, P. 2001, ‘Consultation and Resource Usage in
retirement Savings Decisions: Australian Evidence of Systematic Gender
Differences,’ Financial Services Review, vol. 10, pp. 273-290.
Clark, R. & Schieber, S. 1998, ‘Factors Affecting Participation Rates and
Contribution Levels in 410(k) Plans’, ,in Living with Defined Contribution Plans,
(eds.) O.Mitchell and S. Schieber, University of Pennsylvania Press, Philadelphia.
Cobanoglu, C., Warde, B., & Moreo, P.J. 2001, ‘A Comparison of Mail, Fax and
Web-based Survey Methods’, International Journal of Market Research, vol. 43 no.
4, pp. 441-452.
Connolly, P., 2007, Quantitative data Analysis in Education: A Critical Introduction
Using SPSS, Routledge, New York.
Converse, J.M., & Presser, S. 1986, Survey Questions: Handcrafting the Standardized
Questionnaire, Sage Series No. 63, Sage Publications, Thousand Oaks, CA.

306
Cook, C., Heath, F. & Thompson, R.L. 2000, ‘A Meta-Analysis of Response Rates in
Web-or Internet-based Surveys, Educational and Psychological Measurement, vol.
60, pp. 821-836.
Corrs Chambers Westgarth 2009, ‘Superannuation Reforms Continue: Federal Budget
2009-2010’, Corrs in Brief, 13 May 2009, viewed 15 May 2009,
<http://www.corrs.com.au/corrs/website/web.nsf/Content/Pub_InBrief_Superannuatio
n_Federal_Budget_130509/$FILE/5111742_InBrief_Superannuation_Federal_Budget
_09.pdf>
Crawford, S.D., Couper, M.P., & Lamias, M.J. 2001, ‘Web Surveys: Perceptions of
Burden,’ Social Science Computer review, vol. 19, no. 2, pp. 146-162.
Crompton, R., & Birkelund, G. 2000, ‘Employment and Caring in British and
Norwegian Banking,’ Work Employment and Society, vol. 14, pp. 331-352.
Cronbach, L. J. 1951, ‘Coefficient Alpha and the Internal Structure of tests,’
Psychometrika, vol. 16, pp. 297-334.
Czaja, R., & Blair, J. 2005, Designing Surveys: A Guide to Decisions and Procedures,
2nd
Edition, Pine Forge Press, Thousand Oaks, CA.
David, M. & Sutton, C. 2004, Social Research – The Basics, Sage Publications,
London.
DeMarrais, K.D., & Lapan, S.D. 2004, Foundations of Research: Methods of Inquiry
in Education and Social Sciences, Lawrence Erlbaum, Mahwah, NJ.
Department of Education, Employment and Workplace Relations 2007, Higher
Education Statistics Collections, Australian Government, Canberra, viewed on 1
December 2008,
<http://dest.gov.au/sectors/higher_education/publication_resources/statistics/publicati
ons_higher_education_statistics_collections.htm>
De Vaus, D.A. 2002, Surveys in Social Research, 5th Edition, Allen and Unwin,
Sydney.
DeVellis, R. F. 2003, Scale Development: Theory and Applications, 2nd
Edition,
Applied Social Research Methods Series, Volume 26, Sage Publications, London
Dillman, D.A. 2007, Mail and Internet Surveys - The Tailored Design Method, 2nd
Edition, 2007 Update, John Wiley & Sons Inc, Hoboken, NJ.
Dillman, D.A., Singer, E., Clark, J. R., & Treat, J. B. 1996, ‘Effects of Benefits
Appeals, Mandatory Appeals, and Variations in Statements of Confidentiality on
Completion Rates for Census Questionnaires’, Public Opinion Quarterly, vol.60,
pp.376-389.
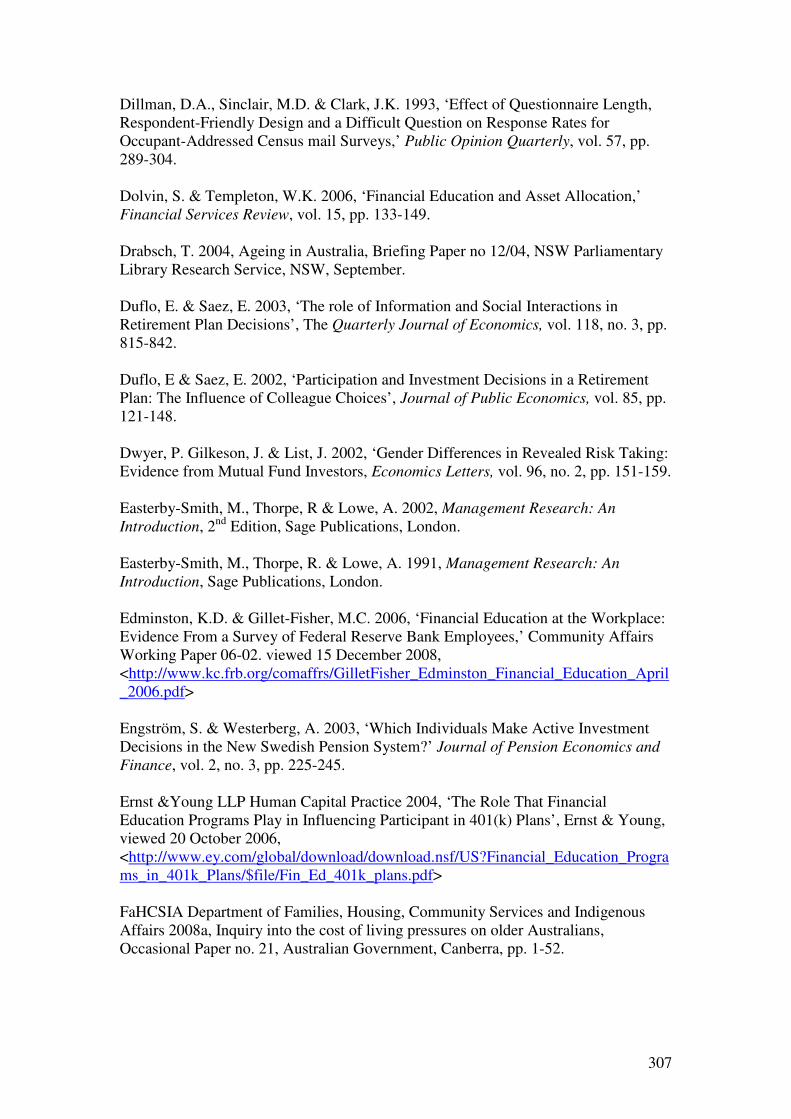
307
Dillman, D.A., Sinclair, M.D. & Clark, J.K. 1993, ‘Effect of Questionnaire Length,
Respondent-Friendly Design and a Difficult Question on Response Rates for
Occupant-Addressed Census mail Surveys,’ Public Opinion Quarterly, vol. 57, pp.
289-304.
Dolvin, S. & Templeton, W.K. 2006, ‘Financial Education and Asset Allocation,’
Financial Services Review, vol. 15, pp. 133-149.
Drabsch, T. 2004, Ageing in Australia, Briefing Paper no 12/04, NSW Parliamentary
Library Research Service, NSW, September.
Duflo, E. & Saez, E. 2003, ‘The role of Information and Social Interactions in
Retirement Plan Decisions’, The Quarterly Journal of Economics, vol. 118, no. 3, pp.
815-842.
Duflo, E & Saez, E. 2002, ‘Participation and Investment Decisions in a Retirement
Plan: The Influence of Colleague Choices’, Journal of Public Economics, vol. 85, pp.
121-148.
Dwyer, P. Gilkeson, J. & List, J. 2002, ‘Gender Differences in Revealed Risk Taking:
Evidence from Mutual Fund Investors, Economics Letters, vol. 96, no. 2, pp. 151-159.
Easterby-Smith, M., Thorpe, R & Lowe, A. 2002, Management Research: An
Introduction, 2nd
Edition, Sage Publications, London.
Easterby-Smith, M., Thorpe, R. & Lowe, A. 1991, Management Research: An
Introduction, Sage Publications, London.
Edminston, K.D. & Gillet-Fisher, M.C. 2006, ‘Financial Education at the Workplace:
Evidence From a Survey of Federal Reserve Bank Employees,’ Community Affairs
Working Paper 06-02. viewed 15 December 2008,
<http://www.kc.frb.org/comaffrs/GilletFisher_Edminston_Financial_Education_April
_2006.pdf>
Engström, S. & Westerberg, A. 2003, ‘Which Individuals Make Active Investment
Decisions in the New Swedish Pension System?’ Journal of Pension Economics and
Finance, vol. 2, no. 3, pp. 225-245.
Ernst &Young LLP Human Capital Practice 2004, ‘The Role That Financial
Education Programs Play in Influencing Participant in 401(k) Plans’, Ernst & Young,
viewed 20 October 2006,
<http://www.ey.com/global/download/download.nsf/US?Financial_Education_Progra
ms_in_401k_Plans/$file/Fin_Ed_401k_plans.pdf>
FaHCSIA Department of Families, Housing, Community Services and Indigenous
Affairs 2008a, Inquiry into the cost of living pressures on older Australians,
Occasional Paper no. 21, Australian Government, Canberra, pp. 1-52.

308
FaHCSIA Department of Families, Housing, Community Services and Indigenous
Affairs 2008b, Pension Review Background Paper, Australian Government, viewed 3
March 2009, <http://www.facs.gov.au/seniors/pension_review>
FaHCSIA Department of Families, Housing, Community Services and Indigenous
Affairs 2004, Policy research Paper No. 13, viewed 20 February 2009,
<http://facsia.gov.au/research/prp13/sec4.htm>
Financial Services Reform Act 2001 (Cwlth)
Fink, A. 2006, How to Conduct Surveys: A Step by Step Guide, 3rd
Edition, Sage
Publications, Thousands Oaks, CA.
Fink, A. 2003, How to Sample in Surveys, Sage Publications, Thousand Oaks, CA.
Fowler, F.J, 2008, Survey Research Methods, Sage Publications, Beverly Hills, LA.
Fox, J., Bartholomae, S. & Lee, J. 2005, ‘Building a Case for Financial Education’,
The Journal of Consumer Affairs, vol. 39, no. 1, pp. 195-214.
Fox, R.J., Crask, M.R., & Kim, J. 1988, ‘Mail Survey Response Rate: A Meta-
Analyis of Selected Techniques for Inducing Response,’ Public Opinion Quarterly,
vol. 66, no. 3, pp. 608-617.
Francis, C. 2004, ‘Ownership Society: Why the US Can’t Buy In’, The Christian
Science Monitor, vol. 27 September.
Frey, J. H., 2004, ‘Telephone Surveys’, in M. S. Lwis-Beck, A. Bryman, & T. F. Liao
(eds), The Sage Encyclopedia of Social Science Research Methods, Vol. 1-3, Sage
Publications, Thousands Oaks, CA.
Frino, A., Chen, Z., Hill, A., Comerton-Forde, C. & Kelly, S. 2006, Introduction to
Corporate Finance, 3rd
Edition, Pearson Education, NSW.
Fry, T.R.L., Heaney, R. & McKeown, W. 2007, ‘Will Investors Change their
Superannuation Fund Given the Choice?’, Accounting and Finance, vol. 47, no. 2, pp.
267-283.
Galesic, M. 2002, ‘Effects of Questionnaire Length on Response rates: Review of
Findings and Guidelines for Future research’, 5th
German Online Research
Conference, Hohenheim.
Gallery, G. & Gallery, N. 2005, ‘Paradox of Choice in a Mandatory Pension Savings
System: Challenges for Australian Retirement Income Policy,’ Policy & Politics, vol
33, no 3, pp. 519-532.
Gallery, G. Gallery, N. & Brown, K. 2004, ‘Superannuation Choice: The Pivotal Role
of the Default Option’, Journal of Australian Political Economy, no. 53, pp.44-66.
309
Ganassali, S. 2008, ‘The Influence of the Design of Web Survey Questionnaires on
the Quality of Responses’, Survey Research methods, vol. 2, no. 1, pp. 21-32.
Garman, T.E. 1997, ‘Retirement Savings and the Poor Financial Behaviors of
Workers,’ International Society for Retirement and Life Planning, vol. 3, no. 2, pp. 3-
4.
Gerrans, P., Clark-Murphy, M. & Speelman, C. 2006, ‘How Much Investment Choice
is Enough for Members?’, Australian Accounting Review, vol. 16, No. 3, pp.14-22.
Gerrans, P., Gardner, D., Clark-Murphy, M. & Speelman, C. 2006, ‘An Investigation
of home Bias in Superannuation Investment Choice,’ Economics Papers, vol. 25, no.
1, pp. 17-31.
Gitman, L.J. Joehnk, M.D. Juchau, R.H. Wheldon, B.J. & Wright, S.J. 2004,
Fundamentals of Investing, 2nd
Australian Edition, Pearson Education, Frenchs
Forest, NSW.
Glaser, B. G., & Strauss, A. L. 1967, The Discovery of Grounded Theory, Aldine,
Chicago.
Gliner, J.A. & Morgan G.A. 2000, Research Methods in Applied Settings: An
Integrated Approach to Design and Analysis, Lawrence Erlbaum, Mahwah, NJ.
Goyder, J.C. 1982, ‘Further evidence on factors Affecting Response Rates to Mailed
Questionnaires,’ American Sociological Review, vol. 47, no. 4, pp. 550-553.
Greenspan, A. 2002, Prepared Statement: Hearings on the State of Financial Literacy
and Education in America, U.S. Senate Committee on Banking, Housing and Urban
Affairs, February 6, 2002, viewed on 11 May 2007,
<http://www.banking.senate.gov/02_02hrg/020502/grnspan.htm>
Groves, R.M., Fowler, F.J., Couper, M.P., Lepkowski, J.M., Singer, E. &
Tourangeau, R. 2004, Survey Methodology, Wiley, Haboken, NJ.
Gunasingham, B. & Zavone, J. 2005, ‘The Psychology of Investor Choice,’
Discussion Paper for the CMSF Conference 2005: The Challenges of Choice, March
2005, Hobart, Tasmania.
Hamilton, M. & Hamilton, C. 2006, ‘Rich Boomer, Poor Boomer: Retirement
Prospects for the not-so-lucky Generation’, The Australia Institute, August 2006,
viewed 26 February 2009, <http://www.tai.org.au/file.php?file=WP88.pdf>
Harding, A. 2005, ‘Analysing Australia’s Ageing Population: A Demographic
Picture,’ Paper presented to ‘Australia’s Ageing Population Summit, Financial
Review Conferences, Sydney, 27 September, pp. 1-5.
310
Harmer, J. 2009, Pension Review Report, Department of Families, Housing,
Community Services and Indigenous Affairs, Australian Government, Canberra,
viewed on 15 May 2009,
<http://www.fahcsia.gov.au/about/publicationsarticles/corp/Budget09_10/pension/Do
cuments?Pension_Review_Report/PensionReviewReport.pdf>
Helman, R., Greenwald, M., VanDerhei, J. & Copeland, C. 2008, ‘The 2008
Retirement Confidence Survey: Americans Much More Worried About Retirement,
Health Costs a Big Concern,’ Issue Brief No. 316, April, Employee Benefit Research
Institute EBRI, Washington, DC.
Helman, R. & Paladino, V. 2004, ‘Will Americans Ever Become Savers? The14th
Retirement Confidence Survey 2004’, EBRI, Issue Brief, No. 268, Employee Benefit
Research Institute (EBRI), Washington D.C.
Herberlein, T.A., & Baumgartner, R. 1978, ‘Factors Affecting Response Rates to
Mailed Questionnaires: A Quantitative Analysis of the Published Literature,’
American Sociological Review, vol. 43, no. 4, pp. 447-462.
Hershey, D.A. and Mowen, J.C. 2000, ‘Psychological Determinants of Financial
Preparedness for Retirement’, The Gerontologist, vol. 40, no. 6, pp. 687-697.
Hershey, D.A., Walsh, D.A., Brougham, R., Carter, S. & Farrell, A. 1998,
‘Challenges of Training Pre-Retirees to Make Sound Financial Planning Decisions,’
Educational Gerontology, vol. 25, no. 5, pp. 447-470.
Hilgert, M., Hogarth, J. & Beverly, S. 2003, ‘Household Financial Management: The
Connection Between Knowledge and Behavior’, Federal Reserve Bulletin, July 2003,
Washington D.C, pp. 309-322.
Hill, R. 1998. ‘What sample Size Is Enough in Internet Survey Research?’,
Interpersonal Computing and Technology: An Electronic Journal for the 21st Century,
viewed 5 June 5 2008, <http://www.emoderators.com/ipct-j/1998/n3-4/hill.html>
Hogarth, J.M. & Hilgert, M.A. 2002, ‘Financial Knowledge, Experience and Learning
Preferences: Preliminary Results forma New Survey on Financial Literacy,’
Consumer Interest Annual, vol. 48, pp. 1-7.
Holland, J.H., Goodman, D. & Stich, B. 2008, ‘Defined Contribution Plans Emerging
in the Public Sector: The Manifestation of Defined Contributions and the Effects of
Workplace Financial literacy Education,’ Review of Public Personnel Administration,
vol. 28, no. 4, pp. 367-384.
Holzman, R. & Hinz, H. 2005, Old-Age Income Support in the 21st Century: An
International Perspective on Pension Systems and Reform, The World Bank,
Washington, D.C.
Hsu, C., & Powers, T.F. 2001, Marketing Hospitality, 3rd
Edition, John Wiley, New
York.

311
Huberman, G. 2001, ‘Familiarity Breeds Investment,’ Review of Financial Studies,
vol. 14, no. 3, pp. 659-680.
Huberman, G. & Jiang, W. 2006, ‘Offering Choice in 401(k) Plans: Equity Exposure
and Number of Funds, The Journal of Finance, vol. LXI, no. 2.
Investment Company Institute 2006, Research Perspective, November, vol. 12, no. 2,
Washington, DC.
Iyengar, S., Jiang, W. & Huberman, G. 2004, ‘How Much Choice is Too Much:?
Contributions to 401(k) Retirement plans,’ in Pension Design and structure: New
Lessons from Behavioral Finance, (eds.) O. Mitchell and S. Utkus, University Press,
Oxford.
Iyengar, S. & Kamenica, E. 2007, ‘Choice Overload and Simplicity Seeking,’
Working Paper, University of Chicago Graduate School of Business, Chicago.
Jansen, J.J. Spink, A. & Taksa, I. 2008, Handbook of Research on Web Log Analysis,
Information Science Reference, Hershey, PA.
Jensen, K. & Jensen K.B. 2002, A Hanbook of Media and Communication Research:
Qualitative and Quantitative Methodologies, Routledge, New York.
Jones, C.P., Shamsuddin, A. & Naumann, K. 2007, Investments: Analysis and
Management, 2nd
Australian Edition, John Wiley, Milton, QLD.
Joo, S & Garman, T. 1998, ‘Worksers Want More than Retirement Education at their
Workplace: A Report of Research Findings,’ Personal Finances and Worker
Productivity, vol. 2 no. 2, pp. 156-161.
Joo, S. & Grable, J.E. 2005, ‘Employee Education and the Likelihood of having a
Retirement Savings Program’, Financial Counseling and Planning, vol. 16, no. 1, pp.
37-49.
Joo, S. & Pauwels, V.W. 2002, ‘Factors Affecting Workers Retirement Confidence: A
Gender Perspective,’ Financial Counseling and Planning, vol. 12, no. 2, pp. 1-10.
Kahneman, D. 2003, ‘Maps of Bounded Rationality: Psychology for Behavioral
Economics,’ American Economic Review, vol. 93, no. 5, pp. 1449-1475.
Kahneman, D. & Tversky, A. 1979, ‘Prospect Theory: An Analysis of Decision under
Risk,’ Econometrica, vol. 47, pp. 263-291.
Kamenica, E. 2008, ‘Contextual Inference in Markets: On the Informational Content
of Product Lines,’ American Economic Review, vol. 98, no.5, pp. 2127-2149.
Kaplowitz, M.D., Hadlock, T.D., & Levine, R. 2004, ‘A Comparison of Web and
Mail Survey Response Rates,’ Public Opinion Quarterly, vol. 68, no. 1, pp. 94-101.

312
Kelly, J., & De Graaf, N. D. 1997, ‘National Context, Parental Socialization, and
Religious Belief: Results from 15 Nations,’ American Sociological Review, vol. 62,
pp. 639-59.
Kerlinger, F.N. 1986, Foundations of Behavioural Research, 3rd
Edition, Holt
Rinehart and Winston, New York.
Kerry, M., Clayton, B. & Olynyk, M. 2007, ‘Evaluating the Impact of Financial
Literacy Programs on the Retirement Savings of Superannuation Fund Members,’
International Review of Business Research Papers, vol. 3, no. 1, pp.73-88.
Kervin, J.B. 1992, Methods for Business Research, Harper Collins Publishers, New
York.
Kim, J., Kwon, J. & Anderson, E.A. 2006, ‘Factors Related to Retirement
Confidence: Retirement Preparation and Workplace Financial Education,’ The
Journal Financial Counselling and Planning, vol. 16, no. 2, pp. 77-89.
Kim, J., Garman, T. & Quach, A. 2005, ‘Workplace Financial Education and
Retirement Savings by Employees and their Spouses,’ Journal of Personal Finance,
vol. 4, no. 3, pp. 92-108.
Kim, J. & Garman, T.E. 2003, ‘Financial Education and Advice Changes Worker
Attitudes and Behaviors’, Journal of Compensation and Benefits, September/October,
pp.7-13.
Kim, J., Bagwell, D.C. & Garman, T. 1998, ‘Evaluation of Workplace Personal
Financial Education’, Personal Finances and Worker Productivity, vol. 2, no. 1, pp.
187-192.
Krajnak, P.A., Burns, S.A. & Natchek, S.M. 2008, ‘Retirement Education in the
Workplace,’ Financial Services Review, vol. 17, no. 2, pp. 131-141.
Kumar, R. 2005, Research Methodology: A Step-by-step Guide for Beginners, 2nd
Edition, Sage Publications, London.
Kwak, N., & Radler, B. 2002, ‘A Comparison between Mail and Web Surveys:
Response Pattern, Respondent Profile, and Data Quality,’ Journal of Official
Statistics, vol. 18, no. 2, pp. 257-273.
Langbein, L.I. & Felbinger, C.L. 2006, Public Program Evaluation: A Statistical
Guide, M.E. Sharpe, New York.
Leech, N.L., Barrett, K.C. & Morgan, G.A. 2005, SPSS for Intermediate Statistics –
Use and Interpretation, 2nd
Edition, Lawrence Erlbaum, Mahwah, NJ.
Leong, T.L.F., & Austin J.T. 2005 The Psychology Research Handbook: A Guide for
Graduate Students and Research Assistants, Sage Publications, Thousand Oaks, CA.

313
Lewis, N.D., 2004, Operational Risk with Excel and VBA: Applied Statistical
Methods for Risk Management, 2nd
Edition, John Wiley, Haboken, NJ.
Liabson, D.I. 1997, ‘Golden Eggs and Hyperbolic Discounting,’ The Quarterly
Journal of Economics,” vol. 62, May, pp. 443-477.
Liabson, D.I., Repetto, A. and Tobacman, J. 1998, ‘Self-Control and Saving for
Retirement,’ Brookings Papers on Economic Activity, vol. 1998, Issue 1, pp.91-172.
Liang, N. & Weisbenner, S. 2002, ‘Investor Behavior and the purchase of Company
Stock in 401(k) Plans- The Importance of Plan Design,’ NBER Working Paper 9131,
Cambridge, MA.
Llieva, J., Baron, S., & Healey, N.M. 2002, ‘Online Surveys in Marketing Research:
Pros and Cons,’ International Journal of Market Research, vol. 44, no. 3, pp. 361-
376.
Loibl, C. & Hira, T.K. 2006, ‘A Workplace and Gender-Related Perspective on
Financial Planning Information Sources and knowledge Outcomes,’ Financial
Services Review, vol. 15, pp. 21-42.
Loibl, C. & Hira, T.K. 2005, ‘Self-Directed Financial Learning and Financial
Satisfaction,’ Journal of Financial Counselling and Planning, vol. 16, no. 1, pp. 11-
21.
Lomax, R.G., 2007a, An Introduction to Statistical Concepts, Edition 2, Lawrence
Erlbaum, Mahwah, NJ.
Lomax, R.G., 2007b Statistical Concepts: A Second Course, Edition 3, Lawrence
Erlbaum. Mahwah, NJ.
Loveridge, D. 2008, Foresight: The Art and Science of Anticipating the Future,
Taylor and Francis, London.
Lusardi, A. 2005, ‘Saving and the Effectiveness of Financial Education,’ in Pension
Design and Structure: New Lessons from Behavioral Finance, (eds.) O.Mitchell and
S. Utkus, Oxford University Press, Oxford.
Lusardi, A. 2003, ‘Planning and Saving for Retirement, Working Paper, Dartmouth
College.
Lusardi, A. & Mitchell, O.S. 2008, Baby Boomer Retirement Security: The Roles of
Planning, Financial Literacy, and Housing Wealth, Journal of Monetary Economics,
vol. 54, pp. 205-224.
Lusardi, A. & Mitchell, O. S. 2007a, ‘Financial Literacy and Retirement Planning:
New Evidence from the Rand American Life Panel,’ Working Paper 2007-157,
University of Michigan Retirement Research Centre, Michigan.
314
Lusardi, A. & Mitchell, O.S. 2007b, ‘Baby Boomer Retirement Security: The Roles of
Planning, Financial Literacy, and Housing Wealth,’ Journal of Monetary Economics,
vol. 54, pp. 205-224.
Lusardi, A. & Mitchell, O. S. 2006, ‘Financial Literacy and Planning: Implications for
Retirement Wellbeing’, Pension Research Working Paper, Pension Research Council,
Wharton School University of the University of Pennsylvania, Philadelphia.
Madrian, B.C. & Shea, D.F. 2001a, ‘The Power of Suggestion: Intertia in 401(k)
Participation and Savings Behavior,’ The Quarterly Journal of Economics, vol. 116.
no. 4, pp. 1149-1187.
Madrian, B.C. & Shea, D.F. 2001b, ‘Preaching to the Converted and Converting those
taught: Financial Education in the Workplace’, University of Chicago, Chicago
Unpublished paper.
Maki, D. 2004, ‘Financial Education and Private Pensions,’ In, Private Pensions and
public Policies, (eds.)W. Gale, J. Shoven & M. Warshawsky, Brookings Institution
Press, Washington, DC, pp. 126-139.
Manfreda, K.L & Vehovar, V. 2002, ‘Survey Design Features Influencing Response
Rates in Web Surveys’, Faculty of Social Sciences, Univeristy of Ljubljana, viewed 2
December 2008 <http://www.icis.dk/icis_papers/c2_4_3.pdf.>
Mangione, T. W. 1995, Mail Surveys: Improving the Quality, Sage Publications,
Thousand Oaks, CA..
Markowitz, H.M. 1952, ‘Portfolio Selection’, The Journal of Finance, vol. 7, no. 1,
pp. 77-91.
McCarthy, D.D. & Turner, J.A. 2000, ‘Pension Education: Does it Work? Does it
Matter?’, Benefits Quarterly, vol. 16, no. 1, pp.64-72.
McClatchey, C.A. & VandenHul, S.P. 2005, ‘The Efficacy of optimization Modelling
as a Retirement Strategy in the Presence of Estimation Error,’ Financial Services
Review, vol. 14, pp. 269-284.
McMurray, A.J., Spoonley, P., Pearson, D.G., Pace, R.W. & Scott, D. 2004,
Research: A Commonsense Approach, Thomson Learning, Southbank, Victoria.
McNair Ingenuity Research 2008, Annual Superannuation Survey Prepared for
Association of Superannuation Funds Australia, viewed 10 February 2009,
<http://www.superannuation.asn.au/Reports/default.aspx>
Mehra, V. & Mishra, S. 2007, ‘The Pension Protection Act and Automatic 401(k)
Enrollment: Opportunities and Challenges,’ viewed 4 March 2009,
<http://www.keane.com/_upload/Documents/WhitePapers?ViewPoint_PPA-
401K_042707(1).pdf>

315
Melbourne Institute of Applied Economic and Social Research 2009, Poverty Lines:
Australia, September Quarter 2008, The University of Melbourne, Melbourne,
February 2009.
Mercer (2006), Mercer Financial Literacy and Retirement Readiness Study 2006,
Mercer Wealth Solutions, Australia, viewed 15 September 2008,
<http://www.mercerwelthsolutions.com.au/FinancialLiteracy/abouthestudy/flyoutnav/
>
Mertens, D.M. 2005, Research and Evaluation in Education and Psychology:
Integrating Diversity with Quantitative, Qualitative, and Mixed Methods, 2nd
Edition,
Sage Publications, Thousand Oaks, CA.
Meulbroek, L. 2005, ‘Company Stock in Pension Plans: How Costly is it?’, The
Journal of Law and Economics, vol. 48, no. 2, pp. 443-474.
Mitchell, O.S. & Utkus, S.P. 2006, ‘How Behavioral Finance Can Inform Retirement
Plan Design,’ Journal of Applied Corporate Finance, vol. 18, no. 1, pp. 82-94.
Mitchell, O.S. & Utkus, S.P. 2003, ‘Lessons from Behavioural Finance for Retirement
Plan Design,’ Pension Research Council Working Paper 6, Wharton School of the
University of Pennsylvania, Philadelphia.
Mitchell, O.S. & Schieber, S.J. 1998, ‘Defined Contribution Pensions: New
Opportunities, New Risks’ in Living with defined contribution pensions: Remaking
responsibility for retirement, (eds.) O. Mitchell & S. Schieber, University of
Pennsylvania Press, Philadelphia.
Modigliani, F. & Brumberg, R. 1954, ‘Utility Analysis and the Consumption
Function: An Interpretation of Cross-Section data’, in Post-Keynesian economics,
(ed.) K.K. Kurihara, Rutgers University Press, New Brunswick, NJ.
Morgan, G.A., Gliner, J.A, & Harmon, R.J. 2006, Understanding and Evaluating
Research in Applied and Clinical Settings, Lawrence Erlbaum, Mahwah, NJ.
Mohr, L.B. 1993, Understanding Significance Testing, 5th
Edition, Sage Publications,
Newbury Park, CA.
Mullainathan, S. & Thaler, R.H. 2000, ‘Behavioural Economics,’ NBER Working
Paper Series, Working Paper no. 7948, Cambridge, MA.
Muller, L.A. 2003, ‘Investment Choice in Defined Contribution Plans: The Effects of
Retirement Education on Asset Allocation,’ Benefits Quarterly, vol. 19, no. 2, pp. 76-
94.
Nielson, L. 2008, ‘Superannuation 2008-2009,’ Department of Parliamentary
Services, Research paper, no. 6, August, Commonwealth of Australia, Canberra,
2008, pp. 1-29.
316
Nielson, L. 2007, ‘Superannuation and Taxation 2007-2008,’ Department of
Parliamentary Services, Research Paper, No. 2, August 2007, Commonwealth of
Australia, Canberra, pp. 1-31.
Nielson, L. 2006, ‘An Adequate Superannuation-Based Retirement Income?’,
Department of Parliamentary Services, Research Brief, no. 12, March 2006,
Commonwealth of Australia, Canberra, pp. 1-37.
Nielson, L. 2005, Super co-contribution – performance to date, Research Note no. 16
2005-2006, Economics Commerce and Industrial Relations Section, viewed 19
February 2009, <http://www.aph.gov.au/library/pubs/rn/2005-06/06rn16.htm>
Nunally, J.C. 1978, Psychometric Theory, McGraw-Hill, New York.
Nyce, S. 2005, ‘The importance of financial Communication for Participation Rates
and Contribution Levels in 401(k) Plans,’ Pension Research Council Working Paper
3, Wharton School of the University of Pennsylvania, Philidelphia.
OECD Organisation for Economic Co-operation and Development 2008a, Improving
Financial Education and Awareness on Insurance and Private Pensions, OECD
Publishing, Paris.
OECD Organisation for Economic Co-operation and Development 2008b, Pension
Markets in Focus, Issue 5, December 2008, OECD Publishing. Paris.
OECD Organization for Economic Co-operation and Development 2006, ‘The
Importance of Financial Education,’ Policy Brief, July, OECD Observer, Paris.
OECD Organisation for Economic Co-operation and Development 2005, Improving
Financial Literacy: Analysis of Issues and Policies, OECD Publishing, Paris.
Olsberg, D. 2004, ‘Women and Superannuation: Still Missing Out,’ Journal of
Political Economy, no. 53, pp. 161-178.
Oppenheim, A.N. 2001, Questionnaire Design, Interviewing and Attitude
Measurement, 2nd
Edition, Continuum International Publishing, London.
Orszag, M. 2003, ‘Who Makes Active Investment Decisions?’, European Pension
News, August.
Papke, L.E. 2003, ‘Individuals Financial Decisions in Retirement Saving Plans: The
Role of Participant-Direction,’ Journal of Public Economics, vol. 88, pp. 39-61.
Peirson, G., Brown, R., Easton., S., Howard, P. and Pinder, S. 2006, Business
Finance, 9th
Edition, McGraw-Hill, North Ryde, NSW.
Pension Protection Act of 2006 (Public Law 109-280)
317
Perry, C. 1995, ‘A Structured Approach to Presenting PhD Theses: Notes for
Candidates and their Supervisors’, paper presented to the ANZ Doctoral Consortium,
Univeristy of Sydney, Sydney, Febraury 1994, with later additions to 2 July 1995.
Phelps, R. Fisher, K. & Ellis. A. 2007, Organising and Managing your Research: A
Practical Guide for Postgraduates, Sage Publications, London.
Porter, S.R., 2004, ‘Raising Response Rates: What Works?’, New Directions for
Institutional Research, Issue 121, pp. 5-21.
Porterba, J. Venti, S. & Wise, D.A. 2007, ‘New Estimates of the Future Path of
401(k) Assets,’ NBER Working Paper Series, Working Paper no. 13083, May 2007,
Cambridge, MA.
Preston, A. & Jefferson, T. 2002, ‘The Economics of Labour Markets and Retirement
Provision: Baby Boomers and Gender Differences in Australia’, Discussion Paper No.
25, Women’s Economic Policy Analysis Unit (WEPAU), Curtain University of
Technology, Western Australia, October.
Proctor, M. 1995, ‘Measuring Attitudes’ in Researching Social Life, (ed.) N.Gilbert,
Sage Publications, London.
Punch, K. F. 2005, Introduction to Social Research: Quantitative and Qualitative
Approaches, 2nd
Edition, Sage Publications, Thousand Oaks, CA.
Rhine, S. & Toussaint-Comeau, M. 2002, ‘Consumer Preferences in the Delivery of
Financial Information: A Summary’, Consumer Interests Annual, vol. 48.
Ritter, L.A., & Sue, V.M. 2007, ‘Selecting a Sample’, New Directions for Evaluation,
Special Issue: Using Online Surveys in Evaluation, Issue 115, pp. 23-28.
Rosenthal, D. L., & Jacobson, L. 1968, Pygmalion in the Classroom: Teacher
Expectation and Pupils’ Intellectual Development, Holt, Rinehart & Winston, New
York.
Ross, D. & Wills, L. 2002, ‘The Shift from Defined Benefit to Defined Contribution
Retirement Plans and the Provisioning of retirement Savings,’ Discussion Paper PI-
0210, The Pension Institute, London, pp.1-31.
Rothman, G. & Bingham, C. 2004, ‘Retirement Income Adequacy Revisited,’ Paper
Presented to the Twelfth Colloquium of Superannuation Researchers, University of
New South Wales, Sydney, July.
Ruane, J.M. 2004, Essentials of research Methods: A Guide to Social Science
Research, Blackwell Publishing, Malden, MA.
Saliterman, V. & Sheckley, B.G. 2003, ‘Adult Learning and Pension Participant
Behavior,’ Pension Research Council Working Paper 17, Pension Research Council,
Wharton School of the University of Pennsylvannia, Philadelphia.

318
Salkind, N.J., 2006, Statistics for People who Think They Hate Statistics: The Excel
Edition, Sage Publications, Thousand Oaks, CA.
Sansone, C., Morf, C.C. & Panter, A.T. 2004, The Sage Handbook of Methods in
Psychology, Sage Publications, London.
Sapsford, R. 2007, Survey Research, 2nd
Edition, Sage Publications, Thousand Oaks,
CA.
Schofield, W. 1996, ‘Survey Sampling’, in R.Sapsford and V.Jupp (eds), Data
Collection and Analysis, Sage Publications, London.
Schonlau, M., Fricker, R.D., & Elliot, M.N. 2001, Conducting Research Surveys Via
E-mail and the Web, Rand Corporation, Santa Monica, CA.
Schubert, S. 2008, ‘Australia vs US: A Scorecard on the Australian and US Defined
Contribution System,’ Presented at the 4th
Financial Services Forum on Innovation in
Financial Markets, May 2008, Melbourne.
Schuman, H., & Scott, J. 1987, ‘Problems in the Use of Survey Questions to Measure
Public Opinion,’ Science, vol. 236, issue 4804, pp. 957-959.
Schuman, H. & Presser, S. 1979, ‘The Open and Closed Question,’ American
Sociological Review, vol. 44, pp. 692-712.
Schutt, R.K. 2006, Investigating the Social World: The Process and Practice of
Research, 5th
Edition, Pine Forge Press, Thousand Oaks, CA.
Seale, C. 2004, Social Research Methods: A Reader, Routledge, London.
Senate Select Committee 2002, Superannuation and Standards of Living in
Retirement – Report on the Adequacy of the Tax Arrangements for Superannuation
and Related Policy, December 2002, Parliament of Australia, Canberra.
Shefrin, H. 2002, Beyond Greed and Fear: Understanding Behavioural Finance and
the Psychology of Investing, 2nd
Edition, Oxford University Press, New York.
Shefrin, H.M. & Thaler, R.H. 1988, ‘The Behavioral Life-Cycle Hypothesis,’
Economic Enquiry, vol. XXVI, October, pp. 609-643.
Sherry, N (Minister for superannuation and Corporate Law) 2009, Find Your Lost
Super in 2009, Australian Labor Party, Viewed 24 February 2009,
<http://www.alp.org.au/media/0109/mssc1051.php>
Shih, T., & Fan, X. 2008, ‘Comparing Response Rates from Mail Surveys: A Meta-
Analysis,’ Field Methods, vol. 20, no. 3, pp. 249-271.
Simon, H.A. 1978, ‘Rationality as Process and Product of Thought’. The American
Economic Review, vol. 68, no. 2, pp. 1-16.

319
Singer, E., von Thurn, D. R., & Miller, E. R. M. 1995 ‘Confidentiality Assurances
and Response: A Quantitative Review of the Experimental Literature,’ Public
Opinion Quarterly, vol. 59, pp. 66-67.
Sirkin, R.M. 1995, Statistics for the Social Sciences, Sage Publications, Thousand
Oaks, CA.
Solomon, D.J. 2001, ‘Conducting Web-Based Surveys,’ Practical Assessment,
Research & Evaluation, vol. 7, no. 19, viewed 20 November 2008,
<http://PAREonline.net/getvn.asp?v=7&n=19>
Somekh, B., & Lewin, C. 2005, Research Methods in the Social Sciences: A Guide for
Students and Researchers, Sage Publications, London.
Spector, P.E. 1992, Summated Rating Scale Construction: An Introduction, Sage
University Paper Series on Quantitative Applications in the Social Sciences, Series no
07-082, Sage Publications, Newbury Park, CA.
Stanford, J.D. 2004, ‘Long-Term Issues in Superannuation: An Overview, Australian
Economic Review,’ vol. 37, June, pp. 180-183.
Stevens, G.R. 2005, ‘Finance and the Ageing Population’, Address to the Financial
Planning Association of Australia Limited FPA National Conference 2005, CFP
Retreat, Gold Coast, 16 November 2005, Reserve Bank of Australia Bulletin,
December, pp. 9-16.
Strauss, A., & Corbin, J. 1994, ‘Grounded Theory Methodogy: An Overview,’ in
Handbook of Qualitative Research, (eds.) N. Denzin, & Y. Lincoln, Sage
Publications, Thousand Oaks, CA.
Sudman, S., & Bradburn, N. 1982, Asking Questions: A Practical Guide to
Questionnaire Design, San Fransisco, Jossey-Bass.
Sudman, S., & Bradburn, N. 1974, Response Effects in Surveys: A Review and
Synthesis, Aldine, Chicago.
Superannuation Guarantee (Administration) Amendment Regulations 2005 (Cwlth)
Superannuation Guarantee (Administration) Act 1992 (Cwlth)
Superannuation Industry (Supervision) Act 1993 (Cwlth)
Superannuation (Reform) Act 2004 (Cwlth)
Superannuation (Resolution of Complaints) Act 1993 (Cwlth)
Superannuation Safety Amendment Act 2004 (Cwlth)

320
Superannuation Stakeholder Group, 2009, Superannuation in the Context of the
Global Financial Crisis, Superannuation Stakeholder Joint Communiqué, 3rd
February
2009, pp. 1-4, viewed on 10 February 2009,
<http://www.superannuation.asn.au/mr090203/default.aspx>
Superannuation Unclaimed Money and Lost Members Act 1999 (Cwlth)
Super Ratings, 2009, Latest Returns, viewed 25 February 2009
<http://www.superrtings.com.au/latestreturns>
Taylor-Carter, M.A., Cook, K. & Weinberg, C. 1997, “Planning and Expectations of
the Retirement Experience”, Educational Gerontology, Vol. 23, No. 3, pp. 273-288.
Thaler, R.H. 1994, ‘Psychology and Savings Policies’, The American Economic
Review, vol. 84, no. 2, Papers and Proceedings of the Hundred and Sixth Annual
Meeting of the American Economic Association, pp. 186-192.
Thaler, R. & Benartzi, S. 2004, ‘Save More Tomorrow: Using Behavioural
Economics to Increase Employee Saving,’ Journal of Political Economy, vol. 112,
No. 1, pp. 164-187.
Thaler, R.H. & Shefrin, H.M. 1981, ‘An Economic Theory of Self-Control,’ Journal
of Political Economy, vol. 89, pp. 392-410.
The American Psychological Association 1985, Standards for Educational and
Psychological Testing, APA Press, Washington, DC.
The Treasury 2008a, Superannuation Clearing House and The Lost Members
Framework, Discussion Paper, November 2008, Australian Government, Canberra.
The Treasury 2008b, Architecture of Australia’s Tax and Transfer System,
Commonwealth of Australia, viewed 15 February 2009,
http://www.taxreview.treasury.gov.au
The Treasury 2007, Intergenerational Report 2007, Assessing the Long-Run
Sustainability of Government Policies, Australian Government, Canberra.
The Treasury 2004, A More Flexible and Adaptable Income System, viewed 13
February 2009,
<http://demographics.treasury.gov.au/content/_download/flexible_retirement_income
_system/HTML/retirement.asp>
The Treasury 2003, ‘Consumer and Financial Literacy Taskforce – Terms of
Reference’, viewed 4 October 2006,
<http://cfltaskforce.treasury.gov.au/contents/terms.asp?NavID=2#attachA>
The Treasury 2002, Intergenerational Report 2002-2003, Budget Paper No. 5,
Australian Government, Canberra, viewed 15 Janaury 2009,
<http://www.budget.gov.au/2002-03/bp5/html/index.html>

321
Thomas, S.J. 2004, Using Web and Paper Questionnaires for Data-based Decision
Making: From Design to Interpretation of the Results, Corwin Press, Thousand Oaks,
CA.
Tiessen, P. & Waterhouse, J.H. 1983, ‘Towards a Descriptive Theory of Management
Accounting,’ Accounting, Organisations and Society, vol 8, No. 2/3, pp. 251-267.
Tourangeau, R., Rips, L.J., & Rasinski, K. 2000, The Psychology of Survey Response,
Cambridge University Press, Cambridge.
Trochim, W.M.K. 2006, Research Methods Knowledge Base, viewed 14 September
2008, <http://www.socialresearchmethods.net/kb/survsel.php>
Tversky, A. & Kahneman, D. 1974, ‘Judgement Under Uncertainty: Heuristics and
Biases,’ Science, vol. 185, pp. 1124-1131.
VanDerhei, J.L. 2007, ‘The Expected Impact of Automatic Escalation of 401(k)
Contributions on Retirement Income,’ EBRI Notes, September, vol. 28, no.9, pp.2-8.
VanDerhei, J., Holden, S., Alonso, L. & Copeland, C. 2008, ‘401(k) Plan Asset
Allocation, Account Balances, and Loan Activity in 2007,’ EBRI Issue Brief No. 324,
December 2008.
Venti, S.F. 2004, ‘Choice Behavior and Retirement Saving,’ in Oxford Handbook of
Pensions and Retirement Income, (eds.) G. Clark, A. Munnell & M. Orszag, Oxford
University Press, Oxford.
Weisberg, H.F. 2005, The Total Survey Error Approach: A Guide to the New Science
of Survey Research, University of Chicago Press, Chicago.
Wilcox, R.T. 2003 ‘Bargaining Hunting or Star Gazing? Investors’ Preferences for
Stock Mutual Funds,’ The Journal of Business, vol. 76, no. 4, pp. 645-655.
Williams, M. 2003, Making Sense of Social Research, Sage Publications, London.
World Bank 1994, World Development Report: Infrastructure for Development,
World Bank Publications, Washington D.C.
Worthington, A.C. 2008, ‘Knowledge and Perceptions of Superannuation in
Australia,’ Journal of Consumer Policy, vol. 31, no. 3, pp. 349-368.
Wright, K.B. 2005, ‘Researching Internet-based populations: Advantages and
Disadvantages of Online Survey Research, Online Questionnaire Authoring Software
Packages, and Web Survey Services’, Journal of Computer-Mediated
Communication, vol. 10, no. 3, Article 11, viewed 24 October 2008
<http://jcmc.indiana.edu/vol10/issue3/wright.html>
Wright, B. & Stone, M. 1999, Measurement Essentials, 2nd
Edition, Wide Range Inc,
Wilmington, DE.

322
Yang, K. & Miller, G.J. 2007, Handbook of Research Methods in Public
Administration- Public Administration and Policy/134, CRC Press, Haboken, NJ.
Yu, J., & Cooper, H. 1983, ‘A Quantitative Review of Research Design on Response
Rates in Questionnaires,’ Journal of Marketing Research, vol. 20, pp. 36-44.