English PDF - Open Knowledge Repository
157
NIGERIA: SKILLS FOR COMPETITIVENESS AND EMPLOYABILITY June 2015 Public Disclosure Authorized Public Disclosure Authorized Public Disclosure Authorized Public Disclosure Authorized Public Disclosure Authorized Public Disclosure Authorized Public Disclosure Authorized Public Disclosure Authorized Public Disclosure Authorized Public Disclosure Authorized Public Disclosure Authorized Public Disclosure Authorized Public Disclosure Authorized Public Disclosure Authorized Public Disclosure Authorized Public Disclosure Authorized Public Disclosure Authorized Public Disclosure Authorized Public Disclosure Authorized Public Disclosure Authorized Public Disclosure Authorized Public Disclosure Authorized Public Disclosure Authorized Public Disclosure Authorized Public Disclosure Authorized Public Disclosure Authorized Public Disclosure Authorized Public Disclosure Authorized Public Disclosure Authorized Public Disclosure Authorized Public Disclosure Authorized Public Disclosure Authorized Public Disclosure Authorized Public Disclosure Authorized Public Disclosure Authorized Public Disclosure Authorized Public Disclosure Authorized Public Disclosure Authorized Public Disclosure Authorized Public Disclosure Authorized Public Disclosure Authorized Public Disclosure Authorized Public Disclosure Authorized Public Disclosure Authorized Public Disclosure Authorized Public Disclosure Authorized Public Disclosure Authorized Public Disclosure Authorized Public Disclosure Authorized Public Disclosure Authorized Public Disclosure Authorized Public Disclosure Authorized Public Disclosure Authorized Public Disclosure Authorized Public Disclosure Authorized Public Disclosure Authorized
-
Upload
khangminh22 -
Category
Documents
-
view
0 -
download
0
Transcript of English PDF - Open Knowledge Repository

NIGERIA: SKILLS FOR COMPETITIVENESS AND
EMPLOYABILITY
June 2015
Pub
lic D
iscl
osur
e A
utho
rized
Pub
lic D
iscl
osur
e A
utho
rized
Pub
lic D
iscl
osur
e A
utho
rized
Pub
lic D
iscl
osur
e A
utho
rized
Pub
lic D
iscl
osur
e A
utho
rized
Pub
lic D
iscl
osur
e A
utho
rized
Pub
lic D
iscl
osur
e A
utho
rized
Pub
lic D
iscl
osur
e A
utho
rized
Pub
lic D
iscl
osur
e A
utho
rized
Pub
lic D
iscl
osur
e A
utho
rized
Pub
lic D
iscl
osur
e A
utho
rized
Pub
lic D
iscl
osur
e A
utho
rized
Pub
lic D
iscl
osur
e A
utho
rized
Pub
lic D
iscl
osur
e A
utho
rized
Pub
lic D
iscl
osur
e A
utho
rized
Pub
lic D
iscl
osur
e A
utho
rized
Pub
lic D
iscl
osur
e A
utho
rized
Pub
lic D
iscl
osur
e A
utho
rized
Pub
lic D
iscl
osur
e A
utho
rized
Pub
lic D
iscl
osur
e A
utho
rized
Pub
lic D
iscl
osur
e A
utho
rized
Pub
lic D
iscl
osur
e A
utho
rized
Pub
lic D
iscl
osur
e A
utho
rized
Pub
lic D
iscl
osur
e A
utho
rized
Pub
lic D
iscl
osur
e A
utho
rized
Pub
lic D
iscl
osur
e A
utho
rized
Pub
lic D
iscl
osur
e A
utho
rized
Pub
lic D
iscl
osur
e A
utho
rized
Pub
lic D
iscl
osur
e A
utho
rized
Pub
lic D
iscl
osur
e A
utho
rized
Pub
lic D
iscl
osur
e A
utho
rized
Pub
lic D
iscl
osur
e A
utho
rized
Pub
lic D
iscl
osur
e A
utho
rized
Pub
lic D
iscl
osur
e A
utho
rized
Pub
lic D
iscl
osur
e A
utho
rized
Pub
lic D
iscl
osur
e A
utho
rized
Pub
lic D
iscl
osur
e A
utho
rized
Pub
lic D
iscl
osur
e A
utho
rized
Pub
lic D
iscl
osur
e A
utho
rized
Pub
lic D
iscl
osur
e A
utho
rized
Pub
lic D
iscl
osur
e A
utho
rized
Pub
lic D
iscl
osur
e A
utho
rized
Pub
lic D
iscl
osur
e A
utho
rized
Pub
lic D
iscl
osur
e A
utho
rized
Pub
lic D
iscl
osur
e A
utho
rized
Pub
lic D
iscl
osur
e A
utho
rized
Pub
lic D
iscl
osur
e A
utho
rized
Pub
lic D
iscl
osur
e A
utho
rized
Pub
lic D
iscl
osur
e A
utho
rized
Pub
lic D
iscl
osur
e A
utho
rized
Pub
lic D
iscl
osur
e A
utho
rized
Pub
lic D
iscl
osur
e A
utho
rized
Pub
lic D
iscl
osur
e A
utho
rized
Pub
lic D
iscl
osur
e A
utho
rized
Pub
lic D
iscl
osur
e A
utho
rized
Pub
lic D
iscl
osur
e A
utho
rized
i
ACKNOWLEDGEMENTS
The study was led by Marta Favara (Economist) and Irajen Appasamy (Senior Operations Specialist), with the
support of Marito Garcia (Principal Consultant). This study was prepared at the request of the federal government
of Nigeria. The team gratefully acknowledges the significant contribution of Olatunde Adekola (Senior Education
Specialist, GEDDR), who provided substantive guidance to the team’s review of Nigeria’s education landscape.
He also led the dialogue and coordination held in two consultation workshops with multi-stakeholders for the
report in June 2014 and December 2014. The team also benefited greatly from the preliminary work by Samira
Halabi (Economist, GEDDR) and Martin Moreno (Consultant) who provided assistance in the analysis of
household surveys. The team would also like to acknowledge Janet Adebo (GEDDR), Solomon Adebayo, and
Hadiza Eneche (AFCW2) for providing team assistance. Leslie Prpich provided technical editing services to the
policy note.
This policy note benefited substantively from the guidance of Indira Konjhodzic (Country Program Coordinator
for Nigeria), Peter N. Materu (Education Practice Manager), and Marie-Francoise Marie-Nelly (Country Director
for Nigeria). This policy note is a companion volume to the Nigeria jobs report entitled: More, and More
Productive, Jobs for Nigeria – A Profile of Work and Workers (2015), which was led by Dena Ringold of the
Social Protection and Labor (GSPDR) Global Practice and Kathleen Beegle formerly of the World Bank
Development Research Group for Poverty and Inequality, whose comments and contributions provided several
key arguments in this report.
The policy note greatly benefited from valuable feedback from participants at the stakeholder consultation
workshop held in Abuja on December 14, 2014, to discuss its preliminary findings. High-level participants
included ministers, CEOs, and directors general from key agencies, including the Federal Ministry of Education
(FME), National Board of Technical Education (NBTE), Federal Ministry of Science and Technology, Federal
Ministry of Industry, Trade and Investment, Industrial Training Fund (ITF), Tertiary Education Trust Fund,
National Board of Technology Innovation (NBTI), National Agency for Science and Engineering Infrastructure
(NASENI), Global Distance Learning Institute, National Office of Technology Acquisition and Promotion,
National Space Research and Development Agency, National Information Telecommunications Development
Agency (NITDA), and the Federal Institute of Industrial Research, as well as representatives from state Ministries
of Education of Ekiti, Anambra, and Bauchi. Also participated in the workshop were non-state stakeholders,
including the Nigeria Economic Summit Group (NESG), Nigeria Society of Engineers, Nigeria Economics
Society, Federation of Construction Industry (FOCI), rectors and deans from five polytechnics and universities at
state and federal levels, and private-sector representatives of Huawei, AfriHUB Ltd, Riplington Associates, and
Human Capital Partners. International development partners from the U.K. Department for International
Development (DfID), Japan International Cooperation Agency (JICA), African Development Bank (ADB), and
U.S. Agency for International Development also participated.
We acknowledge the contributions from peer reviewers of the report: Harsha Aturupane (Lead Education
Specialist and Country Sector Coordinator, GEDDR); Nalin Jena (Senior Education Specialist, GEDDR); and
Kathleen G. Beegle (Program Leader, AFCW1). Additional comments were provided by John Speakman (Lead
Private Sector Development Specialist, GTCDR); Lucy Fye (Senior Private Sector Development Specialist,
GTCDR); Meskerem Mulatu (Lead Education Specialist); Olatunde Adekola (Senior Education Specialist);
Shobhana Sosale (Senior Operations Specialist); Kebede Feda (Human Development Economist); Peter Darvas
(Senior Economist, GEDDR); Foluso Okunmadewa (GSPDR); Khwima Nthara (Program Leader, AFCW2);
Sateh Chafic El-Arnaout (Program Leader, AFCW2); Michael Wong (Lead Private Sector Development
Specialist, GTCDR); Andrew Gartside (Senior Private Sector Development Specialist, GTCDR); Obadiah
Tohomdet (Senior Communications Officer, AFREC); Halima Usman (Consultant, GTCDR; Vasco Molini
(Economist, GPVDR); and Johanne Buba (Economist, GTCDR).
ii
ABBREVIATIONS AND ACRONYMS
ACCESS Assessment of Core Competencies for Employability in the Services Sector
ANJIMS Access Nigeria Jobs Information System
ATA Agricultural Transformation Agenda
AUST African University for Science and Technology
BPO Business Process Outsourcing
CoE College of Education
CAC Corporate Affairs Commission
CCT Conditional Cash Transfer
CPS Country Partnership Strategy
DfID Department for International Development
DHS Demographic and Health Survey
ECD Early Childhood Development
ECDI Early Child Development Index
ESSPIN Education Sector Support Program in Nigeria
FEC Federal Executive Council
FGCs Federal Government Colleges
FIRS Federal Inland Revenue Service
FME Federal Ministry of Education
GDP Gross Domestic Product
GHS General Household Survey
GNP Gross National Product
HND Higher National Diploma
GAR Gross Attendance Rate
GNI Gross National Income
HIPC Heavily Indebted Poor Countries
ICT Information and Communication Technology
IF&FS Infrastructure Leasing and Financial Services
ITF Industrial Training Fund
ISCO88 International Standard Classification of Occupations version 1988
IDPs International Development Partners
JAMB Joint Admission and Matriculation Board
LFP Labor Force Participation
LMI Labor Market Information
LMIS Labor Market Information System
LGA Local Government Authority
LGEAs Local Government Education Authorities
MAN Manufacturers Association of Nigeria
MICS Multiple Indicator Cluster Survey
MLA Monitoring Learning Achievement
MOOC Massive Open Online Course
NABTEB National Business and Technical Examinations Board
NAR Net Attendance Rate
NBTE National Board of Technical Education
iii
NCE National Council on Education
NCCE National Commission for Colleges of Education
ND National Diploma
NDE National Directorate of Employment
NECA Nigeria Employers’ Consultative Association
NECO National Examinations Council
NEDS Nigeria Education Data Survey
NEET Not in Education, Employment, or Training
NEPC Nigerian Export Promotion Council
NEPZA Nigeria Export Processing Zones Authority
NERDC Nigerian Educational Research and Development Council
NESG Nigeria Economic Summit Group
NGHSP Nigeria General Household Survey - Panel
NIPC Nigerian Investment Promotion Commission
NITDA Nigeria Information Technology Development Agency
NPFD Nigeria Partners for Development
NUC National Universities Commission
NVQF National Vocational Qualification Framework
NYC National Youth Corps
O*NET Occupational Information Network
PBEI Post-Basic Education Institution
SBMC School-Based Management Committee
POOC Professional Open Online Course
PPP Public-Private Partnership
PTR Pupil-Teacher Ratio
SETA South Africa’s Skills Education Training Authority
SMEs Small and Medium Enterprises
S&T Science And Technology
SMoEs State Ministries of Education
STEP Skills Toward Employment and Productivity
STEP-B Science and Technology Post-Basic Education Project
STEM Science, Technology, Engineering, and Mathematics
SUBEBs State Universal Basic Education Boards
TETFund Tertiary Education Trust Fund
TIMSS Trends in International Mathematics and Science Study
TVET Technical and Vocational Education and Training
UBE Universal Basic Education
UBEC Universal Basic Education Commission
UIS UNESCO Institute of Statistics
UNESCO United Nations Educational, Scientific, and Cultural Organization
UNICEF United Nations Children’s Fund
UTME Unified Tertiary Matriculation Examination
WAEC West African Examinations Council
WASSCE West African Senior School Certificate Examination
YESSO Youth Employment and Social Support Operation
i
Report No. 96420-NG Standard Disclaimer: This volume is a product of the staff of the International Bank for Reconstruction and Development/the World Bank. The findings, interpretations, and conclusions expressed in this paper do not necessarily reflect the views of the executive directors of the World Bank or the governments they represents. The World Bank does not guarantee the accuracy of the data included in this work. The boundaries, colors, denominations, and other information shown on any map in this work do not imply any judgment of the part of the World Bank concerning the legal status of any territory or the endorsement or acceptance of such boundaries. Copyright Statement: The material in this publication is copyrighted. Copying and/transmitting portions or all of this work without permission may be a violation of applicable law. The International Bank for Reconstruction and Development/the World Bank encourages dissemination of its work and will normally grant permission to reproduce portions of the work promptly. For permission to photocopy or reprint any part of this work, please send a request with complete information to the Copyright Clearance Center, Inc., 222 Rosewood Drive, Danvers, MA 01923,USA, telephone 978-750-8400, fax 978-750-4470, http://www.copyright.com/.
i
TABLE OF CONTENTS
ACKNOWLEDGEMENTS ........................................................................................................................................ i
LIST OF TABLES ..................................................................................................................................................... ii
LIST OF BOXES ......................................................................................................................................................iii
LIST OF FIGURES ..................................................................................................................................................iii
FOREWORD ............................................................................................................................................................ vi
EXECUTIVE SUMMARY ....................................................................................................................................... ix
CHAPTER 1. THE NIGERIAN LANDSCAPE IN JOBS, EDUCATION AND SKILLS ................................. 1
A. Introduction .................................................................................................................................................. 1 Accelerating Nigeria’s economic growth and poverty reduction ................................................................. 1 Education and skills: Why are they so important to Nigeria’s growth and poverty reduction strategy? ..... 1
B. Jobs in Nigeria .............................................................................................................................................. 4 The current job landscape ............................................................................................................................ 4 Areas and sectors of likely demand for skills .............................................................................................. 5 A look at the future demand for skills ......................................................................................................... 5
C. Education and skills profile of the Nigerian population and labor force ................................................. 9 Education and literacy ................................................................................................................................. 9 Improvements in the education level of Nigerians .................................................................................... 13 Country moving at two speeds ................................................................................................................... 14
D. The skills content of the current workforce ............................................................................................. 22 Five categories of skills ............................................................................................................................. 23
CHAPTER 2. THE SHORTAGE OF SKILLS AND THE MISALIGNMENT OF SKILLS DEMAND AND
SUPPLY .................................................................................................................................................................. 31
A. Unemployment and underemployment: Structural problems ................................................................ 31
B. Imperfections in the skills supply market ................................................................................................. 33 Public and private provision of skills: Formal TVET, traditional apprenticeships, and informal training 33 The Nigerian education and TVET systems: Complex with no clear accountability mechanism ............. 33 Funding sources: Diverse and with poor accountability for results ........................................................... 35 National certification system: Not comprehensive and unresponsive to employers’ needs ....................... 35 Low capacity of post-basic and tertiary TVET .......................................................................................... 38 Low access to post-basic and tertiary TVET in relation to the needs of the economy .............................. 38 Gender disparity in technology and science education .............................................................................. 41 Regional disparities in access to TVET ..................................................................................................... 41 Poor quality of TVET system .................................................................................................................... 43 Poor learning outcomes in secondary schools ........................................................................................... 43 Lack of qualified teachers and learning resources ..................................................................................... 47
C. Imperfections in the labor market ............................................................................................................ 48 Lack of skills and incentives for investing in training ............................................................................... 48
D. Imperfections in capital markets ............................................................................................................... 50 Need for understanding of capital markets for education and skills development: Solving the lack of
access to financial means .................................................................................................................... 50
E. Individual decision-making failures .......................................................................................................... 51 Household and student decisions about post-basic education are not well informed ................................ 51
F. Planning and coordination failures ........................................................................................................... 51 Issues with imbalance in skills demand and supply ................................................................................... 51 Understanding demand for skills from the market and failures in planning: Poor market information and
ii
poor signaling of needs ....................................................................................................................... 51 Too many parastatals in the education sector complicate planning and coordination ............................... 53
G. Informal TVET Sector and Skills for the informal economy ................................................................. 54
CHAPTER 3. STRATEGIES FOR ACCELERATING SKILLS DEVELOPMENT TO SUPPORT
ECONOMIC GROWTH AND SHARED PROSPERITY ................................................................................. 56
A. Capitalizing on Nigeria’s demographic dividend ..................................................................................... 56
B. Enhancing LFP and unemployed workforce ............................................................................................ 58
C. Exploiting the potential of the inactive and NEET population: Is it a youth phenomenon only? ....... 60
D. Increasing productivity of the underemployed workforce ...................................................................... 62
E. Improving outcomes for workers in the informal sector ......................................................................... 64
F. New perspectives in addressing job market skills: A granular profile of Nigeria’s young
population .................................................................................................................................................... 69
G. Building a foundation for solid, sustained economic growth: Addressing out-of-school children ...... 76
CHAPTER 4. OPERATIONALIZING SKILLS DEVELOPMENT STRATEGIES TO SUPPORT
NIGERIAN ECONOMIC GROWTH AND SHARED PROSPERITY ............................................................ 78
A. Can Nigeria fulfill its potential? ................................................................................................................ 78
B. A vision for accelerating economic growth through a new skills development framework ................. 78
C. Key policy recommendations ..................................................................................................................... 79
D. Final note ..................................................................................................................................................... 86
Annex 1. State-level breakdown of education and data .................................................................................. 87
Annex 2. Basic education and foundational skills ......................................................................................... 111
Annex 3. Geopolitical zones classification ...................................................................................................... 119
Annex 4. STEP-B overview: Key innovations and outcomes ....................................................................... 120
Annex 5. NaijaCloud microwork job creation: Global online outsourcing job skills for Nigerian youth 122
Annex 6. Fab Labs: 21st-century digital fabrication skills........................................................................... 123
Annex 7. Massive open online courses for Nigeria ........................................................................................ 125
Annex 8. The returns to education in Nigeria ............................................................................................... 126
Annex 9. Skills content analysis methodology ............................................................................................... 132
REFERENCES ...................................................................................................................................................... 135
LIST OF TABLES
Table 1-1. Education composition of Nigerian population across geopolitical zones (15–64 age group, 2011) ..... 15 Table 1-2. Change in educational composition, comparing across cohorts (2011) .................................................. 17 Table 2-1. Causes of the jobs and skills market failures .......................................................................................... 32 Table 2-2. NVQF levels and descriptors proposed for Nigeria ................................................................................ 37 Table 2-3. TVET institutions by ownership (2010) ................................................................................................. 38 Table 2-4. Enrolment in mono-technics and polytechnics by education field (ND, HDN, %) ................................ 39 Table 2-5.Enrolment in polytechnics by zones (2009–2010) ................................................................................... 42 Table 2-6. Federal government budget allocated to education (2008–2014) ........................................................... 43 Table 3-1. Labor force status (15–64-year-old population, 2011) ........................................................................... 59 (percent) ................................................................................................................................................................... 59 Table 3-2. Labor force status by age groups, gender, and urban/rural (2011) (percent) .......................................... 60
iii
Table 3-3. Education level of inactive and NEET population (15–64, 2011) (percent) ........................................... 61 Table 3-4. Distribution of underemployment by age, gender, rural/urban (2011) (percent) .................................... 62 Table 3-5. Distribution of underemployment by education (15–64-year-old population, 2011) (percent) .............. 62 Table 3-6. Underemployment rate by geopolitical zones (15–64-year-old population, 2011) (percent) ................. 63 Table 3-7. Formal and informal employees by age groups, gender, urban/rural (2011) (percent) ........................... 64 Table 3-8. Distribution of formal and informal 15–64-year-old employees across economic sectors (2011)
(percent).......................................................................................................................................................... 67 Table 3-9. Distribution of formal and informal 15–64-year-old employees across occupations (2011) (percent)... 67 Table 3-10. Literacy rate among formal and informal 15–64-year-old employees (2011) ...................................... 68 Table 3-11. Distribution of formal and informal employees (15–64) by education level, 2011 (percent) ............... 69 Table 3-12. Education profile of 15–24-year-old population by geopolitical zones, 2011 (percent) ....................... 69 Table 3-13. Literacy levels of 15–24-year-old population by geopolitical zones, 2011 (percent) ........................... 70 Table 3-14. Labor force status of 15–24-year-old population by geopolitical zones, 2011 ..................................... 70 Table 3-15. Underemployed rate (15–24-year-old population, 2011) ...................................................................... 72 Table 3-16. Distribution of underemployment by education (15–24-year-old population, 2011) (percent) ............ 72 Table 3-17. Distribution of young employees across formal and informal sectors by education level (15–24-year-
old population, 2011) (percent) ...................................................................................................................... 73 Table 3-18. Literacy rate among formal and informal 15–24-year-old employees, 2011 ........................................ 73 Table A1-1. Education composition of Nigerian population across states (15–64 age group, 2011) ...................... 87 Table A1-2. Education composition of Nigerian population across states (15–24 age group, 2011) ...................... 88 Table A1-3. Illiteracy rate raw scores by state and educational level, 15–64, 2011 ................................................ 90 Table A1-4. Illiteracy rate by state and educational level, 15–24, 2011 .................................................................. 91 Table A1-5. Raw skills scores by states (2009) ....................................................................................................... 94 Table A1-6. Raw skills scores by states (2011) ....................................................................................................... 95 Table A1-7. Labor force definition (LFP) and NEET (15–64-year-old population, 2011) ...................................... 97 Table A1-8. Distribution of labor force status (LFP and NEET) 15–64 by state, 2011 ........................................... 98 Table A1-9. Labor force definition (LFP) and NEET (15–24-year-old population, 2011) ...................................... 99 Table A1-10. Distribution of labor force status (LFP and NEET) 15–24 by state, 2011 ....................................... 100 Table A1-11. Labor force definition: Underemployment (15–64-year-old population, 2011) .............................. 101 Table A1-12. Distribution of labor force (underemployment) 15–64 by state, 2011 ............................................. 102 Table A1-13. Labor force definition: Underemployment (15–24-year-old population, 2011) .............................. 103 103 Table A1-14. Distribution of labor force (underemployment) 15–24-year-old by state, 2011 .............................. 104 Table A1-15. Labor force definition: Formal vs. informal (15–64-year-old population, 2011) ............................ 105 Table A1-16. Distribution of formal versus informal employees 15–64 by state, 2011 ........................................ 106 Table A1-17. Labor force definition: Formal vs. informal (15–24-year-old population, 2011) ............................ 107 Table A1-18. Distribution of formal vs. informal employees 15–24 by state, 2011 .............................................. 108 Table A2-1. Mean scores in ESSPIN teacher assessment by state ......................................................................... 115 Table A2-2. Service delivery indicators at a glance ............................................................................................... 116 Table A8-1. The returns to education by economic sectors and across geopolitical zones .................................... 129 Table A8-2. The returns to education by countries ................................................................................................ 130 Table A8-3. The returns to skills ............................................................................................................................ 131
LIST OF BOXES
Box 1. Shortage of reliable information on skills ...................................................................................................... 3 Box 2. Illiteracy rates across states: Being at school and being illiterate ................................................................. 12 Box 3. Labor force definitions ................................................................................................................................. 56 Box 4. Characterizing the young: Evidence from the Nigeria Youth Survey .......................................................... 73
LIST OF FIGURES
Figure 1-1. Nigeria: The returns of education, by economic sectors ......................................................................... 2 Figure 1-2. Distribution of Nigeria’s population and labor force (15–64) in millions (2011) ................................... 4 Figure 1-3. Employment by sector, population aged 15–64 (1999, 2007, and 2011 (percent) .................................. 5 Figure 1-4. Many children are unable to read and add numbers after completing school .......................................... 9

iv
Figure 1-5. Population and labor force literacy rate by education level (15–64-year-old population, 2011) ........... 10 Figure 1-6. Share of illiterate population by geopolitical zone 8 (2009 and 2011) .................................................. 11 Figure 1-7. Illiteracy rate by states (15–64-year-old population, 2011) ................................................................... 11 Figure 1-8. Share of illiterate population by economic sector (Panel A) and occupation (Panel B) ........................ 12 Figure 1-9. Illiteracy rate across states (15–64 years old, 2011) .............................................................................. 12 Figure 1-10. Illiteracy gap by education level across states (16–64 age group, 2011) ............................................. 13 Figure 1-11. Education composition by age groups (15–24; 25–34; 35–44; and 45-54, 2011) ............................... 14 Figure 1-12. Education composition of Nigerian population (15–64 age group, 2009 and 2011) ........................... 14 Figure 1-13. Percentage of population with up to primary education (15–64 age group, 2011) .............................. 15 Figure 1-14. Percentage of population with secondary education (15–64 age group, 2011) ................................... 16 Figure 1-15. Percentage of population with tertiary education (15–64 age group, 2011) ........................................ 16 Figure 1-16. Gender gap in education composition across generations (female versus male education attainment,
2011) ............................................................................................................................................................... 17 Figure 1-17. Educational composition by economic sectors (15–64-year-old population, 2009–2011) .................. 18 Figure 1-18. Educational composition by low/mid-value-added services subgroup, 2011 ...................................... 19 Figure 1-19. Within-sector changes in educational structure (2007–2011) ............................................................. 20 Figure 1-20. Education composition by occupation (2011) ..................................................................................... 21 Figure 1-21. Education composition by occupations and skills level (2011) ........................................................... 22 Figure 1-22. Skills categories used in skills content analysis .................................................................................. 24 Figure 1-23. Skills content of Nigerian economic sectors (2011) ............................................................................ 25 Figure 1-24. Evolution of skills content of the Nigerian labor force in 2009 and 2011 ........................................... 25 Figure 1-25. Evolution of skills content of the Nigerian labor force by age cohorts (2011) .................................... 26 Figure 1-26. Skills content of the Nigerian labor force by gender (2011) ............................................................... 26 Figure 1-27. Skills content of the Nigerian labor force by education level (2011) .................................................. 27 Figure 1-28. Skills content of the Nigerian labor force by geopolitical zones (2011) ............................................. 28 Figure 1-29. Routine cognitive skills and GNP per capita (2009 and 2011) ............................................................ 28 Figure 1-30. Non-routine cognitive analytical skills and GNP per capita (2009 and 2011) .................................... 29 Figure 1-31. Non-routine cognitive interpersonal skills and GNP per capita (2009 and 2011) ............................... 29 Figure 1-32. Routine manual skills and GNP per capita (2009 and 2011) ............................................................... 30 Figure 1-33. Non-routine manual physical skills and GNP per capita (2009 and 2011) .......................................... 30 Figure 2-1. Organogram of the FME ....................................................................................................................... 34 Figure 2-2. National competency-based qualifications framework .......................................................................... 36 Figure 2-3. Enrolment in polytechnics and mono-technics (2005–2010) ................................................................ 39 Figure 2-4. Enrolment in mono-technics and polytechnics by education field (2009–2010) ................................... 40 Figure 2-5: Male and female enrolment in mono-technics and polytechnics (ND and HND, 2005–2010 .............. 41 Figure 2-6. Enrolment in mono-technics and polytechnics by field of education (ND and HND, 2005–2010) ...... 42 Figure 2-7. Enrolment by state (2009–2010) ........................................................................................................... 42 Figure 2-8. Percentage of registered students passing the NECO with 5 credits and above, 2010 .......................... 44 Figure 2-9. Percentage of students passing the WASSCE with 5 credits and above (May/June 2011) ................... 45 Figure 2-10. Class sizes for all and good classrooms in primary and junior secondary schools .............................. 46 Figure 2-11. Correct words per minute in reading test, by having access to print materials .................................... 48 Figure 2-12. The top 3 obstacles for employers when trying to hire new employees .............................................. 50 Figure 3-1. Population pyramid age by sex (2011) .................................................................................................. 57 Figure 3-2. Population composition by age group by geopolitical areas (2011) ...................................................... 57 Figure 3-3. LFP (15–64-year-old population, 2011) ................................................................................................ 58 Figure 3-4.LFP in Sub-Saharan Africa .................................................................................................................... 59 Figure 3-5. Unemployment rate (15-64 population, 2011) ...................................................................................... 60 Figure 3-6. Share of NEET (15–64-year-old population, 2011) .............................................................................. 61 Figure 3-7. Underemployment by economic sector and occupation (15–64 and 15–24-year-old population,
2011) ............................................................................................................................................................... 62 Figure 3-8 Distribution of underemployed workers by economic sector and occupation (15–64-year-old
population, 2011) ............................................................................................................................................ 63 Figure 3-9. Underemployment rate (15–64-year-old population, 2011) .................................................................. 64 Figure 3-10. Percentage of formal wage workers (15–64-year-old population, 2011) ............................................ 65 Figure 3-11. Percentage of informal wage workers (15–64-year-old population, 2011) ......................................... 65 Figure 3-12. Percentage of informal self-employed agricultural workers (15–64-year-old population, 2011) ........ 66
v
Figure 3-13. Percentage of informal nonfarm self-employed workers (15–64-year-old population, 2011)............. 66 Figure 3-14. Education level of formal and informal 15–64-year-old employees (2011) ........................................ 68 Figure 3-15. Share of NEET (16–24-year-old population 2011) ............................................................................. 71 Figure 3-16. Unemployment rate (15–24-year-old population, 2011) ..................................................................... 71 Figure 3-17. Underemployed rate (15–24-year-old population, 2011) .................................................................... 72 Figure 3-18. Percentage distribution of youth by attendance in school ................................................................... 74 Figure 3-19. School attendance rates have stagnated at primary level but improved dramatically at secondary and
tertiary level between 1990 and 2010 ............................................................................................................. 76 Figure 3-20. Out-of-school children by states and gender (2010) ............................................................................ 77 Figure 4-1. Skills for employability: Technical skills with foundational and behavioral skills ............................... 80 Figure A1-1. Change in educational composition at state level, comparing two age groups (15–64 and 19–30,
2009) ............................................................................................................................................................... 89 Figure A1-2. Illiteracy rate by states and age groups (2011) - Panel A. Illiteracy rate 15–24-year-old population
(2011) ............................................................................................................................................................. 92 Figure A1-3. ............................................................................................................................................................. 96 Figure A1-4. Percentage of formal wage workers (15–24-year-old population, 2011).......................................... 109 Figure A1-5. Percentage of informal wage workers (15–24-year-old population, 2011) ...................................... 109 Figure A1-6. Percentage of informal nonfarm self- employed workers (15–24-year-old population, 2011) ......... 110 Figure A1-7. Percentage of informal self-employed agriculture employees (15–24-year-old population, 2011) .. 110 Figure A2-1. Oral reading fluency of primary grade 3 students in Bauchi and Sokoto ......................................... 112 Figure A2-2. Average performance of grade 4 students in the 2010 MLA (percent) ............................................ 112 Figure A2-3. PTR in secondary education ............................................................................................................. 113 Figure A2-4. Percentage of qualified teachers in primary schools, 2009-10 ......................................................... 114 Figure A2-5. ESSPIN teacher knowledge assessment results, 2010 ...................................................................... 115 Figure A8-1. The return of education by economic sectors ................................................................................... 126
vi
FOREWORD
About this policy note
This policy note is a diagnostic of the state of Nigerian skills and human capital. It seeks to understand the kinds
and levels of human capital that Nigeria possesses to support its efforts toward economic competitiveness over the
next two decades. It also looks at inefficiencies of the Nigerian skills-building system, including barriers to growth,
and proposes policy recommendations and actions to overcome these constraints. The policy note offers key insights
into the drivers of the labor market, the underlying analysis of why Nigeria has been unable to reduce its poverty
rate over time, the jobs landscape, and the drivers, dimensions, and directions for skills development to transform
the Nigerian economy. The emphasis is on directions for public sector responsibility and public-private partnerships.
The study reinforces the nexus between the jobs and the employability. Finally, it provides the analytical bases and
policy and programmatic directions for the government of Nigeria in keeping with the World Bank Country
Partnership Strategy (FY2014–17).
Education and policy report series
Policy Note 2 is the second in a series of three programmatic outputs:
Education Access, Equity, and Quality (Pillar 1)
Skills for Competitiveness and Employability (Pillar 2)
Governance, Accountability, and Finance Analysis in the Education Sector (Pillar 3)
The multiyear programmatic Analytical and Advisory Assistance aims to undertake a comprehensive review of the
state of education and skills in Nigeria. It complements the work on skills done by other Global Practice Groups,
including Poverty and Equity, Social Protection and Labor, and Finance and Markets.
There is a compelling link between jobs, skills, poverty reduction, and the social protection agenda for job creation,
which makes this work well suited for a joint effort of the various groups. The policy note aims to assist
policymakers in understanding the complex relationship between skills supply (that is, the skills level of the
Nigerian labor force) and the demand for skills from the labor market. It presents important messages and policy
options for the main stakeholders in this area, including state actors at federal, state, and local levels and non-state
actors, such as nongovernmental organizations, civil society organizations, private actors, and development
partners, including international development partners.
Scope of the policy note
The policy note recognizes the centrality of education in the development of quality human capital for the economy
and adopts a comprehensive approach to skills development, from foundational to high-level skills. In particular, it
seeks to
investigate the education profile of the Nigerian population and how education translates into skills;
probe the skills content of the Nigerian labor force and determine whether Nigeria has the requisite
skills in the labor force;
identify the mechanisms and failures behind the suboptimal levels or alignment between skills supply
and demand;
establish the characteristics of unexploited human capital potential with regard to unemployment,
inactivity, underemployment, and informality; and

vii
propose policy recommendations and actions to overcome existing constraints to effective skills
development.
In doing this, the policy note takes into account the high heterogeneity across geopolitical zones, states, economic
sectors, and population groups and differentiates the analysis along these dimensions.
Focus of the policy note
This policy note focuses mainly on post-basic education and skills with emphasis on the formal and informal
provision in the technical vocational subsector of education.1 This covers technical and vocational education and
training (TVET), higher education, formal and informal on-the-job training, and traditional apprenticeship, which
are the key avenues for acquiring technical skills that help workers succeed in their chosen profession. Formal
training programs refer to officially accredited and recognized TVET programs. TVET is offered at the post-basic
level by technical colleges and at the tertiary level by polytechnics, universities, and specialized colleges (public
and private). Informal vocational training is short-term vocational training provided by government and
nongovernment institutions for those who will likely continue to be in the informal workforce.
Sectors of the economy that will drive growth in Nigeria—such as infrastructure, retail, and manufacturing
services—require these post-basic and technical vocational skills, which are currently being produced in small
numbers and with poor quality. At the same time technical skills are crucial for improving productivity, particularly
for Nigeria’s informal sector workers in household enterprises who comprise half of the workforce and who need
some accreditation.
Apprenticeship programs and on-the-job training are predominantly of an informal nature. Higher education
generally prepares graduates for white-collar jobs, while vocational training provides students with applied skills
required for vocational tasks. On-the-job training deepens the technical skills acquired in formal education and
training and adapts them to the individual workplace. Vocational training and education and on-the-job training are
less popular but currently absorb large numbers of young people—and will continue do so in the medium and long
term.
Linkage of the policy note with Nigeria jobs report
In formulating the analysis and recommendations, this policy note builds on the findings of a parallel study, the
2015 Nigeria Jobs Report: More, and More Productive, Jobs for Nigeria – A Profile of Work and Workers (World
Bank 2015), which defined the structure of the Nigerian labor force and identified areas and sectors of the economy
where potential jobs would need to be created. The demand for skills in those priority sectors forms the basis for
recommendations moving forward.
Education and skills are part of a broader set of interventions for a jobs strategy. The projections
from the companion Nigeria Jobs Report indicate that between 2010 and 2030, the Nigerian population will need
over 40 million jobs. The policy note recognizes the importance of education and skills in the production of these
jobs.
Data sources
The analysis was informed by various sources, including (a) Nigerian General Household Survey (GHS 2009 and
2011 and round two of the panel 2012); (b) 2010 Nigeria Education Data Survey (NEDS); (c) 2011 World
Development Indicators; (d) 2011 Multiple Indicator Cluster Survey; (e) 2010–11 Nigerian General Household
Survey Panel; (f) Demographic and Health Survey (DHS, various years); (g) West African Examinations Council (WAEC) Senior School Certificate Examinations (various years); and (h) data provided by the National Board for
Technical Education and the Universal Basic Education Commission, among other institutions.
1 Tertiary education is considered in this report with respect to the review of polytechnics. The analysis of basic
education has been dealt with extensively in an earlier report on Nigeria: Access, Equity, and Quality (World
Bank 2013).

viii
The lack of data on skills and the fragmented nature and poor quality of the data available limited the study and has
been a major constraint in the analysis.
Policy note overview
Chapter 1 looks at Nigeria’s current and future job market (skills demand), profiles the education, literacy, and
skills of the Nigerian population (skills supply), and provides skills content analysis of the Nigerian labor force.
Chapter 2 analyzes the shortage of skills and human capital and the misalignment of skills demand and supply.
Chapter 3 discusses strategies for accelerating skills development to support economic growth in Nigeria. It focuses
on Nigeria’s unexploited human capital, that is, the population who could potentially fill future labor needs so that
Nigeria can take advantage of its demographic dividend. In particular, the chapter focuses on (a) the unemployed
labor force; (b) people who are out of the labor force; and (c) people who are underemployed.
Chapter 4 presents key policy recommendations and actions to improve the alignment of skills demand and supply
for competitiveness and employability.
ix
EXECUTIVE SUMMARY
Human capital and skills: Key to accelerating Nigeria’s economic growth and shared prosperity
1. This policy note is a diagnostic of the state of Nigerian skills and human capital. It seeks to understand the
kinds and levels of human capital that Nigeria possesses to support its efforts toward economic competitiveness
over the next two decades. It also looks at inefficiencies of the Nigerian skills-building system, including the barriers
to growth, barriers to sharing prosperity, and proposes policy recommendations and actions to overcome these
constraints.
Main findings
2. Education quality/attainment is the key determinant of the skills level in the population. In the last
three decades, the Nigerian population has become more educated, but large variations exist. The largest variation
is along geopolitical lines between the North and the South, with the former characterized by low levels of education
access and high youth underemployment. In addition, the education that most Nigerians receive is of poor quality,
and illiteracy remains high even among those who attend school. The percentage of the population who never
attended school has decreased significantly all over the country, but at two speeds, with the South decreasing faster
than the North. The rate of illiteracy in the northern states is between two and three times that in the South. And,
while access to basic education is increasing for both men and women, the gender gap is markedly high, both in
basic and higher education.
3. The educational level of the workforce population is very heterogeneous across economic sectors, with
most of the illiterate labor force concentrated in agriculture. Education does not necessarily equip the labor force
with basic and rentable skills for the labor market. Notably, the completion of primary school does not necessarily
mean that students are able to read and add numbers. The high illiteracy rate reflects both a limited access to
education and low-quality education.
4. Many educated Nigerians cannot find jobs and the situation is worsening. Another striking sign of
failure of the skills development system in place is reflected in the inability of many educated Nigerians to find
productive work, a problem that appears to be worsening. Four in ten people who are ‘not in education, employment,
or training’ (NEET) have senior secondary education or higher. Furthermore, many employees are either
underqualified or overqualified for their occupations. This mismatch generates a loss of human capital and signals
that having senior secondary or higher education does not automatically translate into a better occupation.
5. Nigeria is not fully exploiting its available human capital—most people are trapped in low
productivity in the informal sector. A majority of the active population has continued to operate within low-
productivity and low-earnings sectors. About 20 percent of the 25–34-year-old population is NEET, and more than
90 percent of the labor force is employed in the informal sector. Finally, the relatively low unemployment masks
high underemployment, particularly within the farm sector.
6. With regard to manual and cognitive skills, there have been positive shifts in the South. Although the
skills required in Nigeria, given the existing employment structure, are still mostly manual, southern states are
pushing Nigeria in the right direction. Encouragingly, the South is experiencing an increase in the use of cognitive
skills, which reflects a shifting of economic production toward the new knowledge economy. The study suggests
that the demand for skilled workers and technicians is already acute and will become ever more intense as the
industrial sector becomes the dominant provider of employment; however, the technical and vocational subsector
is unable to respond to the changing labor market requirements, primarily due to inadequate resources and
institutional capacity.
7. The inefficiencies in the Nigerian skills-building system are on both the supply and the demand sides.
Specifically, the study found failures in the skills-building system due to imperfections in the skills supply market,
job market, and capital market and due to limited capacity in workforce projections and inefficiencies in the
mechanisms and institutions designed to facilitate the transition from school to work.
x
8. There are deep institutional constraints in the Technical Vocational Education and Training (TVET)
system. On the skills supply side, the study identified the following main constraints: the institutional complexity
of the education system; the lack of a comprehensive and credible system for certification of competencies; the
weak linkage between programs offered by post-basic and tertiary education institutions and the changing needs of
the labor market; the poor quality of education and service delivery at all levels (including poor learning outcomes,
poor infrastructure, lack of qualified teachers and learning materials); and weak systems governance and quality
assurance mechanisms.
9. In summary, the main challenges of the skills development system in Nigeria are (a) severe constraints on
staffing, facilities, and equipment resulting in exceedingly low equitable access and quality; (b) extremely low
external efficiency due to the absence of linkages between curriculum design and labor market information (LMI),
especially from industry and enterprises; (c) gender inequity; (d) a shortage of well-qualified technical and
vocational education teachers and inadequate professional development; and (e) weak institutional capacity at the
federal and state levels.
Introducing a new skills development framework for Nigeria
10. This policy note proposes a comprehensive strategy for improving Nigerian skills development system.
The vision is to reposition Nigeria’s skills and vocational education to support the country’s growth. Clearly, the
demands for skills development need to encompass both the formal and informal sectors. The informal sectors
present new challenges as a huge proportion of workers are in this area—which for the most part has not been
addressed in the traditional skills framework. The formal side of skills development encompasses TVET providers
from both the public and private sectors. The public side covers the technical colleges, as well as polytechnics and
mono-technics at the state and federal levels. On the informal side, the providers include the programs that support
the short-term and focused training, especially for the youth who are not in school and are unemployed. The
demands of the workplace are changing rapidly. While agricultural and nonfarm self-employment in the informal
sector still play the largest role in Nigeria’s economy, the strategy proposes to expand nonfarm employment such
as trading and retail; small and medium enterprises (SMEs); infrastructure; banking and finance; and modern
information and communication technology (ICT) sector development. The main element of the transformation
agenda consists of a TVET framework, as broadly defined earlier, implemented through specific enabling policy
initiatives for immediate and medium-term implementation.
Why a new skills development framework?
11. A stigma is attached to vocational training—a phenomenon that is prevalent not only in Nigeria but
worldwide, including in some developed economies. Thus, TVET is seen as a second-rate choice. A new skills
development framework is needed to take account of (a) improving relevance of TVET programs by aligning
training to skills needs in priority sectors; (b) reforming system and institutional governance to strengthen the
certification and accreditation systems and the role of the private sector among others; and (c) ensuring strong
foundational skills in education to ensure that students going to TVET have the necessary competencies to succeed.
Although many students and their parents believe that vocational training is more helpful than academic tracks in
finding work after school, the reality is that the enrolment and completion rates in Nigeria’s technical schools are
very low in comparison to the academics-oriented schools.
12. Today fewer than 184,000 students annually complete TVET programs in Nigeria, and these numbers have
not increased over the last decade. In relation to the total needs of the formal and informal economy of Nigeria,
these are far too little. For instance, there are currently more than 19 million Nigerians in the nonagriculture self-
employed sector, and another 9 million nonagriculture wage sector where technical and vocational skills are in
demand (Jobs Study, World Bank 2015). Despite the small number, many of the graduates do not find jobs in the
area of training. Yet, employers indicate that they cannot find the people they need. Thus, it is important to embark
on a campaign to change students’ and parents’ views of vocational training. Parents and students as well as the
community in general should be shown that the college or post-basic academic track is not necessary to get a job
with a good salary and that skills-oriented jobs have excellent long-term prospects.
xi
Key policy recommendations
13. This policy note lays out five sets of short- and medium-term policy actions for the Nigerian leadership
and stakeholders to consider and discuss.
First policy recommendation: Build strong foundations in basic education
14. The findings from this policy note show that the literacy and numeracy levels of basic education graduates
in Nigeria are very low—in fact, the completion of primary school does not necessarily mean that students are able
to read and add numbers. At the national level, 60 percent and 44 percent of students, after completing primary
grade 4 and grade 6, respectively, cannot read a complete sentence. The message for policy is clear: the Nigerian
basic education system needs to be upgraded to a minimum level to set the foundations for post-basic TVET not
only for cognitive but also for noncognitive skills.
Short-term actions: The key actions to deliver results are as follows:
o Improve the quality of primary education through training and on-the-job support for teachers
and textbooks and learning materials provision.
o Address regional disparity through school grants and cash transfers in the northern states.
o Improve governance and increase accountability through school-based management
committees.
o Address the gender and cultural barriers through girls’ school scholarships and promotion of
integrated Quranic education.
o Expand and universalize early childhood development (ECD) programs to enhance school
readiness.
Medium-term actions:
o Review and reform the Universal Basic Education (UBE) Programme, established in 1999, so
that it would achieve its raison d’être. The early gains have now been shown to be erased, and
recent deterioration in the sector has been observed.
Second policy recommendation: Address the skills deficit of the existing ‘stock’ of workers through
informal short programs to upgrade skills for employability
15. The large cohort of people who are not in the labor force, employment or training (NEET need jobs, and
they would need specific short-term training to make them more employable. These groups include those youth who
have dropped out and have never reached secondary level.
Short-term actions:
o Support for the expansion of programs for this large cohort of the NEET group, especially
labor-intensive public works programs with the view to activating labor and providing
subsequent opportunities for apprenticeship or transitioning them into the formal skills
development system and thereby enhancing their skills for more productive work. There are
multiple programs addressing these groups such as the Bank-supported Youth Employment
and Social Support Operation programs. The key is to review those programs and expand those
that are cost-effective and able to reach the existing ‘stock’ of potential workers.
o Short-term programs similar to the Indian model of Infrastructure Leasing and Financial
Services (IL&FS) and the Jovenes programs in Latin America where short-term and low-cost
but effective training links the training to the job market. As a private venture, the IL&FS
program in India operates 18 skill schools (hubs) and 355 skill centers (spokes) in 24 Indian
xii
states offering instruction in 27 trades such as textiles, welding, hospitality, and retail; courses
are generally one to three months long at a very low cost to learners. The biggest design draw
and compelling value proposition for the IL&FS program is ‘finish the course and there is a
job waiting for you.’ This success is made possible by innovative program design—the IL&FS
program starts by securing commitments from 1,000 partner companies and enterprises to
provide job placements for trainees.
Third policy recommendation: Expand access and market relevance of the formal post-basic TVET
through the strengthening of a national post-basic TVET policy and program
16. A new national post-basic technical and vocational education program is needed to increase total enrolment
and completion in TVET institutions from the current level of 184,000 students to more than 400,000 in five years
and 1,000,000 in ten years. These targets are the minimum required to respond to the needs of the Nigerian economy
moving forward in the development of the power and infrastructure sectors, retail and wholesale trade, agro-
processing industries, light manufacturing, and finance and ICT sectors. Such targets are feasible if the TVET
sector is made a national priority for financing and policy support.
Short-term actions:
o It is recommended that a national post-basic TVET program be developed that includes support
for the existing 373 public and private technical and vocational schools in Nigeria. The
program would be implemented using successful design features such as those used in the
Science and Technology Post-Basic Education Project (STEP-B) (see Annex 4 for an overview
of the schemes). The STEP-B uses an innovative design (the first of its kind in Nigeria) and
approaches that include (a) a paradigm shift focusing on demand-driven, merit-based,
competitive funding and institutional interaction with other institutions and regulatory
agencies; (b) incentives for students to obtain innovation grants to enable them to complete
their studies—the Innovators of Tomorrow Program; (c) the promotion of 11 Science and
Technology Centers of Excellence through collaboration between universities and research
institutions in Nigeria and abroad, particularly involving the regional African University for
Science and Technology (AUST).
o Dramatically enhance vocational education curriculum and professional development for
teachers to improve learning outcomes and produce industry-ready graduates. The poor
learning outcomes in the Nigerian TVET system have profound roots in the current curriculum.
For too many students, more schooling has not resulted in more knowledge and skills. Youth
are leaving school and entering the workforce without the knowledge, skills, and competencies
necessary to adapt to a competitive and increasingly globalized economy. Further, learning
outcomes (typically measured with regard to reading and numeracy skills) are only a small part
of what makes an individual’s human capital. The knowledge and competencies that help
people live healthy, productive, satisfying lives are much broader. Social, communication,
teamwork, critical thinking, and problem-solving skills are invaluable for people to function
well at home, in their communities, and at work. Specific technical or vocational skills related
to an occupation are also important for success in the labor market. Cognitive and noncognitive
skills matter greatly in determining labor market outcomes.
o Expand internship and apprenticeship by enhancing the role of the National Youth Corps
(NYC) as a key program to enhance the job experience of young entrants into the labor force.
The framework of the NYC should be expanded not only providing internship and
apprenticeship but also deepening its relationships with the private sector, identifying
structures to facilitate the transitions from school to full time jobs, and providing LMI. The
NYC should also identify and provide incentives for the private sector to participate more
actively in the NYC programs.
xiii
Medium-term actions:
o Create policy incentives to scale up new-economy skills. Nigeria has undergone a quiet
revolution in ICT; investments of more than US$10 billion by private investors and operators
over the last two decades resulted in expansion of ICT infrastructure. The country is now in a
position to grow its new-economy sectors, become a dynamic player in the global market for
IT and IT-enabled services, and create quality jobs for youth. A necessary prerequisite is
human capital that meets global standards. New economy skills for young population of
graduates to take advantage of included, among others, such as online outsourcing of global
jobs, business process outsourcing (BPO), learning online through massive open online courses
(MOOCs), and modern skills in digital fabrication (Fab Labs, see Annex 6).
Fourth policy recommendation: Strengthen the job accreditation and certification and expand
opportunities for school to work transitions through job market information and facilitation
Short-term action:
o Accelerate and finalize the preparation of the National Vocational Qualification Framework
(NVQF) through a more inclusive process, by including the private industry and professional
associations in defining the framework of common grid of skills and qualifications. An
appropriate regulatory and institutional framework is a precondition for the long-term
development of a demand-oriented, efficient, and relevant TVET system. While the National
Board of Technical Education (NBTE) has taken first steps to create a National Vocational
Qualifications Framework (NVQF), the process needs to be accelerated and made more
inclusive with regard to skills development institutions. This certification system provides a
comprehensive qualification of education, training, and vocational qualifications available.
Such qualifications framework needs to also address granularly defined skills in various trades
for the workforce in the informal sector—which comprise the largest group of Nigeria’s
workers who are trapped in low productivity. In doing so, it will be important to learn from
successful initiatives in implementing the NVQF from comparator countries such as South
Africa’s Skills Education Training Authorities (SETAs) and Brazil’s National Service for
Industrial Training (SENAI) (see the next recommendation below). Defining job qualifications
should involve the employers, especially from the private sector. An example of how such a
system works is that of South Africa’s SETA. The SETAs have been established to manage
many skills development needs and training for at least 23 sectors, each sector having its own
SETA—and where a sector is made up of economic activities that are linked or related— for
example, an SETA that deals with agricultural sector, or manufacturing sector, or banking
sector. The government collects the training levies, and the management of training is
delegated to each SETA. SETAs are concerned with learnerships, internships, defining the
learning program-type matrix and unit-based skills program.
o Implement the new National Vocational Qualifications Framework to improve job
accreditation and certification. The NVQF provides a common grid of skills and qualifications
that will provide an understanding of the job progression routes between different trades and
fields, learning in initial and further education, and qualifications obtained from formal and
informal education and training.
Medium-term action:
o Expand the role of the National Directorate for Employment (NDE) in providing up-to-date
labor market information. Nigeria lacks an effective labor market information system (LMIS)
due to the absence of coherent government policies and actions in support of such a system.
Today, no institutional framework exists for the continuous collection, collation, analysis, and
dissemination of labor market information. Timely time series data that are available to central
agencies for the purpose of macroeconomic management could be made more widely available
for planning and policy formulation in human resource development. Without information on
employers’ skills needs, market conditions, and returns to certain types of work, the providers
xiv
cannot make good choices about what programs to develop and offer. And potential workers
will not have source of information for jobs. Specific initiatives like the Access Nigeria Jobs
Information System (ANJIMS), which was successfully tested in Nigeria, could provide some
lessons for developing platforms for linking jobs with training and skills. The overall goal of
the ANJIMS (http://www.anjims.org.ng) is to make graduates of Nigeria readily
employable and to ensure job placement. This uses a mobile interactive platform where these
candidates can be showcased to potential employers. These programs provides information that
improves the efficiency of the jobs matching process.
Fifth policy recommendation: Expand the role of the private sector and non-state actors, and
provide incentives for private sector provision of skills
17. Public-private partnerships (PPPs) between public TVET providers and industry, as a mechanism to expand
access and improve TVET quality, are gaining traction in Nigeria. Two types of collaboration are needed: the first
focuses on partnerships between TVET public providers and the industries that are expected to drive Nigeria’s
economic growth in the coming two decades; the second is private-sector TVET provision. Employers and state and
non-state TVET providers need to step actively into each other’s worlds and interact intensively and often. The
private industry needs to be actively involved in the development of curriculum so that skills are produced efficiently
and addressing their needs.
Short term actions:
o Expand public private partnerships (PPP) in the provision of technical vocational education
similar to the successful pilots in the Lagos Eko Project where several private companies set
up joint technical academies within the campuses of existing government technical colleges.
The pilots have shown that skills in specific trades were jointly defined with the partner private
sector and have resulted in high employment rates of the graduates of these academies—in
electronics, mechatronics, electrical trades, and automechanics.
o Enable private sector provision of technical and vocational education through incentives and
enabling regulations to expand private sector provision. These enabling incentives such as tax
breaks and financing would help private sector open more innovation centers, skill centers, as
well as private technical colleges and technical institutes. Currently there are private sector-
driven institutions such as the innovation enterprise institutions and vocational enterprise
institutions that will need to expand to provide industry-specific competencies in such
competencies like communications, oil and gas, fashion, hospitality, entertainment,
construction, and welding sectors.
o Improve the Industrial Training Fund. The Industrial Training Fund (ITF) needs to be
revitalized and given a new focus to achieve its mandate to support technical and vocational
training with strong involvement of private sector and employers. Successful models exist
elsewhere in the world; the SENAI (National Service for Industrial Training, a fully private
sector-owned organization program in Brazil is a comparable program, where the training
levies are collected by the government and passed on to the SENAI, which manages the entire
public and private system of technical training. In the case of the ITF, the management of the
training itself is with the ITF agency. Brazil is just a little bigger than Nigeria with regard to
population (Brazil has 200 million people and Nigeria 174 million) and, like Nigeria, has a
federal system of government. The SENAI is currently training more than 2.3 million trainees
in 817 schools and technology centers in 28 industrial areas in Brazil. This is the scale at which
Nigeria needs to develop to catch up with skills development in support of the country’s
economic growth.
- 1 -
CHAPTER 1. THE NIGERIAN LANDSCAPE IN JOBS, EDUCATION AND SKILLS
A. Introduction
Accelerating Nigeria’s economic growth and poverty reduction
1. Nigeria has the world’s 26th largest economy and Africa’s largest, with a gross domestic product (GDP) of
US$510 billion in 2010. The country has risen to become one of Africa’s economic powerhouses, and during the last
ten years, it has grown consistently at over 6 percent annually. Projections show that Nigeria has the potential to grow
at more than 7 percent annually in the coming decade if it can overcome existing barriers to achieving its ambition
to become a top-20 economy in the world by 2020. At this growth rate, it is projected that Nigeria’s GDP could reach
over US$1.60 trillion by 2030. This growth could move 70 million people out of poverty and enlarge Nigeria’s
consuming class (middle income above US$7,500 per year at purchasing power parity) from 40 million in 2010 to
160 million Nigerians in 2030 (McKinsey 2014; World Bank 2014).
2. The implications of these projections are that Nigerians will need the relevant skills to support the growth of
their economy. Lessons from other economies that have experienced rapid growth in recent years suggest that
technical, vocational, and professional skills that require higher cognitive abilities will need to be produced to
support the development of infrastructure and power, construction of roads, agricultural productivity and agro-
processing, tourism, and particularly retail and wholesale trade, which have been the biggest drivers of the Nigerian
GDP.
Education and skills: Why are they so important to Nigeria’s growth and poverty reduction strategy?
3. The educational profile of the workforce is recognized to be highly positively correlated with the average
GDP per person, intended here as proxy for productivity. For this reason and for many others not directly associated
with labor productivity, there is a general benefit to the economy as a whole from increased education. The rationale
behind this is that education produces a skilled workforce through learning.
4. Nevertheless, within the context of poor-quality education, additional years spent in schools might not
translate into skills and thus into higher productivity and earnings. The investment in education in that case might not
pay off. Is the labor market creating incentives to acquire the right skills? The returns to education are a crucial issue
discussed further in Annex 8.
5. In Nigeria, education and skills are strong predictors of labor market success: Any additional year spent in
school matters. Even having an incomplete primary education means having a total monthly income 22 percent higher
than people who never attended school (Figure 1-1).
6. Returns of secondary, TVET, and tertiary education are high. People with complete upper secondary
education or TVET can expect to earn more than 80 percent and 100 percent more, respectively, than people who
never attended school. The highest return is for people with tertiary education (130 percent). The education premium
in earnings increases as the level of education increases; the premium is manifested prominently in the services sector
with high-value-added services like banking and ICT services and lowest in the agriculture sector—although the
premium is still high even there.
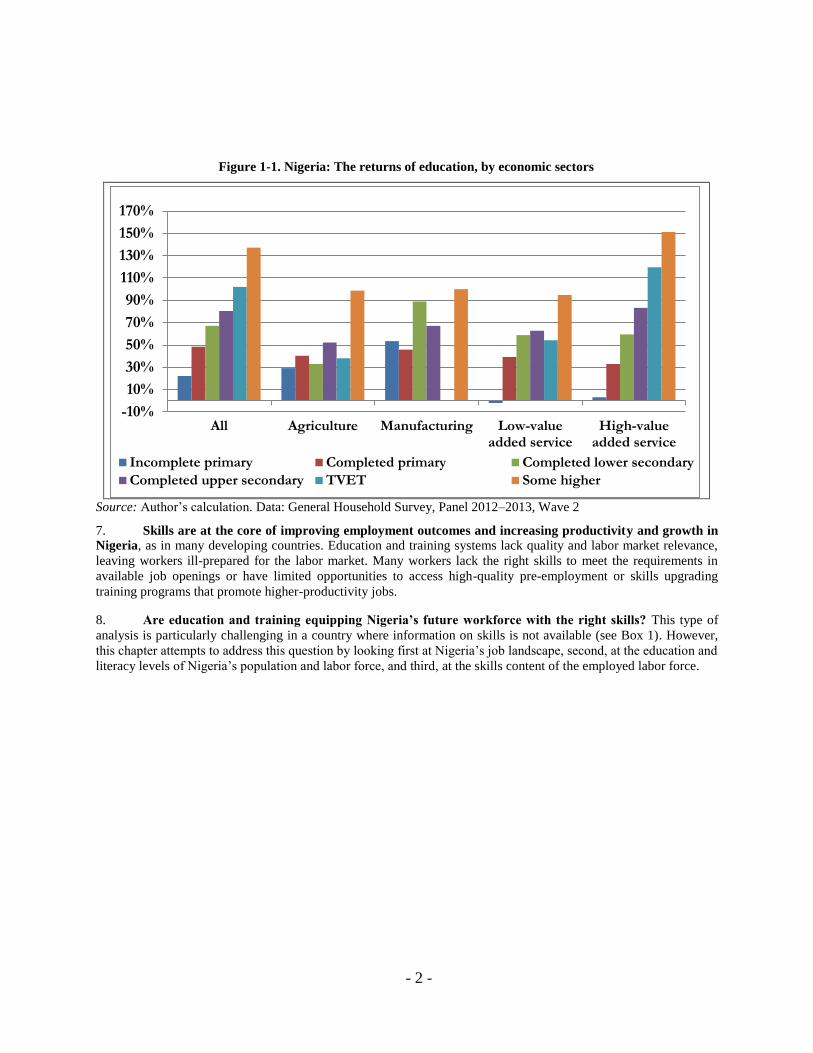
- 2 -
Source: Author’s calculation. Data: General Household Survey, Panel 2012–2013, Wave 2
7. Skills are at the core of improving employment outcomes and increasing productivity and growth in
Nigeria, as in many developing countries. Education and training systems lack quality and labor market relevance,
leaving workers ill-prepared for the labor market. Many workers lack the right skills to meet the requirements in
available job openings or have limited opportunities to access high-quality pre-employment or skills upgrading
training programs that promote higher-productivity jobs.
8. Are education and training equipping Nigeria’s future workforce with the right skills? This type of
analysis is particularly challenging in a country where information on skills is not available (see Box 1). However,
this chapter attempts to address this question by looking first at Nigeria’s job landscape, second, at the education and
literacy levels of Nigeria’s population and labor force, and third, at the skills content of the employed labor force.
Figure 1-1. Nigeria: The returns of education, by economic sectors
-10%
10%
30%
50%
70%
90%
110%
130%
150%
170%
All Agriculture Manufacturing Low-valueadded service
High-valueadded service
Incomplete primary Completed primary Completed lower secondary
Completed upper secondary TVET Some higher
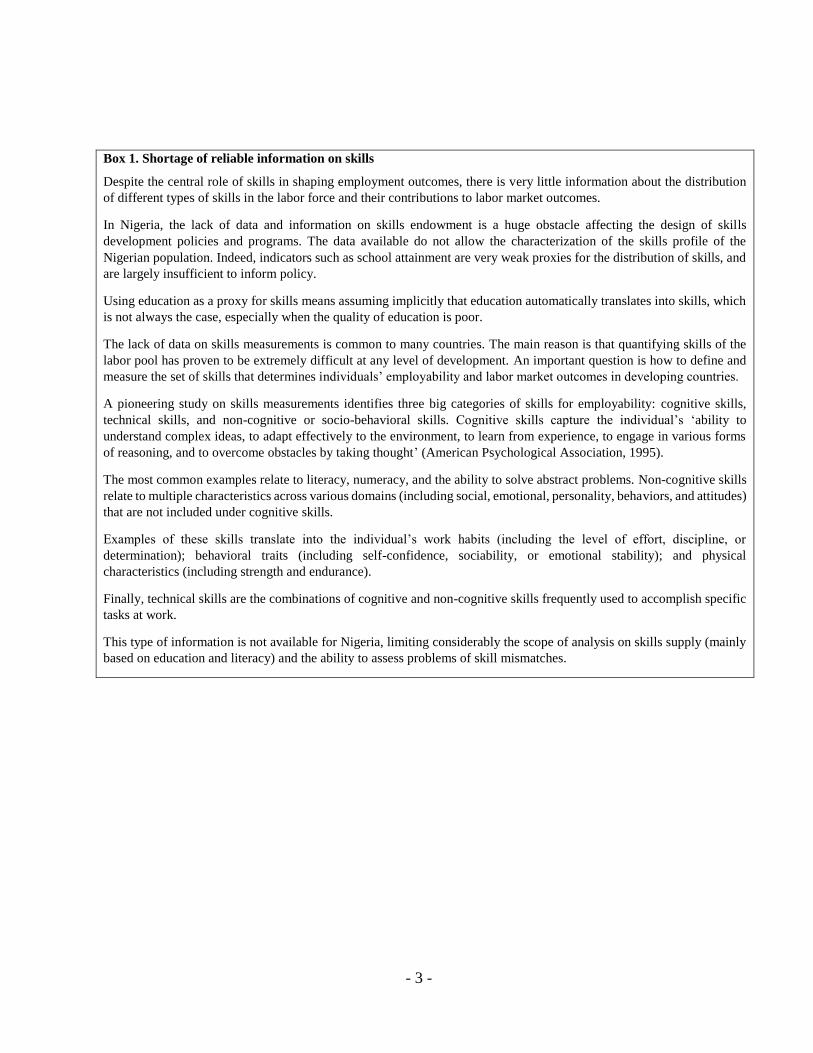
- 3 -
Box 1. Shortage of reliable information on skills
Despite the central role of skills in shaping employment outcomes, there is very little information about the distribution
of different types of skills in the labor force and their contributions to labor market outcomes.
In Nigeria, the lack of data and information on skills endowment is a huge obstacle affecting the design of skills
development policies and programs. The data available do not allow the characterization of the skills profile of the
Nigerian population. Indeed, indicators such as school attainment are very weak proxies for the distribution of skills, and
are largely insufficient to inform policy.
Using education as a proxy for skills means assuming implicitly that education automatically translates into skills, which
is not always the case, especially when the quality of education is poor.
The lack of data on skills measurements is common to many countries. The main reason is that quantifying skills of the
labor pool has proven to be extremely difficult at any level of development. An important question is how to define and
measure the set of skills that determines individuals’ employability and labor market outcomes in developing countries.
A pioneering study on skills measurements identifies three big categories of skills for employability: cognitive skills,
technical skills, and non-cognitive or socio-behavioral skills. Cognitive skills capture the individual’s ‘ability to
understand complex ideas, to adapt effectively to the environment, to learn from experience, to engage in various forms
of reasoning, and to overcome obstacles by taking thought’ (American Psychological Association, 1995).
The most common examples relate to literacy, numeracy, and the ability to solve abstract problems. Non-cognitive skills
relate to multiple characteristics across various domains (including social, emotional, personality, behaviors, and attitudes)
that are not included under cognitive skills.
Examples of these skills translate into the individual’s work habits (including the level of effort, discipline, or
determination); behavioral traits (including self-confidence, sociability, or emotional stability); and physical
characteristics (including strength and endurance).
Finally, technical skills are the combinations of cognitive and non-cognitive skills frequently used to accomplish specific
tasks at work.
This type of information is not available for Nigeria, limiting considerably the scope of analysis on skills supply (mainly
based on education and literacy) and the ability to assess problems of skill mismatches.
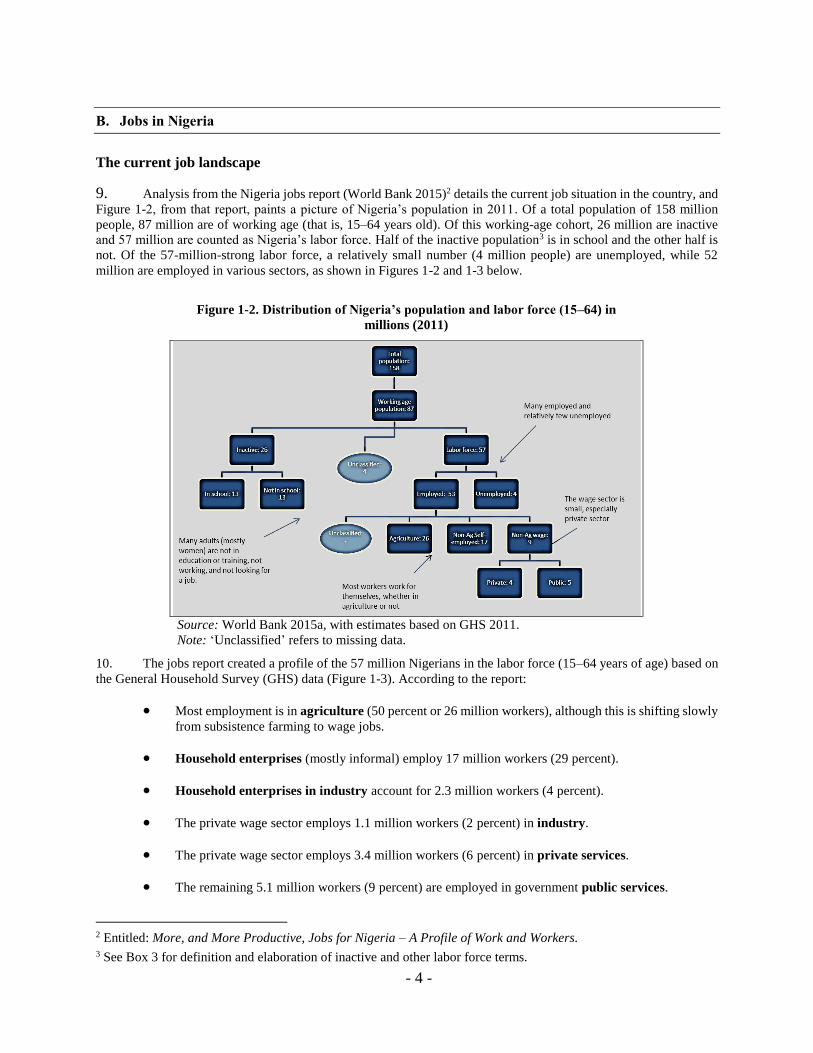
- 4 -
B. Jobs in Nigeria
The current job landscape
9. Analysis from the Nigeria jobs report (World Bank 2015)2 details the current job situation in the country, and
Figure 1-2, from that report, paints a picture of Nigeria’s population in 2011. Of a total population of 158 million
people, 87 million are of working age (that is, 15–64 years old). Of this working-age cohort, 26 million are inactive
and 57 million are counted as Nigeria’s labor force. Half of the inactive population3 is in school and the other half is
not. Of the 57-million-strong labor force, a relatively small number (4 million people) are unemployed, while 52
million are employed in various sectors, as shown in Figures 1-2 and 1-3 below.
10. The jobs report created a profile of the 57 million Nigerians in the labor force (15–64 years of age) based on
the General Household Survey (GHS) data (Figure 1-3). According to the report:
Most employment is in agriculture (50 percent or 26 million workers), although this is shifting slowly
from subsistence farming to wage jobs.
Household enterprises (mostly informal) employ 17 million workers (29 percent).
Household enterprises in industry account for 2.3 million workers (4 percent).
The private wage sector employs 1.1 million workers (2 percent) in industry.
The private wage sector employs 3.4 million workers (6 percent) in private services.
The remaining 5.1 million workers (9 percent) are employed in government public services.
2 Entitled: More, and More Productive, Jobs for Nigeria – A Profile of Work and Workers. 3 See Box 3 for definition and elaboration of inactive and other labor force terms.
Figure 1-2. Distribution of Nigeria’s population and labor force (15–64) in
millions (2011)
Source: World Bank 2015a, with estimates based on GHS 2011.
Note: ‘Unclassified’ refers to missing data.

- 5 -
Areas and sectors of likely demand for skills
11. The Nigeria Profile of Work and Workers Report (World Bank 2015) also indicates the areas and sectors
where jobs are likely to be created in the near future.
12. Employment will be mostly in agriculture and (mostly informal) household enterprises. The jobs report
indicates that in the immediate term, while the skills demands will still be largest in the farming sector, the nonfarm
sector is gaining significance. About 27 million (50 percent) of the Nigerian workforce are engaged in farm
employment, followed by 17 million (29 percent) in household enterprises in off-farm self-employment. Most of the
household enterprises are very small and informal: 80 percent are one-person activities and less than 3 percent have
five employees or more. These enterprises provide retail trade and personal services, and some are venturing into
manufacturing goods and cater to consumers and not to other businesses.
13. Wage employment is small (about 4.4 million or 8 percent of the labor force in private wages in services
and in industry) but rapidly growing and is increasing in the South-West region and especially in metropolitan Lagos.
Wage employment is also concentrated in small informal firms, although the largest share of wage employment is in
the public sector in areas of public administration, education, and health, where some 5 million (9 percent) of Nigeria’s
57-million force are working. Most Nigerians work in informal jobs, defined as wage workers working without
contract and self-employed/household enterprise workers in firms not registered with authorities. About 96 percent of
the self-employed work on their own farm and 84 percent of the self-employed working in the nonfarm sector are not
registered with authorities.
A look at the future demand for skills
14. The 40 million jobs that need to be created in Nigeria between 2010 and 2030 will be determined by the
performance of the country’s main economic sectors. The recent economic forecast from McKinsey (2014) shows that
Nigeria has the potential to build on the record of consistent growth that it has established in 2001–2013 and achieve
significant reductions in poverty. By capitalizing on its strengths and positioning itself to take advantage of emerging
global trends, Nigeria potentially could triple its GDP by 2030, easily becoming a top-20 economy (up from 26th
today). There could also be significant progress in the effort to reduce poverty. If growth can be made more inclusive,
Figure 1-3. Employment by sector, population aged 15–64 (1999, 2007, and
2011 (percent)
Source: More, and More Productive, Jobs for Nigeria – A Profile of Work and
Workers (2015).
- 6 -
Nigeria could help lift 70 million people out of poverty and move nearly 120 million above the empowerment line4
by 2030 (McKinsey 2014).
15. The growth of the economy will require skills that Nigeria has to supply to reach its goal to become a top-20
economy by 2030. The McKinsey Report (2014) and the Nigeria jobs report (World Bank 2015)5 show the following
sectoral trends that will likely be important sources of employment in the medium and long term.
Agriculture and informal nonfarm household enterprises. The Nigeria jobs report indicates that in
the short term, jobs will continue to be in the household enterprises sector, which will absorb a
significant share of those leaving agriculture through self-employment. This sector is dominated by
informal enterprises. But agriculture sector will remain as the largest employer of individuals for some
time, unless growth in the nonagricultural sector becomes highly labor-intensive. Agriculture is
Nigeria’s largest sector, contributing 22 percent of GDP, according to the government’s rebased
statistics—larger than oil, which contributes 14 percent of GDP. It is also the largest employer. The
Agricultural Transformation Agenda (ATA) has moved forward with a mechanism targeted at de-
risking lending to the agricultural sector, a strategy designed to provide the singular transformational,
one-bullet solution to break the seeming jinx in Nigeria’s agricultural lending and development. Under
the ATA, markets for agricultural commodities will be strengthened through the establishment of
commodity marketing corporations around each of the commodities. The ATA also focuses on
attracting private sector agribusinesses to set up processing plants in zones of high food production, to
process commodities into food products. The McKinsey Report (2014) estimates that Nigeria could
more than double agricultural output, from US$112 billion per year in 2013 to US$263 billion by 2030.
This implies raising the annual growth rate to 5.2 percent from 2.6 percent in recent years. Large
commercial farms could also be a significant employment opportunity for a young labor force.
Commercial farms are not a major factor in Nigerian agriculture today, but they could evolve if titling
and land transfer processes are strengthened and simplified.
Trade: Retail and wholesale. Trade accounts for 17 percent of Nigeria’s GDP and 25 percent of
employment and has been the largest driver of growth in Nigeria over the past decade. This sector
includes both retail trade—selling goods to consumers—and wholesale trade, which involves selling
goods to businesses and retailers. Nigeria’s retail sector has been highly informal and fragmented,
dominated by street vendors, small shops, and open markets; however, chains of modern stores are
expanding. The growth potential of this sector has attracted investment by consumer goods makers and
retailers from around the world. According to the McKinsey Report, foreign direct investment in retail
totaled US$1.3 billion in 2011 and 2012, and the growth in the number of consuming households will
be the principal driver of growth in trade. The report forecasts 29 million Nigerians in the middle and
upper consuming classes by 2030, with these new consumers providing fresh opportunities for retailers
and manufacturers of consumer goods. Nigeria’s burgeoning consumer class will likely shift demand
for a range of food and non-food products.
Infrastructure. These are the growth areas where skills particularly in the technical vocational areas
will be strongly demanded. The McKinsey Report (2014) looked at a number of different types of
infrastructure to size the opportunities in the ‘core’ stock in a country—transportation; electricity, gas,
and steam supply; water supply and sewerage; real estate; and telecommunications. The report
examined the economic impact of both construction of infrastructure across these areas and the
operation of infrastructure. Historically, Nigeria has underinvested in infrastructure. The report
forecasts that between core infrastructure and real estate, total infrastructure investments in Nigeria
could reach US$1.5 trillion between 2014 and 2030. Infrastructure could contribute US$257 billion to
4 An analytical framework that determines the level of consumption required to fulfill eight basic needs—food,
energy, housing, drinking water, sanitation, health care, education, and social security—at a level sufficient to
achieve a decent standard of living rather than bare subsistence (McKinsey 2014). 5 Entitled: More, and More Productive, Jobs for Nigeria – A Profile of Work and Workers.

- 7 -
GDP in 2030, achieving an annual growth rate of 8.7 percent over the period. A quick look at Nigeria’s
future infrastructure growth potential as reported in the McKinsey Report is summarized below:
o Transportation infrastructure. Transportation includes roads, railways, airports, seaports, and
inland waterways. The country’s 200,000-km road network constitutes the largest infrastructure
asset, but it is severely limited compared with those of peer economies. The road density of
Nigeria, at 21 km per 100 km2, is just one-fifth that of India. The quality is often poor, with large
stretches that are either unpaved or in need of repair. The Nigerian rail system received little
investment during the latter half of the 20th century, leaving the country with less than 5,000
kilometers of rail track. The government has begun to reinvest in railways, but Nigeria has a long
way to go to catch up with its peers. The air transportation infrastructure consists of 5
international and 19 domestic airports. Substantial investment is needed to bring them into line
with international standards.
o Infrastructures in electricity, gas, and steam supply. Some 83 percent of firms surveyed by
the Bank enterprise survey (forthcoming) found electricity to be a major or very severe problem
for their business. For manufacturing firms, outages cost an average of 4.3 percent of sales, rising
to 8.5 percent for the country’s microbusinesses. The lack of reliable electricity supply in Nigeria
is one of the country’s biggest weaknesses. Installed generation capacity is 10,000 MW, but
current output is only 3,500–4,500 MW and demand is widely expected to dramatically outstrip
both. Unreliable electricity forces many businesses and households to install their own
generators, at significant cost, and reduces Nigeria’s attractiveness as an investment destination.
The power sector has recently undergone a privatization process that is intended to improve the
operations of both generation and distribution systems while increasing the energy supply and
the financial viability of the sector. The transmission grid also needs investment. Further
extension of power lines and major investment in substations are both needed. To unleash growth
potential, significant new investment is needed in generation.
o Water supply and sewerage infrastructure. Improved water supply for sanitation and safe
drinking water is necessary for Nigerian human well-being—but is also needed in agriculture,
mining, and industrial production. Only 61 percent of the population has access to an adequate
drinking water source, and just 31 percent has access to adequate sanitation. Investments in these
infrastructures are priority.
o Housing construction and real estate. A strong demand for housing is forecast for the next two
decades. Much of the housing stock is dilapidated, with widespread unsanitary conditions. The
required investment to improve housing quality and availability will only rise as the population
grows and more people move to urban areas. Nigeria has an estimated 200 million m2 of real
estate, of which 160 million m2 is residential, 30 million m2 is commercial space, and 10 million
m2 is industrial. On a per capita basis, Nigeria’s housing stock is one-third to one-sixth the levels
in Indonesia. A particular challenge is housing Nigerians at the bottom of the economic pyramid.
A number of efforts, including the National Housing Policy (2006), have been made to improve
housing stock, but the shortage of housing has not been reduced significantly.
o Telecommunications and ICT. The telecommunications sector has been growing rapidly in
recent years and, according to the rebased data, has been a significant contributor to GDP growth.
However, there is a need for further investment to address huge demand, which often can
overwhelm existing infrastructure. South Africa, for example, has four times as many base
stations as Nigeria, despite a much smaller population. There is much potential to expand access.
Despite recent improvements in access, many Nigerians still do not have basic telephone service.
And, although it is growing, mobile penetration is only 72 percent, compared with 140 percent
in South Africa in 2013. Around 30 percent of Nigeria’s population had Internet access in 2013,
and much of that was at sub-broadband speeds. Nigeria has a large need for investment in telecom
infrastructure.
- 8 -
Finance and banking services. Nigeria’s banking and financial services have been growing rapidly in
the last 10 years and will continue to play a strong role in the economy—4 of the top 10 banks in Africa
are Nigerian and many have regional presence. Based on data from McKinsey (2012), financial services
could add 2.2 million new stable jobs between 2010 and 2020, roughly 30 percent of the new stable
jobs in the country.
Manufacturing. Nigeria’s manufacturing sector is currently dominated by businesses in the regional
processing and energy- and resource-intensive subsectors. These industries make up 92 percent of
manufacturing GDP, showing that Nigeria has few labor-intensive industries and that innovation-based
industries have not yet developed. To further develop manufacturing, the Nigerian Ministry of Industry,
Trade, and Investment has set a target of significantly increasing manufacturing GDP by 2017. To
pursue this goal, the ministry has launched the Nigeria Industrial Revolution Plan, which aims to focus
expansion efforts on manufacturing sectors in which Nigeria has competitive and comparative
advantages. Phase 1 focuses on building up four industries: palm oil, textiles, basic metals, and
automobiles.
Oil and gas. Oil and gas account for more than 90 percent of exports, providing the foreign capital to
purchase food and manufactured goods from abroad. While Nigeria’s oil and gas industry is no longer
the country’s largest sector, it continues to play a vital role. Taxes on the sector generate the vast
majority of government revenue, making the health of oil and gas a factor in everything, from national
security to schools. The sector has struggled in recent years. While many of Nigeria’s assets have low
geological costs, the country may not be as competitive in attracting investment as it has been in the
past. Estimates suggest that oil production declined by 7 percent between 2011 and 2013, from 2.52
million barrels a day to 2.35 million.
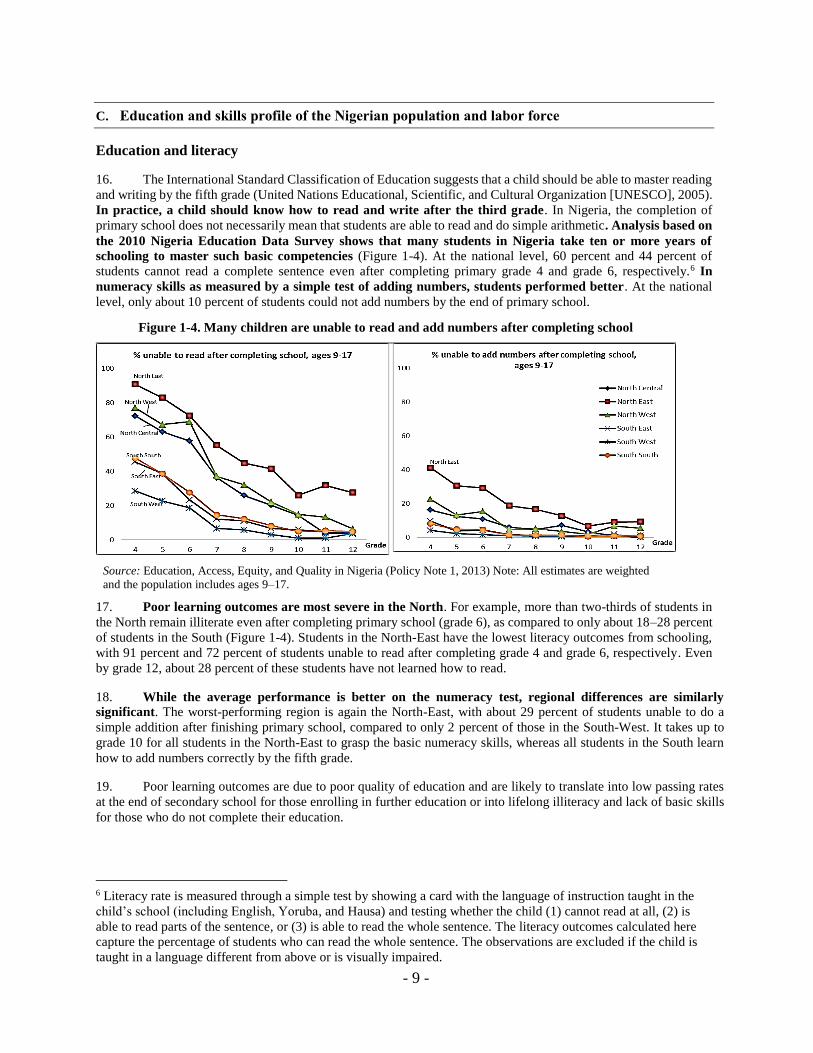
- 9 -
C. Education and skills profile of the Nigerian population and labor force
Education and literacy
16. The International Standard Classification of Education suggests that a child should be able to master reading
and writing by the fifth grade (United Nations Educational, Scientific, and Cultural Organization [UNESCO], 2005).
In practice, a child should know how to read and write after the third grade. In Nigeria, the completion of
primary school does not necessarily mean that students are able to read and do simple arithmetic. Analysis based on
the 2010 Nigeria Education Data Survey shows that many students in Nigeria take ten or more years of
schooling to master such basic competencies (Figure 1-4). At the national level, 60 percent and 44 percent of
students cannot read a complete sentence even after completing primary grade 4 and grade 6, respectively.6 In
numeracy skills as measured by a simple test of adding numbers, students performed better. At the national
level, only about 10 percent of students could not add numbers by the end of primary school.
17. Poor learning outcomes are most severe in the North. For example, more than two-thirds of students in
the North remain illiterate even after completing primary school (grade 6), as compared to only about 18–28 percent
of students in the South (Figure 1-4). Students in the North-East have the lowest literacy outcomes from schooling,
with 91 percent and 72 percent of students unable to read after completing grade 4 and grade 6, respectively. Even
by grade 12, about 28 percent of these students have not learned how to read.
18. While the average performance is better on the numeracy test, regional differences are similarly
significant. The worst-performing region is again the North-East, with about 29 percent of students unable to do a
simple addition after finishing primary school, compared to only 2 percent of those in the South-West. It takes up to
grade 10 for all students in the North-East to grasp the basic numeracy skills, whereas all students in the South learn
how to add numbers correctly by the fifth grade.
19. Poor learning outcomes are due to poor quality of education and are likely to translate into low passing rates
at the end of secondary school for those enrolling in further education or into lifelong illiteracy and lack of basic skills
for those who do not complete their education.
6 Literacy rate is measured through a simple test by showing a card with the language of instruction taught in the
child’s school (including English, Yoruba, and Hausa) and testing whether the child (1) cannot read at all, (2) is
able to read parts of the sentence, or (3) is able to read the whole sentence. The literacy outcomes calculated here
capture the percentage of students who can read the whole sentence. The observations are excluded if the child is
taught in a language different from above or is visually impaired.
Figure 1-4. Many children are unable to read and add numbers after completing school
Source: Education, Access, Equity, and Quality in Nigeria (Policy Note 1, 2013) Note: All estimates are weighted
and the population includes ages 9–17.

- 10 -
20. Looking at the GHS data, illiteracy is not limited to those who never attended school.7 In addition, there are
no significant differences between the literacy rate of the population and labor force (Figure 1-5). Nearly 77 percent of
the labor force who never attended school are illiterate. Nearly 10 percent of those with primary education are illiterate.
This more optimistic picture is likely to be due to the fact that because this is a self-reported measure, and individuals
might overestimate their real reading abilities.
21. The share of the population who is illiterate in the northern states is between two and three times the
share in the southern states. In 2011, nearly 49 percent of the population in the North-West were illiterate, and in
states such as Katsina more than 60 percent of the 15–64-year-old population were illiterate (see Figure 1-6 and Box
2).
22. Over the past three generations, illiteracy has been decreasing in all states, and in particular in the
southern states. In some of the northern states, more specifically in Kebbi, Katsina, Kano, Bauchi, and Gombe, the
illiteracy rate persists at over 40 percent among the youngest (15–24 years old) as well as the oldest (55–64 years old)
(see Annex 1, Tables A1-3 and A1-4, and Figure A1-2).
7 In 2010–2011 GHS, literacy is defined as being able to read/write in any language.
Figure 1-5. Population and labor force literacy rate by education level (15–64-year-old population,
2011)
Source: Author’s calculation. Data: GHS 2010–2011.
75.0
10.1 3.0 2.3 1.2
76.7
10.3 4.4 1.9 0.9
0%
20%
40%
60%
80%
100%
Never
att
en
ded
sch
oo
l
Pri
mary
Jun
ior
Seco
nd
ary
Sen
ior
Seco
nd
ary
Tert
iary
Never
att
en
ded
sch
oo
l
Pri
mary
Jun
ior
Seco
nd
ary
Sen
ior
Seco
nd
ary
Tert
iary
Population Labor ForceLiterate Illiterate

- 11 -
Figure 1-6. Share of illiterate population by geopolitical zone 8 (2009 and 2011)
Source: Author’s calculation. Data: GHS 2009–2010 and 2010–2011.
Figure 1-7. Illiteracy rate by states (15–64-year-old population, 2011)
Source: Author’s calculation. Data: GHS 2010–2011.
23. Most of the illiterate labor force (41 percent) is concentrated in agriculture and mining and less in the
high-value-added services (7 percent) (Figure 1-8, Panel A). This pattern reflects the educational composition of the
economic sectors. In fact, nearly half of the employees in the agriculture sector never attended school. Similarly, the
illiterate members of the labor force are more likely to work in low-skill occupations (38 percent of illiterate) than in
high-skill occupations (nearly 7 percent) (Figure 1-8, Panel B).
45.1
56.8 54.9
23.727.5 25.8
37.2
44.948.7
14.5
22.519.4
0
10
20
30
40
50
60
NC NE NW SW SE SS
2009 2011

- 12 -
Figure 1-8. Share of illiterate population by economic sector (Panel A) and occupation (Panel B)
Panel A Panel B
Source: Author’s calculation. Data: GHS 2009–2010 and 2010–2011.
Note: Figures based on employed population only.
24. Between 2009 and 2011, the illiterate labor force employed in manufacturing increased by nearly 10
percentage points. This reflects the increase in the labor force of those who never attended school but were employed
in the manufacturing sector.
Figure 1-9. Illiteracy rate across states (15–64 years old, 2011)
25. The question is whether higher illiteracy rates are due to lower educational attainment and whether the same
level of educational attainment generates the same level of literacy skills in different states. Figure 1-10 displays the
share of illiterate population with primary education and those with junior secondary or higher education, and it shows
that (a) in general, education and literacy are correlated: on average, states with higher educational attainments tend to
have higher literacy rates;(b) there, however, is substantial variation across states in the size of literacy gaps by levels
0
10
20
30
40
50
60
70
Kats
ina
Kan
o
Bau
ch
i
Go
mb
e
Kw
ara
Keb
bi
Jig
aw
a
Za
mfa
ra
Nassara
wa
Ad
am
aw
a
Ta
rab
a
Kad
un
a
Ko
gi
Yo
be
Pla
teau
Eb
on
yi
Nig
er
Ben
ue
Bo
rno
So
ko
to
Cro
ss
Riv
er
Imo
En
ug
u
FC
T A
bu
ja
Bayels
a
Ed
o
On
do
Delt
a
Riv
ers
Og
un
Oyo
Ek
iti
An
am
bra
Osu
n
Ab
ia
Akw
a Ib
om
La
go
s
Box 2. Illiteracy rates across states: Being at school and being illiterate
As mentioned above, there is significant heterogeneity with regard to education attainments as well as literacy across
geopolitical zones (Figure 1-9). In some northern states such as Katsina, Kano, Bauchi, Gombe, Kwara, and Kebbi,
more than half of the population is illiterate, while in Lagos, Akwa Ibom, and Abia, less than 15 percent of the
population could not read.

- 13 -
of educational attainment; and (c) in those states where education attainment is lower, education is also less effective
in providing students with basic literacy skills.8
Figure 1-10. Illiteracy gap by education level across states (16–64 age group, 2011)
Source: Author’s calculation, GHS 2010–2011.
Improvements in the education level of Nigerians
26. In the last three decades, the Nigerian population has become more educated. In 2011 the difference in
educational levels across age groups was huge (Figure 1-11).9 Among the youngest age group, the percentage of
people who had never attended school was 24 percentage points lower than the oldest generation.
27. The dramatic changes in education bring more out-of-school children to school, and more students are
accessing secondary education. About 44 percent of those in the youngest group (15–24 years old) now complete
senior secondary education as compared to only 17 percent of those 45–64 years old (Figure 1-11).
8 Notably, the small share (that is, sample size) of people with higher education in some of the poorest/low-educated
states might increase the relevance of measurement errors in the education variable. This might inflate the illiteracy
gap (that is, overestimate the share of people with higher education who are illiterate).
9 Notably, the “never attended school” group also includes those with incomplete primary education, if not
differently specified.

- 14 -
Figure 1-11. Education composition by age groups (15–24; 25–34; 35–44; and 45-54, 2011)
Source: Author’s calculation. Data: GHS 2010–2011.
28. The long-term trend showed in Figure 1-11 persists in more recent years, as shown in the change in the
educational level between 2009 and 2011 (Figure 1-12).
Country moving at two speeds
29. Education levels vary substantially between the North and South and between geopolitical zones and states. A
huge gap in education levels exists between the North, where most of the population does not attend school, and
the South, where most of the population holds a secondary education diploma or higher. Thus, an immediate
challenge is how to accelerate educational levels in the northern regions so that they can catch up with the speed of the
southern regions.
22
10
18
44
5
32
16
4
35
14
36
22
4
25
14
46
23
2
17
13
0
10
20
30
40
50
Never attendedschool
Primary Junior SecondarySenior Secondary Tertiary15-24 25-34 35-44 45-64
Figure 1-12. Education composition of Nigerian population (15–64 age group, 2009
and 2011)
Source: Author’s calculation. Data: GHS 2010–2011.
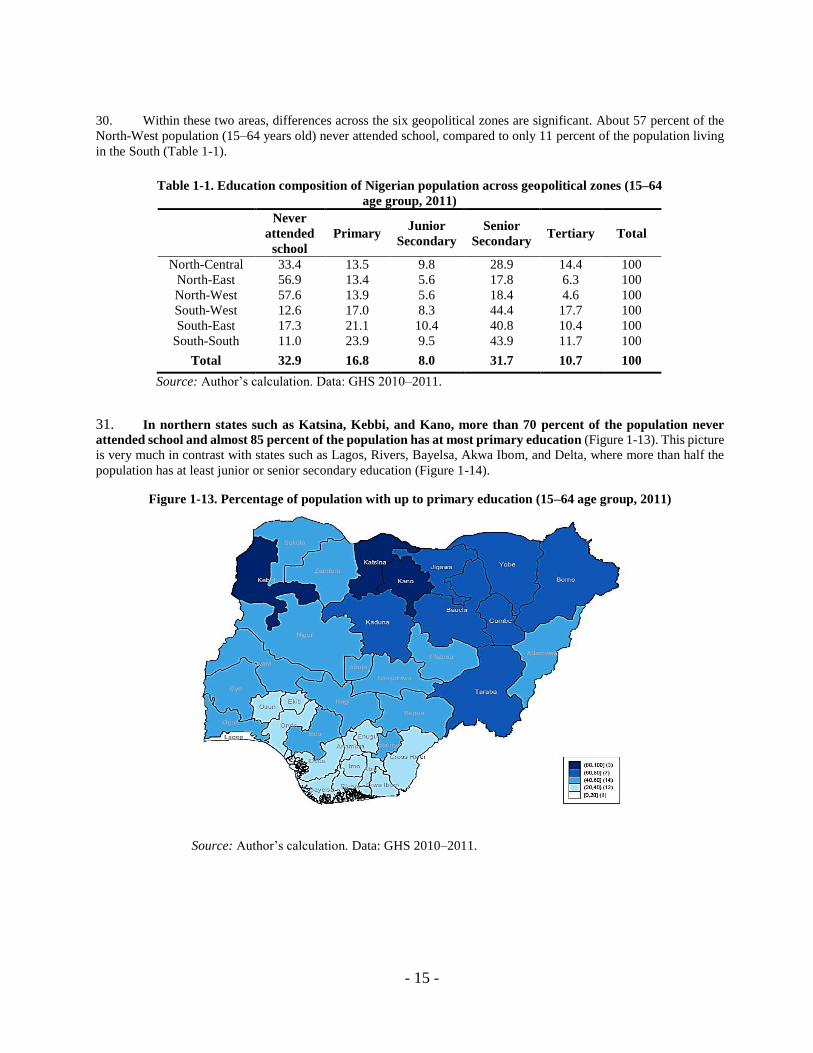
- 15 -
30. Within these two areas, differences across the six geopolitical zones are significant. About 57 percent of the
North-West population (15–64 years old) never attended school, compared to only 11 percent of the population living
in the South (Table 1-1).
31. In northern states such as Katsina, Kebbi, and Kano, more than 70 percent of the population never
attended school and almost 85 percent of the population has at most primary education (Figure 1-13). This picture
is very much in contrast with states such as Lagos, Rivers, Bayelsa, Akwa Ibom, and Delta, where more than half the
population has at least junior or senior secondary education (Figure 1-14).
Figure 1-13. Percentage of population with up to primary education (15–64 age group, 2011)
Source: Author’s calculation. Data: GHS 2010–2011.
Table 1-1. Education composition of Nigerian population across geopolitical zones (15–64
age group, 2011)
Never
attended
school
Primary Junior
Secondary
Senior
Secondary Tertiary Total
North-Central 33.4 13.5 9.8 28.9 14.4 100
North-East 56.9 13.4 5.6 17.8 6.3 100
North-West 57.6 13.9 5.6 18.4 4.6 100
South-West 12.6 17.0 8.3 44.4 17.7 100
South-East 17.3 21.1 10.4 40.8 10.4 100
South-South 11.0 23.9 9.5 43.9 11.7 100
Total 32.9 16.8 8.0 31.7 10.7 100
Source: Author’s calculation. Data: GHS 2010–2011.

- 16 -
Figure 1-14. Percentage of population with secondary education (15–64 age group, 2011)
Source: Author’s calculation. Data: GHS 2010–2011.
Figure 1-15. Percentage of population with tertiary education (15–64 age group, 2011)
Source: Author’s calculation. Data: GHS 2010–2011.
32. In Table 1-2, we compare the educational composition of different age groups (25–34 versus 35–44 in Panel
A and 25–34 versus 45–54 in Panel B) to have a sense of the change in educational attainments in Nigerian states over
the span of one and two generations, respectively.
33. As mentioned above, most of the differences show up at a very low (or no) education level and at the secondary
level in all geopolitical zones. The percentage of population who never attended school decreased significantly
everywhere, though it happened at two speeds. When comparing the 25–34-year-olds with the 45–64-years-olds
(Table 1-2, Panel B), the increase in secondary education has been huge in the southern zones (South-East and South-

- 17 -
South). The North-West is struggling to improve educational attainments; after a slight improvement in the past decade
(Panel B), it is not progressing anymore.
Table 1-2. Change in educational composition, comparing across cohorts (2011)
Panel A: 25-34 versus 35-44 years old Panel B: 25-34 versus 45-64 years old
Never
attended
school
Primary Secondary Total
Never
attended
school
Primary Secondary Total
NC −6.8 −3.8 13.7 −3.1 NC −23.2 2.0 23.6 −2.4
NE −5.1 −1.2 8.0 −1.6 NE −15.1 4.6 12.8 −2.3
NW 0.7 1.3 0.8 0.2.9 NW −5.6 1.6 4.5 −0.5
SW −6.0 −8.4 9.6 4.9 SW −17.6 −12.8 26.0 4.4
SE −11.0 −12.6 20.2 3.4 SE −33.6 −20.2 43.8 10.1
SS −4.7 −15.9 19.8 0.8 SS −19.5 −13.6 31.6 1.7
Source: Author’s calculation. Data: GHS 2010–2011.
Note: NC: North-Central; NE: North-West; NW: North-West; SW: South-West; SE: South-East; SS: South-South.
34. A conclusion from these figures is that raising the quality of the skills provided at the secondary level is crucial
to enhance a virtuous circle between education and labor market provisions and demand of good skills.
35. The gender gap in education is markedly high. Females are still facing barriers to accessing primary
education and reaching secondary and higher levels of education, though gender equality is increasing over time.
Figure 1-16 shows the gender gap in 2011, defined as the difference between the proportion of women and men
achieving each education level, for the four age groups. Among the youngest generation (15–24 years old), 19 percent
of men versus 26 percent of women never attended schools, a 6.8-point gender gap. This gap is lower than for the
generation aged 25–34, where there is a 17-point gender gap (39 percent of women versus 22 percent of men). Thus,
access to basic education is increasing for both men and women, and women are catching up with their male
counterparts.
Figure 1-16. Gender gap in education composition across generations (female versus male education
attainment, 2011)
36. Similarly, more men than women complete senior secondary education (41 percent of men versus 30 percent
of women aged 25–34) and tertiary education (17 percent of men and 11 percent of women aged 25–34) (Figure 1-16).
This gap began shrinking only recently.
37. A modest increase in access to education is reflected in the labor force as well. The share of the workforce
that never attended school decreased from nearly 41 percent in 2009 to 34 percent in 2011. The educational composition
of the rest of the labor force remains essentially the same: In 2011, 21 percent completed primary education, 33 percent
held a secondary diploma (only 5 percent a junior secondary diploma), and 12 percent held an academic degree.
Source: Author’s calculation. Data: GHS 2010–2011.
-20
-10
0
10
20
Neverattendedschool
Primary JuniorSecondary
SeniorSecondary
Tertiary
(dif
fere
nce f
em
ale
-m
ale
att
ain
men
ts, %
)
15-24 25-34

- 18 -
38. The educational level of the workforce population is very heterogeneous across economic sectors (see
Figure 1-17, which lumps the economic sectors other than agriculture and mining and manufacturing into two groups:
the low/mid-value-added services10 and the high-value-added services11).
Figure 1-17. Educational composition by economic sectors (15–64-year-old population, 2009–2011)
Source: Author’s calculation. Data: GHS 2009–2010 and 2010–2011.
39. Agriculture and manufacturing are mostly dominated by workers with at most primary education (Figure 1-
17, Panel B). Nevertheless, the education level of employees in these two sectors increased substantially from 2009 to
2011. In 2009, 79 percent and 55 percent of the employees in agriculture/mining and in manufacturing, respectively,
had at least primary education, though most of them never attended school. By 2011, the employees were more
educated, especially in the agriculture and mining sectors. This result may reflect either a shift of senior secondary
graduates to low-value-added sectors (where they had a chance of finding a job) and/or an increase of access to basic
education more than a redistribution of low-educated labor force to other sectors.
40. The services sector includes a heterogeneous set of subsectors, with very distinct skill requirements. As
mentioned above, the services sector is broken down into low/mid-value-added subsectors and high-value-added
subsectors. The degree of heterogeneity is particularly high within the low/mid-value-added services (Figure 1-18).
Wholesale and retail trade, accommodations, and food services have the highest share of workers with at least primary
education, while the electricity and gas sectors have the highest share of degree holders.
10 Low/mid-value-added sectors include electricity, gas, steam and air conditioning supply, water supply and
sewerage, waste management, construction, wholesale and retail trade, transportation and storage, accommodation
and food services, information and communication, arts, entertainment and recreation, other service activities,
activities of households, and extraterritorial organizations and bodies. 11 High-value-added sectors include financial and insurance activities, real estate activities, professional, scientific
and technical activities, administrative and support service activities, public administration and social security,
education, human health, and social work activities.
0
10
20
30
40
50
60
Agriculture andMining
Low-Mid ValueAdded Services
Manufacturing High ValueAdded Services
Panel A: 2009 Panel B: 2011Never attended school Primary Junior Secondary

- 19 -
Figure 1-18. Educational composition by low/mid-value-added services subgroup, 2011
Source: Author’s calculation. Data: GHS 2010–2011.
41. As part of Nigeria’s growth strategy, agriculture/mining, manufacturing, and construction have been identified
as high-potential sectors. In all of these sectors, with the exception of construction, which registers about 68 percent of
the employees with secondary or higher education, the educational level of the workforce is very low. For the sectors
to be competitive, Nigeria will need to shift its production model toward more mechanization and capital intensity.
This in turn will increase demand for workers with higher levels of education to perform technical, professional, and
managerial tasks.
42. As shown in Figure 1-19, between 2007 and 2011 there was a substantial increase of workers in agriculture at
all education levels. Indeed, the share of people with primary education working in agriculture increased by 4 percent
and at the same time about 11 percent more diploma holders started working in agriculture. Conversely, there appears
to have been a shift away of workers with higher diplomas from the mining sector. Likewise, the other high-potential
sectors (manufacturing and construction) have not been able to attract a higher-qualified labor force.
25
22
14
13
5
28
17
18
35
27
34
30
47
42
33
8
28
18
4
31
0% 10% 20% 30% 40% 50% 60% 70% 80% 90% 100%
Wholesale, Retail Trade, Accommodation andFood Services
Other Activities
Construction
Transportation, Storage, Information andCommunication
Electricity and Utilities
Never attended school Primary Junior Secondary Senior Secondary Tertiary

- 20 -
Figure 1-19. Within-sector changes in educational structure (2007–2011)
-2 -1 0 1 2
Agriculture andFishing
Mining andQuarrying
Manufacturing
Electricity andUtilities
Construction
Wholesale, Retail Trade,Accommodation and Food Services
Transportation, Storage,Information and Communication
Financial, Insurance andReal Estate Activities
Public Administration andSocial Security
OtherActivities
Never attended school
-5 0 5
Agriculture andFishing
Mining andQuarrying
Manufacturing
Electricity andUtilities
Construction
Wholesale, Retail Trade,Accommodation and Food Services
Transportation, Storage,Information and Communication
Financial, Insurance andReal Estate Activities
Public Administration andSocial Security
OtherActivities
Primary
-15 -10 -5 0 5 10 15
Agriculture andFishing
Mining andQuarrying
Manufacturing
Electricity andUtilities
Construction
Wholesale, Retail Trade,Accommodation and Food Services
Transportation, Storage,Information and Communication
Financial, Insurance andReal Estate Activities
Public Administration andSocial Security
OtherActivities
Senior Secondary
-10 -5 0 5 10
Agriculture andFishing
Mining andQuarrying
Manufacturing
Electricity andUtilities
Construction
Wholesale, Retail Trade,Accommodation and Food…
Transportation, Storage,Information and Communication
Financial, Insurance andReal Estate Activities
Public Administration andSocial Security
OtherActivities
Junior Secondary

- 21 -
Source: Author’s calculation. Data: GHS 2006–2007 and 2010–2011.
43. Despite the increase of more skilled workers in the agricultural sector, most of the agricultural employees
together with technicians (54 percent), plant workers (51 percent), and elementary workers (50 percent) have at most
primary education (Figure 1-20). Notably nearly 45 percent of the workforce employed in agriculture has never
attended school.
44. At the other extreme, in 2011 nearly 41 percent of Nigerians working as professionals held an academic degree
and 34 percent of professionals and 45 percent of clerical workers held a higher education diploma.
Figure 1-20. Education composition by occupation (2011)
Source: Author’s calculation. Data: GHS 2010–2011.
-15 -10 -5 0 5 10 15
Agriculture andFishing
Mining andQuarrying
Manufacturing
Electricity andUtilities
Construction
Wholesale, Retail Trade,Accommodation and Food Services
Transportation, Storage,Information and Communication
Financial, Insurance andReal Estate Activities
Public Administration andSocial Security
OtherActivities
Tertiary
0% 10% 20% 30% 40% 50% 60% 70% 80% 90% 100%
Skilled Agricultural
Technicians
Plant Workers
Elementary
Managers
Craft Workers
Service Workers
Profesionals
Clerical Workers
Never attended school Primary Junior Secondary
Senior Secondary Tertiary

- 22 -
45. There is a mismatch between the level of skills required by each occupation and the educational level of the
workforce employed in it. Many employees are either underqualified or overqualified for their occupations.
For example, nearly 66 percent of the employees in skilled occupations12 have secondary education or higher, and a
notable share have tertiary education (Figure 1-21). Nevertheless, about 34 percent of employees in skilled occupations
never attended school or have at most primary education. These workers are presumably underqualified for their
occupations. Conversely, about 45 percent of the employees working in low-skill occupations have senior secondary or
higher education. Thus, they are likely to be overqualified. This mismatch generates a loss of human capital, and it
signals that having senior secondary or higher education does not automatically translate into a better occupation.
D. The skills content of the current workforce
46. The rise of new technologies and their rapid diffusion have been altering the mix of jobs and skills demanded
in the workplace. As Aedo et al. (2013) note:
“a central feature of development is the changing nature of the production process of goods and
services. The mirror image of such shifting economic production is a change in occupations and,
embedded, a transformation of the types of human skills used in an economy. Occupations that
require intensively manual skills, associated with many jobs in low-machine intensity farming but also
with specific trades as well as mass manufacturing, give way to occupations requiring more cognitive
skills. Such cognitive skills include verbal ability, working memory, numeracy, and problem-solving
abilities—teachers will need these as much as computer operators would. The more modern the
economy and the more sophisticated the division of labor in production processes, the more important
are the interpersonal skills, which underlie behaviors such as teamwork, reliability, discipline, and
work effort (emphasis added).”
12 Low-skill occupations include skilled agricultural and fishery workers, craft and related trades workers, plant and
machine operators, and elementary workers. Mid-skill occupation subgroups include technicians and associate
professionals, clerks, service workers, and shop and market sales workers. Skilled occupation subgroups include
professionals and technicians.
Figure 1-21. Education composition by occupations and skills level (2011)
Source: Author’s calculation. Data: GHS 2010–2011.
20.8
22.9
20.5
13.5
27.4
29.4
3.4
5.4
4.5
35.7
34.9
38
26.5
9.5
7.6
0% 10% 20% 30% 40% 50% 60% 70% 80% 90% 100%
Skilled Occupations
Mid-Skill Occupations
Less-Skill Occupations
Never attended school Primary Junior Secondary Senior Secondary Tertiary

- 23 -
47. The introduction of computers in the workplace in the United States, for example, has decreased the demand
for skills in routine and manual tasks, while sharply increasing the demand for new-economy skills—analytical and
interpersonal skills for dealing with non-routine circumstances. Can the Nigerian education systems adjust fast
enough to help students meet these changes in the labor market?
48. Recent technological changes are also affecting developing economies, perhaps especially the fast-growing
ones. In Brazil, the skill structure of the labor force since the early 1980s shows a decline in manual skills and an
increase in routine cognitive skills. In particular, high-income groups show an evolution in their skills mix similar to
that of high-income groups in the United States. As yet, there has been no rapid increase in new-economy skills, but
more highly educated individuals have increased their new-economy skills faster than individuals with less
education. Even though the speed at which an economy adapts to technological change depends on a variety of factors,
this evidence reinforces the perception that more educated individuals will adapt faster to change and, by doing so,
contribute to technological catch-up (Levy and Murnane 2004; Luque and Moreno, forthcoming; Bruns, Evans, and
Luque 2010).
49. While an examination of educational levels provides important insights into the skill level of Nigeria’s
workforce, recent methodological innovations permit a more nuanced evaluation of the composition of these skills and
how this composition has changed over time. This approach illustrates the ‘skills content’ of the Nigerian economy or
the prevalence of certain types of skills among the Nigerian workforce. More specifically, this approach measures
whether jobs in Nigeria are moving toward or away from a ‘knowledge economy’.13 A growing, developing
economy should be more heavily reliant on the cognitive skills associated with higher-income economies than on
the manual skills associated with less-developed countries.
50. This section reveals that, given the existing employment structure, the skills required in Nigeria are still
mostly manual. Encouragingly, the use of cognitive skills is increasing, and the occupational structure in Nigeria is
in fact more intensive in new-economy skills than would be expected given Nigeria’s income level. Indeed, younger
workers are slightly less likely to work in occupations requiring manual skills than older cohorts. Interestingly, workers
with tertiary levels of education are more likely to work where cognitive skills are intensely used, but there is no
difference between graduates from primary and secondary education with regard to accessing occupations
requiring more cognitive skills.
Five categories of skills
51. Nigerian occupations are categorized according to their intensity in five broad skill categories: non-routine
cognitive analytical skills; non-routine cognitive interpersonal skills; routine cognitive skills; non-routine manual skills;
and routine manual skills (see Figure 1-22).14 These categories broadly reflect the range of skills present in an economy,
paying particular attention to the types of skills relevant to the development process as economies shift from less to
more sophisticated modes of production. Non-routine cognitive skills (both analytical and interpersonal) are most often
associated with knowledge economies, while manual skills are more typical of less-developed ones.
52. More specifically, each occupation is assessed based on two factors. First, a ‘skill content level’ is determined
for each occupation in each of the five skill categories. Second, the share of people in each occupation is assigned to
each occupation for each year analyzed to weight the score in each skill category by its prevalence in the economy.
This skill content level is based on the importance (or ‘intensity’) of a subset of skill requirements that are unique to
each skill category.15 The skill categories and the skill requirements, from which their skill content levels are derived,
are described in Figure 1-22. For example, occupations that require workers to operate machinery will score higher in
13 Powell and Snellman (2004) define a knowledge economy as “production and services based on knowledge-
intensive activities that contribute to an accelerated pace of technical and scientific advance, as well as rapid
obsolescence. The key component of a knowledge economy is a greater reliance on intellectual capabilities than on
physical inputs or natural resources.” 14 The methodology of this section builds directly on a technique developed by Autor, Levy, and Murnane (2003) and
elaborated in a recent work by Acemoglu and Autor (2010).
15 For more details on how these scores are created, please refer to Annex 9.

- 24 -
the routine manual skills category than in the non-routine cognitive analytical category (but would receive scores in all
five categories).
Source: Aedo et al. 2013, based on descriptions in O*Net (Levy and Murnane 2003) and Acemoglu and Autor
2010.
Cognitive versus manual skills
53. Figure 1-23 shows the different skills content by economic sector in Nigeria. The use of manual skills is
predominant in agriculture and mining, while high-value-added services show a high content for cognitive skills, in
particular non-routine cognitive skills (both analytical and interpersonal). An expansion of the high-value-added
services will require a labor force with more cognitive skills than an economy dominated by agriculture and
mining.
54. The skills content analysis16 reveals that the Nigerian economy is reliant on non-routine manual skills
(Figures 1.23 and 1.26). In other words, the skills required in Nigeria, given the existing employment structure,
are still mostly manual. The prevalence of manual skills has to be interpreted bearing in mind that the intensity of
manual skills, both routine and non-routine, decreases with the level of economic development (Aedo et al. 2013). As
agriculture and low-skilled manufacturing tend to contribute less to economic activity with incomes rising, so do the
skills used intensively in their production processes. This is not the case in Nigeria, which still relies heavily on manual
skills.
16 See Annex 9 for a note on the skills content analysis method used.
Figure 1-22. Skills categories used in skills content analysis
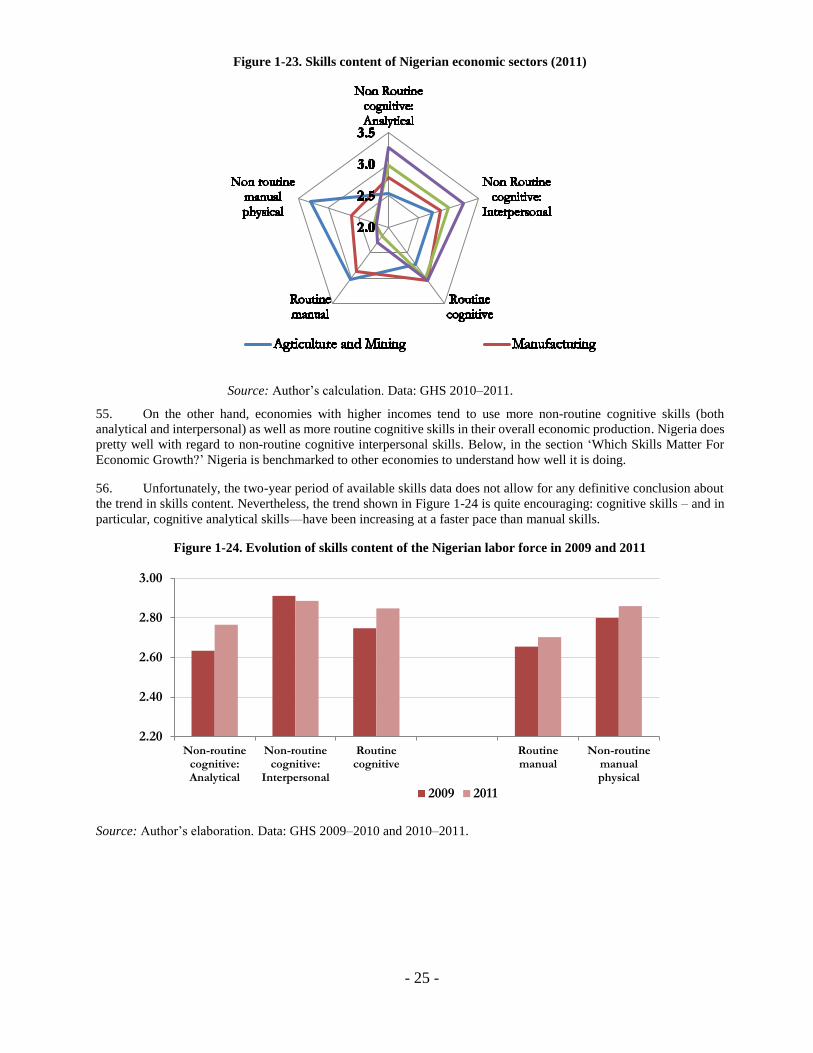
- 25 -
Figure 1-23. Skills content of Nigerian economic sectors (2011)
Source: Author’s calculation. Data: GHS 2010–2011.
55. On the other hand, economies with higher incomes tend to use more non-routine cognitive skills (both
analytical and interpersonal) as well as more routine cognitive skills in their overall economic production. Nigeria does
pretty well with regard to non-routine cognitive interpersonal skills. Below, in the section ‘Which Skills Matter For
Economic Growth?’ Nigeria is benchmarked to other economies to understand how well it is doing.
56. Unfortunately, the two-year period of available skills data does not allow for any definitive conclusion about
the trend in skills content. Nevertheless, the trend shown in Figure 1-24 is quite encouraging: cognitive skills – and in
particular, cognitive analytical skills—have been increasing at a faster pace than manual skills.
Figure 1-24. Evolution of skills content of the Nigerian labor force in 2009 and 2011
Source: Author’s elaboration. Data: GHS 2009–2010 and 2010–2011.
2.20
2.40
2.60
2.80
3.00
Non-routinecognitive:Analytical
Non-routinecognitive:
Interpersonal
Routinecognitive
Routinemanual
Non-routinemanualphysical
2009 2011

- 26 -
57. The slight shift toward a more intensive use of cognitive versus manual skills is also confirmed
over a longer period of time (Figure 1-25). Looking at the change in skills content across cohorts, the two
youngest cohorts (25–34 and 35–44 years old in 2011) have higher cognitive and lower manual skills than
the oldest one (45–64 years old).
58. Manual skills (both non-routine manual physical skills and routine manual skills) are more
dominant for male than for female workers (Figure 1-26).
Figure 1-25. Evolution of skills content of the Nigerian labor force by age cohorts (2011)
Source: Author’s calculation. Data: GHS 2010–2011.
Figure 1-26. Skills content of the Nigerian labor force by gender (2011)
Source: Author’s calculation. Data: GHS 2010–2011.
2.4
2.5
2.6
2.7
2.8
2.9
3.0
Non Routinecognitive:Analytical
Non Routinecognitive:
Interpersonal
Routine cognitive Routine manual Non routinemanual physical
25-34 35-44 45-64
2.0
2.5
3.0
3.5
Non Routinecognitive:Analytical
Non Routinecognitive:
Interpersonal
Routinecognitive
Routinemanual
Non routinemanualphysical
2011 Male 2011 Female
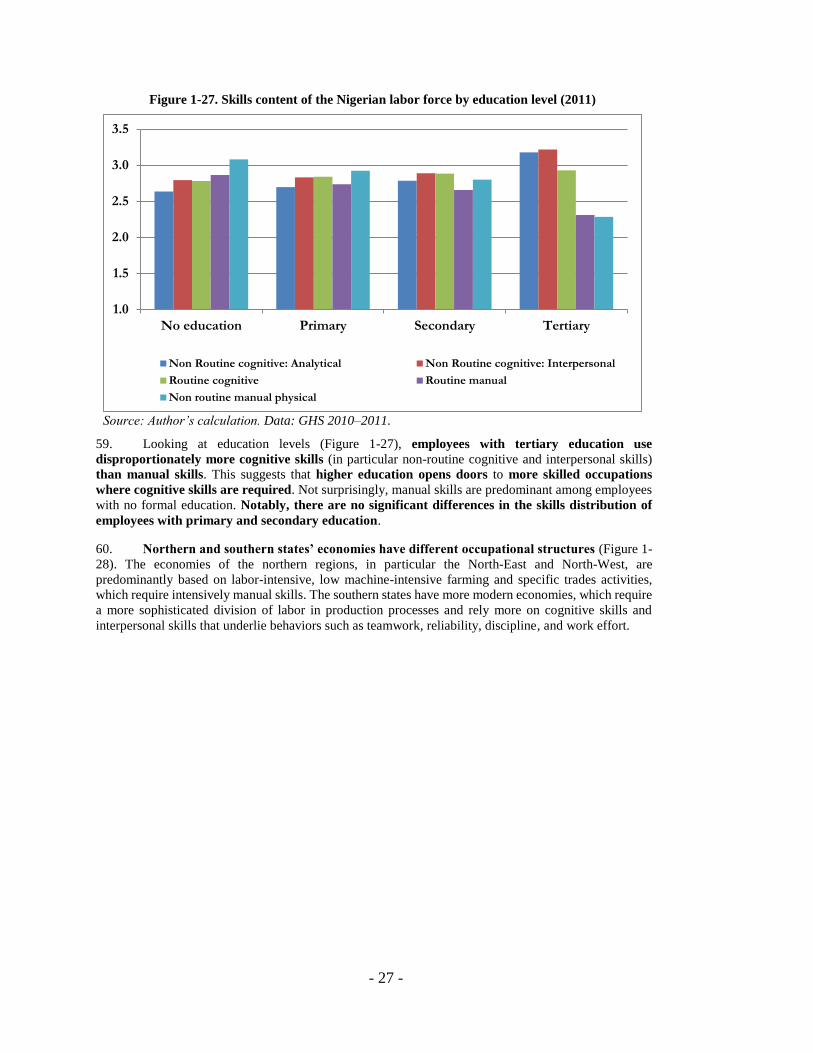
- 27 -
Figure 1-27. Skills content of the Nigerian labor force by education level (2011)
Source: Author’s calculation. Data: GHS 2010–2011.
59. Looking at education levels (Figure 1-27), employees with tertiary education use
disproportionately more cognitive skills (in particular non-routine cognitive and interpersonal skills)
than manual skills. This suggests that higher education opens doors to more skilled occupations
where cognitive skills are required. Not surprisingly, manual skills are predominant among employees
with no formal education. Notably, there are no significant differences in the skills distribution of
employees with primary and secondary education.
60. Northern and southern states’ economies have different occupational structures (Figure 1-
28). The economies of the northern regions, in particular the North-East and North-West, are
predominantly based on labor-intensive, low machine-intensive farming and specific trades activities,
which require intensively manual skills. The southern states have more modern economies, which require
a more sophisticated division of labor in production processes and rely more on cognitive skills and
interpersonal skills that underlie behaviors such as teamwork, reliability, discipline, and work effort.
1.0
1.5
2.0
2.5
3.0
3.5
No education Primary Secondary Tertiary
Non Routine cognitive: Analytical Non Routine cognitive: Interpersonal
Routine cognitive Routine manual
Non routine manual physical

- 28 -
Figure 1-28. Skills content of the Nigerian labor force by geopolitical zones (2011)
Source: Author’s calculation. Data: GHS 2010–2011.
61. All three regions in the South experienced an increase in the use of cognitive skills, which
reflects a shifting of economic production and a subsequent change in occupations, and of the types of
human skills used in their economy. The North-West and North-East relied on manual skills in 2011,
more so than in 2009. The North-Central regions made some encouraging progress by increasing
production requiring more analytical and routine cognitive skills.
Figure 1-29. Routine cognitive skills and GNP per capita (2009 and 2011)
Source: Author’s calculation. Data: General Household Survey, Panel 2012–2013, Wave 2.
Note: GNP = gross national product.
62. Which skills matter for economic growth? Trends in Nigerian labor force compared with other countries
tracing Nigerian’s skills content over time and across age cohorts show a slight shift away from manual toward
cognitive skills. Compared to other countries with similar GNP per capita and to the United States (which serves as a
benchmark country), Nigeria has been successful in developing routine cognitive skills among its workforce. For
instance, these are the skills that bookkeepers and shopkeepers use regularly (Figure 1-29).
63. Furthermore, Nigeria shows remarkably high/above average use of non-routine cognitive skills for its
level of development. Indeed, Nigeria is placed on or above the best-fit line for both analytical and interpersonal
cognitive skills, as shown in Figures 1-30 and 1-31, respectively. Non-routine cognitive skills (both analytical and
2.302.402.502.602.702.802.903.003.103.20
Non Routinecognitive:Analytical
Non Routinecognitive:
Interpersonal
Routinecognitive
Routinemanual
Non routinemanualphysical
SW SS SE NW NE NC

- 29 -
interpersonal) are critical skills for innovation, adaptability, and competitiveness, and the development of these skills
is needed in Nigeria to sustain and exceed its current level of development.
Figure 1-30. Non-routine cognitive analytical skills and GNP per capita (2009 and 2011)
Source: Author’s calculation using 2008–2009 GHS for Nigeria and DHS from various countries.
Also, see Aedo et al. 2013.
Figure 1-31. Non-routine cognitive interpersonal skills and GNP per capita (2009 and 2011)
Source: Author’s calculation using 2008–2009 GHS for Nigeria and DHS from various countries.
Also, see Aedo et al. 2013.
64. As highlighted above, Nigeria has been able to shift away from its reliance on manual skills; the data in the
graphs below show that workers use routine and non-routine manual skills less intensively than its level of economic
development would imply (Figures 1.32 and 1.33).

- 30 -
Figure 1-32. Routine manual skills and GNP per capita (2009 and 2011)
Source: Author’s calculation using 2008–2009 GHS for Nigeria and DHS from various countries. Also,
see Aedo et al. 2013.
65. Finally, even though jobs in Nigeria are more reliant on manual skills than on cognitive skills, at the national
level, jobs have transitioned slightly to the more intensive use of non-routine cognitive (analytical and interpersonal)
skills. This shift is encouraging because these skills are associated with advanced production processes and higher
productivity.
66. Next, in Chapter 2, the shortage of skills and the misalignment of skills demand and supply in Nigeria are
analyzed. The chapter makes use of a model to examine causes of the job and skills market failures; it closes with a
discussion of skills development for the informal economy.
Figure 1-33. Non-routine manual physical skills and GNP per capita (2009 and 2011)
Source: Author’s calculations using 2008–2009 GHS/ Nigeria and DHS from various countries. Also,
see Aedo et al. 2013.

- 31 -
CHAPTER 2. THE SHORTAGE OF SKILLS AND THE MISALIGNMENT OF SKILLS DEMAND
AND SUPPLY
A. Unemployment and underemployment: Structural problems
67. In Nigeria, unemployment and underemployment problems are structural in nature. The Nigerian economy is
unable to generate growth rates that are high enough to absorb the ever-increasing workforce into the modern sectors.
In fact, as discussed in Chapter 1, the current level of formal employment reflects only a small proportion of Nigeria’s
workforce.
68. If education and training institutions do not help create skills demanded in the economy, market
inefficiencies may be compounded as individuals invest time and money in skills that do not provide necessary or
relevant training, and their employment choices may be less than optimal as a result. On the demand side, employer
needs may go unmet or be met inadequately. Ultimately, such inefficiencies can create significant imbalances that can
affect firms’ competitiveness in a global economy. On the supply side, the workforce is not able to acquire valuable
skills and continues to operate within low-productivity and low-earnings sectors, including subsistence activities such
as traditional agriculture and informal enterprises. In the middle, the lack of efficient mechanisms and institutions to
guarantee smooth transitions from school to work originates from coordination failures and imperfect matches between
skills demand and supply.
69. Policy dialogue in the matter of skills development is complicated by the multiplicity of actors and
channels through which skills are acquired, including parents and families; schools, universities, and vocational
centers; and, ultimately, on-the-job training and learning-by-doing experiences.
70. A second complication is the diversity of skills that matter. As argued in Chapter 1, as economies develop
and diversify, the demand for higher-level cognitive skills versus manual and job-specific skills increases. Recent
empirical research found that cognitive and noncognitive skills are equally important and are valuable determinants of
individual opportunities in the labor market (Heckman, Stixrud, and Urzua 2006). Cognitive and noncognitive skills
are acquired during early childhood and in basic and secondary education. Timely policy interventions are thus required
at an earlier stage in the life cycle and will be rewarded in the long term, which of course creates problems related to
political rewards and accountability.
71. In perfectly competitive labor markets, employers’ demand for skills will be completely satisfied by
employees’ supply of skills. Indeed, employees will have the incentive to invest in training and in acquiring the
demanded skills expecting a return higher than the cost faced. In this scenario, the government should intervene to
make sure that everybody has the financial means to make the investments. In imperfectly competitive labor markets
both firms and employees can underinvest in training (Almeida, Behrman, and Robalino 2012).
72. The relevant question from a policymaker perspective is why the market alone cannot create an efficient
distribution of skills. For the Nigerian economy, five main reasons are identified in Table 2-1, and these reasons are
elaborated on as sections within this chapter: (a) imperfections in the skill supply market, (b) imperfections in labor
markets, (c) imperfections in capital markets, (d) individual decision-making failures, and (e) planning and coordination
failures (Almeida, Behrman, and Robalino 2012). Some of these imperfections might be sector specific, or they might
be constraints across different sectors.
73. The chapter closes with a discussion of TVET skill development for the informal economy.
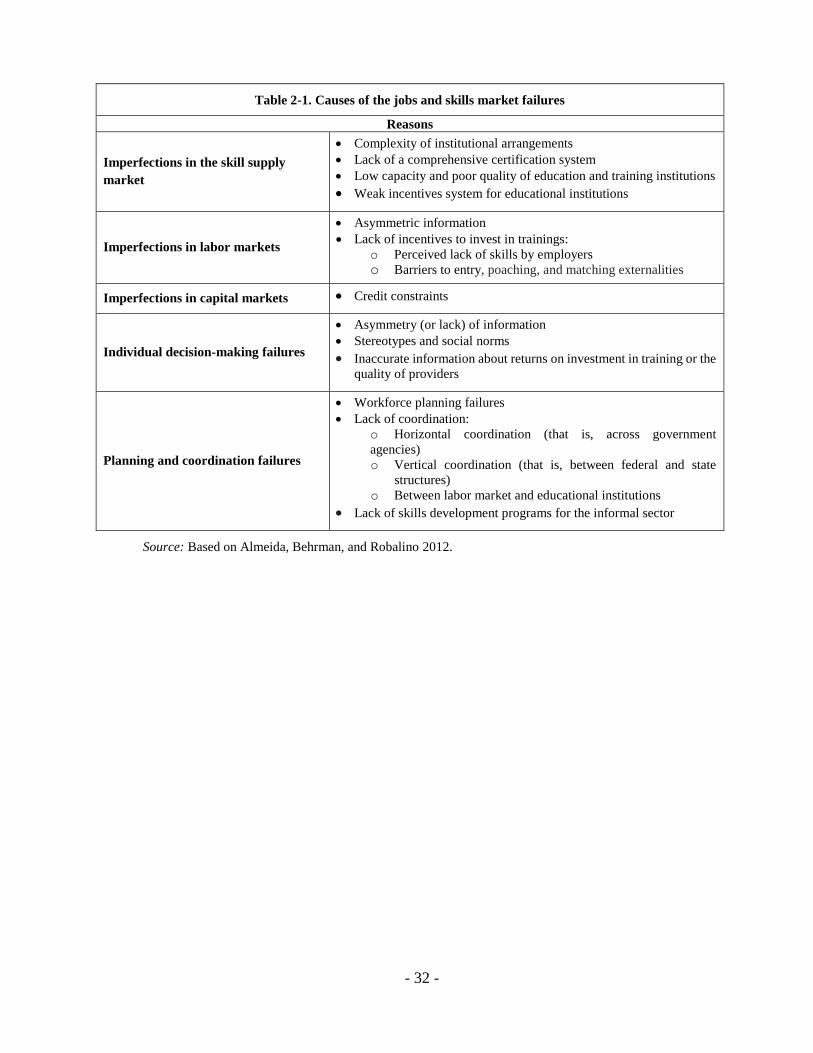
- 32 -
Table 2-1. Causes of the jobs and skills market failures
Reasons
Imperfections in the skill supply
market
Complexity of institutional arrangements
Lack of a comprehensive certification system
Low capacity and poor quality of education and training institutions
Weak incentives system for educational institutions
Imperfections in labor markets
Asymmetric information
Lack of incentives to invest in trainings:
o Perceived lack of skills by employers
o Barriers to entry, poaching, and matching externalities
Imperfections in capital markets Credit constraints
Individual decision-making failures
Asymmetry (or lack) of information
Stereotypes and social norms
Inaccurate information about returns on investment in training or the
quality of providers
Planning and coordination failures
Workforce planning failures
Lack of coordination:
o Horizontal coordination (that is, across government
agencies)
o Vertical coordination (that is, between federal and state
structures)
o Between labor market and educational institutions
Lack of skills development programs for the informal sector
Source: Based on Almeida, Behrman, and Robalino 2012.
- 33 -
B. Imperfections in the skills supply market
Public and private provision of skills: Formal TVET, traditional apprenticeships and non-formal
training
74. There are three basic avenues of skills acquisition in Nigeria: formal technical and vocational education and
training (TVET); traditional apprenticeship (the predominant avenue); and non-formal training. Apprenticeship
programs are predominantly informal. While the National Directorate for Employment (NDE) operates the Open
Apprenticeship Scheme, the informal sector organizes apprenticeship training to a significant extent by itself. Non-
formal training refers to training provided outside the mainstream education system and does not lead to a recognized
qualification. It is offered by many different types of organizations, public and private, and caters to a diverse audience,
including youth who have never attended a formal school, those who once attended but withdrew, and people of all
ages who want additional knowledge and proficiency in their area of qualification.
75. The private sector plays an important role in apprenticeship and non-formal training provision, with the quality
of the training varying greatly and rarely following any specific curriculum or leading to a recognized qualification.
There is general agreement on the importance of bringing the private sector into the skills development system to a
greater extent, of establishing a more comprehensive accreditation system and of formalizing informal skills
development institutions.
76. Historically, public interest in the skills of the workforce and economic growth led governments to assume
responsibility for providing TVET in dedicated schools (Johanson and Adams 2004). TVET was infused with broad
social objectives, including fighting youth unemployment, relieving demographic pressure on higher education
institutions, and serving academically less able students. The idea was that the government must remain involved to
compensate for limited private training capacity and to stimulate economic growth with supplies of trained workers
(Middleton, Ziderman, and Adams 1993).
77. In Nigeria, a workforce with technical education and vocational training has been recognized as a strategic
tool for national development, with huge potential for enhancing productivity and economic development.
The Nigerian education and TVET systems: Complex with no clear accountability mechanism
78. The Nigerian education system is known as the 6-3-3-4 system, wherein the first 9 years are the basic
education cycle, composed of 6 years of primary and 3 years of junior secondary education; the next 3 years cover
senior secondary education; and the final 4 years cover tertiary education. A one-year pre-primary education was
recently announced by the Federal Ministry of Education (FME) as part of the system to prepare children for school.
At the senior secondary level, terminal vocational training can serve as an alternative to moving on to tertiary education.
The responsibility to provide the various levels of education is divided among the federal, state, and local governments
as outlined in the Constitution, although some responsibilities are shared (concurrent) rather than exclusive.
79. The education system is composed of a multitude of institutions and agencies at the federal, state, and local
government authority levels. The complex institutional arrangement for the Nigerian education system is mapped in
Figure 2-1. The organigram depicts a chaotic and unclear (sometimes overlapping) division of responsibility between
the state and federal governments and the multiplicity of institutions.
80. The FME is the organ of government charged with education policy formulation and the coordination
of the nation’s educational sector. The constitutional provision for education provides for shared responsibility
between the federal government and the states. There are essentially six education spheres in Nigeria under the FME:
(a) early childhood development and preschool; (b) basic education (primary and junior secondary); (c) secondary
education; (d) tertiary education; (e) adult and informal education; and (f) special education.
81. Federal and state governments act as legislators and establish and manage university, technological,
professional, and other post-primary education. The federal authorities are responsible for policy, curriculum,
inspections, examinations, and the management of schools and federal technical colleges belonging to the senior
secondary education level. The federal government is also responsible for policy design, strategy, and management of
all federally owned colleges of education (CoEs), polytechnics, and universities. The FME is in charge of harmonizing
educational policies and procedures of all the states of the federation.

- 34 -
Figure 2-1. Organogram of the Federal Ministry of Education
Source: Federal Ministry of Education.
82. The ministry consists of several units and the following departments: basic and secondary education (5
divisions); tertiary education (7 divisions); the federal inspectorate service; human resources; finance and accounting;
procurement; and policy planning, education management, and research. The Federal Inspectorate Service performs a
number of functions, such as designing monitoring and evaluation instruments for measuring education quality and
ensuring linkages with the Nigerian Educational Research and Development Council (NERDC), the faculties of
education, institutes of education, and other national and international bodies on development in curriculum content,
delivery, and pedagogy practices as they apply to secondary technical and vocational education. The National Board
for Technical Education (NBTE) exists under the authority of the FME; it was established in 1977 with the purpose of
handling all aspects of technical and vocational education falling outside of university education.
83. The highest policymaking body in educational matters in the country is the National Council of
Education. It consists of the federal minister of education and the state commissioners for education. The Joint
Consultative Committee on Education (JCCE) assists the National Council of Education in its work. The JCCE consists
of professional officers of the federal and state ministers of education. The Nigerian Educational Research and
Development Council was established in 1972 with the purpose of developing curricula for use at all levels of Nigeria’s
educational system. The role of the council is limited to primary and secondary education but does not include higher
education. Another important body is the National Examinations Council (NECO), which conducts examinations for
some junior secondary schools and for senior secondary schools in cooperation with the West African Examination
Council.
The National Business and Technical Examinations Board administers technical and business examinations. Its mission
is to effectively conduct technical and business examinations and issue valid, reliable certificates with a view to meeting
the needs of candidates who wish to use them for academic progress and employment. The National Commission for
Colleges of Education, an advisory body for the FME, coordinates all aspects of nondegree teacher education in the
country.

- 35 -
Funding sources: Diverse and with poor accountability for results
84. Funds for education come from a diverse array of sources that vary by government and education levels.
Federal funding for education comes from the federation budget, as well as several major funds, including the Tertiary
Education Trust Fund, the Universal Basic Education (UBE) Intervention Fund, Science and Technical Education Post-
the Basic (STEP-B) program, and the Nigeria Information Technology Development Agency (NITDA), among others.
These are legal funding entities. The Virtual Poverty Fund, created from money saved through the Heavily Indebted
Poor Countries (HIPC) Initiative, has resulted in substantial funding for the FME. Approximately 80 percent of public
expenditure for education is spent at levels below the federal one (World Bank 2008).
85. Primary and junior secondary education are under the authority of local government education
authorities (LGEAs), who also fund primary schools through their budgets, but federal control and support for primary
education has been growing. Senior secondary education is under the jurisdiction of state governments, with the
exception of 104 federal unity schools. Tertiary education is primarily managed by the federal or state
governments, with the federal government taking the largest role. Tertiary education is provided through
universities, polytechnics, mono-technics (institutions offering courses in a single scientific or technical subject), and
colleges of education (CoEs).17 The FME owns and funds a number of universities, polytechnics, technical colleges,
colleges of education (CoEs), and secondary schools, located in every state of the country. The rest of the tertiary
institutions are owned and funded by the state governments, whereas some secondary schools are owned and funded
by state governments, communities, and private organizations.
86. This complex education system is reflected in technical and vocational education as well, where formal
institutions coexist with a multitude of informal on-the-job training and informal vocational institutions. Formal
TVET institutions include a variety of training institutions at different levels. Indeed, TVET institutions include
polytechnics, mono-technics, and technical colleges, overseen by the National Board for Technical Education (NBTE),
while the informal system works mainly through apprenticeships. Polytechnics train graduates of senior secondary
schools to the standards of National Diploma (ND), Higher National Diploma (HND), and the Post-Higher National
Diploma (Post-HND).
87. A major recent initiative is the introduction of the innovation enterprise institutions and vocational
enterprise institutions. These are private sector-driven institutions targeting areas of skills shortage and market needs.
They provide industry-specific competencies in such fields as oil and gas, communication, entertainment, fashion,
hospitality, automobile, construction, and welding sectors.
National certification system: Not comprehensive and unresponsive to employers’ needs
88. The unstructured system, the absence of an appropriate certification system, and the low quality of education
have given technical and vocational institutions a bad reputation. Thus, potential postsecondary school candidates
queue for enrolment into universities, facing keen competition for gaining admission. This situation results in the
society becoming deprived of skilled technicians such as bricklayers, carpenters, painters, auto mechanics, and
laboratory and pharmacy technicians (Adeiza 2010).
89. In 2013, the Federal Executive Council (FEC) approved a six-level national vocational qualification
framework (NVQF) for the country. In the short term, the certification system provides a comprehensive
classification of the education, training, and vocational qualifications available. In the medium term, it intends to set
the criteria and a common grid of skill levels for all qualifications. This would clarify the standards for graduation,
standardizing learning outcomes, and competencies. The framework should also facilitate the establishment of
progression routes between different fields of study, general and vocational education, learning in initial and further
education, and qualifications obtained through formal and non-formal education and training.
17 The 2014 enumeration counted 40 federal universities, 39 state universities, and 50 private universities. See link:
http://www.nuc.edu.ng/pages/universities.asp?ty=2&order=inst_name&page=2. These counts do not include other
state institutions and facilities that train senior secondary school graduates or leavers outside of the formal system.
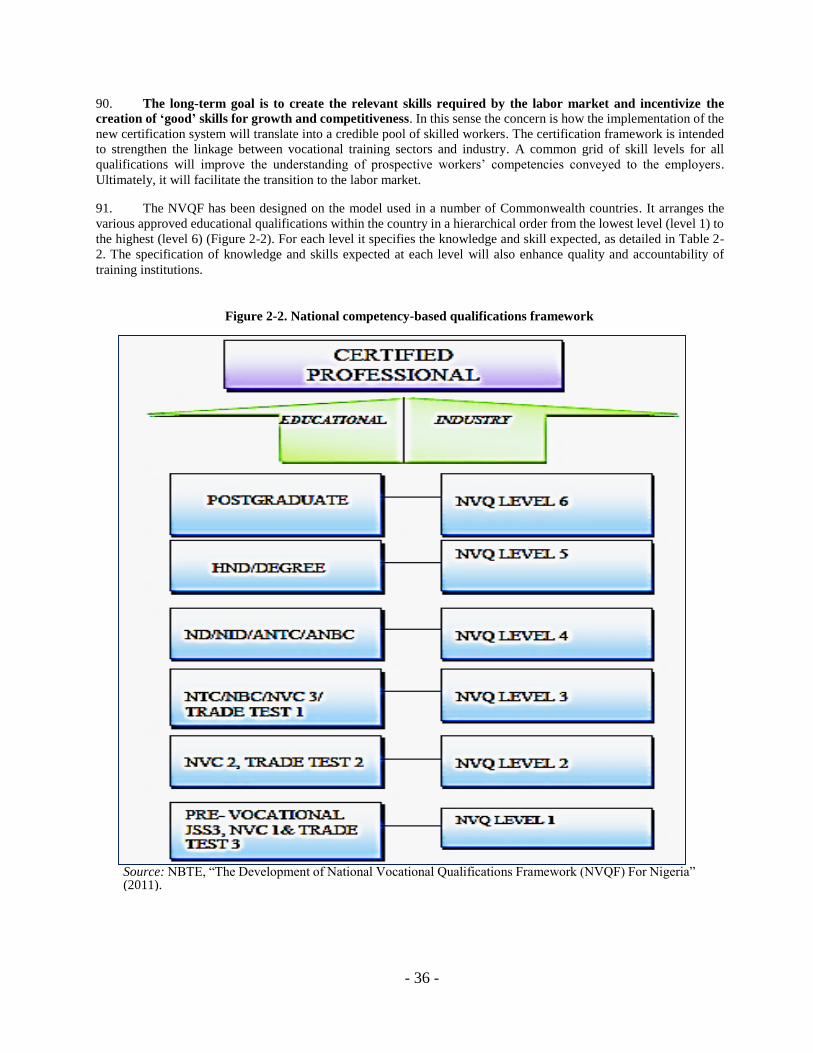
- 36 -
90. The long-term goal is to create the relevant skills required by the labor market and incentivize the
creation of ‘good’ skills for growth and competitiveness. In this sense the concern is how the implementation of the
new certification system will translate into a credible pool of skilled workers. The certification framework is intended
to strengthen the linkage between vocational training sectors and industry. A common grid of skill levels for all
qualifications will improve the understanding of prospective workers’ competencies conveyed to the employers.
Ultimately, it will facilitate the transition to the labor market.
91. The NVQF has been designed on the model used in a number of Commonwealth countries. It arranges the
various approved educational qualifications within the country in a hierarchical order from the lowest level (level 1) to
the highest (level 6) (Figure 2-2). For each level it specifies the knowledge and skill expected, as detailed in Table 2-
2. The specification of knowledge and skills expected at each level will also enhance quality and accountability of
training institutions.
Figure 2-2. National competency-based qualifications framework
Source: NBTE, “The Development of National Vocational Qualifications Framework (NVQF) For Nigeria” (2011).
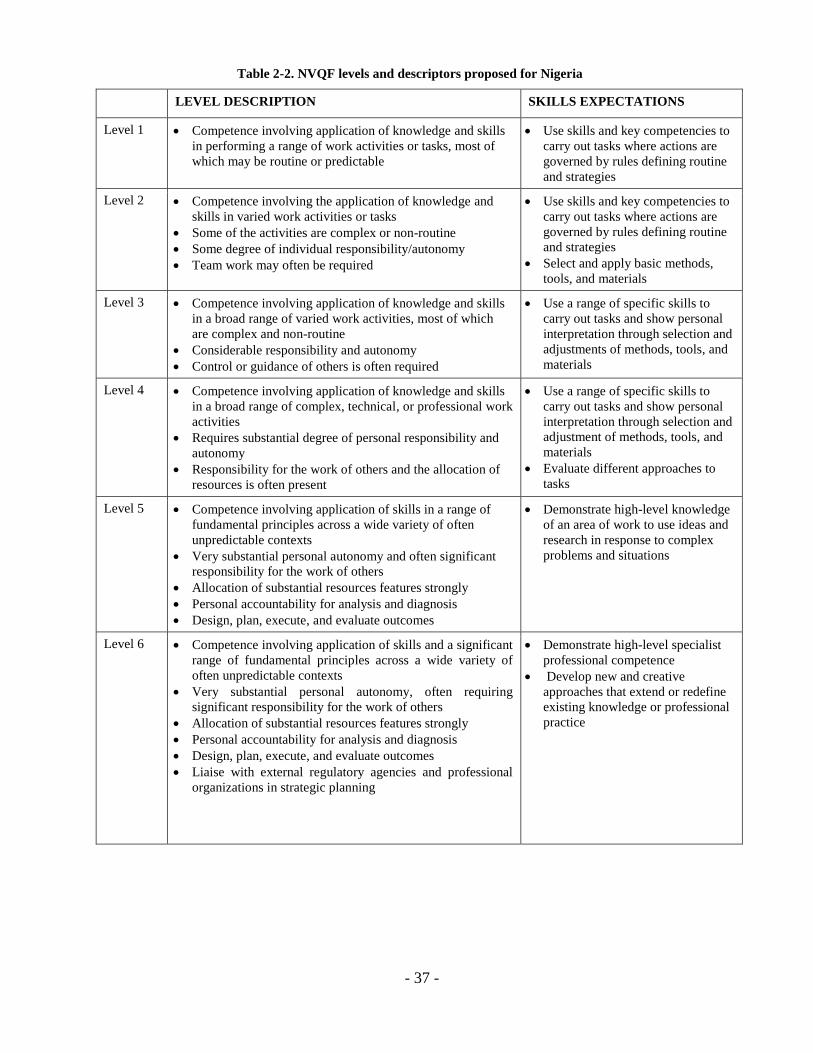
- 37 -
Table 2-2. NVQF levels and descriptors proposed for Nigeria
LEVEL DESCRIPTION SKILLS EXPECTATIONS
Level 1 Competence involving application of knowledge and skills
in performing a range of work activities or tasks, most of
which may be routine or predictable
Use skills and key competencies to
carry out tasks where actions are
governed by rules defining routine
and strategies
Level 2 Competence involving the application of knowledge and
skills in varied work activities or tasks
Some of the activities are complex or non-routine
Some degree of individual responsibility/autonomy
Team work may often be required
Use skills and key competencies to
carry out tasks where actions are
governed by rules defining routine
and strategies
Select and apply basic methods,
tools, and materials
Level 3 Competence involving application of knowledge and skills
in a broad range of varied work activities, most of which
are complex and non-routine
Considerable responsibility and autonomy
Control or guidance of others is often required
Use a range of specific skills to
carry out tasks and show personal
interpretation through selection and
adjustments of methods, tools, and
materials
Level 4 Competence involving application of knowledge and skills
in a broad range of complex, technical, or professional work
activities
Requires substantial degree of personal responsibility and
autonomy
Responsibility for the work of others and the allocation of
resources is often present
Use a range of specific skills to
carry out tasks and show personal
interpretation through selection and
adjustment of methods, tools, and
materials
Evaluate different approaches to
tasks
Level 5 Competence involving application of skills in a range of
fundamental principles across a wide variety of often
unpredictable contexts
Very substantial personal autonomy and often significant
responsibility for the work of others
Allocation of substantial resources features strongly
Personal accountability for analysis and diagnosis
Design, plan, execute, and evaluate outcomes
Demonstrate high-level knowledge
of an area of work to use ideas and
research in response to complex
problems and situations
Level 6 Competence involving application of skills and a significant
range of fundamental principles across a wide variety of
often unpredictable contexts
Very substantial personal autonomy, often requiring
significant responsibility for the work of others
Allocation of substantial resources features strongly
Personal accountability for analysis and diagnosis
Design, plan, execute, and evaluate outcomes
Liaise with external regulatory agencies and professional
organizations in strategic planning
Demonstrate high-level specialist
professional competence
Develop new and creative
approaches that extend or redefine
existing knowledge or professional
practice

- 38 -
Low capacity of post-basic and tertiary TVET
92. Recently, the NBTE developed a program to monitor polytechnics, mono-technics, and technical
colleges in Nigeria to reform the administrative method of collecting data from the technical institutions. As part
of the program, it established a census of all the polytechnics, mono-technics, and technical colleges in the country—a
total of 71 polytechnics, 56 mono-technics, and 164 technical colleges (Table 2-3)—for a period spanning five years
(2005 to 2010). The data collected include the total student enrolment and graduation numbers; student enrolment and
graduate numbers by programs of study; the geographical and gender distribution and male-female disparities of student
enrolment and graduation; and the academic staff distribution by programs.
93. A growing economy like Nigeria needs more TVET schools with a new framework, curriculum, and delivery
to meet the needs of the workforce. This deficit should be filled quickly to respond to such challenges.
Table 2-3. TVET institutions by ownership (2010)
Institution Type Ownership
Total Federal State Private
Technical Colleges 19 142 3 164
Innovation Enterprises Institutions (IEIs) 0 0 82 82
Polytechnics 21 37 13 71
Mono-technics:
(a) Colleges of Agriculture & Related Disciplines 17 12 - 29
(b) Colleges of Health Technology 5 4 1 10
(c) Other Specialized Institutions 12 3 2 17
Subtotal Mono-technics 34 19 3 56
TOTAL 74 198 101 373
Source: NBTE, 2010.
Low access to post-basic and tertiary TVET in relation to the needs of the economy
94. According to the third edition of the National Policy on Education, the Nigerian government expected that
about 20 percent of those enrolling in post-basic education (after junior secondary education) would have been enrolled
in technical colleges.18 Considering an annual enrolment of about 4 million, the technical colleges should be able to
enroll about 800,000 to meet the 20 percent target. In 2009/2010, the total enrolment in technical colleges was 74,299,
barely reaching 9.3 percent of the target.19
95. A similar case of inadequate access is widespread at the tertiary level as well. In 2011, the Joint Admission
and Matriculation Board (JAMB) reported over 1.4 million Unified Tertiary Matriculation Examination (UTME)
candidates seeking admissions for about 150,000 university enrolment slots. Similarly, the total enrolment in
polytechnics in 2009/2010 was 151,899 (about 65 percent for the National Diploma and 35 percent for the Higher
National Diploma, against the total polytechnics’ enrolment capacity of 80,000. This figure shows that oversubscription
is about 90 percent, with consequent implications on quality of graduates, and reflecting the inability of the TVET
system to satisfy the demand.
96. These statistics clearly show the need for increasing access to technical and vocational education at the tertiary
level. Enrolment in polytechnics for the ND has decreased over time, while that for the HND has been constant since
2005. Conversely, the overall trend of enrolment in mono-technics shows an erratic pattern (Figure 2-3). It maintained
a downward trend between 2005/06 and 2006/07. It rose in 2007/08 and dropped in 2009/10 academic year. However,
the overall trend shows a slight drop in students’ enrolment over the period considered.
97. With regard to the field of education, there are not big variations across the time: sciences (including chemistry
and biology) and accountancy are the two most common fields, with 21 percent and 12 percent enrolment, respectively
(for ND and HDN together) (Table 2-4 and Figure 2-4).
18 The remaining post-basic education students would be distributed as follows: 60% in senior secondary schools and
10% each in vocational training centers and apprenticeship schemes. 19 More recent data are not currently available.

- 39 -
Figure 2-3. Enrolment in polytechnics and mono-technics (2005–2010)
Source: Author’s calculation. Data: NBTE data 2005–2010.
Table 2-4. Enrolment in mono-technics and polytechnics by education field (ND, HDN, %)
Source: Author’s calculation. Data: NBTE data, 2005–2010.
Enrollment in Mono-technics and Polytechnics by Education Field (%) (ND+HDN)
2005–2006 2006–2007 2007–2008 2008–2009 2009–2010
Chemistry, Biology, Science 16.7 18.6 17.2 19.1 20.5
Accountancy 15.8 14.0 10.8 12.9 12.2
Construction, Manufacturing 9.3 10.6 10.1 8.9 10.1
Agriculture, Forestry, Fishing 8.5 8.0 9.2 8.1 10.3
Administration, Management 8.3 7.1 9.0 7.8 7.1
Computer 6.4 7.3 7.6 9.9 9.1
Banking, Finance, Business, Insurance 5.9 7.8 7.1 7.0 6.8
Information, Communication 5.2 6.5 6.6 6.7 6.1
Accommodation, Food, Service 6.3 6.5 5.7 5.2 4.2
Engineering 5.2 3.1 5.0 4.4 4.0
Mechanics 4.6 3.6 3.1 3.4 3.5
Economics, Math, Statistics 2.7 3.3 3.0 2.4 1.9
Art and Design 2.4 1.7 2.9 2.4 2.2
Electronics 1.0 1.6 1.8 1.6 1.7
Real Estate Activities 0.9 0.1 0.8 0.2 0.1
Architecture 0.8 0.2 0.1 0.0 0.1
Health 0.1 0.0 0.0 0.1 0.1
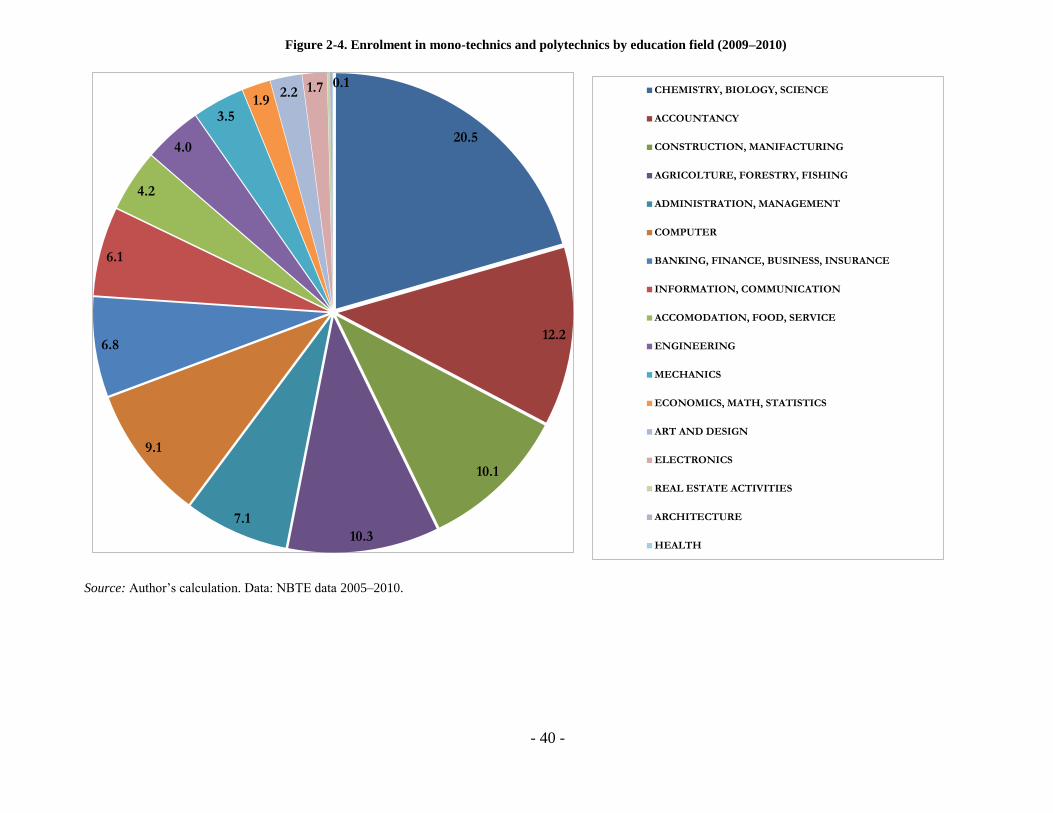
- 40 -
Figure 2-4. Enrolment in mono-technics and polytechnics by education field (2009–2010)
Source: Author’s calculation. Data: NBTE data 2005–2010.
20.5
12.2
10.1
10.3
7.1
9.1
6.8
6.1
4.2
4.0
3.51.9
2.2 1.7 0.1CHEMISTRY, BIOLOGY, SCIENCE
ACCOUNTANCY
CONSTRUCTION, MANIFACTURING
AGRICOLTURE, FORESTRY, FISHING
ADMINISTRATION, MANAGEMENT
COMPUTER
BANKING, FINANCE, BUSINESS, INSURANCE
INFORMATION, COMMUNICATION
ACCOMODATION, FOOD, SERVICE
ENGINEERING
MECHANICS
ECONOMICS, MATH, STATISTICS
ART AND DESIGN
ELECTRONICS
REAL ESTATE ACTIVITIES
ARCHITECTURE
HEALTH
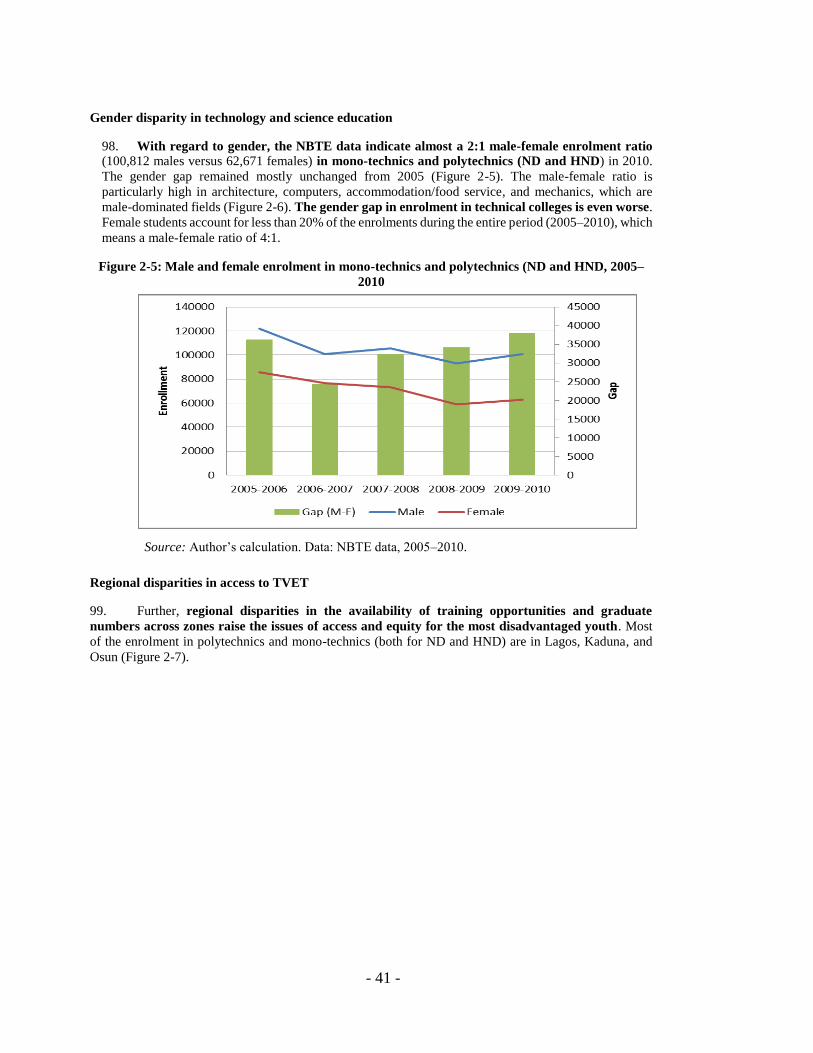
- 41 -
Gender disparity in technology and science education
98. With regard to gender, the NBTE data indicate almost a 2:1 male-female enrolment ratio (100,812 males versus 62,671 females) in mono-technics and polytechnics (ND and HND) in 2010.
The gender gap remained mostly unchanged from 2005 (Figure 2-5). The male-female ratio is
particularly high in architecture, computers, accommodation/food service, and mechanics, which are
male-dominated fields (Figure 2-6). The gender gap in enrolment in technical colleges is even worse.
Female students account for less than 20% of the enrolments during the entire period (2005–2010), which
means a male-female ratio of 4:1.
Figure 2-5: Male and female enrolment in mono-technics and polytechnics (ND and HND, 2005–
2010
Regional disparities in access to TVET
99. Further, regional disparities in the availability of training opportunities and graduate
numbers across zones raise the issues of access and equity for the most disadvantaged youth. Most
of the enrolment in polytechnics and mono-technics (both for ND and HND) are in Lagos, Kaduna, and
Osun (Figure 2-7).
Source: Author’s calculation. Data: NBTE data, 2005–2010.

- 42 -
Figure 2-6. Enrolment in mono-technics and polytechnics by field of education (ND and HND,
2005–2010)
Source: Author’s calculation. Data: NBTE data 2005–2010.
Figure 2-7. Enrolment by state (2009–2010)
100. For example, most of the polytechnics are concentrated in the South-West (31 percent) and the
North-West (24 percent); they are fewest in the South-East, contributing only 10 percent of the enrolment
(Table 2-5).
Table 2-5.Enrolment in polytechnics by zones (2009–2010)
National
Diploma
Higher
Diploma Total (%)
North-Central 13,870 7,328 21,198 12.9
North-East 13,814 6,478 20,292 12.3
North-West 15,620 23,500 39,120 23.7

- 43 -
Poor quality of TVET system
Poor outcomes, lack of resources, qualified teachers, and absence of incentives
101. As has emerged from the previous sections and from the 2013 policy note on education (Pillar 1),
low-quality education is at the basis of the lack of skills in Nigeria. Returns to schooling depend
considerably on the quality of education, and deep deficiencies in the quality of education mean that
the effect of schooling on productivity is far below its potential. Furthermore, the deteriorating quality
of education may lead to an increased proportion of children never attending school or dropping out. If
parents learn that the quality of schooling is so poor that their children will not learn anything, they will
lose interest in investing in their children’s education.
102. The Nigerian education system shows poor learning outcomes at primary and secondary
levels, poor school infrastructure and lack of qualified teachers, and inadequate teaching and
learning materials, as detailed in the remaining part of this section.
103. These poor performing indicators are symptoms of system-wide failure. Educational
institutions complain about the lack of resources, the shortage of budgets to invest in better facilities,
teachers and education in general (Table 2-6), and an uneven allocation in favor of unity schools (FGCs),
which represent a small percentage (about 2 percent) of the total number of students in secondary schools.
Poor learning outcomes in secondary schools
104. As mentioned previously, many students in Nigeria take ten or more years of schooling to acquire
basic competencies such as reading and basic numeracy, and poor learning outcomes are most severe in
the North.
105. Poor learning outcomes result in low passing rates at the end of secondary school, particularly
for students from public or federal schools in the North. Results from the two most common exams at
senior secondary level, the National Examinations Council (NECO and the West African Senior School
Certificate Examination (WASSCE), indicate very low passing rates.
South-West 14,581 1,579 16,160 9.8
South-East 10,257 6,176 16.433 10.0
South-South 29,821 21,768 51,589 31.3
Total 97,963 66,829 164,792 100.0
Source: NBTE data 2009–2010. Mono-technics and polytechnics together.
Table 2-6. Federal government budget allocated to education (2008–2014)
Year Federal Government
Total Expenditure
Allocated to
Education % of Education
2008 3,241 213 6.57
2009 3,453 181 5.23
2010 4,195 259 6.17
2011 4,712 371 7.88
2012 4,877 410 8.40
2013 4,987 437 8.77
2014 4,643 494 10.63
Source: Budget office website for 2012–2014 (http://www.budgetoffice.gov.ng); Central Bank of
Nigeria website for 2008–2011 (http://www.cenbank.org).

- 44 -
106. According to the June 2010 NECO exams, on average only about 22 percent of registered
students passed with five credits (the minimum [five subjects] prerequisite for university entrance)
and above. The average NECO pass rates in the North-East and North-West are merely 6.6 percent and
12 percent, respectively, about one-fifth and one-third of the highest performing regions of the South-East
and South-South (31 percent). Students in the North-Central region performed relatively better than their
peers in other northern regions, with about a 20 percent passing rate, but still performed much lower than
those in the South (30–31 percent) (Figure 2-8).
107. In addition, not all states from the same region perform equally poorly or equally well in
these examinations. For instance, the highest-performing states in the lowest-performing regions, such as
Jigawa and Kaduna in the North-West, have slightly higher passing rates than the lowest-performing states
in the highest-performing regions, such as Ebonyi in the South-East and Akwa-Ibom in the South-South.
Hence, learning outcomes can differ substantially across states within a region as well as across regions
(Figure 2-8).
108. In general, the results also suggest better performance of students from private schools than those
from public schools. The difference in pass rates is extremely large in some northern states, up to 25
percentage points in Kaduna and between 18 and 20 percentage points in Borno, Zamfara, Kano, and
Jigawa. The quality also differs largely between private and public in some states of the high-performing
regions in the South. For example, in Ebonyi and Anambra (South-East) and Akwa Ibom and Bayelsa
(South-South), compared to private schools, students from public schools are about half as likely to pass
the NECO exams (Figure 2-8).
Figure 2-8. Percentage of registered students passing the NECO with 5 credits and above, 2010
Source: Education, Access, Equity, and Quality in Nigeria (Policy Note 1 2013).
109. In the May 2011 WASSCE, about 31 percent of registered students passed with five credits
and above, with huge differences across states (Figure 2-9). More recently, only 29.2 percent of the
total number of candidates who sat for the November/December 2013 examination of the WAEC
obtained credits in five subjects and above.
0
10
20
30
40
50
60
yob
eg
om
be
ad
am
aw
ab
au
chi
born
ota
rab
a
sok
oto
keb
bi
zam
fara
kats
ina
kan
oji
ga
wa
kad
un
a
pla
tea
un
iger
kw
ara
nasa
raw
ab
enu
efc
t-a
bu
jak
og
i
on
do
ekit
io
sun
oyo
lag
os
ogu
n
ebo
ny
ien
ugu
an
am
bra
imo
ab
ia
ak
wa
-ib
om
del
taed
ocr
oss
-riv
erri
ver
sb
ay
elsa
All Schools Private
North-East North-West North-Central South-West South-East
South-South
Source: Author's calculation using NECO 2010 results

- 45 -
Figure 2-9. Percentage of students passing the WASSCE with 5 credits and above
(May/June 2011)
Source: Education, Access, Equity, and Quality in Nigeria (Policy Note 1 2013).
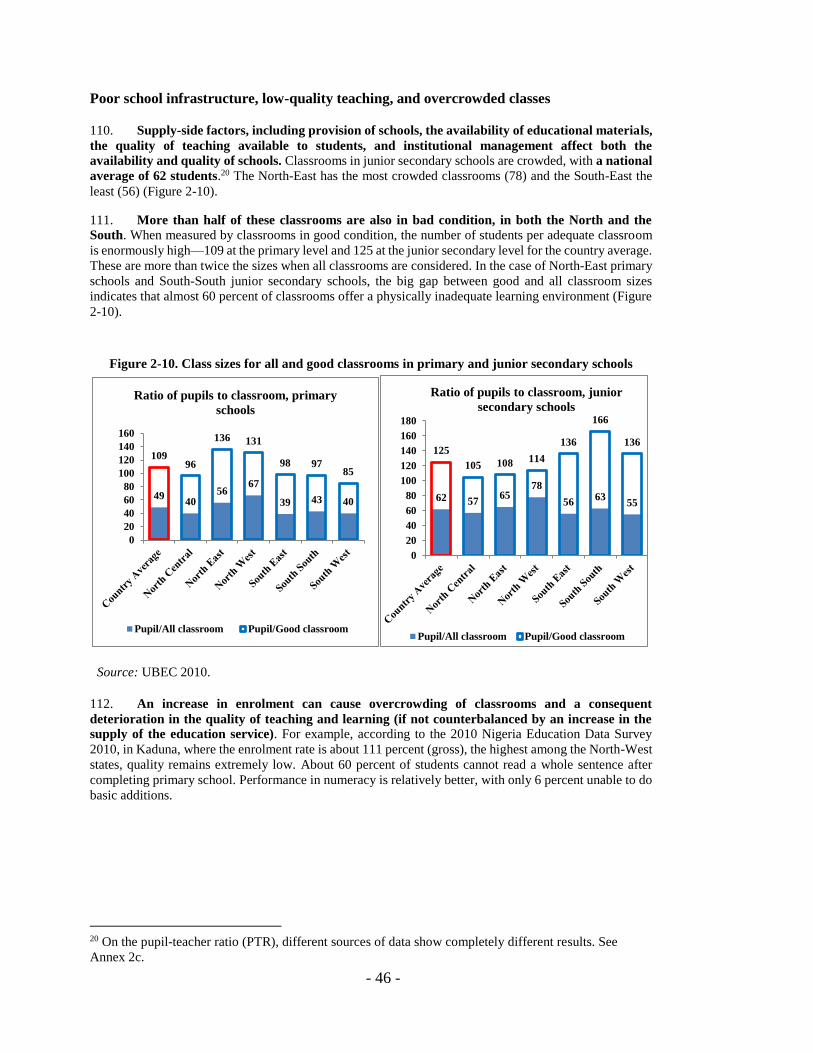
- 46 -
Poor school infrastructure, low-quality teaching, and overcrowded classes
110. Supply-side factors, including provision of schools, the availability of educational materials,
the quality of teaching available to students, and institutional management affect both the
availability and quality of schools. Classrooms in junior secondary schools are crowded, with a national
average of 62 students.20 The North-East has the most crowded classrooms (78) and the South-East the
least (56) (Figure 2-10).
111. More than half of these classrooms are also in bad condition, in both the North and the
South. When measured by classrooms in good condition, the number of students per adequate classroom
is enormously high—109 at the primary level and 125 at the junior secondary level for the country average.
These are more than twice the sizes when all classrooms are considered. In the case of North-East primary
schools and South-South junior secondary schools, the big gap between good and all classroom sizes
indicates that almost 60 percent of classrooms offer a physically inadequate learning environment (Figure
2-10).
Figure 2-10. Class sizes for all and good classrooms in primary and junior secondary schools
112. An increase in enrolment can cause overcrowding of classrooms and a consequent
deterioration in the quality of teaching and learning (if not counterbalanced by an increase in the
supply of the education service). For example, according to the 2010 Nigeria Education Data Survey
2010, in Kaduna, where the enrolment rate is about 111 percent (gross), the highest among the North-West
states, quality remains extremely low. About 60 percent of students cannot read a whole sentence after
completing primary school. Performance in numeracy is relatively better, with only 6 percent unable to do
basic additions.
20 On the pupil-teacher ratio (PTR), different sources of data show completely different results. See
Annex 2c.
Source: UBEC 2010.
4940
5667
39 43 40
10996
136 131
98 9785
0
20
40
60
80
100
120
140
160
Ratio of pupils to classroom, primary
schools
Pupil/All classroom Pupil/Good classroom
62 5765
78
5663
55
125
105 108 114
136
166
136
0
20
40
60
80
100
120
140
160
180
Ratio of pupils to classroom, junior
secondary schools
Pupil/All classroom Pupil/Good classroom

- 47 -
Lack of qualified teachers and learning resources
113. There is a dearth of qualified teachers in some areas of Nigeria, and even qualified teachers do not have the
adequate professional knowledge and competency to teach.21 Research suggests that teacher quality is the main school-
based predictor of student achievement and that several consecutive years of outstanding teaching can offset the learning
deficits of disadvantaged students.22 However, it is not yet clear exactly which teacher policies can raise teacher
effectiveness (Goldhaber 2002; Rivkin et al. 2005), and the absence of systematic efforts to generate data and analysis
that can provide policy guidance on teacher policies makes it even more difficult. In 2010, only 65 percent of teachers
in secondary education held formal teaching qualifications (UNESCO 2010).23 A similar picture obtains for primary
education: in 2005 only 50 percent of teachers were trained; by 2010, this had grown somewhat to 66 percent. The ratio
of teaching to non-teaching personnel is 1:1.65 in unity schools (federal secondary colleges), and 1:3 in both university
and polytechnics. An assessment in five states in 2010 showed that the majority of the qualified teachers had only limited
professional working knowledge. Teaching materials are lacking; for example, fewer than 15 percent of teachers have
teacher guides in a review of a few states. TVET teachers in particular are undervalued and do not receive needed
incentives.
114. Furthermore, learning and teaching materials are very scarce. The FME estimated that a total of about 78.5
million textbooks were needed for primary schools (both public and private) in the 2006–07 academic year. On average,
about 5–6 students have to share a textbook for a subject. About 60 percent of public primary school students do not
have a mathematics or English textbook. In other languages, textbooks are even less available. For example, about 90
percent and 95 percent of students taught in Hausa and Yoruba do not have a textbook for their respective language. In
Igbo language, that statistic is about 88 percent (FME 2011). The severe lack of textbooks is similarly observed in Bauchi
and Sokoto, where the early grade reading assessment in Hausa was conducted. About 55 percent of pupils in Bauchi
and nearly 60 percent in Sokoto reported they did not have a Hausa book at school (RTI International 2011). In over 80
percent of the classrooms in Jigawa, Kaduna, and Kano, few or no students have a relevant textbook. Students in Kwara
and Lagos have better access to textbooks, though students in about one-third of the classrooms have no textbooks or
only a few (Education Sector Support Program in Nigeria [ESSPIN] and UKAid 2010).
115. Having access to printed materials is important for students’ learning, especially for learning how to
read. The 2010 Early Grade Reading Assessment found that students having a book, being able to bring home books
from class or a library, and having access to printed materials at home performed significantly better than their peers on
the reading test. On average, they could read twice as many words or more as their peers without printed material at
school or at home (Figure 2-11).
21 See Annex 2d. 22 See, for example, Hanushek and Rivkin 2006; Nye et al. 2004; Park and Hannum 2001; Rivkin et al. 2005; Rockoff
2004; Sanders 1998; Sanders and Rivers 1996; and Vignoles et al. 2000. 23 Trained teachers refers to teaching force with the necessary pedagogical skills to teach and use teaching materials in
an effective manner. The share of trained teachers is calculated by dividing the number of trained teachers in primary
education, divided by the total number of teachers in primary education and multiplied by 100. Aggregate data are
estimates by the United Nations Educational, Scientific, and Cultural Organization (UNESCO Institute for Statistics
(UIS). Data on education are collected by the UNESCO Institute of Statistics UIS from official responses to its annual
education survey.

- 48 -
Figure 2-11. Correct words per minute in reading test, by having access to print materials
116. More generally, there is a lack of incentives to improve the quality of education and produce valuable skills for
the labor market. There is no incentive in place to reward those institutions making an effort to guarantee adequate
infrastructure, equipment and materials, and competent teachers, ultimately increasing students’ performance.
C. Imperfections in the labor market
Lack of skills and incentives for investing in training
117. There are many reasons why the market converges toward a non-optimal equilibrium. In a perfectly
competitive labor market, the government should intervene to make sure that everybody has the financial means to
acquire training and invest in skills acquisition. Employees would have an incentive to invest in training because they
knew that employers valued and demanded those skills. Employers themselves would have an incentive to invest in
employees’ skills because, in perfect competition, they would be able to compete for those skills. This is not the case in
the real world, however, and certainly not for Nigeria. Multiple distorting mechanisms exist, mainly related to
asymmetric information, externalities, and barriers to entry.
118. A weak policymaking process is the first factor hampering the government’s ability to intervene
effectively in the training markets. Furthermore, imperfect information affects all major players, from policymakers
to training recipients, due to the absence of sufficient and dynamic monitoring and evaluation systems, thereby
preventing the fine-tuning and adjustment of programs to improve their effectiveness.
119. The lack or asymmetry of information is worse where strong accountability mechanisms are not in place
for training providers. A results-based approach is preferable in a context lacking appropriate governance and
institutional arrangements. In many countries, and this is the case for Nigeria, governments are not able to establish an
effective institutional and regulatory framework with a clear delegation of roles and responsibilities between central and
local governments and the different institutions (public and private) involved in the provision of training.
120. Information is the oxygen of responsive skills development systems. First, without good information about
employers’ skill needs, labor market conditions and returns to certain fields of study, education, and training providers
cannot make good choices about what programs to develop and offer. Second, without such information, students and
parents cannot make good decisions on which school or university and which study program to choose. Third, without
information on the quality of education programs and employment success of graduates, prospective students may not
be able to make wise choices. The uncertainty created by the lack of, or asymmetric, information implicitly increases
the opportunity cost of investing in additional education and training.
Source: RTI International and USAid, “Nigeria Northern Education Initiative: Results of the Early Grade Reading
Assessment in Hausa,” 2011.
4.5
2.5
10.0
5.7
0.0
2.0
4.0
6.0
8.0
10.0
12.0
Bauchi Sokoto
Having access to print
materials at home
NO access HAVE access
3.82.6
9.4
4.3
0.0
2.0
4.0
6.0
8.0
10.0
12.0
14.0
Bauchi Sokoto
Bring home books from
class/library
NOT bring home BRING home
4.5
2.8
11.9
5.6
0.0
2.0
4.0
6.0
8.0
10.0
12.0
14.0
Bauchi Sokoto
Having a Hausa textbook
NOT have HAVE
- 49 -
121. Barriers to entry for new firms and asymmetric information generate two main sources of failures in the labor
market: (a) imperfect competition among employers for different types of skills that can lead to ‘poaching
externalities’ and (b) imperfect information in the job-matching process that can create pecuniary externalities for
training or ‘matching externalities’ (Almeida, Behrman, and Robalino 2012)
122. In the case of poaching externalities, investments in skills are limited when either the employers or the
employees are unable to appropriate the return from the investments in training they are paying for. An extreme case is
when the skills acquired by workers during their training are fully transferable and the employer has limited bargaining
power in keeping the trained labor force because of competition with other employers. At the other extreme is the case
of firm-specific skills, which are valued by a single employer. The returns from investments in this type of skill can be
fully appropriated by the employer because workers cannot sell the skill elsewhere. In the real world, most skills are
partially transferable. Employers invest less because they face the threat that other employers will poach their skilled
workers. Employees also invest less because limited competition for their skills gives market power to employers that
can depress wages—and therefore the rate of return on investments in training.
123. Another source of failure in the labor market leading to underinvestment in training is imperfect or limited
information in the labor market for a particular skill. One consequence is that most employers and workers do not take
wages as a given, but rather bargain for them. For example, if employers have more bargaining power than employees,
then wages will be lower than in a perfectly competitive labor market, and workers would have fewer incentives to invest
in training. Employees underinvest because they would not receive fair remuneration for their higher productivity.
124. Thus, in the presence of asymmetric information and barriers to entry, employees and employers tend to
underinvest in training. According to the Bank Investment Climate Survey 200924 in Nigeria, despite that 35 percent
of the employees have six years of education or less, only 28 percent of their employers interviewed run formal
training.
125. Furthermore, most of the employers do not perceive the lack of adequately educated workforce as an
obstacle (40 percent) or perceived it as a minor obstacle (23 percent). For only 17 percent of them it is a major (13
percent) or very severe obstacle (4 percent). According to the 2007 Bank’s Enterprise Surveys,25 complaints about the
lack of adequate skills are more often voiced by firms that are newer, faster-growing, more outwardly oriented and more
eager to move up the technology ladder.
126. The reason why the lack of skills is not perceived as a major constraint is due to the presence of bigger
constraints affecting enterprises’ business. The main ones mentioned by employers are the inefficient or inadequate
supply of electricity (for 55 percent it represents a very severe obstacle), corruption and macroeconomic environment
(17 percent), and tax rate and tax administration (13–15 percent).
Employers’ perceptions of barriers to job creation: Comparing Nigeria with other African countries
127. In 2011 McKinsey conducted a survey of 1,373 business owners and executives in 5 African countries (Egypt,
Kenya, Nigeria, Senegal, and South Africa). The respondents came from retail (23 percent), manufacturing (15 percent),
agriculture (13 percent), construction (13 percent), hospitality (12 percent), and the remainder from transport,
communications, community services, finance, and real estate. The majority of the employers surveyed were in small
business. The sample size of the survey is too small to be representative of African business or at the country level.
Nevertheless it offers interesting qualitative information on the perceived lack of workers with the appropriate technical
skills, or job experience and ‘work readiness’.
24 The Bank Investment Climate Survey in Nigeria in 2009 consisted of a series of structured, face-to-face interviews
with key senior managers/owners of a sample of 3,157 establishments across 26 states (Adamawa, Akwa Ibom,
Bayelsa, Benue, Borno, Delta, Ebonyi, Edo, Ekiti, Gombe, Imo, Jigawa, Katsina, Kebbi, Kogi, Kwara, Nasarawa,
Niger, Ondo, Osun, Oyo, Plateau, Rivers, Taraba, Yobe, and Zamfara) representing most sectors of activity and firm
sizes. Following the ISIC classification, the following industries were targeted: all manufacturing sectors, construction,
retail and wholesale services, hotels and restaurants, transport, storage, and communications, and computer and related
activities. 25 The Bank’s Enterprise Surveys collect data from key manufacturing and service sectors in every region of the world.
The industries included in the surveys include the following (according to ISIC classification): all manufacturing sectors,
construction, services, and transport, storage, and communications.

- 50 -
128. The McKinsey survey confirms that the lack of finance and infrastructure (especially electricity) are the main
obstacles perceived by employers to growth. Nigerian businesses saw an economy full of opportunities but lack of
operating environment to be able to capture them. Nigerian businesses cited a lack of qualified candidates as one of their
top three constraints on growth. This reflects the fact that inadequate infrastructure and financing are more pressing
concerns.
129. Nevertheless, as employers in all African countries represented in the survey have stated, Nigerian employers
say that the most common barriers to hiring are that good candidates are too expensive, lack job readiness (including
punctuality and dependability), and lack prior employment experience (Figure 2-12). The high cost of good candidates
can be interpreted as evidence of insufficient supply of such candidates and that the margins and growth prospects of
the smallest business are not high enough to justify hiring the most qualified and costly talent.
D. Imperfections in capital markets
Need for understanding of capital markets for education and skills development: Solving the lack of
access to financial means
130. One of the functions of the government with regard to facilitating appropriate investments in training is to
guarantee that individuals have the financial means to pay for it. Training decisions among low-income workers are
negatively affected by the lack of financing, as is the case for investment in education. In principle, people could borrow,
but lack of access to external financing, in particular bank credit, may depress efficient investment in training.
131. One way to mitigate this problem is for governments to facilitate individual and firm access to credit
through direct provision of credit or guarantees to financial institutions that finance specific types of training.
For low-income workers, straight subsidies to finance training (e.g., training vouchers) may also be considered.
Figure 2-12. The top 3 obstacles for employers when trying to hire new employees
Source: McKinsey Survey of African Businesses, 2011. Note: 1Lack of readiness includes, for example, punctuality
and dependability.
- 51 -
E. Individual decision-making failures
Household and student decisions about post-basic education are not well informed
132. As mentioned above, in 2011 about 1.4 million candidates were seeking admissions for about 150,000
university enrolment slots (JAMB, 2011). This might reflect a shortage in supply and a preference for university over
TVET paths.
133. The lack of attractiveness of TVET is an issue common to many African countries. Parents who can afford
university rarely send their child to a vocational school. They predominantly prefer general education. King (2013)
suggests that this preference is not a mere prejudice against TVET. On the contrary, the choice of university over TVET
is based on rational decision making. Indeed, many people believe that TVET does not prepare graduates for the labor
market as well as general education does.
134. This excess demand for university education is fueled by the growing misconception that a university degree is
a guarantee to succeed in life irrespective of what one studies. However, whether university graduates have better
opportunities in the labor market than TVET graduates is a matter of debate. Going to university is considered to be
prestigious. However, vocational training may provide students with skills that are a more powerful gun to fight
unemployment.
135. A major concern is that if university courses are not deliberately skewed toward the development of skilled
labor in critical areas that address the country’s skills gaps, traditional degrees per se cannot produce a critical mass of
skilled people to drive economic growth and development. Where this is the case, university graduates will not be able
to recoup quick returns on their investment, and ultimately it will result in a significant loss of valuable human capital.
F. Planning and coordination failures
Issues with imbalance in skills demand and supply
136. The mismatch between labor demand and supply is a broad concern across Africa, not only in Nigeria. The
fundamental issue in skills development is how best to balance the supply of skills with the demand in the labor market
(Johansson and Adams 2004).
137. National socioeconomic development largely depends on a country’s ability to effectively develop and utilize
its human resources. Such development is better realized through implementation of plans, policies, and programs that
are informed by relevant, reliable, timely, and organized information on major aspects of the labor market. If the
demand is unsatisfied, skills bottlenecks impede growth and development. If the supply is not absorbed,
unemployment and waste of scarce resources ensue. This section discusses issues concerned with planning and
coordination failures in the management of human resources in Nigeria.
Understanding demand for skills from the market and failures in planning: Poor market information and poor
signaling of needs
138. The main objective of a workforce planning is to develop a strategy to match the supply of workers to the
availability of jobs at the national and subnational levels. Workforce planning involves reviewing current workforce
resources, forecasting future requirements and availability, and taking steps to ensure that the supply of people
and skills meets demand. Without strategic national workforce planning, the national education system is likely to fail
to address the skills demands of the labor market.

- 52 -
139. Nigeria long ago identified the need for labor market information and recognized its role in the
development of national human resource plans. In Nigeria, the poor national workforce planning is not unrelated to
the discontinuation of the original practice of five-year national development plans,26 abandoned since late 1970s. It is
worth mentioning the need for a functional labor market information system (LMIS), which has been the rationale behind
the Labor Market Observatory (LMO) set up in 2012 as a pilot, funded by the federal government through Nigeria’s
STEP-B Project, and disrupted after a short period.
140. The LMIS is based on the analysis of movements in demand and supply. This approach is founded on the
idea that, to influence developments effectively, it is essential to base the formulation and implementation of plans and
policies on comprehensive (i.e., relevant, reliable, systematized, and up-to-date) information on key aspects of human
resources.
141. The LMIS approach, which emerged in the 1990s, is only one approach to workforce planning. One of the
earliest approaches attempted to balance supply and demand using requirements forecasting, in which skills requirements
by sector are forecast 5–10 years ahead. However, the forecasts proved uniformly unreliable (Middleton, Ziderman, and
Adams 1993). Another approach to investment in skills development, and indirectly to balancing supply and demand, is
rate-of-return analysis, which compares the discounted future income stream of graduates with the direct and indirect
costs of producing their skills. The advantage of the rate-of-return analysis is that it compares the costs as well as the
benefits of acquiring education and training (Richards and Amjad 1994).
142. The main labor market indicators captured by the LMIS are employment rates, waiting times for
employment, and wages for various occupations. High relative wages, assuming they are free to float, indicate scarcity
of skills, and low or declining wages point to oversupplies. This third approach tries to solve one of the causes at the
origin of a failure in coordination between the labor market, the educational institutions, and the Nigerian labor force,
which is asymmetric information. If such comprehensive information is not available to its users, it is almost impossible
to obtain a realistic appraisal of the country’s major labor market or, more generally, human resource problems, options,
and priorities. In addition, the absence of comprehensive labor market information makes it impossible to guide higher
education institutions on the quality and relevance of their products to the labor market for purposes of effective
academic planning.
143. Some of the reasons many developing economies fail to develop and provide labor market information
(LMI for their own policy development and planning include the following:
Limited capacity and means for conducting, in an efficient, consistent, and prompt manner, the collection,
processing, analysis, and dissemination of LMI
Bad and/or incomplete coverage of the field
Inability to compile, or insufficient attention to compiling, information from various sources
Inability to incorporate informal sector data collection exercises into the national framework
Ill-adapted resources for statistical programs and other activities aimed at generating LMI
Difficulty for statistical data users to clearly define their needs and submit them to LMI producers
Inadequate analysis of information gathered to address the needs of decision makers
LMI systems failing to provide timely responses to emerging situations
26 A national development plan refers to the plan formulated by the National Economic Council on the systematic
determination of manpower requirements and supply of the sectors of the economy over a future period of time. It
embodies policies and strategies on how human resources can be improved in quality and productivity and how they
can be efficiently allocated to various jobs, with a view to accelerating attainment of the country's overall economic
and social objectives. (For a review of the national development plans adopted in Nigeria in the last four decades, see
Marcellus 2009.)

- 53 -
Poor structural mechanisms for establishing the link between policy implementation and labor market
trends
Imbalance between qualitative and quantitative information on the labor market
Failure to assess the relevance and utility of the information for the various users, particularly those
outside public ministries, departments, and agencies
144. Nigeria lacks an effective labor market information system (LMIS) due to the absence of coherent government
policies and actions in support of such a system. The organ of government established to address this challenge, the
National Manpower Board (NMB) was merged, by executive order, with the Nigerian Institute of Social and Economic
Research (NISER) without requisite changes to the extant laws at both ends. Consequently, no institutional
framework exists for the collection, collation, analysis, and dissemination of labor market information.
145. Timely time series data that are available to central agencies for the purpose of macroeconomic management
could be made more widely available for planning and policy formulation in human resource development. In general,
agencies are collecting extensive LMI data at considerable cost, but this information is often used only for internal
purposes or is published with long delays. On the other hand, there is a need to carefully review the wide range of
data being collected with a view to containing costs, avoiding duplication and reducing the burden on the
respondents.
146. As mentioned above, coordination between the education system, on the supply side, and the labor
market, on the demand side, is essential for a productive and efficient economy. The importance of a comprehensive
certification system such as the NVQF and of timely or accurate labor market information has already been emphasized.
As the 2010 Poverty Reduction and Economic Management Study reminds: “The existence of an NVQF would facilitate
the development and certification of new short-term programs that address emerging and short-term needs such as skills
upgrading for the informal sector. An NVQF would also, if appropriately managed, open the national certification
procedures to private and community-based training institutions. Hence, the establishment of an NVQF would provide
opportunities for the large group of young people who have acquired their skills in the informal sector to get recognition
for their competencies.” On the supply side, while the NBTE has taken the first step adopting the NVQF, the process
needs to be accelerated and made more inclusive. On the demand side, much more needs to be done to obtain a viable
labor market information system, with proper coordination as equally vital to the economy.
Too many parastatals in the education sector complicate planning and coordination
147. Other important bottlenecks in the planning, creation, and management of valuable human resources are the
failure in horizontal coordination (that is, across government agencies), vertical coordination (that is, between federal
and state structures), and coordination between the labor market and the educational institutions.
148. In the first case, effective horizontal coordination across government agencies is weak, and institutional
complexity at the federal level is worsened by the duplication of institutions, roles, and functions at the state level.
Mention was already made of the institutional complexity of the education system. This same complexity refers to the
significant number of public institutions currently active in the delivery of industrial policy and facilitating the school-
to-work transition. Key ministries involved in the design of industrial policy include the Federal Ministry of Finance
and the Federal Ministry of Commerce, Industry, and Trade together with a number of agencies: the Federal Inland
Revenue Service (FIRS), Nigerian Investment Promotion Commission (NIPC), the Corporate Affairs Commission
(CAC), Nigeria Export Processing Zones Authority (NEPZA), and the separate Nigeria Export Processing Zones (EPZs)
and Nigerian Export Promotion Council (NEPC). Furthermore, a number of institutions have been created to facilitate
the school-to-work transition. These institutions, such as the Industrial Training Fund (ITF, the National Directorate of
Employment, the Bank of Industry, and the Bank of Agriculture, provide short-term skills programs and apprenticeship
programs for industry, practical training for students and graduates of tertiary institutions of finance skills development,
and youth employment programs.
- 54 -
G. Informal TVET Sector and Skills for the informal economy
149. As mentioned in Chapter 1, most of Nigeria’s nonfarm workforce is employed in the informal sector and most
of the informal nonfarm workers are young. In light of the significant and growing role of informal sector employment,
particularly for youth, finding ways and means of increasing the productivity and earnings of those in the informal sector
in Nigeria is crucial.
150. Most jobs are created in micro, small, and medium enterprises that fall mostly in the informal sector.
Thus, training systems that address skills requirements and prepare people to be productively employed (or self-
employed) are necessarily required to provide adequate human resources for the informal sector. In spite of this need,
an assessment of the skills requirements of the informal sector is still missing, and the curricula of the education and
training institutions are not designed to target the specific needs of the informal sector. As the recent work “Improving
Skills Development in the Informal Sector” argues “Nigeria’s TVET sector … is too ‘formalized’ and there is no
provision to cater for those who acquire skills informally; neither to assess them on the job, nor to provide for
their progression” (Adams, de Silva, and Razmara 2013).
151. Formal and informal sector workers differ along a number of characteristics. For example, the informal
sector is characterized by the absolute prevalence of micro and small enterprise; average earnings are higher in the formal
sector than in the informal sector (and both are higher than those of farming); and workers in the informal sector have
less formal schooling than those in the formal sector.
152. It is worth noting that, despite low skill levels in the informal sector, the lack of awareness of skills
shortcomings and of opportunities to apply newly acquired skills stunts the demand (and the willingness to pay)
for training. In many countries, such as Kenya and Uganda, few informal-sector operators see the need for, or the value
of, skills development. The limited access to capital or electricity, inadequate demand for their goods and services, and
lack of appropriate equipment are the main concerns. Lack of qualified workers is at the bottom of the list.
153. The sources of skills vary between informal and formal sector workers, and the existing public training
capacity is inadequate. The scant enterprise-provided training available in Nigeria is mostly for the formal sector.
Informal workers are more likely to have received skills through apprenticeships. In particular, for informal
workers, having a basic level of literacy and numeracy increases the likelihood of becoming apprentices.
154. Nevertheless, while apprenticeships increase the predicted probability of informal sector participation,
the return for apprenticeships is not significant. In fact, Adams, de Silva, and Razmara 2013 study reveals that
conditional on being in the informal sector, an apprenticeship does not affect earnings significantly. In general, acquiring
more education does not pay off as much in the informal sector as it does in the formal sector. This gap in earnings
cannot be explained exclusively by a difference in the workers’ characteristics (such the level of education and other
demographic characteristics). At least part of the earnings premium of the formal sector wage workers over workers in
the informal sector is not related to them.
155. Adams, de Silva, and Razmara (2013) suggests a number of different possible interpretations of the lower
returns to education in the informal sector:
Inadequate curricula and quality concerns for the skills training opportunities open to the informal
sector.
Rationing effects: Individuals who acquire education but nonetheless fail to secure formal sector work
end up in the informal sector where their education is not needed and hence not remunerated.
Convex wage earnings profile: Informal workers tend to have low returns because they have low levels
of education, and formal sector workers have high returns because they manage to get to the stage where
returns are high.
Signaling: The lack of education is less severe in the informal sector and higher in the formal sector
where education is used as a signal or a proxy of the expected capacity of workers. This pre-hiring
screening process is more important in the formal sector where the firing costs are high.

- 55 -
156. Concerning skills development training available to the informal sector, informal, short-term vocational training
and apprenticeships are the two most likely training opportunities for informal workers. Nevertheless, as described
above, apprenticeships do not lead to a significant return with regard to earnings and an improvement in labor market
opportunities.
157. One of the main problems with the skills opportunities open to the informal sector is that they are largely
unregulated and of unknown quality. The lack of standards in certification reduces the efficiency of training with
regard to signaling of acquired competencies. Furthermore, as for TVET and other skills development programs, the
lack of direct connection to labor market needs further reduces the effectiveness of training.
158. Finally, a basic level of numeracy and literacy is not only a requirement to qualify for apprenticeship but
is also an important factor in determining the returns to the training Investment. Literacy or the lack thereof is
likely to be an issue for skills development in the informal sector.
159. Training for the informal sector is necessarily different from that for the formal sector (in its flexible
schedule and its preference for merging technical skills with business management skills besides integrating them with
basic literacy skills training). Traditional apprenticeships are not just about technical training. Successful examples are
available of programs that combine learning for livelihoods with literacy training as well as integrate a life skills training
module to address some of the crucial barriers faced by informal workers, such as the lack of basic interpersonal skills,
self-esteem, leadership, and so on, or more ‘real’ constraints such as access to secure workplaces, credit, and technology.
160. On this last point, training interventions can have an added benefit in raising productivity and incomes in micro
and small enterprises by acting as an entry point for upgrading the technology of enterprises.
161. According to the ‘Skills Development in Sub-Saharan Africa’ study (Johansson and Adams 2004) training for
self-employment in micro enterprises requires major changes for most training providers, particularly with regard
to the following areas:
Training content. Practical business skills need to be taught, and training for examinations and official
certificates de-emphasized.
Linkages with labor market needs. Technical training will need to be broadened beyond the standard
trades for which it is now offered (for example, tailoring, carpentry) to avoid market saturation for the
products of these trades.
Training delivery. Training has to be short, modest, and competency based. Entry requirements should
be flexible and training hours and venues convenient for trainees.
Training materials. Trainees, even poorly educated ones, should be able to follow the materials.
Certification. Certification should be based on demonstrable competency.
Training follow-up. Early attention should be given to complementary services needed to succeed as a
self-employed person (e.g, credit, marketing, business counseling).
162. With regard to financing, experience over the past decades has shown how shifting financing to the demand
side through training funds and vouchers for workers can elicit a new supply response from trainers for the informal
sector.
163. Having looked at the structural problems of unemployment and underemployment, the reasons behind failures
in the jobs and skills markets, and Nigeria’s skills development needs in the informal sector, the policy note turns next
to the country’s unexploited human capital, that is, the population who could potentially fill future labor needs in support
of economic growth.
- 56 -
CHAPTER 3. STRATEGIES FOR ACCELERATING SKILLS DEVELOPMENT TO SUPPORT
ECONOMIC GROWTH AND SHARED PROSPERITY
164. This chapter focuses on Nigeria’s unexploited human capital, that is, the population who could potentially fill future
labor needs so that Nigeria can take advantage of its demographic dividend. In particular, the chapter focuses on (a) the
unemployed labor force; (b) people who are out of the labor force; and (c) people who are underemployed, as defined in Box
3.
Box 3. Labor force definitions
The labor force is the actual number of people available for work. A country’s labor force includes people aged 15–64, both
employed and unemployed (and seeking a job). The labor force participation (LFP) rate is defined as the ratio of the labor
force and the overall size of their cohort (national population of the same age group).
The employed labor force refers to those working for pay, including those who did not work because they were sick or
waiting to start a new job, those working for profit, and those in apprenticeships. The unemployed labor force includes
those who are looking for a job and laid off for 30 days or less. The employment/unemployment rate can be computed as a
share of employed/unemployed people over the total 15–64 age population or over the labor force (excluding inactive
population).
The labor force definition distinguishes between these two groups and the inactive population, which includes people who
are at school as well as those not working, not looking for work, and not in school. This last group is defined as NEET (not
in education, employment, or training). The inactive subgroup is ultimately broken down to distinguish between married and
unmarried people. In Nigeria, as in many other African countries, married women are more likely to be inactive in the labor
force than unmarried women. The NEET rate is defined as a share of the 15–64 age population (including both the active
and inactive populations).
Among the employed, the underemployed are those employees working fewer than 40 hours (considering primary and
secondary occupations together) and willing to work more hours. Underemployment is defined both as a share of active labor
force (employed and unemployed) and as a share of employed labor force only.
Finally, a distinction is made between those employed in the formal sector and the informal sector. A reasonable and
relatively standard definition of ‘informal employment’ is ‘wage workers’ who are in an informal employment situation and
non-wage workers or the self-employed who work in informal enterprises. Using the GHS, wage workers are defined as
formal/informal wage workers based on whether they contribute or not to the National Health Insurance Scheme.27 Within
the informal sector, informal wage workers are separated from the self-employed in agriculture and in other sectors.28
A. Capitalizing on Nigeria’s demographic dividend
165. Nigeria is on the threshold of a major demographic transition. Since independence, Nigeria has struggled against
very high fertility rates, resulting in a high ratio of children in the population. The increase in working-age share (or
‘demographic dividend’) can result from a lag between declines in mortality and fertility and might translate into a ‘boom’
of economic growth. Nevertheless, in the past decades, Nigeria’s rapid economic growth was not propelled by this transition.
166. A dividend from a favorable demographic transition may create a window of opportunity for significant
economic growth in Nigeria, though it is not automatic. According to Bloom et al. (2010), the share of working-age people
in the population is expected to rise significantly from 2010 to 2050. With the demographic dividend, by 2030 Nigeria’s
economy could be three times larger than today’s, and Nigeria could lift about 5.8 million more people out of poverty by
2020 and an additional 31.8 million by 2030.
27 Notably, participation in the National Health Insurance Scheme should be mandatory for formally employed workers. 28 The assumption is that self-employment is always informal. In theory, the formal sector should also include workers in
formal enterprises identified as those that are not registered with the authorities. In practice, however, there were too many
missing observations on the registration status of household enterprises.

- 57 -
167. The big challenge ahead for Nigeria is that, to realize its demographic dividend, it has to create an enormous
number of new job opportunities. Bloom et al. (2010) estimate that Nigeria will need to create around 24 million new jobs
in the next decade and around 50 million new jobs over 2010–2030. Furthermore, the jobs will have to be productive. This
will require increasing Nigeria’s human capital, which cannot be achieved without making large investments in education,
together with health, gender parity, and institutions.
168. The nature of unemployment and underemployment problems in Nigeria is, as in many Sub-Saharan African
countries, a structural problem. Most economies on the continent are unable to generate growth rates that are sufficiently
high enough to absorb the ever-increasing labor supply in the modern sector. In fact, the current level of formal employment
reflects only a small proportion of the workforce.
169. The nature and trend of unemployment and underemployment in Nigeria poses an even more serious concern
when demographics are factored in. The population age group 0–14 represented nearly 40 percent of the total Nigerian
population in 2011, and about 57 percent were under 24 years old (Figure 3-1). More recently, the 2012 National Baseline
Youth Survey29 estimated the population of youths (15–35 years) in Nigeria at 64 million.
Figure 3-1. Population pyramid age by sex (2011)
Source: Author’s calculation. Data: GHS 2010–2011.
170. The northern states have an especially young population (Figure 3-2). In the North-East and North-West, nearly half
of the population is under 15. This suggests that targeting the North and creating the right skills for the new workforce generation
is the right direction to ‘activate’ the unexploited potential.
Figure 3-2. Population composition by age group by geopolitical areas (2011)
Source: Author’s calculation. Data: GHS 2010–2011.
29 The survey, which was conducted in 2012, covered all of the 36 states of the Federation and Federal Capital Territory
(Abuja). The target population canvassed was the youths, with the sampling domain being the households and some
institutions (police command headquarters as well as the Drug and Law Enforcement Agency (NDLEA) in each state.
Percentage
Ag
e G
rou
ps
Female Male
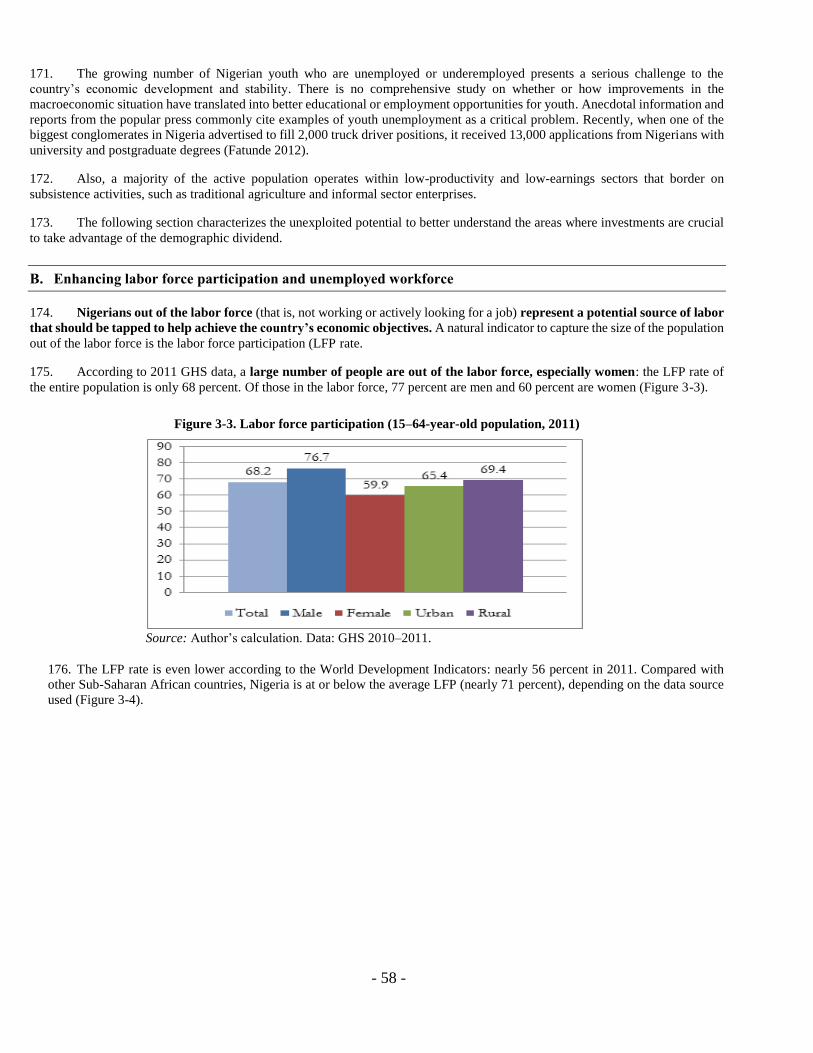
- 58 -
171. The growing number of Nigerian youth who are unemployed or underemployed presents a serious challenge to the
country’s economic development and stability. There is no comprehensive study on whether or how improvements in the
macroeconomic situation have translated into better educational or employment opportunities for youth. Anecdotal information and
reports from the popular press commonly cite examples of youth unemployment as a critical problem. Recently, when one of the
biggest conglomerates in Nigeria advertised to fill 2,000 truck driver positions, it received 13,000 applications from Nigerians with
university and postgraduate degrees (Fatunde 2012).
172. Also, a majority of the active population operates within low-productivity and low-earnings sectors that border on
subsistence activities, such as traditional agriculture and informal sector enterprises.
173. The following section characterizes the unexploited potential to better understand the areas where investments are crucial
to take advantage of the demographic dividend.
B. Enhancing labor force participation and unemployed workforce
174. Nigerians out of the labor force (that is, not working or actively looking for a job) represent a potential source of labor
that should be tapped to help achieve the country’s economic objectives. A natural indicator to capture the size of the population
out of the labor force is the labor force participation (LFP rate.
175. According to 2011 GHS data, a large number of people are out of the labor force, especially women: the LFP rate of
the entire population is only 68 percent. Of those in the labor force, 77 percent are men and 60 percent are women (Figure 3-3).
Figure 3-3. Labor force participation (15–64-year-old population, 2011)
Source: Author’s calculation. Data: GHS 2010–2011.
176. The LFP rate is even lower according to the World Development Indicators: nearly 56 percent in 2011. Compared with
other Sub-Saharan African countries, Nigeria is at or below the average LFP (nearly 71 percent), depending on the data source
used (Figure 3-4).
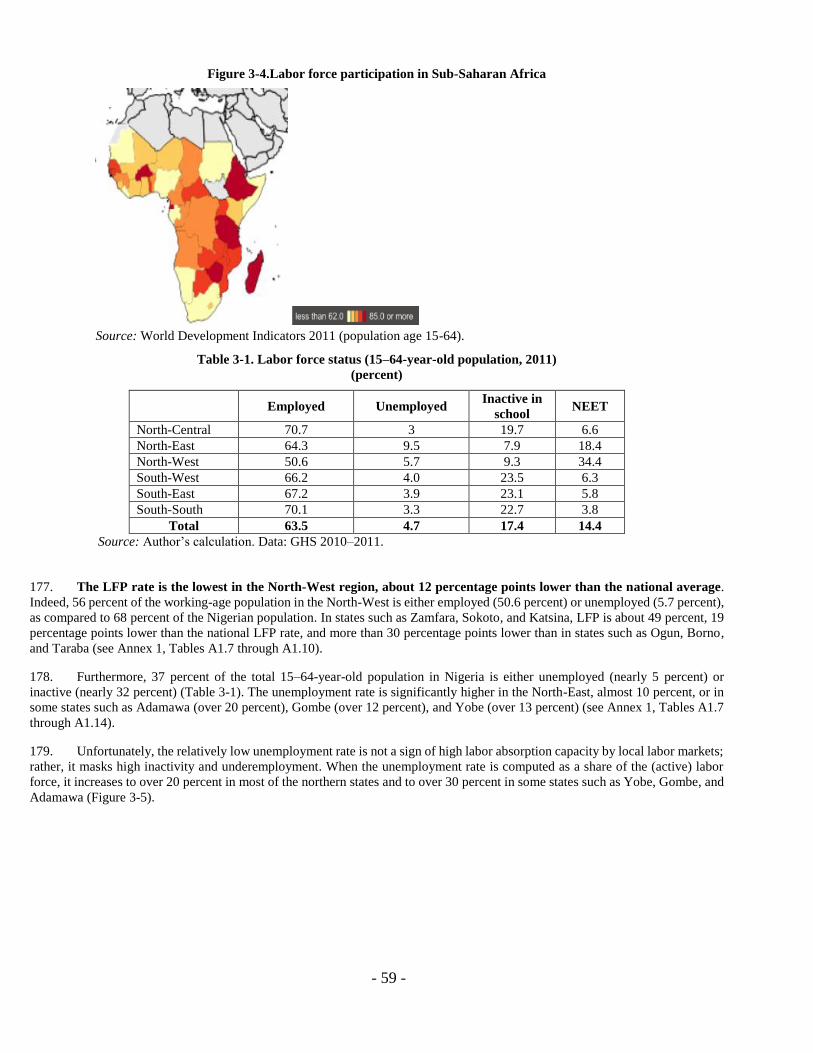
- 59 -
Figure 3-4.Labor force participation in Sub-Saharan Africa
Source: World Development Indicators 2011 (population age 15-64).
Table 3-1. Labor force status (15–64-year-old population, 2011)
(percent)
Employed Unemployed Inactive in
school NEET
North-Central 70.7 3 19.7 6.6
North-East 64.3 9.5 7.9 18.4
North-West 50.6 5.7 9.3 34.4
South-West 66.2 4.0 23.5 6.3
South-East 67.2 3.9 23.1 5.8
South-South 70.1 3.3 22.7 3.8
Total 63.5 4.7 17.4 14.4
Source: Author’s calculation. Data: GHS 2010–2011.
177. The LFP rate is the lowest in the North-West region, about 12 percentage points lower than the national average.
Indeed, 56 percent of the working-age population in the North-West is either employed (50.6 percent) or unemployed (5.7 percent),
as compared to 68 percent of the Nigerian population. In states such as Zamfara, Sokoto, and Katsina, LFP is about 49 percent, 19
percentage points lower than the national LFP rate, and more than 30 percentage points lower than in states such as Ogun, Borno,
and Taraba (see Annex 1, Tables A1.7 through A1.10).
178. Furthermore, 37 percent of the total 15–64-year-old population in Nigeria is either unemployed (nearly 5 percent) or
inactive (nearly 32 percent) (Table 3-1). The unemployment rate is significantly higher in the North-East, almost 10 percent, or in
some states such as Adamawa (over 20 percent), Gombe (over 12 percent), and Yobe (over 13 percent) (see Annex 1, Tables A1.7
through A1.14).
179. Unfortunately, the relatively low unemployment rate is not a sign of high labor absorption capacity by local labor markets;
rather, it masks high inactivity and underemployment. When the unemployment rate is computed as a share of the (active) labor
force, it increases to over 20 percent in most of the northern states and to over 30 percent in some states such as Yobe, Gombe, and
Adamawa (Figure 3-5).

- 60 -
Figure 3-5. Unemployment rate (15-64 population, 2011)
Source: Author’s calculation. Data: GHS 2010–2011.
Note: Unemployment is defined as a share of the (active) labor force.
180. The employment rate is lower among the youngest (15–24 year olds) and among women (Table 3-2). The main reason the
employment rate is lower among the youngest is that many of them (48 percent) are still at school. The lower rate of women
employed signals the disadvantaged position of women in the labor market.
Table 3-2. Labor force status by age groups, gender, and urban/rural (2011) (percent)
Source:
Author’s
calculation. Data: GHS 2010–2011.
C. Exploiting the potential of the inactive and NEET population: Is it a youth phenomenon only?
181. The LFP rate, inactivity, and the share of NEET population convey information about labor market dynamics. For
instance, declining labor force participation rates could be interpreted in various ways; for example, workers may be discouraged
by poor labor market prospects, or workers may be able (or have) to retire earlier, or young people may choose to remain in the
education system to further their studies.
182. In the case of Nigeria, inactivity does not exclusively concern the youngest. Indeed, although nearly 61 percent of the
19–24 aged population are inactive, a large share of them (49 percent) are students, while about 13 percent are economically
inactive, not working or looking for jobs or not in school (NEET). The share of NEET population is the highest among the 25–
34 and 35–44 aged population (20 percent and 15 percent, respectively) (Table 3-2).
183. The share of NEET is the highest among the married population and, in particular, among married women. About
25 percent of women are NEET and 9 out of 10 NEET women are married (while only 50 percent of NEET men are married).
Total 15–
24
25–
34
35–
44
45–
64 Male Female Urban Rural
Employed 63.5 33.5 64.4 81.3 86.4 71.3 55.9 60.9 64.6
Unemployed 4.7 5.6 6.9 3.1 2.6 5.4 4.0 4.5 4.8
Inactive in
school 17.4 48.5 9.1 0.9 0.2 19.8 15.1 22.5 15.3
NEET 14.4 12.4 19.7 14.7 10.8 3.4 24.9 12.1 15.2
NEET, married 12.0 8.1 17.5 14.1 9.2 1.2 22.4 8.9 13.2
NEET,
unmarried 2.4 4.3 2.2 0.6 1.6 2.2 2.5 3.2 2.0
Total 100 100 100 100 100 100 100 100 100
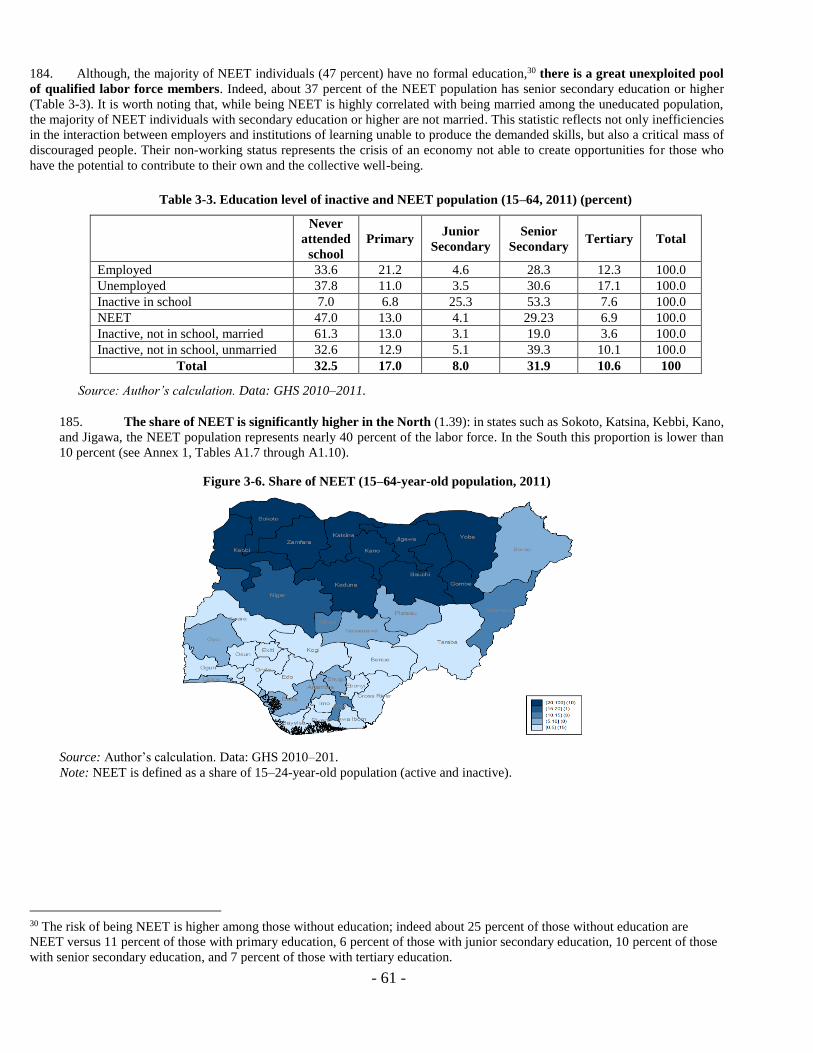
- 61 -
184. Although, the majority of NEET individuals (47 percent) have no formal education,30 there is a great unexploited pool
of qualified labor force members. Indeed, about 37 percent of the NEET population has senior secondary education or higher
(Table 3-3). It is worth noting that, while being NEET is highly correlated with being married among the uneducated population,
the majority of NEET individuals with secondary education or higher are not married. This statistic reflects not only inefficiencies
in the interaction between employers and institutions of learning unable to produce the demanded skills, but also a critical mass of
discouraged people. Their non-working status represents the crisis of an economy not able to create opportunities for those who
have the potential to contribute to their own and the collective well-being.
185. The share of NEET is significantly higher in the North (1.39): in states such as Sokoto, Katsina, Kebbi, Kano,
and Jigawa, the NEET population represents nearly 40 percent of the labor force. In the South this proportion is lower than
10 percent (see Annex 1, Tables A1.7 through A1.10).
Figure 3-6. Share of NEET (15–64-year-old population, 2011)
Source: Author’s calculation. Data: GHS 2010–201.
Note: NEET is defined as a share of 15–24-year-old population (active and inactive).
30 The risk of being NEET is higher among those without education; indeed about 25 percent of those without education are
NEET versus 11 percent of those with primary education, 6 percent of those with junior secondary education, 10 percent of those
with senior secondary education, and 7 percent of those with tertiary education.
Table 3-3. Education level of inactive and NEET population (15–64, 2011) (percent)
Never
attended
school
Primary Junior
Secondary
Senior
Secondary Tertiary Total
Employed 33.6 21.2 4.6 28.3 12.3 100.0
Unemployed 37.8 11.0 3.5 30.6 17.1 100.0
Inactive in school 7.0 6.8 25.3 53.3 7.6 100.0
NEET 47.0 13.0 4.1 29.23 6.9 100.0
Inactive, not in school, married 61.3 13.0 3.1 19.0 3.6 100.0
Inactive, not in school, unmarried 32.6 12.9 5.1 39.3 10.1 100.0
Total 32.5 17.0 8.0 31.9 10.6 100
Source: Author’s calculation. Data: GHS 2010–2011.

- 62 -
D. Increasing productivity of the underemployed workforce
186. About 6 percent of the employed labor force (corresponding to 4 percent of the 15–64-year-old population) is
underemployed (Table 3-4). Underemployment is higher among the youngest labor force (9 percent) and among the male labor
force (6 percent of the male employed labor force versus 4 percent for the female employed labor force is underemployed).
Furthermore, the rural employed labor force accounts for a larger proportion of the underemployed.
187. The underemployed are a mix of educated and uneducated people. Holders of bachelor’s degrees make up about 11 percent
of the underemployed while those with senior secondary education make up 26 percent (Table 3-5). While Nigeria has one of the
highest tertiary enrolment rates in the African continent, a common perception is that the relevance of secondary and university
education has not matched the needs of the Nigerian economy, leaving many graduates with weak technical skills and poor
prospects for stable employment (Fatunde 2013).
188. The problem of inactivity and low productivity does not only affect university or secondary school graduates, who represent
a relatively small proportion of the young population. Indeed, about 40 percent of the underemployed have never attended school
Table 3-4. Distribution of underemployment by age, gender, rural/urban (2011) (percent)
Total 15–24 25–34 35–44 45–64 Male Female Urban Rural
Employed 94.5 91.1 93.9 95.3 95.9 94.0 95.1 95.7 94.0
Underemployed 5.5 8.9 6.1 4.7 4.1 6.0 4.9 4.3 6.0
Total 100 100 100 100 100 100 100 100 100
Source: Author’s calculation. Data: GHS 2010–2011.
Note: Underemployment is defined as a share of the employed labor force.
Figure 3-7. Underemployment by economic sector and occupation (15–64 and 15–24-year-old population, 2011)
Source: Author’s calculation. Data: GHS 2010–2011.
Note: Underemployment is defined as a share of employed labor force.
Table 3-5. Distribution of underemployment by education (15–64-year-old population, 2011) (percent)
Never
Attended
School
Primary Junior
Secondary
Senior
Secondary Tertiary Total
Employed 33.2 21.5 4.6 28.5 12.3 100.0
Underemployed 40.1 17.1 5.2 26.1 11.4 100.0
Total 33.6 21.2 4.6 28.3 12.3 100
Source: Author’s calculation. Data: GHS 2010–2011.
Note: Underemployment is defined as a share of the employed labor force.
0.0
8.2
3.4
17.3
5.7
10.2
7.8
3.8
12.8
9.1
2.94.8
2.41.1
3.6
7.0
4.33.1
8.1
02468
101214161820
Legislators,Senior
Officials andManagers
Profesionals Techniciansand
AssociateProfessionals
Clerks ServiceWorkers and
Shop andMarket Sales
Workers
SkilledAgriculturaland Fishery
Workers
Craft andrelatedTrades
Workers
Plant andMachine
Operatorsand
Assemblers
ElementaryOccupations
Total
15-24 15-64
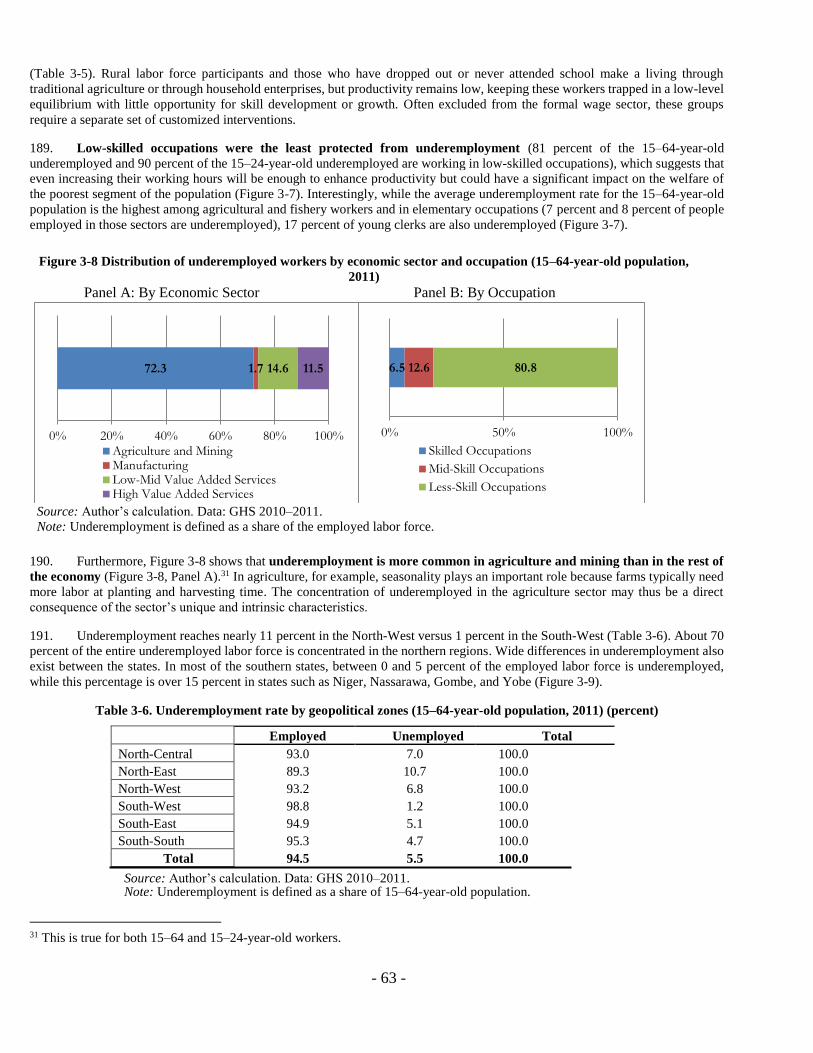
- 63 -
(Table 3-5). Rural labor force participants and those who have dropped out or never attended school make a living through
traditional agriculture or through household enterprises, but productivity remains low, keeping these workers trapped in a low-level
equilibrium with little opportunity for skill development or growth. Often excluded from the formal wage sector, these groups
require a separate set of customized interventions.
189. Low-skilled occupations were the least protected from underemployment (81 percent of the 15–64-year-old
underemployed and 90 percent of the 15–24-year-old underemployed are working in low-skilled occupations), which suggests that
even increasing their working hours will be enough to enhance productivity but could have a significant impact on the welfare of
the poorest segment of the population (Figure 3-7). Interestingly, while the average underemployment rate for the 15–64-year-old
population is the highest among agricultural and fishery workers and in elementary occupations (7 percent and 8 percent of people
employed in those sectors are underemployed), 17 percent of young clerks are also underemployed (Figure 3-7).
Figure 3-8 Distribution of underemployed workers by economic sector and occupation (15–64-year-old population,
2011) Panel A: By Economic Sector Panel B: By Occupation
Source: Author’s calculation. Data: GHS 2010–2011.
Note: Underemployment is defined as a share of the employed labor force.
190. Furthermore, Figure 3-8 shows that underemployment is more common in agriculture and mining than in the rest of
the economy (Figure 3-8, Panel A).31 In agriculture, for example, seasonality plays an important role because farms typically need
more labor at planting and harvesting time. The concentration of underemployed in the agriculture sector may thus be a direct
consequence of the sector’s unique and intrinsic characteristics.
191. Underemployment reaches nearly 11 percent in the North-West versus 1 percent in the South-West (Table 3-6). About 70
percent of the entire underemployed labor force is concentrated in the northern regions. Wide differences in underemployment also
exist between the states. In most of the southern states, between 0 and 5 percent of the employed labor force is underemployed,
while this percentage is over 15 percent in states such as Niger, Nassarawa, Gombe, and Yobe (Figure 3-9).
Table 3-6. Underemployment rate by geopolitical zones (15–64-year-old population, 2011) (percent)
Employed Unemployed Total
North-Central 93.0 7.0 100.0
North-East 89.3 10.7 100.0
North-West 93.2 6.8 100.0
South-West 98.8 1.2 100.0
South-East 94.9 5.1 100.0
South-South 95.3 4.7 100.0
Total 94.5 5.5 100.0
Source: Author’s calculation. Data: GHS 2010–2011. Note: Underemployment is defined as a share of 15–64-year-old population.
31 This is true for both 15–64 and 15–24-year-old workers.
6.5 12.6 80.8
0% 50% 100%
Skilled Occupations
Mid-Skill Occupations
Less-Skill Occupations
72.3 1.7 14.6 11.5
0% 20% 40% 60% 80% 100%Agriculture and MiningManufacturingLow-Mid Value Added ServicesHigh Value Added Services

- 64 -
E. Improving outcomes for workers in the informal sector
192. Informal sector activities hold a dominant share of Nigerian economic sectors.32 In 2011, only 3.1 percent of the total
employed labor force was working in the formal wage sector. In fact, the rest of the employed labor force is informal, mostly in the
self-employment sector. Over 86 percent of the employed labor force is self-employed, and two out of three work in agriculture
(Table 3-7).
193. The share of youth and women in the informal sector is higher than in the formal sector. Furthermore, rural residents are
more likely than urban residents to be in the informal sector. Nearly 73 percent of the labor force in rural areas is self-employed in
agriculture.
Table 3-7. Formal and informal employees by age groups, gender, urban/rural (2011) (percent)
Total 15–
24 25–34 35–44 45–64 Male Female
Urba
n Rural
Formal Wage Workers 3.1 0.4 2.6 4.2 3.8 3.8 2.3 6.6 1.7
Informal Wage workers
(nonfarm) 10.3 4.7 10.6 13.1 10.6 12.6 7.5 20.7 6.1
Informal Self-
Employed (nonfarm) 28.9 19.7 35.4 31.6 26.1 21.7 38.0 52.4 19.4
Informal Self-
Employed (agriculture) 57.6 75.3 51.4 51.0 59.5 61.9 52.3 20.4 72.7
Total 100 100 100 100 100 100 100 100 100
Source: Author’s calculation. Data: GHS 2010–2011.Note: Formal/informal is defined as a share of the employed labor force.
32 According to the study “Improving Skills Development for the Informal Sector,” in 2007 the size of the informal sector
accounted, on average, for over 50 percent of the GNP (Adams et al. 2013). The informal sector is defined to include the self-
employed (those working on their own or with additional workers) in both farm and nonfarm), the contributing family members,
and the wage workers in small and household enterprises.
Figure 3-9. Underemployment rate (15–64-year-old population, 2011)
Source: Author’s calculation. Data: GHS 2010–2011.
Note: Underemployment is defined as a share of the employed labor force.
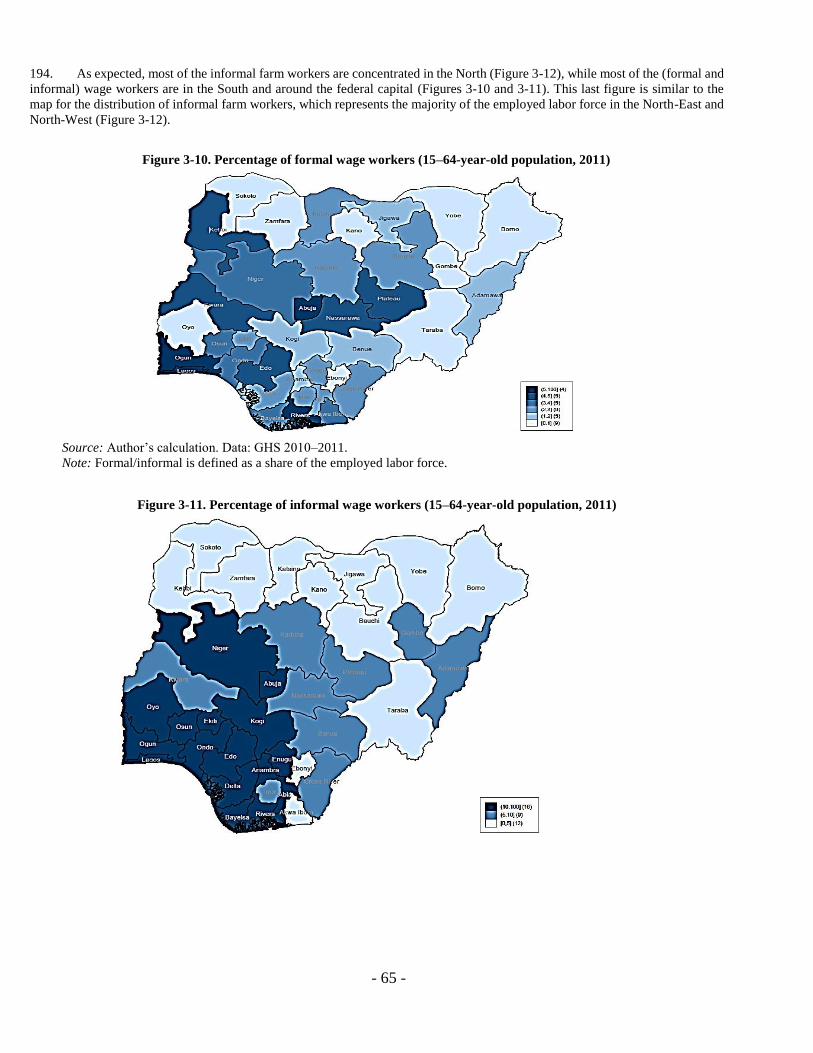
- 65 -
194. As expected, most of the informal farm workers are concentrated in the North (Figure 3-12), while most of the (formal and
informal) wage workers are in the South and around the federal capital (Figures 3-10 and 3-11). This last figure is similar to the
map for the distribution of informal farm workers, which represents the majority of the employed labor force in the North-East and
North-West (Figure 3-12).
Figure 3-11. Percentage of informal wage workers (15–64-year-old population, 2011)
Figure 3-10. Percentage of formal wage workers (15–64-year-old population, 2011)
Source: Author’s calculation. Data: GHS 2010–2011.
Note: Formal/informal is defined as a share of the employed labor force.
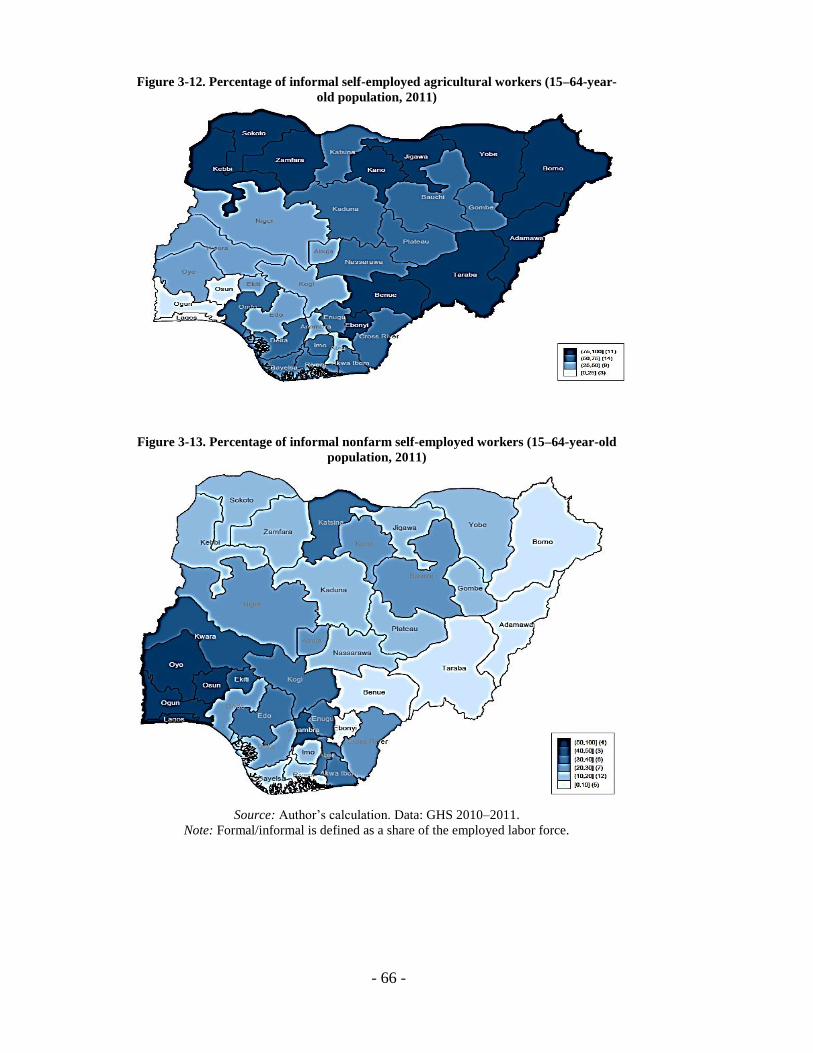
- 66 -
Figure 3-12. Percentage of informal self-employed agricultural workers (15–64-year-
old population, 2011)
Figure 3-13. Percentage of informal nonfarm self-employed workers (15–64-year-old
population, 2011)
Source: Author’s calculation. Data: GHS 2010–2011.
Note: Formal/informal is defined as a share of the employed labor force.

- 67 -
195. Most employment in the nonfarm informal sector is in low/mid-value-added services. In fact, over 72 percent
of the nonfarm informal (self-employed) workers are employed in low/mid-value-added services as technicians (43
percent), service workers (22 percent), or craft workers (14 percent) (Table 3-8). Conversely, over 90 percent and 70
percent, respectively, of the formal and informal wage workers are employed in high-value-added services (Table 3-
8) working as professionals, technicians, and managers, very likely in the public sector (Table 3-9).
Table 3-9. Distribution of formal and informal 15–64-year-old employees across occupations (2011) (percent)
Formal
Wage
Workers
Informal
Wage
Workers
(Nonfarm)
Informal
Self-
employed
(Nonfarm)
Informal
Self-
employed
(Agriculture)
Total
Managers 17.7 10.7 1.8 0.2 2.3
Professionals 40.4 36.1 3.6 0.2 6.1
Technicians 31.7 20.7 42.9 4.3 18.0
Clerical Workers 0.7 0.1 0.2 0.0 0.7
Service Workers 1.2 4.1 22.3 0.1 6.9
Skilled Agriculture 0.8 0.9 2.3 90.4 53.0
Craft Workers 2.1 6.6 13.8 0.2 4.8
Plant Workers 2.6 8.6 9.0 0.1 3.6
Elementary 2.9 6.2 4.6 4.6 4.6
Total 100.0 100.0 100.0 100.0 100.0 Source: Author’s calculation. Data: GHS 2010–2011.
Note: Formal/informal is defined as a share of the employed labor force.
196. Workers in the nonfarm informal sector and, in particular, self-employed workers have less formal
schooling than workers in the formal sector, but both have higher levels of education than farm workers (Figure
3-14). On average, 46 percent of farm workers never attended school versus 23 percent of nonfarm self-employed
workers.
Table 3-8. Distribution of formal and informal 15–64-year-old employees across economic sectors (2011)
(percent)
Formal
Wage
Workers
Informal
Wage
Workers
(Nonfarm)
Informal Self-
employed
(Nonfarm)
Informal Self-
employed
(Agriculture)
Total
Agriculture and Mining 1.3 0.7 0.6 100.0 100.0
Manufacturing 1.0 4.4 5.8 – 100.0
Low-Mid-Value-Added
Services
7.4 21.6 72.3 – 100.0
High-Mid-Value-Added
Services
90.3 73.4 21.3 – 100.0
Total 100.0 100.0 100.0 100.0 100.0
Source: Author’s calculation. Data: GHS 2010–2011.
Note: Formal/informal is defined as a share of the employed labor force.

- 68 -
197. At the higher education level, the gap is even bigger. Over 66 percent of formal sector workers completed
postsecondary education, compared with 47 percent of informal wage workers and only 9 percent of the nonfarm self-
employed (Figure 3-14).
198. Literacy is highest among formal workers. Workers in the nonfarm informal sector have more schooling than
self-employed workers in the nonfarm sector, but both have reached a higher level of education than farm workers.
199. The literacy rate is lower for people employed in the informal sector and, in particular, among self-
employed farm workers. Indeed, employees working in the informal sector are less likely to be able to read or write
than those in the formal sector (Table 3-10). Illiteracy is a barrier to acquiring skills in both the formal and informal
sectors. People who can read, write, and calculate (or any of the three) are more likely to have been apprentices than
those without these basic skills.
Table 3-10. Literacy rate among formal and informal 15–64-year-old employees (2011) (percent)
Formal
Wage
Workers
Informal
Wage
Workers
(nonfarm)
Informal Self-
employed
(nonfarm)
Informal Self-
employed
(agriculture)
Total
Literate 98.5 97.1 77.2 61.8 100.0
Illiterate 1.5 2.9 22.8 38.2 100.0
Total 100.0 100.0 100.0 100.0 100.0
Source: Author’s calculation. Data: GHS 2010–2011.
Note: Formal/informal is defined as a share of the employed labor force.
200. Education plays an important role in accessing formal and informal sectors. Nevertheless, there is huge
unexploited potential. Notably, over 46 percent of the employed labor force with senior secondary education is self-
employed in agriculture, and about 37 percent in nonfarm self-employment (Table 3-11).
Figure 3-14. Education level of formal and informal 15–64-year-old employees (2011)
Source: Author’s calculation. Data: GHS 2010–2011.
Note: Formal/informal is defined as a share of the employed labor force.
2.0 3.9
23.2
45.7
4.59.5
25.622.3
0.0 2.15.5 4.6
27.5
37.8 36.4
22.7
66.0
46.8
9.44.7
0
10
20
30
40
50
60
70
Formal WageWorkers
Informal WageWorkers (non-farm)
Informal Self-employed (non-farm)
Informal Self-employed (agriculture)
Never attended school Primary Junior Secondary Senior Secondary Tertiary

- 69 -
Table 3-11. Distribution of formal and informal employees (15–64) by education level, 2011 (percent)
Formal
Wage
Workers
Informal
Wage
Workers
(Nonfarm)
Informal Self-
employed
(Nonfarm)
Informal Self-
employed
(Agriculture)
Total
Never attended school 0.2 1.2 20.0 78.6 100.0
Primary 0.7 4.6 34.6 60.2 100.0
Junior Secondary 0.0 4.8 35.3 59.9 100.0
Senior Secondary 3.0 13.8 37.2 46.1 100.0
Tertiary 16.6 39.3 22.0 22.1 100.0
Total 3.1 10.3 28.9 57.6 100.0
Source: Author’s calculation. Data: GHS 2010–2011.
Note: Formal/informal is defined as a share of the employed labor force.
201. The prevalence of the informal sector suggests the urgency to increase the availability of training
opportunities, specifically addressing the skills needs of the informal sector. Skills development for the informal
sector is different from that of the formal sector, where large firms have the resources to acquire and sustain a well-
educated workforce and to enhance skills with training on and off the job. Small businesses often depend on workers
who perform multiple tasks and thus need multiple skills, but finding this type of training (‘multi-skilling’) is difficult
and its cost often acts as a constraint to upgrading skills in the informal sector (Adams, de Silva, Razmara 2013).
Public secondary and tertiary schools with technical and vocational education programs are not sufficient in preparing
workers for informal sector employment, so apprenticeship is frequently the only option available. Training options
and policy recommendations for the informal sectors are discussed in Chapter 4.
F. New perspectives in addressing job market skills: A granular profile of Nigeria’s young
population
202. Young people are key actors and a driving force for global development and peace. Providing them with
education and the right skills are ways to guarantee a sustainable transition to a middle-income country, as in the case
of Nigeria.
203. Access to basic and higher education is limited in the northern regions. About 24 percent of the youngest
Nigerians have never attended school, and 10 percent have only primary education. As discussed earlier, access to
education is more difficult in the northern regions: about 46 percent and 48 percent of the 15–24-year-old population
in the North-East and North-West, respectively, never attended school. In states such as Gombe and Kebbi, this share
rises to over 60 percent. Furthermore, the access to secondary and higher education is much lower in the North (Table
3-12).
Table 3-12. Education profile of 15–24-year-old population by geopolitical zones, 2011 (percent)
Never
Attended
School
Primary Junior
Secondary
Senior
Secondary Tertiary
North-Central 15.8 10.7 24.8 44.1 45.6
North-East 46.0 13.1 12.9 23.9 4.0
North-West 48.1 12.8 14.3 21.8 2.9
South-West 4.1 4.2 18.8 64.1 8.8
South-East 4.4 6.7 22.6 60.2 6.1
South-South 4.2 11.3 19.3 60.4 4.8
Total 22.3 10.0 18.5 44.1 5.0
Source: Author’s calculation. Data: GHS 2010–2011.
204. Where the access to basic education is limited, the share of illiterate young people is significantly
higher. On average, about 17 percent of Nigerian youth are illiterate (Table 3-13). This share rises to 33 percent
and 36 percent in the North-East and North-West regions, respectively, which have the lowest access to basic
education.

- 70 -
Table 3-13. Literacy levels of 15–24-year-old population by geopolitical zones, 2011 (percent)
Literate Illiterate Total
North-Central 86.7 13.3 100.0
North-East 66.9 33.1 100.0
North-West 63.6 36.4 100.0
South-West 97.3 2.7 100.0
South-East 97.8 2.2 100.0
South-South 95.2 4.8 100.0
Total 83.1 16.9 100.0
Source: Author’s calculation. Data: GHS 2010–2011.
205. As mentioned above, about 12 percent of the 15–24-year-old population are out of the labor force and
out of school as well (i.e., NEET). As for education and literacy, inactivity is predominant in the North-West and
the North-East, where nearly 29 percent and 16 percent of the young population are NEET (Table 3-14 and Figure
3-15). In states such as Katsina and Zamfara, about 4 out of 10 young people are not working or studying.
Table 3-14. Labor force status of 15–24-year-old population by geopolitical zones, 2011
Source: Author’s calculation. Data: GHS 2010–2011.
Employed Underemployed Unemployed
Inactive
in
School
NEET NEET,
Married
NEET,
Unmarried Total
North-
Central 33.8 3.8 4.3 53.3 4.8 2.2 2.6
100.0
North-
East 48.1 7.6 7.5 21.3 15.5 12.6 2.9
100.0
North-
West 32.5 3.4 7.1 28.3 28.7 23.0 5.7
100.0
South-
West 16.4 0,1 5.4 70.1 8.1 2.7 5.4
100.0
South-
East 23.5 2.6 5.4 62.4 6.1 0.6 5.5
100.0
South-
South 32.2 1.7 3.7 58.9 3.6 0.6 3.0
100.0
Total 30.6 3.0 5.6 48.5 12.4 8.1 4.3 100.0
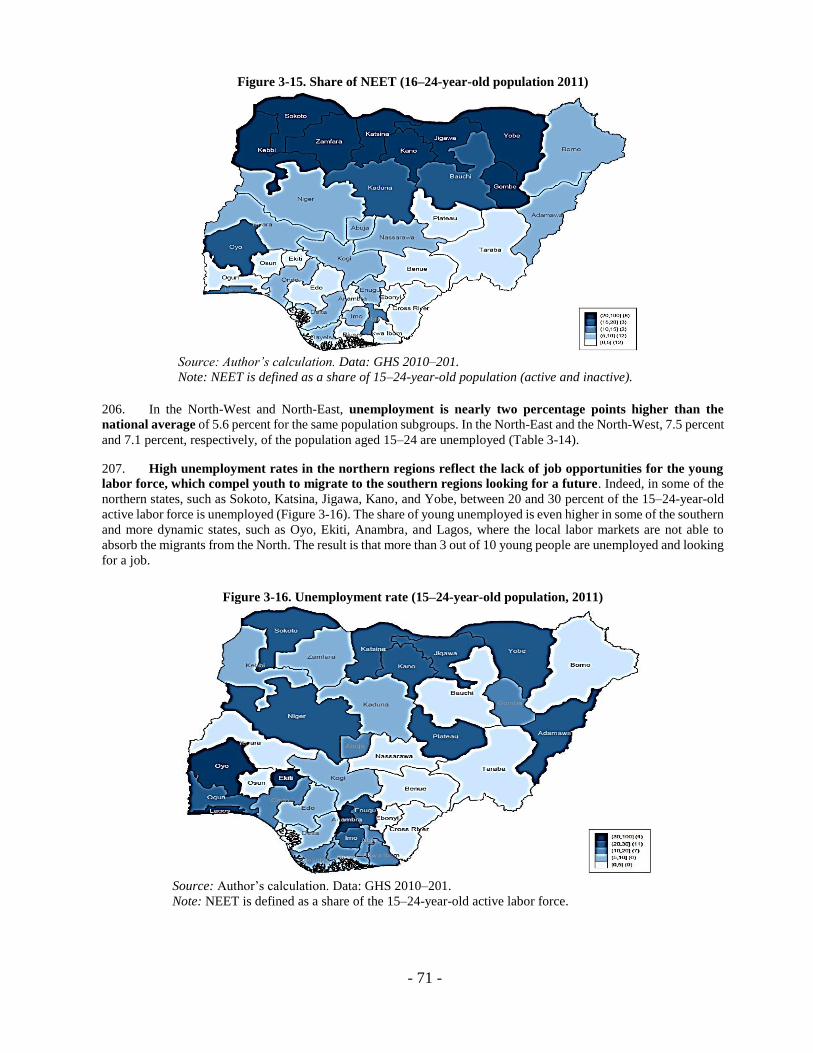
- 71 -
Figure 3-15. Share of NEET (16–24-year-old population 2011)
Source: Author’s calculation. Data: GHS 2010–201.
Note: NEET is defined as a share of 15–24-year-old population (active and inactive). 206. In the North-West and North-East, unemployment is nearly two percentage points higher than the
national average of 5.6 percent for the same population subgroups. In the North-East and the North-West, 7.5 percent
and 7.1 percent, respectively, of the population aged 15–24 are unemployed (Table 3-14).
207. High unemployment rates in the northern regions reflect the lack of job opportunities for the young
labor force, which compel youth to migrate to the southern regions looking for a future. Indeed, in some of the
northern states, such as Sokoto, Katsina, Jigawa, Kano, and Yobe, between 20 and 30 percent of the 15–24-year-old
active labor force is unemployed (Figure 3-16). The share of young unemployed is even higher in some of the southern
and more dynamic states, such as Oyo, Ekiti, Anambra, and Lagos, where the local labor markets are not able to
absorb the migrants from the North. The result is that more than 3 out of 10 young people are unemployed and looking
for a job.
Figure 3-16. Unemployment rate (15–24-year-old population, 2011)
Source: Author’s calculation. Data: GHS 2010–201.
Note: NEET is defined as a share of the 15–24-year-old active labor force.
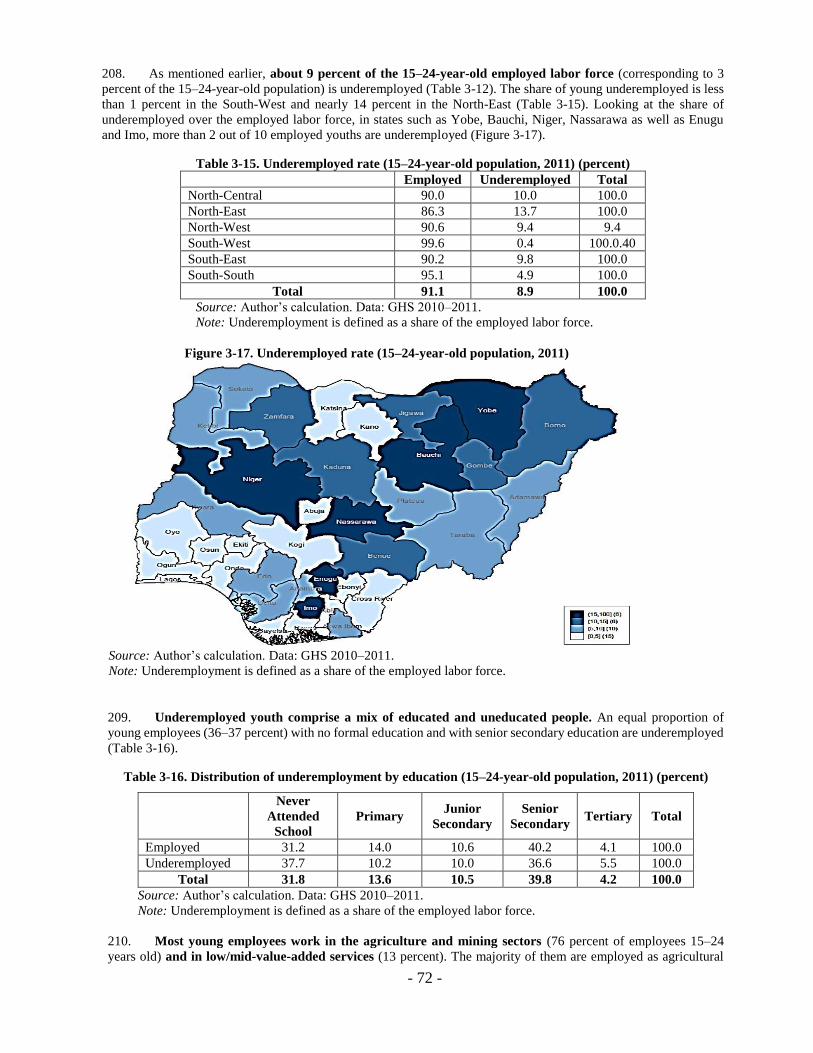
- 72 -
208. As mentioned earlier, about 9 percent of the 15–24-year-old employed labor force (corresponding to 3
percent of the 15–24-year-old population) is underemployed (Table 3-12). The share of young underemployed is less
than 1 percent in the South-West and nearly 14 percent in the North-East (Table 3-15). Looking at the share of
underemployed over the employed labor force, in states such as Yobe, Bauchi, Niger, Nassarawa as well as Enugu
and Imo, more than 2 out of 10 employed youths are underemployed (Figure 3-17).
Table 3-15. Underemployed rate (15–24-year-old population, 2011) (percent)
Employed Underemployed Total
North-Central 90.0 10.0 100.0
North-East 86.3 13.7 100.0
North-West 90.6 9.4 9.4
South-West 99.6 0.4 100.0.40
South-East 90.2 9.8 100.0
South-South 95.1 4.9 100.0
Total 91.1 8.9 100.0
Source: Author’s calculation. Data: GHS 2010–2011.
Note: Underemployment is defined as a share of the employed labor force.
Figure 3-17. Underemployed rate (15–24-year-old population, 2011)
Source: Author’s calculation. Data: GHS 2010–2011.
Note: Underemployment is defined as a share of the employed labor force.
209. Underemployed youth comprise a mix of educated and uneducated people. An equal proportion of
young employees (36–37 percent) with no formal education and with senior secondary education are underemployed
(Table 3-16).
Table 3-16. Distribution of underemployment by education (15–24-year-old population, 2011) (percent)
Never
Attended
School
Primary Junior
Secondary
Senior
Secondary Tertiary Total
Employed 31.2 14.0 10.6 40.2 4.1 100.0
Underemployed 37.7 10.2 10.0 36.6 5.5 100.0
Total 31.8 13.6 10.5 39.8 4.2 100.0
Source: Author’s calculation. Data: GHS 2010–2011.
Note: Underemployment is defined as a share of the employed labor force.
210. Most young employees work in the agriculture and mining sectors (76 percent of employees 15–24
years old) and in low/mid-value-added services (13 percent). The majority of them are employed as agricultural

- 73 -
and fishery workers (70 percent) or technicians (10 percent) or work in elementary occupations (5 percent). This
explains the prevalence of informal workers among the youngest cohort. In fact, 75 percent of the employed
15–24-year-old population works in the informal farm sector, and nearly 20 percent in the informal nonfarm sector
(Table 3-17). Only 5 percent of them are wage workers and less than 1 percent are employed in the formal wage
sector. To find opportunities in the wage sectors, the young have to migrate to the federal capital and to the South-
West states.
211. The likelihood of a young worker being in the informal sector is higher than that of older workers.
Young employees are concentrated in the informal farm and nonfarm sectors regardless of their educational
level (Table 3-14). Although education matters in increasing the probability of young workers to access the (formal
and informal) wage sectors, 79 percent of young employees with junior secondary education and 61 percent of young
employees with tertiary education are still employed in agriculture (Table 3-17).
Table 3-17. Distribution of young employees across formal and informal sectors by education level (15–24-
year-old population, 2011) (percent)
Formal
Wage
Workers
Informal
Wage
Workers
(onfarm)
Informal Self-
employed
(onfarm)
Informal Self-
employed
(griculture)
Total
Primary 0.0 2.3 21.9 75.8 100.0
Junior Secondary 0.0 4.3 16.7 79.0 100.0
Senior Secondary 0.4 7.5 23.2 68.9 100.0
Tertiary 5.2 18.8 15.1 61.0 100.0
Total 0.4 4.7 19.7 75.3 100.0
Source: Author’s calculation. Data: GHS 2010–2011.
Note: Formal/informal workers are defined as a share of the employed labor force.
212. Despite the progress made in increasing access and equity in formal education at the basic education level,
more remains to be done for skills in the informal sector. About 26 percent of the young employed labor force exits
school before learning to read and write (Table 3-18). Not surprisingly, for them the only option is to work in the
informal sector. The crucial policy issue is not only how to provide students with valuable skills while they are
at school, but also how to equip young workers with adequate skills for the labor market outside the realm of
formal education.
Table 3-18. Literacy rate among formal and informal 15–24-year-old employees, 2011
(Percent)
Formal
Wage
Workers
Informal
Wage
Workers
(onfarm)
Informal Self-
employed
(onfarm)
Informal Self-
employed
(griculture)
Total
Literate 100.0 98.1 76.4 72.1 74.2
Illiterate 0.0 1.9 23.6 28.0 25.8
Total 100.0 100.0 100.0 100.0 100.0
Source: Author’s calculation. Data: GHS 2010–2011.
Note: Formal/informal workers are defined as a share of the employed labor force.
Box 4. Characterizing the young: Evidence from the Nigeria Youth Survey
In 2012, the Nigerian National Bureau of Statistics, in collaboration with the Federal Ministry of Youth
Development, conducted a survey of the young, defined as those 15–35 years old. This survey was
conducted in all 36 states and Abuja. It includes information about the demographic characteristics,
migration, education, access to healthcare, employment, participation in politics and decision making,
information and communication technology/computer proficiency, and participation in sports and recreation
for all household members aged 15–35 years.
The broad objective of this study was to provide useful data for the design and development of youth-
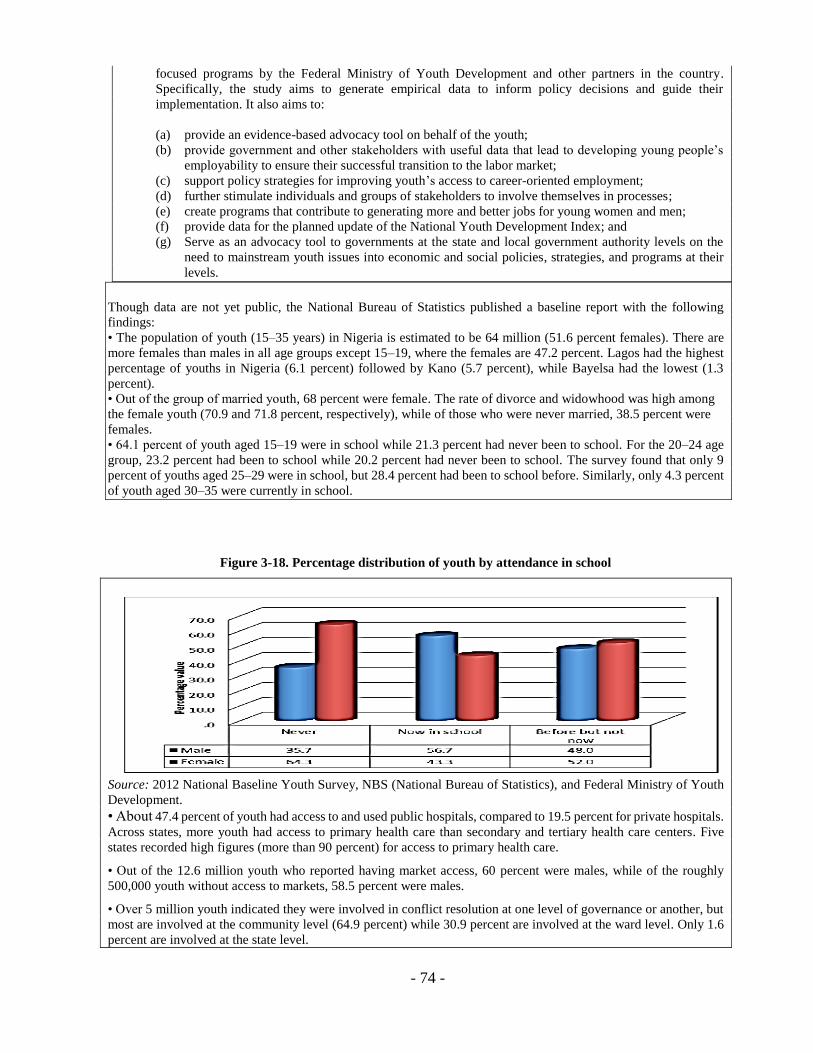
- 74 -
focused programs by the Federal Ministry of Youth Development and other partners in the country.
Specifically, the study aims to generate empirical data to inform policy decisions and guide their
implementation. It also aims to:
(a) provide an evidence-based advocacy tool on behalf of the youth;
(b) provide government and other stakeholders with useful data that lead to developing young people’s
employability to ensure their successful transition to the labor market;
(c) support policy strategies for improving youth’s access to career-oriented employment;
(d) further stimulate individuals and groups of stakeholders to involve themselves in processes;
(e) create programs that contribute to generating more and better jobs for young women and men;
(f) provide data for the planned update of the National Youth Development Index; and
(g) Serve as an advocacy tool to governments at the state and local government authority levels on the
need to mainstream youth issues into economic and social policies, strategies, and programs at their
levels.
Though data are not yet public, the National Bureau of Statistics published a baseline report with the following
findings:
• The population of youth (15–35 years) in Nigeria is estimated to be 64 million (51.6 percent females). There are
more females than males in all age groups except 15–19, where the females are 47.2 percent. Lagos had the highest
percentage of youths in Nigeria (6.1 percent) followed by Kano (5.7 percent), while Bayelsa had the lowest (1.3
percent).
• Out of the group of married youth, 68 percent were female. The rate of divorce and widowhood was high among
the female youth (70.9 and 71.8 percent, respectively), while of those who were never married, 38.5 percent were
females.
• 64.1 percent of youth aged 15–19 were in school while 21.3 percent had never been to school. For the 20–24 age
group, 23.2 percent had been to school while 20.2 percent had never been to school. The survey found that only 9
percent of youths aged 25–29 were in school, but 28.4 percent had been to school before. Similarly, only 4.3 percent
of youth aged 30–35 were currently in school.
Figure 3-18. Percentage distribution of youth by attendance in school
Source: 2012 National Baseline Youth Survey, NBS (National Bureau of Statistics), and Federal Ministry of Youth
Development.
• About 47.4 percent of youth had access to and used public hospitals, compared to 19.5 percent for private hospitals.
Across states, more youth had access to primary health care than secondary and tertiary health care centers. Five
states recorded high figures (more than 90 percent) for access to primary health care.
• Out of the 12.6 million youth who reported having market access, 60 percent were males, while of the roughly
500,000 youth without access to markets, 58.5 percent were males.
• Over 5 million youth indicated they were involved in conflict resolution at one level of governance or another, but
most are involved at the community level (64.9 percent) while 30.9 percent are involved at the ward level. Only 1.6
percent are involved at the state level.

- 75 -
• More males (83.9 percent) are involved in football than females (16.1 percent). This was also true in boxing,
swimming, wrestling, and tennis. However, a higher proportion of females (81.1 percent) are involved in volleyball
than males (18.9 percent), in hockey (59.3 percent females and 40.7 percent males), and track and field events (74
percent females and 26 percent males).
• About 31 percent of youth who had ever changed their location did so due to familial reasons compared to 28.6
percent who relocated due to education and 20.9 percent who did so to search for jobs. Only 2.2 percent and 4.8
percent stated they changed their residence due to job transfer and conflict/civil unrest, respectively.
• Out of a total of 46,836 youth committing different types of crimes, 42,071 (75.5 percent) were males while the
remaining 24.5 percent were females. Among the 32 different crimes committed, smoking marijuana (Indian hemp)
had the largest share at 15.7 percent. This was followed by theft and murder with 8.1 percent and 7.4 percent,
respectively. The least committed crime was immigration/emigration, representing 0.04 percent.

- 76 -
G. Building a foundation for solid, sustained economic growth: Addressing out-of-school
children
213. Despite improvements in access to secondary and postsecondary education, stalled progress in
primary education in the past two decades kept many primary school-aged children out of school. As
reported above, in 2011 about 33 percent of the Nigerian population never attended school. Nigeria’s universal
primary education policy, first implemented in 1976 and reinstated in 1999 and 2004, mandates free, compulsory
basic education, but progress has been slow and remains stagnant since 2003 (Figure 3-19). This represents a
huge loss in human capital. Education is the most powerful weapon for reducing poverty and inequality because
it lays a solid foundation for sustained economic growth. It is the backbone of every society’s development, and
children are the future of a nation.
214. At the end of 2005, the Ministry of Education reported that, out of the 42.1 million eligible
Nigerians, only 22.3 million were in primary schools. This figure implies that about 19.8 million children (47
percent) who should have been in primary schools were not. Similarly, in 2005 there were 33.9 million Nigerians
eligible for secondary school education, and only 6.4 million were enrolled (18.9 percent).
215. The majority of out-of-school children in the North (from primary school aged 6–11 to secondary
school aged 12–16) never attended school. The percentage of out-of-school children never attending school
ranges from 56 percent of girls in North-Central to 83–86 percent of girls and boys in North-East. It is plausible
that many children start school much later than the official starting age of 6, accounting for a large share of
children who are counted as never having attended school.
216. However, even among children aged 12–16 years, 41 percent of boys in the North-West and 60 percent
of girls in the North-East and North-West still never attended school. This implies the existence of demand
barriers that hinder the ability of many children to even set foot in school (Figure 3-20).
217. The combination of a high number of out-of-school children, a high percentage of NEET
population, and a big share of the active population trapped in a low-productivity cycle represents both a
huge loss of human capital and an unexploited potential for Nigeria. Recognizing the problem is the first
step to solving it. Chapter 2 discusses why the market alone is not able to create an efficient distribution of skills
and, more specifically, analyzes the drivers behind the shortage of appropriate skills and human capital and the
misalignment of skills demand and supply.
Figure 3-19. School attendance rates have stagnated at primary level but improved dramatically at
secondary and tertiary level between 1990 and 2010
Source: Author’s calculation using DHS 1990, 1999, 2003, and 2008, NEDS 2010 for primary- Attendance
rates, and NGHSP (Nigeria General Household Survey Panel) 2010–11 for secondary and tertiary
attendance rate.
54 60
60 61
20
40 35
44
56
2 4 6 7 12
83 76
91 85
85.1
29
58 62
70 90
-
20
40
60
80
100
1990 1999 2003 2008 2010Sch
oo
l a
tten
da
nce
ra
te (
%)
YearPrimary net Secondary net Tertiary gross

- 77 -
218. Next, in Chapter 4, the policy note suggests ways to operationalize skills development strategies to
support Nigeria’s economic growth. Nine short- and medium-term policy actions are presented.
Figure 3-20. Out-of-school children by states and gender (2010)
Source: Author’s calculation using NEDS 2010.
46
47
50
57
75
80
95
95
96
96
97
97
8
18
6
9
9
6
45
35
43
32
14
13
4
4
4
4
2
2
0 20 40 60 80 100
North East girls
North West girls
North East boys
North West boys
North Central girls
North Central boys
South West girls
South West boys
South East boys
South East girls
South South boys
South South girls
%Ages 6–11
In formal/integrated religious school In non-integrated religious school Dropped out Never attended
40
43
53
59
74
80
88
89
92
93
96
96
17
9
5
6
6
4
8
7
6
9
11
8
9
9
7
6
4
4
35
40
36
27
10
9
3
2
0 20 40 60 80 100
North West girls
North East girls
North East boys
North West boys
North Central girls
North Central boys
South West boys
South West girls
South South girls
South South boys
South East girls
South East boys
%Ages 12–16
In formal/integrated religious school In non-integrated religious school Dropped out Never attended

- 78 -
CHAPTER 4. OPERATIONALIZING SKILLS DEVELOPMENT STRATEGIES TO
SUPPORT NIGERIAN ECONOMIC GROWTH AND SHARED PROSPERITY
A. Can Nigeria fulfill its potential?
219. As noted in the opening paragraph of Chapter 1, Nigeria has the potential to become a top-20 economy
in the world by 2020 and to reach a GDP of over US$1.60 trillion by 2030. This growth could move 70 million
people out of poverty and enlarge Nigeria’s consuming class from 40 million in 2010 to 160 million in 2030
(McKinsey 2014; World Bank 2014).
220. To support this growth, Nigeria needs the right skills. The Asian economic miracle of the 1980s to the
1990s was driven to a large extent by the availability of an educated population with the right skills to match the
needs of industry. Does Nigeria have the requisite skills and human capital to create a similar miracle and support
its growth projections? The major findings of this Bank report point to substantial gaps in skills and human
capital. However, the research has yielded insights into the main ingredients to address those gaps.
221. Technical, vocational, and professional skills that require higher cognitive abilities will need to be
produced in Nigeria to support the development of infrastructure, roads, and power, to boost agricultural
productivity and agro-processing, and to translate skills in the agricultural sector—which, in addition to
Nigeria’s oil and gas sector that accounts for 14 percent of its GDP, has been the biggest driver of the economy—
to the retail and wholesale sector. The country’s metropolis of Lagos is another important economic driver
through its major private banks and financial services, manufacturing and ICT services. Particular kinds of skills
are needed to achieve the growth of these industries.
B. A vision for accelerating economic growth through a new skills development framework
222. This chapter presents a comprehensive strategy for transforming Nigeria’s skills development system.
The vision is to focus on new skills and enhancing TVET to support the country’s growth.
223. The demands of the labor market are rapidly changing. While agricultural and nonfarm self-
employment in the informal sector still play the largest role in Nigeria’s economy, the strategy outlined in this
chapter proposes to expand nonfarm employment such as trading and retail, small and medium enterprises
(SMEs, infrastructure, banking and finance, and modern ICT development. The main element of the
transformation agenda is a skills development framework implemented through nine specific action-oriented
policy initiatives for immediate and medium-term implementation.
Why new skills and an enhanced skills development framework?
224. Today fewer than 184,000 students per year complete technical vocational education programs in
Nigeria, and these numbers have not increased over the last decade. The entire workforce in nonagriculture self-
employed area exceeds 19 million today and will remain large in the foreseeable future, and add to that another
9 million in the service sector. This workforce requires technical and vocational skills. Thus the number of
students in this area must be drastically increased if Nigeria is to meet its economic and social goals.
225. A stigma is attached to vocational training when students choose schools—a phenomenon that is
prevalent not only in Nigeria but worldwide, including in developed economies. Although many students and
their parents believe that vocational training is more helpful than academic tracks in finding work after school,
the reality is that the enrolment and completion rates in Nigeria’s technical schools are very low in comparison
to the academic-oriented schools.
226. Thus, it is important to embark on a campaign to change students’ and parents’ views of vocational
training. Parents and students as well as the community in general should be shown that the university or post-
basic academic track is not necessary to get a job with a good salary; skills-oriented jobs have excellent long-
term prospects.

- 79 -
227. The Lagos Eko Project (supported by the Bank and described in the First Policy Recommendation,
below) demonstrated how this can be accomplished. Successful examples have been shown in other countries
as well, such as South Korea, with substantial success in transforming a subset of the master schools with the
idea of creating a sense of status and addressing the social stigma attached to manual or technical work.
228. This policy note’s holistic strategy for improving the Nigerian skills development system looks at
today’s workforce as much as the workforce of the future. It includes policies, programs, and accountability
mechanisms that bind an education system together with the resources and financing mechanisms that sustain it.
In a country such as Nigeria, much like any large economy (e.g., Brazil, India, or Indonesia), the education
system spans a large number of structures and participants at all education levels, linked together by contractual
and non-contractual relationships for the delivery of educational services.
229. The policy recommendations below are focused mainly on the supply side of skills, while the factors
surrounding the demand side of skills are covered elsewhere, by the structural reforms for growth and jobs in
programs such as Growth and Employment in Markets (GEMS), power generation and transmission programs,
policies boosting agricultural productivity, the private sector development initiatives in SMEs, and so on.
Policies aimed at creating jobs are inextricably linked to macro-economic and sector-wide policies in the main
sectors of the economy.
230. Nevertheless, it is crucial that Nigeria addresses both its shortage of new skills and TVET skills for the
new economy and the misalignment of skills demand and supply that this policy note highlights. Key policy
recommendations
C. Key policy recommendations
231. This policy note lays out five policy recommendations for the Nigerian leadership and stakeholders to
consider and discuss.
First policy recommendation: Build strong foundations in basic education
232. Success in post-basic TVET hinges on the inputs coming out of Nigeria’s basic education system. The
findings from this policy note as well as the earlier Nigeria Education and Skills Policy Note 1 show that the
literacy and numeracy levels of basic education graduates in Nigeria are very low (see Annex 2b). In fact, the
completion of primary school does not necessarily mean that students are able to read and add numbers. The
analysis in this policy note, which is based on the 2010 Nigeria Education Data Survey, shows that many
Nigerian students take ten or more years of schooling to master such basic competencies. At the national level,
60 percent and 44 percent of students, after completing primary grade 4 and grade 6, respectively, cannot read a
complete sentence. In numeracy skills as measured by a simple test of adding numbers, students perform better.
On the national average, about 10 percent of students cannot add numbers at the end of primary school.
233. Figure 4-1 illustrates the link between early education and success in post-basic education and the labor
market. Investments in prenatal health and early childhood development programs that include education and
health are essential to maximize human capital. In the primary years, quality teaching is critical for giving
students the foundational literacy and numeracy on which lifelong learning depends. Children need a stimulating
and responsive environment to develop these abilities; deprivation inflicts profound long-term damage on a
child. The availability of an integrated system of parenting education, nutrition, and health care—in short, an
effective early childhood development (ECD system—can thus have substantial lifelong benefits.

- 80 -
234. Learning happens throughout life: a person’s brain starts growing from early on in life and continues to
do so into adulthood. At each stage of brain development, there are opportunities for learning. But whether a
person can take full advantage of those opportunities depends significantly on the learning that takes place during
his or her younger years (through age 25), when an individual acquires the ability to learn.
235. Human capital is created through cumulative investments starting from early childhood learning, and
missing important developmental inputs during formative years can lead to lower cognitive ability, labor market
competitiveness, educational outcomes, lifetime earnings, and, ultimately, lower quality of life. The message for
policy is clear: the Nigerian basic education system needs to be upgraded to a minimum level to set the
foundations for post-basic skills and TVET.
236. Key foundational skills. First, foundational skills acquired early in childhood make possible a lifetime
of learning; hence, the traditional view of education as starting in primary school takes up the challenge too late.
Second, getting value for the education dollar requires smart investments—that is, investments that have proven
to contribute to learning. Quality needs to be the focus of education investments, with learning gains as a key
metric of quality. Third, learning for all means ensuring that all students, not just the most privileged or gifted,
acquire the knowledge and skills they need. This goal will require lowering the barriers that keep girls, people
with disabilities, and ethnolinguistic minorities from attaining as much education as other population groups.
Short-term actions to build strong basic education foundation:
o Early childhood development (ECD programs must be expanded and universalized to
enhance children’s readiness for school.
o Improve the quality of primary education through training and on-the-job support for
teachers and textbooks and learning materials provision.
o Address regional disparity through school grants and cash transfers in the northern states.
o Improve governance and increase accountability through the school-based management
committees.
o Address the gender and cultural barriers through girls’ school scholarships and promotion
of integrated Quranic education.
Figure 4-1. Skills for employability: Technical skills with foundational and behavioral skills
Source: World Bank 2013.
- 81 -
Medium-term actions:
o Review and reform the UBE (Universal Basic Education) Programme, which was
established in 1999, so that it would achieve the goals for which it was established. The
early gains have now been shown to be erased and recent deterioration in the sector has
been observed.
Second policy recommendation: Address the skills deficit of the existing ‘stock’ of workers
through informal short programs to upgrade skills for employability
237. The large cohort of people who are not in the labor force, employment or training (NEET) need jobs,
and specific short-term training will need to be addressed to make them more employable. These groups include
those youth who have dropped out and have never reached secondary level. Nigeria’s informal sector in both
household enterprises and small to medium enterprises dominates the workforce. In the short term, a policy is
required to provide enabling incentives for large-scale informal sector-based training led by the private sector.
A large number of adult Nigerians who completed post-basic education are currently unemployed and looking
for work; many of them belong to the NEET population (see Chapter 3).
Short-term actions:
o Support for the expansion of programs for this large cohort of the NEET group, especially
labor-intensive public works programs with the view to activating labor and providing
subsequent opportunities for apprenticeship or transitioning them into the formal skills
development system and thereby enhancing their skills for more productive work. There
are multiple programs addressing these groups such as those supported by the Bank YESSO
programs. The key is to review those programs and expand those that are cost-effective and
able to reach the existing ‘stock’ of potential workers.
o Short-term programs similar to the Indian model of IL&FS (Infrastructure Leasing and
Financial Services) and the Jovenes programs in Latin America where short and low-cost
but effective training that links the training to the job market. As a private venture, the
IL&FS program in India operates 18 skill schools (hubs) and 355 skill centers (spokes) in
24 Indian states offering instruction in 27 trades such as textiles, welding, hospitality, and
retail; courses are generally one to three months long at a very low cost to learners. The
biggest design draw and compelling value proposition for the IL&FS program is ‘finish the
course and there is a job waiting for you.’ This success is made possible by innovative
program design—the IL&FS program starts by securing commitments from 1,000 partner
companies and enterprises to provide job placements for trainees.
Third policy recommendation: Expand access and market relevance of the formal post-basic
TVET through the strengthening of a national post-basic TVET policy and program
238. A new national post-basic skills and TVET program is needed to increase total enrolment and
completion in TVET institutions from the current level of 184,000 students to more than 400,000 in five years
and 1,000,000 in ten years. TVET programs are urgently needed nationwide, but high priority should be given
to northern states and to girls to address significant inequities along geopolitical and gender lines.
239. These targets are the minimum required to respond to the needs of the Nigerian economy in moving
forward in the development of the power and infrastructure sectors, retail and wholesale trade, agro-processing
industries, light manufacturing, finance and ICT sectors. Such targets are feasible if the skills development
and TVET sectors are given national priority for financing and policy support.
240. The National policy for skills and TVET needs to involve the systematic assessment of skills needs in
relation to demand-driven grants offered to the technical and vocational schools. There are locational dimensions
in skills supply provision, as industries demanding these will be driven first by demand in the main cities and
centers of population in the country.

- 82 -
241. National budgetary support, and potentially external funding, will be necessary to launch the national
skills development program. In addition, the use of the Tertiary Education Trust Fund (TETFUND) needs to be
explored because the scale of training proposed is large and the requisite resources to reach the goal are
substantial.
Short-term actions to address access and relevance of formal post-basic TVET:
o It is recommended that a national post-basic TVET program be developed that
includes support for the existing 373 public and private technical and vocational
schools in Nigeria. The program will be implemented using successful design features such
as those used in the STEP-B (see Annex 4 for an overview of the schemes). The STEP-B
(Science and Technology Education Post-Basic) uses an innovative design (the first of its
kind in Nigeria) and approaches that include (a) a paradigm shift focusing on demand-
driven, merit-based, competitive funding and institutional interaction with other institutions
and regulatory agencies; (b) incentives for students to obtain innovation grants to enable
them to complete their studies—the Innovators of Tomorrow Program; (c) the promotion
of 11 Science and Technology Centers of Excellence through collaboration between
universities and research institutions in Nigeria and abroad, particularly involving the
regional African University for Science and Technology (AUST; (d) support to cross-
cutting areas in science and technology, including the regulatory framework, science and
technology (S&T) policy, and relevant studies; and (e) support of interconnectivity and ICT
for the Nigeria Research Education Network.
o Dramatically enhance vocational education curriculum and professional development
for teachers to improve learning outcomes and produce industry-ready graduates. The
poor learning outcomes in the Nigerian TVET system have profound roots in the current
curriculum. For too many students, more schooling has not resulted in more knowledge and
skills. Youth are leaving school and entering the workforce without the knowledge, skills,
and competencies necessary to adapt to a competitive and increasingly globalized economy.
Further, learning outcomes (typically measured with regard to reading and numeracy skills)
are only a small part of what makes an individual’s human capital. The knowledge and
competencies that help people live healthy, productive, satisfying lives are much broader.
Social, communication, teamwork, critical thinking, and problem-solving skills are
invaluable for people to function well at home, in their communities, and at work. Specific
technical or vocational skills related to an occupation are also important for success in the
labor market.
o Expand internship and apprenticeship by enhancing the role of the National Youth
Corps (NYC as a key program to enhance the job experience of young entrants into
the labor force. The framework of the NYC should be expanded not only providing
internship and apprenticeship but also deepening its relationships with the private sector,
identifying structures to facilitate the transitions from school to full-time jobs, and
providing labor market information. The NYC should also identify and provide incentives
for the private sector to actively participate in the NYC programs.
Medium-term actions:
o Create policy incentives to scale up new-economy skills. Nigeria has undergone a quiet
revolution in information and communication technologies (ICT); investments of more than
US$10 billion by private investors and operators over the last two decades have resulted in
expansion of ICT infrastructure. Nigeria is now in a position to grow its new-economy
sectors, become a dynamic player in the global market for IT and IT-enabled services, and
create quality jobs for youth. A necessary prerequisite is human capital that meets global
standards.
- 83 -
o The New-Economy Skills for Nigeria program (Assessment of Core Competencies for
Employability in the Services Sector [ACCESS] Nigeria) was piloted from 2009 onwards
and has successfully gained traction in skills development for employability, job creation,
start-up development, and business growth in areas of new-economy and ICT-related
services. A key feature of the initiative was the development of a standardized skills testing
framework based on three key pillars (cognitive, communication, and computing skills) that
apply to a wide variety of occupations in the services industry. The approach could be
replicated in other sectors.
o This policy note proposes scaling up the ACCESS program to build globally benchmarked
skills for Nigeria’s knowledge economy. With more than 120 million mobile phones,
Nigeria has one of the best IT infrastructures in Africa, and the large English-speaking
population has the advantage of leading in IT and IT-enabled services in the region. The
potential for the workforce to contribute to economic growth is huge. This has been shown
in India, for instance, where the IT sector has added 10 million direct and indirect jobs,
more than 70 percent of which have gone to people under the age of 35. In Egypt, where
the business process outsourcing industry is fairly new, 30,000 new jobs had already been
added by 2010. In the Philippines, the contact center/ business process outsourcing (BPO)
sector has contributed over US$15 billion to the economy, directly employing 1 million
workers in just over seven years, with 60 percent of the jobs created going to women. South
Africa, which aggressively markets itself as an outsourcing destination, has created 150,000
jobs. (See Annex 5 for a detailed discussion of NaijaCloud, a program to create global
outsourcing job skills for Nigerian youth.)
o Another area with potential for enormous growth is Fab Labs, applied Science, Technology,
Engineering, and Mathematics (STEM) learning environments that are being used for
digital fabrication around the world in schools, community centers, colleges, and
universities. The new era of digital fabrication reignites local manufacture and small or
micro-business creation, supporting new economic opportunity at the local level. More than
250 Fab Labs are in operation around the world today, with hundreds more in development
in more than 40 countries, including a few in Lagos and two other Nigerian states. Fab Labs
offer Nigeria a novel opportunity both to ramp up skills development in technical-
vocational schools and to create jobs. (See Annex 6 for a detailed discussion of Fab Labs.)
o A radical new way of scaling up teaching and course upgrading is the use of massive open
online courses (MOOCs), which are now being piloted in many schools in Nigeria. Access
to the Internet and the wide use of smartphones and mobile phones in Nigeria is fueling use
of MOOCs. (See Annex 7 for a detailed discussion of MOOCs.)
Fourth policy recommendation: Strengthen job accreditation and certification and expand
opportunities for school to work transitions through job market information and facilitation
Short-term actions:
o There is a need to fully operationalize job accreditation and certification. An
appropriate regulatory and institutional framework is a precondition for the long-term
development of a demand-oriented, efficient, and relevant TVET system. While the
National Board of Technical Education (NBTE) has taken first steps to create a National
Vocational Qualifications Framework (NVQF), the process needs to be accelerated and
made more inclusive in term of skills development institutions. A rapid implementation of
the NVQF will (a) facilitate the development and certification of new short-term programs
that address emerging and short-term needs, such as skills upgrading for the informal sector;
(b) enhance the accreditation of private and community-based training institutions; (c)
recognize the competencies of those who have acquired their skills in the informal sector,
thereby enabling them to be recognized for their competencies; (d) improve the information
base for prospective students and employers more generally; and (e) enhance openness,
transparency, and accountability of the skills development system in general. An NVQF
could also be an avenue for integrating the National Youth Service into the national strategy
- 84 -
for skills development, including matching NYS postings to applicants with appropriate
skills profiles. Thus, those who received training from anywhere within or outside the
formal training systems could be certified for skills and trades if they track within the NVQF
framework.
o Include the private industry and professional associations in the NVQF
implementation, especially in defining the framework for a common grid of skills and
qualifications. Defining job qualifications should involve the employers, especially from
the private sector. An example of how such a system works is that of South Africa’s SETA
(Skills Education Training Authorities). The SETAs have been established to manage many
skills development needs and training for at least 23 sectors, each sector having its own
SETA—and where a sector is made up of economic activities that are linked or related—
for example, an SETA that deals with agricultural sector, or manufacturing sector, or
banking sector. The government collects the training levies, and the management of training
is delegated to each SETA. SETAs are concerned with learnerships, internships, defining
the learning program-type matrix, and unit-based skills program.
Medium-term action:
o Expand the role of the National Directorate for Employment in providing up-to-date
labor market information. Nigeria lacks an effective labor market information system
(LMIS) due to the absence of coherent government policies and actions in support of such
a system. Today, no institutional framework exists for the collection, collation, analysis,
and dissemination of labor market information. Timely time series data that are available
to central agencies for the purpose of macroeconomic management could be made more
widely available for planning and policy formulation in human resource development.
Without information on employers’ skills needs, market conditions, and returns to certain
types of work, the providers cannot make good choices about what programs to develop
and offer. And potential workers will not have a source of information for jobs. Specific
initiatives like the ANJIMS (Access Nigeria Jobs Information System) , which has been
successfully tested in Nigeria, could provide some platforms for linking jobs with training
and skills. The overall goal of the ANJIMS (http://www.anjims.org.ng) is to make graduates
of Nigeria readily employable and to ensure job placement. This uses a mobile interactive
platform where these candidates can be showcased to potential employers. These programs
provide information that improves the efficiency of the jobs matching process.
Fifth policy recommendation: Expand the role of the private sector and non-state actors, and
provide incentives for private sector provision of skills
242. A key enabling policy is needed for two types of collaboration with industries that are demanding skills.
The first recognizes the role of industry itself as the main client and user of TVET training systems and thus
focuses on public-private partnerships (PPPs) between TVET public providers and the industries that are
expected to drive Nigeria’s economic growth in the coming two decades: construction and infrastructure, power
generation and distribution, retail and wholesale trade in agro-processing, and light manufacturing.
243. The second type of collaboration is private sector provision of technical and vocational education. It is
important for the government to provide enabling regulations to the private provision of technical education and
training. Private TVET provision has a recent history in Nigeria—and today there are 101 private TVET
providers nationwide out of the 373 total TVET providers. These are mostly called innovation enterprise
institutions, polytechnics, and technical colleges.
Short-term actions:
o Expand private participation through PPPs. PPPs as a mechanism to expand access and
improve the quality of TVET are gaining traction in Nigeria based on the successful piloting
in the Lagos Eko Project. In the program successfully launched in this project, government
technical colleges partnered with firms, including Samsung (for electronics and mobile
phones), the German company FESTO (for mechatronics), Automedics (for

- 85 -
automechanical services), and LSEB/Skipper for electrical and power services. Each of
these firms partnered with six technical colleges in Lagos State. For instance, at Agidigbi
Technical College, the partnership created a Samsung Academy within the school. PPPs
comprise four key elements: (a) private companies are invited by the government to partner
with a technical college or a polytechnic; (b) the partner company is expected to contribute
equipment and staff to work together with the school in developing curriculum appropriate
for the technical college of choice; (c) the school, through a grant from the project, will
offer school premises and even new classrooms and facilities where the equipment will be
housed; and (d) the partner company will make staff available to be part of the school’s
teaching force together with the school faculty. PPPs are needed and education providers
and employers need to step actively into each other’s worlds and interact intensively
and often. The positive experience from the Lagos Eko Project, described above, could be
replicated in other parts of the country. From the analysis of this policy note, it is clear that
there will be locational differences in the kinds of partnerships that will need to be
promoted. For example, the drivers in metropolitan areas like Lagos, Ibadan, or Port
Harcourt, Abuja, and Kano would be different from those in the country’s rural areas.
o Implement innovations in private training provisions. Others are underemployed in jobs
outside their field of training (e.g., college graduates driving taxis or engaged in the large
informal sector). To address the NEET group, especially those youth who completed post-
basic education but are underemployed in Nigeria, it is recommended that a new innovative
training and skills-building program (for profit) be implemented, led by the private sector
but with enabling support from the government. This type of program has the potential to
lead to employment at scale, with low cost, and be implemented at a rapid pace. Training
could be offered in a large-volume scheme similar to those successfully implemented in
Morocco, in South Africa (Harambee Youth Employment Accelerator) and in India
(Infrastructure Leasing and Financial Services [IL&FS]). India’s IL&FS Program, for
example, was founded in 2007 as a for-profit venture in skills training and development. It
has become one of 50 private partners selected by the Indian government through its
National Skills Development Corporation. As a private venture, the program operates 18
skill schools (hubs) and 355 skill centers (spokes) in 24 Indian states. These schools offer
instruction in 27 trades such as textiles, welding, hospitality, and retail; courses are
generally one to three months long at a very low cost to learners. The biggest design draw
and compelling value proposition for the IL&FS program is ‘finish the course and there is
a job waiting for you’ (Mourshed, Farrell, and Barton 2012). This success is made possible
by innovative program design—the IL&FS program starts by securing commitments from
1,000 partner companies and enterprises to provide job placements for trainees.
Medium-term actions:
o Enable private sector provision of technical and vocational education through incentives
and enable regulations to expand private sector provision. These enabling incentives such
as tax breaks and financing will help private sector open more innovation centers, skill
centers, as well as private technical colleges and technical institutes. Currently, there are
private sector-driven institutions such as the Innovation Enterprise Institutions and
Vocational Enterprise Institutions that will need to expand to provide industry-specific
competencies in such competencies like communications, oil and gas, fashion, hospitality,
entertainment, construction, and welding sectors.
o Improve the Industrial Training Fund. Nigeria has implemented the Industrial Training
Fund (ITF that was organized in 1971 to support technical and vocational training financed
by a 1 percent levy from enterprises with at least 25 employees. However, in its 40 years’
existence, the number of trainees enrolling in and completing skills programs through the
ITF has been very small—not more than a few thousand people have been trained in any
given year. In 2011, new legislation was enacted with changes that enable the ITF to
increase revenues by increasing the number of enterprises that must contribute to the 1
percent levy. Now, all enterprises with 5 or more employees must contribute to the fund.
- 86 -
o It is proposed that the ITF program be revitalized and given a new focus to achieve its
mandate. Successful models exist elsewhere in the world; the SENAI program in Brazil is
the most comparable program. Brazil is just a little bigger than Nigeria with regard to
population (Brazil has 200 million people and Nigeria 174 million) and, like Nigeria, has a
federal system of government. The SENAI is currently training more than 2.3 million
trainees in 817 schools and technology centers in 28 industrial areas in Brazil.
o A key to Brazilian SENAI’s success in training is its structure whereby the institutional
ownership is directly in the hands of the Federation of Industries instead of a public entity,
as is the case with the ITF. The industries tax themselves to fund their training programs—
1 percent of their payrolls fund the training operations, and the various employers run the
institutions with full independence under private sector statutes. Likewise, the training
delivery is not necessarily organized by the SENAI itself, but rather the program can buy
training from the market rather than establishing its own institutions. Thus, the SENAI
institutions have evolved into groups of training sectors that are able to train 2 million
workers a year. This is the scale at which Nigeria needs to develop to catch up with skills
development in support of the country’s economic growth.
D. Final note
244. In summary, while Nigeria has the potential to become a top-20 economy in the world by 2020 and to
reach a GDP of over US$1.60 trillion by 2030, potentially moving 70 million Nigerians out of poverty, this
policy note has underlined substantial gaps in the requisite skills and human capital to reach those goals. In an
effort to understand the kinds and levels of human capital Nigeria possesses to support its movement toward
economic competitiveness over the next two decades, the policy note examined inefficiencies in the country’s
skills-building system, including barriers to growth.
245. As elucidated by this research, the main challenges within Nigeria’s skills development system are (a)
severe constraints on staffing, facilities, and equipment, resulting in exceedingly low equitable access and
quality; (b) extremely low external efficiency due to the absence of linkages between curriculum design and
labor market information, especially from industry and enterprises; (c) gender inequity; (d) a shortage of well-
qualified technical and vocational education teachers and inadequate professional development; and (e) weak
institutional capacity at the federal and state levels.
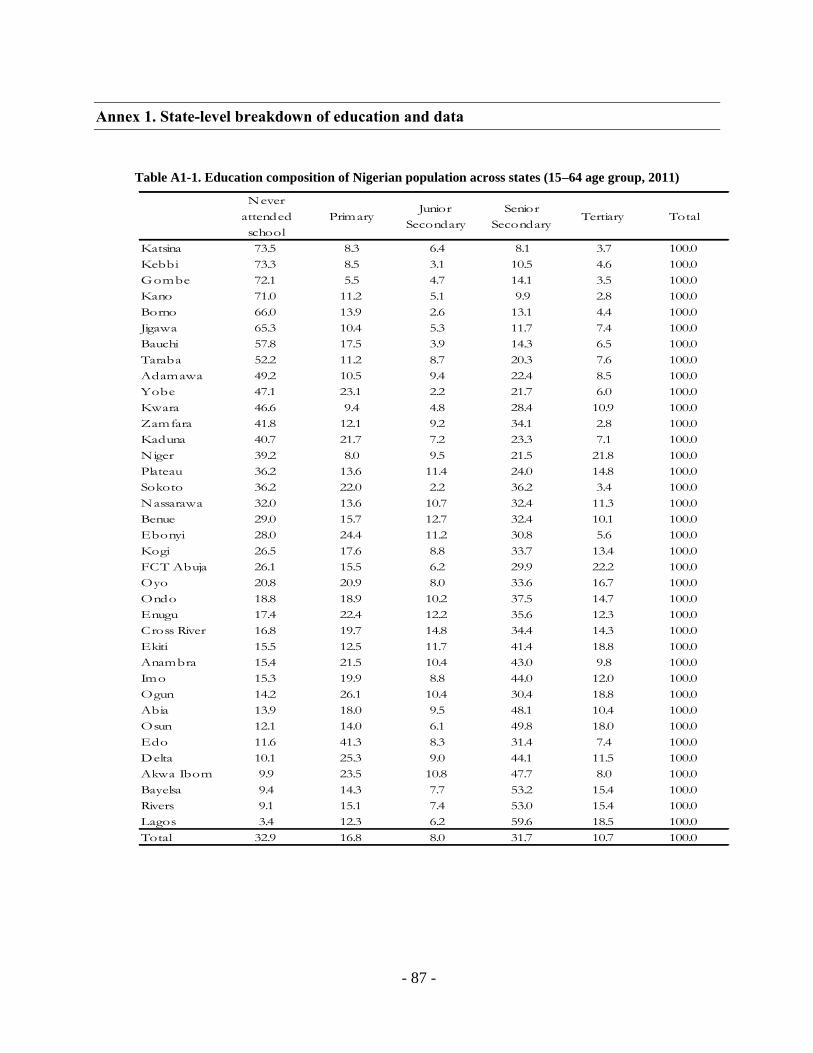
- 87 -
Annex 1. State-level breakdown of education and data
Table A1-1. Education composition of Nigerian population across states (15–64 age group, 2011)
Never
attended
school
PrimaryJunior
Secondary
Senior
SecondaryTertiary Total
Katsina 73.5 8.3 6.4 8.1 3.7 100.0
Kebbi 73.3 8.5 3.1 10.5 4.6 100.0
Gombe 72.1 5.5 4.7 14.1 3.5 100.0
Kano 71.0 11.2 5.1 9.9 2.8 100.0
Borno 66.0 13.9 2.6 13.1 4.4 100.0
Jigawa 65.3 10.4 5.3 11.7 7.4 100.0
Bauchi 57.8 17.5 3.9 14.3 6.5 100.0
Taraba 52.2 11.2 8.7 20.3 7.6 100.0
Adamawa 49.2 10.5 9.4 22.4 8.5 100.0
Yobe 47.1 23.1 2.2 21.7 6.0 100.0
Kwara 46.6 9.4 4.8 28.4 10.9 100.0
Zamfara 41.8 12.1 9.2 34.1 2.8 100.0
Kaduna 40.7 21.7 7.2 23.3 7.1 100.0
Niger 39.2 8.0 9.5 21.5 21.8 100.0
Plateau 36.2 13.6 11.4 24.0 14.8 100.0
Sokoto 36.2 22.0 2.2 36.2 3.4 100.0
Nassarawa 32.0 13.6 10.7 32.4 11.3 100.0
Benue 29.0 15.7 12.7 32.4 10.1 100.0
Ebonyi 28.0 24.4 11.2 30.8 5.6 100.0
Kogi 26.5 17.6 8.8 33.7 13.4 100.0
FCT Abuja 26.1 15.5 6.2 29.9 22.2 100.0
Oyo 20.8 20.9 8.0 33.6 16.7 100.0
Ondo 18.8 18.9 10.2 37.5 14.7 100.0
Enugu 17.4 22.4 12.2 35.6 12.3 100.0
Cross River 16.8 19.7 14.8 34.4 14.3 100.0
Ekiti 15.5 12.5 11.7 41.4 18.8 100.0
Anambra 15.4 21.5 10.4 43.0 9.8 100.0
Imo 15.3 19.9 8.8 44.0 12.0 100.0
Ogun 14.2 26.1 10.4 30.4 18.8 100.0
Abia 13.9 18.0 9.5 48.1 10.4 100.0
Osun 12.1 14.0 6.1 49.8 18.0 100.0
Edo 11.6 41.3 8.3 31.4 7.4 100.0
Delta 10.1 25.3 9.0 44.1 11.5 100.0
Akwa Ibom 9.9 23.5 10.8 47.7 8.0 100.0
Bayelsa 9.4 14.3 7.7 53.2 15.4 100.0
Rivers 9.1 15.1 7.4 53.0 15.4 100.0
Lagos 3.4 12.3 6.2 59.6 18.5 100.0
Total 32.9 16.8 8.0 31.7 10.7 100.0

- 88 -
Table A1-2. Education composition of Nigerian population across states (15–24 age group, 2011)
Never
attended
school
PrimaryJunior
Secondary
Senior
SecondaryTertiary Total
Abia 4.8 5.3 20.5 65.1 4.3 100
Adamawa 38.2 8 21.1 27.3 5.4 100
Akwa Ibom 1.9 8.4 21.6 64.9 3.3 100
Anambra 1.8 4.9 22.2 68.4 2.7 100
Bauchi 47.5 19.2 10.2 18.5 4.7 100
Bayelsa 3.1 6 16.5 65.9 8.6 100
Benue 8.5 13.6 27.9 46.9 3.1 100
Borno 53.2 14.8 8.2 20.2 3.6 100
Cross River 6.3 11.1 30.6 48.4 3.6 100
Delta 5.3 5.8 18.2 63.5 7.1 100
Ebonyi 10 15.4 23.3 47.6 3.7 100
Edo 5 34.5 15.9 42.7 1.8 100
Ekiti 2.6 2.7 24.2 58.8 11.8 100
Enugu 2.7 4.4 26.3 56.9 9.6 100
FCT Abuja 18.4 11.8 19.9 46.3 3.7 100
Gombe 64.7 4.7 9.3 19.3 2.1 100
Imo 3.8 4.9 19.4 63.3 8.6 100
Jigawa 55.1 8.6 13.4 18.4 4.4 100
Kaduna 39 16.1 20.6 22.8 1.5 100
Kano 58.5 14.9 11.1 12.1 3.4 100
Katsina 51.6 8.3 19.5 17.1 3.5 100
Kebbi 64.3 8.1 8.2 15.5 3.8 100
Kogi 9.8 6.5 26.8 54.5 2.5 100
Kwara 16.9 11.8 15 47.8 8.4 100
Lagos 1.8 1.9 15 75.9 5.4 100
Nassarawa 14.7 10.7 24.4 46.8 3.5 100
Niger 22.9 7.2 33.2 34.6 2.1 100
Ogun 4 7.4 20.1 52.5 15.9 100
Ondo 5.4 5.7 21.5 61.3 6.1 100
Osun 4.5 5.5 14.6 71.2 4.2 100
Oyo 8.1 5.2 21.9 51.3 13.5 100
Plateau 24.9 11.4 20.1 34.5 9 100
Rivers 3.7 4.1 15.7 72.2 4.4 100
Sokoto 31.7 17.5 6.5 41.5 2.9 100
Taraba 37.2 11.3 18.4 28.8 4.2 100
Yobe 36.1 25.6 5.6 29.4 3.4 100
Zamfara 33.5 13.4 18.3 33.7 1.2 100
Total 22.3 10 18.5 44.1 5 100

- 89 -
Figure A1-1. Change in educational composition at state level, comparing two age groups (15–64 and 19–30, 2009)
-30
-25
-20
-15
-10
-5
0
5
10
15
20
So
koto
Keb
bi
Yo
be
Bo
rno
Kat
sin
a
Zam
fara
Jig
awa
Bau
chi
Nig
er
Go
mbe
Kan
o
Tar
aba
Kad
una
Ad
amaw
a
Nas
sara
wa
Kw
ara
Ko
gi
Pla
teau
Ben
ue
Oy
o
FC
T
Og
un
Osu
n
Eb
on
yi
On
do
Ek
iti
Cro
ss R
iver
En
ug
u
Bay
elsa
An
ambra
Ed
o
Riv
ers
Ak
wa
Ibo
m
Ab
ia
Del
ta
Imo
Lag
os
change in at last primary change in JS-SS change in Tertiary

- 90 -
Table A1-3. Illiteracy rate raw scores by state and educational level, 15–64, 2011
State
Never
attended
school
PrimaryJunior
Secondary
Senior
SecondaryTertiary
Abia 0.54 0.09 0.01 0.01 0.00
Adamawa 0.67 0.10 0.03 0.01 0.02
Akwa Ibom 0.54 0.03 0.00 0.00 0.00
Anambra 0.56 0.07 0.00 0.01 0.01
Bauchi 0.87 0.06 0.05 0.06 0.03
Bayelsa 0.77 0.23 0.06 0.01 0.00
Benue 0.85 0.06 0.01 0.01 0.01
Borno 0.24 0.16 0.00 0.10 0.00
Cross River 0.80 0.26 0.04 0.02 0.02
Delta 0.78 0.19 0.13 0.02 0.01
Ebonyi 0.81 0.07 0.01 0.01 0.00
Edo 0.81 0.09 0.10 0.05 0.04
Ekiti 0.85 0.06 0.01 0.00 0.00
Enugu 0.84 0.04 0.00 0.03 0.00
Gombe 0.72 0.09 0.10 0.04 0.12
Imo 0.77 0.13 0.02 0.02 0.01
Jigawa 0.56 0.07 0.01 0.08 0.00
Kaduna 0.85 0.02 0.00 0.01 0.02
Kano 0.73 0.18 0.05 0.12 0.18
Katsina 0.89 0.02 0.02 0.02 0.00
Kebbi 0.61 0.02 0.01 0.00 0.03
Kogi 0.94 0.15 0.03 0.01 0.04
Kwara 0.96 0.26 0.00 0.00 0.00
Lagos 0.82 0.10 0.00 0.00 0.00
Nassarawa 0.93 0.36 0.07 0.02 0.00
Niger 0.85 0.06 0.00 0.00 0.00
Ogun 0.87 0.19 0.04 0.00 0.01
Ondo 0.74 0.06 0.01 0.00 0.00
Osun 0.68 0.05 0.00 0.00 0.01
Oyo 0.91 0.02 0.03 0.01 0.00
Plateau 0.87 0.12 0.01 0.01 0.00
Rivers 0.85 0.10 0.05 0.01 0.02
Sokoto 0.50 0.01 0.09 0.11 0.02
Taraba 0.70 0.09 0.05 0.03 0.01
Yobe 0.74 0.03 0.10 0.04 0.07
Zamfara 0.83 0.37 0.07 0.17 0.05
FCT Abuja 0.79 0.05 0.05 0.01 0.02

- 91 -
Table A1-4. Illiteracy rate by state and educational level, 15–24, 2011
Literate Illiterate Total
Abia 98.5 1.5 100
Adamawa 76.1 23.9 100
Akwa Ibom 99.8 0.2 100
Anambra 99.2 0.8 100
Bauchi 56.7 43.3 100
Bayelsa 95.4 4.6 100
Benue 93.9 6.1 100
Borno 86.3 13.7 100
Cross River 94.1 5.9 100
Delta 90.5 9.5 100
Ebonyi 94.7 5.3 100
Edo 94.9 5.1 100
Ekiti 98.5 1.5 100
Enugu 99 1 100
FCT Abuja 90.9 9.1 100
Gombe 46.9 53.1 100
Imo 97.2 2.8 100
Jigawa 67.3 32.7 100
Kaduna 68.8 31.2 100
Kano 53.2 46.8 100
Katsina 53.7 46.3 100
Kebbi 59 41 100
Kogi 91.3 8.7 100
Kwara 85 15 100
Lagos 99.1 0.9 100
Nassarawa 81.7 18.3 100
Niger 83.7 16.3 100
Ogun 95.9 4.1 100
Ondo 98.2 1.8 100
Osun 97.5 2.5 100
Oyo 93.3 6.7 100
Plateau 77.9 22.1 100
Rivers 96.5 3.5 100
Sokoto 81.5 18.5 100
Taraba 71.6 28.4 100
Yobe 77.2 22.8 100
Zamfara 66.2 33.8 100
Total 83.1 16.9 100
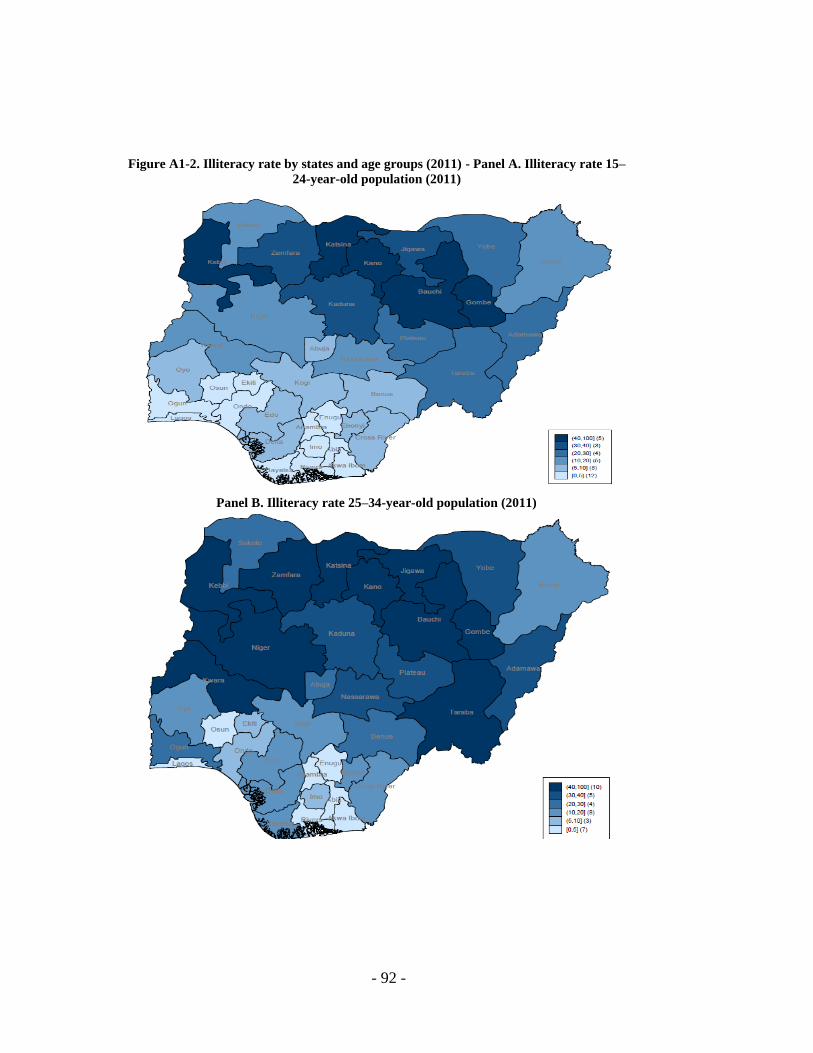
- 92 -
Figure A1-2. Illiteracy rate by states and age groups (2011) - Panel A. Illiteracy rate 15–
24-year-old population (2011)
Panel B. Illiteracy rate 25–34-year-old population (2011)

- 93 -
Panel C. Illiteracy rate 35–44-year-old population
Panel D. Illiteracy rate 45–64-year-old population (2011)

- 94 -
Table A1-5. Raw skills scores by states (2009)
Non
Routine
cognitive:
Analytical
Non Routine
cognitive:
Interpersonal
Routine
cognitive
Routine
manual
Non
routine
manual
physical
Abia 2.602 2.936 2.700 2.534 2.683
Adamawa 2.652 2.892 2.739 2.817 2.983
Akwa Ibom 2.620 3.008 2.631 2.356 2.497
Anambra 2.628 2.946 2.731 2.510 2.646
Bauchi 2.513 2.828 2.697 2.813 2.941
Bayelsa 2.643 2.864 2.839 2.740 2.851
Benue 2.513 2.766 2.717 2.940 3.208
Borno 2.590 2.831 2.728 2.938 3.132
Cross River 2.536 2.816 2.738 2.852 3.075
Delta 2.673 2.959 2.738 2.521 2.679
Ebonyi 2.504 2.770 2.714 2.915 3.168
Edo 2.598 2.961 2.649 2.568 2.739
Ekiti 2.788 3.076 2.701 2.436 2.554
Enugu 2.631 2.928 2.724 2.584 2.727
FCT Abuja 2.772 2.983 2.822 2.561 2.659
Gombe 2.663 2.900 2.744 2.764 2.914
Imo 2.645 2.887 2.818 2.608 2.800
Jigawa 2.588 2.856 2.708 2.782 3.002
Kaduna 2.623 2.864 2.793 2.868 2.991
Kano 2.699 2.967 2.772 2.702 2.754
Katsina 2.531 2.817 2.735 2.848 3.018
Kebbi 2.623 2.838 2.726 2.951 3.190
Kogi 2.636 2.933 2.698 2.630 2.789
Kwara 2.636 3.038 2.647 2.354 2.442
Lagos 2.794 3.008 2.902 2.301 2.310
Nassarawa 2.568 2.822 2.730 2.823 3.037
Niger 2.651 2.959 2.712 2.590 2.676
Ogun 2.679 2.919 2.904 2.697 2.705
Ondo 2.622 2.905 2.725 2.617 2.822
Osun 2.611 3.116 2.523 2.117 2.215
Oyo 2.687 2.947 2.797 2.557 2.697
Plateau 2.551 2.807 2.718 2.859 3.100
Rivers 2.707 2.942 2.811 2.640 2.736
Sokoto 2.638 2.861 2.731 2.953 3.140
Taraba 2.521 2.765 2.726 2.998 3.253
Yobe 2.551 2.795 2.752 2.870 3.093
Zamfara 2.646 2.860 2.784 2.827 2.906

- 95 -
Table A1-6. Raw skills scores by states (2011)
Non
Routine
cognitive:
Analytical
Non Routine
cognitive:
Interpersonal
Routine
cognitive
Routine
manual
Non
routine
manual
physical
Abia 2.663 2.909 2.766 2.660 2.838
Adamawa 2.616 2.835 2.730 2.911 3.142
Akwa Ibom 2.746 2.861 2.861 2.744 2.953
Anambra 2.830 2.919 2.891 2.563 2.702
Bauchi 2.515 2.762 2.740 2.897 3.105
Bayelsa 2.977 2.867 2.967 2.612 2.767
Benue 2.610 2.839 2.710 2.918 3.154
Borno 2.706 2.804 2.775 2.913 3.159
Cross River 2.683 2.839 2.817 2.831 3.003
Delta 2.689 2.848 2.823 2.784 2.988
Ebonyi 2.602 2.766 2.779 2.931 3.161
Edo 2.866 2.906 2.948 2.596 2.752
Ekiti 2.916 2.978 2.932 2.618 2.675
Enugu 2.658 2.914 2.755 2.625 2.839
Gombe 2.606 2.851 2.690 2.865 3.099
Imo 2.696 2.851 2.797 2.807 3.008
Jigawa 2.676 2.830 2.792 2.870 3.068
Kaduna 2.743 2.836 2.807 2.760 2.946
Kano 2.676 2.827 2.799 2.850 3.039
Katsina 2.891 2.881 2.917 2.677 2.781
Kebbi 2.693 2.839 2.786 2.857 3.048
Kogi 2.755 2.947 2.789 2.535 2.679
Kwara 3.041 2.917 3.029 2.501 2.590
Lagos 3.073 3.038 3.058 2.312 2.285
Nassarawa 2.643 2.850 2.766 2.813 3.012
Niger 2.797 2.935 2.849 2.640 2.722
Ogun 3.239 3.087 3.106 2.249 2.223
Ondo 2.593 2.883 2.704 2.653 2.854
Osun 3.001 3.015 3.038 2.449 2.461
Oyo 2.768 2.908 2.949 2.567 2.695
Plateau 2.719 2.886 2.795 2.879 3.055
Rivers 2.834 2.956 2.862 2.699 2.828
Sokoto 2.585 2.761 2.789 2.958 3.207
Taraba 2.490 2.730 2.719 2.990 3.281
Yobe 2.828 2.804 2.860 2.812 3.030
Zamfara 2.583 2.785 2.778 2.957 3.141
FCT Abuja 2.830 2.975 2.842 2.601 2.758
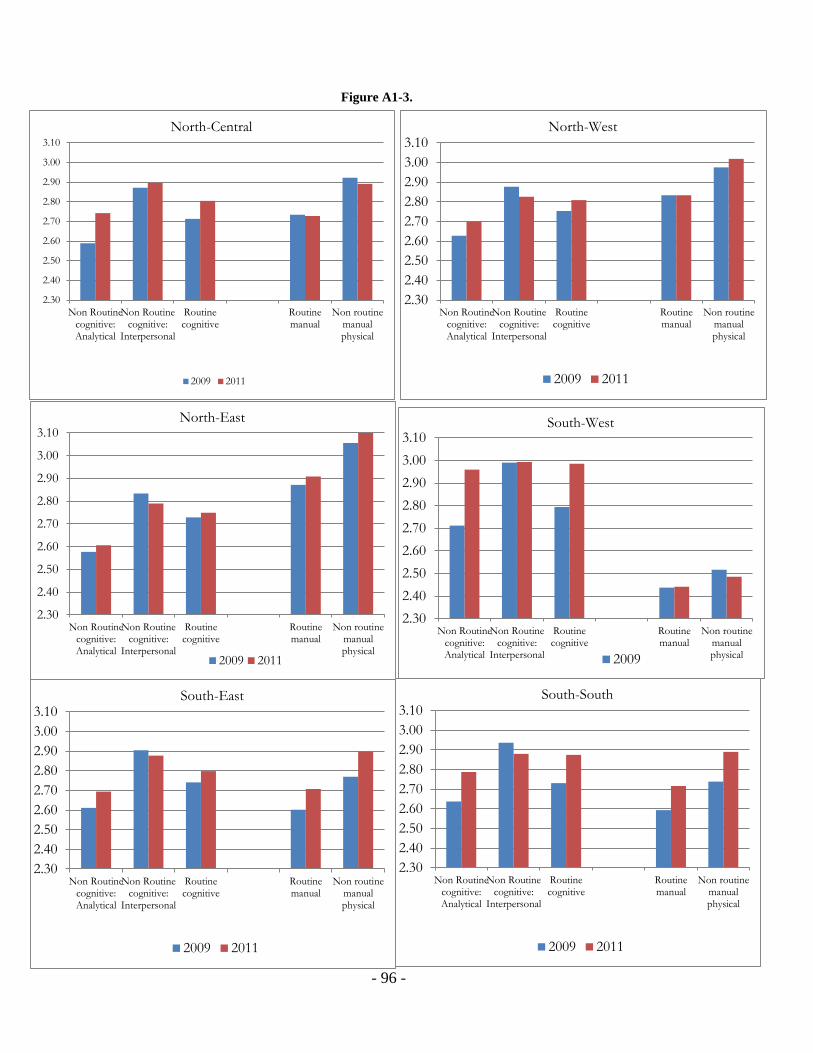
- 96 -
Figure A1-3.
2.30
2.40
2.50
2.60
2.70
2.80
2.90
3.00
3.10
Non Routinecognitive:Analytical
Non Routinecognitive:
Interpersonal
Routinecognitive
Routinemanual
Non routinemanualphysical
2009 2011
North-Central
2.30
2.40
2.50
2.60
2.70
2.80
2.90
3.00
3.10
Non Routinecognitive:Analytical
Non Routinecognitive:
Interpersonal
Routinecognitive
Routinemanual
Non routinemanualphysical
2009 2011
North-East
2.30
2.40
2.50
2.60
2.70
2.80
2.90
3.00
3.10
Non Routinecognitive:Analytical
Non Routinecognitive:
Interpersonal
Routinecognitive
Routinemanual
Non routinemanualphysical
2009 2011
North-West
2.30
2.40
2.50
2.60
2.70
2.80
2.90
3.00
3.10
Non Routinecognitive:Analytical
Non Routinecognitive:
Interpersonal
Routinecognitive
Routinemanual
Non routinemanualphysical2009
South-West
2.30
2.40
2.50
2.60
2.70
2.80
2.90
3.00
3.10
Non Routinecognitive:Analytical
Non Routinecognitive:
Interpersonal
Routinecognitive
Routinemanual
Non routinemanualphysical
2009 2011
South-East
2.30
2.40
2.50
2.60
2.70
2.80
2.90
3.00
3.10
Non Routinecognitive:Analytical
Non Routinecognitive:
Interpersonal
Routinecognitive
Routinemanual
Non routinemanualphysical
2009 2011
South-South

- 97 -
Table A1-7. Labor force definition (LFP) and NEET (15–64-year-old population, 2011)
Employed Unemployed LFPInactive in
schoolNEET
Inactive not
in school,
married
Inactive not
in school,
unmarried
Total
Zamfara 47.3 1.4 48.7 11.6 39.7 5 6.6 100
Sokoto 41.9 7 48.9 8.9 42.3 8.6 2.2 100
Katsina 41.2 8.6 49.8 12.1 38.2 1.6 0.3 100
Jigawa 47.3 7.6 54.9 10.9 34.2 3.6 1.8 100
Yobe 44.4 13.1 57.5 10.1 32.3 23.1 2.5 100
Kano 50.7 6.8 57.5 5.6 36.8 1.8 2.3 100
Kebbi 55.4 3.3 58.7 7.9 33.4 0.9 0.7 100
Gombe 46 12.7 58.7 10.2 31.1 5.9 1.1 100
Niger 59.2 3.9 63.1 19.4 17.6 1.8 2.3 100
Enugu 61.2 4.6 65.8 28.9 5.3 2.6 2.9 100
Ondo 65.3 2.2 67.5 28.6 3.9 0.3 0.6 100
Lagos 61.6 6.1 67.7 22.6 9.7 2 1.4 100
Abia 65.8 2.2 68 20.4 11.6 1.4 1.2 100
Osun 66.4 1.6 68 28.5 3.5 1.7 3.6 100
Ekiti 64.5 3.6 68.1 29.4 2.6 29.1 2 100
Kaduna 65.2 3.6 68.8 10.1 21 1.2 2.8 100
Rivers 62.8 6.1 68.9 27.2 3.8 30.3 3.9 100
Kwara 67.6 1.3 68.9 26.2 4.9 17.7 3.3 100
Oyo 66 3.2 69.2 21 9.8 35.5 1.3 100
FCT Abuja 65.4 4 69.4 16.6 13.9 34.4 3.8 100
Bauchi 69.4 1.1 70.5 3.9 25.6 29.8 3.6 100
Edo 67.2 3.5 70.7 25.9 3.4 1.3 1.3 100
Cross River 69.9 1.2 71.1 24.8 4.1 2.1 2.8 100
Anambra 66.8 5.6 72.4 22.1 5.4 6.4 3.3 100
Imo 68.4 4.5 72.9 23.2 4 3.6 1.6 100
Nassarawa 72.4 0.5 72.9 21.9 5.2 16.7 0.9 100
Bayelsa 69.4 4.7 74.1 21.8 4.1 1 1.3 100
Kogi 74.8 1.1 75.9 21.4 2.6 2 1.9 100
Akwa Ibom 73.7 2.3 76 22.1 1.9 2.2 1.3 100
Adamawa 55.9 20.5 76.4 12.8 10.8 3.8 6 100
Plateau 68.7 9.3 78 16.6 5.4 4.1 1.3 100
Delta 76.4 2.1 78.5 16 5.5 2.5 1.3 100
Ebonyi 78.9 1.5 80.4 18.7 0.9 40.3 2 100
Benue 79.9 0.8 80.7 17.7 1.6 2.2 0.9 100
Ogun 77.5 4.3 81.8 15.9 2.3 29.3 3 100
Borno 83.9 4.1 88 4.9 7 37.7 2 100
Taraba 87.1 4.7 91.8 5.1 3.1 12.1 1.8 100
Total 63.5 4.7 68.2 17.4 14.4 12 2.4 100

- 98 -
Table A1-8. Distribution of labor force status (LFP and NEET) 15–64 by state, 2011
Employed Unemployed LFPInactive in
schoolNEET
Inactive not
in school,
married
Inactive not
in school,
unmarried
Total
Abia 2.7 1.2 2.0 3.0 4.2 1.1 7.2 2.6
Adamawa 2.1 10.3 6.2 1.7 2.0 1.7 2.2 2.4
Akwa Ibom 3.2 1.3 2.3 3.5 0.4 0.4 0.3 2.8
Anambra 2.7 3.1 2.9 3.3 1.4 0.8 2.0 2.6
Bauchi 2.8 0.6 1.7 0.6 3.9 5.0 2.7 2.6
Bayelsa 2.0 1.8 1.9 2.3 1.1 0.3 1.8 1.8
Benue 4.3 0.5 2.4 3.5 0.7 0.3 1.0 3.4
Borno 2.0 1.3 1.7 0.4 0.7 0.7 0.7 1.5
Cross River 2.3 0.5 1.4 3.0 1.2 0.3 2.0 2.1
Delta 4.0 1.5 2.8 3.1 2.4 0.7 4.1 3.4
Ebonyi 2.1 0.5 1.3 1.9 0.2 0.0 0.4 1.7
Edo 2.9 2.0 2.5 4.1 1.1 0.5 1.7 2.8
Ekiti 2.2 1.7 2.0 3.7 0.7 0.3 1.1 2.2
Enugu 2.9 2.9 2.9 5.0 2.5 0.4 4.6 3.0
Gombe 1.0 3.7 2.4 0.8 2.2 3.3 1.1 1.4
Imo 2.9 2.5 2.7 3.6 1.8 0.3 3.2 2.7
Jigawa 2.4 5.1 3.8 2.0 6.7 8.1 5.3 3.2
Kaduna 4.9 3.6 4.3 2.8 6.9 7.0 6.7 4.7
Kano 4.2 7.6 5.9 1.7 9.4 15.8 2.9 5.3
Katsina 2.4 6.6 4.5 2.5 8.2 10.5 5.9 3.7
Kebbi 2.1 1.7 1.9 1.1 4.8 5.9 3.6 2.4
Kogi 3.2 0.6 1.9 3.4 0.9 0.3 1.5 2.8
Kwara 1.8 0.5 1.2 2.6 1.2 0.3 2.0 1.7
Lagos 5.8 7.7 6.8 7.8 5.8 3.2 8.3 6.0
Nassarawa 2.0 0.2 1.1 2.2 0.9 0.5 1.2 1.8
Niger 2.4 2.1 2.3 2.8 2.2 3.5 0.9 2.5
Ogun 3.6 2.7 3.2 2.7 1.0 0.2 1.7 3.0
Ondo 2.6 1.2 1.9 4.1 1.3 0.4 2.1 2.5
Osun 2.3 0.7 1.5 3.6 0.8 0.4 1.2 2.2
Oyo 3.8 2.5 3.2 4.4 5.1 1.1 9.1 3.6
Plateau 2.8 5.0 3.9 2.4 1.2 0.9 1.4 2.6
Rivers 2.9 3.8 3.4 4.6 1.2 0.6 1.7 2.9
Sokoto 2.1 4.7 3.4 1.6 6.7 10.8 2.6 3.2
Taraba 2.1 1.5 1.8 0.5 0.5 0.3 0.6 1.5
Yobe 1.1 4.5 2.8 1.0 3.1 4.0 2.1 1.6
Zamfara 2.0 0.8 1.4 1.8 5.5 8.6 2.3 2.7
FCT Abuja 1.2 1.0 1.1 1.1 1.1 1.2 0.9 1.2
Total 100.0 100.0 100.0 100.0 100.0 100.0 100.0 100.0

- 99 -
Table A1-9. Labor force definition (LFP) and NEET (15–24-year-old population, 2011)
Employed Unemployed LFPInactive in
schoolNEET
Inactive not
in school,
married
Inactive not
in school,
unmarried
Total
Katsina 18 5.9 23.9 39.3 36.9 0.3 13.6 100
Zamfara 26.1 1.8 27.9 39.5 32.7 5.2 1.2 100
Kebbi 42.1 3.9 46 21.6 32.3 0.9 0.3 100
Sokoto 29.2 12 41.2 27.1 31.7 2.2 2.2 100
Yobe 29.9 12.6 42.5 27.4 30.1 13.9 5.5 100
Jigawa 32.6 8.7 41.3 29.2 29.5 1.3 4 100
Gombe 40.9 8.7 49.6 23 27.4 0 1 100
Kano 43 11.9 54.9 17.8 27.3 4.3 2.5 100
Bauchi 70.1 0.6 70.7 9.9 19.4 0.4 4.1 100
Kaduna 49.7 3.1 52.8 29.1 18.1 0.3 5.8 100
Oyo 9.1 4 13.1 70.6 16.3 0.3 0.5 100
Abia 20.5 3.6 24.1 62.1 13.9 0.5 1.8 100
Lagos 17.2 7.7 24.9 64.9 10.2 0.6 2.6 100
Kwara 16.2 0.8 17 73.4 9.7 0 5.5 100
Niger 18.2 6.6 24.8 67 8.3 24.6 2.8 100
FCT Abuja 29.9 7.3 37.2 55.3 7.4 0.5 5.4 100
Borno 74.8 1 75.8 17.3 6.8 21.8 7.7 100
Adamawa 42.2 16.6 58.8 34.7 6.4 11.5 6.6 100
Nassarawa 38.7 0.9 39.6 54.2 6.2 25.4 1.9 100
Delta 47 3.4 50.4 43.6 6.1 28.7 8.2 100
Imo 24.1 7.6 31.7 62.5 5.9 23.3 9 100
Enugu 17.7 5.2 22.9 71.5 5.5 1.7 3.5 100
Bayelsa 34 5.7 39.7 55 5.3 2.1 7.6 100
Kogi 26.5 1.5 28 66.8 5.2 5.3 4.9 100
Ondo 18.7 3.8 22.5 72.3 5.2 2.7 3.5 100
Cross River 31.8 0.4 32.2 63.3 4.5 5.9 2.4 100
Anambra 18.2 8.4 26.6 69 4.4 0 4.3 100
Ogun 22.8 6.7 29.5 66.2 4.3 1 4.2 100
Ekiti 13.3 7.5 20.8 75.9 3.2 2.1 1.1 100
Osun 19.6 0 19.6 77.2 3.2 3.4 12.9 100
Plateau 44.6 13.4 58 38.9 3.0 2.3 0.7 100
Rivers 26.2 5.6 31.8 65.9 2.3 0.2 2.1 100
Edo 25.1 1.7 26.8 70.9 2.3 27.6 4.1 100
Taraba 80.4 3.5 83.9 14.7 1.4 1.4 0 100
Akwa Ibom 36.4 5 41.4 57.4 1.2 25.8 4.3 100
Benue 58.6 0.4 59 40 1.0 28.3 4.4 100
Ebonyi 54.8 1.7 56.5 42.6 0.8 3.8 3.6 100
Total 33.5 5.6 39.1 48.5 12.4 8.1 4.3 100

- 100 -
Table A1-10. Distribution of labor force status (LFP and NEET) 15–24 by state, 2011
Employed Unemployed LFPInactive in
schoolNEET
Inactive not
in school,
married
Inactive not
in school,
unmarried
Total
Abia 1.4 1.5 1.5 3.0 3.8 0.1 7.4 2.4
Adamawa 3.2 7.6 5.4 1.8 1.2 1.7 0.7 2.6
Akwa Ibom 3.3 2.8 3.1 3.6 0.3 0.3 0.2 3.1
Anambra 1.3 3.6 2.5 3.4 1.0 0.7 1.3 2.4
Bauchi 5.8 0.3 3.1 0.6 4.1 4.7 3.5 2.8
Bayelsa 2.1 2.1 2.1 2.4 1.1 0.3 1.9 2.1
Benue 7.4 0.3 3.9 3.5 0.5 0.0 0.9 4.2
Borno 2.7 0.2 1.5 0.4 0.7 0.7 0.7 1.2
Cross River 2.1 0.1 1.1 2.8 1.1 0.1 2.1 2.2
Delta 4.9 2.1 3.5 3.2 2.4 0.1 4.7 3.5
Ebonyi 3.7 0.7 2.2 2.0 0.2 0.1 0.3 2.3
Edo 2.1 0.8 1.5 4.0 0.7 0.2 1.1 2.8
Ekiti 0.9 2.9 1.9 3.4 0.8 0.2 1.3 2.2
Enugu 1.8 3.2 2.5 5.0 2.2 0.0 4.3 3.4
Gombe 2.2 2.8 2.5 0.9 3.4 5.5 1.2 1.8
Imo 1.9 3.6 2.8 3.4 1.7 0.1 3.3 2.7
Jigawa 3.2 5.2 4.2 2.0 7.5 9.0 5.9 3.3
Kaduna 7.1 2.7 4.9 2.9 7.1 6.8 7.4 4.8
Kano 6.3 10.5 8.4 1.8 8.8 15.4 2.1 4.9
Katsina 1.9 3.6 2.8 2.8 9.4 12.2 6.5 3.4
Kebbi 3.1 1.7 2.4 1.1 6.2 7.1 5.2 2.5
Kogi 1.9 0.6 1.3 3.3 1.3 0.5 2.0 2.4
Kwara 0.8 0.2 0.5 2.5 1.7 0.4 2.9 1.7
Lagos 2.7 7.4 5.1 7.1 4.8 3.4 6.1 5.3
Nassarawa 2.4 0.3 1.4 2.3 1.2 0.7 1.7 2.1
Niger 1.2 2.6 1.9 3.1 1.4 1.6 1.2 2.2
Ogun 1.4 2.4 1.9 2.7 1.0 0.0 2.0 2.0
Ondo 1.4 1.8 1.6 3.8 1.4 0.3 2.5 2.6
Osun 1.3 0.0 0.7 3.5 0.6 0.6 0.6 2.2
Oyo 0.8 2.2 1.5 4.3 5.1 1.3 8.9 3.0
Plateau 4.1 7.4 5.8 2.5 0.7 0.9 0.5 3.1
Rivers 2.6 3.3 3.0 4.5 0.9 0.1 1.6 3.3
Sokoto 2.6 6.4 4.5 1.7 6.5 10.1 2.8 3.0
Taraba 4.1 1.1 2.6 0.5 0.2 0.3 0.0 1.7
Yobe 1.5 3.8 2.7 1.0 3.6 5.4 1.7 1.7
Zamfara 1.9 0.8 1.4 2.0 5.5 8.5 2.5 2.4
FCT Abuja 0.9 1.3 1.1 1.1 0.7 0.5 0.8 1.0
Total 100.0 100.0 100.0 100.0 100.0 100.0 100.0 100.0

- 101 -
Table A1-11. Labor force definition: Underemployment (15–64-year-old population, 2011)
Employed Underemplo
yed Unemployed
Inactive in
schoolNEET
Inactive not
in school,
married
Inactive not
in school,
unmarried
Total
Abia 64.1 1.7 2.2 20.4 11.6 5.0 6.6 100.0
Adamawa 52.8 3.0 20.5 12.8 10.8 8.6 2.2 100.0
Akwa Ibom 68.9 4.8 2.3 22.1 1.9 1.6 0.3 100.0
Anambra 64.0 2.8 5.6 22.1 5.4 3.6 1.8 100.0
Bauchi 60.1 9.4 1.1 3.9 25.6 23.1 2.5 100.0
Bayelsa 66.7 2.7 4.7 21.8 4.1 1.8 2.3 100.0
Benue 75.5 4.4 0.8 17.7 1.6 0.9 0.7 100.0
Borno 74.4 9.5 4.1 4.9 7.0 5.9 1.1 100.0
Cross River 68.7 1.3 1.2 24.8 4.1 1.8 2.3 100.0
Delta 71.0 5.4 2.1 16.0 5.5 2.6 2.9 100.0
Ebonyi 77.1 1.8 1.5 18.7 0.9 0.3 0.6 100.0
Edo 64.0 3.2 3.5 25.9 3.4 2.0 1.4 100.0
Ekiti 62.1 2.3 3.6 29.4 2.6 1.4 1.2 100.0
Enugu 55.3 5.9 4.6 28.9 5.3 1.7 3.6 100.0
Gombe 39.1 7.0 12.7 10.2 31.1 29.1 2.0 100.0
Imo 64.2 4.2 4.5 23.2 4.0 1.2 2.8 100.0
Jigawa 42.7 4.6 7.6 10.9 34.2 30.3 3.9 100.0
Kaduna 57.6 7.6 3.6 10.1 21.0 17.7 3.3 100.0
Kano 48.9 1.8 6.8 5.6 36.8 35.5 1.3 100.0
Katsina 39.1 2.1 8.6 12.1 38.2 34.4 3.8 100.0
Kebbi 52.5 3.0 3.3 7.9 33.4 29.8 3.6 100.0
Kogi 72.4 2.4 1.1 21.4 2.6 1.3 1.3 100.0
Kwara 67.2 0.5 1.3 26.2 4.9 2.1 2.8 100.0
Lagos 60.8 0.8 6.1 22.6 9.7 6.4 3.3 100.0
Nassarawa 60.6 11.8 0.5 21.9 5.2 3.6 1.6 100.0
Niger 49.6 9.5 3.9 19.4 17.6 16.7 0.9 100.0
Ogun 77.3 0.2 4.3 15.9 2.3 1.0 1.3 100.0
Ondo 64.8 0.5 2.2 28.6 3.9 2.0 1.9 100.0
Osun 66.4 0.0 1.6 28.5 3.5 2.2 1.3 100.0
Oyo 65.1 0.9 3.2 21.0 9.8 3.8 6.0 100.0
Plateau 64.6 4.1 9.3 16.6 5.4 4.1 1.3 100.0
Rivers 61.4 1.5 6.1 27.2 3.8 2.5 1.3 100.0
Sokoto 40.1 1.8 7.0 8.9 42.3 40.3 2.0 100.0
Taraba 84.1 3.0 4.7 5.1 3.1 2.2 0.9 100.0
Yobe 34.8 9.6 13.1 10.1 32.3 29.3 3.0 100.0
Zamfara 45.2 2.1 1.4 11.6 39.7 37.7 2.0 100.0
FCT Abuja 64.9 0.6 4.0 16.6 13.9 12.1 1.8 100.0
Total 60.0 3.5 4.7 17.4 14.4 12.0 2.4 100.0

- 102 -
Table A1-12. Distribution of labor force (underemployment) 15–64 by state, 2011
Employed
(40h+ or <40h
not willing to
work)
Underemplo
yed (<40h
and willing
to work)
UnemployedInactive in
schoolNEET
Inactive not
in school,
married
Inactive not
in school,
unmarried
Total
Abia 19.5 1.0 3.6 62.1 13.9 0.3 13.6 100.0
Adamawa 38.6 3.6 16.6 34.7 6.4 5.2 1.2 100.0
Akwa Ibom 34.5 1.9 5.0 57.4 1.2 0.9 0.3 100.0
Anambra 16.8 1.4 8.4 69.0 4.4 2.2 2.2 100.0
Bauchi 57.2 12.9 0.6 9.9 19.4 13.9 5.5 100.0
Bayelsa 33.9 0.1 5.7 55.0 5.3 1.3 4.0 100.0
Benue 52.5 6.1 0.4 40.0 1.0 0.0 1.0 100.0
Borno 66.2 8.6 1.0 17.3 6.8 4.3 2.5 100.0
Cross River 31.0 0.8 0.4 63.3 4.5 0.4 4.1 100.0
Delta 44.0 3.0 3.4 43.6 6.1 0.3 5.8 100.0
Ebonyi 53.3 1.5 1.7 42.6 0.8 0.3 0.5 100.0
Edo 22.8 2.3 1.7 70.9 2.3 0.5 1.8 100.0
Ekiti 13.3 0.0 7.5 75.9 3.2 0.6 2.6 100.0
Enugu 13.4 4.2 5.2 71.5 5.5 0.0 5.5 100.0
Gombe 34.8 6.1 8.7 23.0 27.4 24.6 2.8 100.0
Imo 20.3 3.8 7.6 62.5 5.9 0.5 5.4 100.0
Jigawa 28.4 4.2 8.7 29.2 29.5 21.8 7.7 100.0
Kaduna 42.7 7.0 3.1 29.1 18.1 11.5 6.6 100.0
Kano 41.5 1.5 11.9 17.8 27.3 25.4 1.9 100.0
Katsina 17.2 0.9 5.9 39.3 36.9 28.7 8.2 100.0
Kebbi 38.5 3.5 3.9 21.6 32.3 23.3 9.0 100.0
Kogi 26.2 0.3 1.5 66.8 5.2 1.7 3.5 100.0
Kwara 15.2 1.0 0.8 73.4 9.7 2.1 7.6 100.0
Lagos 17.2 0.0 7.7 64.9 10.2 5.3 4.9 100.0
Nassarawa 30.6 8.2 0.9 54.2 6.2 2.7 3.5 100.0
Niger 14.4 3.8 6.6 67.0 8.3 5.9 2.4 100.0
Ogun 22.6 0.1 6.7 66.2 4.3 0.0 4.3 100.0
Ondo 18.3 0.4 3.8 72.3 5.2 1.0 4.2 100.0
Osun 19.6 0.0 0.0 77.2 3.2 2.1 1.1 100.0
Oyo 9.1 0.0 4.0 70.6 16.3 3.4 12.9 100.0
Plateau 41.9 2.8 13.4 38.9 3.0 2.3 0.7 100.0
Rivers 25.2 1.0 5.6 65.9 2.3 0.2 2.1 100.0
Sokoto 26.6 2.6 12.0 27.1 31.7 27.6 4.1 100.0
Taraba 74.5 5.9 3.5 14.7 1.4 1.4 0.0 100.0
Yobe 22.1 7.8 12.6 27.4 30.1 25.8 4.3 100.0
Zamfara 23.0 3.1 1.8 39.5 32.7 28.3 4.4 100.0
FCT Abuja 29.4 0.6 7.3 55.3 7.4 3.8 3.6 100.0
Total 30.6 3.0 5.6 48.5 12.4 8.1 4.3 100.0
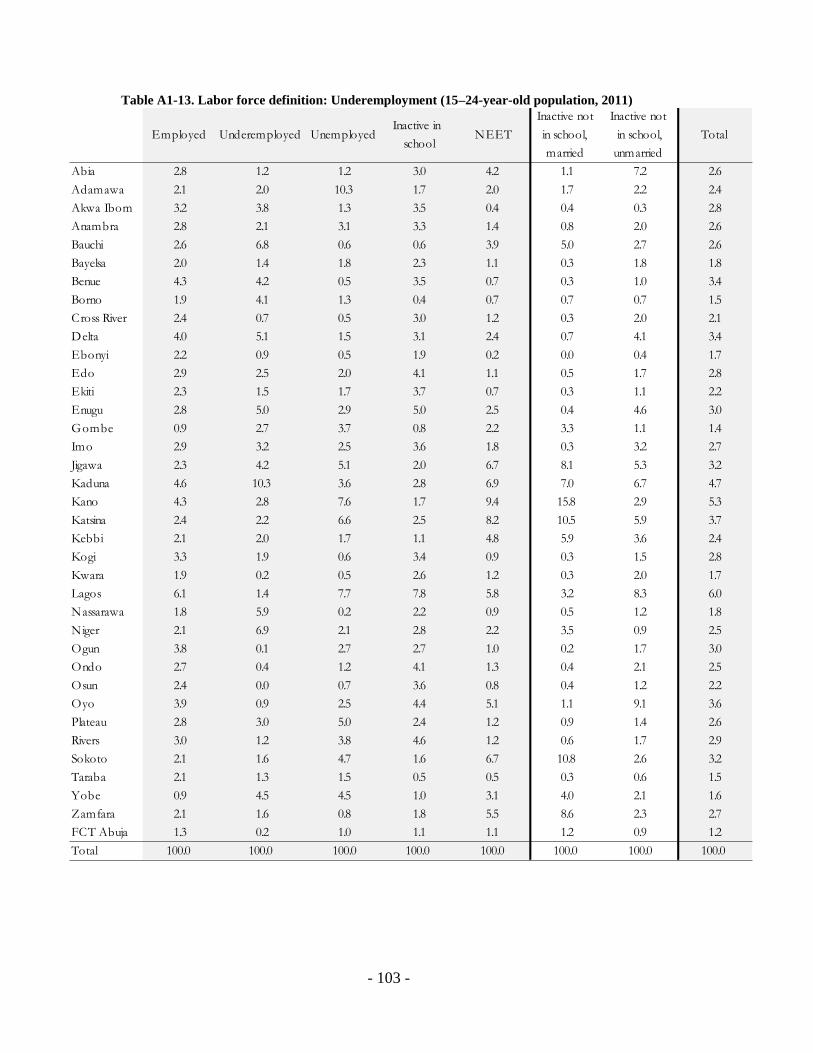
- 103 -
Table A1-13. Labor force definition: Underemployment (15–24-year-old population, 2011)
Employed Underemployed UnemployedInactive in
schoolNEET
Inactive not
in school,
married
Inactive not
in school,
unmarried
Total
Abia 2.8 1.2 1.2 3.0 4.2 1.1 7.2 2.6
Adamawa 2.1 2.0 10.3 1.7 2.0 1.7 2.2 2.4
Akwa Ibom 3.2 3.8 1.3 3.5 0.4 0.4 0.3 2.8
Anambra 2.8 2.1 3.1 3.3 1.4 0.8 2.0 2.6
Bauchi 2.6 6.8 0.6 0.6 3.9 5.0 2.7 2.6
Bayelsa 2.0 1.4 1.8 2.3 1.1 0.3 1.8 1.8
Benue 4.3 4.2 0.5 3.5 0.7 0.3 1.0 3.4
Borno 1.9 4.1 1.3 0.4 0.7 0.7 0.7 1.5
Cross River 2.4 0.7 0.5 3.0 1.2 0.3 2.0 2.1
Delta 4.0 5.1 1.5 3.1 2.4 0.7 4.1 3.4
Ebonyi 2.2 0.9 0.5 1.9 0.2 0.0 0.4 1.7
Edo 2.9 2.5 2.0 4.1 1.1 0.5 1.7 2.8
Ekiti 2.3 1.5 1.7 3.7 0.7 0.3 1.1 2.2
Enugu 2.8 5.0 2.9 5.0 2.5 0.4 4.6 3.0
Gombe 0.9 2.7 3.7 0.8 2.2 3.3 1.1 1.4
Imo 2.9 3.2 2.5 3.6 1.8 0.3 3.2 2.7
Jigawa 2.3 4.2 5.1 2.0 6.7 8.1 5.3 3.2
Kaduna 4.6 10.3 3.6 2.8 6.9 7.0 6.7 4.7
Kano 4.3 2.8 7.6 1.7 9.4 15.8 2.9 5.3
Katsina 2.4 2.2 6.6 2.5 8.2 10.5 5.9 3.7
Kebbi 2.1 2.0 1.7 1.1 4.8 5.9 3.6 2.4
Kogi 3.3 1.9 0.6 3.4 0.9 0.3 1.5 2.8
Kwara 1.9 0.2 0.5 2.6 1.2 0.3 2.0 1.7
Lagos 6.1 1.4 7.7 7.8 5.8 3.2 8.3 6.0
Nassarawa 1.8 5.9 0.2 2.2 0.9 0.5 1.2 1.8
Niger 2.1 6.9 2.1 2.8 2.2 3.5 0.9 2.5
Ogun 3.8 0.1 2.7 2.7 1.0 0.2 1.7 3.0
Ondo 2.7 0.4 1.2 4.1 1.3 0.4 2.1 2.5
Osun 2.4 0.0 0.7 3.6 0.8 0.4 1.2 2.2
Oyo 3.9 0.9 2.5 4.4 5.1 1.1 9.1 3.6
Plateau 2.8 3.0 5.0 2.4 1.2 0.9 1.4 2.6
Rivers 3.0 1.2 3.8 4.6 1.2 0.6 1.7 2.9
Sokoto 2.1 1.6 4.7 1.6 6.7 10.8 2.6 3.2
Taraba 2.1 1.3 1.5 0.5 0.5 0.3 0.6 1.5
Yobe 0.9 4.5 4.5 1.0 3.1 4.0 2.1 1.6
Zamfara 2.1 1.6 0.8 1.8 5.5 8.6 2.3 2.7
FCT Abuja 1.3 0.2 1.0 1.1 1.1 1.2 0.9 1.2
Total 100.0 100.0 100.0 100.0 100.0 100.0 100.0 100.0
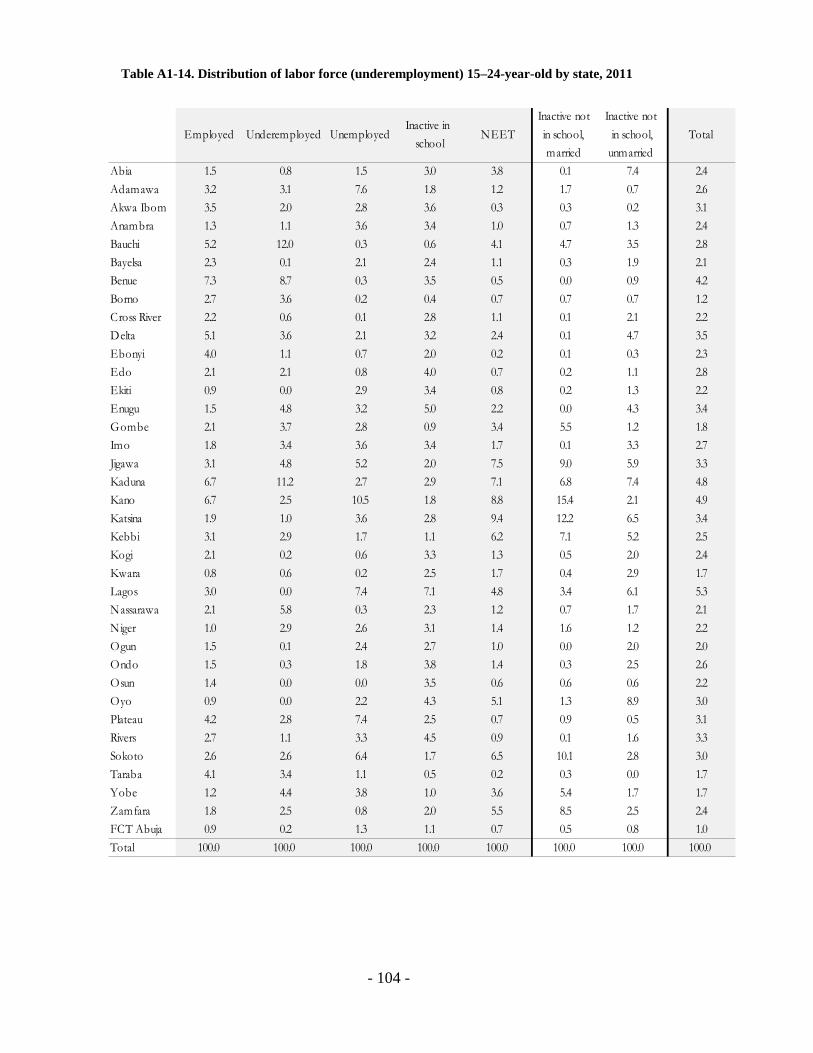
- 104 -
Table A1-14. Distribution of labor force (underemployment) 15–24-year-old by state, 2011
Employed Underemployed Unemployed
Inactive in
schoolNEET
Inactive not
in school,
married
Inactive not
in school,
unmarried
Total
Abia 1.5 0.8 1.5 3.0 3.8 0.1 7.4 2.4
Adamawa 3.2 3.1 7.6 1.8 1.2 1.7 0.7 2.6
Akwa Ibom 3.5 2.0 2.8 3.6 0.3 0.3 0.2 3.1
Anambra 1.3 1.1 3.6 3.4 1.0 0.7 1.3 2.4
Bauchi 5.2 12.0 0.3 0.6 4.1 4.7 3.5 2.8
Bayelsa 2.3 0.1 2.1 2.4 1.1 0.3 1.9 2.1
Benue 7.3 8.7 0.3 3.5 0.5 0.0 0.9 4.2
Borno 2.7 3.6 0.2 0.4 0.7 0.7 0.7 1.2
Cross River 2.2 0.6 0.1 2.8 1.1 0.1 2.1 2.2
Delta 5.1 3.6 2.1 3.2 2.4 0.1 4.7 3.5
Ebonyi 4.0 1.1 0.7 2.0 0.2 0.1 0.3 2.3
Edo 2.1 2.1 0.8 4.0 0.7 0.2 1.1 2.8
Ekiti 0.9 0.0 2.9 3.4 0.8 0.2 1.3 2.2
Enugu 1.5 4.8 3.2 5.0 2.2 0.0 4.3 3.4
Gombe 2.1 3.7 2.8 0.9 3.4 5.5 1.2 1.8
Imo 1.8 3.4 3.6 3.4 1.7 0.1 3.3 2.7
Jigawa 3.1 4.8 5.2 2.0 7.5 9.0 5.9 3.3
Kaduna 6.7 11.2 2.7 2.9 7.1 6.8 7.4 4.8
Kano 6.7 2.5 10.5 1.8 8.8 15.4 2.1 4.9
Katsina 1.9 1.0 3.6 2.8 9.4 12.2 6.5 3.4
Kebbi 3.1 2.9 1.7 1.1 6.2 7.1 5.2 2.5
Kogi 2.1 0.2 0.6 3.3 1.3 0.5 2.0 2.4
Kwara 0.8 0.6 0.2 2.5 1.7 0.4 2.9 1.7
Lagos 3.0 0.0 7.4 7.1 4.8 3.4 6.1 5.3
Nassarawa 2.1 5.8 0.3 2.3 1.2 0.7 1.7 2.1
Niger 1.0 2.9 2.6 3.1 1.4 1.6 1.2 2.2
Ogun 1.5 0.1 2.4 2.7 1.0 0.0 2.0 2.0
Ondo 1.5 0.3 1.8 3.8 1.4 0.3 2.5 2.6
Osun 1.4 0.0 0.0 3.5 0.6 0.6 0.6 2.2
Oyo 0.9 0.0 2.2 4.3 5.1 1.3 8.9 3.0
Plateau 4.2 2.8 7.4 2.5 0.7 0.9 0.5 3.1
Rivers 2.7 1.1 3.3 4.5 0.9 0.1 1.6 3.3
Sokoto 2.6 2.6 6.4 1.7 6.5 10.1 2.8 3.0
Taraba 4.1 3.4 1.1 0.5 0.2 0.3 0.0 1.7
Yobe 1.2 4.4 3.8 1.0 3.6 5.4 1.7 1.7
Zamfara 1.8 2.5 0.8 2.0 5.5 8.5 2.5 2.4
FCT Abuja 0.9 0.2 1.3 1.1 0.7 0.5 0.8 1.0
Total 100.0 100.0 100.0 100.0 100.0 100.0 100.0 100.0

- 105 -
Table A1-15. Labor force definition: Formal vs. informal (15–64-year-old population, 2011)
Formal
Wage
Workers
Informal
Wage
Workers
(non-farm)
Informal
Self- (non-
farm)
Informal Self-
(agriculture)Total
Abia 1.9 3.4 3.6 2.3 2.7
Adamawa 0.9 1.4 0.7 2.8 2.0
Akwa Ibom 3.7 1.4 3.3 3.4 3.2
Anambra 1.0 2.9 4.1 2.2 2.8
Bauchi 2.0 0.9 2.1 3.4 2.7
Bayelsa 2.2 2.9 1.2 2.3 2.0
Benue 2.1 2.9 0.8 6.5 4.3
Borno 0.4 0.4 0.6 3.0 2.0
Cross River 1.6 2.2 1.7 2.7 2.3
Delta 2.9 3.9 3.0 4.5 3.9
Ebonyi 0.3 0.8 0.7 3.2 2.1
Edo 3.8 3.0 3.7 2.4 2.9
Ekiti 1.9 3.4 3.5 1.5 2.3
Enugu 2.7 3.2 3.3 2.7 2.9
Gombe 0.1 0.6 0.6 1.2 0.9
Imo 2.2 2.5 2.0 3.6 3.0
Jigawa 1.1 1.0 1.3 3.2 2.4
Kaduna 4.4 3.0 3.1 6.2 4.9
Kano 0.0 0.7 3.3 5.5 4.2
Katsina 1.6 1.1 2.8 2.4 2.4
Kebbi 2.7 0.6 1.1 2.8 2.1
Kogi 1.9 6.3 3.9 2.5 3.3
Kwara 2.7 1.2 2.9 1.4 1.9
Lagos 19.4 14.0 13.0 0.3 6.0
Nassarawa 2.9 1.9 0.9 2.6 2.1
Niger 3.0 4.5 2.3 2.1 2.4
Ogun 6.7 4.8 9.0 0.6 3.7
Ondo 2.8 3.3 2.3 2.6 2.6
Osun 2.8 3.1 5.4 0.6 2.4
Oyo 0.3 7.0 6.7 2.0 3.8
Plateau 3.6 1.8 1.5 3.5 2.7
Rivers 7.8 5.2 1.8 2.7 2.9
Sokoto 0.5 0.9 0.8 3.1 2.1
Taraba 0.4 0.3 0.6 3.0 2.0
Yobe 0.1 0.5 0.5 1.6 1.1
Zamfara 0.1 0.9 1.0 2.9 2.1
FCT Abuja 5.4 2.4 0.9 1.0 1.2
Total 100.0 100.0 100.0 100.0 100.0
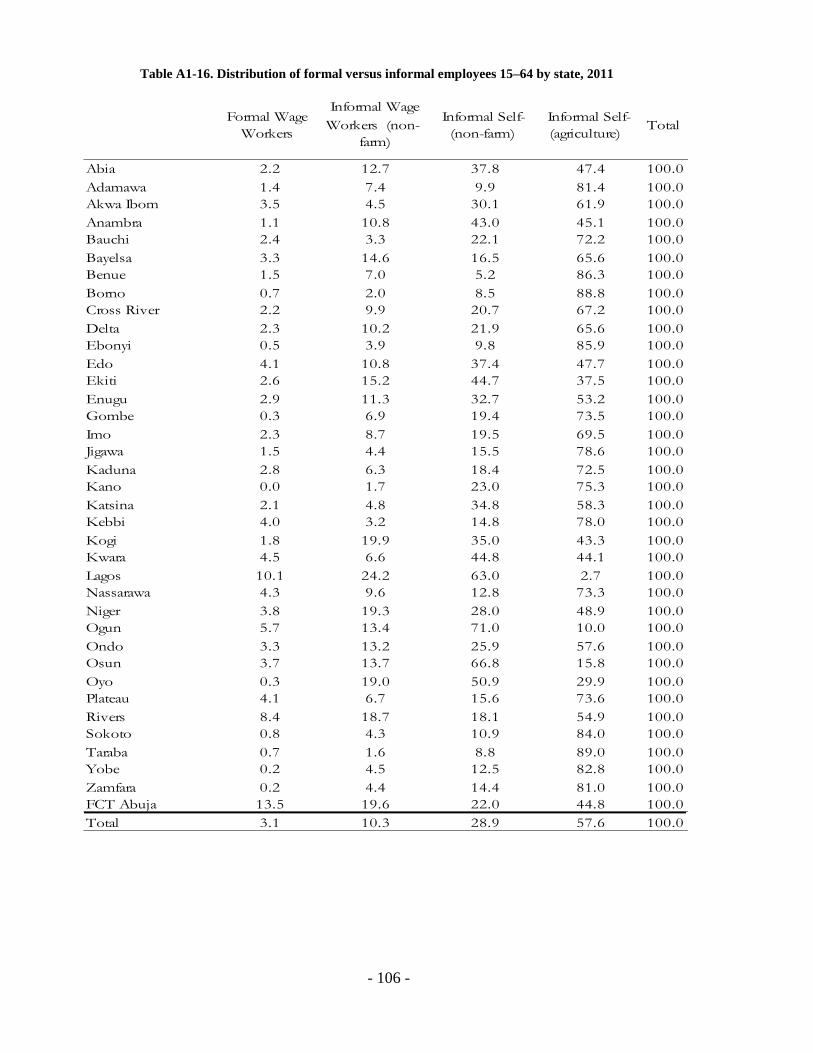
- 106 -
Table A1-16. Distribution of formal versus informal employees 15–64 by state, 2011
Formal Wage
Workers
Informal Wage
Workers (non-
farm)
Informal Self-
(non-farm)
Informal Self-
(agriculture)Total
Abia 2.2 12.7 37.8 47.4 100.0
Adamawa 1.4 7.4 9.9 81.4 100.0
Akwa Ibom 3.5 4.5 30.1 61.9 100.0
Anambra 1.1 10.8 43.0 45.1 100.0
Bauchi 2.4 3.3 22.1 72.2 100.0
Bayelsa 3.3 14.6 16.5 65.6 100.0
Benue 1.5 7.0 5.2 86.3 100.0
Borno 0.7 2.0 8.5 88.8 100.0
Cross River 2.2 9.9 20.7 67.2 100.0
Delta 2.3 10.2 21.9 65.6 100.0
Ebonyi 0.5 3.9 9.8 85.9 100.0
Edo 4.1 10.8 37.4 47.7 100.0
Ekiti 2.6 15.2 44.7 37.5 100.0
Enugu 2.9 11.3 32.7 53.2 100.0
Gombe 0.3 6.9 19.4 73.5 100.0
Imo 2.3 8.7 19.5 69.5 100.0
Jigawa 1.5 4.4 15.5 78.6 100.0
Kaduna 2.8 6.3 18.4 72.5 100.0
Kano 0.0 1.7 23.0 75.3 100.0
Katsina 2.1 4.8 34.8 58.3 100.0
Kebbi 4.0 3.2 14.8 78.0 100.0
Kogi 1.8 19.9 35.0 43.3 100.0
Kwara 4.5 6.6 44.8 44.1 100.0
Lagos 10.1 24.2 63.0 2.7 100.0
Nassarawa 4.3 9.6 12.8 73.3 100.0
Niger 3.8 19.3 28.0 48.9 100.0
Ogun 5.7 13.4 71.0 10.0 100.0
Ondo 3.3 13.2 25.9 57.6 100.0
Osun 3.7 13.7 66.8 15.8 100.0
Oyo 0.3 19.0 50.9 29.9 100.0
Plateau 4.1 6.7 15.6 73.6 100.0
Rivers 8.4 18.7 18.1 54.9 100.0
Sokoto 0.8 4.3 10.9 84.0 100.0
Taraba 0.7 1.6 8.8 89.0 100.0
Yobe 0.2 4.5 12.5 82.8 100.0
Zamfara 0.2 4.4 14.4 81.0 100.0
FCT Abuja 13.5 19.6 22.0 44.8 100.0
Total 3.1 10.3 28.9 57.6 100.0
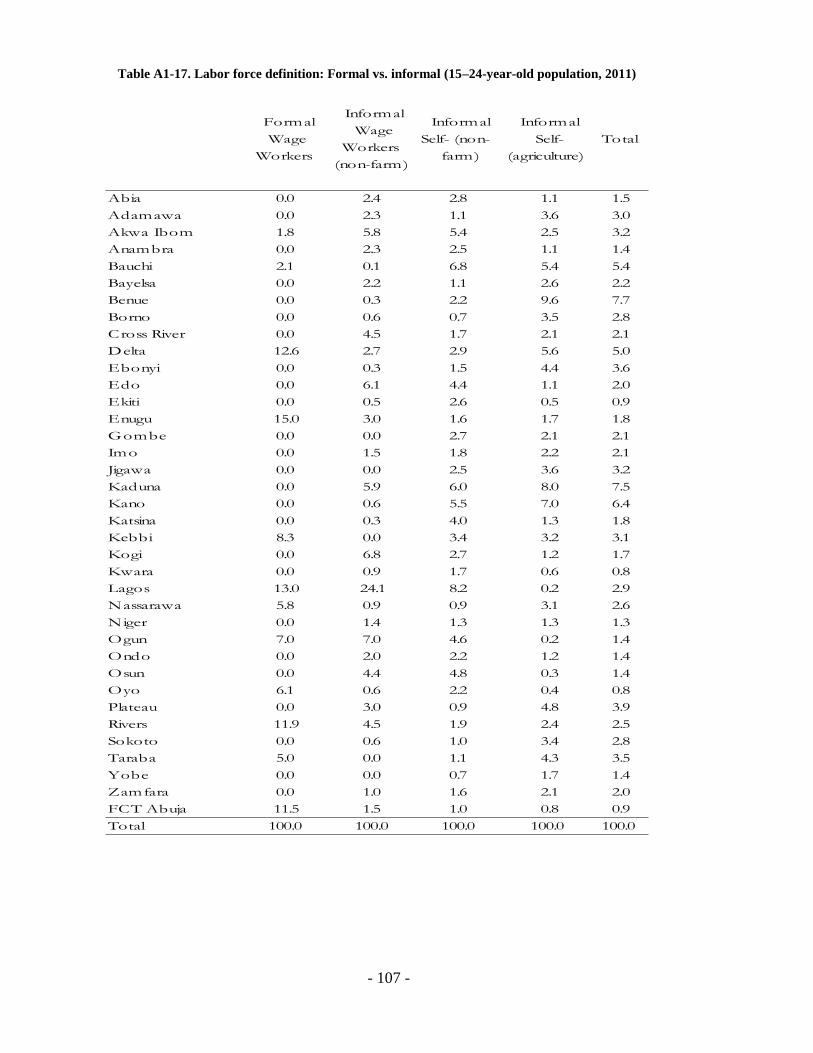
- 107 -
Table A1-17. Labor force definition: Formal vs. informal (15–24-year-old population, 2011)
Formal
Wage
Workers
Informal
Wage
Workers
(non-farm)
Informal
Self- (non-
farm)
Informal
Self-
(agriculture)
Total
Abia 0.0 2.4 2.8 1.1 1.5
Adamawa 0.0 2.3 1.1 3.6 3.0
Akwa Ibom 1.8 5.8 5.4 2.5 3.2
Anambra 0.0 2.3 2.5 1.1 1.4
Bauchi 2.1 0.1 6.8 5.4 5.4
Bayelsa 0.0 2.2 1.1 2.6 2.2
Benue 0.0 0.3 2.2 9.6 7.7
Borno 0.0 0.6 0.7 3.5 2.8
Cross River 0.0 4.5 1.7 2.1 2.1
Delta 12.6 2.7 2.9 5.6 5.0
Ebonyi 0.0 0.3 1.5 4.4 3.6
Edo 0.0 6.1 4.4 1.1 2.0
Ekiti 0.0 0.5 2.6 0.5 0.9
Enugu 15.0 3.0 1.6 1.7 1.8
Gombe 0.0 0.0 2.7 2.1 2.1
Imo 0.0 1.5 1.8 2.2 2.1
Jigawa 0.0 0.0 2.5 3.6 3.2
Kaduna 0.0 5.9 6.0 8.0 7.5
Kano 0.0 0.6 5.5 7.0 6.4
Katsina 0.0 0.3 4.0 1.3 1.8
Kebbi 8.3 0.0 3.4 3.2 3.1
Kogi 0.0 6.8 2.7 1.2 1.7
Kwara 0.0 0.9 1.7 0.6 0.8
Lagos 13.0 24.1 8.2 0.2 2.9
Nassarawa 5.8 0.9 0.9 3.1 2.6
Niger 0.0 1.4 1.3 1.3 1.3
Ogun 7.0 7.0 4.6 0.2 1.4
Ondo 0.0 2.0 2.2 1.2 1.4
Osun 0.0 4.4 4.8 0.3 1.4
Oyo 6.1 0.6 2.2 0.4 0.8
Plateau 0.0 3.0 0.9 4.8 3.9
Rivers 11.9 4.5 1.9 2.4 2.5
Sokoto 0.0 0.6 1.0 3.4 2.8
Taraba 5.0 0.0 1.1 4.3 3.5
Yobe 0.0 0.0 0.7 1.7 1.4
Zamfara 0.0 1.0 1.6 2.1 2.0
FCT Abuja 11.5 1.5 1.0 0.8 0.9
Total 100.0 100.0 100.0 100.0 100.0
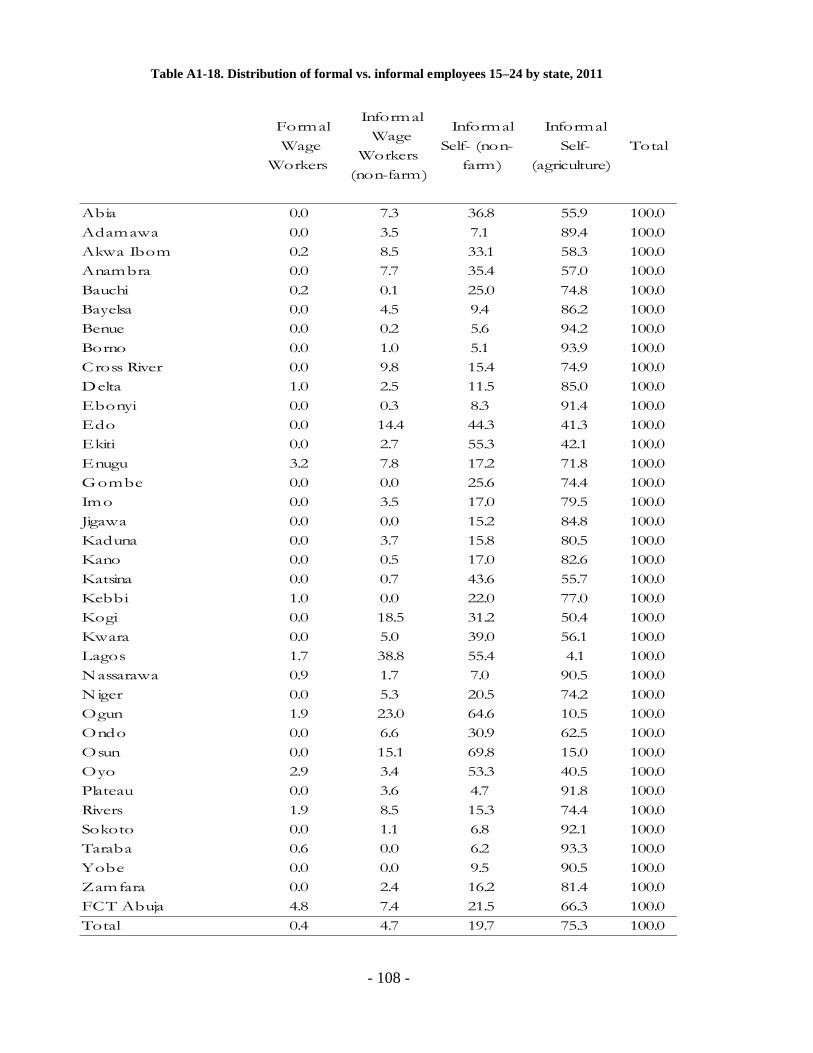
- 108 -
Table A1-18. Distribution of formal vs. informal employees 15–24 by state, 2011
Formal
Wage
Workers
Informal
Wage
Workers
(non-farm)
Informal
Self- (non-
farm)
Informal
Self-
(agriculture)
Total
Abia 0.0 7.3 36.8 55.9 100.0
Adamawa 0.0 3.5 7.1 89.4 100.0
Akwa Ibom 0.2 8.5 33.1 58.3 100.0
Anambra 0.0 7.7 35.4 57.0 100.0
Bauchi 0.2 0.1 25.0 74.8 100.0
Bayelsa 0.0 4.5 9.4 86.2 100.0
Benue 0.0 0.2 5.6 94.2 100.0
Borno 0.0 1.0 5.1 93.9 100.0
Cross River 0.0 9.8 15.4 74.9 100.0
Delta 1.0 2.5 11.5 85.0 100.0
Ebonyi 0.0 0.3 8.3 91.4 100.0
Edo 0.0 14.4 44.3 41.3 100.0
Ekiti 0.0 2.7 55.3 42.1 100.0
Enugu 3.2 7.8 17.2 71.8 100.0
Gombe 0.0 0.0 25.6 74.4 100.0
Imo 0.0 3.5 17.0 79.5 100.0
Jigawa 0.0 0.0 15.2 84.8 100.0
Kaduna 0.0 3.7 15.8 80.5 100.0
Kano 0.0 0.5 17.0 82.6 100.0
Katsina 0.0 0.7 43.6 55.7 100.0
Kebbi 1.0 0.0 22.0 77.0 100.0
Kogi 0.0 18.5 31.2 50.4 100.0
Kwara 0.0 5.0 39.0 56.1 100.0
Lagos 1.7 38.8 55.4 4.1 100.0
Nassarawa 0.9 1.7 7.0 90.5 100.0
Niger 0.0 5.3 20.5 74.2 100.0
Ogun 1.9 23.0 64.6 10.5 100.0
Ondo 0.0 6.6 30.9 62.5 100.0
Osun 0.0 15.1 69.8 15.0 100.0
Oyo 2.9 3.4 53.3 40.5 100.0
Plateau 0.0 3.6 4.7 91.8 100.0
Rivers 1.9 8.5 15.3 74.4 100.0
Sokoto 0.0 1.1 6.8 92.1 100.0
Taraba 0.6 0.0 6.2 93.3 100.0
Yobe 0.0 0.0 9.5 90.5 100.0
Zamfara 0.0 2.4 16.2 81.4 100.0
FCT Abuja 4.8 7.4 21.5 66.3 100.0
Total 0.4 4.7 19.7 75.3 100.0
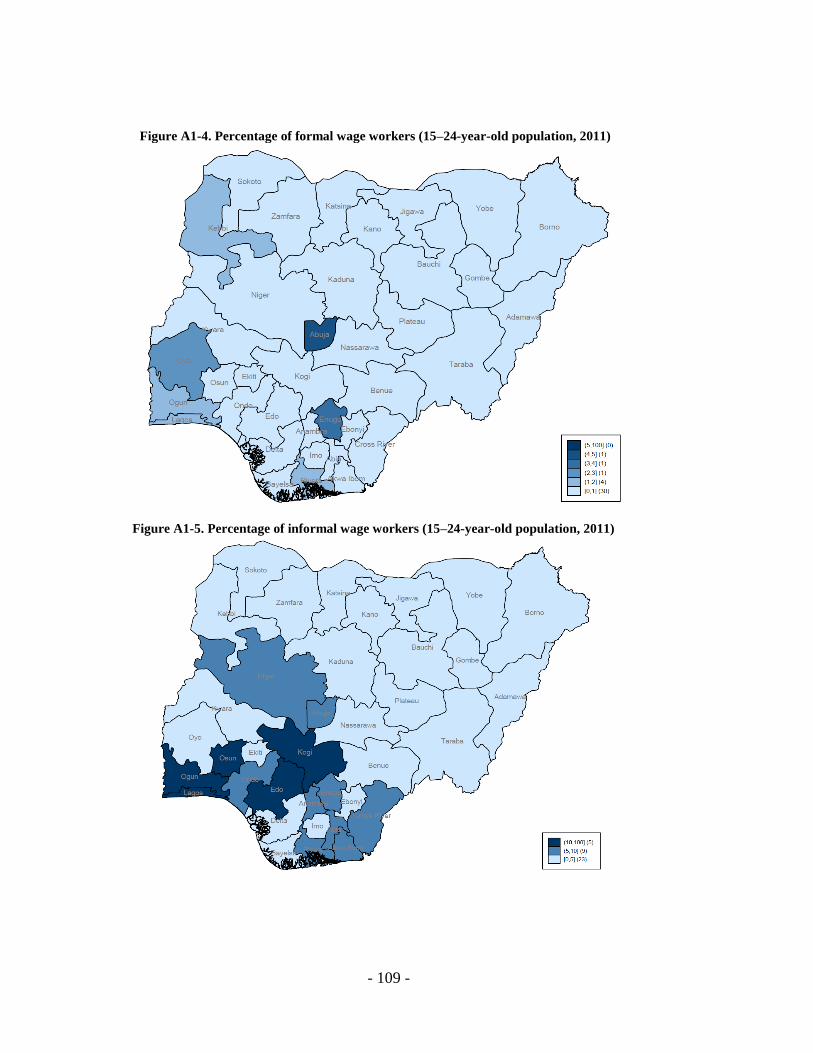
- 109 -
Figure A1-4. Percentage of formal wage workers (15–24-year-old population, 2011)
Figure A1-5. Percentage of informal wage workers (15–24-year-old population, 2011)

- 110 -
Figure A1-6. Percentage of informal nonfarm self- employed workers (15–24-year-old population, 2011)
Figure A1-7. Percentage of informal self-employed agriculture employees (15–24-year-old population, 2011)
Source: Author’s calculation. Data: GHS, 2010–2011.
Note: Formal/informal is defined as a share of the employed labor force.
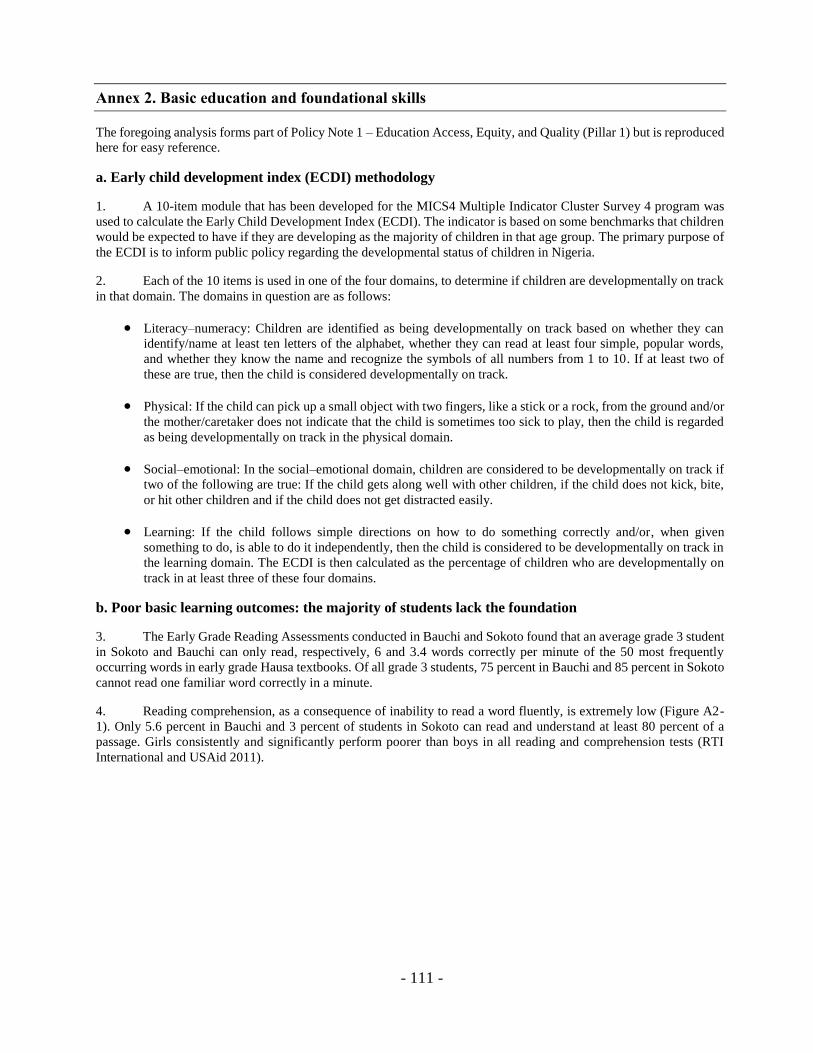
- 111 -
Annex 2. Basic education and foundational skills
The foregoing analysis forms part of Policy Note 1 – Education Access, Equity, and Quality (Pillar 1) but is reproduced
here for easy reference.
a. Early child development index (ECDI) methodology
1. A 10-item module that has been developed for the MICS4 Multiple Indicator Cluster Survey 4 program was
used to calculate the Early Child Development Index (ECDI). The indicator is based on some benchmarks that children
would be expected to have if they are developing as the majority of children in that age group. The primary purpose of
the ECDI is to inform public policy regarding the developmental status of children in Nigeria.
2. Each of the 10 items is used in one of the four domains, to determine if children are developmentally on track
in that domain. The domains in question are as follows:
Literacy–numeracy: Children are identified as being developmentally on track based on whether they can
identify/name at least ten letters of the alphabet, whether they can read at least four simple, popular words,
and whether they know the name and recognize the symbols of all numbers from 1 to 10. If at least two of
these are true, then the child is considered developmentally on track.
Physical: If the child can pick up a small object with two fingers, like a stick or a rock, from the ground and/or
the mother/caretaker does not indicate that the child is sometimes too sick to play, then the child is regarded
as being developmentally on track in the physical domain.
Social–emotional: In the social–emotional domain, children are considered to be developmentally on track if
two of the following are true: If the child gets along well with other children, if the child does not kick, bite,
or hit other children and if the child does not get distracted easily.
Learning: If the child follows simple directions on how to do something correctly and/or, when given
something to do, is able to do it independently, then the child is considered to be developmentally on track in
the learning domain. The ECDI is then calculated as the percentage of children who are developmentally on
track in at least three of these four domains.
b. Poor basic learning outcomes: the majority of students lack the foundation
3. The Early Grade Reading Assessments conducted in Bauchi and Sokoto found that an average grade 3 student
in Sokoto and Bauchi can only read, respectively, 6 and 3.4 words correctly per minute of the 50 most frequently
occurring words in early grade Hausa textbooks. Of all grade 3 students, 75 percent in Bauchi and 85 percent in Sokoto
cannot read one familiar word correctly in a minute.
4. Reading comprehension, as a consequence of inability to read a word fluently, is extremely low (Figure A2-
1). Only 5.6 percent in Bauchi and 3 percent of students in Sokoto can read and understand at least 80 percent of a
passage. Girls consistently and significantly perform poorer than boys in all reading and comprehension tests (RTI
International and USAid 2011).
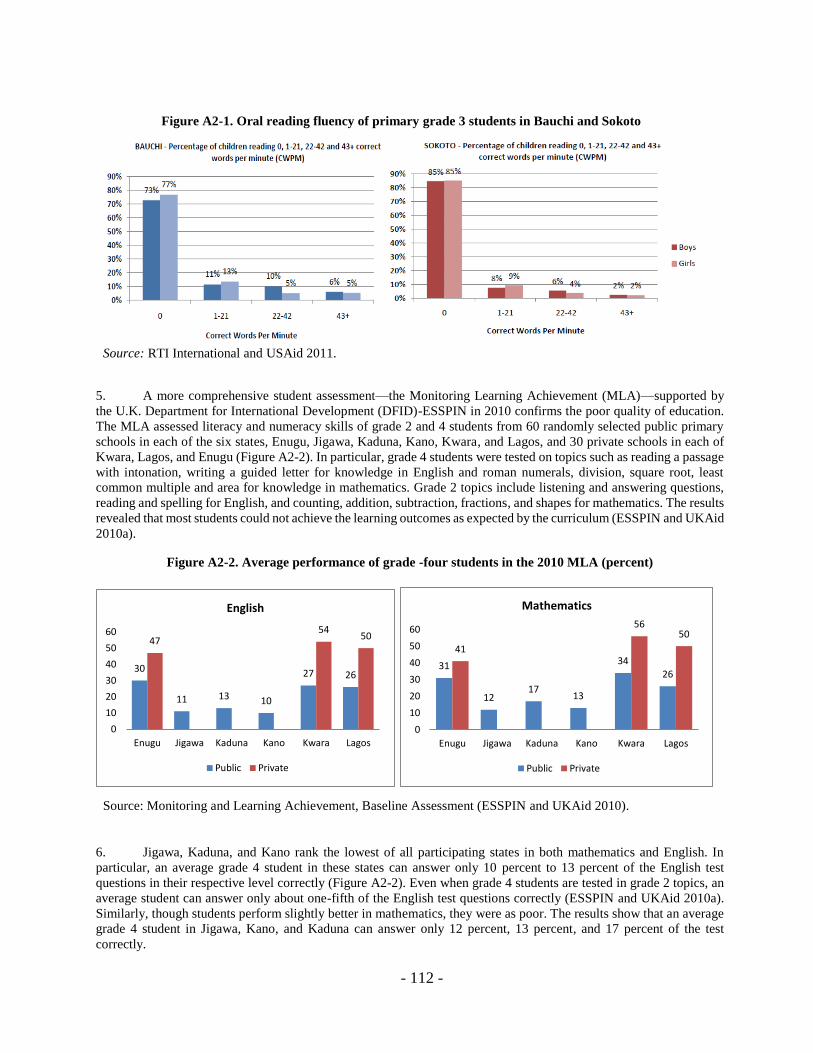
- 112 -
5. A more comprehensive student assessment—the Monitoring Learning Achievement (MLA)—supported by
the U.K. Department for International Development (DFID)-ESSPIN in 2010 confirms the poor quality of education.
The MLA assessed literacy and numeracy skills of grade 2 and 4 students from 60 randomly selected public primary
schools in each of the six states, Enugu, Jigawa, Kaduna, Kano, Kwara, and Lagos, and 30 private schools in each of
Kwara, Lagos, and Enugu (Figure A2-2). In particular, grade 4 students were tested on topics such as reading a passage
with intonation, writing a guided letter for knowledge in English and roman numerals, division, square root, least
common multiple and area for knowledge in mathematics. Grade 2 topics include listening and answering questions,
reading and spelling for English, and counting, addition, subtraction, fractions, and shapes for mathematics. The results
revealed that most students could not achieve the learning outcomes as expected by the curriculum (ESSPIN and UKAid
2010a).
Figure A2-2. Average performance of grade -four students in the 2010 MLA (percent)
6. Jigawa, Kaduna, and Kano rank the lowest of all participating states in both mathematics and English. In
particular, an average grade 4 student in these states can answer only 10 percent to 13 percent of the English test
questions in their respective level correctly (Figure A2-2). Even when grade 4 students are tested in grade 2 topics, an
average student can answer only about one-fifth of the English test questions correctly (ESSPIN and UKAid 2010a).
Similarly, though students perform slightly better in mathematics, they were as poor. The results show that an average
grade 4 student in Jigawa, Kano, and Kaduna can answer only 12 percent, 13 percent, and 17 percent of the test
correctly.
Figure A2-1. Oral reading fluency of primary grade 3 students in Bauchi and Sokoto
Source: RTI International and USAid 2011.
Source: Monitoring and Learning Achievement, Baseline Assessment (ESSPIN and UKAid 2010).
30
11 13 10
27 26
4754
50
0
10
20
30
40
50
60
Enugu Jigawa Kaduna Kano Kwara Lagos
English
Public Private
31
1217
13
3426
41
5650
0
10
20
30
40
50
60
Enugu Jigawa Kaduna Kano Kwara Lagos
Mathematics
Public Private
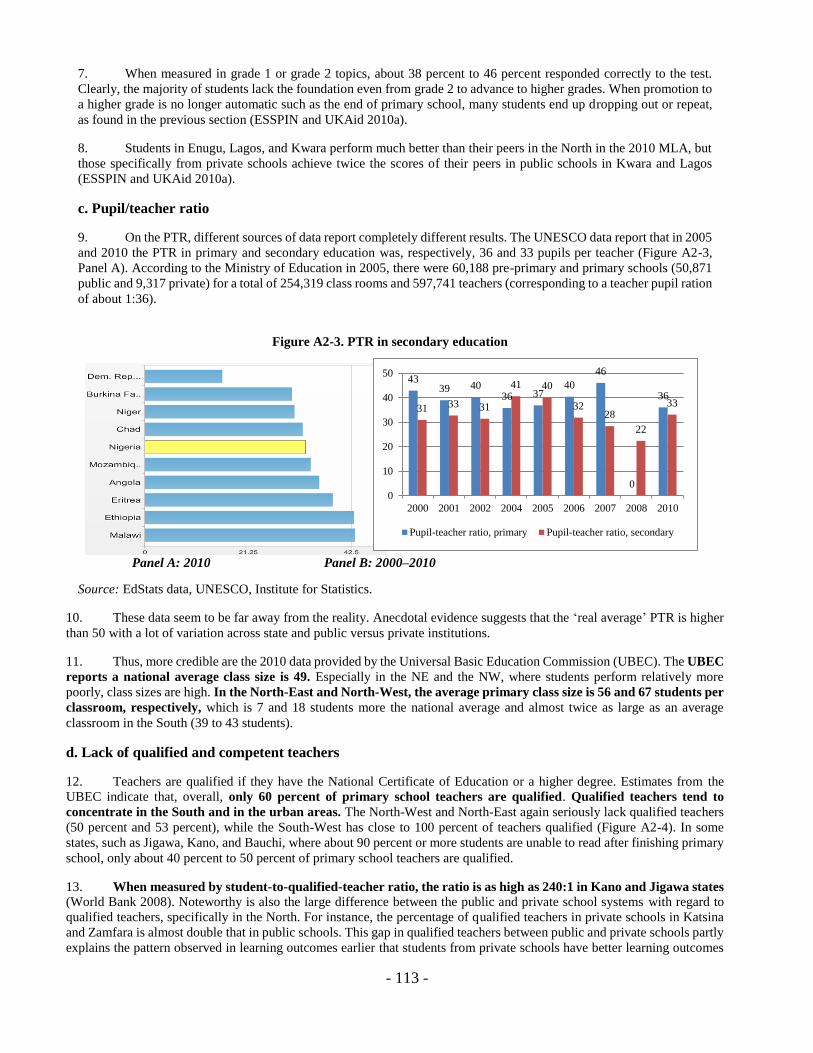
- 113 -
7. When measured in grade 1 or grade 2 topics, about 38 percent to 46 percent responded correctly to the test.
Clearly, the majority of students lack the foundation even from grade 2 to advance to higher grades. When promotion to
a higher grade is no longer automatic such as the end of primary school, many students end up dropping out or repeat,
as found in the previous section (ESSPIN and UKAid 2010a).
8. Students in Enugu, Lagos, and Kwara perform much better than their peers in the North in the 2010 MLA, but
those specifically from private schools achieve twice the scores of their peers in public schools in Kwara and Lagos
(ESSPIN and UKAid 2010a).
c. Pupil/teacher ratio
9. On the PTR, different sources of data report completely different results. The UNESCO data report that in 2005
and 2010 the PTR in primary and secondary education was, respectively, 36 and 33 pupils per teacher (Figure A2-3,
Panel A). According to the Ministry of Education in 2005, there were 60,188 pre-primary and primary schools (50,871
public and 9,317 private) for a total of 254,319 class rooms and 597,741 teachers (corresponding to a teacher pupil ration
of about 1:36).
Source: EdStats data, UNESCO, Institute for Statistics.
10. These data seem to be far away from the reality. Anecdotal evidence suggests that the ‘real average’ PTR is higher
than 50 with a lot of variation across state and public versus private institutions.
11. Thus, more credible are the 2010 data provided by the Universal Basic Education Commission (UBEC). The UBEC
reports a national average class size is 49. Especially in the NE and the NW, where students perform relatively more
poorly, class sizes are high. In the North-East and North-West, the average primary class size is 56 and 67 students per
classroom, respectively, which is 7 and 18 students more the national average and almost twice as large as an average
classroom in the South (39 to 43 students).
d. Lack of qualified and competent teachers
12. Teachers are qualified if they have the National Certificate of Education or a higher degree. Estimates from the
UBEC indicate that, overall, only 60 percent of primary school teachers are qualified. Qualified teachers tend to
concentrate in the South and in the urban areas. The North-West and North-East again seriously lack qualified teachers
(50 percent and 53 percent), while the South-West has close to 100 percent of teachers qualified (Figure A2-4). In some
states, such as Jigawa, Kano, and Bauchi, where about 90 percent or more students are unable to read after finishing primary
school, only about 40 percent to 50 percent of primary school teachers are qualified.
13. When measured by student-to-qualified-teacher ratio, the ratio is as high as 240:1 in Kano and Jigawa states (World Bank 2008). Noteworthy is also the large difference between the public and private school systems with regard to
qualified teachers, specifically in the North. For instance, the percentage of qualified teachers in private schools in Katsina
and Zamfara is almost double that in public schools. This gap in qualified teachers between public and private schools partly
explains the pattern observed in learning outcomes earlier that students from private schools have better learning outcomes
Figure A2-3. PTR in secondary education
Panel A: 2010 Panel B: 2000–2010
4339 40
36 3740
46
0
36
31 33 31
41 40
3228
22
33
0
10
20
30
40
50
2000 2001 2002 2004 2005 2006 2007 2008 2010
Pupil-teacher ratio, primary Pupil-teacher ratio, secondary

- 114 -
and are more likely to pass the NECO exams.
14. Even qualified teachers do not have the adequate professional knowledge and competency to teach. In 2010,
the ESSPIN conducted a teacher assessment of 54,918 primary- and junior-secondary-school teachers in Kwara, Lagos,
Jigawa, Kano, and Kaduna. The assessment was aimed to measure teachers’ knowledge in primary English and mathematics,
their ability to read materials and write notes for lesson preparation and teaching, and their ability to assess students’ learning
and monitor their progress.
15. The results show that while nearly all teachers in Kwara and Lagos participating in the assessment are
qualified, only 0.5 and 1.5 percent achieve the sufficient level (a score of 75–100 percent) of professional working
knowledge. In other states, no teachers could achieve the desirable benchmarking level (Figure A2-5). Of high concern are
the teachers at the bottom of the performance. About three (or more) in four teachers have the limited knowledge of teaching
in Kaduna, Kano, and Jigawa (Education Sector Support Programme in Nigeria and UKAid 2011).
16. Results of subcomponents also reveal that teachers in Lagos and Kwara have a reasonable competency to mark
correctly primary mathematics and English tests, while those in Kaduna and Kano have a serious lack of knowledge in both
of these subjects. Teachers in Jigawa have a reasonable knowledge in math but a severe lack of knowledge in English (Table
A2-1).
Figure A2-4. Percentage of qualified teachers in primary schools, 2009-10
-
20
40
60
80
100
jigaw
ak
ano
soko
tok
atsi
na
zam
fara
kad
una
keb
bi
bau
chi
yob
eg
om
be
born
ota
rab
aad
amaw
a
bay
elsa
edo
del
tacr
oss
riv
erri
ver
sak
wa
ibo
m
nig
ern
asar
awa
kw
ara
kog
ifc
t ab
uja
ben
ue
ebon
yi
abia
enug
uan
amb
raim
o
lag
os
ond
oo
yo
osu
nek
iti
ogu
n
All schools Private schools Public schools
North-West North-East North-Central South-WestSouth-EastSouth-South
Source: Nigeria Digest of Education Statistics (FME 2011).

- 115 -
17. In all states, most teachers do not have the adequate knowledge in general pedagogy (a mean test score of 9 percent
in Kaduna to 38 percent in Lagos) and pedagogical content (a mean of 6 percent in Kaduna to 50 percent in Kwara).
Table A2-1. Mean scores in ESSPIN teacher assessment by state
Kwara Lagos Jigawa Kano Kaduna
Total test score 46.51 44.62 19.85 15.7 12.81
(15.31) (13.62) (10.39) (0.29) (0.31)
Subject Knowledge: Mathematics 67.85 67.36 40.74 29.75 24.27
(19.12) (18.35) (20.27) (0.54) (0.55)
Subject Knowledge: English 38.51 43.81 17.54 15.29 13.26
(18.32) (17.02) (13.32) (0.37) (0.37)
General Pedagogical Knowledge: Reading and
Writing Literacy
34.05 38.3 14.94 12.36 9.12
(19.12) (17.72) (12.46) (0.33) (0.3)
Pedagogical Content Knowledge: Pedagogical
Literacy
49.78 31.18 7.87 6.86 5.92
(22.35) (16.78) (9.75) (0.25) (0.25)
Number of teachers 19823 21358 10518 1620 1599
Source: “An assessment of the professional working knowledge of teachers in Nigeria: implications for
teacher development policy and implementation” (ESSPIN 2010).
Note: Standard deviations in parenthesis.
18. This implies that most of the assessed teachers cannot read and write to prepare lessons or using reference materials
for teaching, cannot assess students’ performance appropriately, and cannot present students’ test scores in tables and graphs
to monitor students’ progress (ESSPIN and UKAid 2010b). In fact, teachers’ inability to assess their students’ performance
is further confirmed by findings from the 2010 Nigeria Education Data Survey, showing a huge disparity between teacher’s
assessment and actual students’ performance in reading. While 95 percent of students in Sokoto cannot read by grade 6, 92
percent of teachers rated pupils’ reading ability as ‘average’, with only 9 percent grading them as having ‘weak’ reading
skills. In Bauchi, our analysis shows 82 percent of grade 6 students are unable to read, in contrast to the fact that 65 percent
of teachers reported pupils as having average reading skills, and 34 percent said they were weak. Head teachers are similarly
unaware of the extremely low learning outcomes, reporting only 20–25 percent of pupils’ reading ability as ‘weak’ (National
Population Commission and RTI International 2011).
Figure A2-5. ESSPIN teacher knowledge assessment results, 2010
40.9
34.3
0.6
0.8
0.6
49.1
57.4
27.6
19.8
15.6
8.5
7.6
71.2
77.8
83.6
0.0 20.0 40.0 60.0 80.0 100.0
Kwara
Lagos
Jigawa
Kano
Kaduna
Sufficient knowledge
(75-100%)
Near-sufficient knowledge
(50-75%)
Emergent knowledge
(25-50%)
Limited knowledge
(0-25%)
%
Source: ESSPIN and UKAid 2010b.

- 116 -
19. Most teaching and learning in Nigeria follows the model of teacher as the center of the classroom. In 2009, the
ESSPIN conducted classroom observation for 505 public primary and junior secondary schools in five states: Kwara, Lagos,
Jigawa, Kaduna, and Kano. The survey shows that across all five states, learners tend to have a passive role in the
classroom, with 97 percent or more of the time organized as a whole class.
20. An average teacher spends about half of the time on the blackboard, two-thirds of the time talking, four minutes
patrolling classroom, less than one minute using teaching materials, and 10 percent of the time doing nothing. Teacher spends
about two minutes to question or talk to learners, but these questions are usually close-ended and do not allow open
discussions or idea exchanges. An average student spends two-thirds of the time listening to teachers and the remaining time
chanting or repeating after the teachers and copying from the blackboard or doing exercises. Overall, the survey shows a
disproportionately passive learning and primarily oral teaching model that does not promote student’ abilities to
think, talk, and write in their own words, does not stimulate students’ motivation, does not allow students to make
use of materials other than the teachers’ lesson. Little exchange with students also inhibit teachers from understanding
their students’ performance and needs and, hence, tailoring teaching to suit students’ needs and cognitive levels (Education
Sector Support Programme in Nigeria (ESSPIN and UKAid 2010c).
e. Assessing the quality of education service delivery in Anambra, Ekiti, and Bauchi
21. The Service Delivery Indicators (SDI) surveys collected data from primary schools in four states: Anambra, Bauchi,
Ekiti, and Niger. A total of 760 randomly selected public and private schools (190 per state) were surveyed, with 2,435 and
5,754 teachers assessed for knowledge and effort, respectively. The sample was selected to make the survey representative
at the state level, allowing for disaggregation by provider type (private/public in education and level of care in health) and
location (rural/urban).
What do teachers and health workers know?
22. Teachers and health professionals were tested for their competency during the surveys. Math and English teachers
were given a math and English assessment covering primary school level curriculum on the one hand and teaching skills on
the other.
23. The assessments reveal a general lack of adequate knowledge among teachers and health professionals alike in all
states (Table A2-2). English and math teachers obtained an average score of only 45 percent in the English and math
assessments.
Table A2-2. Service delivery indicators at a glance
Indicator Allb Anambra Bauchi Ekiti Niger
Minimum knowledge - At least 80%
in Math & English4% 7% 2% 8% 2%
Minimum knowledge - At least 70%
in Math & English12% 22% 7% 23% 5%
Test score (Math & English) 45% 58% 40% 59% 35%
Test score (Math, English &
Pedagogy)34% 47% 28% 47% 25%
School absence rate 14% 6% 22% 7% 17%
Classroom absence rate 22% 8% 42% 11% 21%
Time spent teaching per day 3h44m 4h49m 2h14m 4h35m 3h26m
Share of students with textbooks 38% 65% 12% 75% 26%
Equipment availability 49% 75% 22% 72% 44%
Infrastructure availability 17% 33% 5% 28% 11%
Pupils per teacher 20 20 20 14 21
What providers know (ability)
What providers do (effort)
What providers have to work with (availability of inputs)
Notes: All results are weighted averages. Disaggregation by State are available on the SDI
website (www.SDIndicators.org). Results are for the combined samples for Anambra,
Bauchi, Ekiti and Niger
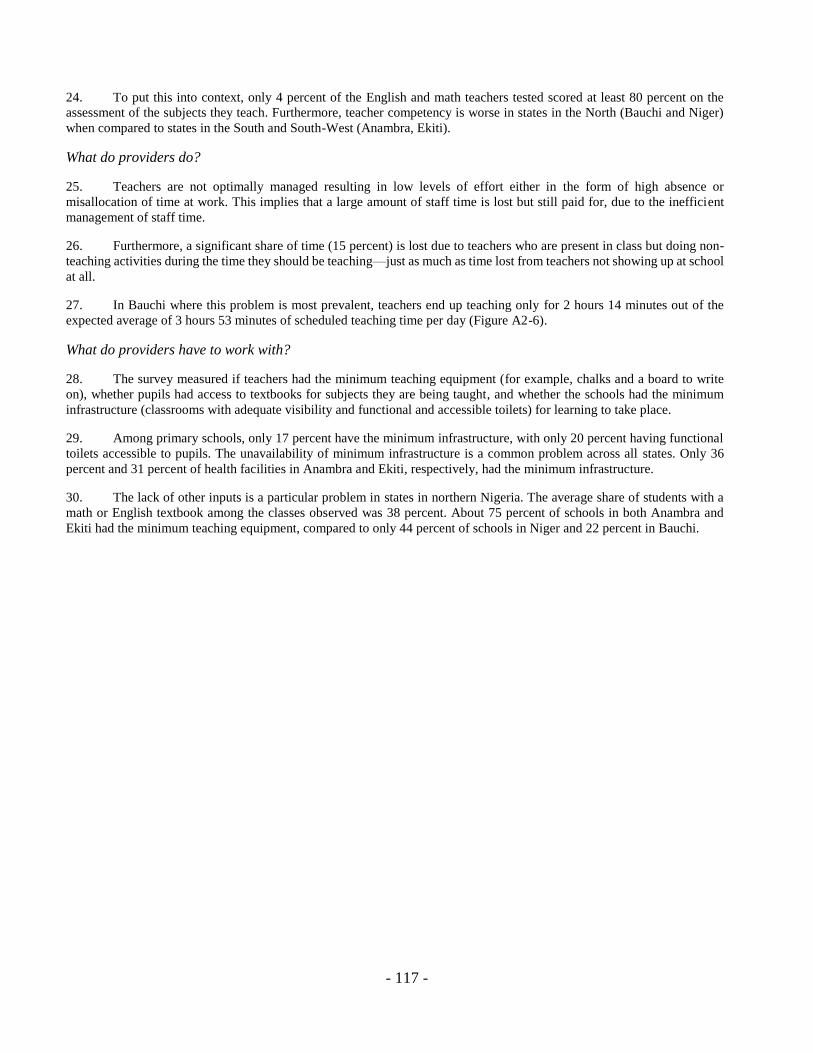
- 117 -
24. To put this into context, only 4 percent of the English and math teachers tested scored at least 80 percent on the
assessment of the subjects they teach. Furthermore, teacher competency is worse in states in the North (Bauchi and Niger)
when compared to states in the South and South-West (Anambra, Ekiti).
What do providers do?
25. Teachers are not optimally managed resulting in low levels of effort either in the form of high absence or
misallocation of time at work. This implies that a large amount of staff time is lost but still paid for, due to the inefficient
management of staff time.
26. Furthermore, a significant share of time (15 percent) is lost due to teachers who are present in class but doing non-
teaching activities during the time they should be teaching—just as much as time lost from teachers not showing up at school
at all.
27. In Bauchi where this problem is most prevalent, teachers end up teaching only for 2 hours 14 minutes out of the
expected average of 3 hours 53 minutes of scheduled teaching time per day (Figure A2-6).
What do providers have to work with?
28. The survey measured if teachers had the minimum teaching equipment (for example, chalks and a board to write
on), whether pupils had access to textbooks for subjects they are being taught, and whether the schools had the minimum
infrastructure (classrooms with adequate visibility and functional and accessible toilets) for learning to take place.
29. Among primary schools, only 17 percent have the minimum infrastructure, with only 20 percent having functional
toilets accessible to pupils. The unavailability of minimum infrastructure is a common problem across all states. Only 36
percent and 31 percent of health facilities in Anambra and Ekiti, respectively, had the minimum infrastructure.
30. The lack of other inputs is a particular problem in states in northern Nigeria. The average share of students with a
math or English textbook among the classes observed was 38 percent. About 75 percent of schools in both Anambra and
Ekiti had the minimum teaching equipment, compared to only 44 percent of schools in Niger and 22 percent in Bauchi.
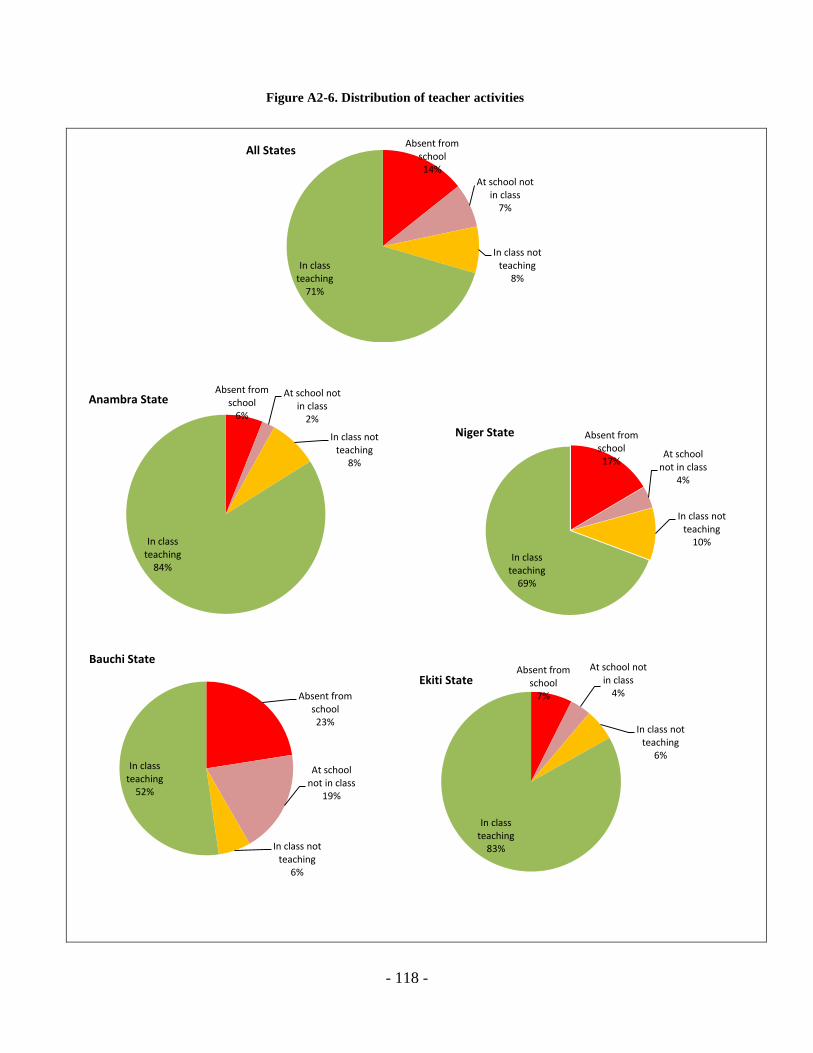
- 118 -
Figure A2-6. Distribution of teacher activities
Absent from school
6%
At school not in class
2%
In class not teaching
8%
In class teaching
84%
Anambra State
Absent from school17%
At school not in class
4%
In class not teaching
10%
In class teaching
69%
Niger State
Absent from school23%
At school not in class
19%
In class not teaching
6%
In class teaching
52%
Bauchi StateAbsent from
school7%
At school not in class
4%
In class not teaching
6%
In class teaching
83%
Ekiti State
Absent from school14%
At school not in class
7%
In class not teaching
8%In class
teaching71%
All States
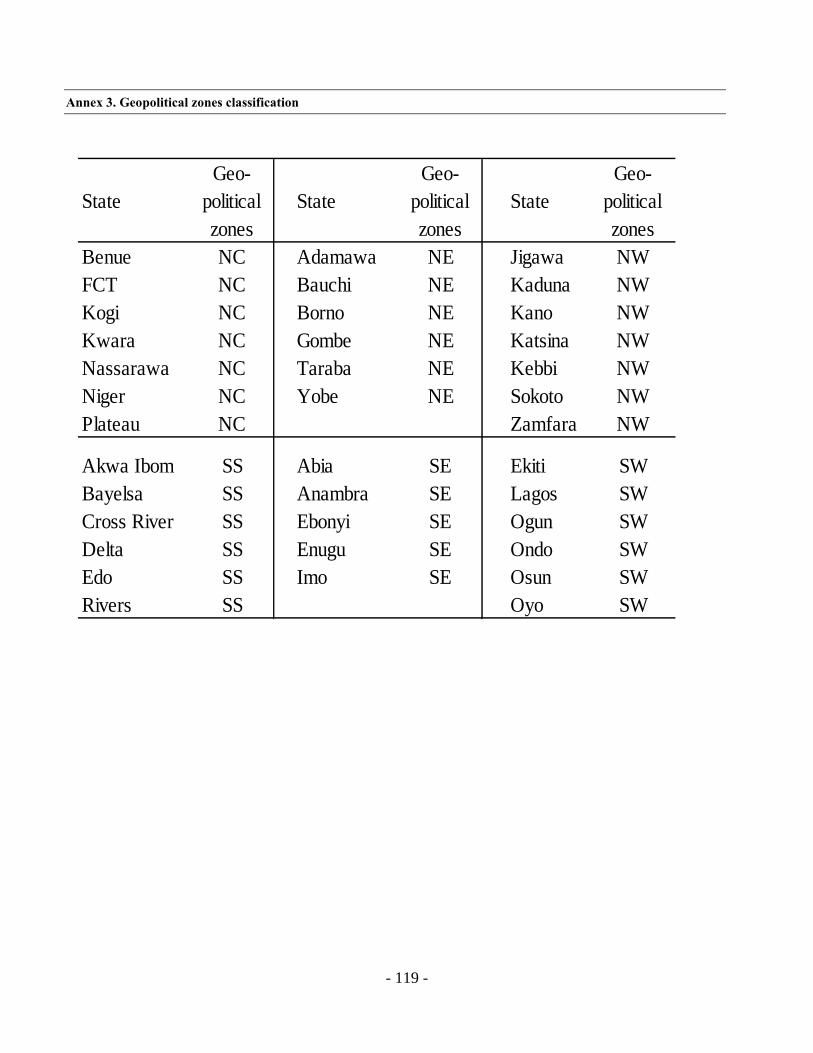
- 119 -
Annex 3. Geopolitical zones classification
State
Geo-
political
zones
State
Geo-
political
zones
State
Geo-
political
zones
Benue NC Adamawa NE Jigawa NW
FCT NC Bauchi NE Kaduna NW
Kogi NC Borno NE Kano NW
Kwara NC Gombe NE Katsina NW
Nassarawa NC Taraba NE Kebbi NW
Niger NC Yobe NE Sokoto NW
Plateau NC Zamfara NW
Akwa Ibom SS Abia SE Ekiti SW
Bayelsa SS Anambra SE Lagos SW
Cross River SS Ebonyi SE Ogun SW
Delta SS Enugu SE Ondo SW
Edo SS Imo SE Osun SW
Rivers SS Oyo SW

- 120 -
Annex 4. STEP-B overview: Key innovations and outcomes
Science and Technology Education Post-Basic Program
1. The STEP-B’s development objective was for the Nigerian federal post-basic education and research subsector to
produce more and better qualified S&T graduates and higher quality and more relevant research. Moreover, the project aimed
at building capacity within participating federal post-basic education institutions (PBEIs) to manage, monitor, and evaluate
merit-based S&T funding according to international best practices. The government, with support from the Bank, embarked
on designing and implementing the Science and Technology Education Post-Basic (STEP-B during 2008–2013 (closed in
June 2013).
2. Innovative approach. In many respects, the STEP-B featured innovative design and approaches. The key areas of
focus included (a) a competitive, demand-driven mechanism for allocation of resources to strengthen S&T research capacity;
(b) a national network of emerging Centers of Excellence to promote collective, quality research and development in S&T,
through international network and private sector partnerships; and (c) development of national policy and strategic planning
and monitoring and evaluation for post-basic S&T education, research, and technology development.
3. Key innovations included: (a) a paradigm shift focusing on demand-driven, merit-based, competitive funding and
how S&T institutions interact with each other and with their regulatory agencies—first of its kind in Nigeria; (b) incentives
for students to obtain S&T innovation grants to enable them to complete their studies—the Innovators of Tomorrow Program;
(c) emergence of Eleven Science and Technology Centers of Excellence, through collaboration and partnership between
universities and research institutions at home and abroad, particularly involving the regional African University for Science
and Technology (ASTU; (d) support of interconnectivity and ICT for the Nigeria Research Education Network (about US$10
million); and (e) the adoption of Information Communication Technologies (ICT throughout the project and support for the
completion of two ICT pilots: (a) Business Process Outsourcing ( BPO) pilot under the New Economy Skills for Africa
Program (NESAP) ICT Skills Technical Assistance and (b) micro-work for a Job Creation pilot, a program in partnership
with the Federal Ministry of Communication Technology, aiming at reducing unemployment through micro-work and e-
lancing opportunities online.
4. Impact of program: Based on fish production and bee-keeping technology in the University of Agriculture,
Makurdi, local farmers (including the poor) got hands-on training in fish production and bee-keeping and were able to utilize
this knowledge for developing their livelihoods. In Zaria, training helped local farmers make better use of cheaper, locally
produced organic fertilizer.
5. In Ondo at the Federal\Technology in Akure, which focused on food security (including agriculture extension
courses and skills training), farmers were able to benefit from the Federal University of Technology, Akure, research and
development in increasing crop yield and resistance and in preserving fish through modern smoking methods. Moreover,
poor students were able to tap Internet connectivity through bandwidth expansion at much lower costs, which resulted in
lower cost to end users.
6. STEP-B interventions contributed to vast improvements in Science and Technology in diverse areas,
involving educational institutions (secondary, technical, polytechnics, colleges of education (CoEs), universities, and
national research institutions):
Institutional awards. More than 160 grants of up to US$250,000 were awarded for research and development
in diverse areas such as agriculture, biotechnology, food research, health sciences, engineering, renewable
energy, and technology (including information technology). The intervention contributed to enhancing
research and development in S&T and boosting capacity for entrepreneurial skills development with potential
job creation, such as in fish farming, mushroom cultivation, bee-keeping, and information communication
technologies(ICT).
Partnership awards. About 30 eligible PBEIs benefited from 45 grants of up to US$3 million. Key
collaboration and partnerships yielded positive results in many S&T research and development areas. For
example, first, the University of Agriculture, Abeokuta, has pioneered innovation in biotechnology research
in both plants and animals focusing on yam, poultry, and palm wine production through partnership with
research centers in Italy (Center for Genetic Engineering) and in the United States (International Livestock
Research Institute and Cornell University) toward capacity building and staff and student exchange. Second,
- 121 -
collaboration and partnership of PBEIs (e.g. NASENI, NARICT, Shetsco) with the Africa University of
Science and Technology (AUST yielded significant S&T benefits in mechatronics, materials R&D, and
nanotechnology. Third, the Federal Institute of Industrial Research (FIIRO), Oshodi, partnered and
collaborated with various national and international institutions toward the development of a center for skills
development and acquisition in food processing (e.g. the Nigeria Institute of Food and Science and
Technology, the Nigeria Institute of Science Laboratory Technology, and Jagee Nigeria Limited).
Innovators of tomorrow program. A total of 587 students in their final year of studies benefited from grants
of US$20,000 for innovative research (under supervision of their university faculties), which enabled them to
graduate on time and earn masters or doctoral degrees in S&T. Some students have excelled in their field of
study, contributing to rapid improvements in S&T. For example, one student at the University of Port Harcourt
undertook a project on the production of biodiesel from vegetable (cucurbits) seed oils, which has raised
awareness on biodiesel research such that the university has witnessed a significant increase in the number of
postgraduate applications in biodiesel research.
Emerging Centers of Excellence. Eleven institutions were selected by an International Advisory Board, with
support from a Technical Review Committee to cover eleven national non-oil priority areas: biotechnology,
environmental protection and preservation, advanced materials, chemical research and development,
multimedia technology and cinematography, renewable energy, infectious and zoonotic diseases, software
engineering, food security, and Science and Technology Education, and Mathematics (STEM R&D, and solid
minerals. Positive developments have yielded greater opportunities for job creation in S&T, with a larger
number of better trained graduates. For example, leveraging on knowledge sharing and acquisition of
specialized equipment, these institutions have been able to generate specialist skills among students, who are
able to obtain jobs in their areas of study. Such is the case of Kaduna Polytechnic, which has been able to
develop a sound program on solid minerals, with heavy collaboration and partnership, and the University of
Lagos, which has produced well-trained graduates in multimedia technology and cinematography, who are
ready for productive employment in the film industry, or similar areas.
Enabling S&T policy framework and implementation for job creation and employment. Implementation
of new policies led to these key results: (a) nation-wide implementation of new S&T teaching curricula and
teacher standards, according to global standards; (b) application of the newly developed National Vocational
Qualification Framework (NVQF and embarking on the development of National Occupational Standards
under the guidance of the NVQF Steering Committee, with assistance from the International Labor
Organization and the International Standard Organization; (c) development of a conceptual framework for
labor market observatory; (d) revamping of the Science and Technology policy based on international
standards; (e) development of S&T laboratory standards; and (f) development of a framework for
interconnectivity and increased use of information communication technologie across post-basic educational
institution, including support to two information communication technologies (ICT-enabled services pilots:
(a) ACCESS Nigeria skills assessment and training in ICT for Business Process Outsourcing, with about 1,000
trainees certified according to global norms (500 of whom were able to obtain employment) and (b)
Microwork for job creation and e-lancing opportunities online, with an estimated 2,500 participants having
been oriented in this field, with potential for 10,000 youths to access job opportunities.
Success in the Centers of Excellence programs. The exposure to this project’s interventions, especially on
emerging Centers of Excellence, has enabled 10 Nigerian universities (about 60 percent of all west African
universities) to compete successfully for funding as Centers of Excellence under the Bank-supported regional
Africa Centers of Excellence (ACE) project. Three more universities have been selected as Centers of
Excellence through the government’s own funding. Also, the government is currently continuing to finance
key areas, through concerned regulatory agencies. In addition, several research projects have been
commercialized.
Source: STEP-B Implementation Completion and Results Report (ICRR), December 2013.

- 122 -
Annex 5. NaijaCloud microwork job creation: Global online outsourcing job skills for Nigerian youth
1. New opportunities for jobs for Nigerian youth. With 13 percent of Nigerian youth 15–30 years of age having
college education, Nigerians have the highest absolute number of college-educated youth in the whole of Africa, larger in
absolute numbers of college graduates than South Africa, Mauritius, Kenya, and Ethiopia combined. This large college-
educated labor force, which is expected to double in 10 years, is available to compete globally in the networked world of the
Internet with outsourced online jobs. Yet, Nigeria’s youth unemployment reached 38 percent in 2012.
2. Job creation is a critical issue on the agenda of the federal government of Nigeria. Online outsourced work is a new
phenomenon that developing countries can tap into to reduce unemployment and boost job creation. This is called the BPO
sector.
3. With 69 percent mobile penetration (120 million mobile phones) and 33 percent Internet penetration (57 million
people with access), Nigeria is well placed to take advantage of these new BPO job opportunities. A joint AFTEW
(Education) / TWICT (Innovations) team of the Bank worked with the government of Nigeria through the Ministry of
Communications to develop a strategy to take advantage of this opportunity and organized a number of awareness-building
and training activities for future Nigerian workers. This work was done as part of Microwork for Job Creation in Nigeria
which became known as NaijaCloud and launched in 2013.
4. What is the innovation? Microwork is a nascent idea, not only in Africa, but around the world. This allows for
local job seekers to use online platforms to source for and complete jobs in various fields in the global market space. Workers
can perform paid tasks on mobile phones or personal computers, from their homes, cyber cafes, or microwork centers. The
global microwork platforms such as Samasource.com, CrowdFlower.com, Elance.com, oDesk.com, and MobileWorks.com
are the world’s leading platforms with the current ability to provide online jobs in the Philippines, India, Canada, China,
Egypt, Jamaica, and other places.
5. Public-private-partnerships for job creation. The World Bank teams partnered with the government and the
private sector on building the awareness of microwork-related job opportunities through hands-on, expert-led workshops and
a media campaign. Five leading international online work firms participated by developing workshop content and leading
multiple sessions locally. Support was also received from Nigeria’s top telecom companies, a BPO company, and an IT lab,
along with the Ministry of Communication Technology.
6. Impact of NaijaCloud. The number of Nigerians hired on the oDesk and eLance increased. The world’s leading
platform increased it by 55 percent in a very short period of time, and thus the NaijaCloud quickly opened up the world
market for Nigerian skills. For instance, 4,000 new Nigerian freelancers using eLance platform now have access to over
80,000 jobs every month on the eLance platform.
7. More Nigerian companies in the BPO field. In addition to an increase in contractor activity, there has also been
an increase in activity from Nigerian companies looking to outsource work. Following the NaijaCloud event, an additional
42 active company clients have outsourced jobs on eLance and 24 on oDesk. Most jobs outsourced are in more technical
areas (e.g. web design, web programming, with some article and blog writing), while most jobs worked by Nigerian workers
are in nontechnical jobs (e.g. writing, web research, data entry, and legal).
Source: Based on interview with Marito Garcia and Olatunde Adekola, World Bank, 2014. VPU Awards 2014. Washington
DC.
- 123 -
Annex 6. Fab Labs: 21st-century digital fabrication skills
21st-Century STEM, Light Manufacturing, and Jobs Skills for Nigeria
1. Why Fab Labs for Nigerian skills, jobs, and non-oil growth? In the World Bank Group’s Country Partnership
Strategy for 2014–2017, assistance will be provided to meet Nigeria’s growing demand for services and manufacturing
associated with the emerging middle class and rapid urbanization. These trends present huge growth opportunities for SMEs
and the agricultural sector to benefit from the large size of the domestic market. Much of today’s economic wealth worldwide
(and including Nigeria, particularly in telecom and energy) is being created through the exploitation of recent digital
technology advances: an increasingly interconnected world (through the Internet), the ubiquitous presence of computers and
computation in our environments, and the emergence and growth of ‘cloud’ computing applications and services. Another
wave of economic opportunity coming our way—through digital fabrication or turning bits into ‘its’—that is, data into
objects (Lassiter 2014). The new era of digital fabrication (Fab Labs) reignites local manufacture and small or micro-business
creation, supporting new economic opportunities at the local level.
2. This triad of advances is creating a new class of globally competitive workers with strong interdisciplinary
21st-century skills. The young people in Nigeria between 15 and 30 years, who have grown up in this era, our digital natives,
will need to know how to make physical, functional things from digital information to shape our future and create new wealth
in the global economy. And Nigeria’s current workforce needs to retool to have the flexibility and knowledge to participate
in this competitive worldwide market. Digital fabrication in essence is the combination of computer design and computer-
controlled manufacturing processes merged with electronics and micro-controller programming to create functional systems,
that is, turning the 1’s and 0’s of our computers into products in the physical world.
3. Nigeria has a novel opportunity for ramping up skills development in technical-vocational schools and job
creation. The Fab Lab program, which originated as the educational outreach component for the Center for Bits and Atoms
(CBA) at the Massachusetts Institute of Technology (MIT), has now spread to 40 countries as a movement, along with the
Maker Movement. Fab Labs are venues for prototyping platforms for local entrepreneurship and are increasingly being
adopted by schools as platforms for project-based import. Empowered by the experience of making something themselves,
students both learn and mentor each other, gaining deep knowledge about the machines, the materials, the design process,
and the engineering that goes into invention and innovation. In educational settings, rather than relying on a fixed curriculum,
learning happens in an authentic, engaging, personal context, one in which students go through a cycle of imagination, design,
prototyping, reflection, and iteration as they find solutions to challenges or bring their ideas to life.
4. What is a Fab Lab and how can Fab Labs be integrated into technical-vocational education? A Fab Lab
consists of a suite of digital fabrication and rapid prototyping machines, including a large CNC router (the ShopBot), a 3D
desktop mill and scanner, a vinyl cutter, a laser cutter, an electronics workbench, a 3D printer and the accompanying
computers and software for design, programming, and machine communications. This equipment allows students to use
computer-aided design and manufacturing tools to make almost anything they can imagine. Fab Labs across the world share
the same foundation of machines and processes and are linked through video conferencing and online tools. Fab Labs are
technical platforms for STEM education, workforce development, and business idea prototyping. Fab Labs allow students to
explore the entire engineering design process in authentic real-world contexts by providing tools that enable them to go from
concept to drawing, models to prototype, and redesign to final product. A Fab Lab gives students the tools to develop the
practical and critical thinking skills they will need to be the inventors and innovators of the future. The lab serves as a
motivational environment to encourage student engagement with technology. The Fab Lab in Nigerian communities will
serve four primary interest groups: (1) middle and high school students for in-school and after-school learning; (2) workers
who seek training or need retraining in new technical and engineering skill sets; (3) entrepreneurs who want to prototype
business ideas and products; and (4) members of the public who want access to high-tech tools for prototyping personal
projects or for lifelong learning goals.
5. Fab Labs in Nigerian technical-vocational and K-12 application. Fab Labs are applied STEM learning
environments being used around the world in community centers, colleges, universities, and more recently in K-12 formal
education settings. The effective integration of a Fab Lab learning environment in schools has so far allowed students to
follow their natural curiosity about how things work and their natural interest for making things they want or need, scaffolding
them on a journey through science, technology, engineering, and math during which knowledge is acquired ‘just in time’
instead of ‘just in case’. In Fab Labs a number of critical skills necessary to succeed in the 21st century are acquired, including
systems thinking, critical thinking, problem solving, analysis skills that inform an evidence-based iterative design process,
communication and collaboration skills, and integration of social and ethical considerations into design thinking (Janisse
- 124 -
2011, 1-2).
6. Fab Lab as community resource around schools. The Fab Lab is designed to be an educational resource as well
as a community resource. To that end the facilities should be open to students and community after hours and/or on weekends,
offering courses, workshops, and free access time to encourage and support lifelong learning as well as to encourage
bidirectional mentorship between students and community members.
7. Workforce development and jobs: Fab Labs are a worldwide movement that can benefit Nigeria. Workforce
development and lifelong learning classes will provide opportunities for the long-term self-sustainability of each Fab Lab. A
community of practice has grown around the Fab Lab concept. Fab Labs are not only machines, tools, and processes, but
also a global community of people who want to collaborate and share knowledge. There are more than 250 Fab Labs in the
world today, with more than 250 more in development in more than 40 countries including a few in Lagos and two other
states. The community meets once a year at a new Fab Lab in the world to share best practices, form collaborations, learn
about the state of the art of digital fabrication in manufacturing and research, and make the personal connections that are so
important to building the community.
Source: Lassiter, S. (2014) Fab Labs. Center for Bits and Atoms, Massachusetts Institute of Technology, Cambridge, MA.

- 125 -
Annex 7. Massive open online courses (MOOCS) for Nigeria
21st-Century Blended Education On-Line and Classroom: Nigeria’s new tool for massively scaling up skills
acquisition
1. The new era with MOOCs: A disruptive innovation to benefit Nigeria. In 2012, a new era in online education
dawned with the arrival of MOOCS (massive open online courses) platforms Coursera, edX, Udacity, and Khan Academy,
which are free and provided by top universities in the United States, Europe, and Asia. POOCs (pProfessional open online
courses (POOCs) recently appeared as courses focused on the current stock of tertiary and secondary graduates, such as
KTM-Advance and Dassault Systeme in France, or Udacity with Georgia Institute of Technology and AT&T, and Stanford
University’s Center for Professional Development. In a period of just over two years, Coursera, the leading platform for
these free courses, reached 8 million enrolments in July 2014. Courses online from the world’s leading universities and
Centers of Excellence including Stanford, Harvard, Ecole Polytechnique, National University of Singapore, Massachusetts
Institute of Technology, etc, can now be accessed freely from the Internet.
2. MOOCS and POOCS: Opening doors for modernizing Nigerian skills development. Nigeria’s current tertiary
enrolment of 13 percent, which is among the highest in Africa and approximates South Africa’s 15 percent, compares to 3
percent for the rest of Africa. This tertiary student population size, which is highest in absolute numbers in Africa, will clearly
benefit from the new paradigm in teaching and learning using free online Internet courses that can be blended (online and
face to face) to improve skills development. Coursera, the leading MOOC provider, for example, launched a series of
professional development courses aimed at teachers of primary and secondary schools, offered by leading universities. This
is about democratization of learning, especially for Nigeria: Learners are in control. We are at the beginning of an exciting
effort to understand how people learn and how to educate well and effectively at scale. When a student joins one of the
courses, he/she also joins a community of thousands of participants with diverse experience that enables further learning and
networking with the peer group. With MOOCs, faculty can reach more learners in one course than they would have
throughout their entire careers.
3. How important is this innovation in higher education for Nigeria? Tuition costs, especially in Nigeria’s
ballooning private schools and universities, have been increasing faster than general inflation and even faster than health
care. And what do we get in return? Nearly half of all bachelor’s degree holders do not find employment or are
underemployed upon graduation. At the same time, employers have not been satisfied with degree candidates. Two recent
Gallup polls (2013), and a McKinsey report (2012) showed that although 96 percent of chief academic officers believe they
are doing a good job of preparing students for employment, only 11 percent of business leaders agree that graduates have the
requisite skills for success in the workforce.
4. How will the MOOCs and POOCs help Nigerian skills and education in the next 10 years? Every year about
2 million senior secondary school leavers in Nigeria take the college entry qualifications exams known as the WAEC, JAMB,
and NECO. Many qualify, but only around 400,000 are able to enroll because of limitations in college places. Thus, the
excess market of more than 1 million potential college students a year provides a huge potential for MOOCs and POOCs to
rapidly and cost-effectively educate and skill up the Nigerian youth. In addition, MOOCs are likely to benefit the present
stock of teachers, employees, and professionals, who will benefit from continuing education and upgrading skills to move
up the job ladder or better their lives.
Source: Garcia, Marito. 2014.. MOOCs: Opportunities and Challenges for Education Service Delivery, World Bank,
Washington DC.

- 126 -
Annex 8. The returns to education in Nigeria
1. The return of education and skills: A simple definition of the return of education is the differential between
the prices of highly and poorly educated labor. A high return of education is an indication that the certain type of human
capital and skills is in demand and a signal for individuals in a position to sell their labor services at the higher price by
‘investing’ in their human capital.
2. The analysis presented in this section does not claim any causality but pure associations. In fact, just because
a person with a college degree earns more than a person without such a degree does not necessarily mean that college
education causes the difference in pay. Rather, the person who went to college might have some characteristics that make
him/her more productive in the labor market, resulting in higher earnings. It is possible, for example, that high-ability people
are more likely to go to college and are more productive. Therefore, it is uncertain whether the higher education premium
reflects a higher return to education or a higher market value of unobserved skills. In the attempt to alleviate this selection
problem, the regression model includes some demographic factors as control variable such as age, gender, rural/urban
location, economic sector, and region as well as work experience. Nevertheless there are many other observable and
unobservable factors that might affect both the probability to work and to work in a specific sectors and occupation and the
return of the education per se.
3. In Nigeria, education and skills are a predictor of labor market success even in the poorest regions. Any
additional year spent in school matter. Even having incomplete primary education means having a total monthly earnings
22 percent higher than people who never attend school.33 The education premium in earnings increases monotonically
along education levels. People with complete upper secondary education and TVET could expect to earn, respectively, more
than 80 and 100 percent than people who never attend school. The highest return is for people with tertiary education (130
percent).
Figure A8-1. The return of education by economic sectors
33 Note that we estimate the log function of monthly earnings as a function of education and a vector of control variables. The data used
are the GHS, Panel 2012–2013, Wave 2. The total monthly earnings is computed by summing together any payment, profit, or gain from
main and secondary occupations regardless of sector of activities. Education level definition is based on formal education attainment, and
people with informal education including Kuranic are coded to no education category. The sample includes the working age population
(age 15–64) based on ILO definition. The vector of control variables includes age, gender (a dummy equal to 1 if male), rural/urban (a
dummy equal to 1 if urban), and the years of work experience (defined as the difference between age and years of schooling).
Source: Author’s calculation. Data: GHS, Panel 2012–2013, Wave 2.
Note: The reference category is workers who never attended formal school.
-10%
10%
30%
50%
70%
90%
110%
130%
150%
170%
All Agriculture Manufacturing Low-value addedservice
High-value addedservice
Incomplete primary Completed primary Completed lower secondaryCompleted upper secondary TVET Some higher
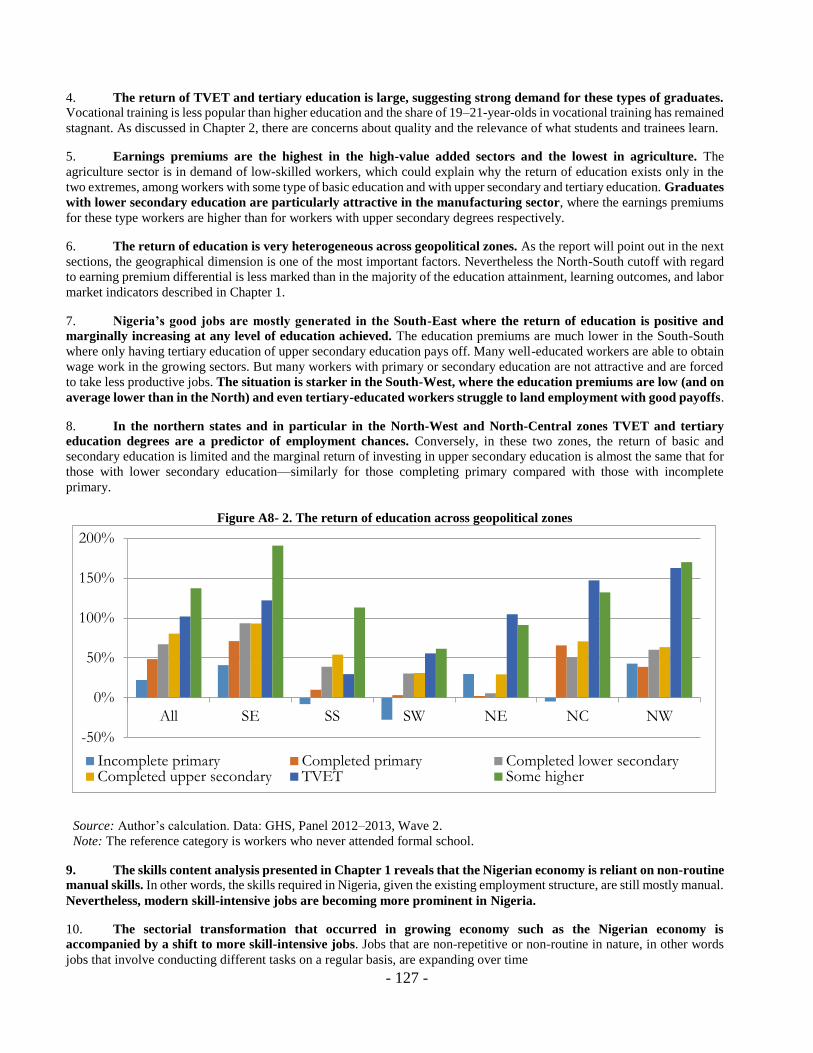
- 127 -
4. The return of TVET and tertiary education is large, suggesting strong demand for these types of graduates. Vocational training is less popular than higher education and the share of 19–21-year-olds in vocational training has remained
stagnant. As discussed in Chapter 2, there are concerns about quality and the relevance of what students and trainees learn.
5. Earnings premiums are the highest in the high-value added sectors and the lowest in agriculture. The
agriculture sector is in demand of low-skilled workers, which could explain why the return of education exists only in the
two extremes, among workers with some type of basic education and with upper secondary and tertiary education. Graduates
with lower secondary education are particularly attractive in the manufacturing sector, where the earnings premiums
for these type workers are higher than for workers with upper secondary degrees respectively.
6. The return of education is very heterogeneous across geopolitical zones. As the report will point out in the next
sections, the geographical dimension is one of the most important factors. Nevertheless the North-South cutoff with regard
to earning premium differential is less marked than in the majority of the education attainment, learning outcomes, and labor
market indicators described in Chapter 1.
7. Nigeria’s good jobs are mostly generated in the South-East where the return of education is positive and
marginally increasing at any level of education achieved. The education premiums are much lower in the South-South
where only having tertiary education of upper secondary education pays off. Many well-educated workers are able to obtain
wage work in the growing sectors. But many workers with primary or secondary education are not attractive and are forced
to take less productive jobs. The situation is starker in the South-West, where the education premiums are low (and on
average lower than in the North) and even tertiary-educated workers struggle to land employment with good payoffs.
8. In the northern states and in particular in the North-West and North-Central zones TVET and tertiary
education degrees are a predictor of employment chances. Conversely, in these two zones, the return of basic and
secondary education is limited and the marginal return of investing in upper secondary education is almost the same that for
those with lower secondary education—similarly for those completing primary compared with those with incomplete
primary.
9. The skills content analysis presented in Chapter 1 reveals that the Nigerian economy is reliant on non-routine
manual skills. In other words, the skills required in Nigeria, given the existing employment structure, are still mostly manual.
Nevertheless, modern skill-intensive jobs are becoming more prominent in Nigeria.
10. The sectorial transformation that occurred in growing economy such as the Nigerian economy is
accompanied by a shift to more skill-intensive jobs. Jobs that are non-repetitive or non-routine in nature, in other words
jobs that involve conducting different tasks on a regular basis, are expanding over time
Figure A8- 2. The return of education across geopolitical zones
Source: Author’s calculation. Data: GHS, Panel 2012–2013, Wave 2.
Note: The reference category is workers who never attended formal school.
-50%
0%
50%
100%
150%
200%
All SE SS SW NE NC NW
Incomplete primary Completed primary Completed lower secondaryCompleted upper secondary TVET Some higher

- 128 -
11. The new worker generation needs a number of attributes for their jobs: they have to solve problems, learn new
things frequently, present ideas or persuade clients at work, or interact with non-colleagues. Workers performing these tasks
are also better remunerated than their peers in traditional jobs.
12. Modern skill-intensive jobs which are becoming more prominent in Nigeria labor market and carry high
returns. More specifically, analytical and interpersonal skills are in high demand and highly valued, as signaled by a high
wage returns to these skills relative to all the other ones.34 Occupations that require a more intensive use of these types of
skills (such as lawyers, teachers, physicians, and managers) are associated with a premium that varies between 16 and 28
percent (Figure A8- 3).
13. On the contrary, individuals in occupations with an intensive use of routine skills tend to receive penalized earnings
as the use of such skills increases.
14. The uncertainty created by the lack of information or asymmetric information implicitly increases the
opportunity cost of investing in additional education and training. Indeed, information is the oxygen of responsive skills
development systems. First, without good information about employers’ skill needs, conditions in the labor market and
returns to certain fields of study, education and training providers cannot make good choices on the programs to develop and
offer. Second, without such information, students and parents cannot make good decisions on which school or university and
which study program to choose. Third, without information on the quality of education programs and employment success
of graduates, prospective students may not be able to make good choices. The uncertainty created by the lack or asymmetric
information implicitly increases the opportunity cost of investing in additional education and training.
34 This analysis has been done using the GHS 2010–2011 and skills (or tasks) definitions discussed in Chapter 1 in Section
1.2.2. In this case the dependent variable is the log function of monthly income (and not only earnings) for all household
members. The sample include all 15–64 wage workers and self-employed with formal and informal job and income greater
than 0. The log income is estimated as a function of one skill at the time controlling for education, age, gender, urban/rural.
Figure A8- 3. The return of skills
Source: Author’s calculation. Data: GHS 2010–2011.
-30%
-20%
-10%
0%
10%
20%
30%
Non RoutineCognitiveAnalytical
Non RoutineCognitive
Interpersonal
Routine Cognitive Routine Manual Non RoutineManual Physical

- 129 -
ANNEX 8
Table A8-1. The returns to education by economic sectors and across geopolitical zones
Source: Author’s calculation. Data: GHS, Panel 2012–2013, Wave 2.
Note: The reference category is workers who never attended formal school.
All Agriculture ManufacturingLow-value added
service
High-value added
serviceSE SS SW NE NC NW
Incomplete primary 0.222 0.292 0.534 -0.02 0.032 0.409 -0.08 -0.276 0.298 -0.048 0.429
(2.34)** (2.02)** (1.72)* -0.13 -0.12 (2.54)** -0.32 -1.61 -0.84 -0.16 (1.68)*
Completed primary 0.484 0.404 0.459 0.392 0.33 0.71 0.1 0.032 0.022 0.656 0.386
(8.93)*** (4.42)*** (2.30)** (4.65)*** (2.28)** (5.37)*** -0.77 -0.3 -0.15 (4.09)*** (2.11)**
Completed lower secondary 0.671 0.33 0.89 0.589 0.596 0.936 0.389 0.303 0.056 0.508 0.603
(7.23)*** -1.5 (2.07)** (4.80)*** (3.61)*** (3.77)*** (1.96)* (1.99)** -0.27 (2.53)** (1.78)*
Completed upper secondary 0.805 0.522 0.672 0.627 0.833 0.932 0.541 0.31 0.291 0.706 0.635
(14.16)*** (4.62)*** (2.38)** (7.04)*** (6.52)*** (6.27)*** (3.90)*** (2.76)*** (1.82)* (5.17)*** (2.60)***
TVET 1.02 0.381 0.543 1.197 1.222 0.295 0.556 1.047 1.473 1.628
(4.97)*** -0.37 -1.48 (4.37)*** (2.49)** -0.54 (2.00)** (8.15)*** (11.42)*** (10.83)***
Some higher 1.373 0.987 1.001 0.948 1.512 1.909 1.131 0.615 0.914 1.321 1.703
(23.30)*** (5.19)*** (2.62)** (8.34)*** (12.28)*** (12.25)*** (8.17)*** (4.84)*** (6.52)*** (10.56)*** (11.15)***
Years of experience 0.049 0.049 0.054 0.031 0.053 0.047 0.021 0.045 0.046 0.036 0.069
(5.76)*** (2.26)** -1.44 (2.63)*** (3.59)*** (2.35)** -1.19 (2.63)*** (1.76)* (2.05)** (3.08)***
Years of experience squared -0.001 -0.001 -0.001 0 -0.001 -0.001 0 -0.001 -0.001 0 -0.001
(3.12)*** (1.73)* -0.67 -0.89 -1.44 -1.36 -0.24 -1.51 -1.38 -0.67 (2.06)**
Gender (Ref. Male) -0.567 -0.507 -0.858 -0.797 -0.352 -0.563 -0.525 -0.663 -0.946 -0.408 -0.649
(15.71)*** (6.72)*** (4.33)*** (13.40)*** (5.78)*** (6.74)*** (7.65)*** (9.98)*** (9.47)*** (4.53)*** (5.22)***
Area of residence (ref. Urban -0.179 -0.361 -0.566 -0.08 0.043 -0.507 0.054 -0.011 -0.298 -0.066 -0.598
(5.04)*** (4.04)*** (3.51)*** -1.42 -0.83 (6.23)*** -0.75 -0.16 (2.35)** -0.77 (4.53)***
Constant 9.562 9.725 9.901 10.348 9.011 9.488 10.156 10.223 10.645 9.312 9.38
(76.87)*** (30.21)*** (17.80)*** (57.91)*** (41.91)*** (27.78)*** (35.97)*** (41.99)*** (28.31)*** (35.16)*** (26.08)***
F 116.382 12.827 21.636 40.118 44.734 39.993 21.696 18.63 61.144 39.318 207.727
R2 0.284 0.132 0.388 0.268 0.358 0.331 0.289 0.221 0.373 0.355 0.443
N 3,643 1,039 246 1,284 1,071 747 791 841 391 425 448

- 130 -
Table A8-2. The returns to education by countries
Source: Authors’ computation using GHS, Panel 2012–2013, and similar household surveys in other countries: Cameroon (2007), Chad (2011), Cote d'Ivoire (2008),
Gambia (2010), Ghana (2005), Guinea (2012), Kenya (2005), Lesotho (2011), Madagascar (2010), Malawi (2010), Mauritania (2008), Mozambique (2009), Niger (2011),
Rwanda (2010), Sierra Leone (2012), South Africa (2012), Tanzania (2010), and Uganda (2010).
CMR TCD CIV GMB GHA GIN KEN LSO MDG MWI MRT MOZ NER NGA RWA ZAF TZA UGA
Incomplete
primary0.4 -0.035 0.406 0.576 -0.162 0.347 0.083 0.228 0.175 0.07 0.318 0.513 0.551 0.222 0.337 0.002 0.043 0.347
(16.47)*** -0.54 (13.30)*** (7.40)*** -1.62 (12.42)*** (1.86)* (3.20)*** (6.18)*** (2.75)*** (14.43)*** (10.33)*** (8.94)*** (2.34)** (7.29)*** -0.07 -0.6 (3.02)***
Completed
primary0.837 0.377 0.695 0.93 0.074 0.636 0.337 0.436 0.533 0.308 0.583 0.717 1.334 0.484 0.802 0.276 0.425 0.939
(36.54)*** (5.46)*** (25.51)*** (11.70)*** -0.88 (23.66)*** (8.01)*** (6.13)*** (16.69)*** (11.83)*** (23.61)*** (13.92)*** (19.35)*** (8.93)*** (16.13)*** (9.43)*** (7.64)*** (7.74)***
Completed
lower
secondary
1.401 0.892 1.127 1.334 0.284 0.893 0.708 0.387 0.973 0.519 0.957 1.18 2.449 0.671 1.159 0.544 0.806 1.402
(40.46)*** (8.57)*** (27.79)*** (14.13)*** (4.22)*** (22.99)*** (16.77)*** (5.16)*** (23.23)*** (14.83)*** (31.33)*** (20.43)*** (9.37)*** (7.23)*** (14.40)*** (18.70)*** (8.17)*** (9.16)***
Completed
upper
secondary
1.804 1.234 1.779 1.944 0.4 1.015 1.666 0.588 1.205 0.924 1.069 1.566 2.863 0.805 1.464 1.07 1.061 1.569
(44.20)*** (12.87)*** (35.28)*** (22.38)*** (4.61)*** (23.56)*** (40.63)*** (7.88)*** (17.69)*** (29.46)*** (23.40)*** (24.29)*** (10.76)*** (14.16)*** (25.00)*** (35.77)*** (11.48)*** (7.89)***
TVET 1.634 1.736 2.097 1.908 0.529 2.134 0.889 1.856 1.661 1.195 1.66 2.806 1.02 1.545
(38.02)*** (7.83)*** (25.50)*** (7.21)*** (6.06)*** (7.56)*** (5.00)*** (16.58)*** (34.35)*** (14.24)*** (22.48)*** (16.10)*** (4.97)*** (23.66)***
Some higher 2.413 2.023 2.435 2.154 1.105 1.359 3.059 0.893 1.675 2.018 1.453 2.281 3.391 1.373 2.592 1.94 1.992 2.392
(56.18)*** (15.89)*** (39.39)*** (19.65)*** (14.99)*** (38.27)*** (38.87)*** (12.41)*** (17.02)*** (28.37)*** (42.82)*** (31.86)*** (22.11)*** (23.30)*** (41.36)*** (58.28)*** (11.48)*** (14.82)***
years of
experience0.098 0.064 0.083 0.079 0.056 -0.008 0.073 0.037 0.023 0.05 0.034 0.054 0.056 0.049 0.074 0 -0.001 -0.002
(32.86)*** (6.71)*** (16.93)*** (8.93)*** (8.11)*** (2.71)*** (17.33)*** (5.47)*** (4.32)*** (14.64)*** (9.35)*** (11.05)*** (5.48)*** (5.76)*** (13.81)*** (7.04)*** (7.51)*** (8.85)***
years of
experience
squared
-0.002 -0.001 -0.001 -0.001 -0.001 0 -0.001 -0.001 0 -0.001 0 -0.001 -0.001 -0.001 -0.001 1.422 1.386 1.564
(26.27)*** (3.73)*** (13.13)*** (5.22)*** (6.52)*** (2.71)*** (11.93)*** (4.19)*** (3.29)*** (10.75)*** (4.09)*** (7.46)*** (2.77)*** (6.60)*** (10.17)*** (32.96)*** (11.66)*** (12.23)***
Constant 7.972 8.971 8.507 4.846 10.091 12.754 6.541 6.824 10.203 8.128 9.269 6.163 7.791 9.562 9.007 6.387 10.378 9.514
(218.58)*** (80.46)*** (141.14)*** (43.24)*** (108.91)*** (393.26)*** (121.73)*** (77.18)*** (154.78)*** (209.72)*** (204.04)*** (92.38)*** (59.92)*** (76.87)*** (140.05)*** (183.35)*** (119.95)*** (64.34)***
F 742.085 65.365 424.038 105.576 71.599 449.087 557.027 29.402 152.347 341.491 359.631 216.876 144.239 116.382 350.072 970.974 71.956 58.206
R2 0.257 0.176 0.171 0.126 0.194 0.113 0.34 0.133 0.077 0.29 0.189 0.32 0.168 0.284 0.402 0.3 0.174 0.299
N 17,212 2,457 16,448 5,869 2,390 24,666 8,672 1,547 14,675 6,710 12,365 3,701 5,737 3,643 4,170 18,166 2,735 1,099
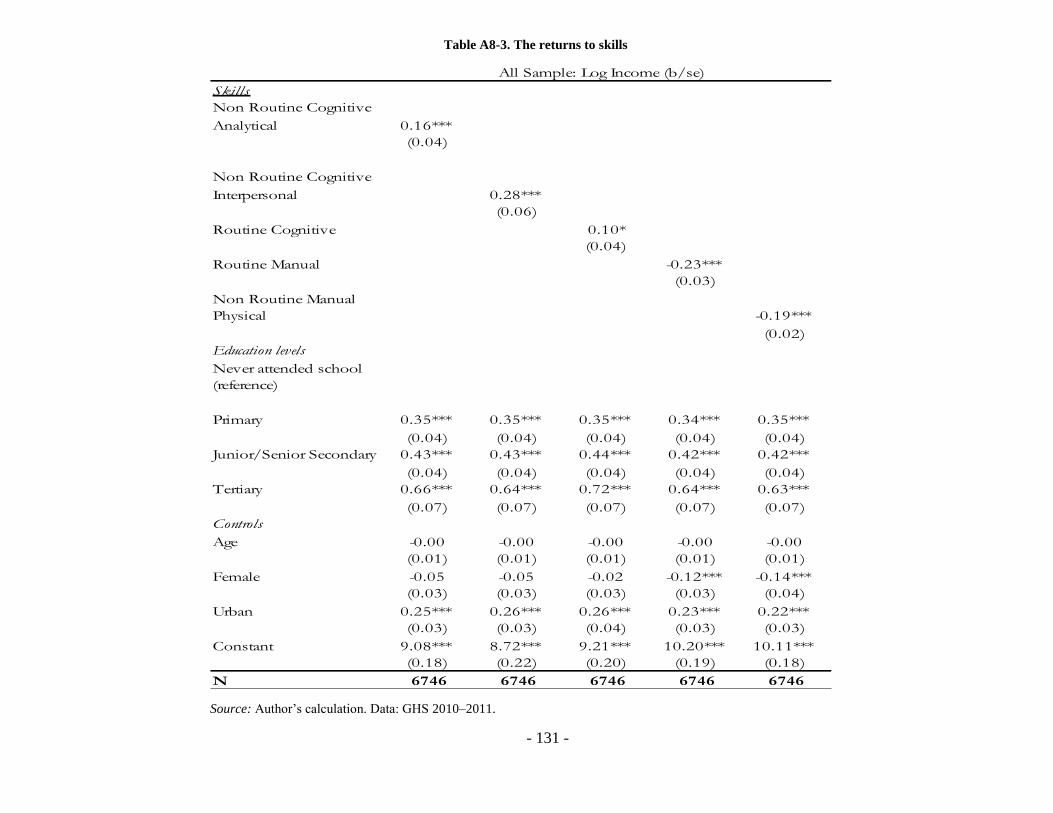
- 131 -
Table A8-3. The returns to skills
Source: Author’s calculation. Data: GHS 2010–2011.
Skills
Non Routine Cognitive
Analytical 0.16***
(0.04)
Non Routine Cognitive
Interpersonal 0.28***
(0.06)
Routine Cognitive 0.10*
(0.04)
Routine Manual -0.23***
(0.03)
Non Routine Manual
Physical -0.19***
(0.02)
Education levels
Never attended school
(reference)
Primary 0.35*** 0.35*** 0.35*** 0.34*** 0.35***
(0.04) (0.04) (0.04) (0.04) (0.04)
Junior/Senior Secondary 0.43*** 0.43*** 0.44*** 0.42*** 0.42***
(0.04) (0.04) (0.04) (0.04) (0.04)
Tertiary 0.66*** 0.64*** 0.72*** 0.64*** 0.63***
(0.07) (0.07) (0.07) (0.07) (0.07)
Controls
Age -0.00 -0.00 -0.00 -0.00 -0.00
(0.01) (0.01) (0.01) (0.01) (0.01)
Female -0.05 -0.05 -0.02 -0.12*** -0.14***
(0.03) (0.03) (0.03) (0.03) (0.04)
Urban 0.25*** 0.26*** 0.26*** 0.23*** 0.22***
(0.03) (0.03) (0.04) (0.03) (0.03)
Constant 9.08*** 8.72*** 9.21*** 10.20*** 10.11***
(0.18) (0.22) (0.20) (0.19) (0.18)
N 6746 6746 6746 6746 6746
All Sample: Log Income (b/se)
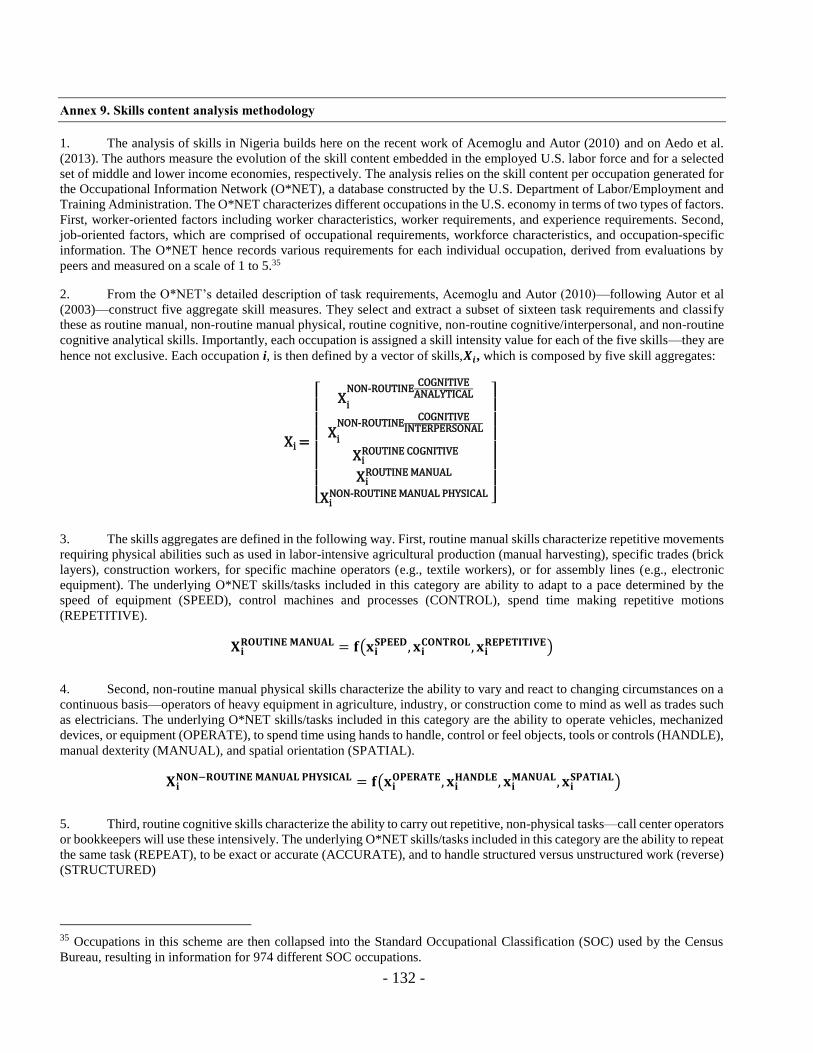
- 132 -
Annex 9. Skills content analysis methodology
1. The analysis of skills in Nigeria builds here on the recent work of Acemoglu and Autor (2010) and on Aedo et al.
(2013). The authors measure the evolution of the skill content embedded in the employed U.S. labor force and for a selected
set of middle and lower income economies, respectively. The analysis relies on the skill content per occupation generated for
the Occupational Information Network (O*NET), a database constructed by the U.S. Department of Labor/Employment and
Training Administration. The O*NET characterizes different occupations in the U.S. economy in terms of two types of factors.
First, worker-oriented factors including worker characteristics, worker requirements, and experience requirements. Second,
job-oriented factors, which are comprised of occupational requirements, workforce characteristics, and occupation-specific
information. The O*NET hence records various requirements for each individual occupation, derived from evaluations by
peers and measured on a scale of 1 to 5.35
2. From the O*NET’s detailed description of task requirements, Acemoglu and Autor (2010)—following Autor et al
(2003)—construct five aggregate skill measures. They select and extract a subset of sixteen task requirements and classify
these as routine manual, non-routine manual physical, routine cognitive, non-routine cognitive/interpersonal, and non-routine
cognitive analytical skills. Importantly, each occupation is assigned a skill intensity value for each of the five skills—they are
hence not exclusive. Each occupation i, is then defined by a vector of skills,𝑿𝒊, which is composed by five skill aggregates:
Xi =
[
Xi
NON-ROUTINECOGNITIVE
ANALYTICAL
Xi
NON-ROUTINECOGNITIVE
INTERPERSONAL
XiROUTINE COGNITIVE
XiROUTINE MANUAL
XiNON-ROUTINE MANUAL PHYSICAL
]
3. The skills aggregates are defined in the following way. First, routine manual skills characterize repetitive movements
requiring physical abilities such as used in labor-intensive agricultural production (manual harvesting), specific trades (brick
layers), construction workers, for specific machine operators (e.g., textile workers), or for assembly lines (e.g., electronic
equipment). The underlying O*NET skills/tasks included in this category are ability to adapt to a pace determined by the
speed of equipment (SPEED), control machines and processes (CONTROL), spend time making repetitive motions
(REPETITIVE).
𝐗𝐢𝐑𝐎𝐔𝐓𝐈𝐍𝐄 𝐌𝐀𝐍𝐔𝐀𝐋 = 𝐟(𝐱𝐢
𝐒𝐏𝐄𝐄𝐃, 𝐱𝐢𝐂𝐎𝐍𝐓𝐑𝐎𝐋, 𝐱𝐢
𝐑𝐄𝐏𝐄𝐓𝐈𝐓𝐈𝐕𝐄)
4. Second, non-routine manual physical skills characterize the ability to vary and react to changing circumstances on a
continuous basis—operators of heavy equipment in agriculture, industry, or construction come to mind as well as trades such
as electricians. The underlying O*NET skills/tasks included in this category are the ability to operate vehicles, mechanized
devices, or equipment (OPERATE), to spend time using hands to handle, control or feel objects, tools or controls (HANDLE),
manual dexterity (MANUAL), and spatial orientation (SPATIAL).
𝐗𝐢𝐍𝐎𝐍−𝐑𝐎𝐔𝐓𝐈𝐍𝐄 𝐌𝐀𝐍𝐔𝐀𝐋 𝐏𝐇𝐘𝐒𝐈𝐂𝐀𝐋 = 𝐟(𝐱𝐢
𝐎𝐏𝐄𝐑𝐀𝐓𝐄, 𝐱𝐢𝐇𝐀𝐍𝐃𝐋𝐄, 𝐱𝐢
𝐌𝐀𝐍𝐔𝐀𝐋, 𝐱𝐢𝐒𝐏𝐀𝐓𝐈𝐀𝐋)
5. Third, routine cognitive skills characterize the ability to carry out repetitive, non-physical tasks—call center operators
or bookkeepers will use these intensively. The underlying O*NET skills/tasks included in this category are the ability to repeat
the same task (REPEAT), to be exact or accurate (ACCURATE), and to handle structured versus unstructured work (reverse)
(STRUCTURED)
35 Occupations in this scheme are then collapsed into the Standard Occupational Classification (SOC) used by the Census
Bureau, resulting in information for 974 different SOC occupations.

- 133 -
𝐗𝐢𝐑𝐎𝐔𝐓𝐈𝐍𝐄 𝐂𝐎𝐆𝐍𝐈𝐓𝐈𝐕𝐄 = 𝐟(𝐱𝐢
𝐑𝐄𝐏𝐄𝐀𝐓, 𝐱𝐢𝐀𝐂𝐂𝐔𝐑𝐀𝐓𝐄, 𝐱𝐢
𝐒𝐓𝐑𝐔𝐂𝐓𝐔𝐑𝐄𝐃)
6. Fourth, non-routine cognitive/analytical skills consist thought processes requiring the absorption, processing, and
decision making of abstract information. Computer programmers, teachers, lawyers, doctors, and nurses, and many other
professional occupations will need such abilities intensively. The underlying O*NET skills/tasks included in this category are
the ability to analyze data/information (ANALYZE), to think creatively (THINK), and to interpret information form others
(INTERPRET).
𝐗𝐢𝐍𝐎𝐍−𝐑𝐎𝐔𝐓𝐈𝐍𝐄 𝐂𝐎𝐆𝐍𝐈𝐓𝐈𝐕𝐄/𝐀𝐍𝐀𝐋𝐘𝐓𝐈𝐂𝐀𝐋
= 𝐟(𝐱𝐢𝐀𝐍𝐀𝐋𝐘𝐙𝐄, 𝐱𝐢
𝐓𝐇𝐈𝐍𝐊, 𝐱𝐢𝐈𝐍𝐓𝐄𝐑𝐏𝐑𝐄𝐓)
7. Lastly, non-routine cognitive/interpersonal skills characterize personality traits that underlie behaviors such as
teamwork, reliability, discipline, and work effort. These are important for professional occupations as well as for all team-
based work environments as well as services that establish direct client contact. The underlying O*NET skills/tasks included
in this category are the capacity to establish and maintain personal relationships (RELATIONSHIPS), to guide, direct and
motivate subordinates (GUIDE), and to coach/develop others (COACH).
𝐗𝐢𝐍𝐎𝐍−𝐑𝐎𝐔𝐓𝐈𝐍𝐄 𝐂𝐎𝐆𝐍𝐈𝐓𝐈𝐕𝐄/𝐈𝐍𝐓𝐄𝐑𝐏𝐄𝐑𝐒𝐎𝐍𝐀𝐋
= 𝐟(𝐱𝐢𝐑𝐄𝐋𝐀𝐓𝐈𝐎𝐍𝐒𝐇𝐈𝐏𝐒, 𝐱𝐢
𝐆𝐔𝐈𝐃𝐄, 𝐱𝐢𝐂𝐎𝐀𝐂𝐇)
8. Figure 1-22 summarizes the different characteristics of the five skill measures and provides occupational examples.
A vector X with skill information for all the 974 occupations that have information on the O*NET database is constructed:
𝚾 = [𝑿𝟏′⋮
𝑿𝑰=𝟗𝟕𝟒′]
9. After the vector X is constructed, it needs to be linked to the occupational structure so that weighted skills measures
for economies can be computed. Employing census data for different years, complemented with data from the Current
Population Survey (CPS) data, Acemoglu et al. (2010) calculate the share in the labor force for each occupation i, 𝜃𝑖 for the
United States as follows:
𝛉𝐢,𝐔𝐒𝐀 =𝐀𝐂𝐓𝐈𝐕𝐄 𝐖𝐎𝐑𝐊𝐄𝐑𝐒 𝐎𝐍 𝐎𝐂𝐂𝐔𝐏𝐀𝐓𝐈𝐎𝐍 𝐢 𝐈𝐍 𝐔𝐒𝐀
𝐓𝐎𝐓𝐀𝐋 𝐀𝐂𝐓𝐈𝐕𝐄 𝐋𝐀𝐁𝐎𝐑 𝐅𝐎𝐑𝐂𝐄 𝐈𝐍 𝐔𝐒𝐀
∑𝛉𝐢,𝐔𝐒𝐀 = 𝟏
𝐢
10. The vector of all the shares of all occupations, define the overall structure of the labor force 𝚯𝐔𝐒𝐀 for the
United States:
𝚯𝐔𝐒𝐀 = [𝛉𝟏,𝐔𝐒𝐀 … 𝛉𝐈,𝐔𝐒𝐀]
11. Finally, to construct the skill structure of the United States, the information on the skill content by occupation as
defined in X and the labor force structure 𝚯𝐔𝐒𝐀 is combined. The skill structure will be a vector with five elements, one per
skill aggregate.

- 134 -
𝐒𝐊𝐈𝐋𝐋_ 𝐒𝐓𝐑𝐔𝐂𝐓𝐔𝐑𝐄𝐔𝐒𝐀 = 𝚯𝐔𝐒𝐀𝚾 =
[ ∑ 𝛉𝐢,𝐔𝐒𝐀𝐗𝐢
𝐍𝐎𝐍−𝐑𝐎𝐔𝐓𝐈𝐍𝐄 𝐂𝐎𝐆𝐍𝐈𝐓𝐈𝐕𝐄/𝐀𝐍𝐀𝐋𝐘𝐓𝐈𝐂𝐀𝐋
𝐢
∑ 𝛉𝐢,𝐔𝐒𝐀𝐗𝐢𝐍𝐎𝐍−𝐑𝐎𝐔𝐓𝐈𝐍𝐄 𝐂𝐎𝐆𝐍𝐈𝐓𝐈𝐕𝐄/𝐈𝐍𝐓𝐄𝐑𝐏𝐄𝐑𝐒𝐎𝐍𝐀𝐋
𝐢
∑ 𝛉𝐢,𝐔𝐒𝐀𝐗𝐢𝐑𝐎𝐔𝐓𝐈𝐍𝐄 𝐂𝐎𝐆𝐍𝐈𝐓𝐈𝐕𝐄
𝐢
∑ 𝛉𝐢,𝐔𝐒𝐀𝐗𝐢𝐑𝐎𝐔𝐓𝐈𝐍𝐄 𝐌𝐀𝐍𝐔𝐀𝐋
𝐢
∑ 𝛉𝐢,𝐔𝐒𝐀𝐗𝐢𝐍𝐎𝐍−𝐑𝐎𝐔𝐓𝐈𝐍𝐄 𝐌𝐀𝐍𝐔𝐀𝐋 𝐏𝐇𝐘𝐒𝐈𝐂𝐀𝐋
𝐢 ]
Source: Adapted from Acemoglu and Autor 2010.
12. The above methodology is applied to the Nigerian economy for those years where the occupations are classified
according to the International Standard Classification of Occupations version 1988 (ISCO88) developed by the International
Labor Office, specifically 2009 and 2011. We match all occupations contained in the household surveys with their respective
skill content from the O*NET database. To achieve this, we apply a crosswalk table, which is an equivalency table between
the occupations in the ISCO88 and the United States Bureau of Labor Standard Occupational Classification System in its
2000 version (SOC 2000) on which the O*NET is based. Whenever possible, we matched the occupations and their content
at the three-digit level but the match a two-digit match can also be used. Because Nigeria uses a national variation of the
ISCO88, we identified those occupations manually and established proper equivalencies.
13. To assess the skill structure for Nigeria, we employ the skill intensities for each occupation as presented in the O*NET
for the United States. This is an important assumption.36 No country-specific applications of the O*NET equivalence table
exist so that we are applying the Unites States skill equivalence to all countries. We assume that the skill content of a given
occupation is comparable internationally. This, though, appears to be reasonable given that skill intensities are derived for a
very fine definition of occupations. Hence, a specialized medical doctor and a bank cashier are assumed to contain similar
skill intensities across countries.
14. Nevertheless, in order to reflect better labor markets in developing countries, we make two adjustments to the matrix.
First, for the category of ‘general manager’, the O*NET assigns high values for both analytical and interpersonal skills.
However, in many developing countries, this category of occupation includes self-employment in small and informal
businesses in the industrial and manufacturing economic sectors. We therefore replace the skill content of the work of those
individuals with less than 12 years of education (in the industrial sector) with the average skill score of all other individuals
with a similar level of education and occupied in the same economic sector. This adjustment usually affects those countries
where general managers are over represented and shows a downward adjustment in their average scores for interpersonal and
analytical skills.
15. The second adjustment concerns the classification of the workforce in the agricultural sector. In various countries in
our sample, low-education agricultural workers are reported as one single group without further distinction between those
working in subsistence agriculture or modern agriculture and whether they work as farmers, farm managers, or farm laborers.
We reclassify all agricultural workers based on the type of employment reported. If a worker is classified in an agriculture-
related occupation and is self-employed or is a non-remunerated family worker, we assume that he/she works as a traditional
agriculture sector subsistence worker. This adjustment adjusts downward the average cognitive skills scores in economies
dominated mostly by the agriculture sector.
16. The matching and adjustment process allows for the computation of average intensity scores for all the five skills
considered. As each occupation is matched with a specific value for all skills, the average across all occupations for each skill
represents a measure of the intensity, composite and normalized, of skills.37
36 Some of the limitations of the O*NET were documented by Haendel (2007). 37 The O*NET equivalency scale includes values for all five skills, ranging from 1 to 5, for each occupation.

- 135 -
REFERENCES
Adams A. V., S. J. de Silva, and S. Razmara. 2013. Improving Skills Development in the Informal Sector. Strategies for
Sub-Saharan Africa. Human Development Perspectives, World Bank.
Adamu, A. U. n.d. Educational Reforms in Nigeria.
http://www.kanoonline.com/publications/educational_reform_in_nigeria.htm.
Alderman, H., J. Hoddinott, and B. Kinsey. 2006. “Long Term Consequences of Early Childhood Malnutrition.” Oxford
Economic Papers 58: 450–474.
Almeida, R., J. Behrman, and D. Robalino. 2012. The Right Skills for the Job? Rethinking Training Policies for Workers.
Human Development Perspectives, World Bank.
Bloom, D., J. Finlay, S. Humair, A. Mason, O. Olaniyan, and A. Soyibo. 2010. Prospects for Economic Growth in Nigeria:
A Demographic Perspective. http://www.ntaccounts.org/doc/repository/BFHMOS2010.pdf.
Bruns, B., D. Filmer, and H. A. Patrinos. 2011. Making Schools Work: New Evidence on Accountability Reforms.
Washington, DC: World Bank.
Case, A. Fertig, and C. Paxson. 2005. “The Lasting Impact of Childhood Health and Circumstance.” Journal of Health
Economics 24 (2): 365–389.
Duflo, E., P. Dupas, and M. Kremer, 2007. “Peer Effects, Pupil-teacher Ratios, and Teacher Incentives: Evidence from a
Randomization Evaluation in Kenya.” Unpublished manuscript, Abdul Latif Jameel Poverty Action Lab (JPAL),
Massachusetts Institute of Technology, Cambridge, MA.
ESSPIN (Education Sector Support Programme in Nigeria), and UKAid. 2010a. “Monitoring Learning Achievement:
Baseline Assessment, Lagos State.” Unpublished report.
———. 2010b. “An Assessment of the Professional Working Knowledge of Teachers in Nigeria: Implications for Teacher
Development Policy and Implementation: Comparisons by State.” Unpublished report.
———. 2010c. “Teaching and Learning Baseline Survey: Summary Report.” Unpublished report.
———. 2011. Teacher Development Needs Analysis: Kano State, Nigeria. http://www.esspin.org/.
———. 2012. “Impact of Support to School-based Management Committees: Stakeholders’ Views of Change: Report of
Qualitative Research in Five States of Nigeria.” Unpublished report.
Fasih, T. 2008. Linking Education Policy to Labor Market Outcomes. Washington, DC: World Bank.
Fatunde, T. 2012. “Postgraduate Drivers Trend Raises Relevance Issue.” University World News Global Edition 249.
———. 2013. “Increased Graduate Unemployment Poses Dilemma.” University World News Global Edition 279.
FME (Federal Ministry of Education). 2007. Vision 2020: The Role of the Nigerian Education Sector. Abuja: Federal
Ministry of Education.
———. 2011a. 4-year Strategic Plan for the Development of the Education Sector: 2011–2015. Draft. Abuja: Federal
Republic of Nigeria.
———. 2011b. Nigeria Digest of Education Statistics 2006–2010. Abuja: Federal Ministry of Education.
Gertler, P., and S. Boyce. 2001. An Experiment in Incentive-based Welfare: The Impact of PROGRESA on Health in
Mexico. Berkeley: University of California.
Glewwe, P., and H. G. Jacoby. 1995. “An Economic Analysis of Delayed Primary School Enrolment in a Low Income
Country: The Role of Early Childhood Nutrition.” The Review of Economics and Statistics 77 (1): 156–169.
- 136 -
Green, A. 2012. “Skills for Competitiveness: Country Report for United Kingdom.” OECD Local Economic and
Employment Development (LEED) Working Papers 2012/05, OECD Publishing.
Green, A. E., C. Hasluck, T. Hogarth, and C. Reynolds. 2003. East Midlands FRESA Targets Project: Final Report. Report
for East Midlands Development Agency. Coventry: Institute for Employment Research, University of Warwick,
and Pera.
Hanushek, E. 1999. “The Evidence on Class Size.” In Earning and Learning: How Schools Matter, edited by S. E. Mayer
and P. Peterson, 131–168. Washington, DC: Brookings Institution.
Haywood, L., and F. Teal. 2010. “Employment, Unemployment, Joblessness, and Incomes in Nigeria, 1999–2006.” In
Putting Nigeria to Work: A Strategy for Employment and Growth, edited by V. Treichel, 61–94. Washington, DC:
World Bank.
Heckman, J. J. 1995. “Lessons from the Bell Curve.” Journal of Political Economy 103 (5): 1091–1120.
———. 2000. “Policies to Foster Human Capital.” NBER Working Papers 7288.
Heckman J. J., J. Stixrud, and S. Urzua. 2006. “The Effects of Cognitive and Non-cognitive Abilities on Labor Market
Outcomes and Social Behavior.” Journal of Labor Economics 24 (3): 411–482.
Hicks, J. H., M. Kremer, I. Mbiti, and E. Miguel. 2011. Vocational Education Voucher Delivery and Labor Market Returns:
A Randomized Evaluation among Kenyan Youth. Report for Spanish Impact Evaluation Fund (SIEF) Phase II.
Washington, DC: World Bank.
http://siteresources.worldbank.org/INTHDOFFICE/Resources/VocEd_SIEF_Report_2011-04-07_final.pdf.
Hoddinott, J., J. Maluccio, J. Behrman, R. Flores, and R. Martorell, 2008. “Effect of a Nutrition Intervention during Early
Childhood on Economic Productivity in Guatemalan Adults.” The Lancet 371 (9610): 411–416.
Hsieh, C. T., and M. Urquiola. 2006. “The Effects of Generalized School Choice on Achievement and Stratification:
Evidence from Chile’s School Voucher Program.” Journal of Public Economics 90 (8–9): 1477–1503.
Iwayemi, A. 2013. “Youth Unemployment in Nigeria: Challenges and Way Forward.” Presentation at World Bank
Workshop on Youth Employment, Abuja, July 23–24.
Jensen, R. 2010. “The (Perceived) Returns to Education and the Demand for Schooling.” The Quarterly Journal of
Economics 125 (2): 515–48.
Johanson, R. K., and A. V. Adams. 2004. Skills Development in Sub-Saharan Africa. World Bank Regional and Sectoral
Studies. Washington, DC: World Bank.
Johnson, D., and J. Hsieh. 2007. “A Baseline Study of the Conditions of Teaching and Learning Outcomes in Nigeria.”
Unpublished research report.
King, E. M., and B. Özler. 1998. “What’s Decentralization Got to Do with Learning? The Case of Nicaragua’s School
Autonomy Reform.” Unpublished manuscript, Development Research Group. Washington, DC: World Bank.
Marcellus, I. O. 2009. “Development Planning in Nigeria: Reflections on the National Economic Empowerment and
Development Strategy (NEEDS) 2003–2007.” Journal of Social Sciences 20 (3): 197–210.
Martinez, S., S. Naudeau, and V. Pereira. 2012. The Promise of Preschool in Africa: A Randomized Impact Evaluation of
Early Childhood Development in Rural Mozambique.
http://siteresources.worldbank.org/INTAFRICA/Resources/The_Promise_of_Preschool_in_Africa_ECD_REPORT
.pdf.
McKinsey Global Institute. 2012. Africa at Work: Job Creation and Inclusive Growth. McKinsey Global Institute.
Muralidharan, K., and V. Sundararaman. 2011. “Teacher Performance Pay: Experimental Evidence from India.” Working
Paper 15323. http://www.nber.org/papers/w15323.pdf.
- 137 -
National Board for Technical Education. 2011. Technical Manpower Needs in Nigeria. Kaduna, Nigeria: National Board for
Technical Education.
National Population Commission, and RTI International. 2011. Nigeria Demographic and Health Survey (DHS) EdData
Profile 1990, 2003, and 2008: Education Data for Decision-making. Washington, DC: National Population
Commission and RTI International.
Okoje, J. 2008. Licensing, Accreditation and Quality Assurance in Nigerian Universities: Achievements and Challenges.
Abuja: National Universities Commission.
Olaleye, O., O. Florence, and K. A. Omotayo. 2009. “Assessment of Quality in Early Childhood Education in Ekiti-State
Nigeria.” World Applied Sciences Journal 7 (5): 683–688.
Omilola, B. 2010. “Patterns and Trends of Child and Maternal Nutrition Inequalities in Nigeria.” IFPRI Discussion Paper
00968, Development Strategy and Governance Division.
Piper, B., and M. Korda. 2010. EGRA Plus: Liberia. Program evaluation report draft. Research Triangle Park, NC: RTI
International.
Psacharopoulos, G., and H. Patrinos. 2004. “Returns to Investment in Education: A Further Update.” Education Economics
12 (2): 111–134.
RTI International, and USAid. 2011. Nigeria Northern Education Initiative (NEI): Results of the Early Grade Reading
Assessment (EGRA) in Hausa. Triangle Park, NC: RTI International.
Sawada, Y. 1999. “Community Participation, Teacher Effort, and Educational Outcome: The Case of El Salvador’s EDUCO
Program.” Working Paper 307, William Davidson Institute, University of Michigan, Ann Arbor.
Sawada, Y., and A. B. Ragatz. 2005. “Decentralization of Education, Teacher Behavior, and Outcomes.” In Incentives to
Improve Teaching: Lessons from Latin America, edited by E. Vegas, 255–306. Washington, DC: World Bank.
Skoufias, E., and J. Shapiro. 2006. “The Pitfalls of Evaluating a School Grants Program using Non-experimental Data.”
Policy Research Working Paper 4036, World Bank, Washington, DC.
Treichel, V, ed. 2010. Putting Nigeria to Work: A Strategy for Employment and Growth. Washington, DC: World Bank.
UNESCO (United Nations Educational, Scientific, and Cultural Organization), and International Bureau of Education. 2010.
World Data on Education. 7th edition. http://www.ibe.unesco.org/fileadmin/user_upload/
Publications/WDE/2010/pdf- versions/Nigeria.pdf.
United Nations Department of Economic and Social Affairs/Population Division. 2010. World Population Prospects,
Volume II: Demographic Profiles.
UBEC (Universal Basic Education Commission). 2009. 2006 National Assessment of Universal Basic Education
Programme: Final Report. Abuja: Universal Basic Education Commission.
Walker, S. P., T. D. Wachs, J. M. Gardnes, B. Lozoff, G. A. Wasserman, E. Pollitt, J. A. Carter, and International Child
Development Steering Group. 2007. “Child Development: Risk Factors for Adverse Outcomes in Developing
Countries.” The Lancet 369: 145–157.
Woessmann, L., and M. West. 2006. “Class-size Effects in School Systems around the World: Evidence from Between-
grade Variation in TIMSS.” European Economic Review 50 (3): 695–736.
World Bank. 2006. Nigeria Science and Technology Education at Post-basic Level (STEP-B): Review of S&T Education in
Federally Funded Institutions. Main Synthesis STEP-B Report No. 37973-NG. Nigeria: Africa Human
Development Department, World Bank.
———. 2010. Stepping Up Skills for More Jobs and Higher Productivity. Washington, DC: World Bank.

- 138 -
———. 2012. “Systems Approach for Better Education Results (SABER) Consolidated Report for Three States in Nigeria.”
Unpublished document.
———. 2015a. “Education Policy Note 1: Nigeria: Education Access, Equity and Quality.” Unpublished document.
———. 2015b. “More, and More Productive, Jobs for Nigeria - A Profile of Work and Workers.” Unpublished document.
World Bank, and A. Hewitt. 2011. Assessment of Core Competence for Employability in the Services Sector (ACCESS):
Nigeria. Washington, DC: World Bank.
Yusuf, M. O., and H. T. Yusuf. 2009. “Educational Reforms in Nigeria: The Potentials of Information and Communication
Technology.” Educational Research and Review 4 (5): 225–230.