ECCAS's Infrastructure - Open Knowledge Repository
70
Policy Research Working Paper 5857 ECCAS’s Infrastructure A Continental Perspective Rupa Ranganathan Vivien Foster e World Bank Africa Region Sustainable Development Unit September 2011 WPS5857
-
Upload
khangminh22 -
Category
Documents
-
view
1 -
download
0
Transcript of ECCAS's Infrastructure - Open Knowledge Repository

Policy Research Working Paper 5857
ECCAS’s Infrastructure
A Continental Perspective
Rupa RanganathanVivien Foster
The World BankAfrica RegionSustainable Development UnitSeptember 2011
WPS5857

Produced by the Research Support Team
Abstract
The Policy Research Working Paper Series disseminates the findings of work in progress to encourage the exchange of ideas about development issues. An objective of the series is to get the findings out quickly, even if the presentations are less than fully polished. The papers carry the names of the authors and should be cited accordingly. The findings, interpretations, and conclusions expressed in this paper are entirely those of the authors. They do not necessarily represent the views of the International Bank for Reconstruction and Development/World Bank and its affiliated organizations, or those of the Executive Directors of the World Bank or the governments they represent.
Policy Research Working Paper 5857
Sound infrastructure is fundamental for growth across the Economic Community of Central African States (ECCAS). During 1995–2005, improvements in infrastructure boosted growth in Central Africa by 1 percentage point per capita annually, primarily due to the introduction and expansion of mobile telephony. Improved roads also made a small contribution. Conversely, inadequate power deterred growth to a greater degree than elsewhere in Africa. ECCAS must address a complex set of challenges. Economic activity takes place in isolated pockets separated by vast distances. Two countries are landlocked and dependent on regional corridors; seven countries have populations of under 10 million; and eight have economies that are smaller than $10 billion/year. This difficult economic geography demands a regional approach to developing infrastructure. Yet Central Africa’s
This paper is a product of the Sustainable Development Unit, the Africa Region. It is part of a larger effort by the World Bank to provide open access to its research and make a contribution to development policy discussions around the world. Policy Research Working Papers are also posted on the Web at http://econ.worldbank.org. The author may be contacted at [email protected].
infrastructure has the poorest performance record in all of Africa on most aggregate indicators. Transportation is slow and the most expensive in Sub-Saharan Africa, with poor road conditions, border delays, port delays, time-consuming administrative processes, no integrated railway network, and inefficient air transport. The ICT backbone is still in its early stages; access rates are low and the prices of critical services are the highest in Africa. ECCAS has the least-developed power sector on the continent despite significant hydropower resources. If Central Africa’s infrastructure could be improved to the level of Mauritius, regional growth performance would be boosted by some 5 percentage points, with power making the strongest contribution. The cost of such an improvement is estimated at $1.8 billion/year for a decade and will require external assistance.

ECCAS’s Infrastructure: A Regional Perspective
Rupa Ranganathan and Vivien Foster
Acknowledgments
This paper draws on contributions from sector specialists from the Africa Infrastructure Country
Diagnostic Team; notably, Heinrich Bofinger on air transport, Michael Minges on information and
communication technologies, and Alvaro Federico Barra on spatial analysis.
The paper is based on data collected by local consultants and benefited greatly from feedback provided by
colleagues in the relevant World Bank teams; notably Yusupha Crookes (director of the Africa Regional
Integration Department), Andrew Roberts (Africa Regional Integration Department), Gael Raballand
(transport), and Charles Kunaka (International Trade Department). The paper benefited from feedback
provided by REC staff at a May 2010 Workshop organized by the Infrastructure Consortium for Africa in
Tunis and at other meetings.

iii
Contents
List of figures iii
List of tables iv
Synopsis v
1 Introduction 1
Why infrastructure matters 1 Why regional integration matters 3 The state of ECCAS’s infrastructure 6
2 Transport 8
Surface transport 8 Roads 18 Railways 18 Ports 21 Air transport 24
3 Power 33
4 Information and communication technologies 44
5 Regional infrastructure funding 54
Bibliography 57
General 57 Financing 57 Growth 57 Information and communication technologies 57 Irrigation 58 Power 58 Transport 58 Water supply and sanitation 59 Other 59
List of figures
Figure 1.1a. Infrastructure‘s historic contribution to economic growth, 1995–2005 2 Figure 1.1b. Infrastructure‘s potential future contribution to economic growth (% GDP per year) 3 Figure 1.2a. Topographical profile of the ECCAS region 5 Figure 1.2b. Spatial distribution of economic activity within ECCAS 6 Figure 2.1a. The condition of ECCAS‘s regional road network 8 Figure 2.1b. Traffic on ECCAS‘s regional road network 9 Figure 2.2. ECCAS‘s main regional road corridors 12 Figure 2.3. Time required to import goods from Douala to Ndjamena via road and rail 15 Figure 2.4. Cost of importing goods from Douala to Ndjamena via road and rail 15 Figure 2.5. Time required to import goods by road through alternate gateways* 16 Figure 2.6. Cost of importing goods by road through alternative gateways 17 Figure 2.7. ECCAS‘s regional railway network 19 Figure 2.8. Traffic densities on African railways 20 Figure 2.9. Ratio of current demand to reported capacity 22

iv
Figure 2.10. ECCAS‘s regional airports and air traffic flows 24 Figure 2.11. International routes within Sub-Saharan Africa for 2007 25 Figure 2.12. Seats for intra-REC travel within ECCAS and CEMAC 26 Figure 2.13. Status of African safety oversight, using several criteria 31 Figure 2.14. Age distribution of airline fleet in the ECCAS region 32 Figure 3.1. ECCAS‘s regional power network and infrastructure 33 Figure 3.2. Regional spending needs as a percentage of GDP 37 Figure 3.3. Simulated patterns of future power trade in the CAPP, 2015 (TWh) 38 Figure 3.4. Trade flows in the CAPP, 2015 (TWh) 39 Figure 3.5. Net imports as a share of domestic demand (%) 40 Figure 3.6. Power generation mix 41 Figure 4.1. ECCAS‘s regional ICT network 44 Figure 4.2. Price of a one-minute peak-rate call within and outside regional economic communities (US$ per minute) 47 Figure 4.3. Proposed fiber-optic connectivity 52 Figure 5.1. Spending on regional infrastructure as a share of GDP 55 Figure 5.2. Spending on regional infrastructure as a percentage of national infrastructure spending 56
List of tables
Table 1.1. Progress and challenges for regional integration in ECCAS 4 Table 2.1. Relative performance of transport corridors in Africa 9 Table 2.2. Road conditions along major transit corridors in ECCAS* 14 Table 2.3. Condition of ECCAS‘s regional road network, by member country (%) 18 Table 2.4. Performance compared across Central African railways, 2005 21 Table 2.5. Port performance compared across African regions 23 Table 2.6. Performance compared across West African ports 23 Table 2.7. Benchmarking air transport in ECOWAS and other regional economic communities 26 Table 2.8. Domestic, international, and intercontinental city pairs, 2007 (number) 27 Table 2.9. All flights within ECCAS, one week in November 2007 28 Table 2.10. Proportion of direct flights and speed of air service in East Africa 28 Table 2.11. Measuring progress toward implementation of the Yamassoukro Declaration 29 Table 2.12. Changes in market share of major regional carriers, 2001–07 (%) 30 Table 3.1. Benchmarking power infrastructure and capacity, access, and utility performance 34 Table 3.2. Demand and suppressed demand in the CAPP 35 Table 3.3. Annualized costs of system expansion in the CAPP, 2015 (million) 36 Table 3.4. Additional infrastructure requirements for trade expansion (MW) 37 Table 3.5. Differences in electricity production and carbon dioxide emissions in trade expansion and stagnation 41 Table 3.6. Long-run marginal costs of power in the CAPP 42 Table 3.7. Rate of return on power trade at country level 43 Table 4.1. Benchmarking ICT infrastructure across regions 45 Table 4.2. Benchmarking ICT across ECCAS member states 46 Table 4.3. GSM roaming in ECCAS 48 Table 4.4. Foreign investors in ECCAS‘s telecommunications sector 49 Table 4.5. Prices of Internet and phone calls in Sub-Saharan Africa, with and without access to submarine cables 50 Table 4.6. Gaps in intraregional connectivity and total investment required to attain minimum levels of regional connectivity 51 Table 4.7. Intercontinental and intraregional spending needs for ECCAS over 10 years 51 Table 5.1. Regional spending needs by sector 55

Synopsis
Sound infrastructure is a critical prerequisite for growth in Central Africa. Over the period 1995–2005,
improvements in infrastructure boosted growth in Central Africa by 1 percentage point per capita
annually. Almost the entire contribution to growth was due to the introduction of mobile telephony, while
improvements in road infrastructure made a small contribution. Inadequate power deterred growth to a
greater degree in Central Africa than in other regions in the continent. If Central Africa’s infrastructure
can be improved to the level of the strongest-performing country in Africa (Mauritius), regional growth
performance would be boosted by some 5 percentage points, with power making the strongest
contribution.
Central Africa’s infrastructure has the poorest performance record in all of Africa on most aggregate
indicators. The gap between southern Africa (the regional leader) and Central Africa is quite dramatic,
indicating that Central Africa has to make a significant effort to catch up with other parts of Africa—let
alone the rest of the developing world. Paved road density is a fraction of the low levels in West Africa.
Central Africa does, however, outperform East Africa on power and information and communication
technology (ICT) indicators.
The Economic Community of Central African States (ECCAS) must address a complex set of factors:
economic activity takes place in isolated pockets separated by vast distances and environmentally
sensitive areas. Two countries are landlocked and are entirely dependent on regional corridors. Seven
countries have populations below 10 million and eight have economies that are smaller than $10 billion
per year. This difficult economic geography makes it critical to take a regional approach to developing
infrastructure. Inland waterways are prominent yet grossly underutilized.
A third of ECCAS’s regional road network is unpaved, with substantial shares in poor condition.
Meanwhile, coastal countries are not devoting sufficient attention to sea corridors. There is only one
significant regional transport corridor linking the Port of Douala to the Central African Republic and
Chad. A second potential corridor running inland from the Port of Pointe Noire fell into neglect during a
recent conflict but is in the process of being revitalized. There is a tendency for coastal countries to
neglect the hinterland portions of their regional corridors to the detriment of their landlocked neighbors.
Traffic volumes along the region’s corridors are exceedingly low and in many cases below the economic
threshold for paving. Regional integration is a challenge because there is limited road connectivity
between countries in the Economic and Monetary Community of Central Africa (CEMAC) and other
ECCAS member states.
Surface transport in Central Africa is the most expensive in Sub-Saharan Africa due to cartelization
and restrictive regulations on the trucking industry. In Central Africa road transport tariffs are on the
order of $0.13 per tonne-kilometer (tonne-km) or even higher, compared with $0.05 per tonne-km in
southern Africa and well below $0.04 per tonne-km in much of the developing world. High freight
charges do not reflect high transport costs so much as high trucking profits that can be traced to the lack
of competition in the industry. In addition, the regulatory framework is based on market sharing and
centralized allocation of freight, which limits vehicle mileage and undermines incentives to invest in
improving service quality.

ECCAS’S INFRASTRUCTURE: A REGIONAL PERSPECTIVE
vi
Surface transport in Central Africa moves slower than most other parts of Africa because of poor
road conditions, border delays, and time-consuming administrative processes. The average effective
velocity of freight movement in Central Africa is around 6 kilometers per hour, about half the effective
velocity of surface transport in southern Africa and not much faster than a horse and buggy. This slow
speed is largely attributed to poor road infrastructure and also to administrative barriers such as border
and customs clearance, as well as formal and informal checkpoints and road blocks that keep trucks
stationary for extended periods of time.
The time taken to move freight from ports to landlocked countries has ranged from 26 to 71 days,
among the longest on the continent. Between 50 to 80 percent of these delays are caused by the long
dwell times at ports. Time required for administrative processes also accounts for a smaller yet significant
share of the long delays that contribute to lengthening transit times along ECCAS’s corridors.
The overall cost of moving goods along Central Africa’s key trade routes is on the order of $230–
$650 per tonne. These are the highest costs found in any African region. The main culprits are the
extensive delays at ports and the high unit costs of road freight transportation.
Central African railway systems do not form a network, and existing rail lines are lightly used. These
factors—coupled with the lack of performance required to retain competiveness with road transport—
complicate the regional integration of the railways. The productivity performance of the railways in
Cameroon and Gabon are encouraging. But the performance of railways in the Democratic Republic of
Congo, the Republic of Congo, and some lines in Angola remains very poor.
Two ports in Central Africa—Douala and Pointe Noire—serve as transshipment hubs for the region,
but the performance of these ports significantly lags global standards. In Doula and Luanda the volume
of general cargo handled significantly exceeds design capacity. Prices in Central African ports are double
that of global benchmarks on some parameters, and efficiency indicators are far from meeting global
benchmarks. These inefficiencies and the excess capacities handled result in congestion problems at the
ports, leading to extensive dwell times.
The air transport sector in ECCAS is striking for the absence of an air transport hub and the lack of
connectivity between the CEMAC region and other ECCAS members. The CEMAC region is among the
most liberalized in Africa and has made significant progress in allowing airlines to fly the so-called fifth
freedom routes, flights flown under fifth-freedom arrangements (that is, by carriers that are not registered
either in the origin or destination country) by instituting free pricing and lifting capacity and frequency
restraints. Nevertheless, the number of seats flown fell dramatically between 2001 and 2007 due to the
collapse of Cameroon Airlines and Air Gabon, as well as Air Afrique. Air safety standards are rather low;
no ECCAS country has yet made significant progress toward achieving international safety standards.
Despite major hydropower resources, Central Africa has the least developed power sector on the
continent. Generation capacity is inadequate and average historic costs of power in the region have been
extremely high—on the order of $0.49 per kilowatt-hour. Notwithstanding this, power access is better
than in some other regions. With power demand likely to double over the next decade, expanding the
power supply infrastructure is critical to the region’s economic future.
Regional power trade through the Central African Power Pool (CAPP) could substantially reduce
power sector costs and the long-run marginal cost of energy in the region. In addition to the Democratic

ECCAS’S INFRASTRUCTURE: A REGIONAL PERSPECTIVE
vii
Republic of Congo, Cameroon could potentially emerge as a significant exporter if it could develop an
additional 1,300 megawatts of hydropower. Chad and Equatorial Guinea would find it economically
attractive to import their entire power needs from the CAPP, while Congo and Gabon could import
between 25 to 50 percent of their demand. Regional power trade would reduce overall energy costs in the
region by $160 million annually, and would facilitate a shift to cleaner energy that would reduce regional
carbon emissions by around 4 million tonnes annually. Importing countries would save significantly on
their national power development costs and substantially reduce their long-run marginal cost of power.
Given the region’s underdeveloped transmission networks, significant investments in interconnectors are
needed to make trade a reality. Overall, investments in regional interconnection yield an average rate of
return of 28 percent.
Compared with other regional economic communities in Africa, ECCAS’s ICT backbone is still in its
incipient stages; access rates are low and the prices of critical services are the highest on the continent. It
is cheaper to call outside of ECCAS than it is to call within the regional economic community. The
roaming arrangements in the region are the least developed in Africa. Only three countries have roaming
arrangements with other regional economic community members, and the special roaming plans (prepaid,
no charge for incoming calls, preferential outgoing call rates) found in other regional economic
communities are absent in Central Africa. A few large operators are beginning to develop a regional
presence in ECCAS, and all countries now have two or three foreign operators. The region has very low
connectivity to submarine cables: only three countries are connected and none of the landlocked countries
have access to the cables despite their proximity. Completing the ICT backbone in ECCAS would require
adding over 4,900 km of cable that would cost $140 million.
Completing and preserving ECCAS’s regional infrastructure backbone would require an investment
of $1.8 billion per year over the course of a decade. Of this, around $1.4 billion a year is needed for the
creation of new regional infrastructure assets, while the balance of $222 million is needed to maintain the
regional network in perpetuity once established, most of it for road maintenance. By far the largest item
on the budget is the power sector, with regional power assets demanding $1.1 billion per year over the
next decade. Of the total for ECCAS, 28 percent, or $680 million per year, is needed to complete
CEMAC’s infrastructure backbone—$470 million for new infrastructure investments and the rest for
maintenance.
While this amounts to only 2 percent of regional gross domestic product (GDP) for ECCAS (and 1
percent for CEMAC), for some small countries the burden is insurmountable. In absolute terms, the
largest burden falls on the Democratic Republic of Congo, which would have to spend $960 million a
year over the next decade to deliver the infrastructure assets (chiefly power) needed by the region.
Cameroon comes in a distant second, with a spending requirement of $350 million a year (also largely
associated with power). If one looks at regional spending requirements relative to the size of each
country’s economy, the burden appears even more uneven. Congo’s regional spending requirement, in
particular, translates to almost 14 percent of GDP, manifestly beyond what the national economy could
plausibly deliver without external assistance. The rest of the countries would need to spend between 1 and
5 percent of their GDP on regional spending—a stretch, even if the absolute sums involved do not look so
large.

1 Introduction
The Africa Infrastructure Country Diagnostic (AICD) has conducted extensive data collection and
analysis of the infrastructure situation in Africa, including in the countries of the Economic Community
of Central African States (ECCAS) region. The results have been presented in a variety of continental
reports covering different areas of infrastructure—information and communication technology (ICT),
irrigation, power, transport, and water and sanitation—and different policy areas, including investment
needs, fiscal costs, and sector performance.
The purpose of this regional economic community is to present the key AICD findings for ECCAS.
The main value in doing so is that it allows ECCAS’s infrastructure situation to be benchmarked against
that of other African peers, the main gaps in the regional infrastructure backbones to be identified, and the
costs and benefits of regional integration (as well as their distribution across member states) to be
quantified.
A number of methodological issues need to be borne in mind.
First, owing to the cross-country nature of the data collection, there is inevitably a time lag involved
in the data. The period covered by AICD runs from 2001 to 2006. Most technical data presented are for
2006 (or the most recent year available), while financial data are typically averaged over the available
period to smooth out the effect of short-term fluctuations. Given the fast pace of regional integration, the
snapshot presented here does not necessarily correspond to today’s situation but rather represents the
2006 baseline against which subsequent progress can be measured.
Second, given the need to make comparisons across countries, indicators and analysis had to be
standardized and made consistent. That means that some of the indicators may be slightly different from
those routinely reported and discussed at the country level.
Third, the database on which the analysis was based was designed to give a national and continental
picture of infrastructure, as opposed to an explicitly regional picture. But national infrastructure provides
the basic building blocks for regional integration, and hence can be used to build up a picture of the
regional situation. Nevertheless, some specifically regional issues—particularly of the regulatory and
institutional variety—may not have been explicitly addressed in the national data collection effort.
Fourth, while water resource management is an important aspect of regional integration in Africa, this
report does not explore water resource issues. This is because the AICD project did not cover water
resources per se, but rather the specific water resource needs associated with the power, irrigation, and
water supply sectors.
Why infrastructure matters
ECCAS has 10 member states: Angola, Burundi, Cameroon, Chad, the Democratic Republic of
Congo, the Republic of Congo, the Central African Republic, Equatorial Guinea, Gabon, and São Tomé
and Príncipe. A subgroup of these countries—Cameroon, the Central African Republic, Chad, the
Republic of Congo, Equatorial Guinea, and Gabon—forms the Economic and Monetary Community of

ECCAS’S INFRASTRUCTURE: A REGIONAL PERSPECTIVE
2
Central Africa (CEMAC). Where relevant, separate aggregate results will be presented for the ECCAS
and CEMAC countries.
For the period 2003–08, all countries for which data are available registered economic growth, albeit
at varying rates. Average annual growth in purchasing power parity (PPP) terms was above 1 percent for
all countries. Burundi, Cameroon, the Central African Republic, and Gabon grew at an average rate of 1
percent annually during this period. The Democratic Republic of Congo, the Republic of Congo, Chad,
Rwanda, and São Tomé and Príncipe grew between 2 and 5 percent on average for the same period, and
Equatorial Guinea had outstanding growth of over 10 percent annually. Infrastructure has contributed
approximately 1 percentage point to the per capita growth rate in Central Africa (figure 1.1a). Almost the
entirety of this was due to the growth of mobile telephony, as was the case in all other regions.
Improvements in road infrastructure made a small contribution to overall growth. The lack of adequate
power infrastructure eroded growth by 0.1 percentage point, more in Central Africa than in other parts.
Figure 1.1a. Infrastructure’s historic contribution to economic growth, 1995–2005
Source: Calderón 2009.
Infrastructure, however, could contribute much more to economic growth in the future than it has in
the past (figure 1.1b). Simulations suggest that if Central Africa’s infrastructure could be upgraded to the
level of the best-performing country in Africa (Mauritius), the impact on per capita economic growth
would be on the order of 5 percent. All areas of infrastructure—ICT, power, and transport—need to be
upgraded. Improvements in power can impact growth by around 2 percentage points. Roads and
telecommunications infrastructure upgrades could contribute 1.5 percentage points each to growth.
-0.4-0.20.00.20.40.60.81.01.21.4
North A
frica
West A
frica
East A
frica
Southern A
frica
Central A
frica
Africa
Ad
dit
ion
al
per
cen
tag
e p
oin
ts o
f p
er c
ap
ita
eco
no
mic
gro
wth
Telecom Power Roads
ECCAS’S INFRASTRUCTURE: A REGIONAL PERSPECTIVE
3
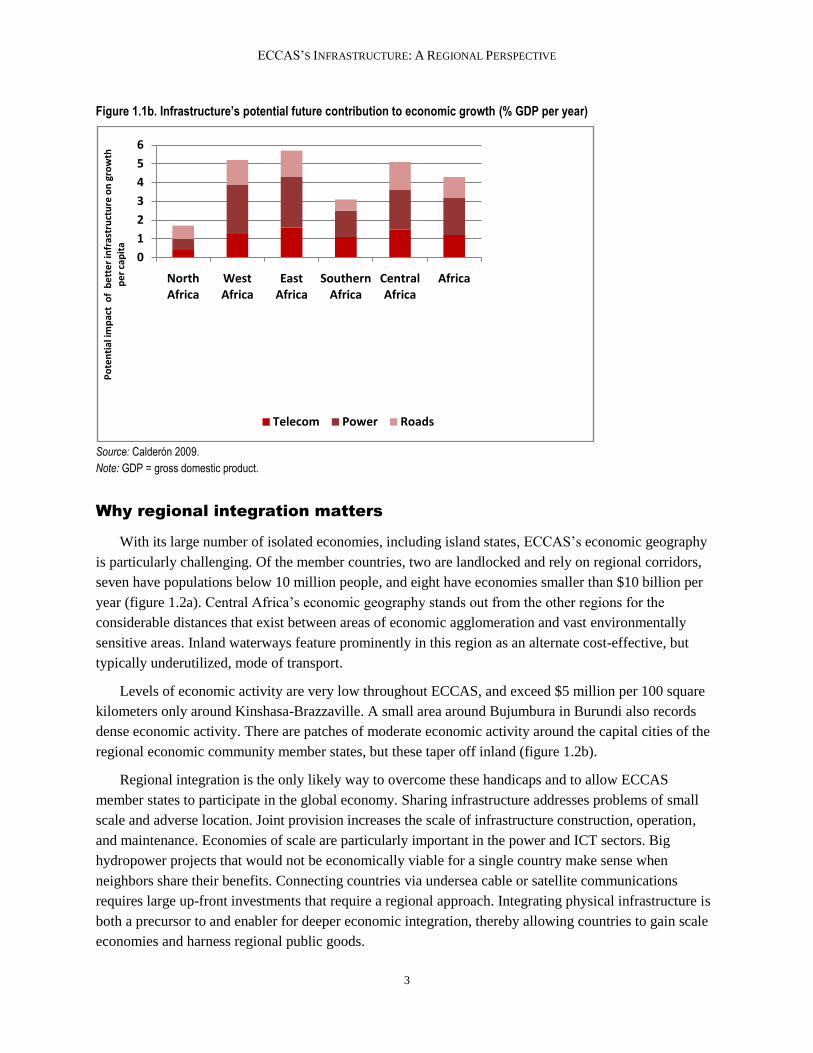
Figure 1.1b. Infrastructure’s potential future contribution to economic growth (% GDP per year)
Source: Calderón 2009.
Note: GDP = gross domestic product.
Why regional integration matters
With its large number of isolated economies, including island states, ECCAS’s economic geography
is particularly challenging. Of the member countries, two are landlocked and rely on regional corridors,
seven have populations below 10 million people, and eight have economies smaller than $10 billion per
year (figure 1.2a). Central Africa’s economic geography stands out from the other regions for the
considerable distances that exist between areas of economic agglomeration and vast environmentally
sensitive areas. Inland waterways feature prominently in this region as an alternate cost-effective, but
typically underutilized, mode of transport.
Levels of economic activity are very low throughout ECCAS, and exceed $5 million per 100 square
kilometers only around Kinshasa-Brazzaville. A small area around Bujumbura in Burundi also records
dense economic activity. There are patches of moderate economic activity around the capital cities of the
regional economic community member states, but these taper off inland (figure 1.2b).
Regional integration is the only likely way to overcome these handicaps and to allow ECCAS
member states to participate in the global economy. Sharing infrastructure addresses problems of small
scale and adverse location. Joint provision increases the scale of infrastructure construction, operation,
and maintenance. Economies of scale are particularly important in the power and ICT sectors. Big
hydropower projects that would not be economically viable for a single country make sense when
neighbors share their benefits. Connecting countries via undersea cable or satellite communications
requires large up-front investments that require a regional approach. Integrating physical infrastructure is
both a precursor to and enabler for deeper economic integration, thereby allowing countries to gain scale
economies and harness regional public goods.
0
1
2
3
4
5
6
North Africa
West Africa
East Africa
Southern Africa
Central Africa
Africa
Po
ten
tial
imp
act
of
be
tte
r in
fras
tru
ctu
re o
n g
row
th
pe
r ca
pit
a
Telecom Power Roads

ECCAS’S INFRASTRUCTURE: A REGIONAL PERSPECTIVE
4
Table 1.1. Progress and challenges for regional integration in ECCAS
Sector Achievements Challenges Promise of regional integration
Road transport
High trucking charges and lengthy delays due to trade facilitation issues. Traffic volumes on regional corridors are well below traffic thresholds and do not justify paving. Road quality is not very good, with patches of very poor roads along key corridors. No connectivity between the CEMAC countries and the Democratic Republic of Congo and Angola. Reducing costs and delays associated with
surface transportation of goods within the region.
Railways
Two relatively successful binational concessions. The concessions have improved productivity of individual railways.
Low levels of passenger and freight traffic. Poor operational performance of railways.
Ports
Douala acts as the main gateway for landlocked countries. Pointe-Noire has good deep-water characteristics.
The two key ports used in the region are facing capacity constraints. Port charges are exceedingly high.
Air transport CEMAC has made good progress toward liberalization.
The air transport market has dwindled, and levels of air connectivity are very low. There is no connectivity between the CEMAC countries and the Democratic Republic of Congo and Angola. Air safety is among the worst in the world.
Collaborating on improvement of safety record. Improving efficiency of regional air transport through a better hub system.
Power Significant availability of cost-effective hydropower resources.
Very low access and generation capacity. Utilities highly inefficient with regard to distribution losses and revenue collection.
Deepening regional integration would save the CAPP area US$160 million (10 percent of power costs) in energy costs and generate annual savings of some 4 million tonnes of carbon emissions. Long-term marginal cost of power in the CAPP would fall by US$0.02 per kilowatt-hour, the greatest savings in Africa. The overall rate of return on regional integration investments is 28%.
ICT
Some countries have been connected to the undersea fiber-optic cable, which has resulted in reduction of costs to ICT services. A few international operators are beginning to develop a regional presence.
Very low access to ICT services and very high prices in ECCAS. Roaming far less developed than other parts of Africa.
Achieving regional ICT integration would cost only US$14 million annually and bring large benefits. Benefits derive primarily from lower prices inducing higher rates of subscription to broadband services.
Source: Summary of analysis presented in the paper
Note: CEMAC = Economic and Monetary Community of Central Africa; CAPP = Central Africa Power Pool; ICT = information and communication technology.

ECCAS’S INFRASTRUCTURE: A REGIONAL PERSPECTIVE
5
As well as assessing the current state of regional infrastructure, this report identifies the basic
infrastructure needed to provide a minimum level of transport, power, and ICT interconnection. Basic
needs include smooth land corridors between landlocked countries and ports, as well as between major
cities within a given country or region; cost-effective power generation technologies harnessed at an
efficient scale in the context of a regional trading pool; and fiber-optic access to submarine cables through
a robust communications network interlinking capital cities. Missing physical links will be identified
throughout the report, and detailed cost estimates presented in the final section.
Figure 1.2a. Topographical profile of the ECCAS region
Source: AICD.
South Sudan

ECCAS’S INFRASTRUCTURE: A REGIONAL PERSPECTIVE
6
Figure 1.2b. Spatial distribution of economic activity within ECCAS
Source: AICD.
The state of ECCAS’s infrastructure
ECCAS’s infrastructure ranks consistently below
other parts of Africa on almost all aggregate
infrastructure indicators (table 1.2). Paved road
density, at 4 km per 100 sq km of land, is barely a
fraction of the density in West Africa, which is the
next-worst performer on this indicator. In terms of
electricity generation capacity and coverage and
mainline and mobile density, Central Africa has
better access than East Africa. In fact, the mobile
revolution seems to have taken off in Central
Africa, where the mobile density, at 84 subscribers
Table 1.2 Benchmarking Central Africa against other regions
Western Eastern Southern Central
Paved road density 38 29 92 4
Mainline density 28 6 80 13
Mobile density 72 46 133 84
Internet density 2 2 4 1
Generation capacity 31 16 176 47
Electricity coverage 18 6 24 21
Improved water 63 71 68 53
Improved sanitation 35 42 46 28
South Sudan

ECCAS’S INFRASTRUCTURE: A REGIONAL PERSPECTIVE
7
out of 100 people, is second only to southern Africa. The gap between southern Africa (the regional
leader) and Central Africa on most indicators, however, is quite dramatic, indicating that Central Africa
has to make a significant effort to catch up with other parts of Africa, let alone the rest of the developing
world.

2 Transport
Figure 2.1a. The condition of ECCAS’s regional road network
Source: AICD.
Surface transport
Surface transport of goods in Africa is much slower and costlier than elsewhere in the developing
world. Across the developing world, freight can typically be moved around at rates of between $0.01 and
$0.04 per tonne-kilometer (tonne-km). A recent study of road transport costs and prices across Africa
found rates of $0.05 per tonne-km—well above the global benchmark. It also found that—despite the
relatively good condition of the road corridors—freight movements were astonishingly slow when all
delays were fully into account. At an effective speed of 6–12 kilometers per hour (kmph), they did not
move much faster than a horse and buggy (table 2.1).
South Sudan

ECCAS’S INFRASTRUCTURE: A REGIONAL PERSPECTIVE
9
Figure 2.1b. Traffic on ECCAS’s regional road network
Source: AICD
Table 2.1. Relative performance of transport corridors in Africa
Corridor
Length
(km)
Road in good condition (%)
Trade density (US$ millions per km)
Implicit velocity*
(kmph)
Freight tariff
(US$ per tonne-km)
Western 2,050 72 8.2 6.0 0.08
Central 3,280 49 4.2 6.1 0.13
Eastern 2,845 82 5.7 8.1 0.07
Southern 5,000 100 27.9 11.6 0.05
Source: Teravaninthorn and Raballand 2009.
Note: *Implicit velocity is the total distance divided by the total time taken to make the trip, including time spent stationary at ports, border
crossings, and other stops.
South Sudan

ECCAS’S INFRASTRUCTURE: A REGIONAL PERSPECTIVE
10
Corridor performance varies across Africa (table 2.1). Teravaninthorn and Raballand (2009) found
that transport corridors in Central Africa perform significantly worse than the rest of Africa and are well
below global standards. Only half of the regional road corridors are in good condition—significantly less
than other parts of Africa—and trade density is lower. The implicit velocity of freight (when stops and
delays are factored in) is only 6.1 kmph, similar to what is found in West Africa. Road freight tariffs, at
$0.13 per tonne-km, are among the highest in the world. For example, transport prices on the Douala to
Ndjamena route are three times higher than in Brazil and almost two times the cost of moving from
Lusaka to Durban.
The Logistics Performance Index (LPI) from 20101 indicated that West and Central Africa performed
slightly better than East Africa, which as of 2010 had amongst the worst trade logistics record in the
world.2 The LPI results revealed that transporters on trade corridors in Central (and West) Africa operated
under regulatory systems that negatively impacted productivity and imposed additional burdens on
landlocked countries.
Similar to West Africa, high road freight charges and very poor transport quality are in large part due
to the cartelization of a trucking industry that operates in a highly restrictive regulatory environment. The
strong presence of freight bureaus and transport associations influences the market and prevents truck
operators from contracting with customers directly. Analysis of cost information provided by trucking
firms indicates that the high road freight charges in the region are not attributable to higher costs but
rather to larger profit margins made possible by limited competition within industry cartels. In the United
States, freight transport prices average around $0.04 per tonne-km, compared with $0.11 per tonne-km
along the Douala- Ndjamena corridor (USITC 2009).
The regulatory framework is based on market sharing and the centralized allocation of freight. This
limits vehicle mileage (to around 2,000 km per month versus 12,000 in the developed world) and
undermines incentives for investing in service quality. Hence, the truck fleet is largely composed of
poorly maintained secondhand trucks that are typically overloaded to obtain maximum revenue from their
restricted usage. There is typically excess supply, with too many vehicles chasing modest freight
volumes. In southern Africa, by contrast, a much larger share of freight traffic is allocated through
competitive bilateral contracts between clients and shippers.
The cartelization of the Central African trucking industry is at an extremely high level. For example,
the truckers surveyed indicated that they were compelled to join truckers’ associations; without
membership, getting a load would be far more difficult. In more deregulated environments such as those
found in East Africa, being a part of a cartel or truckers’ association counts for less than the individual
professionalism of a trucking company.
These considerations make the liberalization of the trucking industry an important step toward
improving surface transport in Central Africa. Indeed, until the regulatory framework for the trucking
1 The LPI is an annual survey of international freight forwarders conducted in 155 countries. This survey aggregates
the responses of survey participants to questions concerning several factors—such as transport, warehousing, and
border clearance—into an index that is used to rank and rate global logistics for trade. 2 Most countries aggregated as ―West and Central Africa‖ by the LPI are countries that belong to the Economic
Community of West African States (ECOWAS).

ECCAS’S INFRASTRUCTURE: A REGIONAL PERSPECTIVE
11
industry is modernized, there will be no real economic benefit from further improvements to the quality
of road corridors.
The slow effective velocity of freight in Central Africa can be explained in terms of numerous road
blocks, lengthy administrative delays at ports and border crossings, and corruption. Corruption levels are
found to be as high as in West Africa. The landlocked countries in Central Africa (Chad and the Central
African Republic) experience by far the most costly and lengthiest export times. A 2009 USITC report
found that trucks often took two weeks to cross the border between the Central African Republic and
Cameroon, losing more time at the border than in transit. Importing goods took between 4 to 6 weeks on
average, including 2 to 4 weeks at the port (Arvis, Raballand, and Marteau 2009).
The uncertainty associated with delays on the road and at ports—in addition to high administrative
costs—translates into an economic drain. Operators and businesses need to hedge against unreliable
service delivery either by increasing inventories or taking alternate transport routes, which are often
extremely expensive. The Economist reported in 2002 that a beer factory in Cameroon, for example,
keeps 40 days of inventory to cope with poor road conditions, and a beer distributor stockpiles five
months of inventory at the beginning of each rainy season. This creates additional business costs and
reduces orders (USITC 2009).
The landlocked members of the Economic Community of Central African States (ECCAS) largely
rely on Douala in Cameroon as a gateway to the sea. The landlocked Central African Republic and Chad
use Douala as the main point of exit to the sea. Trade with the western Democratic Republic of Congo
tends to go through Matadi. Pointe-Noire in the Republic of Congo could potentially play a greater role as
a deepwater gateway to the sea for the Democratic Republic of Congo and the Central African Republic.
But the neglect of surface transport corridors during these nations’ recent conflicts has prevented this
from taking place. Exports from the southeastern Democratic Republic of Congo have traditionally used
Durban as a gateway to the sea because of its proximity to the north-south corridor in the Southern
African Development Community (SADC) region.
A substantial share of regional corridors are unpaved and in poor condition. There are five major
corridors in Central Africa (table 2.2).3 In most cases, only around two-thirds of the total length is paved.
The Central African Republic has paved just about the entirety of its sea corridors and keeps them in good
condition. But much of the connecting routes in Cameroon and the Republic of Congo is unpaved and in
poor condition. The same can be said of the Angolan portion of the Lobito corridor. These countries seem
to be neglecting strategic hinterland routes that are critical to Chad, the Central African Republic, and the
Democratic Republic of Congo. What is striking in each of these cases is that the problem seems to lie in
the neglect of road quality by a coastal gateway country. The incentives for the coastal country to
maintain hinterland road corridors do not appear to be strong, since the coastal countries’ own economies
are typically concentrated along the coast.
Traffic volumes on ECCAS’s regional corridors are substantially lower than in other regions and
make the case for paving questionable. The Douala to Ndjamena route is the only one recording a
significant volume of traffic: above 300 vehicles per day over three-quarters of its length. In most other
3 The route between Matadi and Lubumbashi is not provided in table 2.4 due to data limitations.

ECCAS’S INFRASTRUCTURE: A REGIONAL PERSPECTIVE
12
cases, much of the corridor length sees less than 300 vehicles per day, which is below the economic
threshold for paving.
The competitiveness of each corridor can be gauged by aggregating the time and costs associated with
transport, administrative processes (customs), and long waits incurred along the route, whether at ports or
otherwise. The cost of moving imports along each of these key arteries and the times taken for this
movement are key elements of the competitiveness of both international and intraregional trade. The time
taken can be broken down into four components: the travel time of goods, based on velocity along each
corridor; the administrative time required to import goods into a country; the time taken to clear ports;
and the delay incurred in crossing borders. Transport costs are based on the unit costs of moving freight
along specific corridors, and administrative costs are based on charges levied for bringing imports into a
country. Port delays and border delays are quantified using the assumption that delays cost $5 per day per
ton of imports.
Figure 2.2. ECCAS’s main regional road corridors
a. Road conditions
Source: AICD.
South Sudan

ECCAS’S INFRASTRUCTURE: A REGIONAL PERSPECTIVE
13
b. Traffic volumes
Source: AICD.
Where competing road and rail networks exist, transporting goods takes longer by rail but is a cheaper
proposition than by road. One railway network, however, effectively competes with road transport in
terms of speed: Camrail, which is indispensible to northern Cameroon. As of 2007 over 90 percent of the
Central African Republic’s exports were conveyed by rail, especially from Belabo to Douala (mainly
timber), and around 90 percent of Chadian imports went by rail from Douala to Ngaoundere. In sum,
Camrail plays an important role in Cameroon’s intercountry trade and in the international trade of the
Economic and Monetary Community of Central Africa (CEMAC) region (World Bank 2007). This
confirms the strategic purpose of rail haulage for international traffic and long hauls.
South Sudan

ECCAS’S INFRASTRUCTURE: A REGIONAL PERSPECTIVE
14
Table 2.2. Road conditions along major transit corridors in ECCAS*
Condition (%) Type (%) Traffic volumes (AADT) (%)
Corridors Good Fair Poor Unknown Paved Unpaved Unknown >300 300–1,000 >1,000 Unknown
Douala to Bangui 53.9 23.4 22.7 0 68.6 31.4 0.0 64.6 20.4 15.0 0.0
Cameroon 29.6 35.7 34.7 0 52.1 47.9 0.0 53.1 24.0 22.9 0.0
Central African Republic 100.0 0.0 0.0 0 100.0 0.0 0.0 86.5 13.5 0.0 0.0
Douala to Ndjamena 18.9 24.5 56.6 0 67.3 32.7 0.0 25.9 49.4 24.7 0.0
Cameroon 18.9 24.5 56.6 0 67.3 32.7 0.0 25.9 49.4 24.7 0.0
Pointe-Noire to Brazzaville to Bangui 29.1 18.9 45.2 7 68.8 25.2 6.0 26.6 11.3 0.0 62.1
Cameroon 55.6 38.8 0.0 6 0.0 100.0 0.0 70.2 24.1 0.0 5.6
Central African Republic 99.2 0.0 0.0 1 99.2 0.8 0.0 79.5 19.3 0.0 1.2
Republic of Congo 0.0 21.3 69.4 9 27.9 62.8 9.2 0.0 6.1 0.0 93.9
Matadi to Kisangani 30.5 10.0 59.4 0 99.7 0.0 0.3 0.0 0.0 0.0 100.0
Congo, Dem. Rep. of 30.5 10.0 59.4 0 30.4 69.3 0.3 0.0 0.0 0.0 100.0
Lubumbashi to Lobito 38.5 29.7 31.0 1 68.1 31.9 0.0 47.0 15.0 0.0 38.0
Angola 50.1 0.0 49.9 0 50.1 49.9 0.0 75.8 24.2 0.0 0.0
Congo, Dem. Rep. of 19.5 78.1 0.0 2 97.6 2.4 0.0 0.0 0.0 0.0 100.0
Source: AICD calculations.
Note: * Another important corridor between Matadi and Lubumbashi has not been included due to data limitations; **Data for only the Cameroon portion of the corridor is available. Aggregates represent the information only for Cameroon.
AADT = average annual daily traffic.
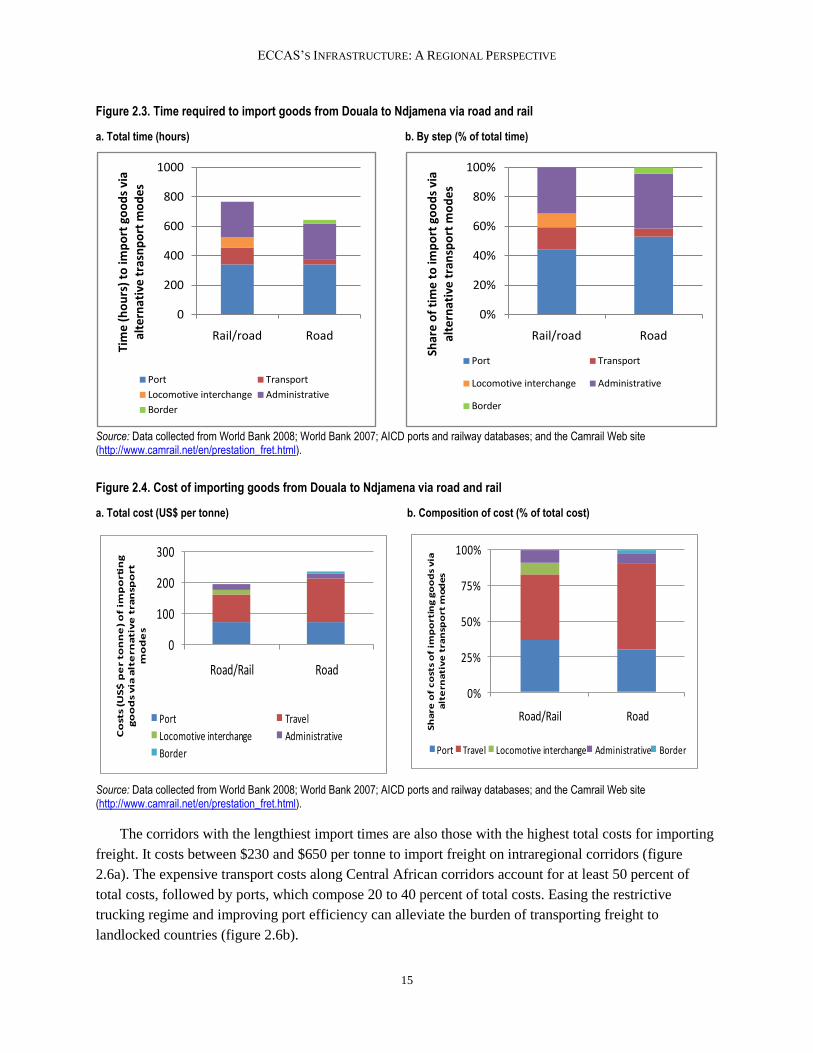
Importing freight via rail between Ndjamena and Douala takes longer than via road. On average, it
takes around 5 days longer to import goods via rail than road. Much of this is due to the time required to
shift freight from rail carriages to trucks for transport to Ndjamena from Ngaoundere via road (figure 2.3).
Despite the lengthy transit times, the cost of importing freight from Ndjamena to Douala provides rail
with a competitive edge. The average freight tariffs charged by Camrail ($0.09 per tonne-km) are lower
than road transport by $0.05 per tonne-km (figure 2.4). Importers consider the factors of both cost and
time when choosing how to deliver their freight.
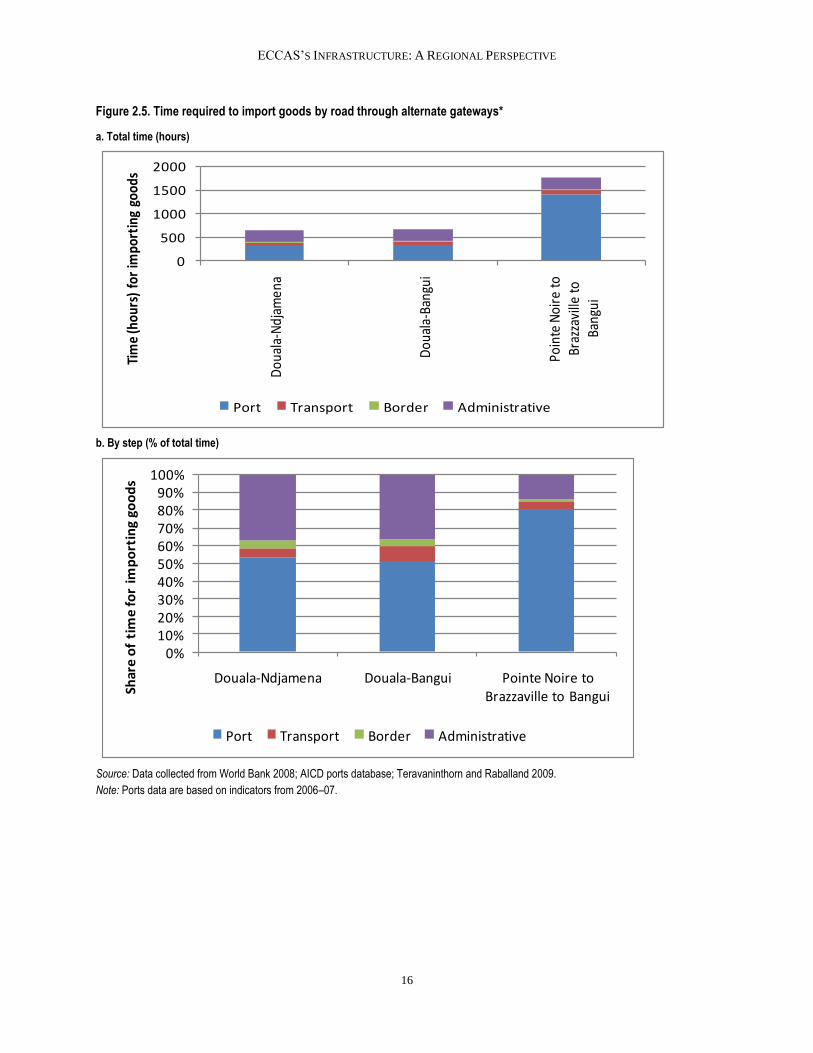
Among road corridors serving landlocked countries, there are significant cost differences across
corridors. Overall transport costs along Central African corridors are very high, while the time taken to
move imports is extremely long. The costs and times of moving imports along these corridors are well
aligned with observed traffic patterns. An analysis of the time required for imports to reach a landlocked
capital from the port ranges between 640 hours to over 1,700 hours (figure 2.5a). Around 50 to 80 percent
of the times can be attributed to the rather inefficient operations that characterize Central African ports
(figure 2.5b). Additionally, the regulatory processes of customs clearance and technical control in Central
Africa are extremely lengthy as well as the time required to import into a landlocked capital.
ECCAS’S INFRASTRUCTURE: A REGIONAL PERSPECTIVE
15
Figure 2.3. Time required to import goods from Douala to Ndjamena via road and rail
a. Total time (hours) b. By step (% of total time)
Source: Data collected from World Bank 2008; World Bank 2007; AICD ports and railway databases; and the Camrail Web site (http://www.camrail.net/en/prestation_fret.html).
Figure 2.4. Cost of importing goods from Douala to Ndjamena via road and rail
a. Total cost (US$ per tonne) b. Composition of cost (% of total cost)
0
100
200
300
Road/Rail Road
Co
sts
(US
$ p
er
ton
ne
) o
f im
po
rtin
g
go
od
s v
ia a
lte
rna
tiv
e t
ran
spo
rt
mo
de
s
Port Travel
Locomotive interchange Administrative
Border
0%
25%
50%
75%
100%
Road/Rail Road
Sh
are
of
co
sts
of
imp
ort
ing
go
od
s v
ia
alt
ern
ati
ve
tra
nsp
ort
mo
de
s
Port Travel Locomotive interchange Administrative Border
Source: Data collected from World Bank 2008; World Bank 2007; AICD ports and railway databases; and the Camrail Web site (http://www.camrail.net/en/prestation_fret.html).
The corridors with the lengthiest import times are also those with the highest total costs for importing
freight. It costs between $230 and $650 per tonne to import freight on intraregional corridors (figure
2.6a). The expensive transport costs along Central African corridors account for at least 50 percent of
total costs, followed by ports, which compose 20 to 40 percent of total costs. Easing the restrictive
trucking regime and improving port efficiency can alleviate the burden of transporting freight to
landlocked countries (figure 2.6b).
0
200
400
600
800
1000
Rail/road Road
Tim
e (
ho
urs
) to
imp
ort
go
od
s vi
a al
tern
ativ
e t
rasn
po
rt m
od
es
Port Transport
Locomotive interchange Administrative
Border
0%
20%
40%
60%
80%
100%
Rail/road Road
Shar
e o
f ti
me
to
imp
ort
go
od
s vi
a al
tern
ativ
e t
ran
spo
rt m
od
es
Port Transport
Locomotive interchange Administrative
Border
ECCAS’S INFRASTRUCTURE: A REGIONAL PERSPECTIVE
16
Figure 2.5. Time required to import goods by road through alternate gateways*
a. Total time (hours)
0
500
1000
1500
2000
Dou
ala-
Ndj
amen
a
Dou
ala-
Bang
ui
Poin
te N
oire
to
Braz
zavi
lle to
Ba
ngui
Tim
e (h
ours
) fo
r im
port
ing
good
s
Port Transport Border Administrative
b. By step (% of total time)
0%10%20%30%40%50%60%70%80%90%
100%
Douala-Ndjamena Douala-Bangui Pointe Noire to Brazzaville to BanguiSh
are
of
tim
e fo
r im
po
rtin
g go
od
s
Port Transport Border Administrative
Source: Data collected from World Bank 2008; AICD ports database; Teravaninthorn and Raballand 2009.
Note: Ports data are based on indicators from 2006–07.

ECCAS’S INFRASTRUCTURE: A REGIONAL PERSPECTIVE
17
Figure 2.6. Cost of importing goods by road through alternative gateways
a. Total cost (US$ per tonne)
b. Composition of cost (% of total cost)
Source: Data collected from World Bank 2008; AICD ports database; and Teravaninthorn and Raballand 2009.
0
100
200
300
400
500
600
700
800
Douala-Ndjamena Douala-Bangui Pointe Noire to Brazzaville to BanguiC
ost
s (U
S$ p
er-
ton
ne
) o
f im
po
rtin
g go
od
s
Administrative Border Transport Port
0%
20%
40%
60%
80%
100%
Douala-Ndjamena Douala-Bangui Pointe Noire to Brazzaville to Bangui
Shar
e o
f C
ost
s o
f im
po
rtin
g go
od
s
Administrative Border Transport Port

ECCAS’S INFRASTRUCTURE: A REGIONAL PERSPECTIVE
18
Roads
This section looks at the national segments of the regional road network. To this end, the regional
road network is defined as the network needed to interconnect all national capitals with one another and
with the major deep seaports. Overall, 43 percent of this network is already paved (table 2.3).
ECCAS members vary substantially in their track record on the maintenance of the regional road
network. Overall, 48 percent of the regional network is in good or fair condition (table 2.3). As a general
rule, most member countries are not doing enough to maintain their share of the regional network in good
or fair condition. But there are three exceptions to this pattern. In Burundi and the Central African
Republic, over 90 percent of the roads are in good or fair condition. A distant third is Gabon, where three-
quarters of the roads are at least in fair condition. This may be symptomatic of wider deficiencies in the
funding and implementation of road maintenance works in these countries, and/or denote that regional
routes are not being prioritized in their national road plans.
Table 2.3. Condition of ECCAS’s regional road network, by member country (%)
Condition Type
Good Fair Poor Unknown Paved Unpaved Unknown
Angola 71.4 5.5 23.2 0 71.4 28.6 0.0
Burundi 42.4 27.9 24.2 6 94.4 5.6 0.0
Cameroon 35.1 27.6 35.8 2 54.9 45.1 0.0
Central African Republic 62.6 17.0 17.6 3 97.2 2.8 0.0
Chad 9.0 44.7 14.9 31 12.5 87.5 0.0
Congo, Dem. Rep. of 14.2 12.6 61.5 12 17.7 82.1 0.2
Gabon 0.0 0.0 0.0 100 74.4 21.6 4.0
Republic of Congo 0.0 19.3 72.3 8 25.3 66.3 8.4
ECCAS 29.1 18.4 39.3 13.2 42.6 56.7 0.7
East Africa 29.8 26.5 11.7 32 57.2 25.4 17.4
ECOWAS 45.1 28.4 22.5 4 91.9 8 0.1
SADC 46.7 24.1 22.8 6.4 74 25.8 0.2
Source: AICD various sources.
Note: ECOWAS = Economic Community of West African States; SADC = Southern African Development Community.
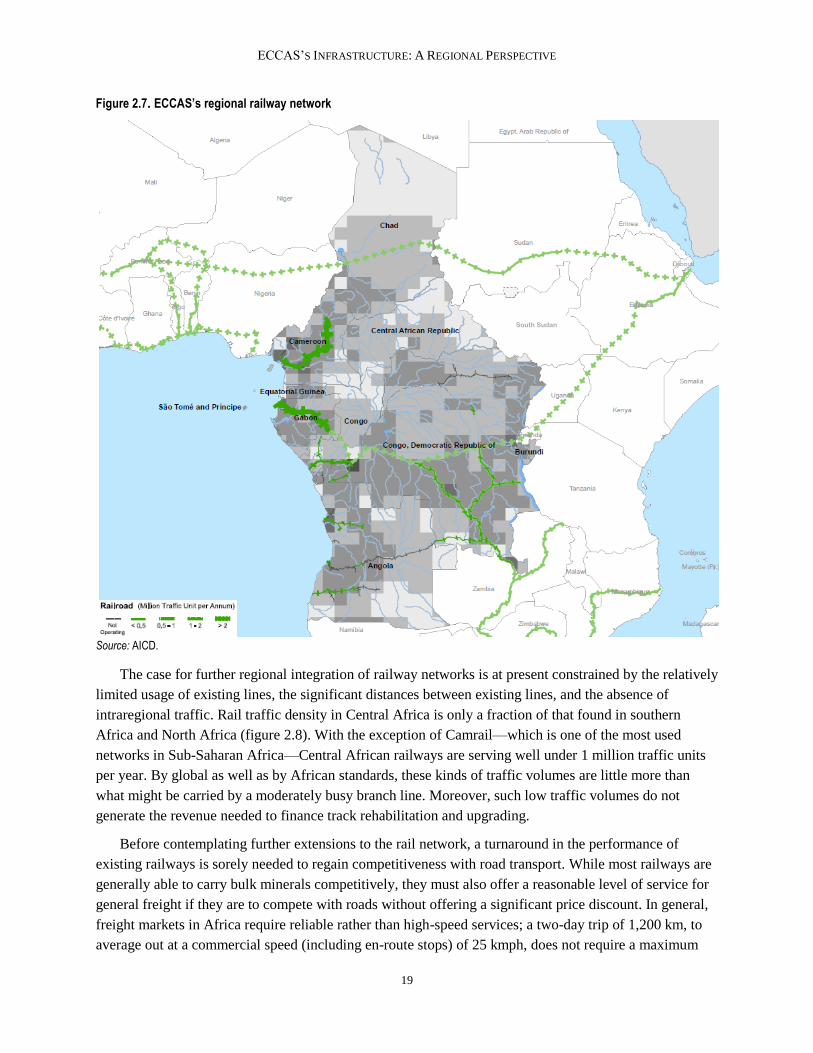
Railways
Central Africa has a handful of disconnected railway systems that are far from forming a regional
network (figure 2.7). This is in contrast to southern Africa, where interconnected national railway systems
form a regional railway network that spans half a dozen countries and extends from the southern
Democratic Republic of Congo all the way to Durban in South Africa. The railway network in Central
Africa operates along 6,000 route-km—the smallest distance in Africa—and carries 4,000 net tonnes-km,
the smallest load in Africa.
ECCAS’S INFRASTRUCTURE: A REGIONAL PERSPECTIVE
19
Figure 2.7. ECCAS’s regional railway network
Source: AICD.
The case for further regional integration of railway networks is at present constrained by the relatively
limited usage of existing lines, the significant distances between existing lines, and the absence of
intraregional traffic. Rail traffic density in Central Africa is only a fraction of that found in southern
Africa and North Africa (figure 2.8). With the exception of Camrail—which is one of the most used
networks in Sub-Saharan Africa—Central African railways are serving well under 1 million traffic units
per year. By global as well as by African standards, these kinds of traffic volumes are little more than
what might be carried by a moderately busy branch line. Moreover, such low traffic volumes do not
generate the revenue needed to finance track rehabilitation and upgrading.
Before contemplating further extensions to the rail network, a turnaround in the performance of
existing railways is sorely needed to regain competitiveness with road transport. While most railways are
generally able to carry bulk minerals competitively, they must also offer a reasonable level of service for
general freight if they are to compete with roads without offering a significant price discount. In general,
freight markets in Africa require reliable rather than high-speed services; a two-day trip of 1,200 km, to
average out at a commercial speed (including en-route stops) of 25 kmph, does not require a maximum
South Sudan

ECCAS’S INFRASTRUCTURE: A REGIONAL PERSPECTIVE
20
speed of much more than 60 kmph. It does, however, require that infrastructure and rolling stock be
maintained ―fit for purpose,‖ that en-route stops do not disrupt schedules, and that commercial
arrangements ensure agreed rolling-stock turnarounds (often a limiting factor for small railways).
Figure 2.8. Traffic densities on African railways
Source: Bullock 2009.
Note: Density is normally expressed as traffic units per route-km. The traffic units carried by a railway are the sum of the passenger-km and the net tonne-km.
The railways in Cameroon and Gabon, as well as the CFM line in Angola, perform relatively well and
have good productivity indicators. Cameroon implemented one of the earliest rail concessions in the
region—Camrail—followed by a concession of railways in Gabon. The concession arrangements for
these two railways have helped to boost operational efficiency and thus traffic, so that labor and rolling-
stock productivity measures are better than for the region’s major publicly owned railways and compare
favorably with other rail concessions in the region (table 2.4). Camrail is carrying about 60 percent of
nonmineral traffic from Douala toward the borders with Cameroon and Chad, and it also compares
favorably with competing bus services on the route from Yaoundé to Ngaoundere, for which travel by
unpaved road becomes difficult in the rainy season.
By contrast, the railways in the Democratic Republic of Congo and the Republic of Congo have very
poor performance indicators. Angola’s northern Benguela railway has fallen completely into disuse,
though it is now in the process of being rehabilitated. These rail lines’ poor quality of service makes it
increasingly difficult for them to compete with roads. Poor maintenance over extended periods of time
has caused the deterioration of many sections of the track beyond repair and has resulted in a loss of
competitiveness and rolling-stock productivity. While such inefficiencies can be tolerated on low-volume
feeder lines, and may be the only way some can be viably operated, they are a major handicap when
competing against the modern roads being constructed along major corridors.
0.0
1.0
2.0
3.0
4.0
5.0
Co
ngo
, Dem
Rep
, SN
CC
Co
ngo
, Re
p, C
FCO
An
gola
, CFB
An
gola
, CFL
An
gola
, CFM
Gab
on
, SET
RA
G
Cen
tral
Afr
ica
Cam
ero
on
, CA
MR
AIL
Wes
t A
fric
a
Sou
ther
n A
fric
a
No
rth
Afr
ica
Mill
ion
Traf
fic U
nits
per
rout
e km

ECCAS’S INFRASTRUCTURE: A REGIONAL PERSPECTIVE
21
Table 2.4. Performance compared across Central African railways, 2005
Labor
productivity Carriage
productivity Locomotive productivity
Wagon productivity
Freight yield Passenger
yield
Angola, CFM 580 4,045 30 950
Cameroon, CAMRAIL 603 4,738 26 868 5 2
Congo, Dem. Rep. of, CFMK 18 64 10 257 14 4
Congo, Dem. Rep. of, SNCC 38 275 4 317 13 3
Congo, CFCO 221 3,212 27 300 11 6
Gabon, SETRAG 1,778 1,891 39 902
Rail concessions 350 2,945 23 491 5 2
Source: AICD railways database.
Note: Labor productivity = ‗000s traffic units per employee; locomotive productivity = millions of traffic units per locomotive; carriage productivity = ‗000s passenger-km per carriage; wagon productivity = ‗000s net tonne-km per wagon.
Ports
Central Africa has numerous ports, of which the two most significant ones are Douala and Pointe-Noire.
Douala is the most important port from a regional perspective, since it handles transit traffic for the
Central African Republic and Chad. Pointe-Noire is one of the best natural deepsea ports in Africa, and
once played an important role in the region prior to the civil conflict affecting the Republic of Congo. But
since that time, the quality of the country’s road and rail surface transport links has deteriorated markedly,
preventing cargo from being channeled into Pointe-Noire. In the meantime, neighboring Gabon has
developed its own integrated rail and port infrastructure, diverting traffic that would previously have gone
to Pointe-Noire. The Democratic Republic of Congo, with its very limited coastline, lacks a natural
deepsea port and could benefit from access to Pointe-Noire. But the absence of well-functioning surface
transport systems prevents this connection, and the Democratic Republic of Congo continues to rely on
the rather limited Matadi port as it explores the development of the port of Banana to accommodate larger
vessels. The possible development of a road-rail bridge linking Kinshasa to Brazzaville, as well as
planned improvements to road and rail infrastructure on the Brazzaville to Pointe-Noire corridor, could
potentially change this picture. Improvements to river navigability on the Congo Basin could also
potentially open up the route from Brazzaville to Bangui. But all this is still some years away.
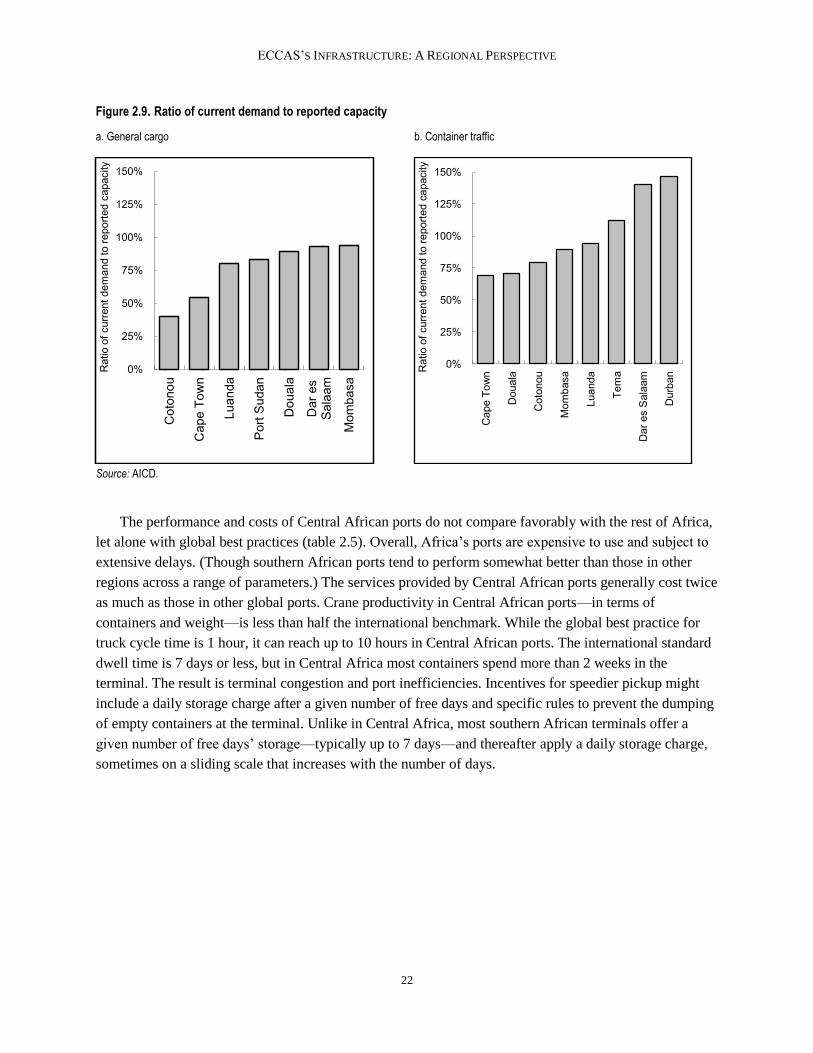
Even though systematic data for the growth of containerized and cargo traffic in Central African ports
are not available, a number of indicators point to capacity constraints (figure 2.9). This is most notable in
the cases of Douala (Cameroon) and Luanda (Angola), where the general-cargo traffic handled
significantly exceeds design capacity. The port of Luanda (Angola) is also experiencing capacity
constraints with respect to container traffic. There is some scope for easing capacity constraints by
improving the efficiency of port performance although, ultimately, new investments will be required.
ECCAS’S INFRASTRUCTURE: A REGIONAL PERSPECTIVE
22
Figure 2.9. Ratio of current demand to reported capacity
a. General cargo b. Container traffic
Source: AICD.
The performance and costs of Central African ports do not compare favorably with the rest of Africa,
let alone with global best practices (table 2.5). Overall, Africa’s ports are expensive to use and subject to
extensive delays. (Though southern African ports tend to perform somewhat better than those in other
regions across a range of parameters.) The services provided by Central African ports generally cost twice
as much as those in other global ports. Crane productivity in Central African ports—in terms of
containers and weight—is less than half the international benchmark. While the global best practice for
truck cycle time is 1 hour, it can reach up to 10 hours in Central African ports. The international standard
dwell time is 7 days or less, but in Central Africa most containers spend more than 2 weeks in the
terminal. The result is terminal congestion and port inefficiencies. Incentives for speedier pickup might
include a daily storage charge after a given number of free days and specific rules to prevent the dumping
of empty containers at the terminal. Unlike in Central Africa, most southern African terminals offer a
given number of free days’ storage—typically up to 7 days—and thereafter apply a daily storage charge,
sometimes on a sliding scale that increases with the number of days.
0%
25%
50%
75%
100%
125%
150%C
oton
ou
Cap
e To
wn
Luan
da
Por
t Sud
an
Dou
ala
Dar
es
Sal
aam
Mom
basa
Rat
io o
f cur
rent
dem
and
to re
porte
d ca
paci
ty
0%
25%
50%
75%
100%
125%
150%
Cap
e To
wn
Dou
ala
Cot
onou
Mom
basa
Luan
da
Tem
a
Dar
es
Sal
aam
Dur
banR
atio
of c
urre
nt d
eman
d to
repo
rted
capa
city

ECCAS’S INFRASTRUCTURE: A REGIONAL PERSPECTIVE
23
Table 2.5. Port performance compared across African regions
East Africa Southern Africa Central/ West
Africa Global best practices
Performance
Container dwell time (days) 5–28 4–8 11–30 <7
Truck-processing time (hours) 4–24 2–12 6–24 1
Crane productivity (containers per hour) 8–20 8–22 7–20 20–30
Crane productivity (tonnes per hour) 8–25 10–25 7–15 >30
Charges
Container handling (US$ per TEU) 135–275 110–243 100–320 80–150
General cargo handling (US$ per tonne) 6–15 11–15 8–15 7–9
Source: AICD Ports database.
Note: TEU = twenty-foot equivalent unit.
Individual port performance varies significantly across ECCAS countries (table 2.6). But even the
best performers do not measure up to good global performance standards. Container dwell times are
particularly high, around 25 days in Matadi in the Democratic Republic of Congo. Container dwell time is
between 10 and 25 days, significantly worse than the global benchmark of 4 to 8 days. Truck-processing
times are also relatively high in ECCAS’s ports. In Matadi it takes as many as 18 hours for truck
processing. Douala, which is considered one of the better performers in ECCAS, records a high crane
productivity of 18.5 containers an hour—but this is only around 60 percent of global productivity
standards. Prices are also exorbitant in most ports in ECCAS. The ports of Luanda and Owendo, for
example, are among the most expensive in Africa, charging $320 per twenty-foot equivalent unit (TEU).
Douala, which is one of the most used ports in Central Africa, charges $220 per TEU. General cargo
handling is around $16 per tonne in Owendo, about twice the global benchmark. Douala and Pointe-Noire
charge $5.50 to $6.50 per tonne, which is consistent with global good standards.
Table 2.6. Performance compared across West African ports
Luanda (Angola)
Douala (Cameroon)
Matadi (Congo,
Dem. Rep. of)
Owendo (Gabon)
Pointe-Noire (Congo, Rep.
of)
Container dwell time (days) 12 12 25 10 18
Truck-processing time (hours) 14 12 18 12
Container crane productivity (containers per hour) 6.5 18.5 6.5 6.5
Container-cargo-handling charge (US$ per TEU) 320 220 120 340 140
General-cargo-handling charge (US$ per tonne) 8.5 6.5 10 16 5.5
Source: AICD ports database.
Note: TEU = twenty-foot equivalent unit.

ECCAS’S INFRASTRUCTURE: A REGIONAL PERSPECTIVE
24
Air transport
Air transport connectivity among the various members of ECCAS is strikingly absent (figure 2.10). While
there is some air transport connectivity within the CEMAC region and between the Democratic Republic
of Congo and Angola, there is complete lack of connectivity between the CEMAC-only members and
members that also form a part of ECCAS (the Democratic Republic of Congo and Angola).
Figure 2.10. ECCAS’s regional airports and air traffic flows
Source: AICD.
Viewed from a continental perspective, there is a lack of strong regional air transportation hubs in the
ECCAS region. The map of the top 60 intracontinental routes in Africa serves to highlight the main traffic
patterns across the continent (figure 2.11). While none of Sub-Saharan Africa’s airports (with the possible
exception of Johannesburg) move enough traffic to be considered global air transport hubs, a number of
regional air transport hubs have emerged over the past decade. On the eastern and southern side of the
continent, a strong hub-and-spoke structure is centered on Johannesburg, and, to a lesser extent, Nairobi
South Sudan

ECCAS’S INFRASTRUCTURE: A REGIONAL PERSPECTIVE
25
and Addis Ababa. Central Africa hardly features in the top 60 routes. The hub-and-spoke structure found
in other regional economic communities is noticeably absent in ECCAS, complicating air transport both
within the ECCAS region and between Central Africa and the rest of the continent.
Relative to other regions,
Central Africa’s air transport
market is extremely small.
CEMAC is the smallest air
transport market in Africa,
followed by ECCAS. These
two regions also have the
continent’s lowest number of
seats available per capita.
The annual number of seats
flown in the region is one-
thirteenth that of southern
Africa, which is Africa’s
largest transport market. The
number of domestic and
international city pairs served
is also the continent’s
smallest. West Africa serves
double the domestic city
pairs and southern Africa
serves four times the
domestic city pairs of Central Africa. The seat-km flown on older aircrafts is 43 percent of the total,
significantly worse than in other regions of Africa.
The semblance of a regional air transport market can be found around Douala. The strongest route in
Central Africa is between Cameroon and Gabon. There is very little traffic headed for the Central African
Republic and no traffic figures available for Chad. Most CEMAC members are able to connect with one
another through Cameroon. Libreville also offers some connectivity within the regional economic
community, although to a much lesser extent. ECCAS as a whole, however, lacks a regional transport
market because the Democratic Republic of Congo and Angola are completely isolated from the rest of
CEMAC.
Figure 2.11. International routes within Sub-Saharan Africa for 2007
Source: Bofinger 2009.

ECCAS’S INFRASTRUCTURE: A REGIONAL PERSPECTIVE
26
Table 2.7. Benchmarking air transport in ECOWAS and other regional economic communities
ECOWAS CEMAC EAC SADC
Annual seats, domestic (‗000s) 2,034 235 1,345 3,076
Annual seats, international within Sub-Saharan Africa (‗000s) 362 187 1,196 964
Domestic city pairs served (number) 8 4 13 17
International city pairs served (number) 20 15 29 26
Seat-km in old aircraft (% of total) 43 30 33 29
Seat-km in recent aircraft (% of total) 57 70 67 71
Domestic market Herfindahl Index 0.84 0.83 0.64 0.73
International market Herfindahl Index 0.19 0.24 0.25 0.34
Market Herfindahl Index (domestic and international) 0.21 0.30 0.27 0.42
Source: AICD database.
Note: ECOWAS = Economic Community of West African States; CEMAC = Economic and Monetary Community of Central Africa; EAC = East African Community; SADC = Southern African Development Community. The SADC aggregates include South Africa and Tanzania and the EAC includes Tanzania, which are not a part of COMESA.
Air transport connectivity in Central Africa has fallen steadily since 2001. This overall pattern is
consistent with air transport connectivity in ECCAS and CEMAC, which have both fallen, albeit at
different rates (figure 2.12). The air transport connectivity for ECCAS in 2007 was only 40 percent of the
connectivity of 2001 and the number of seats in 2007 only a little over 600,000. In CEMAC the air
transport connectivity in 2007 was only 30 percent of the connectivity in 2001. The total number of seats
in 2007 was a little over 300,000, compared with almost a million in 2001.
Figure 2.12. Seats for intra-REC travel within ECCAS and CEMAC
a. ECCAS b. CEMAC
Source: Derived from Bofinger 2009.
Note: REC = regional economic community; CEMAC = Economic and Monetary Community of Central Africa.
0
500,000
1,000,000
1,500,000
2,000,000
2001 2004 2007
0
500,000
1,000,000
1,500,000
2,000,000
2001 2004 2007

ECCAS’S INFRASTRUCTURE: A REGIONAL PERSPECTIVE
27
The loss in the total estimated seats between 2001 and 2007 can be largely attributed to the collapse
of Cameroon Airlines and Air Gabon. The collapse of Air Afrique also had an impact.
Domestic connectivity is largely absent in the CEMAC countries, except for Cameroon and Gabon.
Looking at the broader ECCAS grouping, Angola and the Democratic Republic of Congo are connected
to a modest number of city pairs. The absence of domestic city pairs in CEMAC may simply be because
the countries are physically small, but it more generally reflects low traffic volumes and limited
purchasing power in the domestic market. This makes it difficult for air transport to compete with surface
transport alternatives, such as roads. International city pairs are also relatively few in number. The Central
African Republic connects to two international city pairs and Burundi and São Tomé and Príncipe
connect to four. All countries have at least one intercontinental city pair (table 2.8).
Table 2.8. Domestic, international, and intercontinental city pairs, 2007 (number)
Total city pairs Intercontinental city pairs International city pairs Domestic city pairs
Angola 42 9 12 21
Burundi 5 1 4
Cameroon 28 8 17 3
Central African Republic 3 1 2
Chad 8 1 7
Congo, Rep. of 22 2 19 1
Congo, Dem. Rep. of 49 3 21 25
Equatorial Guinea 19 4 14 1
Gabon 22 1 12 9
São Tomé and Príncipe 5 1 4
Source: Bofinger 2009.
By and large, each country in CEMAC has one daily connection with Cameroon. Gabon and
Cameroon have the strongest connectivity in the regional economic community with 18 flights daily. The
origin-destination matrix for the ECCAS countries shows the minimal levels of air connectivity that are
prevalent in the region. It is also striking that connections between the CEMAC countries and the rest of
ECCAS barely exist. For example, Angola is connected with the Democratic Republic of Congo,
Equatorial Guinea, and São Tomé and Príncipe with at least one daily flight. But Angola does not have
any air transport connectivity with the rest of the CEMAC member countries. The Democratic Republic
of Congo’s only connection with CEMAC is a single daily flight to Cameroon and three flights to
Equatorial Guinea, and São Tomé and Príncipe’s connectivity with CEMAC is with Gabon.

ECCAS’S INFRASTRUCTURE: A REGIONAL PERSPECTIVE
28
Beyond basic connectivity, it is also
important to evaluate the convenience
and velocity of air travel. Cameroon and
Gabon have the greatest frequency of
flights, both direct and indirect.
Cameroon serves as a hub for the
CEMAC countries. São Tomé and
Príncipe and the Central African
Republic have three or fewer direct
flights per week. Lower velocity of air
travel is associated with lengthy travel
times (table 2.10b). The flights
originating from the Central African
Republic to Equatorial Guinea and from
São Tomé and Príncipe to Gabon have
low velocities, implying that passengers
spend a longer amount of travel time, in part due to waiting for connecting flights.
Table 2.10. Proportion of direct flights and speed of air service in East Africa
a. Directness of service b. Speed of service
All flights Direct flights
Angola 6 4
Cameroon 24 23
Central African Republic
1 1
Congo, Dem. Rep. of
4 3
Equatorial Guinea 9 4
Gabon 24 22
São Tomé and Príncipe
3 3
Destination
Ang
ola
Cam
eroo
n
Cen
tral
Afr
ican
Rep
ublic
Con
go, D
em.
Rep
. of
Equ
ator
ial
Gui
nea
Gab
on
São
Tom
é an
d
Prí
ncip
e
Orig
in
Angola 443 559
Cameroon
Central African Republic 559 230 348 402
Congo, Dem. Rep. of 559
Equatorial Guinea 646 514
Gabon 436 348 533 204
São Tomé and Príncipe 392 143
Source: Bofinger 2009.
CEMAC’s air transport market is considered among the most liberalized in Africa, though minor
restrictions remain. By instituting free pricing and lifting capacity and frequency restraints, the region has
made significant progress toward implementing the Yamoussoukro Decision (YD). Specifically, the
number of flights flown under fifth-freedom arrangements (that is, by carriers that are not registered either
in the origin or destination country) is on the rise. This progress puts the CEMAC region ahead of most of
east and southern Africa.
Table 2.9. All flights within ECCAS, one week in November 2007
Destination
Ang
ola
Cam
eroo
n
Cen
tral
Afr
ican
Rep
ublic
Con
go ,
Dem
. Rep
. of
Equ
ator
ial G
uine
a
Gab
on
São
Tom
é an
d P
rínc
ipe
Orig
in
Angola 1 4 1
Cameroon 1 1 3 19
Central African Republic 1
Congo, Dem. Rep. of 1 3
Equatorial Guinea 2 3 2 2
Gabon 18 4 2
São Tomé and Príncipe 1 2

ECCAS’S INFRASTRUCTURE: A REGIONAL PERSPECTIVE
29
The structure of the regional air transport market has altered significantly since 2001 with the collapse
of regional players and the emergence of new carriers (table 2.12). As of 2007 the regional air transport
market comprised three major carriers—Air Service, Hewa Bora Airlines, and TAAG Angola Airlines—
which together accounted for 65 percent of the regional market. Other carriers—Trans Air Congo,
Ethiopian Airlines, and Star Equatorial Airlines—comprised a further 25 percent of the market. Ethiopian
Airways is a growing presence in the region. The situation in 2007 was a complete turnaround from 2001,
when the three major carriers—Air Afrique, Air Gabon, and Cameroon Airlines—accounted for over 70
percent of the market. European carriers such as Air France, Swiss Air, or Brussels Air SN that were
present in 2001 had largely disappeared by 2007.
Table 2.11. Measuring progress toward implementation of the Yamassoukro Declaration
Community General status of YD implementation Status of air services liberalization Overall implementation score
Arab Maghreb Union No implementation. No liberalization within the Arab Maghreb Union initiated, but need is recognized.
1
Banjul Accord Group Principles of the YD agreed upon in a multilateral air services agreement.
Up to fifth freedom granted, tariffs are free, and capacity/frequency is open.
4
Economic and Monetary Community of Central Africa
Principles of the YD agreed upon in an air transport program. Some minor restrictions remain.
Up to fifth freedom granted, tariffs are free, and capacity/frequency is open. Maximum two carriers per state may take part.
5
Common Market for Eastern and Southern Africa
Full liberalization agreed upon (―legal notice no. 2‖), but application and implementation remain pending until a joint competition authority is established.
Pending. Operators will be able to serve any destination (all freedoms), and tariffs and capacity/frequency will be free.
3
East African Community
The EAC council issued a directive to amend bilaterals among the EAC states to conform with the YD.
Air services are not liberalized, as the amendments of bilaterals remain pending.
3
Southern African Development Community
No steps taken toward implementation, although the civil aviation policy includes gradual liberalization of air services within the SADC.
No liberalization has been initiated. 2
West African Economic and Monetary Union
The YD is fully implemented. All freedoms, including cabotage, granted. Tariffs have been liberalized.
5
Source: Bofinger 2009.

ECCAS’S INFRASTRUCTURE: A REGIONAL PERSPECTIVE
30
No countries in ECCAS have made progress
toward achieving international standards in air
safety, making this an area ripe for further
regional collaboration. In some cases, problems
with air transport safety have been an
undesirable consequence of market
liberalization (figure 2.13). Regional
cooperation could help to improve oversight and
safety by pooling scarce human resources and
increasing regulatory independence—a process
that is under way. With support from France,
CEMAC member countries already belong to
the Agence pour la Sécurité de la Navigation
Aérienne en Afrique et à Madagascar
(ASECNA), which provides air traffic safety
services. There is scope to broaden and deepen
this kind of collaborative arrangement. A
Cooperative Development of Operational Safety
and Continuing Airworthiness Project (COSCAP) has been planned for the CEMAC region.
An important factor of air safety is the vintage of the airline fleet. Unlike in southern Africa and other
regions, the Central African airline fleet was not significantly renewed between 2001 and 2007. Here, the
percentage of the airline fleet classified as ―Western old‖ has remained relatively steady at 36–37 percent.
In fact, the number of planes classified as ―new‖ or ―somewhat new‖ decreased between 2001 and 2007
from 42 percent to 35 percent (figure 2.14).
Airport charges in the CEMAC region are extremely high by international standards—30 to 40
percent higher than the charges at Fraport in Frankfurt, a commonly used international benchmark. Gabon
and Cameroon, two CEMAC countries for which data are available, record extremely high airport
charges.
Box 2.1. Airport concession in Cameroon: A rare phenomenon in Africa
Few public-private partnerships (PPPs) have been implemented in Africa to improve the overall performance of the
airports. Cameroon is one of the few African countries with one such PPP, a 15-year joint management contract
involving shared risk between the public and private sector. The contract was comanaged by the Aéroports de Paris
(34 percent) and government of Cameroon (24 percent), along with other carriers and a bank, from 1993 to 2008; the
agreement covered 7 of Cameroon’s 14 airports.
Source: Bofinger 2009.
Table 2.12. Changes in market share of major regional carriers, 2001–07 (%)
Market share (%) 2001 2004 2007
Air Service 25.2
Hewa Bora Airways 0.6 22.9
TAAG Angola Airlines 10.2 12.4 16.9
Trans Air Congo (TAC) 1.5 8.9
Ethiopian Airlines 1.1 8.8
Star Equatorial Airlines 6.9
Cameroon Airlines 32.7 46.7
Air Gabon 24.6 32.4
Air Afrique 14.6
Market concentration measures
Concentration of top 3 71.9 91.5 65
Source: Bofinger 2009.

ECCAS’S INFRASTRUCTURE: A REGIONAL PERSPECTIVE
31
Figure 2.13. Status of African safety oversight, using several criteria
Source: Bofinger 2009.

ECCAS’S INFRASTRUCTURE: A REGIONAL PERSPECTIVE
32
Figure 2.14. Age distribution of airline fleet in the ECCAS region
2001 2007
Source: Bofinger 2009.
15%
15%
44%
26%
Western recentWestern somewhat recentWestern oldWestern age unkown
2%
28% 50%
20%
Western recent Western somewhat recent Western old
Western age unknown

3 Power
Few countries in Central Africa have developed significant national power grids. The only major regional
transmission link is that from the Inga site into the Southern Africa Power Pool (SAPP) via Zambia. The
formation of a regional grid is still some way away, and in contrast to some of theother regions, there
seem to be no firm plans for the routes of future regional power lines (figure 3.1). The region’s larger
power plants are concentrated in Cameroon, at the Inga site in the Democratic Republic of Congo, and in
northern Angola.
Figure 3.1. ECCAS’s regional power network and infrastructure
Source: AICD.
South Sudan

ECCAS’S INFRASTRUCTURE: A REGIONAL PERSPECTIVE
34
The power sector performance of the Economic and Monetary Community of Central Africa
(CEMAC) is weaker than other parts of Africa as measured by many criteria. Table 3.1 corroborates the
glaring absence of installed generation capacity in Central Africa. Southern Africa has seventeen times
the installed capacity of Central Africa, and West Africa seven times. The per capita generation capacity
in CEMAC, though better than East Africa, is much lower than southern and West Africa. The frequency
of power outages and the loss of value however, are not dramatically different than in West and East
Africa. Despite the lack of power generation, a relatively large share of the population has access to
power. Utility performance in the CEMAC region is particularly poor. Over 30 percent of the already
minimal generation is lost due to system outages. And, at less than 50 percent, cost-recovery rates are the
worst in Africa.
Table 3.1. Benchmarking power infrastructure and capacity, access, and utility performance
ECOWA
S CEMA
C COMES
A EAC SAD
C
Low-income
countries Middle-income
countries
Installed generation capacity (MW) 3,912 583 1,085 774 9,85
5 2,110 36,971
Net generation per capita, annual (kWh/capita/year) 171 147 114 82 1214 165 4,479
Outages, number, annually (number/year) 165 152 119 132 91 134 71
Outages, value lost, annually (% of sales) 7 5 7 8 2 5 2
Firms with own generator (% of firms) 54 51 43 56 19 33 18
Access (urban, % of population) 50 31 34 23 35 43 50
Growth in access of population to electricity, annual (%) 2 1 1 1 1 3 2
System losses (% of generation) 29 31 32 23 12 10
Cost recovery ratio, historical (%) 79 45 73 69 68 100 87
Total hidden costs (% of revenue) 159 107 102 65 4 544 0
Collection rate, reported by utility, electricity (% of billing) 71 93 93 94 89 91
WAPP CAPP EAP
P SAP
P
Average historic cost (US$/kWh) 0.21 0.49 0.19 0.14 ─ ─
Long-run marginal cost (US$/kWh) 0.18 0.09 0.12 0.07 ─ ─
Source: Eberhard and others 2008.
Note: CEMAC = Economic and Monetary Community of Central Africa; COMESA = Common Market for Eastern and Southern Africa; EAC = East African Community; ECOWAS = Economic Community of West African States; SADC = Southern African Development Community; kWh = kilowatt-hour; MW = megawatt; WAPP = West African Power Pool; EAPP = East African Power Pool (expanded to include the key Nile Basin trading partners Egypt, Ethiopia, and Sudan); CAPP = Central Africa Power Pool; SAPP = Southern African Power Pool.
The remainder of this section will focus on the Central African Power Pool (CAPP) countries. This is
because power sector issues in Central Africa are best analyzed in the context of regional trade
arrangements. For the purposes of this analysis, the CAPP is defined as including Cameroon, the Central
African Republic, Chad, the Republic of Congo, Equatorial Guinea, and Gabon.4 The CAPP will be
4 The Democratic Republic of Congo also belongs to the CAPP. But the AICD analysis does not allow for the same
country to belong to more than one regional power pool, and so the Democratic Republic of Congo was mapped to

ECCAS’S INFRASTRUCTURE: A REGIONAL PERSPECTIVE
35
benchmarked against other regional power pools, namely, the East African Power Pool (EAPP-NB,
expanded to include the key Nile Basin trading partners Egypt, Ethiopia, and Sudan) and the SAPP.
As of today, only 90 percent of the region’s effective power demand is being met. The baseline total
net demand for power in the CAPP was 10.7 terawatt-hours (TWh) in 2005, making it by far the smallest
power market in Sub-Saharan Africa. At the country level, between 7 and 11 percent of total power
demand is suppressed. In the Central African Republic, the Republic of Congo, and Gabon, frequent
outages suppress as much as 10 percent of demand. In Cameroon, where there are several power
generation plants, outages suppress demand by as much as 7 percent.
Power demand in the CAPP area is expected to almost double over the next decade. Taking into
account the need to fully satisfy existing demand for power—plus the anticipated expansion in market
demands driven by economic growth in commerce and industry, plus the need to provide additional
power to support the planned expansion of electrification from 35 percent to 53 percent of households —
it is estimated that power demand could reach 20.2 TWh by 2015. This would require the development of
4,400 megawatts (MW), or 2.5 times existing generation capacity (table 3.2). Over half the current
capacity—900 MW—needs to be refurbished.5
Table 3.2. Demand and suppressed demand in the CAPP
Total net demand
in 2005
% of suppressed demand as a total
of net demand
Market demand 2015
Social demand with national targets 2015
Total net demand 2015
CAPP 10.7 9 17.1 3.1 20.2
WAPP 31.3 42 69.6 24.8 94.3
SAPP 258.8 1 383 14 396.9
EAPP 100.6 1 144.8 24.2 169
Island states 1.1 5 1.6 1.5 3
Cameroon 3.4 7 5.2 1.2 6.4
Central African Republic 0.1 11 0.1 0.4 0.6
Chad 0.1 10 0.1 0.8 1
Congo, Rep. of 5.84 11 9.8 0.5 10.3
Equatorial Guinea 0.03 10 0.1 0.05 0.1
Gabon 1.2 11 1.7 0.1 1.8
Source: Rosnes and Vennemo 2009.
Note: WAPP = West African Power Pool; EAPP = East African Power Pool; CAPP = Central Africa Power Pool; SAPP = Southern African Power Pool.
Future power demand can be met by either expanding national production or by expanding cross-
border power trade within the CAPP. Two alternative scenarios will be considered in this report. The
the SAPP, where it already participates in regional trade. While this is a limitation, an additional scenario is
considered in which part of the Democratic Republic of Congo’s hydropower generation is sold into the CAPP. 5 These projections are based on economic growth forecasts prior to the onset of the global financial crisis of 2008.
On the assumption that the economic crisis could halve anticipated economic growth rates over this region, the
estimate of demand for 2015 is 2.25 TWh (or 9 percent), mostly due to decreases in demand in the Republic of
Congo (10 percent) and Cameroon (9 percent).

ECCAS’S INFRASTRUCTURE: A REGIONAL PERSPECTIVE
36
trade stagnation scenario assumes that no additional cross-border interconnectors will be built, so that
trade is constrained at the levels observed today, and countries are thus obliged to meet incremental
power demands solely through the development of their own domestic power sectors. For many CAPP
countries that lack significant energy resources of their own, this entails increased reliance on thermal
generation fueled by oil imports.
Alternatively, under the trade expansion scenario,
future regional power demand is met by the most cost-
effective energy resources available to the region as a
whole, and additional cross-border transmission
capacity is added wherever required to allow power to
flow from production to consumption locations.
Essentially, this scenario takes regional power trade to
its fullest economic potential, assuming that there are
no restrictions to cross-border exchange and that the
necessary infrastructure can be built wherever it is
required. Reality is likely to lie somewhere in between
the trade stagnation and trade expansion scenarios,
and in this sense the two scenarios serve to frame the
range of possible outcomes.
Deepening regional integration would save the
CAPP area $160 million in annual energy costs. Table
3.3 compares the cost of meeting growing regional
power demand over the next decade, depending on
whether the trade stagnation or trade expansion
scenarios are adopted. Overall, trade expansion
reduces the total annual cost of producing and
distributing power from $1.55 billion to $1.39 billion,
saving the region $160 million each year. Under the
trade expansion scenario, countries would have to
make larger investments in capital-intensive
hydropower generation of $62 million each year as
well as invest $39 million a year in the development
of cross-border transmission capacity. These higher
investments of $101 million a year are more than compensated by reduced variable costs of $255 million
a year, which are essentially the annual reduction in the fuel bill associated with reduced reliance on
thermal generating plants. The net savings are thus $160 million each year.
To make trade expansion possible, significant additional investments would be required. In particular,
Cameroon would need to develop 1,400 MW of additional hydropower capacity to be dedicated to
supplying export markets in neighboring countries. All countries in the CAPP region except the Central
African Republic would need to invest in developing a total of 1,662 MW of new cross-border
interconnectors to allow power to flow more readily around the region (table 3.4). The heaviest
Table 3.3. Annualized costs of system expansion in the CAPP, 2015 (million)
(Annualized cost millions $) Trade expansion
Trade stagnation
Generation
Investment cost 860 798
Refurbishment cost 48 53
Variable cost (fuel, O&M) 92 347
T&D and connection
Investment cost 292 253
- Cross-border 39 0
- Domestic 252 252
Refurbishment cost 28 28
Variable cost (existing capacity) 67 67
Total
Capital cost 1,227 1,131
- Investment cost 1,151 1,051
- Refurbishment cost 76 81
Variable cost 159 414
Total for CAPP 1,386 1,546
Total for EAPP 15 16
Total for SAPP 18.4 19.5
Total for WAPP 12.2 12.7
Island states 0.6 0.6
Source: Rosnes and Vennemo 2009. Note: EAPP = East African Power Pool; SAPP = Southern African Power Pool; WAPP = West African Power Pool; CAPP = Central Africa Power Pool; T&D = transmission and distribution; O&M = operation and maintenance.

ECCAS’S INFRASTRUCTURE: A REGIONAL PERSPECTIVE
37
transmission investments would need to be made in Cameroon and the Republic of Congo, which
compose 80 percent of the required cross-border investment.
The CAPP region as a whole would need to spend
around 2 percent of GDP to meet power needs, and
most countries stand to save money by deepening
regional trade (figure 3.2). For individual countries,
the impact of adopting trade can substantially
influence the burden of power sector development
needs on their national economies. Under trade
stagnation, the amount that countries need to spend to
meet their power sector needs varies. Gabon,
Cameroon, and Chad would have to spend between 1
and 2 percent of their GDP to meet their power needs,
while the Republic of Congo would have to spend as
much as 7.5 percent of its gross domestic product
(GDP). Under trade expansion, the pattern of spending shifts. Most countries would spend substantially
less to meet their power sector needs than under trade stagnation. Gabon and Chad would need to spend
less than 1 percent of their GDP to meet their power needs. Meanwhile, the burden of spending in the
Republic of Congo would decrease from over 7 percent to less than 5 percent of the GDP, benefitting the
most from trade. But the expenditure burden for Cameroon would increase substantially, reaching 3
percent of GDP. Under the trade expansion scenario, Cameroon becomes the main exporter of
hydropower in the region and has to bear the burden of additional investments to fulfill this role.
Figure 3.2. Regional spending needs as a percentage of GDP
Source: Derived from Rosnes and Vennemo 2009.
Note: GDP = gross domestic product.
012345678
Equatorial G
uinea
Gabon
Cam
eroon
Chad
Central A
frican R
ep
Congo R
ep.
Spe
ndin
g as
% o
f GD
P
Trade Expansion Trade Stagnation
Table 3.4. Additional infrastructure requirements for trade expansion (MW)
Cross-border transmission
Additional hydropower (MW)
Cameroon 831 1,383
Central Africa Republic 0 0
Chad 202
Congo, Rep. of 498 0
Equatorial Guinea 20 0
Gabon 111 0
Source: Rosnes and Vennemo 2009.
Note: MW = megawatt.

ECCAS’S INFRASTRUCTURE: A REGIONAL PERSPECTIVE
38
As of 2005 power trade flows in the CAPP region were minimal, at 1.8 TWh of exports and 0.1 TWh
of imports. These consisted of exports from the Democratic Republic of Congo to its neighbors, the
Central African Republic and the Republic of Congo.
Under trade stagnation, negligible amounts of power would be traded. All countries would have to
rely on domestic production for power generation. Therefore, the Republic of Congo, Chad, and Gabon
would all need to increase their production considerably, with new hydropower plants in the Republic of
Congo and Equatorial Guinea and a considerable increase in Heavy Fuel Oil -based generation in Gabon.
Under trade expansion, Cameroon would capitalize on its rich hydropower potential and export power
to all the countries in the CAPP except the Central African Republic, which would remain self-sufficient.
The resulting additional 1,450 MW of hydropower in Cameroon would support exports to Republic of
Congo, Chad, Gabon, and Equatorial Guinea (figure 3.3).
Figure 3.3. Simulated patterns of future power trade in the CAPP, 2015 (TWh)
Source: Rosnes and Vennemo 2009.
Note: CAPP = Central Africa Power Pool; TWh = terawatt-hour.
-10-8-6-4-20246
Cam
eroo
n
CA
R
Ch
ad
Co
ngo
Equ
atorial G
uin
ea
Gab
on
Net
Pow
er Im
ports
(TW
h)
Trade expansion Trade stagnation

ECCAS’S INFRASTRUCTURE: A REGIONAL PERSPECTIVE
39
Figure 3.4. Trade flows in the CAPP, 2015 (TWh)
a. Trade stagnation b. Trade expansion
Source: Rosnes and Vennemo 2009.
Note: CAPP = Central Africa Power Pool; TWh = terawatt-hour.
Under the trade expansion scenario, Cameroon would export around 80 percent of its domestic
consumption to several neighbors. Chad and Equatorial Guinea would find it more economic to import
100 percent of their power requirements from Cameroon than to generate power domestically. The
Republic of Congo would import around a third of its consumption from both Cameroon and the
Democratic Republic of Congo. Gabon would import around half of its consumption from Cameroon.
The Central African Republic would not be impacted by trade expansion as it is completely self-
sufficient.

ECCAS’S INFRASTRUCTURE: A REGIONAL PERSPECTIVE
40
Figure 3.5. Net imports as a share of domestic demand (%)
Source: Derived from Rosnes and Vennemo 2009.
Note: CAPP = Central Africa Power Pool; TWh = terawatt-hour.
When the Democratic Republic of Congo is mapped to the SAPP rather than the CAPP, the CAPP
relies primarily on Cameroon for cost-effective hydropower generation. Nevertheless, in reality, the
Democratic Republic of Congo could potentially supply the CAPP with some of the power to be
developed at the Inga site. Analysis suggests that with the development of 9,500 MW of additional
hydropower capacity under the Inga III and Grand Inga 1 projects, the Democratic Republic of Congo
could export as much as 52 TWh to the SAPP. Since demand growth in the CAPP region over the same
period is not projected to be much more than 10 TWh, a small share of the Democratic Republic of Congo
exports could be diverted northward to the CAPP, making a significant contribution to the power supply
in this area.
To illustrate the implications, a scenario in which the Democratic Republic of Congo exports 5 TWh
of power via the Republic of Congo into the CAPP is considered. These imports displace some 550 MW
of hydropower capacity for export in Cameroon and a further 300 MW of hydropower capacity for
domestic consumption in the Republic of Congo that would otherwise have been developed. But even
though imports from the Democratic Republic of Congo to the Republic of Congo replace imports from
Cameroon to some extent, they do not eliminate them. Congo still imports 1.3 TWh from Cameroon, and
Gabon still relies heavily on Cameroon. Allowing the Democratic Republic of Congo to export to the
CAPP provides overall annual savings of $220 million. Of this total, $180 million is from reduced
investment in generation capacity in the CAPP region, while the rest is due to lower operating costs and
fewer cross-border transmission investments. This, however, does not account for costs incurred in the
Democratic Republic of Congo.
-100-75-50-25
0255075
100
Cam
eroon
Central A
frican R
epublic
Chad
Congo, R
ep.
Equatorial G
uinea
GabonIm
ports
as
% o
f dom
estic
dem
and
Trade-expansion Trade-stagnation

ECCAS’S INFRASTRUCTURE: A REGIONAL PERSPECTIVE
41
Trade expansion significantly increases the weight of hydropower in the regional generation portfolio,
from 83 to 97 percent. Doing so spurs annual savings of some 4 million tonnes of carbon emissions. The
main impact of trade expansion would be to enable a shift away from thermal generation and relatively
dispersed small-scale hydropower, toward larger and more cost-effective hydropower resources that
would generate some 0.3 TWh of additional power (table 3.5). Other sources of power would also be
displaced, decreasing from 17 percent to 3 percent under trade expansion (figure 3.6). The savings in
carbon emissions is smaller than that projected in other regional power pools, where trade permits a much
larger volume of hydropower to be harnessed.
Figure 3.6. Power generation mix
a. Trade expansion b. Trade stagnation
Source: Derived from Rosnes and Vennemo 2009.
Table 3.5. Differences in electricity production and carbon dioxide emissions in trade expansion and stagnation
WAPP SAPP EAPP CAPP Total WAPP SAPP EAPP CAPP Total
Production difference (TWh) Emissions savings (millions of tonnes)
Coal –41.5 0.7 –40.8 –37.8 0.6 –37.2
Diesel –0.8 –0.3 0.3 –0.8 –0.6 –0.2 0.2 –0.6
Gas –9.2 –5.3 –42.4 –56.8 –4.7 –2.7 –21.5 –28.9
HFO 0.2 0.4 –4.9 –4.3 0.1 0.3 –3.6 –3.2
Hydro 11.5 47.5 43.4 5.1 107 0
Total 1.6 0.5 2.4 0.3 4.7 –5.2 –40.7 –20.4 –3.6 –69.9
Source: Derived from Rosnes and Vennemo 2009.
Note: WAPP = Western African Power Pool; SAPP = Southern African Power Pool; EAPP = East African Power Pool; CAPP = Central Africa Power Pool; TWh = terawatt-hour; HFO = heavy fuel oil
97
3
Hydro Other
83
17
Hydro Other

ECCAS’S INFRASTRUCTURE: A REGIONAL PERSPECTIVE
42
Table 3.6. Long-run marginal costs of power in the CAPP
(US cents/kWh) Trade expansion Trade stagnation Absolute differential Percentage differential
CAPP 7 9 –2 –22
EAPP 12 12 0 0
SAPP 6 7 –1 –14
WAPP 18 19 –1 –5
Cameroon 7 6 1 17
Central African Republic 11 11 0 0
Chad 7 11 –4 –36
Congo, Rep. of 6 8 –2 –25
Equatorial Guinea 8 10 –2 –20
Gabon 7 7 0 0
Source: Rosnes and Vennamo 2009
Note: CAPP = Central Africa Power Pool; SAPP = Southern African Power Pool; WAPP = West African Power Pool; EAPP = East African Power Pool; kWh = kilowatt-hour.
Power trade expansion would reduce the long-run marginal cost (LRMC) of power in the CAPP by
$0.02 per kilowatt-hour (kWh), or 22 percent overall. The savings accrued in the CAPP under trade
expansion are greater than all other power pools and promise substantial economic benefits to the region.
Given that power is a key production input to the economy, any reduction in the reference level of
power costs would have an important and positive effect in terms of productivity and competitiveness.
For the CAPP as a whole, trade expansion would reduce the LRMC of power from $0.09 to $0.07 per
kWh, a reduction of 22 percent (table 3.6).
The magnitude of power cost savings, however, varies across individual countries in the CAPP area
(table 3.6). Small countries that have traditionally relied on very expensive small-scale oil-based
generation have the most to gain from switching to the import of hydropower from Cameroon. In
particular, Chad, Equatorial Guinea, and Republic of Congo could save between $0.02 and $0.04 per
kWh, a percentage reduction in power costs of between 20 and 36 percent. Chad, which currently
produces power domestically at high costs, could save $0.04 per kWh and reduce costs of generating
power by as much as 36 percent under trade expansion. The Central African Republic and Gabon do not
accrue significant savings under trade. The Central African Republic continues to rely on domestic
sources for power. Cameroon, the major power exporter under trade expansion, would face an increase in
LRMCs due to the need to develop a much larger amount of power, and hence more expensive schemes
than those that would be strictly necessary to meet domestic demand alone.
The costs related to transmission grid expansion are about $310 million higher (since there are
additional investments in cross-border transmission lines). On the other hand, the annual costs of the
enlarged system (variable costs) in 2015 are $255 million lower.
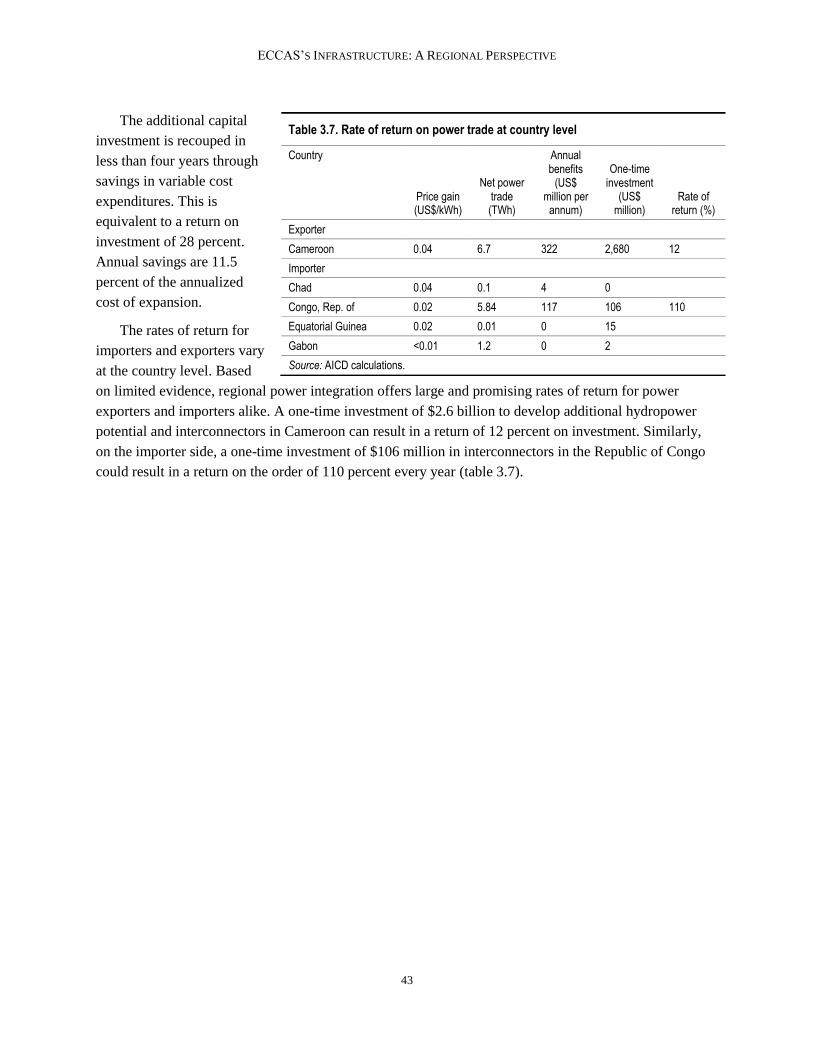
ECCAS’S INFRASTRUCTURE: A REGIONAL PERSPECTIVE
43
The additional capital
investment is recouped in
less than four years through
savings in variable cost
expenditures. This is
equivalent to a return on
investment of 28 percent.
Annual savings are 11.5
percent of the annualized
cost of expansion.
The rates of return for
importers and exporters vary
at the country level. Based
on limited evidence, regional power integration offers large and promising rates of return for power
exporters and importers alike. A one-time investment of $2.6 billion to develop additional hydropower
potential and interconnectors in Cameroon can result in a return of 12 percent on investment. Similarly,
on the importer side, a one-time investment of $106 million in interconnectors in the Republic of Congo
could result in a return on the order of 110 percent every year (table 3.7).
Table 3.7. Rate of return on power trade at country level
Country
Price gain (US$/kWh)
Net power trade (TWh)
Annual benefits
(US$ million per
annum)
One-time investment
(US$ million)
Rate of return (%)
Exporter
Cameroon 0.04 6.7 322 2,680 12
Importer
Chad 0.04 0.1 4 0
Congo, Rep. of 0.02 5.84 117 106 110
Equatorial Guinea 0.02 0.01 0 15
Gabon <0.01 1.2 0 2
Source: AICD calculations.

4 Information and communication technologies
The Economic Community of Central African States’ (ECCAS’s) information and communication
technology (ICT) backbone infrastructure is still in an incipient stage (figure 4.1). Compared with other
regional economic communities, the Economic and Monetary Community of Central Africa (CEMAC)
has the lowest access to Internet and voice services in all of Africa and faces very high prices for critical
ICT services. The level of broadband subscribers, at 0.01 per 100 inhabitants, is lower than all the other
regional economic communities. International bandwidth, at 11 bits per capita, is the same as the East
African Community (EAC) and lower than other regional economic communities, and the number of
mobile subscribers, at 22 per 100 inhabitants, is also relatively low. High tariffs may explain part of this
difference. Prices of ICT services are relatively high and in some cases are prohibitive. In particular, the
price of a prepaid mobile basket, at $15, is higher than all other regions. The price of a three-minute call
to the United States, at $5.68, is significantly higher (table 4.1).
Figure 4.1. ECCAS’s regional ICT network
Source: AICD.
South Sudan
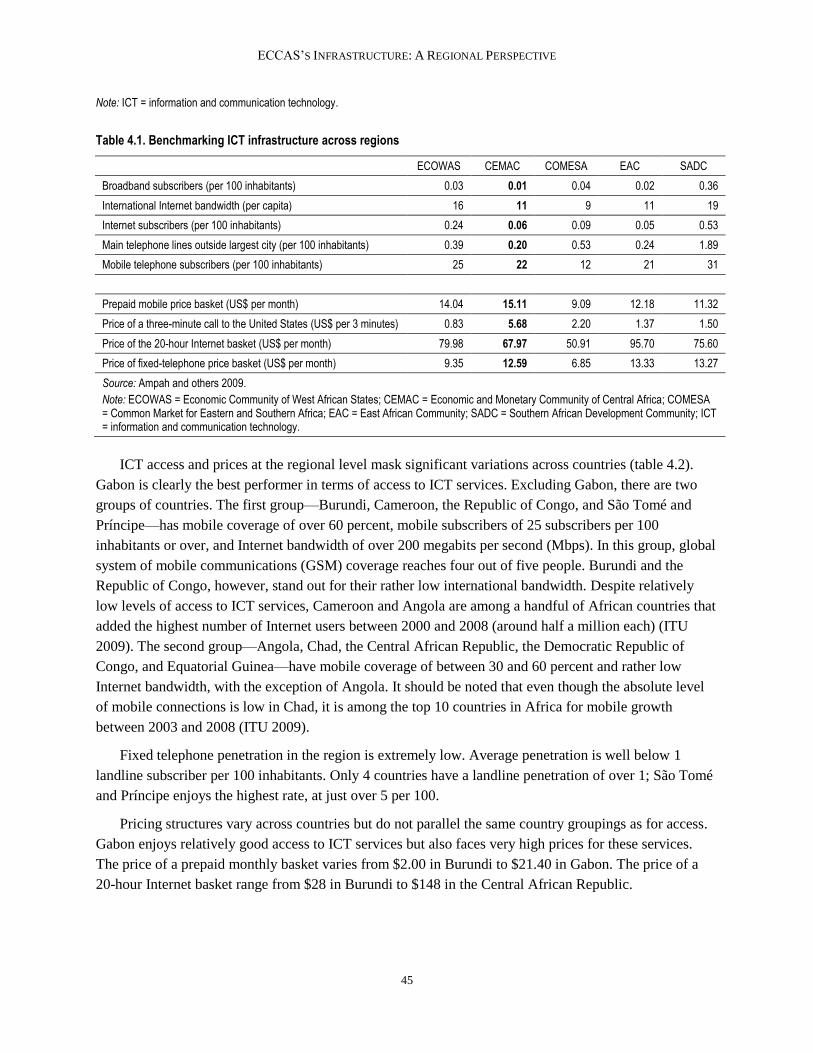
ECCAS’S INFRASTRUCTURE: A REGIONAL PERSPECTIVE
45
Note: ICT = information and communication technology.
Table 4.1. Benchmarking ICT infrastructure across regions
ECOWAS CEMAC COMESA EAC SADC
Broadband subscribers (per 100 inhabitants) 0.03 0.01 0.04 0.02 0.36
International Internet bandwidth (per capita) 16 11 9 11 19
Internet subscribers (per 100 inhabitants) 0.24 0.06 0.09 0.05 0.53
Main telephone lines outside largest city (per 100 inhabitants) 0.39 0.20 0.53 0.24 1.89
Mobile telephone subscribers (per 100 inhabitants) 25 22 12 21 31
Prepaid mobile price basket (US$ per month) 14.04 15.11 9.09 12.18 11.32
Price of a three-minute call to the United States (US$ per 3 minutes) 0.83 5.68 2.20 1.37 1.50
Price of the 20-hour Internet basket (US$ per month) 79.98 67.97 50.91 95.70 75.60
Price of fixed-telephone price basket (US$ per month) 9.35 12.59 6.85 13.33 13.27
Source: Ampah and others 2009.
Note: ECOWAS = Economic Community of West African States; CEMAC = Economic and Monetary Community of Central Africa; COMESA = Common Market for Eastern and Southern Africa; EAC = East African Community; SADC = Southern African Development Community; ICT = information and communication technology.
ICT access and prices at the regional level mask significant variations across countries (table 4.2).
Gabon is clearly the best performer in terms of access to ICT services. Excluding Gabon, there are two
groups of countries. The first group—Burundi, Cameroon, the Republic of Congo, and São Tomé and
Príncipe—has mobile coverage of over 60 percent, mobile subscribers of 25 subscribers per 100
inhabitants or over, and Internet bandwidth of over 200 megabits per second (Mbps). In this group, global
system of mobile communications (GSM) coverage reaches four out of five people. Burundi and the
Republic of Congo, however, stand out for their rather low international bandwidth. Despite relatively
low levels of access to ICT services, Cameroon and Angola are among a handful of African countries that
added the highest number of Internet users between 2000 and 2008 (around half a million each) (ITU
2009). The second group—Angola, Chad, the Central African Republic, the Democratic Republic of
Congo, and Equatorial Guinea—have mobile coverage of between 30 and 60 percent and rather low
Internet bandwidth, with the exception of Angola. It should be noted that even though the absolute level
of mobile connections is low in Chad, it is among the top 10 countries in Africa for mobile growth
between 2003 and 2008 (ITU 2009).
Fixed telephone penetration in the region is extremely low. Average penetration is well below 1
landline subscriber per 100 inhabitants. Only 4 countries have a landline penetration of over 1; São Tomé
and Príncipe enjoys the highest rate, at just over 5 per 100.
Pricing structures vary across countries but do not parallel the same country groupings as for access.
Gabon enjoys relatively good access to ICT services but also faces very high prices for these services.
The price of a prepaid monthly basket varies from $2.00 in Burundi to $21.40 in Gabon. The price of a
20-hour Internet basket range from $28 in Burundi to $148 in the Central African Republic.

ECCAS’S INFRASTRUCTURE: A REGIONAL PERSPECTIVE
46
Table 4.2. Benchmarking ICT across ECCAS member states
Access Ang
ola
Bur
undi
Cam
eroo
n
Cen
tral
Afr
ican
Rep
ublic
Cha
d
Con
go, D
em.
Rep
. of
Con
go, R
ep. o
f
Equ
ator
ial
Gui
nea
Gab
on
São
Tom
é an
d
Prí
ncip
e
Coverage of mobile network (% of population) 35 60 80 20 50 53 80 30 80 80
Mobile telephone subscribers (per 100 inhabitants) 22.3 3.2 24.5 6.8 8.5 8.9 35.4 43.4 87.9 19.4
Broadband subscribers (per 100 inhabitants) 0.07 0.002 0.039 0.25 0.19
Internet subscribers (per 100 inhabitants) 0.3 0.02 0.06 0.03 0.25 0.76 1.78
International Internet bandwidth (Mbps) 250 4 203 10 6 10 8 17 200 4
Prepaid mobile monthly basket (US$) 11.6 11.5 14.4 12.7 16 11.2 18.8 18.6 13.7 9.9
Price of a three-minute call to United States (US$) 3.7 2.4 0.6 14.4 12.5 1.2 2.4 2.3 3.8
Price of 20-hour Internet basket (US$) 63 52 28 148 105 93 85 35 40 53
Price of the fixed-line monthly phone basket (US$) 20.5 2.5 14.3 12.9 8.3 21.4 10.1
Source: Ampah and others 2009.
Note: Mbps = megabits per second; ICT = information and communication technology.
As far as fixed-line international calls are concerned, ECCAS is the only regional economic
community in Africa in which it is cheaper to call outside the community than within it. The average cost
of an international fixed-line call within ECCAS, at $1.06 per minute, is higher than calling outside
ECCAS, which costs about $0.86 per minute (figure 4.2). The cost of calling outside ECCAS is lower
than for any other regional economic community. The cost of an intra-ECCAS call varies from $0.51 in
the Democratic Republic of Congo to $2.41 in Equatorial Guinea. In Angola, the Democratic Republic of
Congo, Equatorial Guinea, and São Tomé and Príncipe, it is cheaper to call the United States than it is to
call within ECCAS. In Cameroon and the Central African Republic, it costs as much to call the United
States.

ECCAS’S INFRASTRUCTURE: A REGIONAL PERSPECTIVE
47
Figure 4.2. Price of a one-minute peak-rate call within and outside regional economic communities (US$ per minute)
Source: Ampah and others 2009.
Note: COMESA = Common Market for Eastern and Southern Africa; ECOWAS = Economic Community of West African States; SADC = Southern African Development Community; and ECCAS = Economic Community of Central African States.
Perhaps more relevant than fixed-line international calls are regional roaming arrangements for
mobile services, an area in which ECCAS has room to grow. Given that fixed-line services have largely
been overtaken by mobile services in Central Africa, the regional availability of roaming arrangements on
mobile tariffs is in many ways a much more relevant measure of the costs of internal communications.
Relative to other regional economic communities, ECCAS has made less progress in promoting
preferential roaming arrangements through special interoperator roaming arrangements. Neither Burundi
nor São Tomé and Príncipe offer roaming within the region. Only three countries offer roaming across the
other Central African countries (the Republic of Congo, the Democratic Republic of Congo, and Gabon).
Meanwhile, the special roaming plans (prepaid, no charge for incoming calls, preferential outgoing call
rates) that are available in other regions in Africa are not prevalent in Central Africa (table 4.3).
These roaming arrangements are helpful because subscribers who belong to one network can use their
mobile handsets in other countries, where they do not pay for incoming calls and are charged local rates
for outgoing calls. Prepaid users can also recharge their phones in the country where they are roaming.
Subscribers who are not a part of a specific network can still use their mobile phones in other ECCAS
countries as long as there is a roaming agreement with the operator in the country in which they are
roaming. Without such arrangements, users have to pay to receive incoming calls as well as pay a
surcharge on outgoing calls.

ECCAS’S INFRASTRUCTURE: A REGIONAL PERSPECTIVE
48
Table 4.3. GSM roaming in ECCAS
Ang
ola
Bur
undi
Cam
eroo
n
Cen
tral
Afr
ican
Rep
ublic
Cha
d
Con
go, R
ep. o
f
Con
go, D
em. R
ep. o
f
Equ
ator
ial G
uine
a
Gab
on
São
Tom
é an
d P
rínc
ipe
Angola X X X X X X
Burundi
Cameroon X X X X X X
Central African Republic X X X X X X X
Chad X X X X X
Congo, Rep. of X X X X X
Congo, Dem. Rep. of X X X X X X X
Equatorial Guinea X X X X X X X X
Gabon X X X X X X X
São Tomé and Príncipe
Source: Derived from Ampah and others 2009.
Note: P = preferential (cheaper tariffs and free incoming calls when using same group network—typically available for prepaid subscribers); X = available but with regulator roaming charges and typically limited to postpaid subscribers; GSM = global system for mobile communications.
A few large operators are beginning to develop a regional presence. All ECCAS countries allow
foreign investment in the telecommunications sector. Most countries have two to three foreign operators
(table 4.4). There are over a dozen different strategic investors in the region. Zain of Kuwait has the most
investments (four countries), followed by France Telecom (three countries). Incumbent operators are
partly privatized in three of the countries through sales to strategic investors in Equatorial Guinea (France
Telecom), Gabon (Maroc Telecom), and São Tomé and Príncipe (Portugal Telecom). France Telecom
once owned part of the incumbent in the Central African Republic but the status of this shareholding is
presently unclear. No shares in any telecommunications operator in the region are listed on local stock
exchanges.
Relative to other regions, Central Africa suffers from a lack of connectivity to submarine fiber-optic
cables. Only Angola, Cameroon, and Gabon have direct access to the undersea fiber-optic South Atlantic
2/West Africa Submarine Cable (SAT-2/WASC). This cable extends from Malaysia to South Africa and
then up the west coast of Africa to Portugal and Spain. At present, only three coastal ECCAS countries
have landing stations for SAT-3: Angola, Cameroon, and Gabon. The remaining coastal and landlocked
countries are bypassed at present—and also lack terrestrial fiber-optic connections with the regional
network, which would at least provide some form of indirect access.

ECCAS’S INFRASTRUCTURE: A REGIONAL PERSPECTIVE
49
A number of cables are planned for the region, including the Africa Coast to Europe (ACE) cable,
which would provide direct access to most of the region’s coastal nations.6 Several additional undersea
cables are also planned, so by the year 2012 Central Africa will likely be served by at least five submarine
cables (figure 4.3). For example, the planned ACE7, which will run from France to Gabon, is expected to
be operational by 2011. The 14,000-kilometer Main One cable system is expected to interconnect Africa
with Europe, the Americas, and Asia in 2010. The initial deployment will connect Portugal to Nigeria,
with a landing station in Ghana. After this is complete, the network will be expanded to connect South
Africa, Angola, Gabon, Senegal, the Democratic Republic of Congo, Côte d’Ivoire, and Morocco.8 The
equally long ACE submarine cable system will connect all countries along the west coast of Africa, from
Morocco to South Africa (more than 25 countries in Africa and western Europe). In November 2008, 17
operators signed a memorandum of understanding, and this cable is scheduled for launch in 2011.9 The
West African Cable System (WACS) will link Europe, West Africa, Central Africa, and South Africa.
The WACS consortium has 11 operators from 9 countries.10
Table 4.4. Foreign investors in ECCAS’s telecommunications sector
Country
Etis
alat
(U
AE
)
Fra
nce
Tel
ecom
Mill
icom
(Lu
xem
bour
g)
MT
C (
Zai
n, K
uwai
t)
MT
N (
Sou
th A
fric
a)
Ora
scom
(E
gypt
)
Por
tuga
l Tel
ecom
Oth
er
Tot
al
Note
Angola 25% 1
Burundi 100% * 3 Other = Econet (Zimbabwe); VTEL (UAE)
Cameroon 99.50% 70% 2
Central African Republic
* 100% 100% 3
Chad 88% 100% 2
Congo, Rep. of 90% 100% 76% 3 Other = Warid (UAE)
Congo, Dem. Rep. of 100% 99% * 4 Other = ZTE (China) (51%); Vodacom (South Africa) (51%)
Equatorial Guinea 40% * 2 Other = HiTs (Saudi Arabia)
Gabon * 90% 51% 3 Other = Maroc Telecom
São Tomé and Príncipe
51% 1
Total 2 3 2 4 2 2 2 24
Source: Adapted from company reports.
Note: Status as of December 31, 2008. Percentages indicate size of shareholding. UAE = United Arab Emirates. * = Not available
6 http://www.francetelecom.com/en_EN/press/press_releases/att00012462/ACE_cable_Press_release-06092009.pdf. 7 http://www.orange.com/en_EN/press/press_releases/cp090609en.jsp. 8 http://www.mainonecable.com. 9 http://www.orange.com/en_EN/press/press_releases/cp090609en.jsp. 10 http://allafrica.com/stories/200910270242.html.

ECCAS’S INFRASTRUCTURE: A REGIONAL PERSPECTIVE
50
In order to benefit from these new projects, coastal countries need to establish an international
gateway to the submarine cable, while landlocked countries need to establish fiber-optic connectivity with
their coastal neighbors. Efforts are already under way. The first phase of the Central Africa Backbone
Project (CAB), involving Cameroon, the Central African Republic, and Chad, aims to improve regional
connectivity among the three countries by leveraging fiber-optic cables laid along the Chad-Cameroon oil
pipeline. Burundi is building a national backbone with World Bank assistance that will have two
international exits via Rwanda and Tanzania to connect to East African submarine cable systems.11
The arrival of new submarine infrastructure could be expected to reduce consumer charges for the
Internet and other international communications, both by providing access to lower-cost technology and
by increasing competition in its supply. The costs of critical ICT services, including the cost of calling
within Africa, are lower in countries with access to the submarine cable (table 4.3). The cost of Internet
access is also cheaper by $20 per month on average. But even where submarine connections exist, costs
remain relatively high due to lack of competition across international gateways.
Access to the submarine
cable is a necessary but not
sufficient condition to lower
prices of critical ICT services.
Levels of competition and
access to competitive gateways
are key. Countries with
competitive international
gateways have significantly
cheaper rates to call within
Africa and to the United States
than those with monopolistic
international gateways. On average, those countries with competitive gateways are charged $0.30 less per
minute to call within Africa and $0.40 per minute to call the United States.
11 http://web.worldbank.org/external/projects/main?pagePK=64312881&piPK=64302848&theSitePK=40941&
Projectid=P094103.
Table 4.5. Prices of Internet and phone calls in Sub-Saharan Africa, with and without access to submarine cables
Price per minute for a call
within Sub-Saharan
Africa (US$)
Price per minute for a call
to the United States (US$)
Price for 20 hours of dial-up Internet access
per month (US$)
No access to submarine cable 1.34 0.86 67.95
Access to submarine cable 0.57 0.48 47.28
Monopoly international gateway 0.7 0.72 37.36
Competitive international gateway 0.48 0.23 36.62
Source: AICD calculations.

ECCAS’S INFRASTRUCTURE: A REGIONAL PERSPECTIVE
51
Countries have taken several steps to open up the
telecommunications sector to competition. Mobile virtual
network operators (MVNOs) have proved to be an effective
way to enhance commercial competition in a market. In
July 2008 Cameroon launched an MVNO under the brand
name Yemba (ITU 2009).
To attain full intraregional connectivity, ECCAS
member countries will have to install almost 5,000
kilometers (km) of new fiber-optic links. Achieving the
minimum levels of regional connectivity will require
investments in several countries. The levels of investment
required in each case are very modest in absolute terms
(table 4.6).
In addition to the interregional connectivity, Central
Africa combined with West African countries will have to spend $1 billion on intercontinental
connectivity (table 4.7). This investment—the largest required among regional economic communities—
is required for the installation of the Infinity, GLO-1, and WAFS. The bulk of it will be funded by the
private sector.
The benefits of completing the regional
integration of ICT networks would be
substantial in relation to the modest costs
involved. Experience from other African
countries suggests that connecting a
country to a submarine cable via a
competitive landing station can bring down
the costs of broadband Internet by as much
as 75 percent. Not only would this deliver
substantial savings to existing users of
broadband, but the price reduction could be
expected to induce additional uptake of
broadband services. Based on regional
experience, every 10 percent reduction in
broadband prices can be expected to bring
about a significant increase in broadband penetration. This makes regional integration a positive business
prospect for broadband service providers, since the revenue lost from existing customers is more than
compensated by the revenue gained from new customers.
Table 4.6. Gaps in intraregional connectivity and total investment required to attain minimum levels of regional connectivity
Country Gaps (km)
Necessary investment
(US$ million)
Angola 782 21
Burundi 90 2
Congo, Dem. Rep. of 1,781 48
Congo, Rep. of 425 12
Central Africa Republic 325 9
Gabon 1,418 38
Equatorial Guinea 89 2
Total 4,910 139
Source: AICD calculations .
Table 4.7. Intercontinental and intraregional spending needs for ECCAS over 10 years
Intercontinental connectivity
Projects Required annual
investment ($ millions)
East Africa EASSy, TEAMS 260
Southern Africa Infraco, SRII 510
Central Africa Infinity, GLO-1, WAFS
1,010 West Africa
Total, Sub-Saharan Africa 1,780
Source: Mayer and others 2009.
Note: EASSy = East African Submarine Cable System. ; TEAMS= The East Africa Marine System ; GLO1= Globacom 1 ; WAFS= West Africa Festooning System.

ECCAS’S INFRASTRUCTURE: A REGIONAL PERSPECTIVE
52
Figure 4.3. Proposed fiber-optic connectivity
Source: Mayer and others 2009.
Note: SAT-3 = South Atlantic 3; WACS = West African Cable System; SAFE = South Africa Far East; WACS = West African Cable System; GSM = global system of mobile communications; GLO1= Globacom 1; WACS= West Africa Cable System; SEACOM = South Africa–East Africa–South Asia fiber-optic cable; LION = Lower Indian Ocean Network; ACE = Africa Coast to Europe;
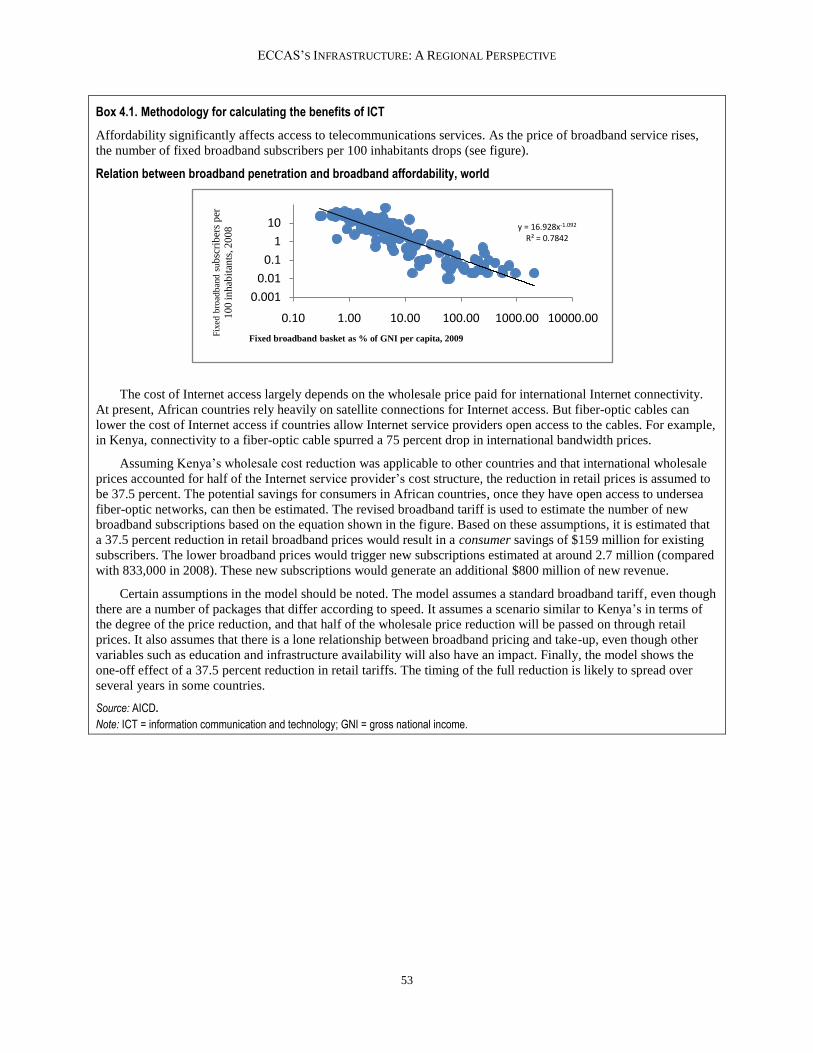
ECCAS’S INFRASTRUCTURE: A REGIONAL PERSPECTIVE
53
Box 4.1. Methodology for calculating the benefits of ICT
Affordability significantly affects access to telecommunications services. As the price of broadband service rises,
the number of fixed broadband subscribers per 100 inhabitants drops (see figure).
Relation between broadband penetration and broadband affordability, world
The cost of Internet access largely depends on the wholesale price paid for international Internet connectivity.
At present, African countries rely heavily on satellite connections for Internet access. But fiber-optic cables can
lower the cost of Internet access if countries allow Internet service providers open access to the cables. For example,
in Kenya, connectivity to a fiber-optic cable spurred a 75 percent drop in international bandwidth prices.
Assuming Kenya’s wholesale cost reduction was applicable to other countries and that international wholesale
prices accounted for half of the Internet service provider’s cost structure, the reduction in retail prices is assumed to
be 37.5 percent. The potential savings for consumers in African countries, once they have open access to undersea
fiber-optic networks, can then be estimated. The revised broadband tariff is used to estimate the number of new
broadband subscriptions based on the equation shown in the figure. Based on these assumptions, it is estimated that
a 37.5 percent reduction in retail broadband prices would result in a consumer savings of $159 million for existing
subscribers. The lower broadband prices would trigger new subscriptions estimated at around 2.7 million (compared
with 833,000 in 2008). These new subscriptions would generate an additional $800 million of new revenue.
Certain assumptions in the model should be noted. The model assumes a standard broadband tariff, even though
there are a number of packages that differ according to speed. It assumes a scenario similar to Kenya’s in terms of
the degree of the price reduction, and that half of the wholesale price reduction will be passed on through retail
prices. It also assumes that there is a lone relationship between broadband pricing and take-up, even though other
variables such as education and infrastructure availability will also have an impact. Finally, the model shows the
one-off effect of a 37.5 percent reduction in retail tariffs. The timing of the full reduction is likely to spread over
several years in some countries.
Source: AICD.
Note: ICT = information communication and technology; GNI = gross national income.
y = 16.928x-1.092
R² = 0.7842
0.001
0.01
0.1
1
10
0.10 1.00 10.00 100.00 1000.00 10000.00
Fix
ed b
road
ban
d s
ub
scri
ber
s p
er
10
0 in
hab
itan
ts, 2
00
8
Fixed broadband basket as % of GNI per capita, 2009

5 Regional infrastructure funding
Completing and maintaining Central Africa’s infrastructure backbone would entail sustained
spending of $1.8 billion a year over the course of a decade in the Economic Community of Central
African States (ECCAS). The preceding sections identified a number of key gaps. The basic regional
infrastructure package recommended would enable full regional power trade, a complete regional road
network, and fiber-optic links connecting all countries to submarine cables. To put this in perspective, the
total amount of infrastructure spending needed in the ECCAS region to fulfill both regional and national
infrastructure demands amounts to $2.4 billion a year. For the Economic and Monetary Community of
Central Africa (CEMAC) region, the total drops to $680 million annually, which is 29 percent of the total
spending needs for infrastructure.12
The amount of spending needed varies widely across countries and sectors. The country with the
highest spending need is the Democratic Republic of Congo, with Cameroon and the Republic of Congo
in a distant second and third place. Together, these three countries account for 80 percent of the total
regional spending needs. The Democratic Republic of Congo would need to spend $960 million annually
to meet the regional infrastructure targets, with about 80 percent related to export-oriented hydropower
development. Cameroon would need to spend $354 million annually to meet the regional spending needs
for infrastructure, of which over 80 percent is again related to export-oriented hydropower development.
The Republic of Congo would need to spend $140 million overall, mainly on regional road infrastructure
investments and maintenance.
Maintaining ECCAS’s regional backbones, once completed, would cost a significant $222 million a
year. Although the bulk of the regional infrastructure spending needs relate to new investment, there is
also a significant ongoing need for maintenance spending, most of it ($196 million) for the regional road
network.
The burden of regional spending as a percentage of gross domestic product (GDP) is 2 percent for
ECCAS and 1 percent for CEMAC. But these aggregates mask country variations (figure 5.1). The
ECCAS countries would need to spend between 1 and 14 percent of their GDP annually to meet regional
infrastructure requirements. The Democratic Republic of Congo and Central African Republic have the
highest needs in terms of GDP. The Democratic Republic of Congo would have to spend almost 14
percent of its GDP to fulfill regional investment needs. The Central African Republic would have to
spend over 5 percent. These levels of spending are far beyond what these small and fragile economies
could sustain, making it unlikely that they would be able to deliver their portion of the regional backbone
without external assistance. The other ECCAS countries—Chad, Cameroon, and Republic of Congo—
would need to spend 2 percent of their GDP annually on regional infrastructure requirements.
Regional spending needs at the country level look extraordinarily high relative to overall historic
spending on infrastructure. The ECCAS countries would need to devote around 28 to 198 percent of their
12 The total regional and national spending required for ECCAS infrastructure is not calculated, as data for Burundi
and Angola are not available at this time. The total spending for CEMAC and the Democratic Republic of Congo is
$1.641 billion a year, which is 68 percent of the total regional and national spending needs.

ECCAS’S INFRASTRUCTURE: A REGIONAL PERSPECTIVE
55
existing infrastructure budgets to fulfill regional spending requirements. The Democratic Republic of
Congo would have to spend an untenable 198 percent of its historic infrastructure budget on regional
infrastructure needs. Even the Republic of Congo, Cameroon, and Chad would need to spend 30 to 60
percent of their existing infrastructure spending on regional needs, which is not a very realistic
proposition.
Table 5.1. Regional spending needs by sector
Transport ICT Power Total Total needs ($ millions) Investment O&M Investment O&M Investment O&M Investment O&M
Cameroon 34 27 268 25 302 52 354
Central African Republic 44 18 1 0 45 18 63
Chad 74 22 74 22 96
Congo, Rep. of 13 13 1 0 15 29 13 140
Equatorial Guinea 0 0 1 1 0 1
Gabon 12 8 4 0 2 18 8 26
CEMAC 177 88 6 0 286 25 469 113 680
Angola 34 36 2 0 88 125 36 160
Burundi 1 3 0 0 1 2 3 6
Congo, Dem. Rep. of 139 69 5 0 748 892 69 961
ECCAS 352 196 13 1 1,123 25 1,488 222 1,808
Source: Derived from Carruthers and others 2009, Rosnes and Vennamo 2009 and Mayer and others 2009.
Note: O&M = operations and maintenance; ICT = information and communication technology; CEMAC = Economic and Monetary Community of Central Africa.
Figure 5.1. Spending on regional infrastructure as a share of GDP
Source: Derived from Carruthers and others 2009, Rosnes and Vennamo 2009 and Mayer and others 2009.
Note: GDP = gross domestic product.
0% 2% 4% 6% 8% 10% 12% 14% 16%
Equatorial Guinea
Gabon
Angola
Burundi
Chad
Cameroon
Congo Rep
Central African Rep
Congo DR
Spen
din
g n
eed
s f
or
regi
on
al in
fras
tru
ctu
re
as %
of
GD
P

ECCAS’S INFRASTRUCTURE: A REGIONAL PERSPECTIVE
56
Figure 5.2. Spending on regional infrastructure as a percentage of national infrastructure spending
Source: Derived from Carruthers and others 2009, Rosnes and Vennamo 2009 and Mayer and others 2009.
0% 50% 100% 150% 200% 250%
Congo Rep
Cameroon
Chad
Congo DR
Reg
ion
al in
fras
tru
ctu
re s
pen
din
g n
eed
s as
a %
of
exis
tin
g n
atio
nal
infr
astr
uct
ure
sp
end
ing

Bibliography
This country report draws upon a wide range of papers, databases, models, and maps that were
created as part of the Africa Infrastructure Country Diagnostic. All of these can be downloaded from the
project website: www.infrastructureafrica.org. For papers go to the document page
(http://www.infrastructureafrica.org/aicd/documents), for databases to the data page
(http://www.infrastructureafrica.org/aicd/tools/data), for models to the models page
(http://www.infrastructureafrica.org/aicd/tools/models), and for maps to the map page
(http://www.infrastructureafrica.org/aicd/tools/maps ). The references for the papers that were used to
compile this country report are provided below.
General
Africa’s Infrastructure: A Time for Transformation (AICD Web site), http://www.infrastructureafrica.org
Foster, Vivien, and Cecilia Briceño-Garmendia, eds. 2009. Africa’s Infrastructure: A Time for
Transformation. Paris and Washington, DC: Agence Française de Développement and World
Bank.
Financing
Briceño-Garmendia, Cecilia, Karlis Smits, and Vivien Foster. 2009. ―Financing Public Infrastructure in
Sub-Saharan Africa: Patterns and Emerging Issues.‖ AICD Background Paper 15, Africa Region,
World Bank, Washington, DC.
Growth
Calderón, César. 2009. ―Infrastructure and Growth in Africa,‖ Policy Research Working Paper 4914,
World Bank, Washington, DC.
Escribano, Alvaro, J. Luis Guasch, and Jorge Pena. 2010. ―Assessing the Impact of Infrastructure Quality
on Firm Productivity in Africa.‖ Policy Research Working Paper 5191, World Bank, Washington,
DC.
Yepes, Tito, Justin Pierce, and Vivien Foster. 2009. ―Making Sense of Africa’s Infrastructure
Endowment: A Benchmarking Approach.‖ Policy Research Working Paper 4912, World Bank,
Washington, DC.
Information and communication technologies
Ampah, Mavis, Daniel Camos, Cecilia Briceño-Garmendia, Michael Minges, Maria Shkratan, and Mark
Williams. 2009. ―Information and Communications Technology in Sub-Saharan Africa: A Sector
Review.‖ AICD Background Paper 10, Africa Region, World Bank, Washington, DC.

ECCAS’S INFRASTRUCTURE: A REGIONAL PERSPECTIVE
58
Mayer, Rebecca, Ken Figueredo, Mike Jensen, Tim Kelly, Richard Green, and Alvaro Federico Barra.
2009. ―Connecting the Continent: Costing the Needs for Spending on ICT Infrastructure in
Africa.‖ AICD Background Paper 3, Africa Region, World Bank, Washington, DC.
Irrigation
Svendsen, Mark, Mandy Ewing, and Siwa Msangi. 2008. ―Watermarks: Indicators of Irrigation Sector
Performance in Africa.‖ AICD Background Paper 4, Africa Region, World Bank, Washington,
DC.
You, L., C. Ringler, G. Nelson, U. Wood-Sichra, R. Robertson, S. Wood, G. Zhe, T. Zhu, and Y. Sun.
2009. ―Torrents and Trickles: Irrigation Spending Needs in Africa.‖ AICD Background Paper 9,
Africa Region, World Bank, Washington, DC.
Power
Eberhard, Anton, Vivien Foster, Cecilia Briceño-Garmendia, Fatimata Ouedraogo, Daniel Camos, and
Maria Shkaratan. 2008. ―Underpowered: The State of the Power Sector in Sub-Saharan Africa.‖
AICD Background Paper 6, Africa Region, World Bank, Washington, DC.
Foster, Vivien, and Jevgenijs Steinbuks. 2009. ―Paying the Price for Unreliable Power Supplies: In-House
Generation of Electricity by Firms in Africa.‖ Policy Research Working Paper 4913, World Bank,
Washington, DC.
Rosnes, Orvika, and Haakon Vennemo. 2009. ―Powering Up: Costing Power Infrastructure Spending
Needs in Sub-Saharan Africa.‖ AICD Background Paper 5, Africa Region, World Bank,
Washington, DC.
Transport
Bullock, Richard. 2009. ―Off Track: Sub-Saharan African Railways.‖ AICD Background Paper 17, Africa
Region, World Bank, Washington, DC.
Carruthers, Robin, Ranga Rajan Krishnamani, and Siobhan Murray. 2009. ―Improving Connectivity:
Investing in Transport Infrastructure in Sub-Saharan Africa.‖ AICD Background Paper 7, Africa
Region, World Bank, Washington, DC.
Gwilliam, Ken, Vivien Foster, Rodrigo Archondo-Callao, Cecilia Briceño-Garmendia, Alberto Nogales,
and Kavita Sethi. 2008. ―The Burden of Maintenance: Roads in Sub-Saharan Africa.‖ AICD
Background Paper 14, Africa Region, World Bank, Washington, DC.
Heinrich C. Bofinger. 2009. ―An Unsteady Course: Growth and Challenges in Africa’s Air Transport
Industry.‖ AICD Background Paper 16, Africa Region, World Bank, Washington, DC.
Kumar, Ajay, and Fanny Barrett. 2008. ―Stuck in Traffic: Urban Transport in Africa.‖ AICD Background
Paper 1, Africa Region, World Bank, Washington, DC.

ECCAS’S INFRASTRUCTURE: A REGIONAL PERSPECTIVE
59
Ocean Shipping Consultants, Inc. 2009. ―Beyond the Bottlenecks: Ports in Africa.‖ AICD Background
Paper 8, Africa Region, World Bank, Washington, DC.
Water supply and sanitation
Banerjee, Sudeshna, Vivien Foster, Yvonne Ying, Heather Skilling, and Quentin Wodon. ―Cost
Recovery, Equity, and Efficiency in Water Tariffs: Evidence from African Utilities.‖ AICD
Working Paper 7, World Bank, Washington, DC.
Banerjee, Sudeshna, Heather Skilling, Vivien Foster, Cecilia Briceño-Garmendia, Elvira Morella, and
Tarik Chfadi. 2008. ―Ebbing Water, Surging Deficits: Urban Water Supply in Sub-Saharan
Africa.‖ AICD Background Paper 12, Africa Region, World Bank, Washington, DC.
Gulyani, Sumila, Debabrata Talukdar, and Darby Jack. 2009. ―Poverty, Living Conditions, and
Infrastructure Access: A Comparison of Slums in Dakar, Johannesburg, and Nairobi.‖ AICD
Working Paper 10, World Bank, Washington, DC.
Keener, Sarah, Manuel Luengo, and Sudeshna Banerjee. 2009. ―Provision of Water to the Poor in Africa:
Experience with Water Standposts and the Informal Water Sector.‖ AICD Working Paper 13,
World Bank, Washington, DC.
Morella, Elvira, Vivien Foster, and Sudeshna Ghosh Banerjee. 2008. ―Climbing the Ladder: The State of
Sanitation in Sub-Saharan Africa.‖ AICD Background Paper 13, Africa Region, World Bank,
Washington, DC.
Other
Christ, Nannette, and Michael Ferrantino. 2009. ―The Effects of Cost, Time, and Uncertainty in Sub-
Saharan Africa.‖ Draft paper. U.S. International Trade Commission, Washington DC.
Arvis, Jean-Francois, Gael Raballand, and Jean-Francois Marteau 2009. ―The Cost of Being Landlocked:
Logistics Costs and Supply Chain Reliability.‖ World Bank Policy Research Working Paper
4258. Washington, DC.
International Telecommunications Union. 2009. ―Information Society Statistical Profiles 2009: Africa.‖
Geneva.
Teravaninthorn, Supee, and Raballand, Gael. 2009. Transport Prices and Costs in Africa: A Review of the
Main International Corridors. Washington, DC: World Bank.
USITC (United States International Trade Commission). 2009. ―Sub-Saharan Africa: Effects of
Infrastructure Conditions on Export Competitiveness.‖ Third Annual Report. April. Washington
DC.
World Bank 2007. CEMAC- Transport-Transit Facilitation Project. Project Appraisal Document. May 25,
2007. Washington DC.
World Bank 2008. Doing Business 2009: Comparing Regulation in 181 Economies. Washington DC.

About AICD
This study is a product of the Africa Infrastructure Country Diagnostic (AICD), a project designed to
expand the world’s knowledge of physical infrastructure in Africa. AICD provides a baseline against
which future improvements in infrastructure services can be measured, making it possible to monitor the
results achieved from donor support. It also offers a solid empirical foundation for prioritizing
investments and designing policy reforms in Africa’s infrastructure sectors.
The AICD is based on an unprecedented effort to collect detailed economic and technical data on African
infrastructure. The project has produced a series of original reports on public expenditure, spending
needs, and sector performance in each of the main infrastructure sectors, including energy, information
and communication technologies, irrigation, transport, and water and sanitation. Africa’s Infrastructure—
A Time for Transformation, published by the World Bank and the Agence Française de Développement in
November 2009, synthesized the most significant findings of those reports.
Reports on Africa’s for major regional economic communities (RECs) provide a snapshot of the state of
integration of infrastructure networks at the regional level. The focus of these reports is on benchmarking
infrastructure performance within and between RECs, gauging the benefits of regional integration,
identifying missing links, and quantifying the main financing gaps and their distribution across countries.
These reports are particularly relevant to national and regional policy makers and development partners
working on regional integration programs.
The AICD was commissioned by the Infrastructure Consortium for Africa following the 2005 G8 (Group
of Eight) summit at Gleneagles, Scotland, which flagged the importance of scaling up donor finance for
infrastructure in support of Africa’s development.
The AICD’s first phase focused on 24 countries that together account for 85 percent of the gross domestic
product, population, and infrastructure aid flows of Sub-Saharan Africa. The countries are: Benin,
Burkina Faso, Cape Verde, Cameroon, Chad, Côte d’Ivoire, the Democratic Republic of Congo, Ethiopia,
Ghana, Kenya, Lesotho, Madagascar, Malawi, Mozambique, Namibia, Niger, Nigeria, Rwanda, Senegal,
South Africa, Sudan, Tanzania, Uganda, and Zambia. Under a second phase of the project, coverage was
expanded to include as many as possible of the remaining African countries.
Consistent with the genesis of the project, the main focus is on the 48 countries south of the Sahara that
face the most severe infrastructure challenges. Some components of the study also cover North African
countries so as to provide a broader point of reference. Unless otherwise stated, therefore, the term
―Africa‖ is used throughout this report as a shorthand for ―Sub-Saharan Africa.‖

The World Bank has implemented the AICD with the guidance of a steering committee that represents the
African Union, the New Partnership for Africa’s Development (NEPAD), Africa’s regional economic
communities, the African Development Bank, the Development Bank of Southern Africa, and major
infrastructure donors.
Financing for the AICD is provided by a multidonor trust fund to which the main contributors are the
United Kingdom’s Department for International Development, the Public Private Infrastructure Advisory
Facility, Agence Française de Développement, the European Commission, and Germany’s KfW
Entwicklungsbank. The Sub-Saharan Africa Transport Policy Program and the Water and Sanitation
Program provided technical support on data collection and analysis pertaining to their respective sectors.
A group of distinguished peer reviewers from policy-making and academic circles in Africa and beyond
reviewed all of the major outputs of the study to ensure the technical quality of the work.
The data underlying the AICD’s reports, as well as the reports themselves, are available to the public
through an interactive Web site, www.infrastructureafrica.org, that allows users to download customized
data reports and perform various simulations. Many AICD outputs will appear in the World Bank’s
Policy Research Working Papers series.
Inquiries concerning the availability of data sets should be directed to the volume editors at the World
Bank in Washington, DC.