Data, Digitalization, and Governance - Open Knowledge ...
172
Data, Digitalization, and Governance Office of the Chief Economist Spring 2021 Europe and Central Asia Economic Update
-
Upload
khangminh22 -
Category
Documents
-
view
1 -
download
0
Transcript of Data, Digitalization, and Governance - Open Knowledge ...

Data, Digitalization, and Governance
Office of the Chief EconomistSpring 2021
Europe and Central Asia Economic Update


Data, Digitalization, and Governance
WORLD BANK ECA ECONOMIC UPDATE SPRING 2021
Office of the Chief Economist

© 2021 International Bank for Reconstruction and Development / The World Bank 1818 H Street NW, Washington, DC 20433 Telephone: 202-473-1000; Internet: www.worldbank.org
Some rights reserved
1 2 3 4 24 23 22 21
This work is a product of the staff of The World Bank with external contributions. The findings, interpretations, and conclusions expressed in this work do not necessarily reflect the views of The World Bank, its Board of Executive Directors, or the governments they represent. The World Bank does not guarantee the accuracy of the data included in this work. The boundaries, colors, denominations, and other information shown on any map in this work do not imply any judgment on the part of The World Bank concerning the legal status of any territory or the endorsement or acceptance of such boundaries.
Nothing herein shall constitute or be considered to be a limitation upon or waiver of the privileges and immunities of The World Bank, all of which are specifically reserved.
Rights and Permissions
This work is available under the Creative Commons Attribution 3.0 IGO license (CC BY 3.0 IGO) http://creativecommons.org/licenses/by/3.0/igo. Under the Creative Commons Attribution license, you are free to copy, distribute, transmit, and adapt this work, including for commercial purposes, under the following conditions:
Attribution—Please cite the work as follows: World Bank. 2021. “Data, Digitalization, and Governance” Europe and Central Asia Economic Update (Spring), Washington, DC: World Bank. Doi: 10.1596/978-1-4648-1698-7. License: Creative Commons Attribution CC BY 3.0 IGO
Translations—If you create a translation of this work, please add the following disclaimer along with the attribution: This translation was not created by The World Bank and should not be considered an official World Bank translation. The World Bank shall not be liable for any content or error in this translation.
Adaptations—If you create an adaptation of this work, please add the following disclaimer along with the attribution: This is an adaptation of an original work by The World Bank. Views and opinions expressed in the adaptation are the sole responsibility of the author or authors of the adaptation and are not endorsed by The World Bank.
Third-party content—The World Bank does not necessarily own each component of the content contained within the work. The World Bank therefore does not warrant that the use of any third-party-owned individual component or part contained in the work will not infringe on the rights of those third parties. The risk of claims resulting from such infringement rests solely with you. If you wish to re-use a component of the work, it is your responsibility to determine whether permission is needed for that re-use and to obtain permission from the copyright owner. Examples of components can include, but are not limited to, tables, figures, or images.
All queries on rights and licenses should be addressed to World Bank Publications, The World Bank Group, 1818 H Street NW, Washington, DC 20433, USA; e-mail: [email protected].
ISBN (electronic): 978-1-4648-1698-7 DOI: 10.1596/978-1-4648-1698-7
Cover design: Lauren Kaley Johnson

Contents
iii
Acknowledgments . . . . . . . . . . . . . . . . . . . . . . . . . . . . . . . . . . . . . . . . . . . . . . . . . . . . . . . . . . . . . . . viAbbreviations . . . . . . . . . . . . . . . . . . . . . . . . . . . . . . . . . . . . . . . . . . . . . . . . . . . . . . . . . . . . . . . . . . . viiiCountry Codes . . . . . . . . . . . . . . . . . . . . . . . . . . . . . . . . . . . . . . . . . . . . . . . . . . . . . . . . . . . . . . . . . . xRegional Classification Used in this Report . . . . . . . . . . . . . . . . . . . . . . . . . . . . . . . . . . . . . . . . . . . . xiExecutive Summary . . . . . . . . . . . . . . . . . . . . . . . . . . . . . . . . . . . . . . . . . . . . . . . . . . . . . . . . . . . . . . . xii
PART I: The Economic Outlook and Long-term Challenges . . . . . . . . . . . . 1
1 The Continuing COVID-19 Pandemic and the Economic Outlook . . . . . . . . . . . . 3Global Context . . . . . . . . . . . . . . . . . . . . . . . . . . . . . . . . . . . . . . . . . . . . . . . . . . . . . . . . . . . . . . . 3Europe and Central Asia: Recent Developments and Outlook . . . . . . . . . . . . . . . . . . . . . . . . . . 11Long-Term Challenges and Policies . . . . . . . . . . . . . . . . . . . . . . . . . . . . . . . . . . . . . . . . . . . . . . . 37Annex 1.1 Data and Forecast Conventions . . . . . . . . . . . . . . . . . . . . . . . . . . . . . . . . . . . . . . . . . 45References . . . . . . . . . . . . . . . . . . . . . . . . . . . . . . . . . . . . . . . . . . . . . . . . . . . . . . . . . . . . . . . . . . . 46
2 Data, Digitalization, and Governance . . . . . . . . . . . . . . . . . . . . . . . . . . . . . . . . . 51The Important Role of Government and Governance in Europe and Central Asia . . . . . . . . . . . 53Harnessing Data and Digitalization to Improve State Capacity . . . . . . . . . . . . . . . . . . . . . . . . . . 65Data and Digitalization for Collaborative Governance . . . . . . . . . . . . . . . . . . . . . . . . . . . . . . . . . 80Policy Recommendations and Conclusions . . . . . . . . . . . . . . . . . . . . . . . . . . . . . . . . . . . . . . . . . 93References . . . . . . . . . . . . . . . . . . . . . . . . . . . . . . . . . . . . . . . . . . . . . . . . . . . . . . . . . . . . . . . . . . . 101
PART II: Selected Country Pages . . . . . . . . . . . . . . . . . . . . . . . . . . . . . . . . 109Albania . . . . . . . . . . . . . . . . . . . . . . . . . . . . . . . . . . . . . . . . . . . . . . . . . . . . . . . . . . . . . . . . . . . . . . 111Armenia . . . . . . . . . . . . . . . . . . . . . . . . . . . . . . . . . . . . . . . . . . . . . . . . . . . . . . . . . . . . . . . . . . . . . 113Azerbaijan . . . . . . . . . . . . . . . . . . . . . . . . . . . . . . . . . . . . . . . . . . . . . . . . . . . . . . . . . . . . . . . . . . . 115Belarus . . . . . . . . . . . . . . . . . . . . . . . . . . . . . . . . . . . . . . . . . . . . . . . . . . . . . . . . . . . . . . . . . . . . . . 117Bosnia and Herzegovina . . . . . . . . . . . . . . . . . . . . . . . . . . . . . . . . . . . . . . . . . . . . . . . . . . . . . . . . 119Bulgaria . . . . . . . . . . . . . . . . . . . . . . . . . . . . . . . . . . . . . . . . . . . . . . . . . . . . . . . . . . . . . . . . . . . . . 121Croatia . . . . . . . . . . . . . . . . . . . . . . . . . . . . . . . . . . . . . . . . . . . . . . . . . . . . . . . . . . . . . . . . . . . . . . 123Georgia . . . . . . . . . . . . . . . . . . . . . . . . . . . . . . . . . . . . . . . . . . . . . . . . . . . . . . . . . . . . . . . . . . . . . 125Kazakhstan . . . . . . . . . . . . . . . . . . . . . . . . . . . . . . . . . . . . . . . . . . . . . . . . . . . . . . . . . . . . . . . . . . . 127Kosovo . . . . . . . . . . . . . . . . . . . . . . . . . . . . . . . . . . . . . . . . . . . . . . . . . . . . . . . . . . . . . . . . . . . . . . 129Kyrgyz Republic . . . . . . . . . . . . . . . . . . . . . . . . . . . . . . . . . . . . . . . . . . . . . . . . . . . . . . . . . . . . . . . 131Moldova . . . . . . . . . . . . . . . . . . . . . . . . . . . . . . . . . . . . . . . . . . . . . . . . . . . . . . . . . . . . . . . . . . . . . 133Montenegro . . . . . . . . . . . . . . . . . . . . . . . . . . . . . . . . . . . . . . . . . . . . . . . . . . . . . . . . . . . . . . . . . . 135North Macedonia . . . . . . . . . . . . . . . . . . . . . . . . . . . . . . . . . . . . . . . . . . . . . . . . . . . . . . . . . . . . . 137Poland . . . . . . . . . . . . . . . . . . . . . . . . . . . . . . . . . . . . . . . . . . . . . . . . . . . . . . . . . . . . . . . . . . . . . . 139Romania . . . . . . . . . . . . . . . . . . . . . . . . . . . . . . . . . . . . . . . . . . . . . . . . . . . . . . . . . . . . . . . . . . . . . 141Russian Federation . . . . . . . . . . . . . . . . . . . . . . . . . . . . . . . . . . . . . . . . . . . . . . . . . . . . . . . . . . . . 143Serbia . . . . . . . . . . . . . . . . . . . . . . . . . . . . . . . . . . . . . . . . . . . . . . . . . . . . . . . . . . . . . . . . . . . . . . . 145Tajikistan . . . . . . . . . . . . . . . . . . . . . . . . . . . . . . . . . . . . . . . . . . . . . . . . . . . . . . . . . . . . . . . . . . . . 147Turkey . . . . . . . . . . . . . . . . . . . . . . . . . . . . . . . . . . . . . . . . . . . . . . . . . . . . . . . . . . . . . . . . . . . . . . 149Ukraine . . . . . . . . . . . . . . . . . . . . . . . . . . . . . . . . . . . . . . . . . . . . . . . . . . . . . . . . . . . . . . . . . . . . . . 151Uzbekistan . . . . . . . . . . . . . . . . . . . . . . . . . . . . . . . . . . . . . . . . . . . . . . . . . . . . . . . . . . . . . . . . . . . 153

iv ● World Bank ECA Economic Update Spring 2021
Figures1.1 Global economic activity and COVID-19 . . . . . . . . . . . . . . . . . . . . . . . . . . . . . . . . . . . . . . . . . . . . . . . . 41.2 Global trade and financial indicators . . . . . . . . . . . . . . . . . . . . . . . . . . . . . . . . . . . . . . . . . . . . . . . . . . . 61.3 Risks to global growth . . . . . . . . . . . . . . . . . . . . . . . . . . . . . . . . . . . . . . . . . . . . . . . . . . . . . . . . . . . . . . 8B1.1.1 Average stock returns of banks versus firms and non-bank financial companies . . . . . . . . . . . . . . . . . 9B1.1.2 Abnormal returns of bank stocks around the announcement window . . . . . . . . . . . . . . . . . . . . . . . . . 10B1.2.1 Oxford Stringency Index for countries in Europe and Central Asia . . . . . . . . . . . . . . . . . . . . . . . . . . . . 14B1.2.2 Implementation of nonpharmaceutical interventions over time . . . . . . . . . . . . . . . . . . . . . . . . . . . . . . 14B1.2.3 Average speed of reopening and the Stringency Index at the start of reopening in countries in
Europe and Central Asia . . . . . . . . . . . . . . . . . . . . . . . . . . . . . . . . . . . . . . . . . . . . . . . . . . . . . . . . . . . . 151.4 Recent developments and outlook in ECA . . . . . . . . . . . . . . . . . . . . . . . . . . . . . . . . . . . . . . . . . . . . . . 171.5 Food price developments in ECA . . . . . . . . . . . . . . . . . . . . . . . . . . . . . . . . . . . . . . . . . . . . . . . . . . . . . 18B1.3.1 Informal and female workers are bearing the brunt of the job crisis in Turkey . . . . . . . . . . . . . . . . . . . 19B1.3.2 Net job losses at the peak of the crisis across income deciles . . . . . . . . . . . . . . . . . . . . . . . . . . . . . . . 201.6 Portfolio and FDI flows in ECA . . . . . . . . . . . . . . . . . . . . . . . . . . . . . . . . . . . . . . . . . . . . . . . . . . . . . . . . 221.7 Macroeconomic policy in ECA . . . . . . . . . . . . . . . . . . . . . . . . . . . . . . . . . . . . . . . . . . . . . . . . . . . . . . . . 231.8 GDP trends in ECA . . . . . . . . . . . . . . . . . . . . . . . . . . . . . . . . . . . . . . . . . . . . . . . . . . . . . . . . . . . . . . . . . 25B1.4.1 Pandemic trends in ECA . . . . . . . . . . . . . . . . . . . . . . . . . . . . . . . . . . . . . . . . . . . . . . . . . . . . . . . . . . . . 26B1.4.2 COVID-19 vaccination trends in ECA . . . . . . . . . . . . . . . . . . . . . . . . . . . . . . . . . . . . . . . . . . . . . . . . . . . 27B1.4.3 ECA outlook, by vaccination progress . . . . . . . . . . . . . . . . . . . . . . . . . . . . . . . . . . . . . . . . . . . . . . . . . . 29B1.4.4 COVID-19 cases under different model scenarios . . . . . . . . . . . . . . . . . . . . . . . . . . . . . . . . . . . . . . . . . 29B1.4.5 Risks to the ECA outlook . . . . . . . . . . . . . . . . . . . . . . . . . . . . . . . . . . . . . . . . . . . . . . . . . . . . . . . . . . . . 301.9 Productivity and the Human Capital Index . . . . . . . . . . . . . . . . . . . . . . . . . . . . . . . . . . . . . . . . . . . . . . 381.10 Strengthening institutions . . . . . . . . . . . . . . . . . . . . . . . . . . . . . . . . . . . . . . . . . . . . . . . . . . . . . . . . . . . 411.11 Green recovery. . . . . . . . . . . . . . . . . . . . . . . . . . . . . . . . . . . . . . . . . . . . . . . . . . . . . . . . . . . . . . . . . . . . 452.1 Correlation between government expenditure as share of GDP and log of GDP per capita in 2019 . . . 532.2 Public expenditure and public employment in Europe and Central Asia, by subregion . . . . . . . . . . . . 542.3 Percent of people with tertiary education among public sector employees and adult
population at large . . . . . . . . . . . . . . . . . . . . . . . . . . . . . . . . . . . . . . . . . . . . . . . . . . . . . . . . . . . . . . . . . 552.4 Percent of women employees in public and private sectors in Europe and Central Asia . . . . . . . . . . . 582.5 Female-to-male wage ratio in public and private sectors of Europe and Central Asia . . . . . . . . . . . . . 582.6 Correlation between government expenditure and World Governance Indicator scores,
in Europe and Central Asia and the world, 2019 . . . . . . . . . . . . . . . . . . . . . . . . . . . . . . . . . . . . . . . . . . 612.7 Average World Governance Indicator scores in the world, 2019 . . . . . . . . . . . . . . . . . . . . . . . . . . . . . 612.8 Average World Governance Indicator scores in Europe and Central Asia, by subregion, 2019 . . . . . . 622.9 Average scores on subindices of World Governance Indicators in Europe and Central Asia,
by subregion, 2019 . . . . . . . . . . . . . . . . . . . . . . . . . . . . . . . . . . . . . . . . . . . . . . . . . . . . . . . . . . . . . . . . 622.10 Change in average Worldwide Governance Indicators scores between 1996 and 2019,
by subindex and world region . . . . . . . . . . . . . . . . . . . . . . . . . . . . . . . . . . . . . . . . . . . . . . . . . . . . . . . . 632.11 Average World Governance Indicators scores of countries in Europe and Central Asia in
1996 and 2019 . . . . . . . . . . . . . . . . . . . . . . . . . . . . . . . . . . . . . . . . . . . . . . . . . . . . . . . . . . . . . . . . . . . . 642.12 Correlation between changes in World Governance Indicators score and per capita GDP
in Europe and Central Asia . . . . . . . . . . . . . . . . . . . . . . . . . . . . . . . . . . . . . . . . . . . . . . . . . . . . . . . . . . 64B2.2.1 Elasticity of firm revenue to judicial speed in commercial courts in Croatia . . . . . . . . . . . . . . . . . . . . . 68B2.3.1 GovTech maturity in Europe and Central Asia, by subregion, 2020 . . . . . . . . . . . . . . . . . . . . . . . . . . . 702.13 Degree of functionality of five GovTech systems in Europe and Central Asia . . . . . . . . . . . . . . . . . . . . 732.14 Implementation of GovTech systems in Europe and Central Asia, by subregion . . . . . . . . . . . . . . . . . 732.15 Correlation between implementation of GovTech systems and broadband access in Europe
and Central Asia . . . . . . . . . . . . . . . . . . . . . . . . . . . . . . . . . . . . . . . . . . . . . . . . . . . . . . . . . . . . . . . . . . . 74
Boxes1.1 Banking sector pandemic: bank stocks and the response to financial policy initiatives . . . . . . . . . . . . 91.2 Lessons after the first wave of the COVID-19 pandemic: opening-up trajectories, trust in
government, and economic recovery . . . . . . . . . . . . . . . . . . . . . . . . . . . . . . . . . . . . . . . . . . . . . . . . . 131.3 Need for an inclusive recovery: insights from the COVID-19 crisis in Turkey . . . . . . . . . . . . . . . . . . . . 191.4 Vaccination assumptions and the COVID-19 pandemic: modeling growth scenarios in Europe
and Central Asia . . . . . . . . . . . . . . . . . . . . . . . . . . . . . . . . . . . . . . . . . . . . . . . . . . . . . . . . . . . . . . . . . . . 262.1 How is governance defined? . . . . . . . . . . . . . . . . . . . . . . . . . . . . . . . . . . . . . . . . . . . . . . . . . . . . . . . . . 602.2 Digitalization of justice: the impact of judicial speed on firm outcomes in Croatia . . . . . . . . . . . . . . . . 672.3 The GovTech Maturity Index . . . . . . . . . . . . . . . . . . . . . . . . . . . . . . . . . . . . . . . . . . . . . . . . . . . . . . . . . 692.4 Using data to improve public management in Estonia, North Macedonia, and Denmark . . . . . . . . . . 752.5 How can governments protect the data they collect on individuals? . . . . . . . . . . . . . . . . . . . . . . . . . . 792.6 Managing potholes in Moscow through digital public engagement . . . . . . . . . . . . . . . . . . . . . . . . . . . 842.7 Information, misinformation, and governance in the era of social media . . . . . . . . . . . . . . . . . . . . . . . 91

Contents ● v
TablesE.1 Regional classification used in this report . . . . . . . . . . . . . . . . . . . . . . . . . . . . . . . . . . . . . . . . . . . . . . . xi1.1 Europe and Central Asia growth forecast summary . . . . . . . . . . . . . . . . . . . . . . . . . . . . . . . . . . . . . . . . 241.2 Europe and Central Asia country growth forecasts . . . . . . . . . . . . . . . . . . . . . . . . . . . . . . . . . . . . . . . . 312.1 Quality of governance and characteristics of public sector in Europe and Central Asia, by country . . . . 562.2 Level of digitalization of government in Europe and Central Asia, by country . . . . . . . . . . . . . . . . . . . 712.3 Selected measures of open government, trust in government, and transparency in Europe and
Central Asia, by country . . . . . . . . . . . . . . . . . . . . . . . . . . . . . . . . . . . . . . . . . . . . . . . . . . . . . . . . . . . . . 85
2.16 Adoption of human resource management information systems (HRMIS) in Europe and Central Asia, 2000–18 . . . . . . . . . . . . . . . . . . . . . . . . . . . . . . . . . . . . . . . . . . . . . . . . . . . . . . . . . . . . . . 77
2.17 Types of human resource data collected by OECD countries in Europe and Central Asia . . . . . . . . . . 782.18 Trust in government and views on transparency in Europe and Central Asia, by subregion . . . . . . . . . 812.19 Availability of government websites that allow citizen participation and grievance redressal
mechanisms in Europe and Central Asia, by subregion, 2020 . . . . . . . . . . . . . . . . . . . . . . . . . . . . . . . . 822.20 Citizens use of Internet for civic and political issues in Europe and Central Asia,
by subregion, 2019 . . . . . . . . . . . . . . . . . . . . . . . . . . . . . . . . . . . . . . . . . . . . . . . . . . . . . . . . . . . . . . . . 832.21 World Justice Project Open Government Index scores, by country, 2020 . . . . . . . . . . . . . . . . . . . . . . 892.22 World Justice Project Open Government Index scores in Europe and Central Asia, by subregion . . . 89

vi
AcknowledgmentsThis Europe and Central Asia (ECA) Economic Update is a product of ECA’s Of-fice of the Chief Economist led by Asli Demirgüç-Kunt, in collaboration with the Macroeconomics, Trade and Investment and the Poverty and Equity Global Practices.
In Part I, Chapter I was prepared in collaboration with the Prospects Group in the Equitable Growth, Finance and Institutions Vice Presidency. The team in-cluded Collette Mari Wheeler, Carlos Arteta, Michael Lokshin, Dana Lauren Vorisek, Damien Matthias Valentin Boucher, Justin Damien Guenette, Vasiliki Papagianni, Julia Renee Roseman Norfleet, Kaltrina Temaj, and Takefumi Yamazaki. Useful comments and inputs were provided by Anna Bjerde, Sandeep Mahajan, Mona Prasad, Tatiana Proskuryakova, Emilia Skrok, Gallina Andron-ova Vincelette, and Fabrizio Zarcone. Chapter I was closely coordinated with contributions from Part II authors. Chapter II was prepared by the ECA Chief Economist’s team jointly with the Development Impact Evaluation Group of De-velopment Economics, in collaboration with the Governance Global Practice. The team was led by Michael Lokshin, Iván Torre, and Daniel Rogger and consisted of Teib Assaf, Zahid Hasnain, Vladimir Kolchin, Robert Lipinski, Patricia Rose Paskov, and Davide Zucchini. Box 2.2 was prepared by Manuel Maqueda and Daniel Li Chen from DIME DEC. Roby Senderowitsch and J. Daniel Boyce and their teams from the Governance Global Practice provided useful guidance and inputs throughout. Useful comments were provided by Lucio Monari and his team from the Infrastructure Global Practice, and by Robert Cull as the co-Direc-tor of the 2021 World Development Report on Data for Better Lives. Gallina An-dronova Vincelette, Natalya Beisenova, R. Sudharshan Canagarajah, Stephen R. Davenport, Cem Dener, Carl Patrick Hanlon, Auguste Kouame, Lalita Moorty, Constantin Rusu, Adam Shayne, Renaud Seligmann, and Linda Van Gelder pro-vided helpful inputs. The team would like to thank Anna Bjerde, Xiaoqing Yu, and ECA regional leadership team for their guidance and inputs during the prep-aration of the report.
Part II was prepared by teams from the Macroeconomics, Trade and Invest-ment Global Practice (led by Andrew Burns, Lalita M. Moorty, Sandeep Mahajan, and Jasmin Chakeri) and the Poverty and Equity Global Practice (led by Salman Zaidi). These teams included the following staff: Azamat Agaidarov, Enrique Blanco Armas, Reena Badiani-Magnusson, Javier Eduardo Baez Ramirez, Olena Bogdan, Tom Bundervoet, Benoit Philippe Marcel Campagne, Marie-Anne Chambonnier, Marcel Chistruga, Stefano Curto, Diana Victoria De Leon Dardon, Mariam Dolidze, Andrei Silviu Dospinescu, Bakyt Dubashov, Olga Emelyanova, Samuel Freije-Rodriguez, Alan Fuchs, Josip Funda, Anastasia Golovach, Maria Fernanda Gonzalez Icaza, Gohar Gyulumyan, Alexander Haider, Kiryl Haiduk,

Acknowledgments ● vii
Sandra Hlivnjak, Saida Ismailakhunova, Ivailo Izvorski, Charl Jooste, Jonathan George Karver, Tehmina Shaukat Khan, Edith Kikoni, Milan Lakicevic, Chang Kee Lee, Leonardo Ramiro Lucchetti, Sanja Madzarevic-Sujster, Armineh Ma-nookian Salmasi, Monika Anna Matyja, Appolenia Mbowe, Kristina Cathrine Mercado, Rose Mungai, Besart Myderrizi, Vinayakraj Nagaraj, Evgenij Najdov, Arvind Nair, Metin Nebiler, Trang Van Nguyen, Nga Thi Viet Nguyen, David Night, Desislava Enikova Nikolova, Chiyu Niu, Natsuko Kiso Nozaki, Ana Ma-ria Oviedo, Catalin Pauna, Alisher Rajabov, Sjamsu Rahardja, Nadir Ramazanov, Besa Rizvanolli, Natasha Rovo, Apurva Sanghi, Cristina Savescu, Marc Tobias Schiffbauer, William Hutchins Seitz, Asli Senkal, Lazar Sestovic, Hilda Shijaku, Bojan Shimbov, Maryna Sidarenka, David Andrew Stephan, Thi Thanh Thanh Bui, Eskender Trushin, Michal Tulwin, Christoph Ungerer, Kristina Vaughan, and Bakhrom Ziyaev.
Sandra Gain and Barbara Karni provided the editorial support, and Michael Alwan typeset the report. Indira Chand, Paul Anthony Clare, Carl Patrick Han-lon, Artem Kolesnikov, John Mackedon, and Sona V. Panajyan provided com-munications and outreach support. Ekaterina Ushakova oversaw the layout and production of the report.

viii
AbbreviationsAEs advanced economies Belstat National Statistical Committee of the Republic of BelarusBHAS Agency for Statistics of Bosnia and HerzegovinaBiH Bosnia and HerzegovinaCA Central AsiaCAB Current Account BalanceCAD current account deficitCBA Central Bank of AzerbaijanCBA Central Bank of ArmeniaCBR Central Bank of RussiaCE Central EuropeCROSTAT Croatian Bureau of StatisticsDSSI Debt Service Suspension InitiativeEBRD European Bank for Reconstruction and DevelopmentECA Europe and Central AsiaECAPOV ECAPOV (ECA Poverty) database of standardized household surveysECDC European Centre for Disease Prevention and ControlEE Eastern EuropeEFSD European Fund for Sustainable DevelopmentEMDEs emerging markets and developing economiesEU European UnionEUR Geographical EuropeEU-SILK European Union Statistics on Income and Living Conditions FCS fragile and conflict-affected situationsFDI foreign direct investmentFMIS financial management information systemFOIA freedom of access to information actFX foreign exchangeG20 Group of TwentyGDP gross domestic product GNI gross national incomeHBS Household Budget SurveyHHS household surveyHICES Household Income, Consumption, and Expenditure SurveyHIS Household Income SurveyHLCS Household Living Conditions SurveyHRM human resource managementHRMIS human resources management information systemICT information and communications technologyIEA International Energy AgencyIFI international financial institutionIHME Institute for Health Metrics and EvaluationILCS Integrated Living Conditions SurveyILO International Labour OrganizationIMF International Monetary FundINSTAT Institute of Statistics (Albania)

Abbreviations ● ix
IOSCO International Organization of Securities CommissionsIP industrial productionIT information technologyKIHS Kyrgyz Integrated Household SurveyLAC Latin America and the CaribbeanLCU local currency unitLHS left-hand sideLICs low-income countriesLMIC lower-middle-income countryMONSTAT Statistical Office of MontenegroNBG National Bank of GeorgiaNBK National Bank of KazakhstanNBR National Bank of RomaniaNBS National Bank of SerbiaNBT National Bank of Tajikistan NGO nongovernmental organizationNPL non-performing loanOECD Organisation for Economic Co-operation and Development OGD open government dataOPEC Organization of the Petroleum Exporting CountriesOPEC+ Organization of the Petroleum Exporting Countries Pluspc per capitaPIMS public investment management systemPMI Purchasing Managers’ Indexpp percentage pointPPP purchasing power parityR&D research and developmentRHS right-hand sideSCC South CaucasusSILC Statistics on Income and Living ConditionsSME small and medium-sized enterprisesSOE state-owned enterpriseSOFAZ State Oil Fund of the Republic of AzerbaijanTajStat Agency on Statistics of TajikistanTMIS tax management information system UMIC upper-middle-income countryUNCTAD United Nations Conference on Trade and DevelopmentUNECE United Nations Economic Commission for EuropeVAT value added tax VFDI vertical foreign direct investmentWBK Western BalkansWDI World Development IndicatorsWEF World Economic ForumWGI Worldwide Governance Indicators WHO World Health Organizationyoy year-over-year

x
Country CodesAlbania ALBArmenia ARMAustria AUTAzerbaijan AZEBelarus BLRBelgium BELBosnia and Herzegovina BIHBulgaria BGRCroatia HRVCyprus CYPCzech Republic CZEDenmark DNKEstonia ESTFinland FINFrance FRAGeorgia GEOGermany DEUGreece GRCHungary HUNIceland ISLIreland IRLItaly ITAKazakhstan KAZKosovo XKXKyrgyz Republic KGZ
Latvia LVALithuania LTULuxembourg LUXMalta MLTMoldova MDAMontenegro MNENetherlands NLDNorway NORPoland POLPortugal PRTRepublic of North Macedonia MKDRomania ROURussian Federation RUSSerbia SRBSlovak Republic SVKSlovenia SVNSpain ESPSweden SWESwitzerland CHETajikistan TJKTurkey TURTurkmenistan TKMUkraine UKRUnited Kingdom GBRUzbekistan UZB

xi
Regional Classification Used in this Report
This report covers 50 countries referred to as Europe and Central Asia (ECA) countries. These are divided into 10 groups: Central Asia, Central Europe and the Baltic Countries, Eastern Europe, Northern Europe, South Caucasus, Southern Europe, Western Balkans, Western Europe, Russia, and Turkey.
TABLE E .1 Regional classification used in this report
Central AsiaCentral Europe and
Baltic Countries Eastern Europe Northern Europe
KazakhstanKyrgyz Republic
TajikistanTurkmenistan
Uzbekistan
BulgariaCroatia
Czech RepublicEstoniaHungary
LatviaLithuaniaPoland
RomaniaSlovak Republic
Slovenia
BelarusMoldovaUkraine
DenmarkFinlandIcelandNorwaySweden
South Caucasus Southern Europe Western Balkans Western Europe
ArmeniaAzerbaijan
Georgia
CyprusGreece
ItalyMalta
PortugalSpain
AlbaniaBosnia and Herzegovina
KosovoRepublic of North Macedonia
MontenegroSerbia
AustriaBelgiumFrance
GermanyIreland
LuxembourgNetherlandsSwitzerland
United Kingdom
Russian Federation Turkey

xii
With the COVID-19 pandemic plunging the global economy into one of its deep-est recessions over the past century, economic activity in the emerging and devel-oping countries of Europe and Central Asia (ECA) contracted by 2.0 percent in 2020. The pace of recovery in 2021 is expected to be at 3.6 percent, reflecting lin-gering disruptions to activity from an earlier resurgence of COVID-19 and the emergence of more contagious variants of the virus. In the global context, this update summarizes recent developments and presents the outlook for the region. It also focuses on governance, a key development issue in the region, the impor-tance of which has also been highlighted during the COVID-19 crisis, since gov-ernment quality, public trust, and credibility are vital elements of success in fight-ing the pandemic.
While activity in the region will rebound in 2021, recovery will be subdued. Per capita GDP is still forecast to remain almost 3 percent below its pre-pandemic trend by 2022. Economies with strong trade or financial linkages to the euro area and those heavily dependent on services and tourism have been the hardest hit. The outlook remains highly uncertain and will continue to be shaped by the pandemic and vaccine development. Growth in 2021 may be weaker if the pan-demic takes longer than expected to fade, external financing conditions tighten, or geopolitical tensions escalate again.
Governments play a critical role in the economies of Europe and Central Asia, as government expenditures are close to 40 percent of gross domestic product. This is expected since richer countries tend to have larger governments, and many countries in the region are still transitioning to market-based economies. Government plays an equally important role in shaping labor markets across the region: the public sector employs 86 million people, or 25 percent of total employ-ment, which is considerably higher than the global average of 16 percent. These shares vary across the region: in Belarus, the public sector employs almost 40 percent of the labor force, whereas this figure is only 13 percent in Romania. The public sector often attracts some of the best educated workers in the region. Pub-lic sector employees are considerably more educated than the average popula-tion, particularly in lower income countries. For example, in the South Caucasus, Central Asia, and the Western Balkans, the share of individuals with tertiary edu-cation employed in the public sector is more than double that in the average population.
The role of government in ECA countries is likely to increase in the coming years. A third of the population in high-income countries and about 45 percent of
Executive Summary

Executive Summary ● xiii
citizens in the transition countries support expansion of the public sector. This is partly because the aging populations in the region require increased public ser-vices such as health care, disability services, and long-term care. In addition, globalization and technological change have led to reduced job security and in-comes for the most vulnerable, and the resulting rise in inequality has led to in-creased demand for redistribution. Finally, the COVID-19 crisis has increased people’s risk aversion and reinforced their desire for the state to socialize indi-vidual risks and play a more important role in public health systems, education, and social protection.
The significant role that government plays underscores the importance of the quality of governance in determining productivity and growth and effectively responding to the region’s economic and social challenges. Among the world regions, ECA has the greatest disparity in quality of governance according to the World Governance Indicators, as there is significant subregional variability. While progress in some parts of the region has been disappointing, overall the region has nevertheless seen significant improvement in government quality over the last two decades, particularly among countries that were originally un-derperforming. For example, countries in the South Caucasus and the Western Balkans saw the greatest increases in the quality of governance over the past 20 years.
Improving the productivity of the public sector can have a profound impact on the economies of ECA, where state capacity in many countries is still weak. Digital technology and the data revolution offer the potential to increase effi-ciency, transparency, responsiveness, and citizen trust, directly impacting the quality of government. Across the world, the quality of government is increas-ingly informed by the extent to which governments harness digital tools and GovTech to optimize management, service delivery, and overall state capacity. The COVID-19 pandemic has highlighted the costs associated with delaying digi-talization and GovTech implementation and the opportunities that lie in public sector modernization.
Technology and data are vital for fostering collaboration between govern-ments and civil society. Many citizens in ECA mistrust the government and view political decisions as not very transparent. The data revolution and digitalization offer an opportunity to change this situation by fostering collaboration between governments and civil society to enhance public sector efficiency and service delivery. One of the most promising mechanisms for doing so is Open Govern-ment Data, which reduces the transaction costs of gathering, analyzing, and dis-seminating public sector data and allows for a more comprehensive understand-ing of the quality of governance as a whole.
The analysis in this report proposes policy recommendations, grounded in empirical evidence, for harnessing the data revolution to improve governance across ECA. The recommendations include (a) implementing incentive structures to encourage the adoption and adaptation of data systems within the civil ser-vice, (b) expanding the impact of the data revolution through enhanced govern-ment digitalization and intersectoral coordination of decentralized data systems across institutions, (c) fostering platforms for citizens to hold government

xiv ● World Bank ECA Economic Update Spring 2021
accountable over their broad approach to using data, and (d) redefining the fire-wall between citizens and government by experimenting with direct feedback.
Much has been accomplished, but much more needs to be done. For example, 21 of the 50 ECA countries—including most of those in Eastern Europe, the West-ern Balkans, the South Caucasus, and Central Asia—do not have high-level coor-dination for data governance and management. And 30 countries in the region lack a GovTech institution supporting interoperability and interconnectivity be-tween government agencies. Open Government Data commitments need to be implemented. Many ECA countries do not have centralized web portals where individuals can address the government with concerns or provide feedback. Im-proving broadband internet coverage and use, particularly in Central Asia, needs to be a priority for meaningful digital connectivity.

PART
The Economic Outlook and Long-term Challenges
I


3
Global ContextThe COVID-19 pandemic has plunged the global economy into a deep recession whose depth was surpassed only by the two World Wars and the Great Depression over the past century and a half. Although global economic activity has picked up again, global gross domestic product (GDP) is not likely to recover for the foreseeable future. Despite the substantial progress made in the development of vaccines, the sharp resurgence of CO-VID-19 at the start of 2021 has cast a shadow over the global recovery, as countries have been forced to retighten social distancing measures. The rebound in global growth is expected to be bolstered by gradual improvement in confidence, consumption, and trade, as well as by ongoing vaccination. Downside risks still predominate however, including the possibility of a further increase in the spread of the virus, delays in vaccine procurement and distri-bution, as well as financial stress triggered by high debt levels and weak growth.
COVID-19 Pandemic and Overall Trends
Following a collapse in economic activity last year due to the COVID-19 pan-demic, global growth has rebounded in 2021. The pace of the global recovery, however, was subdued at the start of 2021, as countries grappled with the spread of more transmissible strains of COVID-19, which forced the extension or reintro-duction of lockdown measures of varying stringency. The baseline forecast in January envisioned a 4 percent expansion of global GDP in 2021 (World Bank 2021). This projection was predicated on proper pandemic management and vac-cination limiting the community spread of COVID-19 in many countries. The projection also assumed continued monetary policy accommodation, which
The Continuing COVID-19 Pandemic and the Economic Outlook
1

4 ● World Bank ECA Economic Update Spring 2021
would help mitigate diminishing fiscal support. After this year’s pickup, global growth was forecast to moderate to 3.8 percent in 2022—still above its potential pace but weighed down by lasting damage from COVID-19 (figure 1.1, panel A). At this rate, global per capita GDP would remain 4.4 percent below pre-pandemic projections by 2022, reflecting the dampening effects of lingering risk aversion on the demand side and of diminished physical and human capital accumulation on labor productivity.
A sharp rise in daily new COVID-19 cases in late 2020 softened the incipient recovery in global activity (figure 1.1, panel B). For several economies, however,
Sources: Consensus Economics; Haver Analytics; Our World in Data (database); World Bank. Note: AEs = advanced economies; EMDEs = emerging markets and developing economies; FCS = fragile and conflict-affected situations; GDP = gross domestic product; LICs = low-income countries.A. The shaded area indicates forecasts. Data for 2020 are estimates. Aggregate growth rates were calculated using GDP weights at 2010 prices and market exchange rates.B. The figure shows the seven-day moving average of daily new COVID-19 cases. The last observation is March 14, 2021. The sample consists of 36 advanced economies and 149 EMDEs.C. The figure shows the percentage point difference between continuous Consensus forecasts published in January 2021 and the actual GDP growth outcomes for 2020Q4. Outcomes refer to quarter-on-quarter percentage changes for all countries apart from the United States, for which the quarter-on-quarter annualized change is used.D. The figure shows the number of total vaccinations performed per 100 people. The last observation is March 14, 2021.
FIGURE 1.1 Global economic activity and COVID-19
b. Evolution of the pandemic
c. Difference between 2020Q4 GDP growth outcomes and Consensus expectations
d. COVID-19 vaccine deployment
a. Global growth
−8
−4
0
4
8
2010 2012 2014 2016 2018 2020 2022
World Advanced economies EMDEs
Perc
ent
0
100
200
300
400
500
Jan-
20
Mar-
20
May
-20
Jul-2
0
Sep-2
0
Nov-20
Jan-
21
Mar-
21
Advanced economies EMDEs
New
dai
ly c
ases
, tho
usan
ds
−1
0
1
2
3
4
Fran
ceSp
ain
Swed
en
Euro ar
ea Italy
United
State
s
Perc
enta
ge p
oint
s
0
3
6
9
12
15
18
13-D
ec
27-D
ec
10-Ja
n
24-Ja
n7-
Feb
21-F
eb7-
Mar
Advanced economies EMDEs World
Vacc
inat
ions
per
hun
dred
peo
ple

Chapter 1: The Continuing COVID-19 Pandemic and the Economic Outlook ● 5
renewed weakness was concentrated in service sectors as governments opted for targeted or less stringent lockdowns rather than economywide shutdowns. Ac-cordingly, resilience in industrial activity—which mirrored a recovery in global goods trade—provided support, with output surpassing Consensus expectations in several economies in the fourth quarter of 2020 (figure 1.1, panel C). Various economic indicators, including the Global Composite Purchasing Managers’ In-dex (PMI) and the Sentix index, pointed to firming activity in early 2021 as the number of daily new cases stabilized and vaccine deployment supported inves-tor sentiment. Although vaccination is underway, with about 5.3 percent of the global population having received at least one dose of the many available vac-cines, progress has been uneven across countries. While vaccinations are gather-ing pace in advanced economies, doses have not yet been administered in about half of the emerging markets and developing economies (EMDEs) and in most low-income countries by mid-March (figure 1.1, panel D).
In 2020, the U.S. economy contracted 3.5 percent (year-on-year)—broadly in line with Consensus expectations—leaving output in the final quarter of the year 2.5 percent below its pre-pandemic 2019 fourth quarter level. Substantial fiscal support to household incomes—far exceeding similar measures delivered during the global financial crisis—contributed to a robust initial rebound, which was subsequently cut short by a broad resurgence of the pandemic. Heading into 2021, the economy remained resilient, notwithstanding elevated COVID-19 cases and the ongoing drag of pandemic control measures on the service sector. The American Rescue Plan was passed in March 2021, and is expected to provide an additional $1.9 trillion of support, or about 9 percent of GDP.
As a result of the COVID-19 shock, output in the euro area collapsed by 6.8 percent in 2020 and remained 5.1 percent below its pre-pandemic level in the fourth quarter. More recently, sharp flareups in new COVID-19 infections, ex-tended restrictions, and slow vaccine rollout are setting the stage for possible deterioration. Resilient growth in manufacturing, however, will help offset con-tinued weakness in the service sector (figure 1.2, panel A). Against the backdrop of a historical recession, the policy response has been far-reaching and sustained. National fiscal support packages were bolstered by grants from the European Union (EU) to the hardest hit member countries, which are expected to support activity in 2021.
In China, GDP expanded by 2.3 percent in 2020—slightly higher than the Con-sensus forecast of 2.1 percent—supported by public investment–led stimulus. Accommodative fiscal and monetary policies led to a sharp increase in the gov-ernment deficit and total debt. More recently, incoming high-frequency data, in-cluding the official Manufacturing PMI and non-Manufacturing PMI, eased amid an uptick in new COVID-19 cases (figure 1.2, panel B).
Global trade collapsed in 2020—declining an estimated 9 percent—as border closures and supply disruptions interrupted the international provision of goods and services (UNCTAD 2021a). Goods trade fell more rapidly and rebounded more swiftly than during the global financial crisis, with the volume of global goods trade surpassing its pre-pandemic level in November 2020 (figure 1.2, panel C). The pace of recovery in goods trade, however, appears to be moderat-ing in early 2021. Meanwhile, services trade remains depressed as the virus

6 ● World Bank ECA Economic Update Spring 2021
Sources: CPB Netherlands Bureau for Economic Policy Analysis; European Central Bank (database); European Commission; World Bank; World Trade Organization.Note: GDP = gross domestic product; IP = industrial production; PMI = Purchasing Managers’ Index.A. The figure shows percentage changes in IP since January 2020 and Services PMI for the euro area. The last observation is December 2020 for IP and February 2021 for Services PMI. Services PMI readings above 50 indicate expansion in economic activity; readings below 50 indicate contraction.B. The figure shows quarter-on-quarter annualized change in real GDP in 2015 prices, and year-on-year change in total real industrial value added (2005 = 100) and non-seasonally adjusted nominal retail sales. The last observation is 2020Q4 for GDP and December 2020 for IP and retail sales.C. Goods trade is in real terms from the CPB Netherlands Bureau for Economic Policy Analysis, whereas services trade is in values from the World Trade Organization. For the global financial crisis, t = September 2008; for COVID-19, t = January 2020.D. The figure shows seven-year inflation swap rates for the euro area and the United States. The last observation is February 10, 2021.E. The last observation is February 5, 2021.F. The last observation is January 2021.
FIGURE 1.2 Global trade and financial indicators
a. Selected indicators of economic activity in the euro area b. Activity indicators in China
e. EMDE portfolio flows f. Commodity price indexes
c. Trade in goods and services d. Inflation pressures
10
20
30
40
50
60
−30
−20
−10
0
10
Jan-
20
Feb-2
0
Mar-
20
Apr-20
May
-20
Jun-
20Ju
l-20
Aug-2
0
Sep-2
0
Oct-20
Nov-20
Dec-2
0
Jan-
21
Feb-2
1
Inde
x, 5
0+=E
xpan
sion
Perc
ent
IP Services PMI (RHS)
−180
−100
−20
60
−45
−35
−25
−15
−5
5
15
Dec-19 Apr-20 Aug-20 Dec-20
GDP (RHS) Retail sales Industrial production
Perc
ent
Perc
ent
70
75
80
85
90
95
100
105
t-1
t+1
t+3
t+5
t+7
t+9
t+11 t-
1
t+1
t+3
t+5
t+7
t+9
t+11
Goods trade Services trade
Global financial crisis COVID-19 pandemic
Inde
x, 1
00=t
-1
0.0
0.4
0.8
1.2
1.6
1.0
1.4
1.8
2.2
2.6
Jan-
19
Jun-
19
Nov-19
Apr-20
Sep-2
0
Feb-2
1
United States Euro area (RHS)
Perc
ent
Perc
ent
−40
−20
0
20
Jan-
20
Feb-2
0
Apr-20
Jun-
20
Aug-2
0
Oct-20
Dec-2
0
Feb-2
1
Equity Debt
US$
, bill
ions
20
40
60
80
100
120
Jan-
19
Apr-19
Jul-1
9
Oct-19
Jan-
20
Apr-20
Jul-2
0
Oct-20
Jan-
21
Energy Agriculture Metals
Inde
x, 1
00=2
010

Chapter 1: The Continuing COVID-19 Pandemic and the Economic Outlook ● 7
continues to persist and impede face-to-face interactions and international travel and tourism. Accordingly, the global new services export orders PMI subindex has continued to contract in early 2021, signaling further weakness on the ser-vices trade front. Although international travel has improved from its trough (about a year ago), it has stabilized far below pre-pandemic levels due in part to COVID-19 travel restrictions. The departure of the United Kingdom from the European Single Market and the European Union Customs Union has thus far had only a muted impact on bilateral trade. Still, many businesses are reporting difficulties complying with the new regulations.
Aggressive policy actions by central banks kept the global financial system from falling into crisis last year. Although the global stock market rally was briefly interrupted in January 2021 amid a spike in risk aversion, risky assets continued to appreciate on the back of new stimulus measures in the United States and the rollout of vaccines lifted market sentiment. Overall, global finan-cial conditions remained exceptionally benign as major central banks reaffirmed the continuation of their asset purchases, but signs of rising inflation expectations are emerging and triggering a steepening of yield curves (figure 1.2, panel D).
After a brisk rebound at the end of 2020, portfolio inflows to EMDEs lost mo-mentum in early 2021 amid rising global yields, asset market rotation, and con-cerns about monetary policy tightening in some major advanced economies (fig-ure 1.2, panel E). Despite the uptick in interest rates, aggregate credit spreads on EMDE bonds have widened only slightly since reaching post-2020 lows in early February. Diverging recovery prospects and increased risks of tighter market ac-cess for some EMDEs, however, have contributed to a deceleration of bond issu-ance. Although financial conditions remain somewhat benign, underlying vul-nerabilities are growing, including rising debt levels and weakening bank balance sheets.
Most commodity prices rebounded over the second half of 2020; however, the pickup in energy prices initially lagged the broader recovery in commodity prices due to the prolonged impact of the pandemic on global demand (World Bank 2020a). However, energy prices experienced a robust rebound in early 2021, and other commodity prices continued to firm (figure 1.2, panel F). Brent crude rose above $65/barrel in February for the first time in a year, supported by pro-duction restraint by the Organization of the Petroleum Exporting Countries Plus (OPEC+). Following an agreement reached in January to extend production cuts, the group’s production as a whole is expected to be nearly 0.5 million barrels per day lower in February and March than during the second half of 2020. The in-crease in prices has occurred despite downgrades to the International Energy Agency’s oil demand outlook due to renewed lockdowns.
Metals prices are also rising, driven in large part by robust demand from China. Agricultural prices rose to their highest level since 2014 at the start of this year, with large increases in the prices of grains and oilseeds, with maize prices in particular driven by surging demand from China. Production shortfalls in some regions, including for soybeans in South America as a result of dry weather and palm oil in South Asia, are also supporting food prices. Some EMDE re-gions are experiencing localized food price spikes that exceed the rise at the global level.

8 ● World Bank ECA Economic Update Spring 2021
Global Risks
The global forecast published in January expected a baseline recovery of 4 per-cent in 2021 and 3.8 percent in 2022. Although incoming data point to a poten-tially stronger rebound, the materialization of several downside risks could de-rail the global recovery (figure 1.3 panel A). The spread of the virus could reaccelerate if pandemic control measures fail or vaccine deployment faces de-lays or bottlenecks. While the pace of vaccination accelerated at the start of 2021 in advanced economies and some large EMDEs, nearly half of the EMDEs and low-income countries had yet to administer any doses by mid-March. The risk of the virus and its damaging impact on the global economy thus looms in the ab-sence of widespread inoculation. The recent emergence of new, more transmis-sible variants of the virus also poses challenges to containment efforts.
A renewed worsening of the pandemic would also exacerbate existing strains—prolonged economic weakness could trigger a wave of bankruptcies; bank balance sheets could be further impaired; governments might be unable to continue providing support; and, in some circumstances, temporary bouts of un-employment and business shutdowns could become permanent. The risks of fi-nancial crises are increasing owing to surging debt, weak activity, eroded capital buffers in the banking system, and elevated risk asset valuations. Analysis of stock prices reveals that the adverse impact of the COVID-19 shock on banks was more pronounced and long lasting than on corporates, suggesting that the coun-tercyclical lending role that banks around the world are expected to play has put the sector under significant pressure. These vulnerabilities will need to be watched carefully as the impact of the pandemic on the corporate sector continues to be re-vealed (box 1.1).
FIGURE 1.3 Risks to global growth
b. Global debta. Possible scenarios of global growth
−8
−4
0
4
8
World Advancedeconomies
EMDEs
2020 2021 2022
Perc
ent
50
100
150
200
250
300
2005 2010 2015 2020
World EMDEs Advanced economies
Perc
ent o
f gov
ernm
ent r
even
ue
Sources: Consensus Economics; Haver Analytics; Our World in Data (database); World Bank.Note: EMDEs = emerging markets and developing economies.A. Shaded areas indicate forecasts. Black vertical lines are the lower and upper bounds of growth in the scenarios described in box 1.4 in the Janu-ary 2021 edition of the Global Economic Prospects report.B. Aggregates are calculated using current GDP in U.S. dollars as weights, based on data for up to 182 countries, including up to 145 EMDEs. The shaded area refers to forecasts for 2021–22; data for 2020 are estimates.

Chapter 1: The Continuing COVID-19 Pandemic and the Economic Outlook ● 9
The spread of COVID-19 represents an unprec-edented global shock, with the disease itself and mitigation efforts—such as social distanc-ing measures and partial and national lockdown measures—having a significant impact on the economy. In the immediate aftermath, the financial sector, particularly banks, was expected to play an important role in absorbing the shock by supply-ing vital credit to the corporate sector and house-holds. In an effort to facilitate this, central banks and governments around the world enacted a wide range of policy measures to provide greater liquid-ity and support the flow of credit. An important policy question is the potential impact of these countercyclical lending policies on the future sta-bility of banking systems and the extent to which their strengthened capital positions since the global financial crisis will allow them to absorb this shock without undermining their resilience.
In a recent paper, Demirgüc-Kunt, Pedraza, and Ruiz-Ortega (2020) use daily stock prices and other
balance sheet information for a sample of banks in 53 countries to take a look at this issue. They first assess the impact of the pandemic on the bank-ing sector and investigate whether the shock had a differential impact on banks versus corporates, as well as by different bank characteristics. Second, using a global database of financial sector policy responses and an event study methodology, the authors investigate the effects that different pol-icy initiatives had on bank stress as perceived by markets, in the aggregate, as well as across differ-ent banks. (This data set was compiled and made publicly available by the World Bank).
The results suggest that the adverse impact of the COVID-19 shock on banks was much more pro-nounced and long-lasting than on corporates and other non-bank financial institutions, revealing the expectation that banks are to absorb at least part of the shock to the corporate sector (figure B1.1.1). The authors also show that banks with lower pre-crisis liquidity buffers experienced larger than nor-mal price drops.
Banking sector pandemic: bank stocks and the response to financial policy initiatives
BOX 1.1
(Continued next page)
Source: Demirgüc-Kunt, Pedraza, and Ruiz-Ortega 2020.Note: The figures plot the average daily stock market returns of banks, firms, and non-bank financial institutions in the sample normalized to January 1, 2020. The average returns of firms in panel A are equally weighted across countries and net of bank re-turns. The average returns of banks are weighted by the contribution of each bank to total bank assets in each region. The re-gional average bank returns are then equally weighted across regions. The same approach is used to obtain the average returns of non-bank financial institutions (panel B).
FIGURE B1.1.1 Average stock returns of banks versus firms and non-bank financial companies
60
70
80
90
100
1/1/
2020
2/1/
2020
3/1/
2020
4/1/
2020
5/1/
2020
Firms Banks
Perc
ent
Perc
ent
a. Banks vs firms
60
70
80
90
100
1/1/
2020
2/1/
2020
3/1/
2020
4/1/
2020
5/1/
2020
Non-bank financials Banks
b. Non-bank financials vs banks

10 ● World Bank ECA Economic Update Spring 2021
(continued)
Next, the authors investigate more than 400 policy announcements between February and April 2020. The financial sector policy initiatives are classified as follows. (i) Liquidity support mea-sures are used by monetary authorities to expand banks’ short-term funding in domestic and foreign currency. (ii) Prudential measures deal with the temporary relaxation of regulatory and supervisory requirements, including capital buffers. (iii) Bor-rower assistance measures include government-sponsored credit lines or liability guarantees. (iv) Monetary policy measures include policy rate cuts and quantitative easing. To investigate the mar-ket response to each policy measure, the authors study abnormal returns to bank stocks around announcement days. The results (summarized in figure B1.1.2) are as follows:
• Announcements of liquidity support were associated with large increases in banks’ stock prices. It appears that access to cen-tral bank refinancing and initiatives that address shortages in bank funding had a calming effect on markets, as evidenced by
BOX 1.1
the overperformance of bank stocks around these events. These initiatives also seem to reduce the liquidity risk premium, as banks with lower liquidity provisions expe-rienced larger abnormal returns after the announcements.
• Borrower assistance announcements had a strong and immediate impact on bank stock prices in advanced countries. Such policies, which typically include the introduction of government guarantees, automatically trans-fer risks from banks’ balance sheets to the sovereign, often requiring large fiscal com-mitments. Relatedly, the authors find that for developing countries, where there is less room for fiscal expansion, borrower support initiatives had no effect on bank stocks.
• In contrast, prudential measures seem to have had only a minor impact on bank stock prices, and in some cases the effect appears to be negative. The results suggest that mar-kets are pricing the downside risk from the depletion of capital buffers, as well as the
(Continued next page)
Source: Demirgüc-Kunt, Pedraza, and Ruiz-Ortega 2020.Note: The variable plotted on the vertical axis shows the accumulated abnormal returns in percentage points within the window of one day before the event and three days after the event, scaled to zero on the day before the announcement. Accumulated abnormal returns are averaged across banks for each policy category. The horizontal axis shows days within the event window, with “0” corresponding to the day of the announcement. The restricted sample excludes days with overlapping announcements of different categories within each country.
FIGURE B1.1.2 Abnormal returns of bank stocks around the announcement window
−3
−2
−1
0
1
2
3
−1 0 1 2 3
Liquidity support Prudential measuresBorrower assistance Asset purchasesPolicy rates
Liquidity support Prudential measuresBorrower assistance Asset purchasesPolicy rates
a. Abnormal returns (full sample) b. Abnormal returns (restricted sample)
Perc
ent
Perc
ent
−3
−2
−1
0
1
2
3
−1 0 1 2 3

Chapter 1: The Continuing COVID-19 Pandemic and the Economic Outlook ● 11
These developments follow a decade that featured the largest, fastest, and most broad-based increase in debt on record (Kose et al. 2020). Fiscal support and private sector borrowing to weather the shock from COVID-19 have pushed debt even higher (figure 1.3, panel B). Although low interest rates mitigate risks for some countries, elevated debt levels nonetheless increase the vulnerability to a shift in market conditions. Many borrowers would struggle to finance fiscal and current account deficits if investor sentiment were to deteriorate suddenly. Un-derdeveloped capital markets in many EMDEs pose risks to banking, corporate, and government funding in the event of renewed tightening in global financial conditions (IOSCO 2020). Although global financial conditions remain somewhat benign, inflation expectations are rising in some large, advanced countries. A sharp reassessment of inflation could trigger a sudden tightening in global fi-nancing conditions—in turn, higher funding costs could lead to forced austerity or disruptive defaults that result in lost access to international debt markets.
Compounding pandemic-related risks are those related to elevated policy un-certainty, especially as countries navigate the challenge of unwinding macroeco-nomic support with fostering the recovery. Similarly, an escalation in geopolitical tensions, such as the ones recently observed between the EU and China, could also have a material impact on the global outlook.
Europe and Central Asia: Recent Developments and OutlookEconomic activity in EMDEs in Europe and Central Asia (ECA) is estimated to have contracted by 2 percent in 2020 in the wake of disruptions related to the COVID-19 pandemic. The pandemic is expected to erase at least five years of per capita income gains in about a sixth of the region’s economies and raise the poverty headcount. Economies
(continued)
additional expansion of riskier loans in the balance sheets of banks. It is possible that in countries with financial vulnerabilities before the start of the crisis, banks were deemed to be in a worse position after the use of coun-tercyclical measures.
• The results for monetary policy announce-ments are more mixed. Although such announcements were not associated with aggregate bank stock price increases, they did seem to reduce the liquidity premium, confirming that policy rate cuts and quantita-tive easing represented a key tool during the crisis.
BOX 1.1
This evidence suggests that the countercycli-cal lending role that banks around the world are expected to play has put the sector under signifi-cant pressure. Although policy measures such as liquidity support, borrower assistance, and mon-etary easing moderated this adverse impact for some banks, this was not true for all banks or in all circumstances. For example, borrower assistance measures and prudential measures exacerbated the stress for banks that were already undercapital-ized and/or operated in countries with little fiscal space. These vulnerabilities will need to be care-fully monitored in the coming year as the pandemic continues to take a toll on the world’s economies.

12 ● World Bank ECA Economic Update Spring 2021
with strong trade or financial linkages to the euro area and those heavily dependent on services and tourism were the hardest hit. The pace of recovery in 2021 is projected to be faster than originally anticipated, at 3.6 percent, as firming external demand and stabiliz-ing industrial commodity prices partly offset a recent flare-up in new COVID-19 cases. Growth is then expected to rise to 3.8 percent in 2022, as the effects of the pandemic gradually wane and the recovery in trade and investment gathers momentum. The out-look remains highly uncertain and growth could be weaker than envisioned if the pan-demic takes longer than expected to fade, external financing conditions tighten, policy uncertainty spikes, or geopolitical tensions escalate again.
Recent Developments
The COVID-19 pandemic has generated a major health and economic crisis in ECA, which has been further compounded by social unrest and conflict. CO-VID-19 has infected 15.5 million people in the region, making ECA the second hardest hit region in per capita terms after Latin America and the Caribbean.1 The rate of new cases sharply accelerated starting in the fourth quarter of last year, forcing governments to maintain or reintroduce mitigation measures well into 2021. Analyzing the experience with the first wave of the pandemic and the dif-ferent opening-up trajectories adopted by countries suggests that a gradual and transparent process will again need to be followed to minimize the health costs and increase the chances of a faster recovery (box 1.2).
Following several weeks of restrictions, the number of daily new cases fell by about 75 percent in early 2021. Although the Russian Federation accounts for about a quarter of the region’s total cases, cumulative cases per capita are higher in all ECA subregions, with the exception of Central Asia. Six ECA countries—Montenegro, Hungary, Bosnia and Herzegovina, Bulgaria, North Macedonia, and Croatia—are among the 10 EMDEs with the highest per capita number of deaths from COVID-19 (figure 1.4, panel A).
Regional GDP is estimated to have contracted by 2 percent in 2020 (figure 1.4, panel B), with nearly all the economies in recession and roughly two-thirds expe-riencing deeper contractions than during the global financial crisis. The contrac-tion was smaller than anticipated due to a robust recovery in Turkey, especially, as well as resilience in other economies despite heightened geopolitical tensions. Industrial production rebounded to pre-pandemic levels and goods trade firmed on the back of improving external demand, particularly from China. However, services activity remained subdued, as social distancing measures and sustained weakness in international tourism weighed on its recovery.
Although the regional recovery was interrupted by a sharp resurgence of the virus in late 2020, the slowdown was shallower than during the initial outbreak, reflecting resilience in industrial activity and an improvement in commodity prices. The development of multiple, effective vaccines also bolstered confidence. To varying degrees, the resilience also reflected the regional economy’s ability to adapt and adjust to containment measures (figure 1.4, panel C). Nonetheless,
1. In this section, ECA refers to the 23 EMDEs in ECA for which the World Bank forecasts GDP growth.
Chapter 1: The Continuing COVID-19 Pandemic and the Economic Outlook ● 13
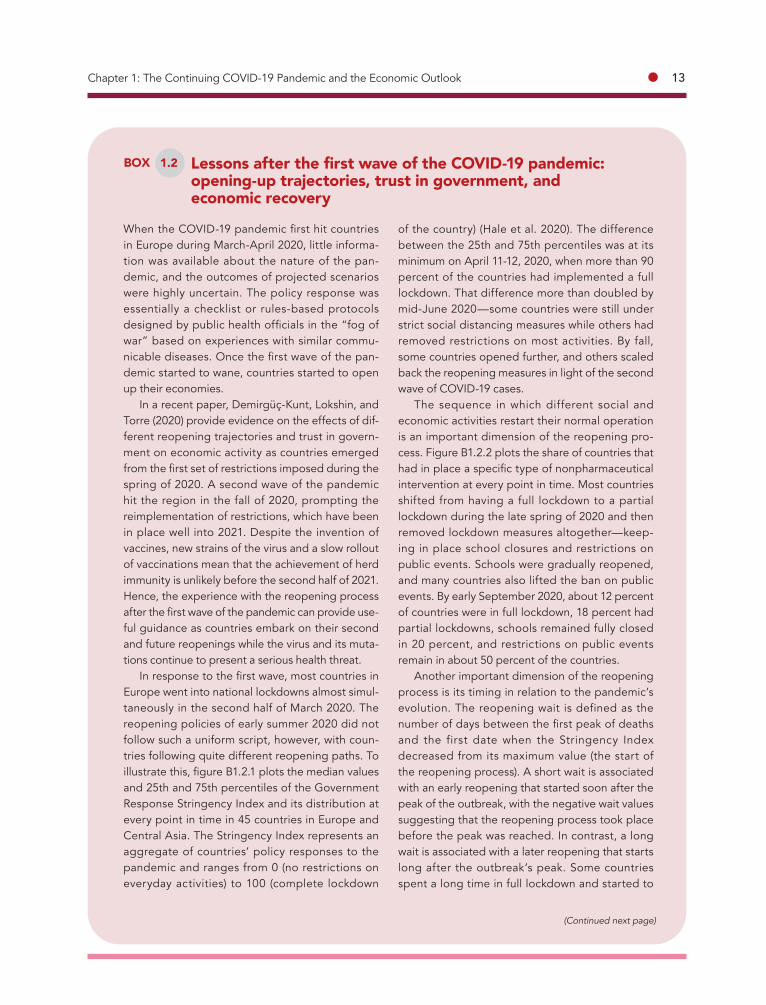
When the COVID-19 pandemic first hit countries in Europe during March-April 2020, little informa-tion was available about the nature of the pan-demic, and the outcomes of projected scenarios were highly uncertain. The policy response was essentially a checklist or rules-based protocols designed by public health officials in the “fog of war” based on experiences with similar commu-nicable diseases. Once the first wave of the pan-demic started to wane, countries started to open up their economies.
In a recent paper, Demirgüç-Kunt, Lokshin, and Torre (2020) provide evidence on the effects of dif-ferent reopening trajectories and trust in govern-ment on economic activity as countries emerged from the first set of restrictions imposed during the spring of 2020. A second wave of the pandemic hit the region in the fall of 2020, prompting the reimplementation of restrictions, which have been in place well into 2021. Despite the invention of vaccines, new strains of the virus and a slow rollout of vaccinations mean that the achievement of herd immunity is unlikely before the second half of 2021. Hence, the experience with the reopening process after the first wave of the pandemic can provide use-ful guidance as countries embark on their second and future reopenings while the virus and its muta-tions continue to present a serious health threat.
In response to the first wave, most countries in Europe went into national lockdowns almost simul-taneously in the second half of March 2020. The reopening policies of early summer 2020 did not follow such a uniform script, however, with coun-tries following quite different reopening paths. To illustrate this, figure B1.2.1 plots the median values and 25th and 75th percentiles of the Government Response Stringency Index and its distribution at every point in time in 45 countries in Europe and Central Asia. The Stringency Index represents an aggregate of countries’ policy responses to the pandemic and ranges from 0 (no restrictions on everyday activities) to 100 (complete lockdown
of the country) (Hale et al. 2020). The difference between the 25th and 75th percentiles was at its minimum on April 11-12, 2020, when more than 90 percent of the countries had implemented a full lockdown. That difference more than doubled by mid-June 2020—some countries were still under strict social distancing measures while others had removed restrictions on most activities. By fall, some countries opened further, and others scaled back the reopening measures in light of the second wave of COVID-19 cases.
The sequence in which different social and economic activities restart their normal operation is an important dimension of the reopening pro-cess. Figure B1.2.2 plots the share of countries that had in place a specific type of nonpharmaceutical intervention at every point in time. Most countries shifted from having a full lockdown to a partial lockdown during the late spring of 2020 and then removed lockdown measures altogether—keep-ing in place school closures and restrictions on public events. Schools were gradually reopened, and many countries also lifted the ban on public events. By early September 2020, about 12 percent of countries were in full lockdown, 18 percent had partial lockdowns, schools remained fully closed in 20 percent, and restrictions on public events remain in about 50 percent of the countries.
Another important dimension of the reopening process is its timing in relation to the pandemic’s evolution. The reopening wait is defined as the number of days between the first peak of deaths and the first date when the Stringency Index decreased from its maximum value (the start of the reopening process). A short wait is associated with an early reopening that started soon after the peak of the outbreak, with the negative wait values suggesting that the reopening process took place before the peak was reached. In contrast, a long wait is associated with a later reopening that starts long after the outbreak’s peak. Some countries spent a long time in full lockdown and started to
Lessons after the first wave of the COVID-19 pandemic: opening-up trajectories, trust in government, and economic recovery
BOX 1.2
(Continued next page)

14 ● World Bank ECA Economic Update Spring 2021
(continued)BOX 1.2
(Continued next page)
FIGURE B1.2.1 Oxford Stringency Index for countries in Europe and Central Asia
0
20
40
60
80
100
Strin
genc
y in
dex
01jan2020 01apr2020 01jul2020 01oct2020
75th percentile
25th percentile
Median
Finland
Italy
Serbia
Source: Demirgüç-Kunt, Lokshin, and Torre 2020.Note: The figure plots the values of the Oxford Stringency Index for countries in Europe and Central Asia. Individual country values are plotted with thin grey lines. The thick black line represents the median value across countries in the region, while the dashed black lines represent the 25th and 75th percentiles of the index’s distribution at every point in time. The blue line plots the values corresponding to Finland; the green line plots the values corresponding to Italy; and the red line plots the values corresponding to Serbia.
FIGURE B1.2.2 Implementation of nonpharmaceutical interventions over time
0
20
40
60
80
100
Perc
ent o
f cou
ntrie
s im
plem
entin
g N
PIs
01feb2020 01apr2020 01jun2020 01aug2020 01oct2020
Social distancingSchool closurePartial lockdownFull lockdown
Source: Oxford University, World Bank.Note: The figure plots the share of countries in Europe and Central Asia adopting each type of nonpharmaceutical intervention at each date between February 1 and October 1, 2020. Social distancing is defined as the canceling of public events and large gatherings. A partial lockdown only applies to a geographical region or a targeted set of activities.

Chapter 1: The Continuing COVID-19 Pandemic and the Economic Outlook ● 15
(continued)
undo some of the restrictions only when COVID-19 cases had decreased considerably. Other coun-tries began reopening when the infection rates were still high or not decreasing. The median wait in the sample of countries is 11 days after the peak of the outbreak. A quarter of the countries started relaxing their restrictions before the first peak. The Russian Federation initiated the earliest reopening, only one week after implementing a full lockdown and almost two months before its COVID-19 deaths peaked. In contrast, Sweden took the longest time to scale back its restrictions, 57 days after the peak of COVID-19-related deaths, but it never imple-mented severe restrictions in the first place.
Another dimension of interest is the speed of the reopening process—how fast the restrictions were lifted. Analyzing the changes in the Strin-gency Index provides a daily measure of the speed of reopening. For each country, figure B1.2.3 plots
BOX 1.2
the average speed of reopening against the Strin-gency Index at the beginning of their reopening process. On average, countries with a higher Strin-gency Index at the start of the process eventually reopened their economies faster than countries with lower levels of restrictions, but the dispersion is large. For example, Italy and Ireland had similar levels of restrictions at the peak of the pandemic, but the average reopening speed for Ireland was about four times higher than that for Italy.
Demirgüç-Kunt, Lokshin, and Torre (2020) analyze the effects of different dimensions of the reopening process on economic recovery using a panel data econometric model. The primary out-come variable in the analysis and the proxy for eco-nomic activity is the log difference between the observed and counterfactual (with no pandemic) electricity consumption. The results suggest that countries that adopted a gradual and staged
(Continued next page)
FIGURE B1.2.3 Average speed of reopening and the Stringency Index at the start of reopening in countries in Europe and Central Asia
AUT
BELBGR
BIH
CHE
CYP
CZE
DEU
DNK
ESP
EST
FIN
FRA
GBR
GEO
GRC
HRV
HUN
IRL
ITA
LTU
LVA
MDANLD
NOR
POL
PRT
ROURUS
SRB
SVKSVN
SWE
TUR
UKR
0
.1
.2
.3
.4
.5
.6
Spee
d of
reop
enin
g
40 50 60 70 80 90 100
Stringency at the start of reopening
Source: Authors.Note: The speed of reopening is expressed as daily changes in the smoothed Stringency In-dex. The Stringency Index is the Oxford Stringency Index by Hale et al. (2020) at the start of the reopening process, defined as the date when the index first shows a decrease from its max-imum recorded value during March-April 2020.

16 ● World Bank ECA Economic Update Spring 2021
mobility trends deteriorated and the Composite PMIs and Manufacturing PMIs faltered across the region.
All in all, five or more years of per capita income gains are estimated to have been erased due to the pandemic in about one-sixth of the economies in 2020. The economies that have been hardest hit by the pandemic are those with strong trade or financial linkages to the euro area and those that are heavily dependent on services and tourism (Croatia, Kosovo, and Montenegro). Mounting job losses in Europe and the impact of the oil price collapse in Russia initially weighed on remittances, but they have rebounded strongly as migrant workers have
(continued)
reopening experienced stronger economic recov-ery compared with the countries that rushed into lifting the restrictive measures. The transition from full to partial to no lockdown appears to be a more effective strategy of lifting the restrictions than a direct move from full to no lockdown. Similarly, economic activity seems to react positively to par-tial school reopening, compared with full school reopening.
The timing of reopening, defined as the number of days countries wait after the first peak of deaths before they start reopening, also matters. Open-ing before the peak reduces electricity consump-tion relative to the predicted level, while delaying reopening past the peak leads to faster recovery. However, when this decision is modeled to be based strictly on epidemiological considerations, it has no effect on the path of economic recovery. The analysis shows that countries that gradually lifted the stringency measures, rather than lifting them faster, experienced a more robust economic recovery.
Trust in government institutions is generally an important determinant of the effectiveness of poli-cies on economic outcomes. In this case, high lev-els of trust in government (and interpersonal trust) are likely to be associated with better compliance with social distancing measures. Demirgüç-Kunt, Lokshin, and Torre (2020) also explore the effects of trust in government and people’s perceptions about the pandemic on the recovery process, using data from the 2018 round of the European Social Survey and the 2016 Life in Transition Survey.
BOX 1.2
They find that governance, particularly trust in gov-ernment institutions, is an essential determinant of economic recovery. Specifically, their results show that a higher level of trust in government is associated with a faster recovery among countries that carried out a gradual reopening process. The analysis also shows that fear and anxiety about the spread of the pandemic may hinder the recovery of economic activity as countries reopen. There is suggestive evidence that providing the population objective information and data about the prog-ress of the pandemic could be an effective policy instrument in promoting faster recovery, although causality is difficult to establish.
The findings have important policy implica-tions for the second wave of the COVID-19 pan-demic that swept most of the world in late 2020. Given the “pandemic fatigue” and growing public exhaustion and frustration with restrictions, public officials in many countries were initially more reluc-tant to introduce strict interventions, fearing their economic impact, although they quickly found themselves with few other options as the second wave of the pandemic worsened. As countries start their second reopening process, Demirgüc-Kunt, Lokshin, and Torre’s (2020) results suggest that a careful, gradual, and transparent reopening pro-cess is likely to be optimal for minimizing the health costs of the pandemic and increasing the chances of a faster recovery. The results also suggest the importance of building trust for governments to increase their chances of success in this process.
Source: Adapted from Demirgüc-Kunt, Lokshin, and Torre (2020).

Chapter 1: The Continuing COVID-19 Pandemic and the Economic Outlook ● 17
benefited from host country macroeconomic support and a drawdown in savings (figure 1.4, panel D) (Dinarte et al. 2021; Quayyum and Kpodar 2020; ILO 2021).2 Within ECA, increases in the number of unemployed were particularly pro-
2. There could be several explanations for the observed recovery of remittance flows in the second half of 2020 and early 2021. Some studies indicate that migrants might have drawn on their saving to send money home during the pandemic, or that some migrants were able to access cash transfers offered by host country governments. Another relevant explanation for ECA is a shift in flows from informal (unrecorded) hand-carrying to formal (recorded) remittance channels. The emerging studies (for example, Dinarte et al., 2021) indicate that the mobility constraints that prevented travelers from carrying cash across borders made electronic wire transfers the only option to remit. Because wire transfers are registered by the central banks, many countries saw an increase in formal remittances over the past sev-eral months. However, the impact of this compositional shift on the total amount of remit-tances is unclear.
Sources: Haver Analytics; Oxford University; UNCTAD; World Bank. Note: CA = Central Asia; CE = Central Europe; ECA = Europe and Central Asia; EE = Eastern Europe; EMDE = emerging markets and developing economies; LAC = Latin America and the Caribbean; SCC = South Caucasus; WBK = Western Balkans.A. The figure shows the number of deaths per capita attributed to COVID-19. Orange markers indicate the regional number of confirmed COVID-19 cases per capita in LAC and ECA.B. Shaded areas indicate forecasts. The figure shows the baseline scenario as presented in the January 2021 edition of the Global Economic Prospects report.C. The figure shows the contribution to forecast revisions between current projections and the January 2021 edition of the Global Economic Prospects report.D. Retail sales volume is seasonally adjusted. The last observation is January 2021 for retail sales and December 2020 for remittances. The sample for retail sales includes nine ECA countries. The sample for remittances includes seven ECA countries.
FIGURE 1.4 Recent developments and outlook in ECA
b. Growth in ECA
c. Contributions to forecast revisions for ECA growth d. Retail sales and remittances inflows in ECA
a. EMDEs with the highest COVID-19deaths and cases per capita
0
1,000
2,000
3,000
4,000
0
40
80
120
160
LAC ECA
Deaths Cases (RHS)
Dea
ths
per 1
00,0
00 p
eopl
e
Case
s pe
r 100
,000
peo
ple
−6
−3
0
3
6
2020
2021
2022
2020
2021
2022
2020
2021
2022
2020
2021
2022
2020
2021
2022
2020
2021
2022
ECA CE WBK SCC EE CA
Perc
ent
−0.2
0.0
0.2
0.4
0.6
0.8
1.0
2020 2021
CEWBK
SCCEE
CARussian Federation
Turkey
Perc
enta
ge p
oint
s
60
80
100
120
140
160
180
Jan-
20
Feb-2
0
Mar-
20
Apr-20
May
-20
Jun-
20Ju
l-20
Aug-2
0
Sep-2
0
Oct-20
Nov-20
Dec-2
0
Jan-
21
Retail sales Remittances
Inde
x, 1
00=J
anua
ry 2
020

18 ● World Bank ECA Economic Update Spring 2021
nounced in some Central European countries and Russia. As countries gradually withdraw labor support measures, however, job losses could swell again. This could undermine an inclusive recovery in parts of the region, particularly in East-ern Europe, where increases in the unemployment rate have been higher for fe-males relative to males during the pandemic (ILO 2021).
It is estimated that the pandemic will push an additional 2.2 million people under the $3.20 a day poverty line in the region. At the $5.50 a day poverty line, which is more commonly used in upper-middle-income countries, this figure is as high as six million. Household surveys in some countries, particularly in Cen-tral Asia, have been reporting an uptick in food insecurity (figure 1.5, panels A and B) (World Bank 2020h). Even prior to the pandemic, households in some ECA economies—mainly in Central Asia, Eastern Europe, and the South Caucasus—were spending more than 40 percent of their budget on food (UNECE 2020).
The poor and the vulnerable generally bear a disproportionately higher bur-den of the pandemic, representing the majority of job losses. Moreover, they sel-dom benefit equally from the recovery, underscoring the importance of prioritiz-ing policies to promote inclusive recovery. Box 1.3 expands on this issue by providing insights from the Turkish experience with the pandemic and recovery.
Economic performance in the ECA region has diverged recently, reflecting the fragmented approach to COVID-19 vaccine procurement and distribution. Lead-ing up to the rollout of multiple vaccines in ECA, activity in the region’s two largest economies—Russia and Turkey—was more resilient than previously an-ticipated. This was especially the case in Turkey, where full-year GDP exceeded expectations and grew 1.8 percent, with growth in the fourth quarter of 2020 eclipsing all other Group of Twenty (G20) economies except China. In addition to
FIGURE 1.5 Food price developments in ECA
b. Food prices in ECAa. Food price inflation in ECA and EMDEs
0
2
4
6
8
Dec-1
9
Jan-
20
Feb-2
0
Mar-
20
Apr-20
May
-20
Jun-
20Ju
l-20
Aug-2
0
Sep-2
0
Oct-20
Nov-20
Dec-2
0
ECA EMDE average
Perc
ent
70
90
110
130
150
Jan-
20
Feb-2
0
Mar-
20
Apr-20
May
-20
Jun-
20Ju
l-20
Aug-2
0
Sep-2
0
Oct-20
Nov-20
Dec-2
0
Jan-
21
Feb-2
1
Maize Wheat Rice
Inde
x,10
0=Ja
n1,2
020
Sources: Bloomberg; World Bank.Note: ECA = Europe and Central Asia; EMDEs = emerging markets and developing economies.A. The figure shows the ECA median and EMDE unweighted average year-on-year change in country price indexes for food and nonalcoholic bev-erages. The last observation is December 2020.B. The last observation is February 10, 2021.

Chapter 1: The Continuing COVID-19 Pandemic and the Economic Outlook ● 19
COVID-19 is the largest public health and eco-nomic crisis to hit the world in nearly a century. The crisis has revealed deep inequalities, with the poor bearing a disproportionately higher burden.
In the case of Turkey, poverty was on a down-ward trend until the 2018 currency crisis and inequality has been on the rise in recent years. Recent analysis using micro data on job losses and household consumption to gauge the impact of the pandemic suggests that the crisis may create 1.6 million new poor in Turkey, setting back pov-erty reduction gains by three years.
To contain the spread of infections when the pandemic first struck Turkey in March last year, the government imposed strict measures that reduced human mobility by 70–80 percent. As a result, economic activity plunged, shrinking the Turkish economy by 9.9 percent in the second quarter of 2020. Together with massive disruptions in global trade and tourism, this led to the destruction of 2.6 million jobs (9.2 percent of total employment) in a matter of weeks. But a closer look at the numbers shows significant variability in the effects of the pandemic on different segments of the popula-tion. Figure B1.3.1 shows that the bulk of the job cuts impacted informal workers, the lower-skilled,
as well as women. Compared with male workers, female workers were three times more likely to become unemployed given their concentration in activities that were highly affected by the contain-ment measures, such as hospitality, food, tourism, and other services.
All in all, in Turkey, the poor and the vulnerable (those above the poverty line but with high levels of economic insecurity), representing the bottom 40 percent of the income distribution, account for 6 in 10 jobs that vanished during the crisis (figure B1.3.2). In stark contrast, the better-off were much less likely to stop working, and the top decile of the income distribution even enjoyed net job gains. At the same time, at the peak of the crisis, four mil-lion people (12.3 percent of employment) opted out or decided not to enter the labor market due to weak job prospects or school closures. This set-back is particularly worrisome for women, whose labor force participation declined by 5.2 percent-age points to 29.2 percent between April 2019 and April 2020. Bringing them back to the market may prove challenging. It took Turkey almost a decade of robust and stable growth to lift female labor force participation by a similar rate.
Need for an inclusive recovery: insights from the COVID-19 crisis in Turkey
BOX 1.3
(Continued next page)
FIGURE B1.3.1 Informal and female workers are bearing the brunt of the job crisis in TurkeyYear-on-year percentage change in employment
−0.25
−0.20
−0.15
−0.10
−0.05
0.00
0.05
Jan-
20
Feb-2
0
Mar-
20
Apr-20
May
-20
Jun-
20
Aug-2
0
Sep-2
0
Perc
ent
Perc
ent
Formal Informal
−0.12
−0.10
−0.08
−0.06
−0.04
−0.02
0.00
0.02
Jan-
20
Feb-2
0
Mar-
20
Apr-20
May
-20
Jun-
20Ju
l-20
Jul-2
0
Aug-2
0
Sep-2
0
Male Female
Source: World Bank calculations using TurkStat data.

20 ● World Bank ECA Economic Update Spring 2021
(continued)BOX 1.3
(Continued next page)
In addition to the losses in income from the crisis, high inflation—largely fueled by monetary and credit expansion policies to stimulate the economy—further squeezed the already strained purchasing power of poor households. In the sec-ond half of 2020, the prices of basic goods and ser-vices with a high share in the typical consumption basket of low-income families recorded significant increases: prices of unprocessed foods rose by 19.8 percent, bread and cereals by 16.3 percent, and transport by 14.7 percent. The overall Consumer Price Index rose by 12.6 percent.
Unequal Recovery The Turkish economy rebounded strongly in the third quarter of 2020 as the first wave of COVID-19 subsided, the stimulus package kicked in, and restrictions on mobility were eased. As of Septem-ber 2020, 72 percent of the jobs that had been lost (1.9 million) had been regained. But the job recov-ery has been unequal, benefitting mainly formal and skilled workers. As of September, more than half a million women remained out of the labor
market and another half a million who were unem-ployed had not recovered their jobs. These dispari-ties are not exclusive to Turkey. Overall, data from developing countries and advanced economies show that the labor market recession for high-wage workers has been shorter and milder (for instance, lasting only three months in the United States), whereas it is still weighing heavily on workers at the bottom of the income distribution.
For a robust and sustainable recovery, many voices are calling for a renewed emphasis on mak-ing economies greener and knowledge- and tech-nology-based in the post-pandemic era. The cur-rent crisis also offers a great opportunity to tackle another long-standing critical challenge that is being exposed and further exacerbated by COVID-19: rising inequality.
The increase in poverty in Turkey could have been three times higher had the government not acted swiftly and decisively, implementing a num-ber of mitigation policies such as increased social transfers, unemployment insurance benefits, and unpaid leave subsidies. The Turkish government’s
FIGURE B1.3.2 Net job losses at the peak of the crisis across income deciles
−5
0
5
10
15
20
−100,000
0
100,000
200,000
300,000
400,000
500,000
Income deciles
Job losses Percentage
Perc
enta
ge o
f tot
al jo
b lo
sses
Net
job
loss
es
1 2 3 4 5 6 7 8 9 10
Source: World Bank calculations using TurkStat data.Note: Values are net changes in employment between April 2019 and April 2020. The circles show job losses as a percentage change in employment for each decile. Negative numbers correspond to net job gains.

Chapter 1: The Continuing COVID-19 Pandemic and the Economic Outlook ● 21
(continued)
pandemic mitigation efforts have been laudable and effective but addressing the growing inequali-ties will require extra policy action.
Among the most immediate challenges are to protect the livelihoods and human capital of dis-advantaged households. With many individuals unable to find a job or work for enough hours, guaranteeing a minimum level of consumption requires extending the length and adequacy of benefits from the ongoing social assistance emer-gency support. Priority should be given to urban self-employed workers—about a third of total employment and comprised mostly by unskilled workers in high-risk sectors—who are not covered by the wage support mechanisms that are part of the crisis response.
The impact of the crisis on education is a seri-ous concern. According to the World Bank’s Europe and Central Asia Economic Update, Fall 2020, close to one learning-adjusted year of schooling will be wiped out in the region due to school closures. Most of these losses will be borne by children in low-income families weighed down by the digital divide. Only 6 percent of poor fami-lies in Turkey own a computer and two in three poor households lack internet access. In addition
BOX 1.3
to current strategies to strengthen distance learn-ing, Turkey will have to step up investments in early childhood education and learning support to ease the transition back to school, close the learning gaps of poor children with their peers, and reduce the risk of massive dropouts.
Finally, the conditions created by the pandemic will accelerate preexisting structural changes in the labor market, such as the shift to work from home and automation. These forces will weaken the demand for some types of labor, particularly low-skilled workers. In Turkey, about 10 percent of jobs can be performed from home, but the overwhelm-ing majority of them are in sectors and occupations that are only suitable for higher-skilled workers. Upskilling, training, and other active labor inter-ventions, many of which are currently implemented by the Turkish Employment Agency, will have to be sustained and deepened in a post-pandemic economy to avoid further widening of those gaps.
It is not too late to change the course of global and regional inequality and make the recovery not only robust and sustainable, but also equitable. It is time now more than ever for trust, solidarity, and above all greater inclusiveness.
Source: Based on the blog by Asli Demirgüc-Kunt and Javier Baez,https://blogs.worldbank.org/europeandcentralasia/urgency-promoting-more-equal-recovery-insights-covid-19-crisis-turkey.
Turkey, Tajikistan and Uzbekistan are also among the few economies in the world that are estimated to have grown in 2020. However, the recovery in other ECA economies has been interrupted by a recent flare-up in COVID-19 cases. Further-more, the rate of vaccine distribution across the region lags the acceleration in daily new cases, which could lead to disappointing regional growth outcomes.
ECA’s EMDEs have experienced larger portfolio outflows relative to others since the early stages of the pandemic, reflecting a loss of investor confidence and a flight to safety (figure 1.6, panel A). These outflows reignited currency depre-ciation and reserve losses. Foreign direct investment (FDI) inflows also collapsed more severely in ECA compared with other EMDEs last year, with levels falling to a near 20-year low as large energy exporters, especially Russia, grappled with the decline in extractive investment (figure 1.6, panel B) (UNCTAD 2021b). De-spite retreating somewhat since the onset of the pandemic, bond spreads are

22 ● World Bank ECA Economic Update Spring 2021
elevated relative to a year ago, and in some cases, they spiked again due to policy uncertainty, geopolitical tensions, or external financing pressures. Some ECA EMDEs subsequently faced external financing pressures, including from the col-lapse in FDI inflows, but were partly able to offset these tensions by tapping into Eurobond markets and bilateral funding from Russia.
Monetary policy became more expansionary as economic conditions deterio-rated in 2020. Several central banks intervened in foreign exchange markets to stabilize their currencies and mitigate volatility (Croatia, Kazakhstan, Kyrgyz Republic, Serbia, and Turkey), while others tapped sovereign wealth funds (Azerbaijan and Kazakhstan). Some countries have used unconventional poli-cies, such as asset purchases (Croatia, Hungary, Poland, Romania, and Turkey) (figure 1.7, panel A). Recent currency depreciation and capacity constraints have put further upward pressure on inflation and reduced the scope for additional policy rate cuts, especially for countries with inflation near or above target ranges. Of the 17 ECA economies with stated inflation targets, nearly half reported head-line inflation that exceeded the upper inflation band in early 2021 (figure 1.7, panel B). As a result of inflationary pressures, roughly a third of ECA’s economies were forced to abruptly hike policy interest rates in early 2021.
Fiscal support packages were announced in nearly all ECA economies, with several governments receiving aid from official sources, ramping up borrowing in debt markets, and prioritizing spending to bolster health care systems, strengthen safety nets, support the private sector, and counter financial market disruptions. Job retention and labor market support schemes were also imple-mented to sustain employment. Although the average fiscal response has been larger in ECA than in most other EMDE regions, there is wide variation within
FIGURE 1.6 Portfolio and FDI flows in ECA
b. Foreign direct investment inflowsby region, 2019 and 2020 a. ECA portfolio outflows
Perc
ent o
f GD
P, a
ccum
ulat
edw
eekl
y flo
ws
−1.4
−1.2
−1.0
−0.8
−0.6
−0.4
−0.2
0.0
0 5 10 15 20 25 30 35 40 45 50 55
Weeks
EMDEs ECA
−42%
−69%
−12%
−77%
0 500 1,000 1,500
World
Advancedeconomies
EMDEs
ECA
2020 2019
US$, billions
Sources: Institute of International Finance; UNCTAD; World Bank.Note: ECA = Europe and Central Asia; EMDEs = emerging markets and developing economies; GDP = gross domestic product.A. The start date of the COVID-19 episode is January 24, 2020. The ECA sample includes Hungary, Poland, Turkey, and Ukraine due to data limita-tions. The last observation is March 5, 2021.

Chapter 1: The Continuing COVID-19 Pandemic and the Economic Outlook ● 23
the region (figure 1.7, panel C). Some ECA economies have announced new fiscal actions or extended the previous temporary measures, while others are contem-plating new legislation. However, many economies will not be able to maintain the level of expenditures needed to support the recovery in 2021–22, which could force some countries into premature fiscal tightening. In all, the fiscal response and contraction in output is expected to raise average debt levels to over 50 percent of GDP by 2022—roughly 9 percentage points higher than in 2019 (figure 1.7, panel D).
Sources: Bank for International Settlements; Bloomberg; Haver Analytics; IMF; Kose et al. 2020; World Bank.Note: CA = Central Asia; CE = Central Europe; ECA = Europe and Central Asia; EE = Eastern Europe; EMDEs = emerging markets and developing economies; GDP = gross domestic product; IMF = International Monetary Fund; SCC = South Caucasus; WBK = Western BalkansA. Blue bars denote unweighted regional averages of announced central bank asset purchase programs, expressed relative to nominal local curren-cy GDP in 2019. Yellow whiskers indicate the range of programs. The ultimate size of asset purchase programs in some countries will depend on market conditions; data for these countries reflect total assets purchased up to August 13, 2020.B. Inflation is seasonally adjusted. Last observation is December 2020 for Armenia and Tajikistan, February 2021 for Ukraine and Turkey, and Janu-ary 2021 for others. C. Fiscal stimulus measures are derived from the October 2020 IMF Fiscal Monitor Database. Aggregates are the GDP-weighted average of the to-tal fiscal package and its components. “Discretionary measures” includes revenue and expenditure measures; “equity injections” includes equity injections, loans, and asset purchases; and “contingent liabilities” includes loan guarantee and other quasi-fiscal measures.D. Aggregates are 2021–22 unweighted averages of general government gross debt. The horizontal line corresponds to 2010–19 unweighted aver-ages. The sample includes 23 ECA countries.
FIGURE 1.7 Macroeconomic policy in ECA
b. Inflation versus targets in ECA countries
c. ECA COVID-19 fiscal stimulus packages d. Average government debt levels in ECA, 2021–22
a. Asset purchases in ECA and EMDEs
0
4
8
12
16
Croatia Poland Turkey Hungary Romania
Advanced-economy average EMDE average
Perc
ent o
f GD
P
0
4
8
12
16
Turke
y
Kyrgyz
Repub
lic
Tajik
istan
Ukraine
Belaru
s
Kazak
hstan
Russia
n
Feder
ation
Armen
ia
Georg
ia
Inflation Inflation target Inflation upper target
Perc
ent,y
ear-o
n-ye
ar
0
3
6
9
12
15
ECA Turkey CE WBK SCC CA RussianFederation
EE
Equity injections Contingent liabilitiesDiscretionary measures Total fiscal
Perc
ent o
f GD
P
0
10
20
30
40
50
60
70
WBK CE EE ECA SCC Turkey CA Russian Federation
2010–19 average
Perc
ent o
f GD
P

24 ● World Bank ECA Economic Update Spring 2021
Regional Outlook
The economy of ECA is projected to expand by a moderate 3.6 percent in 2021, reflecting lingering disruptions to activity from an earlier resurgence of CO-VID-19 and the emergence of more contagious variants of the virus (table 1.1; annex 1.1). Although this forecast is stronger than projected in January, the out-look remains challenging due to a worsening of the pandemic, combined with tightening monetary policy as well as elevated policy uncertainty and geopoliti-cal tensions. The strength and speed of the recovery will depend on the effective-ness of pandemic management and the pace of vaccine deployment. Rollouts have proceeded in most of the region’s economies, as expected, but the number of doses administered remains low amid procurement challenges.
Growth is expected to strengthen to 3.8 percent in 2022, as the economic effects of the pandemic gradually wane and the recovery in trade and investment gath-ers momentum. Although growth is set to pick up in 2022, it is weaker than en-visioned in January, reflecting tighter-than-expected macroeconomic policy and elevated policy uncertainty. As a result, per capita GDP is forecast to remain 2.9 percent below pre-pandemic trends by 2022 (figure 1.8, panel A). The pandemic is also expected to exacerbate the slowdown in productivity growth over the long
TABLE 1.1 Europe and Central Asia growth forecast summary(real GDP growth at market prices in percent, unless indicated otherwise)
2018 2019 2020e 2021f 2022f
Percentage point differences from January 2021 projections
2020e 2021f 2022f
EMDE ECA, GDPa 3.5 2.5 −2.0 3.6 3.8 0.9 0.3 −0.1EMDE ECA, GDP excl. Turkey 3.7 3.1 −3.2 3.2 3.6 0.8 0.3 0.1
Commodity exportersb 3.0 2.5 −3.0 3.1 3.3 0.9 0.4 0.1Commodity importersc 3.9 2.6 −1.0 4.2 4.3 1.0 0.3 −0.2Central Europe and Baltic Statesd 4.9 4.2 −3.6 3.6 4.1 0.7 0.0 −0.1Western Balkanse 4.0 3.6 −3.6 4.4 3.7 0.9 0.9 0.0Eastern Europef 3.3 2.7 −3.3 1.9 2.7 1.1 0.6 0.2South Caucasusg 2.7 3.6 −5.2 3.1 4.2 0.5 0.6 −0.6Central Asiah 4.5 4.9 −1.5 3.7 4.1 0.2 0.7 0.3
Russian Federation 2.8 2.0 −3.1 2.9 3.2 0.9 0.3 0.2Turkey 3.0 0.9 1.8 5.0 4.5 1.3 0.5 −0.5Poland 5.4 4.5 −2.7 3.3 4.2 0.7 −0.2 −0.1
Source: World Bank.Note: World Bank assumptions are frequently updated based on new information and changing (global) circumstances. Consequently, the work-ing assumptions presented here may differ from those contained in other World Bank documents, even if basic assessments of countries’ pros-pects do not differ at any given moment. Due to lack of reliable data of adequate quality, the World Bank is currently not publishing economic output, income, or growth data for Turkmenistan, and Turkmenistan is excluded from cross-country macroeconomic aggregates. e = estimate; ECA = Europe and Central Asia; EMDE = emerging market and developing economy; f = forecast; GDP = gross domestic product.a. GDP and expenditure components are measured in 2010 prices and market exchange rates.b. Includes Albania, Armenia, Azerbaijan, Kazakhstan, the Kyrgyz Republic, Kosovo, the Russian Federation, Tajikistan, Ukraine, and Uzbekistan.c. Includes Belarus, Bosnia and Herzegovina, Bulgaria, Croatia, Georgia, Hungary, Moldova, Montenegro, North Macedonia, Poland, Romania, Serbia, and Turkey.d. Includes Bulgaria, Croatia, Estonia, Hungary, Latvia, Lithuania, Poland, and Romania.e. Includes Albania, Bosnia and Herzegovina, Kosovo, Montenegro, North Macedonia, and Serbia.f. Includes Belarus, Moldova, and Ukraine.g. Includes Armenia, Azerbaijan, and Georgia.h. Includes Kazakhstan, the Kyrgyz Republic, Tajikistan, and Uzbekistan.

Chapter 1: The Continuing COVID-19 Pandemic and the Economic Outlook ● 25
run, through its damaging effects on investment and human capital accumula-tion (figure 1.8, panel B) (Dieppe 2020).
In all, the near-term outlook is predicated on the distribution of effective vac-cines gathering pace in the first half of 2021 in advanced economies and major EMDEs, then later in the year for others. It also assumes that policy uncertainty will remain in check and that geopolitical tensions will not re-escalate in the re-gion. Due to considerable uncertainty surrounding the pandemic and subse-quent growth forecasts, box 1.4 discusses downside and upside scenarios.
Trends in Europe and Central Asia: Major Economies and Subregions
Russian Federation
After peaking in late December, the number of daily new COVID-19 cases more than halved in early 2021. Restrictions to slow the spread of the virus are ex-pected to remain in place until a larger share of the population is vaccinated. Despite the rollout of Russia’s Sputnik V vaccine in December, less than 5.4 per-cent of the population had received a dose as of mid-March, reflecting a general reluctance to be immunized. Unless vaccine uptake accelerates, the Ministry of Health’s target of vaccinating 60 percent of adults by mid-2021 could remain a distant goal. Internationally, Sputnik V had been approved in about 50 countries as of mid-March.
The contraction in output in 2020 was shallower than anticipated, with the Russian economy shrinking -3.1 percent compared with the January estimate of -4 percent (table 1.2). Despite high compliance with OPEC+ production cuts, in-dustrial activity was more resilient than had been assumed, as policy makers
FIGURE 1.8 GDP trends in ECA
b. Long-term investment forecastsa. GDP per capita growth gaps with pre-pandemic projections by 2022
−10
−8
−6
−4
−2
0
EE SCC WBK CA CE ECARussian
Federation Turkey
Perc
ent
Perc
ent
0
2
4
6
8
2021
2022
2023
2024
2025
2026
2027
2028
Turkey Russian FederationECA Central Europe
Sources: Consensus Economics; World Bank.Note: CA = Central Asia; CE = Central Europe; ECA = Europe and Central Asia; EE = Eastern Europe; EMDEs = emerging markets and developing economies; GDP = gross domestic product; IMF = International Monetary Fund; SCC = South Caucasus; WBK = Western Balkans.A. The figure shows the gaps between the current projections and the forecasts released in the January 2020 edition of the Global Economic Pros-pects report.B. The figure shows long-term investment Consensus forecasts. Aggregates were calculated using GDP-weighted averages.

26 ● World Bank ECA Economic Update Spring 2021
The COVID-19 pandemic has inflicted a severe human and economic toll in Europe and Central Asia (ECA), with millions of lives and jobs lost since the initial global spread of the virus in March 2020. The rollout of multiple effective COVID-19 vaccines, however, alongside social distancing measures is expected to help rein in the number of daily new COVID-19 cases. Widespread vaccination could allow for a gradual relaxation of pandemic-related restrictions, which would set the stage for a rebound in economic activity later this year. In con-trast, the materialization of risks related to the pan-demic—including delays in vaccine procurement, delivery, or administration—could dim the outlook.
Against this backdrop, this box examines how the regional outlook will continue to be shaped by vaccine developments and risks, by addressing the following questions:
• How are pandemic and vaccine trends evolv-ing in ECA?
• What vaccine assumptions underpin the region’s near-term economic outlook?
• What are the underlying vaccine risks and what impact could they have on the region’s near-term economic outlook?
Recent pandemic and vaccine trends in ECA A sharp acceleration of COVID-19 infections that started in late 2020 forced several governments in ECA to reintroduce or extend social distanc-ing measures into 2021. Although initially this appeared to have contributed to a steep fall in the number of daily new COVID-19 cases, several economies in the region are experiencing a flare-up as authorities grapple with new, more transmis-sible strains of the virus or as increases in mobility counteract restrictive measures (figure B1.4.1, pan-els A and B). A recent rise in the rate of positive COVID-19 tests, particularly in Central Europe and the Western Balkans, suggests that the number of actual cases could be higher than confirmed by current testing capacity.
Since the start of the year, COVID-19 deaths per capita in six ECA countries (Montenegro, Hungary,
Vaccination assumptions and the COVID-19 pandemic: modeling growth scenarios in Europe and Central Asia
BOX 1.4
(Continued next page)
FIGURE B1.4.1 Pandemic trends in ECA
−80
−60
−40
−20
0
20
0
50
100
150
200
250
300
Feb-2
0
Apr-20
Jun-
20
Aug-2
0
Oct-20
Dec-2
0
Feb-2
1
New daily cases (7-day average)Retail and recreation mobility (RHS)
Thou
sand
s
Perc
ent c
hang
e fr
om b
asel
ine
a. New daily COVID-19 cases and mobility trends b. Increase in new daily COVID-19 cases since February 17
−50
0
50
100
150
200
250
300
CE SCC Turkey EE WBK ECA CA Russia
Perc
ent
Sources: Johns Hopkins University; Blavatnik School of Government, University of Oxford.Note: CA = Central Asia; CE = Central Europe; ECA = Europe and Central Asia; EE = Eastern Europe; SCC = South Caucasus; WBK =Western Balkans. A. The last observation is March 21, 2021 for new daily cases and March 13, 2021 for retail and recreation mobility.B. The figure shows the percentage increase in the seven-day average of new daily COVID-19 cases on March 21, 2021 relative to February 17, 2021.

Chapter 1: The Continuing COVID-19 Pandemic and the Economic Outlook ● 27
(continued)BOX 1.4
(Continued next page)
Bosnia and Herzegovina, Bulgaria, North Macedo-nia, and Croatia) are among the 10 emerging mar-kets and developing economies (EMDEs) with the highest death rates. Excess death statistics imply that the true rate could be far more devastating, with about half of the region’s economies experi-encing double-digit increases in deaths relative to pre-pandemic years. The relatively high mortality rate partly reflects the region’s aging demograph-
ics—the population share of individuals ages 65 and older is larger in half of ECA’s economies than the world average.
Vaccine rollout in some ECA economies (Cen-tral Europe, the Russian Federation, and Serbia) began as early as December 2020, and has since progressed in about 75 percent of the region’s countries (figure B1.4.2, panel A). Despite the broad-based rollout, the number of doses admin-
FIGURE B1.4.2 COVID-19 vaccination trends in ECA
a. Share of ECA economies deploying COVID-19 vaccines b. Number of COVID-19 vaccine doses administered
c. Total doses procured through advance agreements d. Progress toward the vaccination goal
0
25
50
75
100
15-Dec 30-Dec 14-Jan 29-Jan 13-Feb 28-Feb
Perc
ent o
f ECA
cou
ntrie
s
0
2
4
6
8
10
12
19-D
ec
27-D
ec4-
Jan
12-Ja
n
20-Ja
n
28-Ja
n5-
Feb
13-F
eb
21-F
eb1-
Mar
9-M
ar
17-M
ar
Euro area ECA World
Vacc
inat
ions
per
hun
dred
peo
ple
050
100150200250300350400450
EU ECAOxford-AstraZeneca Pfizer-BioNTech Janssen (J&J)Moderna Sanofi-GSK SinovacNovavax Gamaleya CureVacSinopharm
Perc
ent o
f pop
ulat
ion
0
10
20
30
40
50
60
70
Jan-21 Mar-21 May-21 Jul-21 Sep-21
ECA Goal
Per 1
00 p
eopl
e
Sources: Duke Global Health Innovation Center Launch and Scale Speedometer 2020; Euronews; France24; Reuters; TASS; Our World in Data.Note: ECA = Europe and Central Asia; EU = European Union; EUR = Geographical Europe. Data from Our World in Data can be accessed at: https://ourworldindata.org/.A. The figure shows the percentage of ECA countries that have started vaccinating their population against COVID-19. The last observation is March 1, 2021.B. The figure shows the unweighted regional average between countries of the percentage of population who received at least one vaccine dose.C. The figure shows total confirmed purchased doses by country and vaccine candidate in percentage of the region’s population. The last observation is February 15, 2021.D. The figure shows the total number of doses administered per 100 people in the total population of ECA countries versus the goal fixed by the European Commission to vaccinate 70 percent of the adult population in EU member states by the summer of 2021.

28 ● World Bank ECA Economic Update Spring 2021
(continued)BOX 1.4
(Continued next page)
istered in the region is low, at about 6.6 doses per 100 people, and the pace is highly uneven, with several ECA countries trailing the world average in mid-March (Albania, Azerbaijan, Belarus, Kazakh-stan, Moldova, Montenegro, and Ukraine) (figure B1.4.2, panel B). The low rate of vaccination partly reflects logistical challenges, including insufficient procurement and long delivery times (ECDC 2021). As a result, several governments have opted to prioritize frontline workers, the elderly, and other vulnerable groups, including those with underlying health issues. As doses become available, vaccine administration will be scaled up to include the gen-eral population.
Many economies in the region have secured advance agreements for vaccines produced by international pharmaceutical companies and other countries (Azerbaijan, Hungary, Serbia, and Tur-key), while others plan to rely on the World Health Organization’s COVAX Facility. Of the 2.3 billion doses forecast to be rolled out globally in 2021 through the COVAX Facility, roughly 165 million are destined for the broader geographical zone of Europe (Gavi 2021). However, vaccine distribution remains a challenge—vaccine procurement in ECA trails high-income Europe and falls short of the two doses per person that is needed for most COVID-19 vaccines (figure B1.4.2, panel C).
Vaccine assumptions for the near-term economic outlook in ECA The regional outlook is predicated on a gradual rollout of vaccines in the first half of 2021, with vaccination gathering pace in the second half of the year in ECA’s largest economies. Meanwhile, widespread vaccine administration within other ECA EMDEs is anticipated to lag by at least one to two quarters, as several countries await ship-ment from the COVAX Facility or face bottlenecks related to the production, procurement, or deliv-ery of vaccines secured through other agreements (Central Asia, Eastern Europe, and the Western
Balkans). Target inoculation goals vary, with some ECA EMDEs refraining from setting targets given procurement and uptake challenges, while sev-eral economies in the European Union are aiming to vaccinate 70 percent of the adult population in 2021 (ECDC 2021). Russia and Turkey, the region’s largest economies, have stated targets of 60 per-cent of the adult population in 2021. Absent an acceleration in vaccine procurement and adminis-tration, however, ECA is likely to fall behind the rest of Europe (figure B1.4.2, panel D).
Differing vaccine timelines are expected to con-tribute to an uneven economic recovery in ECA, with the countries that are rapidly deploying vac-cines projected to recover at a faster clip in 2021 than those with slower vaccine administration (figure B1.4.3, panel A). In the latter group, activ-ity is anticipated to be dampened by extended pandemic-related restrictions, which are likely to push the eventual recovery further into the forecast horizon, particularly for countries that rely heavily on international tourism. In all, upgrades to base-line forecasts for 2021 are smaller in countries with slower vaccine progress (figure B1.4.3, panel B).
Underlying vaccine risks to the region’s near-term economic outlookThe highly uncertain evolution of the pandemic will continue to play a critical role in shaping the region’s outlook. Although vaccine rollouts have provided cautious optimism for the regional out-look, a worsening of the recent flare-up in infection rates—alongside delays in vaccine procurement, delivery, and administration—could weaken or stall the recovery. Even with widespread vaccina-tion of the adult population, the vaccines that are currently offered are not authorized for pediatric use, which, combined with vaccine reluctance, could hamper efforts to inoculate the population (Murray and Piot 2021). In contrast, progress in pandemic management, combined with improved vaccine procurement or administration, could lead

Chapter 1: The Continuing COVID-19 Pandemic and the Economic Outlook ● 29
(continued)BOX 1.4
(Continued next page)
to stronger economic outcomes over the forecast horizon (figure B1.4.4, panels A and B). The box fol-lows the methodology in Guénette and Yamazaki (2021), which use a combination of epidemiologi-cal and macroeconometric models to model the deviation from baseline regional forecasts.
In the downside scenario, pandemic trends deteriorate, perhaps as new variants spread or fatigue reduces adherence to social distancing measures and mask wearing. Relative to the base-line scenario, vaccine deployment is slowed by further supply bottlenecks and the reluctance of
FIGURE B1.4.3 ECA outlook, by vaccination progress
a. GDP growth forecasts,by vaccination progress
b. GDP growth forecast revisions for 2021, by vaccination progress
0
2
4
6
ECA
2021 2022
Perc
ent
Vaccinedeployment
above EU level
Vaccinedeployment
below EU level
ECAVaccinedeployment
above EU level
Vaccinedeployment
below EU level
0.0
0.2
0.4
0.6
Perc
enta
ge p
oint
Sources: Consensus Economics; Our World in Data; World Bank.Note: ECA = Europe and Central Asia; EU = European Union; GDP = gross domestic product. Data from Our World in Data can be accessed at: https://ourworldindata.org/. A. The figure shows the GDP-weighted average of growth forecasts as published in the January 2021 edition of Global Economic Prospects. “Vaccine deployment above (below) EU level” refers to countries with a total number of doses administered per 100 people in the national population higher (lower) than the EU ratio.B. The figure shows the unweighted average of the percentage-point difference of Consensus growth forecasts in February 2021 relative to December 2020.
FIGURE B1.4.4 COVID-19 cases under different modeled scenarios
a. Projected daily new COVID-19 cases in ECA West b. Projected daily new COVID-19 cases in ECA East
0
10
20
30
40
50
1/1/
2021
3/1/
2021
5/1/
2021
7/1/
2021
9/1/
2021
11/1
/202
1
1/1/
2022
3/1/
2022
5/1/
2022
7/1/
2022
9/1/
2022
11/1
/202
2
Downside UpsideBaseline Without Vaccine Downside UpsideBaseline Without Vaccine
Num
ber o
f cas
es p
er 1
00,0
00
Num
ber o
f cas
es p
er 1
00,0
00
0
5
10
15
20
1/1/
2021
3/1/
2021
5/1/
2021
7/1/
2021
9/1/
2021
11/1
/202
1
1/1/
2022
3/1/
2022
5/1/
2022
7/1/
2022
9/1/
2022
11/1
/202
2
Sources: Guenette and Yamazaki (2021); World Bank.Note: The figures show the baseline, downside, and upside scenarios, as well as the without vaccine scenario, for projections of mean daily new observed cases per 100,000 population. ECA West models data based on pandemic trends in Turkey, while ECA East is based on Russia. ECA = Europe and Central Asia. See Guénette and Yamazaki (2021) for a description of the epidemio-logical modeling strategy.

30 ● World Bank ECA Economic Update Spring 2021
(continued)BOX 1.4
a higher proportion of the population to receive vaccines (figure B1.4.5, panel B). In turn, govern-ments are forced to impose longer-lasting and more stringent pandemic control measures, which leads to a more subdued pace of recovery. Finan-cial conditions tighten markedly through 2021, as financial market sentiment continuously deterio-rates in tandem with a string of unexpected vac-cine delays and insufficient control of the pan-demic, and as corporate and bank balance sheets deteriorate over prolonged demand weakness and forbearance requirements. While accommodative monetary policy keeps financial crises at bay, fiscal sustainability concerns limit the size of additional fiscal stimulus, leading to insufficient income sup-port to the unemployed and struggling small and medium-size firms. In this downside scenario, the projected economic recovery in ECA would reach only 2.2 percent in 2021 and 1.1 percent in 2022, which are 1.4 and 2.7 percentage points lower than the baseline forecasts for 2021 and 2022, respectively.
In the upside scenario, economic activity resumes in the near term amid more effective man-agement of COVID-19 variants coupled with rapid deployment of highly effective vaccines, allowing countries to meet upper target inoculation rates of around 70 percent of adults. Relative to the base-line, vaccine administration rapidly accelerates and widespread immunization is achieved across and within ECA’s economies in 2021. Widespread pub-lic education campaigns facilitate greater public compliance with pandemic control policies, as well as ameliorate vaccine reluctance, allowing econo-mies to roll back stringent containment measures. As social distancing eases and businesses resume, employment is anticipated to lift while investor con-fidence improves, which should bolster a rebound in domestic demand. In this upside scenario, the projected economic recovery in ECA would rise to 4.2 percent in 2021 and 5.2 percent in 2022, or 0.6 and 1.3 percentage points higher than the baseline forecasts for 2021 and 2022, respectively.
FIGURE B1.4.5 Risks to the ECA outlook
a. GDP growth scenarios in ECA b. Vaccine reluctance, by country
−4
−2
0
2
4
6
2020 2021 2022
Baseline scenario Downside scenario Upside scenario
Perc
ent
0 50 100
RUS March 21Hungary
BiHMontenegro
UkraineRUS Dec 20
RomaniaCroatiaTurkeyPoland
Does not plan to get vaccinated
Neutral Plans to get vaccinatedPe
rcen
t of a
nsw
ers
Sources: Guenette and Yamazaki (2021); Levada Center; Marcec, Matja, and Likic (2021); World Bank.Note: BiH = Bosnia and Herzegovina; ECA = Europe and Central Asia; GDP = gross domestic product; RUS = Russian Federation. A. The bars denote the latest forecast; diamonds correspond to the percent difference between the latest projected levels of GDP growth and those in the January 2020 Global Economic Prospects report. GDP-weighted averages (at 2010 prices and market ex-change rates).B. The figure shows the percentage of people willing/planning to get a Sars CoV 2 vaccine. “Neutral” refers to the percentage of people not providing an opinion or declaring to have already received the COVID-19 vaccine.

Chapter 1: The Continuing COVID-19 Pandemic and the Economic Outlook ● 31
opted for targeted rather than economywide lockdowns. Additionally, the econ-omy was aided by firming oil prices and accommodative macroeconomic policy. Still, the acceleration of new COVID-19 cases stalled the recovery in the fourth quarter of 2020, with the Manufacturing PMI and Services PMI slipping back into contraction.
Growth in Russia is envisioned to pick up only modestly in 2021, to 2.9 per-cent, as ongoing restrictions weigh on services activity and vaccine reluctance impedes inoculation. However, firming energy prices have helped counter these headwinds. The recovery is anticipated to gather pace in 2022, rising to 3.2 per-cent, as the pandemic’s effects on the economy gradually wane. Despite this im-provement, per capita income will remain 2.2 percent below pre-pandemic trends
TABLE 1.2 Europe and Central Asia country growth forecasts(real GDP growth at market prices in percent, unless indicated otherwise)
2018 2019 2020e 2021f 2022f
Percentage point differences from January 2021 projections
2020e 2021f 2022f
Albania 4.1 2.2 −4.7 4.4 3.7 2.0 −0.7 −0.7
Armenia 5.2 7.6 −7.6 3.4 4.3 0.4 0.3 −0.2
Azerbaijan 1.5 2.2 −4.3 2.8 3.9 0.7 0.9 −0.6
Belarus 3.1 1.4 −0.9 −2.2 1.9 0.7 0.5 1.0
Bosnia and Herzegovinaa 3.7 2.8 −4.0 2.8 3.5 0.0 0.0 0.0
Bulgaria 3.1 3.7 −4.2 2.6 3.3 0.9 −0.7 −0.4
Croatia 2.8 2.9 −8.4 4.7 4.9 0.2 −0.7 0.7
Georgia 4.8 5.0 −6.2 4.0 5.0 −0.2 0.0 −1.0
Hungary 5.4 4.6 −5.0 3.8 4.3 0.9 0.0 0.0
Kazakhstan 4.1 4.5 −2.6 3.2 3.5 −0.1 0.7 0.0
Kosovo 3.8 4.9 −6.9 4.0 4.5 1.9 0.3 −0.4
Kyrgyz Republic 3.8 4.6 −8.6 3.8 4.3 −0.6 0.0 −0.2
Moldova 4.3 3.7 −7.0 3.8 3.7 0.2 0.0 0.0
Montenegro 5.1 4.1 −14.9 7.1 4.5 0.0 1.0 0.6
North Macedonia 2.9 3.2 −4.5 3.6 3.5 0.6 0.0 0.0
Poland 5.4 4.5 −2.7 3.3 4.2 0.7 −0.2 −0.1
Romania 4.5 4.1 −3.9 4.3 4.1 1.1 0.8 0.0
Russian Federation 2.8 2.0 −3.1 2.9 3.2 0.9 0.3 0.2
Serbia 4.4 4.2 −1.0 5.0 3.7 1.0 1.9 0.3
Tajikistan 7.3 7.5 4.5 5.0 5.7 2.3 1.5 0.2
Turkey 3.0 0.9 1.8 5.0 4.5 1.3 0.5 −0.5
Ukraine 3.4 3.2 −4.2 3.8 3.0 1.3 0.8 −0.1
Uzbekistan 5.4 5.8 1.6 4.8 5.5 1.0 0.5 1.0
Source: World Bank.Note: World Bank forecasts are frequently updated based on new information and changing (global) circumstances. Consequently, projections presented here may differ from those contained in other Bank documents, even if basic assessments of countries’ prospects do not significantly differ at any given moment in time. Due to lack of reliable data of adequate quality, the World Bank is currently not publishing economic output, income, or growth data for Turkmenistan, and Turkmenistan is excluded from cross-country macroeconomicaggregates. For additional information, see www.worldbank.org/gep.e = estimate; f = forecast.a. GDP growth rate at constant prices is based on the production approach.

32 ● World Bank ECA Economic Update Spring 2021
by 2022. Growth will be further buoyed by a stabilization in industrial commod-ity prices, as well as the continuation of some supportive policy measures, in-cluding more accommodative fiscal policy. However, the policy interest rate was increased from a record low in late March amid a recent rise in inflation. As has been the case in past recoveries, the rebound will be constrained by struc-tural rigidities.
Turkey
A sharp resurgence of COVID-19 gripped the Turkish economy in late 2020, with the rapid acceleration leading to the imposition of strict curfews and weekend lockdowns. These measures were kept in place for most of the first quarter of 2021, which helped stem the spread of the virus, with daily new cases falling to less than a fifth of the December peak. As discussed in box 1.3, however, the spread of new variants has coincided with a flare-up in daily new cases. Turkey began a mass vaccination campaign in mid-January, with nearly 14.4 doses ad-ministered per 100 people by mid-March, largely with the Chinese Sinovac vac-cine, and plans to distribute the Pfizer-BioNTech vaccine. Authorities are aiming to vaccinate 60 percent of the adult population in 2021.
Turkey’s economy avoided a contraction in 2020, with activity growing at a higher-than-expected 1.8 percent amid a substantial expansion in credit. The strength of the rebound was robust, with industrial production and retail sales rising above their pre-pandemic levels by the third quarter of 2020 and the Manu-facturing PMI pointing to continued expansion in 2021. Despite substantial hikes in the policy interest rate, headline and core inflation continue to accelerate, limit-ing the space available for countercyclical policy responses. However, tighter monetary policy appeared to rebuild market confidence initially, with the Turk-ish lira partly recovering earlier losses against the U.S. dollar by early 2021. In late March, however, markets were roiled by the sudden departure of the central bank governor, which triggered about a 15 percent fall in the Turkish lira in the hours after the announcement.
Growth is projected to rise to 5 percent in 2021, as exports benefit from firming external demand from neighboring euro area. The recovery is then set to moder-ate to 4.5 percent in 2022, with activity supported by a gradual pick up in domes-tic demand. The pace of recovery, combined with the earlier expansion in 2020, is expected to help buoy income relative to the regional average. Per capita GDP in Turkey is among the few countries in the world where the forecast exceeds pre-pandemic projections, with projections 0.4 percent higher by 2022—but the head-line data mask growing inequalities, as discussed in box 1.3. Nevertheless, the outlook faces headwinds, including an acceleration in new COVID-19 cases, weak international tourism, and elevated policy uncertainty.
Central Europe
Central Europe suffered a severe resurgence of the virus in the fourth quarter of 2020, which was exacerbated by new, more transmissible variants of COVID-19 and pressures on health care systems. Although the number of cases fell sharply

Chapter 1: The Continuing COVID-19 Pandemic and the Economic Outlook ● 33
in early 2021—by about 80 percent from the November peak—signs are emerging that daily new cases are once again on the rise. The rate of positive tests also re-mains elevated, implying that cases are likely higher than captured by official statistics. Central Europe has been one of the hardest hit ECA subregions in terms of deaths per capita, with Bulgaria, Croatia, and Hungary among the 10 EMDEs with the highest COVID-19 death rates in the world. Vaccine rollout began in December, but the pace of administration has been uneven—ranging from 5 doses per 100 people (Bulgaria) to more than 19 doses per 100 people (Hungary), owing in part to vaccine import delays and general reluctance.
Output in Central Europe is estimated to have contracted -3.6 percent in 2020, with many countries facing renewed weakness, especially in services and tour-ism, due to a resurgence of COVID-19. Despite these drags, the economy firmed in the second half of last year, benefiting from resilience in the euro area. The improvement in external demand bolstered goods exports and industrial activity, with the latter exceeding its pre-pandemic level in the fourth quarter of 2020. Despite challenges related to the pandemic, the Manufacturing PMI points to expansion in early 2021.
Growth in Central Europe is envisioned to firm to 3.6 percent in 2021 and rise to 4.1 percent in 2022, supported by the recovery in trade as activity improves in the euro area. The outlook in 2021 remains challenging, however, as the recent surge in COVID-19 cases dampened the recovery at the start of the year. Excep-tional policy accommodation is expected to continue throughout 2021, including near-zero policy interest rates (Hungary and Poland). By 2022, GDP per capita is expected to remain 5.2 percent below pre-pandemic projections. Among the ECA subregions, fiscal support packages have been largest in Central Europe, at 9 percent of GDP, reflecting sizable discretionary measures and loan guarantees and other credit measures. The European Union’s structural fund package to Central Europe as part of its COVID-19 response could help support medium-term growth.
Western Balkans
Economies in the Western Balkans suffered from one of the sharpest resurgences of the virus in ECA heading into 2021, with the peak number of daily new cases far outstripping the regional average. Similar to Central Europe, three Western Balkan economies (Bosnia and Herzegovina, Montenegro, and North Macedo-nia) are among the 10 EMDEs with the highest numbers of COVID-19 deaths per capita—putting further strain on the health care systems. For most economies in the Western Balkans, widespread vaccine rollout is not anticipated to begin until the second quarter of 2021—slower than initially anticipated—as countries await the delivery of vaccines via the World Health Organization’s COVAX Facility. Vaccine delivery has been roiled by manufacturing and import delays. Serbia is an exception and began vaccinating in late December, administering 24 doses per 100 people as of mid-March—far outpacing the regional and global averages.
Growth in the Western Balkans is expected to rebound to 4.4 percent in 2021 and to moderate to 3.7 percent in 2022, assuming that consumer and business confidence is restored as COVID-19 is brought under control and that political

34 ● World Bank ECA Economic Update Spring 2021
instability eases. Despite this improvement, per capita income is anticipated to remain 6.5 percent below pre-pandemic projections by 2022. Tourism-dependent economies, particularly Albania and Montenegro, will continue to grapple with international travel restrictions. Rising fiscal liabilities in the subregion have re-duced space for fiscal support and contributed to macroeconomic imbalances. At the same time, government budgets will be further stretched by the additional spending necessary to counter the damaging economic effects of the COVID-19 outbreak.
Despite these headwinds, medium-term growth and productivity in Albania and North Macedonia should be boosted by accelerating structural reforms in preparation for EU membership, assuming negotiations surrounding the acces-sion process are not further delayed (Rovo 2020). The subregion is also expected to benefit from the EU’s recently adopted Economic and Investment Plan, which will mobilize funding to support sustainable connectivity, human capital, com-petitiveness and inclusive growth, and green and digital transition.
South Caucasus
Similar to other ECA subregions, the number of daily new cases in the South Caucasus surged again in the fourth quarter of 2020. Georgia suffered the most severe outbreak, with per capita cases rising at roughly three times the peak rate in Armenia and Azerbaijan. However, Armenia faces the highest cumulative deaths per capita in the South Caucasus—it is also the only country that did not enter into a second lockdown amid the late-2020 resurgence. Vaccine rollouts have been hampered in the South Caucasus due to procurement delays, but Azerbaijan initiated its immunization campaign in February amid the delivery of Sinovac vaccines. Although widespread progress has been slow, agreements with the United Kingdom’s pharmaceutical company AstraZeneca and with Russia for Sputnik V could help jumpstart vaccinations later this year. High vaccine re-luctance, particularly in Georgia, could hinder broader vaccination efforts.
After suffering the sharpest collapse among the ECA subregions in 2020 amid armed conflict and high COVID-19 infection and fatality rates, growth in the South Caucasus subregion is projected to rise to 3.1 percent in 2021 and to acceler-ate to 4.2 percent in 2022. The recovery at the start of 2021 remains muted, how-ever, reflecting subdued domestic demand due to the pandemic, as well as an escalation in domestic political tensions (Armenia) and continued weakness in transport and tourism (Georgia). Monetary policy also became tighter, with Ar-menia and Georgia hiking policy rates. In all, GDP per capita is expected to re-main 7.0 percent below pre-pandemic forecasts by 2022. The outlook over the forecast horizon is predicated on the shocks related to the pandemic and conflict dissipating, and on a recovery in tourism alongside improving consumer and business confidence. Activity is expected to expand in Azerbaijan over the fore-cast horizon as oil prices stabilize and the economy benefits from investment and reconstruction spending. The ceasefire agreement between Armenia and Azer-baijan is expected to help alleviate geopolitical tensions in the region, although risks to stability remain.

Chapter 1: The Continuing COVID-19 Pandemic and the Economic Outlook ● 35
Eastern Europe
Daily new COVID-19 infections accelerated toward the start of 2021 but eased in the first quarter of 2021 in Eastern Europe. Cases have been rising rapidly once again, however, forcing the extension of COVID-19 restrictions in some coun-tries. Belarus began administering doses of Russia’s Sputnik V vaccine in Decem-ber and aims to inoculate more than 10 percent of its population by the second quarter of 2021. The rollout in Eastern Europe has been slow, however, as these economies struggle to procure doses or are stalled by shipment delays. Despite these bottlenecks, Ukraine is aiming to vaccinate a third of its adult population by the end of 2021, and Moldova has indicated it plans to procure enough doses to cover 20 percent of its population.
The economy in Eastern Europe contracted -3.3 percent in 2020, reflecting the dual shock of COVID-19 and an escalation of geopolitical tensions. Despite these headwinds, the recovery in Ukraine—the subregion’s largest economy—was more resilient than was anticipated, as the economy benefited from robust con-struction and agricultural activity and firming retail sales in late 2020. However, monetary policy tightened in Ukraine in early 2021 amid a surge in inflation. Growth in Eastern Europe is projected to rise to a tepid 1.9 percent in 2021 and pick up to a modest 2.7 percent in 2022—the weakest of the ECA subregions. GDP per capita by 2022 is expected to remain 7.4 percent below pre-pandemic projec-tions. The recovery is constrained by continued challenges related to the pan-demic, heightened political tensions in Belarus, subdued domestic demand, and ongoing structural weakness. In particular, investment will continue to be damp-ened amid weak investor sentiment, triggered in part by an earlier intensification of political tensions.
Central Asia
In sharp contrast to the rest of ECA, the number of COVID-19 cases remains rela-tively low in Central Asia. However, growing signs of acceleration in early 2021 forced the extension of various restrictions in some economies to help mitigate pressures on the health care system. Kazakhstan, the subregion’s largest econ-omy, began administering doses of Russia’s Sputnik V vaccine in February and aims to inoculate a third of its population in 2021. Meanwhile, vaccination is ex-pected to begin in March in Uzbekistan. For the rest of Central Asia, vaccine rollout is pending procurement and delivery of doses, mainly through the World Health Organization’s COVAX Facility.
In Central Asia, growth is expected to recover to 3.7 percent in 2021 and to 4.1 percent in 2022—well below historical averages, with per capita income antici-pated to remain 6.4 percent below pre-pandemic projections by 2022. The econ-omy is anticipated to be supported by a modest rise in commodity prices, relax-ation of OPEC+ production cuts (Kazakhstan), and firming FDI as the subregion deepens its integration with the rest of the world and with each other. In Uzbeki-stan, growth should continue to benefit from the implementation of an ambitious reform agenda, which progressed last year despite formidable headwinds from

36 ● World Bank ECA Economic Update Spring 2021
the pandemic. However, the sub-regional rebound has been dampened by rising policy uncertainty in Central Asia, particularly in the Kyrgyz Republic, following political tensions and social unrest. Inflationary pressures have triggered more restrictive monetary policy in some countries, with the Kyrgyz Republic and Ta-jikistan raising their key policy rates.
Risks to the Regional Outlook
Risks to the outlook are markedly tilted to the downside, despite the positive progress with vaccine deployment across several ECA economies. The near-term growth outlook for ECA is clouded by the sharp rise in uncertainty over the surge in new cases, which contributed to social unrest in some countries, as well as the risk of geopolitical tensions re-escalating. Several euro area countries were forced to re-impose nationwide lockdowns, which may weaken near-term external de-mand in ECA. Similarly, a persistently high number or increase in number of cases within ECA could lead to the extension of stringent restrictions and re-sponses by households and firms, which would weigh on private consumption and investment. If the downturn in travel is prolonged, growth outcomes could be much weaker, particularly in tourism-dependent economies (Central Europe, Turkey, and the Western Balkans). Delays in the production, procurement, or dis-tribution of COVID-19 vaccines, lower-than-expected vaccine effectiveness, the suspension of vaccines due to safety concerns, higher-than-expected vaccine re-luctance, or the continuation of pandemic-related restrictions could also delay the economic recovery. The challenges of distribution and inoculation are par-ticularly elevated in Central Asia, where health care capacity is weaker than in other parts ECA.
The threat of premature fiscal consolidation also poses downside risks to the outlook, particularly in economies experiencing continued flare-ups of new CO-VID-19 cases and ongoing social-distancing measures, as well as those depen-dent on international tourism. Regional economies face the formidable policy challenge of balancing the need to place public debt on a sustainable path with that of supporting a durable and inclusive recovery. However, the optimal timing of withdrawing fiscal support will depend on country-specific conditions, in-cluding those related to pandemic trends, macroeconomic space, and prevailing output gaps.
In the context of capital outflows, foreign exchange reserves have been drawn down sharply in some ECA economies, constraining the capacity of central banks to buffer the impact of further negative external shocks. A sudden reassessment of investor sentiment could lead to cascading defaults and rising nonperforming loans, especially given the sharp increase in government debt. Despite excep-tional liquidity support, corporate balance sheet pressures in ECA have contin-ued to rise in the wake of COVID-19 due to lower earnings and substantial ex-change rate depreciation, putting strain on the banking sector. For banks that are undercapitalized or operate in countries with narrow fiscal space, regulatory forbearance has intensified stress (see box 1.1). The pandemic has also amplified the risk that contingent liabilities will be realized, which could further strain pub-lic finances.

Chapter 1: The Continuing COVID-19 Pandemic and the Economic Outlook ● 37
The pandemic poses medium-term risks if protracted spells of unemployment and school closures have a significant impact on human capital development through lost opportunities to acquire skills and gain knowledge (Dieppe 2020; Shmis et al. 2020; World Bank 2020c). Renewed school closures in response to a worsening of the pandemic would exacerbate these risks. Investment prospects have eroded further in response to the slowdown in capital expenditures, with the exception of Central Europe. The sizable EU structural funds package to Cen-tral Europe as part of its COVID-19 response could help mitigate the weakness in investment, but the boost could be tempered by low absorption of funds due to challenges surrounding administrative capacity and governance.
Renewed geopolitical tensions in ECA would also present headwinds to growth. Eventual unraveling of the ceasefire agreement between Armenia and Azerbaijan, further political pressures in Belarus or the Kyrgyz Republic, or re-newed involvement by the region’s largest economies in conflicts in Libya, the Syrian Arab Republic, or Ukraine could trigger additional sanctions and generate substantial financial market pressures. Disagreements between the EU and other major economies, such as China, could also lead to additional sanctions that have implications for some ECA countries. A rise in policy uncertainty, particularly in some of the region’s large economies, could also undermine the recovery if it triggers financial stress. A protracted deterioration in investor sentiment—whether from uncertainty related to the pandemic, geopolitical tensions, policy uncertainty, or delays in EU accession negotiations—could have material impli-cations for ECA and erode the outlook.
Long-Term Challenges and PoliciesThe COVID-19 crisis has left scarring effects on EMDEs in ECA due to the erosion of human capital following significant disruptions to education and health. Despite prog-ress in institutional reforms over the past decade, longstanding bottlenecks to inclusive, sustainable growth—including weak governance, a high perception of corruption, and obstacles to competition—continue to restrain productivity in the region. However, un-precedented government support packages provide a rare opportunity for green invest-ment, which could facilitate the transition to a low-carbon future and yield sustainable growth dividends. Policy makers can also seize the opportunity to lay the foundations for a durable, equitable, and sustainable recovery, including through achieving progress on longstanding structural reforms and leveraging digital progress.
Boosting Human Capital and Reversing COVID-19 Damage
The COVID-19 pandemic has gripped the world and is expected to roll back years of hard-won improvements in human capital, including in ECA, as high-lighted in the Europe and Central Asia Economic Update, Fall 2020 (World Bank 2020e). Even before the pandemic, the average newborn in ECA could only be expected to achieve 69 percent of her potential productivity as a future worker (World Bank 2020h). Already over the past decade, all fundamental drivers of growth—investment, productivity growth, improvements in education and

38 ● World Bank ECA Economic Update Spring 2021
health, and working-age population growth—had slowed (Dieppe 2020). Absent effective policy action or major technological advances, it is expected that the pandemic will further slow potential growth in ECA (figure 1.9, panel A) (World Bank 2021).
Counting the costs. The pandemic has disrupted education for 90 percent of the world’s children, including those in ECA (World Bank 2020c). In quality-adjusted terms, the pandemic could lower average years of schooling by 0.3 to 1.1 years in ECA—the steepest decline among EMDE regions—which, combined with the deskilling associated with prolonged unemployment, could lead to sizable future earnings losses (Azevedo et al. 2020; Fasih, Patrinos, and Shafiq 2020).
By 2040, about one-third of the world’s workforce will be composed of indi-viduals whose schooling was disrupted by the pandemic and, on average, the human capital of the global workforce would be almost one Human Capital In-dex point lower—equivalent to 1 percent below potential productivity—than in the absence of the pandemic (World Bank 2020h). Additionally, the global unem-ployment rate increased by about 2 percentage points in the first half of 2020 alone. In Europe, COVID-19 triggered the equivalent of a loss of 30 million full-time jobs in 2020, with seven to 22 million jobs at risk in 2021, depending on pandemic assumptions (ILO 2021). The longer unemployment remains high, the more pronounced the associated human capital losses will be.
Beyond educational costs, long term health impacts of the pandemic may be expected. Reduced lung function among COVID-19 survivors—which can repre-sent a substantial part of the workforce in the worst hit countries—may impact productivity for several years. The disruption of health care services is
FIGURE 1.9 Productivity and the Human Capital Index
b. Access to digital technologya. Potential growth prospects in ECA, 2020s
0.0
0.5
1.0
1.5
2.0
2.5
3.0
Pre-COVID-19 COVID-192010-192020-29
Perc
ent
0
10
20
30
40
0
25
50
75
100
Advancedeconomies
EMDEs LICs ECA
Individuals using the InternetFixed broadband subscriptions (RHS)
Perc
ent o
f pop
ulat
ion
Per 1
00 p
eopl
e
Sources: Consensus Economics; Kilic Celik, Kose, and Ohnsorge 2020; World Bank.Note: ECA = Europe and Central Asia; EMDEs = emerging markets and developing economies; GDP = gross domestic product; LICs=low-income countries.A. GDP-weighted averages (at 2010 prices and exchange rates). Potential growth estimates are based on a production function approach as de-scribed in Kilic Celik, Kose, and Ohnsorge (2020). Pre-COVID prospects for the 2020s assume that investment grows at its historical average rate, working-age population and life expectancy evolve as envisaged by the UN Population Projections; and secondary and tertiary school enrollment and completion rates improve at their historical average rate. Post-COVID estimates for the 2020s assume that investment grows as expected by Consensus forecasts, working-age population and life expectancy evolve as envisaged by the UN Population Projects, and secondary attainment rates decline by 2.5 percentage points. B. The figure shows the average share of the population using the internet and fixed broadband subscriptions per 100 people in 2017. The sample includes 36 advanced economies, 155 EMDEs, and 29 LICs.

Chapter 1: The Continuing COVID-19 Pandemic and the Economic Outlook ● 39
particularly concerning for child and maternal health. If immunizations are not provided after the pandemic, decreases could leave cohorts of children without full immunization and therefore more exposed to preventable infectious diseases in the future. Disruption of health care provision can also adversely affect adult health if, for instance, regular preventive screenings for noncommunicable dis-eases are skipped or postponed for too long.
Ensuring access to education. Safeguarding access to education is critical for promoting better long-run growth outcomes (Sala-i-Martin, Doppelhofer, and Miller 2004). Increased investment in infrastructure related to education can im-prove the quantity and quality of human capital (Francisco and Tanaka 2020; Barrett et al. 2019). The short-term challenge is a safe reopening of schools and keeping students, especially girls because they are at greater risk of dropping out, in school, while the long-term challenge is to reverse some of the pandemic-re-lated losses in learning outcomes.3
Long-term improvements start with better measurement of the outcomes in education to help target interventions more effectively (World Bank 2019a). School meals programs and early childhood interventions can help better pre-pare students for learning. To strengthen pedagogical effectiveness, teachers can be supported with coaching, motivated by incentives, and provided appropriate technologies. The dividends could be large—going from a low-performing teacher to a high-performing teacher can increase student learning by multiple years.4 Community and parental support will also be critical to improve learning.
The COVID-19 crisis underscores the critical need for investment in digital skills and technology to ensure educational continuity, as well as for resources to upgrade information and communications technology infrastructure to support virtual learning, particularly for more vulnerable households. Digital approaches to remote learning that have been developed during the pandemic can be lever-aged gradually to broaden access to affordable education across EMDEs, includ-ing those in ECA, over the long term (Li and Lalani 2020). In ECA, there is wide divergence in internet access, with some EU members having rates similar to those in euro area countries, while Central Asia lags even the EMDE average (figure 1.9, panel B). This could heighten educational inequalities between coun-tries that offer remote learning and those that cannot, and within countries be-tween children with private tutors and remote learning and those without (Vegas and Winthrop 2020).
Improving educational outcomes. Although ECA fares well relative to other EM-DEs in higher educational attainment, reforms to increase educational outcomes, as well as vocational programs, could improve labor market outcomes (EBRD 2020). To be competitive in the global market, students will need to be equipped with in-demand skills for the future of work and remain productive in rapidly changing economies (Europe and Central Asia Economic Update, Fall 2020; WEF
3. https://blogs.worldbank.org/education/realizing-returns-schooling-how-covid-19-and-school-closures-are-threatening-womens.4. http://documents1.worldbank.org/curated/en/235831548858735497/Successful-Teachers-Successful-Students-Recruiting-and-Supporting-Society-s-Most-Crucial-Profes-sion.pdf; https://blogs.worldbank.org/education/realizing-promise-effective-teachers-every-child-global-platform-successful-teachers.

40 ● World Bank ECA Economic Update Spring 2021
2021).5 Curricula should be aligned to increase employability and reduce skills gaps and mismatches to ensure that students are prepared for the dynamic na-ture of the labor market and changing needs of employers.6
In a few economies in ECA, particularly in Central Asia, inadequate invest-ment in human capital left parts of the workforce poorly equipped for rapid tech-nological change even prior to the COVID-19 pandemic (Flabbi and Gatti 2018). Low educational attainment among the workforce and inadequate skills are often cited as constraints for doing business, firm growth, job creation, and innovation in ECA (Brancatelli, Marguerie, and Brodmann 2020; World Bank 2019b). An ag-ing workforce, a declining working-age population share, and high emigration rates among young and skilled workers in ECA highlight the need for education to help workers adapt to new job requirements and technologies (Aiyar, Ebeke, and Shao 2016; Hallward-Driemeier and Nayyar 2018; World Bank 2018). Beyond formal edu-cation, access to retraining programs for workers in the hardest hit sectors—whether from the pandemic or automation—can facilitate their re-employment.
On the health front, the pandemic has laid bare the need to detect rapidly and respond to public health emergencies (World Bank 2020g). Aging populations in the region and the greater vulnerability of the elderly to many infectious diseases make this an even greater priority. Addressing and minimizing the health risks of high rates of obesity, smoking, and heavy drinking in the region are also important, not only for limiting the impact of noncommunicable diseases, but also for mini-mizing the loss of lives associated with major outbreaks of infectious diseases.
Strengthening Institutions
Strong institutions and conducive business climates can set the stage for vigorous growth. Institutions can promote forms of economic activity that are associated with greater economic complexity and higher productivity growth by encourag-ing human capital accumulation and innovative activities (Dieppe 2020; Vu 2019). A distinguishing feature of ECA is the large state presence in the economy, which partly reflects an incomplete transition process. Even in the decade prior to COVID-19, the state’s footprint was increasing (EBRD 2020). The pandemic has exacerbated this trend, as governments have been forced to intervene with large-scale macroeconomic support packages to help counter the downturn and protect lives and livelihoods. Given the large and growing role of the state in ECA, reforms that strengthen institutions are key to improve development outcomes.
Improving governance. Good governance ensures competitive and flexible mar-kets with limited market concentration, effective regulation, and the efficient and equitable provision of public services, including health care, education, and pub-lic infrastructure (Acemoglu, Johnson, and Robinson 2005; Dort, Méon, and Sek-kat 2014; Gwartney, Holcombe, and Lawson 2006). Improvements in governance, especially to emphasize accountability, can promote trust in government (World Bank 2017). The COVID-19 crisis has highlighted the importance of public trust and credibility—there is early evidence that compliance with pandemic control
5. http://www3.weforum.org/docs/WEF_Future_of_Jobs_2020.pdf.6. https://ideas.repec.org/a/gam/jsusta/v12y2020i15p5900-d388035.html? deliveryName=DM88805.

Chapter 1: The Continuing COVID-19 Pandemic and the Economic Outlook ● 41
measures has been greater in countries and subnational entities with stronger trust in government (see box 1.2 and Devine et al. (2020)).
Strengthening institutions. Weak institutions and governance remain an obsta-cle to sustained, robust growth of investment and productivity in ECA, under-scoring the potential benefits of reforms in these areas (World Bank 2018, 2020f). Pervasive corruption and crime, weak administrative capacity, and informality are formidable constraints on the ability of private firms to invest, innovate, and close the productivity gap with high-income countries. Thus, there is consider-able scope for governments to stem or reverse a slowdown in productivity and potential growth by strengthening institutions and reducing corruption (Kilic Celik, Kose, and Ohnsorge 2020). Major reform initiatives to improve business climates or governance have been followed by significantly higher total factor productivity growth in the near term and investment growth in the medium term (figure 1.10, panel A). In contrast, reform setbacks have often been associated with slowdowns in total factor productivity growth that set in early and were not reversed over the subsequent five years.
Reducing corruption. Good governance also requires control of corruption. While progress has been made in reducing corruption over the past decade, there have been setbacks in some countries, including those in ECA (figure 1.10, panel B). Over 30 percent of firms in EMDEs identify corruption and competition from the informal sector as major constraints to their growth. Among the EMDE re-gions, the perception of corruption is second highest in ECA only after Sub-Saha-ran Africa (Corruption Perceptions Index, 2021). Survey data suggest that the perception of democracy has deteriorated further since the COVID-19 crisis be-gan, particularly in countries facing rising social unrest and other geopolitical tensions (Freedom House 2021).
FIGURE 1.10 Strengthening institutions
b. Corruption Perceptions Indexa. Cumulative response of total factor productivity after
institutional reform advances and setbacks
−1.5
−1.0
−0.5
0.0
0.5
1.0
1.5
t+3 t+5 t+3 t+5Reform advances Setbacks
Perc
enta
ge p
oint
s
−10
0
10
20
30
40
50
SCC Turkey EE WBK CARussian
Federation
2020 Change since 2012
Scor
e
Sources: Consensus Economics; Dieppe 2020; EM-DAT (database); Laeven and Valencia 2020; Transparency International; World Bank.Note: CA = Central Asia; EE = Eastern Europe; SCC = South Caucasus; WBK =Western Balkans. A. The values are coefficient estimates of a local projection estimation of 10-year-ahead growth forecasts on reform advances and setbacks in 57 countries. Reform advances (setbacks) are defined as years in which the average of indicators by the International Crisis Risk Group increase (de-crease) and are sustained for at least three years. The vertical orange lines show the 90-percent confidence intervals.B. The blue bars show countries’ scores on Transparency International’s Corruption Perceptions Index 2020. The orange diamonds denote the change in countries’ scores compared with the Corruption Perceptions Index 2012.

42 ● World Bank ECA Economic Update Spring 2021
Reducing corruption is paramount in light of the expansion of government activity induced by the pandemic (World Bank 2020d). Addressing corruption can play a crucial role in bolstering the recovery and improving the effectiveness of resource allocation over the longer run (Avellan, Galindo, and Leon-Diaz 2020).7 Fostering a more predictable investment climate can help countries attract FDI, seize new trade opportunities brought on by ongoing global value chain reconfiguration, and address balance of payments difficulties (World Bank 2020i). Reducing corruption can also help increase the quality of government expenditures, the effectiveness of social benefit systems, and, by boosting government revenues, the amount of fiscal space (Peisakhin and Pinto 2010).
Promoting digitalization. Promoting digitalization can have many cross-cutting benefits, including strengthening and improving governance. A prerequisite for meaningful digital connectivity—internet coverage—remains highly uneven across and within ECA countries—and even within countries in Central Europe, access is far less prevalent in small towns and rural areas. This digital divide hinders opportunities for remote work and virtual learning, which could further reverse human capital gains and exacerbate inequality. An expansion of broad-band and mobile internet access would enable a larger share of the population to access digital services, which could improve connectivity in ECA’s low-density areas (EBRD 2020).
Importantly, digital technology and the data revolution offer the potential to increase efficiency, transparency, responsiveness, and citizen trust, directly im-pacting government quality. Part 2 of this Update takes a closer look at how digi-tal tools and GovTech can optimize management, service delivery, and overall state capacity in ECA countries. It assesses the extent to which countries in the region exploit data and digitalization and includes specific policy recommenda-tions for harnessing the data revolution to improve governance across ECA.
Good governance is necessary, but it takes time to improve and will not be sufficient to address the challenges faced by ECA governments, since structural transformation requires adequate resources. Unfortunately, the pressing need for COVID-19 support and subsequent collapse in activity has triggered a spike in government debt and exhausted fiscal space for many countries. To this end, as efforts to improve governance continue, it will be important to target reforms that boost inclusive and sustainable growth, reverse the losses in human capital ac-cumulation, bolster domestic revenue mobilization, and strengthen the public expenditure review process. These will set the stage for a robust recovery and medium-term growth, as well as place debt on a more sustainable footing.
Enabling Markets and Fostering Competition
EMDEs with business-friendly regulations tend to have higher levels of eco-nomic inclusiveness, have smaller informal sectors, and grow faster (Djankov,
7. Several studies show that anticorruption reforms have significantly boosted long-term growth and investment, albeit with substantial variation in outcomes across countries (Cieślik and Goczek 2018; de Vaal and Ebben 2011; Gründler and Potrafke 2019; Hodge et al. 2011; OECD 2015; Shleifer and Vishny 1993).

Chapter 1: The Continuing COVID-19 Pandemic and the Economic Outlook ● 43
McLiesh, and Ramalho 2006; World Bank 2014). Major improvements in business environments have been associated with increased output growth as the im-provements encourage the entry of more productive firms, including multina-tional companies, and stimulate spending on research and development (R&D) (Alam, Uddin, and Yazdifar 2019; Divanbeigi and Ramalho 2015; Egan 2013; Kirkpatrick 2014). However, weak business environments may diminish the complementarities between public and foreign direct investment and domestic investment (Topalova and Khandelwal 2011).
Although legacies from centrally planned economies are still evident, several ECA countries have made progress over the past decade in facilitating competi-tion and undertaking structural transformation, with notable improvement in Central Asia as well as Azerbaijan and Turkey (EBRD 2020). A handful of coun-tries in ECA, particularly in Central Asia, have implemented reforms to facilitate the ease of doing business, particularly for small and medium-size enterprises (EBRD 2020). These reforms include tax code changes, reductions in regulatory burdens, and measures that encourage fair competition and innovation. Mean-while, some countries have recently adopted reforms to open up agriculture, which should help attract investment and support the expansion of private en-terprise in agriculture sectors (Ukraine and Uzbekistan). Still, further institu-tional reforms can be adopted to enable markets, foster competition, and bolster economic growth (Bluhm and Szirmai 2011; Nawaz 2015; Prati, Onorato, and Papageorgiou 2013).8 In Romania, competition is hampered by regulations that restrict entry and rivalry, particularly in retail trade, while measures to promote competition neutrality to ensure fair market access of public enterprises and pri-vate firms are largely absent.9
The pandemic has pushed firms, including those in ECA, to rely increasingly on digital solutions to remain in the market (Apedoh-Amah et al. 2020). Digitali-zation has been associated with higher firm-level productivity (Cusolita, Leder-man, and Pena 2020). In light of social distancing measures, the use of online payment systems and other forms of cashless payments as well as online com-merce has expanded rapidly (Barrero, Bloom, and Davis 2020; Kenney and Zys-man 2020). Even beyond the pandemic, digitalization can facilitate job search, accelerate the discovery of new job opportunities, and increase employment (El-Mallakh 2020; Hjort and Poulsen 2019; Viollaz and Winkler 2020). It can also re-duce uncertainty and information asymmetries in product markets (World Bank 2019c). And in addition to its productivity-enhancing effects, wider internet ac-cess has been found to increase female labor force participation (Viollaz and Win-kler 2020).
8. Market-friendly reforms have been shown to strengthen the underlying drivers of growth by dismantling regulatory barriers to doing business and entrepreneurship, and by removing obstacles to innovation and entrepreneurship, openness, competition, and finan-cial development (Kilic Celik, Kose, and Ohnsorge 2020; Acemoglu, Johnson, and Robinson 2005; Botero, Ponce, and Shleifer 2012; Glaeser et al. 2004; Glaeser, Ponzetto, and Shleifer 2007).9. https://documents.worldbank.org/en/publication/documents-reports/documentde-tail/845981607007573350/corporate-market-power-in-romania-assessing-recent-trends-drivers-and-implications-for-competition.
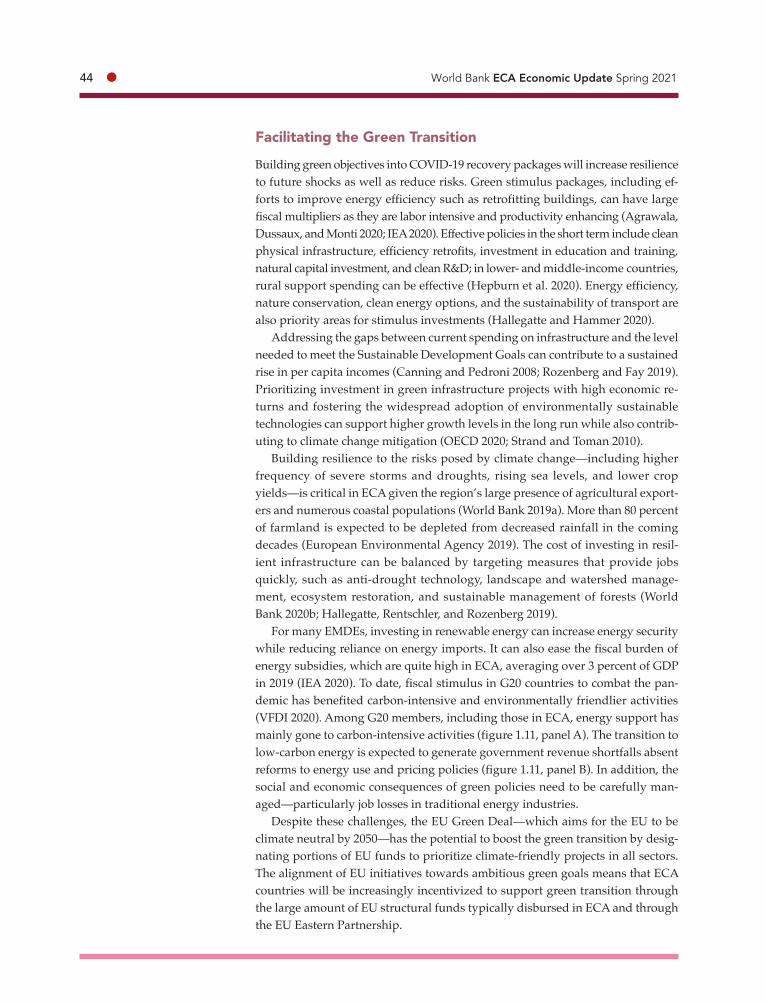
44 ● World Bank ECA Economic Update Spring 2021
Facilitating the Green Transition
Building green objectives into COVID-19 recovery packages will increase resilience to future shocks as well as reduce risks. Green stimulus packages, including ef-forts to improve energy efficiency such as retrofitting buildings, can have large fiscal multipliers as they are labor intensive and productivity enhancing (Agrawala, Dussaux, and Monti 2020; IEA 2020). Effective policies in the short term include clean physical infrastructure, efficiency retrofits, investment in education and training, natural capital investment, and clean R&D; in lower- and middle-income countries, rural support spending can be effective (Hepburn et al. 2020). Energy efficiency, nature conservation, clean energy options, and the sustainability of transport are also priority areas for stimulus investments (Hallegatte and Hammer 2020).
Addressing the gaps between current spending on infrastructure and the level needed to meet the Sustainable Development Goals can contribute to a sustained rise in per capita incomes (Canning and Pedroni 2008; Rozenberg and Fay 2019). Prioritizing investment in green infrastructure projects with high economic re-turns and fostering the widespread adoption of environmentally sustainable technologies can support higher growth levels in the long run while also contrib-uting to climate change mitigation (OECD 2020; Strand and Toman 2010).
Building resilience to the risks posed by climate change—including higher frequency of severe storms and droughts, rising sea levels, and lower crop yields—is critical in ECA given the region’s large presence of agricultural export-ers and numerous coastal populations (World Bank 2019a). More than 80 percent of farmland is expected to be depleted from decreased rainfall in the coming decades (European Environmental Agency 2019). The cost of investing in resil-ient infrastructure can be balanced by targeting measures that provide jobs quickly, such as anti-drought technology, landscape and watershed manage-ment, ecosystem restoration, and sustainable management of forests (World Bank 2020b; Hallegatte, Rentschler, and Rozenberg 2019).
For many EMDEs, investing in renewable energy can increase energy security while reducing reliance on energy imports. It can also ease the fiscal burden of energy subsidies, which are quite high in ECA, averaging over 3 percent of GDP in 2019 (IEA 2020). To date, fiscal stimulus in G20 countries to combat the pan-demic has benefited carbon-intensive and environmentally friendlier activities (VFDI 2020). Among G20 members, including those in ECA, energy support has mainly gone to carbon-intensive activities (figure 1.11, panel A). The transition to low-carbon energy is expected to generate government revenue shortfalls absent reforms to energy use and pricing policies (figure 1.11, panel B). In addition, the social and economic consequences of green policies need to be carefully man-aged—particularly job losses in traditional energy industries.
Despite these challenges, the EU Green Deal—which aims for the EU to be climate neutral by 2050—has the potential to boost the green transition by desig-nating portions of EU funds to prioritize climate-friendly projects in all sectors. The alignment of EU initiatives towards ambitious green goals means that ECA countries will be increasingly incentivized to support green transition through the large amount of EU structural funds typically disbursed in ECA and through the EU Eastern Partnership.

Chapter 1: The Continuing COVID-19 Pandemic and the Economic Outlook ● 45
Annex 1.1 Data and Forecast ConventionsThe macroeconomic forecasts presented in this Update are the result of an itera-tive process involving staff from the World Bank Prospects Group in the Equita-ble Growth, Finance, and Institutions Vice-Presidency; country teams; regional and country offices; and the Europe and Central Asia Chief Economist’s office. This process incorporates data, macroeconometric models, and judgment.
Data
The data used to prepare the country forecasts come from a variety of sources. National income accounts, balance of payments, and fiscal data are from Haver Analytics; the World Bank’s World Development Indicators; and the Interna-tional Monetary Fund’s (IMF’s) World Economic Outlook, Balance of Payments Statistics, and International Financial Statistics. Population data and forecasts are from the United Nations’ World Population Prospects. Country and lending group classifications are from the World Bank. In-house databases include com-modity prices, data on previous forecast vintages, and country classifications. Other internal databases include high-frequency indicators—such as industrial production, consumer price indexes, housing prices, exchange rates, exports, im-ports, and stock market indexes—based on data from Bloomberg, Haver Analyt-ics, the Organisation for Economic Co-operation and Development’s analytical hous-ing price indicators, the IMF’s Balance of Payments Statistics, and the IMF’s International Financial Statistics. Aggregate growth for the world and all subgroups of countries (such as regions and income groups) is calculated as the gross domestic product–weighted average (in 2010 prices) of country-specific growth rates. Income groups are defined as in the World Bank’s classification of country groups.
FIGURE 1.11 Green recovery
b. Potential oil and gas revenue shortfall in the low-carbon scenario, 2021–40
a. Amount of support committed towardenergy initiatives in 2020
0
100
200
300
400
500
G20 EMDEs Other G20countries
Total G20
Fossil Clean Other
US$
, bill
ions
0
20
40
60
80
Ukraine
Azerb
aijan
EMDEs
Russia
n
Feder
ation
Kazak
hstan
Uzbek
istan
Perc
ent d
evia
tion
from
bas
elin
e
Sources: Carbon Tracker; Energy Policy Tracker; World Bank.Note: EMDEs = emerging markets and developing economies; G20 = Group of Twenty.A. The figure shows G20 commitments to types of energy policies as a percentage of total commitments since the pandemic began. The data are as of March 17, 2021.B. The blue bars show the potential oil and gas revenue shortfall relative to the baseline for the petrostates over the next two decades (2021–40) in a low -carbon scenario compared with the past five years (2015–19), in annual average terms.

46 ● World Bank ECA Economic Update Spring 2021
Forecast Process
The process starts with initial assumptions about advanced economy growth and commodity price forecasts. These assumptions are used as conditions for the first set of growth forecasts for emerging markets and developing economies, which are produced using macroeconometric models, accounting frameworks to ensure national accounts identities and global consistency, estimates of spillovers from major economies, and high-frequency indicators. These forecasts are then evalu-ated to ensure consistency of treatment across similar economies. This process is followed by extensive discussions with World Bank country teams, which con-duct continuous macroeconomic monitoring and dialogue with country authori-ties. Throughout the forecasting process, staff use macroeconometric models that allow the combination of judgment and consistency with model-based insights.
ReferencesAcemoglu, D., S. Johnson, and J. Robinson. 2005. “The Rise of Europe: Atlantic Trade,
Institutional Change, and Economic Growth.” American Economic Review 95 (3): 546–79.
Agrawala, S., D. Dussaux, and N. Monti. 2020. “What Policies for Greening the Crisis Re-sponse and Economic Recovery? Lessons Learned from Past Green Stimulus Measures and Implications for the Covid-19 Crisis.” OECD Environment Working Paper 164, Or-ganisation for Economic Co-operation and Development, Paris.
Aiyar, S., C. Ebeke, and X. Shao. 2016. “The Impact of Workforce Aging on European Productivity.” IMF Working Paper 16/238, International Monetary Fund, Washington DC.
Alam, A., M. Uddin, and H. Yazdifar. 2019. “Institutional Determinants of R&D Investment: Evidence from Emerging Markets.” Technological Forecasting and Social Change 138 (C): 34–44.
Apedo-Amah, M. C., B. Avdiu, X. Cirera, M. Cruz, E. Davies, A. Grover, L. Iacovone, U. Kilinc, D. Medvedev, F. O. Maduko, and S. Poupakis. 2020. “Unmasking the Impact of COVID-19 on Businesses: Firm-Level Evidence from across the World.” Policy Research Working Paper 9434, World Bank, Washington, DC.
Avellan, L., J. A. Galindo, and J. Leon-Diaz. 2020. “The Role of Institutional Quality on the Effects of Fiscal Stimulus.” IDB Working Paper Series 01113, Inter-American Develop-ment Bank, Washington, DC.
Azevedo, J. P., A. Hasan, D. Goldemberg, S. A. Iqbal, and K. Geven. 2020. “Simulating the Potential Impacts of Covid-19 School Closures on Schooling and Learning Outcomes: A Set of Global Estimates.” Policy Research Working Paper 9284, World Bank, Wash-ington, DC.
Barrero, J. M., N. Bloom, and S. J. Davis. 2020. “Covid-19 Is also a Reallocation Shock.” NBER Working Paper 27137, National Bureau of Economic Research, Cambridge, MA.
Barrett, P., A. Treves, T. Shmis, D. Ambasz, and M. Ustinova. 2019. The Impact of School Infrastructure on Learning: A Synthesis of the Evidence. International Development in Focus Series. Washington, DC: World Bank.
Bluhm, R., and A. Szirmai. 2011. “Institutions, Inequality and Growth: A Review of Theory and Evidence on the Institutional Determinants of Growth and Inequality.” Innocenti Working Paper 2011/02, United Nations, New York.
Botero, J., A. Ponce, and A. Shleifer. 2012. “Education and the Quality of Government.” NBER Working Paper 18119, National Bureau of Economic Research, Cambridge, MA.

Chapter 1: The Continuing COVID-19 Pandemic and the Economic Outlook ● 47
Brancatelli, C., A. Marguerie, and S. Brodmann. 2020. “Job Creation and Demand for Skills in Kosovo: What Can We Learn from Job Portal Data?” Policy Research Working Paper 9266, World Bank, Washington, DC.
Canning, D., and P. Pedroni. 2008. “Infrastructure, Long-Run Economic Growth and Cau-sality Tests for Cointegrated Panels.” The Manchester School 76 (5): 504–27.
Cieślik, A., and L. Goczek. 2018. “Control of Corruption, International Investment, and Economic Growth—Evidence from Panel Data.” World Development 103 (C): 323–35.
Cusolito, A. P., D. Lederman, and J. Pena. 2020. “The Effects of Digital-Technology Adop-tion on Productivity and Factor Demand: Firm-Level Evidence from Developing Coun-tries.” Policy Research Working Paper 9333, World Bank, Washington, DC.
de Vaal, A., and W. Ebben. 2011. “Institutions and the Relation between Corruption and Economic Growth.” Review of Development Economics 15 (1): 108–23.
Demirgüc-Kunt, A., M. Lokshin, and I. Torre. 2020. “Opening-up Trajectories and Eco-nomic Recovery: Lessons after the First Wave of the COVID-19 Pandemic.” Policy Re-search Working Paper 9480, World Bank, Washington, DC.
Demirgüc-Kunt, A., A. Pedraza, and C. Ruiz-Ortega. 2020. “Banking Sector Performance during the COVID-19 Crisis.” Policy Research Working Paper 9363, World Bank, Wash-ington, DC.
Devine, D., J. Gaskell, W. Jennings, and G. Stoker. 2020. “Trust and the Coronavirus Pan-demic: What Are the Consequences of and for Trust? An Early Review of the Literature.” Political Studies Review, https:// doi.org/10.1177/1478929920948684.
Dieppe, A., ed. 2020. Global Productivity: Trends, Drivers, and Policies. Washington, DC: World Bank.
Dinarte, L., E. Medina-Cortina, D. Jaume, and H. Winkler. 2021. “Not by Land nor by Sea: The Rise of Formal Remittances during COVID-19.” World Bank, Washington, DC. https://devpolicy.org/Events/2021/Not-by-land-nor-by-sea-the-rise-of-formal-remittances-during-COVID-19-Dinarte-13Apr/Full-paper.pdf.
Divanbeigi, R., and R. Ramalho. 2015. “Business Regulations and Growth.” Policy Research Working Paper 7299, World Bank, Washington, DC.
Djankov, S., C. McLiesh, and R. Ramalho. 2006. “Regulation and Growth.” Economics Let-ters 92 (3): 395–401.
Dort, T., P. Meon, and K. Sekkat. 2014. “Does Investment Spur Growth Everywhere? Not Where Institutions Are Weak.” Kyklos 67 (4): 482–505.
EBRD (European Bank for Reconstruction and Development). 2020. Transition Report 2020-21: The State Strikes Back. London: EBRD.
ECDC (European Centre for Disease Prevention and Control). 2021. “Overview of the Im-plementation of COVID-19 Vaccination Strategies and Vaccine Deployment Plans in the EU/EEA.” Technical Report, ECDC, Solna, Sweden.
EEA (European Environmental Agency). 2019. Climate Change Adaptation in the Agricul-ture Sector in Europe. Luxembourg: EEA.
Egan, P. 2013. “R&D in the Periphery? Foreign Direct Investment, Innovation, And Institu-tional Quality in Developing Countries.” Business and Politics 15 (1): 1–32.
El-Mallakh, N. 2020. “Internet Job Search, Employment, and Wage Growth: Evidence from the Arab Republic of Egypt.” Policy Research Working Paper 9196, World Bank, Wash-ington, DC.
Fasih, T., H. A. Patrinos, and M. J. Shafiq. 2020. “The Impact of COVID-19 on Labor Market Outcomes: Lessons from Past Economic Crises.” Education for Global Development Blog, World Bank, May 20, https://blogs.worldbank.org/education/impact-covid-19-labor-market-outcomes-lessons-past-economiccrises.

48 ● World Bank ECA Economic Update Spring 2021
Flabbi, L., and R. Gatti. 2018. “A Primer on Human Capital.” Policy Research Working Pa-per 8309, World Bank, Washington, DC.
Francisco, A. K., and M. Tanaka. 2020. “Does Public Infrastructure Affect Human Capital? The Effect of Improved Transport Connectivity on Children’s Education in the Philip-pines.” Economics of Education Review 73 (C).
Freedom House. 2021. Freedom in the World 2021: Democracy under Siege. Washington, DC: Freedom House.
Gavi, The Vaccine Alliance. 2021. COVAX Global Supply Forecast. Geneva: Gavi.
Glaeser, E., R. La Porta, F. Lopez-de-Silanes, and A. Shleifer. 2004. “Do Institutions Cause Growth?” Journal of Economic Growth 9 (3): 271–03.
Glaeser, E., G. Ponzetto, and A. Shleifer. 2007. “Why Does Democracy Need Education?” Journal of Economic Growth 12 (2): 77–99.
Gründler, K., and N. Potrafke. 2019. “Corruption and Economic Growth: New Empirical Evidence.” European Journal of Political Economy 60 (C): Article 101810.
Guenette, J.D., and T. Yamazaki. 2021. “Projecting the Economic Consequences of the COVID-19 Pandemic.” Policy Research Working Paper 9589, World Bank, Washington, DC.
Gwartney, D., R. Holcombe, and R. Lawson. 2006. “Institutions and the Impact of Invest-ment on Growth.” Kyklos 59 (2): 255–73.
Hale, T., N. Angrist, E. Cameron-Blake, L. Hallas, B. Kira, S. Majumdar, A. Petherick et al. 2020. Oxford COVID-19 Government Response Tracker, Blavatnik School of Govern-ment. https://www.bsg.ox.ac.uk/research/research-projects/coronavirus-government-response-tracker.
Hallegatte, S., and S. Hammer. 2020. “Thinking Ahead: For a Sustainable Recovery from COVD-19 (Coronavirus).” Development and Changing Climate Blog, March 30, https://blogs.worldbank.org/climatechange/thinking-ahead-sustainable-recovery-covid-19-coronavirus.
Hallegatte, S., J. Rentschler, and J. Rozenberg. 2019. Lifelines: The Resilient Infrastructure Opportunity. Sustainable Infrastructure. Washington, DC: World Bank.
Hallward-Driemeier, M., and G. Nayyar. 2017. Trouble in the Making? The Future of Man-ufacturing-Led Development. Washington, DC: World Bank.
Hepburn, C., B. O’Callaghan, N. Stern, J. Stiglitz, and D. Zenghelis. 2020. “Will COVID-19 Fiscal Recovery Packages Accelerate or Retard Progress on Climate Change?” Smith School Working Paper 20-02, University of Oxford, Oxford.
Hjort, J., and J. Poulsen. 2019. “The Arrival of Fast Internet and Employment in Africa.” American Economic Review 109 (3): 1032–79.
Hodge, A., S. Shankar, D. Rao, and A. Duhs. 2011.“Exploring the Links between Corruption and Growth.” Review of Development Economics 15 (3): 474–90.
IEA (International Energy Agency). 2020. “Sustainable Recovery.” World Energy Outlook Special Report in collaboration with the International Monetary Fund. International En-ergy Agency, Paris, https:// www.iea.org/reports/sustainable-recovery.
ILO (International Labour Organization). 2021. ILO Monitor: COVID-19 and the World of Work, seventh edition. Geneva: ILO.
IOSCO (International Organization of Securities Commissions). 2020. “Development of Emerging Capital Markets: Opportunities, Challenges and Solutions. Final Report.” IOSCO, Madrid, Spain.
Kenney, M., and J. Zysman. 2020. “COVID-19 and the Increasing Centrality and Power of Platforms in China, the U.S., and Beyond.” Management and Organization Review 16 (4): 747–52.

Chapter 1: The Continuing COVID-19 Pandemic and the Economic Outlook ● 49
Kilic Celik, S., M. A. Kose, and F. Ohnsorge. 2020. “Subdued Potential Growth: Sources and Remedies.” In Growth in a Time of Change: Global and Country Perspectives on a New Agenda, edited by H.-W. Kim and Z. Qureshi. Washington, DC: Brookings Institution.
Kirkpatrick, C. 2014. “Assessing the Impact of Regulatory Reform in Developing Coun-tries.” Public Administration and Development 34 (3): 162–68.
Kose, M. A., P. Nagle, F. Ohnsorge, and N. Sugawara. 2020a. Global Waves of Debt: Causes and Consequences. Washington, DC: World Bank.
Laeven, L., and F. Valencia. 2020. “Systemic Banking Crises Database II.” IMF Economic Review 68: 307–61.
Li, C., and F. Lalani. 2020. “The COVID-19 Pandemic Has Changed Education Forever. This Is How.” WEforum.org, April 29, https://www.weforum.org/agenda/2020/04/coronavi-rus-educationglobal-covid19-online-digital-learning/.
Marcec, R., M. Matja, and R. Likic. 2021. “Will Vaccination Refusal Prolong the War on SARS-CoV-2?” Postgraduate Medical Journal 2021 (97): 143–49.
Murray, C., and P. Piot. 2021. The Potential Future of the COVID-19 Pandemic. JAMA, http://www.healthdata.org/research-article/potential-future-covid-19-pandemic.
Nawaz, S. 2015. “Growth Effects of Institutions: A Disaggregated Analysis.” Economic Modelling 45 (C):118–26.
OECD (Organisation for Economic Co-operation and Development). 2015. Consequences of Corruption at the Sector Level and Implications for Economic Growth and Develop-ment. Paris: OECD.
———. 2020. “Building Back Better: A Sustainable, Resilient Recovery after COVID-19.” OECD Policy Responses to Coronavirus (COVID-19). OECD, Paris.
Oxford Economics. 2020. “The Oxford Global Economic Model.” July. Oxford Economics, Oxford, UK.
Peisakhin, L., and P. Pinto. 2010. “Is Transparency an Effective Anti-Corruption Strategy? Evidence from a Field Experiment in India.” Regulation and Governance 4 (3): 261–80.
Prati, A., M. G. Onorato, and C. Papageorgiou. 2013. “Which Reforms Work and under What Institutional Environment?” Review of Economics and Statistics 95 (3): 946–68.
Quayyum, S. N., and R. K. Kpodar. 2020. “Supporting Migrants and Remittances as CO-VID-19 Rages On.” IMFblog, September 11, 2020, https://blogs.imf.org/2020/09/11/supporting-migrants-and-remittances-as-covid-19-rages-on/.
Rovo, N. 2020. “Structural Reforms to Set the Growth Ambition.” Policy Research Working Paper 9175, World Bank, Washington, DC.
Rozenberg, J., and M. Fay, eds. 2019. Beyond the Gap: How Countries Can Afford the Infrastructure They Need While Protecting the Planet. Washington, DC: World Bank.
Sala-i-Martin, X., G. Doppelhofer, and R. Miller. 2004. “Determinants of Long-Term Growth: A Bayesian Averaging of Classical Estimates (BACE) Approach.” American Economic Review 94 (4): 813–35.
Shleifer, A., and R. Vishny. 1993. “Corruption.” Quarterly Journal of Economics 108 (3): 599–617.
Shmis, T., A. Sava, J. E. N. Teixeira, and H. A. Patrinos. 2020. “Response Note to COVID-19 in Europe and Central Asia: Policy and Practice Recommendations.” World Bank, Wash-ington, DC.
Strand, J., and M. Toman. 2010. “Green Stimulus, Economic Recovery, and Long-Term Sustainable Development.” Policy Research Working Paper 5163, World Bank, Wash-ington, DC.
Topalova, P., and A. Khandelwal. 2011. “Trade Liberalization and Firm Productivity: The Case of India.” Review of Economics and Statistics 93 (3): 995–1009.

50 ● World Bank ECA Economic Update Spring 2021
UNCTAD (United Nations Conference on Trade and Development). 2021a. Global Trade Update. Geneva: UNCTAD.
———. 2021b. Investment Trends Monitor. Issue 38. Geneva: UNCTAD.
UNECE (United Nations Economic Commission for Europe). 2020. Europe and Central Asia: Regional Food Market Situation and Policy Bulletin in Response to the COVID-19 Pandemic. Issue 2. UNECE, Geneva, Switzerland.
Vegas, E., and R. Winthrop. 2020. “Beyond Reopening Schools: How Education Can Emerge Stronger Than before COVID-19.” Brookings Institution, Washington, DC.
VFDI (Vivid Economics and Finance for Diversity Initiative). 2020. Greenness of Stimulus Index. London: Vivid Economics.
Viollaz, M., and H. Winkler. 2020. “Does the Internet Reduce Gender Gaps? The Case of Jordan.” Policy Research Working Paper 9183, World Bank, Washington, DC.
Vu, T. 2019. “Does Institutional Quality Foster Economic Complexity?” MPRA Paper 97843, University Library of Munich, Munich.
WEF (World Economic Forum). 2020. The Future of Jobs Report 2020. Geneva: World Economic Forum.
World Bank. 2014. Doing Business 2014. Understanding Regulations for Small and Medi-um-Size Enterprises. Washington, DC: World Bank.
———. 2017. World Development Report 2017: Governance and the Law. Washington, DC: World Bank.
———. 2018. Global Economic Prospects: Broad Based Upturn, but for How Long? Janu-ary. Washington, DC: World Bank.
———. 2019a. Global Economic Prospects: Darkening Skies. January. Washington, DC: World Bank.
———. 2019b. Global Economic Prospects: Heightened Tensions, Subdued Investment. June. Washington, DC: World Bank.
———. 2019c. World Development Report: Learning to Realize Education’s Promise. Washington, DC: World Bank.
———. 2020a. Commodity Markets Outlook: Persistence of Commodity Shocks. October. Washington, DC: World Bank.
———. 2020b. The Cost of Staying Healthy—Semiannual Report of the Latin America and the Caribbean Region. Washington, DC: World Bank.
———. 2020c. The COVID-19 Pandemic: Shocks to Education and Policy Responses. Washington, DC: World Bank.
———. 2020d. Enhancing Government Effectiveness and Transparency: The Fight Against Corruption. Washington, DC: World Bank.
———. 2020e. Europe and Central Asia Economic Update, Fall 2020: COVID-19 and Hu-man Capital. Washington, DC: World Bank.
———. 2020f. Global Economic Prospects. June. Washington, DC: World Bank.
———. 2020g. Global Economic Prospects: Slow Growth, Policy Challenges. January. Washington, DC: World Bank.
———. 2020h. The Human Capital Index, 2020 Update: Human Capital in the Time of COVID-19. Washington, DC: World Bank.
———. 2020i. World Development Report 2020: Trading for Development in the Age of Global Value Chains. Washington, DC: World Bank.
———. 2021. Global Economic Prospects. January 2021. Washington, DC: World Bank.

51
2
51
Thirty years after the fall of the Berlin Wall, the process of transformation continues in Europe and Central Asia (ECA). Governments in the region have made strides in devel-oping their economies through structural reforms and investments in education and healthcare. The quality of government has increasingly come to be seen as the central mediator of economic development. Public policy shapes the nature of development through both its actions and inactions. Countries’ fates depend on their governance—a fact that the COVID-19 pandemic has underscored.
Governments play a critical role in determining the productivity of ECA econo-mies, where government expenditures account for almost 40 percent of GDP and the public sector employs more than a quarter of the workforce. Given the scale of public sector employment in ECA, governments have considerable weight in influencing labor market standards through their policies. This significant role of the government underscores the importance of improving the quality of gover-nance in ECA to effectively respond to the region’s economic and social challenges.
Strengthening state capacity while improving citizen trust is a priority for governments across ECA. Digitalization and the data revolution can fundamen-tally change the quality of government. Public administrations’ use of data is vital in catalyzing institutional evolution. As the costs of producing, analyzing, and aggregating data plummet, and the availability of analytically trained work-ers increases, governments across the region are adopting and adapting data sys-tems within their management and organizational models. To fully exploit the opportunities of the data revolution, governments must situate and coordinate their modernization within the unique nature of the public service.
Data, Digitalization, and Governance

52 ● World Bank ECA Economic Update Spring 2021
This report argues that the data revolution and digitalization are among the most practical and feasible approaches to improving governance in ECA. The use of information technologies in the public sector has been increasing exponen-tially over the last three decades, penetrating all government sectors: from per-sonal management systems to judiciary services. A large body of evidence reveals the positive impact of digitalization on government efficiency, accountability, control of corruption, and service delivery.
By increasing transparency and the availability of information and reducing information asymmetry, the digital revolution was embraced by different politi-cal regimes and by countries with different levels of economic development. The modernization of governments in ECA would also produce large externalities for the region and the world. The World Bank’s role is to help its client countries internalize such externalities and advise on addressing the social, political, orga-nizational, and legal challenges of the transition from the “analog” to “digital” governance.
Digitalization and the data revolution can also help strengthen linkages be-tween governments and citizens. Transparency and availability of information pave the way for a societal paradigm shift. It reduces the information asymmetry between governments and ordinary citizens. The accessibility and sharing of in-formation are transforming governance models from hierarchical technocracies to open networked economies, creating opportunities for civil society and indi-vidual citizens to hold governments accountable.
The COVID-19 pandemic has underscored the importance of digital technolo-gies and highlighted the costs associated with delaying public sector moderniza-tion. The crisis may catalyze advances in digitalization and the use of data by the public.
This chapter proposes policy recommendations, grounded in empirical evi-dence, for harnessing the data revolution to improve governance across ECA. They include the following:
• Implement incentive structures to encourage the adoption and adaptation of data systems within the civil service.
• Expand the impact of the data revolution through coordination of decentral-ized data systems across institutions.
• Foster platforms for citizens to hold government accountable.• Redefine the firewall between societies and governments by experimenting
with direct feedback between citizens and government.
The chapter is organized as follows. The first section outlines the significant role of government in ECA countries and discusses the importance of good gov-ernance in determining countries’ productivity and efficiency. The following sec-tions describe the current conditions of data and digitalization for state capacity and for collaborative governance in ECA countries. They underscore the need for interoperability of data systems in government and civil society to achieve trans-parency, data-fueled decision making, and accountability. The last section sum-marizes the main conclusions and provides recommendations on using the data revolution to make governance and civil service management more effective.

Chapter 2: Data, Digitalization, and Governance ● 53
The Important Role of Government and Governance in Europe and Central AsiaWith many countries still transitioning to market economies, the public sector plays a critical role in determining the productivity of economies in ECA. As the employer of more than a quarter of the region’s workers, particularly the more educated ones, govern-ments in the region affect labor market standards through their policies and composition. Although the region as a whole is home to the highest-quality governance in the world, average figures conceal large subregional differences in the governance quality. Improv-ing the quality of governance is critical if ECA is to respond to the economic and social challenges it faces.
The Role of Government in Europe and Central Asia
Government plays a critical role in determining the productivity of the econo-mies of ECA. Government expenditures in the region account for 39 percent of GDP—a larger share than the world average of 33 percent.
Across the world, government expenditure as a share of GDP increases with per capita income (figure 2.1). This correlation suggests that this share is likely to rise in ECA, as the region’s middle-income countries experience stronger growth in the coming years.
Within ECA, the richest subregions (Northern, Southern, and Western Eu-rope) spend more than 40 percent of their GDP on public expenditures; the poor-est subregions (Central Asia and the South Caucasus) spend less than a third (figure 2.2).
Source: IMF and Worldwide Bureaucracy Indicators (World Bank 2020d).Note: Figure plots the public expenditure expressed as a share of GDP in 2019 (vertical axis), and the log of GDP per capita in 2019 expressed in current dollars (horizontal axis).
FIGURE 2.1 Correlation between government expenditure as share of GDP and log of GDP per capita in 2019
0
10
20
30
40
50
60
6 10 12Log of GDP per capita
ECA World
Gov
ernm
ent e
xpen
ditu
re a
s pe
rcen
t of G
DP
8

54 ● World Bank ECA Economic Update Spring 2021
Governments in ECA also play an outsized role in shaping labor markets. The public sector employs 86 million people (just over 25 percent of total employ-ment), a significantly larger share than the global average of 16 percent.1
The share of public sector employment in total employment (formal and infor-mal) varies significantly across subregions. The Russian Federation and Eastern Europe have the largest shares (more than 30 percent of total employment), and the South Caucasus and Turkey have the smallest shares (no more than 20 per-cent). State-owned enterprises account for at least 5 percent of total employment in Central, Eastern, and Southeastern Europe (Richmond and others 2019).
Given the large scale of public sector employment in ECA, governments have considerable weight in influencing labor market standards through their policies and compositions. The characteristics of public administration shape broader labor market trends (Hasnain and others 2019; Gindling, Mossaad, and Newhouse 2020).
Public employment in the region attracts skilled labor: 54 percent of public sector employees in the region have tertiary education. This share is highest in the South Caucasus and Northern Europe (above 60 percent) and lowest in Cen-tral Asia, Eastern Europe, and the Western Balkans (below 50 percent). Public sector employees are considerably more educated than the average person in the region, particularly in lower-income countries (figure 2.3). In the South Cauca-sus, Central Asia, and Western Balkans, the share of the population with tertiary education is more than twice as large in the public sector as it is in the population at large.
1. Calculation based on ILOSTAT (2020) and country-specific sources.
FIGURE 2.2 Public expenditure and public employment in Europe and Central Asia, by subregion
28
4137
49
34
29
43
3537
42
29
21
36
31 31
2023
16
2527
0
10
20
30
40
50
Centra
l Asia
Centra
l Euro
pe and
Baltic
coun
tries
Eastern
Europe
Northern
Europe
Russian
Federa
tion
South
Cauca
sus
South
ern Euro
peTu
rkey
Western
Balkan
s
Western
Europe
Shar
e of
GD
P/sh
are
of to
tal
empl
oym
ent (
perc
ent)
Public employment as a share of total employmentPublic expenditure as a percent of GDP
Source: IMF Fiscal Monitor, Worldwide Bureaucracy Indicators (World Bank 2020d), and country labor force surveys.Note: Data are averages for 2010–19. Figure plots the subregional average of the public expenditure expressed as a share of GDP in 2019 or lat-est available year (red bar), and the public employment as a share of total employment in 2019 or latest available year (blue bar).

Chapter 2: Data, Digitalization, and Governance ● 55
Women make up about 57 percent of public sector paid employees in the re-gion (table 2.1). In Northern Europe, 74 percent of public sector paid employees are women, the largest share in the region. Kosovo has the smallest share, at less than 34 percent.
In all countries the share of female employees is larger in the public sector than in the private sector (figure 2.4), possibly because the female-to-male wage ratio is slightly higher in the public sector (0.783) than in the private sector (0.767) (Hasnain and others 2019). Turkey and the Western Balkans have the highest fe-male-to-male public sector wage ratios within the region, and Western Europe and Central Asia have the lowest.
Pay ratios in the private sector in the region suggest that the pay ratio is not the only factor behind the larger share of women among public employees, how-ever. Among the 34 countries in the region for which the comparison can be made, female-to-male wage ratios are higher in the public sector than in the pri-vate sector in 22 and lower in 12 countries (figure 2.5). The better complementar-ity with family responsibilities and shorter work hours of public sector jobs may explain women’s preference for public employment in countries where women are still expected to perform most household tasks (World Bank 2012).
The structure of wages in the public sector is relevant for various aspects of career development, including upward mobility, pay progression, and pay satis-faction, as well as for competition for talent with the private sector. If, for exam-ple, public sector workers receive significantly lower wages than their private sector counterparts, the supply of qualified personnel in the public sector may fall, adversely affecting the quality of publicly provided goods and services.
FIGURE 2.3 Percent of people with tertiary education among public sector employees and adult population at large
KAZTJK
UZBBGR
HRV
EST
HUN
LVA
POL
ROU
MDA
DNK
FIN
ISL
NORGEO
CYPGRC
ITA
MLT
PRT
ESPTUR
BIH
SRB
AUT
BEL
FRA
IRL
LUX
CHE
GBR
0
20
40
60
80
0 20 40 60 80
Perc
enta
ge o
f pub
lic e
mpl
oyee
s w
ith te
rtia
ry e
duca
tion
Percentage of the adult population with tertiary education
Source: Worldwide Bureaucracy Indicators (World Bank 2020d), Eurostat, and labor force surveys.Note: Figure plots the percentage of public employees that have tertiary education (vertical axis) and the percentage of the adult population that has tertiary education (horizontal axis) in 2019 (or the latest available year). Data for 2019 or latest year available. Country abbreviations are in the section Country Codes.

56 ● World Bank ECA Economic Update Spring 2021
TABL
E 2.
1 Q
ualit
y of
gov
erna
nce
and
char
acte
ristic
s of
pub
lic s
ecto
r in
Euro
pe a
nd C
entr
al A
sia,
by
coun
try
Sub
reg
ion/
cou
ntry
Ave
rage
WG
I, 20
19
Publ
ic
expe
nditu
re a
s pe
rcen
t of G
DP,
20
19
Publ
ic s
ecto
r em
ploy
men
t as
perc
ent o
f tot
al
empl
oym
ent
Pay
com
pres
sion
ra
tio in
pub
lic
sect
or
Mea
n fe
mal
e:
mal
e w
age
ratio
in
pub
lic s
ecto
r
Perc
ent o
f w
omen
am
ong
publ
ic s
ecto
r em
ploy
ees
Perc
ent o
f pu
blic
pai
d em
ploy
ees
with
tert
iary
ed
ucat
ion
Perc
ent o
f ad
ults
25–
64
with
tert
iary
ed
ucat
ion
Euro
pe a
nd C
entr
al A
sia
(cou
ntry
av
erag
e)0.
5239
.425
.54.
560.
7856
.757
.333
.2
Cen
tral
Asi
a –
0.88
28.0
28.5
5.3
0.69
47.2
47.7
23.4
Kaz
akhs
tan
0.3
20.3
37.2
3.5
0.77
51.5
40.3
38.2
Kyrg
yz R
epub
lic –
0.62
34.2
20.8
——
——
19.9
Tajik
ista
n –
1.17
29.5
28.0
7.5
0.55
38.8
38.9
23.1
Turk
men
ista
n–1
.38
——
——
——
—
Uzb
ekis
tan
–0.
9128
.228
.05.
00.
7551
.263
.912
.3
Cen
tral
Eur
op
e an
d B
altic
co
untr
ies
0.7
340
.820
.64.
00.
8169
.861
.531
.5
Bul
gar
ia 0
.28
36.0
17.1
5.2
0.83
69.4
58.3
28.1
Cro
atia
0.4
647
.120
.63.
70.
8268
.451
.825
.3
Cze
ch R
epub
lic 0
.93
41.2
19.5
3.4
0.69
72.9
44.3
—
Est
oni
a 1
.24
39.0
21.5
4.4
0.75
75.5
76.6
41.4
Hun
gar
y 0
.42
46.1
26.1
5.3
0.89
69.4
50.3
26.0
Latv
ia 0
.86
37.8
22.7
4.5
0.77
76.9
68.5
35.7
Lith
uani
a 0
.96
34.1
22.3
3.7
0.83
76.9
82.4
43.1
Pola
nd 0
.65
42.0
19.6
3.6
0.77
73.3
68.1
32.0
Rom
ania
0.2
433
.413
.53.
00.
8960
.564
.718
.4
Slov
ak R
epub
lic 0
.71
42.8
21.2
2.8
0.81
71.1
50.5
—
Slov
enia
0.9
943
.722
.5—
—52
.9—
33.3
East
ern
Euro
pe
–0.
4437
.236
.17.
70.
7862
.943
.533
.2
Bel
arus
–0.
4538
.639
.3—
——
—29
.6
Mol
dov
a –
0.31
31.4
30.3
12.5
0.81
63.6
43.5
19.4
Ukr
aine
–0.
5741
.538
.72.
90.
7562
.1—
50.7
Nor
ther
n Eu
rop
e 1
.69
48.8
30.5
3.6
0.77
74.0
63.1
43.8
Den
mar
k1.
6849
.733
.72.
80.
8670
.263
.440
.0
Finl
and
1.74
53.2
26.9
3.5
0.79
77.7
64.2
46.0
Icel
and
1.56
41.8
29.9
4.0
0.65
77.3
61.2
45.2
Nor
way
1.77
50.8
33.0
4.1
0.76
70.7
63.4
44.0
Swed
en1.
7248
.429
.2—
——
—44
.0
(con
tinue
d ne
xt p
age)

Chapter 2: Data, Digitalization, and Governance ● 57
Sub
reg
ion/
cou
ntry
Ave
rage
WG
I, 20
19
Publ
ic
expe
nditu
re a
s pe
rcen
t of G
DP,
20
19
Publ
ic s
ecto
r em
ploy
men
t as
perc
ent o
f tot
al
empl
oym
ent
Pay
com
pres
sion
ra
tio in
pub
lic
sect
or
Mea
n fe
mal
e:
mal
e w
age
ratio
in
pub
lic s
ecto
r
Perc
ent o
f w
omen
am
ong
publ
ic s
ecto
r em
ploy
ees
Perc
ent o
f pu
blic
pai
d em
ploy
ees
with
tert
iary
ed
ucat
ion
Perc
ent o
f ad
ults
25–
64
with
tert
iary
ed
ucat
ion
Russ
ian
Fed
erat
ion
–0.
5833
.631
.05.
10.
7665
.839
.9
Sout
h C
auca
sus
–0.
1129
.120
.08.
10.
8855
.965
.930
.8
Arm
enia
–0.
124
.822
.2—
——
—26
.1
Aze
rbai
jan
–0.
6633
.423
.4—
——
——
Geo
rgia
0.4
529
.114
.38.
10.
8855
.965
.935
.5
Sout
hern
Eur
op
e 0
.86
42.7
23.1
4.4
0.78
60.2
59.1
31.7
Cyp
rus
0.83
39.5
21.1
6.0
0.70
56.1
66.1
44.7
Gre
ece
0.3
946
.222
.32.
90.
8453
.170
.331
.9
Ital
y 0
.56
48.7
18.6
3.9
0.71
62.1
46.7
19.6
Mal
ta 0
,87
37.2
29.3
3.1
0.84
58.7
56.1
29.1
Port
ugal
1.0
742
.724
.44.
90.
8168
.846
.926
.3
Spai
n 0
.85
41.9
23.0
5.9
0.77
62.5
68.5
38.6
Turk
ey –
0.45
35.2
15.7
3.0
0.90
34.9
65.0
20.6
Wes
tern
Bal
kans
–0.
05 3
7.4
24.7
2.93
0.89
45.6
47.5
21.1
Alb
ania
–0.
0831
.720
.02.
600.
9146
.343
.6—
Bos
nia
and
Her
zeg
ovin
a –
0.38
45.2
30.3
4.29
0.91
38.2
32.1
13.3
Kos
ovo
–0.
3629
.230
.72.
000.
9233
.556
.7—
Mo
nten
egro
0.1
45.3
25.6
——
——
25.8
Nor
th M
aced
oni
a –
0.03
32.1
22.8
——
——
21.3
Serb
ia –
0.08
40.7
18.8
2.85
0.83
64.5
57.7
23.9
Wes
tern
Eur
op
e 1
.47
42.4
027
.45.
440.
7264
.055
.942
.0
Aus
tria
1.4
548
.21
24.1
6.43
0.64
65.9
55.4
33.8
Bel
giu
m 1
.18
52.2
734
.93.
120.
7767
.363
.340
.7
Fran
ce 1
.17
55.5
631
.55.
370.
7670
.046
.137
.9
Ger
man
y 1
.46
45.1
722
.4—
—48
.3—
—
Irel
and
1.3
424
.20
26.7
5.99
0.76
70.9
78.1
47.3
Luxe
mb
our
g 1
.70
42.6
331
.25.
380.
7750
.333
.147
.0
Net
herl
and
s 1
.65
42.2
719
.9—
——
—40
.4
Swit
zerl
and
1.7
332
.67
26.5
6.40
0.62
69.1
52.4
44.4
Uni
ted
Kin
gd
om
1.3
738
.61
29.0
5.37
0.70
70.4
62.8
44.7
Sour
ces:
All
data
exc
ept a
vera
ge W
GI s
core
s, p
ublic
exp
endi
ture
, and
tert
iary
edu
catio
n ar
e fro
m W
orld
wid
e B
urea
ucra
cy In
dica
tors
(Wor
ld B
ank
2020
d), e
xcep
t for
Tur
key
and
the
Russ
ian
Fede
ra-
tion.
Lab
or fo
rce
data
for T
urke
y co
me
from
the
2019
labo
r for
ce s
urve
y. D
ata
on p
ublic
sec
tor e
mpl
oym
ent i
n Ru
ssia
com
e fro
m D
i Bel
la, D
ynni
kova
and
Sla
vov
(201
9). A
vera
ge W
GI s
core
s ar
e fro
m W
orld
Ban
k (2
020c
). Pu
blic
exp
endi
ture
as
perc
ent o
f GD
P ar
e fro
m IM
F (2
020)
. Per
cent
of a
dults
with
tert
iary
edu
catio
n is
from
EU
and
nat
iona
l lab
or fo
rce
surv
eys.
Dat
a ar
e la
test
ava
ilabl
e fo
r eac
h in
dica
tor;
year
s va
ry b
y co
untr
y. P
ublic
sec
tor e
mpl
oym
ent i
nclu
des
empl
oyee
s of
sta
te-o
wne
d en
terp
rises
. N
ote:
a. T
he p
ay c
ompr
essi
on ra
tio is
the
ratio
of t
he 9
0th
perc
entil
e of
wag
es to
the
10th
per
cent
ile.
— N
ot a
vaila
ble.
TABL
E 2.
1 (c
ontin
ued)

58 ● World Bank ECA Economic Update Spring 2021
FIGURE 2.4 Percent of women employees in public and private sectors in Europe and Central Asia
ALB
AUTBEL
BGR
BIH
CHE
CYP
CZE
DNK
ESP
EST
FIN
FRAGBR
GEO
GRC
HRVHUN
IRL
ISL
ITA
KAZ
LTU
LUX
LVA
MDA
MLT
NORPOL
PRT
ROU
RUSSRB
SVK
SVN
TJK
TUR
UKR
UZB
XKX
20
30
40
50
60
70
80
Wom
en a
s pe
rcen
t of p
ublic
sec
tor e
mpl
oyee
s
20 30 40 50 60 70 80Women as percent of private sector employees
Source: Worldwide Bureaucracy Indicators (World Bank 2020d) and Turkey 2019 Labor Force Survey.Note: Figure plots the percentage of public paid employees that are female (vertical axis) and the percentage of private paid employees that are female (horizontal axis). Data are for 2019 or latest available year. Country abbreviations are in the section Country Codes.
FIGURE 2.5 Female-to-male wage ratio in public and private sectors of Europe and Central Asia ALB
AUT
BEL
BGR
BIH
CHE
CYPCZE
DNK
ESP
EST
FINFRA
GBR
GRCHRV
HUN
IRL
ISL
ITA
KAZ
LTU
LUX LVAMDA
MLT
NOR
POLPRT
ROU
RUS
SRBSVK
TJK
TUR
UKRUZB
XKX
1
Fem
ale−
to−m
ale
wag
e ra
tio in
pub
lic s
ecto
r
1
Female−to−male wage ratio in private sector
0.9
0.9
0.8
0.8
0.7
0.7
0.6
0.6
0.5
0.5
0.4
0.4
Source: Worldwide Bureaucracy Indicators (World Bank 2020d) and Turkey 2019 Labor Force Survey.Note: Figure plots the female-to-male wage ratio in the public sector (vertical axis) and the female-to-male wage ratio in the private sector (hori-zontal axis). Data are for 2019 or latest available year. Country abbreviations are in the section Country Codes.
Conversely, high public sector wage premiums may crowd out pro-poor spend-ing or increase youth unemployment (Gindling, Mossaad, and Newhouse 2019). They can also crowd out skilled employment in the private sector.
In many countries in ECA, pensions and fringe benefits for top-level jobs are only slightly less generous in the private sector than in the public sector. The

Chapter 2: Data, Digitalization, and Governance ● 59
public sector also pays higher average wages than the private sector for employ-ees with similar characteristics. These findings suggest that in the public sector, top talent is underpaid compared with lower-skilled labor, making it challenging to retain the best employees (Mizala, Romaguera, and Gallegos 2011; Gindling, Mossaad, and Newhouse 2019).
The pay compression ratio is the ratio of the 90th percentile of wages to the 10th percentile. Low values imply that the best-paid public servants earn little more than those at the entry level; high values imply greater differential compensation. The average ratio in the ECA region is 4.9, indicating that, on average, the best-paid public employees earn almost five times more than the lowest-paid ones. South Caucasus has the highest ratio in the region (8.1) and Kosovo the lowest (2.0).
Three trends could shape the role of government in ECA in upcoming years, for several reasons. First, the aging population of Europe will require expansion of healthcare, disability, and long-term care services. These services are more la-bor-intensive and expensive than other government-provided services. As a re-sult, the state tends to spend more and employ a larger share of the population in aging economies (EBRD 2020).
Second, support for state ownership is growing. The share of the population in advanced economies that favors the expansion of public ownership increased from 27 percent in 2017 to 33 percent in 2020; in the post-transition countries, about 45 percent of citizens support the expansion of public ownership (EBRD 2020). Sti-glitz (2015) attributes these trends to rising income inequality and the increased de-mand for redistribution, potentially through the increased share of state ownership.
Third, the COVID-19 pandemic has reinforced citizens’ desire for the state to socialize individual risks. Even before the pandemic, globalization and techno-logical change had reduced job security, especially for the most economically vulnerable individuals. Like many previous crises, the pandemic increased peo-ple’s risk aversion, which often leads to increased interest in a larger role for the state. Citizens in ECA have already witnessed a massive expansion of their gov-ernments’ role in public health systems, the welfare state, and education through policy interventions and regulations.
The Quality of Governance in Europe and Central Asia
The influential role that government has in shaping the broader productivity and the labor market of countries in ECA underscores the importance of looking at the quality of governance. Emerging research shows that the quality of gover-nance is significantly tied to the quality of life, with changes in governance qual-ity associated with higher quality of life (Helliwell and others 2018). Better gov-ernance is also associated with better development outcomes, including long-term growth (Kaufmann and Kraay 2002) and reduced inequality and poverty (World Bank 2006, 2017).
The average score of the six subcomponents of the Worldwide Governance Indicators (WGI) provides a valuable indicator of the quality of governance (box 2.1). ECA scores above average on both relative government expenditure and the quality of governance. This finding is consistent with the global trend in which gov-ernment quality is positively correlated with government expenditure (figure 2.6).

60 ● World Bank ECA Economic Update Spring 2021
How is governance defined?
Governance can be defined and measured in vari-ous ways. Some definitions cast a broad net. The World Bank’s 2017 World Development Report, for example, defines governance as “rules, enforce-ment mechanisms, and organizations.” Other defi-nitions are narrower, defining public sector gover-nance as “the manner in which power is exercised in the management of a country’s economic and social resources for development” (World Bank 1991).
Several datasets provide intercountry and intertemporal comparisons of the quality of gover-nance. They include the following:
• World Governance Indicators (WGI), pro-duced by the World Bank annually since 1996 for more than 200 countries (Kaufmann, Kraay, and Mastruzzi 2006)
• The World Economic Forum (WEF) gover-nance dataset, produced since 2007 for more than 140 countries (WEF 2018)
• Public Sector Governance (PSG) indicators, developed by the World Bank for the EU Commission, which focus on the public sec-tor and public administration (Bernstein, Recanatini and Georgieva-Andonovska 2018)
• The Bertelsmann Transformation Index (BTI) (Bertelsmann Stiftung 2020)
• The International Country Risk Guide (ICRG), produced by the PRS Group (PRS Group 2020).
Most of these indicators are highly correlated, and some of them (such as the ICRG) are used as components in constructing other indexes. The WGI uses a consistent methodology and covers the largest number of countries over the longest time period. This chapter, therefore, uses the WGI governance indicators.
The WGI defines governance as “the traditions and institutions by which authority in a country is exercised,” including “the process by which gov-ernments are selected, monitored and replaced; the capacity of the government to formulate and implement sound policies; and the respect of citi-zens and the state for the institutions that govern economic and social interactions among them” (Kaufmann, Kraay and Mastruzzi 2006). It measures governance through six subindices:
• Control of Corruption “captures percep-tions of the extent to which public power is exercised for private gain, including both petty and grand forms of corruption, as well as ‘capture’ of the state by elites and private interests.”
• Government Effectiveness captures “per-ceptions of the quality of public services, the quality of the civil service and the degree of its independence from political pressures, the quality of policy formulation and imple-mentation, and the credibility of the govern-ment’s commitment to such policies.”
• Political Stability and the Absence of Vio-lence captures “perceptions of the likelihood of political instability and/or politically-moti-vated violence, including terrorism.”
• Regulatory quality captures “perceptions of the ability of the government to formulate and implement sound policies and regula-tions that permit and promote private sector development.”
• Rule of Law captures “perceptions of the extent to which agents have confidence in and abide by the rules of society, and in par-ticular the quality of contract enforcement, property rights, the police, and the courts, as well as the likelihood of crime and violence.”
• Voice and Accountability captures “percep-tions of the extent to which a country’s citi-zens are able to participate in selecting their government, as well as freedom of expres-sion, freedom of association, and a free media.”
These subindices reflect more than 30 under-lying data scores, which represent the views of citizens, entrepreneurs, and experts in the public, private, and nongovernmental organization (NGO) sectors around the world. The values of the WGI subindices range from –2.5 to +2.5, with higher val-ues indicating better governance. This report uses the average score across the six subindices as the indicator of the governance quality, referred to as the governance score.
BOX 2.1

Chapter 2: Data, Digitalization, and Governance ● 61
Figure 2.7 illustrates the country-level variation in governance quality across the world. It and figure 2.8 show that ECA has the widest subregional disparities of governance quality in the world. Northern Europe and Western Europe have the world’s highest governance quality; the Russian Federation and Central Asia have the lowest rankings within ECA.
This subregional variability is also evident for the six subindices of the WGI (figure 2.9). Northern and Western Europe have the highest scores across all sub-indices. Central Asia and the Russian Federation have the lowest scores, except for Political Stability (where Eastern Europe, the South Caucasus, and Turkey have the lowest scores).
FIGURE 2.6 Correlation between government expenditure and World Governance Indicator scores, in Europe and Central Asia and the world, 2019
0
10
20
30
40
50
60
−2 −1 0 1 2Mean World Governance Indicator score
ECA World
Gov
ernm
ent e
xpen
ditu
re a
s pe
rcen
t of G
DP
Source: IMF and World Governance Indicators.
Governance score−2.5 to −1 −1 to 0 0 to 1 1 to 2.5 No data
IBRD 45687 |MARCH 2021
FIGURE 2.7 Average World Governance Indicator scores in the world, 2019
Source: World Governance Indicators.

62 ● World Bank ECA Economic Update Spring 2021
FIGURE 2.8 Average World Governance Indicator scores in Europe and Central Asia, by subregion, 2019
−0.88
0.7
−0.44
1.69
−0.58
0.76
−0.45
1.45
−1
0
1
2
WesternBalkans
WesternEurope
TurkeySouthernEurope
SouthCaucasus
RussianFederation
NorthernEurope
CentralAsia
Central Europe and
Baltic countries
EasternEurope
WG
I gov
erna
nce
scor
e
Source: World Governance Indicators.Note: Figure plots the subregional average of the WGI governance score in 2019.
FIGURE 2.9 Average scores on subindices of World Governance Indicators in Europe and Central Asia, by subregion, 2019
−2
−1
0
1
2
Political stability
Voice and accountability
Government effectiveness
Rule of law
Control of corruption
Regulatory quality
WesternBalkans
WesternEurope
TurkeySouthernEurope
SouthCaucasus
RussianFederation
NorthernEurope
CentralAsia
Central Europe and
Baltic countries
EasternEurope
WG
I gov
erna
nce
scor
e
Source: World Governance Indicators (World Bank 2020c).Note: Figure plots the subregional average of the six subindices of the World Governance Indicators in 2019. The black horizontal line shows the subregional average WGI score.

Chapter 2: Data, Digitalization, and Governance ● 63
Figure 2.10 shows the change in governance score across world regions, by subindex, between 1996 and 2019. Alongside East Asia and the Pacific, ECA leads the world in improvement in government quality, not only in the aggregate but also over almost all subindices over the past two decades. Over the same period, the governance quality in all other world regions declined.
Governance in the region improved significantly in underperforming coun-tries in the past 25 years. Most countries with low scores in 1996 increased them by 2019, and countries with higher scores maintained their scores (figure 2.11). Countries in the South Caucasus and the Western Balkans saw the largest increases in the quality of governance, albeit with some deterioration in recent years, particularly in the Western Balkans. Russia has not improved signifi-cantly since the mid-1990s, and Turkey has seen some deterioration. The overall governance scores of Hungary, and to some extent Poland, also declined in re-cent years.
Countries at the lower end of the ECA income distribution enjoyed larger improvements in government quality, and countries at the higher end demon-strated more stability (figure 2.12). These trends point to the convergence of gov-ernment quality in the region over time and explain the improvement in the re-gion as a whole.
FIGURE 2.10 Change in average Worldwide Governance Indicators scores between 1996 and 2019, by subindex and world region
−0.6
−0.4
−0.2
0
0.2
0.4
Chan
ge in
WG
I gov
erna
nce
scor
e
Political stability
Voice and accountability
Government effectiveness
Rule of law
Control of corruption
Regulatory quality
Sub-Saharan AfricaSouth AsiaNorth AmericaLatin Americaand the
Caribbean
Middle East andNorth Africa
East Asiaand Pacific
ECA
Source: World Governance Indicators.Note: Figure plots the change in the subregional average of the six subindices of the World Governance Indicators between 1996 and 2019. The black horizontal line shows the subregional average WGI score.

64 ● World Bank ECA Economic Update Spring 2021
FIGURE 2.11 Average World Governance Indicators scores of countries in Europe and Central Asia in 1996 and 2019
ALBARM
AZE
BLR
BEL
BIH
KGZ
BGRHRV
CZEEST
POL
FINAUT
CBR
ISL
IRLFRASVN
GEO GRCHUN
SWE
ITACYP
LUX
KAZKSV
LVALTU
PRTMLT
MDA
MNEMKD
NOR
ROM
SRB
SVKESP
CHE
TUR
TKM
UKR
RUS
UZB
−2
−1
0
1
2
−2 −1 0 1 21996 WGI governance score
2019
WG
I gov
erna
nce
scor
e
Eastern EuropeNorthern Europe
Russian FederationCentral AsiaCentral Europe andBaltic Countries
South Caucasus
Southern EuropeTurkey
Western BalkansWestern Europe
TJK
Source: World Governance Indicators (World Bank 2020c).Note: Figure plots, for each country, the WGI governance score in 2019 (vertical axis) and the WGI governance score in 1996 (horizontal axis). Country abbreviations are in the section Country Codes.
FIGURE 2.12 Correlation between changes in World Governance Indicators score and per capita GDP in Europe and Central Asia
ALB
ARM
AZE
BLRBIH
BGR
HRV
CZE FRA
EST
ISLSWEFIN
GEO
GRC
HUN
IRL
NOR
ITA
DNKNLD
AUTBEL
GBR
DEU
KAZ
KSVKGZ
LVA
LTU
LUXMDA
MNEMKD
POL
ROM
RUS
SRB
SVK
SVNPRT CYP
ESP
MLT
CHE
TJK
TUR
UKR
UZB
−0.5
0
0.5
1.0
1.5
7 8 9 10 11Log of per capita GDP 2019 (current PPP dollars)
Chan
ge in
WG
I gov
erna
nce
scor
e be
twee
n 19
96 a
nd 2
019
Eastern EuropeNorthern Europe
Russian FederationCentral AsiaCentral Europe andBaltic Countries
South Caucasus
Southern EuropeTurkey
Western BalkansWestern Europe
Source: World Development Indicators (World Bank 2020b) and World Governance Indicators (World Bank 2020c).Note: Figure plots the change in World Governance Indicators governance score between 1996 and 2019 (vertical axis) and the level of log GDP per capita in current dollars in 2019 (horizontal axis). Country abbreviations are in the section Country Codes.

Chapter 2: Data, Digitalization, and Governance ● 65
Harnessing Data and Digitalization to Improve State Capacity Technology can make government more efficient. The COVID-19 pandemic revealed the costs of delaying digitalization and modernization of the public sector. Improving the public sector’s productivity would have a profound impact in ECA, where state capacity in many countries is weak. As the data revolution transforms management systems worldwide, it offers the public sector an opportunity to optimize its management and organizational processes for a more significant societal impact. To capture the full benefits of the data revolution in the public sector, governments must integrate data systems within the public administration in a manner that actively addresses the public sector’s unique constraints to innovation and information.
Data and Digitalization
ECA is home to some of the most effective governments in the world. But state capacity is still weak in many of the region’s countries. Improving the efficiency of the state while building citizen trust is a key priority for governments across the region. This task is particularly important for members of the European Union (EU) and countries aspiring to join it, which are aligning with EU stan-dards of good governance (Arizti and others 2020).
Data lay the ground for improved decision making, optimized government functioning, and more effective resource allocation in government processes such as revenue management, procurement, and citizen interface (Hashim and Piatti-Fünfkirchen 2018; World Bank 2016, 2020a). Digitalization allows governments to provide higher-quality services more efficiently and at a lower cost, increases government accountability and transparency, and reduces corruption (Anderson 2009; Chopra 2014; Cumbie and Kar 2016; Bearfield and Bowman 2017; Ma and Zheng 2017).
The impact of the data revolution on the public sector hinges on the adoption and use of data systems, which entail the collection and use of accessible and actionable information relevant to decision making.2 The reach and sustainability of the data revolution are closely linked to digital transformation in the public sector. That transformation is marked by three processes that enable govern-ments to seamlessly access, engage with, and apply data in an agile, responsive, and proactive manner:
• digitization (the conversion of information from analog to digital formats)• digitalization (the adoption of digitized data and tools)• GovTech (a whole-of-government approach to public sector modernization
that promotes simple, efficient, and transparent government with the citizen at the center of reforms).
The data revolution can transform the internal organization and management of the civil service and policy making by making them more empirical.
2. The “data revolution” refers to the rapidly declining cost of producing, analyzing, and aggregating data and the substantial increase in the number of people who are trained in analytical methods.

66 ● World Bank ECA Economic Update Spring 2021
Empiricism is an approach that creates data-based mathematical models, which are used to reach conclusions about observed processes and form predictions about their progression.3 To fully capture the enormous benefits that improved data use can have for the public sector, governments must integrate data systems within the public administration in a manner that addresses the public sector’s unique constraints to innovation and information.
How Does Digital Government Become Better Government?
Across the world, the quality of government is increasingly informed by the ex-tent to which governments harness digital tools and GovTech to optimize man-agement, service delivery, and overall state capacity. Technology offers the poten-tial to increase efficiency, transparency, responsiveness, and citizen trust, directly affecting government. The COVID-19 pandemic made salient the opportunities that lie in fostering public sector modernization and the costs associated with delaying digitalization and GovTech implementation.
Digitalization of government has been shown to improve government capac-ity. Implementation of e-filing of taxes and e-procurement improves government capacity to raise and spend fiscal resources by lowering tax compliance costs, improving tax collection and public procurement competitiveness, and reducing corruption (Kochanova, Hasnain, and Larson 2020). The association between e-government and improved capacity is particularly strong for ECA countries, given their level of development, Internet penetration and the interoperability of their information management systems. Durkiewicz and Janowski (2018) find that digital government indicators (the e-participation index, the online service index, laws relating to information and communications technology) are strongly correlated with government effectiveness and regulatory quality. They conclude that ensuring value from digital transformation requires investment in tradi-tional governance quality.
Country case studies reveal the mechanisms through which digitalization im-proves government capacity. The introduction of e-filing of taxes in Tajikistan lowered the compliance costs of firms by reducing the amount of time needed to fulfill tax obligations. It also made tax payments more equitable, as electronic filing greatly reduced opportunities to reduce the tax burden through bribes. Firms that were less likely to evade taxes—and were thus charged comparatively more by corrupt tax officials—decreased their tax payments (Okunogbe and Pou-liquen 2018). In Albania, the government worked with the World Bank to intro-duce more agile electronic services, which significantly increased citizen satisfac-tion and reduced the time needed to process a request. The time needed to register a vehicle fell from 5.3 days in 2016 to 30 minutes in 2020, and the process to request a health card, which took 5 days in 2016, could be completed in just a few minutes. Croatia digitalized its justice system to improve its efficiency (box 2.2).
3. See Hausman (1998) for a discussion of the distinction between a classical approach, which starts out with a theoretical model on the functioning of a given process, and an empirical approach, in the context of economics.

Chapter 2: Data, Digitalization, and Governance ● 67
Efficient, fair, and accessible justice systems pro-mote peace and security, encourage investment and growth, and provide citizens with fundamental protection of their rights. Digital technology that incorporates integrated case management sys-tems, online conflict resolution, online access to court registries, litigation analysis, and the use of artificial intelligence applications can transform the justice sector. The benefits of introducing digital technologies can be especially significant for coun-tries with lengthy trials and low public confidence in justice systems.
Digital justice has the potential to bring the fol-lowing benefits:
• greater efficiency and effectiveness of case management, by expediting processing time and automating standardized tasks
• improved access to justice services, by using digital tools and holding remote hearings
• increased transparency, by facilitating access to information, securing legal documents, and reducing opportunities for corruption
• better quality of judicial decisions and con-sistent application of the law, by providing streamlined access to the legal text, case law, and court decisions
• a more resilient justice system with adequate governance and management structure that respects the independence and impartiality of the judiciary
• efficient cross-border judicial cooperation• greater predictability of judicial decision mak-
ing, which allows firms to better assess the risk/reward analysis of engaging in litigation
• greater public trust in the judicial system.
Reform of the judicial system to implement a digital justice approach involves transitioning from paper-based processes to digitized processes; recruiting new professionals, such as data analysts, computer scientists, and designers; promoting digital skills that allow judges, prosecutors, judi-cial staff, and other justice practitioners to use and apply digital technologies and tools effectively;
improving the collection and management of digi-tal information; and developing systems that allow various actors, such as police officers, prosecutors, courts, and prisons, to exchange information. The interoperability of these systems allows the col-lection and analysis of more accurate information in the context of policymaking and policy reform (Cordella and Contini 2020).
Many countries in the ECA region have started introducing digital solutions in justice administra-tion. In 2010, for example, the Ministry of Justice in Croatia launched an Integrated Case Management System (ICMS) to record and track the progress of all court cases.
The team of the Data and Evidence for Justice Reform (DE JURE) program within the World Bank’s Development Impact Evaluation group used this rich, case-level database to evaluate the impact the speed of justice has on the financial outcomes of firms, using the random allocation of cases to judges to produce estimates of the causal effects of fast or slow judges (DE JURE 2019). The analy-sis suggests that firm revenue is highly responsive to increases in judge speed (figure B.2.3.1). If firm resources remain tied up in prolonged court pro-ceedings, it can impede a firm’s operations. The gains from introducing the ICMS and increasing judicial efficiency could be substantial for courts with high and low numbers of backlogged cases.
Croatia’s example demonstrates how judicia-ries may leverage case management systems to assess the sources of backlog and delays in courts and identify where greater investments in justice may lead to higher returns on courts’ efficiency and economic growth. Nonetheless, this is just one example of the untapped potential of the data revolution. Data may also be used to identify (and address) gaps in access to justice for vulner-able populations; motivate and incentivize judges to increase their efficiency; diagnose and reduce biases in judicial decisions, ensuring equal treat-ment under the law; and assess the impact of any new laws on citizens and firms (Ramos-Maqueda and Chen 2020).
Digitalization of justice: the impact of judicial speed on firm outcomes in Croatia
BOX 2.2
(Continued next page)
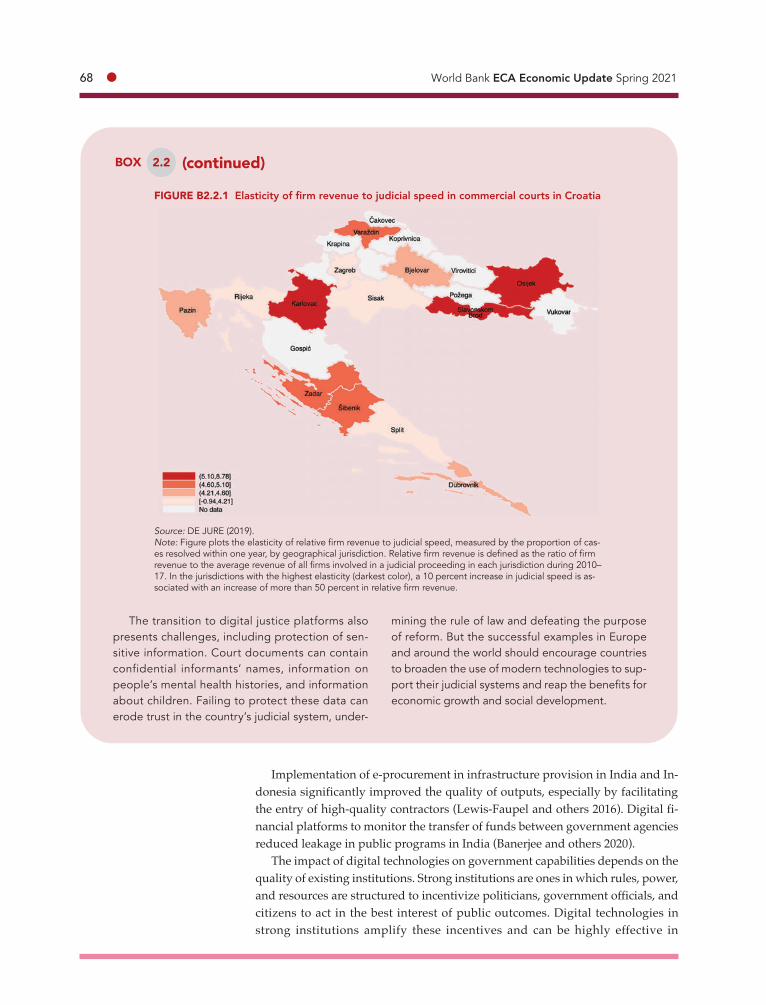
68 ● World Bank ECA Economic Update Spring 2021
Implementation of e-procurement in infrastructure provision in India and In-donesia significantly improved the quality of outputs, especially by facilitating the entry of high-quality contractors (Lewis-Faupel and others 2016). Digital fi-nancial platforms to monitor the transfer of funds between government agencies reduced leakage in public programs in India (Banerjee and others 2020).
The impact of digital technologies on government capabilities depends on the quality of existing institutions. Strong institutions are ones in which rules, power, and resources are structured to incentivize politicians, government officials, and citizens to act in the best interest of public outcomes. Digital technologies in strong institutions amplify these incentives and can be highly effective in
The transition to digital justice platforms also presents challenges, including protection of sen-sitive information. Court documents can contain confidential informants’ names, information on people’s mental health histories, and information about children. Failing to protect these data can erode trust in the country’s judicial system, under-
(continued)BOX 2.2
mining the rule of law and defeating the purpose of reform. But the successful examples in Europe and around the world should encourage countries to broaden the use of modern technologies to sup-port their judicial systems and reap the benefits for economic growth and social development.
Source: DE JURE (2019).Note: Figure plots the elasticity of relative firm revenue to judicial speed, measured by the proportion of cas-es resolved within one year, by geographical jurisdiction. Relative firm revenue is defined as the ratio of firm revenue to the average revenue of all firms involved in a judicial proceeding in each jurisdiction during 2010–17. In the jurisdictions with the highest elasticity (darkest color), a 10 percent increase in judicial speed is as-sociated with an increase of more than 50 percent in relative firm revenue.
FIGURE B2.2.1 Elasticity of firm revenue to judicial speed in commercial courts in Croatia

Chapter 2: Data, Digitalization, and Governance ● 69
improving public outcomes. In contrast, adoption of digital technologies in the context of clientelist institutions can cause politicians to reject digitally enabling reforms, because they are accountable to a small set of political elites. Patronage bureaucracies resist e-government, because it reduces the room for discretion and rent-seeking opportunities. Digital technologies in unaccountable institu-tions increase the risk of elite capture and wasting public resources on e-govern-ment projects that are limited (World Bank 2016).
Digitalization of Government in Europe and Central Asia
The degree of government digitalization can be characterized in various ways. One is to use an aggregate, qualitative classification, such as the GovTech Matu-rity Index (box 2.3). An alternative is to consider how many government systems have transitioned to an electronic format that allows all transactions to be con-ducted electronically.
The World Bank database on Digital Government/GovTech Systems and Ser-vices (DGSS) tracks digitalization at the country level for several core govern-ment systems. Five are selected for analysis:
• human resources management information system (HRMIS)• public investment management system (PIMS) • tax management information system (TMIS)• financial management information system (FMIS)• procurement system.
The DGSS assesses these systems at the central administration level.
The GovTech Maturity Index (GTMI) measures a country’s performance on a GovTech trajectory by determining the extent to which a whole-of-gov-ernment approach, focus on simple and efficient government, and citizen-centric modernization are incorporated into a government’s advancement of digital innovation. The index has four components: government core operations, public service deliv-ery, citizen engagement, and GovTech enablers. It can be used to benchmark countries and identify the GovTech solutions that are needed.
The GTMI is based on the World Bank’s Digi-tal Government/GovTech Systems and Services (DGSS) dataset. The DGSS comprises comprehen-sive information on 43 indicators collected from the governments of 198 economies about the
maturity of GovTech foundational blocks from two perspectives: (a) an international outlook based on data available on 198 economies and (b) a regional outlook based on a subset of data, with a focus on 168 World Bank client countries benefiting from financial and technical assistance. Six other indica-tors of the GTMI come from the 2020 UN e-Gov-ernment Survey, the 2018 Identification for Devel-opment (ID4D) dataset, and the 2019 Worldwide Governance Indicators (WGI).
The GTMI is the simple average of the normal-ized scores of four components measuring the maturity of GovTech foundational blocks based on these 49 indicators. It divides 198 economies into four groups based on their average GTMI score (table B2.3.1 and figure B2.3.1)
The GovTech Maturity IndexBOX 2.3
(Continued next page)

70 ● World Bank ECA Economic Update Spring 2021
(continued)BOX 2.3
FIGURE B2.3.1 GovTech maturity in Europe and Central Asia, by subregion, 2020
0
20
40
60
80
100
WesternEurope
SouthernEurope
Central Europe
and BalticCountries
NorthernEurope
WesternBalkans
SouthCaucasus
CentralAsia
Russian Federation
Turkey EasternEurope
A B C D
Perc
ent o
f cou
ntrie
s
Source: World Bank Group Digital Government/GovTech Systems and Services (DGSS) dataset.Note: See table B2.3.1 for group definitions.
TABLE B2.3.1 Grouping of countries in Europe and Central Asia on the GovTech Maturity Index (GTMI)
Group Description Countries in ECA
A GovTech leader countries that use advanced/innovative digital solutions and demonstrate good practices in all four GovTech focus areas.
Most of Northern, Western, and Southern Europe and some countries in Central Europe and the Baltic (19)
B Countries with a significant focus on GovTech Russian Federation, Turkey, South Caucasus, and most countries in Central and Eastern Europe (26)
C Countries with some focus on GovTech Belarus, Bosnia and Herzegovina, Kosovo, and Tajikistan (4)
D Countries with minimal focus on GovTech Turkmenistan (1)
One indicator of government digitalization is the number of central adminis-tration systems that have been digitalized. All countries in ECA except Tajikistan, Turkmenistan, and Ukraine have at least four systems in place (table 2.2 and figure 2.13). The system that is most often missing is digital PIMS.
The degree of functionality and integration of the digital systems in place is critical. A fragmented digital HRMIS, in which agencies have separate, stand-alone systems, is less functional than a centralized platform that is shared across all government units. An e-procurement system in which information on forms and contracts can only be viewed is less functional than one in which transac-tions can be carried out.

Chapter 2: Data, Digitalization, and Governance ● 71
TABL
E 2.
2 Le
vel o
f dig
italiz
atio
n of
gov
ernm
ent i
n Eu
rope
and
Cen
tral
Asi
a, b
y co
untr
y
Co
unt
ryH
RMIS
in p
lace
Pres
ence
of G
ovTe
ch
Syst
emsa
Gov
Tech
M
atur
ity
Inde
x,
2020
b
Perc
ent o
f po
pula
tion
with
acc
ess
to 4
G, 2
019
Num
ber o
f fixe
d br
oadb
and
subs
crip
tions
per
10
0 pe
ople
, 201
8
Is t
here
a
gove
rnm
ent
agen
cy in
ch
arge
of d
ata
gove
rnan
ce?
Is t
here
a G
ovTe
ch
inst
itutio
n re
spon
sibl
e fo
r sup
port
ing
inte
rope
rabi
lity
and
inte
rcon
nect
ivit
y of
go
vern
men
t sys
tem
s?U
nwei
ghte
d (0
–5)
Wei
ghte
d by
fu
nctio
nalit
y (0
–5)
Eur
op
e an
d C
entr
al A
sia
(co
untr
y av
erag
e)4.
33.
6
9025
Cen
tral
Asi
a3.
22.
4
7010
K
azak
hsta
nYe
s, c
entr
aliz
ed4
3.3
B75
13N
oN
oKy
rgyz
Rep
ublic
Yes,
cen
tral
ized
42.
8B
804
No
Yes
Tajik
ista
nN
o3
2.4
C80
0N
oN
oTu
rkm
enis
tan
No
10.
3D
No
No
Uzb
ekis
tan
Yes,
cen
tral
ized
43.
0B
4413
No
No
Cen
tral
Eur
op
e an
d B
altic
cou
ntri
es4.
63.
8
9928
Bul
gar
iaYe
s, c
entr
aliz
ed4
3.7
B10
027
No
No
Cro
atia
Yes,
cen
tral
ized
53.
3B
9927
Yes
No
Cze
ch R
epub
licYe
s, c
entr
aliz
ed4
3.3
B10
030
Yes
No
Est
oni
aYe
s, fr
agm
ente
d5
3.8
A99
33Ye
sYe
sH
ung
ary
Yes,
cen
tral
ized
43.
7B
9932
Yes
No
Latv
iaYe
s, fr
agm
ente
d5
3.5
B97
27N
oN
oLi
thua
nia
Yes,
cen
tral
ized
54.
0A
9928
No
Yes
Pola
ndYe
s, c
entr
aliz
ed5
4.3
B10
021
No
Yes
Rom
ania
Yes,
cen
tral
ized
43.
7B
9826
No
No
Slov
ak R
epub
licYe
s, c
entr
aliz
ed5
4.0
B97
28Ye
sYe
sSl
oven
iaYe
s, c
entr
aliz
ed5
4.0
B99
29Ye
sN
oEa
ster
n Eu
rop
e3.
73.
1
8621
Bel
arus
Yes,
frag
men
ted
43.
2C
8234
No
No
Mol
dov
aYe
s, c
entr
aliz
ed4
3.2
B98
15N
oYe
sU
krai
neYe
s, fr
agm
ente
d3
2.8
B77
13N
oN
oN
orth
ern
Euro
pe
4.2
3.6
99
39D
enm
ark
Yes,
cen
tral
ized
54.
7A
100
44Ye
sYe
sFi
nlan
dYe
s, c
entr
aliz
ed4
3.7
A10
031
Yes
No
Icel
and
Yes,
frag
men
ted
42.
7B
9941
Yes
No
Nor
way
Yes,
frag
men
ted
43.
5A
9941
Yes
Yes
Swed
enYe
s, c
entr
aliz
ed4
3.5
A99
40Ye
sYe
s
(con
tinue
d ne
xt p
age)

72 ● World Bank ECA Economic Update Spring 2021
Co
unt
ryH
RMIS
in p
lace
Pres
ence
of G
ovTe
ch
Syst
emsa
Gov
Tech
M
atur
ity
Inde
x,
2020
b
Perc
ent o
f po
pula
tion
with
acc
ess
to 4
G, 2
019
Num
ber o
f fixe
d br
oadb
and
subs
crip
tions
per
10
0 pe
ople
, 201
8
Is t
here
a
gove
rnm
ent
agen
cy in
ch
arge
of d
ata
gove
rnan
ce?
Is t
here
a G
ovTe
ch
inst
itutio
n re
spon
sibl
e fo
r sup
port
ing
inte
rope
rabi
lity
and
inte
rcon
nect
ivit
y of
go
vern
men
t sys
tem
s?U
nwei
ghte
d (0
–5)
Wei
ghte
d by
fu
nctio
nalit
y (0
–5)
Russ
ian
Fed
erat
ion
Yes,
cen
tral
ized
54.
3B
8622
Yes
Yes
Sout
h C
auca
sus
43.
5
9017
Arm
enia
Yes,
cen
tral
ized
43.
7B
9512
No
No
Aze
rbai
jan
Yes,
cen
tral
ized
43.
2B
9019
No
Yes
Geo
rgia
Yes,
cen
tral
ized
43.
7B
8522
No
No
Sout
hern
Eur
op
e4.
83.
8
9936
Cyp
rus
Yes,
cen
tral
ized
43.
3B
9936
Yes
No
Gre
ece
Yes,
frag
men
ted
53.
8A
9938
Yes
No
Ital
yYe
s, c
entr
aliz
ed5
4.3
A99
28Ye
sYe
sM
alta
Yes,
cen
tral
ized
43.
7A
9944
Yes
No
Port
ugal
Yes,
cen
tral
ized
54.
0A
9937
No
No
Spai
nYe
s, fr
agm
ente
d5
3.5
A10
033
Yes
No
Turk
eyYe
s, c
entr
aliz
ed5
4.7
B
16Ye
sYe
sW
este
rn B
alka
ns4.
33.
8
8119
Alb
ania
Yes,
cen
tral
ized
54.
7B
9613
Yes
Yes
Bos
nia
and
Her
zeg
ovin
aYe
s, c
entr
aliz
ed5
3.8
C23
22N
oN
oK
osov
oYe
s, c
entr
aliz
ed4
3.7
C
N
oN
oM
ont
eneg
roYe
s, c
entr
aliz
ed4
3.2
B90
25N
oN
oN
orth
Mac
edo
nia
Yes,
cen
tral
ized
44.
0B
100
Ye
sYe
sSe
rbia
Yes,
cen
tral
ized
43.
2B
9818
No
No
Wes
tern
Eur
op
e4.
73.
9
9939
Aus
tria
Yes,
frag
men
ted
53.
8A
9928
Yes
Yes
Bel
giu
mYe
s, c
entr
aliz
ed4
3.7
A10
039
Yes
No
Fran
ceYe
s, c
entr
aliz
ed5
4.3
A99
45Ye
sYe
sG
erm
any
Yes,
cen
tral
ized
54.
3A
9841
Yes
Yes
Irel
and
Yes,
cen
tral
ized
43.
3B
9830
Yes
No
Luxe
mb
our
gYe
s, c
entr
aliz
ed4
3.7
A98
37Ye
sYe
sN
ethe
rlan
ds
Yes,
cen
tral
ized
54.
0A
100
43Ye
sN
oSw
itze
rlan
dYe
s, fr
agm
ente
d4
3.5
A10
046
Yes
Yes
Uni
ted
Kin
gd
om
Yes,
frag
men
ted
54.
5A
9940
Yes
No
Sour
ce: A
ll va
riabl
es a
re fr
om th
e 20
20 W
orld
Ban
k G
roup
Dig
ital G
over
nmen
t/G
ovTe
ch S
yste
ms
and
Serv
ices
(DG
SS) D
atas
et e
xcep
t 4G
con
nect
ivity
, whi
ch is
sou
rced
from
the
GSM
A M
obile
Con
-ne
ctiv
ity In
dex
data
base
, and
bro
adba
nd p
enet
ratio
n, w
hich
com
es fr
om W
orld
Dev
elop
men
t Ind
icat
ors
(Wor
ld B
ank
2020
c).
Not
e: H
RMIS
= h
uman
reso
urce
s m
anag
emen
t inf
orm
atio
n sy
stem
.a.
Sys
tem
s in
clud
e fin
anci
al m
anag
emen
t inf
orm
atio
n sy
stem
, hum
an re
sour
ces
man
agem
ent i
nfor
mat
ion
syst
em, p
ublic
inve
stm
ent m
anag
emen
t sys
tem
, tax
man
agem
ent i
nfor
mat
ion
syst
em, a
nd
e-pr
ocur
emen
t. b.
See
tabl
e B
2.3.
1 in
box
2.3
for c
lass
ifica
tions
.
TABL
E 2.
2 (c
ontin
ued)

Chapter 2: Data, Digitalization, and Governance ● 73
Digital systems can be weighted by their functionality. According to this weighted indicator, Central Asia and Eastern Europe are the subregions with the lowest levels of government digitalization (figure 2.14)
FIGURE 2.13 Degree of functionality of five GovTech systems in Europe and Central Asia
0
20
40
60
80
100
Perc
ent o
f cou
ntrie
s
FMIS HRMIS PIMS TMIS eProc
Not implemented Partially functional Fully functional
Source: 2020 WBG Digital Government/GovTech Systems and Services (DGSS) Dataset.Note: Figure covers the 48 countries in ECA for which information was available. FMIS = financial management information system; HRMIS = human resources management information system; PIMS = public investment management system; TMIS = tax management information system; eProc = e-Procurement.
FIGURE 2.14 Implementation of GovTech systems in Europe and Central Asia, by subregion
0
1
2
3
4
5
Num
ber o
f Gov
Tech
sys
tem
s in
pla
ce
WesternEurope
SouthernEurope
Central Europe and Baltic States
NorthernEurope
WesternBalkans
SouthCaucasus
CentralAsia
RussianFederation
Turkey EasternEurope
Unweighted Weighted by functionality
Source: Calculations based on 2020 WBG Digital Government/GovTech Systems and Services (DGSS) Dataset.Note: Figure plots the subregional average of the number of GovTech systems implemented as a simple unweighted count (blue bar) and weighted by functionality (red bar).

74 ● World Bank ECA Economic Update Spring 2021
FIGURE 2.15 Correlation between implementation of GovTech systems and broadband access in Europe and Central Asia
AUTBEL
CHE
DEU FRAGBR
IRL
NLD
CYPESP
GRC
ITA
PRT
BGR
CZE
EST
HRV
HUN
LTU
LVA
POL
ROUSVK SVN
DNK
FIN
ISL
NORSWE
ALB
BIH
MNE
SRB
ARM
AZE
GEO
KAZ
KGZ
TJK
UZB
RUS
TUR
BLRMDA
UKR
0
1
2
3
4
5
Num
ber o
f Gov
Tech
sys
tem
s, w
eigh
ted
by fu
nctio
nalit
y
0 10 20 30 40 50
Fixed broadband subscriptions per 100 people
Source: 2020 WBG Digital Government/GovTech Systems and Services (DGSS) Dataset and World Development Indicators (World Bank 2020c).
In many countries in the region, government digitalization is ahead of digita-lization of the economy as a whole. Figure 2.15 plots the correlation between the number of GovTech systems implemented in a country, weighted by functional-ity, and the number of fixed broadband subscription per 100 people, a proxy for the degree of digitalization of the economy (using the degree of 4G mobile Inter-net coverage as a proxy results in a similar pattern). The results show that in many countries, governments are digitalized, but lag in terms of broadband ac-cess. Increasing connectivity is critical to making full use of digitalization in the public sector.
Beyond Digitalization: Building an Empirical Public Administration
Data help direct public expenditure to its most productive uses, track the activi-ties and motivations of the public sector workforce, and manage organizations to a 21st century standard. Recent advancements in data and digitalization can transform how public sector personnel acquire, interact with, and apply informa-tion to organizational decisions. Wider access to and engagement with information can, in turn, help optimize public sector management and improve productivity (Dal Bó, Finan, and Rossi 2018; Hjort and others 2019; Callen and others 2020).
Data analytics provide an opportunity to improve government services. In 2014, for example, the Polish Labour Office implemented automated, data-driven decision making to determine eligibility for unemployment assistance. The move reduced bias, inefficiency, and errors. Analysis of transactional data from the FMIS of Cambodia and Pakistan by Hashim and others (2019) found that a sig-nificant share of the budget was not subject to internal controls or was routed

Chapter 2: Data, Digitalization, and Governance ● 75
outside of the system. Data-driven approaches have been shown to improve the quality of services, such as police patrolling (Mastrobuoni 2020). City govern-ments have had success with an empirical approach to performance measure-ment known as the CitiStat model (Nam 2014). In 2017, the Bulgarian govern-ment introduced shared services to make the administration more efficient by centralizing and digitalizing general administrative functions (initially human resources and financial management). Estonia, North Macedonia, and Denmark have also used digitalization and data to improve government capacity (box 2.4).
To ground the public sector in empiricism and inform policy making with evi-dence, governments must strengthen their personnel’s capacity to undertake and manage empirical work. The data revolution should not be confined to the top of the public sector hierarchy; it should be integrated throughout the public service. This integration can be achieved in three ways.
First, recruitment can help push the public sector toward a data-driven skillset and culture. In the status quo, public managers are incentivized to recruit officials with policy beliefs that may perpetuate conventional and inefficient perspectives on data systems and digitalization (Besley and Ghatak 2005). Recruiting person-nel who value the data revolution and have the skills to incorporate it into public service practices is key to institutional change.
Second, capacity building of existing personnel is crucial. The World Develop-ment Report: Digital Dividends (World Bank 2016) outlines the need to develop analog complements to information technology to construct information systems that link decision making to data-driven information. Analog complements in-clude skillsets that allow public officials to harness opportunities of the digital world and accountable institutions that use the Internet to empower citizens.
Many governments are introducing data tech-nologies to improve public sector management. A leading example is Estonia’s X-Road system, a connected information infrastructure that houses administrative data (a population register, a busi-ness register, a medical prescription database). The digital data exchange facilitates administrative processes by capitalizing on data analytics across linked databases. The system is so efficient that it allows users to register a company in just three hours.
A project in Skopje in North Macedonia relies on the Internet of Things to automate the man-agement of traffic. The system collects data from detectors on the road, air quality sensors, and traf-fic monitoring cameras to automate traffic lights to
optimize traffic flow. The system has reduced travel time in the city by up to 20 percent.
The Danish government has devised a data-driven early warning system to alert authorities of socially vulnerable children. The system collects data from various sources, such as documented mental ill-ness, missed doctor’s appointments, and poverty indicators in specific regions, to devise a point sys-tem. If a threshold is reached, a child is flagged, and the appropriate intervention is initiated.
The Danish government has also experimented with predictive data analytics to assist seniors. Drawing on personal health, assistance history, and text messages with caregivers, the model can predict with 80 percent accuracy when a new level of assistance is needed.
Using data to improve public management in Estonia, North Macedonia, and Denmark
BOX 2.4

76 ● World Bank ECA Economic Update Spring 2021
The digital revolution can make routine and transaction-incentive tasks cheaper, faster, and more convenient. It is more limited in transforming tasks that require human judgment, intuition, and discretion for better decision making. Therefore, the building of robust information management systems requires ana-log complements that ensure that the quality, management, retrieval, and reuse of data is maximized for broad-based gains (World Bank 2016, 2021). For exam-ple, in the CitiStat or PerformanceStat data-driven model used by many local governments to improve performance, the “data” component (the information produced by the data collection system) is complemented by an “analog” com-ponent (meetings to discuss the performance dashboard) (Negoita 2018).
Third, as the vast majority of public sector work is team-based, the creation of teams is key for grounding the public sector in empiricism. This is particularly true in a context where changes in recruitment policies alone will not substan-tially alter the composition of the public sector workforce in the short term. The question facing public sector managers is how to complement existing expertise with new hires that move public administration toward using data (World Bank 2021). Recruitment policies should use the stock of personnel as a basis for opti-mal recruitment and implement approaches that enhance workplace diversity to maximize organizational performance (Lazear 1999; Hong and Page 2001).
The role of incentives in the data revolution is critical. Individual-level incen-tives to acquire, absorb, and act on data and analytical insights are necessary to create a data-oriented public service. An individual’s decision to engage with data and information determines and is determined by the nature of the hierar-chy he or she inhabits (Aghion and Tirole 1997). As the core organizational sys-tem of government is a hierarchy, its design will determine the extent to which officials capitalize on the data revolution (World Bank 2021).
The passage of reform will differ across and within countries, depending not only on personnel characteristics but also on the nature of the institutional envi-ronments, which are shaped by cultural and historical features, as Bialas (2013) shows in Poland, Gogeanu (2015) and Munteanu (2015) show in Romania, and Đorđević (2016) shows in Serbia. Many public services in ECA have a history of centralized state control and rigid hierarchy (Meyer-Sahling 2009; O’Connor, Knox, and Janenova forthcoming), which inform the incentives to adopt and use data systems.
Harnessing Human Resource Management Data
Governments can start implementing a more empirical approach to public sector management by using human resource management (HRM) data, as personnel management is a key determinant of state capacity and regional productivity.
The performance of and decisions of public sector workers affect the organi-zational productivity and fiscal sustainability of government (World Bank 2020a). Because of their vast number in ECA, even modest improvements in their pro-ductivity can have a large impact on public services and the broader economy (Heichlinger and others 2018).
Over the past 30 years, many ECA governments accelerated the adoption of data management systems as part of their New Public Management reforms

Chapter 2: Data, Digitalization, and Governance ● 77
(Heichlinger and others 2018).4 The number of ECA countries adopting HRMIS rose steadily between 2000 and 2018 (figure 2.16).
By and large, however, these systems collect only basic information on staff rather than information that might make the public service more effective (figure 2.17). Few ECA countries use data to inform strategic HRM policies (Thijs, Ham-merschmid, and Palaric 2018; OECD 2019). Instead, policies tend to be based on intuition and past practices (Melchor 2013).
There is significant scope to increase the type and quality of HRMIS data (OECD 2019); integrate such data with a range of complementary administrative and survey data on performance, competencies, skills, engagement, and motiva-tion; and apply these data to decision making. Acknowledgment of the impor-tance of evidence-based policy making is growing, but public administrations have collected little data on the bottlenecks to the take-up and application of data systems. Such information could provide evidence of the efficacy of data for good governance (OECD 2019).
Governments have been strategically using human resources data to improve the quality of the civil service (Van Ooijen, Ubaldi, and Welby 2019). For example, In Belgium, the Copernicus Reform introduced workforce planning combined with efforts to realign institutional objectives with the medium-term budget and the skillsets requirements. In Ireland, the government introduced the Public Ser-vice 2020, a framework for fostering innovation in Ireland’s public service. In It-aly, the government has used predictive analytics in the health sector to forecast the demand for doctors, nurses, dentists, midwives, and pharmacists. The analysis
4. New Public Management reforms refer to public administration reforms that are often based on experiences and concepts from the private sector (Hammerschmid and others 2013)
FIGURE 2.16 Adoption of human resource management information systems (HRMIS) in Europe and Central Asia, 2000–18
0
10
20
30
40
Num
ber o
f cou
ntrie
s in
ECA
2000 2005 2010 2015 2018
Source: World Bank Data Governance Dataset.Note: Figure includes only countries for which year of adoption was available.
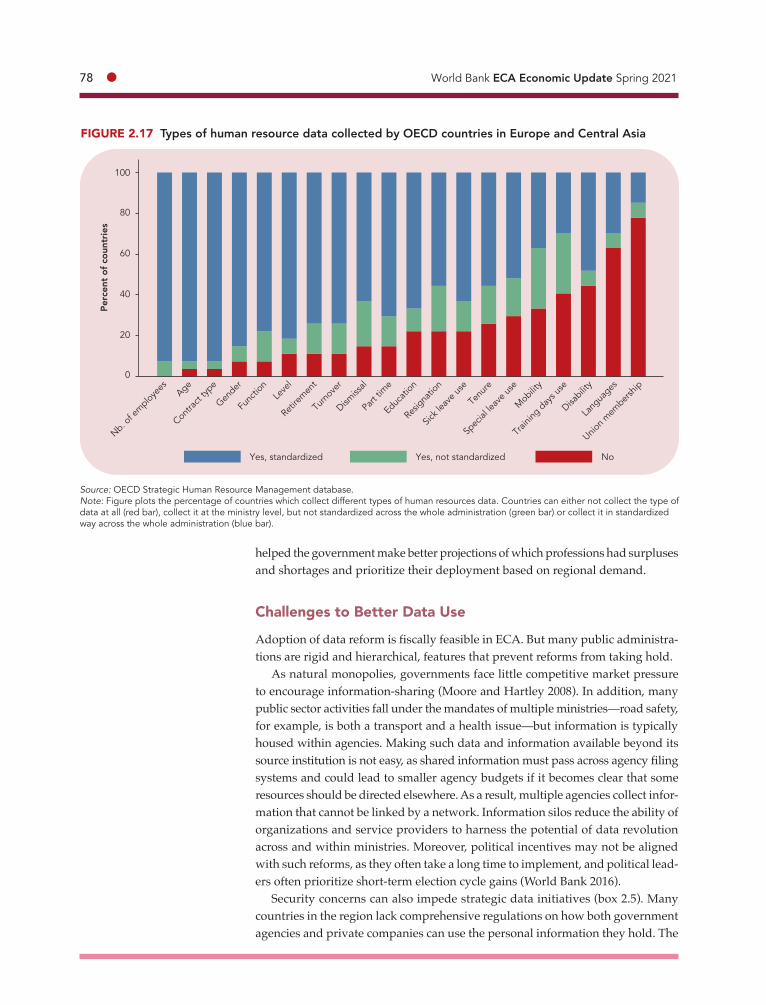
78 ● World Bank ECA Economic Update Spring 2021
helped the government make better projections of which professions had surpluses and shortages and prioritize their deployment based on regional demand.
Challenges to Better Data Use
Adoption of data reform is fiscally feasible in ECA. But many public administra-tions are rigid and hierarchical, features that prevent reforms from taking hold.
As natural monopolies, governments face little competitive market pressure to encourage information-sharing (Moore and Hartley 2008). In addition, many public sector activities fall under the mandates of multiple ministries—road safety, for example, is both a transport and a health issue—but information is typically housed within agencies. Making such data and information available beyond its source institution is not easy, as shared information must pass across agency filing systems and could lead to smaller agency budgets if it becomes clear that some resources should be directed elsewhere. As a result, multiple agencies collect infor-mation that cannot be linked by a network. Information silos reduce the ability of organizations and service providers to harness the potential of data revolution across and within ministries. Moreover, political incentives may not be aligned with such reforms, as they often take a long time to implement, and political lead-ers often prioritize short-term election cycle gains (World Bank 2016).
Security concerns can also impede strategic data initiatives (box 2.5). Many countries in the region lack comprehensive regulations on how both government agencies and private companies can use the personal information they hold. The
FIGURE 2.17 Types of human resource data collected by OECD countries in Europe and Central Asia
0
20
40
60
80
100
Perc
ent o
f cou
ntrie
s
Nb. of e
mployees
Age
Gender
Contrac
t typ
e
Func
tion
Leve
l
Retire
ment
Turn
over
Dismiss
al
Part
time
Educati
on
Resigna
tion
Tenu
re
Sick l
eave
use
Mobilit
y
Spec
ial le
ave u
se
Train
ing d
ays u
se
Disabilit
y
Lang
uages
Union m
ember
ship
Yes, standardized Yes, not standardized No
Source: OECD Strategic Human Resource Management database.Note: Figure plots the percentage of countries which collect different types of human resources data. Countries can either not collect the type of data at all (red bar), collect it at the ministry level, but not standardized across the whole administration (green bar) or collect it in standardized way across the whole administration (blue bar).

Chapter 2: Data, Digitalization, and Governance ● 79
The digital revolution has driven exponential growth in the high-value data accumulated by national, regional, and local governments, includ-ing vast quantities of personally identifiable infor-mation collected on government employees, taxpayers, students, pensioners, and any person or entity interacting with the government. While these data have a huge potential to transform how the government operates, it also represents a high risk of being sought after by cyber-criminals, mali-cious insiders, and nation-states that may seek access to these data for nefarious purposes.
To be more transparent and provide better citizen services, government agencies need to increase data sharing between the agencies and citizens and use new technologies for big data ana-lytics. As governments adopt new technologies, data security becomes more complicated. The broader use of mobile devices and IoT and reli-ance on cloud infrastructure increases the number of devices, connections, and networks susceptible to attacks. On the other hand, many government agencies in the ECA region still depend on legacy systems and applications that lack modern secu-rity functionality and thus are vulnerable to hacker attacks.
There are clear indications of a global worsen-ing cyber threat environment. The COVID-19 crisis has given rise to additional cyber risks resulting from greater reliance on remote working and the use of e-government services and mobile bank-ing. According to the International Monetary Fund (IMF), the number of cyberattacks has increased significantly, with public institutions and financial services the most targeted victims (IMF 2020b). Cybersecurity is increasingly seen as a threat to government operations that rely on digital ser-vices, such as cloud technologies and application programming interfaces (APIs). Smaller agencies and local government departments with smaller budgets and IT security teams appear to be the most at risk. On the other hand, large centralized stores of personal data attract hackers and state actors who try to obtain their secrets.
A challenge for governments all over the world is how to protect these data without imposing high costs on data users that would prevent wider use, sharing, and analysis of the data. Overly tight con-trols should not impede strategic data initiatives. Each type of government organization faces its own risks. The data protection strategies of every organization should depend on the type of data it handles and the type of services it delivers.
To create a safe environment for a wide range of without compromising the security of agency operations, governments can adopt the following principles and best practices:
1. Establish national frameworks to help agen-cies understand their cybersecurity risks, and apply best practices to improve the security and resilience of critical infrastruc-ture and services.
2. Improve data security by promoting informa-tion-sharing between government depart-ments and with the public and private sec-tors. Cybersecurity advisory councils can be created to bring together industry experts, academics, and public sector leaders to develop cybersecurity strategies.
3. Create a cybersecurity culture by training all government employees in cybersecurity.
4. Develop the ability to contain the damage caused by cyberattacks. Develop cyber-resilience strategies that allow networks to adapt, recover, and continue to operate if an attack occurs.
5. Improve policies to ensure that government vendors comply with procurement rules and demonstrate that their tools and services comply with security regulations.
6. Enhance the cross-border coordination of the investigation of and action against cyber-attacks in order to strengthen deterrence.
7. Develop and test national and cross-border response protocols to improve govern-ments’ ability to respond to cyber-incidents.
8. Build skills, resources, and operational capac-ity in all countries to achieve global impact.
How can governments protect the data they collect on individuals?
BOX 2.5

80 ● World Bank ECA Economic Update Spring 2021
General Data Protection Regulation (GDPR), put into effect on May 2018 by the European Commission, is designed to protect a wide range of personal data on EU residents (EU 2021). The new regulation protects not only uniquely identify-ing information, such as official identity documents, but also information re-quested by websites, including IP and email addresses; physical device informa-tion, such as a computer’s MAC address; home address and date of birth; and online financial information, including online transaction histories. Countries in ECA may need to establish a dedicated data protection agency with independent authority and enforcement capabilities. One of the main goals of such an agency should be to set and enforce clear standards for the government to access per-sonal data of its citizens.
Free-riding concerns also affect the acquisition and absorption of information in hierarchical environments. Officials acquire information in the public sector based not only on their own circumstances but also on the decisions of others (Aghion and Tirole 1997). If a team member undertakes the costly effort to learn and organize information for a project, other team members may have little in-centive to do so—a classic free-rider problem.
Bureaucratic conservatism may also constrain the broader use of data in the public sector. Mission-oriented employees in the public sector are often less likely to adopt new practices, because they have a predefined set of missions or beliefs, making organizational change more challenging (Williams and Yecalo-Tecle 2020). Management of these classical characteristics of the public institutions is a crucial determinant of whether public officials capitalize on the data revolution (Arizti and others 2020).
Data and Digitalization for Collaborative Governance Many citizens in ECA mistrust the government and view political decisions as nontrans-parent. The data revolution and digitalization offer an opportunity to foster collaboration between governments and civil society that will enhance public sector efficiency and service delivery and increase citizens’ trust in government. One of the most promising mechanisms for doing so is open government data (OGD), which reduces the transaction costs of gathering, analyzing, and disseminating public sector data and allows for a more comprehensive understanding of the quality of public governance as a whole.
Trust, Transparency, and Opportunities for Digital, Collaborative Governance
Trust in government is weak in many ECA countries. According to the 2019 Gal-lup World Poll, in 29 of the 50 countries in the region, less than half of citizens have confidence in their national government. Trust is greatest in Central Asia and the South Caucasus, where the share of citizens who have confidence in the government exceeds 60 percent (the only subregions in which the share exceeds 50 percent). Trust is lowest in Central Europe and the Western Balkans, where no more than 30 percent of citizens have confidence in their government (figure 2.18).

Chapter 2: Data, Digitalization, and Governance ● 81
Citizens in the region also view decisions in their country’s politics as non-transparent. The majority (53.5 percent) of respondents to the European Social Survey (2018) indicated that decision making in their country’s politics is not transparent; only 12.3 percent expressed the view that they are very transparent.5 Where data are available, perceptions of the transparency of political decisions are weakest in Central and Southern Europe and the Western Balkans.
The data revolution and digitalization can help build strong linkages between governments and citizens by reducing the information asymmetry between them, transforming governance models from hierarchical technocracies to open networked economies (De Blasio and Sorice 2016; Máchová and Lněnička 2016), thereby improving trust in and legitimacy of governments.
Feedback mechanisms have enabled civil society to directly engage with gov-ernments and suggest ways to improve the usability and quality of public data. They allow civil society to become a stakeholder in the governance of public data systems.
Digitally advanced countries in ECA are already making use of digital plat-forms and data analytics for collaborative governance. Iceland, for example, ex-perimented with allowing citizens the chance to write parts of its constitution6.
5. The countries included in the ninth round of the European Social Survey are Austria, Bel-gium, Bulgaria, Croatia, Cyprus, the Czech Republic, Germany, Estonia, Finland, France, Hun-gary, Ireland, Italy, Latvia, Lithuania, Montenegro, the Netherlands, Norway, Poland, Portugal, Serbia, the Slovak Republic, Slovenia, Spain, Sweden, Switzerland, and the United Kingdom.6. While the “crowdsourced” draft of the constitution eventually failed to be passed by the Icelandic Parliament, this process provided the opportunity to understand what an inclu-sive constitutional reform could look like (Landemore 2015).
FIGURE 2.18 Trust in government and views on transparency in Europe and Central Asia, by subregion
n.a. n.a. n.a. n.a. n.a.0
20
40
60
80
Perc
enta
ge o
f res
pond
ents
Have trust in government Think decisions are transparent
WesternEurope
SouthernEurope
Central Europe and Baltic States
NorthernEurope
WesternBalkans
SouthCaucasus
CentralAsia
RussianFederation
Turkey EasternEurope
Source: Data on confidence in government are from the Gallup World Poll 2019. Data on transparency are from the ninth round of the European Social Survey (2018). Data on transparency are not available for the South Caucasus, Central Asia, the Russian Federation, Turkey, or Eastern Europe. n.a. = not available.

82 ● World Bank ECA Economic Update Spring 2021
Estonia publishes the early stage of draft laws and their development on the government website and allows citizens and interested parties to provide feed-back and share their knowledge (World Bank 2016).
By integrating mechanisms of civic engagement with conventional account-ability mechanisms (such as political checks and balances, audit systems, and administrative rules), governments can help civil society actively participate in decision-making processes (Malena, Forster, and Singh 2004; De Blasio and Sorice 2016). Inputs from civil society can result in responsive governance if feedback on policy implementation is used for improvement (World Bank 2021).
Websites can serve as a channel of fluid communication with citizens. Most ECA governments have established national websites that allow citizen partici-pation in policy making. Many have also established websites for citizens to pro-vide feedback on public services or participate in decision making and websites that are part of broader grievance redressal mechanisms (figure 2.19). The use of these websites is limited, however. In ECA, only in Estonia, Iceland, and Switzer-land more than 20 percent of citizens use the Internet to participate in online consultations to define civic or political issues (figure 2.20). The share of indi-viduals using the Internet to post opinions on the same kind of issues is only slightly higher. Low take up of online channels of communication may reflect the fact that technological fixes to communication deficits don’t always work in the presence of structural weaknesses in political systems (Grossman, Humphreys and Sacramone Lutz 2020).
Fostering knowledge collaboration between citizens and governments may strengthen the research, monitoring, and evaluation framework of policy-making
FIGURE 2.19 Availability of government websites that allow citizen participation and grievance redressal mechanisms in Europe and Central Asia, by subregion, 2020
Perc
enta
ge o
f cou
ntrie
s in
sub
regi
on
WesternEurope
SouthernEurope
Central Europeand Baltic Countries
NorthernEurope
WesternBalkans
SouthCaucasus
CentralAsia
Turkey EasternEurope
Have national website that allows for citizen participation
Have national website that includes a grievance redressal mechanism
0
20
40
60
80
100
Source: 2020 World Bank Group Digital Government/GovTech Systems and Services (DGSS) Dataset.Note: Figure plots the percentage of countries in each subregion that has a national website for citizen participation (blue bar) and a national website that serves as part of a grievance redressal mechanism (red bar). DGSS contains no information on the presence of these types of national websites in the Russian Federation, although they exist for different federal ministries and for the Russian government.

Chapter 2: Data, Digitalization, and Governance ● 83
processes (Ruijer, Grimmelikhuijsen, and others 2020). Governments can crowd-source solutions to pressing challenges from civil society, freeing up resources that can be reallocated to other priorities (Church 2017). Such collaboration be-tween civil society and governments can advance democratic participation (Noveck 2009) and improve the quality of data and information, which can be used to improve service delivery design and implementation (Nagaraj, Shears, and de Vaan 2020). Moscow’s management of pothole complaints shows how digital civic engagement can both improve service delivery and bring political rewards (box 2.6).7 For digital engagement tools to be successful in improving service delivery, specific, actionable feedback information in the purview of gov-ernment officials should be provided by citizens, and officials need to be able to respond in a relatively short time frame (Grossman, Platas and Rodden 2018).
Open Government Data and Public Administration Governance
Open government initiatives vary widely across ECA (table 2.3). Open govern-ment data (OGD) increase government transparency and civil society collabora-tion in decision making. Most ECA countries have promoted initiatives that call for the release of government data so that they can be freely used, reused, and
7. The United Kingdom has a similar system, “Fix My Street” (www.fixmystreet.com).
FIGURE 2.20 Citizens use of Internet for civic and political issues in Europe and Central Asia, by subregion, 2019
n.a. n.a. n.a. n.a.0
5
10
15
20
25
30
Perc
ent o
f ind
ivid
uals
that
use
dIn
tern
et in
the
last
3 m
onth
s
WesternEurope
SouthernEurope
Central Europeand Baltic Countries
NorthernEurope
WesternBalkans
SouthCaucasus
CentralAsia
RussianFederation
Turkey EasternEurope
Take part in online consultations or voting to define civic or political issues
Post opinions on civic or political issues
Source: Eurostat ICT statistics 2019.Note: Figures are based on an average share of population 15 and over that used the Internet in the previous three months to take part in online consultations or voting to define civic or political issues (blue bar) or post opinions on civic or political issues on a website (red bar). No data are available for countries in Central Asia, Eastern Europe, South Caucasus, or the Russian Federation. n.a. = not available.

84 ● World Bank ECA Economic Update Spring 2021
distributed by anyone (Ubaldi 2013). The data made available should be open both technically (in a machine-readable standard format) and legally (open li-cense and accessible).
Several ECA countries have created public data portals. Examples include the United Kingdom (data.gov.uk, launched in September 2009); Norway (data.norge.no, launched in April 2010); and Ukraine (data.gov.ua, launched in 2018). These sites contain large public government datasets (on healthcare, weather, GPS, and the census, for example). The European data portal (europeandatapor-tal.eu, launched in November 2015) includes more than 1.1 million datasets, cov-ering the economy and finance, energy, health, population and society, justice and public safety, and the environment in 36 countries.
Information and communications technology (ICT) allows citizens to engage directly with government, thereby improving the quality of public services, as citizens create and use data and co-produce solu-tions (Goldsmith and Crawford 2014). But what are the incentives for governments to promote digital engagement? Gorgulu, Sharafutdinova, and Stein-buks (2020) show that digital participatory gover-nance can also be a political boon for incumbents.
In 2011, the city government of Moscow launched the online portal Nash Gorod (“Our City”). Two years later, it created a mobile phone application within that portal that allowed citizens to complain about potholes and attach photos. Citizens submit complaints to the responsible authority, which, according to the portal, resolves most problems within five days.
The pothole reporting application in Nash Gorod was not the first application of its kind. Rosyama, which allows individuals to report vari-ous road problems, was created in 2010, by the Foundation against Corruption (a non-govern-mental organization). Rosyama was developed by civil society to highlight the dire conditions of road infrastructure and promote local government accountability.
Gorgulu, Sharafutdinova, and Steinbuks (2020) look at the effect that pothole complaints had on the results of the mayoral elections in 2013 and
2018. In order to identify the effect that a higher volume of pothole complaints has on the incum-bent’s number of votes, the authors use within-city weather variation that contributed to potholes for geophysical reasons. They find that in areas that reported more pothole complaints, the incumbent mayor obtained more votes and won by a larger margin. They argue that this result was driven by voters rewarding the incumbent administration for its performance and responsiveness in solving pot-hole complaints. In neighborhoods with a higher prevalence of potholes for climatic reasons, the local government could show that it was responsive to citizens’ needs by solving the problem quickly and fixing the road within five days; the government could not make a similar showcase of responsive-ness in neighborhoods that had fewer potholes.
The experience of the pothole reporting appli-cation in Nash Gorod shows that local govern-ments can simultaneously improve the quality of public services and be politically rewarded for doing so by implementing digital participatory governance tools. It also shows that politicians who are responsive to their citizens’ needs can embrace digital governance without the fear of political backlash. Talented administrators with a vocation for public service should push for increased use of digital tools in the relationship between citizens and governments.
Managing potholes in Moscow through digital public engagement
BOX 2.6
Source: Adapted from Gorgulu, N., Sharafutdinova, G. and J. Steinbuks (2020) “Political Dividends of Digital Participatory Gover-nance: Evidence from Moscow Pothole Management” Policy Research Working Paper 9445, World Bank, Washington, DC.

Chapter 2: Data, Digitalization, and Governance ● 85TA
BLE
2.3
Sele
cted
mea
sure
s of
ope
n go
vern
men
t, t
rust
in g
over
nmen
t, a
nd t
rans
pare
ncy
in E
urop
e an
d Ce
ntra
l Asi
a, b
y co
untr
y
Subr
egio
n/co
untr
y
Ope
n go
vern
men
t sc
ore
Co
nfid
enc
e in
nat
iona
l g
ove
rnm
ent
(p
erc
ent
of
resp
ond
ent
s)
Dec
isio
ns
in c
ou
ntry
po
litic
s ar
e tr
ansp
are
nt (
pe
rce
nt o
f re
spo
nde
nts)
Pe
rce
nt o
f p
eop
le 1
5 an
d o
lde
r w
ho
use
d I
nte
rnet
in la
st t
hre
e m
ont
hs
toC
ou
ntry
has
nat
iona
l we
bsi
te t
hat
allo
ws
Yes
No
Don
’t kn
ow o
r re
fuse
Not
at a
ll or
ver
y lit
tleSo
me
A lo
t or
a gr
eat
deal
Take
par
t in
onlin
e co
nsul
tatio
ns o
r vo
ting
to d
efine
civ
ic
or p
oliti
cal i
ssue
s
Post
opi
nion
s on
civ
ic o
r po
litic
al is
sues
Citi
zen
part
icip
atio
n in
po
licy
deci
sion
m
akin
g
Citi
zen
feed
back
an
d gr
ieva
nce
redr
essa
l m
echa
nism
Eur
op
e an
d C
entr
al
Asi
a (c
oun
try
aver
age)
0.58
46.4
46.6
753
.533
.912
.616
12 —
—
Cen
tral
Asi
a0.
4471
.320
.78.
0 —
—
——
—
——
K
azak
hsta
n0.
4667
2112
——
—
—
—Ye
sYe
sKy
rgyz
Rep
ublic
0.54
5140
9 —
—
——
—
Yes
No
Tajik
ista
n —
—
——
—
—
——
—
No
No
Turk
men
ista
n0.
44 —
—
——
—
—
——
N
oN
oU
zbek
ista
n0.
3396
13
——
—
—
—Ye
sN
oC
entr
al E
uro
pe
and
Bal
tic c
oun
trie
s0.
6234
.555
.79.
959
.632
.67.
99
12 —
—
Bul
gar
ia0.
5627
6112
68.9
26.0
5.1
514
No
No
Cro
atia
0.61
2965
773
.822
.63.
613
14Ye
sYe
sC
zech
Rep
ublic
0.67
4240
1853
.136
.310
.67
13N
oN
oE
sto
nia
0.81
4044
1654
.337
.38.
429
12Ye
sYe
sH
ung
ary
0.46
4841
1057
.331
.011
.66
14N
oN
oLa
tvia
—
2468
857
.632
.310
.17
12N
oN
oLi
thua
nia
—
4147
1363
.033
.93.
213
15Ye
sYe
sPo
land
0.60
5040
1053
.836
.59.
77
15N
oN
oRo
man
ia0.
6116
768
——
—
410
No
No
Slov
ak R
epub
lic—
23
716
——
—
612
No
No
Slov
enia
0.65
4060
154
.337
.28.
56
5N
oYe
sEa
ster
n Eu
rop
e0.
4938
.047
.015
.0 —
—
— —
—
——
B
elar
us0.
3646
3321
——
—
——
N
oN
oM
old
ova
0.55
3163
7 —
—
— —
—
Yes
Yes
Ukr
aine
0.57
3745
17 —
—
— —
—N
oN
oN
orth
ern
Euro
pe
0.87
58.0
39.6
2.0
30.8
46.1
23.2
1715
——
D
enm
ark
0.88
6335
1 —
— —
1520
Yes
Yes
Finl
and
0.86
6433
332
.045
.722
.316
9Ye
sYe
sIc
elan
d—
52
444
——
—27
18N
oN
oN
orw
ay0.
8960
400
28.1
48.7
23.2
1213
Yes
Yes
Swed
en0.
8651
462
32.2
43.8
24.0
1315
Yes
Yes
Russ
ian
Fed
erat
ion
0.49
4448
8 —
—
——
—
——
So
uth
Cau
casu
s0.
5764
.025
.310
.7 —
—
——
—
——
A
rmen
ia —
6522
13 —
—
——
—
Yes
Yes
Aze
rbai
jan
—
866
8—
—
—
—
—N
oN
oG
eorg
ia0.
5741
4811
—
—
——
—
Yes
No
(con
tinue
d ne
xt p
age)

86 ● World Bank ECA Economic Update Spring 2021
Subr
egio
n/co
untr
y
Ope
n go
vern
men
t sc
ore
Co
nfid
enc
e in
nat
iona
l g
ove
rnm
ent
(p
erc
ent
of
resp
ond
ent
s)
Dec
isio
ns
in c
ou
ntry
po
litic
s ar
e tr
ansp
are
nt (
pe
rce
nt o
f re
spo
nde
nts)
Pe
rce
nt o
f p
eop
le 1
5 an
d o
lde
r w
ho
use
d I
nte
rnet
in la
st t
hre
e m
ont
hs
toC
ou
ntry
has
nat
iona
l we
bsi
te t
hat
allo
ws
Yes
No
Don
’t kn
ow o
r re
fuse
Not
at a
ll or
ver
y lit
tleSo
me
A lo
t or
a gr
eat
deal
Take
par
t in
onlin
e co
nsul
tatio
ns o
r vo
ting
to d
efine
civ
ic
or p
oliti
cal i
ssue
s
Post
opi
nion
s on
civ
ic o
r po
litic
al is
sues
Citi
zen
part
icip
atio
n in
po
licy
deci
sion
m
akin
g
Citi
zen
feed
back
an
d gr
ieva
nce
redr
essa
l m
echa
nism
Sout
hern
Eur
op
e0.
6541
.054
.54.
772
.324
.73.
111
15 —
—
Cyp
rus
—
3359
859
.337
.63.
15
15Ye
sYe
sG
reec
e0.
6140
5110
—
—
—
413
Yes
Yes
Ital
y0.
6322
762
78.3
20.3
1.4
915
Yes
Yes
Mal
ta—
70
272
—
— —
1815
Yes
Yes
Port
ugal
0.66
4453
472
.023
.05.
015
17Ye
sYe
sSp
ain
0.71
3761
279
.517
.72.
812
14Ye
sYe
sTu
rkey
0.42
5634
9
924
Yes
Yes
Wes
tern
Bal
kans
0.49
32.8
58.7
8.5
56.4
28.6
15.0
49
——
Alb
ania
0.47
3461
5 —
—
—
——
Yes
Yes
Bos
nia
and
Her
zeg
ovin
a0.
4717
767
——
—
5
8N
oN
o
Kos
ovo
0.56
3166
3—
—
—
7
13Ye
sN
oM
ont
eneg
ro —
4145
1451
.832
.116
.12
6Ye
sYe
sN
orth
Mac
edo
nia
0.48
2763
10 —
—
—5
9Ye
sN
oSe
rbia
0.47
4741
1261
.025
.113
.93
9Ye
sYe
sW
este
rn E
uro
pe
0.78
54.7
43.0
2.4
48.5
37.6
13.9
1311
——
Aus
tria
0.71
5147
242
.644
.113
.411
7Ye
sYe
sB
elg
ium
0.76
3361
752
.138
.89.
16
6Ye
sYe
sFr
ance
0.78
3860
271
.321
.76.
910
9Ye
sYe
sG
erm
any
0.79
5741
252
.336
.910
.818
13Ye
sYe
sIr
elan
d—
58
402
53.8
36.5
9.7
711
No
No
Luxe
mb
our
g—
78
193
——
—17
15Ye
sYe
sN
ethe
rlan
ds
0.82
6238
036
.345
.618
.09
9Ye
sYe
sSw
itze
rlan
d—
81
172
18.5
44.7
36.8
2111
Yes
No
Uni
ted
Kin
gd
om
0.79
3464
260
.932
.66.
416
19Ye
sYe
s
Sour
ces:
Ope
n go
vern
men
t dat
a ar
e fro
m th
e W
orld
Jus
tice
Proj
ect (
2020
); sc
ores
rang
e fro
m 0
to 1
. Dat
a on
con
fiden
ce in
nat
iona
l gov
ernm
ents
are
from
the
Gal
lup
Wor
ld P
oll 2
019.
Dat
a on
tr
ansp
aren
cy o
f dec
isio
n m
akin
g in
pol
itics
are
from
the
Euro
pean
Soc
ial S
urve
y 20
18. D
ata
on In
tern
et u
se a
re fr
om E
uros
tat I
CT
Stat
istic
s 20
19. D
ata
on n
atio
nal w
ebsi
tes
are
from
the
Wor
ld B
ank
Gro
up D
igita
l Gov
ernm
ent/
Gov
Tech
Sys
tem
s an
d Se
rvic
es (D
GSS
) Dat
aset
202
0. L
ates
t dat
a av
aila
ble
are
used
for e
ach
indi
cato
r; ye
ars
vary
by
coun
try.
N
ote:
— N
ot a
vaila
ble.
TABL
E 2.
3 (c
ontin
ued)

Chapter 2: Data, Digitalization, and Governance ● 87
The COVID-19 pandemic has highlighted the importance of OGD. Demirgüç-Kunt, Lokshin, and Torre (2020) show that greater trust in government improved both health and economic outcomes associated with reopening strategies after the first wave of the pandemic (see box 1.2). The pandemic also showed that governments’ success in curtailing the spread of the virus while reducing the economic consequences depended on their ability to collect data and make data-driven decisions. Throughout 2020, hotspot (targeted) lockdowns emerged in lieu of national lockdowns as governments’ strengthened their data collection efforts through better testing and tracing systems. Public Health England, for instance, conducts door-to-door testing in areas as small as just a few blocks of a city when a cluster of COVID-19 cases is detected. Epidemiological, economic, and open science data were instrumental in facilitating national responses and in coordinating global efforts for the development of vaccines and testing and the provision of personal protective equipment.
OGD imply that the public sector is ready to take on a new role as an informa-tion provider and relinquish its role of information gatekeeper (Davies 2010; Reale 2014). Because aggregate public data make information easier to process, combine, and analyze, they facilitate greater public scrutiny (Ubaldi 2013). Adop-tion of OGD thus implies that the government is willing to open accountability processes that allow for constructive criticism and opposing viewpoints (Jans-sen, Charalabidis, and Zuiderwijk 2012). Although the initial returns from the first bits of data are not substantial, improving systems—through database inte-gration, for example—can increase returns to open data (World Bank 2021).
Access to information can increase awareness of government activity and re-duce corruption if citizens use the information to engage in anti-corruption ef-forts (Cook 2010). For example, in the Slovak Republic, anti-corruption activists spurred the government to reform its public contracting practices. In response, between 2011 and 2014, the government put 780,000 public contracts and receipts online and implemented anti-corruption reforms. The public procurement data portals received 54,000 visits a month. Ongoing transparency efforts improved public perceptions of government (Carolan 2016).
The expansion of civic space through OGD can foster trust between civil soci-ety and governments, as citizens use data to express their concerns and hold governments accountable on issues that affect them. A thriving and pluralistic civic space allows citizens to use and discuss the data and insights from them in a nonrestrictive environment to voice their concerns and express discontent. Poli-cies aimed at expanding civic space signal to citizens that the government is com-mitted to fostering dialogue and increasing trust and transparency. In the long run, OGD can fulfill citizen’s rights to the public access to government informa-tion, which is critical in democratic settings (Zuiderwijk and Janssen 2014).
Beyond accountability, both citizens and governments can derive benefits from OGD to facilitate decision-making processes. Citizens can make data-driven decisions to improve the quality of their lives. Data on crime rates, student–teacher ratios, and the quality of healthcare, for example, can help people decide where to live. For governments, OGD can enhance the efficiency of the public sector by building an information network that can facilitate interagency coordi-nation by allowing information exchange and data reuse (Jetzek, Avital, and

88 ● World Bank ECA Economic Update Spring 2021
Bjorn-Anderson 2014). Civil society can be a partner in improving the quality of service delivery through OGD. NGOs in Ukraine, for example, relied on publicly available procurement data to construct monitoring platforms that hold both procurers and tenderees accountable. This inexpensive mechanism reduced prices and collusion in the public procurement process (Baranek, Musolff, and Titl 2020).
The State of Open Government Data in Europe and Central Asia
Signatories of the Open Government Declaration, issued in September 2011, com-mit to uphold the principles of open and transparent governments and to “foster a global culture of open government that empowers and delivers for citizens, and advances the ideals of open and participatory 21st century government” (Open Government Partnership 2020). As of 2020, the declaration had 78 participating countries, 35 of them in ECA. Commitments to make government data available to the public range from financial assistance and communication of best practices to formal legislation and regulation (Dawes, Vidiasova, and Parkhimovich 2016).8
The Global Open Government Index reveals regional variations in open gov-ernment scores (figures 2.21).9 Constructed by the World Justice Project as a com-ponent of the Rule of Law Index, it measures government openness based on the general public’s perceptions on a scale of 0–1. Estonia, Denmark, Norway, and Sweden all have scores above 0.8; Kazakhstan, Uzbekistan, Belarus, and Albania all have scores below 0.5 (figure 2.22).
Signatories to the Open Government Declaration are integrating open data policies in legislation aimed at modernizing public entities and adopting policy frameworks. The mechanisms through which countries implement OGD vary widely. Some countries have a specific open data policy; others have embedded it into their national digital strategy or data strategy. For example, Denmark’s OGD policy is part of its digital strategy. It aims to make public sector data acces-sible in order to strengthen its artificial intelligence capabilities. The government is identifying five datasets that can help realize this vision. In Italy, OGD is part of the country’s digital growth strategy for 2014–15. In Slovenia, the policy is part of the 2015–20 strategy for public administration. Of the European Union 28 (EU28) countries that are signatories to the Open Government Declaration, 25 use open data as a basis for evidence in policy making, and 24 report that OGD serves as a knowledge basis for their daily operations. Three-quarters of EU28 govern-ments have opted for hybrid governance models that include both central
8. The Open Government Partnership classifies commitments based on five dimensions; (a) anti-corruption (beneficial ownership and open contracting); (b) civic space (assembly, as-sociation, and defense of journalists and activists); (c) open policy making (rules and regu-lations and participation in lawmaking); (d) access to information (open data on water/sanitation, health, and education and right to information); and (e) fiscal openness (trans-parency, participation, and oversight). 9. The index is based on scores on four dimensions: publicized laws and government data, right to information, civic participation, and complaint mechanisms. It draws on the World Justice Project’s General Population Poll and the Qualified Respondents’ Questionnaire. The data are normalized on a scale of 0–1. Variable-level data are aggregated to the dimension level for each country, which is then used to come up with an overall score and ranking.

Chapter 2: Data, Digitalization, and Governance ● 89
<0.4 0.4−0.5 0.5−0.6 0.6−0.7 >0.7 No data
IBRD 45687 |MARCH 2021
FIGURE 2.21 World Justice Project Open Government Index scores, by country, 2020
Open Government Index
Source: World Justice Project 2020.Note: Index ranges from zero to one.
FIGURE 2.22 World Justice Project Open Government Index scores in Europe and Central Asia, by subregion
Ope
n G
over
nmen
t sco
re
1.0
0.8
0.6
0.4
0.2
0WesternEurope
SouthernEurope
Central Europe and Baltic States
NorthernEurope
WesternBalkans
SouthCaucasus
CentralAsia
RussianFederation
Turkey EasternEurope
Source: World Justice Project 2020.Note: This figure plots the subregional country average of the Open Government Index score; scores range from 0 (least open) to 1 (most open).
government and civil society; seven countries (Bulgaria, Cyprus, the Czech Re-public, Hungary, Ireland, Luxembourg, and Slovenia) have exclusively top-down models for data use (European Data Portal 2019).
Some governments appear to be implementing their commitments only su-perficially—making data publicly available without broader transparency com-mitments (Carolan 2016) or releasing data in harmless domains (Ruijer, Détienne, and others 2020). Released information is often limited to geospatial,

90 ● World Bank ECA Economic Update Spring 2021
transportation, and demographic data and statistics, for example. An analysis of 30 governments that have made the most advances in OGD commitments and actions finds that fewer than one in five government datasets is available for public use (World Wide Web Foundation 2018). The Czech Republic has about 10,000 public sector data providers, but only 30 publish their data on national portals, as most of them are small and lack the capacity to publish the data (Eu-ropean Data Portal 2019). This limited availability may reflect the fact that OGD requires technical expertise, resources, and the interest and willingness of public sector bodies.
Frictions in the Supply of and Demand for Open Government Data
Even when OGD is available, its use is often limited, for various reasons (Attard and others 2015; Ruijer and Martinius 2017). Several frictions in the supply and demand of open government data may be responsible for this. On the supply side, the raw data may of limited use to end-users; only data that are processed and customized generate value (Janssen, Charalabidis, and Zuiderwijk 2012; Weerakkody and others 2017). For OGD to have an impact, data must be of high quality, secure, processed, and used as the basis of public discussion (Halonen 2012; Huijboom and van den Broek 2011; Carolan 2016; Khemani and others 2016).
The supply-side incentive structures to release OGD assume that there is a political acceptance of OGD—something that may not always be the case. The government may be hesitant to publish data because the public may perceive the quality of the data as low. If the public learns that governments rely on low-quality data for monitoring and evaluation and decision making, OGD efforts may erode public trust in governments (Weerakkody and others 2017).
Governments may also fear the loss of control associated with releasing data to the public and engage in “information politics” to safeguard the information power vested internally (Barry and Bannister 2014; Davenport, Eccles, and Pru-sak 1992). Government data are a source of power; the incentive to relinquish this power by making it accessible to the public and/or allowing for multi-stake-holder decentralized governance may be limited. Carolan (2016) notes that the Catch-22 of open data and transparency is that high-value data are often con-trolled by the same institution that they are meant to hold accountable.
Because the cost of developing statistical capacity is high, governments may forgo investing in building data capacity and data-driven administrations, espe-cially in developing countries (Islam and Lederman 2020). Other barriers to OGD include the lack of real-time provision of data and reusable formats, high cost, and low quality or relevance (World Bank 2021).
The main obstacles hindering OGD impact may stem not from the lack of sup-ply but from lack of demand (Verhulst and Young 2016). Once data are published, it is often the role of intermediaries—“information brokers”—to strengthen the data-processing value chain to yield information that can be understood by the public. Obstacles in this process include weak demand for data and the inade-quate capacity of the public to analyze them (World Bank 2021). Individuals or organizations may not know how to find, process, and use data. These barriers

Chapter 2: Data, Digitalization, and Governance ● 91
The expansion of the Internet and the emergence of social media affect the relationship between citizens and their governments. Research on tra-ditional sources of information—mass media like newspapers, radio, or TV—shows that the more numerous and pluralistic these sources are, the more responsive governments are to their citizens’ needs (Prat and Strömberg 2013). Initially, by pro-viding entertainment and nonpolitical information, the Internet reduced citizens’ interest in politics (Zhuravskaya, Petrova, and Enikolopov 2020). The expansion of 3G mobile broadband Internet had, however, a more substantial impact on governance. Guriev, Melnikov, and Zhuravskaya (forthcoming) look at the effect of the spread of 3G mobile net-works on incumbent government approval in 116 countries for the years 2008–2017 and find that expansion of 3G increased perceptions of govern-ment corruption and reduced approval of the gov-ernment in countries where the Internet is not cen-sored. The increase in perceptions of government corruption is associated with actual corruption incidents, providing evidence that mobile Internet allows citizens to access information about their governments and make them accountable.
The qualitatively different effect associated with the expansion of mobile internet vis-à-vis Internet, in general, coincides with the emergence of social media. Social media is both a source of informa-tion and a tool for coordinating citizens. In Russia, for example, it induced protest activity, primarily by reducing the cost of coordination (Enikolopov, Makarin and Petrova 2020). Qin, Strömberg, and Wu (2019) show that in China, collective actions spread geographically based on the degree of social media connection between locations.
Little is understood about the effects of social media on government accountability through means other than elections and protests (Zhuravs-kaya, Petrova, and Enikolopov 2020). An excep-tion is the study of Enikolopov, Petrova, and Sonin (2018) find that blog posts about corruption in large state-controlled firms in Russia were associated
with higher management turnover and improve-ments in corporate governance in the long run. There is a concern, however, that the increased vis-ibility of social media activity may threaten bureau-cratic neutrality if public servants carry out online political activity (Cooper 2018).
Social media can increase the circulation of misinformation or false news. While it is not clear whether the prevalence of false news is higher today than in the past, there is overwhelming evidence that false news circulates widely online (Zhuravskaya, Petrova, and Enikolopov 2020). False stories spread considerably more rapidly than true ones, probably because of their novelty and emo-tional charge—and most false stories are spread by humans, not “bots” (Vosoughi, Roy, and Aral 2018). During the 2016 US presidential campaign, Face-book users older than 65 shared seven times as many false news stories as younger users, accord-ing to Guess, Nagler, and Tucker (2019), but false news represented a small share of overall activity. Grinberg and others (2019) show that the circula-tion of false news was highly concentrated among a minority of users.
False news and misinformation are particularly problematic for governance if they induce citizens to change their beliefs. Barrera and others (2020) show that during the 2017 French presidential campaign, false news was highly persuasive in increasing the voting intention of the candidate spreading misinformation. However, they caution that this result may be driven by the fact that false news gives salience to a particular policy issue (immigration in the French case), irrespective of the truth or falsehood of the news. Their study did not involve individuals receiving false news through social media; it exposed them to false information in an experimental setting. Zhuravskaya, Petrova, and Enikolopov (2020) note that it is still unclear whether false news has a persuasion effect when spread through social media.
The COVID-19 pandemic highlights the risks that misinformation spread through social media
Information, misinformation, and governance in the era of social media
BOX 2.7
(Continued next page)

92 ● World Bank ECA Economic Update Spring 2021
may have on public health. Ajzenman, Cavalcanti, and Da Mata (2020) find that adherence to social distancing measures decreased when Brazil’s pres-ident publicly dismissed the risks associated with the COVID-19 pandemic and that this decrease was particularly strong in areas with higher levels of social media activity.
How can governments and civil society pre-vent the spread of false news? Some governments have resorted to digital censorship, blocking social media. Hobbs and Roberts (2018) show that doing so can backfire. When China blocked Instagram, millions of Chinese users switched to private net-works to circumvent the block, accessing censored sites such as Facebook and Wikipedia. Some of these users, who had previously been apolitical, started consuming political news.
In a traditional media setting, competition among news outlets can reduce bias and improve the quality of information (Gentzkow and Shapiro 2006). Inducing competition among social media platforms could help stem the spread of false news. However, social media platforms tend to be monopolistic, because of network effects, making it difficult to increase competition.
An alternative strategy for reducing the spread of false news is fact-checking, which is usually car-ried out by civil society organizations. Fact-check-ing in itself may not be effective in reducing the persuasion effect of false news. Barrera and oth-
(continued)BOX 2.7
ers (2020) show that when individuals exposed to a false statement by a political candidate were sub-sequently shown information indicating the false-hood of the statement, they updated their factual knowledge on the topic but did not change their support for the candidate.
Fact-checking may reduce the spread of false news, however. Henry, Zhuravskaya, and Guriev (2021) conducted an experiment in which indi-viduals were exposed to false news and offered the possibility to share it on Facebook. Providing fact-checking reduced the sharing of false news on social media by almost half. Imposing a small extra cost—asking users to click through an extra screen before sharing the false statements—induced a further decrease in the rate of false news sharing. This evidence suggests that fact-checking has the potential to reduce the spread of false news and that creating a very small friction in the act of shar-ing false news substantially decreases its circulation.
Twitter adopted such a strategy during the 2020 US presidential campaign, requiring users to make an extra click to access tweets that included false or heavily disputed statements. Labeling false con-tent and fact-checking may help reduce the spread of false news on social media without resorting to censorship and the blockage of the free circulation of information, which is fundamental for improved accountability and a better quality of governance in societies.
may be particularly significant for disadvantaged communities, where digital skills and access to digital tools may be more limited.
Another issue is that individuals and organizations may focus on single issues rather than on broader, more encompassing ones. Networks and communities may form around, for instance, environmental protection, education, or health-care service delivery, making OGD issues more fragmented and less likely to move into national priorities or political agendas. The fact that users of data do not always share interests and goals makes advocacy work difficult.
The concept of public interest in OGD has been dubbed a myth, which may also help explain the weak demand for OGD (Hellberg and Hedström 2015; Car-olan 2016). Little is known about the public’s willingness and ability to use data

Chapter 2: Data, Digitalization, and Governance ● 93
or the factors that can encourage its widespread use (Weerakkody and others 2017). Because OGD is a public good, the incentives for civil society to contribute to its value chain may be low, as they can enjoy the benefits without having to invest resources.
Even if governments incentivize OGD use, it is unclear that citizens will use OGD to monitor the government’s efficiency if formal accountability mecha-nisms are weak. In the context of endemic corruption, this issue can result in a “second-order collective action dilemma,” in which private actors are more will-ing to comply with the formal rules (rational strategy) than revert to establish informal accountability mechanisms. Formal accountability mechanisms (su-preme audit institutions, regulatory agencies, the judiciary) are a necessary com-plement to informal accountability. If OGD reveal failures or problems in service delivery that the government does not respond to, the increase in transparency could end up diminishing trust in government institutions.
High digital connectivity in ECA facilitates the dissemination of OGD, and the use of social media can overcome the collective action problem of civil society failing to mobilize to hold governments to account. By reducing the cost of infor-mation and rousing public sentiment about problems and service delivery, social media can help keep governments accountable. However, social media is also a source of misinformation, prompting governments to block or heavily censor it. Alternative strategies, such as better fact-checking, may help preserve the func-tioning of social media without limiting the content that helps improve govern-ment accountability (box 2.7).
Beyond frictions in the supply and demand of OGD that may hinder its use, limited impact evaluations of OGD policies make it difficult to evaluate the out-puts and outcomes of OGD efforts (Uhlir 2009). As OGD initiatives are new, it remains too early to evaluate their long-term impact.
Policy Recommendations and Conclusions Promoting the intersectoral coordination of decentralized data systems across institu-tions can expand the impact of the data revolution. Fostering platforms that allow citizens to hold government accountable for their broad approach to using data can help mitigate barriers to the use of open government data by civil society. Encouraging direct feedback between civil society and governments can break down the firewall between them.
Generating Diagnostics
Diagnosing the State of the Public Administration
The quality of public administrations and the level of data use and technological sophistication vary widely across ECA. Assessing the state’s capacity can allow public administrations to target reform efforts to specific contexts.
In generating diagnostics, it is important to track the quality of empiricism across work units and to analyze what characteristics are linked to the stronger

94 ● World Bank ECA Economic Update Spring 2021
application of empirical methods. Government-wide measurements can high-light areas of strength and weakness of each organization, unit, or team.
Survey and administrative HRMIS data can provide input for public admin-istration diagnostics (Rogger 2017). Schuster and others (2020) show the value of timely surveys for coronavirus response. In subsequent research, they evaluated the personnel digital readiness for remote work across a range of public admin-istrations; this exercise laid the ground for adopting a data-driven policy on re-mote work and digital skill-building.
Surveys can track the level of data and digital skills and the culture of public officials. The results can measure the impact of reforms. Surveys also provide insights into best practices in recruitment, promotion, and capacity building. An example is the Federal Viewpoint Survey (FEVS), which the US federal govern-ment conducts to improve the management of federal employees. It has been used in dozens of pieces of research to examine topics central to public adminis-tration (Resh and others 2019).
Extending the type of information collected in HRMIS beyond the basic char-acteristics of the staff is essential to provide a clear picture of staff skills. A survey in the United Kingdom found that 40 percent of public sector organizations lack the skills needed for digital transformation (GovTechLeaders 2018). Performance-based testing may be a better measure of digital skills than self-reported assessments.
Maderick and others (2015) and Kaarakaine, Kivinen, and Vainio (2017) at-tempted to create a performance-based measure of ICT skills for teachers. Assess-ment of ICT skills can use testing that mimics real-world applications to ensure that staff are able to use a specific dashboard, program, or process.
Diagnosing the Environment in Which the Public Administration Operates
To make meaningful change, governments must first understand the broader environment in which the public administration functions. This exercise can pro-vide insights on regulatory, personnel, cultural, and labor market characteristics that affect the data revolution in the public sector.
The first task in this diagnostic is to take stock of the legal and regulatory framework. Such frameworks play an important role in ensuring data security, facilitating advances in accountability and trust in the data revolution, and en-abling the secure and smooth sharing and use of data across institutions and sectors. The legal and regulatory infrastructure must be comprehensive and flex-ible enough to generate an enabling, empirical environment within the public administration. Estonia, a global leader in digital transformation, succeeded in modernizing its government partly because of its low legal and public barriers to digital transformation (Kattel and Mergel 2019).
Regulations should aim at breaking down barriers to make way for innova-tion and implementing unified data classification standards and interoperable IT and data systems (World Bank 2021). Examples of regulatory changes that have fostered data sharing in Europe include the regulation on the Free Flow of

Chapter 2: Data, Digitalization, and Governance ● 95
Non-Personal Data (FFD), the Cybersecurity Act (CSA), and the Open Data Di-rective (EC 2020). Further, the New European Interoperability Framework pro-vides guidance on how to setup interoperable digital services (EU 2017).
Comparative survey data of the private and the public sectors can help iden-tify agencies that lag behind private sector counterparts and assess the impacts of these gaps. Labor market surveys or surveys of potential public sector recruits can complement this diagnostic. They could be used, for example, to evaluate the supply of empirical skills (see Thomson, Veall and Sweetman 2018). Surveys can also help policy makers understand how these factors affect the decision of em-pirically minded individuals to apply for or accept public sector positions and the role monetary incentives play in the decision (Dal Bó, Finan and Rossi 2013; Mastracci 2009)
Staffing, Capacity Building, and Team Building for Empiricism and Innovation
Public administrations in ECA should recruit staff with technological skills. Do-ing so requires a rethinking of the recruitment process. The United Kingdom’s Digital, Data and Technology Fast Stream and Fast Track Apprenticeship pro-vides opportunities to attract and retain digital skills. To retain and attract skilled personnel, the federal government of Australia offers ICT experts more struc-tured careers. Contracts should balance the attractiveness of recruitment with the flexibility required to rotate across staff with different specializations.
Using integrated personnel data to assess the likely future career paths of per-sonnel can help public institutions make strategic staffing decisions (Melchor 2013). In combination with work that aims to project future employment needs, personnel management itself can become more empirical.
Coordinated efforts across civil services can strengthen capacity-building ef-forts. The United Kingdom’s Stabilization Unit highlights the importance of cross-cutting units in creating a system of capacity building for modernization within the public service (Connolly and Pyper 2020). Capacity-building efforts must build teams of empiricists and shift individual attitudes toward empirics. Evidence from the literature on civil service management suggests that individ-ual-focused training may be more effective in shifting beliefs and practices than team-focused training because the latter may reinforce existing cultures and lead to free-riding problems (Azulai and others 2020).
Teams should be structured to maximize synergies and complementarities of knowledge and skills. Peer-to-peer learning and knowledge spillovers have proven effective in various environments (Burlig and Stevens 2019; Bandiera and Rasul 2006; Banerjee and others 2013; Hinz and others 2011). The sharing of in-novations across departments should be supported and best practice examples celebrated and documented. Providing training and workshops across work units helps build communities of practice outside of traditional hierarchies. The power of empiricism can be showcased through the regular sharing of case stud-ies by management at all levels.

96 ● World Bank ECA Economic Update Spring 2021
Incentives throughout the civil service also need to be changed. In public ad-ministration settings, the decision of an individual to acquire and absorb infor-mation to make empirical decisions is based on the nature of formal and informal institutions in which he or she is embedded. Evidence from Ethiopia indicates that when officials have more de facto control over their tasks, they have more accurate information about it (Rogger and Somani 2018), suggesting that auton-omy and authority mediate personnel incentives to take up and apply data.
Where feasible, administrations should make promotions and performance discussions partly based on attempts—not necessarily successes—for reform. It is essential to engage with unions and other public sector stakeholders to ensure their support for incentives for empiricism and evidence-based reform. Ensuring political cover by supporting specific areas in which innovations are tested and adapting the legal environment are important. For example, Portugal’s Right to Challenge Act allows officials to apply for temporary concessions to pilot new procedures that are not within the public service rules.
Governments should articulate a policy of empiricism across political and ex-ecutive branches, within each organization and team unit, and by each manager, making empiricism a backbone of public service management, linked to both the individual and the organization. Momentum must work in both top-down and bottom-up directions. To ensure alignment between messaging, perceptions, and beliefs, it is helpful to monitor the extent to which staff believe that agendas for empiricism reflect the core priorities of the administration at each level.
Building an Agenda and Platform for Innovation and Reform
To expand the impact of the data revolution, central governments must build mechanisms for intersectoral coordination of decentralized data systems across institutions. Where digitalization lags, they must deepen it, as any agenda for improved data use requires effective digital infrastructure.
Some aspects of public service reform toward evidence-based policy making can be implemented asymmetrically across a service; others require a whole-of-government approach. High-level coordination of digital and data-driven activi-ties across government facilitates implementation (EC 2019). Governments should therefore develop a national strategy to bring together stakeholders across ministries and agencies to define the government’s vision, shared needs, potential gaps, and strategic goals (UN 2012).
The United States developed the Federal Data Strategy, supported by 57 mem-bers from across the federal government representing 23 agencies (US Federal Government 2021). In Germany, the federal government’s data strategy is de-signed to significantly increase the provision and responsible use of data, pro-mote data-driven innovations, and prevent the misuse of data (Government of Germany 2021). Articulating a set of government-wide standards provides re-formers with the necessary support as they push reforms in their agency.
It is also useful to set up dedicated agencies for data governance and data management, provide them with the authority to undertake the assigned tasks, and regularly assess their role in encouraging empiricism and innovation. Strong

Chapter 2: Data, Digitalization, and Governance ● 97
leadership and coordination are required at these agencies, through functions such as a coordination authority and a chief information officer or equivalent. Only 29 of the 50 ECA countries—and no country in Central Asia, Eastern Eu-rope, or the South Caucasus—have this kind of agency. Establishing them is criti-cal to create a culture of empiricism and provide individuals and teams with knowledge and common standards.
Innovation agencies within governments can provide complementary in-sights on data use. Examples include Austria’s GovLab, Denmark’s National Center for Public Sector Innovation, Georgia’s ServiceLab, and Portugal’s LabX. These agencies provide the space for proposing solutions to public sector chal-lenges in an interdisciplinary way. In this process, innovation agencies should partner with government entities in a way that allows the government entities to receive a substantial part of the praise for any successes but protects them from being blamed for failures.
Whole-of-government agendas for change should be accompanied by creat-ing a widely accessible infrastructure for data and digital tools. Where feasible, setting up a common IT infrastructure on which agencies can access government-wide data at low cost can generate innovation within organizations and harmo-nize activities across government.
Just 20 of 50 ECA countries have a GovTech institution supporting interoper-ability and interconnectivity across government agencies. The French Ministry of Interior, the Dutch Ministry of Education, and agencies in Germany and Sweden have set up cloud networks to allow their staff to store, analyze, and collaborate using data on citizens and civil servants while preserving digital sovereignty. The government of Moldova uses a platform that consolidates more than 100 data centers across the country in a joint management platform (BTS 2019).
Interoperability makes it possible to share data across government institu-tions. The United Kingdom’s National Indicator system, for example, mandates that all local governments produce a standardized set of indicators on key ser-vices. The transition requires the establishment of an interoperable architecture with open data and standards (UN 2012). Systems throughout the government must be interoperable at the back end and provide a single-entry point for users at the front end through one-stop portals.
Strengthening Platforms for Government Accountability
Platforms are needed that allow citizens to hold government accountable for their broad approach to using data. An ecosystem of institutions and platforms can create incentives to implement cultures of empiricism for higher productivity (a priority highlighted in the second section of this chapter) and foster dialogue between government and civil society (a priority highlighted in the third section of this chapter). Such institutions can be organizations of government, such as the US Government Accountability Office, or independent of government, such as the United Kingdom’s Institute for Government or the Netherlands’ Institute for Public Sector Efficiency Studies, which conducts research on the efficiency of the public sector.

98 ● World Bank ECA Economic Update Spring 2021
Civil society institutions can support the quality of empirical analysis in gov-ernment by undertaking rigorous research, thereby acting as a check on public institutions. The Institute for Fiscal Studies has built a reputation for world-class analysis of the British government’s budgets; its analysis complements that of the government’s Office for Budget Responsibility, providing the British state with a powerful combination of checks and balances on fiscal issues. In the higher-ca-pacity countries of ECA, such institutions can provide a public good that im-proves the quality of government as a whole.
NGOs can monitor and study the efficacy of government functioning in broad terms. The European Civic Space Watch, for example, fosters collective action by a range of civil society groups and advocates for the rights of individuals and groups to access information, evaluate it, and speak out. Such platforms and ecosystems foster engagement between civil service and civil society; and strengthen the capacity of government in the long run.
The beneficial influence of civic society can be threatened if government tar-gets its criticism. In authoritarian regimes, such criticism discourages the entry of empirically oriented organizations into the ecosystem and reduces the quality of empiricism in the polity. Fostering the development of civil society organiza-tions, particularly in countries where they do not exist, is a necessary starting point for holding governments accountable.
Formal accountability mechanisms are necessary for constructive engagement between governments and civil society. When cases of corruption or failures in service delivery are identified by civil society, formal accountability mechanisms (supreme audit institutions, regulatory agencies, the judiciary) need to intervene.
Broadening Access to Government Information and Data
Governments need to make information on government activities and analysis available at low cost to civil society. Examples of initiatives that do so include the Aarhus Convention, which established the rights of the public across Europe to receive environmental information held by public authorities (UNECE 1993), and freedom of access to information acts (FOIA), which are in place in a wide range of ECA countries.10 Initiatives must be accompanied by protocols and authorities powerful enough to monitor and discipline parties that fail to comply with the spirit of the law. Citizens who are not satisfied with the government’s decision on their FOIA request should have the right for judicial review of their requests.
Making data available does not guarantee that civil society will use them. In-centives should be created for citizens to process raw government data into com-pelling and digestible narratives and solutions. One way to do so is through hackathons. In 2018, the Bulgaria State e-Government Agency, in collaboration with a range of partners, hosted the Balkan Hackathon to generate innovations for societal progress (Balkan Hackathon 2020). In Ukraine, SocialBoost, an NGO
10. Bosnia and Herzegovina was the first country in the Balkans to pass a Freedom of Infor-mation Act (in 2000).

Chapter 2: Data, Digitalization, and Governance ● 99
that promotes the use of open data for transparent government, hosted the Social Entrepreneurship Hackathon in 2014 (USAID 2015). In response to the COVID-19 crisis, a range of ECA governments organized hackathons that fostered engage-ment with civil society in data-oriented and digital spaces, including GovTech Polska’s HackYeah (HackYeah 2020) and the German federal government’s #WeVsVirus (Gegenhuber 2020).
Governments must be mindful of the potential backlash of misrepresentations of official data. The same platforms that allow for rich dissemination of data (namely, social media) can be associated with the spread of misinformation and false news. Governments should not resort to censorship or the blockage of infor-mation. Instead, they should promote fact-checking and similar strategies to pro-vide truthful information and enrich the quality of public debate.
Governments should provide feedback on the use of OGD by civil society organizations and private citizens to generate a virtuous circle of data publishing and use. Transparent, open data alone will not be sufficient to improve service deliv-ery or hold governments accountable if governments do not respond to its use.
Encouraging Citizen Action for Public Reform
Societies and governments must promote direct feedback between citizens and government. Where access to broadband Internet lags, it needs to be expanded.
Citizen participation is likely to be more successful in areas where citizens have better local knowledge than public officials (as shown in box 2.6). It is not well suited to technically complex areas, such as utility regulation. Stakeholders should focus on reshaping the public administration firewall in areas where citi-zens are likely to be most effective.
Closing the feedback loop by telling citizens how the government took action regarding their recommendations can build public trust in government. For citi-zens to have an incentive to provide feedback, governments must be willing and able to resolve the concerns citizens raised (World Bank 2016). There is likely to be substantial scope for co-production mechanisms, where public officials and citizens cooperate to deliver projects or activities (a type of collaborative gover-nance discussed in the previous section). Such mechanisms capitalize on the skills and information of each group. Governments should experiment with ways to engage citizens in co-producing data and capitalizing on the data held by citizens regarding their preferences and local constraints.
These interactions should be part of a process of making the public sector more responsive to local needs. A starting point is directly engaging citizens is to set up a centralized website where individuals can contact the government about their concerns or provide feedback on service delivery. Only 28 of the 50 coun-tries in the region have this kind of web portal. Most countries in Central Asia and Eastern Europe and some in Central Europe, and the Western Balkans lack such websites. As many individuals, particularly in disadvantaged communities, may lack digital access or be unfamiliar with websites, analog channels of com-munication should also be provided.

100 ● World Bank ECA Economic Update Spring 2021
Further Research
Research is needed to better understand and address the challenges outlined in this chapter. The gradual implementation of an evidence-based approach in the civil service should be accompanied with a research agenda on its impact. The outputs of this research agenda will provide leaders and policy makers with the tools they need to adapt and scale programs. In parallel, research on civil soci-ety’s use and application of OGD can yield insights that can strengthen the im-pact of the data revolution on government productivity and accountability.
The research agenda on empirics in the public sector is very rich. To equip the civil service with data-oriented individuals and teams, it is important to investi-gate human resource management questions. These questions include how to (a) attract and retain talented, high-skilled, and innovative individuals; (b) build the capacity of existing personnel for data and digital usage; (c) structure perfor-mance review and promotion systems to incentivize productivity and empiri-cism; and (d) integrate individuals with different skill sets, experiences, and backgrounds into cohesive teams that are equipped and motivated to harness the data revolution in the public sector. It is also important to understand which strategies improve service delivery most (service-wide reforms of sector-specific ones, for example).
The efficacy of individually versus organizationally targeted approaches may vary with the structure of the team and the nature of the task. Research can shed light on these interactions. Given the relationship between information and hier-archy, the research could also explore the degree to which knowledge-sharing may diffuse to differentially shift attitudes, norms, and practices throughout the civil service. Findings could support the implementation of new norms and pro-tocols and foster the use and application of new systems of data and digitalization.
Research could also focus on the factors that motivate civil society to engage with OGD. Research on incentives and disincentives to using and applying OGD could inform policies that foster greater collaboration and communication be-tween the civil service and civil society. Such feedback could push governments toward greater accountability, innovation, and empiricism.
Impact evaluation could evaluate the outcomes of OGD. Such studies require determination of the objectives of OGD and the standardization of the measure-ment for evaluation. It is also important to evaluate the impact of empirically minded civil service reforms on citizen perceptions, in order to understand how to build public support for more ambitious reforms in the same direction.
Collaboration with academic institutions and think tanks can spur broader and faster innovation. External partners could be invited to use data on the pub-lic service. Such data need to be published in a standardized way, with documen-tation on the data collection process. The analyses could be used to build momen-tum within the public service for innovations in empiricism. Creating fellowship and internship opportunities with empirically minded academics and private sector analysts could also be helpful.

Chapter 2: Data, Digitalization, and Governance ● 101
ReferencesAghion, P., and J. Tirole. 1997. “Formal and Real Authority in Organizations.” Journal of
Political Economy 105 (1): 1–29.
Andersen, T.B. 2009. “E-Government as an Anti-Corruption Strategy.” Information Eco-nomics and Policy 21 (3): 201–10. doi:10.1016/j.infoecopol.2008.11.003.
Ajzenman, N., T. Cavalcanti, and D. Da Mata. 2020. “More than Words: Leaders’ Speech and Risky Behavior During a Pandemic.” Working paper. https://papers.ssrn.com/sol3/papers.cfm?abstract_id=3582908.
Arizti, P., D.J. Boyce, N. Manuilova, C. Sabatino, R. Senderowitsch, and E. Vila. 2020. Build-ing Effective, Accountable, and Inclusive Institutions in Europe and Central Asia: Les-sons from the Region. Washington, DC: World Bank.
Attard, J., F. Orlandi, S. Scerri, and S. Auer. 2015. “A Systematic Review of Open Govern-ment Data Initiatives.” Government Information Quarterly 32 (4): 399–418.
Azulai, M., I. Rasul, D. Rogger, and M. Williams. 2020. “Can Training Improve Organiza-tional Culture? Experimental Evidence from Ghana’s Civil Service.” Working Paper. http://www.danrogger.com/files/papers/Azulaietal_2020_Can%20Training%20Im-prove%20Organizational%20Culture.pdf.
Balkan Hackathon. 2020. https://www.balkanhackathon.eu/. Accessed February 5, 2021.
Bandiera, O., and I. Rasul. 2006. “Social Networks and Technology Adoption in Northern Mozambique.” Economic Journal 116 (514): 869–902.
Banerjee, A., A.G. Chandrasekhar, E. Duflo, and M.O. Jackson. 2013. “The Diffusion of Microfinance.” Science 341 (6144): 1236498.
Banerjee, A., E. Duflo, C. Imbert, S. Mathew, and R. Pande. 2020. “E-Governance, Ac-countability, and Leakage in Public Programs: Experimental Evidence from a Financial Management Reform in India.” American Economic Journal: Applied Economics 12 (4): 39–72.
Baranek, Musolff, and Titl. 2020. “Data transparency, public oversight and collusion in e-procurement.” Accessed at: https://www.econpol.eu/sites/default/files/2020-10/Work-ing_Paper_Titl_Vitezslav_Collusion_in_auctions.pdf.
Barrera, O., S. Guriev, E. Henry, and E. Zhuravskaya. 2020. “Facts, Alternative Facts, and Fact Checking in Times of Post-Truth Politics.” Journal of Public Economics 182: 104–13
Barry, E., and B. Bannister. 2014. “Barriers to Open Data Release: A View from the Top.” Information Polity 19: 129–52.
Bearfield, D.A., and A.O. Bowman. 2017. “Can You Find It on the Web? An Assessment of Municipal E-Government Transparency.” American Review of Public Administration 33 (6): 847–53.
Bernstein, D., F. Recanatini, and E. Georgieva-Andonovska. 2018. Public Sector Gover-nance Indicators for EU Regions. World Bank: Washington, DC
Bertelsmann Stiftung. 2020. Bertelsmann Transformation Index 2020. Available at: https://www.bti-project.org/en/home.
Besley, T., and M. Ghatak. 2005. “Competition and Incentives with Motivated Agents.” American Economic Review 95 (3): 616–36.
Bialas, S. 2013. “The Home-Country Culture as One of the Factors of Human Resource Management: A Case of MNCS in Poland.” in Active Citizenship by Knowledge Man-agement & Innovation: Proceedings of the Management, Knowledge and Learning International Conference 2013. ToKnowPress: Celje, Slovenia.
BTS. 2019. A Fully-Fledged Private eGov Cloud for Moldova. https://bts.md/project/a-fully-fledged-private-governmental-cloud/. Accessed February 5, 2021.

102 ● World Bank ECA Economic Update Spring 2021
Burlig, F., and A.W. Stevens. 2019. “Reap What Your Friends Sow: Social Networks and Technology Adoption.” Working Paper. https://static1.squarespace.com/static/558eff8ce4b023b6b855320a/t/5d6585987c74b3000110c495/1566934426266/Burlig_Stevens_RWYFS.pdf.
Callen, M., S. Gulzar, S.A. Hasanain, M.Y. Khan, and A.B. Rezaee. 2020. “Data and Policy Decisions: Experimental Evidence from Pakistan.” Journal of Development Economics 146: 10253.
Carolan, L. 2016. Open Data, Transparency and Accountability: Topic Guide. GSDRC, Uni-versity of Birmingham, United Kingdom.
Chopra. A. 2014. Innovative State: How New Technologies Can Transform Government. New York: Atlantic Monthly Press.
Church, J. A. 2017. “Civil Society and the Open Data Movement.” Quarterly Journal of Government Information Practice and Perspective 45 (3): 5–8.
Connolly, J., and R. Pyper. 2020. “Public Servants and Corporate Governance Failures: Developing for the Future by Learning from the Past.” In The Palgrave Handbook of the Public Servant, ed. H. Dickinson and H. Sullivan. London: Palgrave Macmillan.
Cook, J.S. 2010. “Economic Issues in Funding and Supplying Public Sector Information.” In Access to Public Sector Information: Law, Technology and Policy, vol. 1, ed. B. Fitzgerald. Sydney: Sydney University Press.
Cooper, C. 2018. “Public Servants, Anonymity, and Political Activity Online: Bureaucratic Neutrality in Peril?” International Review of Administrative Sciences 86 (3): 496–512.
Cordella, A., and F. Contini. 2020. Digital Technologies for Better Justice. Discussion Paper IDB-DP-761, Inter-American Development Bank, Washington, DC.
Cumbie, B.A., and B. Kar. 2016. “A Study of Local Government Website Inclusiveness: The Gap between E-Government Concept and Practice.” Information Technology for De-velopment 22 (1): 15–35. doi:10.1080/02681102.2014.906379.
Dal Bó, E., F. Finan, and M.A. Rossi. 2013. “Strengthening State Capabilities: The Role of Financial Incentives in the Call to Public Service.” Quarterly Journal of Economics 128 (3): 1169–218.
Davenport, T., R. Eccles, and L. Prusak. 1992. “Information Politics.” Sloan Management Review 34: 53–65.
Davies, T. 2010. “Open Data, Democracy and public sector reform. A look at Open Gov-ernment Data Use from Data.gov.uk.” Working paper. http://www.opendataimpacts.net/report/wp-content/uploads/2010/08/How-is-open-government-data-being-used-in-practice.pdf.
Dawes, S., L. Vidiasova, and O. Parkhimovich. 2016. “Planning and Designing Open Gov-ernment Data Programs: An Ecosystem Approach.” Government Information Quar-terly 33: 15–27.
De Blasio, E., and M. Sorice. 2016. “Open Government: A Tool for Democracy?” Media Studies 7 (14).
DE JURE (Data and Evidence for Justice Reform). 2019. Data and Evidence for Justice Reform. World Bank, Washington, DC. http://pubdocs.worldbank.org/en/923891592406548876/DE-JURE-Brief.pdf.
Demirgüç-Kunt, A., M. Lokshin, and I. Torre. 2020. “Opening-up Trajectories and Eco-nomic Recovery: Lessons after the First Wave of the COVID-19 Pandemic.” Policy Re-search Working Paper 9480, World Bank, Washington, DC.
Đorđević, B. 2016. “Impact of National Culture on International Human Resource Management.” Economic Themes 54 (2): 281–300.

Chapter 2: Data, Digitalization, and Governance ● 103
Durkiewicz, J., and T. Janowski. 2018. “Is Digitalization Improving Governance Quality? Correlating Analog and Digital Benchmarks.” In Proceedings of the 18th European Conference on Digital Government, 48–56. Academic Conferences and Publishing Limited, Reading, UK.
EBRD (European Bank for Reconstruction and Development). 2020. Transition Report 2020. London.
EC. 2019. Directive (EU) 2019/1024 of the European Parliament and of the Council of 20 June 2019 on open data and the re-use of public sector information PE/28/2019/REV/1, accessed at: https://eur-lex.europa.eu/legal-content/EN/TXT/?qid=1561563110433&uri=CELEX:32019L1024.
Enikolopov, R., A. Makarin, and M. Petrova. 2020. “Social Media and Protest Participation: Evidence from Russia.” Econometrica 88 (4): 1479–514.
Enikolopov, R., M. Petrova, and K. Sonin. 2018. “Social Media and Corruption.” American Economic Journal: Applied Economics 10 (1): 150–74.
EU (European Union). 2017. New European Interoperability Framework: Promoting Seam-less Services and Data Flows for European Public Administrations. Brussels.
———. 2021. Data Protection in the EU. https://ec.europa.eu/info/law/law-topic/data-protection/data-protection-eu_en.
European Data Portal. 2019. Open Data Maturity Report 2019. European Commission, Directorate-General of Communications, Networks, Content and Technology, Brussels. doi: 10.2830/073835.
Eurostat. 2019. ICT Statistics 2019. Available at: https://ec.europa.eu/eurostat/web/digi-tal-economy-and-society.
Gallup. 2019. Gallup World Poll 2019. https://www.gallup.com/home.aspx.
Gegenhuber, Thomas. 2020. “Countering Coronavirus with Open Social Innovation.” Stan-ford Social Innovation Review, April 29.
Gentzkow, M., and J. Shapiro. 2006. “Media Bias and Reputation.” Journal of Political Economy 114 (2): 280–316.
Gindling, T.H., N. Mossaad, and D. Newhouse. 2020. “Self-Employment Earnings Premi-ums/Penalties and Regulations: Evidence from Developing Economies.” Small Busi-ness Economics 55 (2): 507–27.
Gogeanu, G.A. 2015. “The Relationship between Organizational Culture and Human Re-sources Management.” Journal of Business and Public Administration 6 (2): 50–66.
Goldsmith, S., and S. Crawford. 2014. The Responsive City: Engaging Communities through Data-Smart Governance. San Francisco: Jossey-Bass.
Gorgulu, N., G. Sharafutdinova, and J. Steinbuks. 2020. “Political Dividends of Digital Participatory Governance: Evidence from Moscow Pothole Management.” Policy Re-search Working Paper 9445, World Bank, Washington, DC.
Government of Germany. 2021. Data Strategy of the German Federal Government. Berlin.
GovTechLeaders. 2018. How Can the Public Sector Overcome the Digital Skills Barrier? https://www.govtechleaders.com/2018/04/27/how-can-the-public-sector-overcome-the-digital-skills-barrier/.
Grinberg, N., K. Joseph, L. Friedland, B. Swire-Thompson, and D. Lazer. 2019. “Fake News on Twitter during the 2016 US Presidential Election.” Science 363 (6425): 374–78.
Grossman, G., Humphreys, M. and G. Sacramone-Lutz. 2020. “Information Technology and Political Engagement: Mixed Evidence from Uganda.” Journal of Politics 82(4): 1321–36.
Grossman, G., Platas, M. R. and J. Rodden. 2018. “Crowdsourcing accountability: ICT for service delivery.” World Development 112: 74–87.

104 ● World Bank ECA Economic Update Spring 2021
Guess, A., J. Nagler, and J. Tucker. 2019. “Less Than You Think: Prevalence and Predictors of Fake News Dissemination on Facebook.” Science Advances 5 (1). https://advances.sciencemag.org/content/5/1/eaau4586.
Guriev, S., N. Melnikov, and E. Zhuravskaya. Forthcoming. “3G and Confidence in Govern-ment.” Quarterly Journal of Economics.
HackYeah. 2020. https://hackyeah.pl/. Accessed February 5, 2021.
Halonen, A. 2012. Being Open about Data. http://finnishinstitute.org.uk/images/stories/pdf2012/being percent20open percent20about percent20data.pdf.
Hammerschmid, G., Van de Walle, S., Oprisor, A., and V. Štimac. 2013. “Trends and Impact of Public Administration Reforms in Europe: Views and Experiences from Senior Public Sector Executives.” COCOPS (Coordinating for Cohesion in the Public Sector of the Future), European Policy Brief, September. Rotterdam, https://ec.europa.eu/research/social-sciences/pdf/policy_briefs/cocops-policy-brief.pdf.
Hashim, A. and W P. Piatti-Fünfkirchen. 2018. “Lessons from Reforming Financial Manage-ment Information Systems: A Review of the Evidence.” Policy Research Working Paper 8312, World Bank, Washington, DC.
Hashim, A., M. Piatti-Fünfkirchen, W.P. Onipede Cole, A. Naqvi, A. Minallah, M. Prathna, and S. So. 2019. “The Use of Data Analytics to Assess the Functioning of a Govern-ment’s Financial Management Information System: an Application to Pakistan and Cambodia.” Policy Research Working Paper 8689, World Bank: Washington, DC.
Hasnain, Z., D. O. Rogger, D. J. Walker, K.M. Kay, and R. Shi. 2019. Innovating Bureau-cracy for a More Capable Government. Washington, DC: World Bank. http://docu-ments.worldbank.org/curated/en/249891549999073918/Innovating-Bureaucracy-for-a-More-Capable-Government.
Hausman, D. 1998. “Economics, Philosophy of.” In Routledge Encyclopedia of Philosophy, vol. 3, ed. Edward Craig, 211–22. London: Routledge.
Heichlinger, A., N. Hammerschmid, G. Thijs, and K. Attström. 2018. Public Administration Reform in Europe: Conclusions, Lessons Learned, and Recommendations for Future EU Policy. Brussels: European Commission.
Hellberg, A.S., and K. Hedström. 2015. “The Story of the Sixth Myth of Open Data and Open Government.” Transforming Government: People, Process and Policy 9 (1): 35–51.
Helliwell, J.F., H. Huang, S. Grover, and S. Wang. 2018. “Empirical Linkages between Good Governance and National Well-Being.” Journal of Comparative Economics 46 (4): 1332–46.
Henry, E., E. Zhuravskaya, and S. Guriev. 2021. “Checking and Sharing Alt-Facts.” Working Paper. https://papers.ssrn.com/sol3/papers.cfm?abstract_id=3597191.
Hinz, O., B. Skiera, C. Barrot, and J.U. Becker. 2011. “Seeding Strategies for Viral Market-ing: An Empirical Comparison.” Journal of Marketing 75: 55–71.
Hjort, J., D. Moreira, G. Rao, and J.F. Santini. 2019. “How Research Affects Policy: Experi-mental Evidence from 2,150 Brazilian Municipalities.” NBER Working Paper w25941, National Bureau of Economic Research, Cambridge, MA.
Hobbs, W., and M. Roberts. 2018. “How Sudden Censorship Can Increase Access to Infor-mation.” American Political Science Review 112 (3): 621–36.
Hong, L., and S. Page. 2001. “Problem Solving by Heterogeneous Agents.” Journal of Economic Theory 97 (1): 123–63.
Hujiboom, N., and T. Van den Broek. 2011. “Open Data: An International Comparison of Strategies.” European Journal of ePractice 12: 4–16.
ILOSTAT. 2020. “Employment by Sex and Institutional Sector–Annual.” Table EMP_TEMP_SEX_INS_NB_A. accessed at: https://www.ilo.org/shinyapps/bulkexplorer6/?lang=en&segment=indicator&id=EMP_TEMP_SEX_INS_NB_A.

Chapter 2: Data, Digitalization, and Governance ● 105
IMF (International Monetary Fund). n.d. World Economic Outlook Dataset. Washington, DC.
———. 2020a. Fiscal Monitor. Washington, DC.
———. 2020b. Cyber Risk is the New Threat to Financial Stability. Accessed at: https://blogs.imf.org/2020/12/07/cyber-risk-is-the-new-threat-to-financial-stability/.
Islam, A.M., and D. Lederman. 2020. Data Transparency and Long-Run Growth. World Bank, Washington, DC.
Janssen, M., Y. Charalabidis, and A. Zuiderwijk. 2012. “Benefits, Adoption Barriers and Myths of Open Data and Open Government.” Information Systems Management 29 (4): 258–68.
Jetzek, T., M. Avital, and N. Bjorn-Andersen. 2014. “Data-Driven Innovation through Open Government Data.” Journal of Theoretical and Applied Electronic Commerce Research 9 (2): 100–20.
Kaarakainen, M.T., O. Kivinen, and T. Vainio. 2017. “Performance-Based Testing for ICT Skills Assessing: A Case Study of Students and Teachers’ ICT Skills in Finnish Schools.” Universal Access in the Information Society 17. https://doi.org/10.1007/s10209-017-0553-9.
Kattel, R. and I. Mergel. 2019. “Estonia’s Digital Transformation: Mission Mystique and the Hiding Hand.” in Compton. M. and P. ‘t Hart (eds.) Great Policy Successes, Oxford University Press: Oxford.
Kaufmann, D., and A. Kraay. 2002. “Growth without Governance.” Economia 3 (1): 169–230.
Kaufmann, D., A. Kraay, and M. Mastruzzi. 2006. “Measuring Governance Using Cross-Country Perceptions Data.” In International Handbook on the Economics of Corrup-tion, ed. S. Rose-Ackerman. Cheltenham, United Kingdom: Edward Elgar.
Khemani, S., E. Dal Bo, C. Ferraz, F. Finan, C. Stephenson, A. Odugbemi, D. Thapa, and S. Abrahams. 2016. Making Politics Work for Development: Harnessing Transparency and Citizen Engagement. Policy Research Report 106337, World Bank, Washington, DC.
Kochanova, A., Z. Hasnain, and B. Larson. 2020. “Does E-Government Improve Govern-ment Capacity? Evidence from Tax Compliance Costs, Tax Revenue, and Public Pro-curement Competitiveness.” World Bank Economic Review 34 (1): 101–20.
Landemore, H. 2015. “Inclusive Constitution-Making: The Icelandic Experiment.” The Journal of Political Philosophy 23 (2): 166–191.
Lazear, E.P. 1999. “Globalisation and the Market for Team-Mates.” Economic Journal 109 (454): 15–40.
Lewis-Faupel, S., Y. Neggers, B.A. Olken, and R. Pande. 2016. “Can Electronic Procure-ment Improve Infrastructure Provision? Evidence from Public Works in India and Indo-nesia.” American Economic Journal 8 (3): 258–83.
Ma, L., and Y. Zheng. 2017. “Does E-Government Performance Actually Boost Citizen Use? Evidence from European Countries.” Public Management Review 20 (10): 1513–32.
Máchová, R., and M. Lněnička. 2016. “Exploring the Emerging Impacts of Open Data in the Public Sector.” Proceedings of the 20th International Conference Current Trends in Public Sector Research. Masarykova Univerzita, Brno, Czech Republic.
Maderick, J.A., S. Zhang, K. Hartley, and G. Marchand. 2015. “Preservice Teachers and Self-Assessing Digital Competence.” Journal of Educational Computing Research 54: 325–51.
Malena, C., R. Forster, and J. Singh. 2004. “Social Accountability: An Introduction to the Concept and Emerging Practice” Social Development Paper no. 76, World Bank: Wash-ington, DC.
Mastracci, S.H. 2009. “Evaluating HR Management Strategies for Recruiting and Retaining IT Professionals in the U.S. Federal Government.” Public Personnel Management 38 (2): 19–34.

106 ● World Bank ECA Economic Update Spring 2021
Mastrobuoni, G. 2020. “Crime Is Terribly Revealing: Information Technology and Police Productivity.” Review of Economic Studies 87 (6): 2727–53.
Melchor, O.H. 2013. “The Government Workforce of the Future: Innovation in Strategic Workforce Planning in OECD Countries.” OECD Working Paper on Public Governance 21: 5–41.
Meyer-Sahling, J. 2009. “Sustainability of Civil Service Reforms in Central and Eastern Europe Five Years after EU Accession.” SIGMA Paper 44, Organisation for Economic Co-operation and Development, Paris.
Mizala, A., P. Romaguera, and S. Gallegos. 2011. “Public–Private Wage Gap in Latin Amer-ica (1992–2007): A Matching Approach.” Labour Economics 18: S115–31.
Moore, M., and J. Hartley. 2008. “Innovations in Governance.” Public Management Review 10 (1): 3–20.
Munteanu, A. 2015. “National and Organizational Culture Influence on The Implementa-tion of Strategic Human Resources Management In Organizations.” In Contemporary Issues and Challenges in Human Resource Management, ed. K. Stankiewicz, 32–40. Gdansk, Poland: Gdansk University of Technology.
Nagaraj, A., E. Shears, and M. de Vaan. 2020. “Improving Data Access Democratizes and Diversifies Science.” Proceedings of the National Academy of Sciences 117 (38): 23490–98.
Nam, T. 2014. “Assessing Operational and Collaborative Performance Management: A Case Study of Philly Stat.” International Journal of Public Administration 37: 514–27.
Negoita, M. 2018. “Beyond Performance Management: A Networked Production Model of Public Service Delivery.” Public Performance & Management Review 41 (2): 253–76
Noveck, B.S. 2009. Wiki Government: How Technology Can Make Government Better, Democracy Stronger and Citizens More Powerful. Washington, DC: Brookings Institu-tion Press.
O’Connor, K., C. Knox, and S. Janenova. Forthcoming. “Bureaucrats, Authoritarianism, and Role Conceptions.” Review of Public Personnel Administration.
OECD (Organisation for Economic Co-operation and Development). 2019. The Path to Becoming a Data-Driven Public Sector. Paris.
Okunogbe, O., and V. Pouliquen. 2018. “Technology, Taxation, and Corruption: Evidence from the Introduction of Electronic Tax Filing.” Policy Research Working Paper 8312, World Bank, Washington, DC.
Open Government Partnership. 2020. “Open Government Declaration.” https://www.opengovpartnership.org/process/joining-ogp/open-government-declaration/. Ac-cessed December 15, 2020.
Prat, A., and D. Strömberg. 2013. “The Political Economy of Mass Media.” In Advances in Economics and Econometrics: Theory and Applications, Proceedings of the Tenth World Congress of the Econometric Society. Cambridge University Press.
PRS Group. 2020. International Country Risk Guide. https://epub.prsgroup.com/products/icrg/international-country-risk-guide-icrg#.
Qin, B., D. Strömberg, and Y. Wu. 2019. “Social Media, Information Networks, and Protests in China.” Working Paper. https://conference.nber.org/conf_papers/f130029.pdf.
Ramos-Maqueda, M., and D. Chen. 2020. “The Role of Justice in Development: The Data Revolution.” Working paper. https://users.nber.org/~dlchen/papers/The_Role_of_Jus-tice_in_Development.pdf.
Reale, G. 2014. “Opportunities and Differences of Open Government Data Policies in Europe.” Athens Journal of Social Sciences 1 (3): 195–205.

Chapter 2: Data, Digitalization, and Governance ● 107
Resh, W., T. Moldogaziev, S. Fernandez, and C.A. Leslie. 2019. “Reversing the Lens: As-sessing the Use of Federal Employee Viewpoint Survey in Public Administration Re-search.” Review of Public Personnel Administration. https://doi.org/10.1177/ 0734371X19865012.
Richmond, C.J., and others. 2019. “Reassessing the Role of State-Owned Enterprises in Central, Eastern and Southeastern Europe.” European Departmental Paper Series 19, International Monetary Fund, Washington, DC.
Rogger, D. 2017. “Who Serves the Poor? Surveying Civil Servants in the Developing World.” Policy Research Working Paper 8051, World Bank, Washington, DC.
Rogger, D., and R. Somani. 2018. “Hierarchy and Information.” Policy Research Working Paper 8644, World Bank, Washington, DC.
Ruijer, E., F. Détienne, M. Baker, J. Groff, and A. J. Meijer. 2020. “The Politics of Open Government Data: Understanding Organizational Responses to Pressure for More Transparency.” American Review of Public Administration 50 (3): 260–74.
Ruijer, E., S. Grimmelikhuijsen, J. van den Berg, and A. Meijer. 2020. “Open Data Work: Understanding Open Data Usage from a Practice Lens.” International Review of Admin-istrative Sciences 86 (1): 3–19.
Ruijer, E.H., and E. Martinius. 2017. “Researching the Democratic Impact of Open Govern-ment Data: A Systematic Literature Review.” Information Polity 22 (4): 233–50.
Schuster, C., L. Weitzman, K.S. Mikkelsen, J. Meyer-Sahling, K. Bersch, F. Fukuyama, P. Paskov, D. Rogger, D. Minstree, and K. Kay. 2020. “Responding to COVID-19 through Surveys of Public Servants.” Public Administration Review 80 (5): 792–96.
Stiglitz, J. 2015. “Inequality and Economic Growth.” Political Quarterly 86 (S1): 134–55.
Thijs, N., G. Hammerschmid, and E. Palaric. 2018. A Comparative Overview of Public Ad-ministration Characteristics and Performance in EU28. Publications Office of the Euro-pean Union, Brussels.
Thomson, A., M. Veall, and A. Sweetman. 2018. “Is There Evidence of an Information and Communication Technology Labour Shortage in the Canadian Labour Force Survey?” Canadian Public Policy 44 (S1): S1–S2.
Ubaldi, B. 2013. “Open Government Data: Towards Empirical Analysis of Open Govern-ment Data Initiatives.” OECD Working Paper on Public Governance 22, Organisation for Economic Co-operation and Development, OECD Publishing, Paris.
Uhlir, P.F. 2009. The Socioeconomic Effects of Public Sector Information on Digital Net-works: Toward a Better Understanding of Different Access and Reuse Policies: Work-shop Summary. US National Committee CODATA, in cooperation with the Organisa-tion for Economic Co-operation and Development. http://www.nap.edu/catalog.php?record_id=12687.
UN (United Nations). 2012. E-Government Survey 2012. New York.
UNECE (United Nations Economic Commission for Europe). 1993. Convention on Access to Information, Public Participation in Decision-Making and Access to Justice in Envi-ronmental Matters. June 25, Aarhus, Denmark.
USAID (US Agency for International Development). 2015. “Hackathon Aims to Help Ukraine Government Better Support its Displaced Citizens. Science, Technology, In-novation, and Partnerships.” Washington, DC.
US Federal Government. 2021. Federal Data Strategy: Leveraging Data as a Strategic As-set. https://strategy.data.gov/background/. Accessed February 5, 2021.
Van Ooijen, C., B. Ubaldi, and B. Welby. 2019. “A Data-Driven Public Sector: Enabling the Strategic Use of Data for Productive, Inclusive and Trustworthy Governance.” OECD Working Paper on Public Governance 33, Organisation for Economic Co-operation and Development, Paris. https://doi.org/10.1787/09ab162c-en.

108 ● World Bank ECA Economic Update Spring 2021
Verhulst, S. and A. Young. 2016. Open Data Impact. When Demand and Supply Meet. The GovLab, New York University: New York City, NY. Available at: https://www.thegovlab.org/static/files/publications/open-data-impact-key-findings.pdf.
Vosoughi, S., D. Roy, and S. Aral. 2018. “The Spread of True and False News Online.” Sci-ence 359 (6380): 1146–51.
Weerakkody, V., Z. Irani, K. Kapoor, U. Sivarajah, and Y.K. Dwivedi. 2017. “Open Data and Its Usability: An Empirical View from the Citizen’s Perspective.” Information Systems Frontiers 19 (2): 285–300.
WEF (World Economic Forum). 2018. The Global Competitiveness Report 2017–2018.
Williams, M., and L. Yecalo-Tecle. 2020. “Innovation, Voice, and Hierarchy In The Public Sector: Evidence From Ghana’s Civil Service.” Governance 33 (4): 789–807.
World Bank. 1991. Managing Development: The Governance Dimension. Washington DC.
———. 2006. World Development Report: Equity and Development. Washington, DC.
———. 2012. World Development Report: Gender Equality and Development. Washing-ton, DC.
———. 2016. World Development Report: Digital Dividends. Washington, DC.
———. 2017. World Development Report: Governance and the Law. Washington, DC.
———. 2020a. Finding Fraud: GovTech and Fraud Detection in Public Administration. Washington, DC.
———. 2020b. World Development Indicators. Washington, DC. Available at: https://datatopics.worldbank.org/world-development-indicators/.
———. 2020c. World Governance Indicators. Washington, DC. Available at: https://info.worldbank.org/governance/wgi/.
———. 2020d. Worldwide Bureaucracy Indicators Version 1.1. Washington, DC. Available at: https://databank.worldbank.org/source/worldwide-bureaucracy-indicators-(wwbi).
———. 2021. World Development Report 2021: Data for Better Lives. Washington, DC.
World Justice Project. 2020. “WJP Rule of Law Index.” Available at https://worldjusticepro-ject.org/our-work/research-and-data/wjp-rule-law-index-2020.
World Wide Web Foundation. 2018. Open Data Barometer - Leaders Edition. World Wide Web Foundation: Washington, DC. Available at https://opendatabarometer.org/doc/leadersEdition/ODB-leadersEdition-Report.pdf.
Zhuravskaya, E., M. Petrova, and R. Enikolopov. 2020. “Political Effects of the Internet and Social Media.” Annual Review of Economics 12: 415–38.
Zuiderwijk, A., and M. Janssen. 2014. “Open Data Policies, Their Implementation and Im-pact: A Framework for Comparison.” Government Information Quarterly 31 (1): 17–29.

PART
Selected Country Pages
II


Selected Country Pages ● 111
42 MPO Apr 21
Table 1 2020Population, million 2.8
GDP, current US$ billion 1 5.1
GDP per capita, current US$ 5290.1
Upper middle-income poverty rate ($5.5)a 33.8
Gini indexa 33.2
School enro llment, primary (% gross)b 1 04.8
Life expectancy at birth, yearsb 78.5
(a) M ost recent value (201 7), 201 1 PPPs.(b) WDI for school enrollment (201 9); life expectancy (201 8).
Source: WDI, M acro Poverty Outlook, and off icial data.Notes:
Key conditions and challenges Albania’s economy grew by 3.3 percent in 2015-2019, achieving significant reform progress while aspiring to EU member-ship. A few large renewable energy pro-jects and expansion in tourism1 and gar-ments’ manufacturing exports drove GDP and employment growth. However, productivity has stagnated below that of peer countries, and wage pressures could reduce competitiveness. Small and Medi-um Enterprises (SMEs) represent more than 90% of private firms and rely on low-skilled, low-wage labor. Limited access to finance, burdensome logistics and poor market integration discourage private investment, while scarce public revenues limit public infrastructure and human capital investment. Growth halted in 2019, as the earthquake further exposed the country’s low buffers. Fiscal consolidation was put on hold and external vulnerabilities reemerged. The pandemic hit Albania’s key sectors of tourism and manufacturing through the recession in the EU, supply chain disrup-tions, travel limitations and social distanc-ing measures. GDP is projected to have declined by 4.7 percent in 2020 due largely to a slowdown in tourism, though smaller than initially projected as domestic tourism demand partially compensated for the drop in for-eign visits. Public support packages for reconstruction and to mitigate the crisis
had a small estimated success in prevent-ing an increase in poverty and had a sig-nificant fiscal cost. Recently introduced tax incentives further stress already de-clining revenues. Delayed global vaccine rollout could cause long-lasting travel restrictions and prevent a recovery of the country’s services and manufacturing, worsening the performance of businesses and delaying the full recovery in employ-ment. The normalization of the global economy will have a significant impact on the shape of the recovery.
Recent developments As key economic sectors were put in lock-down, the economy experienced a sharp contraction of 10.2 percent in Q2. Travel and tourism services were among the first sectors hit and a combination of official restrictions and post-COVID behavior change reduced both supply and demand. Sales, profits and employment losses affected SMEs disproportionately. Unem-ployment rose to 11.9 percent in Q2. Social distancing measures were lifted in the summer and employment bounced back, with tourism and reconstruction partially absorbing job losses in manufacturing. While total job losses have been relatively
ALBANIA
FIGURE 1 Albania / Real GDP growth and contributions to real GDP growth
FIGURE 2 Albania / Actual and projected poverty rates and real GDP per capita
Sources: INSTAT and World Bank. Source: World Bank. Notes: see Table 2.
Albania was hit hard, first by an earth-quake in November 2019 and then the COVID-19 pandemic. As tourism and services contracted sharply, GDP and employment slumped. Reconstruction and COVID19 related stimulus alleviated the shocks, but at the cost of fiscal space erosion in a context of high economic uncertainty for the years ahead. Recon-struction is likely to be the main driver of the recovery in 2021, followed by a milder growth in private demand due to ongoing travel restrictions.
1 n = up to 2016 poverty is measured using consump-tion data from the Household Budget Survey; starting in 2017 income data from the Survey of Income and Living Conditions are used to measure and forecast poverty
-6
-4
-2
0
2
4
6
8
10
2011 2012 2013 2014 2015 2016 2017 2018 2019 2020 2021 2022
Consumption InvestmentNet exports GDP Growth
Percent, percentage points Poverty rate (%) Real GDP per capita (LCU constant)
0
100000
200000
300000
400000
500000
600000
700000
0
5
10
15
20
25
30
35
40
2005 2007 2009 2011 2013 2015 2017 2019 2021 2023
Upper middle-income pov. rate Real GDP pc

112 ● World Bank ECA Economic Update Spring 2021
43 MPO Apr 21
small, the quality of jobs has likely de-creased, as Albania employs a large share of labor in the informal economy. Despite the employment recovery, economic activ-ity continued to contract by 3.4 percent in Q3. Private consumption and investment declined sharply, as the number of infec-tions consistently rose during the year. Declining garment processing orders led a sharp decline of 6.7 percent of goods ex-ports, while tourist visits decreased by 60 percent. Poverty (at USD 5.5 per day) is estimated to have increased in 2020 by 1 percentage point, equivalent to 28 thousand new poor. Response measures included in-creased social assistance benefits, wage subsidies, credit guarantees to ease sala-ry payments and working capital, which are estimated to have prevented a further poverty increase of about 1.7 percentage points. Tax deferrals and further VAT exemptions were introduced to help SMEs, while public spending rose to 33.7 percent of GDP and public revenues slumped to 26.7 percent of GDP, despite large grants financing reconstruction. The fiscal stimulus package increased public debt to 80 percent of GDP, a first-time increase since 2017, as the fiscal rule mandates that debt-to-GDP ratio should decline annually2.
Outlook Tourism and travel are likely to remain limited until global vaccination rollout is completed. In this scenario, GDP is fore-casted to grow by 4.4 percent in 2021 as exports, consumption and investment partially rebound. The services sector, led by tourism, and construction are expected to be key drivers of the recovery, in part thanks to reconstruction investment, fol-lowing evidence from similar disasters in developing economies. Poverty is ex-pected to decline in line with the recovery by about 2 percentage points. In the years following, private consumption will play an increasingly important role in growth, supported by reconstruction efforts. Pri-vate investment will contribute to growth, provided that the government continues to implement business climate reforms. Beyond 2021, government spending will likely be constrained by limited fiscal space. The fiscal situation could deterio-rate in a downside growth scenario and in the absence of expanded revenue collec-tion. In this case, the government may need to further reduce capital spending to keep the debt to GDP ratio from rising.
The current account deficit is expected to narrow to 8.8 percent of GDP in 2021 and further decline to 6.5 percent in line with the pre-crisis trends, driven by projected improvements in the trade balance. Ser-vice exports, including tourism and fast-expanding business-process operations should narrow the trade deficit over the medium term. Import growth will be high at 13 percent in 2021, as infrastructure investment speeds up. With economic activity picking up, reve-nues are projected to recover to 27.6 per-cent of GDP by 2022-2025. Albania’s pub-lic debt is projected to only marginally decrease to 79.5 percent of GDP in 2021. The employment outlook is largely de-pendent on the recovery of the services sectors and reconstruction, where jobs are mostly low pay and vulnerable to eco-nomic uncertainty.
TABLE 2 Albania / Macro poverty outlook indicators (annual percent change unless indicated otherwise)
2 The fiscal rule includes an escape clause in the case of an emergency, which applied in 2020
2018 2019 2020 e 2021 f 2022 f 2023 fReal GDP growth, at constant market prices 4.1 2.2 -4.7 4.4 3.7 3.7
Private Consumption 3.3 3.3 -4.1 2.6 3.2 3.2Government Consumption 0.7 3.8 2.3 6.4 0.9 3.3Gross Fixed Capital Investment 2.4 -3.3 -7.1 5.4 -4.6 2.3Exports, Goods and Services 4.1 6.0 -30.6 20.5 13.7 6.9Imports, Goods and Services 2.4 3.0 -21.8 12.3 4.3 4.3
Real GDP growth, at constant factor prices 4.1 2.2 -4.6 4.3 3.6 3.6Agriculture 1.2 0.4 1.7 1.7 1.5 1.5Industry 9.3 1.8 -2.1 6.9 5.0 5.0Services 2.9 3.1 -8.1 4.1 3.8 3.7
Inflation (Consumer Price Index) 2.1 1.4 2.2 2.6 2.9 2.8Current Account Balance (% of GDP) -6.8 -8.0 -9.3 -8.8 -7.4 -6.5Net Foreign Direct Investment (% of GDP) 8.0 7.6 5.7 6.2 7.7 7.3Fiscal Balance (% of GDP) -1.7 -2.0 -6.9 -5.5 -4.1 -3.9Debt (% of GDP) 69.5 67.9 80.0 79.5 78.8 77.8Primary Balance (% of GDP) 0.5 0.1 -4.8 -2.9 -1.4 -1.4Upper middle-income poverty rate ($5.5 in 2011 PPP)a,b 32.8 32.0 33.0 31.7Source: World Bank, Poverty & Equity and M acroeconomics, Trade & Investment Global Practices.Notes: e = estimate, f = forecast.NA(a) Calculations based on ECAPOV harmonization, using HBS until 201 6 and SI LC from 201 7.Actual data: 201 7. Nowcast: 201 8-201 9. Forecast: 2020-2021.(b) Nowcast 201 8-201 9 using neutral distribution (201 7) with pass-through = 1 based on GDP in constant LCU. Projections 2020-2021 use sector GDP pro jections with pass-through = 1.

Selected Country Pages ● 113
44 MPO Apr 21
Key conditions and challenges Before the coronavirus pandemic, Arme-nia was making gradual improvements to its business environment and establishing a track record of prudent economic man-agement, underpinned by a robust fiscal rule, an inflation-targeting monetary poli-cy framework, and improving financial sector oversight. The authorities launched an ambitious reform program aimed at strengthening governance in 2018. Eco-nomic growth was strong, averaging 6.4 percent in 2018 and 2019. Despite Armenia’s reform progress, struc-tural challenges have prevented the coun-try from reaching its full potential. These include governance gaps such as incom-plete judicial reform, weak connectivity (resulting in limited trade integration and undiversified trade patterns), an aging population, and a labor market character-ized by high unemployment, pervasive informality, and skills mismatches. A tense geopolitical situation exacerbates these challenges. Armenia’s progress was derailed in 2020 by twin shocks: the worst military con-frontation with Azerbaijan since 1994 and the coronavirus pandemic. Armenia suffered a severe COVID-19 outbreak, ranking 27th globally in recorded cases per million population. Meanwhile, the country’s conflict with Azerbaijan escalat-ed dramatically in September 2020. Alt-hough the November 10th ceasefire halted
hostilities, Armenia has since entered a period of heightened domestic political instability. These twin shocks led to a sharp economic contraction, increased poverty, and a fiscal deterioration. Nevertheless, Armenia maintained overall macroeconomic stabil-ity and healthy external buffers through the crisis.
Recent developments Real GDP contracted by 7.6 percent in 2020. Services—trade and the hospitality sector, in particular—were most affected, contracting by 10 percent. Reflecting struc-tural challenges, for the fifth consecutive year agricultural output fell (by 4 percent). On the demand side, private consumption and investment slumped, while the drag from net exports eased as the decline in imports outpaced that of exports. The pandemic’s impact on vulnerable households, which has been severe, was only partially mitigated by the govern-ment’s COVID-19 response (estimated at 3.5 percent of GDP, including support through the banking sector to businesses). The poverty rate (measured at the upper-middle-income economy poverty line) is estimated to have jumped to over 51 per-cent in 2020, a 7 percentage point rise. The unemployment rate rose by 1 percentage point year on year, reaching 18.1 percent at end-September 2020. Somewhat effec-tive mitigation measures implemented by the government and the relatively short duration of pandemic-related restrictions
ARMENIA
FIGURE 1 Armenia / GDP growth, fiscal and current account balances
FIGURE 2 Armenia / Actual and projected poverty rates and real GDP per capita
Sources: Statistical Committee of Armenia; Central Bank of Armenia; World Bank staff projections.
Source: World Bank. Note: see Table 2.
In 2020, Armenia experienced one of the region’s sharpest GDP contractions—7.6 percent—as a severe COVID-19 outbreak and a military conflict with Azerbaijan late in the year impacted performance. Poverty is estimated to have increased by 7 percentage points in 2020. The econom-ic recovery will be gradual, with output reaching pre-COVID levels by 2023, as-suming that the pandemic is contained, and regional stability maintained. Risks to the recovery include a slow pace of im-munization and elevated political uncertainty.
0.2
7.5
5.2
7.6
-7.6
3.44.3
5.3
-12
-8
-4
0
4
8
2016 2017 2018 2019 2020e 2021f 2022f 2023f
Real GDP growth, % change CAB, % of GDPFiscal balance, % of GDP
Percent Poverty rate (%) Real GDP per capita (millions of constant LCU)
0
1
1
2
2
3
0
10
20
30
40
50
60
70
80
2004 2006 2008 2010 2012 2014 2016 2018 2020 2022
International poverty rate Lower middle-income pov. rateUpper middle-income pov. rate Real GDP pc
Table 1 2020Population, million 2.9
GDP, current US$ billion 1 2.6
GDP per capita, current US$ 4297.0
International poverty rate ($1.9)a 1 .1
Lower middle-income poverty rate ($3.2)a 9.8
Upper middle-income poverty rate ($5.5)a 44.0
Gini indexa 29.9
School enro llment, primary (% gross)b 91 .8
Life expectancy at birth, yearsb 74.9
(a) M ost recent value (201 9), 201 1 PPPs.(b) WDI for school enrollment (201 9); life expectancy (201 8).
Source: WDI, M acro Poverty Outlook, and off icial data.Notes:

114 ● World Bank ECA Economic Update Spring 2021
45 MPO Apr 21
prevented an even greater increase in un-employment. The budget deficit widened sharply to 5.1 percent of GDP in 2020 (from 0.8 percent of GDP in 2019), driven by increased spending associated with the govern-ment’s pandemic response, higher mili-tary spending, and depressed tax reve-nues. The deficit was financed by a depos-its drawdown and increased public bor-rowing, prompting Armenia to invoke its fiscal rule’s escape clause as public debt rose above the statutory level of 60 per-cent of GDP. Inflation remained subdued through most of 2020, reflecting weak aggregate de-mand. However, price pressures accelerat-ed in December and reached 5.3 percent in February 2021, prompting the Central Bank of Armenia (CBA) to raise its policy rate. The recent uptick in inflation was driven by an increase in international food prices and exchange rate depreciation pass-through. The current account deficit narrowed in 2020 as import compression and higher official grants offset a sharp decline in export earnings and weaker remittances. FDI contracted further from a low base, but higher public sector external borrow-ing boosted foreign exchange reserves (which provided 4.7 months of import cover at end-2020). The issuance of a
$750 million Eurobond in early 2021 fur-ther increased external buffers. The CBA intervened to smooth dram volatility, which came under pressure in late 2020 owing to political instability after remain-ing relatively stable for most of the year.
Outlook GDP growth is projected to recover par-tially in 2021 (to 3.4 percent) and more strongly in 2022 (4.3 percent). The recov-ery will be slow; the economy is unlikely to return to pre-COVID output levels until 2023. The baseline scenario assumes that the authorities will not enact additional lock-downs and restrictions in 2021. Although the pace of vaccinations will gradually ramp up, the authorities do not expect to vaccinate a significant share of the popula-tion until 2022. The baseline scenario also assumes improved political stability. Private consumption and the services sec-tor are expected to recover gradually. Pri-vate investment will likely remain sub-dued, reflecting weak investor confidence. High post-conflict spending and ambi-tious public investment plans— although tempered by execution challenges—will keep the fiscal deficit elevated and drive
the debt-to-GDP ratio above 70 percent in the medium term. Average inflation is forecast to remain close to the CBA’s 4-percent target in 2021 but could surge higher if global food and fuel prices continue to rise unexpectedly. The current account deficit is projected to remain near 5–6 percent of GDP in 2021–23, as recovering demand spurs import growth, and the global recovery boosts exports and remittances. FDI inflows are expected to remain subdued, but public borrowing will keep reserves at a comfort-able level over the medium term. The COVID-19 outbreak is estimated to have had a devastating impact on vulner-able households. Forecasts suggest that 48 percent of the population will remain be-low the $5.5 2011 PPP poverty line in 2021, driven by income losses, down only slightly from 51 percent in 2020. The risks to the outlook are weighted heavily to the downside. They include uncertainty over progress in containing the pandemic and the pace of vaccination, weak economic recovery in key trading partners like the Russian Federation, geo-political fragility, and heightened political uncertainty.
TABLE 2 Armenia / Macro poverty outlook indicators (annual percent change unless indicated otherwise)
2018 2019 2020 e 2021 f 2022 f 2023 fReal GDP growth, at constant market prices 5.2 7.6 -7.6 3.4 4.3 5.3
Private Consumption 4.9 11.7 -14.0 4.9 4.1 5.0Government Consumption -3.0 12.5 15.6 -0.6 1.1 2.4Gross Fixed Capital Investment 4.8 4.4 -8.6 2.3 5.2 5.4Exports, Goods and Services 5.0 16.0 -31.4 8.7 12.2 12.6Imports, Goods and Services 13.3 12.0 -32.1 8.3 9.2 9.7
Real GDP growth, at constant factor prices 4.9 7.6 -7.3 3.4 4.3 5.3Agriculture -6.9 -2.6 -4.0 1.3 2.2 3.5Industry 3.7 7.1 -2.8 1.2 2.4 3.8Services 9.0 10.4 -10.2 5.1 5.8 6.4
Inflation (Consumer Price Index) 2.5 1.4 1.2 3.5 3.8 4.0Current Account Balance (% of GDP) -6.9 -7.2 -4.2 -4.8 -5.5 -6.4Net Foreign Direct Investment (% of GDP) 2.0 2.9 1.2 1.8 2.3 2.6Fiscal Balance (% of GDP) -1.6 -0.8 -5.1 -5.3 -3.8 -3.5Debt (% of GDP) 55.7 53.5 67.3 70.8 70.6 70.0Primary Balance (% of GDP) 0.7 1.6 -2.4 -2.6 -1.7 -1.4International poverty rate ($1.9 in 2011 PPP)a,b,c 1.4 1.1 1.3 1.3 1.1 0.7Lower middle-income poverty rate ($3.2 in 2011 PPP)a,b,c 9.4 9.8 13.2 11.7 10.2 8.5Upper middle-income poverty rate ($5.5 in 2011 PPP)a,b,c 42.5 44.0 51.7 48.3 45.0 40.6Source: World Bank, Poverty & Equity and M acroeconomics, Trade & Investment Global Practices.Notes: e = estimate, f = forecast.NA(a) Calculations based on ECAPOV harmonization, using 201 9-ILCS.Actual data: 201 9. Nowcast: 2020. Forecast are from 2021 to 2023.(b) Projection using neutral distribution (201 9) with pass-through = 1 based on GDP per capita in constant LCU. (c) The poverty rates for 201 9 are not strictly comparable with 201 8 due to revisions on the I LCS starting in 201 9.

Selected Country Pages ● 115
44 MPO Apr 21
Key conditions and challenges Azerbaijan is an upper-middle-income economy rich in hydrocarbon resources. Since the 2000s, inflows of FDI to the oil and natural gas sectors have driven a surge in exports, propelling economic growth and reducing poverty. However, economic performance has stalled in recent years as hydrocarbon production plateaued and prices fell, revealing sys-temic macroeconomic and structural challenges. A large state footprint, a small and fragile financial sector, and weak institutions impede economic di-versification and the development of a vibrant private sector. Additionally, re-gional inequality persists, informality is widespread, and a considerable part of the population remains socially and eco-nomically vulnerable. Azerbaijan’s hu-man capital indicators lag its regional and income group peers. The country’s human capital constraints, which trans-late into a shortage of skilled labor, could worsen with more automation in the future. Simmering tensions with Armenia esca-lated into a military conflict in late 2020. In addition to a significant human toll, the conflict also inflicted high socio-economic and environmental costs. Nu-merous facilities, infrastructure and resi-dential areas were destroyed or dam-aged, and natural habitats devastated.
Recent developments In 2020, Azerbaijan was hit by the triple shocks of the COVID-19 pandemic, re-duced oil prices, and the armed conflict. The economy experienced its second re-cession since 2015, contracting by an esti-mated 4.3 percent. Three waves of COVID-19 induced lockdowns halted activity in nonhydrocarbon sectors, partic-ularly travel, hospitality, and domestic trade. The energy sector contracted by 7 percent, as adherence to OPEC+ oil pro-duction quotas slashed oil output. On the demand side, investment fell by 8.3 per-cent as business confidence plummeted. Private consumption was also affected, but wage hikes in late-2019 prevented a deeper slump. The lockdowns were successful in con-taining new coronavirus infections and easing pressures on the health care sys-tem. However, a spike in new cases fol-lowed the eventual relaxation of contain-ment measures, prompting the authorities to alternate between loosening and tight-ening restrictions throughout the year. Azerbaijan launched a COVID-19 vaccina-tion campaign using China’s Sinovac vac-cine in late January 2021. Azerbaijan’s consolidated budget record-ed a large deficit of 6.5 percent of GDP in 2020, as revenues collapsed and spending rose, including to finance the pandemic policy response (estimated at 2.7 percent of GDP). The deficit was financed by State Oil Fund (SOFAZ) assets.
AZERBAIJAN
FIGURE 1 Azerbaijan / Nonoil GDP growth and Oil Price FIGURE 2 Azerbaijan / Official Poverty Rate and Unemploy-ment
Sources: State Statistical Committee, World Bank data, and World Bank staff estimates.
Source: State Statistical Committee. Note: The World Bank has not reviewed the official national poverty rates for 2013–19.
The COVID-19 pandemic and plunging oil prices and production drove Azerbai-jan’s economy into recession in 2020. Poverty is estimated to have risen as households experienced job losses and financial hardship. Azerbaijan’s economy is projected to recover gradually over the medium term, aided by the vaccination effort and increased public spending. However, downside risks remain acute and stem from the possibility of a slower-than-expected vaccine rollout, sluggish recovery in oil output, and persistent structural rigidities.
-6-4-202468101214
0
20
40
60
80
100
120
2012 2013 2014 2015 2016 2017 2018 2019 2020 2021 2022
Average Brent oil price (LHS) Non-oil GDP growth (RHS)
USD/bbl Percent
Table 1 2020Population, million 1 0.1
GDP, current US$ billion 42.5
GDP per capita, current US$ 4205.4
School enro llment, primary (% gross)a 97.9
Life expectancy at birth, yearsa 72.9
(a) WDI for school enrollment (201 9); life expectancy (201 8).
Source: WDI, M acro Poverty Outlook, and off icial data.Notes:
0
50
100
150
200
250
300
350
400
0
2
4
6
8
10
2010 2011 2012 2013 2014 2015 2016 2017 2018 2019 2020
Official poverty rate (LHS)Number of unemployed persons (ILO methodology) (RHS)
Percent of population Thousands of persons

116 ● World Bank ECA Economic Update Spring 2021
45 MPO Apr 21
A narrowing merchandise trade surplus, together with falling services receipts and rising capital outflows, resulted in a balance of payments deficit of 5.9 per-cent of GDP in the first nine months of 2020. The deficit was financed by in-creased sales of foreign exchange by SO-FAZ. Depressed domestic demand and a sta-ble exchange rate contained 12-month inflation to 2.7 percent in 2020. The Cen-tral Bank of Azerbaijan (CBA) cut the policy rate five times during the year, lowering it from 7.5 percent to 6.25 per-cent. Bank performance was uneven in 2020, suggesting that financial sector condi-tions remain fragile. Bank credit de-clined by 5 percent year on year owing to plummeting economic activity and the revocation of four banks’ operating li-censes. Deposits fell by 4.4 percent year on year as households and firms tapped their savings to weather the downturn. Household welfare deteriorated marked-ly in 2020. Poverty is estimated to have risen due to a rise in unemployment as-sociated with the recession. The number of unemployed increased by an estimat-ed 124,300 persons in 2020. Fiscal measures only partially mitigated the pandemic’s negative impact on house-holds.
Outlook Azerbaijan’s economic recovery is ex-pected to be gradual, with output return-ing to pre-COVID-19 levels only by end-2022. The early launch of Azerbaijan’s vaccination initiative and significantly higher public post-conflict reconstruction spending suggest that the recovery may materialize faster than previously antici-pated. In 2021, an acceleration of domestic de-mand will support economic growth, but this will be conditional on an improved health situation and increased public spending. Higher oil prices are forecast to narrow fiscal deficit and help current ac-count return to surplus. Beyond 2021, without major structural reforms, the pace of the economic revival is likely to be moderate owing to a protracted recovery in oil output and anticipated fiscal tight-ening (amid rising fiscal pressures). Inflation is projected to rise in the medium term as a recent administrative price hike passes through to prices more generally, and demand begins to recover. Once the government phases out measures to sup-port the financial sector, some banks are likely to experience a deterioration of cap-ital and profitability ratios.
Downside risks to this forecast will re-main substantial in the medium term. The existing oil market equilibrium is fragile and largely depends on the OPEC+ agree-ments. In addition, the evolution of the pandemic is still uncertain and will de-pend on the speed of the vaccine rollout. Finally, regional geopolitical risks will remain elevated in the foreseeable future. Significant SOFAZ reserves—over 100 percent of GDP at end-2020—will help shield the economy from these risks. The long-term poverty and inequality trajectory will depend on the severity and duration of the crisis. The longer the pan-demic’s duration, the deeper and broader the impact, particularly on employment and wages in the services sector, which would lead to more severe effects on household welfare and poverty. Azerbaijan’s recently announced 2030 national development vision outlines a renewed, long-run commitment to ad-dressing systemic macroeconomic, struc-tural, and governance challenges. Ad-dressing these challenges could unlock new nonhydrocarbon sources of economic growth and achieve sustainable, resilient, and inclusive development.
TABLE 2 Azerbaijan / Macro poverty outlook indicators (annual percent change unless indicated otherwise)
2018 2019 2020 e 2021 f 2022 f 2023 fReal GDP growth, at constant market prices 1.5 2.2 -4.3 2.8 3.9 3.4
Private Consumption 3.0 3.8 -5.1 3.7 3.6 3.5Government Consumption 1.5 7.9 4.0 4.7 3.6 3.6Gross Fixed Capital Investment -0.2 -3.1 -6.5 4.2 1.2 3.2Exports, Goods and Services 1.0 1.5 -8.1 2.1 4.1 2.3Imports, Goods and Services 1.5 2.2 -10.5 3.5 3.0 1.7
Real GDP growth, at constant factor prices 1.5 2.2 -4.4 2.8 3.9 3.4Agriculture 4.6 7.3 1.9 2.5 3.2 3.2Industry -0.7 0.4 -5.2 2.8 3.3 2.0Services 5.1 4.3 -4.4 2.9 5.1 5.7
Inflation (Consumer Price Index) 1.6 2.4 2.7 3.9 3.2 3.0Current Account Balance (% of GDP) 12.8 9.1 -1.0 2.8 3.9 3.1Net Foreign Direct Investment (% of GDP) -1.7 -2.9 -1.5 1.3 1.2 1.1Fiscal Balance (% of GDP) 5.6 9.0 -6.5 -2.5 2.8 4.0Debt (% of GDP) 18.9 18.9 18.2 17.1 16.7 16.5Primary Balance (% of GDP) 6.8 9.8 -5.7 -1.9 3.3 4.5Source: World Bank, Poverty & Equity and M acroeconomics, Trade & Investment Global Practices.Notes: e = estimate, f = forecast.NA

Selected Country Pages ● 117
48 MPO Apr 21
Key conditions and challenges Even before COVID-19, a lack of progress on reforms had already contributed to a sharp slowdown, with annual GDP growth averaging 0.5 percent since 2011. The COVID-19 outbreak and political tur-bulence following elections in August 2020 have further depressed household and investor sentiment and contributed to household deposit outflows and an 18-percent currency depreciation against the US$ during 2020. At the same time, policy support may lead to further erosion of already depleted fiscal and FX buffers, undermining macro-financial stability. The possible gradual relocation of the export-oriented ICT sector could affect services exports. Economic sanctions, if further imposed, are likely to increase the costs of doing business for selected ex-porters. Restoring economic confidence promptly is crucial, given the limited poli-cy buffers and large downside risks. Belarus’s incomplete transition to a market economy has saddled it with a low-productivity and highly-leveraged SOE sector, a weak and dollarized banking sec-tor, and heavy dependence on commodity exports. Per National Bank estimates, loans taken by large SOEs, sometimes with ques-tionable ability to be serviced on time, aver-aged 14 percent of GDP over the past sev-eral years. Given the share of FX debt on SOE balance sheets, currency depreciation and economic weakness have further
weakened bank asset quality over the past year. Over the medium-term, the challenge is to move towards an economy less dependent on oil processing that can be competitive as the implicit oil import price subsidies are withdrawn with the implementation of Russia’s “tax maneuver”. Anchoring fiscal sustainability in the medium term will require SOE restructuring, and ration-alization of the public sector wage bill and tax expenditures. A robust social safety net and expanded unemployment support will be critical for maintaining basic in-comes of vulnerable households and facil-itating reallocation of workers.
Recent developments In 2020, the economy contracted by 0.9 percent y/y, dragged back by external headwinds, which were only partially offset by demand-side policy measures. Disagreements with Russia on oil supply terms contributed to a 1.9 percent decline in real merchandize exports y/y during Q1-Q3 2020. The lack of mobility restrictions, coupled with subsidized lending to SOEs (about 1.6 percent of GDP) prevented a deeper contraction of industrial output, while sustained real wage growth sup-ported consumption. The current account deficit remained nearly balanced, as the trade surplus reached 3.2 percent of GDP. During the second half of 2020, forex de-posit withdrawals and forex demand by households put strong pressure on the currency and banking sector liquidity,
BELARUS
FIGURE 1 Belarus / FX Reserves and Currency Trends FIGURE 2 Belarus / Actual and projected poverty rates and real GDP per capita
Sources: Belstat, World Bank. Source: World Bank. Notes: see Table 2.
In 2020, the absence of mobility re-strictions and credit relief for state-owned enterprises prevented a deeper recession, while external financing needs and do-mestic foreign exchange pressures were met through a drawdown of reserves and debt financing. Amidst the ongoing politi-cal crisis and limited space for fiscal or monetary expansion, the outlook, in the absence of reforms, is for a deepening of the recession in 2021, and a slow recovery thereafter. Poverty rates are expected to stagnate at a low level.
2.5
3.5
4.5
5.5
6.5
7.5
8.5
9.5
10.5
2
4
6
8
10
12
14
2008 2010 2012 2014 2016 2018 2020
Corporates: FX deposits, US$ bnHouseholds: FX deposits, US$ bnGross international reserves, US$ bn rhs
Billions of USD BYN/USD Poverty rate (%) Real GDP per capita (LCU constant)
0
1000
2000
3000
4000
5000
6000
7000
8000
9000
0
5
10
15
20
25
30
2004 2006 2008 2010 2012 2014 2016 2018 2020 2022
Upper middle-income pov. rate Real GDP pc
Table 1 2020Population, million 9.4
GDP, current US$ billion 60.2
GDP per capita, current US$ 6371 .4
Upper middle-income poverty rate ($5.5)a 0.2
Lower middle-income poverty rate ($3.2) 25.3
School enro llment, primary (% gross)b 1 00.5
Life expectancy at birth, yearsb 74.2
(a) M ost recent value (201 9), 201 1 PPPs.(b) M ost recent WDI value (201 8).
Source: WDI, M acro Poverty Outlook, and off icial data.Notes:

118 ● World Bank ECA Economic Update Spring 2021
49 MPO Apr 21
accommodated by the spending of gross reserves (down 20.5 percent in 2020), and increasing banks’ liabilities to non-residents. The weakening currency con-tributed to an acceleration in headline inflation to 7.4 percent at end-2020 from 4.7 percent in 2019. To prevent additional currency pressures, the National Bank switched from the provision of overnight loans to weekly auctions. In February 2021, the government introduced broad-based price controls by capping monthly price increases on basic food items and drugs. For the first time since 2009, the general government budget shifted into a deficit: 1.2 percent of GDP. Tax revenues dropped by 2.6 percentage points (pp) of GDP, on lower revenues from profit tax and for-eign trade. Spending grew by 1.9pp of GDP as capital expenditures and public sector wages increased by 2pp and 0.6pp of GDP, respectively. External public debt repayment pressures were alleviated by issuances of Eurobonds (US$1.25bn), RUR-denominated bonds (US$135mln), and loans from Russia and the EFSD (totaling US$1 bn). Real household incomes grew by 4.6 per-cent in 2020 on account of higher real wages (8 percent y/y), though the pace of disposable income growth decreased in the latter half of 2020. While the national
poverty rate remained unchanged in 2020 at 4.8 percent, this outcome was due to favorable dynamics in the Minsk City, Minsk, and Grodno regions. In other are-as, rates went above 6 percent. PPP US$5.5/day poverty remained stable at a low level (less than 1 percent).
Outlook The outlook is for deepening recession during 2021 and weak recovery thereafter, assuming ongoing political tensions, con-tinued headwinds from the Russian “tax maneuver”, and lack of structural reforms. Recently announced tax increases – to contain the fiscal deficit and that of the pension system – will hurt an already struggling private sector, hit by the ab-sence of support during the COVID-19 shock. Elevated market interest rates and falling investor confidence will dampen domestic and foreign investment. Recent-ly introduced price controls are unlikely to contain inflation but in certain circum-stances might cause shortages of some goods. A GDP contraction of 2.2 percent is pro-jected in 2021. With weak domestic de-mand expected to persist, the recovery is expected to be modest in the medium
term; however, slow growth will also help to compress imports and the current ac-count deficit. The outlook is contingent on the availabil-ity of external financing. In 2021, external financing needs will be closed by a combi-nation of agreed debt refinancing from Russia and drawdown of reserves, and thus appears manageable. However, 2022-23 are more challenging, on account of repayments coming due of bilateral loans to Russia in 2022, and the principal repay-ments on Eurobonds and the nuclear power plant loan in 2023. The government’s ability to support vul-nerable households is expected to weaken as a result of limited fiscal space. Probably a decline in real wages and incomes will negatively affect household welfare. Yet, measured at the World Bank’s US$5.5/day threshold, the welfare impact is projected to be small, with poverty rates increasing by 0.1pp in 2021.
TABLE 2 Belarus / Macro poverty outlook indicators (annual percent change unless indicated otherwise)
2018 2019 2020 e 2021 f 2022 f 2023 fReal GDP growth, at constant market prices 3.1 1.4 -0.9 -2.2 1.9 1.2
Private Consumption 7.9 5.1 -3.8 -4.1 3.8 2.6Government Consumption -0.4 0.4 1.0 -1.2 0.6 0.3Gross Fixed Capital Investment 4.4 3.3 -3.9 -6.5 4.3 6.7Exports, Goods and Services 3.8 1.0 -2.0 2.1 3.0 3.8Imports, Goods and Services 7.3 5.2 -1.0 -1.1 5.5 7.2
Real GDP growth, at constant factor prices 3.2 1.5 -1.1 -2.1 1.9 1.2Agriculture -3.4 3.0 3.3 2.8 3.1 3.1Industry 5.2 1.4 -4.5 -6.7 3.5 3.3Services 2.9 1.3 0.8 0.3 0.6 -0.6
Inflation (Consumer Price Index) 4.9 4.7 7.4 8.2 6.1 5.7Current Account Balance (% of GDP) 0.0 -1.8 -0.3 -0.2 -1.4 -2.4Net Foreign Direct Investment (% of GDP) 2.4 2.0 0.0 0.0 0.0 0.0Fiscal Balance (% of GDP) 4.0 2.4 -1.2 -2.6 -1.1 -0.5Debt (% of GDP) 42.5 37.9 41.9 44.1 44.0 45.4Primary Balance (% of GDP) 5.9 4.2 0.8 -0.4 1.0 1.4Upper middle-income poverty rate ($5.5 in 2011 PPP)a,b 0.4 0.2 0.2 0.3 0.2 0.2Source: World Bank, Poverty & Equity and M acroeconomics, Trade & Investment Global Practices.Notes: e = estimate, f = forecast.NA(a) Calculations based on ECAPOV harmonization, using 201 9-HHS. Actual data: 201 9. Nowcast: 2020. Forecast are from 2021 to 2023.(b) Projection using neutral distribution (201 9) with pass-through = 0.7 based on GDP per capita in constant LCU.

Selected Country Pages ● 119
50 MPO Apr 21
Table 1 2020Population, million 3.3
GDP, current US$ billion 1 9.3
GDP per capita, current US$ 5892.7
School enro llment, primary (% gross)a
Life expectancy at birth, yearsa 77.3
(a) M ost recent WDI value (201 8).
Source: WDI, M acro Poverty Outlook, and off icial data.Notes:
Key conditions and challenges BiH has enjoyed macroeconomic stability over the last decade. However, pre-pandemic the pace of growth has been below that of peer countries in Europe and below what is needed to converge to EU living standards. BiH has not devel-oped the foundations for sustainable eco-nomic growth as its economic model re-mains out of balance. The economy is driven by consumption, rather than production. Investment is low, and the economy is inward-looking. Poverty rates have not improved accord-ing to the latest data available from 2015 and many people do not have a formal job –or, indeed, any job at all– which could cause many people to grow old in pov-erty. The pandemic has highlighted the chal-lenges of BiH's complex institutional set-up. Disbursing fiscal support to house-holds and businesses has been slow, which has weighed heavily on economic activity and could delay the recovery in 2021. Pressures from frequent elections in combination with slow implementation of structural reforms continue to hold back the country’s ability to return to growth. The immediate priority for BiH is to con-trol the pandemic and to minimize its economic and social impact. Addressing persistent unemployment and minimizing layoffs remain an important challenge and will be key to curbing emigration.
Recent developments Real GDP growth is projected at -4.0 per-cent in 2020 due to a slowdown in most productive sectors, a weaker external en-vironment and high political uncertainty. In 2020 growth was positive in Q1 but after the introduction of a lockdown and containment measures in Q2 the economy faced a sudden stop as domestic and ex-ternal demand dropped. By Q4 2020, economic activity had some-what improved, but growth remained in negative territory. Unemployment has recently worsened. According to official estimates, the num-ber of people in paid employment de-creased approximately 1 percent y-o-y in November 2020, while the number of un-employed increased by about 3 percent in the same period. Deeper labour market effects have been prevented by wage sub-sidy programs in both entities and other policy measures targeting affected eco-nomic sectors aimed to safeguard poten-tial job losses. As the economy has fallen into recession and with low oil prices deflation has re-turned. In December the consumer price index was down 1.6 percent year-on-year (y-o-y). In 2020, a fiscal deficit of 5.5 percent of GDP is expected, down from a surplus of 1.9 percent in 2019. In 2020, revenues fell main-ly due to the slump in tax revenue collec-tion, while expenditures rose mainly as a result of higher spending on public wages, goods and services and social benefits.
FIGURE 1 Bosnia and Herzegovina / Real GDP growth and contributions to real GDP growth
FIGURE 2 Bosnia and Herzegovina / Labor market indicators, 2020
Sources: BiH Agency for Statistics (BHAS), World Bank staff estimate. Sources: : LFS Q1 and Q2 2020 report, World Bank staff calculations.
Following a sharp contraction of 4 per-cent in 2020, economic activity is ex-pected to expand by 2.8 percent in 2021. As the world recovers from the COVID-19 crisis and with the implementation of the Economic Reform program, growth is expected to gradually recover. The ongo-ing crisis highlights the need to imple-ment long-delayed structural reforms to achieve faster recovery. Addressing per-sistent unemployment and countering the increase in layoffs that occurred during the pandemic is critical to reducing poverty.
BOSNIA AND HERZEGOVINA
-5
-4
-3
-2
-1
1
2
3
4
5
2018 2019 2020f 2021f 2022f 2023f
Percent, percentage points
Agriculture Industry Services GDP
47.1
39.3
16.7
47.1
39.6
16.0
0
5
10
15
20
25
30
35
40
45
50
Activity rate Emp. rate Unemp. rate
Percent Q1 2020 Q2 2020

120 ● World Bank ECA Economic Update Spring 2021
51 MPO Apr 21
The current account deficit is estimated to have worsened slightly in 2020 due to a drop in the services balance and re-mittances. Total public debt, consisting largely of concessional debt, has increased and is estimated at 40.6 percent of GDP, while the total external debt is estimated at 72 percent of GDP. Even during the pandemic, the financial sector has been broadly stable. On aver-age, banks are sufficiently capitalized and liquid, but their profitability is eroding. The latest available poverty data using the national poverty line is for 2015 and the poverty rate was estimated at 16 percent, very close to the 15 percent estimated for 2011. The slowdown in the economy and the consequent loss of people’s employment and earnings have negatively affected household welfare in 2020. Estimates show that many of those who may have been affected were not covered by social protection programs before the crisis.
Outlook The outlook is marked by the implemen-tation of measures to combat the pan-demic. Authorities are currently focused on securing vaccines. As the pandemic
subsides the Socio-Economic Program is expected to gain needed attention, mainly through the return of announced invest-ments in energy and infrastructure. Con-sumption will continue to drive growth, resulting in strong growth of imports. Remittances will recover in the medium term, and, together with progress on re-forms, will underpin a gradual pickup in consumption and finance a significant part of the trade deficit. Monetary policy anchored to the Euro will continue to sup-port local currency stability. Safe-guarding the banking sector will continue to be important in particular as the full impact of moratoria is yet to be assessed. Authorities have adopted budgets and secured funds to ensure necessary liquidity through credit lines via entity development banks to support affected businesses. As BiH does not have access to international markets, support from IFIs will be critical. As revenues recover BiH’s fiscal deficit will return to surplus over the medium term. A stronger push on the capital investment program will need to remain a high priori-ty for the authorities’ economic programs. Planned investments in energy, infrastruc-ture, and tourism will also support job cre-ation in those sectors after the crisis. As the pandemic loses force and the econ-omy gradually recovers in 2021, improve-ments in labor market participation and
employment will remain key for growth to translate into poverty reduction. There are several risks to the outlook but the main risk is a prolonged pandemic which could lead to lower growth rates in 2021 than projected. In addition, the chal-lenging political environment will affect the implementation of the adopted socio-economic program. The main external risk for BiH remains slow growth in the EU and political tensions in the region.
TABLE 2 Bosnia and Herzegovina / Macro poverty outlook indicators (annual percent change unless indicated otherwise)
2018 2019 2020 e 2021 f 2022 f 2023 fReal GDP growth, at constant market prices 3.1 2.9 -4.0 2.8 3.5 3.7
Private Consumption 2.4 2.8 -4.5 2.8 3.7 3.8Government Consumption 0.9 2.6 0.5 4.6 3.0 3.0Gross Fixed Capital Investment 6.3 2.9 -25.8 3.4 4.5 6.3Exports, Goods and Services 5.9 -0.3 -8.5 2.0 3.5 4.2Imports, Goods and Services 3.2 0.2 -13.4 3.0 3.7 4.5
Real GDP growth, at constant factor prices 3.7 2.8 -4.0 2.8 3.5 3.7Agriculture 9.1 2.9 -1.5 3.4 3.0 2.9Industry 3.8 1.9 -3.0 2.0 2.6 3.2Services 3.2 3.1 -4.7 3.1 3.9 4.0
Inflation (Consumer Price Index) 1.4 1.2 -0.5 0.7 0.7 0.8Current Account Balance (% of GDP) -3.7 -3.2 -3.7 -4.0 -4.7 -5.4Net Foreign Direct Investment (% of GDP) 2.2 2.9 2.1 3.5 3.6 3.5Fiscal Balance (% of GDP) 2.5 1.9 -5.5 -2.3 -0.9 0.9Debt (% of GDP) 36.4 34.6 40.6 39.9 39.3 39.4Primary Balance (% of GDP) 3.8 2.8 -4.2 -0.9 0.0 1.8Source: World Bank, Poverty & Equity and M acroeconomics, Trade & Investment Global Practices.Notes: e = estimate, f = forecast.NA
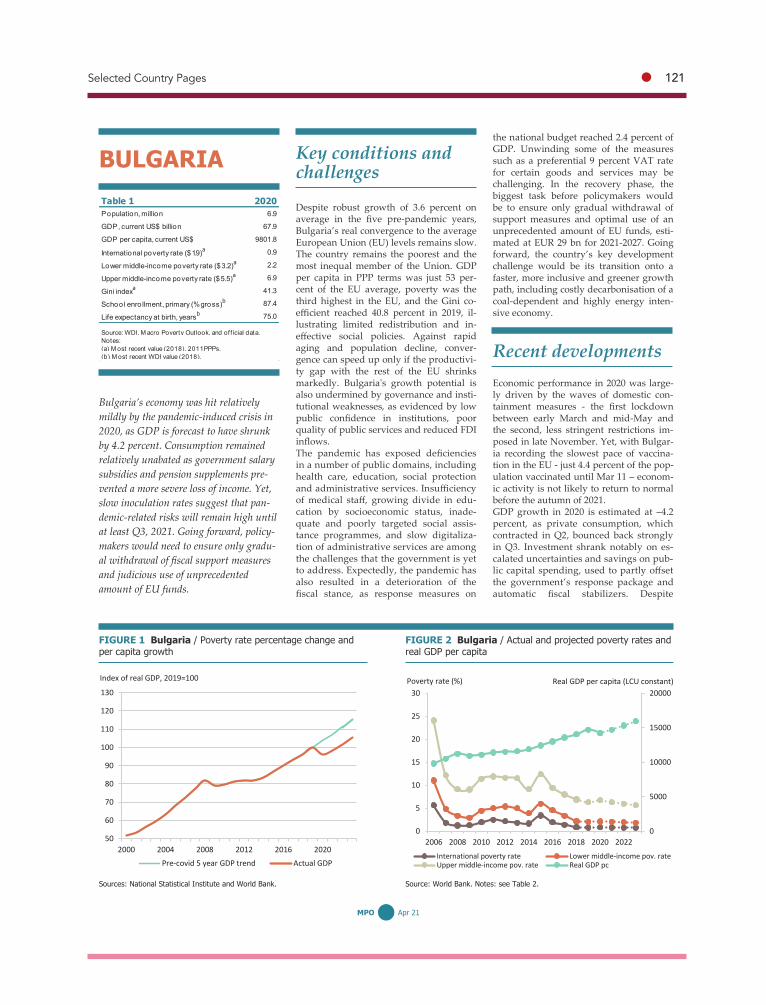
Selected Country Pages ● 121
52 MPO Apr 21
Key conditions and challenges Despite robust growth of 3.6 percent on average in the five pre-pandemic years, Bulgaria’s real convergence to the average European Union (EU) levels remains slow. The country remains the poorest and the most inequal member of the Union. GDP per capita in PPP terms was just 53 per-cent of the EU average, poverty was the third highest in the EU, and the Gini co-efficient reached 40.8 percent in 2019, il-lustrating limited redistribution and in-effective social policies. Against rapid aging and population decline, conver-gence can speed up only if the productivi-ty gap with the rest of the EU shrinks markedly. Bulgaria's growth potential is also undermined by governance and insti-tutional weaknesses, as evidenced by low public confidence in institutions, poor quality of public services and reduced FDI inflows. The pandemic has exposed deficiencies in a number of public domains, including health care, education, social protection and administrative services. Insufficiency of medical staff, growing divide in edu-cation by socioeconomic status, inade-quate and poorly targeted social assis-tance programmes, and slow digitaliza-tion of administrative services are among the challenges that the government is yet to address. Expectedly, the pandemic has also resulted in a deterioration of the fiscal stance, as response measures on
the national budget reached 2.4 percent of GDP. Unwinding some of the measures such as a preferential 9 percent VAT rate for certain goods and services may be challenging. In the recovery phase, the biggest task before policymakers would be to ensure only gradual withdrawal of support measures and optimal use of an unprecedented amount of EU funds, esti-mated at EUR 29 bn for 2021-2027. Going forward, the country’s key development challenge would be its transition onto a faster, more inclusive and greener growth path, including costly decarbonisation of a coal-dependent and highly energy inten-sive economy.
Recent developments Economic performance in 2020 was large-ly driven by the waves of domestic con-tainment measures - the first lockdown between early March and mid-May and the second, less stringent restrictions im-posed in late November. Yet, with Bulgar-ia recording the slowest pace of vaccina-tion in the EU - just 4.4 percent of the pop-ulation vaccinated until Mar 11 – econom-ic activity is not likely to return to normal before the autumn of 2021. GDP growth in 2020 is estimated at –4.2 percent, as private consumption, which contracted in Q2, bounced back strongly in Q3. Investment shrank notably on es-calated uncertainties and savings on pub-lic capital spending, used to partly offset the government’s response package and automatic fiscal stabilizers. Despite
BULGARIA
FIGURE 1 Bulgaria / Poverty rate percentage change and per capita growth
FIGURE 2 Bulgaria / Actual and projected poverty rates and real GDP per capita
Sources: National Statistical Institute and World Bank. Source: World Bank. Notes: see Table 2.
Bulgaria’s economy was hit relatively mildly by the pandemic-induced crisis in 2020, as GDP is forecast to have shrunk by 4.2 percent. Consumption remained relatively unabated as government salary subsidies and pension supplements pre-vented a more severe loss of income. Yet, slow inoculation rates suggest that pan-demic-related risks will remain high until at least Q3, 2021. Going forward, policy-makers would need to ensure only gradu-al withdrawal of fiscal support measures and judicious use of unprecedented amount of EU funds.
50
60
70
80
90
100
110
120
130
2000 2004 2008 2012 2016 2020Pre-covid 5 year GDP trend Actual GDP
Index of real GDP, 2019=100 Poverty rate (%) Real GDP per capita (LCU constant)
0
5000
10000
15000
20000
0
5
10
15
20
25
30
2006 2008 2010 2012 2014 2016 2018 2020 2022International poverty rate Lower middle-income pov. rateUpper middle-income pov. rate Real GDP pc
Table 1 2020Population, million 6.9
GDP, current US$ billion 67.9
GDP per capita, current US$ 9801 .8
International poverty rate ($1.9)a 0.9
Lower middle-income poverty rate ($3.2)a 2.2
Upper middle-income poverty rate ($5.5)a 6.9
Gini indexa 41 .3
School enro llment, primary (% gross)b 87.4
Life expectancy at birth, yearsb 75.0
(a) M ost recent value (201 8), 201 1 PPPs.(b) M ost recent WDI value (201 8).
Source: WDI, M acro Poverty Outlook, and off icial data.Notes:

122 ● World Bank ECA Economic Update Spring 2021
53 MPO Apr 21
the pandemic-induced crisis, tax and so-cial security revenues increased 1.6 per-cent nominally, possibly thanks to public sector salary increases and the growth of consumption in most of the year. Not-withstanding reduced capital spending, total expenditure grew by 5.8 percent y/y, due largely to the fiscal support measures. The budget deficit thus reached 3.0 per-cent of GDP (against 1 percent in 2019), while public debt picked up to estimated 25 percent against 20 percent at end-2019. The hardest hit sectors remain tourism and related activities. Overnight stays declined by some 56 percent y/y as foreign tourist arrivals fell markedly. This also showed its impact on external balances, as export of services declined by 32 percent y/y. As a result, the current account sur-plus shrank to 0.1 percent of GDP in 2020. The imposition of containment measures led to substantial disruptions to work in the form of work stoppages and reduced hours, though this was not reflected in headline unemployment that increased only moderately. Though the govern-ment’s salary subsidies and pension sup-plements helped stabilize incomes for some individuals, work disruptions and higher food prices is projected to have led to a moderate increase in the poverty rate from 6.3 percent in 2019 to 6.8 percent in
2020 using the upper middle income pov-erty line of US$5.50 PPP per day. Outlook The biggest risks to the outlook stem from the epidemiology of the virus and the government’s vaccination program. The latter hinges not only on the availability of vaccines and the organization of a well-paced vaccination process, but also on the population’s perceptions towards vaccina-tion. Skepticism against vaccines remains high and may decrease only with a strong-er pro-vaccination campaign. Bulgaria is projected to grow by 2.6 per-cent in 2021 and reach its pre-crisis (2019) level of real output in 2022. The baseline scenario assumes that vaccination in Bul-garia will gain momentum in Q2 and Q3, which will gradually help restore consum-er and business confidence. With expecta-tions of reduced infection rates in the summer and increased inoculation in Bul-garia’s main market, the EU, external sales of goods are likely to recover but tourism is expected to remain below pre-crisis levels. Drawdowns on the EU Recovery and Resilience Facility are not expected before Q4/2021, with limited impact on this
year’s investment and growth. Even if non-performing loans have risen moderately until December, 2020 (from 6.5 percent a year ago to 7.4 percent) and the banking sector remains well capitalized, NPL lev-els may pick up more steeply after the current moratorium on bank loan service is lifted. In addition to the pandemic-related chal-lenges, upcoming general elections in ear-ly April also add to the uncertainties. Swift formation of a new government would be a prerequisite for the smooth continuity of fiscal response measures and the restoration of investor confidence as vaccination gains momentum. Delivery on the fiscal consolidation plans also hinges on the outcome of election. Barring any unforeseen developments with the COVID-19 virus and under the assumption of high vaccination rates, pov-erty is projected to decline in 2021 to 6.3 percent as a result of an improved econo-my facilitating favorable labor market conditions and normalized food inflation.
TABLE 2 Bulgaria / Macro poverty outlook indicators (annual percent change unless indicated otherwise)
2018 2019 2020 e 2021 f 2022 f 2023 fReal GDP growth, at constant market prices 3.1 3.7 -4.2 2.6 3.3 3.4
Private Consumption 4.4 5.5 0.2 2.6 2.8 3.1Government Consumption 5.4 2.0 7.0 0.8 1.1 0.5Gross Fixed Capital Investment 5.4 4.5 -5.1 3.2 6.3 5.6Exports, Goods and Services 1.7 3.9 -11.3 7.1 6.4 5.8Imports, Goods and Services 5.7 5.2 -6.6 6.5 6.0 5.1
Real GDP growth, at constant factor prices 3.5 3.3 -4.3 2.6 3.3 3.4Agriculture -2.0 4.1 -5.3 3.4 1.0 0.5Industry -1.1 -0.5 -4.6 3.7 4.0 3.9Services 5.8 4.6 -4.2 2.1 3.2 3.5
Inflation (Consumer Price Index) 2.8 3.1 1.7 3.2 3.3 3.4Current Account Balance (% of GDP) 1.0 3.0 0.1 1.8 2.5 2.4Net Foreign Direct Investment (% of GDP) -1.4 -1.3 -0.7 -1.7 2.1 1.9Fiscal Balance (% of GDP) 0.1 -1.0 -3.0 -1.9 -1.5 -0.9Debt (% of GDP) 22.3 20.2 25.3 26.6 26.7 26.0Primary Balance (% of GDP) 0.8 -0.4 -2.6 -1.7 -1.2 -0.5International poverty rate ($1.9 in 2011 PPP)a,b 0.9 0.8 0.9 0.8 0.7 0.7Lower middle-income poverty rate ($3.2 in 2011 PPP)a,b 2.2 2.0 2.1 2.0 2.0 1.8Upper middle-income poverty rate ($5.5 in 2011 PPP)a,b 6.9 6.3 6.8 6.3 6.0 5.6Source: World Bank, Poverty & Equity and M acroeconomics, Trade & Investment Global Practices.Notes: e = estimate, f = forecast.NA(a) Calculations based on ECAPOV harmonization, using 201 8-EU-SI LC.Actual data: 201 8. Nowcast: 201 9-2020. Forecast are from 2021 to 2023.(b) Projection using neutral distribution (201 8) with pass-through = 0.87 based on GDP per capita in constant LCU.

Selected Country Pages ● 123
54 MPO Apr 21
Key conditions and challenges The large reliance on tourism has made Croatia highly vulnerable to adverse ex-ternal shocks such as the current pandem-ic. GDP contraction in Croatia in 2020, at -8.4 percent, was one of the largest in the EU. The country also suffered from two devastating earthquakes, in March and December 2020. Going forward, generous EU funding through various initiatives should play a key role in supporting the country’s economic recovery. However, Croatia will need to use such funds appro-priately for both reforms and investment, to maximize the benefits of such financing. While the vaccination program has start-ed, the situation remains highly uncertain because of vaccine supply bottlenecks, its effectiveness on new virus variants, and uptake levels among the population. At 65.2 percent of the EU27 GDP per capi-ta in 2019 (PPP), Croatia still lags behind EU peers. Strengthening long-term growth is critical to accelerate the income convergence. This will require a diversifi-cation of the economy towards more knowledge-based sectors and addressing the economy’s structural issues, including public sector governance, education out-comes and the efficiency of the judiciary. On the fiscal front, the surge in public debt in 2020, reflecting the economic downturn and a large fiscal stimulus package, calls for fiscal prudence and efforts to increase the effectiveness and
efficiency of public spending over the coming years.
Recent developments Economic activity continued to recover at the end of the last year from a drop expe-rienced during the first half of 2020. How-ever, the pace of recovery was much slow-er compared to the summer months due to the reintroduction of social distancing measures. Overall, Croatia’s real GDP is estimated to have contracted by 8.4 per-cent in 2020. The tourism sector bore the brunt of the impact, which was reflected in a sharp drop in export of services. De-cline in exports of goods was, on the other hand, relatively moderate following re-covery towards the end of the year. Pri-vate consumption and investment also strengthened in the second half of 2020, which further helped in cushioning the annual decline in the manufacturing sec-tor, while construction activity continued to increase in 2020. Due to a sharp deterioration in the trade deficit, the current account balance is esti-mated to have fallen to -1.3 percent of GDP in 2020, after six years of surpluses. As a result of the fiscal stimulus, the de-cline in employment was relatively mod-est, and administrative unemployment averaged 9 percent, 1.3 percentage points higher than in 2019. Fiscal support measures together with decline in eco-nomic activity led to a surge in public debt, estimated at 87.2 percent of GDP in 2020.
CROATIA
FIGURE 1 Croatia / Real GDP growth and contributions to real GDP growth
FIGURE 2 Croatia / Actual and projected poverty rates and real GDP per capita
Sources: CROSTAT, World Bank. Source: World Bank. Notes: see notes to Table 2.
As for most countries in Europe, the end of 2020 saw a surge of COVID-19 infections and the reintroduction of social distancing restrictions in Croatia. The country also suffered from a second devastating earth-quake in December last year. Progress on vaccination should allow for reopening poli-cies, resulting in a gradual recovery of the Croatian economy led by the tourism sector. GDP is projected to increase by 4.7 percent in 2021, enabling poverty to return to a downward trend.
Poverty rate (%) Real GDP per capita (LCU constant)
0
20000
40000
60000
80000
100000
120000
0
2
4
6
8
2009 2011 2013 2015 2017 2019 2021 2023International poverty rate Lower middle-income pov. rateUpper middle-income pov. rate Real GDP pc
-10-8-6-4-202468
2014 2015 2016 2017 2018 2019 2020e 2021f 2022f 2023f
Final consumption Gross fixed capital formationChange in inventories Net exportsGDP growth
Percent, percentage points
Table 1 2020Population, million 4.0
GDP, current US$ billion 56.8
GDP per capita, current US$ 1 41 01 .4
International poverty rate ($1.9)a 0.5
Lower middle-income poverty rate ($3.2)a 0.8
Upper middle-income poverty rate ($5.5)a 2.4
Gini indexa 29.8
School enro llment, primary (% gross)b 94.6
Life expectancy at birth, yearsb 78.1
(a) M ost recent value (201 8), 201 1 PPPs.(b) M ost recent WDI value (201 8).
Source: WDI, M acro Poverty Outlook, and off icial data.Notes:

124 ● World Bank ECA Economic Update Spring 2021
55 MPO Apr 21
The degree of expansionary monetary policy increased, and the liquidity of the banking sector reached historical highs. Also, the NPLs ratio remained stable. This, however, can be partly explained by regulatory relief and agreed moratorium on credit obligations and should therefore be monitored closely. Results from the second round of the Rap-id Household Assessment conducted in December indicate low-wage earners con-tinue to be more affected by the crisis than those in the top income brackets. Also, nearly 30 percent of Croatian households reported an annual reduction in overall income in 2020 and approximately 80 per-cent of households indicate inadequate savings to weather the shock from the prolonged pandemic. The situation is more challenging for poor and rural households. Poverty is estimated to have increased to 2.6 percent in 2020 – or ap-proximately 14,000 additional Croatian living on less than $5.5 a day at 2011 PPP prices.
Outlook Economic activity in Croatia is projected to gradually recover from the downturn expe-rienced in 2020 growing at the average
annual rate of 4.5 percent in the 2021-2023 period. Implementation of the vaccination strategy and epidemiological measures in Croatia and Europe are expected to put the pandemic under control by the summer of 2021 allowing countries to partially lift travel restrictions. For Croatia this would result in an increase in tourist arrivals, and together with the recovery of its trad-ing partners, would lead to strong growth of exports of goods and services. Invest-ments are projected to be supported by EU funds, including for earthquake recon-struction. Although a pick-up in inflation that could reach 1.8 percent by 2023 will weigh in on real incomes, improved household sentiment and gradual labor market recovery could result in strength-ening of personal consumption. The eco-nomic situation in Croatia is likely to con-tinue improving till the end of the forecast horizon as the pandemic abates, and with increased uptake of EU funds. The current account balance is projected to return to surplus (estimated at 2.2 percent of GDP in 2023), following trade deficit improve-ments. Continued increase in economic activity and phasing-out of the fiscal sup-port measures should reduce the fiscal deficit and bring public debt below 80 percent of GDP by 2023. The gradual rebound of the economy is expected to reduce poverty. However,
the compounded impacts of the crisis and the low savings rate among working poor households could mean a longer recovery process for this vulnerable group com-pared to others. Poverty is estimated to return to the pre-crisis level of 2.2 percent by 2021 and fall further to 2.0 percent by 2023. The risks for the forecast are tilted to the downside reflecting possible prolongation of the pandemic and related travel re-strictions as well as phasing out the fiscal support measures that could lead to a rise in unemployment. This would weaken the recovery and slow down the fall in the poverty.
TABLE 2 Croatia / Macro poverty outlook indicators (annual percent change unless indicated otherwise)
2018 2019 2020 e 2021 f 2022 f 2023 fReal GDP growth, at constant market prices 2.8 2.9 -8.4 4.7 4.9 4.0
Private Consumption 3.3 3.5 -6.2 2.8 3.0 3.0Government Consumption 2.3 3.4 2.0 2.4 2.2 2.2Gross Fixed Capital Investment 6.5 7.1 -2.9 6.0 6.3 6.5Exports, Goods and Services 3.7 6.8 -25.0 14.2 15.4 6.3Imports, Goods and Services 7.5 6.3 -13.8 9.7 11.2 5.2
Real GDP growth, at constant factor prices 2.6 2.5 -6.3 4.7 4.9 4.0Agriculture 6.2 1.2 3.7 2.4 2.4 2.4Industry 1.4 2.3 -1.3 3.9 4.6 4.1Services 2.8 2.7 -8.6 5.2 5.2 4.1
Inflation (Consumer Price Index) 1.5 0.8 0.2 0.9 1.7 1.8Current Account Balance (% of GDP) 1.8 2.8 -1.3 0.3 0.9 2.2Net Foreign Direct Investment (% of GDP) 1.6 2.0 2.2 2.1 1.9 1.8Fiscal Balance (% of GDP) 0.2 0.4 -7.2 -3.7 -2.3 -1.1Debt (% of GDP) 74.3 72.8 87.2 85.8 82.7 79.2Primary Balance (% of GDP) 2.5 2.6 -5.1 -1.6 -0.3 0.8International poverty rate ($1.9 in 2011 PPP)a,b 0.5 0.5 0.5 0.5 0.4 0.4Lower middle-income poverty rate ($3.2 in 2011 PPP)a,b 0.8 0.7 0.8 0.8 0.7 0.7Upper middle-income poverty rate ($5.5 in 2011 PPP)a,b 2.4 2.2 2.6 2.2 2.1 2.0Source: World Bank, Poverty & Equity and M acroeconomics, Trade & Investment Global Practices.Notes: e = estimate, f = forecast.NA(a) Calculations based on ECAPOV harmonization, using 201 8-EU-SI LC.Actual data: 201 8. Nowcast: 201 9-2020. Forecast are from 2021 to 2023.(b) Projection using neutral distribution (201 8) with pass-through = 0.87 based on GDP per capita in constant LCU.

Selected Country Pages ● 125
56 MPO Apr 21
Key conditions and challenges Georgia has a strong record of implement-ing economic reforms and raising the living standards of its citizens. Economic growth has been strong—averaging 5 percent per annum between 2005 and 2019—and pov-erty (national measure) declined rapidly to 19.5 percent in 2019, almost half its 2007 rate, spurred by sound macroeconomic policies and improving governance. How-ever, the economy has not created suffi-cient employment, and many Georgians remain engaged in low-productivity agri-cultural activities. Georgia’s export basket, which is relatively small and undiversified, underscores the economy’s incomplete structural transformation. Georgia’s human capital outcomes are also weak—learning outcomes and linkages to private sector needs are weak. The COVID-19 outbreak threatens to reverse Georgia’s past economic gains. Stringent measures, including curfews, a ban on public transport, lockdowns, and border closures, allowed the country to contain the pandemic’s spread in early 2020. However, the easing of measures in the summer contributed to a significant second surge in late 2020—Georgia be-came one of the 20 most affected coun-tries in the world in terms of reported cases per million population. The author-ities enacted a second strict lockdown from end-November to early February, leading to a reduction of COVID cases
and permitting a gradual reopening of the economy starting March 2021.
Recent developments The economy fell into recession in 2020, contracting by 6.2 percent. Following a strong start to the year, economic activity collapsed after March as the authorities introduced pandemic-related lockdown measures. The shock has been broad-based, but the transport, tourism, and construction sectors suffered the largest impacts. Job and income losses were se-vere. The unemployment rate reached 20.4 percent in the fourth quarter of 2020. More than one-third of the employed were una-ble to work at the peak of the restrictions. Poverty is estimated to have risen by 5.4 percentage points in 2020 (using the na-tional poverty line); even as government’s sizeable support package likely prevented an even greater increase in poverty. The economic shock also put pressure on the external accounts. The current account deficit reached 12 percent of GDP in the first nine months of 2020, driven by weak services exports as border closings halted tourist arrivals. The deficit was only par-tially offset by an improving net income balance and transfers from abroad—remittances remained resilient (this could, however, reflect the rising formalization of transfers)—and a narrowing trade defi-cit driven by import compression as do-mestic demand weakened. On the financ-ing side, substantial public borrowing fully financed the gap and allowed for
GEORGIA
FIGURE 1 Georgia / Real GDP growth and contributions to real GDP growth
FIGURE 2 Georgia / Poverty rate and GDP per capita
Sources: Geostat and WB staff calculations. Source: World Bank Note: see Table 2.
The COVID-19 pandemic hit Georgia hard. Mobility restrictions, a sudden halt to tourist arrivals, and weak external de-mand drove an estimated economic con-traction of 6.2 percent in 2020. The pov-erty rate increased by an estimated 5.4 percentage points. Job and income losses were severe. The fiscal deficit and public debt rose above statutory levels as the crisis put pressure on fiscal and external balances. The recovery will be gradual. The current forecast—with output recov-ering to pre-COVID levels in 2022—remains subject to considerable downside risks.
Table 1 2020Population, million 3.7
GDP, current US$ billion 1 5.9
GDP per capita, current US$ 4271 .7
International poverty rate ($1.9)a 3.8
Lower middle-income poverty rate ($3.2)a 1 4.9
Upper middle-income poverty rate ($5.5)a 42.0
Gini indexa 35.9
School enro llment, primary (% gross)b 99.3
Life expectancy at birth, yearsb 73.6
(a) M ost recent value (201 9), 201 1 PPPs.(b) WDI for school enrollment (201 9); life expectancy (201 8).
Source: WDI, M acro Poverty Outlook, and off icial data.Notes:
-10
-5
0
5
10
15
2014 2015 2016 2017 2018 2019 2020e 2021p 2022p 2023p
Gov. consumption Net ExportsInvestments Prv. ConsumptionReal GDP growth
Percent/percentage points Poverty rate (%) Real GDP per capita (LCU constant)
0
2000
4000
6000
8000
10000
12000
0
10
20
30
40
50
60
70
2004 2006 2008 2010 2012 2014 2016 2018 2020 2022International poverty rate Lower middle-income pov. rateUpper middle-income pov. rate Real GDP pc

126 ● World Bank ECA Economic Update Spring 2021
57 MPO Apr 21
reserves accumulation. Official reserves rose to $3.9 billion by the end of 2020 (representing nearly 5 months of goods and services imports). However, the exter-nal debt-to-GDP ratio jumped to 124 per-cent of GDP by end-September, up from 102 percent of GDP a year earlier. The government’s fiscal response to the pandemic—estimated at over 7 percent of GDP—drove a widening of the fiscal deficit in 2020, with government spending up by 19 percent year on year. Simultaneously, revenue collection fell by round about 4 percent compared to 2019. As a result, the fiscal deficit widened to 9.7 percent of GDP and public debt to over 60 percent of GDP, above the limits prescribed by the fiscal rule, triggering the rule’s escape clause. Support from development partners and stepped-up domestic debt issuance fully met the government’s financing needs. Annual inflation moderated in the second half of 2020 after reaching 7 percent in April 2020. A modest recovery of the lari and lower oil prices helped bring inflation down to 2.4 percent by end-2020 (this in-cludes 2 percentage point downward ad-justment owing to a government utility subsidy). The National Bank of Georgia (NBG) responded by lowering its policy rate by 100 basis points between April and August to 8 percent, keeping it steady through February.
The banking sector remained profitable in 2020 despite the frontloading of potential losses in March, as mandated by the NBG. The share of nonperforming loans rose to 2.6 percent in 2020 from 1.9 percent in 2019. An-nual credit growth moderated but remained robust at 13 percent in December 2020.
Outlook Georgia’s economy is projected to recover in 2021, growing by 4 percent, with the key baseline assumption that there are no further severe waves of COVID-19 infec-tions that necessitate additional lock-downs and ongoing political impasse is resolved. The recovery will be supported by fiscal stimulus in the form of accelerat-ed capital spending, tax deferrals, acceler-ated VAT refunds, and targeted support for the most affected businesses, as well as higher social spending. The fiscal deficit is expected to remain elevated at around 7 percent of GDP in 2021. The external deficit is expected to narrow in 2021 compared to 2020. Still, it will re-main high at about 11 percent of GDP as the services sector recovers gradually, and import flows pick up in line with firming economic activity. Recovering FDI and sustained support from international
financial institutions are expected to cover Georgia’s external financing needs and help maintain a comfortable reserves cushion. The pace of recovery beyond 2021 will be contingent on vaccine rollout and the res-toration of international trade and invest-ment. Under a baseline scenario in which no third wave of infections materializes and a significant share of the population is vaccinated by 2022, economic growth could recover to 5.0 percent in 2022 and 2023. The baseline scenario projects that the fiscal deficit will narrow to reach the levels prescribed by the fiscal rule (3 per-cent of GDP) by 2023. The pandemic’s impact on poverty and inequality will depend on the severity and duration of the crisis and the policy response. Under the baseline scenario, the poverty rate is expected to decline gradually, returning to pre-crisis levels by 2023. Delayed vaccinations, further restrictions and prolonged political tensions represent the key downside risks to this outlook. Either scenario could lead to a slower re-covery in 2021 and a more modest recovery in the medium term, with output not re-turning to pre-COVID levels until 2024. A delayed recovery could also pose risks to macro-financial stability, given Georgia’s high rate of dollarization, unhedged bal-ance sheets, and high gross external debt.
TABLE 2 Georgia / Macro poverty outlook indicators (annual percent change unless indicated otherwise)
2018 2019 2020 e 2021 f 2022 f 2023 fReal GDP growth, at constant market prices 4.8 5.0 -6.2 4.0 5.0 5.0
Private Consumption 5.8 7.2 -4.0 2.2 4.0 5.2Government Consumption 1.6 5.7 11.8 0.7 -2.4 -3.7Gross Fixed Capital Investment 1.9 -0.1 -8.3 4.4 10.5 6.8Exports, Goods and Services 10.1 9.8 -30.2 20.9 10.0 9.7Imports, Goods and Services 10.3 6.6 -19.2 11.5 7.3 7.1
Real GDP growth, at constant factor prices 5.2 5.1 -5.9 3.7 5.1 5.0Agriculture 13.8 -0.6 3.6 0.7 2.1 2.6Industry 0.2 2.7 -2.8 3.6 3.8 3.6Services 5.8 6.4 -7.7 4.0 5.8 5.6
Inflation (Consumer Price Index) 2.6 5.0 5.3 4.0 3.0 3.0Current Account Balance (% of GDP) -6.8 -5.5 -12.0 -11.0 -9.4 -7.9Net Foreign Direct Investment (% of GDP) 5.3 5.9 4.3 5.5 6.8 6.4Fiscal Balance (% of GDP) -2.6 -3.4 -9.7 -7.5 -4.4 -3.0Debt (% of GDP) 41.4 41.8 62.5 62.5 61.1 59.8Primary Balance (% of GDP) -1.4 -2.2 -8.2 -5.7 -2.9 -1.4International poverty rate ($1.9 in 2011 PPP)a,b 4.5 3.8 4.5 4.0 3.6 2.9Lower middle-income poverty rate ($3.2 in 2011 PPP)a,b 15.5 14.9 17.0 15.5 13.7 11.8Upper middle-income poverty rate ($5.5 in 2011 PPP)a,b 42.5 42.0 45.7 43.2 40.0 36.7Source: World Bank, Poverty & Equity and M acroeconomics, Trade & Investment Global Practices.Notes: e = estimate, f = forecast.NA(a) Calculations based on ECAPOV harmonization, using 201 9-HIS. Actual data: 201 9. Nowcast: 2020. Forecast are from 2021 to 2023.(b) Projection using neutral distribution (201 9) with pass-through = 1 based on GDP per capita in constant LCU.

Selected Country Pages ● 127
58 MPO Apr 21
Table 1 2020Population, million 1 8.7
GDP, current US$ billion 1 59.8
GDP per capita, current US$ 8528.4
Upper middle-income poverty rate ($5.5)a 4.6
Gini indexa 27.8
School enro llment, primary (% gross)b 1 04.4
Life expectancy at birth, yearsb 73.2
(a) M ost recent value (201 8), 201 1 PPPs.(b) WDI for school enrollment (201 9); life expectancy (201 8).
Source: WDI, M acro Poverty Outlook, and off icial data.Notes:
Key conditions and challenges Since independence in 1991, Kazakhstan has experienced remarkable economic performance. Rapid growth, fueled by structural reforms, tapping of abundant hydrocarbon resources, strong domestic demand, and FDI has helped reduce pov-erty and transform the country into an upper middle-income economy. However, productivity growth has weak-ened, averaging close to zero percent over the past decade, slowing down the pace of economic growth. Over-dependence on hydrocarbons makes the economy vulner-able to external shocks, as nearly 70 per-cent of country’s export earnings comes from crude oil. Half of country’s popula-tion lives in rural, sparsely populated, and economically isolated areas with poor access to public services and vulnerability to poverty. The COVID-19 pandemic is likely to exacerbate the economic and so-cial vulnerabilities. To support strong, sustainable, and inclu-sive economic recovery, the authorities need to advance structural reforms while dealing effectively with the pandemic. The policy imperatives are multifold. The first policy priority is to diversify the economic base by improving competitiveness of the non-oil and gas sectors, including through reforms in the financial sector and invest-ment policies. The second priority is to limit the outsized role of SOEs, enhance competition and create a level playing
field for the private sector. The third prior-ity is to improve the quality and progres-sivity of public spending to address ine-quality. Finally, it would be essential to strengthen public sector institutions and reinforce the rule of law to attract much-needed investment in the non-extractive sector.
Recent developments The coronavirus pandemic and the col-lapse in exports have taken a severe toll on the Kazakh economy. GDP fell for the first time in two decades, down by 2.6 percent in 2020. The nationwide mobility restrictions over COVID-19 led to a con-traction in consumer demand and invest-ment. Consumer demand fell 5.0 percent along with a drop in retail trade, while investment dropped by 3.4 percent, large-ly because of a sharp fall in FDI. Economic activity experienced a severe contraction in April-June of 2020, at the peak of re-strictions, followed by a growth rebound in manufacturing, trade and transporta-tion services in the second half of the year. A sharp fall in exports and commensu-rate reduction in imports left the current account balance broadly unchanged at 3.4 percent of GDP in 2020. NBK reserves rose by almost $6.7 bln. in December to reach $35.6 bln. because of higher gold prices, despite heavy FX market interven-tions. The tenge fell by 15 percent against the dollar by April 2020 because of the collapse in oil prices but has since re-gained a third of its losses following the
KAZAKHSTAN
FIGURE 1 Kazakhstan / Real GDP growth and contribution to real GDP growth
FIGURE 2 Kazakhstan / Actual and projected poverty rates and real GDP per capita
Sources: Statistical Office of Kazakhstan; World Bank staff estimates. Source: World Bank. Note: see Table 2.
GDP fell by 2.6 percent in 2020 due to reduced domestic demand and mobility and health safety restrictions brought about by the COVID-19 crisis and the collapse in exports. Inflation moved up driven by higher food prices and tenge depreciation. With employment and in-comes negatively affected, the poverty rate increased to 14 percent in 2020. Growth is likely to bounce back in 2021 as disrup-tions associated with the pandemic dissi-pate and external demand picks up. The pace of recovery remains vulnerable to the course of the pandemic.
Poverty rate (%) Real GDP per capita (LCU constant)
0
100000
200000
300000
400000
500000
600000
700000
800000
900000
0
10
20
30
40
50
60
2005 2007 2009 2011 2013 2015 2017 2019 2021 2023
Upper middle-income pov. rate Real GDP pc
-4
-2
0
2
4
6
8
2018 2019 2020e 2021f 2022f
Consumption InvestmentNet exports Real GDP growth
Percent/percentage points

128 ● World Bank ECA Economic Update Spring 2021
59 MPO Apr 21
pickup in oil prices and FX interventions by NBK. The government responded early to the COVID-19 crisis and introduced a fiscal stimulus package in the size of about 6 percent of GDP directed to SMEs and households. As a result, budget spending surged to an estimated 23.2 percent of GDP from a pre-crisis 19.5 percent. To fund the anti-crisis package, the govern-ment reallocated existing budgetary funds, tapped into Oil Fund reserves and scaled up domestic borrowing. The budg-et deficit rose to 4.0 percent of GDP from a 1.8 percent a year earlier, and public debt moved up to 24.4 percent of GDP. In February 2021, inflation rose to 7.4 per-cent y-o-y, up from 6.0 percent a year ear-lier, largely because of 11.6 percent in-crease in food prices in January. Higher inflation also reflects the impact of the tenge depreciation. Despite higher infla-tion, the National Bank (NBK) kept its policy rate at 9.0 percent in January 2021. Despite the crisis, the banking sector rec-orded a positive return to assets of 2.3 percent, thanks to strong growth in con-sumer loans, while corporate lending re-mained subdued. Nonperforming loans (NPLs) remained little changed at 6.8 per-cent of the loan portfolio in December. Government support measures, such as loan guarantees, moratoria, and subsi-dized loans helped halt mass corporate
insolvencies during the lockdown. Howev-er, the true size of NPLs might emerge high-er than officially reported after the pandem-ic, when support measures taper off. In 2020, the official unemployment rate changed little from a pre-pandemic level. However, the rate of temporary leave, es-pecially among low-income workers, rose sharply during the national lockdowns. As a result, poverty rate is estimated to have increased to 14 percent in 2020.
Outlook Economic growth is expected to rebound in 2021, driven by resumption of domestic activity, recovery in global demand for oil, continued fiscal support measures, and a successful national inoculation against the COVID-19 virus. With the continued pace of recovery, the economy is expected to grow within 3.0-4.0 percent range in 2021. Private consumption spending is likely to pick up in 2021, driven by the release of pent-up demand as incomes rebound and retail lending continue apace. Higher de-mand for housing is expected to support residential investment, as government program would allow pensioners to use some their savings to purchase a house or pay down mortgages.
The government is likely to continue an expansionary fiscal stance in 2021 due to rising spending on social assistance, edu-cation, and infrastructure. The nonoil defi-cit is projected to decline to nearly 9.0 per-cent of GDP in 2021 but remain above the mid-term target of 6 percent. Government debt is likely to increase to 27 percent of GDP due to higher domestic borrowing and disbursement of external loans to finance the deficit. Inflation is expected to moderate in 2021, as supply disruptions and the crisis pre-cautionary food buying wane. However, an expansionary fiscal stance with signifi-cant direct lending provisions can sustain pressure on inflation. The current account deficit is projected to improve modestly, supported by stronger exports thanks to higher oil prices and rebound in global demand for oil and a gradual pick up in imports. Despite growth recovery, poverty rate is expected to decrease gradually before reaching to a pre-crisis level of welfare. However, economic recovery could lose momentum if the progress on vaccination slows, mobility restrictions last longer, public investments delayed, and external demand is weaker than expected. Busi-ness insolvencies and layoffs could hit incomes, increase poverty, and expose the banking sector to higher NPLs.
TABLE 2 Kazakhstan / Macro poverty outlook indicators (annual percent change unless indicated otherwise)
2018 2019 2020 e 2021 f 2022 f 2023 fReal GDP growth, at constant market prices 4.1 4.5 -2.6 3.2 3.5 4.3
Private Consumption 5.3 5.8 -5.0 4.2 3.4 3.7Government Consumption -14.0 15.5 14.2 -0.3 1.4 1.4Gross Fixed Capital Investment 4.6 11.9 -3.4 3.5 3.5 4.0Exports, Goods and Services 11.5 2.2 -2.6 2.5 3.1 4.0Imports, Goods and Services 3.2 11.6 -2.3 4.7 3.1 3.5
Real GDP growth, at constant factor prices 4.1 4.5 -2.5 3.4 3.4 4.3Agriculture 3.2 0.9 2.6 2.4 2.6 2.6Industry 4.1 3.8 -1.5 2.9 3.3 5.0Services 4.2 5.3 -3.7 3.8 3.6 4.1
Inflation (Consumer Price Index) 6.2 5.3 6.8 6.2 5.4 5.0Current Account Balance (% of GDP) 0.0 -3.6 -3.4 -2.4 -1.1 1.1Net Foreign Direct Investment (% of GDP) 2.8 3.2 2.2 2.5 4.9 4.5Fiscal Balance (% of GDP) -1.1 -1.5 -4.0 -3.8 -1.8 -1.6Debt (% of GDP) 20.7 19.8 24.4 26.8 27.1 27.1Primary Balance (% of GDP) -0.2 -0.5 -3.0 -3.0 -0.8 -0.6Upper middle-income poverty rate ($5.5 in 2011 PPP)a,b 4.6 4.0 14.2 12.9 11.6 9.7Source: World Bank, Poverty & Equity and M acroeconomics, Trade & Investment Global Practices.Notes: e = estimate, f = forecast.NA(a) Calculations based on ECAPOV harmonization, using 201 8-HBS.Actual data: 201 8. Nowcast: 201 9-2020. Forecast are from 2021 to 2023.(b) Projection using neutral distribution (201 8) with pass-through = 0.87 based on GDP per capita in constant LCU.
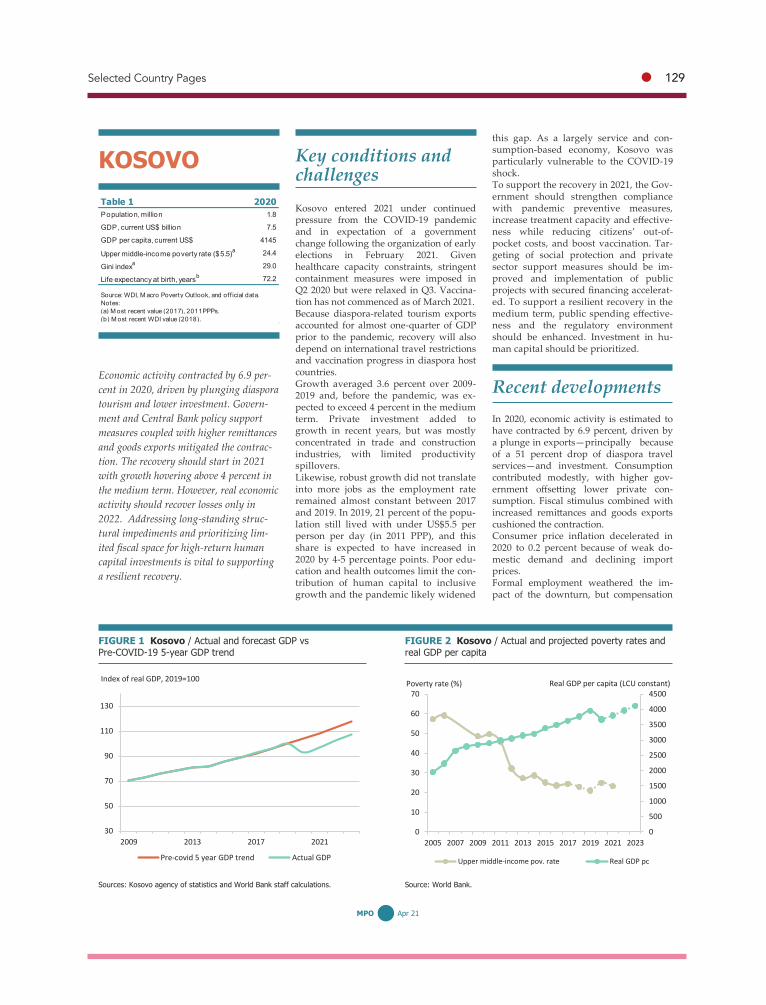
Selected Country Pages ● 129
60 MPO Apr 21
Key conditions and challenges Kosovo entered 2021 under continued pressure from the COVID-19 pandemic and in expectation of a government change following the organization of early elections in February 2021. Given healthcare capacity constraints, stringent containment measures were imposed in Q2 2020 but were relaxed in Q3. Vaccina-tion has not commenced as of March 2021. Because diaspora-related tourism exports accounted for almost one-quarter of GDP prior to the pandemic, recovery will also depend on international travel restrictions and vaccination progress in diaspora host countries. Growth averaged 3.6 percent over 2009-2019 and, before the pandemic, was ex-pected to exceed 4 percent in the medium term. Private investment added to growth in recent years, but was mostly concentrated in trade and construction industries, with limited productivity spillovers. Likewise, robust growth did not translate into more jobs as the employment rate remained almost constant between 2017 and 2019. In 2019, 21 percent of the popu-lation still lived with under US$5.5 per person per day (in 2011 PPP), and this share is expected to have increased in 2020 by 4-5 percentage points. Poor edu-cation and health outcomes limit the con-tribution of human capital to inclusive growth and the pandemic likely widened
this gap. As a largely service and con-sumption-based economy, Kosovo was particularly vulnerable to the COVID-19 shock. To support the recovery in 2021, the Gov-ernment should strengthen compliance with pandemic preventive measures, increase treatment capacity and effective-ness while reducing citizens’ out-of-pocket costs, and boost vaccination. Tar-geting of social protection and private sector support measures should be im-proved and implementation of public projects with secured financing accelerat-ed. To support a resilient recovery in the medium term, public spending effective-ness and the regulatory environment should be enhanced. Investment in hu-man capital should be prioritized.
Recent developments In 2020, economic activity is estimated to have contracted by 6.9 percent, driven by a plunge in exports—principally because of a 51 percent drop of diaspora travel services—and investment. Consumption contributed modestly, with higher gov-ernment offsetting lower private con-sumption. Fiscal stimulus combined with increased remittances and goods exports cushioned the contraction. Consumer price inflation decelerated in 2020 to 0.2 percent because of weak do-mestic demand and declining import prices. Formal employment weathered the im-pact of the downturn, but compensation
KOSOVO
FIGURE 1 Kosovo / Actual and forecast GDP vs Pre-COVID-19 5-year GDP trend
FIGURE 2 Kosovo / Actual and projected poverty rates and real GDP per capita
Sources: Kosovo agency of statistics and World Bank staff calculations. Source: World Bank.
Economic activity contracted by 6.9 per-cent in 2020, driven by plunging diaspora tourism and lower investment. Govern-ment and Central Bank policy support measures coupled with higher remittances and goods exports mitigated the contrac-tion. The recovery should start in 2021 with growth hovering above 4 percent in the medium term. However, real economic activity should recover losses only in 2022. Addressing long-standing struc-tural impediments and prioritizing lim-ited fiscal space for high-return human capital investments is vital to supporting a resilient recovery.
30
50
70
90
110
130
2009 2013 2017 2021
Pre-covid 5 year GDP trend Actual GDP
Index of real GDP, 2019=100
Table 1 2020Population, million 1 .8
GDP, current US$ billion 7.5
GDP per capita, current US$ 41 45
Upper middle-income poverty rate ($5.5)a 24.4
Gini indexa 29.0
Life expectancy at birth, yearsb 72.2
(a) M ost recent value (201 7), 201 1 PPPs.(b) M ost recent WDI value (201 8).
Source: WDI, M acro Poverty Outlook, and off icial data.Notes:
Poverty rate (%) Real GDP per capita (LCU constant)
0
500
1000
1500
2000
2500
3000
3500
4000
4500
0
10
20
30
40
50
60
70
2005 2007 2009 2011 2013 2015 2017 2019 2021 2023
Upper middle-income pov. rate Real GDP pc

130 ● World Bank ECA Economic Update Spring 2021
61 MPO Apr 21
and working hours were reduced. Regis-tered unemployment increased, most like-ly from informal job losses. Overall, un-employment remains high at 25 percent of the labor force (46.9 percent of youth) in Q3 2020. Projections suggest a poverty increase of 4-5 p.p. in 2020 (70-90 thou-sand new poor). The expected return to growth in 2021 should modestly reduce poverty as the services sector recovers. Despite a 28.4 percent reduction in public investment, the budget deficit closed 2020 at 7.6 percent of GDP, due to lower public revenues against the contraction. Current spending increased by 18.6 percent, driv-en by pandemic-related spending of an estimated 4.4 percent of GDP. The deficit was financed primarily through domestic and external debt and liquidation receipts. The drop in imports and a rise in second-ary income almost compensated the plunge in exports during 2020. As a result, the current account deficit (CAD) deterio-rated marginally from 5.5 to 5.7 percent of GDP. CAD was primarily financed by net FDI inflows and other international debt-driven investment flows. Bank deposits and bank credit increased by 11.5 and 7.1 percent, respectively. New loans increased only by 1.8 percent, reflecting restructuring activity through-out the year. Capital adequacy is above regulatory requirements, while NPLs
increased by 0.7 p.p. Forbearance measures by the Central Bank cushioned the impact of the pandemic on the finan-cial sector.
Outlook Growth is projected to reach 4 percent in 2021. The recovery is expected to be grad-ual. Economic activity will reach pre-pandemic levels only in 2022, mainly driv-en by a rise in exports and consumption. Growth in goods exports should continue to be strong in the medium term, as base metal prices are expected to rise. Service exports should also recover driven by a recovery in diaspora-related tourism ex-ports, as international travel restrictions are relaxed, and vaccination accelerates in Europe. Economic growth is projected to remain over 4 percent in the medium term, but downside risks to the outlook are high. The projected outlook rests on the as-sumption of relaxed international mobility between Europe and Kosovo, no further strict local containment measures and a recovery in Euro Area growth. There is also potential for higher growth, including through faster implementation of IFI-financed public investment.
Fiscal deficit will remain elevated in 2021 projected at 5.1 percent of GDP, driven by fiscal stimulus measures and the disrup-tion in the growth trajectory induced by the pandemic. Revenues are expected to recover as growth picks up. Fiscal stimu-lus aimed at supporting businesses and livelihoods should be fully executed in 2021, at about 3.2 percent of GDP. The CAD should remain at 5.7 percent of GDP in 2021 and gradually improve over the medium-term. Goods exports should increase gradually, while imports also increase on the back of higher aggregate demand. The size CAD will be deter-mined by the pace of remittance growth and recovery of diaspora-related tourism exports. The pandemic has intensified the develop-mental gaps, hence progress on structural reforms, including improvements in the design and targeting of social protection spending and regulatory environment for businesses is vital in reversing the adverse economic and social impact of the pan-demic and building resilience against fu-ture negative shocks.
TABLE 2 Kosovo / Macro poverty outlook indicators (annual percent change unless indicated otherwise)
2018 2019 2020 e 2021 f 2022 f 2023 fReal GDP growth, at constant market prices 3.8 4.9 -6.9 4.0 4.5 4.1
Private Consumption 5.3 1.6 -0.2 0.8 2.5 3.2Government Consumption 8.9 9.6 4.8 2.1 -0.3 -1.0Gross Fixed Capital Investment 6.1 6.8 -13.5 3.3 6.6 8.0Exports, Goods and Services 2.2 7.5 -27.2 25.5 13.6 7.2Imports, Goods and Services 8.9 3.3 -7.9 6.7 5.3 4.9
Inflation (Consumer Price Index) 1.1 2.7 0.2 0.7 1.0 1.3Current Account Balance (% of GDP) -7.6 -5.5 -5.7 -5.7 -4.9 -4.7Net Foreign Direct Investment (% of GDP) 3.4 2.7 4.0 3.2 3.2 3.2Fiscal Balance (% of GDP) -2.9 -2.9 -7.6 -5.1 -3.1 -3.0Debt (% of GDP) 16.3 16.9 22.3 24.9 26.5 28.2Primary Balance (% of GDP) -2.6 -2.6 -7.2 -4.6 -2.4 -2.2Upper middle-income poverty rate ($5.5 in 2011 PPP)a,b 23.0 21.0 24.9 23.2Source: World Bank, Poverty & Equity and M acroeconomics, Trade & Investment Global Practices.Notes: e = estimate, f = forecast.NA(a) Calculations based on ECAPOV harmonization, using 201 7-HBS.Actual data: 201 7. Nowcast: 201 8-201 9. Forecast:2020-2021.(b) Nowcast using neutral distribution (201 7) with pass-through = 0.7 based on GDP per capita in constant LCU. Projection using sector-level GPD forecast for 2020 and 2021 with pass-through =1

Selected Country Pages ● 131
62 MPO Apr 21
Key conditions and challenges The Kyrgyz Republic was making strides toward macroeconomic stability before the COVID-19 pandemic. Real GDP growth averaged 4 percent over the last decade, average inflation was low at 1.1 percent and the fiscal deficit was reduced to 0.5 percent of GDP in 2019. As a result of debt forgiveness from the Russian Federation and prudent debt management policy, gov-ernment debt fell to 52 percent of GDP at end-2019 from 67 percent in 2015. The Kyrgyz som was broadly stable against the U.S. dollar, and the country’s foreign exchange reserves were equivalent to 6 months of import cover in December 2019. However, the Kyrgyz economy has re-mained vulnerable to external shocks ow-ing to its heavy dependence on remittanc-es (27 percent of GDP) and gold exports (9 percent of GDP). Together with political instability, these vulnerabilities have re-sulted in volatile economic growth. Con-sequently, it has been insufficient to raise living standards or reduce poverty. Sub-stantial import spending for investment kept the current account deficit high (12 percent of GDP). Strong and sustainable economic growth requires institutional strengthening and policies to develop the private sector, spur international trade, and encourage fiscally sustainable energy production. Constraints to private investment and
growth include the large infrastructure gap, weak rule of law and governance, poor business environment, and onerous regulations. The energy sector’s financial weaknesses—stemming from below-cost recovery tariffs and a failure to meet WTO and Eurasian Economic Union standards and technical regulations—further limit the Kyrgyz Republic’s growth potential.
Recent developments The March–May 2020 lockdown, which included border closures to contain the spread of COVID-19, was a major shock to the Kyrgyz economy, significantly reduc-ing household incomes and business reve-nues. In October 2020, political turmoil worsened the country’s investment cli-mate. As a result—and despite the easing of lockdown restrictions later in the year—real GDP contracted by 8.6 percent in 2020. Twelve-month inflation rose to 9.7 percent in December (from 3.1 percent a year earlier), primarily driven by ex-change rate depreciation (19 percent). The current account is estimated to have run a surplus of 4 percent of GDP in 2020, re-flecting a 30 percent contraction in im-ports and resilient export earnings that— supported by gold exports—declined only by about 2 percent. Remittances remained at 2019 levels. Gross official reserves re-mained adequate at 5.9 months of imports as the central bank purchased domestical-ly-produced gold to offset sales of foreign exchange ($518 million, three times as much as in 2019) to limit som volatility.
FIGURE 1 Kyrgyz Republic / Real GDP growth and contribu-tions to real GDP growth
FIGURE 2 Kyrgyz Republic / Actual and projected poverty rates and real GDP per capita
Sources: Kyrgyz authorities; World Bank staff calculations. Source: Source: World Bank. Note: see Table 2.
Real GDP contracted by 8.6 percent in 2020 because of the COVID-19 outbreak, the policies to limit its impact, and the domestic political turmoil. External trade declined sharply, and the fiscal position deteriorated. The poverty rate is estimated to have more than doubled compared to the precrisis period. GDP growth is fore-cast to recover in 2021, assuming that domestic economic activity picks up and external trade resumes as the pandemic wanes, political stability is maintained, and external demand recovers.
KYRGYZ REPUBLIC Table 1 2020Population, million 6.6
GDP, current US$ billion 7.7
GDP per capita, current US$ 1 178.4
International poverty rate ($1.9)a 0.6
Lower middle-income poverty rate ($3.2)a 9.7
Upper middle-income poverty rate ($5.5)a 52.6
Gini indexa 29.7
School enro llment, primary (% gross)b 1 06.0
Life expectancy at birth, yearsb 71 .4
(a) M ost recent value (201 9), 201 1 PPPs.(b) WDI for school enrollment (201 9); life expectancy (201 8).
Source: WDI, M acro Poverty Outlook, and off icial data.Notes:
-10-8-6-4-202468
2015 2016 2017 2018 2019 2020 2021 2022 2023
Percent, percentage points
Agriculture Industry w/out gold sectorGold sector ConstructionServices GDP (RHS)
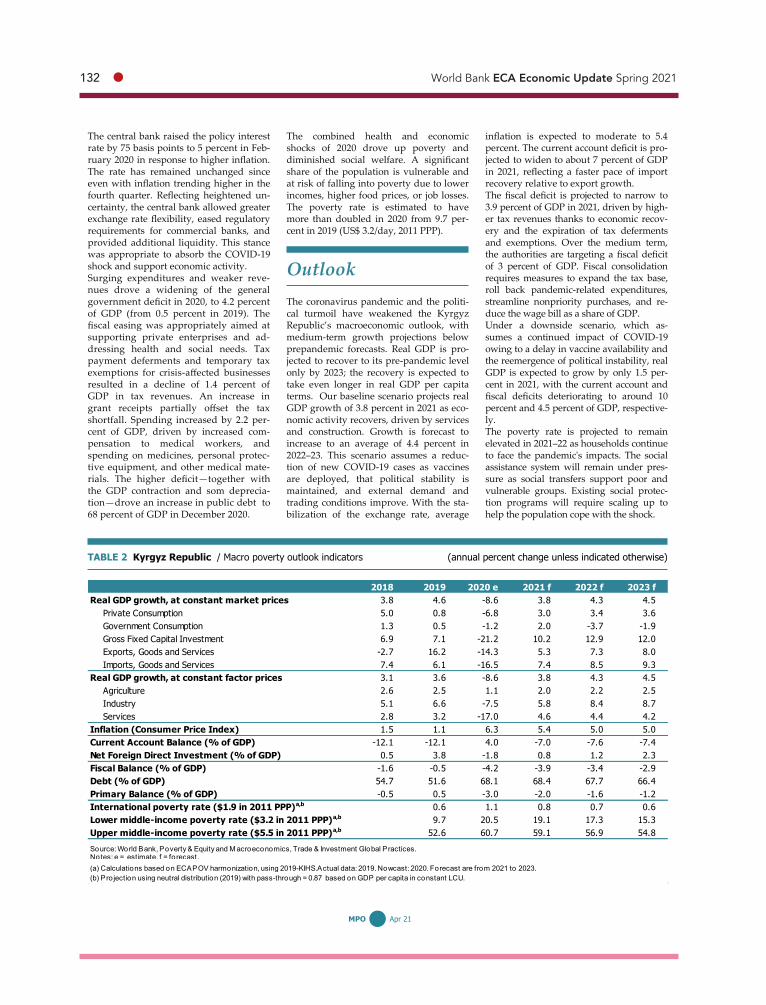
132 ● World Bank ECA Economic Update Spring 2021
63 MPO Apr 21
The central bank raised the policy interest rate by 75 basis points to 5 percent in Feb-ruary 2020 in response to higher inflation. The rate has remained unchanged since even with inflation trending higher in the fourth quarter. Reflecting heightened un-certainty, the central bank allowed greater exchange rate flexibility, eased regulatory requirements for commercial banks, and provided additional liquidity. This stance was appropriate to absorb the COVID-19 shock and support economic activity. Surging expenditures and weaker reve-nues drove a widening of the general government deficit in 2020, to 4.2 percent of GDP (from 0.5 percent in 2019). The fiscal easing was appropriately aimed at supporting private enterprises and ad-dressing health and social needs. Tax payment deferments and temporary tax exemptions for crisis-affected businesses resulted in a decline of 1.4 percent of GDP in tax revenues. An increase in grant receipts partially offset the tax shortfall. Spending increased by 2.2 per-cent of GDP, driven by increased com-pensation to medical workers, and spending on medicines, personal protec-tive equipment, and other medical mate-rials. The higher deficit—together with the GDP contraction and som deprecia-tion—drove an increase in public debt to 68 percent of GDP in December 2020.
The combined health and economic shocks of 2020 drove up poverty and diminished social welfare. A significant share of the population is vulnerable and at risk of falling into poverty due to lower incomes, higher food prices, or job losses. The poverty rate is estimated to have more than doubled in 2020 from 9.7 per-cent in 2019 (US$ 3.2/day, 2011 PPP).
Outlook The coronavirus pandemic and the politi-cal turmoil have weakened the Kyrgyz Republic’s macroeconomic outlook, with medium-term growth projections below prepandemic forecasts. Real GDP is pro-jected to recover to its pre-pandemic level only by 2023; the recovery is expected to take even longer in real GDP per capita terms. Our baseline scenario projects real GDP growth of 3.8 percent in 2021 as eco-nomic activity recovers, driven by services and construction. Growth is forecast to increase to an average of 4.4 percent in 2022–23. This scenario assumes a reduc-tion of new COVID-19 cases as vaccines are deployed, that political stability is maintained, and external demand and trading conditions improve. With the sta-bilization of the exchange rate, average
inflation is expected to moderate to 5.4 percent. The current account deficit is pro-jected to widen to about 7 percent of GDP in 2021, reflecting a faster pace of import recovery relative to export growth. The fiscal deficit is projected to narrow to 3.9 percent of GDP in 2021, driven by high-er tax revenues thanks to economic recov-ery and the expiration of tax deferments and exemptions. Over the medium term, the authorities are targeting a fiscal deficit of 3 percent of GDP. Fiscal consolidation requires measures to expand the tax base, roll back pandemic-related expenditures, streamline nonpriority purchases, and re-duce the wage bill as a share of GDP. Under a downside scenario, which as-sumes a continued impact of COVID-19 owing to a delay in vaccine availability and the reemergence of political instability, real GDP is expected to grow by only 1.5 per-cent in 2021, with the current account and fiscal deficits deteriorating to around 10 percent and 4.5 percent of GDP, respective-ly. The poverty rate is projected to remain elevated in 2021–22 as households continue to face the pandemic's impacts. The social assistance system will remain under pres-sure as social transfers support poor and vulnerable groups. Existing social protec-tion programs will require scaling up to help the population cope with the shock.
TABLE 2 Kyrgyz Republic / Macro poverty outlook indicators (annual percent change unless indicated otherwise)
2018 2019 2020 e 2021 f 2022 f 2023 fReal GDP growth, at constant market prices 3.8 4.6 -8.6 3.8 4.3 4.5
Private Consumption 5.0 0.8 -6.8 3.0 3.4 3.6Government Consumption 1.3 0.5 -1.2 2.0 -3.7 -1.9Gross Fixed Capital Investment 6.9 7.1 -21.2 10.2 12.9 12.0Exports, Goods and Services -2.7 16.2 -14.3 5.3 7.3 8.0Imports, Goods and Services 7.4 6.1 -16.5 7.4 8.5 9.3
Real GDP growth, at constant factor prices 3.1 3.6 -8.6 3.8 4.3 4.5Agriculture 2.6 2.5 1.1 2.0 2.2 2.5Industry 5.1 6.6 -7.5 5.8 8.4 8.7Services 2.8 3.2 -17.0 4.6 4.4 4.2
Inflation (Consumer Price Index) 1.5 1.1 6.3 5.4 5.0 5.0Current Account Balance (% of GDP) -12.1 -12.1 4.0 -7.0 -7.6 -7.4Net Foreign Direct Investment (% of GDP) 0.5 3.8 -1.8 0.8 1.2 2.3Fiscal Balance (% of GDP) -1.6 -0.5 -4.2 -3.9 -3.4 -2.9Debt (% of GDP) 54.7 51.6 68.1 68.4 67.7 66.4Primary Balance (% of GDP) -0.5 0.5 -3.0 -2.0 -1.6 -1.2International poverty rate ($1.9 in 2011 PPP)a,b 0.6 1.1 0.8 0.7 0.6Lower middle-income poverty rate ($3.2 in 2011 PPP)a,b 9.7 20.5 19.1 17.3 15.3Upper middle-income poverty rate ($5.5 in 2011 PPP)a,b 52.6 60.7 59.1 56.9 54.8Source: World Bank, Poverty & Equity and M acroeconomics, Trade & Investment Global Practices.Notes: e = estimate, f = forecast.NA(a) Calculations based on ECAPOV harmonization, using 201 9-KIHS.Actual data: 201 9. Nowcast: 2020. Forecast are from 2021 to 2023.(b) Projection using neutral distribution (201 9) with pass-through = 0.87 based on GDP per capita in constant LCU.

Selected Country Pages ● 133
64 MPO Apr 21
Key conditions and challenges Despite solid economic performance in recent years, Moldova has fallen short of its aspiration to achieve faster conver-gence towards EU income levels. The eco-nomic model continues to be reliant on remittances-induced consumption. Declin-ing productivity growth resulting from deep structural and governance weak-nesses constitutes a key challenge. State enterprises have a significant footprint and lower productivity than the private sector, while the business environment, anticompetitive practices, and taxes dis-tort private initiatives. The bank fraud of 2014 uncovered deep weaknesses in the financial sector. Moldova has one of the highest COVID-19 infection and death rates per population in Europe. Despite the restrictive measures, the number of cases has been rising progressively on the back of low enforcement and compliance. The global recession, disruptions in sup-ply chains, measures to flatten the conta-gion curve, financial risk aversion, among others, are taking a heavy toll on the key components of aggregate de-mand. While the medium-term growth prospects remain positive, a sustained recovery hinges on the containment of the pandemic and favorable external en-vironment. A new wave of restrictions in the country and in the main trading part-ners may further reduce consumer and
business confidence leading to even lower remittances and exports. On the fiscal side, though the 2021 budget envisages an ambi-tious fiscal stimulus, it might not be enough in case of slow roll-out of vaccines and limited foreign financing. Domestic risks relate to political instability, institu-tional weaknesses, and political con-straints to implement reforms of the judi-ciary and structural reforms. Fragile eco-nomic conditions and low productivity levels are exacerbated by the large foot-print of the state in the economy, shrink-ing fiscal space, low financial inter-mediation and governance challenges. Ad-ditionally, as shown by the severe drought episode in 2020, the economy is highly vul-nerable to extreme weather episodes.
Recent developments The combination of the pandemic and the severe drought is expected to affect most sectors of the economy. The economic activity plummeted in 2020, with GDP declining by 7.0 percent. Primary drivers of this deceleration are households’ con-sumption, which declined by 7 percent in 2020, and investments togeth-er with de-stocking. The lockdown measures have halted trade and industrial production while a severe drought has resulted in a decline in agriculture production by over 26 percent. Since the end of the lockdown, the economy has started to rebound grad-ually, but most of the short-term indica-tors remain in the negative territory.
MOLDOVA
FIGURE 1 Moldova / Actual and projected GDP growth and current account balance
FIGURE 2 Moldova / Actual and projected poverty rates and real GDP per capita
Source: World Bank, based on national statistics. Source: World Bank. Notes: see Table 2.
Moldova has one of the highest COVID-19 infection- and death rates per population in Europe. COVID-19 and the recent drought have drastically worsened the outlook for Moldova with a significant recession in 2020. Beyond 2020, high uncertainty on the duration of the pan-demic and its economic and social ramifi-cations could further constrain firms, workers and households, hampering the recovery. If downside risks materialize, reduced fiscal space may limit the capaci-ty for further countercyclical measures.
-11
-9
-7
-5
-3
-1
1
3
5
2014 2015 2016 2017 2018 2019 2020 2021 2022 2023Real GDP, % changeCurrent account balance, % GDPFiscal deficit, % of GDP
Percent, percent of GDP Poverty rate (%) Real GDP per capita (LCU constant)
0
10000
20000
30000
40000
50000
60000
0
10
20
30
40
50
60
70
80
2004 2006 2008 2010 2012 2014 2016 2018 2020 2022Lower middle-income pov. rate Upper middle-income pov. rateReal GDP pc
Table 1 2020Population, million 2.7
GDP, current US$ billion 1 1 .9
GDP per capita, current US$ 4499.4
Lower middle-income poverty rate ($3.2)a 0.9
Upper middle-income poverty rate ($5.5)a 1 2.8
Gini indexa 25.7
School enro llment, primary (% gross)b 89.5
Life expectancy at birth, yearsb 71 .8
(a) M ost recent value (201 8), 201 1 PPPs.(b) WDI for school enrollment (201 9); life expectancy (201 8).
Source: WDI, M acro Poverty Outlook, and off icial data.Notes:

134 ● World Bank ECA Economic Update Spring 2021
65 MPO Apr 21
On the back of falling import prices and domestic demand, inflation has decelerat-ed markedly in 2020, fluctuating below the lower band of the corridor of 5 percent (+/- 1.5 percent) since August. In response, the National Bank cut the prime rate 5 times to a new record low of 2.65 percent. The large import compression has led to an improvement in the current account deficit, which was mainly financed by debt instruments, predominantly public. On this background, fiscal stance deterio-rated substantially. From pre-COVID-19 level, tax revenue increased by about 0.3 pp of GDP while spending increased by 4.1 pp of GDP. As a result, the fiscal defi-cit reached 5.1 percent of GDP in 2020. Employment dropped by 0.5 percent in the last quarter of 2020, with the most affected sectors being trade and hospital-ity, followed by agriculture and industry. Job losses, together with declining earn-ings, the return of the most vulnerable economic migrants, and rising food pric-es have led to increased strain on house-holds' finances. As a result, poverty, as measured by the US$5.50 PPP a day, is projected to increase from an estimated 10.6 percent in 2019 to an estimated 14.2 percent in 2020.
Outlook Uncertainties around the evolution of the pandemic will keep the economy below potential. Economic growth is expected to rebound to 3.8 percent in 2021, assuming favorable conditions thanks to the rollout of vaccines. Consumer and investment confidence are expected to improve on the back of favorable external conditions, in-crease in social transfers, and accommoda-tive monetary stance. Most sectors are expected to bounce back, though the 2019 levels are estimated to be reached only in 2022. The agricultural sector is expected to rebound strongly after a bad yield in 2020. While the current account deficit is ex-pected to have narrowed in 2020, it will gradually widen as the economy acceler-ates. Inflation is expected to remain lower than the target corridor of 5 percent +/- 1.5 pp in 2021-22 but to pick up as the recov-ery strengthens. The authorities plan the fiscal deficit to reach 6.3 percent of GDP in 2021 and will remain higher than historical averages in the medium term due to a decline in reve-nues as businesses struggle and house-
holds suffer from weak job creation. Public debt is expected to increase (by 9.1 pp of GDP from pre-COVID-19 level) to 36.5 percent of GDP in 2021, while still remaining relatively low by international standards. The government faces consid-erable financing needs which might be difficult to meet domestically despite ag-gressive monetary loosening. The capacity to mitigate the impact of the crisis and support economic recovery will critically depend on external financing, particularly a successful renegotiation on an IMF pro-gram. Under the assumption of an economic rebound in Moldova and its main migrant destination countries, poverty, as meas-ured by the US$5.50 PPP/day poverty line, is projected to decline from 14.2 percent in 2020 to 12.3 percent in 2021. Going for-ward, Moldova will need to address the inequality of opportunities and accelerate private sector-driven job creation.
TABLE 2 Moldova / Macro poverty outlook indicators (annual percent change unless indicated otherwise)
2018 2019 2020 e 2021 f 2022 f 2023 fReal GDP growth, at constant market prices 4.3 3.7 -7.0 3.8 3.7 3.8
Private Consumption 4.5 3.2 -5.9 2.8 3.0 3.1Government Consumption -0.2 -0.5 -0.2 0.2 0.0 -0.1Gross Fixed Capital Investment 14.5 12.9 -1.7 7.8 8.7 8.9Exports, Goods and Services 7.2 7.3 -15.5 6.6 7.1 7.5Imports, Goods and Services 9.7 6.7 -8.9 5.1 6.3 6.5
Real GDP growth, at constant factor prices 4.4 4.0 -7.2 3.8 3.7 3.8Agriculture 2.6 -2.3 -26.4 10.0 5.0 7.0Industry 8.3 7.1 -4.3 4.3 4.8 5.4Services 3.3 4.2 -4.1 2.5 3.0 2.6
Inflation (Consumer Price Index) 3.1 4.7 4.1 4.4 5.0 5.0Current Account Balance (% of GDP) -10.4 -9.4 -5.5 -6.8 -7.5 -8.2Net Foreign Direct Investment (% of GDP) 2.4 4.5 1.3 3.5 3.7 3.5Fiscal Balance (% of GDP) -0.8 -1.4 -5.1 -4.0 -2.8 -2.5Debt (% of GDP) 30.1 27.4 33.5 36.0 37.3 41.4Primary Balance (% of GDP) 0.0 -0.7 -4.3 -3.2 -2.0 -1.8Lower middle-income poverty rate ($3.2 in 2011 PPP)a,b 0.9 0.7 1.0 0.8 0.7 0.4Upper middle-income poverty rate ($5.5 in 2011 PPP)a,b 12.8 10.6 14.2 12.3 10.5 9.2Source: World Bank, Poverty & Equity and M acroeconomics, Trade & Investment Global Practices.Notes: e = estimate, f = forecast.NA(a) Calculations based on ECAPOV harmonization, using 201 8-HBS. Actual data: 201 8. Nowcast: 201 9-2020. Forecast are from 2021 to 2023.(b) Projection using neutral distribution (201 8) with pass-through = 0.87 based on GDP per capita in constant LCU.

Selected Country Pages ● 135
66 MPO Apr 21
Key conditions and challenges As a small, open, and heavily tourism-dependent economy, Montenegro was hit hard by COVID19, affirming its vulnera-bilities to strong boom-bust cycles. Over the five years prior to the crisis, growth averaged 4 percent, driven by large public investments and consump-tion. Over two-thirds of Montenegro’s jobs are in services, which account for over 70 percent of value added. The exter-nal imbalances are structurally high and averaged 15 percent of GDP over 2015-19, largely financed by net FDI and external debt. Montenegro’s net international posi-tion at negative 170 percent of GDP is amongst the largest in the world. Due to weaker adherence to fiscal plans and debt-financed highway construction, public debt has doubled since independence. Montenegro aspires to join the EU, but significant rule of law challenges slow down progress and reflect a key develop-ment constraint. The crisis has wiped out recent economic and social gains from the period of strong growth and exacerbated Montenegro’s vulnerabilities. These include: the lack of fiscal space, small production base and low diversification of the economy, busi-ness environment weaknesses, and in-come and social inequalities. These vul-nerabilities translate into significant rever-sals of progress in creating jobs, raising income, and reducing poverty.
Montenegro ranks third in the number of infections per million inhabitants and rec-ords among the highest death rates per capita from COVID-19 in the world. The pace of recovery will depend on when the pandemic is contained and the pace of immunization, which is currently slow. In 2020, the country saw the first demo-cratic change of power. The new govern-ment committed to accelerating reforms, strengthening the rule of law, and fighting corruption. These, coupled with strong fiscal and debt management and inde-pendent and accountable state institu-tions, would enable more inclusive, pri-vate sector-led growth and efficient ser-vice delivery to citizens.
Recent developments In 2020, tourism plummeted due to COVID19: foreign tourist overnight stays and receipts collapsed by 90 percent. Con-sequently, retail trade fell by almost 17 percent, while industrial production was at 2019 levels. Administrative data show employment was down to a 9-year low, with the tour-ism, construction, and trade sectors hit hardest. Unemployment went up by 13 percent. Wage subsidies and one-off cash transfers helped to avoid even larger layoffs and increases in poverty, though vulnerable workers in the informal sector might not have received much support. Poverty (income below $5.5/day in 2011PPP) is estimated to increase from 14.5 percent in 2019 to 20 percent in 2020.
MONTENEGRO
FIGURE 1 Montenegro / Real GDP growth and contributions to real GDP growth
FIGURE 2 Montenegro / Actual and projected poverty rates and real GDP per capita
Sources: MONSTAT, World Bank projections Source: World Bank. Note: see Table 2.
Montenegro suffered a very deep recession in 2020, estimated at 15 percent. The cri-sis exposed Montenegro’s structural chal-lenges and vulnerabilities, reversing eco-nomic and social gains of recent years. Despite government support, employment fell across all sectors, and poverty is esti-mated to have increased to 20 percent. Public debt soared to over 100 percent of GDP, requiring vigilant fiscal manage-ment in the years ahead. The economy is projected to rebound in 2021, but GDP will not fully recover before 2023.
Poverty rate (%) Real GDP per capita (LCU constant)
0
1000
2000
3000
4000
5000
6000
0
5
10
15
20
25
2012 2014 2016 2018 2020 2022
Upper middle-income pov. rate Real GDP pc
-20
-10
0
10
20
2014 2015 2016 2017 2018 2019 2020e 2021f 2022f 2022f
Final consumption Gross fixed capital formationChange in inventories Net exportsGDP growth
Percent, percentage points
Table 1 2020Population, million 0.6
GDP, current US$ billion 4.7
GDP per capita, current US$ 7567.0
Upper middle-income poverty rate ($5.5)a 1 6.0
Gini indexa 38.8
School enro llment, primary (% gross)b 1 00.6
Life expectancy at birth, yearsb 76.8
(a) M ost recent value (201 6), 201 1 PPPs.(b) WDI for school enrollment (201 9); life expectancy (201 8).
Source: WDI, M acro Poverty Outlook, and off icial data.Notes:
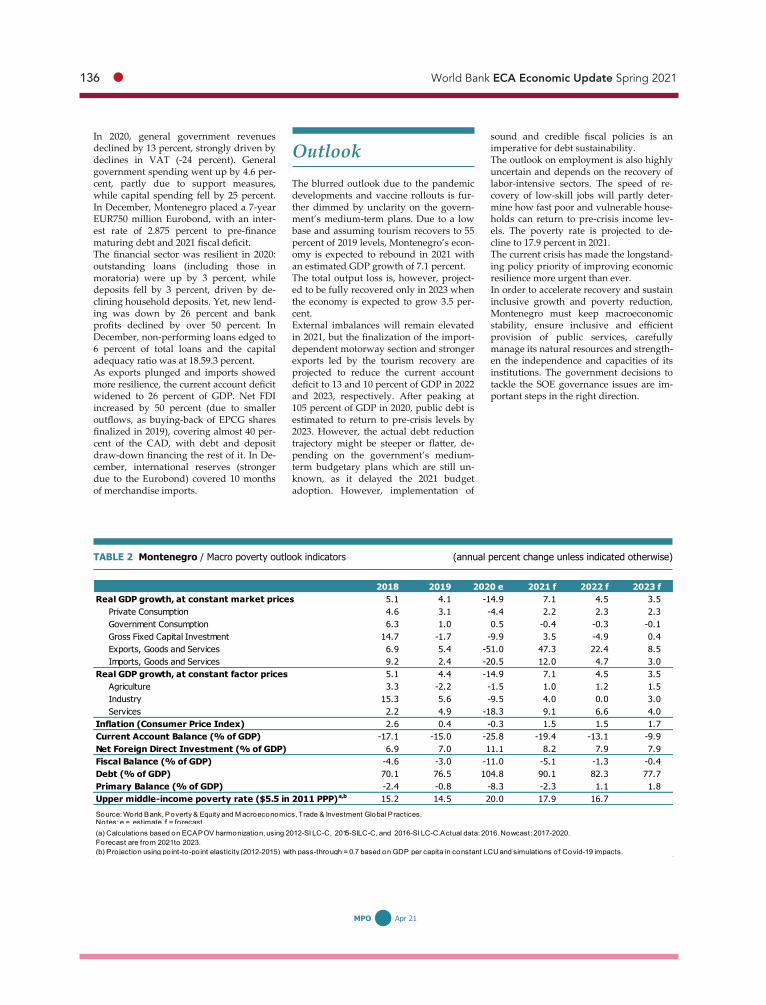
136 ● World Bank ECA Economic Update Spring 2021
67 MPO Apr 21
In 2020, general government revenues declined by 13 percent, strongly driven by declines in VAT (-24 percent). General government spending went up by 4.6 per-cent, partly due to support measures, while capital spending fell by 25 percent. In December, Montenegro placed a 7-year EUR750 million Eurobond, with an inter-est rate of 2.875 percent to pre-finance maturing debt and 2021 fiscal deficit. The financial sector was resilient in 2020: outstanding loans (including those in moratoria) were up by 3 percent, while deposits fell by 3 percent, driven by de-clining household deposits. Yet, new lend-ing was down by 26 percent and bank profits declined by over 50 percent. In December, non-performing loans edged to 6 percent of total loans and the capital adequacy ratio was at 18.59.3 percent. As exports plunged and imports showed more resilience, the current account deficit widened to 26 percent of GDP. Net FDI increased by 50 percent (due to smaller outflows, as buying-back of EPCG shares finalized in 2019), covering almost 40 per-cent of the CAD, with debt and deposit draw-down financing the rest of it. In De-cember, international reserves (stronger due to the Eurobond) covered 10 months of merchandise imports.
Outlook The blurred outlook due to the pandemic developments and vaccine rollouts is fur-ther dimmed by unclarity on the govern-ment’s medium-term plans. Due to a low base and assuming tourism recovers to 55 percent of 2019 levels, Montenegro’s econ-omy is expected to rebound in 2021 with an estimated GDP growth of 7.1 percent. The total output loss is, however, project-ed to be fully recovered only in 2023 when the economy is expected to grow 3.5 per-cent. External imbalances will remain elevated in 2021, but the finalization of the import-dependent motorway section and stronger exports led by the tourism recovery are projected to reduce the current account deficit to 13 and 10 percent of GDP in 2022 and 2023, respectively. After peaking at 105 percent of GDP in 2020, public debt is estimated to return to pre-crisis levels by 2023. However, the actual debt reduction trajectory might be steeper or flatter, de-pending on the government’s medium-term budgetary plans which are still un-known, as it delayed the 2021 budget adoption. However, implementation of
sound and credible fiscal policies is an imperative for debt sustainability. The outlook on employment is also highly uncertain and depends on the recovery of labor-intensive sectors. The speed of re-covery of low-skill jobs will partly deter-mine how fast poor and vulnerable house-holds can return to pre-crisis income lev-els. The poverty rate is projected to de-cline to 17.9 percent in 2021. The current crisis has made the longstand-ing policy priority of improving economic resilience more urgent than ever. In order to accelerate recovery and sustain inclusive growth and poverty reduction, Montenegro must keep macroeconomic stability, ensure inclusive and efficient provision of public services, carefully manage its natural resources and strength-en the independence and capacities of its institutions. The government decisions to tackle the SOE governance issues are im-portant steps in the right direction.
TABLE 2 Montenegro / Macro poverty outlook indicators (annual percent change unless indicated otherwise)
2018 2019 2020 e 2021 f 2022 f 2023 fReal GDP growth, at constant market prices 5.1 4.1 -14.9 7.1 4.5 3.5
Private Consumption 4.6 3.1 -4.4 2.2 2.3 2.3Government Consumption 6.3 1.0 0.5 -0.4 -0.3 -0.1Gross Fixed Capital Investment 14.7 -1.7 -9.9 3.5 -4.9 0.4Exports, Goods and Services 6.9 5.4 -51.0 47.3 22.4 8.5Imports, Goods and Services 9.2 2.4 -20.5 12.0 4.7 3.0
Real GDP growth, at constant factor prices 5.1 4.4 -14.9 7.1 4.5 3.5Agriculture 3.3 -2.2 -1.5 1.0 1.2 1.5Industry 15.3 5.6 -9.5 4.0 0.0 3.0Services 2.2 4.9 -18.3 9.1 6.6 4.0
Inflation (Consumer Price Index) 2.6 0.4 -0.3 1.5 1.5 1.7Current Account Balance (% of GDP) -17.1 -15.0 -25.8 -19.4 -13.1 -9.9Net Foreign Direct Investment (% of GDP) 6.9 7.0 11.1 8.2 7.9 7.9Fiscal Balance (% of GDP) -4.6 -3.0 -11.0 -5.1 -1.3 -0.4Debt (% of GDP) 70.1 76.5 104.8 90.1 82.3 77.7Primary Balance (% of GDP) -2.4 -0.8 -8.3 -2.3 1.1 1.8Upper middle-income poverty rate ($5.5 in 2011 PPP)a,b 15.2 14.5 20.0 17.9 16.7Source: World Bank, Poverty & Equity and M acroeconomics, Trade & Investment Global Practices.Notes: e = estimate, f = forecast.NA
(b) Projection using point-to-point elasticity (201 2-201 5) with pass-through = 0.7 based on GDP per capita in constant LCU and simulations of Covid-1 9 impacts.
(a) Calculations based on ECAPOV harmonization, using 201 2-SI LC-C, 2015-SILC-C, and 201 6-SI LC-C.Actual data: 201 6. Nowcast: 201 7-2020. Forecast are from 2021 to 2023.

Selected Country Pages ● 137
68 MPO Apr 21
Key conditions and challenges North Macedonia has enjoyed a period of relative macroeconomic stability over the last decade, accompanied by rising trade integration, especially in GVCs, an im-proved business environment and inflow of foreign direct investment. While this has resulted in an average GDP growth of 2.6 percent in the period 2010-2019, it was still lower than in peer countries. Poverty declined in recent years, but about 16.8 percent of Macedonians (using the US$5.5/day at 2011 PPP line) were still projected to live in poverty in 2019. Hit by the pandemic and the related recession, it is estimated that poverty increased be-tween 1 and 4 percentage points in 2020. Support measures introduced by the gov-ernment (i.e., subsidies and social security contributions to private firms and cash benefits and vouchers for vulnerable peo-ple) helped alleviate the impact of the pandemic on poverty. Outlook for the near term, although posi-tive, remains challenging as a result of continued containment measures in place, slow vaccine rollout, and unresolved structural bottlenecks. Human capital development is limited as a result of weak education and workforce skills acquisition which, together with low and declining productivity, has been constraining growth. This has only been further exacer-bated by the learning loss caused by COVID-19. In addition, labor resources
are underutilized as only 48 percent of working-age Macedonians are employed, while low birth rates and emigration are shrinking the workforce. The transition to a more dynamic econom-ic model and, with it, the creation of job opportunities for the youth is linked to the implementation of key social sector, eco-nomic, and governance reforms in a con-text of political stability, increased trans-parency, accountability, voice and partici-pation. The current economic model, based on generous public support through subsidies and broad and growing tax ex-emptions, is not sustainable and has led to an ever-increasing state involvement in the market. Countercyclical fiscal policies put in place to mitigate the impact of COVID-19 depleted the fiscal buffers and increased sustainability concerns. As the economic recovery firms up, a gradual withdrawal of the state support will be necessary. Finally, further delays in the opening of the EU accession negotiations may reduce willingness to undertake structural reforms.
Recent developments Growth declined by 4.5 percent in 2020; less than earlier projected as the recession sharply eased in Q4. Private consumption, the main driver of growth in the past, ex-perienced a sharp decline of 5.6 percent y-o-y as a result of containment measures. Investment also declined by more than 10 percent, even though it shortly rebounded in Q3. Government consumption that
FIGURE 1 North Macedonia / Fiscal deficit, debt and guarantees
FIGURE 2 North Macedonia / Actual and projected poverty rates and GDP per capita
Sources: North Macedonia State Statistics Office and World Bank. Sources: : World Bank. Notes: see Table 2
The pandemic led to a growth contraction of 4.5 percent in 2020—the largest since inde-pendence. Government response measures partially mitigated the crisis impact on households and firms, but the fiscal deficit tripled to 8.9 percent of GDP, and debt reached 60 percent of GDP. The near-term outlook is positive, but downside risks are high. While economic and social measures to remedy the crisis will take priority in early 2021, fiscal, competition, environmental and governance reforms are needed for re-covery and EU accession.
NORTH MACEDONIA
-9
-8
-7
-6
-5
-4
-3
-2
-1
0
0
10
20
30
40
50
60
70
2012 2013 2014 2015 2016 2017 2018 2019 2020e
Domestic debt Foreign debtGuarantees Fiscal balance-rhs
Percent of GDP Percent
Table 1 2020Population, million 2.1
GDP, current US$ billion 1 2.1
GDP per capita, current US$ 5825.2
Upper middle-income poverty rate ($5.5)a 1 7.9
Gini indexa 33.0
School enro llment, primary (% gross)b 98.2
Life expectancy at birth, yearsb 75.7
(a) M ost recent value (201 8), 201 1 PPPs.(b) M ost recent WDI value (201 8).
Source: WDI, M acro Poverty Outlook, and off icial data.Notes:

138 ● World Bank ECA Economic Update Spring 2021
69 MPO Apr 21
increased by over 10 percent partly allevi-ated declining domestic demand. External demand also plummeted, reflected in a 10.9 percent y-o-y decline of exports. The accompanying decline in imports alleviat-ed the pressure on the current account deficit which is expected to remain largely unchanged compared to 2019. On the pro-duction side, agriculture, ICT and real estate activities were only sectors growing in 2020. Government support helped cushion the crisis impact on the labor market by sup-porting over 130,000 jobs through wage subsidies in April, declining to 60,000 to-wards the year-end as the economy slowly recovered. The unemployment rate re-mained largely unchanged, but this was partly a result of people dropping out of the labor market. The activity rate dropped by 0.8 pp to 56.4 percent, the lowest level since 2008. The banking sector liquidity ratio of over 23 percent in Q3 remained adequate, helped by the central bank measures. Credit continued growing at 4.7 percent y-o-y by end-2020, on account of both household and firm credits supported by strong deposit growth and crisis-support programs. Non-performing loans de-clined to 3.3 percent given the allowed suspension on credit reclassification re-quirements until December. However, an
upward correction is expected in 2021 as this measure ended. The capital adequacy ratio stood at 16.9 percent in Q3 2020, double the mandatory level. Inflation re-mained low at 1.2 percent y-o-y in 2020, reflecting subdued output and despite rising food prices in the second half of 2020. The fiscal deficit tripled to 8.9 percent of GDP in 2020. The drop in VAT and excise revenues amounted to 0.9 percent of GDP and was cushioned somewhat by an in-crease in social contributions. Spending increased by 4.4 percent of GDP, as health expenditures and subsidy schemes, aimed at employment retention, surged. Spend-ing on wages and pensions also increased as a result of previous policy changes, while capital spending declined. Public and publicly guaranteed debt increased to 60.2 percent of GDP as the government ramped up borrowing to finance the soar-ing deficit and repay maturing obliga-tions.
Outlook The economic growth is expected to rebound to 3.6 percent in 2021. This sce-nario assumes accelerated vaccinations by mid-2021, no further lockdowns, and
increased external demand. In this sce-nario of a gradual recovery, after a pro-tracted recession in Q1 2021, a rebound is expected thereafter, as restored con-sumer and investor confidence pushes up personal consumption, private in-vestment, and exports. The fiscal deficit is planned at 4.9 percent but given the extended government support to firms and households in early 2021 of an ad-ditional 1.4 percent of GDP, the actual deficit will likely be higher. Setting pub-lic finances back on a sustainable path will be needed over the medium term, as public and publicly guaranteed debt surpasses 64 percent of GDP in 2021. Targeting a primary balance over the medium term would be needed to stem further public debt growth and not crowd out productive spending. This is even more important in the eventuality that international financing costs rise. Boosting revenues through cutting back on exemptions and strengthening com-pliance are priorities along with a grad-ual state withdrawal from the corporate sector. Bringing people back to the labor market, as well as education and gov-ernance reforms could help boost poten-tial growth. Poverty is projected to re-sume its decline as growth gradually recovers in 2021.
TABLE 2 North Macedonia / Macro poverty outlook indicators (annual percent change unless indicated otherwise)
2018 2019 2020 e 2021 f 2022 f 2023 fReal GDP growth, at constant market prices 2.9 3.2 -4.5 3.6 3.5 3.4
Private Consumption 4.5 5.6 -7.4 4.5 3.9 3.7Government Consumption 2.0 -1.3 10.1 3.6 1.2 0.3Gross Fixed Capital Investment -19.8 20.2 -7.7 5.1 5.9 5.1Exports, Goods and Services 15.6 4.6 -10.9 6.2 7.2 7.3Imports, Goods and Services 9.1 10.5 -10.5 6.4 6.5 6.2
Real GDP growth, at constant factor prices 3.9 3.2 -3.7 3.6 3.5 3.4Agriculture 8.6 0.6 1.7 2.7 2.5 2.0Industry 0.2 4.6 -6.8 5.7 5.0 4.5Services 4.9 2.9 -3.2 2.9 3.1 3.1
Inflation (Consumer Price Index) 1.5 0.9 1.2 1.6 2.0 2.0Current Account Balance (% of GDP) -0.1 -3.3 -3.5 -3.4 -2.6 -1.5Financial and Capital Account excl. reserves (% of GDP) 5.2 6.6 5.2 3.9 3.1 1.9
Net Foreign Direct Investment (% of GDP) 5.6 3.2 1.9 2.6 2.7 2.7Fiscal Balance (% of GDP) -1.1 -2.2 -8.2 -5.4 -4.0 -3.3Fiscal Balance with Pub. Ent. for State Roads (% of GDP) -1.7 -3.1 -8.9 -6.0 -4.2 -3.4Debt (% of GDP) 48.4 49.4 60.2 64.9 65.9 67.2Primary Balance (% of GDP) -0.5 -1.9 -7.7 -4.7 -2.8 -2.0Upper middle-income poverty rate ($5.5 in 2011 PPP)a,b 17.9 16.8 18.0 17.0Source: World Bank, Poverty & Equity and M acroeconomics, Trade & Investment Global Practices.Notes: e = estimate, f = forecast.NA(a) Calculations based on ECAPOV harmonization, using 201 8-SI LC-C.Actual data: 201 8. Nowcast: 201 9-2020. Forecast are from 2021.(b) Projections based on sectoral GDP growth at constant LCU.

Selected Country Pages ● 139
70 MPO Apr 21
Key conditions and challenges The well-diversified Polish economy is one of Europe’s least affected economies by the COVID-19 pandemic. GDP de-clined however by 2.7 percent in 2020, the first output contraction in over 20 years. Prudent macroeconomic policies, effective absorption of EU investment funds, a sound financial sector, and better access to long-term credit fed into inclusive growth and poverty reduction. Real wage growth and a range of demographically targeted social programs (“Family 500+”, “13th pension”) fed into robust consumption growth until early 2020. With an improv-ing business environment, Poland inte-grated well into regional value chains (RVCs). Higher levels of private invest-ment, an improved innovation ecosystem, and further upgrading of RVCs are need-ed to boost productivity and growth. A key challenge over the short term is to continue supporting the sectors most affected by the pandemic, while ensuring public debt sustainability. The unprece-dented policy response to the COVID cri-sis has narrowed available fiscal space. Increased spending efficiency is needed to rebuild fiscal buffers for future countercy-clical policies and to prepare for the grow-ing fiscal burden arising from aging. The full economic and social impact of COVID-19 hinges on the success of con-tainment efforts, the vaccination rollout and of the policy measures. The second
wave of the pandemic weakened the recov-ery, forcing a lockdown in multiple sectors, in particular retail, accommodations and services, and further straining the healthcare system. The risk of delays in the vaccination rollout and subsequent pandemic waves could undermine the recovery, with implica-tions for jobs and inclusion. Over the medium term, a key challenge to sustained growth is a tightening labor sup-ply made more acute by the aging popula-tion. Achieving decarbonization commit-ments is another challenge. Strengthening institutions at both the national and subna-tional level are necessary ingredients for sustained and inclusive growth and for the narrowing of regional disparities.
Recent developments The economy recorded its first contraction since 1991 amid the pandemic, with out-put contracting 2.7 percent in 2020. The government swiftly implemented excep-tional stimulus and accommodative mon-etary policy to mitigate the health, social impact and prevent economic scarring. The pandemic, heightened uncertainty, and negative confidence effects dampened pri-vate consumption (-3.1 percent) and total investment, (-8.4 percent). Government spending to cushion pandemic impacts and a higher public wage bill contributed to the 3.2 percent increase in public consumption, while public investment remained stable. Disruptions to international trade and transport and lower demand from key EU partners caused a 0.5 percent decline in
POLAND
FIGURE 1 Poland / Real GDP growth and contributions to real GDP growth
FIGURE 2 Poland / Actual and projected poverty rates and real GDP per capita
Source: World Bank.
The two COVID-19 waves and contain-ment measures have pushed the Polish economy into recession; however, Poland remained among the most resilient econo-mies in the region. To mitigate the impact on firms and employment, economic measures were introduced that have nar-rowed the fiscal space. While unemploy-ment impacts have been stymied, work stoppages have resulted in considerable household income impacts. The key chal-lenges over the short term are swiftly roll-ing out vaccinations and ensuring a ro-bust economic recovery.
Sources:World Bank. Notes: see table 2
-6.0
-4.0
-2.0
0.0
2.0
4.0
6.0
8.0
2013 2015 2017 2019 2021f 2023f
Final consumption Gross Fixed InvestmentChange in inventories Net exportsStatistical Discrepancy GDP growth
Percent, percentage points Poverty rate (%) Real GDP per capita (LCU constant)
0
10000
20000
30000
40000
50000
60000
70000
0
2
4
6
8
10
12
14
2004 2006 2008 2010 2012 2014 2016 2018 2020 2022
Upper middle-income pov. rate Real GDP pc
Table 1 2020Population, million 38.0
GDP, current US$ billion 594.2
GDP per capita, current US$ 1 5654.9
Upper middle-income poverty rate ($5.5)a 1 .2
Gini indexa 30.3
School enro llment, primary (% gross)b 96.9
Life expectancy at birth, yearsb 77.6
(a) M ost recent value (201 8), 201 1 PPPs.(b) M ost recent WDI value (201 8).
Source: WDI, M acro Poverty Outlook, and off icial data.Notes:

140 ● World Bank ECA Economic Update Spring 2021
71 MPO Apr 21
exports. Lower domestic expenditure caused imports to decline 2.6 percent, with net exports contributing 1 percentage point to growth in 2020. Although disruptions to RVCs and lock-down measures affected industrial activity (-9.4 percent in Q2), the Q3 rebound in do-mestic activity and exports limited the de-cline to 1.0 percent in 2020. Accommodation and catering collapsed by 45.5 percent, rais-ing the risk of economic scarring. Most sec-tors contracted at a moderate pace, while real estate activities and ICT expanded. Household income and employment im-pacts of the pandemic were mitigated through multiple additional support measures as well as by demographically targeted transfers that acted as an income base for population segments. Rapid assess-ments show that household income declines were more widespread and pronounced in the first pandemic wave. Work stoppages have however had a more pronounced im-pact on lower-wage workers and those in non-standard contract types, who are also less likely to be covered by protective leave policies. The current account surplus rose to 3.5 per-cent of GDP, as imports dropped by USD 11.6 billion, while primary income outflows declined by USD 6.6 billion. The stimulus packages appear to have been effective in preventing a sharper increase in
unemployment and earnings losses by sub-sidizing salaries and supporting domestic enterprises via non-returnable transfers, loans, tax reliefs and deferrals among others. The unemployment rate increase was con-tained to 1 pp. year-on-year by January 2021, rising to 6.5 percent. The large fiscal stimulus and the decline in economic activity caused the fiscal deficit to widen to an estimated 8.5 percent of GDP in 2020. Inflation reached 3.4 percent in 2020, primar-ily on account of lower international fuel prices and food prices. Meanwhile, higher electricity tariffs and a record low reference interest rate prevented a sharper decline in inflation. The financial sector's asset quality and capi-tal adequacy remain at satisfactory levels.
Outlook Trade recovery in the euro area, combined with improved confidence and a rebound in private consumption and investment is expected to support a moderate recovery of around 3.3 percent in 2021, bringing output above pre-crisis levels. The outlook incorporates the uncertainty arising from the new strains of the COVID-19 virus and the current pace of vaccination campaigns
throughout Europe. Exceptional policy accommodation in Poland and in the EU more broadly is expected to continue throughout 2021, including near-zero poli-cy interest rates. This baseline assumes that the pandemic is contained, with a vaccine effectively rolled out in 2021. The persistence of the crisis is expected to put a continued financial strain on poor working households that are more vulnera-ble to reductions in hours worked and job loss. Therefore, the share of the population at risk of poverty is expected to remain ele-vated through 2021 before gradually recov-ering in 2022. Pent-up domestic demand, especially for capital and durable goods, and stronger demand for Poland’s exports from key EU trading partners will support a recovery in the industrial sector and exports. Recovery in imports and increased primary income outflows are expected to contribute to a nar-rowing in the current account surplus. Po-land could receive nearly Euro 28 billion in grants and guarantees under the “Next Gen-eration EU” recovery package to fund its national recovery program, providing sup-port for a green and digital transition. The fiscal deficit is expected to narrow start-ing in 2021, as the economy recovers and as support measures are targeted to the most affected sectors and vulnerable groups.
TABLE 2 Poland / Macro poverty outlook indicators (annual percent change unless indicated otherwise)
2018 2019 2020 e 2021 f 2022 f 2023 fReal GDP growth, at constant market prices 5.4 4.5 -2.7 3.3 4.2 4.2
Private Consumption 4.5 3.9 -3.1 3.1 3.4 3.3Government Consumption 3.5 6.2 3.2 3.2 3.3 3.3Gross Fixed Capital Investment 9.4 7.2 -8.4 5.6 10.2 8.4Exports, Goods and Services 6.9 5.1 -0.5 2.0 5.1 5.5Imports, Goods and Services 7.4 3.3 -2.6 2.4 6.1 5.8
Real GDP growth, at constant factor prices 5.3 4.5 -2.8 3.5 4.2 4.2Agriculture -9.1 0.1 -3.0 5.5 1.0 1.0Industry 7.0 2.2 -1.0 2.0 2.8 2.9Services 5.0 5.8 -3.7 4.2 5.0 4.9
Inflation (Consumer Price Index) 1.6 2.3 3.4 2.6 2.5 2.4Current Account Balance (% of GDP) -1.3 0.5 3.5 1.4 0.3 -0.6Net Foreign Direct Investment (% of GDP) -2.6 -1.6 -0.9 -1.2 -1.1 -1.0Fiscal Balance (% of GDP) -0.2 -0.7 -8.5 -5.1 -3.2 -2.9Debt (% of GDP) 48.8 45.7 58.2 59.5 59.0 58.1Primary Balance (% of GDP) 1.2 0.7 -7.2 -3.8 -1.6 -1.4Upper middle-income poverty rate ($5.5 in 2011 PPP)a,b 1.2 1.1 1.2 1.2 1.1 1.0Source: World Bank, Poverty & Equity and M acroeconomics, Trade & Investment Global Practices.Notes: e = estimate, f = forecast.NA(a) Calculations based on ECAPOV harmonization, using 2007-EU-SI LC, 201 7-EU-SILC, and 201 8-EU-SI LC.Actual data: 201 8. Nowcast: 201 9-2020. Forecast are from 2021 to 2023.(b) Pro jection based off elasticities calibrated on 2007-201 7 growth periods and rapid assessment data, allowing for elasticities to vary between periods of contraction, recovery and expansion.

Selected Country Pages ● 141
72 MPO Apr 21
Key conditions and challenges Prior to the COVID-19 pandemic, Roma-nia enjoyed a decade of economic growth; however, the COVID-19 crisis has affected economic activity and household incomes, exposing Romania’s structural issues. Fis-cal policy has historically been procyclical. The budget deficit averaged -2.8 percent of GDP between 2011-2019 as GDP growth averaged 3.9 percent over the same period. Economic growth was strong despite weak fundamentals. Elevat-ed private consumption, driven in part by unsustainable wage growth, has triggered inflationary pressures and placed the cur-rent account deficit on a widening path. The quality and quantity of labor and cap-ital, as well as slower productivity dy-namics, have limited potential growth. Private investment has remained at fairly high levels, but a shallow financial sector limits the availability of long-term finance. The Government responded rapidly to the COVID-19 crisis by providing a fiscal stimulus of 4.4 percent of GDP in 2020. This is one of the lowest stimuli in the EU, reflecting the limited fiscal space. In the first COVID wave, poor and vulnerable households were less supported by the fiscal response measures, which extended more directly to those in formal employ-ment structures; subsequent programs for daily wage and seasonal workers extend-ed protections to typically more vulnera-ble segments.
The key challenge in the short term is to contain the COVID-19 crisis and limit its health, economic and social consequences. The Government’s policy response along-side the European Union (EU) support, as well as a successful rollout of the COVID-19 vaccine, will be critical in ensuring re-covery. Bringing down the fiscal deficit alongside structural reforms to reduce inefficient expenditures and strengthen revenue mobilization will be paramount for the consolidation of public finance and for averting a sharp increase in public debt over the medium term. Additional challenges stem from Romania’s histori-cally low EU fund absorption rates, rais-ing questions on the country’s capacity to take advantage of the new recovery funds.
Recent developments
The Romanian economy contracted by 3.9 percent in 2020 on the back of better than expected fourth-quarter performance at -1.4 percent yoy. This reflects in part a smaller disruption of employment and production in the second wave of the pan-demic in Q4 2020 compared to the first. Trade and services decreased by 4.7 per-cent in 2020, and high-frequency indica-tors point to a quicker recovery contrib-uting to the fourth quarter GDP rebound, although certain sectors – such as tourism and hospitality – remained heavily affect-ed. Industry contracted by 9.3 percent, over the same period, reflecting the weak-ening of external demand from Europe alongside pandemic-related restrictions
ROMANIA
FIGURE 1 Romania / Real GDP growth and contributions to real GDP growth
FIGURE 2 Romania / Actual and projected poverty rates and real GDP per capita
Source: World Bank Source: World Bank. Notes: see table 2
The Romanian economy performed better than anticipated, contracting by 3.9 per-cent in 2020. A proactive but constrained fiscal response, at 4.4 percent of GDP, supported firms to retain employees and fed into household incomes. Economic growth is expected to rebound to 4.3 per-cent in 2021, supported by a pick-up in economic activity in the second half of the year. Poverty is anticipated to increase in the short term as the protracted impacts of COVID-19 affect domestic income sources and remittances.
Poverty rate (%) Real GDP per capita (LCU constant)
0
2000
4000
6000
8000
10000
12000
0
5
10
15
20
25
30
35
40
2006 2008 2010 2012 2014 2016 2018 2020 2022International poverty rate Lower middle-income pov. rateUpper middle-income pov. rate Real GDP pc
-30
-20
-10
0
10
20
30
2006 2008 2010 2012 2014 2016 2018 2020 2022
Gov. cons. GFCF Private cons.Imports Exports GDP
Percent, percentage points
Table 1 2020Population, million 1 9.2
GDP, current US$ billion 245.4
GDP per capita, current US$ 1 2757.5
International poverty rate ($1.9)a 2.6
Lower middle-income poverty rate ($3.2)a 5.3
Upper middle-income poverty rate ($5.5)a 1 1 .0
Gini indexa 35.9
School enro llment, primary (% gross)b 87.3
Life expectancy at birth, yearsb 75.4
(a) M ost recent value (201 8), 201 1 PPPs.(b) M ost recent WDI value (201 8).
Source: WDI, M acro Poverty Outlook, and off icial data.Notes:

142 ● World Bank ECA Economic Update Spring 2021
73 MPO Apr 21
and supply chain disruptions. The biggest contraction was seen in agriculture, linked to persistent droughts affecting crops. The output contractions led to deteriorating labor market conditions and increased unemployment affecting household in-come. The unemployment rate reached as high as 5.5 percent in July 2020 before edging down to 5.3 percent in December 2020. Rapid household assessments of COVID-19 impacts showed a substantial rise in the share of the population at risk of poverty in April 2020, which gradually declined between July 2020 and January 2021 as temporarily inactive workers returned to work. Poverty levels at the start of 2021, however, remain elevated – linked to the combination of the sharp agricultural con-traction and the persistence of the pan-demic. Lower-earning workers and those on non-standard contracts continue to be more affected by employment stoppages during the second pandemic wave and approximately 20 percent of households reported lower incomes in January 2021 than prior to the pandemic, with impacts felt across income groups. The fiscal deficit surged to 9.8 percent of projected GDP at the end of 2020 on the back of COVID-19 related expenditures and lower revenues due to the economic downturn and tax relief. Tax facilities,
investments, and exceptional expendi-tures allocated to combat the effects of the COVID-19 pandemic totaled 46.3 billion Ron (4.4 percent of GDP). This included 4.2 billion Ron for benefits granted during the period of temporary suspension of individual employment contracts, 2.7 bil-lion Ron in VAT refunds supporting firm liquidity, and 0.9 billion Ron in bonuses granted for the payment at maturity of the tax on the income of micro-enterprises and the corporate income tax. To reduce the effects of the COVID-19 crisis, the National Bank of Romania (NBR) has pursued a quantitative easing policy which included the purchase of government bonds from the secondary market, repo operations to provide liquid-ity to credit institutions and monetary policy rate cuts amounting to 1.25 percent-age points from 2.5 percent in February 2020 to 1.25 percent in January 2021.
Outlook The economy is projected to grow at around 4.3 percent in 2021 on the back of strengthened economic activity in the sec-ond half of 2021. The strength of the re-covery will depend on the success of the vaccine rollout and the policy response to
the health crisis, as well as on develop-ments in the EU. The impact of the stimu-lus pursued at the EU level will play a critical role in the recovery given limited fiscal space. The NBR will continue its quantitative easing policy, further sup-porting the recovery. However, as growth recovers, inflationary and current account deficit pressures are expected to reemerge, requiring an appropriate policy response. A substantial reduction of the fiscal deficit in 2021 is improbable, as the government will have to support the economic recov-ery process. Over the medium term, the deficit will follow a downward trajectory but is likely to remain above 3 percent throughout the projection period. The widening fiscal deficit would push public debt to 62.2 percent in 2023, from 37.3 percent in 2019. However, public debt remains one of the lowest in the EU. Poverty is projected to remain elevated due to the triple-hit in incomes facing poorer segments of the population, in the form of the persistent pandemic, the poor agricultural year, and declining remittance incomes.
TABLE 2 Romania / Macro poverty outlook indicators (annual percent change unless indicated otherwise)
2018 2019 2020 e 2021 f 2022 f 2023 fReal GDP growth, at constant market prices 4.5 4.1 -3.9 4.3 4.1 3.8
Private Consumption 6.5 6.4 -5.1 6.5 6.0 5.9Government Consumption 6.8 5.0 6.5 1.2 3.5 3.0Gross Fixed Capital Investment -1.1 13.0 5.6 3.9 5.1 3.9Exports, Goods and Services 5.3 4.6 -10.0 6.2 7.8 6.8Imports, Goods and Services 8.6 6.8 -6.0 7.1 8.1 7.3
Real GDP growth, at constant factor prices 3.9 4.0 -3.3 4.3 4.1 3.8Agriculture 9.4 -5.0 -16.2 14.2 6.1 2.9Industry 4.3 -0.6 -9.3 5.2 4.3 4.1Services 3.2 7.6 0.9 3.1 3.8 3.7
Inflation (Consumer Price Index) 4.6 3.8 2.6 3.0 3.2 2.9Current Account Balance (% of GDP) -5.3 -4.7 -5.0 -5.4 -5.7 -6.3Net Foreign Direct Investment (% of GDP) 2.3 2.3 0.9 2.1 2.3 2.4Fiscal Balance (% of GDP) -2.9 -4.4 -9.8 -7.2 -6.0 -4.7Debt (% of GDP) 36.4 37.3 47.7 53.6 58.1 62.2Primary Balance (% of GDP) -1.6 -3.1 -8.4 -5.5 -4.0 -2.8International poverty rate ($1.9 in 2011 PPP)a,b 2.6 2.5 2.5 2.4 2.3 2.2Lower middle-income poverty rate ($3.2 in 2011 PPP)a,b 5.3 5.0 5.2 4.9 4.6 4.4Upper middle-income poverty rate ($5.5 in 2011 PPP)a,b 11.0 10.3 11.6 11.2 10.8 10.2Source: World Bank, Poverty & Equity and M acroeconomics, Trade & Investment Global Practices.Notes: e = estimate, f = forecast.NA(a) Calculations based on ECAPOV harmonization, using 2007-EU-SI LC, 201 7-EU-SI LC, and 201 8-EU-SILC.Actual data: 201 8. Nowcast: 201 9-2020. Forecasts: 2021 to 2023.(b) Projection based off elasticities calibrated on 2007-201 8 growth periods and rapid assessment data, allowing for elasticities to vary between periods of contraction, recovery and expansion.

Selected Country Pages ● 143
74 MPO Apr 21
Key conditions and challenges In recent years, Russia undertook signifi-cant macro-fiscal stabilization efforts, re-sulting in an improved fiscal position—including a sizeable accumulation of fiscal and reserve buffers—reduced exposure to oil price volatility and a lower public debt burden. A massive banking sector clean-up, together with enhanced regulation and supervision, fortified capital and li-quidity buffers. These efforts strengthened Russia’s ability to respond to the pan-demic’s adverse economic shocks. They allowed the government to provide a sub-stantial countercyclical fiscal stimulus (about 4.5 percent of GDP) and an accom-modative monetary policy (the key rate was lowered by 200 basis points between February–July 2020). Russia’s potential growth has been trend-ing downward since the global financial crisis. While near-term recovery will be contingent on the stemming of the pan-demic, longer-term economic prospects will depend on boosting potential growth through promoting economic diversifica-tion, reducing the state’s economic foot-print, leveling the playing field for the pri-vate sector, improving governance—particularly of state-owned enterprises—and taking advantage of shifting global value chains. A green transition could pose significant challenges for the Russian econ-omy unless the government undertakes preemptive steps toward decarbonization.
The downward trajectory in poverty rates since 2010 was interrupted by the shocks of 2014–15. Since then, poverty has again declined, reaching 12.3 percent in 2019 (using the national measure). The official poverty rate jumped to 13.3 percent in the third quarter of 2020, reflecting the coro-navirus pandemic’s impact. Emergency social protection measures prevented an even greater increase in the poverty rate.
Recent developments GDP contracted sharply in the second quarter of 2020, declining by 10.9 percent quarter on quarter, saar. Economic activity only partly recovered in the third quarter (rising by 2.8 percent quarter on quarter, saar) as mobility restrictions eased follow-ing a decline in COVID-19 cases and households and companies benefited from government support, including countercy-clical fiscal, monetary, macroprudential, and regulatory measures. Momentum slowed again in the fourth quarter as the pandemic’s second wave swept across Russia and the globe. Pandemic mitiga-tion measures heavily impacted the ser-vices sectors, with the transportation and hotels and catering sectors registering double-digit contractions. The 2020 exten-sion of the OPEC+ agreement weighed on mineral resource extraction, which con-tributed -1 percentage point to GDP growth. Lower energy export receipts, financial market volatility, and increased geopolitical risks fueled a sharp increase in capital outflows in 2020 ($47.8 billion,
FIGURE 1 Russian Federation / High frequency economic indicators
FIGURE 2 Russian Federation / Actual and projected pov-erty rates and real private consumption per capita
Sources: Russian Statistical Authorities. Source: World Bank. Notes: see Table 2.
A lower-than-expected GDP contraction in 2020 and a rapid easing of COVID-19–related restrictions have improved growth momentum, spurring an upgrade in the Russian Federation’s economic growth forecast to 2.9 percent in 2021 and 3.2 per-cent in 2022 (from a December forecast of 2.6 percent and 3.0 percent, respectively). However, this outlook remains subject to substantial uncertainty and downside risks. Following an uptick in 2020, the poverty rate is expected to decline in 2021 but re-main above pre-pandemic levels until 2022.
RUSSIAN FEDERATION Table 1 2020Population, milliona 1 44.5
GDP, current US$ billion 1 481 .9
GNI per capita, US$ (Atlas method)a 1 1 260
International poverty rate ($1.9)b 0.0
Lower middle-income poverty rate ($3.2)b 0.4
Upper middle-income poverty rate ($5.5)b 3.7
Gini indexc 37.5
School enro llment, primary (% gross)c 1 04.7
Life expectancy at birth, yearsc 72.7
(a) M ost recent value (201 9).(b) M ost recent value (201 8), 201 1 PPPs.(c) M ost recent value (201 8).
Sources: WDI, M PO, Rosstat.Notes:
-25-20-15-10
-505
1015
Jan-20 Apr-20 Jul-20 Oct-20 Jan-21
Coal Crude oil Natural gasManufacturing Transportation AgricultureRetail trade
Percent change (y/y production volumes)

144 ● World Bank ECA Economic Update Spring 2021
75 MPO Apr 21
up from $22.1 billion in 2019), driving a real effective exchange rate depreciation. The sharp contraction in imports due to the depreciation, a decline in real income, and impediments to outward tourism failed to fully offset the drop in energy exports. The general government fiscal deficit wid-ened to 4.0 percent of GDP in 2020 (compared to a surplus of 1.9 percent of GDP in 2019), driven by pandemic re-sponse spending and the need for eco-nomic support measures amid lower ener-gy revenues. Unemployment rose in all regions, but job losses were concentrated in manufacturing, real estate, and hotels and catering. The unemployment rate stood at 5.8 percent in January 2021, down from its peak of 6.4 percent in August but still above the 4.6 percent rate recorded in December 2019. Weakening asset quality across the corpo-rate, small and medium enterprise, and retail segments put pressure on bank profitability and amplified macro-financial risks. The extent of problem loans on bank balance sheets will only become clearer in mid-2021 when the au-thorities lift the remaining regulatory for-bearance measures. Since the end of 2020, 12-month consumer price inflation has exceeded the central bank’s target of 4 percent, owing mainly
to higher global food prices and ruble deprecation. In February 2021, inflation reached 5.7 percent. Elevated inflationary pressure coupled with domestic demand rebound prompted the Central Bank of Russia (CBR) to raise its key interest rate by 25 bp to 4.5 percent in March.
Outlook Assuming that no third wave of corona-virus infections occurs in Russia, consum-er and business confidence are expected to improve, paving the way for a gradual economic rebound. GDP growth is fore-cast at 2.9 percent in 2021 and 3.2 percent in 2022. The general government deficit is expected to improve, narrowing to about 2.0 percent of GDP in 2021 and turning into 0.5 percent of GDP surplus in 2022. Deficit financing, mainly through domes-tic debt issuance, will increase general government debt to a still-manageable 20 percent of GDP in 2023 (from 14 percent in 2019). Following 2020’s stronger fiscal impulse, the 2021–22 fiscal consolidation in Russia will be deeper than in other emerging markets and will become a drag on growth. Given its relatively low public debt, sizeable macro-fiscal buffers, and expected persisting negative output gap,
Russia has the fiscal space for a more gradual consolidation, allowing further increases in social spending and support to regions. In line with the OPEC+ agree-ment, oil production restrictions will fall away in 2021-–22, supporting growth of oil output and export volumes. Twelve-month consumer price inflation is project-ed to average 4.3 percent in 2021 before stabilizing around the central bank’s tar-get of 4 percent in 2022–23. In 2021, the poverty rate (using the upper-middle-income poverty line of US$5.5 per day) is expected to decline to below 2020 levels as the economy rebounds. Howev-er, it will remain above pre-pandemic levels until 2022. The outlook faces substantial downside risks. Lower-than-expected vaccine effec-tiveness or vaccine hesitancy could delay the economic recovery, as could new sanc-tions. Banks could face deteriorating asset quality, profitability, and capitalization, including from the country’s overheated mortgage market. The CBR extended the forbearance on impairment recognition until mid-2021. Although these measures should allow banks to accumulate profits to increase loan loss provisioning, they will also delay the realization of unavoid-able and costly losses.
TABLE 2 Russian Federation / Macro poverty outlook indicators (annual percent change unless indicated otherwise)
2018 2019 2020 e 2021 f 2022 f 2023 fReal GDP growth, at constant market prices 2.8 2.0 -3.1 2.9 3.2 2.5
Private Consumption 4.2 3.1 -8.6 4.7 4.9 3.8Government Consumption 1.3 2.4 4.0 -1.0 -1.0 1.0Gross Fixed Capital Investment 0.6 1.5 -6.2 2.8 3.4 3.0Exports, Goods and Services 5.6 0.9 -5.1 1.9 3.6 3.2Imports, Goods and Services 2.7 3.5 -13.7 5.9 9.3 4.9
Real GDP growth, at constant factor prices 2.8 2.0 -2.8 2.7 3.2 2.4Agriculture 1.7 2.7 0.0 1.8 1.8 1.8Industry 2.9 1.5 -3.5 1.9 2.7 2.5Services 2.8 2.2 -2.6 3.2 3.6 2.4
Inflation (Consumer Price Index) 2.9 4.5 3.4 4.3 4.0 4.0Current Account Balance (% of GDP) 7.0 3.8 2.2 3.1 2.7 2.0Net Foreign Direct Investment (% of GDP) -1.4 0.6 -0.3 0.2 0.2 0.2Fiscal Balance (% of GDP)a 2.9 1.9 -4.0 -1.8 0.5 0.6Debt (% of GDP) 13.7 14.0 17.8 19.1 19.6 20.0Primary Balance (% of GDP)a 3.8 2.7 -3.1 -0.8 1.6 1.7International poverty rate ($1.9 in 2011 PPP)b,c 0.0 0.0 0.0 0.0 0.0 0.0Lower middle-income poverty rate ($3.2 in 2011 PPP)b,c 0.4 0.3 0.4 0.4 0.3 0.3Upper middle-income poverty rate ($5.5 in 2011 PPP)b,c 3.7 3.3 4.2 3.7 3.2 2.9Source: World Bank, Poverty & Equity and M acroeconomics, Trade & Investment Global Practices.Notes: e = estimate, f = forecast.NA(a) Fiscal and Primary Balance refer to general government balances.(b) Calculations based on ECAPOV harmonization, using 201 8-HBS.Actual data: 201 8. Nowcast: 201 9-2020. Forecast are from 2021 to 2023.(c) Projection using neutral distribution (201 8) with pass-through = 0.7 based on private consumption per capita in constant LCU.

Selected Country Pages ● 145
76 MPO Apr 21
Key conditions and challenges The focus of the Government of Serbia in recent years has been on macroeconomic stability, in light of deficits of over 6 per-cent of GDP (2012-14) and high and in-creasing public debt. A substantial fiscal consolidation effort started in 2014 to low-er total expenditures from 45.2 percent of GDP in 2014 to 42.3 percent in 2019, and to increase revenues from around 38 per-cent of GDP to 42.1 in 2019. As a result, the large deficits were turned into a sur-plus in 2017 and a balanced budget there-after. Tighter fiscal policy together with natural disasters, including a drought in 2012 and major floods in 2014, resulted in lower growth, which averaged 1.9 percent over 2010-19 period. The rate of economic growth started to improve just before the COVID-19 pandemic, averaging 4.4 per-cent in 2018 and 2019. Growth was pri-marily led by consumption, and invest-ment remained low as a share of GDP at around 19 percent over 2010-19 period. The Serbian economy went through the first year of the pandemic with a minimal recession since the government used most of the available fiscal space and buffers at the start of the pandemic. The impact of the program on the economy and living standards was favorable but came at a considerable fiscal cost. With limited space for future stimulus packages, fur-ther reforms are needed to bring the econ-omy back to sustained growth and to
secure jobs and incomes while strengthen-ing resilience to shocks. Over the medium term the Serbian econo-my is expected to return to the pre-COVID-19 growth pattern. However, some challenges that limit growth both over the short and over the medium to long term will remain. Most importantly, Serbia needs to continue efforts to remove bottlenecks for private sector growth stemming from the deteriorating govern-ance environment, insufficiently devel-oped infrastructure and unreformed edu-cation sector which creates increasing con-cern about skills mismatch.
Recent developments After a robust growth of 4.2 percent in 2019, the COVID-19 pandemic caused a recession of -1 percent in 2020. This is a significantly better result than what was previously projected (a drop of 3 percent). Services sectors were hit most by the pan-demic-related events (down 1.5 percent, y/y) while value added in industry re-mained flat in real terms, and the agricul-ture sector grew by 4.9 percent. On the expenditure side, both investment and consumption had a negative contribution to growth in 2020 (-1.1 and -0.7pp, respec-tively) while net exports had a positive contribution to growth (0.8pp). The large fiscal stimulus program, of close to 13 percent of GDP, helped to keep the recession mild. It comprised tax deferrals and increased expenditures of around 8 percent of GDP and guarantees
SERBIA
FIGURE 1 Serbia / Actual and forecast GDP vs 5-year pre-covid trend
FIGURE 2 Serbia / Actual and projected poverty rates and real GDP per capita
Source: World Bank. Source: World Bank. Notes: see Table 2.
The Serbian economy entered only a mild recession of -1 percent in 2020 thanks to the significant fiscal stimulus program of around 13 percent of GDP. As a result, there was not a substantial increase in poverty, which is estimated to be close to its 2019 level. Downside risks remain, primarily because of uncertainties related to the external environment. To promote economic growth this year the govern-ment announced a new fiscal stimulus program worth around 5 percent of GDP.
Poverty rate (%) Real GDP per capita (LCU constant)
0
100000
200000
300000
400000
500000
600000
700000
0
5
10
15
20
25
30
2012 2014 2016 2018 2020 2022
Upper middle-income pov. rate Real GDP pc
Table 1 2020Population, million 6.9
GDP, current US$ billion 53.0
GDP per capita, current US$ 7673.3
Upper middle-income poverty rate ($5.5)a 1 9.8
Gini indexa 37.2
School enro llment, primary (% gross)b 99.6
Life expectancy at birth, yearsb 75.9
(a) M ost recent value (201 7), 201 1 PPPs.(b) WDI for school enrollment (201 9); life expectancy (201 8).
Source: WDI, M acro Poverty Outlook, and off icial data.Notes:
80
85
90
95
100
105
110
115
120
2010 2012 2014 2016 2018 2020 2022
Pre-covid 5 year GDP trend Actual GDP
Index of real GDP, 2019=100

146 ● World Bank ECA Economic Update Spring 2021
77 MPO Apr 21
in the amount of 4.8 percent of GDP. As the largest part of the package (7.4 percent of GDP) went to businesses, it helped to avoid a major reduction in employment. In fact, registered employment increased by 1.9 percent compared to 2019. The Q3 unemployment rate, as measured by the Labor Force Survey, stood at 9 percent in 2020, slightly lower than 2019. The wage subsidy and cash support to citizens also helped to avert a spike in poverty, alt-hough at a significant fiscal cost. Due to the support package, limited labor market impacts, and growth in agriculture, pov-erty (income under $5.5/day in revised 2011 PPP) is estimated to have remained stagnant from 17.3 percent in 2019 to 17.4 percent in 2020. The fiscal deficit increased significantly in 2020 and reached an estimated 8.1 percent of GDP. This increase is primarily the re-sult of the large fiscal stimulus program. Public debt is estimated at 58.2 percent of GDP by end-2020. Inflation by year-end reached 1.3 percent y/y, however food prices increased by 2.1 percent. The dinar has remained broadly stable against the euro, supported by sig-nificant interventions by the NBS on the foreign exchange market (NBS sold re-serves worth 1.5 billion euros in 2020). The banking sector’s performance remains ro-bust despite two rounds of debt moratoria
introduced in 2020 as part of the COVID-19 response measures. NPLs stood at 3.5 percent as of November. On the external side, CAD decreased significantly – from 6.9 percent of GDP in 2019 to 4.3 percent in 2020.
Outlook Recovery from the COVID-19 related re-cession is expected to start in 2021. Growth will be supported by a recently announced new package of measures to support citizens and the economy worth 5.1 percent of GDP. As a result, the econo-my is expected to rebound by 5 percent in 2021. Over the medium term, growth is expected to be around 4 percent. Growth will be driven by consumption and invest-ment will recover only slowly, which may slow down the impact of growth on labor markets (both employment and wages). This medium-term outlook crucially de-pends on international developments (including the control of COVID-19), the pace of structural reforms and political developments. Immediate focus is needed on measures to improve the business environment and governance in order to lower the cost of doing business and ensure security and
safety, as well as efforts to improve the quality of infrastructure. Regarding the medium- to long-term challenges the fo-cus should be on demography and climate change. First, an aging and shrinking pop-ulation will leave Serbia with a smaller available labor force. Labor shortages combined with skills mismatches could significantly hurt the competitiveness of the Serbian economy. Second, the impact of climate change – including more fre-quent and severe droughts and floods – will hit agriculture and food production hard and will make the cost of infrastruc-ture maintenance much higher. The pace of labor market recovery will be critical for resumed poverty reduction. The new package is expected to support citizens and economic recovery, though poor and vulnerable households, who tend to depend more on self-employment and less secure jobs, may take longer to regain their income level. Poverty is pro-jected to slowly decline to 16.8 percent in 2021. In the medium term, regional disputes and slow progress with the EU accession process could affect investment sentiment and therefore delay investment projects in infrastructure and other sectors. Labor market challenges limit the scope for ro-bust welfare improvements and could be exacerbated by a significant brain-drain.
TABLE 2 Serbia / Macro poverty outlook indicators (annual percent change unless indicated otherwise)
2018 2019 2020 e 2021 f 2022 f 2023 fReal GDP growth, at constant market prices 4.4 4.2 -1.0 5.0 3.7 3.9
Private Consumption 3.1 3.1 -2.5 5.7 4.2 4.0Government Consumption 3.7 8.7 11.8 -6.4 1.9 4.0Gross Fixed Capital Investment 17.8 11.2 -8.2 15.1 5.6 5.2Exports, Goods and Services 8.3 8.5 -5.9 7.8 8.6 9.5Imports, Goods and Services 11.6 9.5 -3.5 7.3 8.0 8.7
Real GDP growth, at constant factor prices 4.5 4.2 -1.0 5.0 3.7 3.9Agriculture 15.2 0.0 4.2 -4.0 1.0 0.0Industry 2.8 0.2 0.0 4.0 4.5 5.0Services 4.1 6.8 -2.1 6.6 3.6 3.8
Inflation (Consumer Price Index) 2.0 2.2 1.6 2.5 2.8 2.6Current Account Balance (% of GDP) -5.2 -6.9 -4.4 -5.2 -5.9 -6.2Net Foreign Direct Investment (% of GDP) 3.8 6.3 4.8 5.0 5.6 5.3Fiscal Balance (% of GDP) 0.6 -0.2 -8.1 -5.0 -2.5 -1.4Debt (% of GDP) 55.6 52.9 58.2 58.0 56.2 54.9Primary Balance (% of GDP) 2.7 1.4 -7.1 -3.8 -0.5 0.5Upper middle-income poverty rate ($5.5 in 2011 PPP)a,b 17.9 17.3 17.4 16.8 15.4
Source: World Bank, Poverty & Equity and M acroeconomics, Trade & Investment Global Practices.Notes: e = estimate, f = forecast.NA(a) Calculations based on ECAPOV harmonization, using 201 3-EU-SI LC and 201 7-EU-SI LC.Actual data: 201 7. Nowcast: 201 8-2020. Forecast are from 2021 to 2023.(b) Projection using point-to-point elasticity (201 3-201 7) with pass-through = 0.7 based on GDP per capita in constant LCU and simulations of Covid-1 9 impacts.

Selected Country Pages ● 147
78 MPO Apr 21
Key conditions and challenges Since the 1997 Peace Accord, the Tajik economy has grown steadily, averaging 7.6 percent annually between 1998–20. GNI per capita rose six-fold, to $1,030 by 2019, and poverty fell to 26.3 percent from over 80 percent in the early 2000s. Tajiki-stan’s strong performance reflects a favor-able external environment (which drove migrant remittances), generous official donor assistance, and the launch of struc-tural reforms. However, despite high an-nual growth rates, job creation rates have fallen short. Tajikistan remains highly dependent on migrant remittances and commodity exports to generate foreign exchange. As external financing declines, Tajikistan’s other main driver of growth—public investment—also faces greater challenges. The 2016 taxpayer bailout of domestic banks and commercial borrowing in 2017 for a large infrastructure project squeezed the fiscal space and pushed up the public debt to a level that presents a high risk of debt distress. In the context of large tax expenditures and inefficient state-owned enterprises ambiguous tax revenue mobi-lization efforts led to a deterioration of the competition required for robust private sector development. With the credit to GDP ratio at 15.8 percent, Tajikistan’s financial sector remains shal-low, lacks effective intermediation, and faces difficulties gaining the public’s trust.
Tajikistan is making progress in improv-ing its business climate. The country was among the top 10 reformers in Doing Business 2020 while still ranking 106 out of 190 economies worldwide. The protec-tion of property rights, the rule of law, and corruption remain significant chal-lenges to businesses operating in Tajiki-stan. Poverty is largely a rural phenomenon in Tajikistan. Roughly 30 percent of the rural population lives in poverty compared to just 18 percent of the urban population. Labor earnings and remittances from abroad have been the two critical factors for poverty reduction in Tajikistan. In 2020, the loss of employment and reduced incomes, especially from remittances, ex-erted additional stress on poor house-holds.
Recent developments The impact of COVID-19 slowed real GDP growth to 4.5 percent in 2020 (from 7.5 percent in 2019). Precious metals exports supported growth in 2020. In contrast, domestic demand suffered from declining private consumption and investment as remittance inflows fell by 6.3 percent year on year. On the supply side, the pandemic mainly affected activities in the hospitality and construction sectors. The current account recorded a surplus of 7.6 percent of GDP in the first nine months of 2020 as Tajikistan benefited from surg-ing gold prices. Exports of precious metals rose threefold to $690 million. In contrast,
TAJIKISTAN
FIGURE 1 Tajikistan / Real GDP growth and contributions to real GDP growth
FIGURE 2 Tajikistan / Actual and projected poverty rates and real GDP per capita
Sources: TajStat; World Bank staff estimates. Source: World Bank. Notes: see Table 2.
COVID-19 suppressed aggregate supply and demand in 2020, slowing real GDP growth to 4.5 percent. Precious metal exports drove growth while remittance declined, unemployment rose, and house-holds reduced food consumption. Poverty reduction paused for the first time in two decades, underscoring the pandemic's severity. The economy is projected to re-bound in 2021–22, subject to a sustained vaccine rollout, improved global trade conditions, and opportunities for migrant workers to travel abroad. Poverty reduc-tion is expected to resume in 2021. How-ever, downside risks prevail.
-4
-2
0
2
4
6
8
10
2018 2019 2020 2021f 2022f 2023f
Percent, percentage points
Agriculture Industry Services Real GDP
Table 1 2020Population, million 9.5
GDP, current US$ billion 8.0
GDP per capita, current US$ 838.6
International poverty rate ($1.9)a 4.1
Lower middle-income poverty rate ($3.2)a 1 7.8
Upper middle-income poverty rate ($5.5)a 50.5
Gini indexa 34.0
School enro llment, primary (% gross)b 1 00.9
Life expectancy at birth, yearsb 70.9
(a) M ost recent value (201 5), 201 1 PPPs.(b) M ost recent WDI value (201 8).
Source: WDI, M acro Poverty Outlook, and off icial data.Notes:
Poverty rate (%) Real GDP per capita (LCU constant)
0
200
400
600
800
1000
0
20
40
60
80
100
2007 2009 2011 2013 2015 2017 2019 2021 2023International poverty rate Lower middle-income pov. rateUpper middle-income pov. rate Real GDP pc

148 ● World Bank ECA Economic Update Spring 2021
79 MPO Apr 21
lower disposable incomes amid job and earning losses and a 7.7 percent currency depreciation dampened consumer goods imports. Preliminary data show a signifi-cant drop in precious metals exports in the fourth quarter of 2020, which likely re-balanced the current account for the full year. Foreign exchange reserves rose to 8.5 months of import cover at end-2020. The authorities swiftly responded to the pandemic by allowing tax deferrals for companies. They also ramped up healthcare spending by 44 percent and social expenditures by 10 percent. As a result, the 2020 fiscal deficit widened to 3.3 percent of GDP. The outcome was low-er than earlier projections, allowing the authorities to save some of the financial support from international financial insti-tutions. Tajikistan also benefited from the Debt Service Suspension Initiative (DSSI), which suspended 2020 debt servicing equivalent to $43.5 million, creating fiscal space to respond to the pandemic. The central bank supported domestic de-mand by cutting the policy rate by 200 bps in 2020, to 10.75 percent. Supply chain disruptions, higher food prices, and cur-rency depreciation pass-through hiked yearly inflation to 9.4 percent. The finan-cial sector was resilient amidst the pan-demic. The nonperforming loan ratio fell to 23.8 percent in 2020 (from 27 percent in 2019).
The crisis increased food insecurity in Tajikistan. In May 2020, 42 percent of households reported reducing their food consumption. Estimates suggest that pov-erty has remained little changed from 26.3 percent in 2019, marking the first time that poverty reduction paused in two decades. In July 2020, the government expanded the Targeted Social Assistance program from 40 districts to all 68 of the country’s districts, increasing the number of benefi-ciaries from 1.3 million to 1.8 million people.
Outlook Tajikistan’s economy is forecast to re-bound in 2021–22, assuming a vaccination rollout to 20 percent in 2021 and 50 per-cent by the end of 2022 for low- and mid-dle-income countries. Real GDP growth is projected at 5 percent in 2021, subject to improved global trade and opportunities for migrants to return to the Russian Fed-eration. Remittances and foreign invest-ment are projected to rise, reflecting a better growth outlook in Russia and Chi-na. Rising fuel and food prices could stoke inflation. The country’s external deficit is expected to deteriorate as higher remittances spur
imports and export growth moderates, especially for precious metals. The approved state budget for 2021 re-flects the authorities’ ambitious plans for fiscal consolidation. Our projections indi-cate a fiscal deficit of 2.6 percent of GDP supported by a moderate rebound in eco-nomic activity and a corresponding tax collection increase. The government is expected to use concessional external bor-rowing to close the financing gap. The authorities are reforming the power utility company, Barqi Tojik, by unbun-dling it into three independent companies responsible for power generation, trans-mission, and distribution. Ongoing tax system reforms and the adoption of a new tax code are expected to improve the busi-ness climate over the medium term. A resumption of the downward trend in the poverty rate is expected in 2021. How-ever, downside risks prevail. A delayed vaccination rollout or renewed failure to contain the spread of COVID-19 could impede economic recovery. Meanwhile, a continuation of travel restrictions could suppress international trade and a recov-ery of remittances. Reduced household income may further exacerbate food inse-curity and household well-being.
TABLE 2 Tajikistan / Macro poverty outlook indicators (annual percent change unless indicated otherwise)
2018 2019 2020 e 2021 f 2022 f 2023 fReal GDP growth, at constant market prices 7.3 7.5 4.5 5.0 5.7 5.9
Private Consumption 7.2 7.1 -4.4 5.2 4.7 4.3Government Consumption 3.8 3.5 0.4 2.1 3.0 3.1Gross Fixed Capital Investment 7.9 -6.4 -6.6 8.6 8.4 8.8Exports, Goods and Services 2.2 3.5 9.6 1.5 3.2 3.4Imports, Goods and Services 3.3 2.2 -2.8 2.1 1.7 1.5
Real GDP growth, at constant factor prices 7.8 8.7 4.3 4.8 5.7 5.9Agriculture 4.0 7.1 8.8 3.3 4.4 4.8Industry 11.8 13.6 9.7 4.8 5.3 5.5Services 6.3 4.9 -4.0 5.9 7.1 7.1
Inflation (Consumer Price Index) 3.9 8.0 8.6 7.8 7.0 6.5Current Account Balance (% of GDP) -5.0 -2.3 0.5 -1.3 -1.6 -2.4Net Foreign Direct Investment (% of GDP) 3.3 2.3 1.4 1.9 2.5 2.9Fiscal Balance (% of GDP) -2.8 -2.7 -3.3 -2.6 -2.2 -1.9Debt (% of GDP) 47.9 45.2 53.5 52.6 51.6 47.6Primary Balance (% of GDP) -1.6 -1.3 -2.3 -1.2 -0.6 -0.3International poverty rate ($1.9 in 2011 PPP)a,b 2.6 2.3 2.3 2.1 1.8 1.7Lower middle-income poverty rate ($3.2 in 2011 PPP)a,b 13.0 11.7 11.2 10.3 9.2 8.5Upper middle-income poverty rate ($5.5 in 2011 PPP)a,b 42.9 40.2 38.8 37.3 35.5 34.0Source: World Bank, Poverty & Equity and M acroeconomics, Trade & Investment Global Practices.Notes: e = estimate, f = forecast.NA(a) Calculations based on ECAPOV harmonization, using 201 5-HSITAFIEN. Actual data: 201 5. Nowcast: 201 6-2020. Forecast are from 2021 to 2023.(b) Projection using neutral distribution (201 5) with pass-through = 1 based on GDP per capita in constant LCU.

Selected Country Pages ● 149
80 MPO Apr 21
Key conditions and challenges Turkey’s economy has rebounded strong- ly from the pandemic-related slowdown of 2020. However, this rapid recovery has raised macroeconomic and financial sta- bility risks. Unless addressed, these vul-nerabilities will expose Turkey to height-ened risk and continue to limit productivi-ty, which has stagnated in recent years. Recent market turmoil following the re-placement of the Central Bank Governor illustrates the importance of a sustained and credible focus on bringing inflation down to the target rate of 5 percent and bolstering the country’s international re-serves. Structural reforms in labor, prod-uct, and financial markets, and to innova-tion systems can support productivity growth. Corporate sector vulnerabilities—further elevated by the pandemic and higher debt burden— present risks to banks. Developing local- currency, long-term finance sources would alleviate exist-ing imbalances in the financial system and contribute to economic growth. The economic recovery in the second half of 2020 helped recover most of the jobs lost during the pandemic’s first wave. However, jobs for informal, lower-skilled, female, and young workers remain well below their pre-pandemic levels. Further-more, 2.6 million more individuals were out of the labor force in 2020. The poverty rate is projected to increase to 12.2 percent in 2020, which would mark the second
successive year that poverty has increased in Turkey, from 8.5 percent in 2018.
Recent developments Real GDP grew by 5.9 percent year on year in the fourth quarter of 2020, completing a remarkable rebound in the second half and resulting in full-year growth of 1.8 percent despite the economic fallout from the coro-navirus pandemic. The recovery was driv-en by surging domestic demand, buoyed by credit in the second and third quarter. The authorities loosened monetary policy and delivered a stimulus program totaling 13 percent of GDP, most of which was sup-port via the banking sector in the form of partial credit guarantees and loan deferrals. Other fiscal support included social sup-port payments to households, support for furloughed workers, tax deferrals, and other support for firms. Growth from these policies came at the cost of rising prices and macro-financial vulnerabilities. Inflation trended upward, reaching 15.6 percent in February—the highest level in 18 months. The Turkish lira depreciated by 20 percent against the U.S. dollar in 2020. From a surplus in 2019, the current account moved back into deficit ($36.7 billion or 5.1 percent of GDP) as tourism income evaporated, merchandise exports fell, and gold im-ports increased. After the central bank stepped in to finance as much as 80 per-cent of the current account deficit, for-eign exchange reserves fell sharply, reaching unprecedented lows on a net
TURKEY
FIGURE 1 Turkey / Real GDP growth and contributions to real GDP growth.
FIGURE 2 Turkey /Actual and projected poverty rates and real GDP per capita
Sources: Turkstat and World Bank staff calculations. Source: World Bank. Notes: see Table 2.
Turkey was the only G20 country aside from China to record an economic expan-sion in 2020. Real GDP growth of 1.8 percent was driven by an extensive stimu-lus and effective control of the COVID-19 pandemic. Turkey’s economy is expected to grow by 5 percent in 2021 but reduc-ing inflation and rebuilding external buff-ers—both of which suffered setbacks in 2020—will prove challenging. Poverty is projected to increase further following increases in 2019 and 2020, with informal workers and households outside the social security system being hit hardest.
Poverty rate (%) Real GDP per capita (LCU constant)
0
5000
10000
15000
20000
25000
0
5
10
15
20
25
30
2004 2006 2008 2010 2012 2014 2016 2018 2020 2022
Upper middle-income pov. rate Real GDP pc
-10%
-5%
0%
5%
10%
2014 2015 2016 2017 2018 2019 2020 2021 2022 2023
Private Consumption Government SpendingInvestment ExportsImports Stocks
Percent, percentage points
Table 1 2020Population, million 83.4
GDP, current US$ billion 720.1
GDP per capita, current US$ 8635.9
Upper middle-income poverty rate ($5.5)a 1 0.2
Gini indexa 41 .9
School enro llment, primary (% gross)b 94.9
Life expectancy at birth, yearsb 77.4
(a) M ost recent value (201 9), 201 1 PPPs.(b) M ost recent WDI value (201 8).
Source: WDI, M acro Poverty Outlook, and off icial data.Notes:

150 ● World Bank ECA Economic Update Spring 2021
81 MPO Apr 21
basis. Deposit dollarization rose to 55 percent. Buoyant tax revenues resulted in a central government deficit of 3.4 percent of GDP in 2020, better than the planned deficit of 4.9 percent of GDP. Toward the end of 2020, a second wave of COVID-19 peaked, with cases reaching 30,000 a day in November. Following the reimposition of containment measures (including masking, weekend curfews, and restaurant closures), new cases de-clined to around 10,000 a day by February 2021, following which, the government began easing restrictions again, based on a province-level risk assessment. By late 2020, the authorities had also moved to address economic vulnerabili-ties, more than doubling interest rates between August and December, repealing exceptional regulations aimed at stimulat-ing credit growth, and increasing trans-parency. This policy shift helped spur portfolio inflows, stabilize the lira, and strengthen market confidence. Credit growth decelerated sharply to near zero (13-week average) by February, and the banking sector reduced its net open for-eign exchange position.
Outlook The economy is expected to grow by 5.0 percent in 2021 and 4.5 percent in 2022
and 2023. Despite slow quarterly growth expected in 2021—as monetary policy remains tight and external demand weak—GDP in the second quarter will be higher than the year-earlier period when COVID-19 brought Turkey’s economy to a near-standstill. These projections assume that cautious reopening continues and that there is no uncontrolled outbreak in Turkey or its major export markets, which could undermine growth. Recent sharp depreciation of the Lira in response to the replacement of the Central Bank Governor will impact inflation. Av-erage inflation is projected to increase in 2021 to 15.5 percent. The current account deficit is expected to narrow to 3.7 percent of GDP in 2021. The 2021 general govern-ment deficit is projected at 3.5 percent of GDP as the need for additional support to cushion the economic and social impact of the pandemic continues, before narrowing to 3.1 percent in 2022 and 2.6 percent in 2023 as temporary tax reductions and oth-er government support is withdrawn. Regulatory forbearance (especially on nonperforming loan definitions and capi-tal adequacy ratio calculations) is ex-pected to be phased out in mid-2021, after which there may be an increase in nonper-forming and distressed loans. Strengthen-ing bad loan resolution, insolvency, and out-of-court corporate debt restructuring frameworks with an effective corporate viability assessment will be critical to
shield corporates and the banks from spillovers. Turkey’s external risk profile is high due to its still-low level of international re-serves and sizeable external financing needs. The country has limited space to manage exchange rate volatility in the event of new external shocks. The banking sector has adequate foreign exchange buffers, most of which form part of central bank international reserves. Simulation analysis suggests that poverty may have increased by as much as 2.1 percentage points in 2020—equivalent to 1.6 million new poor. The crisis pushed a similar number of people into poverty as the 2018/19 recession. Had the govern-ment not acted swiftly to stem the social effects of COVID-19 the increase in pov-erty would have been three times greater. Turkey is projected to enter 2021 with the highest poverty rate since 2012. Successful poverty reduction will require ensuring that the recovery benefits informal and unskilled workers and other vulnerable groups through a policy mix of social transfers, inclusive job creation, and labor activation strategies.
TABLE 2 Turkey / Macro poverty outlook indicators (annual percent change unless indicated otherwise)
2018 2019 2020 e 2021 f 2022 f 2023 fReal GDP growth, at constant market prices 3.0 0.9 1.8 5.0 4.5 4.5
Private Consumption 0.5 1.6 3.2 2.5 2.6 2.9Government Consumption 6.6 4.4 2.3 2.3 2.2 1.8Gross Fixed Capital Investment -0.3 -12.4 6.5 1.8 8.0 7.2Exports, Goods and Services 9.0 4.9 -15.4 19.5 9.0 8.5Imports, Goods and Services -6.4 -5.3 7.4 7.0 6.5 6.0
Real GDP growth, at constant factor prices 3.2 1.1 1.2 5.0 4.5 4.5Agriculture 2.1 3.7 4.8 1.5 2.0 2.0Industry 0.5 -3.0 0.6 5.7 5.0 4.2Services 4.8 2.8 1.1 5.0 4.6 4.9
Inflation (Consumer Price Index) 16.3 15.2 12.3 15.5 12.0 10.0Current Account Balance (% of GDP) -2.8 0.9 -5.1 -3.7 -4.0 -4.0Net Foreign Direct Investment (% of GDP) 1.2 0.8 0.6 0.9 1.0 1.0Fiscal Balance (% of GDP) -2.4 -3.0 -3.9 -3.5 -3.1 -2.6Debt (% of GDP) 30.2 32.5 39.6 40.6 39.6 38.4Primary Balance (% of GDP) -0.2 -0.5 -1.0 -0.4 0.0 0.1Upper middle-income poverty rate ($5.5 in 2011 PPP)a,b 8.5 10.2 12.2 12.1 12.0 11.9Source: World Bank, Poverty & Equity and M acroeconomics, Trade & Investment Global Practices.Notes: e = estimate, f = forecast.NA(a) Calculations based on ECAPOV harmonization, using 201 3-HICES and 201 9-HICES. Actual data: 201 9. Nowcast: 2020. Forecast are from 2021 to 2023.(b) Projection using point-to-point elasticity (201 3-201 9) with pass-through = 1 based on GDP per capita in constant LCU.

Selected Country Pages ● 151
82 MPO Apr 21
Key conditions and challenges Even prior to the COVID-19 outbreak, Ukraine faced structurally weak growth due to low levels of domestic savings and fixed investment. Until 2020, savings repre-sented up to 5 percent of GDP and gross capital formation was above 10 percent over the last five years. While the pandemic and associated recession has temporarily reversed this trend, savings estimated at 11.3 percent of GDP in 2020 and investment at around 7 percent are well below compar-ator countries with similar development and infrastructure needs. Reforms that address structural weaknesses in the finan-cial sector; reduce market distortions, in-cluding due to still dominant role of SOEs in select sectors; and address macroeco-nomic vulnerabilities are paramount to increase investment. In addition, while household incomes have grown rapidly in recent years, this has increasingly been driven by transfers rather than labor in-comes, a pattern that is unsustainable for effective poverty reduction. The COVID-19 outbreak redirected gov-ernment policy from structural reforms towards ad-hoc reactive measures. As a result, macro-fiscal risks have increased. Public sector financial needs are expected to grow due to increases in minimum wages and social transfers, limiting space for public investment, and fueling infla-tionary pressures in a supply-constrained economy. Additionally, large government
domestic borrowings are crowding out much needed private investment. Hold-ings of government securities already rep-resent close to 30 percent of total assets of the state-owned banks while corporate lending continues to stagnate. Stronger fiscal discipline is needed to reduce risks for medium-term growth prospects.
Recent developments Although the economic impact from the COVID-19 outbreak appears to be less se-vere than initially anticipated – GDP de-clined by estimated 4.5 percent in 2020 (vs 6.5 percent decline 1H2020) – the pandemic has exacted a heavy toll in terms of health and mortality impacts; and undermined the government’s commitment to undertake critical reforms. Recent anti-corruption re-forms have also suffered setbacks due to adverse court rulings in late 2020. Economic activity recovered in H2 2020 supported by a number of measures to mitigate the impact of COVID-19. Moreo-ver, the full-scale lockdown has been re-placed by an adaptive quarantine in June 2020 that enabled many services to return to normal functioning. Domestic demand was boosted by over 10 percent YoY real wage growth due to increase in minimum wages and gradual recovery in economic activity. Thus, on the supply side, retail and wholesale trade grew 7.9 percent YoY in 2020 and made a significant positive contribution to GDP growth. The financial sector has weathered the downturn with its capital adequacy still strong. At the
UKRAINE
FIGURE 1 Ukraine / GDP and sectoral growth FIGURE 2 Ukraine / Actual and projected poverty rates and real GDP per capita
Source: State Statistics Service of Ukraine. Source: State Statistics Service of Ukraine.
With an estimated contraction of 4.5 per-cent, the economic impact of COVID-19 has been smaller than in most other coun-tries, nevertheless the pandemic has caused a heavy toll on households and weakened the commitment by the govern-ment to undertake critical reforms. Only a partial recovery in GDP growth of 3.8 percent is expected in 2021, given high uncertainty regarding the rollout of the vaccine and the slow pace of structural reforms to address bottlenecks to invest-ment and to safeguard macroeconomic sustainability.
-30
-25
-20
-15
-10
-5
0
5
10
15
20
2017-Q1 2017-Q3 2018-Q1 2018-Q3 2019-Q1 2019-Q3 2020-Q1 2020-Q3
Agriculture Manufacturing Domestic trade GDP
Percent change, y-o-y Poverty rate (%) Real GDP per capita (LCU constant)
0
5000
10000
15000
20000
25000
30000
0
5
10
15
20
25
30
2004 2006 2008 2010 2012 2014 2016 2018 2020 2022Lower middle-income pov. rate Upper middle-income pov. rateReal GDP pc
Table 1 2020Population, million 44.0
GDP, current US$ billion 1 37.3
GDP per capita, current US$ 31 1 8.4
International poverty rate ($1.9)a 0.0
Lower middle-income poverty rate ($3.2)a 0.2
Upper middle-income poverty rate ($5.5)a 2.5
Gini indexa 26.6
School enro llment, primary (% gross)b 99.0
Life expectancy at birth, yearsb 71 .6
(a) M ost recent value (201 9), 201 1 PPPs.(b) M ost recent WDI value (201 8).
Source: WDI, M acro Poverty Outlook, and off icial data.Notes:

152 ● World Bank ECA Economic Update Spring 2021
83 MPO Apr 21
same time, agriculture output fell almost 12 percent due to drought and a poor harvest. On the external side, lower energy and higher iron and grain commodity prices resulted in the most favorable terms of trade for Ukraine for the last decade. Com-bined with import compression, this result-ed in a CA surplus of 4.4 percent in 2020. Remittances were relatively resilient, down only 5.3 percent YoY in 2020, while private capital inflows also recovered in 2H2020. Thus, international reserves reached US$29.1bn at end-December, equal to 4.7 months of next year’s imports. Following the smaller-than-expected eco-nomic decline, fiscal revenue also per-formed better than anticipated. On the ex-penditure side, COVID-19 related outlays were less than budgeted, and a portion of the pandemic special fund was redirected to capital expenditures and to support a public sector wage and pension increase. The fiscal deficit amounted to 6.2 percent of GDP vs. the initial plan of 7.6 percent. After two years of tight monetary policy, the National Bank of Ukraine gradually cut its key policy rate to 6 percent in June 2020, a level it has since maintained How-ever, a more accommodative fiscal policy stance resulted in an increase in inflation expectations from 6.7 percent in August to 8 percent at year-end. The inflation rate grew from 2.5 percent on average in
Q1-Q3 2020 to 6.1 percent in January 2021 that is slightly above the NBU’s target of 5+/-1 percent. This triggered the key rate increase to 6.5 percent in March 2021. While the COVID-19 relief measures were welcome, attention once again needs to turn towards structural reforms that are needed to raise the medium-term growth prospects. Slower reform momentum has undermined investors’ confidence and delayed IFI financing; as a result, signifi-cant public financing needs in 2020 have been met mostly by domestic borrowing that amounted to 10.5 percent GDP (gross). The composition of external financing was shifted towards more expensive commer-cial borrowings and Eurobonds comprising 4.3 percent of GDP in total. The poverty effects of COVID-19 are ex-pected to be relatively muted, with the poverty rate based on US$5.5 a day pro-jected to have increased by 0.5 pp to 3 percent in 2020, as increase of pensions and wages helped to partially offset de-cline in employment.
Outlook Ukraine’s economic recovery in 2021 is expected to be mild given high uncertain-ty associated with the vaccine rollout and
the direction of economic policies to ad-dress bottlenecks to investment and safe-guard macroeconomic sustainability. The GDP growth projection of 3.8 percent is underpinned by positive base effects in agriculture and processing industry and takes into account that further temporary lockdowns are possible in the first half of 2021 due to the delays in vaccinations. The 2021 budget targets a 5.4 percent defi-cit. Together with 10.5 percent of GDP debt amortization and 1.3 percent of GDP of arrears to private sector, this will in-crease total fiscal financing needs to 17.2 percent of GDP (vs 15 percent of GDP in 2020). The increase in minimum wages will push the public wage bill to over 11 percent of GDP and create additional pressures on current account imbalances and inflation. Prudent fiscal policy is needed to address inflationary pressures in the medium term. The poverty rate based on the US$5.5 a day threshold is expected to decrease to 2.5 percent in 2021, similar to the level in 2019. Accelerating the reform momentum is key to achieve faster economic growth and poverty reduction in 2022 and 2023.
TABLE 2 Ukraine / Macro poverty outlook indicators (annual percent change unless indicated otherwise)
2018 2019 2020 e 2021 f 2022 f 2023 fReal GDP growth, at constant market prices 3.3 3.4 -4.5 3.8 3.0 3.5
Private Consumption 8.9 11.9 -3.0 4.6 3.8 3.5Government Consumption 0.1 -5.0 1.8 1.5 0.0 0.0Gross Fixed Capital Investment 14.3 15.0 -27.4 9.7 8.4 7.5Exports, Goods and Services -1.6 6.7 -7.4 3.4 2.0 4.4Imports, Goods and Services 3.2 6.3 -11.5 6.8 5.0 4.8
Real GDP growth, at constant factor prices 3.3 3.4 -4.6 3.9 2.9 3.5Agriculture 7.8 1.3 -7.0 5.0 4.5 5.0Industry 2.0 -2.0 -4.0 2.0 3.0 4.5Services 3.0 5.7 -4.4 4.4 2.6 2.9
Inflation (Consumer Price Index) 9.8 4.1 4.8 5.0 5.0 5.8Current Account Balance (% of GDP) -3.2 -0.9 4.4 -1.3 -2.8 -3.3Net Foreign Direct Investment (% of GDP) 1.9 2.1 2.2 2.4 2.6 6.2Fiscal Balance (% of GDP) -2.0 -2.0 -6.1 -5.4 -4.0 -2.5Debt (% of GDP) 60.6 50.4 63.2 62.4 59.7 57.8Primary Balance (% of GDP) 1.4 1.1 -2.4 -0.9 0.1 1.8Lower middle-income poverty rate ($3.2 in 2011 PPP)a,b 0.4 0.2 0.3 0.2 0.2 0.2Upper middle-income poverty rate ($5.5 in 2011 PPP)a,b 3.4 2.5 3.0 2.5 2.0 1.6Source: World Bank, Poverty & Equity and M acroeconomics, Trade & Investment Global Practices.Notes: e = estimate, f = forecast.NA(a) Calculations based on ECAPOV harmonization, using 201 9-HLCS. Actual data: 201 9. Nowcast: 2020. Forecast are from 2021 to 2023.(b) Projection using neutral distribution (201 9) with pass-through = 0.87 based on GDP per capita in constant LCU.

Selected Country Pages ● 153
84 MPO Apr 21
Key conditions and challenges After an initial phase of market liberaliza-tion, Uzbekistan is moving into a more complex phase of reforms to land, labor, capital markets, and state-owned enter-prises. The most significant medium-term challenge will be ensuring reform inclu-sivity and transparency. Reducing the state’s role in the economy by accelerating the reform of state-owned enterprises and creating a competitive and inclusive pri-vate sector-led growth model will help address the legacy of the state-led model, which produced high growth rates (averaging more than 6 percent between 2000–16), but insufficient jobs and oppor-tunities. The COVID-19 crisis made the transition to a market economy even more im-portant. About 9 percent of the population still lives below the World Bank’s lower-middle-income poverty line ($3.2 a day, PPP 2011 adjusted), and significantly more live close to this line. During the peak of the COVID-19 lockdowns, these vulnera-bilities were acute—nearly 1 million addi-tional Uzbeks slipped into poverty. To reduce these vulnerabilities, the au-thorities’ strong focus on vibrant growth will need to be complemented by reforms to strengthen safety nets, improve labor market conditions, and remove con-straints to human capital development through better health and education ser-vices. An important sign of reform success
will be greater private sector participation and ownership in the economy and better quality jobs. Addressing these challenges with limited administrative capacity will be even more difficult as the pandemic’s impact lingers.
Recent developments GDP growth slowed sharply in 2020 (to 1.6 percent from 5.8 percent in 2019) due to COVID-19–related lockdowns and trad-ing disruptions. Uzbekistan was one of the few countries in the region to record an economic expansion in 2020. Positive growth was supported by robust agricul-ture output and substantial anticrisis measures that boosted health spending and supported households and firms. Fis-cal stimulus and lower public investment due to the pandemic lifted consumption in 2020, making it the main driver of growth for the first time in over a decade. The unemployment rate rose sharply, from 9 percent in 2019 to 11.1 percent in September 2020. The poverty rate rose to 9 percent (well above the precrisis projec-tion of 7.4 percent in 2020) as the pandem-ic led to job losses, income reductions, and declining remittances. A large expansion of social assistance provided some relief to Uzbekistan’s affected households. The current account deficit narrowed to 5.2 percent of GDP in 2020 (from 5.7 percent in 2019), reflecting an 18 percent surge in gold exports that helped limit the decline in total exports to 15 percent in 2020. Import spending fell by 17 percent as capital
UZBEKISTAN
FIGURE 1 Uzbekistan / GDP growth, inflation, unemploy-ment
FIGURE 2 Uzbekistan / Poverty, GDP per capita, and small business development
Sources: Uzbekistan official statistics. Sources: Uzbekistan official statistics. Due to the lack of data access, the Bank cannot validate the official figures. Note: The national poverty line is based on a minimum food consumption norm of 2,100 calories per person per day. Both the national poverty line and welfare aggregate exclude nonfood items.
Following a sharp deceleration in 2020, Uzbekistan’s economy is projected to par-tially recover from the COVID-19 crisis in 2021. Until a full recovery occurs, vul-nerable households will require continued support to mitigate the pandemic’s im-pact. The medium-term economic outlook remains favorable, as global conditions improve, and as authorities advance re-forms to reduce the role of state-owned enterprises in the economy to strengthen private sector-led growth and production efficiency. Translating this outlook into faster poverty reduction will require a stronger focus on inclusive reforms that increase employment, incomes, and op-portunities.
0
5
10
15
20
2017 2018 2019 2020
GDP growth CPI inflation Unemployment rate
Percent
Table 1 2020Population, million 34.2
GDP, current US$ billion 57.7
GDP per capita, current US$ 1 686.7
School enro llment, primary (% gross)a 1 02.2
Life expectancy at birth, yearsa 71 .6
(a) M ost recent WDI value (201 8).
Source: WDI, M acro Poverty Outlook, and off icial data.Notes:
0
10
20
30
40
50
60
0
500
1,000
1,500
2,000
2,500
2010 2012 2014 2016 2018 2020
Percent
Small business, % of GDP (rhs)GDP per capita, US$, lhsNational poverty rate, % of population, rhs
GDP per capita, US$

154 ● World Bank ECA Economic Update Spring 2021
85 MPO Apr 21
imports declined sharply. Higher external borrowing helped finance the deficit. Lower revenues and higher spending widened the overall fiscal deficit to 4.4 percent of GDP in 2020 (from 3.9 percent in 2019). Slower GDP growth and tax re-lief measures in the government's fiscal stimulus package (2.5 percent of GDP) reduced revenues, while spending in-creases in the package drove up expendi-tures. Higher gold dividends, the repriori-tization of some public expenditure, and a sharp fall in policy lending largely offset the impact of the fiscal stimulus and con-tained the deficit. Higher borrowing to finance the deficit increased public and publicly guaranteed debt to 37.9 percent of GDP in 2020. Foreign exchange reserves equivalent to 60 percent of GDP provide a substantial buffer. Smaller increases in administered prices because of the pandemic offset higher food prices to slow 12-month inflation to 11 percent in December 2020 (from 15.2 percent a year earlier). With inflationary pressures low, the Central Bank of Uzbek-istan reduced its policy rate from 16 per-cent to 14 percent. Credit growth in 2020 slowed to 34 percent (from 52 percent in 2019), reflecting higher real lending rates, lower government-subsidized lending, and the impact of COVID-19. Firms and households also received significant loan
repayment deferrals during the year. The banking sector’s capital adequacy ratio fell to 18.4 percent in November 2020 (from 23.5 percent at end-2019). As a result of the pandemic, nonperforming loans tri-pled to 4.5 percent in November 2020. Nevertheless, Uzbekistan’s financial sys-tem remains sufficiently capitalized to absorb potential credit shocks.
Outlook GDP growth is projected to recover to 4.8 percent in 2021. However, this forecast is subject to uncertainty surrounding the global recovery and the potential pace of the country’s COVID-19 vaccination cam-paign. A gradual resumption of trade and investment flows, a bountiful agricultural harvest, a ecovery of remittances, and vaccine distribution will support the re-covery and spur further reductions in poverty and unemployment. Stronger GDP growth of 5.5 percent is projected in 2022 as vaccination efforts accelerate and global disruptions ease further. The cur-rent account deficit is projected to widen to 5.5 percent of GDP in 2021 as capital imports for large investment projects recov-er. Although foreign direct investment is expected to partially recover from its
decline in 2020, public and private borrow-ing are expected to continue financing most of the deficit. Lower budget reve-nues, vaccine purchases, expanding social support, and increased policy lending are expected to contribute to a wider overall fiscal deficit of 5.4 percent of GDP in 2021. This deficit will be financed by increased public borrowing. Uzbekistan’s public debt is projected to reach 42 percent of GDP in 2021 and stabilize at about 45 per-cent over the medium term. As conditions for households and firms improve, a grad-ual withdrawal of anticrisis measures will reduce the deficit over the medium term.
TABLE 2 Uzbekistan / Macro poverty outlook indicators (annual percent change unless indicated otherwise)
2018 2019 2020 e 2021 f 2022 f 2023 fReal GDP growth, at constant market prices 5.4 5.8 1.6 4.8 5.5 5.8
Private Consumption 3.8 5.4 2.6 4.6 5.2 5.5Government Consumption 3.7 5.5 17.3 7.0 3.9 3.1Gross Fixed Capital Investment 18.1 34.2 -8.0 7.3 8.2 9.8Exports, Goods and Services 10.7 10.9 -14.9 12.0 15.4 16.1Imports, Goods and Services 26.8 47.3 -17.8 14.1 15.6 17.2
Real GDP growth, at constant factor prices 5.4 5.8 1.6 4.8 5.5 5.8Agriculture 0.3 3.1 3.0 3.1 3.3 3.5Industry 11.5 8.9 2.3 4.0 4.3 4.5Services 5.2 5.5 0.3 6.4 7.7 8.0
Inflation (Consumer Price Index) 17.5 14.5 12.9 10.6 8.9 6.0Current Account Balance (% of GDP) -7.1 -5.7 -5.2 -5.5 -5.1 -4.5Fiscal Balance (% of GDP) -2.3 -3.9 -4.4 -5.4 -3.8 -2.4Debt (% of GDP) 20.4 29.4 37.9 42.6 44.3 43.9Primary Balance (% of GDP) -1.9 -3.4 -3.8 -5.0 -3.4 -2.1Source: World Bank, Poverty & Equity and M acroeconomics, Trade & Investment Global Practices.Notes: e = estimate, f = forecast.NA


ISBN (electronic): 978-1-4648-1698-7
© 2021 International Bank for Reconstruction and Development / The World Bank
Some rights reserved
1818 H Street NW, Washington, DC 20433
Telephone: 202-473-1000
Internet: www.worldbank.org
This work is available under the
Creative Commons Attribution 3.0
IGO license (CC BY 3.0 IGO)
http://creativecommons.org
/licenses/by/3.0/igo.
Governments play a critical role in the economies of Europe and Central Asia, where government expenditures are close to 40 percent of gross domestic product and the public sector accounts for over 25 percent of total employment, much higher than the global average of 16 percent. The public sector often attracts some of the best educated workers in the region. And support for a larger public sector is increasing due to aging populations and their growing health care and long-term care needs, rising inequality and greater support for redistribution, and increasing expenditures as governments address the challenges posed by the COVID-19 crisis. The significant role that government plays underscores the importance of the quality of governance in determining productivity and growth and effectively responding to the region’s economic and social challenges.
Digital technology and the data revolution offer the potential to increase efficiency, transparency, responsiveness, and citizen trust, directly impacting the quality of government. Across the world, the quality of government is increasingly informed by the extent to which governments harness digital tools and GovTech to optimize man-agement, service delivery, and overall state capacity. Technology and data are also key for fostering collaboration between governments and civil society to improve public sector efficiency and service delivery. The COVID-19 pandemic has highlight-ed the costs associated with delaying digitalization and GovTech implementation and the opportunities that lie in public sector modernization.
WORLD BANK ECA ECONOMIC UPDATE SPRING 2021
Data, Digitalization, and Governance